| FREE WRITING PROSPECTUS | ||
| FILED PURSUANT TO RULE 433 | ||
| REGISTRATION FILE NO.: 333-207361-06 | ||
 | September 11, 2017 |

CSAIL 2017-CX9 Commercial Mortgage TrustFree Writing Prospectus Structural and Collateral Term SheetCredit Suisse Commercial Mortgage Securities Corp.as DepositorCommercial Mortgage Pass-Through Certificates Series 2017-CX9 Column Financial, Inc. Natixis Real Estate Capital LLC Benefit Street Partners CRE Finance LLCas Sponsors and Mortgage Loan SellersCredit Suisse NatixisCo-Lead Manager and Joint Bookrunner Co-Lead Manager and Joint BookrunnerTHE DEPOSITOR HAS FILED A REGISTRATION STATEMENT (INCLUDING A PROSPECTUS) WITH THE SEC (SEC FILE NO. 333-207361) FOR THE OFFERING TO WHICH THIS COMMUNICATION RELATES. BEFORE YOU INVEST, YOU SHOULD READ THE PROSPECTUS IN THAT REGISTRATION STATEMENT AND OTHER DOCUMENTS THE ISSUER HAS FILED WITH THE SEC FOR MORE COMPLETE INFORMATION ABOUT THE ISSUER AND THIS OFFERING. YOU MAY GET THESE DOCUMENTS FOR FREE BY VISITING EDGAR ON THE SEC WEB SITE AT WWW.SEC.GOV. ALTERNATIVELY, CREDIT SUISSE WILL ARRANGE TO SEND YOU THE PROSPECTUS IF YOU REQUEST IT BY CALLING TOLL FREE 1-800-221-1037.
STATEMENT REGARDING ASSUMPTIONS AS TO
SECURITIES, PRICING ESTIMATES AND OTHER INFORMATION
This material is for your information, and neither Credit Suisse Securities (USA) LLC nor the other underwriters (collectively, the “Underwriters”) are soliciting any action based upon it. This material is not to be construed as an offer to sell or the solicitation of any offer to buy any security in any jurisdiction where such an offer or solicitation would be illegal.
Neither this document nor anything contained herein shall form the basis for any contract or commitment whatsoever. The information contained herein is preliminary as of the date hereof. These materials are subject to change, completion or amendment from time to time. The information contained herein will be superseded by similar information delivered to you prior to the time of sale, including as part of the Preliminary Prospectus referred to herein relating to the CSAIL 2017-CX9 Commercial Mortgage Trust, Commercial Mortgage Pass-Through Certificates (the “Offering Document”). The information supersedes any such information previously delivered. The information should be reviewed only in conjunction with the entire Offering Document. All of the information contained herein is subject to the same limitations and qualifications contained in the Offering Document. The information contained herein does not contain all relevant information relating to the underlying mortgage loans or mortgaged properties. Such information is described elsewhere in the Offering Document. The information contained herein will be more fully described elsewhere in the Offering Document. The information contained herein should not be viewed as projections, forecasts, predictions or opinions with respect to value. Prior to making any investment decision, prospective investors are strongly urged to read the Offering Document in its entirety. Neither the Securities and Exchange Commission nor any state securities commission has approved or disapproved of these securities or determined if this Free Writing Prospectus is truthful or complete. Any representation to the contrary is a criminal offense.
The attached information contains certain tables and other statistical analyses (the “Computational Materials”) which have been prepared in reliance upon information furnished by the Mortgage Loan Sellers. Numerous assumptions were used in preparing the Computational Materials, which may or may not be reflected herein. As such, no assurance can be given as to the appropriateness of the assumptions used in preparing the Computational Materials, or as to whether the Computational Materials and/or the assumptions upon which they are based reflect present market conditions or future market performance. The Computational Materials should not be construed as either projections or predictions or as legal, tax, financial or accounting advice. You should consult your own counsel, accountant and other advisors as to the legal, tax, business, financial and related aspects of a purchase of these securities. Any weighted average lives, yields and principal payment periods shown in the Computational Materials are based on prepayment and/or loss assumptions, and changes in such prepayment and/or loss assumptions may dramatically affect such weighted average lives, yields and principal payment periods. In addition, it is possible that prepayments or losses on the underlying assets will occur at rates higher or lower than the rates shown in the attached Computational Materials. The specific characteristics of the securities may differ from those shown in the Computational Materials due to differences between the final underlying assets and the preliminary underlying assets used in preparing the Computational Materials. The principal amount and designation of any security described in the Computational Materials are subject to change prior to issuance. None of the Underwriters nor any of their respective affiliates makes any representation or warranty as to the actual rate or timing of payments or losses on any of the underlying assets or the payments or yield on the securities.
This document contains forward-looking statements. Those statements are subject to certain risks and uncertainties that could cause the success of collections and the actual cash flow generated to differ materially from the information set forth herein. While such information reflects projections prepared in good faith based upon methods and data that are believed to be reasonable and accurate as of the dates thereof, the depositor undertakes no obligation to revise these forward-looking statements to reflect subsequent events or circumstances. Individuals should not place undue reliance on forward-looking statements and are advised to make their own independent analysis and determination with respect to the forecasted periods, which reflect the issuer’s view only as of the date hereof.
IMPORTANT NOTICE RELATING TO AUTOMATICALLY GENERATED EMAIL DISCLAIMERS
Any legends, disclaimers or other notices that may appear at the bottom of the email communication to which this Free Writing Prospectus is attached relating to (1) these materials not constituting an offer (or a solicitation of an offer), (2) no representation being made that these materials are accurate or complete and may not be updated or (3) these materials possibly being confidential, are not applicable to these materials and should be disregarded. Such legends, disclaimers or other notices have been automatically generated as a result of these materials having been sent via Bloomberg or another system.
THE INFORMATION IN THIS STRUCTURAL AND COLLATERAL TERM SHEET IS NOT COMPLETE AND MAY BE AMENDED PRIOR TO THE TIME OF SALE. THIS TERM SHEET IS NOT AN OFFER TO SELL THESE SECURITIES AND IT IS NOT A SOLICITATION OF AN OFFER TO BUY THESE SECURITIES IN ANY JURISDICTION WHERE THE OFFER OR SALE IS NOT PERMITTED.
2

Indicative Capital Structure
Publicly Offered Certificates
| Class | Expected Ratings (Fitch/KBRA/S&P) | Approximate Initial Certificate Principal Balance or Notional Amount(1) | Approximate Initial Available Certificate Principal Balance or Notional Amount(1)(2) | Approximate Initial Retained Certificate Principal Balance or Notional Amount(1)(2) | Approximate Initial Credit Support | Expected Weighted Avg. Life (years)(3) | Expected Principal Window(3) | Certificate Principal to Value Ratio(4) | Underwritten NOI Debt Yield(5) |
| A-1 | AAAsf/AAA(sf)/AAA(sf) | $21,973,000 | $21,034,000 | $939,000 | 30.000%(6) | 2.65 | 1 - 57 | 33.4% | 20.7% |
| A-2 | AAAsf/AAA(sf)/AAA(sf) | $233,274,000 | $223,313,000 | $9,961,000 | 30.000%(6) | 4.85 | 57 - 60 | 33.4% | 20.7% |
| A-3 | AAAsf/AAA(sf)/AAA(sf) | $97,756,000 | $93,581,000 | $4,175,000 | 30.000%(6) | 6.86 | 82 - 83 | 33.4% | 20.7% |
| A-4 | AAAsf/AAA(sf)/AAA(sf) | $93,339,000 | $89,353,000 | $3,986,000 | 30.000%(6) | 9.40 | 109 - 115 | 33.4% | 20.7% |
| A-5 | AAAsf/AAA(sf)/AAA(sf) | $140,010,000 | $134,031,000 | $5,979,000 | 30.000%(6) | 9.70 | 115 - 118 | 33.4% | 20.7% |
| A-SB | AAAsf/AAA(sf)/AAA(sf) | $14,861,000 | $14,226,000 | $635,000 | 30.000%(6) | 7.05 | 60 - 109 | 33.4% | 20.7% |
| X-A(7) | AAAsf/AAA(sf)/AAA(sf) | $703,205,000 | $673,174,000 | $30,031,000 | N/A | N/A | N/A | N/A | N/A |
| X-B(7) | A-sf/AAA(sf)/A-(sf) | $73,004,000 | $69,886,000 | $3,118,000 | N/A | N/A | N/A | N/A | N/A |
| A-S | AAAsf/AAA(sf)/AAA(sf) | $101,992,000 | $97,636,000 | $4,356,000 | 18.125% | 9.83 | 118 - 119 | 39.1% | 17.7% |
| B | AA-sf/AA-(sf)/AA-(sf) | $42,943,000 | $41,109,000 | $1,834,000 | 13.125% | 9.88 | 119 - 119 | 41.5% | 16.7% |
| C | A-sf/A-(sf)/A-(sf) | $30,061,000 | $28,777,000 | $1,284,000 | 9.625% | 9.92 | 119 - 120 | 43.1% | 16.0% |
Privately Offered Certificates(8)
| Class | Expected Ratings (Fitch/KBRA/S&P) | Approximate Initial Certificate Principal Balance or Notional Amount(1) | Approximate Initial Available Certificate Principal Balance or Notional Amount(1)(2) | Approximate Initial Retained Certificate Principal Balance or Notional Amount(1)(2) | Approximate Initial Credit Support | Expected Weighted Avg. Life (years)(3) | Expected Principal Window(3) | Certificate Principal to Value Ratio(4) | Underwritten NOI Debt Yield(5) |
| D | BBB-sf/BBB-(sf)/NR | $31,134,000 | $29,804,000 | $1,330,000 | 6.000% | 9.96 | 120 - 120 | 44.9% | 15.4% |
| X-E(7) | BB-sf/BB-(sf)/NR | $18,252,000 | $17,472,000 | $780,000 | N/A | N/A | N/A | N/A | N/A |
| E | BB-sf/BB-(sf)/NR | $18,252,000 | $17,472,000 | $780,000 | 3.875% | 9.96 | 120 - 120 | 45.9% | 15.1% |
| F | B-sf/B(sf)/NR | $8,588,000 | $8,221,000 | $367,000 | 2.875% | 9.96 | 120 - 120 | 46.3% | 14.9% |
| NR | NR/NR/NR | $24,693,503 | $23,639,000 | $1,054,503 | 0.000% | 9.96 | 120 - 120 | 47.7% | 14.5% |
| (1) | Approximate, subject to a variance of plus or minus 5%. |
| (2) | On the Closing Date, the certificates (other than the Class R certificates) with the initial certificate balances or notional amounts, as applicable, set forth in the table under “Approximate Initial Retained Certificate Principal Balance or Notional Amount” are expected to be sold by the Underwriters and Initial Purchasers to Natixis as described in “Credit Risk Retention” in the Preliminary Prospectus relating to the Publicly Offered Certificates dated September 11, 2017 (the “Preliminary Prospectus”). Additionally, with respect to the Class E, Class F and Class NR certificates, the Approximate Initial Available Certificate Principal Balance or Notional Amount of each of the Class E, Class F and Class NR certificates is subject to change based on final pricing of all certificates and the final determination of the portion of the Class F and Class NR certificates that will be retained by the retaining third-party purchaser or its “majority-owned affiliate” as part of the retaining sponsor’s satisfaction of its U.S. risk retention requirements (such retained portion, the “HRR Certificates”). For more information regarding the methodology, key inputs and assumptions used to determine the sizing of the HRR Certificates, see “Credit Risk Retention” in the Preliminary Prospectus. |
| (3) | Assumes 0% CPR / 0% CDR and a September 29, 2017 closing date. Based on “Modeling Assumptions” as described in the Preliminary Prospectus. Capitalized terms used but not defined herein have the meanings ascribed to them in the Preliminary Prospectus. |
| (4) | The “Certificate Principal to Value Ratio” for any class (other than the Class A-1, Class A-2, Class A-3, Class A-4, Class A-5 and Class A-SB certificates) is calculated as the product of (a) the weighted average Cut-off Date LTV Ratio for the mortgage loans, multiplied by (b) a fraction, the numerator of which is the total initial certificate principal balance of such class of certificates and all classes of principal balance certificates senior to such class of certificates and the denominator of which is the total initial certificate principal balance of all of the principal balance certificates. The Class A-1, Class A-2, Class A-3, Class A-4, Class A-5 and Class A-SB Certificate Principal to Value Ratios are calculated in the aggregate for those classes as if they were a single class. Investors should note, however, that excess mortgaged property value associated with a mortgage loan will not be available to offset losses on any other mortgage loan. |
| (5) | The “Underwritten NOI Debt Yield” for any class (other than the Class A-1, Class A-2, Class A-3, Class A-4, Class A-5 and Class A-SB certificates) is calculated as the product of (a) the weighted average UW NOI Debt Yield for the mortgage loans and (b) the total initial certificate principal balance of all of the classes of principal balance certificates divided by the total initial certificate principal balance for such class and all classes of principal balance certificates senior to such class of certificates. The Underwritten NOI Debt Yield for each class of the Class A-1, Class A-2, Class A-3, Class A-4, Class A-5 and Class A-SB certificates is calculated in the aggregate for those classes as if they were a single class. Investors should note, however, that net operating income from any mortgaged property supports only the related mortgage loan and will not be available to support any other mortgage loan. |
| (6) | The credit support percentages set forth for the Class A-1, Class A-2, Class A-3, Class A-4, Class A-5 and Class A-SB certificates are represented in the aggregate. |
| (7) | The notional amounts of the Class X-A, Class X-B and Class X-E certificates (collectively, the “Class X Certificates”) are defined in the Preliminary Prospectus. |
| (8) | The Class Z and Class R certificates are not shown above. |
THE INFORMATION IN THIS STRUCTURAL AND COLLATERAL TERM SHEET IS NOT COMPLETE AND MAY BE AMENDED PRIOR TO THE TIME OF SALE. THIS TERM SHEET IS NOT AN OFFER TO SELL THESE SECURITIES AND IT IS NOT A SOLICITATION OF AN OFFER TO BUY THESE SECURITIES IN ANY JURISDICTION WHERE THE OFFER OR SALE IS NOT PERMITTED.
3
Summary of Transaction Terms
| Securities: | $858,876,503 monthly pay, multi-class, commercial mortgage REMIC Pass-Through Certificates. |
| Managers and Bookrunners: | Credit Suisse Securities (USA) LLC and Natixis Securities Americas LLC, as Co-Lead Managers and Joint Bookrunners. |
| Mortgage Loan Sellers: | Natixis Real Estate Capital LLC (“Natixis”) (49.2%), Column Financial, Inc. (“Column”) (38.8%) and Benefit Street Partners CRE Finance LLC (“BSP”) (12.0%). |
| Master Servicer: | KeyBank National Association (“KeyBank”). |
| Special Servicer: | Rialto Capital Advisors, LLC (“Rialto”). |
| Directing Certificateholder: | RREF III – D AIV RR, LLC or an affiliate of Rialto. |
| Trustee: | Wells Fargo Bank, National Association (“Wells Fargo”). |
| Certificate Administrator: | Wells Fargo. |
| Operating Advisor: | Pentalpha Surveillance LLC (“Pentalpha”). |
| Asset Representations Reviewer: | Pentalpha. |
| U.S. Credit Risk Retention: | For a discussion of the manner by which Natixis, as retaining sponsor, intends to satisfy the credit risk requirements of the Credit Risk Retention Rules, see “Credit Risk Retention” in the Preliminary Prospectus. Note that this securitization transaction is not structured to satisfy the EU risk retention and due diligence requirements. |
| Risk Retention Consultation Party: | Natixis. |
| Closing Date: | On or about September 29, 2017. |
| Cut-off Date: | With respect to each mortgage loan, the respective due date for the monthly debt service payment that is due in September 2017 (or, in the case of any mortgage loan that has its first due date in October 2017, the date that would have been its due date in September 2017 under the terms of that mortgage loan if a monthly payment were scheduled to be due in that month.) |
| Distribution Date: | The 4th business day following each Determination Date, commencing in October 2017. |
| Determination Date: | 11thday of each month, or if the 11th day is not a business day, then the business day immediately following such 11th day, commencing in October 2017. |
| Rated Final Distribution Date: | The Distribution Date in September 2050. |
| Tax Treatment: | The Publicly Offered Certificates are expected to be treated as REMIC regular interests for U.S. federal income tax purposes. |
| Form of Offering: | The Class A-1, Class A-2, Class A-3, Class A-4, Class A-5, Class A-SB, Class X-A, Class X-B, Class A-S, Class B and Class C certificates will be offered publicly (the “Publicly Offered Certificates”). The Class X-E, Class D, Class E, Class F, Class NR and Class R certificates (the “Privately Offered Certificates”) and the Class Z certificates will be offered domestically to Qualified Institutional Buyers and to Institutional Accredited Investors and to institutions that are not U.S. Persons pursuant to Regulation S. |
| SMMEA Status: | The certificates willnot constitute “mortgage related securities” for purposes of SMMEA. |
| ERISA: | The Publicly Offered Certificates are expected to be ERISA eligible. |
| Optional Termination: | 1% clean-up call. |
| Minimum Denominations: | The Publicly Offered Certificates (other than the Class X-A and Class X-B certificates) will be issued in minimum denominations of $10,000 and integral multiples of $1 in excess of $10,000. The Class X-A and Class X-B certificates will be issued in minimum denominations of $1,000,000 and in integral multiples of $1 in excess of $1,000,000. |
| Settlement Terms: | DTC, Euroclear and Clearstream Banking. |
| Analytics: | The transaction is expected to be available on Bloomberg Financial Markets, L.P., CMBS.com, Inc., Thomson Reuters Corporation, Trepp, LLC, Intex Solutions, Inc., Moody’s Analytics and BlackRock Financial Management, Inc. |
THE INFORMATION IN THIS STRUCTURAL AND COLLATERAL TERM SHEET IS NOT COMPLETE AND MAY BE AMENDED PRIOR TO THE TIME OF SALE. THIS TERM SHEET IS NOT AN OFFER TO SELL THESE SECURITIES AND IT IS NOT A SOLICITATION OF AN OFFER TO BUY THESE SECURITIES IN ANY JURISDICTION WHERE THE OFFER OR SALE IS NOT PERMITTED.
4
Collateral Characteristics
| Loan Pool | |
| Initial Pool Balance (“IPB”)(1): | $858,876,504 |
| Number of Mortgage Loans: | 31 |
| Number of Mortgaged Properties: | 70 |
| Average Cut-off Date Balance per Mortgage Loan: | $27,705,694 |
| Weighted Average Current Mortgage Rate(2): | 4.1763% |
| 10 Largest Mortgage Loans as % of IPB: | 60.5% |
| Weighted Average Remaining Term to Maturity(3): | 97 |
| Weighted Average Seasoning: | 2 |
| Credit Statistics | |
| Weighted Average UW NCF DSCR(4)(5): | 3.11 |
| Weighted Average UW NOI Debt Yield(4): | 14.5% |
| Weighted Average Cut-off Date LTV(4)(6): | 47.7% |
| Weighted Average Maturity Date LTV(3)(4)(6): | 44.9% |
| Other Statistics | |
| % of Credit Assessment Mortgage Loans(7): | 52.1% |
| % of Mortgage Loans with Additional Debt: | 44.9% |
| % of Mortgaged Properties with Single Tenants: | 10.9% |
| Amortization | |
| Weighted Average Original Amortization Term(8): | 350 |
| Weighted Average Remaining Amortization Term(8): | 349 |
| % of Mortgage Loans with Interest-Only: | 61.4% |
| % of Mortgage Loans with Amortizing Balloon: | 26.2% |
| % of Mortgage Loans with Partial Interest-Only followed by Amortizing Balloon: | 9.6% |
| % of Mortgage Loans with IO-Balloon, ARD: | 2.8% |
| Cash Management(9) | |
| % of Mortgage Loans with In-Place, Hard Lockboxes: | 83.1% |
| % of Mortgage Loans with In-Place, Soft Springing Hard Lockboxes: | 7.9% |
| % of Mortgage Loans with Springing Lockbox: | 6.2% |
| % of Mortgage Loans with No Lockbox: | 2.9% |
| Reserves | |
| % of Mortgage Loans Requiring Upfront or Ongoing Tax Reserves: | 65.4% |
| % of Mortgage Loans Requiring Upfront or Ongoing Insurance Reserves: | 64.2% |
| % of Mortgage Loans Requiring Upfront or Ongoing CapEx Reserves(10): | 63.2% |
| % of Mortgage Loans Requiring Upfront or Ongoing TI/LC Reserves(11): | 49.6% |
| (1) | Subject to a permitted variance of plus or minus 5%. |
| (2) | The Loan No. 11 Mortgage Loan accrues interest at an interest rate that increases over time as set forth on Annex H of the Preliminary Prospectus. The Mortgage Rate shown is the interest rate on September 9, 2017. |
| (3) | In the case of Loan No. 16, with an anticipated repayment date, Remaining Loan Term and Maturity Date LTV are calculated through or as of, as applicable, the related anticipated repayment date. |
| (4) | In the case of Loan Nos. 1, 2, 3, 4, 5, 7, 9, 10, 11, 13, 15, 18, 20, and 23, the UW NCF DSCR, UW NOI Debt Yield, Cut-off Date LTV and Maturity Date LTV calculations include the relatedpari passu companion loan(s). In the case of Loan Nos. 3, 4, 7, 8, 9, 11, 13, and 18, the UW NCF DSCR, UW NOI Debt Yield, Cut-off Date LTV and Maturity Date LTV calculations exclude the subordinate companion loan(s) or other subordinate indebtedness. In the case of Loan Nos. 4, 6, 8, 9, 11, and 22, the UW NCF DSCR, UW NOI Debt Yield, Cut-off Date LTV and Maturity Date LTV calculations exclude the mezzanine loan. |
| (5) | For each partial interest-only mortgage loan, the UW NCF DSCR is calculated using the first principal and interest payment to be made into the trust during the term of the mortgage loan once amortization has commenced. In the case of Loan Nos. 6, 11, 13, 22, the loans pay according to a fixed amortization schedule. |
| (6) | In the case of Loan Nos. 8, 12, and 20, the Cut-off Date LTV and Maturity Date LTV are calculated based upon an “as stabilized” appraised value. In the case of Loan Nos. 16, the Cut-off Date LTV and Maturity Date LTV are calculated based upon a portfolio level appraised value. In the case of Loan No. 18 and 24, the Cut-off Date LTV and Maturity Date LTV are calculated based upon “as-complete” appraised values. |
| (7) | Includes loans that at least one of Fitch, KBRA or S&P have confirmed, in the context of its inclusion in the Initial Pool Balance, have credit characteristics consistent with an investment grade credit. However, it should be noted that S&P does not provide credit assessments on underlying loans. |
| (8) | Excludes twelve (12) mortgage loans that are interest-only or interest-only, ARD for the entire term. |
| (9) | For a detailed description of cash management, refer to“Description of the Mortgage Pool—Certain Terms of the Mortgage Loans—Mortgaged Property Accounts—Lockbox Accounts” in the Preliminary Prospectus. |
| (10) | CapEx Reserves include FF&E reserves for hospitality properties. |
| (11) | Calculated only with respect to Cut-off Date Balance of mortgage loans secured by industrial, office, mixed use and retail properties. |
THE INFORMATION IN THIS STRUCTURAL AND COLLATERAL TERM SHEET IS NOT COMPLETE AND MAY BE AMENDED PRIOR TO THE TIME OF SALE. THIS TERM SHEET IS NOT AN OFFER TO SELL THESE SECURITIES AND IT IS NOT A SOLICITATION OF AN OFFER TO BUY THESE SECURITIES IN ANY JURISDICTION WHERE THE OFFER OR SALE IS NOT PERMITTED.
5
Collateral Characteristics
| Originator | Sponsor | Number of Mortgage Loans | Number of Mortgaged Properties | Aggregate Cut-off Date Balance | % of IPB |
| Natixis(1) (2) | Natixis | 15 | 46 | $422,693,892 | 49.2% |
| Column(1)(3)(4)(5) | Column | 8 | 8 | 332,888,177 | 38.8 |
| BSP | BSP | 8 | 16 | 103,294,435 | 12.0 |
| Total: | 31 | 70 | $858,876,504 | 100.0% |
| (1) | Loan No. 3, originated by Column, represents approximately 6.4% of the IPB. Note A-3-B, representing approximately 2.9% of IPB, was acquired by Natixis from Column. Note A-2, representing approximately 3.5% of the IPB, is held by Column. |
| (2) | Loan No. 4, originated by Natixis, representing approximately 6.3% of IPB, is part of a whole loan that was co-originated by JPMorgan Chase Bank, National Association, Natixis, Société Générale, Deutsche Bank AG, New York Branch and Barclays Bank PLC. |
| (3) | Loan No. 2, originated by Column, representing approximately 7.9% of IPB, is part of a whole loan that was co-originated by Column and Wells Fargo Bank, National Association. |
| (4) | Loan No. 13, originated by Column, representing approximately 3.5% of IPB, is part of a whole loan that was co-originated by Column and JPMorgan Chase Bank, National Association. |
| (5) | Loan No. 26, originated by Column, representing approximately 0.9% of IPB, and was co-originated by Column and SSC MBS, LLC. |
Ten Largest Mortgage Loans
| No. | Loan Name | Mortgage Loan Seller | No. of Properties | Cut-off Date Balance | % of IPB | SF/ Rooms/ Units | Property Type | UW NCF DSCR(1)(2) | UW NOI Debt Yield(1) | Cut-off Date LTV(3) | Maturity Date LTV(3) | Credit Assessment (Fitch/KBRA)(4) |
| 1 | Park Center Phase I | Column | 1 | $80,000,000 | 9.3% | 590,926 | Office | 3.17x | 10.8% | 51.4% | 51.4% | (NR/NR) |
| 2 | Westin Building Exchange | Column | 1 | 67,500,000 | 7.9 | 401,544 | Office | 7.20x | 24.7% | 26.6% | 26.6% | (AAA/AA) |
| 3 | Two Independence Square | Column / Natixis | 1 | 55,000,000 | 6.4 | 605,897 | Office | 3.80x | 12.5% | 43.7% | 43.7% | (A-/BBB-) |
| 4 | 245 Park Avenue | Natixis | 1 | 54,000,000 | 6.3 | 1,723,993 | Office | 2.73x | 10.7% | 48.9% | 48.9% | (BBB-/BBB) |
| 5 | The Boulders Resort & Spa | Column | 1 | 50,000,000 | 5.8 | 160 | Hotel | 1.61x | 13.2% | 56.0% | 52.0% | (NR/NR) |
| 6 | Hilton Glendale | Column | 1 | 47,204,053 | 5.5 | 351 | Hotel | 1.83x | 13.6% | 63.4% | 58.8% | (NR/NR) |
| 7 | 85 Broad Street | Natixis | 1 | 45,000,000 | 5.2 | 1,118,512 | Office | 4.11x | 15.3% | 25.9% | 25.9% | (BBB-/BBB+) |
| 8 | Allergan HQ | Natixis | 1 | 45,000,000 | 5.2 | 453,680 | Office | 4.45x | 19.4% | 26.2% | 26.2% | (NR/A) |
| 9 | JW Marriott Chicago | Natixis | 1 | 40,000,000 | 4.7 | 610 | Hotel | 5.64x | 26.8% | 21.4% | 21.4% | (NR/BBB) |
| 10 | 300 Montgomery | Natixis | 1 | 36,000,000 | 4.2 | 192,574 | Office | 2.56x | 9.6% | 55.2% | 55.2% | (NR/NR) |
| Top 3 Total/Weighted Average | 3 | $202,500,000 | 23.6% | 4.68x | 15.9% | 41.1% | 41.1% | |||||
| Top 5 Total/Weighted Average | 5 | $306,500,000 | 35.7% | 3.84x | 14.5% | 44.9% | 44.2% | |||||
| Top 10 Total/Weighted Average | 10 | $519,704,053 | 60.5% | 3.78x | 15.5% | 42.2% | 41.4% | |||||
| (1) | In the case of Loan Nos. 1, 2, 3, 4, 5, 7, 9, and 10, the UW NCF DSCR, UW NOI Debt Yield, Cut-off Date LTV and Maturity Date LTV calculations include the related pari passu companion loan(s). In the case of Loan Nos. 3, 4, 7, 8, and 9, the UW NCF DSCR, UW NOI Debt Yield, Cut-off Date LTV and Maturity Date LTV calculations exclude the subordinate companion loan(s) or other subordinate indebtedness. In the case of Loan Nos. 4, 6, 8, and 9, the UW NCF DSCR, UW NOI Debt Yield, Cut-off Date LTV and Maturity Date LTV calculations exclude the mezzanine loan. |
| (2) | For each partial interest-only mortgage loan, the UW NCF DSCR is calculated using the first principal and interest payment to be made into the trust during the term of the mortgage loan once amortization has commenced. |
| (3) | In the case of Loan No. 8, the Cut-off Date LTV and Maturity Date LTV are calculated based upon “as stabilized” appraised value. |
| (4) | Fitch and KBRA have each confirmed that, in the context of its inclusion in the Initial Pool Balance, the respective loans have credit characteristics consistent with an investment grade obligation, as noted. S&P does not provide credit assessments on underlying loans. |
THE INFORMATION IN THIS STRUCTURAL AND COLLATERAL TERM SHEET IS NOT COMPLETE AND MAY BE AMENDED PRIOR TO THE TIME OF SALE. THIS TERM SHEET IS NOT AN OFFER TO SELL THESE SECURITIES AND IT IS NOT A SOLICITATION OF AN OFFER TO BUY THESE SECURITIES IN ANY JURISDICTION WHERE THE OFFER OR SALE IS NOT PERMITTED.
6
Whole Loan Summary
| No. | Loan Name | Trust Cut-off Date Balance | Pari Passu Companion Loan Cut-off Date Balance | Whole Loan Cut-off Date Balance(1)(2) | Lead Pooling and Servicing Agreement | Master Servicer | Special Servicer |
| 1 | Park Center Phase I | $80,000,000 | $78,000,000 | $158,000,000 | CSAIL 2017-CX9 | KeyBank | Rialto |
| 2 | Westin Building Exchange | $67,500,000 | $67,500,000 | $135,000,000 | CSAIL 2017-CX9 | KeyBank | Rialto |
| 3 | Two Independence Square | $55,000,000 | $109,000,000 | $225,700,000 | CSMC 2017-MOON | KeyBank | Aegon USA Realty Advisors, LLC |
| 4 | 245 Park Avenue | $54,000,000 | $1,026,000,000 | $1,200,000,000 | 245 Park Avenue Trust 2017-245P | Wells Fargo | Aegon USA Realty Advisors, LLC |
| 5 | The Boulders Resort & Spa | $50,000,000 | $23,000,000 | $73,000,000 | CSAIL 2017-CX9 | KeyBank | Rialto |
| 7 | 85 Broad Street | $45,000,000 | $124,000,000 | $358,600,000 | CSAIL 2017-C8 | Wells Fargo | Midland Loan Services |
| 9 | JW Marriott Chicago | $40,000,000 | $39,300,000 | $203,500,000 | CSAIL 2017-CX9 | KeyBank | Rialto |
| 10 | 300 Montgomery | $36,000,000 | $30,000,000 | $66,000,000 | CSAIL 2017-CX9 | KeyBank | Rialto |
| 11 | Center 78 | $35,863,277 | $28,000,000 | $68,800,000 | CSAIL 2017-CX9 | KeyBank | Rialto |
| 13 | West Town Mall | $30,000,000 | $93,900,000 | $210,000,000 | WTOWN 2017-KNOX | Wells Fargo | Wells Fargo |
| 15 | Acropolis Garden | $25,000,000 | $20,000,000 | $45,000,000 | CSAIL 2017-CX9 | KeyBank | Rialto |
| 18 | Carolina Hotel Portfolio | $20,000,000 | $16,500,000 | $36,500,000 | CSAIL 2017-CX9 | KeyBank | Rialto |
| 20 | Apex Fort Washington | $16,750,000 | $37,750,000 | $54,500,000 | CSAIL 2017-CX9 | KeyBank | Rialto |
| 23 | IC Leased Fee Hotel Portfolio | $11,465,000 | $51,000,000 | $62,465,000 | UBS 2017-C3 | Midland Loan Services | Midland Loan Services |
| (1) | In the case of Loan Nos. 3, 4, 7, 9, 11, and 13, includes subordinate debt of one or more B notes. |
| (2) | In the case of Loan Nos. 4, 9, and 11, excludes one or more mezzanine loans. |
Additional Debt Summary
| No. | Loan Name | Trust Cut-off Date Balance | Subordinate and Mezzanine Debt Cut-off Date Balance(1) | Total Debt Cut-off Date Balance(1)(2) | Mortgage Loan UW NCF DSCR | Total Debt UW NCF DSCR | Mortgage Loan Cut-off Date LTV | Total Debt Cut-off Date LTV | Mortgage Loan UW NOI Debt Yield | Total Debt UW NOI Debt Yield |
| 3 | Two Independence Square | $55,000,000 | $61,700,000 | $225,700,000 | 3.80x | 2.76x | 43.7% | 60.2% | 12.5% | 9.1% |
| 4 | 245 Park Avenue | $54,000,000 | $688,000,000 | $1,768,000,000 | 2.73x | 1.42x | 48.9% | 80.0% | 10.7% | 6.5% |
| 6 | Hilton Glendale | $47,204,053 | $5,244,895 | $52,448,947 | 1.83x | 1.54x | 63.4% | 70.4% | 13.6% | 12.2% |
| 7 | 85 Broad Street | $45,000,000 | $189,600,000 | $358,600,000 | 4.11x | 1.75x | 25.9% | 55.0% | 15.3% | 7.2% |
| 8 | Allergan HQ | $45,000,000 | $70,000,000 | $115,000,000 | 4.45x | 1.01x | 26.2% | 66.9% | 19.4% | 7.6% |
| 9 | JW Marriott Chicago | $40,000,000 | $190,700,000 | $270,000,000 | 5.64x | 1.26x | 21.4% | 72.9% | 26.8% | 7.9% |
| 11 | Center 78 | $35,863,277 | $16,836,723 | $80,700,000 | 1.86x | 1.08x | 67.4% | 85.1% | 9.9% | 7.9% |
| 13 | West Town Mall | $30,000,000 | $86,100,000 | $210,000,000 | 2.40x | 1.67x | 33.0% | 56.0% | 18.2% | 10.8% |
| 18 | Carolina Hotel Portfolio | $20,000,000 | $8,230,000 | $44,730,000 | 1.87x | 1.36x | 65.9% | 80.8% | 15.5% | 12.7% |
| 22 | Tenalok Portfolio | $13,558,191 | $4,948,245 | $18,506,436 | 2.02x | 1.20x | 48.0% | 65.5% | 14.2% | 10.4% |
| (1) | In the case of Loan Nos. 4, 6, 8, 9, 11, and 22, includes one or more mezzanine loans. In the case of Loan Nos. 3, 4, 7, 8, 9, 11, 13, and 18, the subordinate debt includes one or more B notes, secured debt and unsecured debt. |
| (2) | Includes the mortgage loan in this securitization,pari passu loans, subordinate debt and mezzanine debt. |
THE INFORMATION IN THIS STRUCTURAL AND COLLATERAL TERM SHEET IS NOT COMPLETE AND MAY BE AMENDED PRIOR TO THE TIME OF SALE. THIS TERM SHEET IS NOT AN OFFER TO SELL THESE SECURITIES AND IT IS NOT A SOLICITATION OF AN OFFER TO BUY THESE SECURITIES IN ANY JURISDICTION WHERE THE OFFER OR SALE IS NOT PERMITTED.
7
Mortgaged Properties by Type(1)
| Weighted Average | ||||||||||
| Property Type | Property Subtype | Number of Properties | Cut-off Date Principal Balance | % of IPB | Occupancy | UW NCF DSCR(2)(3) | UW NOI Debt Yield(2) | Cut-off Date LTV(2)(4) | Maturity Date LTV(2)(4) | |
| Office | ||||||||||
| CBD | 4 | $202,500,000 | 23.6 | % | 90.6% | 4.49x | 16.2% | 37.5% | 37.5% | |
| Suburban | 6 | 197,477,021 | 23.0 | 95.9% | 2.93x | 12.8% | 50.6% | 48.8% | ||
| Single Tenant | 1 | 55,000,000 | 6.4 | 100.0% | 3.80x | 12.5% | 43.7% | 43.7% | ||
| Subtotal | 11 | $454,977,021 | 53.0 | % | 94.0% | 3.73x | 14.3% | 43.9% | 43.2% | |
| Hotel | ||||||||||
| Full Service | 3 | $107,638,177 | 12.5 | % | 77.7% | 3.21x | 18.3% | 46.1% | 43.4% | |
| Limited Service | 12 | 51,217,310 | 6.0 | 67.3% | 1.78x | 14.4% | 61.8% | 52.1% | ||
| Resort | 1 | 50,000,000 | 5.8 | 73.8% | 1.61x | 13.2% | 56.0% | 52.0% | ||
| Subtotal | 16 | $208,855,487 | 24.3 | % | 74.2% | 2.48x | 16.1% | 52.3% | 47.6% | |
| Retail | ||||||||||
| Single Tenant | 26 | $31,872,500 | 3.7 | % | 100.0% | 1.99x | 12.5% | 50.9% | 46.8% | |
| Super Regional Mall | 1 | 30,000,000 | 3.5 | 93.1% | 2.40x | 18.2% | 33.0% | 30.7% | ||
| Shadow Anchored | 1 | 29,473,305 | 3.4 | 88.6% | 1.52x | 9.9% | 74.3% | 59.8% | ||
| Anchored | 4 | 13,558,191 | 1.6 | 96.5% | 2.02x | 14.2% | 48.0% | 37.2% | ||
| Subtotal | 32 | $104,903,996 | 12.2 | % | 94.4% | 1.98x | 13.6% | 52.0% | 44.6% | |
| Multifamily | ||||||||||
| Cooperative | 1 | $25,000,000 | 2.9 | % | N/A | 5.31x | 20.4% | 25.4% | 25.4% | |
| Garden | 1 | 15,000,000 | 1.7 | 95.4% | 1.46x | 11.4% | 54.5% | 40.4% | ||
| Subtotal | 2 | $40,000,000 | 4.7 | % | 95.4% | 3.87x | 17.0% | 36.3% | 31.0% | |
| Mixed Use | ||||||||||
| Office/Retail | 1 | $32,875,000 | 3.8 | % | 95.8% | 1.75x | 8.2% | 62.4% | 62.4% | |
| Subtotal | 1 | $32,875,000 | 3.8 | % | 95.8% | 1.75x | 8.2% | 62.4% | 62.4% | |
| Other | ||||||||||
| Leased Fee | 7 | $11,465,000 | 1.3 | % | 100.0% | 1.67x | 8.5% | 73.2% | 73.2% | |
| Subtotal | 7 | $11,465,000 | 1.3 | % | 100.0% | 1.67x | 8.5% | 73.2% | 73.2% | |
| Industrial | ||||||||||
| Flex | 1 | $5,800,000 | 0.7 | % | 92.4% | 2.57x | 17.4% | 46.4% | 37.3% | |
| Subtotal | 1 | $5,800,000 | 0.7 | % | 92.4% | 2.57x | 17.4% | 46.4% | 37.3% | |
| Total / Wtd. Avg.: | 70 | $858,876,504 | 100.0 | % | 89.3% | 3.11x | 14.5% | 47.7% | 44.9% | |
| (1) | Because this table presents information relating to the mortgaged properties and not mortgage loans, the information for mortgage loans secured by more than one mortgaged property is based on allocated loan amounts. |
| (2) | In the case of Loan Nos. 1, 2, 3, 4, 5, 7, 9, 10, 11, 13, 15, 18, 20, and 23, the UW NCF DSCR, UW NOI Debt Yield, Cut-off Date LTV and Maturity Date LTV calculations include the related pari passu companion loan(s). In the case of Loan Nos. 3, 4, 7, 8, 9, 11, 13, and 18, the UW NCF DSCR, UW NOI Debt Yield, Cut-off Date LTV and Maturity Date LTV calculations exclude the subordinate companion loan(s) or other subordinate indebtedness. In the case of Loan Nos. 4, 6, 8, 9, 11, and 22, the UW NCF DSCR, UW NOI Debt Yield, Cut-off Date LTV and Maturity Date LTV calculations exclude the mezzanine loan. In the case of Loan No. 16, with an anticipated repayment date, Maturity Date LTV, is calculated through or as of, as applicable, the related anticipated repayment date. |
| (3) | For each partial interest-only mortgage loan, the UW NCF DSCR is calculated using the first principal and interest payment to be made into the trust during the term of the mortgage loan once amortization has commenced. In the case of Loan Nos. 6, 11, 13, 22, the loans pay according to a fixed amortization schedule. |
| (4) | In the case of Loan No. 8, 12, and 20, the Cut-off Date LTV and Maturity Date LTV are calculated based upon an “as stabilized” appraised value. In the case of Loan No. 16, the Cut-off Date LTV and Maturity Date LTV are calculated based upon a portfolio level appraised value. In the case of Loan No. 18 and 24, the Cut-off Date LTV and Maturity Date LTV are calculated based upon “as-complete” appraised values. |
THE INFORMATION IN THIS STRUCTURAL AND COLLATERAL TERM SHEET IS NOT COMPLETE AND MAY BE AMENDED PRIOR TO THE TIME OF SALE. THIS TERM SHEET IS NOT AN OFFER TO SELL THESE SECURITIES AND IT IS NOT A SOLICITATION OF AN OFFER TO BUY THESE SECURITIES IN ANY JURISDICTION WHERE THE OFFER OR SALE IS NOT PERMITTED.
8
| 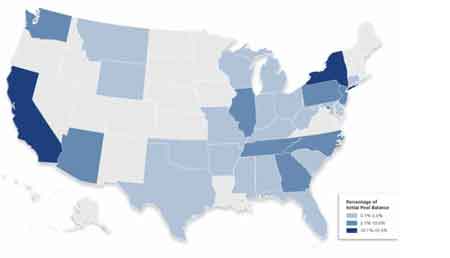 |
Mortgaged Properties by Location(1)
| State | Number of Properties | Cut-off Date Principal Balance | % of IPB | Weighted Average | ||||
| Occupancy | UW NCF DSCR(2)(3) | UW NOI Debt Yield(2) | Cut-off Date LTV(2)(4) | Maturity Date LTV(2)(4) | ||||
| CA | 4 | $133,111,483 | 15.5% | 83.3% | 1.93x | 11.5% | 62.2% | 56.8% |
| NY | 4 | 125,541,759 | 14.6 | 89.4% | 3.72x | 14.3% | 36.3% | 36.3% |
| D.C. | 2 | 87,875,000 | 10.2 | 98.4% | 3.03x | 10.9% | 50.7% | 50.7% |
| NJ | 2 | 80,863,277 | 9.4 | 93.9% | 3.30x | 15.2% | 44.4% | 44.4% |
| GA | 1 | 80,000,000 | 9.3 | 99.5% | 3.17x | 10.8% | 51.4% | 51.4% |
| WA | 1 | 67,500,000 | 7.9 | 94.1% | 7.20x | 24.7% | 26.6% | 26.6% |
| AZ | 1 | 50,000,000 | 5.8 | 73.8% | 1.61x | 13.2% | 56.0% | 52.0% |
| IL | 3 | 46,022,500 | 5.4 | 79.2% | 5.12x | 24.6% | 26.0% | 25.4% |
| TN | 3 | 39,646,616 | 4.6 | 94.8% | 2.31x | 17.2% | 36.7% | 32.3% |
| PA | 4 | 38,522,054 | 4.5 | 93.6% | 1.62x | 12.0% | 57.5% | 46.9% |
| NC | 7 | 37,757,551 | 4.4 | 85.4% | 1.81x | 14.0% | 63.3% | 54.5% |
| OH | 11 | 12,695,256 | 1.5 | 100.0% | 2.12x | 13.1% | 49.5% | 45.4% |
| TX | 1 | 9,650,000 | 1.1 | 81.8% | 1.78x | 12.8% | 65.2% | 53.6% |
| AR | 4 | 7,767,310 | 0.9 | 42.5% | 1.69x | 14.6% | 52.6% | 45.2% |
| FL | 1 | 7,750,000 | 0.9 | 79.3% | 1.67x | 13.2% | 62.0% | 48.1% |
| MS | 1 | 6,050,000 | 0.7 | 40.8% | 1.72x | 14.6% | 54.5% | 42.1% |
| IN | 4 | 4,261,037 | 0.5 | 100.0% | 1.87x | 11.7% | 50.3% | 46.2% |
| MI | 3 | 3,274,533 | 0.4 | 100.0% | 2.12x | 13.1% | 49.5% | 45.4% |
| SC | 1 | 3,178,082 | 0.4 | 60.2% | 1.87x | 15.5% | 65.9% | 58.5% |
| WI | 1 | 2,953,662 | 0.3 | 100.0% | 1.67x | 8.5% | 73.2% | 73.2% |
| MO | 1 | 2,892,175 | 0.3 | 100.0% | 1.67x | 8.5% | 73.2% | 73.2% |
| OK | 1 | 2,106,958 | 0.2 | 77.5% | 2.02x | 14.2% | 48.0% | 37.2% |
| KY | 2 | 1,873,839 | 0.2 | 100.0% | 2.12x | 13.1% | 49.5% | 45.4% |
| AL | 1 | 1,804,617 | 0.2 | 100.0% | 2.02x | 14.2% | 48.0% | 37.2% |
| CT | 1 | 1,233,408 | 0.1 | 100.0% | 1.67x | 8.5% | 73.2% | 73.2% |
| WY | 1 | 1,221,477 | 0.1 | 100.0% | 1.67x | 8.5% | 73.2% | 73.2% |
| DE | 1 | 1,044,665 | 0.1 | 100.0% | 2.12x | 13.1% | 49.5% | 45.4% |
| MD | 1 | 1,007,188 | 0.1 | 100.0% | 2.12x | 13.1% | 49.5% | 45.4% |
| WV | 1 | 721,428 | 0.1 | 100.0% | 2.12x | 13.1% | 49.5% | 45.4% |
| MT | 1 | 550,628 | 0.1 | 100.0% | 1.67x | 8.5% | 73.2% | 73.2% |
| Total/ Wtd. Avg.: | 70 | $858,876,504 | 100.0% | 89.3% | 3.11x | 14.5% | 47.7% | 44.9% |
| (1) | Because this table presents information relating to the mortgaged properties and not mortgage loans, the information for mortgage loans secured by more than one mortgaged property is based on allocated loan amounts. |
| (2) | In the case of Loan Nos. 1, 2, 3, 4, 5, 7, 9, 10, 11, 13, 15, 18, 20, and 23, the UW NCF DSCR, UW NOI Debt Yield, Cut-off Date LTV and Maturity Date LTV calculations include the related pari passu companion loan(s). In the case of Loan Nos. 3, 4, 7, 8, 9, 11, 13, and 18, the UW NCF DSCR, UW NOI Debt Yield, Cut-off Date LTV and Maturity Date LTV calculations exclude the subordinate companion loan(s) or other subordinate indebtedness. In the case of Loan Nos. 4, 6, 8, 9, 11, and 22, the UW NCF DSCR, UW NOI Debt Yield, Cut-off Date LTV and Maturity Date LTV calculations exclude the mezzanine loan. In the case of Loan No. 16, with an anticipated repayment date, Maturity Date LTV, is calculated through or as of, as applicable, the related anticipated repayment date. |
| (3) | For each partial interest-only mortgage loan, the UW NCF DSCR is calculated using the first principal and interest payment to be made into the trust during the term of the mortgage loan once amortization has commenced. In the case of Loan Nos. 6, 11, 13, 22, the loans pay according to a fixed amortization schedule. |
| (4) | In the case of Loan No. 8, 12, and 20, the Cut-off Date LTV and Maturity Date LTV are calculated based upon an “as stabilized” appraised value. In the case of Loan No. 16, the Cut-off Date LTV and Maturity Date LTV are calculated based upon a portfolio level appraised value. In the case of Loan No. 18 and 24, the Cut-off Date LTV and Maturity Date LTV are calculated based upon “as-complete” appraised values. |
THE INFORMATION IN THIS STRUCTURAL AND COLLATERAL TERM SHEET IS NOT COMPLETE AND MAY BE AMENDED PRIOR TO THE TIME OF SALE. THIS TERM SHEET IS NOT AN OFFER TO SELL THESE SECURITIES AND IT IS NOT A SOLICITATION OF AN OFFER TO BUY THESE SECURITIES IN ANY JURISDICTION WHERE THE OFFER OR SALE IS NOT PERMITTED.
9
Cut-off Date Principal Balance
| Weighted Average | |||||||||||||||||||
| Range of Principal Balances | Number of Loans | Cut-off Date Principal Balance | % of IPB | Mortgage Rate(1) | Remaining Loan Term(2) | UW NCF DSCR(3)(4) | UW NOI Debt Yield(3) | Cut-off Date LTV(3)(5) | Maturity Date LTV(2)(3)(5) | ||||||||||
| $1,900,000 - $9,999,999 | 8 | $44,939,810 | 5.2 | % | 5.2125% | 118 | 1.81x | 13.6% | 56.9% | 47.1% | |||||||||
| $10,000,000 - $14,999,999 | 2 | 25,023,191 | 2.9 | 4.5677% | 116 | 1.86x | 11.6% | 59.6% | 53.7% | ||||||||||
| $15,000,000 - $19,999,999 | 3 | 51,613,744 | 6.0 | 4.9951% | 116 | 1.57x | 11.7% | 60.1% | 49.2% | ||||||||||
| $20,000,000 - $34,999,999 | 7 | 181,732,430 | 21.2 | 4.5514% | 98 | 2.36x | 13.8% | 52.2% | 47.7% | ||||||||||
| $35,000,000 - $49,999,999 | 6 | 249,067,330 | 29.0 | 4.0724% | 97 | 3.44x | 16.0% | 42.5% | 41.7% | ||||||||||
| $50,000,000 - $80,000,000 | 5 | 306,500,000 | 35.7 | 3.7164% | 88 | 3.84x | 14.5% | 44.9% | 44.2% | ||||||||||
| Total/Wtd. Avg.: | 31 | $858,876,504 | 100.0 | % | 4.1763% | 97 | 3.11x | 14.5% | 47.7% | 44.9% | |||||||||
Mortgage Interest Rates
| Weighted Average | |||||||||||||||||||
| Range of Mortgage Interest Rates | Number of Loans | Cut-off Date Principal Balance | % of IPB | Mortgage Rate(1) | Remaining Loan Term(2) | UW NCF DSCR(3)(4) | UW NOI Debt Yield(3) | Cut-off Date LTV(3)(5) | Maturity Date LTV(2)(3)(5) | ||||||||||
| 3.2300% - 3.9999% | 7 | $362,500,000 | 42.2 | % | 3.4211% | 101 | 4.15x | 14.7% | 40.7% | 40.7% | |||||||||
| 4.0000% - 4.4999% | 8 | 232,569,773 | 27.1 | 4.2381% | 99 | 3.05x | 15.9% | 45.6% | 42.6% | ||||||||||
| 4.5000% - 4.9999% | 9 | 131,340,297 | 15.3 | 4.8482% | 97 | 1.81x | 12.9% | 59.0% | 51.4% | ||||||||||
| 5.0000% - 5.4999% | 4 | 98,649,125 | 11.5 | 5.3304% | 75 | 1.58x | 12.1% | 59.2% | 54.9% | ||||||||||
| 5.5000% - 6.3300% | 3 | 33,817,310 | 3.9 | 5.8687% | 96 | 1.80x | 15.2% | 60.8% | 52.5% | ||||||||||
| Total/Wtd. Avg.: | 31 | $858,876,504 | 100.0 | % | 4.1763% | 97 | 3.11x | 14.5% | 47.7% | 44.9% | |||||||||
Original Term to Maturity/ARD in Months
| Weighted Average | |||||||||||||||||||
| Original Term to Maturity/ARD in Months | Number of Loans | Cut-off Date Principal Balance | % of IPB | Mortgage Rate(1) | Remaining Loan Term(2) | UW NCF DSCR(3)(4) | UW NOI Debt Yield(3) | Cut-off Date LTV(3)(5) | Maturity Date LTV(2)(3)(5) | ||||||||||
| 60 | 6 | $242,638,177 | 28.3 | % | 4.4601% | 59 | 2.91x | 15.9% | 46.0% | 43.7% | |||||||||
| 84 | 2 | 100,000,000 | 11.6 | 3.8080% | 83 | 2.91x | 11.8% | 54.3% | 52.8% | ||||||||||
| 120 | 23 | 516,238,327 | 60.1 | 4.1142% | 117 | 3.24x | 14.3% | 47.2% | 44.0% | ||||||||||
| Total/Wtd. Avg.: | 31 | $858,876,504 | 100.0 | % | 4.1763% | 97 | 3.11x | 14.5% | 47.7% | 44.9% | |||||||||
| (1) | The Loan No. 11 accrues interest at an interest rate that increases over time as set forth on Annex H of the Preliminary Prospectus. The Mortgage Rate shown is the interest rate on September 9, 2017. |
| (2) | In the case of Loan No. 16, with an anticipated repayment date, Remaining Loan Term and Maturity Date LTV are calculated through or as of, as applicable, the related anticipated repayment date. |
| (3) | In the case of Loan Nos. 1, 2, 3, 4, 5, 7, 9, 10, 11, 13, 15, 18, 20, and 23, the UW NCF DSCR, UW NOI Debt Yield, Cut-off Date LTV and Maturity Date LTV calculations include the related pari passu companion loan(s). In the case of Loan Nos. 3, 4, 7, 8, 9, 11, 13, and 18, the UW NCF DSCR, UW NOI Debt Yield, Cut-off Date LTV and Maturity Date LTV calculations exclude the subordinate companion loan(s) or other subordinate indebtedness. In the case of Loan Nos. 4, 6, 8, 9, 11, and 22, the UW NCF DSCR, UW NOI Debt Yield, Cut-off Date LTV and Maturity Date LTV calculations exclude the mezzanine loan. |
| (4) | For each partial interest-only mortgage loan, the UW NCF DSCR is calculated using the first principal and interest payment to be made into the trust during the term of the mortgage loan once amortization has commenced. In the case of Loan Nos. 6, 11, 13, 22, the loans pay according to a fixed amortization schedule. |
| (5) | In the case of Loan No. 8, 12, and 20, the Cut-off Date LTV and Maturity Date LTV are calculated based upon an “as stabilized” appraised value. In the case of Loan No. 16, the Cut-off Date LTV and Maturity Date LTV are calculated based upon a portfolio level appraised value. In the case of Loan No. 18 and 24, the Cut-off Date LTV and Maturity Date LTV are calculated based upon “as-complete” appraised values. |
THE INFORMATION IN THIS STRUCTURAL AND COLLATERAL TERM SHEET IS NOT COMPLETE AND MAY BE AMENDED PRIOR TO THE TIME OF SALE. THIS TERM SHEET IS NOT AN OFFER TO SELL THESE SECURITIES AND IT IS NOT A SOLICITATION OF AN OFFER TO BUY THESE SECURITIES IN ANY JURISDICTION WHERE THE OFFER OR SALE IS NOT PERMITTED.
10
Remaining Term to Maturity/ARD in Months
| Weighted Average | |||||||||||||||||||
| Remaining Term to Maturity/ARD in Months | Number of Loans | Cut-off Date Principal Balance | % of IPB | Mortgage Rate(1) | Remaining Loan Term(2) | UW NCF DSCR(3)(4) | UW NOI Debt Yield(3) | Cut-off Date LTV(3)(5) | Maturity Date LTV(2)(3)(5) | ||||||||||
| 57 - 60 | 6 | $242,638,177 | 28.3 | % | 4.4601% | 59 | 2.91x | 15.9% | 46.0% | 43.7% | |||||||||
| 61 - 120 | 25 | 616,238,327 | 71.7 | 4.0645% | 112 | 3.18x | 13.9% | 48.4% | 45.4% | ||||||||||
| Total/Wtd. Avg.: | 31 | $858,876,504 | 100.0 | % | 4.1763% | 97 | 3.11x | 14.5% | 47.7% | 44.9% | |||||||||
Original Amortization Term in Months
| Weighted Average | |||||||||||||||||||
| Original Amortization Term in Months | Number of Loans | Cut-off Date Principal Balance | % of IPB | Mortgage Rate(1) | Remaining Loan Term(2) | UW NCF DSCR(3)(4) | UW NOI Debt Yield(3) | Cut-off Date LTV(3)(5) | Maturity Date LTV(2)(3)(5) | ||||||||||
| Interest Only | 12 | $527,703,277 | 61.4 | % | 3.6810% | 102 | 3.93x | 15.2% | 41.8% | 41.8% | |||||||||
| 300 | 4 | 48,800,000 | 5.7 | 5.2896% | 104 | 1.69x | 13.8% | 60.4% | 49.3% | ||||||||||
| 330 | 1 | 13,558,191 | 1.6 | 4.1853% | 113 | 2.02x | 14.2% | 48.0% | 37.2% | ||||||||||
| 360 | 14 | 268,815,036 | 31.3 | 4.9458% | 85 | 1.80x | 13.3% | 56.9% | 50.6% | ||||||||||
| Total/Wtd. Avg.: | 31 | $858,876,504 | 100.0 | % | 4.1763% | 97 | 3.11x | 14.5% | 47.7% | 44.9% | |||||||||
Remaining Amortization Term in Months
| Weighted Average | |||||||||||||||||||
| Remaining Amortization Term in Months | Number of Loans | Cut-off Date Principal Balance | % of IPB | Mortgage Rate(1) | Remaining Loan Term(2) | UW NCF DSCR(3)(4) | UW NOI Debt Yield(3) | Cut-off Date LTV(3)(5) | Maturity Date LTV(2)(3)(5) | ||||||||||
| Interest Only | 12 | $527,703,277 | 61.4 | % | 3.6810% | 102 | 3.93x | 15.2% | 41.8% | 41.8% | |||||||||
| 300 - 300 | 4 | 48,800,000 | 5.7 | 5.2896% | 104 | 1.69x | 13.8% | 60.4% | 49.3% | ||||||||||
| 301 - 359 | 6 | 138,300,727 | 16.1 | 4.8418% | 88 | 1.74x | 12.7% | 61.9% | 53.7% | ||||||||||
| 360 - 360 | 9 | 144,072,500 | 16.8 | 4.9741% | 85 | 1.89x | 13.9% | 51.3% | 46.4% | ||||||||||
| Total/Wtd. Avg.: | 31 | $858,876,504 | 100.0 | % | 4.1763% | 97 | 3.11x | 14.5% | 47.7% | 44.9% | |||||||||
| (1) | The Loan No. 11 accrues interest at an interest rate that increases over time as set forth on Annex H of the Preliminary Prospectus. The Mortgage Rate shown is the interest rate on September 9, 2017. |
| (2) | In the case of Loan No. 16, with an anticipated repayment date, Remaining Loan Term and Maturity Date LTV are calculated through or as of, as applicable, the related anticipated repayment date. |
| (3) | In the case of Loan Nos. 1, 2, 3, 4, 5, 7, 9, 10, 11, 13, 15, 18, 20, and 23, the UW NCF DSCR, UW NOI Debt Yield, Cut-off Date LTV and Maturity Date LTV calculations include the related pari passu companion loan(s). In the case of Loan Nos. 3, 4, 7, 8, 9, 11, 13, and 18, the UW NCF DSCR, UW NOI Debt Yield, Cut-off Date LTV and Maturity Date LTV calculations exclude the subordinate companion loan(s) or other subordinate indebtedness. In the case of Loan Nos. 4, 6, 8, 9, 11, and 22, the UW NCF DSCR, UW NOI Debt Yield, Cut-off Date LTV and Maturity Date LTV calculations exclude the mezzanine loan. |
| (4) | For each partial interest-only mortgage loan, the UW NCF DSCR is calculated using the first principal and interest payment to be made into the trust during the term of the mortgage loan once amortization has commenced. In the case of Loan Nos. 6, 11, 13, 22, the loans pay according to a fixed amortization schedule. |
| (5) | In the case of Loan No. 8, 12, and 20, the Cut-off Date LTV and Maturity Date LTV are calculated based upon an “as stabilized” appraised value. In the case of Loan No. 16, the Cut-off Date LTV and Maturity Date LTV are calculated based upon a portfolio level appraised value. In the case of Loan No. 18 and 24, the Cut-off Date LTV and Maturity Date LTV are calculated based upon “as-complete” appraised values. |
THE INFORMATION IN THIS STRUCTURAL AND COLLATERAL TERM SHEET IS NOT COMPLETE AND MAY BE AMENDED PRIOR TO THE TIME OF SALE. THIS TERM SHEET IS NOT AN OFFER TO SELL THESE SECURITIES AND IT IS NOT A SOLICITATION OF AN OFFER TO BUY THESE SECURITIES IN ANY JURISDICTION WHERE THE OFFER OR SALE IS NOT PERMITTED.
11
Amortization Types
| Weighted Average | |||||||||||||||||||
| Amortization Types | Number of Loans | Cut-off | % of IPB | Mortgage Rate(1) | Remaining Loan Term(2) | UW NCF DSCR(3)(4) | UW NOI Debt Yield(3) | Cut-off Date LTV(3)(5) | Maturity Date LTV(2)(3)(5) | ||||||||||
| Interest Only | 12 | $527,703,277 | 61.4 | % | 3.6810% | 102 | 3.93x | 15.2% | 41.8% | 41.8% | |||||||||
| Balloon | 11 | 224,800,727 | 26.2 | 4.9993% | 87 | 1.71x | 12.9% | 59.6% | 51.7% | ||||||||||
| IO-Balloon | 7 | 82,422,500 | 9.6 | 4.9654% | 87 | 1.93x | 14.8% | 52.3% | 46.2% | ||||||||||
| IO-Balloon, ARD | 1 | 23,950,000 | 2.8 | 4.6470% | 120 | 2.12x | 13.1% | 49.5% | 45.4% | ||||||||||
| Total/Wtd. Avg.: | 31 | $858,876,504 | 100.0 | % | 4.1763% | 97 | 3.11x | 14.5% | 47.7% | 44.9% | |||||||||
Interest Only Periods(6)
| Weighted Average | |||||||||||||||||||
| Interest Only Periods | Number of Loans | Cut-off Date Principal Balance | % of IPB | Mortgage Rate(1) | Remaining Loan Term(2) | UW NCF DSCR(3)(4) | UW NOI Debt Yield(3) | Cut-off Date LTV(3)(5) | Maturity Date LTV(2)(3)(5) | ||||||||||
| 12 - 48 | 4 | $74,500,000 | 8.7 | % | 4.9762% | 83 | 1.96x | 15.3% | 51.9% | 45.7% | |||||||||
| 49 - 84 | 7 | 206,872,500 | 24.1 | 3.6566% | 77 | 3.64x | 14.6% | 43.5% | 42.8% | ||||||||||
| 85 - 120 | 9 | 352,703,277 | 41.1 | 3.7875% | 117 | 3.93x | 15.3% | 41.7% | 41.7% | ||||||||||
| Total/Wtd. Avg.: | 20 | $634,075,777 | 73.8 | % | 3.8845% | 100 | 3.60x | 15.0% | 43.5% | 42.5% | |||||||||
Underwritten Net Cash Flow Debt Service Coverage Ratios
| Weighted Average | |||||||||||||||||||
| Underwritten Net Cash Flow Debt Service Coverage Ratios | Number of Loans | Cut-off Date Principal Balance | % of IPB | Mortgage Rate(1) | Remaining Loan Term(2) | UW NCF DSCR(3)(4) | UW NOI Debt Yield(3) | Cut-off Date LTV(3)(5) | Maturity Date LTV(2)(3)(5) | ||||||||||
| 1.41 - 1.49 | 3 | $35,100,000 | 4.1 | % | 5.0184% | 117 | 1.44x | 10.8% | 60.0% | 49.6% | |||||||||
| 1.50 - 1.74 | 8 | 134,839,740 | 15.7 | 5.1692% | 88 | 1.61x | 12.1% | 61.3% | 54.2% | ||||||||||
| 1.75 - 1.99 | 7 | 168,128,573 | 19.6 | 4.7321% | 97 | 1.82x | 11.9% | 63.9% | 59.7% | ||||||||||
| 2.00 - 2.99 | 6 | 163,308,191 | 19.0 | 3.9859% | 107 | 2.48x | 12.7% | 47.3% | 45.0% | ||||||||||
| 3.00 - 7.20 | 7 | 357,500,000 | 41.6 | 3.5446% | 93 | 4.73x | 17.8% | 34.0% | 34.0% | ||||||||||
| Total/Wtd. Avg.: | 31 | $858,876,504 | 100.0 | % | 4.1763% | 97 | 3.11x | 14.5% | 47.7% | 44.9% | |||||||||
| (1) | The Loan No. 11 accrues interest at an interest rate that increases over time as set forth on Annex H of the Preliminary Prospectus. The Mortgage Rate shown is the interest rate on September 9, 2017. |
| (2) | In the case of Loan No. 16, with an anticipated repayment date, Remaining Loan Term and Maturity Date LTV are calculated through or as of, as applicable, the related anticipated repayment date. |
| (3) | In the case of Loan Nos. 1, 2, 3, 4, 5, 7, 9, 10, 11, 13, 15, 18, 20, and 23, the UW NCF DSCR, UW NOI Debt Yield, Cut-off Date LTV and Maturity Date LTV calculations include the related pari passu companion loan(s). In the case of Loan Nos. 3, 4, 7, 8, 9, 11, 13, and 18, the UW NCF DSCR, UW NOI Debt Yield, Cut-off Date LTV and Maturity Date LTV calculations exclude the subordinate companion loan(s) or other subordinate indebtedness. In the case of Loan Nos. 4, 6, 8, 9, 11, and 22, the UW NCF DSCR, UW NOI Debt Yield, Cut-off Date LTV and Maturity Date LTV calculations exclude the mezzanine loan. |
| (4) | For each partial interest-only mortgage loan, the UW NCF DSCR is calculated using the first principal and interest payment to be made into the trust during the term of the mortgage loan once amortization has commenced. In the case of Loan Nos. 6, 11, 13, 22, the loans pay according to a fixed amortization schedule. |
| (5) | In the case of Loan No. 8, 12, and 20, the Cut-off Date LTV and Maturity Date LTV are calculated based upon an “as stabilized” appraised value. In the case of Loan No. 16, the Cut-off Date LTV and Maturity Date LTV are calculated based upon a portfolio level appraised value. In the case of Loan No. 18 and 24, the Cut-off Date LTV and Maturity Date LTV are calculated based upon “as-complete” appraised values. |
| (6) | Excluding twelve (12) loans that have no interest-only period during the loan term. |
THE INFORMATION IN THIS STRUCTURAL AND COLLATERAL TERM SHEET IS NOT COMPLETE AND MAY BE AMENDED PRIOR TO THE TIME OF SALE. THIS TERM SHEET IS NOT AN OFFER TO SELL THESE SECURITIES AND IT IS NOT A SOLICITATION OF AN OFFER TO BUY THESE SECURITIES IN ANY JURISDICTION WHERE THE OFFER OR SALE IS NOT PERMITTED.
12
LTV Ratios as of the Cut-off Date
| Weighted Average | |||||||||||||||||||
| Range of Cut-off Date LTVs | Number of Loans | Cut-off Date Principal Balance | % of IPB | Mortgage Rate(1) | Remaining Loan Term(2) | UW NCF DSCR(3)(4) | UW NOI Debt Yield(3) | Cut-off Date LTV(3)(5) | Maturity Date LTV(2)(3)(5) | ||||||||||
| 21.4% - 44.9% | 7 | $307,500,000 | 35.8 | % | 3.6784% | 93 | 4.91x | 19.7% | 29.4% | 29.1% | |||||||||
| 45.0% - 54.9% | 11 | 231,132,125 | 26.9 | 4.0779% | 100 | 2.51x | 11.8% | 50.9% | 47.7% | ||||||||||
| 55.0% - 59.9% | 2 | 86,000,000 | 10.0 | 4.6805% | 85 | 2.01x | 11.7% | 55.7% | 53.4% | ||||||||||
| 60.0% - 64.9% | 6 | 127,792,797 | 14.9 | 4.8267% | 95 | 1.73x | 11.6% | 62.7% | 57.3% | ||||||||||
| 65.0% - 69.9% | 3 | 65,513,277 | 7.6 | 4.7080% | 108 | 1.85x | 12.1% | 66.6% | 62.6% | ||||||||||
| 70.0% - 74.3% | 2 | 40,938,305 | 4.8 | 4.5304% | 119 | 1.56x | 9.5% | 74.0% | 63.6% | ||||||||||
| Total/Wtd. Avg.: | 31 | $858,876,504 | 100.0 | % | 4.1763% | 97 | 3.11x | 14.5% | 47.7% | 44.9% | |||||||||
LTV Ratios as of the Maturity Date
| Weighted Average | |||||||||||||||||||
| Range of Maturity/ARD Date LTVs | Number of Loans | Cut-off Date Principal Balance | % of IPB | Mortgage Rate(1) | Remaining Loan Term(2) | UW NCF DSCR(3)(4) | UW NOI Debt Yield(3) | Cut-off Date LTV(3)(5) | Maturity Date LTV(2)(3)(5) | ||||||||||
| 21.4% - 34.9% | 6 | $252,500,000 | 29.4 | % | 3.7761% | 100 | 5.15x | 21.2% | 26.2% | 26.0% | |||||||||
| 35.0% - 44.9% | 5 | 95,408,191 | 11.1 | 3.8409% | 83 | 2.97x | 13.0% | 46.9% | 41.8% | ||||||||||
| 45.0% - 54.9% | 11 | 277,987,678 | 32.4 | 4.3585% | 93 | 2.34x | 11.9% | 53.2% | 50.1% | ||||||||||
| 55.0% - 59.9% | 6 | 152,777,358 | 17.8 | 4.6260% | 95 | 1.89x | 11.8% | 64.0% | 57.8% | ||||||||||
| 60.0% - 73.2% | 3 | 80,203,277 | 9.3 | 4.3468% | 119 | 1.79x | 9.0% | 66.2% | 66.2% | ||||||||||
| Total/Wtd. Avg.: | 31 | $858,876,504 | 100.0 | % | 4.1763% | 97 | 3.11x | 14.5% | 47.7% | 44.9% | |||||||||
Prepayment Protection
| Weighted Average | |||||||||||||||||||
| Amortization Types | Number of Loans | Cut-off Date Principal Balance | % of IPB | Mortgage Rate(1) | Remaining Loan Term(2) | UW NCF DSCR(3)(4) | UW NOI Debt Yield(3) | Cut-off Date LTV(3)(5) | Maturity Date LTV(2)(3)(5) | ||||||||||
| Defeasance | 26 | $644,453,199 | 75.0 | % | 4.3423% | 94 | 3.17x | 15.4% | 47.1% | 44.2% | |||||||||
| Yield Maintenance | 2 | 116,000,000 | 13.5 | 3.4114% | 94 | 2.98x | 10.4% | 52.6% | 52.6% | ||||||||||
| Defeasance/Yield Maintenance | 3 | 98,423,305 | 11.5 | 3.9907% | 118 | 2.85x | 13.2% | 46.1% | 40.8% | ||||||||||
| Total/Wtd. Avg.: | 31 | $858,876,504 | 100.0 | % | 4.1763% | 97 | 3.11x | 14.5% | 47.7% | 44.9% | |||||||||
| (1) | The Loan No. 11 accrues interest at an interest rate that increases over time as set forth on Annex H of the Preliminary Prospectus. The Mortgage Rate shown is the interest rate on September 9, 2017. |
| (2) | In the case of Loan No. 16, with an anticipated repayment date, Remaining Loan Term and Maturity Date LTV are calculated through or as of, as applicable, the related anticipated repayment date. |
| (3) | In the case of Loan Nos. 1, 2, 3, 4, 5, 7, 9, 10, 11, 13, 15, 18, 20, and 23, the UW NCF DSCR, UW NOI Debt Yield, Cut-off Date LTV and Maturity Date LTV calculations include the related pari passu companion loan(s). In the case of Loan Nos. 3, 4, 7, 8, 9, 11, 13, and 18, the UW NCF DSCR, UW NOI Debt Yield, Cut-off Date LTV and Maturity Date LTV calculations exclude the subordinate companion loan(s) or other subordinate indebtedness. In the case of Loan Nos. 4, 6, 8, 9, 11, and 22, the UW NCF DSCR, UW NOI Debt Yield, Cut-off Date LTV and Maturity Date LTV calculations exclude the mezzanine loan. |
| (4) | For each partial interest-only mortgage loan, the UW NCF DSCR is calculated using the first principal and interest payment to be made into the trust during the term of the mortgage loan once amortization has commenced. In the case of Loan Nos. 6, 11, 13, 22, the loans pay according to a fixed amortization schedule. |
| (5) | In the case of Loan No. 8, 12, and 20, the Cut-off Date LTV and Maturity Date LTV are calculated based upon an “as stabilized” appraised value. In the case of Loan No. 16, the Cut-off Date LTV and Maturity Date LTV are calculated based upon a portfolio level appraised value. In the case of Loan No. 18 and 24, the Cut-off Date LTV and Maturity Date LTV are calculated based upon “as-complete” appraised values. |
THE INFORMATION IN THIS STRUCTURAL AND COLLATERAL TERM SHEET IS NOT COMPLETE AND MAY BE AMENDED PRIOR TO THE TIME OF SALE. THIS TERM SHEET IS NOT AN OFFER TO SELL THESE SECURITIES AND IT IS NOT A SOLICITATION OF AN OFFER TO BUY THESE SECURITIES IN ANY JURISDICTION WHERE THE OFFER OR SALE IS NOT PERMITTED.
13
Loan Purpose
| Weighted Average | |||||||||||||||||||
| Amortization Types | Number of Loans | Cut-off Date Principal Balance | % of IPB | Mortgage Rate(1) | Remaining Loan Term(2) | UW NCF DSCR(3)(4) | UW NOI Debt Yield(3) | Cut-off Date LTV(3)(5) | Maturity Date LTV(2)(3)(5) | ||||||||||
| Refinance | 17 | $450,062,902 | 52.4 | % | 4.2937% | 99 | 3.48x | 16.5% | 43.6% | 41.4% | |||||||||
| Acquisition | 13 | 384,863,602 | 44.8 | 4.0096% | 92 | 2.74x | 12.2% | 52.4% | 49.1% | ||||||||||
| Recapitalization | 1 | 23,950,000 | 2.8 | 4.6470% | 120 | 2.12x | 13.1% | 49.5% | 45.4% | ||||||||||
| Total/Wtd. Avg.: | 31 | $858,876,504 | 100.0 | % | 4.1763% | 97 | 3.11x | 14.5% | 47.7% | 44.9% | |||||||||
| (1) | The Loan No. 11 accrues interest at an interest rate that increases over time as set forth on Annex H of the Preliminary Prospectus. The Mortgage Rate shown is the interest rate on September 9, 2017. |
| (2) | In the case of Loan No. 16, with an anticipated repayment date, Remaining Loan Term and Maturity Date LTV are calculated through or as of, as applicable, the related anticipated repayment date. |
| (3) | In the case of Loan Nos. 1, 2, 3, 4, 5, 7, 9, 10, 11, 13, 15, 18, 20, and 23, the UW NCF DSCR, UW NOI Debt Yield, Cut-off Date LTV and Maturity Date LTV calculations include the related pari passu companion loan(s). In the case of Loan Nos. 3, 4, 7, 8, 9, 11, 13, and 18, the UW NCF DSCR, UW NOI Debt Yield, Cut-off Date LTV and Maturity Date LTV calculations exclude the subordinate companion loan(s) or other subordinate indebtedness. In the case of Loan Nos. 4, 6, 8, 9, 11, and 22, the UW NCF DSCR, UW NOI Debt Yield, Cut-off Date LTV and Maturity Date LTV calculations exclude the mezzanine loan. |
| (4) | For each partial interest-only mortgage loan, the UW NCF DSCR is calculated using the first principal and interest payment to be made into the trust during the term of the mortgage loan once amortization has commenced. In the case of Loan Nos. 6, 11, 13, 22, the loans pay according to a fixed amortization schedule. |
| (5) | In the case of Loan No. 8, 12, and 20, the Cut-off Date LTV and Maturity Date LTV are calculated based upon an “as stabilized” appraised value. In the case of Loan No. 16, the Cut-off Date LTV and Maturity Date LTV are calculated based upon a portfolio level appraised value. In the case of Loan No. 18 and 24, the Cut-off Date LTV and Maturity Date LTV are calculated based upon “as-complete” appraised values. |
Previous Securitization History(1)
| No. | Loan / Property Name | Location | Property Type | Previous Securitization |
| 2 | Westin Building Exchange | Seattle, WA | Office | BSCMS 2007-PW17 |
| 5 | The Boulders Resort & Spa | Scottsdale, AZ | Hotel | WBCMT 2007-WHL8 |
| 6 | Hilton Glendale | Glendale, CA | Hotel | JPMCC 2005-LDP4 |
| 9 | JW Marriott Chicago | Chicago, IL | Hotel | GSMS 2014-GSFL |
| 13 | West Town Mall | Knoxville, TN | Retail | MSC 2007-IQ16 |
| 17 | Sheraton Garden Grove | Garden Grove, CA | Hotel | MSBAM 2012-C6 |
| 19.01 | Keystone 300 | Durham, NC | Office | GSMS 2007-GG10 |
| 19.02 | Keystone 200 | Durham, NC | Office | GCCFC 2007-GG11 |
| 21 | Whitehall Place Apartments | Pittsburgh, PA | Multifamily | RCCMT 2014-1 |
| 22.01 | Frayser Village | Memphis, TN | Retail | JPMCC 2016-CB17 |
| 22.02 | Bartlesville Plaza | Bartlesville, OK | Retail | JPMCC 2016-CB17 |
| 22.03 | Three Notch Plaza | Andalusia, AL | Retail | JPMCC 2016-CB17 |
| 22.04 | Frayser Center | Memphis, TN | Retail | JPMCC 2016-CB17 |
| (1) | The table above represents the properties for which the previously existing debt was most recently securitized, based on information provided by the related borrower or obtained through searches of a third-party database. While loans secured by the above mortgaged properties may have been securitized multiple times in prior transactions, mortgage loans in this securitization are only listed in the above chart if the mortgage loan in this securitization paid off a loan in another securitization. |
THE INFORMATION IN THIS STRUCTURAL AND COLLATERAL TERM SHEET IS NOT COMPLETE AND MAY BE AMENDED PRIOR TO THE TIME OF SALE. THIS TERM SHEET IS NOT AN OFFER TO SELL THESE SECURITIES AND IT IS NOT A SOLICITATION OF AN OFFER TO BUY THESE SECURITIES IN ANY JURISDICTION WHERE THE OFFER OR SALE IS NOT PERMITTED.
14
Class A-2(1)
| No. | Loan Name | Location | Cut-off Date Balance | % of IPB | Maturity/ARD Balance | % of Certificate Class | Original Loan Term | Remaining Loan Term | UW NCF DSCR(2) | UW NOI Debt Yield(2) | Cut-off Date LTV Ratio(2) | Maturity Date LTV Ratio(2) | ||||||||||||||
| 3 | Two Independence Square | Washington, D.C. | $55,000,000 | 6.4 | % | $55,000,000 | 23.6 | % | 60 | 58 | 3.80x | 12.5% | 43.7% | 43.7% | ||||||||||||
| 5 | The Boulders Resort & Spa | Scottsdale, AZ | 50,000,000 | 5.8 | 46,436,501 | 21.4 | % | 60 | 60 | 1.61x | 13.2% | 56.0% | 52.0% | |||||||||||||
| 6 | Hilton Glendale | Glendale, CA | 47,204,053 | 5.5 | 43,814,900 | 20.2 | % | 60 | 59 | 1.83x | 13.6% | 63.4% | 58.8% | |||||||||||||
| 9 | JW Marriott Chicago | Chicago, IL | 40,000,000 | 4.7 | 40,000,000 | 17.1 | % | 60 | 59 | 5.64x | 26.8% | 21.4% | 21.4% | |||||||||||||
| 13 | West Town Mall | Knoxville, TN | 30,000,000 | 3.5 | 27,907,947 | 12.9 | % | 60 | 58 | 2.40x | 18.2% | 33.0% | 30.7% | |||||||||||||
| 17 | Sheraton Garden Grove | Garden Grove, CA | 20,434,125 | 2.4 | 18,957,069 | 8.8 | % | 60 | 57 | 1.61x | 12.5% | 54.6% | 50.7% | |||||||||||||
| Total / Wtd. Avg.: | $242,638,177 | 28.3 | % | $232,116,417 | 60 | 59 | 2.91x | 15.9% | 46.0% | 43.7% | ||||||||||||||||
| (1) | The table above presents the mortgage loans whose balloon payments would be applied to pay down the majority of the principal balance of the Class A-2 certificates, assuming a 0% CPR and applying the “Modeling Assumptions” described in the Preliminary Prospectus, including the assumptions that (i) none of the mortgage loans in the pool experience prepayments prior to the maturity date, defaults or losses; (ii) there are no extensions of maturity dates of any mortgage loans in the pool; and (iii) each mortgage loan in the pool is paid in full on its stated maturity date. Each class of certificates, including the Class A-2 certificates, evidences undivided ownership interests in the entire pool of mortgage loans. Debt service coverage ratio, debt yield and loan-to-value ratio information does not take into account subordinate debt (whether or not secured by the mortgaged property), if any, that is allowed under the terms of any mortgage loan. See Annex A-1 to the Preliminary Prospectus. |
THE INFORMATION IN THIS STRUCTURAL AND COLLATERAL TERM SHEET IS NOT COMPLETE AND MAY BE AMENDED PRIOR TO THE TIME OF SALE. THIS TERM SHEET IS NOT AN OFFER TO SELL THESE SECURITIES AND IT IS NOT A SOLICITATION OF AN OFFER TO BUY THESE SECURITIES IN ANY JURISDICTION WHERE THE OFFER OR SALE IS NOT PERMITTED.
15
Class A-3(1)
| No. | Loan Name | Location | Cut-off Date | % of IPB | Maturity/ARD Balance | % of Certificate Class | Original Loan Term | Remaining Loan Term | UW NCF DSCR(2) | UW NOI Debt Yield(2) | Cut-off Date LTV Ratio(2) | Maturity Date LTV Ratio(2) | ||||||||||||||
| 1 | Park Center Phase I | Dunwoody, GA | $80,000,000 | 9.3 | % | $80,000,000 | 81.8 | % | 84 | 83 | 3.17x | 10.8% | 51.4% | 51.4% | ||||||||||||
| 18 | Carolina Hotel Portfolio | Various, Various | 20,000,000 | 2.3 | 17,756,244 | 20.5 | % | 84 | 82 | 1.87x | 15.5% | 65.9% | 58.5% | |||||||||||||
| Total / Wtd. Avg.: | $100,000,000 | 11.6 | % | $97,756,244 | 84 | 83 | 2.91x | 11.8% | 54.3% | 52.8% | ||||||||||||||||
| (1) | The table above presents the mortgage loans whose balloon payments would be applied to pay down the majority of the principal balance of the Class A-3 certificates, assuming a 0% CPR and applying the “Modeling Assumptions” described in the Preliminary Prospectus, including the assumptions that (i) none of the mortgage loans in the pool experience prepayments prior to the maturity date, defaults or losses; (ii) there are no extensions of maturity dates of any mortgage loans in the pool; and (iii) each mortgage loan in the pool is paid in full on its stated maturity date. Each class of certificates, including the Class A-3 certificates, evidences undivided ownership interests in the entire pool of mortgage loans. Debt service coverage ratio, debt yield and loan-to-value ratio information does not take into account subordinate debt (whether or not secured by the mortgaged property), if any, that is allowed under the terms of any mortgage loan. See Annex A-1 to the Preliminary Prospectus. |
THE INFORMATION IN THIS STRUCTURAL AND COLLATERAL TERM SHEET IS NOT COMPLETE AND MAY BE AMENDED PRIOR TO THE TIME OF SALE. THIS TERM SHEET IS NOT AN OFFER TO SELL THESE SECURITIES AND IT IS NOT A SOLICITATION OF AN OFFER TO BUY THESE SECURITIES IN ANY JURISDICTION WHERE THE OFFER OR SALE IS NOT PERMITTED.
16
Structural Overview
Order of Distribution: | On each Distribution Date, funds available for distribution from the mortgage loans, net of specified trust expenses, yield maintenance charges, prepayment premiums and excess interest distributable to the Class Z Certificates, will be distributed in the following amounts and order of priority (in each case to the extent of remaining available funds):
First: To interest on the Class A-1, Class A-2, Class A-3, Class A-4, Class A-5, Class A-SB, Class X-A, Class X-B and Class X-E certificates, up to, andpro rata in accordance with, their respective interest entitlements.
Second: To the extent of funds allocated to principal and available for distribution: (i) first,to principal on the Class A-SB certificates, until the certificate balance of the Class A-SB certificates is reduced to the scheduled principal balance for the related distribution date set forth in Annex E to the Preliminary Prospectus, (ii) second,to principal on the Class A-1 certificates, until the certificate balance of the Class A-1 certificates has been reduced to zero, (iii)third,to principal on the Class A-2 certificates, until the certificate balance of the Class A-2 certificates has been reduced to zero, (iv) fourth,to principal on the Class A-3 certificates, until the certificate balance of the Class A-3 certificates has been reduced to zero, (v)fifth, to principal on the Class A-4 certificates until the certificate balance of the Class A-4 certificates has been reduced to zero (vi)sixth, to principal on the Class A-5 certificates until the certificate balance of the Class A-5 certificates has been reduced to zero, and (vii)seventh, to principal on the Class A-SB certificates, until the certificate balance of the Class A-SB certificates has been reduced to zero. If the certificate balance of each and every class of certificates other than the Class A-1, Class A-2, Class A-3, Class A-4, Class A-5 and Class A-SB certificates has been reduced to zero as a result of the allocation of mortgage loan losses to those certificates, funds available for distributions of principal will be distributed to the Class A-1, Class A-2, Class A-3, Class A-4, Class A-5 and Class A-SB certificates,pro rata, based on their respective certificate balances, without regard to the distribution priorities described above or the planned principal balance of the Class A-SB certificates.
Third: To reimburse the Class A-1, Class A-2, Class A-3, Class A-4, Class A-5 and Class A-SB certificates,pro rata, for any previously unreimbursed losses on the mortgage loans allocable to principal that were previously borne by those classes, together with interest on that amount at the pass-through rate for such class.
Fourth: (i)first, to interest on the Class A-S certificates in the amount of their interest entitlement; (ii)second, to the extent of funds allocated to principal remaining after any distributions in respect of principal to each class of certificates with a higher payment priority (in this case, the Class A-1, Class A-2, Class A-3, Class A-4. Class A-5 and Class A-SB certificates), to principal on the Class A-S certificates until their certificate balance is reduced to zero; and (iii)third, to reimburse the Class A-S certificates for any previously unreimbursed losses on the mortgage loans allocable to principal that were previously borne by that class, together with interest at its pass-through rate.
Fifth: (i)first, to interest on the Class B certificates in the amount of their interest entitlement; (ii)second, to the extent of funds allocated to principal remaining after any distributions in respect of principal to each class of certificates with a higher payment priority (in this case, the Class A-1, Class A-2, Class A-3, Class A-4, Class A-5, Class A-SB and Class A-S certificates), to principal on the Class B certificates until their certificate balance is reduced to zero; and (iii)third, to reimburse the Class B certificates |
THE INFORMATION IN THIS STRUCTURAL AND COLLATERAL TERM SHEET IS NOT COMPLETE AND MAY BE AMENDED PRIOR TO THE TIME OF SALE. THIS TERM SHEET IS NOT AN OFFER TO SELL THESE SECURITIES AND IT IS NOT A SOLICITATION OF AN OFFER TO BUY THESE SECURITIES IN ANY JURISDICTION WHERE THE OFFER OR SALE IS NOT PERMITTED.
17
| Order of Distribution (continued): | for any previously unreimbursed losses on the mortgage loans allocable to principal that were previously borne by that class, together with interest at its pass-through rate.
Sixth: (i)first, to interest on the Class C certificates in the amount of their interest entitlement; (ii)second, to the extent of funds allocated to principal remaining after any distributions in respect of principal to each class of certificates with a higher payment priority (in this case, the Class A-1, Class A-2, Class A-3, Class A-4, Class A-5, Class A-SB, Class A-S and Class B certificates), to principal on the Class C certificates until their certificate balance is reduced to zero; and (iii)third, to reimburse the Class C certificates for any previously unreimbursed losses on the mortgage loans allocable to principal that were previously borne by that class, together with interest at its pass-through rate.
Seventh:After the Class A-1, Class A-2, Class A-3, Class A-4, Class A-5, Class A-SB, Class X-A, Class X-B, Class X-E, Class A-S, Class B and Class C certificates are paid all amounts to which they are entitled, the remaining funds available for distribution will be used to pay interest and principal and to reimburse any unreimbursed losses to the Class D, Class E, Class F and Class NR certificates sequentially in that order in a manner analogous to that described in clausesixthabove with respect to the Class C certificates, until the certificate balance of each such class is reduced to zero.
For more detailed information regarding the distributions on the certificates, see “Description of the Certificates—Distributions—Priority of Distributions” in the Preliminary Prospectus. |
| Realized Losses: | The certificate balances of the Class A-1, Class A-2, Class A-3, Class A-4, Class A-5, Class A-SB, Class A-S, Class B, Class C, Class D, Class E, Class F and Class NR certificates will each be reduced without distribution on any Distribution Date as a write-off to the extent of any loss realized on the mortgage loans allocated to such class of certificates on such Distribution Date. On each Distribution Date, any such write-offs will be applied to such classes of certificates in the following order, in each case until the related certificate balance is reduced to zero:first, to the Class NR certificates;second, to the Class F certificates;third, to the Class E certificates;fourth, to the Class D certificates;fifth, to the Class C certificates;sixth, to the Class B certificates;seventh, to the Class A-S certificates; and,finally,pro rata, to the Class A-1, Class A-2, Class A-3, Class A-4, Class A-5 and Class A-SB certificates, based on their then-current respective certificate balances. The notional amount of the Class X-A certificates will be reduced to reflect reductions in the certificate balances of the Class A-1, Class A-2, Class A-3, Class A-4, Class A-5, Class A-SB and Class A-S certificates resulting from allocations of losses realized on the mortgage loans. The notional amount of the Class X-B certificates will be reduced to reflect reductions in the certificate balance of the Class B and Class C certificates resulting from allocations of losses realized on the mortgage loans. The notional amount of the Class X-E certificates will be reduced to reflect reductions in the certificate balance of the Class E certificates resulting from allocations of losses realized on the mortgage loans. |
Prepayment Premiums and | On each Distribution Date, each yield maintenance charge collected on the mortgage loans during the one-month period ending on the related Determination Date is required to be distributed to certificateholders (excluding the Class X-E, Class E, Class F, Class NR, Class Z and Class R certificates) as follows: (1)pro rata, between (x) the group (the “YM Group A”) of Class A-1, Class A-2, Class A-3, Class A-4, Class A-5, Class A-SB, Class X-A and Class A-S certificates, and (y) the group (the “YM Group B” and collectively with the YM Group A, the “YM Groups”) of the Class X-B, Class B, Class C and Class D |
THE INFORMATION IN THIS STRUCTURAL AND COLLATERAL TERM SHEET IS NOT COMPLETE AND MAY BE AMENDED PRIOR TO THE TIME OF SALE. THIS TERM SHEET IS NOT AN OFFER TO SELL THESE SECURITIES AND IT IS NOT A SOLICITATION OF AN OFFER TO BUY THESE SECURITIES IN ANY JURISDICTION WHERE THE OFFER OR SALE IS NOT PERMITTED.
18
Prepayment Premiums and
| certificates, based upon the aggregate amount of principal distributed to the classes of principal balance certificates in each YM Group on such Distribution Date, and (2) as among the respective classes of principal balance certificates in each YM Group in the following manner: (A) on apro rata basis in accordance with their respective entitlements in those yield maintenance charges, to each class of principal balance certificates in such YM Group with a certificate balance in an amount equal to the product of (x) a fraction whose numerator is the amount of principal distributed to such class of principal balance certificates on such Distribution Date and whose denominator is the total amount of principal distributed to all of the certificates in such YM Group with certificate balances on such Distribution Date, (y) the Base Interest Fraction for the related principal prepayment with respect to such class of principal balance certificates, and (z) the aggregate amount of such yield maintenance charge allocated to such YM Group; and (B) the portion of such yield maintenance charge allocated to such YM Group remaining after such distributions to the applicable class(es) of principal balance certificates in such YM Group, in the case of amounts distributable to YM Group A, to the Class X-A certificates and in the case of amounts distributable to YM Group B, to the Class X-B certificates.
The “Base Interest Fraction” with respect to any principal prepayment on any mortgage loan and with respect to any class of Class A-1, Class A-2, Class A-3, Class A-4, Class A-5, Class A-SB, Class A-S, Class B, Class C and Class D certificates is a fraction (a) whose numerator is the greater of (x) zero and (y) the difference between (i) the pass-through rate on such class of certificates and (ii) the discount rate used in accordance with the related mortgage loan documents in calculating the yield maintenance charge with respect to such principal prepayment and (b) whose denominator is the greater of zero and the difference between (i) the mortgage loan rate on such mortgage loan (or serviced whole loan) and (ii) the discount rate used in accordance with the related mortgage loan documents in calculating the yield maintenance charge with respect to such principal prepayment;provided,however, that under no circumstances will the Base Interest Fraction be greater than one or less than zero. If such discount rate is greater than or equal to the lesser of (x) the mortgage loan rate on the related mortgage loan and (y) the pass-through rate described in the preceding sentence, then the Base Interest Fraction will equal zero;provided,however, that if such discount rate is greater than or equal to the mortgage loan rate, but less than the pass-through rate, the fraction will be one.
If a prepayment premium (calculated as a fixed percentage of the amount prepaid) is imposed in connection with a prepayment rather than a yield maintenance charge, then the prepayment premium so collected will be allocated as described above. For this purpose, the discount rate used to calculate the Base Interest Fraction will be the discount rate used to determine the yield maintenance charge for mortgage loans that require payment at the greater of a yield maintenance charge or a minimum amount equal to a fixed percentage of the principal balance of the mortgage loan or, for mortgage loans that only have a prepayment premium based on a fixed percentage of the principal balance of the mortgage loan, such other discount rate as may be specified in the related loan documents.
No prepayment premiums or yield maintenance charges will be distributed to holders of the Class X-E, Class E, Class F, Class NR, Class Z or Class R certificates. Instead, after the notional amounts of the Class X-A and Class X-B certificates and the certificate balances of the Class A-1, Class A-2, Class A-3, Class A-4, Class A-5, Class A-SB, Class A-S, Class B, Class C and Class D certificates have been reduced to zero, all prepayment premiums and yield maintenance charges with respect to the mortgage loans will be distributed to holders of the Class X-B certificates, regardless of whether the |
THE INFORMATION IN THIS STRUCTURAL AND COLLATERAL TERM SHEET IS NOT COMPLETE AND MAY BE AMENDED PRIOR TO THE TIME OF SALE. THIS TERM SHEET IS NOT AN OFFER TO SELL THESE SECURITIES AND IT IS NOT A SOLICITATION OF AN OFFER TO BUY THESE SECURITIES IN ANY JURISDICTION WHERE THE OFFER OR SALE IS NOT PERMITTED.
19
| Prepayment Premiums and Yield Maintenance Charges (continued): | notional amount of the Class X-B certificates has been reduced to zero. For a description of prepayment premiums and yield maintenance charges required on the mortgage loans, see Annex A-1 to the Preliminary Prospectus. See also“Certain Legal Aspects of the Mortgage Loans—Default Interest and Limitations on Prepayments” in the Preliminary Prospectus. Prepayment premiums and yield maintenance charges will be distributed on any Distribution Date only to the extent they are received in respect of the mortgage loans as of the related Determination Date. See also“Description of the Certificates—Distributions” in the Preliminary Prospectus. |
| Non-Serviced Mortgage Loans: | Each of the Westin Building Exchange mortgage loan, the Two Independence Square mortgage loan, the 245 Park Avenue mortgage loan, the 85 Broad Street mortgage loan, the West Town Mall mortgage loan and the IC Leased Fee Hotel Portfolio mortgage loan is referred to in this Term Sheet as, individually, a “non-serviced mortgage loan” and, collectively, the “non-serviced mortgage loans”. Each non-serviced mortgage loan and the related companion loan(s) are being serviced and administered in accordance with, and all decisions, consents, waivers, approvals and other actions on the part of the holders of such non-serviced mortgage loan and the related companion loan(s) will be effected in accordance with, the Lead Pooling and Servicing Agreement set forth in the “Whole Loan Summary” table above and the related co-lender agreement. Consequently, the servicing provisions set forth in this Term Sheet will generally not be applicable to the non-serviced mortgage loans, but instead such servicing and administration of the non-serviced mortgage loans will, in each case, be governed by the related Lead Pooling and Servicing Agreement. Each Lead Pooling and Servicing Agreement provides for servicing in a manner acceptable for rated transactions similar in nature to this securitization. The non-serviced mortgage loans are discussed further under“—Whole Loans” below. |
| Advances: | The master servicer and, if it fails to do so, the trustee, will be obligated to make (i) P&I advances with respect to each mortgage loan in the issuing entity and (ii) with respect to each mortgage loan (other than the non-serviced mortgage loans) and serviced whole loan, servicing advances, including paying delinquent real estate taxes, assessments and hazard insurance premiums, but only to the extent that those advances are not deemed nonrecoverable from collections on the related mortgage loan (or, if applicable, serviced whole loan) and, in the case of P&I advances, subject to reduction in connection with any appraisal reduction amounts that may occur. The special servicer will have no obligation to make servicing advances;providedthat with respect to a specially serviced loan, the special servicer will be entitled to make a servicing advance in an urgent or emergency situation, and the master servicer will be required to reimburse the special servicer for such advance, with interest;provided that the advance is not determined by the master servicer to be nonrecoverable. Notwithstanding the foregoing, servicing advances for the non-serviced mortgage loans will be made by the parties to, and pursuant to, the applicable Lead Pooling and Servicing Agreement. |
| Appraisal Reduction Amounts: | An appraisal reduction amount generally will be created with respect to a required appraisal loan (which is a serviced mortgage loan (or serviced whole loan, if applicable)) as to which certain defaults, modifications or insolvency events have occurred (as further described in the Preliminary Prospectus) in the amount, if any, by which the principal balance of such required appraisal loan, exceeds 90% of the appraised value of the related mortgaged property (as determined by one or more appraisals obtained by the special servicer) plus certain escrows and reserves (including letters of credit) held with respect to such required appraisal loan (net of other amounts overdue or advanced in connection with such required appraisal loan). In general, subject to the discussion in the |
THE INFORMATION IN THIS STRUCTURAL AND COLLATERAL TERM SHEET IS NOT COMPLETE AND MAY BE AMENDED PRIOR TO THE TIME OF SALE. THIS TERM SHEET IS NOT AN OFFER TO SELL THESE SECURITIES AND IT IS NOT A SOLICITATION OF AN OFFER TO BUY THESE SECURITIES IN ANY JURISDICTION WHERE THE OFFER OR SALE IS NOT PERMITTED.
20
Appraisal Reduction Amounts (continued):
| next paragraphs, any appraisal reduction amount calculated with respect to a whole loan will be allocated to the related mortgage loan andpari passu companion loan(s) on apro rata basis in accordance with their respective outstanding principal balances. In the case of the non-serviced mortgage loans, any appraisal reduction amounts will be calculated pursuant to, and by a party to, the related Lead Pooling and Servicing Agreement (as discussed under “—Whole Loans” below). As a result of an appraisal reduction amount being calculated for and/or allocated to a given mortgage loan, the interest portion of any P&I advance for such mortgage loan will be reduced, which will have the effect of reducing the amount of interest available for distribution to the most subordinate class(es) of certificates (exclusive of the Class Z and Class R certificates) then outstanding (i.e., first to the Class NR certificates, then to the Class F certificates, then to the Class E certificates, then to the Class D certificates, then to the Class C certificates, then to the Class B certificates, then to the Class A-S certificates, and then,pro rata based on their respective interest entitlements, to the Class A-1, Class A-2, Class A-3, Class A-4, Class A-5, Class A-SB, Class X-A, Class X-B and Class X-E certificates). In general, a mortgage loan (or whole loan, if applicable) serviced under the pooling and servicing agreement for this transaction will cease to be a required appraisal loan, and no longer be subject to an appraisal reduction amount, when the same has ceased to be a specially serviced loan (if applicable), has been brought current for at least three consecutive months and no other circumstances exist that would cause such serviced loan to be a required appraisal loan.
Appraisal reduction amounts with respect to each of the Two Independence Square whole loan, the 245 Park Avenue whole loan, the 85 Broad Street whole loan, the Allergan HQ whole loan, the JW Marriott Chicago whole loan, the Center 78 whole loan and the West Town Mall whole loan will be allocated to notionally reduce the outstanding principal balance of the related subordinate companion loan(s) prior topro rata allocation to the related mortgage loan and any relatedpari passu companion loans.
At any time an appraisal is ordered under the pooling and servicing agreement with respect to a property that would result in an appraisal reduction amount with respect to a mortgage loan that would result in a change in the controlling class, certain certificateholders will have a right to request a new appraisal as described in the Preliminary Prospectus. |
| Age of Appraisals: | Appraisals (which can be an update of a prior appraisal) with respect to a mortgage loan serviced under the pooling and servicing agreement are required to be no older than 9 months for purposes of determining appraisal reduction amounts, market value, and other calculations as described in the Preliminary Prospectus. |
| Sale of Defaulted Loans: | There will be no “Fair Market Value Purchase Option”, instead defaulted loans will be sold in a process similar to the sale process for REO property. |
| Cleanup Call: | On any distribution date on which the aggregate unpaid principal balance of the mortgage loans remaining in the issuing entity is less than 1% of the aggregate principal balance of the mortgage loans as of the cut-off date, certain entities specified in the Preliminary Prospectus will have the option to purchase all of the remaining mortgage loans (and all property acquired through exercise of remedies in respect of any mortgage loan) at the price specified in the Preliminary Prospectus. If the aggregate certificate balances of all certificates (exclusive of the Class X Certificates) senior to the Class D certificates, and the notional amounts of the Class X-A and Class X-B certificates have been reduced to zero, and if the master servicer has consented, the issuing entity could also be terminated in connection with a voluntary exchange of all the then-outstanding certificates (excluding the Class Z and Class R certificates and the VRR Interest), for the mortgage loans, but all |
THE INFORMATION IN THIS STRUCTURAL AND COLLATERAL TERM SHEET IS NOT COMPLETE AND MAY BE AMENDED PRIOR TO THE TIME OF SALE. THIS TERM SHEET IS NOT AN OFFER TO SELL THESE SECURITIES AND IT IS NOT A SOLICITATION OF AN OFFER TO BUY THESE SECURITIES IN ANY JURISDICTION WHERE THE OFFER OR SALE IS NOT PERMITTED.
21
| of the holders of those classes of outstanding certificates (excluding the Class Z and Class R certificates) would have to voluntarily participate in the exchange. | |
| Directing Certificateholder / Directing Holder: | The “Directing Certificateholder” will generally be the controlling class certificateholder or other representative designated by the holder(s) of at least a majority of the voting rights of the controlling class. The controlling class is the most subordinate class of the Class F and Class NR certificates (the “Control Eligible Certificates”) that has an aggregate certificate balance as notionally reduced by any Cumulative Appraisal Reduction Amounts allocated to such class, that is equal to or greater than 25% of the initial certificate balance of such class of certificates, or if no class of Control Eligible Certificates meets the preceding requirement, the most senior class of Control Eligible Certificates. The Controlling Class as of the Closing Date will be the Class NR certificates. At any time when Class F is the controlling class, the majority Class NR certificateholders may elect under certain circumstances to opt-out from its rights under the pooling and servicing agreement. See “Pooling and Servicing Agreement—The Directing Holder” in the Preliminary Prospectus. No other class of certificates will be eligible to act as the controlling class or appoint a Directing Certificateholder.
RREF III – D AIV RR, LLC (or its affiliate) is expected to purchase the Class F, Class NR and Class Z certificates (and possibly certain other Classes of Certificates, including the Class X-E and Class E certificates) (in each case, other than the portions thereof to be retained by Natixis Real Estate Capital LLC) and, on the Closing Date, is expected to be the initial Directing Certificateholder.
The “Directing Holder” will initially be:
(a) with respect to any Mortgage Loan (other than any Non-Serviced Mortgage Loan) or Serviced Whole Loan, the Directing Certificateholder and
(b) with respect to any Serviced AB Whole Loan, (i) for so long as no related Control Appraisal Period exists, the AB Whole Loan Controlling Holder and (ii) for so long as a related Control Appraisal Period exists, the Directing Certificateholder.
The initial Directing Holder with respect to each of the Allergan HQ whole loan, the JW Marriot Chicago whole loan and the Center 78 whole loan will be the holder of the related subordinate companion loan, which is anticipated to be a separate unaffiliated third party investor.
For a description of the directing holder for the Non-Serviced Whole Loan, see “Description of the Mortgage Pool—The Whole Loans” in the Preliminary Prospectus. |
| Control/Consultation Rights: | The Directing Holder will be entitled to have consultation and approval rights with respect to certain major decisions (including with respect to assumptions, waivers, loan modifications and workouts).
So long as a Control Termination Event does not exist, the Directing Certificateholder will be entitled to direct the special servicer to take, or refrain from taking, certain actions that would constitute major decisions with respect to a mortgage loan or whole loan serviced under the pooling and servicing agreement (or, with respect to each of the Allergan HQ whole loan, the JW Marriott Chicago whole loan and the Center 78 whole loan, during the related control appraisal period) and will also have the right to notice and to consent to certain material actions that would constitute major decisions that the master servicer or the special servicer plan on taking with respect to any such mortgage loan or serviced |
THE INFORMATION IN THIS STRUCTURAL AND COLLATERAL TERM SHEET IS NOT COMPLETE AND MAY BE AMENDED PRIOR TO THE TIME OF SALE. THIS TERM SHEET IS NOT AN OFFER TO SELL THESE SECURITIES AND IT IS NOT A SOLICITATION OF AN OFFER TO BUY THESE SECURITIES IN ANY JURISDICTION WHERE THE OFFER OR SALE IS NOT PERMITTED.
22
Control/Consultation Rights
| whole loan subject to the servicing standard and other restrictions as described in the Preliminary Prospectus.
Following the occurrence and during the continuation of a Control Termination Event and until the occurrence of a Consultation Termination Event, all of the rights of the Directing Certificateholder will terminate other than a right to consult with respect to the major decisions and other matters as to which it previously had approval rights. After the occurrence and during the continuation of an Operating Advisor Consultation Event, the operating advisor will be entitled to consult with the special servicer with respect to certain major decisions on behalf of the issuing entity and in the best interest of, and for the benefit of, the certificateholders, as if those certificateholders and, with respect to a serviced pari passu companion loan, the related pari passu companion loan holder(s) constituted a single lender.
With respect to each Serviced AB Whole Loan (the Allergen HQ whole loan, the JW Marriott Chicago whole loan and the Center 78 whole loan), prior of the occurrence and continuance of a control appraisal period relating to such loan, the holder of the related subordinate companions loan, as the Directing Holder of such loan, will be entitled to exercise the rights described above rather than the Directing Certificateholder.
A “Control Termination Event” will occur when (i) no Class of Control Eligible Certificates exists that has a certificate balance (as notionally reduced by any Cumulative Appraisal Reduction Amounts allocable to such Class) that is at least equal to 25% of the initial certificate balance of such Class; (ii) such mortgage loan or whole loan is an excluded loan; or (iii) a holder of the Class F Certificates becoming the majority controlling class certificateholder and having irrevocably waived its right, in writing, to exercise any of the rights of the controlling class certificateholder and such rights have not been reinstated to a successor controlling class certificateholder; provided that a Control Termination Event shall not be deemed continuing in the event that the certificate balances of the Certificates other than the Control Eligible Certificates have been reduced to zero as a result of principal payments on the mortgage loans. The “Cumulative Appraisal Reduction Amount” as of any date of determination for any mortgage loan, is equal to the sum of (i) all appraisal reduction amounts then in effect, and (ii) with respect to any AB Modified Loan, any Collateral Deficiency Amount then in effect. “AB Modified Loan” means any corrected loan (1) that became a corrected loan (which includes for purposes of this definition any non-serviced mortgage loan that became a “corrected loan” (or any term substantially similar thereto) pursuant to the Lead Pooling and Servicing Agreement governing the servicing of such non-serviced mortgage loan) due to a modification thereto that resulted in the creation of an A/B note structure (or similar structure) and as to which the new junior note(s) did not previously exist or the principal amount of the new junior note(s) was previously part of either an A note held by the issuing entity or the original unmodified mortgage loan and (2) as to which an appraisal reduction amount is not in effect.
“Collateral Deficiency Amount” means, with respect to any AB Modified Loan as of any date of determination, the excess of (i) the principal balance of such AB Modified Loan (taking into account the related junior note(s) and any pari passu notes included therein), over (ii) the sum of (in the case of a Whole Loan, solely to the extent allocable to the subject mortgage loan) (x) the most recent Appraised Value for the related mortgaged property or mortgaged properties, plus (y) solely to the extent not reflected or taken into account in such Appraised Value (or in the calculation of any related appraisal reduction amount) and to the extent on deposit with, or otherwise under the control of, the lender as of the date of such determination, any capital or additional collateral contributed by the |
THE INFORMATION IN THIS STRUCTURAL AND COLLATERAL TERM SHEET IS NOT COMPLETE AND MAY BE AMENDED PRIOR TO THE TIME OF SALE. THIS TERM SHEET IS NOT AN OFFER TO SELL THESE SECURITIES AND IT IS NOT A SOLICITATION OF AN OFFER TO BUY THESE SECURITIES IN ANY JURISDICTION WHERE THE OFFER OR SALE IS NOT PERMITTED.
23
Control/Consultation Rights (continued): | related borrower at the time the mortgage loan became (and as part of the modification related to) such AB Modified Loan for the benefit of the related mortgaged property or mortgaged properties (provided that in the case of a non-serviced mortgage loan, the amounts set forth in this clause (y) will be taken into account solely to the extent relevant information is received by the master servicer), plus (z) any other escrows or reserves (in addition to any amounts set forth in the immediately preceding clause (y) and solely to the extent not reflected or taken into account in the calculation of any related appraisal reduction amount) held by the lender in respect of such AB Modified Loan as of the date of such determination, which such excess, for the avoidance of doubt, will be determined separately from and exclude any related appraisal reduction amounts. A “Consultation Termination Event” will occur when (i) no class of Control Eligible Certificates exists where such class’ aggregate certificate balance is at least equal to 25% of the initial certificate balance of that class, in each case, without regard to the application of any Cumulative Appraisal Reduction Amounts or (ii) a holder of Class F Certificates is the majority controlling class certificateholder and has irrevocably waived its right, in writing, to exercise any of the rights of the controlling class certificateholder, and such rights have not been reinstated to a successor controlling class certificateholder;provided that no Consultation Termination Event resulting solely from the operation of clause (ii) shall be deemed to have existed or be in continuance with respect to a successor holder of a majority of the Class F Certificates that has not irrevocably waived its right to exercise any of the rights of the controlling class certificateholder. With respect to each non-serviced whole loan, so long as a Consultation Termination Event does not exist, the Directing Certificateholder for this transaction will have certain consultation rights with respect to certain major decisions regarding the non-serviced whole loans, and the applicable directing certificateholder (or equivalent entity) pursuant to the related Lead Pooling and Servicing Agreement will have consultation, approval and direction rights, with respect to certain major decisions (including with respect to assumptions, waivers, loan modifications and workouts) regarding such non-serviced whole loan, as provided for in the related co-lender agreement and in the related Lead Pooling and Servicing Agreement, and as described under “Description of the Mortgage Pool—The Whole Loans” in the Preliminary Prospectus.
Notwithstanding any contrary description set forth above, in the event that, with respect to any mortgage loan, the Directing Certificateholder or any controlling class certificateholder is a Borrower Party (any of the above, as applicable, an “Excluded Controlling Class Holder”), such Excluded Controlling Class Holder will not have any consultation or approval rights with respect to such mortgage loan and will have no right to receive asset status reports or such other information as may be specified in the pooling and servicing agreement. A “Borrower Party” is a borrower, a mortgagor, a manager of a mortgaged property or the holder of a mezzanine loan that has been accelerated or as to which foreclosure or enforcement proceedings have been commenced against the equity collateral pledged to secure the related mezzanine loan, a person controlling or controlled by or under common control with the foregoing or any other such person owning, directly or indirectly, 25% or more of the beneficial interests in such borrower, mortgagor, manager of a mortgaged property or mezzanine lender. |
THE INFORMATION IN THIS STRUCTURAL AND COLLATERAL TERM SHEET IS NOT COMPLETE AND MAY BE AMENDED PRIOR TO THE TIME OF SALE. THIS TERM SHEET IS NOT AN OFFER TO SELL THESE SECURITIES AND IT IS NOT A SOLICITATION OF AN OFFER TO BUY THESE SECURITIES IN ANY JURISDICTION WHERE THE OFFER OR SALE IS NOT PERMITTED.
24
| Risk Retention Consultation Party: | The risk retention consultation party will be the party selected by the holder or holders of more than 50% of the VRR Interest. Natixis is expected to be appointed as the initial risk retention consultation party with respect to the mortgage loans. Except with respect to an excluded loan as to such party, the risk retention consultation party will have certain non-binding consultation rights with respect to certain matters relating to specially serviced loans. |
| Whole Loans: | The Park Center Phase I mortgage loan, which will be contributed to the issuing entity, has an outstanding principal balance as of the Cut-off Date of $80,000,000, represents approximately 9.3% of the Initial Pool Balance, and has one related companion loan that ispari passu in right of payment with the Park Center Phase I mortgage loan, which is currently held by Column Financial, Inc. and is expected to be contributed to one or more future securitization trusts (the “Park Center Phase I Companion Loan”). Thepari passu companion loan described above is referred to in this Term Sheet as a “pari passu companion loan”, a “serviced companion loan” and a “companion loan”. The Park Center Phase I mortgage loan and the related companion loans are collectively referred to in this Term Sheet as the “Park Center Phase I whole loan”, a “serviced whole loan” and a “whole loan”.
The Westin Building Exchange mortgage loan, which will be contributed to the issuing entity, has an outstanding principal balance as of the Cut-off Date of $67,500,000, represents approximately 7.9% of the Initial Pool Balance, and has one related companion loan that ispari passu in right of payment with the Westin Building Exchange mortgage loan, which is currently held by Wells Fargo Bank, National Association and is expected to be contributed to one or more future securitization trusts (the “Westin Building Exchange Companion Loan”). Thepari passu companion loan described above is referred to in this Term Sheet as a “pari passu companion loan”, a “non-serviced companion loan” and a “companion loan”. The Westin Building Exchange mortgage loan and the related companion loans are collectively referred to in this Term Sheet as the “Westin Building Exchange whole loan”, a “non-serviced whole loan” and a “whole loan”.
The Two Independence Square mortgage loan, which will be contributed to the issuing entity, has an outstanding principal balance as of the Cut-off Date of $55,000,000, represents approximately 6.4% of the Initial Pool Balance, and has (i) two related companion loans that arepari passu in right of payment with the Two Independence Square mortgage loan, one of which was contributed to the CSMC Trust 2017-MOON securitization transaction and one of which was contributed to the WFCM 2017-C39 securitization transaction (the “Two Independence Square Pari Passu Companion Loans”) and (ii) one related companion loan that is generally subordinate in right of payment with the Two Independence Square mortgage loan and was contributed to the CSMC Trust 2017-MOON securitization transaction (the “Two Independence Square Subordinate Companion Loan”). Eachpari passu companion loan described above is referred to in this Term Sheet as a “pari passu companion loan”, a “non-serviced companion loan” and a “companion loan”. The subordinate companion loan described above is referred to in this Term Sheet as a “subordinate companion loan”, a “non-serviced companion loan” and a “companion loan”. The Two Independence Square mortgage loan and the related companion loans are collectively referred to in this Term Sheet as the “Two Independence Square whole loan”, a “non-serviced whole loan” and a “whole loan”. The Two Independence Square whole loan will be serviced by the CSMC 2017-MOON transaction master servicer and, if and to the extent necessary, the CSMC 2017-MOON transaction special servicer under the CSMC 2017-MOON transaction trust and servicing agreement |
THE INFORMATION IN THIS STRUCTURAL AND COLLATERAL TERM SHEET IS NOT COMPLETE AND MAY BE AMENDED PRIOR TO THE TIME OF SALE. THIS TERM SHEET IS NOT AN OFFER TO SELL THESE SECURITIES AND IT IS NOT A SOLICITATION OF AN OFFER TO BUY THESE SECURITIES IN ANY JURISDICTION WHERE THE OFFER OR SALE IS NOT PERMITTED.
25
Whole Loans (continued):
| (referred to as the “CSMC 2017-MOON TSA” in this Term Sheet). Wells Fargo, as the CSMC 2017-MOON transaction trustee, or a custodian on its behalf, will hold the mortgage file for the Two Independence Square whole loan pursuant to the CSMC 2017-MOON TSA (other than the promissory note for the related mortgage loan, which will be held by the custodian under the pooling and servicing agreement for this securitization, and any related companion loans not included in the CSMC 2017-MOON transaction).
The 245 Park Avenue mortgage loan, which will be contributed to the issuing entity, has an outstanding principal balance as of the Cut-off Date of $54,000,000, represents approximately 6.3% of the Initial Pool Balance, and has (i) 21 related companion loans that arepari passu in right of payment with the 245 Park Avenue mortgage loan, of which (a) five notes were contributed to the 245 Park Avenue Trust 2017-245P securitization transaction, (b) one note was contributed to the JPMCC 2017-JP7 securitization transaction, (c) one note was contributed to the JPMCC 2017-JP6 securitization transaction, (d) two notes were contributed to the DBJPM 2017-C6 securitization transaction, (e) one note was contributed to the CSAIL 2017-C8 securitization transaction, (f) one note was contributed to the WFCM 2017-C38 transaction, (g) one note was contributed to the WFCM 2017-C39 securitization transaction, (h) two notes were contributed to the UBS 2017-C3 securitization transaction, (i) one note was contributed to the UBS 2017-C2 securitization transaction, (j) one note is currently held by JPMorgan Chase Bank, National Association and are expected to be contributed to one or more future securitization trusts, (k) two notes are currently held by Natixis Real Estate Capital LLC or an affiliate and are expected to be contributed to one or more future securitization trusts, (l) two notes are currently held by Deutsche Bank AG, New York Branch or an affiliate and are expected to be contributed to one or more future securitization trusts, and (m) one note is currently held by Barclays Bank PLC and is expected to be contributed to one or more future securitization trusts, and (ii) five related companion loans that are subordinate in right of payment with the 245 Park Avenue mortgage loan, of which all five subordinate companion notes were contributed to the 245 Park Avenue Trust 2017-245P securitization transaction. Eachpari passu companion loan described above is referred to in this Term Sheet as a “pari passu companion loan”, a “non-serviced companion loan” and a “companion loan”. Each subordinate companion loan described above is referred to in this Term Sheet as a “subordinate companion loan”, a “non-serviced companion loan” and a “companion loan”. The 245 Park Avenue mortgage loan and the related companion loans are collectively referred to in this Term Sheet as the “245 Park Avenue whole loan”, a “non-serviced whole loan” and a “whole loan”. The 245 Park Avenue whole loan will be serviced by the 245 Park Avenue Trust 2017-245P transaction master servicer and, if and to the extent necessary, the 245 Park Avenue Trust 2017-245P transaction special servicer under the 245 Park Avenue Trust 2017-245P transaction trust and servicing agreement (referred to as the “245 Park Avenue Trust 2017-245P TSA” in this Term Sheet). Wilmington Trust, National Association as the 245 Park Avenue Trust 2017-245P transaction trustee, or a custodian on its behalf, will hold the mortgage file for the 245 Park Avenue whole loan pursuant to the 245 Park Avenue Trust 2017-245P TSA (other than the promissory note for the related mortgage loan, which will be held by the custodian under the pooling and servicing agreement for this securitization, and any related companion loans not included in the 245 Park Avenue Trust 2017-245P transaction).
The Boulders Resort & Spa mortgage loan, which will be contributed to the issuing entity, has an outstanding principal balance as of the Cut-off Date of $50,000,000, represents approximately 5.8% of the Initial Pool Balance, and has one related companion loan that ispari passu in right of payment with the Boulders Resort & Spa mortgage loan, which is |
THE INFORMATION IN THIS STRUCTURAL AND COLLATERAL TERM SHEET IS NOT COMPLETE AND MAY BE AMENDED PRIOR TO THE TIME OF SALE. THIS TERM SHEET IS NOT AN OFFER TO SELL THESE SECURITIES AND IT IS NOT A SOLICITATION OF AN OFFER TO BUY THESE SECURITIES IN ANY JURISDICTION WHERE THE OFFER OR SALE IS NOT PERMITTED.
26
Whole Loans (continued):
| currently held by Column Financial, Inc. and is expected to be contributed to one or more future securitization trusts (the “Boulders Resort & Spa Companion Loan”). Thepari passu companion loan described above is referred to in this Term Sheet as a “pari passu companion loan”, a “serviced companion loan” and a “companion loan”. The Boulders Resort & Spa mortgage loan and the related companion loan are collectively referred to in this Term Sheet as the “Boulders Resort & Spa whole loan”, a “serviced whole loan” and a “whole loan.”
The 85 Broad Street mortgage loan, which will be contributed to the issuing entity, has an outstanding principal balance as of the Cut-off Date of $45,000,000, represents approximately 5.2% of the Initial Pool Balance, and has (i) three related companion loans that arepari passu in right of payment with the 85 Broad Street mortgage loan, two of which were contributed to the CSAIL 2017-C8 securitization transaction and one of which was contributed to the UBS 2017-C2 securitization transaction (the “85 Broad Street Pari Passu Companion Loans”), (ii) one related companion loan that is generally subordinate in right of payment with the 85 Broad Street mortgage loan and which was contributed to the CSAIL 2017-C8 securitization transaction (the “85 Broad Street Non-Trust Subordinate Companion Loan”) and (iii) two related companion loans that are generally subordinate in right of payment with the 85 Broad Street mortgage loan, the 85 Broad Street Pari Passu Companion Loan and the 85 Broad Street Non-Trust Subordinate Companion Loan, which are currently held by separate unaffiliated third party investors. Eachpari passu companion loan described above is referred to in this Term Sheet as a “pari passu companion loan”, a “non-serviced companion loan” and a “companion loan”. Each subordinate companion loan described above is referred to in this Term Sheet as a “subordinate companion loan”, a “non-serviced companion loan” and a “companion loan”. The 85 Broad Street mortgage loan and the related companion loans are collectively referred to in this Term Sheet as the “85 Broad Street whole loan”, a “non-serviced whole loan” and a “whole loan”. The 85 Broad Street whole loan will be serviced by the CSAIL 2017-C8 transaction master servicer and, if and to the extent necessary, the CSAIL 2017-C8 transaction special servicer under the CSAIL 2017-C8 transaction pooling and servicing agreement (referred to as the “CSAIL 2017-C8 PSA” in this Term Sheet). Wells Fargo Bank, National Association, as the CSAIL 2017-C8 transaction trustee, or a custodian on its behalf, will hold the mortgage file for the 85 Broad Street whole loan pursuant to the CSAIL 2017-C8 PSA (other than the promissory note for the related mortgage loan, which will be held by the custodian under the pooling and servicing agreement for this securitization, and any related companion loans not included in the CSAIL 2017-C8 transaction).
The Allergan HQ mortgage loan, which will be contributed to the issuing entity, has an outstanding principal balance as of the Cut-off Date of $45,000,000, represents approximately 5.2% of the Initial Pool Balance, and has one related companion loan that is subordinate in right of payment with the Allergan HQ mortgage loan, which was sold to a third party investor. The subordinate companion loan described above is referred to in this Term Sheet as a “subordinate companion loan”, a “serviced companion loan” and a “companion loan”. The Allergan HQ mortgage loan and the related companion loans are collectively referred to in this Term Sheet as the “Allergan HQ whole loan”, a “serviced whole loan” and a “whole loan”.
The JW Marriott Chicago mortgage loan, which will be contributed to the issuing entity, has an outstanding principal balance as of the Cut-off Date of $40,000,000, represents approximately 4.7% of the Initial Pool Balance, and has (i) two related companion loans |
THE INFORMATION IN THIS STRUCTURAL AND COLLATERAL TERM SHEET IS NOT COMPLETE AND MAY BE AMENDED PRIOR TO THE TIME OF SALE. THIS TERM SHEET IS NOT AN OFFER TO SELL THESE SECURITIES AND IT IS NOT A SOLICITATION OF AN OFFER TO BUY THESE SECURITIES IN ANY JURISDICTION WHERE THE OFFER OR SALE IS NOT PERMITTED.
27
Whole Loans (continued): | that arepari passu in right of payment with the JW Marriott Chicago mortgage loan, one of which was contributed to the UBS 2017-C3 securitization transaction and one of which is held by Natixis Real Estate Capital LLC or an affiliate and (ii) three related companion loans that are subordinate in right of payment with the JW Marriott Chicago mortgage loan, each of which was sold to a third party investor. Thepari passu companion loans described above are referred to in this Term Sheet as “pari passu companion loans”, “serviced companion loans” and “companion loans”. The subordinate companion loans described above are referred to in this Term Sheet as “subordinate companion loans”, “serviced companion loans” and “companion loans”. The JW Marriott Chicago mortgage loan and the related companion loans are collectively referred to in this Term Sheet as the “JW Marriott Chicago whole loan”, a “serviced whole loan” and a “whole loan”.
The 300 Montgomery mortgage loan, which will be contributed to the issuing entity, has an outstanding principal balance as of the Cut-off Date of $36,000,000, represents approximately 4.2% of the Initial Pool Balance, and has one related companion loan that ispari passu in right of payment with the 300 Montgomery mortgage loan, which is currently held by Natixis Real Estate Capital LLC and is expected to be contributed to one or more future securitization trusts (the “300 Montgomery Companion Loan”). Thepari passu companion loan described above is referred to in this Term Sheet as a “pari passu companion loan”, a “serviced companion loan” and a “companion loan”. The 300 Montgomery mortgage loan and the related companion loan are collectively referred to in this Term Sheet as the “300 Montgomery whole loan”, a “serviced whole loan” and a “whole loan”.
The Center 78 mortgage loan, which will be contributed to the issuing entity, has an outstanding principal balance as of the Cut-off Date of $35,863,277, represents approximately 4.2% of the Initial Pool Balance, and has (i) one related companion loan that ispari passu in right of payment with the Center 78 mortgage loan, which was contributed to the UBS 2017-C3 securitization transaction and (ii) one related companion loan that is subordinate in right of payment with the Center 78 mortgage loan, which is currently held by Natixis Real Estate Capital LLC or an affiliate. Thepari passu companion loan described above is referred to in this Term Sheet as a “pari passu companion loan”, a “serviced companion loan” and a “companion loan”. The subordinate companion loan described above is referred to in this Term Sheet as a “subordinate companion loan”, a “serviced companion loan” and a “companion loan”. The Center 78 mortgage loan and the related companion loans are collectively referred to in this Term Sheet as the “Center 78 whole loan”, a “serviced whole loan” and a “whole loan”.
The West Town Mall mortgage loan, which will be contributed to the issuing entity, has an outstanding principal balance as of the Cut-off Date of $30,000,000, represents approximately 3.5% of the Initial Pool Balance, and has (i) three related companion loans that arepari passu in right of payment with the West Town Mall mortgage loan, two of which were contributed to the WTOWN 2017-KNOX securitization transaction and one of which was contributed to the JPMCC 2017-JP7 securitization transaction (the “West Town Mall Pari Passu Companion Loans”) and (ii) two related companion loans that are generally subordinate in right of payment with the West Town Mall mortgage loan and which were contributed to the WTOWN 2017-KNOX securitization transaction. Eachpari passu companion loan described above is referred to in this Term Sheet as a “pari passu companion loan”, a “non-serviced companion loan” and a “companion loan”. Each subordinate companion loan described above is referred to in this Term Sheet as a “subordinate companion loan”, a “non-serviced companion loan” and a “companion loan”. |
THE INFORMATION IN THIS STRUCTURAL AND COLLATERAL TERM SHEET IS NOT COMPLETE AND MAY BE AMENDED PRIOR TO THE TIME OF SALE. THIS TERM SHEET IS NOT AN OFFER TO SELL THESE SECURITIES AND IT IS NOT A SOLICITATION OF AN OFFER TO BUY THESE SECURITIES IN ANY JURISDICTION WHERE THE OFFER OR SALE IS NOT PERMITTED.
28
| The West Town Mall mortgage loan and the related companion loans are collectively referred to in this Term Sheet as the “West Town Mall whole loan”, a “non-serviced whole loan” and a “whole loan”. The West Town Mall whole loan will be serviced by the WTOWN 2017-KNOX transaction master servicer and, if and to the extent necessary, the WTOWN 2017-KNOX transaction special servicer under the WTOWN 2017-KNOX transaction trust and servicing agreement (referred to as the “WTOWN 2017-KNOXTSA” in this Term Sheet). Wilmington Trust, National Association, as the WTOWN 2017-KNOX transaction trustee, or a custodian on its behalf, will hold the mortgage file for the West Town Mall whole loan pursuant to the WTOWN 2017-KNOX TSA (other than the promissory note for the related mortgage loan, which will be held by the custodian under the pooling and servicing agreement for this securitization, and any related companion loans not included in the WTOWN 2017-KNOX transaction). | |
| Whole Loans (continued): | The Acropolis Garden mortgage loan, which will be contributed to the issuing entity, has an outstanding principal balance as of the Cut-off Date of $25,000,000, represents approximately 2.9% of the Initial Pool Balance and has one related companion loan that ispari passu in right of payment with the Acropolis Garden mortgage loan, which was contributed to the CSAIL 2017-C8 securitization transaction. Thepari passu companion loan described above is referred to in this Term Sheet as a “pari passu companion loan”, a “serviced whole loan” and a “companion loan”. The Acropolis Garden mortgage loan and the related companion loan are collectively referred to in this Term Sheet as the “Acropolis Garden whole loan”, a “serviced whole loan” and a “whole loan”.
The Carolina Hotel Portfolio mortgage loan, which will be contributed to the issuing entity, has an outstanding principal balance as of the Cut-off Date of $20,000,000, represents approximately 2.3% of the Initial Pool Balance and has one related companion loan that ispari passu in right of payment with the Carolina Hotel Portfolio mortgage loan, which was contributed to the JPMCC 2017-JP7 securitization transaction. Thepari passu companion loan described above is referred to in this Term Sheet as a “pari passu companion loan”, a “serviced whole loan” and a “companion loan”. The Carolina Hotel Portfolio mortgage loan and the related companion loan are collectively referred to in this Term Sheet as the “Carolina Hotel Portfolio whole loan”, a “serviced whole loan” and a “whole loan”.
The Apex Fort Washington mortgage loan, which will be contributed to the issuing entity, has an outstanding principal balance as of the Cut-off Date of $16,750,000, represents approximately 2.0% of the Initial Pool Balance and has two related companion loans that arepari passu in right of payment with the Apex Fort Washington mortgage loan, one of which was contributed to the JPMCC 2017-JP6 securitization transaction and the other of which was contributed to the JPMCC 2017-JP7 securitization transaction. Thepari passu companion loan described above is referred to in this Term Sheet as a “pari passu companion loan”, a “serviced whole loan” and a “companion loan”. The Apex Fort Washington mortgage loan and the related companion loan are collectively referred to in this Term Sheet as the “Apex Fort Washington whole loan”, a “serviced whole loan” and a “whole loan”.
The IC Leased Fee Hotel Portfolio mortgage loan, which will be contributed to the issuing entity, has an outstanding principal balance as of the Cut-off Date of $11,465,000, represents approximately 1.3% of the Initial Pool Balance, and has two related companion loans that arepari passuin right of payment with the IC Leased Fee Hotel Portfolio mortgage loan, one of which was contributed to the UBS 2017-C2 securitization transaction and one of which was contributed to the UBS 2017-C3 securitization transaction (the “IC Leased Fee Hotel Portfolio Companion Loans”). Eachpari passu companion loan described above is |
THE INFORMATION IN THIS STRUCTURAL AND COLLATERAL TERM SHEET IS NOT COMPLETE AND MAY BE AMENDED PRIOR TO THE TIME OF SALE. THIS TERM SHEET IS NOT AN OFFER TO SELL THESE SECURITIES AND IT IS NOT A SOLICITATION OF AN OFFER TO BUY THESE SECURITIES IN ANY JURISDICTION WHERE THE OFFER OR SALE IS NOT PERMITTED.
29
Whole Loans (continued):
| referred to in this Term Sheet as a “pari passu companion loan”, a “non-serviced companion loan” and a “companion loan”. The IC Leased Fee Hotel Portfolio mortgage loan and the related companion loans are collectively referred to in this Term Sheet as the “IC Leased Fee Hotel Portfolio whole loan”, a “non-serviced whole loan” and a “whole loan”. The IC Leased Fee Hotel Portfolio whole loan will be serviced by the UBS 2017-C3 transaction master servicer and, if and to the extent necessary, the UBS 2017-C3 transaction special servicer under the UBS 2017-C3 transaction pooling and servicing agreement (referred to as the “UBS 2017-C3 PSA” in this Term Sheet). Wells Fargo Bank, National Association, as the UBS 2017-C3 transaction trustee, or a custodian on its behalf, will hold the mortgage file for the IC Leased Fee Hotel Portfolio whole loan pursuant to the UBS 2017-C3 PSA (other than the promissory note for the related mortgage loan, which will be held by the custodian under the pooling and servicing agreement for this securitization, and any related companion loans not included in the UBS 2017-C3 transaction).
Each of the CSMC 2017-MOON TSA, the 245 Park Avenue TSA, the CSAIL 2017-C8 PSA, the West Town Mall Trust 2017-KNOX TSA and the UBS 2017-C3 PSA is also referred to in this Term Sheet as a “Lead Pooling and Servicing Agreement” insofar as it relates to the non-serviced whole loan serviced thereunder.
In the case of the non-serviced whole loans, the related mortgage loans are referred to as “non-serviced mortgage loans”.
The Park Center Phase I Whole Loan, The Boulders Resort & Spa Whole Loan, the Allergan HQ Whole Loan, the JW Marriot Chicago Whole Loan, the 300 Montgomery Whole Loan, the Center 78 Whole Loan, the Acropolis Garden Whole Loan, the Carolina Hotel Portfolio Whole Loan and the Apex Fort Washington Whole Loan will be serviced by KeyBank, as the CSAIL 2017-CX9 master servicer, and special serviced by Rialto, as the CSAIL 2017-CX9 special servicer pursuant to the terms of the CSAIL 2017-CX9 PSA. Wells Fargo, as the CSAIL 2017-CX9 trustee, or a custodian on its behalf, will hold the mortgage file for the Park Center Phase I Whole Loan, The Boulders Resort & Spa Whole Loan, the Allergan HQ Whole Loan, JW Marriott Chicago whole loan, the 300 Montgomery whole loan, the Center 78 Whole Loan, the Acropolis Garden Whole Loan, the Carolina Hotel Portfolio Whole Loan and the Apex Fort Washington Whole Loan pursuant to the CSAIL 2017-CX9 PSA (other than the promissory notes for any related companion loans that are not assets of the CSAIL 2017-CX9 securitization).
For more information regarding the whole loans, see “Description of the Mortgage Pool—The Whole Loans” in the Preliminary Prospectus. |
| Servicing Standard: | Each of the mortgage loans (other than the non-serviced mortgage loans) and serviced whole loan(s) will be serviced by the master servicer and the special servicer pursuant to the terms of the pooling and servicing agreement. In all circumstances, each of the master servicer and the special servicer are obligated to act in the best interests of the certificateholders (and, in the case of a serviced whole loan, the holder of the related serviced companion loan) as a collective whole as if such certificateholders (and, if applicable, such companion loan holder), constituted a single lender (taking into account thepari passu or subordinate nature of any related companion loan(s)). The special servicer is required to determine the effect on net present value of various courses of action (including workout or foreclosure), using the Calculation Rate as the discount rate, and pursue the course of action that it determines would maximize recovery on a net present value basis. |
THE INFORMATION IN THIS STRUCTURAL AND COLLATERAL TERM SHEET IS NOT COMPLETE AND MAY BE AMENDED PRIOR TO THE TIME OF SALE. THIS TERM SHEET IS NOT AN OFFER TO SELL THESE SECURITIES AND IT IS NOT A SOLICITATION OF AN OFFER TO BUY THESE SECURITIES IN ANY JURISDICTION WHERE THE OFFER OR SALE IS NOT PERMITTED.
30
“Calculation Rate” means:
(a) for principal and interest payments on a mortgage loan or proceeds from the sale of a defaulted loan, the highest of (i) the rate determined by the master servicer or the special servicer, as applicable, that approximates the market rate that would be obtainable by borrowers on similar debt of the borrowers as of such date of determination, (ii) the mortgage loan rate and (iii) the yield on 10-year US treasuries; and
(b) for all other cash flows, including property cash flow, the “discount rate” set forth in the most recent appraisal (or update of such appraisal). | |
| Termination of Special Servicer: | Except as limited by certain conditions described in the Preliminary Prospectus, the special servicer may generally be replaced, prior to the occurrence and continuance of a Control Termination Event, at any time and without cause, by the Directing Holder so long as, among other things, the Directing Holder provides a replacement special servicer that meets the requirements of the pooling and servicing agreement.
After the occurrence and during the continuance of a Control Termination Event, the holders of at least 25% of the voting rights of the principal balance certificates may request a vote to replace the special servicer. The subsequent vote may result in the termination and replacement of such special servicer if, within 180 days of the initial request for that vote, the holders of (a) at least 66-2/3% of a “certificateholder quorum” (holders of certificates evidencing at least 75% of the aggregate voting rights (taking into account the application of realized losses) of the certificates (other than the Class X, Class Z and Class R certificates)), or (b) more than 50% of the voting rights of each class of certificates other than any Class X, Class Z and Class R certificates (but in the case of this clause (b) only such classes of principal balance certificates that, in each case, have an outstanding certificate balance, as notionally reduced by any appraisal reduction amounts allocated to such class, equal to or greater than 25% of the initial certificate balance of such class, minus all payments of principal made on such class of certificates), vote affirmatively to so replace such special servicer.
If the operating advisor determines, in its sole discretion exercised in good faith, that (1) the special servicer is not performing its duties as required under the pooling and servicing agreement or is otherwise not acting in accordance with the servicing standard and (2) the replacement of the special servicer would be in the best interest of the certificateholders as a collective whole, the operating advisor will have the right to recommend the replacement of the special servicer. The operating advisor’s recommendation to replace the special servicer must be confirmed within 180 days of after the notice is posted to the certificate administrator’s website by an affirmative vote of holders of certificates evidencing at least a majority of a quorum of certificateholders (which, for this purpose, is the holders of certificates that (i) evidence at least 20% of the voting rights (taking into account the application of any appraisal reduction amounts to notionally reduce the respective certificate balances) of all principal balance certificates on an aggregate basis, and (ii) consist of at least three certificateholders or certificate owners that are not Risk Retention Affiliated with each other). In the event the holders of such principal balance certificates elect to remove and replace the special servicer, the certificate administrator will be required to obtain a rating agency confirmation from each of the rating agencies at that time. |
| Excluded Special Servicer: | In the event that, with respect to any mortgage loan (other than any non-serviced mortgage |
THE INFORMATION IN THIS STRUCTURAL AND COLLATERAL TERM SHEET IS NOT COMPLETE AND MAY BE AMENDED PRIOR TO THE TIME OF SALE. THIS TERM SHEET IS NOT AN OFFER TO SELL THESE SECURITIES AND IT IS NOT A SOLICITATION OF AN OFFER TO BUY THESE SECURITIES IN ANY JURISDICTION WHERE THE OFFER OR SALE IS NOT PERMITTED.
31
| loan), the special servicer has obtained knowledge that it is a Borrower Party with respect to any mortgage loan or serviced whole loan, the special servicer will be required to resign as special servicer of such mortgage loan (an “Excluded Special Servicer Loan”), and, prior to the occurrence and continuance of a Control Termination Event, the Directing Certificateholder or the majority controlling class certificateholder on its behalf will be required to select a successor special servicer that is not a Borrower Party in accordance with the terms of the pooling and servicing agreement (an “Excluded Special Servicer”) with respect to such Excluded Special Servicer Loan unless such Excluded Special Servicer Loan is also an excluded loan with respect to such Directing Certificateholder or the holder of the majority of the controlling class, in which case the resigning special servicer will be required to use reasonable efforts to appoint the Excluded Special Servicer. | |
Servicing Compensation:
| Modification Fees: Certain fees resulting from modifications, amendments, waivers or other changes to the terms of the loan documents, as more fully described in the Preliminary Prospectus, will be used to offset expenses on the related serviced mortgage loan (i.e., a mortgage loan other than a non-serviced mortgage loan) or serviced whole loan, if applicable (i.e., reimburse the trust for certain expenses including unreimbursed advances and interest on unreimbursed advances previously incurred (other than special servicing fees, workout fees and liquidation fees) on the related mortgage loan (other than a non-serviced mortgage loan) or serviced whole loan, if applicable, but not yet reimbursed to the trust or servicers), or to pay expenses (other than special servicing fees, workout fees and liquidation fees) that are still outstanding, in each case unless as part of the written modification the related borrower is required to pay these amounts on a going forward basis or in the future). Any excess modification fees not so applied to offset expenses will be available as compensation to the master servicer and/or applicable special servicer. Within any prior 12-month period, all excess modification fees earned by the master servicer or by the applicable special servicer (after taking into account the offset described below applied during such 12-month period) with respect to any mortgage loan (other than a non-serviced mortgage loan) or serviced whole loan, if applicable, will be subject to a cap equal to the greater of (i) 1.0% of the outstanding principal balance of such mortgage loan after giving effect to such transaction and (ii) $25,000.
All excess modification fees earned by either special servicer will be required to offset any future workout fees or liquidation fees payable with respect to the related mortgage loan (other than a non-serviced mortgage loan) or serviced whole loan, if applicable, or related REO property;provided that if the mortgage loan (other than a non-serviced mortgage loan) or serviced whole loan, if applicable, ceases being a corrected loan, and is subject to a subsequent modification, any excess modification fees earned by the applicable special servicer prior to such mortgage loan (other than a non-serviced mortgage loan) or serviced whole loan, if applicable, ceasing to be a corrected loan will no longer be offset against future liquidation fees and workout fees unless such mortgage loan (other than a non-serviced mortgage loan) or serviced whole loan, if applicable, ceased to be a corrected loan within 12 months of it becoming a modified mortgage loan (or modified whole loan, if applicable).
Penalty Charges: All late fees and default interest will first be used to reimburse certain expenses previously incurred with respect to the related mortgage loan (other than a non-serviced mortgage loan) or serviced whole loan, if applicable (other than special servicing fees, workout fees and liquidation fees) but not yet reimbursed to the trust, the master servicer or the applicable special servicer or to pay certain expenses (other than special |
THE INFORMATION IN THIS STRUCTURAL AND COLLATERAL TERM SHEET IS NOT COMPLETE AND MAY BE AMENDED PRIOR TO THE TIME OF SALE. THIS TERM SHEET IS NOT AN OFFER TO SELL THESE SECURITIES AND IT IS NOT A SOLICITATION OF AN OFFER TO BUY THESE SECURITIES IN ANY JURISDICTION WHERE THE OFFER OR SALE IS NOT PERMITTED.
32
Servicing Compensation
| servicing fees, workout fees and liquidation fees) that are still outstanding on the related mortgage loan (other than a non-serviced mortgage loan) or serviced whole loan, if applicable, and any excess received with respect to a serviced loan will be paid to the master servicer (for penalty charges accrued while a non-specially serviced loan), and the applicable special servicer (for penalty charges accrued while a specially serviced loan). To the extent any amounts reimbursed out of penalty charges are subsequently recovered on a related serviced loan, they will be paid to the master servicer or applicable special servicer who would have been entitled to the related penalty charges that were previously used to reimburse such expense.
Liquidation / Workout Fees: Liquidation fees will be calculated at the lesser of (a) 1.0% and (b) such lower rate as would result in a liquidation fee of $1,000,000, for each mortgage loan (other than a non-serviced mortgage loan) or serviced whole loan that is a specially serviced loan and any REO property, subject in any case to a minimum liquidation fee of $25,000, except that the liquidation fee will be zero with respect to certain liquidation events set forth in the pooling and servicing agreement, and the liquidation fee with respect to each mortgage loan or REO mortgage loan repurchased or substituted for after more than 180 days following the Mortgage Loan Seller’s receipt of notice or discovery of a material breach or material defect will be in an amount equal to the liquidation fee rate described above of the outstanding principal balance of such mortgage loan or REO loan. For any mortgage loan (other than a non-serviced loan) or serviced whole loan that is a corrected loan, workout fees will be calculated at the lesser of (a) 1.0% and (b) such lower rate as would result in a workout fee of $1,000,000 when applied to each expected payment of principal and interest (other than default interest) on the related mortgage loan (other than a non-serviced mortgage loan) or serviced whole loan, if applicable, from the date such serviced loan becomes a corrected loan through and including the then related maturity date; or in any case such higher rate as would result in a workout fee of $25,000 when applied to each expected payment of principal and interest (other than default interest) on any mortgage loan from the date such serviced loan becomes a corrected loan through and including the then related maturity date.
Notwithstanding the foregoing, in connection with a maturity default, no liquidation or workout fee will be payable in connection with a payoff or refinancing of the related serviced loan within 90 days of the maturity default. |
| Operating Advisor: | The operating advisor will have access to any final asset status report and information available with respect to the transaction on the certificate administrator’s website and will have certain monitoring responsibilities on behalf of the entire issuing entity. After the occurrence and during the continuance of an Operating Advisor Consultation Event, the operating advisor will be entitled to consult with the special servicer with respect of the asset status reports and certain major decisions processed by the special servicer on behalf of the issuing entity and in the best interest of, and for the benefit of, the certificateholders and, in the case of a serviced whole loan, the related companion loan holder(s), as a collective whole, as if those certificateholders and, if applicable, such companion loan holder(s) constituted a single lender (taking into account thepari passu or subordinate nature of any related companion loan(s)).
After the occurrence and during the continuance of a Consultation Termination Event, the operating advisor may be removed without cause if the holders of at least 25% of the voting rights request a vote to replace the operating advisor and such vote is approved by the holders of at least 75% of the voting rights. |
THE INFORMATION IN THIS STRUCTURAL AND COLLATERAL TERM SHEET IS NOT COMPLETE AND MAY BE AMENDED PRIOR TO THE TIME OF SALE. THIS TERM SHEET IS NOT AN OFFER TO SELL THESE SECURITIES AND IT IS NOT A SOLICITATION OF AN OFFER TO BUY THESE SECURITIES IN ANY JURISDICTION WHERE THE OFFER OR SALE IS NOT PERMITTED.
33
| An “Operating Advisor Consultation Event” will occur when (i) the HRR Certificates have an aggregate certificate balance (as notionally reduced by any appraisal reduction amounts allocable to any class of the HRR certificates) is 25% or less of the initial aggregate certificate balance of the HRR Certificates, or (ii) a Control Termination Event has occurred and is continuing. | |
Asset Representations Reviewer: | The asset representations reviewer will be required to review certain delinquent mortgage loans after a specified delinquency threshold has been exceeded and the required percentage of certificateholders vote to direct a review of such delinquent mortgage loans. An asset review will occur when either (1) mortgage loans with an aggregate outstanding principal balance of 25.0% or more of the aggregate outstanding principal balance of all of the mortgage loans (including any REO loans (or a portion of any REO loan in the case of a whole loan)) held by the issuing entity as of the end of the applicable collection period are delinquent loans or (2) at least 15 mortgage loans are delinquent loans as of the end of the applicable collection period and the outstanding principal balance of such delinquent loans in the aggregate constitutes at least 20.0% of the aggregate outstanding principal balance of all of the mortgage loans (including any REO loans (or a portion of any REO loan in the case of a whole loan)) held by the issuing entity as of the end of the applicable collection period. |
| Replacement of the Asset Representations Reviewer: | The asset representations reviewer may be terminated and replaced without cause. Upon (i) the written direction of certificateholders evidencing not less than 25% of the voting rights (without regard to the application of any cumulative appraisal reduction amounts) requesting a vote to terminate and replace the asset representations reviewer with a proposed successor asset representations reviewer that is an eligible asset representations reviewer, and (ii) payment by such holders to the certificate administrator of the reasonable fees and expenses to be incurred by the certificate administrator in connection with administering such vote, the certificate administrator will promptly provide notice to all certificateholders and the asset representations reviewer of such request. Upon the written direction of certificateholders evidencing at least 75% of a certificateholder quorum (without regard to the application of any cumulative appraisal reduction amounts), the trustee will terminate all of the rights and obligations of the asset representations reviewer under the pooling and servicing agreement, and the proposed successor asset representations reviewer will be appointed. |
Dispute Resolution Provisions: | Each Mortgage Loan Seller will be subject to the dispute resolution provisions set forth in the pooling and servicing agreement to the extent those provisions are triggered with respect to any mortgage loan sold to the depositor by a Mortgage Loan Seller and such Mortgage Loan Seller will be obligated under the related mortgage loan purchase agreement to comply with all applicable provisions and to take part in any mediation or arbitration proceedings that may result.
Generally, in the event that a repurchase request is not “Resolved” (as defined below) within 180 days after the related Mortgage Loan Seller receives such repurchase request, then the enforcing servicer will be required to send a notice to the “initial requesting certificateholder” (if any) and to the certificate administrator who will make such notice available to all other certificateholders and certificate owners indicating the enforcing servicer’s intended course of action with respect to the repurchase request. Such notice will notify all certificateholders and certificate owners that in the event any certificateholder disagrees with the enforcing servicer’s intended course of action, the enforcing servicer will be required to follow the course of action agreed to and/or proposed by the majority of the responding certificateholders that involves referring the matter to mediation or |
THE INFORMATION IN THIS STRUCTURAL AND COLLATERAL TERM SHEET IS NOT COMPLETE AND MAY BE AMENDED PRIOR TO THE TIME OF SALE. THIS TERM SHEET IS NOT AN OFFER TO SELL THESE SECURITIES AND IT IS NOT A SOLICITATION OF AN OFFER TO BUY THESE SECURITIES IN ANY JURISDICTION WHERE THE OFFER OR SALE IS NOT PERMITTED.
34
Dispute Resolution Provisions (continued):
| arbitration, as the case may be. If (a) the enforcing servicer’s intended course of action with respect to the repurchase request does not involve pursuing further action to exercise rights against the related Mortgage Loan Seller with respect to the repurchase request and the initial requesting certificateholder, if any, or any other certificateholder or certificate owner wishes to exercise its right to refer the matter to mediation (including nonbinding arbitration) or arbitration, or (b) the enforcing servicer’s intended course of action is to pursue further action to exercise rights against the related Mortgage Loan Seller with respect to the repurchase request but the initial requesting certificateholder, if any, or any other certificateholder or certificate owner does not agree with the dispute resolution method selected by the enforcing servicer, then the initial requesting certificateholder, if any, or such other certificateholder or certificate owner may deliver a written notice to the enforcing servicer indicating its intent to exercise its right to refer the matter to either mediation or arbitration.
“Resolved” means, with respect to a repurchase request, (i) that related material defect has been cured, (ii) the related mortgage loan has been repurchased in accordance with the related mortgage loan purchase agreement, (iii) a mortgage loan has been substituted for the related mortgage loan in accordance with the related mortgage loan purchase agreement, (iv) the applicable Mortgage Loan Seller has paid a loss of value payment, (v) a contractually binding agreement is entered into between the enforcing servicer, on behalf of the issuing entity, and the related Mortgage Loan Seller that settles the related Mortgage Loan Seller’s obligations under the related mortgage loan purchase agreement, or (vi) the related mortgage loan is no longer property of the issuing entity as a result of a sale or other disposition in accordance with the pooling and servicing agreement. |
| Deal Website: | The Certificate Administrator will maintain a deal website including, but not limited to:
■ all special notices delivered
■ summaries of final asset status reports
■ all appraisals in connection with appraisal reduction amounts plus any subsequent appraisal updates
■ an “Investor Q&A Forum” and a voluntary investor registry |
THE INFORMATION IN THIS STRUCTURAL AND COLLATERAL TERM SHEET IS NOT COMPLETE AND MAY BE AMENDED PRIOR TO THE TIME OF SALE. THIS TERM SHEET IS NOT AN OFFER TO SELL THESE SECURITIES AND IT IS NOT A SOLICITATION OF AN OFFER TO BUY THESE SECURITIES IN ANY JURISDICTION WHERE THE OFFER OR SALE IS NOT PERMITTED.
35
Mortgage Loan No. 1 — Park Center Phase I
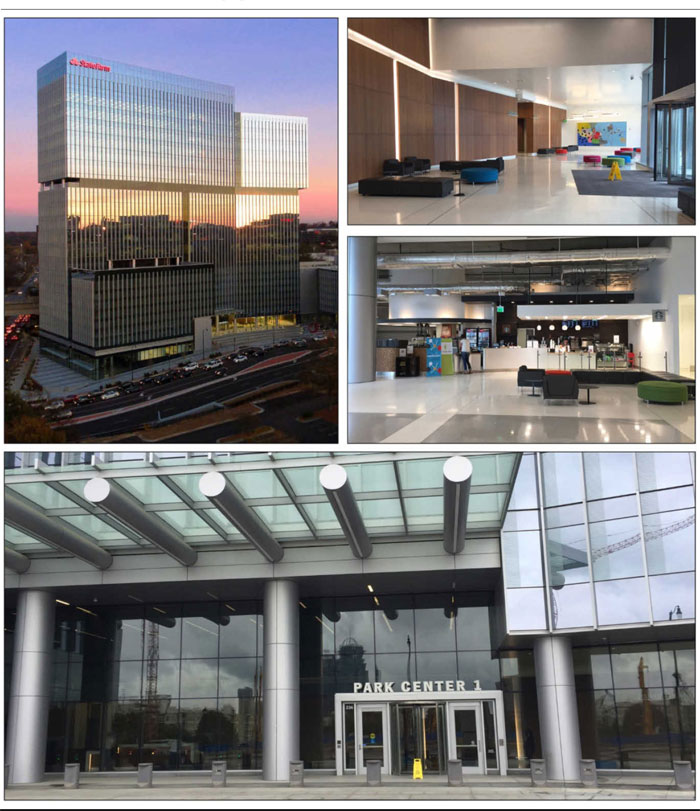
THE INFORMATION IN THIS COLLATERAL TERM SHEET IS NOT COMPLETE AND MAY BE AMENDED PRIOR TO THE TIME OF SALE. THIS TERM SHEET IS NOT AN OFFER TO SELL THESE SECURITIES AND IT IS NOT A SOLICITATION OF AN OFFER TO BUY THESE SECURITIES IN ANY JURISDICTION WHERE THE OFFER OR SALE IS NOT PERMITTED.
36
Mortgage Loan No. 1 — Park Center Phase I
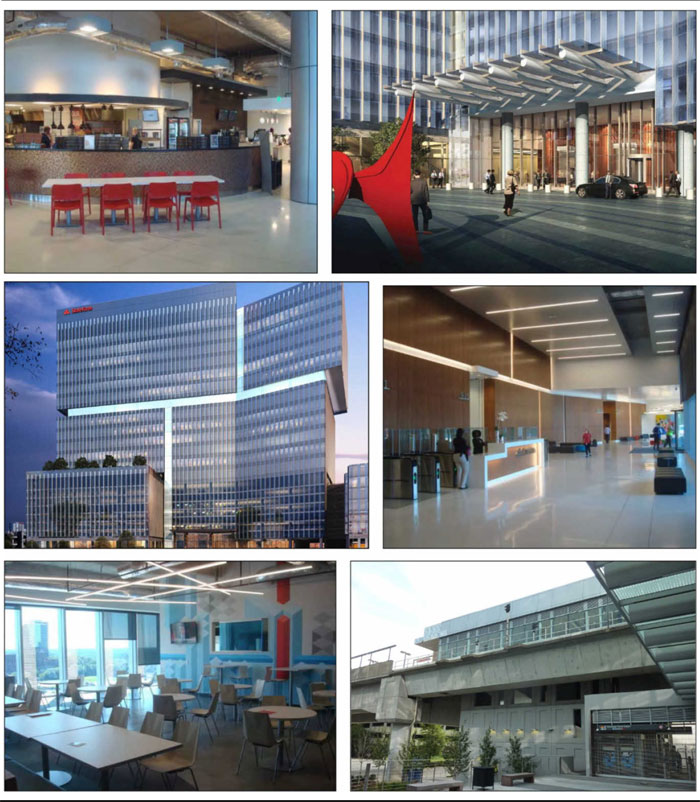
THE INFORMATION IN THIS COLLATERAL TERM SHEET IS NOT COMPLETE AND MAY BE AMENDED PRIOR TO THE TIME OF SALE. THIS TERM SHEET IS NOT AN OFFER TO SELL THESE SECURITIES AND IT IS NOT A SOLICITATION OF AN OFFER TO BUY THESE SECURITIES IN ANY JURISDICTION WHERE THE OFFER OR SALE IS NOT PERMITTED.
37
Mortgage Loan No. 1 — Park Center Phase I
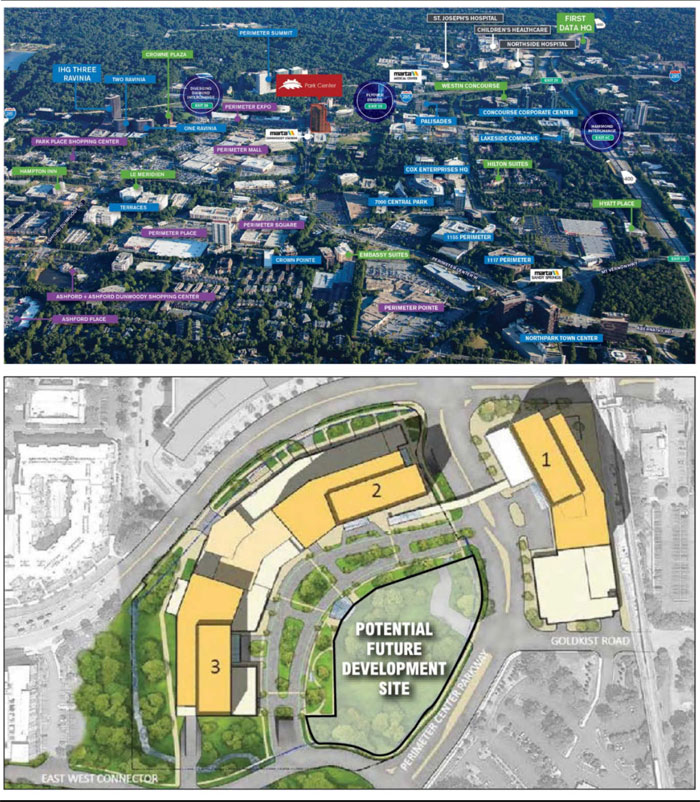
THE INFORMATION IN THIS COLLATERAL TERM SHEET IS NOT COMPLETE AND MAY BE AMENDED PRIOR TO THE TIME OF SALE. THIS TERM SHEET IS NOT AN OFFER TO SELL THESE SECURITIES AND IT IS NOT A SOLICITATION OF AN OFFER TO BUY THESE SECURITIES IN ANY JURISDICTION WHERE THE OFFER OR SALE IS NOT PERMITTED.
38
Mortgage Loan No. 1 — Park Center Phase I

THE INFORMATION IN THIS COLLATERAL TERM SHEET IS NOT COMPLETE AND MAY BE AMENDED PRIOR TO THE TIME OF SALE. THIS TERM SHEET IS NOT AN OFFER TO SELL THESE SECURITIES AND IT IS NOT A SOLICITATION OF AN OFFER TO BUY THESE SECURITIES IN ANY JURISDICTION WHERE THE OFFER OR SALE IS NOT PERMITTED.
39
Mortgage Loan No. 1 — Park Center Phase I
| Mortgage Loan Information | Property Information | |||
| Mortgage Loan Seller: | Column | Single Asset / Portfolio: | Single Asset | |
| Original Principal Balance(1): | $80,000,000 | Title: | Fee | |
| Cut-off Date Principal Balance(1): | $80,000,000 | Property Type - Subtype: | Office – Suburban | |
| % of Pool by IPB: | 9.3% | Net Rentable Area (SF): | 590,926 | |
| Loan Purpose: | Acquisition | Location: | Dunwoody, GA | |
| Borrower: | Corporate Properties Trust II SPE, L.L.C. | Year Built / Renovated: | 2016 / NAP | |
| Sponsors: | Mirae Asset Global Investments | Occupancy: | 99.5% | |
| Interest Rate: | 3.3400% | Occupancy Date: | 7/1/2017 | |
| Note Date: | 7/27/2017 | Number of Tenants: | 3 | |
| Maturity Date: | 8/6/2024 | 2014 NOI(3): | N/A | |
| Interest-only Period: | 84 months | 2015 NOI(3): | N/A | |
| Original Term: | 84 months | 2016 NOI(3): | N/A | |
| Original Amortization: | None | YTD NOI(3): | $15,881,058 | |
| Amortization Type: | Interest Only | UW Economic Occupancy: | 99.6% | |
| Call Protection: | YM1(74),O(10) | UW Revenues: | $24,931,963 | |
| Lockbox(2): | Hard | UW Expenses: | $7,842,171 | |
| Additional Debt(1): | Yes | UW NOI: | $17,089,792 | |
| Additional Debt Balance(1): | $78,000,000 | UW NCF: | $16,965,384 | |
| Additional Debt Type(1): | Pari Passu | Appraised Value / Per SF: | $307,500,000 / $520 | |
| Additional Future Debt Permitted: | No | Appraisal Date: | 6/26/2017 |
| Escrows and Reserves(4) | Financial Information(1) | |||||
| Initial | Monthly | Initial Cap | Cut-off Date Loan / SF: | $267 | ||
| Taxes: | $0 | Springing | N/A | Maturity Date Loan / SF: | $267 | |
| Insurance: | $0 | Springing | N/A | Cut-off Date LTV: | 51.4% | |
| Replacement Reserves: | $0 | Springing | N/A | Maturity Date LTV: | 51.4% | |
| TI/LC: | $3,090,000 | Springing | N/A | UW NOI DSCR: | 3.19x | |
| UW NCF DSCR: | 3.17x | |||||
| UW NOI Debt Yield: | 10.8% | |||||
| UW NCF Debt Yield: | 10.7% | |||||
| Sources and Uses | ||||||
| Sources | Proceeds | % of Total | Uses | Proceeds | % of Total | |
| Whole Mortgage Loan | $158,000,000 | 57.7% | Purchase Price | $275,400,000 | 100.6% | |
| Sponsor Equity | 115,737,730 | 42.3 | Closing Credit and Proration | (7,180,915) | (2.6) | |
| Upfront Reserves | 3,090,000 | 1.1 | ||||
| Closing Costs | 2,428,645 | 0.9 | ||||
| Total Sources | $273,737,730 | 100.0% | Total Uses | $273,737,730 | 100.0% |
| (1) | The Park Center Phase I loan is part of a larger split whole loan evidenced by twopari passu notes with an aggregate original principal balance of $158.0 million (collectively, the “Park Center Phase I Whole Loan”). The financial information presented in the chart above reflects the cut-off date balance of the Park Center Phase I Whole Loan. |
| (2) | For a more detailed description of lockbox, please refer to “Lockbox / Cash Management” below. |
THE INFORMATION IN THIS COLLATERAL TERM SHEET IS NOT COMPLETE AND MAY BE AMENDED PRIOR TO THE TIME OF SALE. THIS TERM SHEET IS NOT AN OFFER TO SELL THESE SECURITIES AND IT IS NOT A SOLICITATION OF AN OFFER TO BUY THESE SECURITIES IN ANY JURISDICTION WHERE THE OFFER OR SALE IS NOT PERMITTED.
40
Mortgage Loan No. 1 — Park Center Phase I
| (3) | Historical financials are not available due to the property being completed in 2016. YTD represents the annualized trailing five month period ending May 31, 2017. |
| (4) | For a more detailed description of Escrows and Reserves, please refer to “Escrows and Reserves” below. |
The Loan. The Park Center Phase I loan, which is part of a larger split whole loan is secured by a first mortgage lien on a 590,926 SF office located on an approximately 3.5-acre site in Dunwoody, Georgia. The Park Center Phase I Whole Loan has an outstanding principal balance of $158.0 million, which is evidenced by two pari-passu notes identified as Note A-1 and Note A-2. Note A-1, which is the controlling note and has an outstanding principal balance as of the Cut-off Date of $80.0 million, is being contributed to the CSAIL 2017-CX9 Commercial Mortgage Trust. Note A-2, which has an outstanding principal balance as of the Cut-off Date of $78.0 million is expected to be contributed to one or more future securitizations. The Park Center Phase I Whole Loan is expected to be serviced pursuant to the CSAIL 2017-CX9 pooling and servicing agreement. As the holder of Note A-1 (the “Controlling Noteholder”), the trustee of the CSAIL 2017-CX9 Commercial Mortgage Trust (or, prior to the occurrence and continuance of a control termination event under the CSAIL 2017-CX9 pooling and servicing agreement, the CSAIL 2017-CX9 directing certificateholder) is entitled to exercise all of the rights of the Controlling Noteholder with respect to the Park Center Phase I Whole Loan; however, the holder of Note A-2 is entitled, under certain circumstances, to consult with respect to certain major decisions. The loan has a 7-year term and is interest-only for the entire term.
Whole Loan Note Summary
| Original Balance | Cut-off Date Balance | Note Holder | Lead Servicer for Whole Loan (Y/N) | Controlling Piece (Y/N) | |
| Note A-1 | $80,000,000 | $80,000,000 | CSAIL 2017-CX9 | Y | Y |
| Note A-2 | 78,000,000 | 78,000,000 | Column | N | N |
| Total | $158,000,000 | $158,000,000 |
The Borrower. The borrowing entity for the loan is Corporate Properties Trust II SPE, L.L.C., a Delaware limited liability company and special purpose entity. The borrower is indirectly owned and controlled by a joint venture between Transwestern Investment Group, L.L.C (“TIG”), the general partner and special limited partner, (5.5% ownership interest) and Mirae Asset Global Investments Co. Ltd. (“Mirae”), the limited partner, (94.5% ownership interest).
The Sponsors. The loan’s sponsors are TIG and Mirae. The loan does not provide for a nonrecourse carve-out guarantor. TIG is a real estate investment advisor with assets under management of approximately $3.1 billion (including assets in separate accounts, joint ventures and fund formats). TIG has a strong relationship with State Farm, acting not only as an investment fiduciary but also as a property manager. In 2011, State Farm engaged TIG to formulate and execute a core equity investment program across the primary property types on a national level. The equity allocation was $1.0 billion to be invested over four years. Since the program's inception, TIG has acquired and currently manages more than $1.0 billion in core assets. As a part of that program, TIG is working with State Farm on its reorganization of mission critical operations into three separate regional HUB locations in Atlanta, Georgia (the property), Dallas, Texas, and Tempe, Arizona. TIG continues to manage and have an ownership interest in the property. Mirae is a subsidiary of Mirae Asset Financial Group, a leading independent financial service firm in Asia, with approximately $4.2 billion in real estate invested equity and a net asset value of $8.5 billion.
The Property. The property is a 590,926 SF, Class A, LEED Gold Certified office building located in Dunwoody, Georgia. The property was constructed in 2016 and consists of a 21-story building situated on approximately 3.5 acres, in the southeast quadrant of Hammond Drive and Perimeter Center Parkway Northeast, immediately southwest of Perimeter Mall and the MARTA (rail transit) Dunwoody Station. The build-out of the floors varies throughout the building, but generally features open areas with cubicles, private offices, kitchenettes, break areas and conference rooms. Floors nine and fifteen are training floors, which have large training rooms, and the tenth floor is an executive floor. The ninth floor also has an outdoor patio on the green roof. Floors eight and below are parking garages which contains 2,283 garage parking spaces providing an overall parking ratio of 3.9 spaces per 1,000 SF of NRA. The lobby has a café and seating area and Del Frisco’s executed a lease for retail space facing Hammond Drive and Perimeter Center Parkway.
THE INFORMATION IN THIS COLLATERAL TERM SHEET IS NOT COMPLETE AND MAY BE AMENDED PRIOR TO THE TIME OF SALE. THIS TERM SHEET IS NOT AN OFFER TO SELL THESE SECURITIES AND IT IS NOT A SOLICITATION OF AN OFFER TO BUY THESE SECURITIES IN ANY JURISDICTION WHERE THE OFFER OR SALE IS NOT PERMITTED.
41
Mortgage Loan No. 1 — Park Center Phase I
As of July 1, 2017, the property was 99.5% leased by 3 tenants. The largest tenant at the property, State Farm Mutual Automobile Insurance Co (S&P: AA) (“State Farm”), leases 569,778 SF (96.4% of the net rentable area (“NRA”)) through June 2037. According to the appraisal, State Farm constructed the campus as a mission critical regional office headquarters. The property is Phase I of a two phase development. Two additional buildings, totaling approximately 1.1 million SF, not part of the collateral, are under construction across Perimeter Center Parkway Northeast. The first of the two buildings is estimated to be complete in the second quarter of 2020, and the second building is estimated to be complete in the second quarter of 2021. The Phase II buildings are expected to be connected with the property via a to-be-built overhead pedestrian bridge as well as a subterranean parking tunnel that was constructed as part of Phase I. The property’s lobby has granite finishes with a cafe and seating area and direct access to the recently completed entrance to the Dunwoody MARTA rail station. The property has a parking garage with eleven stories which includes the four basement levels and floors 2-8 between the lobby and the office space. The garage has 2,283 spaces, or 3.9 spaces per 1,000 SF of NRA, and can be accessed via four entrances. The property is 99.5% leased, with all of the office space leased to State Farm (569,778 SF, 96.4% of NRA), the remaining spaces are a restaurant leased to Del Frisco's, which is anticipated to take occupancy on June 1, 2018 (10,090 SF, 1.7% of NRA), a cafeteria and a cafe leased to Compass Food Court (“Compass”) (4,895 SF, 0.8% of NRA), and management and security offices and storage (6,163 SF, 1.0% of NRA). The storage space (2,869 SF) is currently the only vacant space. At closing, the borrower funded an upfront reserve of approximately $3.1 million for outstanding tenant improvement costs and leasing commissions related to the Del Frisco’s space.
The property was built-to-suit by State Farm and TIG to act as one of State Farm’s three regional Hub locations for State Farm. State Farm has an option to extend the lease for up to 20 additional years by exercising multiple extensions. This location acts as their southeastern HUB housing operations including, underwriting, claims, accounting, and IT. State Farm occupies approximately 1.2 million SF of additional space in the market. As leases at alternate sites expire, employees will be moving to the property and the two buildings in Phase II. State Farm is a Fortune 500, AA rated by S&P, insurance company with over 65,000 employees and more than 18,000 independent contractor agents. As of December 31, 2016, State Farm had serviced over 84.4 million policies and accounts.
According to the appraiser, the property’s local market area benefits from its close proximity and access to several major thoroughfares, public transportation stations, the City of Atlanta, densely developed residential neighborhoods and commercial nodes. The property benefits from its direct access to the Dunwoody MARTA Station. Additionally, Georgia Highway 400 is 0.7 miles west of the property and Interstate 285 is located just north of the property.
The Market. The property is located in the Central Perimeter area which is located about 12.5 miles north of downtown Atlanta, and houses several major office complexes. The Atlanta-Sandy Springs-Marietta Metropolitan Statistical Area (“Atlanta MSA”) is the ninth largest region in the United States, consisting of 28 counties in northwest Georgia. The City of Atlanta is the largest incorporated area within the Atlanta MSA encompassing, most of Fulton County and a portion extending into neighboring DeKalb County. According to Moody’s Analytics, Atlanta had the third fastest-growing MSA between 2000 and 2010 of the 10 most populous MSAs in the United States.
Per the appraisal, as of February 2017, the region added 95,400 new jobs over the last year pushing total non-farm employment to over 2.7 million. According to the Bureau of Labor Statistics, the Atlanta MSA had the fastest rate of job growth among the 12 largest metropolitan areas in the nation, measuring 3.6% as of the trailing twelve month period ending February 2017. Atlanta gained the third-most jobs in the nation, behind New York (145,800 jobs) and Dallas (119,300 jobs). The Atlanta MSA is home to four Global 500 corporations, thirteen Fortune 500 corporations and 24 Fortune 1000 corporations. Atlanta ranks third in the number of Fortune 500 companies headquartered within city boundaries, behind New York and Houston.
THE INFORMATION IN THIS COLLATERAL TERM SHEET IS NOT COMPLETE AND MAY BE AMENDED PRIOR TO THE TIME OF SALE. THIS TERM SHEET IS NOT AN OFFER TO SELL THESE SECURITIES AND IT IS NOT A SOLICITATION OF AN OFFER TO BUY THESE SECURITIES IN ANY JURISDICTION WHERE THE OFFER OR SALE IS NOT PERMITTED.
42
Mortgage Loan No. 1 — Park Center Phase I
According to Reis, Inc., Atlanta Office market contains approximately 143.8 million SF of office space. The property falls in Reis, Inc.’s North Central/I-285/Georgia 400 submarket which is the largest submarket, containing approximately 23.8 million SF and 16.6% of the area's total inventory. According to CoStar as of July 2017, the Atlanta office market reported an inventory of approximately 302.8 million SF, a vacancy rate of 12.2%, and an asking rent of $21.94 PSF. The vacancy rate was up 0.3% over the previous year, was down from the 13.7% historical average. Vacancies have compressed steadily since 2010. Net absorption was positive approximately 1.6 million SF over the 12-month period. According to the appraisal, the property’s competitive set consists of the eight properties detailed in the table below.
Competitive Set Summary(1)
| Property | Year Built | Total GLA (SF) | Est. Rent PSF(2) | Est. Occ. | Proximity (miles) |
| Park Center Phase I(3) | 2016 | 590,926 | $29.18 | 99.5% | N/A |
| Buckhead Atlanta | 2014 | 112,150 | $26.25 | UAV | 6.9 |
| 12th& Midtown | 2010 | 752,710 | $24.00 | 88% | 10.9 |
| 1180 Peachtree | 2006 | 670,443 | $40.00(4) | 99% | 10.7 |
| CODA Tech Square(5) | 2019 | 775,000 | $47.50(4) | UAV | 11.6 |
| Concourse Corporate Center | 1988 | 687,107 | $33.50(4) | UAV | 0.9 |
| Three Alliance | 2017 | 501,678 | $27.50 - $30.25 | 65% | 5.5 |
| 4004 Perimeter Summit(5) | 2017 | 355,250 | $32.00 | UAV | 1.2 |
| (1) | Source: Appraisal. |
| (2) | Based on recent leases identified by the appraisal. |
| (3) | Based on the underwritten rent roll. |
| (4) | The rents reflect gross rental rates while the other rents reflect net rental rates. |
| (5) | Currently under construction, Year Built is based on estimates provided by the appraisal. |
Corporations with Offices in the Central Perimeter
| Property | Fortune 500 Company | Proximity (miles) |
| UPS World Headquarters | Yes | 2.4 |
| First Data Headquarters | Yes | 1.7 |
| Mercedes Benz USA Headquarters (under construction) | N/A | 1.8 |
| IHG International Hotels Group | N/A | 0.7 |
| Cox Enterprises Headquarters | N/A | 0.6 |
| Veritiv Corporate Headquarters | Yes | 1.5 |
| Axiall Corporate Headquarters | N/A | 1.5 |
Historical and Current Occupancy(1)
| 2014 | 2015 | 2016 | Current(2) |
| N/A | N/A | N/A | 99.5% |
| (1) | Historical financials are not available due to the property being built in 2016. |
| (2) | Based on the underwritten rent roll. |
THE INFORMATION IN THIS COLLATERAL TERM SHEET IS NOT COMPLETE AND MAY BE AMENDED PRIOR TO THE TIME OF SALE. THIS TERM SHEET IS NOT AN OFFER TO SELL THESE SECURITIES AND IT IS NOT A SOLICITATION OF AN OFFER TO BUY THESE SECURITIES IN ANY JURISDICTION WHERE THE OFFER OR SALE IS NOT PERMITTED.
43
Mortgage Loan No. 1 — Park Center Phase I
Tenant Summary(1)(2)
| Tenant | Ratings Moody’s/S&P/Fitch | Net Rentable Area (SF) | % of Total NRA | Base Rent PSF | Base Rent | % of Total Base Rents | Lease Expiration Date |
| State Farm(3) | NR / AA / NR | 569,778 | 96.4% | $29.27 | $16,677,288 | 96.7% | 6/30/2037 |
| Del Frisco's(4) | NR / NR / NR | 10,090 | 1.7% | $51.54 | $520,000 | 3.0% | 5/31/2028 |
| Compass Food Court | NR / NR / NR | 4,895 | 0.8% | $9.38 | $45,932 | 0.3% | 12/31/2022 |
| (1) | Based on the underwritten rent roll. Rent includes base rent and rent increases for the proceeding 12 month period for Del Frisco's and Compass. State Farm's rent, as a credit tenant, is underwritten to the average annual rent over the term of the loan, or $29.27 PSF. Property leased rent is currently $16,267,668, or $27.53 PSF compared to underwritten rent of $17,243,241, or $29.18 PSF. |
| (2) | The property also includes a 2,143 SF management office and a 1,151 SF security office. |
| (3) | Ratings provided are for tenant, State Farm Mutual Automobile Insurance Company. |
| (4) | Del Frisco’s is anticipated to take occupancy in June 2018 upon completion of its space. |
Lease Rollover Schedule(1)
| Year | Number of Leases Expiring | NRA Expiring | % of NRA Expiring | Base Rent Expiring | % of Base Rent Expiring | Cumulative NRA Expiring | Cumulative % of NRA Expiring | Cumulative Base Rent Expiring | Cumulative % of Base Rent Expiring |
| Vacant | NAP | 2,869 | 0.5% | NAP | NAP | 2,869 | 0.5% | NAP | NAP |
| MTM | 0 | 0 | 0.0 | $0 | 0.0% | 2,869 | 0.5% | $0 | 0.0% |
| 2017 | 0 | 0 | 0.0 | 0 | 0.0 | 2,869 | 0.5% | $0 | 0.0% |
| 2018 | 0 | 0 | 0.0 | 0 | 0.0 | 2,869 | 0.5% | $0 | 0.0% |
| 2019 | 0 | 0 | 0.0 | 0 | 0.0 | 2,869 | 0.5% | $0 | 0.0% |
| 2020 | 0 | 0 | 0.0 | 0 | 0.0 | 2,869 | 0.5% | $0 | 0.0% |
| 2021 | 0 | 0 | 0.0 | 0 | 0.0 | 2,869 | 0.5% | $0 | 0.0% |
| 2022 | 1 | 4,895 | 0.8 | 45,932 | 0.3 | 7,764 | 1.3% | $45,932 | 0.3% |
| 2023 | 0 | 0 | 0.0 | 0 | 0.0 | 7,764 | 1.3% | $45,932 | 0.3% |
| 2024 | 0 | 0 | 0.0 | 0 | 0.0 | 7,764 | 1.3% | $45,932 | 0.3% |
| 2025 | 0 | 0 | 0.0 | 0 | 0.0 | 7,764 | 1.3% | $45,932 | 0.3% |
| 2026 | 0 | 0 | 0.0 | 0 | 0.0 | 7,764 | 1.3% | $45,932 | 0.3% |
| 2027 & Beyond | 2 | 583,162 | 98.7 | 17,197,288 | 99.7 | 590,926 | 100.0% | $17,243,221 | 100.0% |
| Total | 3 | 590,926 | 100.0% | $17,243,221 | 100.0% |
| (1) | Based on the underwritten rent roll. Rent includes base rent and rent increases for the proceeding 12 month period for Del Frisco's and Compass. State Farm's rent, as a credit tenant, is underwritten to the average annual rent over the term of the loan, or $29.27 PSF. Property leased rent is currently $16,267,668, or $27.53 PSF compared to underwritten rent of $17,243,241, or $29.18 PSF. |
THE INFORMATION IN THIS COLLATERAL TERM SHEET IS NOT COMPLETE AND MAY BE AMENDED PRIOR TO THE TIME OF SALE. THIS TERM SHEET IS NOT AN OFFER TO SELL THESE SECURITIES AND IT IS NOT A SOLICITATION OF AN OFFER TO BUY THESE SECURITIES IN ANY JURISDICTION WHERE THE OFFER OR SALE IS NOT PERMITTED.
44
Mortgage Loan No. 1 — Park Center Phase I
Operating History and Underwritten Net Cash Flow
| 2014(1) | 2015(1) | 2016(1) | YTD(2) | Underwritten(3) | PSF | %(4) | |
| Rents in Place | N/A | N/A | N/A | $15,323,094 | $17,243,221 | $29.18 | 69.0% |
| Vacant Income | N/A | N/A | N/A | 0 | $20 | 0.00 | 0.0% |
| Gross Potential Rent | N/A | N/A | N/A | $15,323,094 | $17,243,241 | $29.18 | 69.0% |
| Total Reimbursements | N/A | N/A | N/A | 7,315,074 | 7,740,078 | 13.10 | 31.0% |
| Net Rental Income | N/A | N/A | N/A | $22,638,168 | $24,983,318 | $42.28 | 100.0% |
| (Vacancy/Collection Loss) | N/A | N/A | N/A | (44,298) | (108,178) | (0.18) | (0.4)% |
| Other Income | N/A | N/A | N/A | 0 | 56,823 | 0.10 | 0.2% |
| Effective Gross Income | N/A | N/A | N/A | $22,593,870 | $24,931,963 | $42.19 | 99.8% |
| Total Expenses | N/A | N/A | N/A | $6,712,812 | $7,842,171 | $13.27 | 31.5% |
| Net Operating Income | N/A | N/A | N/A | $15,881,058 | $17,089,792 | $28.92 | 68.5% |
| Total TI/LC, Capex/RR | N/A | N/A | N/A | 0 | 124,408 | 0.21 | 0.5% |
| Net Cash Flow | N/A | N/A | N/A | $15,881,058 | $16,965,384 | $28.71 | 68.0% |
| (1) | Historical financials are not available due to the property being built in 2016. |
| (2) | YTD represents the annualized trailing five months ending May 31, 2017. |
| (3) | Rents in Place includes base rent and rent increases for the proceeding 12 month period for Del Frisco's and Compass. State Farm's rent, as a credit tenant, is underwritten to the average annual rent over the term of the loan, or $29.27 PSF. Property leased rent is currently $16,267,668, or $27.53 PSF compared to underwritten rent of $17,243,241, or $29.18 PSF. Del Frisco’s is anticipated to take occupancy in June 2018 upon completion of its space. |
| (4) | Percentage column represents percent of Net Rental Income for all revenue lines and represents percent of Effective Gross Income for the remainder of fields. |
Property Management. The property is managed by Transwestern Commercial Services Georgia L.L.C., an affiliate of TIG.
Escrows and Reserves. At origination, the borrower deposited into escrow $3,090,000 for TI/LC reserves.
Tax and Insurance Escrows – The requirement of the borrower to make monthly deposits to the tax reserve and insurance reserve is waived so long as (a) State Farm has paid all taxes and insurance premiums prior to delinquency (such failure, a “Tenant Failure Event”) and (b) no Trigger Period (as defined below) has occurred.
TI/LC Reserves – At origination, the borrower made an initial TI/LC deposit of $3,090,000 related to obligations under the Del Frisco’s lease. The lender will collect $49,244 monthly only during a Trigger Period.
Replacement Reserves – The lender will collect $7,387 monthly only during a Trigger Period.
Lockbox / Cash Management. The loan is structured with a hard lockbox and springing cash management. Tenants have been directed to remit all payments due under their respective leases directly into the lockbox account. All funds in the lockbox account are required to be swept each business day into the lender-controlled cash management account and then to the borrower’s operating account unless a Tenant Failure Event or a Trigger Period has occurred. During the continuance of a Tenant Failure Event, so long as no Trigger Period is continuing, funds sufficient to pay the monthly tax and insurance escrow are retained in the cash management account and disbursed during each interest period in accordance with the loan documents; all additional funds are swept each business day to the borrower’s operating account. During the continuance of a Trigger Period, all funds in the cash management account are retained in the cash management account and disbursed during each interest period of the term of the loan in accordance with the loan documents.
THE INFORMATION IN THIS COLLATERAL TERM SHEET IS NOT COMPLETE AND MAY BE AMENDED PRIOR TO THE TIME OF SALE. THIS TERM SHEET IS NOT AN OFFER TO SELL THESE SECURITIES AND IT IS NOT A SOLICITATION OF AN OFFER TO BUY THESE SECURITIES IN ANY JURISDICTION WHERE THE OFFER OR SALE IS NOT PERMITTED.
45
Mortgage Loan No. 1 — Park Center Phase I
A “Trigger Period” means any period during which (i) an event of default shall have occurred and be continuing, (ii) State Farm is in default under the State Farm lease beyond any applicable notice and cure period, (iii) State Farm is rated below Baa3 by Moody’s (to the extent Moody’s is then rating State Farm) or BBB- by S&P, (iv) State Farm shall have surrendered, cancelled or terminated the State Farm lease or given written notice of its intent to surrender, cancel or terminate the State Farm lease, (v) State Farm fails to continuously occupy at least 50% of the aggregate space demised by the State Farm lease, (vi) State Farm is the subject of a voluntary or involuntary case concerning itself under the bankruptcy code or the subject of any other proceeding under any reorganization, arrangement, adjustment of debt, relief of creditors, dissolution, insolvency or similar law of any jurisdiction whether now or hereafter in effect, or State Farm shall have otherwise dissolved, been adjudicated insolvent or bankrupt or made a general assignment for the benefit of creditors, or (vii) the approved property manager is the subject of a voluntary or involuntary case concerning itself under the bankruptcy code or the subject of any other proceeding under any reorganization, arrangement, adjustment of debt, relief of creditors, dissolution, insolvency or similar law of any jurisdiction whether now or hereafter in effect, or approved property manager shall have otherwise dissolved, been adjudicated insolvent or bankrupt or made a general assignment for the benefit of creditors, and the borrower has not entered into a replacement approved management agreement with a new approved property manager within 90 days.
THE INFORMATION IN THIS COLLATERAL TERM SHEET IS NOT COMPLETE AND MAY BE AMENDED PRIOR TO THE TIME OF SALE. THIS TERM SHEET IS NOT AN OFFER TO SELL THESE SECURITIES AND IT IS NOT A SOLICITATION OF AN OFFER TO BUY THESE SECURITIES IN ANY JURISDICTION WHERE THE OFFER OR SALE IS NOT PERMITTED.
46
(THIS PAGE INTENTIONALLY LEFT BLANK)
47
Mortgage Loan No. 2 — Westin Building Exchange

THE INFORMATION IN THIS COLLATERAL TERM SHEET IS NOT COMPLETE AND MAY BE AMENDED PRIOR TO THE TIME OF SALE. THIS TERM SHEET IS NOT AN OFFER TO SELL THESE SECURITIES AND IT IS NOT A SOLICITATION OF AN OFFER TO BUY THESE SECURITIES IN ANY JURISDICTION WHERE THE OFFER OR SALE IS NOT PERMITTED.
48
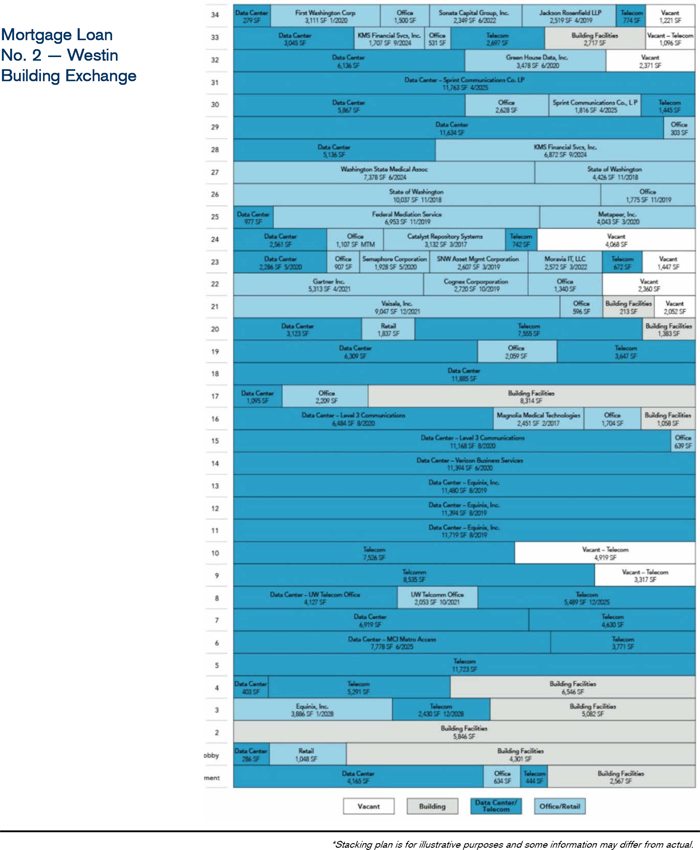
THE INFORMATION IN THIS COLLATERAL TERM SHEET IS NOT COMPLETE AND MAY BE AMENDED PRIOR TO THE TIME OF SALE. THIS TERM SHEET IS NOT AN OFFER TO SELL THESE SECURITIES AND IT IS NOT A SOLICITATION OF AN OFFER TO BUY THESE SECURITIES IN ANY JURISDICTION WHERE THE OFFER OR SALE IS NOT PERMITTED.
49
Mortgage Loan No. 2 — Westin Building Exchange
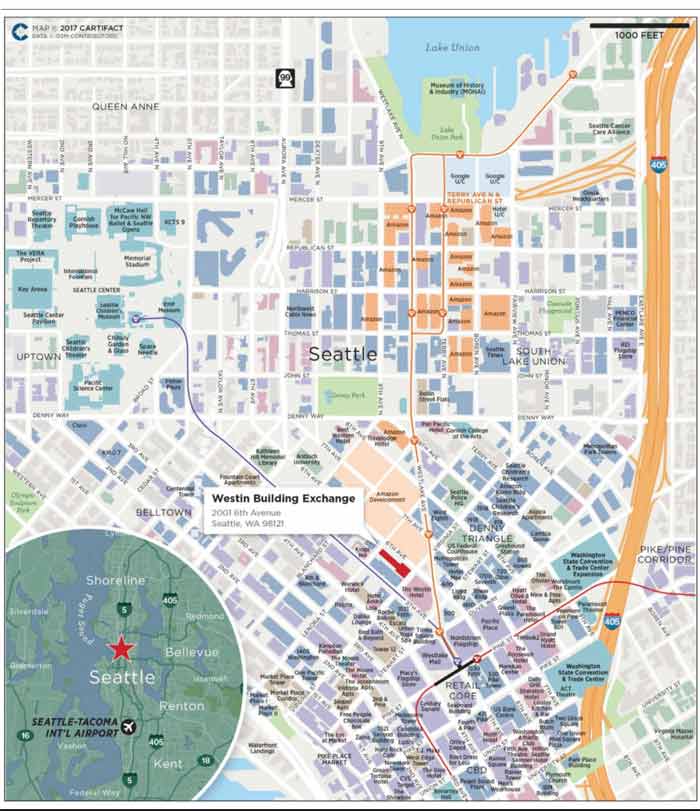
THE INFORMATION IN THIS COLLATERAL TERM SHEET IS NOT COMPLETE AND MAY BE AMENDED PRIOR TO THE TIME OF SALE. THIS TERM SHEET IS NOT AN OFFER TO SELL THESE SECURITIES AND IT IS NOT A SOLICITATION OF AN OFFER TO BUY THESE SECURITIES IN ANY JURISDICTION WHERE THE OFFER OR SALE IS NOT PERMITTED.
50
Mortgage Loan No. 2 — Westin Building Exchange
| Mortgage Loan Information | Property Information | |||
| Mortgage Loan Seller: | Column | Single Asset / Portfolio: | Single Asset | |
| Original Principal Balance(1): | $67,500,000 | Title: | Fee | |
| Cut-off Date Principal Balance(1): | $67,500,000 | Property Type – Subtype(5): | Office – CBD | |
| % of Pool by IPB: | 7.9% | Net Rentable Area (SF): | 401,544 | |
| Credit Assessment (Fitch/KBRA)(2): | AAA/AA | Location: | Seattle, WA | |
| Loan Purpose: | Refinance | Year Built / Renovated: | 1981 / 2007 | |
| Borrower: | 2001 Sixth LLC | Occupancy: | 94.1% | |
| Sponsors: | Clise Properties, Inc.; Digital Realty Trust, L.P. | Occupancy Date: | 6/26/2017 | |
| Interest Rate: | 3.2900% | 2014 NOI: | $26,342,988 | |
| Note Date: | 6/29/2017 | 2015 NOI: | $28,765,913 | |
| Maturity Date: | 7/11/2027 | 2016 NOI: | $30,064,403 | |
| Interest-only Period: | 120 months | TTM NOI(6)(7): | $30,830,493 | |
| Original Term: | 120 months | UW Economic Occupancy: | 93.4% | |
| Original Amortization: | None | UW Revenues: | $49,623,835 | |
| Amortization Type: | Interest Only | UW Expenses: | $16,327,188 | |
| Call Protection(3): | L(26),Def(87),O(7) | UW NOI(7): | $33,296,646 | |
| Lockbox(4): | Soft Springing Hard | UW NCF: | $32,413,250 | |
| Additional Debt: | Yes | Appraised Value / Per SF: | $507,000,000 / $1,263 | |
| Additional Debt Balance(1): | $67,500,000 | Appraisal Date: | 5/23/2017 | |
| Additional Debt Type(1): | Pari Passu | |||
| Additional Future Debt Permitted: | No |
| Escrows and Reserves(8) | Financial Information(1) | |||||
| Initial | Monthly | Initial Cap | Cut-off Date Loan / SF: | $336 | ||
| Taxes: | $0 | Springing | N/A | Maturity Date Loan / SF: | $336 | |
| Insurance: | $0 | Springing | N/A | Cut-off Date LTV: | 26.6% | |
| Replacement Reserves: | $0 | Springing | $160,618 | Maturity Date LTV: | 26.6% | |
| Leasing Reserve: | $0 | Springing | (7) | UW NOI DSCR: | 7.39x | |
| UW NCF DSCR: | 7.20x | |||||
| UW NOI Debt Yield: | 24.7% | |||||
| UW NCF Debt Yield: | 24.0% |
| Sources and Uses | ||||||
| Sources | Proceeds | % of Total | Uses | Proceeds | % of Total | |
| Whole Mortgage Loan | $135,000,000 | 100.0% | Payoff Existing Debt | $101,080,612 | 74.9% | |
| Return of Equity | 32,940,179 | 24.4 | ||||
| Closing Costs | 979,209 | 0.7 | ||||
| Total Sources | $135,000,000 | 100.0% | Total Uses | $135,000,000 | 100.0% |
| (1) | The Westin Building Exchange Whole Loan was co-originated by Column and Wells Fargo. The loan is part of a larger split whole loan comprised of twopari passu senior notes with an original balance of $135.0 million (collectively, the “Westin Building Exchange Whole Loan”). The financial information presented in the chart above is based on the cut-off date balance of the promissory notes comprising the Westin Building Exchange Whole Loan. For a detailed description, please refer to “The Loan” below. |
| (2) | Fitch and KBRA have each confirmed that the loan has, in the context of its inclusion in the Initial Pool Balance, credit characteristics consistent with an investment grade obligation. |
THE INFORMATION IN THIS COLLATERAL TERM SHEET IS NOT COMPLETE AND MAY BE AMENDED PRIOR TO THE TIME OF SALE. THIS TERM SHEET IS NOT AN OFFER TO SELL THESE SECURITIES AND IT IS NOT A SOLICITATION OF AN OFFER TO BUY THESE SECURITIES IN ANY JURISDICTION WHERE THE OFFER OR SALE IS NOT PERMITTED.
51
Mortgage Loan No. 2 — Westin Building Exchange
| (3) | The lockout period will be at least 26 payments beginning with and including the first payment date of August 11, 2017. Defeasance of the full $135.0 million Westin Building Exchange Whole Loan is permitted at any time after the earlier to occur of (i) August 11, 2020 or (ii) the date that is two years after the closing date of the securitization that includes the last note to be securitized. |
| (4) | For a more detailed description of lockbox, please refer to “Lockbox / Cash Management” below. |
| (5) | The property is a Class A office building located in the Seattle, Washington CBD. A significant portion of its NRA is leased and utilized for data center and telecommunication services. |
| (6) | Represents the trailing twelve month period ending April 30, 2017. |
| (7) | UW NOI exceeds TTM NOI mainly due to underwriting the current rent roll and rent increases occurring through July 1, 2018. |
| (8) | For a more detailed description of Escrows and Reserves, please refer to “Escrows and Reserves” below. |
The Loan.The Westin Building Exchange loan, which is part of a larger split whole loan, is secured by a $135.0 million first mortgage loan secured by the fee interest in a 401,544 SF Class A office building located in Seattle, Washington. The Westin Building Exchange Whole Loan is evidenced by two pari-passu $67.5 million notes identified as Note A-1 and Note A-2. Note A-2 has an outstanding principal balance as of the cut-off date of $67.5 million and is being contributed to the CSAIL 2017-CX9 Commercial Mortgage Trust. Note A-1, is the controlling note and has an outstanding principal balance as of the cut-off date of $67.5 million. Note A-1 is held by Wells Fargo Bank, National Association and is expected to be contributed to a future securitization. The holder of the Note A-2 is entitled, under certain circumstances, to consult with the controlling noteholder with respect to certain major decisions. The loan has a 10-year term and is interest-only for the entire term.
Whole Loan Note Summary
| Original Balance | Cut-off Date Balance | Note Holder | Lead Servicer for Whole Loan (Y/N) | Controlling Piece (Y/N) | |
| Note A-1 | $67,500,000 | $67,500,000 | Wells Fargo Bank, NA | Y | Y |
| Note A-2 | 67,500,000 | 67,500,000 | CSAIL 2017-CX9 | N | N |
| Total | $135,000,000 | $135,000,000 |
The Borrower. The borrowing entity for the loan is 2001 Sixth LLC, a Delaware limited liability company and special purpose entity.
The Sponsors. The loan’s sponsors and nonrecourse carve-out guarantors are Clise Properties, Inc., a major Seattle-based commercial real estate firm, and Digital Realty Trust, L.P., one of the world’s largest publicly-traded data center REITs. Digital Realty Trust, L.P., an S&P 500 company, focuses on providing data center, colocation, and interconnection solutions for domestic and international customers across a variety of industrial verticals. As of March 31, 2017, the company had 145 properties located throughout North America, Europe, Asia, and Australia. Founded by J.W. Clise in 1889, Clise Properties, Inc. owns and manages over three million SF of properties in the Seattle area including the Securities Building, Westin Building Exchange, Denny Building, 2018 Fifth Avenue, Six & Lenora Building and 1700 Seventh Avenue.
The Property. The Westin Building Exchange property is a 34-story class A building totaling approximately 401,544 SF, located in downtown Seattle, Washington. The property comprises 159,413 SF of data center space (39.7% of net rentable area (“NRA”); 43.3% of gross potential rent), 121,849 SF of office space (30.3% of NRA; 14.0% of gross potential rent), 76,703 SF of colocation/telecommunication space (19.1% of NRA; 42.4% of gross potential rent) and 43,579 SF attributed to building facilities, retail and storage space (10.9% of NRA; 0.3% of gross potential rent). Additionally, the property includes a 7-story, above-grade parking garage totaling 426 spaces, resulting in 1.1 spaces per 1,000 SF (or 3.5 spaces per 1,000 SF of office space).
THE INFORMATION IN THIS COLLATERAL TERM SHEET IS NOT COMPLETE AND MAY BE AMENDED PRIOR TO THE TIME OF SALE. THIS TERM SHEET IS NOT AN OFFER TO SELL THESE SECURITIES AND IT IS NOT A SOLICITATION OF AN OFFER TO BUY THESE SECURITIES IN ANY JURISDICTION WHERE THE OFFER OR SALE IS NOT PERMITTED.
52
Mortgage Loan No. 2 — Westin Building Exchange
Built in 1981 and renovated in 2007, the Westin Building Exchange property is situated on a 0.8-acre site and is one of the leading data center and colocation facilities in the United States. As one of the largest carrier hotel data centers in the United States, the property serves as the primary hub for interconnection, hosting, and business deployment in the Pacific Northwest with more than 40,000 interconnections. The property benefits from its physical location between submarine and terrestrial cable routes. Through the property’s extensive fiber and copper “Meet-Me” rooms, the property provides neutral connectivity points, carriers, and internet service providers. The property also provides access to numerous other networks via the Seattle Internet Exchange (“SIX”) and the Pacific Northwest Gigapop (“PN-WGP”), both of which have access points located at the property. In total, the property provides access to over 250 carriers and service/content providers.
The Westin Building Exchange property has a critical IT load of 10 megawatts and can facilitate an electrical build-out up to 150 watts PSF for the data center space. The property has 17 emergency backup generators, with capacity ranging from 500 kilowatts to 2.5 megawatts, and approximately 20,000 gallons of fuel storage on site. The property has multiple layers of security, including 24/7/365 security guards on site, 24/7/365 secure and monitored access, CCTV monitoring, proximity card readers and secure key card access.
The Westin Building Exchange property has a diversified rent roll with tenants in the hundreds, including internet and cloud service providers, as well as telecommunication, social media, gaming and streaming companies. The largest tenant by underwritten base rent is Equinix, Inc. (“Equinix”), which represents 9.6% of the NRA, 18.5% of the underwritten base rent and has been in occupancy at the property since 1999. Equinix’s annual underwritten base rent at the property is approximately $5.3 million, of which 57.1% is attributed to colocation/telecommunication space, 40.6% attributed to data center space, 2.1% attributed to office space and 0.2% attributed to storage space. Equinix connects more than 9,500 businesses to their customers, employees and partners inside carrier-neutral data centers and internet exchanges. Equinix serves approximately 34.0% of Fortune 500 companies and operates over 175 data center locations in 44 global markets, representing approximately 17.0 million SF globally, with more than 1,500 networks and approximately 230,000 connections.
The Market. The property is located in downtown Seattle, Washington, on Virginia Street between 5th and 6th Avenues in an area known as the Denny Triangle. Located adjacent to the southeast of the property (and connected via sky-bridge) is the 891-room Westin Seattle. Located adjacent to the northeast of the Westin Exchange Building property is the 36-story Doppler building, which is the southern-most portion of Amazon.com’s headquarters campus, which is expected to be completed in 2021 and will encompass three blocks. Amazon.com purchased the three block site for approximately $207.5 million from Clise Properties, Inc., one of the borrower sponsors of the Westin Building Exchange Whole Loan.
The 2017 estimated population within a three- and five-mile radius of the property is 219,468 and 443,849, respectively. The 2017 estimated average household income within the same three- and five-mile radii was $109,857 and $111,943, respectively. Within a 0.5-mile radius of the Westin Exchange Building property there are 171 retail properties, comprising approximately 4.4 million SF, with a total occupancy rate of 96.4% and a five-year average total occupancy of 97.0%. Located two blocks to the southeast of the property is Seattle’s retail core district which contains Seattle’s only Macy’s, Nordstrom’s Seattle flagship store, Nike’s downtown Seattle location, as well as Pacific Place (a 339,000 SF five-level indoor retail center) and Westlake Center (a 102,706 SF indoor retail center home to Zara’s flagship location).
According to the appraisal, Seattle is the 10th-largest U.S. data center market with 58 existing facilities containing a total 981,800 SF of operational space, and the property currently accounts for approximately 21.0% of all operational data center square footage in Seattle.
According to a third party market report, the property is located in the Belltown/Denny Regrade submarket of the Downtown Seattle office market. As of the second quarter of 2017, the Belltown/Denny Regrade submarket consisted of approximately 7.6 million SF of office space with an overall vacancy rate of 5.5%. For the same period, the Class A office segment of the Belltown/Denny Regrade submarket consisted of approximately 3.8 million SF of inventory with an overall vacancy rate of 2.9%. The appraisal determined office market rents of $36.00 PSF for space on floors 1 through 17 and $39.00 PSF for space on floors 18 through 34, both on a modified gross basis. The appraiser determined data center market rents of $95.00 PSF on a modified gross basis.
THE INFORMATION IN THIS COLLATERAL TERM SHEET IS NOT COMPLETE AND MAY BE AMENDED PRIOR TO THE TIME OF SALE. THIS TERM SHEET IS NOT AN OFFER TO SELL THESE SECURITIES AND IT IS NOT A SOLICITATION OF AN OFFER TO BUY THESE SECURITIES IN ANY JURISDICTION WHERE THE OFFER OR SALE IS NOT PERMITTED.
53
Mortgage Loan No. 2 — Westin Building Exchange
Top Tenant Summary(1)
| Tenant | Ratings Fitch/Moody’s/DBRS(2) | Net Rentable Area (SF) | % of Total NRA | Annual U/W base rent PSF(3) | Annual U/W Base Rent(3) | % of Total Annual underwritten base rent | Lease Expiration Date |
| Equinix, Inc. | BB/Ba3/NR | 38,650 | 9.6% | $136.22 | $5,264,913 | 18.5% | Various |
| Level 3 Communications, LLC | BB/Ba3/NR | 19,718 | 4.9 | 94.51 | 1,863,480 | 6.5 | 8/31/2020 |
| Sprint Communications Co., LP | B+/B1/NR | 17,031 | 4.2 | 89.62 | 1,526,391 | 5.4 | 4/30/2025 |
| Verizon Business Svcs. | A-/Baa1/NR | 12,362 | 3.1 | 88.92 | 1,099,224 | 3.9 | Various |
| BCE Nexxia Corporation | NR/NR/NR | 4,641 | 1.2 | 195.70 | 908,221 | 3.2 | Various |
| Green House Data, Inc. | NR/NR/NR | 13,359 | 3.3 | 67.50 | 901,716 | 3.2 | Various |
| The Mead Group/Colocenters Inc | NR/NR/NR | 8,805 | 2.2 | 78.67 | 692,712 | 2.4 | 3/31/2022 |
| Total Major Tenants | 114,566 | 28.5% | $106.98 | $12,256,657 | 43.0% | ||
| Non-Major Tenants | 263,207 | 65.5% | $61.72 | $16,245,984 | 57.0% | ||
| Occupied Collateral Total | 377,773 | 94.1% | $75.45 | $28,502,641 | |||
| Vacant Space | 23,771 | 5.9% | |||||
| Collateral Total | 401,544 | 100.0% | |||||
| (1) | Represents top tenants by annual underwritten base rent. |
| (2) | Certain ratings are those of the parent company whether or not the parent guarantees the lease. |
| (3) | Annual underwritten base rent PSF and annual underwritten base rent include contractual rent steps through July 2018 totaling $391,010. |
Historical and Current Occupancy(1)
| 2014 | 2015 | 2016 | Current(2) |
| 91.4% | 91.4% | 93.0% | 94.1% |
| (1) | Source: Historical Occupancy is provided by the loan sponsors. Occupancies are an average of quarterly occupancy throughout the respective years. |
| (2) | Based on the June 26, 2017 underwritten rent roll. |
THE INFORMATION IN THIS COLLATERAL TERM SHEET IS NOT COMPLETE AND MAY BE AMENDED PRIOR TO THE TIME OF SALE. THIS TERM SHEET IS NOT AN OFFER TO SELL THESE SECURITIES AND IT IS NOT A SOLICITATION OF AN OFFER TO BUY THESE SECURITIES IN ANY JURISDICTION WHERE THE OFFER OR SALE IS NOT PERMITTED.
54
Mortgage Loan No. 2 — Westin Building Exchange
Lease Rollover Schedule(1)(2)
| Year | NRA Expiring | % of NRA Expiring | Base Rent Expiring | % of Base Rent Expiring | Cumulative NRA Expiring | Cumulative % of NRA Expiring | Cumulative Base Rent Expiring | Cumulative % of Base Rent Expiring |
| MTM & 2017 | 27,186 | 6.8% | $3,357,773 | 11.8% | 53,519 | 13.3% | 5,492,194 | 19.3% |
| 2018 | 23,555 | 5.9 | $3,185,932 | 11.2 | 50,741 | 12.6% | 6,543,705 | 23.0% |
| 2019 | 58,476 | 14.6 | $5,784,234 | 20.3 | 109,217 | 27.2% | 12,327,939 | 43.3% |
| 2020 | 52,796 | 13.1 | $4,561,044 | 16.0 | 162,013 | 40.3% | 16,888,983 | 59.3% |
| 2021 | 28,308 | 7.0 | $2,264,139 | 7.9 | 190,321 | 47.4% | 19,153,123 | 67.2% |
| 2022 | 21,041 | 5.2 | $2,056,473 | 7.2 | 211,362 | 52.6% | 21,209,595 | 74.4% |
| 2023 | 15,853 | 3.9 | $4,271,713 | 15.0 | 227,215 | 56.6% | 25,481,308 | 89.4% |
| 2024 | 15,957 | 4.0 | $440,514 | 1.5 | 243,172 | 60.6% | 25,921,822 | 90.9% |
| 2025 | 24,809 | 6.2 | $2,162,079 | 7.6 | 267,981 | 66.7% | 28,083,902 | 98.5% |
| 2026 | 0 | 0.0 | $88,200 | 0.3 | 267,981 | 66.7% | 28,172,102 | 98.8% |
| 2027 | 451 | 0.1 | $193,915 | 0.7 | 268,432 | 66.8% | 28,366,017 | 99.5% |
| 2028 & Beyond | 4,520 | 1.1 | $136,624 | 0.5 | 272,952 | 68.0% | 28,502,641 | 100.0% |
| Other NRA(3) | 104,821 | 26.1 | $0 | 0.0 | 377,773 | 94.1% | 28,502,641 | 100.0% |
| Vacant | 23,771 | 5.9 | NAP | NAP | 401,544 | 100.0% | NAP | NAP |
| Total | 401,544 | 100.0% | $28,502,641 | 100.0% |
| (1) | Based on the underwritten rent roll. Rent includes base rent and rent increases occurring through July 1, 2018 |
| (2) | Certain tenants may have lease expiration options that are exercisable prior to the stated expiration date of the subject lease and that are not considered in the Lease Expiration Schedule. |
| (3) | Other NRA includes square footage related to WBX/Telecom, MMR and other Building Facility space. |
THE INFORMATION IN THIS COLLATERAL TERM SHEET IS NOT COMPLETE AND MAY BE AMENDED PRIOR TO THE TIME OF SALE. THIS TERM SHEET IS NOT AN OFFER TO SELL THESE SECURITIES AND IT IS NOT A SOLICITATION OF AN OFFER TO BUY THESE SECURITIES IN ANY JURISDICTION WHERE THE OFFER OR SALE IS NOT PERMITTED.
55
Mortgage Loan No. 2 — Westin Building Exchange
The following table presents certain information relating to comparable data center leases for the Westin Building Exchange property:
Comparable Data Center Leases(1)
| U.S. Market | Date | Premises | Term (months) | Rent/SF/Year |
| West Coast | 2Q17 | 7,750 | 60 | $58.00 |
| Northwest | 1Q17 | 8,000 | 120 | $200.00 |
| Northwest | 1Q17 | 5,000 | 120 | $90.00 |
| West Coast | 3Q16 | 2,500 | 180 | $106.00 |
| Northeast | 2Q16 | 10,000 | 240 | $47.00 |
| Northeast | 2Q16 | 50,000 | 240 | $62.50 |
| Northeast | 2Q16 | 38,000 | 120 | $65.50 |
| Northeast | 4Q15 | 7,500 | 120 | $45.00 |
| Northeast | 4Q15 | 50,000 | 120 | $55.00 |
| Northeast | 4Q15 | 1,000 | 240 | $60.00 |
| Northwest | 4Q15 | 7,700 | 36 | $85.00 |
| Northeast | 3Q15 | 2,150 | 120 | $98.00 |
| West Coast | 3Q15 | 2,500 | 120 | $115.00 |
| Northeast | 2Q15 | 14,500 | 60 | $95.00 |
| Northeast | 4Q14 | 64,000 | 60 | $85.00 |
| Northwest | 1Q14 | 840 | 168 | $127.00 |
| Northwest | 3Q13 | 14,000 | 118 | $94.00 |
| Northeast | 3Q13 | 45,000 | 240 | $60.00 |
| Northeast | 3Q13 | 27,500 | 240 | $205.00 |
| Northeast | 3Q12 | 12,000 | 240 | $6500 |
| Northeast | 2Q13 | 30,000 | 180 | $71.00 |
| Northeast | 2Q13 | 11,000 | 240 | $85.00 |
| (1) | Source: Appraisal. |
THE INFORMATION IN THIS COLLATERAL TERM SHEET IS NOT COMPLETE AND MAY BE AMENDED PRIOR TO THE TIME OF SALE. THIS TERM SHEET IS NOT AN OFFER TO SELL THESE SECURITIES AND IT IS NOT A SOLICITATION OF AN OFFER TO BUY THESE SECURITIES IN ANY JURISDICTION WHERE THE OFFER OR SALE IS NOT PERMITTED.
56
Mortgage Loan No. 2 — Westin Building Exchange
The following table presents certain information relating to comparable office leases for the Westin Building Exchange property:
Comparable Office Leases(1)
| Property | Year Built | Total GLA (SF) | Proximity (miles) | Tenant Name | Lease Date/Term | Lease Area (SF) | Annual Base Rent PSF | Lease Type |
| 428 Westlake Avenue North | 2004 | 88,546 | 0.6 | Amazon.com | 2Q17/ 10.0 Yrs | 80,978 | $44.00 | Gross |
| 800 Fifth Avenue | 1981 | 933,808 | 0.7 | Greystar | 1Q17/ 8.25 Yrs | 34,484 | $40.50 | Gross |
| 800 Fifth Avenue | 1981 | 933,808 | 0.7 | Entercom Seattle, LLC | 1Q17/ 10.0 Yrs | 21,485 | $38.00 | Gross |
| US Bank Centre | 1989 | 943,575 | 0.3 | Badgely, Phelps & Bell | 4Q16/ 5.0 Yrs | 16,579 | $44.85 | Gross |
| First & Stew Art | 1986 | 94,333 | 0.4 | Hewitt Architects | 3Q16/ 7.0 Yrs | 10,829 | $36.00 | Gross |
| Market Place Tower | 1988 | 194,687 | 0.4 | Snapchat | 4Q16/ 5.0 Yrs | 47,000 | $42.00 | Gross |
| Market Place II | 1988 | 46,752 | 0.4 | Davis Law | 4Q16/ 4.0 Yrs | 1,648 | $39.00 | Gross |
| Fourth & Blanchard | 1979 | 409,874 | 0.3 | Aritex USA, Inc. | 4Q16/ 2.0 Yrs | 1,009 | $31.00 | Gross |
| (1) | Source: Appraisal. |
Operating History and Underwritten Net Cash Flow
| 2014 | 2015 | 2016 | TTM(1) | Underwritten(2) | PSF(2) | %(3) | |
| Gross Potential Rent - Office/Data Center | $14,034,815 | 14,797,797 | 15,747,196 | $16,066,525 | $17,602,696 | $43.84 | 52.7% |
| Gross Potential Rent - Telecom | 9,881,953 | 11,014,556 | 10,709,321 | 10,850,411 | 13,005,742 | 32.39 | 38.9% |
| Gross Potential Rent - Storage | 52,720 | 56,772 | 42,412 | 37,212 | 45,036 | 0.11 | 0.1% |
| Gross Potential Rent - Retail | 22,590 | 18,730 | 39,221 | 51,274 | 55,848 | 0.14 | 0.2% |
| Infrastructure Fee | 2,951,414 | 2,927,375 | 2,770,041 | 2,747,610 | 2,822,910 | 7.03 | 8.4% |
| Cost of Service Escalations/CAM | 1,836,909 | 1,977,050 | 1,988,010 | 2,106,089 | 2,267,576 | 5.65 | 6.8% |
| Gross Revenues | $28,780,401 | $30,792,280 | $31,296,201 | $31,859,121 | $35,799,807 | $89.16 | 107.1% |
| (Vacancy/Collection Loss)(4) | 0 | 0 | 0 | 0 | (2,376,919) | (5.92) | (7.1%) |
| Net Rental Income | $28,780,401 | $30,792,280 | $31,296,201 | $31,859,121 | 33,422,888 | $83.24 | 100.0% |
| Other Income(5) | 11,025,934 | 12,601,384 | 14,209,539 | 14,896,350 | 16,200,947 | 40.35 | 48.5% |
| Effective Gross Income | $39,806,335 | $43,393,664 | $45,505,740 | $46,755,471 | $49,623,835 | $123.58 | 148.5% |
| Total Expenses | $13,463,347 | $14,627,751 | $15,441,337 | $15,924,978 | $16,327,188 | $40.66 | 32.9% |
| Net Operating Income(6) | $26,342,988 | $28,765,913 | $30,064,403 | $30,830,493 | $33,296,646 | $82.92 | 67.1% |
| Total TI/LC, Capex/RR | 0 | 0 | 0 | 0 | 883,397 | 2.20 | 1.8% |
| Net Cash Flow | $26,342,988 | $28,765,913 | $30,064,403 | $30,830,493 | $32,413,250 | $80.72 | 65.3% |
| (1) | Represents the trailing twelve month period ending April 30, 2017. |
| (2) | Rent includes base rent and rent increases occurring through July 1, 2018. |
| (3) | Percentage column represents percent of Net Rental Income for all revenue lines and represents percent of Effective Gross Income for the remainder of fields. |
| (4) | Based on actual economic vacancy plus three tenants vacating through August 2017. |
| (5) | Other income includes roof and antenna rent, cabling, meet me room, tenant service, WBX electric income, parking and other miscellaneous income. Underwritten Other Income mainly exceeds the TTM Other Income due to increases in revenues from cabling and meet me room revenue. |
| (6) | Underwritten Net Operating Income exceeds TTM Net Operating Income mainly due to underwriting the current rent roll and rent increases occurring through July 1, 2018. |
THE INFORMATION IN THIS COLLATERAL TERM SHEET IS NOT COMPLETE AND MAY BE AMENDED PRIOR TO THE TIME OF SALE. THIS TERM SHEET IS NOT AN OFFER TO SELL THESE SECURITIES AND IT IS NOT A SOLICITATION OF AN OFFER TO BUY THESE SECURITIES IN ANY JURISDICTION WHERE THE OFFER OR SALE IS NOT PERMITTED.
57
Mortgage Loan No. 2 — Westin Building Exchange
Property Management. The property is managed by Clise Agency, Inc., an affiliate of Clise Properties, Inc.
Escrows and Reserves.
Tax & Insurance Escrows– Upon the commencement of a Cash Trap Event Period (as defined below) and on each mortgage loan payment date during the continuance of a Cash Trap Event Period, 1/12th of an amount which would be sufficient to pay the taxes, other charges and insurance premiums estimated by the lender to be payable during the next ensuing 12 months in order to accumulate with the lender sufficient funds to pay all such taxes, other charges and insurance premiums at least 10 days prior for taxes and 30 days prior for insurance to their respective date of delinquency.
Replacement Reserve – The borrower is required to deposit an amount of $0.20 PSF per year, subject to a cap equal to two years of collections (which must be replenished by the borrower up to the foregoing cap as funds are withdrawn from the reserve) only during a Cash Trap Event Period.
Leasing Reserve – The borrower is required to escrow amount of $5.00 PSF per year of vacant space (exclusive of the WBX/Telecom datacenter space) subject to a cap equal to two years of collections, which must be replenished by the borrower up to the foregoing cap as funds are withdrawn from the reserve monthly only during a Cash Trap Event Period.
Lockbox / Cash Management.The Westin Building Exchange Whole Loan requires a lender-controlled lockbox account, which is already in place, and that upon the occurrence of a Cash Trap Event period, the borrower will direct all tenants to pay their rents directly to such lockbox account. The loan documents also require that all rents received by the borrower or the property manager be deposited into the lockbox account within one business day of receipt. Prior to the occurrence of a Cash Trap Event Period (as defined below), all funds are required to be distributed to the borrower. During a Cash Trap Event Period, all cash flow is required to be swept to a lender-controlled cash management account.
A “Cash Trap Event Period” shall mean a period commencing upon the earlier of (i) the occurrence and continuance of an event of default or (ii) the debt yield as determined by lender being less than 13.0% as of the applicable date of determination.
THE INFORMATION IN THIS COLLATERAL TERM SHEET IS NOT COMPLETE AND MAY BE AMENDED PRIOR TO THE TIME OF SALE. THIS TERM SHEET IS NOT AN OFFER TO SELL THESE SECURITIES AND IT IS NOT A SOLICITATION OF AN OFFER TO BUY THESE SECURITIES IN ANY JURISDICTION WHERE THE OFFER OR SALE IS NOT PERMITTED.
58
(THIS PAGE INTENTIONALLY LEFT BLANK)
59
Mortgage Loan No. 3 — Two Independence Square
 |
THE INFORMATION IN THIS COLLATERAL TERM SHEET IS NOT COMPLETE AND MAY BE AMENDED PRIOR TO THE TIME OF SALE. THIS TERM SHEET IS NOT AN OFFER TO SELL THESE SECURITIES AND IT IS NOT A SOLICITATION OF AN OFFER TO BUY THESE SECURITIES IN ANY JURISDICTION WHERE THE OFFER OR SALE IS NOT PERMITTED.
60
Mortgage Loan No. 3 — Two Independence Square
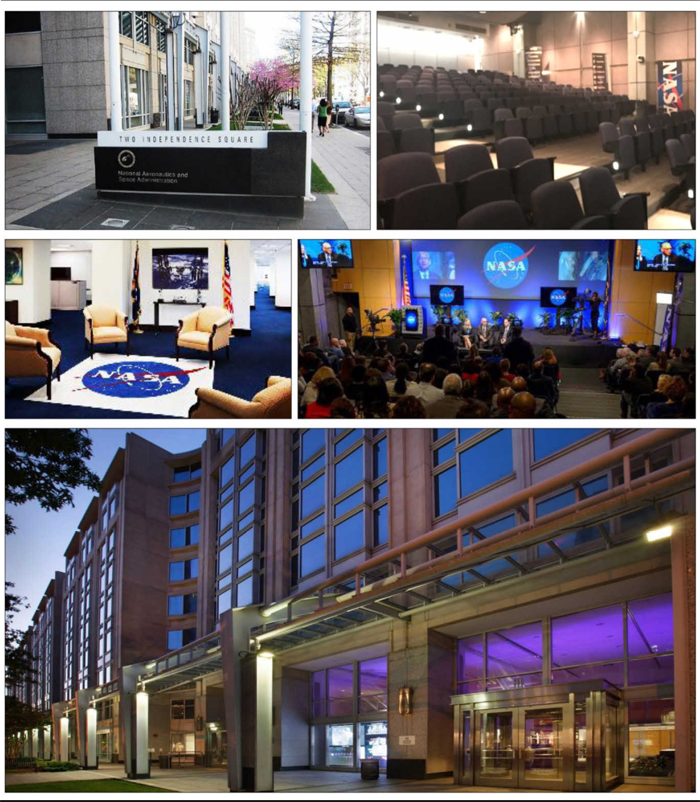 |
THE INFORMATION IN THIS COLLATERAL TERM SHEET IS NOT COMPLETE AND MAY BE AMENDED PRIOR TO THE TIME OF SALE. THIS TERM SHEET IS NOT AN OFFER TO SELL THESE SECURITIES AND IT IS NOT A SOLICITATION OF AN OFFER TO BUY THESE SECURITIES IN ANY JURISDICTION WHERE THE OFFER OR SALE IS NOT PERMITTED.
61
Mortgage Loan No. 3 — Two Independence Square
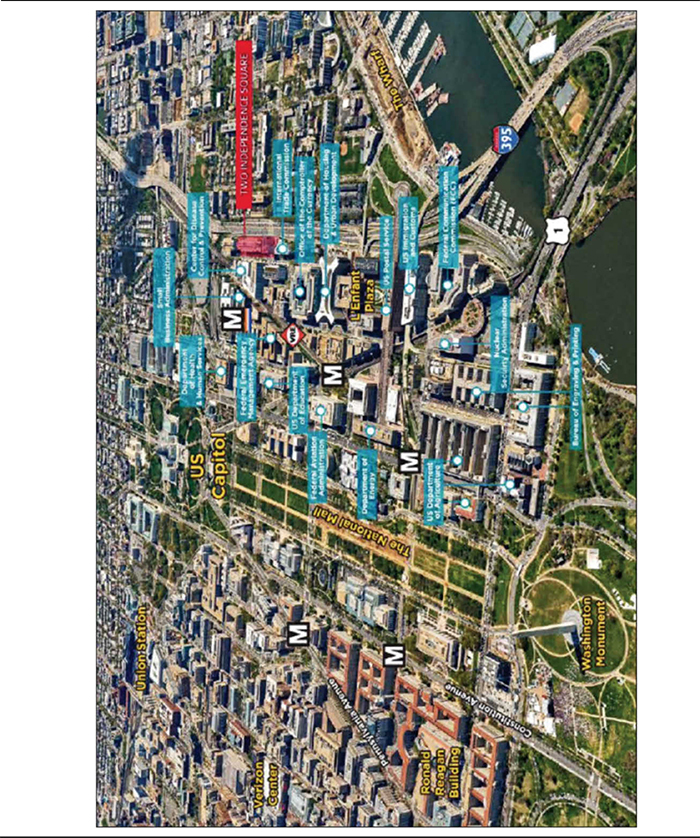 |
THE INFORMATION IN THIS COLLATERAL TERM SHEET IS NOT COMPLETE AND MAY BE AMENDED PRIOR TO THE TIME OF SALE. THIS TERM SHEET IS NOT AN OFFER TO SELL THESE SECURITIES AND IT IS NOT A SOLICITATION OF AN OFFER TO BUY THESE SECURITIES IN ANY JURISDICTION WHERE THE OFFER OR SALE IS NOT PERMITTED.
62
Mortgage Loan No. 3 — Two Independence Square
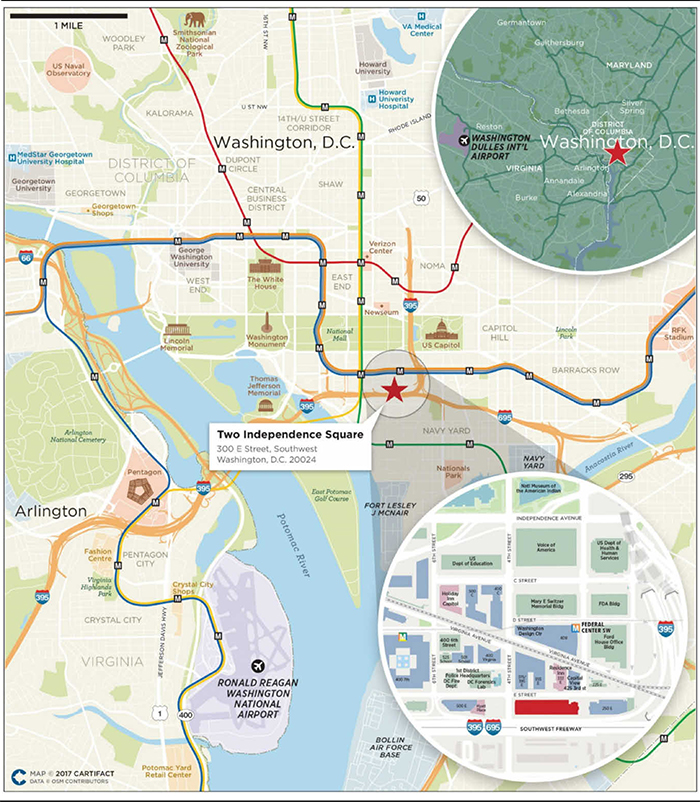 |
THE INFORMATION IN THIS COLLATERAL TERM SHEET IS NOT COMPLETE AND MAY BE AMENDED PRIOR TO THE TIME OF SALE. THIS TERM SHEET IS NOT AN OFFER TO SELL THESE SECURITIES AND IT IS NOT A SOLICITATION OF AN OFFER TO BUY THESE SECURITIES IN ANY JURISDICTION WHERE THE OFFER OR SALE IS NOT PERMITTED.
63
Mortgage Loan No. 3 — Two Independence Square
| Mortgage Loan Information | Property Information | |||
| Mortgage Loan Sellers(1): | Column / Natixis | Single Asset / Portfolio: | Single Asset | |
| Original Principal Balance(2): | $55,000,000 | Title: | Fee | |
| Cut-off Date Principal Balance(2): | $55,000,000 | Property Type - Subtype: | Office – Single Tenant | |
| % of Pool by IPB: | 6.4% | Net Rentable Area (SF): | 605,897 | |
| Credit Assessment (Fitch/KBRA)(3): | A-/BBB- | Location: | Washington, D.C. | |
| Loan Purpose: | Acquisition | Year Built / Renovated: | 1992 / 2014 | |
| Borrower: | Two Independence Hana OW, LLC | Occupancy: | 100.0% | |
| Sponsor: | Hana Asset Management Co., Ltd. | Occupancy Date: | 9/6/2017 | |
| Interest Rate: | 3.2300% | Number of Tenants: | 4 | |
| Note Date: | 7/5/2017 | 2014 NOI: | $20,670,983 | |
| Maturity Date: | 7/6/2022 | 2015 NOI: | $20,576,410 | |
| Interest-only Period: | 60 months | 2016 NOI: | $20,939,551 | |
| Original Term: | 60 months | TTM NOI(5): | $21,189,590 | |
| Original Amortization: | None | UW Economic Occupancy: | 100.0% | |
| Amortization Type: | Interest Only | UW Revenues: | $31,593,604 | |
| Call Protection: | L(26),Def(30),O(4) | UW Expenses: | $11,035,326 | |
| Lockbox(4): | Hard | UW NOI: | $20,558,277 | |
| Additional Debt: | Yes | UW NCF: | $20,418,701 | |
| Additional Debt Balance(2): | $170,700,000 | Appraised Value / Per SF: | $375,000,000 / $619 | |
| Additional Debt Type: | Pari Passu, B-Note | Appraisal Date: | 1/5/2017 | |
| Additional Future Debt Permitted: | No |
| Escrows and Reserves(6) | Financial Information(1) | |||||
| Initial | Monthly | Initial Cap | Cut-off Date Loan / SF: | $271 | ||
| Taxes: | $0 | Springing | N/A | Maturity Date Loan / SF: | $271 | |
| Insurance: | $0 | Springing | N/A | Cut-off Date LTV: | 43.7% | |
| GSA Replacement Reserve: | $2,500,000 | $250,000 | $4,000,000 | Maturity Date LTV: | 43.7% | |
| Garage Replacement Reserve: | $871,097 | $0 | N/A | UW NOI DSCR: | 3.83x | |
| TI/LC Reserve: | $0 | Springing | N/A | UW NCF DSCR: | 3.80x | |
| Replacement Reserve: | $0 | Springing | N/A | UW NOI Debt Yield: | 12.5% | |
| UW NCF Debt Yield: | 12.5% |
Sources and Uses
| Sources | Proceeds | % of Total | Uses | Proceeds | % of Total | |
| Mortgage Loan | $225,700,000 | 60.3% | Purchase Price | $354,701,303 | 94.8% | |
| Sponsor Equity | 148,576,402 | 39.7 | Closing Costs | 16,204,002 | 4.3 | |
| Upfront Reserves | 3,371,097 | 0.9 | ||||
| Total Sources | $374,276,402 | 100.0% | Total Uses | $374,276,402 | 100.0% |
| (1) | The Two Independence Square loan is comprised of four senior notes, of which a $30.0 million A-2 note is being contributed by Column and a $25.0 million A-3-B note is being contributed by Natixis. |
| (2) | The Two Independence Square loan is a part of a larger split whole loan evidenced by four seniorpari passu A-notes with an original balance of $164.0 million and Note B with an original principal balance of $61.7 million. The financial information presented in the chart above and herein reflects the cut-off date balance of $164.0 million of A Notes, but not the $61.7 million Note B. For a more detailed description of the additional debt, please refer to “Additional Debt” below. |
THE INFORMATION IN THIS COLLATERAL TERM SHEET IS NOT COMPLETE AND MAY BE AMENDED PRIOR TO THE TIME OF SALE. THIS TERM SHEET IS NOT AN OFFER TO SELL THESE SECURITIES AND IT IS NOT A SOLICITATION OF AN OFFER TO BUY THESE SECURITIES IN ANY JURISDICTION WHERE THE OFFER OR SALE IS NOT PERMITTED.
64
Mortgage Loan No. 3 — Two Independence Square
| (3) | Fitch and KBRA have each confirmed that the loan has, in the context of its inclusion in the Initial Pool Balance, credit characteristics consistent with an investment grade obligation. |
| (4) | For a more detailed description of lockbox, please refer to “Lockbox / Cash Management” below. |
| (5) | Represents the trailing twelve-month period ending March 31, 2017. |
| (6) | For a more detailed description of Escrows and Reserves, please refer to “Escrows and Reserves” below. |
The Loan. The Two Independence Square loan, which is part of a larger split whole loan, is a first mortgage loan secured by the fee interest in a 605,897 SF Class A office building located in Washington, DC. The loan has a 5-year term and is interest-only for the term of the loan. The Two Independence Square loan is a part of a whole loan (the “Two Independence Square Whole Loan”) that is evidenced by fourpari passu promissory notes (Notes A-1, A-2, A-3-A and A-3-B, collectively the “Two Independence Square Senior Loans”) and one subordinate note (“Note B” or the “Two Independence Square Subordinate Companion Loan”). For more information see “Description of the Mortgage Pool – The Whole Loans” in the Preliminary Prospectus. Note A-1 and Note B were contributed to the CSMC 2017-MOON Trust, a private securitization pursuant to which the Two Independence Square Whole Loan is expected to be serviced and administered. The Note A-2 and A-3-B have an aggregate balance of $55.0 million and are being contributed to the CSAIL 2017-CX9 Trust. The trustee of the CSMC 2017-MOON is entitled to exercise all of the rights of the controlling noteholder with respect to the Two Independence Square Whole Loan, however, the holders of Note A-2, A-3 –A and A-3-B are entitled, under certain circumstances, to consult with respect to certain major decisions.
Whole Loan Note Summary
| Original Balance | Cut-off Date Balance | Note Holder | Lead Servicer for Whole Loan (Y/N) | Controlling Piece (Y/N) | |
| Note A-1 | $64,000,000 | $64,000,000 | CSMC 2017-MOON | Y | N |
| Note A-2 | 30,000,000 | 30,000,000 | CSAIL 2017-CX9 | N | N |
| Note A-3-A | 45,000,000 | 45,000,000 | WFCM 2017-C39 | N | N |
| Note A-3-B | 25,000,000 | 25,000,000 | CSAIL 2017-CX9 | N | N |
| Note B | 61,700,000 | 61,700,000 | CSMC 2017-MOON | Y | Y |
| Total | $225,700,000 | $225,700,000 |
THE INFORMATION IN THIS COLLATERAL TERM SHEET IS NOT COMPLETE AND MAY BE AMENDED PRIOR TO THE TIME OF SALE. THIS TERM SHEET IS NOT AN OFFER TO SELL THESE SECURITIES AND IT IS NOT A SOLICITATION OF AN OFFER TO BUY THESE SECURITIES IN ANY JURISDICTION WHERE THE OFFER OR SALE IS NOT PERMITTED.
65
Mortgage Loan No. 3 — Two Independence Square
Two Independence Square Total Debt Capital Structure

| (1) | Based on an as-is appraised value of $375.0 million as of January 5, 2017 per the appraisal. |
| (2) | Based on the UW NOI of $20,558,277. |
| (3) | Based on the UW NCF of $20,418,701 and the coupon of 3.2300% on the Two Independence Square Whole Loan. |
| (4) | Implied Equity is based on the as-is appraised value of $375.0 million, less total debt of $225.7 million. |
The Borrower. The borrowing entity for the loan is Two Independence Hana OW, LLC, a Delaware limited liability company and special purpose entity. The borrowing entity is indirectly owned by Two Independence Hana, LLC and is indirectly controlled by Hana Asset Management Co., Ltd.
The Sponsor. The borrower, Two Independence Hana OW, LLC, is the sole party liable for any breach or violation of the non-recourse provisions in the loan documents. There is no separate non-recourse carve-out guarantor. Two Independence Hana OW, LLC is indirectly owned by Two Independence Hana, LLC (the “REIT”), a public U.S. REIT and a Delaware LLC, and indirectly owned by two Korean Investment Trusts (one public and one private), which are both managed by Hana Asset Management Co., Ltd., a wholly owned subsidiary of Hana Financial Group Inc. (“Hana”), with year-end 2016 revenues of $7.7 billion, total assets of $288.2 billion, total equity of $19.3 billion, and a market cap of approximately $12.9 billion as of August 23, 2017. Hana Asset Management Co., Ltd. will be the REIT’s asset manager in Korea, and Ocean West Capital Partners or one of its affiliates will serve as the REIT’s U.S. asset and property manager. Ocean West Capital Partners is an experienced real estate investment and management firm with a history of operating Class A assets. Since inception in 2009, Ocean West Capital Partners has acquired and operated investments valued at over $550.0 million, and its principals have completed over $50.0 billion of real estate transactions.
The Property. The Two Independence Square property is a 605,897 SF, nine-story, Class A office building located on a 2.3-acre site on the southeast corner of E Street SW and 4th Street SW in Washington, DC. The property is the headquarters for the National Aeronautics and Space Administration (“NASA”). The Two Independence Square property is LEED Gold Certified and Level IV secured and contains an underground parking garage permitted for 796 spaces (1.3 spaces per 1,000 SF of net rentable area), which is leased to NASA and operated by a third party garage operator. The property features specialized construction and security for NASA, including high-tech computer and conference rooms, recording studios, sound control, separate systems for back-up and 24-hour operation.
Amenities in the NASA space include an auditorium for 200+ people with 14 levels of stadium seating and a 20 foot ceiling, which is located on the first floor adjacent to the main lobby, a fitness facility of 4,500 SF with separate male/female locker rooms, showers, saunas, and towel service, and two ninth floor rooftop terraces with seating, planters and views of the Washington Monument and U.S. Capitol.
THE INFORMATION IN THIS COLLATERAL TERM SHEET IS NOT COMPLETE AND MAY BE AMENDED PRIOR TO THE TIME OF SALE. THIS TERM SHEET IS NOT AN OFFER TO SELL THESE SECURITIES AND IT IS NOT A SOLICITATION OF AN OFFER TO BUY THESE SECURITIES IN ANY JURISDICTION WHERE THE OFFER OR SALE IS NOT PERMITTED.
66
Mortgage Loan No. 3 — Two Independence Square
As of September 6, 2017, the Two Independence Square property is 100.0% occupied. NASA has been a tenant at the Two Independence Square property since it was built in 1992. In 2013, the United States Government Services Administration (“GSA”) (Fitch/Moody’s/S&P: AAA/Aaa/AA+), on behalf of NASA, renewed its lease for 15 years through August 2028. As part of the renewal, the seller has invested approximately $86.3 million ($142 PSF) to renovate the building, including $45.4 million ($75 PSF) expended on tenant improvements in the NASA space. NASA occupies 597,253 SF or 98.6% of the net rentable area, and the balance of 8,644 SF is leased to three ground floor retail tenants, including the Grand Deli & Café (7,292 SF), Independence Lobby Shop (718 SF), and Cleaner of Cleaners (634 SF).
The Market. The property is located in the Southwest submarket of downtown Washington, DC, a business district predominantly occupied by branches of the federal government and many of the Smithsonian Museums. In addition to leasing the majority of the office space in this submarket, the federal, state and local governments provide 22% of all jobs. The Two Independence Square property is within a few blocks of the United States Capitol, the District’s most recognizable landmark. The Two Independence Square property is situated just east of the heavily trafficked entrance to Interstates 395 and 695, has excellent visibility and access, and is one block southwest of the Federal Center SW MetroRail station.
According to the appraiser, the Southwest submarket is undergoing significant new mixed-use development and gentrification. Major projects include The Wharf, a $2.2 billion landmark waterfront development to contain 3.2 million SF and located one-mile south, the $300 million, 25,000 seat, DC United pro soccer team Stadium at Buzzard Point expected to open in 2018, and the $400.0 million Museum of the Bible re-development to open in 2017. The L’Enfant Plaza complex is located 0.6 miles west and contains four office towers above the “La Promenade” shopping mall, the 370-room Loews L’Enfant Plaza Hotel and L’Enfant MetroRail station, all totaling 1.2 million SF. The retail promenade is undergoing a $60.0 million renovation, and the International Spy Museum with 600,000 annual visitors are expected to move to the L’Enfant Plaza in 2018, at an estimated cost of $100.0 million.
Per the appraisal, as of year-end 2016, the Southwest office submarket contained 11,853,498 SF of inventory, with an 11.1% vacancy rate, unchanged from year-end 2015, and had an average asking rent of $47.81 PSF. The year-end 2016 Class A vacancy was 11.0%, a 0.1% decline from year-end 2015, with an average asking rent of $50.87 PSF, a 5.1% increase over $48.38 PSF for year-end 2015. The appraisal concluded a market rent of $48.00 PSF for office space at the Two Independence Square property, which is 7.0% higher than the underwritten rent for NASA.
Competitive Set Summary(1)
| Property | Year Built / Renovated | Total GLA (SF) | Est. Rent PSF | Est. Occ. | Proximity (miles) | Anchor Tenants |
| Two Independence Square | 1992 / 2014 | 605,897(2) | $44.64(2) | 100%(2) | N/A | NASA(2) |
| Patriots Plaza II | 2009 / NAV | 321,499 | $47.83 | 88% | 0.1 | GSA – FBI, GSA – DOL |
| One Patriots Plaza | 2005 / NAV | 280,001 | $46.50 | 58% | 0.1 | GSA – FBI |
| Capitol View | 2007 / NAV | 249,334 | $44.05 | 100% | 1.1 | GSA – HUD |
| Aerospace Center | 1987 / NAV | 400,215 | $45.00 | 68% | 0.9 | GSA Bureau of Prisons |
| 3 & 4 Constitution Square | 2014 / NAV | 839,000 | $49.00 | 100% | 0.8 | GSA – DOJ |
| (1) | Source: Appraisal. |
| (2) | Based on the underwritten rent roll. |
Historical and Current Occupancy(1)
| 2013 | 2014 | 2015 | 2016 | Current(2) |
| 100.0% | 100.0% | 100.0% | 100.0% | 100.0% |
| (1) | Source: Historical Occupancy is provided by the sponsor. Occupancies are as of December 31 of each respective year. |
| (2) | Based on the September 6, 2017 underwritten rent roll. |
THE INFORMATION IN THIS COLLATERAL TERM SHEET IS NOT COMPLETE AND MAY BE AMENDED PRIOR TO THE TIME OF SALE. THIS TERM SHEET IS NOT AN OFFER TO SELL THESE SECURITIES AND IT IS NOT A SOLICITATION OF AN OFFER TO BUY THESE SECURITIES IN ANY JURISDICTION WHERE THE OFFER OR SALE IS NOT PERMITTED.
67
Mortgage Loan No. 3 — Two Independence Square
Tenant Summary(1)
| Tenant | Ratings Moody’s/S&P/Fitch(2) | Net Rentable Area (SF) | % of Total NRA | Base Rent PSF | % of Total Base Rents | Lease Expiration Date |
| NASA | Aaa/AA+/AAA | 597,253 | 98.6% | $44.87 | 99.1% | 8/3/2028 |
| Grand Deli & Café | NR/NR/NR | 7,292 | 1.2% | $26.75 | 0.7% | 7/31/2027 |
| Independence Lobby Shop | NR/NR/NR | 718 | 0.1% | $44.35 | 0.1% | 5/31/2023 |
| Cleaner of Cleaners | NR/NR/NR | 634 | 0.1% | $35.11 | 0.1% | 3/31/2026 |
| (1) | Based on the underwritten rent roll, including rent increases occurring through March 31, 2018. |
| (2) | Ratings provided are for the parent company of the entity listed in the “Tenant” field whether or not the parent company guarantees the lease. |
Lease Rollover Schedule(1)
| Year | Number of Leases Expiring | NRA Expiring | % of NRA Expiring | Base Rent Expiring | % of Base Rent Expiring | Cumulative NRA Expiring | Cumulative % of NRA Expiring | Cumulative Base Rent Expiring | Cumulative % of Base Rent Expiring | |||||||||||||||||
| Vacant | NAP | 0 | 0.0 | % | NAP | NAP | 0 | 0.0 | % | NAP | NAP | |||||||||||||||
| MTM | 0 | 0 | 0.0 | $0 | 0.0 | % | 0 | 0.0 | % | $0 | 0.0 | % | ||||||||||||||
| 2017 | 0 | 0 | 0.0 | 0 | 0.0 | 0 | 0.0 | % | $0 | 0.0 | % | |||||||||||||||
| 2018 | 0 | 0 | 0.0 | 0 | 0.0 | 0 | 0.0 | % | $0 | 0.0 | % | |||||||||||||||
| 2019 | 0 | 0 | 0.0 | 0 | 0.0 | 0 | 0.0 | % | $0 | 0.0 | % | |||||||||||||||
| 2020 | 0 | 0 | 0.0 | 0 | 0.0 | 0 | 0.0 | % | $0 | 0.0 | % | |||||||||||||||
| 2021 | 0 | 0 | 0.0 | 0 | 0.0 | 0 | 0.0 | % | $0 | 0.0 | % | |||||||||||||||
| 2022 | 0 | 0 | 0.0 | 0 | 0.0 | 0 | 0.0 | % | $0 | 0.0 | % | |||||||||||||||
| 2023 | 1 | 718 | 0.1 | 31,843 | 0.1 | 718 | 0.1 | % | $31,843 | 0.1 | % | |||||||||||||||
| 2024 | 0 | 0 | 0.0 | 0 | 0.0 | 718 | 0.1 | % | $31,843 | 0.1 | % | |||||||||||||||
| 2025 | 0 | 0 | 0.0 | 0 | 0.0 | 718 | 0.1 | % | $31,843 | 0.1 | % | |||||||||||||||
| 2026 | 1 | 634 | 0.1 | 22,260 | 0.1 | 1,352 | 0.2 | % | $54,103 | 0.2 | % | |||||||||||||||
| 2027 & Beyond | 2 | 604,545 | 99.8 | 26,992,331 | 99.8 | 605,897 | 100.0 | % | $27,046,434 | 100.0 | % | |||||||||||||||
| Total | 4 | 605,897 | 100.0 | % | $27,046,434 | 100.0 | % | |||||||||||||||||||
| (1) | Based on the underwritten rent roll. Rent includes base rent and rent increases occurring through March 31, 2018. |
THE INFORMATION IN THIS COLLATERAL TERM SHEET IS NOT COMPLETE AND MAY BE AMENDED PRIOR TO THE TIME OF SALE. THIS TERM SHEET IS NOT AN OFFER TO SELL THESE SECURITIES AND IT IS NOT A SOLICITATION OF AN OFFER TO BUY THESE SECURITIES IN ANY JURISDICTION WHERE THE OFFER OR SALE IS NOT PERMITTED.
68
Mortgage Loan No. 3 — Two Independence Square
Operating History and Underwritten Net Cash Flow
| 2014 | 2015 | 2016 | TTM(1) | Underwritten(2) | PSF | %(3) | |||||||||||||||
| Rents in Place | $26,646,134 | $27,002,748 | $26,990,943 | $27,001,926 | $27,046,434 | $44.64 | 94.4 | % | |||||||||||||
| Vacant Income | 0 | 0 | 0 | 0 | 0 | 0 | 0.0 | ||||||||||||||
| Gross Potential Rent | $26,646,134 | $27,002,748 | $26,990,943 | $27,001,926 | $27,046,434 | $44.64 | 94.4 | % | |||||||||||||
| Total Reimbursements | 1,143,975 | 605,679 | 561,455 | 675,196 | 1,592,642 | 2.63 | 5.6 | ||||||||||||||
| Net Rental Income | $27,790,109 | $27,608,427 | $27,552,398 | $27,677,122 | $28,639,076 | $47.27 | 100.0 | % | |||||||||||||
| (Vacancy/Collection Loss) | 0 | 0 | 0 | 0 | 0 | 0 | 0.0 | ||||||||||||||
| Other Income | 72,415 | 135,967 | 244,354 | 302,811 | 251,849 | 0.42 | 0.9 | ||||||||||||||
| Parking Income | 2,455,187 | 2,528,842 | 2,604,707 | 2,623,983 | 2,702,679 | 4.46 | 9.4 | ||||||||||||||
| Effective Gross Income | $30,317,711 | $30,273,236 | $30,401,458 | $30,603,916 | $31,593,604 | $52.14 | 110.3 | % | |||||||||||||
| Total Expenses | $9,646,728 | $9,696,826 | $9,461,907 | $9,414,326 | $11,035,326 | $18.21 | 34.9 | % | |||||||||||||
| Net Operating Income | $20,670,983 | $20,576,410 | $20,939,551 | $21,189,590 | $20,558,277 | $33.93 | 65.1 | % | |||||||||||||
| Total TI/LC, Capex/RR | 0 | 0 | 0 | 0 | 139,576 | 0.23 | 0.4 | ||||||||||||||
| Net Cash Flow | $20,670,983 | $20,576,410 | $20,939,551 | $21,189,590 | $20,418,701 | $33.70 | 64.6 | % | |||||||||||||
| (1) | Represents the trailing twelve-month period ending March 31, 2017. |
| (2) | Rent includes Base Rent and Rent Increases occurring through March 31, 2018. |
| (3) | Percentage column represents percent of Net Rental Income for all revenue lines and represents percent of Effective Gross Income for the remainder of fields. |
Property Management. The property is managed by OW Management Services, Inc.
Escrows and Reserves. At origination, the borrower deposited into escrow $2.5 million for the GSA replacement reserve and $871,097 for the garage replacement reserve.
Tax & Insurance Escrows– Upon the commencement of a Cash Sweep Period and on each mortgage loan payment date during the continuance of a Cash Sweep Period, 1/12th of an amount which would be sufficient to pay the taxes, other charges and insurance premiums estimated by the lender to be payable during the next ensuing 12 months in order to accumulate with the lender sufficient funds to pay all such taxes, other charges and insurance premiums at least 30 days prior to their respective date of delinquency.
GSA Replacement Reserve– At closing, $2.5 million was escrowed for interior renovations and improvements required in the GSA lease. In addition, on a monthly basis, the borrower is required to escrow $250,000 for replacement reserves. The reserve is subject to a cap of $4.0 million.
Replacement Reserve – The borrower is required to escrow 1/12th of $151,474 monthly only during a Cash Sweep Period.
TI/LC Reserve – The borrower is required to escrow $75,737 monthly only during a Cash Sweep Period.
Lockbox / Cash Management. The Two Independence Square Whole Loan is structured with a hard lockbox and in-place cash management. Tenants have been directed to remit all payments due under their leases directly into such lockbox account. The borrower will, and will cause the manager to, deposit all amounts received constituting rents into the lockbox account within one business day after receipt. All funds in the lockbox account will be swept to a lender-controlled cash management account. Upon the occurrence of a Cash Sweep Period (as defined below), all excess cash flow will be swept to the lender-controlled account.
A “Cash Sweep Period” will commence upon: (i) the occurrence of an event of default under the Two Independence Square Whole Loan documents; (ii) the occurrence of any bankruptcy action of the borrower or the manager; (iii) the debt yield being less than 7.5% for the calendar quarter immediately preceding the date of such determination, based upon the trailing 12-month period immediately preceding such date of determination, as determined by the lender; or (iv) the occurrence of a GSA Trigger Event (as defined below). A Cash Sweep Period will end, with respect to clause (i), upon the acceptance by the lender of a
THE INFORMATION IN THIS COLLATERAL TERM SHEET IS NOT COMPLETE AND MAY BE AMENDED PRIOR TO THE TIME OF SALE. THIS TERM SHEET IS NOT AN OFFER TO SELL THESE SECURITIES AND IT IS NOT A SOLICITATION OF AN OFFER TO BUY THESE SECURITIES IN ANY JURISDICTION WHERE THE OFFER OR SALE IS NOT PERMITTED.
69
Mortgage Loan No. 3 — Two Independence Square
cure of such event of default; with respect to a Cash Sweep Period caused by a bankruptcy action of a manager, if the borrower replaces the manager with a qualified manager under a replacement management agreement following such bankruptcy action; with respect to clause (iii), if (a) no event of default is continuing and (b) the debt yield is at least 7.5% for the two consecutive calendar quarters immediately preceding the date of determination based upon the trailing 12-month period immediately preceding such date of determination; and with respect to clause (iv), upon the occurrence of a GSA Cure (as defined below).
A “GSA Trigger Event” will commence if (a) GSA ceases operation and/or goes dark with respect to more than 50.0% of its space or (b) GSA vacates, abandons or ceases to occupy more than 50.0% of its space.
A “GSA Cure” will occur if (a) GSA has recommenced operations within 45 days of going dark or (b) the borrower replaces GSA with a new tenant or tenants acceptable to the lender pursuant to a new lease acceptable to the lender such that GSA and the replacement tenant(s) collectively occupy more than 50.0% of the GSA space.
Additional Debt. The Two Independence Square loan is a part of the Two Independence Square Whole Loan that is evidenced by fourpari passu promissory notes and one subordinate note. The Two Independence Square Whole Loan was originated on July 5, 2017 by Column Financial, Inc. Note A-3-A and Note A-3-B were purchased by Natixis Real Estate Capital LLC on July 14, 2017. The Two Independence Square Whole Loan has an outstanding principal balance as of the Cut-off Date of $225.7 million and accrues interest at an interest rate of 3.2300% per annum.
The Note A-1 and the Two Independence Square Subordinate Companion Loan, which had an aggregate original principal balance of $125.7 million, were contributed to the CSMC 2017-MOON Trust. The remaining Note A-2-A was contributed to the WFCM 2017-C39 Trust. See “Description of the Mortgage Pool—The Whole Loans—The Non-Serviced AB Whole Loans—The Two Independence Square Whole Loan” in the Preliminary Prospectus.
THE INFORMATION IN THIS COLLATERAL TERM SHEET IS NOT COMPLETE AND MAY BE AMENDED PRIOR TO THE TIME OF SALE. THIS TERM SHEET IS NOT AN OFFER TO SELL THESE SECURITIES AND IT IS NOT A SOLICITATION OF AN OFFER TO BUY THESE SECURITIES IN ANY JURISDICTION WHERE THE OFFER OR SALE IS NOT PERMITTED.
70
(THIS PAGE INTENTIONALLY LEFT BLANK)
71
Mortgage Loan No. 4 — 245 Park Avenue
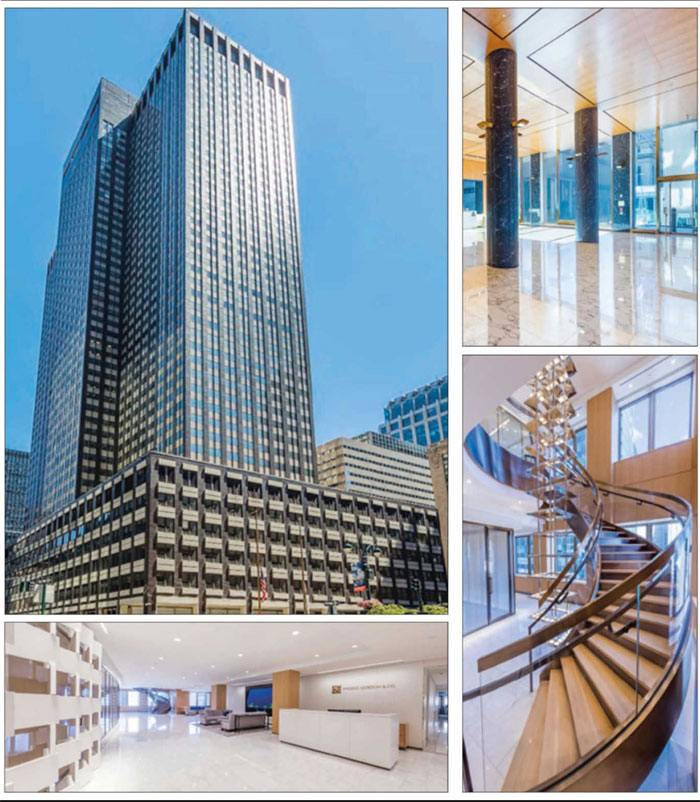
THE INFORMATION IN THIS COLLATERAL TERM SHEET IS NOT COMPLETE AND MAY BE AMENDED PRIOR TO THE TIME OF SALE. THIS TERM SHEET IS NOT AN OFFER TO SELL THESE SECURITIES AND IT IS NOT A SOLICITATION OF AN OFFER TO BUY THESE SECURITIES IN ANY JURISDICTION WHERE THE OFFER OR SALE IS NOT PERMITTED.
72
Mortgage Loan No. 4 — 245 Park Avenue
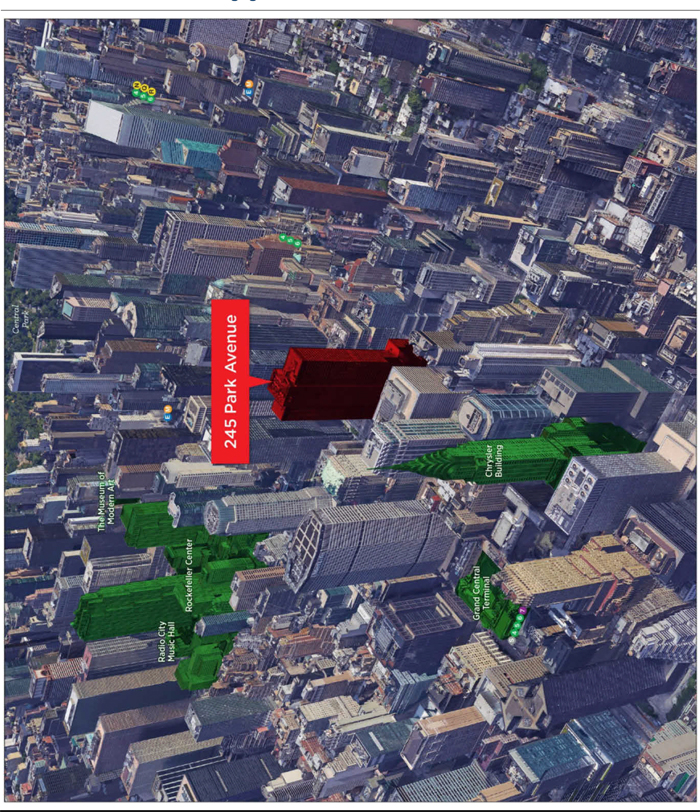
THE INFORMATION IN THIS COLLATERAL TERM SHEET IS NOT COMPLETE AND MAY BE AMENDED PRIOR TO THE TIME OF SALE. THIS TERM SHEET IS NOT AN OFFER TO SELL THESE SECURITIES AND IT IS NOT A SOLICITATION OF AN OFFER TO BUY THESE SECURITIES IN ANY JURISDICTION WHERE THE OFFER OR SALE IS NOT PERMITTED.
73
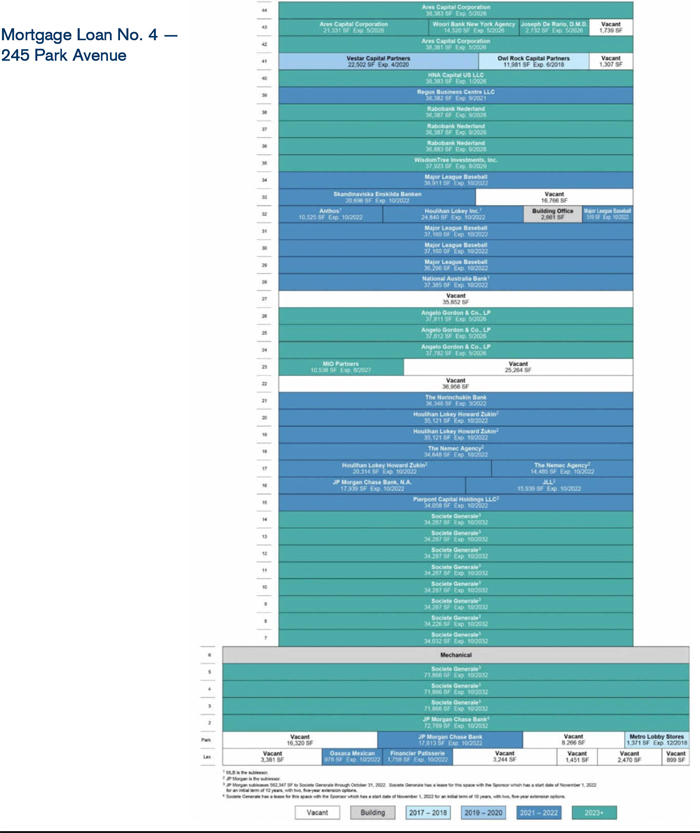
THE INFORMATION IN THIS COLLATERAL TERM SHEET IS NOT COMPLETE AND MAY BE AMENDED PRIOR TO THE TIME OF SALE. THIS TERM SHEET IS NOT AN OFFER TO SELL THESE SECURITIES AND IT IS NOT A SOLICITATION OF AN OFFER TO BUY THESE SECURITIES IN ANY JURISDICTION WHERE THE OFFER OR SALE IS NOT PERMITTED.
74
Mortgage Loan No. 4 — 245 Park Avenue

THE INFORMATION IN THIS COLLATERAL TERM SHEET IS NOT COMPLETE AND MAY BE AMENDED PRIOR TO THE TIME OF SALE. THIS TERM SHEET IS NOT AN OFFER TO SELL THESE SECURITIES AND IT IS NOT A SOLICITATION OF AN OFFER TO BUY THESE SECURITIES IN ANY JURISDICTION WHERE THE OFFER OR SALE IS NOT PERMITTED.
75
Mortgage Loan No. 4 — 245 Park Avenue
| Mortgage Loan Information | Property Information | |||
| Mortgage Loan Seller(1): | Natixis | Single Asset / Portfolio: | Single Asset | |
| Original Principal Balance(2): | $54,000,000 | Title: | Fee | |
| Cut-off Date Principal Balance(2): | $54,000,000 | Property Type - Subtype: | Office – CBD | |
| % of Pool by IPB: | 6.3% | Net Rentable Area (SF)(6): | 1,779,515 | |
| Credit Assessment (Fitch/KBRA)(3): | BBB-/BBB | Location: | New York, NY | |
| Loan Purpose: | Acquisition | Year Built / Renovated: | 1965 / 2006 | |
| Borrower: | 245 Park Avenue Property LLC | Occupancy(6)(7): | 91.2% | |
| Sponsor: | HNA Group | Occupancy Date: | 2/28/2017 | |
| Interest Rate: | 3.6694% | Number of Tenants: | 19 | |
| Note Date: | 5/5/2017 | 2014 NOI: | $98,558,306 | |
| Maturity Date: | 6/1/2027 | 2015 NOI: | $102,667,705 | |
| Interest-only Period: | 120 months | 2016 NOI: | $106,715,962 | |
| Original Term: | 120 months | TTM NOI(8): | $107,676,675 | |
| Original Amortization: | None | UW Economic Occupancy: | 88.5% | |
| Amortization Type: | Interest Only | UW Revenues: | $177,756,680 | |
| Call Protection(4): | L(27),Def (89),O(4) | UW Expenses: | $62,448,738 | |
| Lockbox(5): | Hard | UW NOI: | $115,307,942 | |
| Additional Debt(2): | Yes | UW NCF: | $109,564,903 | |
| Additional Debt Balance(2): | $1,714,000,000 | Appraised Value / Per SF(6): | $2,210,000,000 / $1,242 | |
| Additional Debt Type(2): | Pari Passu, B-Notes, Mezzanine | Appraisal Date: | 4/1/2017 | |
| Additional Future Debt Permitted: | No |
| Escrows and Reserves(9) | Financial Information(2) | |||||
| Initial | Monthly | Initial Cap | Cut-off Date Loan / SF(6): | $607 | ||
| Taxes: | $0 | $3,878,518 | N/A | Maturity Date Loan / SF(6): | $607 | |
| Insurance: | $227,000 | $113,500 | N/A | Cut-off Date LTV: | 48.9% | |
| Replacement Reserves: | $47,738 | $47,738 | N/A | Maturity Date LTV: | 48.9% | |
| TI/LC: | $0 | Springing | N/A | UW NOI DSCR: | 2.87x | |
| Other: | $11,431,608 | $0 | N/A | UW NCF DSCR: | 2.73x | |
| UW NOI Debt Yield: | 10.7% | |||||
| UW NCF Debt Yield: | 10.1% |
Sources and Uses
| Sources | Proceeds | % of Total | Uses | Proceeds | % of Total | |
| Mortgage Loan | $1,200,000,000 | 52.4% | Purchase Price | $2,210,000,000 | 96.4% | |
| Mezzanine Loan A | 236,500,000 | 10.3 | Upfront Reserves | 11,706,346 | 0.5 | |
| Mezzanine Loan B | 221,000,000 | 9.6 | Closing Costs | 70,356,233 | 3.1 | |
| Mezzanine Loan C | 110,500,000 | 4.8 | ||||
| Cash Equity | 524,062,579 | 22.9 | ||||
| Total Sources | $2,292,062,579 | 100.0% | Total Uses | $2,292,062,579 | 100.0% |
| (1) | The 245 Park Avenue Whole Loan was co-originated by JPMorgan Chase Bank, National Association, Natixis Real Estate Capital LLC, Barclays Bank PLC, Deutsche Bank AG, New York Branch and Société Générale. |
| (2) | The 245 Park Avenue loan is part of a larger split whole loan evidenced by 23pari passunotes (collectively, “A Notes”) and five subordinate notes (collectively, “B Notes”) with an aggregate original principal balance of $1.2 billion. The additional debt consists of 21pari passu companion loans with an outstanding principal balance of $1.026 billion, $120.0 million of B Notes and $568.0 million of mezzanine loans. The financial information presented in |
THE INFORMATION IN THIS COLLATERAL TERM SHEET IS NOT COMPLETE AND MAY BE AMENDED PRIOR TO THE TIME OF SALE. THIS TERM SHEET IS NOT AN OFFER TO SELL THESE SECURITIES AND IT IS NOT A SOLICITATION OF AN OFFER TO BUY THESE SECURITIES IN ANY JURISDICTION WHERE THE OFFER OR SALE IS NOT PERMITTED.
76
Mortgage Loan No. 4 — 245 Park Avenue
| the chart above and herein reflects the cut-off date balance of the $1.08 billion of A Notes, but not the $568.0 million of mezzanine loans or the $120.0 million of B Notes. For a more detailed description of the additional debt, please refer to “Additional Debt” below. |
| (3) | Fitch and KBRA have each indicated that the loan has, in the context of its inclusion in the Initial Pool Balance, credit characteristics consistent with an investment grade obligation. |
| (4) | The lockout period will be at least 27 payments beginning with and including the first payment date of July 1, 2017. Defeasance of the full $1.2 billion 245 Park |
Avenue Whole Loan is permitted at any time after the earlier to occur of (i) July 1, 2020 or (ii) the date that is two years after the closing date of the securitization that includes the last note to be securitized.
| (5) | For a more detailed description of the lockbox, please refer to “Lockbox / Cash Management” below. |
| (6) | Based on remeasured net rentable area of 1,779,515 SF in accordance with current REBNY standards, which is the basis for the square footage in future leasing. The property’s contractual square footage is 1,723,993 SF as leased. |
| (7) | Occupancy includes HNA Capital USA LLC (an affiliate of the loan sponsor) and MIO Partners (together, approximately 2.7% of the remeasured net rentable area), which have executed leases but have not yet taken occupancy. |
| (8) | Represents the trailing twelve month period ending March 31, 2017. |
| (9) | For a more detailed description of escrows and reserves, please refer to “Escrows and Reserves” below. |
The Loan. The 245 Park Avenue loan, which is part of a larger split whole loan, is a first mortgage loan secured by the borrower’s fee interest in a 44-story, remeasured 1,779,515 SF office building that occupies the entire city block between 46th and 47th Streets and Park and Lexington Avenues in Midtown Manhattan, New York. The whole loan has an outstanding principal balance of $1.2 billion (the “245 Park Avenue Whole Loan”) and is comprised of (i) a senior loan, evidenced by 23pari passu notes, with an aggregate outstanding principal balance of $1.08 billion (collectively, the “A Notes”) and (ii) a subordinate companion loan, evidenced by fivepari passu notes, with an aggregate outstanding principal balance of $120.0 million (collectively, the “B Notes”). Two of the A Notes, Note A-2-B-2-A and Note A-2-B-3-B, have an aggregate outstanding principal balance as of the cut-off date of $54.0 million and are being contributed to the CSAIL 2017-CX9 Commercial Mortgage Trust. Five of the A Notes, including the controlling Note A-1-A, along with all five of the B Notes were contributed to the 245 Park Avenue Trust 2017-245P securitization which governs the servicing and administration of the 245 Park Avenue Whole Loan and is the controlling noteholder under the related intercreditor agreement, the rights of which will be exercised by the related trustee (or, prior to the occurrence and continuance of a control termination event under the related trust and servicing agreement (the “245 Park Avenue Trust 2017-245P Trust and Servicing Agreement”), the directing certificateholder under the 245 Park Avenue Trust 2017-245P Trust and Servicing Agreement). However, the CSAIL 2017-CX9 Trust will be entitled, under certain circumstances, to be consulted with respect to certain major decisions (which rights will be exercised by the directing certificateholder prior to a control termination event). The 245 Park Avenue Whole Loan has a 10-year term and will be interest-only for the term of the loan. Additionally, Note A-2-A-1, which has an outstanding principal balance as of the cut-off date of $98.0 million was contributed to the JPMCC 2017-JP6 securitization, Note A-2-A-2 and Note A-2-C-1-A, which have an aggregate outstanding principal balance as of the cut-off date of $93.75 million, were contributed to the DBJPM 2017-C6 securitization, Note A-2-B-1, which has an outstanding principal balance as of the cut-off date of $80.0 million, was contributed to the CSAIL 2017-C8 securitization, Note A-2-D-1, which has an outstanding principal balance as of the cut-off date of $32.0 million, were contributed to the UBS 2017-C2 securitization, Note A-2-D-2 and Note A-2-D-3, which have an aggregate outstanding principal balance as of the cut-off date of $38.0 million, were contributed to the UBS 2017-C3 securitization, Note A-2-B-3-A, which has an aggregate outstanding principal balance as of the cut-off date of $45.0 million, was contributed to the WFCM 2017-C39 securitization, and Note A-2-E-1, which has an aggregate outstanding principal balance as of the cut-off date of $55.0 million, was contributed to the WFCM 2017-C38 securitization. The remaining A Notes are currently held by their respective co-originators as depicted in the chart below and are expected to be contributed to one or more future securitizations.
THE INFORMATION IN THIS COLLATERAL TERM SHEET IS NOT COMPLETE AND MAY BE AMENDED PRIOR TO THE TIME OF SALE. THIS TERM SHEET IS NOT AN OFFER TO SELL THESE SECURITIES AND IT IS NOT A SOLICITATION OF AN OFFER TO BUY THESE SECURITIES IN ANY JURISDICTION WHERE THE OFFER OR SALE IS NOT PERMITTED.
77
Mortgage Loan No. 4 — 245 Park Avenue
Whole Loan Note Summary
| Original Balance | Cut-off Date Balance | Note Holder | Lead Servicer for Whole Loan (Y/N) | Controlling Piece (Y/N) | |
| Note A-1-A | $152,000,000 | $152,000,000 | 245 Park Avenue Trust 2017-245P | Y | N |
| Note A-1-B | 114,000,000 | 114,000,000 | 245 Park Avenue Trust 2017-245P | N | N |
| Note A-1-C | 38,000,000 | 38,000,000 | 245 Park Avenue Trust 2017-245P | N | N |
| Note A-1-D | 38,000,000 | 38,000,000 | 245 Park Avenue Trust 2017-245P | N | N |
| Note A-1-E | 38,000,000 | 38,000,000 | 245 Park Avenue Trust 2017-245P | N | N |
| Note A-2-A-1 | 98,000,000 | 98,000,000 | JPMCC 2017-JP6 | N | N |
| Note A-2-A-2 | 75,000,000 | 75,000,000 | DBJPM 2017-C6 | N | N |
| Note A-2-A-3 | 75,000,000 | 75,000,000 | JPMorgan Chase | N | N |
| Note A-2-A-4 | 32,000,000 | 32,000,000 | JPMorgan Chase | N | N |
| Note A-2-B-1 | 80,000,000 | 80,000,000 | CSAIL 2017-C8 | N | N |
| Note A-2-B-2-A | 45,000,000 | 45,000,000 | CSAIL 2017-CX9 | N | N |
| Note A-2-B-2-B | 25,000,000 | 25,000,000 | Natixis | N | N |
| Note A-2-B-3-A | 45,000,000 | 45,000,000 | WFCM 2017-C39 | N | N |
| Note A-2-B-3-B | 9,000,000 | 9,000,000 | CSAIL 2017-CX9 | N | N |
| Note A-2-B-3-C | 6,000,000 | 6,000,000 | Natixis | N | N |
| Note A-2-C-1-A | 18,750,000 | 18,750,000 | DBJPM 2017-C6 | N | N |
| Note A-2-C-1-B | 6,250,000 | 6,250,000 | Deutsche Bank | N | N |
| Note A-2-C-2 | 45,000,000 | 45,000,000 | Deutsche Bank | N | N |
| Note A-2-D-1 | 32,000,000 | 32,000,000 | UBS 2017-C2 | N | N |
| Note A-2-D-2 | 25,000,000 | 25,000,000 | UBS 2017-C3 | N | N |
| Note A-2-D-3 | 13,000,000 | 13,000,000 | UBS 2017-C3 | N | N |
| Note A-2-E-1 | 55,000,000 | 55,000,000 | WFCM 2017-C38 | N | N |
| Note A-2-E-2 | 15,000,000 | 15,000,000 | Barclays | N | N |
| Note B-1 | 48,000,000 | 48,000,000 | 245 Park Avenue Trust 2017-245P | N | N |
| Note B-2 | 36,000,000 | 36,000,000 | 245 Park Avenue Trust 2017-245P | N | N |
| Note B-3 | 12,000,000 | 12,000,000 | 245 Park Avenue Trust 2017-245P | N | N |
| Note B-4 | 12,000,000 | 12,000,000 | 245 Park Avenue Trust 2017-245P | N | N |
| Note B-5 | 12,000,000 | 12,000,000 | 245 Park Avenue Trust 2017-245P | N | Y |
| Total | $1,200,000,000 | $1,200,000,000 |
THE INFORMATION IN THIS COLLATERAL TERM SHEET IS NOT COMPLETE AND MAY BE AMENDED PRIOR TO THE TIME OF SALE. THIS TERM SHEET IS NOT AN OFFER TO SELL THESE SECURITIES AND IT IS NOT A SOLICITATION OF AN OFFER TO BUY THESE SECURITIES IN ANY JURISDICTION WHERE THE OFFER OR SALE IS NOT PERMITTED.
78
Mortgage Loan No. 4 — 245 Park Avenue
245 Park Avenue Total Debt Capital Structure
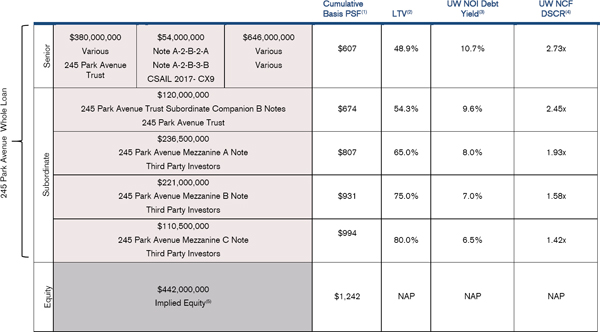
| (1) | Based on remeasured net rentable area of 1,779,515 SF in accordance with current REBNY standards which is the basis for the square footage in future leasing. The property’s contractual square footage is 1,723,993 SF as leased. |
| (2) | Based on an as-is appraised value of $2.21 billion ($1,242 PSF) as of April 1, 2017 per the appraisal. |
| (3) | Based on the UW NOI of $115,307,942. |
| (4) | Based on assumed coupons of 3.6694% for the Mortgage Loan, 5.0000% for the Mezzanine Loan A, 5.7000% for the Mezzanine Loan B, 6.8500% for the Mezzanine Loan C and 4.3000% for the Total Debt. |
| (5) | Implied Equity is based on the as-is appraised value of $2.21 billion, less total debt of $1.77 billion. |
The Borrower. The borrowing entity for the loan is 245 Park Avenue Property LLC, a Delaware limited liability company and special purpose entity.
The Sponsor. The loan sponsor is HNA Group (“HNA”) and the nonrecourse carve-out guarantor is 181 West Madison Holding LLC, an affiliate of the loan sponsor. HNA is a China-based global Fortune 500 conglomerate with core divisions of aviation, hospitality, tourism, real estate, retail, finance, logistics, shipbuilding and eco-tech. In 2016, HNA had total assets of approximately $140.0 billion with revenues of approximately $87.0 billion. The main business of HNA Finance, a subsidiary of HNA, is leasing and insurance and it also provides financial services such as securities, banking, futures, fund and investment banking. HNA Real Estate, a subsidiary of HNA, focuses on the development and management of central business district and urban real estate assets and, as of December 31, 2016, it had 34 real estate investments in over 40 cities. HNA owns more than $1.3 billion of commercial real estate in the United States including 850 Third Avenue in New York, New York, 1180 Sixth Avenue in New York, New York, the Cassa Hotel at 70 West 45th Street in New York, New York and two golf courses, Nicklaus Club Monterey in Monterey, California and Somers Pointe Country Club in Somers, New York. In 2016, HNA purchased a 25% stake in Hilton Worldwide Holdings Inc. from Blackstone Group LP for $6.5 billion.
THE INFORMATION IN THIS COLLATERAL TERM SHEET IS NOT COMPLETE AND MAY BE AMENDED PRIOR TO THE TIME OF SALE. THIS TERM SHEET IS NOT AN OFFER TO SELL THESE SECURITIES AND IT IS NOT A SOLICITATION OF AN OFFER TO BUY THESE SECURITIES IN ANY JURISDICTION WHERE THE OFFER OR SALE IS NOT PERMITTED.
79
Mortgage Loan No. 4 — 245 Park Avenue
The Property.The property is a Class A office tower located along Park Avenue between 46th and 47th Streets that consists of 44 stories with 42 office levels, 57,799 SF of retail space and 1,580 SF of lobby retail space in Midtown Manhattan, New York. The property is one of approximately 12 buildings that feature direct underground access to Grand Central Terminal, Metro North Transit and the 4, 5, 6, 7 and S subway lines. The property is located in the Park Avenue office submarket, adjacent to Grand Central Terminal, and within 0.6 miles of 5th Avenue, Rockefeller Center, Radio City Music Hall, St. Patrick’s Cathedral and the Museum of Modern Art. According to the appraisal, Park Avenue is widely considered to be one of the premier office corridors in the United States due to its central location, prestigious tenancy, proximity to Grand Central Station and other amenities. As of February 28, 2017, the property was 91.2% leased to 19 tenants based on remeasured net rentable area and the property has demonstrated average occupancy of 95.0% from 2007 to 2016.
The property’s largest tenant is Société Générale, a French multinational banking and financial services company, which utilizes the property as its United States headquarters and leases 33.3% of the remeasured net rentable area through October 2032 across 12 floors. In 2010, Société Générale executed a sublease from JPMorgan Chase Bank for 562,347 contractual SF through October 31, 2022. Additionally, in 2010, Société Générale executed a 10-year direct lease with the prior owner of 245 Park Avenue for 593,344 remeasured SF which lease has a start date of November 1, 2022 at (i) approximately $88.00 PSF for the first five years of the term and (ii) a base rent for the second five years of the term equal to the higher of the rent payable for the first five years and a fair market rental value (no more than $110 PSF). Société Générale’s direct lease has a base year of 2013. As of May 25, 2017, Société Générale reported a market capitalization of approximately €40.5 billion and had revenues of €25.3 billion in 2016. Société Générale has offices in 67 countries, employing 145,700 people and serving approximately 31 million customers as of December 31, 2016. The second-largest tenant, JPMorgan Chase Bank, N.A. (“JPMorgan Chase Bank”), leases 13.4% of the remeasured net rentable area through October 2022. JPMorgan Chase Bank is the largest banking institution in the United States with a market capitalization of $303.2 billion as of May 25, 2017, operates in more than 60 countries, has more than 250,000 employees and serves consumers, small businesses, corporate, institutional and government clients. As of 2016, JPMorgan Chase Bank reported revenues of $95.7 billion and assets of $2.5 trillion. The JPMorgan Chase Bank space does not include the space subleased to Société Générale due to the fact that Société Générale has executed the direct lease described above. Of the 225,438 total contractual SF leased by JPMorgan Chase Bank, 189,686 contractual SF is subleased through October 30, 2022, including 90,556 contractual SF to Houlihan Lokey Howard & Zukin Financial Advisors, Inc., 49,133 contractual SF to The Nemec Agency, Inc., 34,058 contractual SF to Pierpont Capital Holdings LLC and 15,939 contractual SF to JLL Partners, LLC. JPMorgan Chase Bank also utilizes 17,813 contractual SF of its leased space at the property. The third largest tenant at the property, Major League Baseball (“MLB”), is currently headquartered at the property and leases 12.6% of the remeasured net rentable area through October 2022. MLB is a professional baseball league in North America. MLB reported record revenues in 2015, up $500.0 million from the prior year and approaching $9.5 billion. MLB had attendance of more than 73.0 million fans in 2016. MLB subleases 37,385 contractual SF to the National Australia Bank, LTD., 24,840 contractual SF to Houlihan Lokey, Inc. and 10,525 contractual SF to Anthos U.S.A. Inc. through October 30, 2022. MLB’s lease expires in October 2022 and MLB has announced that it plans to vacate its space at the end of its lease term. In addition, MLB has signed a lease at 1271 Avenue of the Americas and declared its intention to move into that space in 2019, which is approximately three years prior to its lease expiration date. If MLB does not renew its lease 12 months before the expiration date or if MLB vacates or abandons all or substantially all of its space, a Cash Sweep Event (as defined in “Escrows and Reserves” below) will occur.
As of February 28, 2017, 62.8% of the property’s annual in-place base rent was attributed to investment grade tenants. The property serves as the United States headquarters for Société Générale (33.3% of remeasured net rentable area, rated A2/A by Moody's and S&P) and features other investment grade and institutional tenants including JPMorgan Chase Bank (13.4% of remeasured net rentable area, rated Aa3/A+/AA- by Moody's, S&P and Fitch), MLB (12.6% of remeasured net rentable area), Angelo Gordon & Co., L.P. (6.4% of remeasured net rentable area) and Rabobank Nederland (6.3% of remeasured net rentable area, rated Aa2/A+/AA- by Moody's, S&P and Fitch). Midtown Manhattan is home to numerous national and multinational corporations, such as Bloomberg L.P., BlackRock, Inc., the Blackstone Group L.P., Colgate-Palmolive Company, J.P.Morgan Chase & Co. and NBC Universal. The surrounding area offers a number of luxury hotels including the Waldorf
THE INFORMATION IN THIS COLLATERAL TERM SHEET IS NOT COMPLETE AND MAY BE AMENDED PRIOR TO THE TIME OF SALE. THIS TERM SHEET IS NOT AN OFFER TO SELL THESE SECURITIES AND IT IS NOT A SOLICITATION OF AN OFFER TO BUY THESE SECURITIES IN ANY JURISDICTION WHERE THE OFFER OR SALE IS NOT PERMITTED.
80
Mortgage Loan No. 4 — 245 Park Avenue
Astoria, The Four Seasons and the New York Palace as well as Michelin starred restaurants such as Aquavit, The Modern and Le Bernardin.
The Market. The property occupies the entire city block between 46th and 47th Streets and Park and Lexington Avenues in Midtown Manhattan. The property is one of approximately 12 buildings that feature direct underground access to Grand Central Terminal, Metro North Transit and the 4, 5, 6, 7 and S subway lines. The property is located in the Park Avenue office submarket, adjacent to Grand Central Terminal, and within 0.6 miles of 5th Avenue, Rockefeller Center, Radio City Music Hall, St. Patrick’s Cathedral and the Museum of Modern Art. According to the appraisal, Park Avenue is widely considered to be one of the premier office corridors in the United States due to its central location, prestigious tenancy, proximity to Grand Central Station and other amenities.
According to the appraisal, as of the fourth quarter of 2016, the Park Avenue office submarket had approximately 21.8 million SF of office inventory, direct weighted average Class A asking rents of $102.15 PSF and a vacancy rate of 10.5%. The appraisal identified seven comparable Class A office buildings including 200 Park Avenue, 277 Park Avenue, 299 Park Avenue, 300 Park Avenue, 320 Park Avenue, 345 Park Avenue and 350 Park Avenue with current asking rents ranging from $85.00 PSF to $125.00 PSF which is in-line with the property’s in-place rent. The comparable buildings had a weighted average occupancy of 97.0%. The property’s weighted average in place office rent of $80.72 PSF is approximately $15.82 PSF lower than the appraiser's concluded weighted average in place market rent of $96.54 PSF. According to the appraisal, the property’s competitive set consists of the 10 properties detailed in the table below.
Competitive Set Summary(1)
| Property | Year Built / Renovated | Total GLA (SF) | Est. Rent PSF | Est. Occ. | Proximity (miles) | Anchor Tenant |
| 245 Park Avenue | 1965 / 2006 | 1,779,515 | $73.00 | 91. 2%(2) | N/A | Société Générale |
| 1177 Avenue of the Americas | 1992 / NAV | 960,050 | $80.00 | 93.1% | 0.5 | Kramer Levin Naftalis & Frankel LLP |
| 280 Park Avenue | 1962 & 1968 / NAV | 1,283,145 | $110.00 | 97.1% | 0.1 | Orix USA, Wells Fargo |
| 599 Lexington Avenue | 1986 / NAV | 955,274 | $85.00 | 100.0% | 0.3 | Vroom |
| 520 Madison Avenue | 1982 / NAV | 849,600 | $127.00 | 94.3% | 0.5 | CIC Eurepeenne Internation et Cie |
| 237 Park Avenue | 1981 / 2015 | 1,142,196 | $79.00 | 65.6% | 0.1 | Permanent Mission of Canada to the UN |
| 399 Park Avenue | 1961 / NAV | 1,250,000 | $108.50 | 98.6% | 0.4 | Morgan Stanley |
| 75 Rockefeller Plaza | 1947 / 2017 | 635,917 | $82.50 | 39.4% | 0.5 | Merrill Lynch Wealth Management |
| 90 Park Ave | 1964 / NAV | 785,000 | $80.00 | 96.8% | 0.5 | Alston & Bird |
| 1285 Avenue of the Americas | 1960 / NAV | 1,473,950 | $79.00 | 100.0% | 0.7 | UBS |
| 601 Lexington Avenue | 1977 / NAV | 1,671,702 | $140.00 | 98.9% | 0.4 | BTG Pactual |
| 277 Park Avenue | 1964 / 2001 | 1,529,945 | $116.00 | 98.1% | 0.1 | Visa |
| (1) | Source: Appraisal and a third party report. |
| (2) | Current occupancy is as of February 28, 2017, is based on remeasured net rentable area of 1,779,515 and includes HNA Capital USA LLC (an affiliate of loan sponsor) and MIO Partners (together, approximately 2.7% of the remeasured net rentable area), which has executed leases but have not yet taken occupancy. For more information, see “Description of the Mortgage Pool—Tenant Issues—Lease Expirations and Terminations—Other” in the Preliminary Prospectus. |
Historical and Current Occupancy(1)
| 2013 | 2014 | 2015 | 2016 | Current(2) |
| 93.6% | 93.6% | 93.6.% | 95.0% | 91.2% |
| (1) | Source: Historical occupancy is provided by the sponsor. Occupancies are as of December 31 of each respective year. |
| (2) | Current occupancy is as of February 28, 2017, is based on remeasured net rentable area of 1,779,515 and includes HNA Capital USA LLC (an affiliate of the loan sponsor) and MIO Partners (together, approximately 2.7% of the remeasured net rentable area), which have executed leases but have not yet taken occupancy. |
THE INFORMATION IN THIS COLLATERAL TERM SHEET IS NOT COMPLETE AND MAY BE AMENDED PRIOR TO THE TIME OF SALE. THIS TERM SHEET IS NOT AN OFFER TO SELL THESE SECURITIES AND IT IS NOT A SOLICITATION OF AN OFFER TO BUY THESE SECURITIES IN ANY JURISDICTION WHERE THE OFFER OR SALE IS NOT PERMITTED.
81
Mortgage Loan No. 4 — 245 Park Avenue
Tenant Summary(1)
| Tenant | Ratings Moody’s/S&P/Fitch(2) | Net Rentable Area (SF)(3) | % of Total NRA(3) | Base Rent PSF(4) | Lease Expiration Date |
| Société Générale(5)(6) | A2 /A /NA | 593,344 | 33.3% | $61.50 | 10/31/2032 |
| JPMorgan Chase Bank(5)(7) | Aa3 / A+ / AA- | 237,781 | 13.4% | $52.42 | 10/31/2022 |
| MLB(8) | NA / NA / NA | 224,477 | 12.6% | $124.75 | 10/31/2022 |
| Angelo Gordon & Co., L.P. | NA / NA / NA | 113,408 | 6.4% | $81.00 | 5/31/2026 |
| Rabobank Nederland | Aa2 / A+ / AA- | 112,662 | 6.3% | $138.00 | 9/30/2026 |
| Ares Capital Corporation | NA / BBB / BBB | 97,101 | 5.5% | $83.91 | 5/31/2026 |
| Regus Business Centre LLC | NA / NA / NA | 38,383 | 2.2% | $84.00 | 9/30/2021 |
| HNA Capital US LLC(9) | NA / NA / NA | 38,382 | 2.2% | $74.00 | 1/31/2026 |
| WisdomTree Investments, Inc.(10) | NA / NA / NA | 37,924 | 2.1% | $73.00 | 8/31/2029 |
| The Norinchukin Bank | A1 / A / NA | 37,342 | 2.1% | $99.00 | 3/31/2022 |
| (1) | Based on the underwritten rent roll dated February 28, 2017, including rent increases occurring through April 30, 2018. |
| (2) | Ratings provided are for the parent company of the entity listed in the “Tenant” field whether or not the parent company guarantees the lease. |
| (3) | Based on remeasured net rentable SF of 1,779,515. |
| (4) | Based on 1,723,993 contractual SF which includes BOP 245 Park LLC. |
| (5) | JPMorgan Chase Bank subleases 562,347 contractual SF to Société Générale through October 31, 2022. In 2010, Société Générale executed a 10-year direct lease with the prior owner for 593,344 remeasured SF which has a start date of November 1, 2022 at (i) approximately $88.00 PSF for the first five years of the term, (ii) a base rent for the second five-year period of the term equal to the higher of the rent payable for the first five years and a fair market rental value (not to exceed $110 PSF). Société Générale’s direct lease has a base year of 2013 and two five-year renewal options. The terms shown for Société Générale in the table above are based on JPMorgan Chase Bank’s direct lease. |
| (6) | Société Générale has the right to terminate either the highest floor or the highest two full floors that it leases (if such floors are contiguous) under either the related sublease described above or under its direct lease with the borrower, with notice by May 1, 2021. Société Générale may not exercise the option if all or any portion of the termination space is covered by a non-disturbance agreement granted by the borrower. |
| (7) | The JPMorgan Chase Bank space does not include the space subleased to Société Générale due to the fact that Société Générale has executed a direct lease which begins November 1, 2022. Of the 225,438 contractual SF of JPMorgan Chase Bank space, a total of 189,686 contractual SF is subleased through October 30, 2022. This includes 90,556 contractual SF to Houlihan Lokey Howard & Zukin Financial Advisors, Inc., 49,133 contractual SF to The Nemec Agency, Inc., 34,058 contractual SF to Pierpont Capital Holdings LLC and 15,939 contractual SF to JLL Partners, LLC. The JPMorgan Chase Bank space also includes 17,813 contractual SF of retail space that it leases at the property. The terms shown for JPMorgan Chase Bank in the table above are based on its direct lease. JPMorgan Chase Bank may not extend any portion of its lease currently subleased to Société Générale pursuant to its sublease agreement with Société Générale. |
| (8) | MLB subleases 37,385 contractual SF to the National Bank of Australia, 24,840 contractual SF to Houlihan Lokey Inc. and 10,525 contractual SF to Anthos USA Inc. through October 30, 2022. MLB does not have any remaining renewal options. The terms shown for MLB in the table above are based on its direct lease. |
| (9) | The HNA Capital US LLC space was originally leased to Heineken Americas Inc. from January 2010 through January 2026. On May 4, 2017, Heineken Americas Inc. assigned its space at the property to HNA Capital US LLC, an affiliate of the sponsor. |
| (10) | WisdomTree Investments, Inc. has the right to terminate its lease effective as of August 20, 2024, with 12 months’ notice and the payment of a termination fee. |
THE INFORMATION IN THIS COLLATERAL TERM SHEET IS NOT COMPLETE AND MAY BE AMENDED PRIOR TO THE TIME OF SALE. THIS TERM SHEET IS NOT AN OFFER TO SELL THESE SECURITIES AND IT IS NOT A SOLICITATION OF AN OFFER TO BUY THESE SECURITIES IN ANY JURISDICTION WHERE THE OFFER OR SALE IS NOT PERMITTED.
82
Mortgage Loan No. 4 — 245 Park Avenue
Lease Rollover Schedule(1)(2)
| Year | Number of Leases Expiring(3) | NRA Expiring(4) | % of NRA Expiring(4) | Base Rent Expiring | % of Base Rent Expiring | Cumulative NRA Expiring(2) | Cumulative % of NRA Expiring(2) | Cumulative Base Rent Expiring | Cumulative % of Base Rent Expiring | |
| Vacant | NAP | 153,915 | 8.9% | NAP | NAP | 153,915 | 8.9% | NAP | NAP | |
| MTM | 0 | 0 | 0.0 | $0 | 0.0% | 153,915 | 8.9% | $0 | 0.0% | |
| 2017 | 0 | 0 | 0.0 | 0 | 0.0 | 153,915 | 8.9% | $0 | 0.0% | |
| 2018 | 2 | 13,352 | 0.8 | 1,282,100 | 1.0 | 167,267 | 9.7% | $1,282,100 | 1.0% | |
| 2019 | 0 | 0 | 0.0 | 0 | 0.0 | 167,267 | 9.7% | $1,282,100 | 1.0% | |
| 2020 | 1 | 22,502 | 1.3 | 1,597,404 | 1.3 | 189,769 | 11.0% | $2,879,504 | 2.3% | |
| 2021 | 1 | 38,382 | 2.2 | 3,224,088 | 2.6 | 228,151 | 13.2% | $6,103,592 | 4.8% | |
| 2022(5) | 6 | 505,781 | 29.3 | 45,017,995 | 35.7 | 733,932 | 42.6% | $51,121,587 | 40.5% | |
| 2023 | 0 | 0 | 0.0 | 0 | 0.0 | 733,932 | 42.6% | $51,121,587 | 40.5% | |
| 2024 | 0 | 0 | 0.0 | 0 | 0.0 | 733,932 | 42.6% | $51,121,587 | 40.5% | |
| 2025 | 0 | 0 | 0.0 | 0 | 0.0 | 733,932 | 42.6% | $51,121,587 | 40.5% | |
| 2026 | 6 | 376,592 | 21.8 | 36,765,311 | 29.1 | 1,110,524 | 64.4% | $87,886,898 | 69.7% | |
| 2027 & Beyond(5) | 3 | 613,469 | 35.6 | 38,290,601 | 30.3 | 1,723,993 | 100.0% | $126,177,500 | 100.0% | |
| Total | 19 | 1,723,993 | 100.0% | $126,177,500 | 100.0% | |||||
| (1) | Based on the underwritten rent roll dated February 28, 2017. Rent includes base rent and rent increases occurring through April 30, 2018. |
| (2) | Certain tenants may have termination or contraction options (which are exercisable prior to the originally stated expiration date of the tenant lease) that are not considered in the above Lease Rollover Schedule. |
| (3) | Certain tenants have more than one lease. |
| (4) | Based on 1,723,993 contractual SF which includes BOP 245 Park LLC. |
| (5) | JPMorgan Chase Bank subleases 562,347 SF to Société Générale through October 31, 2022. In 2010, Société Générale executed a direct lease with the prior owner that has a start date of November 1, 2022 and is for an initial term of 10 years, with two five-year extension options. The lease maturity of this space is reflected as 2032 in the table above. |
Operating History and Underwritten Net Cash Flow
| 2014 | 2015 | 2016 | TTM(1) | Underwritten(2) | PSF(3) | %(4) | |
| Rents in Place | $118,736,577 | $125,320,974 | $128,705,034 | $129,095,683 | $126,177,500 | $73.19 | 65.1% |
| Vacant Income | 0 | 0 | 0 | 0 | 16,425,575 | 9.53 | 8.5 |
| Rent Steps | 0 | 0 | 0 | 0 | 10,341,838 | 6.00 | 5.3 |
| Gross Potential Rent(5) | $118,736,577 | $125,320,974 | $128,705,034 | $129,095,683 | $152,944,913 | $88.72 | 78.9% |
| Total Reimbursements(6) | 31,667,499 | 34,635,748 | 37,032,022 | 37,903,249 | 40,918,609 | 23.73 | 21.1 |
| Net Rental Income | $150,404,076 | $159,956,722 | $165,737,056 | $166,998,932 | $193,863,523 | $112.45 | 100.0% |
| (Vacancy/Collection Loss) | 0 | 0 | 0 | 0 | (16,425,575) | (9.53) | (8.5) |
| Other Income(7) | 488,183 | 704,333 | 1,901,893 | 1,888,513 | 318,732 | 0.18 | 0.2 |
| Effective Gross Income | $150,892,259 | $160,661,056 | $167,638,950 | $168,887,445 | $177,756,680 | $103.11 | 91.7% |
| Total Expenses | $52,333,953 | $57,993,351 | $60,922,988 | $61,210,770 | $62,448,738 | $36.22 | 35.1% |
| Net Operating Income(8) | $98,558,306 | $102,667,705 | $106,715,962 | $107,676,675 | $115,307,942 | $66.88 | 64.9% |
| Total TI/LC, Capex/RR | 0 | 0 | 0 | 0 | 5,743,040 | 3.33 | 3.2 |
| Net Cash Flow | $98,558,306 | $102,667,705 | $106,715,962 | $107,676,675 | $ 109,564,903 | $63.55 | 61.6% |
| (1) | TTM represents the trailing 12-month period ending March 31, 2017. |
| (2) | Rent includes Base Rent and Rent Increases occurring through April 30, 2018. |
| (3) | Based on 1,723,993 contractual SF. |
| (4) | Percentage column represents percent of Net Rental Income for all revenue lines and represents percent of Effective Gross Income for the remainder of fields. |
| (5) | The increase in Underwritten Gross Potential Rent from TTM Gross Potential Rent is primarily due to the inclusion of rent steps, which are underwritten to (i) for noninvestment-grade tenants, rent steps through April 2018 and (ii) for investment-grade tenants, the average base rent over the lesser of the 245 Park Avenue Whole Loan term and the applicable lease term. With respect to the Société Générale subleased space, rent steps are underwritten based on the average of the JPMorgan Chase base rent of $61.50 PSF through October 2022 and base rent pursuant to Société Générale’s direct lease of $88.00 PSF through the remainder of the loan term. |
THE INFORMATION IN THIS COLLATERAL TERM SHEET IS NOT COMPLETE AND MAY BE AMENDED PRIOR TO THE TIME OF SALE. THIS TERM SHEET IS NOT AN OFFER TO SELL THESE SECURITIES AND IT IS NOT A SOLICITATION OF AN OFFER TO BUY THESE SECURITIES IN ANY JURISDICTION WHERE THE OFFER OR SALE IS NOT PERMITTED.
83
Mortgage Loan No. 4 — 245 Park Avenue
| (6) | Total Reimbursements are calculated on a tenant-by-tenant basis according to each tenant’s reimbursement methodology. Reimbursements for the JPMorgan Chase Bank space subleased to Société Générale are underwritten pursuant to the triple-net JPMorgan Chase Bank lease; upon the commencement of Société Générale’s direct modified gross lease in October 2022, the tenant will reimburse expenses over a base year of 2013. |
| (7) | Other Income consists of licensing fees, utility fees, generator fees and other miscellaneous items. |
| (8) | The increase in 2015 Net Operating Income from 2014 Net Operating Income was primarily due to contractual rent increases resulting in an increase in the weighted average base rent PSF from approximately $68.87 to approximately $72.69 PSF. |
Property Management. The property is managed by Brookfield Properties Management LLC (“Brookfield”) on an interim basis subject to a property management agreement that is in place until October 31, 2017. The borrower has indicated that it expects to replace Brookfield and select a long term property manager on or before the expiration of the current management agreement. Under the loan agreement, the loan sponsor may replace the property manager with a qualified manager, which will include certain preapproved parties or, among other criteria, a nationally recognized property management company having at least 7.5 million rentable SF (excluding the property) under management, including at least 5.0 million rentable SF under management in office properties in New York City.
Escrows and Reserves. At origination, the borrower deposited $10,298,441 for outstanding tenant improvements and leasing commissions, $1,133,167 for free rent, $227,000 for insurance reserves and $47,738 for replacement reserves. In lieu of depositing any reserve amounts required under the loan documents in cash, the borrower may deliver to the lender one or more letters of credit for all or any portion of the deposit requirements. The amount of any such letter(s) of credit may not exceed 10.0% of the 245 Park Avenue Whole Loan, unless such excess is permitted under a new non-consolidation opinion delivered to the lender.
Tax Escrows - On a monthly basis, the borrower is required to escrow 1/12th of annual estimated tax payments, which currently equates to $3,878,518 (approximately $26.15 per remeasured SF annually).
Insurance Escrows - On a monthly basis, the borrower is required to escrow 1/12th of the annual insurance premiums, which currently equates to $113,500 (approximately $0.77 per remeasured SF annually).
Replacement Reserves - On a monthly basis, the borrower is required to escrow $47,738 (approximately $0.32 per remeasured SF annually) for ongoing replacement reserves.
Rollover Reserves - Commencing on May 1, 2025 and continuing on a monthly basis, the borrower is required to deposit $446,775 per month ($3.00 per remeasured SF annually) with the lender for costs related to tenant improvements and leasing commissions.
The borrower is also required to deposit any lease modification fees, settlement of claims against third parties related to any lease, any rejection, termination, cancellation or surrender fee and any holdover rents or use and occupancy fees from any current or former tenants.
Lockbox / Cash Management. The 245 Park Avenue Whole Loan is structured with a hard lockbox and springing cash management. The borrower and the property manager were required at origination to deliver letters to all tenants at the property directing them to pay rents into a lockbox account. All funds in the lockbox account are required to be swept within one business day into the borrower’s operating account, unless a Cash Sweep Event (as defined below) has occurred, in which event such funds are required to be swept each business day into the cash management account controlled by the lender and disbursed on each payment date in accordance with the loan documents. The lenders have been granted a first priority security interest in the cash management account.
A “Cash Sweep Event” means the occurrence of (a) an event of default under the loan documents or an event of default under the mezzanine loan documents, (b) the bankruptcy or insolvency of the borrower or the property manager (in the case of the property manager, to the extent such action results in the cash or bank accounts associated with the property being included in the bankruptcy action or that has a material adverse effect on the property or the value or security of the lender's interests), (c) if the debt service coverage ratio (as calculated in the loan documents) for the 245 Park Avenue Whole Loan and the related mezzanine loans, based on underwritten net cash flow and the trailing three-month period, falls below 1.15x at the end of any quarter, or (d) if MLB does not renew all or substantially all of its premises at least 12 months before its lease expiration date or
THE INFORMATION IN THIS COLLATERAL TERM SHEET IS NOT COMPLETE AND MAY BE AMENDED PRIOR TO THE TIME OF SALE. THIS TERM SHEET IS NOT AN OFFER TO SELL THESE SECURITIES AND IT IS NOT A SOLICITATION OF AN OFFER TO BUY THESE SECURITIES IN ANY JURISDICTION WHERE THE OFFER OR SALE IS NOT PERMITTED.
84
Mortgage Loan No. 4 — 245 Park Avenue
if MLB vacates or abandons all or substantially all of its premises (this clause (d), a “Tenant Trigger Event”); (provided that, in the case of a Tenant Trigger Event, such sweep will be capped at $85.00 PSF with respect to the space leased by MLB.
A Cash Sweep Event may be cured in accordance with the following conditions: (i) with respect to a Cash Sweep Event caused solely by clause (a) above, the acceptance of a cure by the applicable lender(s) of the related event of default, (ii) with respect to a Cash Sweep Event caused by clause (b) above, if the borrower replaces such manager within 60 days of such action in accordance with the loan documents, (iii) with respect to a Cash Sweep Event caused solely by clause (c) above, either (1) the achievement of a debt service coverage ratio for the 245 Park Avenue Whole Loan and the related mezzanine loans of at least 1.15x for six consecutive months based on the trailing three-month period or (2) the borrower effects a DSCR Cure (as defined below) or (iv) with respect to a Cash Sweep Event caused solely by a Tenant Trigger Event, the occurrence of a Tenant Trigger Cure (as defined below). Each Cash Sweep Event cure is also subject to the following: (x) no other event of default has occurred and is continuing, (y) a cure may not occur more than five times in the aggregate during the term of the loan (except that there are no limits on the number of times a DSCR Cure may occur and a DSCR Cure is excluded from the foregoing limit) and (z) borrower has paid all of lender’s reasonable expenses incurred in connection with such Cash Sweep Event. The borrower may not cure a Cash Sweep Event caused by a bankruptcy or insolvency of the borrower.
A “DSCR Cure” means the satisfaction of the following conditions: (a) the borrower delivers a letter of credit with a notional amount which, if applied to the 245 Park Avenue Whole Loan and each related mezzanine loan, would result in a debt service coverage ratio of at least 1.15x based upon the trailing three-month period immediately preceding the date of determination; and (b) no Cash Sweep Event resulting from a separate event has occurred that has not been cured; provided that (x) the amount of the letter of credit (together with the amount of any other letters of credit that have been delivered by the borrower under the loan documents) may not exceed 10.0% of the 245 Park Avenue Whole Loan, unless such excess is permitted under a new non-consolidation opinion and (y) the borrower has no reimbursement obligations with respect to such letter of credit.
A “Tenant Trigger Cure” means either (x) the replacement of MLB with one or more tenants approved by the lender if required under the loan documents leasing not less than 90.0% of the leasable area of the MLB space (including any portion of the space retained by MLB), which tenant(s) are in occupancy and paying full contractual rent, without right of offset or free rent credit, as evidenced by an estoppel certificate or (y) during the period of any Cash Sweep Event from and after a Tenant Trigger Event, excess cash flow has been deposited in the cash management account in an amount equal to or exceeding $85.00 PSF with respect to the space demised under the MLB lease.
Additional Debt.The $568.0 million mezzanine debt consists of a $236.5 million mezzanine loan A, a $221.0 million mezzanine loan B and a $110.5 million mezzanine loan C. The mezzanine loan A has a 5.0000% coupon, the mezzanine loan B has a 5.7000% coupon and the mezzanine loan C has a 6.8500% coupon. The mezzanine loans are interest-only for the full term of the loans and are coterminous with the 245 Park Avenue Whole Loan. Including the 245 Park Avenue B Notes and mezzanine loans, the cumulative cut-off date LTV, cumulative UW NCF DSCR and cumulative UW NOI Debt Yield are 80.0%, 1.42x and 6.5%, respectively. The mortgage and mezzanine lenders have entered into an intercreditor agreement. The mezzanine loans have been or are expected to be sold to institutional investors.
THE INFORMATION IN THIS COLLATERAL TERM SHEET IS NOT COMPLETE AND MAY BE AMENDED PRIOR TO THE TIME OF SALE. THIS TERM SHEET IS NOT AN OFFER TO SELL THESE SECURITIES AND IT IS NOT A SOLICITATION OF AN OFFER TO BUY THESE SECURITIES IN ANY JURISDICTION WHERE THE OFFER OR SALE IS NOT PERMITTED.
85
Mortgage Loan No. 5 — The Boulders Resort & Spa

THE INFORMATION IN THIS COLLATERAL TERM SHEET IS NOT COMPLETE AND MAY BE AMENDED PRIOR TO THE TIME OF SALE. THIS TERM SHEET IS NOT AN OFFER TO SELL THESE SECURITIES AND IT IS NOT A SOLICITATION OF AN OFFER TO BUY THESE SECURITIES IN ANY JURISDICTION WHERE THE OFFER OR SALE IS NOT PERMITTED.
86
Mortgage Loan No. 5 — The Boulders Resort & Spa

THE INFORMATION IN THIS COLLATERAL TERM SHEET IS NOT COMPLETE AND MAY BE AMENDED PRIOR TO THE TIME OF SALE. THIS TERM SHEET IS NOT AN OFFER TO SELL THESE SECURITIES AND IT IS NOT A SOLICITATION OF AN OFFER TO BUY THESE SECURITIES IN ANY JURISDICTION WHERE THE OFFER OR SALE IS NOT PERMITTED.
87
Mortgage Loan No. 5 — The Boulders Resort & Spa

THE INFORMATION IN THIS COLLATERAL TERM SHEET IS NOT COMPLETE AND MAY BE AMENDED PRIOR TO THE TIME OF SALE. THIS TERM SHEET IS NOT AN OFFER TO SELL THESE SECURITIES AND IT IS NOT A SOLICITATION OF AN OFFER TO BUY THESE SECURITIES IN ANY JURISDICTION WHERE THE OFFER OR SALE IS NOT PERMITTED.
88
Mortgage Loan No. 5 — The Boulders Resort & Spa

THE INFORMATION IN THIS COLLATERAL TERM SHEET IS NOT COMPLETE AND MAY BE AMENDED PRIOR TO THE TIME OF SALE. THIS TERM SHEET IS NOT AN OFFER TO SELL THESE SECURITIES AND IT IS NOT A SOLICITATION OF AN OFFER TO BUY THESE SECURITIES IN ANY JURISDICTION WHERE THE OFFER OR SALE IS NOT PERMITTED.
89
Mortgage Loan No. 5 — The Boulders Resort & Spa
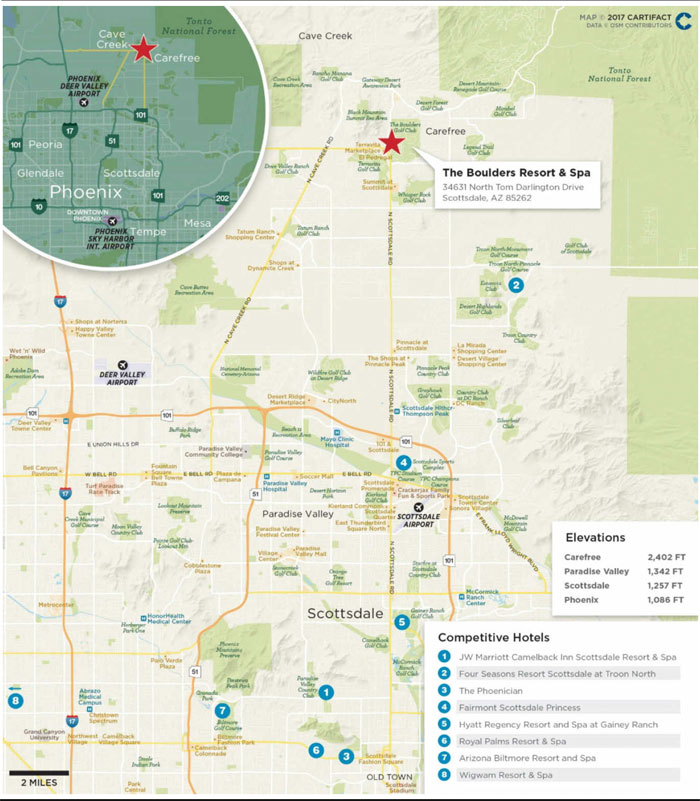
THE INFORMATION IN THIS COLLATERAL TERM SHEET IS NOT COMPLETE AND MAY BE AMENDED PRIOR TO THE TIME OF SALE. THIS TERM SHEET IS NOT AN OFFER TO SELL THESE SECURITIES AND IT IS NOT A SOLICITATION OF AN OFFER TO BUY THESE SECURITIES IN ANY JURISDICTION WHERE THE OFFER OR SALE IS NOT PERMITTED.
90
Mortgage Loan No. 5 — The Boulders Resort & Spa
| Mortgage Loan Information | Property Information | |||
| Mortgage Loan Seller: | Column | Single Asset / Portfolio: | Single Asset | |
| Original Principal Balance(1): | $50,000,000 | Title: | Fee | |
| Cut-off Date Principal Balance(1): | $50,000,000 | Property Type - Subtype: | Hotel – Resort | |
| % of Pool by IPB: | 5.8% | Net Rentable Area (Rooms): | 160 | |
| Loan Purpose: | Refinance | Location: | Scottsdale, AZ | |
| Borrower: | CP Boulders, LLC | Year Built / Renovated: | 1985 / 2015-2016 | |
| Sponsors: | Columbia Sussex Corporation; CSC Holdings, LLC | Occupancy / ADR / RevPAR: | 73.8% / $244.24 / $180.23 | |
| Interest Rate: | 5.4800% | Occupancy / ADR / RevPAR Date: | 6/30/2017 | |
| Note Date: | 8/31/2017 | Number of Tenants: | N/A | |
| Maturity Date: | 9/6/2022 | 2014 NOI: | $3,428,221 | |
| Interest-only Period: | 0 Months | 2015 NOI: | $8,101,115 | |
| Original Term: | 60 months | 2016 NOI: | $8,767,694 | |
| Original Amortization: | 360 months | TTM NOI(4): | $9,388,998 | |
| Amortization Type: | Balloon | UW Occupancy / ADR / RevPAR: | 73.8% / $244.24 / $180.23 | |
| Call Protection(2): | L(24),Def(32),O(4) | UW Revenues: | $40,823,938 | |
| Lockbox(3): | Hard | UW Expenses: | $31,183,660 | |
| Additional Debt: | Yes | UW NOI: | $9,640,278 | |
| Additional Debt Balance: | $23,000,000 | UW NCF: | $8,007,320 | |
| Additional Debt Type: | Pari Passu | Appraised Value / Per Room: | $130,300,000 / $814,375 | |
| Additional Future Debt Permitted: | No | Appraisal Date: | 7/6/2017 |
��
| Escrows and Reserves(5) | Financial Information(1) | |||||
| Initial | Monthly | Initial Cap | Cut-off Date Loan / Room: | $456,250 | ||
| Taxes: | $73,769 | $59,673 | N/A | Maturity Date Loan / Room: | $423,733 | |
| Insurance: | $167,878 | $18,780 | N/A | Cut-off Date LTV: | 56.0% | |
| FF&E: | $136,080 | $136,080 | N/A | Maturity Date LTV: | 52.0% | |
| Seasonality Reserve: | $300,000 | Springing | Various | UW NOI DSCR: | 1.94x | |
| UW NCF Debt Yield: | 1.61x | |||||
| UW NOI Debt Yield: | 13.2% | |||||
| UW NCF Debt Yield: | 11.0% |
| Sources and Uses | ||||||
| Sources | Proceeds | % of Total | Uses | Proceeds | % of Total | |
| Whole Mortgage Loan | $73,000,000 | 100.0% | Payoff Existing Debt | $53,826,337 | 73.7% | |
| Return of Equity | 17,231,263 | 23.6 | ||||
| Closing Costs | 1,264,673 | 1.7 | ||||
| Upfront Reserves | 677,727 | 0.9 | ||||
| Total Sources | $73,000,000 | 100.0% | Total Uses | $73,000,000 | 100.0% |
| (1) | The Boulders Resort & Spa loan is part of a larger split whole loan evidenced by twopari passu notes with an aggregate original principal balance of $73.0 million (collectively, “The Boulders Resort & Spa Whole Loan”). The financial information presented in the chart above reflects the cut-off date balance of the Boulders Resort & Spa Whole Loan. |
| (2) | The lockout period will be at least 24 payments beginning with and including the first payment date of October 6, 2017. Defeasance of the full $73.0 million of The Boulders Resort & Spa Whole Loan is permitted at any time after the earlier to occur of (i) August 31, 2021 or (ii) the date that is two years after the closing date of the securitization that includes the last note to be securitized. |
THE INFORMATION IN THIS COLLATERAL TERM SHEET IS NOT COMPLETE AND MAY BE AMENDED PRIOR TO THE TIME OF SALE. THIS TERM SHEET IS NOT AN OFFER TO SELL THESE SECURITIES AND IT IS NOT A SOLICITATION OF AN OFFER TO BUY THESE SECURITIES IN ANY JURISDICTION WHERE THE OFFER OR SALE IS NOT PERMITTED.
91
Mortgage Loan No. 5 — The Boulders Resort & Spa
| (3) | For a more detailed description of lockbox, please refer to “Lockbox / Cash Management” below. |
| (4) | Represents the trailing twelve month period ending June 30, 2017. |
| (5) | For a more detailed description of Escrows and Reserves, please refer to “Escrows and Reserves” below. |
The Loan. The Boulders Resort & Spa loan, which is part of a larger split whole loan, is secured by a first mortgage lien on a 160-room, luxury resort hotel property located in Scottsdale, Arizona. The Boulders Resort & Spa Whole Loan has an outstanding principal balance of $73.0 million, which is evidenced by two notes identified as Note A-1 and Note A-2. Note A-1, which is the controlling note and has an outstanding principal balance as of the Cut-off Date of $50.0 million, is being contributed to the CSAIL 2017-CX9 Commercial Mortgage Trust. Note A-2, which has an outstanding principal balance as of the Cut-off Date of $23.0 million is expected to be contributed to a future securitization. The Boulders Resort & Spa Whole Loan is expected to be serviced pursuant to the CSAIL 2017-CX9 pooling and servicing agreement. As the holder of Note A-1 (the “Controlling Noteholder”), the trustee of the CSAIL 2017-CX9 Commercial Mortgage Trust (or, prior to the occurrence and continuance of a control termination event under the CSAIL 2017-CX9 pooling and servicing agreement, the CSAIL 2017-CX9 directing certificateholder) is entitled to exercise all of the rights of the Controlling Noteholder with respect to The Boulders Resort & Spa Whole Loan; however, the holder of Note A-2 is entitled, under certain circumstances, to consult with respect to certain major decisions. The loan has a 5-year term and amortizes on a 30-year schedule.
Whole Loan Note Summary
| Original Balance | Cut-off Date Balance | Note Holder | Lead Servicer for Whole Loan (Y/N) | Controlling Piece (Y/N) | |
| Note A-1 | $50,000,000 | $50,000,000 | CSAIL 2017-CX9 | Y | Y |
| Note A-2 | 23,000,000 | 23,000,000 | Column | N | N |
| Total | $73,000,000 | $73,000,000 |
The Borrower. The borrowing entity for the loan is CP Boulders, LLC, a Delaware limited liability company and special purpose entity.
The Sponsor. The loan’s sponsors and nonrecourse carve-out guarantors are Columbia Sussex Corporation and CSC Holdings, LLC. Columbia Sussex Corporation was founded by William J. Yung III in 1972 with one hotel, and currently owns a portfolio of 38 Hilton, Marriott, and Starwood brand hotels in 22 states.
The Property. The property is a 160-room, Curio Collection by Hilton branded, Southwest Adobe style, full-service, luxury resort located on 361.7 acres in northern Scottsdale, Arizona. The property anchors the larger 1,300 acre master planned Boulders development, a high-end resort community in the northeast Phoenix metropolitan statistical area (“MSA”). The property has recently garnered several awards, including, Best Hotels in the USA (US News & World Reports), Best Hotel in Arizona (Travel + Leisure Magazine for 2017), Top 25 U.S. Resorts (Golf Digest), Top 50 Tennis Resorts in America (TENNIS Magazine), and Top 50 Resort Spa (Conde Nast Traveler). The property was built in 1985 and renovated from 2015 to 2016, which included renovating all guestrooms, upgrading common areas, renovating the main lodge and spa, expansion of the Grill Restaurant’s outdoor seating and additional amenity areas. Capital expenditures at the property were approximately $16.2 million or $101,319 per room since the sponsor’s acquisition in April 2015.
The property features 160 casita style guestrooms (550 SF each) in 90 one- and two-story buildings, with amenities including five dining outlets, a main lodge, 34,453 SF of indoor and 46,710 SF of outdoor meeting space, a 33,000 SF spa with 24 treatment rooms and café, a 2,000 SF fitness facility, an adult pool, two championship award-winning golf courses, golf clubhouse and pro-shop, a terraced tennis garden with eight courts of three different surface types, three outdoor pools, business center, gift shop, and the 81,791 SF El Pedregal center with a mix of meeting facilities, retail and dining and an outdoor event amphitheater. The recently renovated guestrooms offer Southwestern accents and wood-burning fireplaces, wood-beamed ceilings, four- and five- fixture bathrooms with natural stone showers, 42” HD TVs, sitting areas, ceiling fans, WiFi, and patios or balconies. Recreational activities offered by the hotel include hiking, biking, rock climbing, fishing, and sight-seeing tours.
THE INFORMATION IN THIS COLLATERAL TERM SHEET IS NOT COMPLETE AND MAY BE AMENDED PRIOR TO THE TIME OF SALE. THIS TERM SHEET IS NOT AN OFFER TO SELL THESE SECURITIES AND IT IS NOT A SOLICITATION OF AN OFFER TO BUY THESE SECURITIES IN ANY JURISDICTION WHERE THE OFFER OR SALE IS NOT PERMITTED.
92
Mortgage Loan No. 5 — The Boulders Resort & Spa
The 1,300-acre master planned community contains privately owned single family homes along with luxury one, two and three bedroom Villas and Haciendas (the “Villas”), which are owned (fee simple) by third-parties (the “Owners”) that are able to participate in a Rental Management Program (the “Program”), whereby the borrower rents the Villas as hotel rooms on their behalf. Currently 55 Villas and 7 Haciendas (62 total) participate in the Program, and the participant total has been stable since 1999. The Owners must commit to a minimum 12-month rental term, which automatically renews at expiration on a month-to-month basis unless terminated. During the November-April high season, Owners are restricted to 30 days of use. The rental income is split 52.5% / 47.5% in favor of the borrower. The Owners are responsible for real estate taxes, insurance and utilities and the borrower is responsible for maid and minor maintenance service, plus property management. The 62 Villas contributed approximately $3.02 million or 7.4% of total revenues for the TTM ending June 30, 2017. Villas and Hacienda owners and renters have access to all resort amenities which are detailed further below.
Amenities at the property includes two championship, 18-hole, Jay Morrish designed, semi-public golf courses developed in 1997 which were constructed to USGA specifications. The course greens are situated amongst boulder formations, rock outcroppings, and natural terrain. Practice facilities include a driving range, putting/chipping green, and practice bunker. The golf clubhouse building contains the Grill Restaurant and Bar, clubhouse, underground parking, pro shop with cart and equipment rentals, retail store, and maintenance/storage space.
El Pedregal center is an 81,791 SF, mixed-use, open-air center with three two-story buildings surrounding a central courtyard. The centerpiece is the 1,200-square foot Courtyard Stage, an expansive amphitheater with a professional raised stage primarily used to host concerts, cultural and charity events. The Tohono Conference Center is located in El Pedregal and includes a 5,370 SF ballroom and breakout space. Additional specialty retail and the Spotted Donkey restaurant are located in El Pedregal. The property has a total of 1,148 surface parking spaces.
��
The property is located on North Tom Darlington Drive with 7,500 feet of frontage. The landscape consists of high desert with large boulder outcroppings and moderate slopes. Traffic within the resort is restricted to enhance the setting and serenity of guests, who can walk on paved paths or request rides in employee-driven golf carts. The 1,300 acre site is bounded by Stagecoach Pass Road (north), E. Westland Road (south), N. Tom Darlington Drive (west), and N. Hayden Rd./N. 79th Way/N. Indian Camp Trail/Ironwood Rd./N. Boulder Dr. to the east. Approximately one third of the master planned community is within the city of Carefree. The elevation of Carefree is approximately 2,400 feet above sea level, compared to approximately 1,100 feet for Phoenix.
Historical Occupancy, ADR, RevPAR(1)
Competitive Set | The Boulders Resort & Spa(2) | Penetration Factor | |||||||
| Year | Occupancy | ADR | RevPAR | Occupancy | ADR | RevPAR | Occupancy | ADR | RevPAR |
| 2014 | 69.0% | $252.01 | $173.90 | 67.7% | $242.78 | $164.26 | 98.1% | 96.3% | 94.5% |
| 2015 | 70.5% | $261.74 | $184.61 | 61.7% | $251.84 | $155.41 | 87.5% | 96.2% | 84.2% |
| 2016 | 67.4% | $269.86 | $181.86 | 75.0% | $234.34 | $175.81 | 111.3% | 86.8% | 96.7% |
| TTM(3) | 66.7% | $280.76 | $187.32 | 73.8% | $244.24 | $180.23 | 110.6% | 87.0% | 96.2% |
| (1) | Source: third party data provider. The competitive set consists of the following hotels: JW Marriott Camelback Inn Scottsdale Resort & Spa, Waldorf Astoria Arizona Biltmore, The Wigwam, The Unbound Collection, Royal Palms Resort & Spa, Hyatt Regency @ Gainey Ranch, Fairmont Scottsdale Princess, Luxury Collection The Phoenician and Four Seasons Resort Scottsdale @ Troon North. |
| (2) | Source: Borrower provided financials. |
| (3) | Represents the trailing twelve month period ending June 30, 2017. |
THE INFORMATION IN THIS COLLATERAL TERM SHEET IS NOT COMPLETE AND MAY BE AMENDED PRIOR TO THE TIME OF SALE. THIS TERM SHEET IS NOT AN OFFER TO SELL THESE SECURITIES AND IT IS NOT A SOLICITATION OF AN OFFER TO BUY THESE SECURITIES IN ANY JURISDICTION WHERE THE OFFER OR SALE IS NOT PERMITTED.
93
Mortgage Loan No. 5 — The Boulders Resort & Spa
The Market. The property is located in the northern end portion of the City of Scottsdale, Maricopa County, Arizona, within the Phoenix-Mesa-Glendale MSA which has a 2017 population of approximately 4.7 million. The property is situated approximately 20 miles north of downtown Scottsdale, and 25 miles northeast of downtown Phoenix, the capital of Arizona. The MSA has a strong transportation network, which includes interstates 10 and 17, six freeways (51, 60, 101, 143, 202, 303), bus service, and the approximately $1.4 billion, 35-station, light rail system that connects Phoenix, Tempe and Mesa, which served 15.5 million riders in 2016. According to the appraisal, the system is expected to expand to 66-miles by 2034. According to the appraisal, the Phoenix Sky Harbor International Airport is the 10th busiest in the U.S. and served 44 million passengers in 2015, a 4.4% increase over 2014. The airport is connected to the light rail system via the Phoenix Sky Train.
Scottsdale is situated in the Salt River Valley or “Valley of the Sun” in the northern Sonoran Desert. The city is bordered by Paradise Valley and Phoenix to the west, Fountain Hills, the Salt River Indian Reservation and the Tonto National Forest on the east, the Salt River and Tempe to the south, and Carefree, Cave Creek and the Tonto National Forest to the north. Development in Scottsdale has occurred in a northerly direction due to manmade and natural barriers, and its remoteness has resulted in mostly master planned communities.
The appraiser identified eight comparable rental properties, ranging from 119 rooms to 750 rooms that were most recently renovated between 2008 and 2017. The average 2016 occupancy and ADR achieved by these properties was roughly 68% and $268.23, respectively. The properties in the appraisal’s competitive set are all located in Scottsdale area and are shown in the below table.
Competitive Hotels Profile(1)
Estimated Market Mix | 2016 Estimated Operating Statistics | ||||||||
| Property | Rooms | Year Built / Renovated | Meeting Space (SF) | Corp. Individual | Meeting & Group | Leisure | Occupancy | ADR | RevPAR |
| The Boulders Resort & Spa | 160 | 1985 / 2016 | 34,453 | 3% | 45% | 52% | 75% | $234.34 | $176.29 |
| JW Marriott Camelback Inn Scottsdale Resort & Spa | 453 | 1936 / 2008 | 33,559 | 5% | 50% | 45% | 70% - 75% | $235 - $245 | $170 - $180 |
| Four Seasons Resort Scottsdale at Troon North | 210 | 1999 / 2014 | 20,000 | 3% | 40% | 57% | 75% - 80% | $390 - $400 | $305 - $315 |
| The Phoenician | 643 | 1988 / 2017 | 64,000 | 3% | 50% | 47% | 60% - 65% | $330 - $340 | $195 - $205 |
| Fairmont Scottsdale Princess | 750 | 1988 / 2012 | 72,000 | 5% | 50% | 45% | 70% - 75% | $265 - $275 | $185 - $195 |
| Hyatt Regency Resort and Spa at Gainey Ranch | 493 | 1986 / 2008 | 35,000 | 5% | 40% | 55% | 70% - 75% | $240 - $250 | $165 - $175 |
| Royal Palms Resort & Spa | 119 | 1929 / 2012 | 20,000 | 5% | 40% | 55% | 70% - 75% | $280 - $290 | $205 - $215 |
| Arizona Biltmore Resort and Spa | 736 | 1929 / 2016 | 100,000 | 5% | 50% | 45% | 60% - 65% | $245 - $255 | $155 - $165 |
| Wigwam Resort & Spa | 331 | 1929 / 2015 | 45,000 | 5% | 40% | 55% | 60% - 65% | $170 - $180 | $110 - $115 |
| Total(2) | 3,735 | ||||||||
(1) | Source: Appraisal. |
| (2) | Excludes the subject property. |
THE INFORMATION IN THIS COLLATERAL TERM SHEET IS NOT COMPLETE AND MAY BE AMENDED PRIOR TO THE TIME OF SALE. THIS TERM SHEET IS NOT AN OFFER TO SELL THESE SECURITIES AND IT IS NOT A SOLICITATION OF AN OFFER TO BUY THESE SECURITIES IN ANY JURISDICTION WHERE THE OFFER OR SALE IS NOT PERMITTED.
94
Mortgage Loan No. 5 — The Boulders Resort & Spa
Operating History and Underwritten Net Cash Flow
| 2014 | 2015 | 2016 | TTM(1) | Underwritten | Per Room(2) | %(3) | |
| Occupancy | 67.7% | 61.7% | 75.0% | 73.8% | 73.8% | ||
| ADR | $242.78 | $251.84 | $234.34 | $244.24 | $244.24 | ||
| RevPAR | $164.26 | $155.41 | $175.81 | $180.23 | $180.23 | ||
| Rooms Revenue | $9,592,548 | $9,075,977 | $10,295,459 | $10,525,442 | $10,525,442 | $65,784 | 25.8% |
| Villas Revenue | 2,559,017 | 3,016,075 | 2,812,538 | 3,020,510 | 3,020,510 | 18,878 | 7.4% |
| Food & Beverage Revenue | 12,706,299 | 12,753,905 | 11,932,163 | 12,485,904 | 12,485,904 | 78,037 | 30.6% |
| Spa Revenue | 3,595,131 | 4,011,423 | 3,939,636 | 3,915,692 | 3,915,692 | 24,473 | 9.6% |
| Golf Revenue | 8,655,851 | 8,325,677 | 8,287,690 | 8,511,319 | 8,511,319 | 53,196 | 20.8% |
| Other Revenue | 3,047,192 | 3,358,347 | 2,443,516 | 2,365,071 | 2,365,071 | 14,782 | 5.8% |
| Total Revenue | $40,156,038 | $40,541,404 | $39,711,002 | $40,823,938 | $40,823,938 | $255,150 | 100.0% |
| Rooms Expense | 4,487,156 | 5,042,620 | 4,593,772 | 4,515,013 | 4,515,013 | 28,219 | 42.9% |
| Villas Expense | 537,437 | 76,292 | 390,096 | 366,007 | 366,007 | 2,288 | 12.1% |
| Food & Beverage Expense | 9,414,944 | 8,003,690 | 7,428,344 | 7,606,589 | 7,606,589 | 47,541 | 60.9% |
| Spa Expense | 2,831,797 | 2,881,554 | 3,070,655 | 3,014,940 | 3,014,940 | 18,843 | 77.0% |
| Golf Expense | 5,694,862 | 5,130,828 | 5,295,086 | 5,387,974 | 5,387,974 | 33,675 | 63.3% |
| Other Departmental Expense | 1,207,496 | 970,644 | 828,938 | 783,476 | 783,476 | 4,897 | 33.1% |
| Departmental Expenses | $24,173,692 | $22,105,628 | $21,606,891 | $21,674,000 | $21,674,000 | $135,463 | 53.1% |
| Departmental Profit | $15,982,346 | $18,435,776 | $18,104,111 | $19,149,938 | $19,149,938 | $119,687 | 46.9% |
| Operating Expenses | $11,163,981 | $8,736,451 | $7,738,149 | $8,123,888 | $8,189,957 | $51,187 | 20.1% |
| Gross Operating Profit | $4,818,365 | $9,699,325 | $10,365,962 | $11,026,050 | $10,959,981 | $68,500 | 26.8% |
| Fixed Expenses(4) | 1,390,144 | 1,598,210 | 1,598,268 | 1,637,052 | 1,319,704 | 8,248 | 3.2% |
| Net Operating Income | $3,428,221 | $8,101,115 | $8,767,694 | $9,388,998 | $9,640,278 | $60,252 | 23.6% |
| FF&E | 1,606,242 | 1,621,656 | 1,588,440 | 1,632,958 | 1,632,958 | 10,206 | 4.0% |
| Net Cash Flow | $1,821,980 | $6,479,459 | $7,179,254 | $7,756,041 | $8,007,320 | $50,046 | 19.6% |
| (1) | The TTM column represent the trailing twelve month period ending June 30, 2017. |
| (2) | Per room values are based on 160 available rooms. |
| (3) | % column represents percent of Total Revenue except for Rooms Expense, Villas Expense, Food & Beverage Expense, Spa Expense, Golf Expense and Other Department Expense, which are based on their corresponding revenue line items. |
| (4) | Underwritten fixed expenses are lower primarily due to the property previously incurring higher expenses for the leasing of golf carts. The property now owns a portion of its golf carts which reduces previous expenses. |
Property Management. The property is managed by Columbia Sussex Management, LLC, an affiliate of the sponsors under an agreement through April 2035.
Escrows and Reserves. At origination, the borrower deposited a total of $677,727 into escrows; $300,000 for seasonality reserve, $167,878 for insurance reserve, $136,080 for FF&E reserve and $73,769 for tax reserve.
Seasonality Reserve – At origination, the borrower made an initial seasonality reserve deposit of $300,000. Commencing on the payment date occurring in February 2018 and on each payment date thereafter which occurs during a Seasonality Trigger Period (as defined below) the borrower is required to escrow all excess cash flow, subject to the Seasonality Reserve Cap (as defined below).
A “Seasonality Trigger Period” shall mean the period commencing with the payment date occurring in February of each calendar year and expiring upon the date on which the balance equals or exceeds the Seasonality Reserve Cap.
THE INFORMATION IN THIS COLLATERAL TERM SHEET IS NOT COMPLETE AND MAY BE AMENDED PRIOR TO THE TIME OF SALE. THIS TERM SHEET IS NOT AN OFFER TO SELL THESE SECURITIES AND IT IS NOT A SOLICITATION OF AN OFFER TO BUY THESE SECURITIES IN ANY JURISDICTION WHERE THE OFFER OR SALE IS NOT PERMITTED.
95
Mortgage Loan No. 5 — The Boulders Resort & Spa
The “Seasonality Reserve Cap” shall mean an amount equal to the product of (a) the sum of the absolute value of each monthly shortfall in net cash flow, less debt service due for each such calendar month over the trailing 12 month period, to be calculated by lender as of the end of each calendar year and (b) 105%.
Insurance Escrows – On a monthly basis, the borrower is required to escrow 1/12th of the annual estimated insurance payments, which currently equates to $18,780.
FF&E Reserve – On a monthly basis, the borrower is required to escrow an amount equal to the greater of (a) 1/12th of 4.0% of gross income from operations for the property over the trailing twelve month period, which currently equates to $136,080 and (b) the amount required to be deposited into the reserve as defined in the management agreement (up to 4.0% of gross revenues).
Tax Escrows – On a monthly basis, the borrower is required to escrow 1/12th of the annual estimated tax payments, which currently equates to $59,673.
Lockbox / Cash Management. The loan is structured with a hard lockbox and in-place cash management. The property manager will send tenant direction letters to instruct tenants and credit card companies to deposit all rental, credit card deposits and other income directly into the lockbox account controlled by the lender. All funds in the lockbox account are swept daily to a cash management account under the control of the lender and disbursed daily during each interest period of the term of the loan in accordance with the loan documents. During the continuance of a Cash Sweep Event (as defined below), all excess cash flow, after payments made in accordance with the loan documents for, amongst other things, debt service, required reserves and operating expenses, will be held as additional collateral for the loan.
“Cash Sweep Event” means: (i) an event of default, (ii) any bankruptcy action of the borrower or manager or (iii) the debt yield on the mortgage loan is less than 9.25%.
THE INFORMATION IN THIS COLLATERAL TERM SHEET IS NOT COMPLETE AND MAY BE AMENDED PRIOR TO THE TIME OF SALE. THIS TERM SHEET IS NOT AN OFFER TO SELL THESE SECURITIES AND IT IS NOT A SOLICITATION OF AN OFFER TO BUY THESE SECURITIES IN ANY JURISDICTION WHERE THE OFFER OR SALE IS NOT PERMITTED.
96
(THIS PAGE INTENTIONALLY LEFT BLANK)
97
Mortgage Loan No. 6 — Hilton Glendale

THE INFORMATION IN THIS COLLATERAL TERM SHEET IS NOT COMPLETE AND MAY BE AMENDED PRIOR TO THE TIME OF SALE. THIS TERM SHEET IS NOT AN OFFER TO SELL THESE SECURITIES AND IT IS NOT A SOLICITATION OF AN OFFER TO BUY THESE SECURITIES IN ANY JURISDICTION WHERE THE OFFER OR SALE IS NOT PERMITTED.
98
Mortgage Loan No. 6 — Hilton Glendale

THE INFORMATION IN THIS COLLATERAL TERM SHEET IS NOT COMPLETE AND MAY BE AMENDED PRIOR TO THE TIME OF SALE. THIS TERM SHEET IS NOT AN OFFER TO SELL THESE SECURITIES AND IT IS NOT A SOLICITATION OF AN OFFER TO BUY THESE SECURITIES IN ANY JURISDICTION WHERE THE OFFER OR SALE IS NOT PERMITTED.
99
Mortgage Loan No. 6 — Hilton Glendale
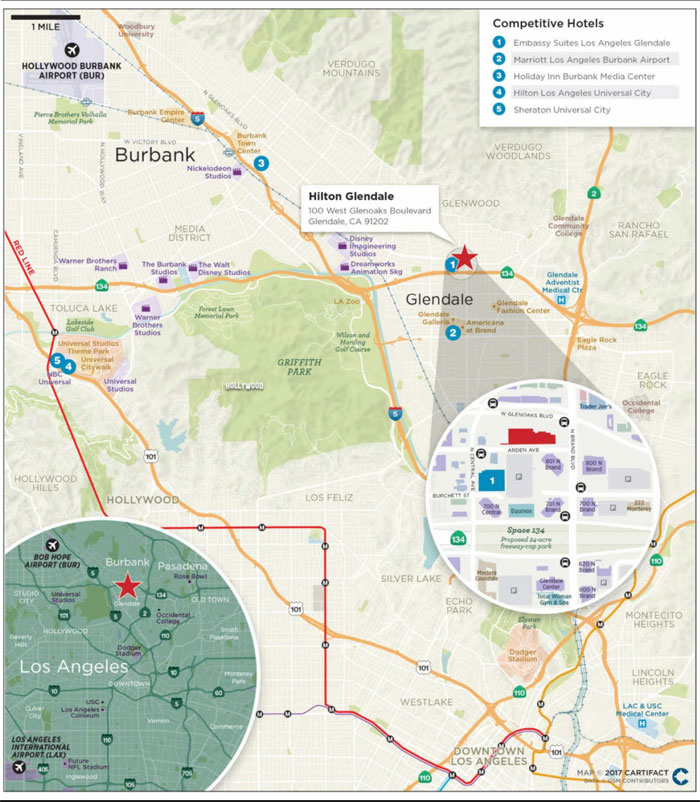
THE INFORMATION IN THIS COLLATERAL TERM SHEET IS NOT COMPLETE AND MAY BE AMENDED PRIOR TO THE TIME OF SALE. THIS TERM SHEET IS NOT AN OFFER TO SELL THESE SECURITIES AND IT IS NOT A SOLICITATION OF AN OFFER TO BUY THESE SECURITIES IN ANY JURISDICTION WHERE THE OFFER OR SALE IS NOT PERMITTED.
100
Mortgage Loan No. 6 — Hilton Glendale
| Mortgage Loan Information | Property Information |
| Mortgage Loan Seller: | Column | Single Asset / Portfolio: | Single Asset | |
| Original Principal Balance: | $47,250,000 | Title: | Fee | |
| Cut-off Date Principal Balance: | $47,204,053 | Property Type - Subtype: | Hotel - Full Service | |
| % of Pool by IPB: | 5.5% | Net Rentable Area (Rooms): | 351 | |
| Loan Purpose: | Acquisition | Location: | Glendale, CA | |
| Borrower: | NA Glendale, LLC | Year Built / Renovated: | 1992 / 2016 | |
| Sponsors: | Kam Sang Company, Inc.; Ronnie Lam | Occupancy / ADR / RevPAR: | 83.9% / $167.03 / $140.19 | |
| Interest Rate: | 4.9111111% | Occupancy / ADR / RevPAR Date: | 7/31/2017 | |
| Note Date: | 7/13/2017 | Number of Tenants: | N/A | |
| Maturity Date: | 8/6/2022 | 2014 NOI: | $3,883,511 | |
| Interest-only Period: | 0 months | 2015 NOI: | $5,166,275 | |
| Original Term: | 60 months | 2016 NOI: | $6,085,338 | |
| Original Amortization(1): | 360 months | TTM NOI(4): | $5,388,082 | |
| Amortization Type: | Balloon | UW Occupancy / ADR / RevPAR: | 83.9% / $167.03 / $140.19 | |
| Call Protection: | L(25),Def(31),O(4) | UW Revenues: | $24,959,643 | |
| Lockbox(2): | Hard | UW Expenses: | $18,539,491 | |
| Additional Debt(3): | Yes | UW NOI: | $6,420,152 | |
| Additional Debt Balance(3): | $5,244,895 | UW NCF: | $5,421,766 | |
| Additional Debt Type(3): | Mezzanine | Appraised Value / Per Room: | $74,500,000 / $212,251 | |
| Additional Future Debt Permitted: | No | Appraisal Date: | 6/20/2017 |
| Escrows and Reserves(5) | Financial Information |
| Initial | Monthly | Initial Cap | Cut-off Date Loan / Room: | $134,484 | ||
| Taxes: | $760,488 | $108,641 | N/A | Maturity Date Loan / Room: | $124,829 | |
| Insurance: | $40,111 | $10,028 | N/A | Cut-off Date LTV: | 63.4% | |
| FF&E Reserves: | $82,870 | $82,870 | N/A | Maturity Date LTV: | 58.8% | |
| Engineering Reserve: | $5,500 | $0 | N/A | UW NOI DSCR: | 2.17x | |
| UW NCF DSCR: | 1.83x | |||||
| UW NOI Debt Yield: | 13.6% | |||||
| UW NCF Debt Yield: | 11.5% |
Sources and Uses
| Sources | Proceeds | % of Total | Uses | Proceeds | % of Total | |
| Mortgage Loan | $47,250,000 | 62.5% | Purchase Price | $74,000,000 | 97.9% | |
| Mezzanine Loan | 5,250,000 | 6.9 | Upfront Reserves | 888,969 | 1.2 | |
| Sponsor Equity | 23,058,672 | 30.5 | Closing Costs | 669,703 | 0.9 | |
| Total Sources | $75,558,672 | 100.0% | Total Uses | $75,558,672 | 100.0% |
| (1) | The Hilton Glendale loan is structured with a fixed amortization schedule based on an approximately 360-month amortization period. For more information see “Description of the Mortgage Pool - The Whole Loans” in the Preliminary Prospectus. |
| (2) | For a more detailed description of the lockbox, please refer to “Lockbox / Cash Management” below. |
| (3) | The Hilton Glendale loan is accompanied by a mezzanine loan with a cut-off date balance of approximately $5.24 million. The financial information presented in the chart above and herein reflects the cut-off date balance of the $47,204,053 senior note. For a more detailed description of the additional debt, please refer to “Additional Debt” below. |
| (4) | Represents the trailing twelve month period ending July 31, 2017. |
THE INFORMATION IN THIS COLLATERAL TERM SHEET IS NOT COMPLETE AND MAY BE AMENDED PRIOR TO THE TIME OF SALE. THIS TERM SHEET IS NOT AN OFFER TO SELL THESE SECURITIES AND IT IS NOT A SOLICITATION OF AN OFFER TO BUY THESE SECURITIES IN ANY JURISDICTION WHERE THE OFFER OR SALE IS NOT PERMITTED.
101
Mortgage Loan No. 6 — Hilton Glendale
| (5) | For a more detailed description of Escrows and Reserves, please refer to “Escrows and Reserves” below. |
The Loan. The Hilton Glendale loan is a $47.25 million first mortgage loan secured by the fee interest in a 351-room full-service hotel property located in Glendale, California. The loan has a five-year term and will amortize on a fixed amortization schedule.
The Borrower. The borrowing entity for the loan is NA Glendale, LLC, a Delaware limited liability company and special purpose entity.
The Sponsors. The loan’s sponsors and nonrecourse carve-out guarantors are Kam Sang Company, Inc. and Ronnie Lam. Kam Sang Company, Inc., established in 1979 by current President and CEO Ronnie Lam, owns hospitality, retail, residential, restaurants, and mixed-use properties. In total, the Kam Sang Company, Inc. owns 1,248 rooms in California and Nevada.
The Property. The property is a 351-room, full-service hotel located in Glendale, California. The property is 18 stories (19 including the Skyline Lounge meeting space) and was constructed in 1992. The property underwent a comprehensive renovation of approximately $9.7 million which was completed in 2016. Major areas of upgrade included the meeting space, public restrooms, guestrooms & bathrooms, guest bathrooms, corridors & elevator lobbies, lobby & lobby lounge, and restaurant/bar/lounge. Additionally, the loan’s sponsors plan to invest approximately $953,000 through April 2018 for a change-in-ownership PIP that will include new desks, dressers, nightstands, new televisions, bathroom lighting and mirror replacements. Upon completion of the change-in ownership PIP, the property will have received approximately $10.6 million ($30,318/room) in capital improvements since 2014.
The unit mix at the property consists of 163 king units, 127 double units, 48 queen units, eight one-bedroom suites, three two-bedroom suites, and two presidential suites. Amenities at the property include one food and beverage outlet, 17,786 SF of meeting space, a fitness center, a business center, an outdoor swimming pool, and a gift shop. The food and beverage outlet, Amuse Restaurant & Bar, has recently undergone a complete renovation and is located adjacent to the main lobby. The 17,786 SF of meeting space consists primarily of the 8,052 SF Grand Ballroom, a smaller 2,800 SF Brand Ballroom, and nine additional spaces. The property has a 547-space subterranean parking garage with valet services as well as self-parking.
The property is located along West Glenoaks Boulevard on a 1.8-acre lot between North Brand Boulevard and North Central Avenue. The property is located at a busy intersection proximate to the Ventura Freeway, State Route 134, which is the nearest major highway. Nearby airports include Hollywood Burbank Airport (5 miles), the Van Nuys Regional Airport (12 miles) and Los Angeles International Airport (15 miles).
The area benefits from several major demand drivers including the Glendale Galleria Mall (GGP, 1 mile), Griffith Observatory (2 miles), the Los Angeles Zoo (3 miles), the Rose Bowl Stadium (4 miles), ABC Studios (5 miles), Warner Brothers Studios (5 miles), Dodger Stadium (6 miles), Universal Studios Hollywood (7 miles), the LA Convention Center (10 miles) and Hollywood (10 miles).
The property is located along Arden Avenue between N. Brand and N. Central Avenue. The primary Glendale office market is situated along N. Brand and N. Central Avenue immediately south the property and extending south of the Ventura Freeway, contributing to the corporate demand at the property.
THE INFORMATION IN THIS COLLATERAL TERM SHEET IS NOT COMPLETE AND MAY BE AMENDED PRIOR TO THE TIME OF SALE. THIS TERM SHEET IS NOT AN OFFER TO SELL THESE SECURITIES AND IT IS NOT A SOLICITATION OF AN OFFER TO BUY THESE SECURITIES IN ANY JURISDICTION WHERE THE OFFER OR SALE IS NOT PERMITTED.
102
Mortgage Loan No. 6 — Hilton Glendale
Historical Occupancy, ADR, RevPAR(1)
Competitive Set | Hilton Glendale(2) | Penetration Factor | |||||||
| Year | Occupancy | ADR | RevPAR | Occupancy | ADR | RevPAR | Occupancy | ADR | RevPAR |
| 2014 | 81.4% | $160.30 | $130.42 | 81.3% | $153.68 | $124.93 | 99.9% | 95.9% | 95.8% |
| 2015 | 83.1% | $171.36 | $142.43 | 84.4% | $156.89 | $132.46 | 101.6% | 91.6% | 93.0% |
| 2016 | 84.3% | $204.06 | $171.94 | 84.1% | $175.97 | $148.01 | 99.8% | 86.2% | 86.1% |
| TTM(3) | 79.5% | $199.83 | $158.83 | 83.9% | $167.03 | $140.19 | 105.6% | 83.6% | 88.3% |
| (1) | Source: third party data provider. The competitive set consists of the following hotels: Holiday Inn Burbank Media Center, Sheraton Hotel Pasadena, Hilton Los Angeles Universal City, Sheraton Hotel Universal City (2014 and 2015 only), Marriott Los Angeles Burbank Airport, Hilton Pasadena, Westin Pasadena, Embassy Suites Los Angeles Glendale and the Langham Huntington Pasadena (2016 and TTM only). |
| (2) | Source: Borrower provided financials. |
| (3) | Represents the trailing twelve month period ending July 31, 2017 for Hilton Glendale and the trailing twelve month period ending May 31, 2017 for the competitive set. |
The Market. The property is located in Glendale, California, within Los Angeles County, in the Los Angeles-Long Beach-Anaheim, California metropolitan statistical area (“MSA”). According to the 2016 U.S. Census, the Los Angeles MSA was the second-largest in the United States after New York. The city of Glendale attracts regional and national firms seeking a West Coast presence due to its intellectual capital, its burgeoning tech cluster in Silicon Beach, and global links through its stronghold industries of entertainment, tourism and fashion. It is home to multiple Fortune 500 companies and is the largest international trade center in the U.S., with over $200 billion in imports and exports annually. According to the appraisal, the Los Angeles MSA is one of the world's major centers of business, entertainment, international trade, culture, media, fashion, science, technology, and education. According to the appraisal, Los Angeles is known as the "Entertainment Capital of the World" because it is home to Hollywood, many famous actors, and several famous entertainment awards shows including the Oscars and Grammys.
According to the REIS, Inc. Los Angeles County recorded 2016 population of 10,208,550, indicating a 0.5% increase over the previous year, and is projected to increase to 10,507,710 by 2021. According to the U.S. Bureau of Labor Statistics, 2016 unemployment for the city and MSA was 5.1% and 4.9%, respectively; both represent the lowest unemployment since 2007.
The city of Glendale, California is located in the San Fernando Valley and is part of Los Angeles County. The city experienced significant development in the 1970s, with the completion of State Highway 2 and Interstate 134, as well as the redevelopment of Brand Boulevard and the construction of the Glendale Galleria shopping mall that opened in 1976. Glendale, along with its neighbor Burbank, has served as a major production center for the U.S. entertainment industry and the U.S. animation industry.
According to a third party data provider, the property is located within the Los Angeles/Long Beach, California lodging market. For the trailing twelve month (“TTM”) period ended May 2017, the Los Angeles/Long Beach market contained 1,015 hotels with a lodging inventory of 99,978 rooms. The Los Angeles/Long Beach lodging market achieved an aggregate occupancy level of 80.8% with an ADR of $172.16, reflecting a RevPAR of $139.13. The TTM May 2017 RevPAR of $139.13 represents an increase of 4.1% over the previous corresponding TTM period.
THE INFORMATION IN THIS COLLATERAL TERM SHEET IS NOT COMPLETE AND MAY BE AMENDED PRIOR TO THE TIME OF SALE. THIS TERM SHEET IS NOT AN OFFER TO SELL THESE SECURITIES AND IT IS NOT A SOLICITATION OF AN OFFER TO BUY THESE SECURITIES IN ANY JURISDICTION WHERE THE OFFER OR SALE IS NOT PERMITTED.
103
Mortgage Loan No. 6 — Hilton Glendale
Competitive Hotels Profile(1)
Estimated Market Mix | 2016 Estimated Operating Statistics | |||||||
| Property | Rooms | Year Built | Commercial | Leisure | Meeting & Group | Occupancy | ADR | RevPAR |
| Hilton Glendale | 351 | 1992 / 2016 | 59% | 23% | 18% | 84.3% | $175.97 | $148.41 |
| Embassy Suites Los Angeles Glendale | 272 | 2008 / 2017 | 55% | 25% | 20% | 85%-90% | $200 -$210 | $170 - $180 |
| Marriott Los Angeles Burbank Airport | 488 | 1982 / 2015 | 60% | 20% | 20% | 85%-90% | $190 - $200 | $170 - $180 |
| Holiday Inn Burbank Media Center | 484 | 1981 / 2013 | 55% | 30% | 15% | 75%-80% | $160 - $170 | $125 - $130 |
| Hilton Los Angeles Universal City | 495 | 1984 / 2014 | 40% | 40% | 20% | 85%-90% | $240 - $250 | $210 - $220 |
| Sheraton Universal City | 449 | 1969 / 2017 | 40% | 40% | 20% | 70%-75% | $220 - $230 | $150 - $160 |
| Total(2) | 2,188 | |||||||
| (1) | Source: Appraisal. |
| (2) | Excludes the subject property. |
Operating History and Underwritten Net Cash Flow
| 2014 | 2015 | 2016 | TTM(1) | Underwritten | Per Room(2) | %(3) | |
| Occupancy | 81.3% | 84.4% | 84.1% | 83.9% | 83.9% | ||
| ADR | $153.68 | $156.89 | $175.97 | $167.03 | $167.03 | ||
| RevPAR | $124.93 | $132.46 | $148.01 | $140.19 | $140.19 | ||
| Room Revenue | $16,005,134 | $16,969,485 | $19,013,722 | $17,960,788 | $17,960,788 | $51,170 | 72.0% |
| Food and Beverage | 4,227,894 | 5,379,135 | 4,985,445 | 6,033,132 | 6,033,132 | $17,188 | 24.2% |
| Other Departmental Revenues | 1,416,202 | 1,133,594 | 1,165,928 | 965,723 | 965,723 | $2,751 | 3.9% |
| Total Revenue | $21,649,230 | $23,482,214 | $25,165,095 | $24,959,643 | $24,959,643 | $71,110 | 100.0% |
| Room Expense | 4,105,755 | 4,243,066 | 4,566,947 | 4,530,633 | 4,530,633 | $12,908 | 25.2% |
| Food and Beverage Expense | 3,847,193 | 4,274,165 | 4,021,625 | 4,359,126 | 4,359,126 | $12,419 | 72.3% |
| Other Departmental Expenses | 646,600 | 139,790 | 136,932 | 137,562 | 137,562 | $392 | 14.2% |
| Departmental Expenses | $8,599,548 | $8,657,021 | $8,725,504 | $9,027,321 | $9,027,321 | $25,719 | 36.2% |
| Departmental Profit | $13,049,682 | $14,825,193 | $16,439,591 | $15,932,322 | $15,932,322 | $45,391 | 63.8% |
| Operating Expenses(4) | $7,803,836 | $7,964,230 | $8,910,977 | $8,829,178 | $8,535,415 | $24,317 | 34.2% |
| Gross Operating Profit | $5,245,846 | $6,860,963 | $7,528,614 | $7,103,144 | $7,396,907 | $21,074 | 29.6% |
| Fixed Expenses(4) | 1,362,335 | 1,694,688 | 1,443,276 | 1,715,062 | 976,755 | $2,783 | 3.9% |
| Net Operating Income(4) | $3,883,511 | $5,166,275 | $6,085,338 | $5,388,082 | $6,420,152 | $18,291 | 25.7% |
| FF&E | 865,969 | 939,289 | 1,006,604 | 970,597 | 998,386 | $2,844 | 4.0% |
| Net Cash Flow | $3,017,542 | $4,226,986 | $5,078,734 | $4,417,485 | $5,421,766 | $15,447 | 21.7% |
| (1) | The TTM column represent the trailing twelve month period ending July 31, 2017. |
| (2) | Per Room values are based on 351 available rooms. |
| (3) | % column represents percent of Total Revenue except for Room Expense, Food and Beverage and Other Department Expenses, which is based on their corresponding revenue line items. |
| (4) | The Underwritten NOI is greater than the TTM NOI primarily due underwriting lower expenses that included property taxes underwritten based on the acquisition value and the current tax rate, consistent with the appraisal (in California the subject will be reassessed based on the sale), insurance that was underwritten to the new policy premium, and a lower management fee per the new management agreement. |
Property Management. The property is managed by Merritt Hospitality, LLC, a wholly-owned management subsidiary of HEI Hospitality, LLC (“HEI”) under a management agreement through 2022. HEI owns and manages over 50 full-service, upscale, luxury, and premium select-service hotels and resorts located in large metropolitan, urban markets and destination locations, representing the world’s leading brands such as Marriott, Hilton, Embassy Suites, Westin, Le Méridien, and Sheraton.
THE INFORMATION IN THIS COLLATERAL TERM SHEET IS NOT COMPLETE AND MAY BE AMENDED PRIOR TO THE TIME OF SALE. THIS TERM SHEET IS NOT AN OFFER TO SELL THESE SECURITIES AND IT IS NOT A SOLICITATION OF AN OFFER TO BUY THESE SECURITIES IN ANY JURISDICTION WHERE THE OFFER OR SALE IS NOT PERMITTED.
104
Mortgage Loan No. 6 — Hilton Glendale
Escrows and Reserves. At origination, the borrower deposited a total of $888,969 into escrows; $760,488 for tax reserve, $82,870 for FF&E reserve, $40,111 for insurance reserve and $5,500 for deferred maintenance reserve.
Tax Escrows – On a monthly basis, the borrower is required to escrow 1/12th of the annual estimated tax payments, which currently equates to $108,641.
Insurance Escrows – On a monthly basis, the borrower is required to escrow 1/12th of the annual estimated insurance payments, which currently equates to $10,028.
FF&E Reserve – On a monthly basis, the borrower is required to escrow an amount equal to the greater of (a) 1/12th of 4.0% of gross income from operations for the property over the trailing twelve month period, which currently equates to $82,870 and (b) the amount required to be deposited into the reserve as defined in the management agreement (up to 4.0% of gross revenues).
Deferred Maintenance Reserves –The engineer identified $5,000 of deferred maintenance to repair the pool apron. At origination, the borrower was required to escrow 110% of the estimated cost of the repairs which equates to $5,500.
Lockbox / Cash Management. The Hilton Glendale loan is structured with a hard lockbox and springing cash management. The property manager will deposit all rental, credit card deposits and other income directly into the lockbox account controlled by the lender. So long as there is no Cash Sweep Event (as defined below), all funds in the lockbox account are swept daily to the borrower operating account during each interest period of the term of the loan in accordance with the loan documents. During the continuance of a Cash Sweep Event, all funds in the lockbox account are swept on a daily basis into a cash management account controlled by the lender. All excess cash flow in the cash management account, after payments made in accordance with the loan documents for, among other things, debt service, required reserves and operating expenses and mezzanine debt service, will be held as additional collateral for the loan so long as the Cash Sweep Event exists.
A “Cash Sweep Event” means: (i) an event of default (ii) any bankruptcy action of the borrower or the property manager, or (iii) the debt yield is less than 7.75%.
Additional Debt. In addition to the Hilton Glendale loan, a $5.25 million mezzanine loan was provided in connection with the financing that is secured by a pledge of the direct equity interests in the mortgage borrower and is conterminous with the mortgage loan. The mezzanine loan has a 9.5000% coupon and will amortize on a fixed amortization schedule. Including the mezzanine loan, the Cut-off Date LTV is 70.4% and the UW NOI Debt Yield is 12.2%.
THE INFORMATION IN THIS COLLATERAL TERM SHEET IS NOT COMPLETE AND MAY BE AMENDED PRIOR TO THE TIME OF SALE. THIS TERM SHEET IS NOT AN OFFER TO SELL THESE SECURITIES AND IT IS NOT A SOLICITATION OF AN OFFER TO BUY THESE SECURITIES IN ANY JURISDICTION WHERE THE OFFER OR SALE IS NOT PERMITTED.
105
Mortgage Loan No. 7 — 85 Broad Street
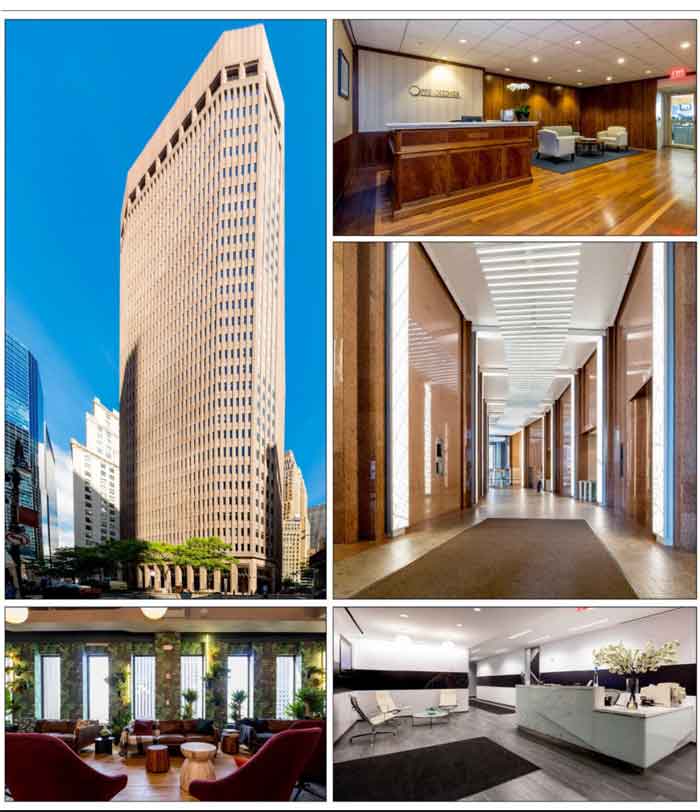
THE INFORMATION IN THIS COLLATERAL TERM SHEET IS NOT COMPLETE AND MAY BE AMENDED PRIOR TO THE TIME OF SALE. THIS TERM SHEET IS NOT AN OFFER TO SELL THESE SECURITIES AND IT IS NOT A SOLICITATION OF AN OFFER TO BUY THESE SECURITIES IN ANY JURISDICTION WHERE THE OFFER OR SALE IS NOT PERMITTED.
106
Mortgage Loan No. 7 — 85 Broad Street
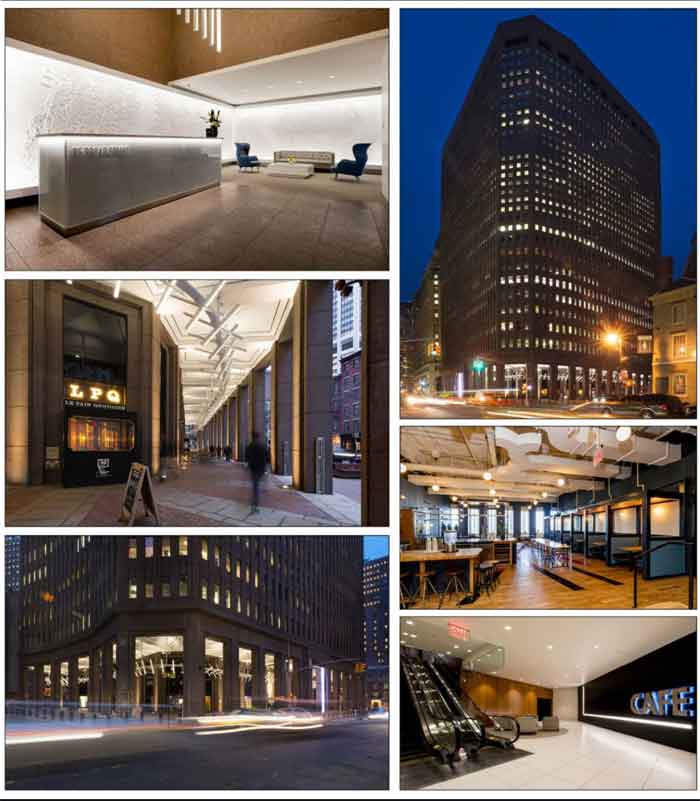
THE INFORMATION IN THIS COLLATERAL TERM SHEET IS NOT COMPLETE AND MAY BE AMENDED PRIOR TO THE TIME OF SALE. THIS TERM SHEET IS NOT AN OFFER TO SELL THESE SECURITIES AND IT IS NOT A SOLICITATION OF AN OFFER TO BUY THESE SECURITIES IN ANY JURISDICTION WHERE THE OFFER OR SALE IS NOT PERMITTED.
107

THE INFORMATION IN THIS COLLATERAL TERM SHEET IS NOT COMPLETE AND MAY BE AMENDED PRIOR TO THE TIME OF SALE. THIS TERM SHEET IS NOT AN OFFER TO SELL THESE SECURITIES AND IT IS NOT A SOLICITATION OF AN OFFER TO BUY THESE SECURITIES IN ANY JURISDICTION WHERE THE OFFER OR SALE IS NOT PERMITTED.
108
Mortgage Loan No. 7 — 85 Broad Street

THE INFORMATION IN THIS COLLATERAL TERM SHEET IS NOT COMPLETE AND MAY BE AMENDED PRIOR TO THE TIME OF SALE. THIS TERM SHEET IS NOT AN OFFER TO SELL THESE SECURITIES AND IT IS NOT A SOLICITATION OF AN OFFER TO BUY THESE SECURITIES IN ANY JURISDICTION WHERE THE OFFER OR SALE IS NOT PERMITTED.
109
Mortgage Loan No. 7 — 85 Broad Street
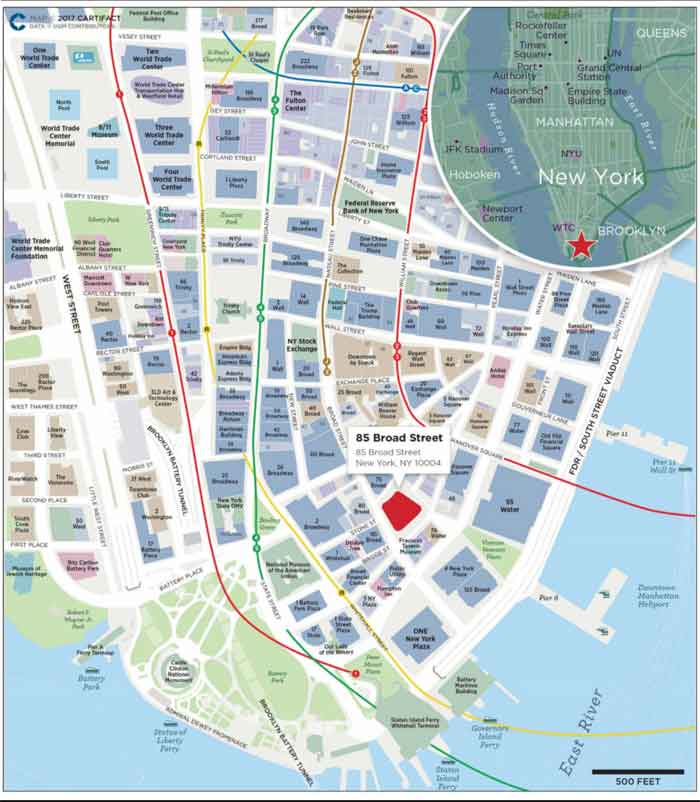
THE INFORMATION IN THIS COLLATERAL TERM SHEET IS NOT COMPLETE AND MAY BE AMENDED PRIOR TO THE TIME OF SALE. THIS TERM SHEET IS NOT AN OFFER TO SELL THESE SECURITIES AND IT IS NOT A SOLICITATION OF AN OFFER TO BUY THESE SECURITIES IN ANY JURISDICTION WHERE THE OFFER OR SALE IS NOT PERMITTED.
110
Mortgage Loan No. 7 — 85 Broad Street
| Mortgage Loan Information | Property Information | |||
| Mortgage Loan Seller: | Natixis | Single Asset / Portfolio: | Single Asset | |
| Original Principal Balance(1): | $45,000,000 | Title: | Fee | |
| Cut-off Date Principal Balance(1): | $45,000,000 | Property Type - Subtype: | Office – CBD | |
| % of Pool by IPB: | 5.2% | Net Rentable Area (SF): | 1,118,512 | |
| Credit Assessment (Fitch/KBRA)(2): | BBB-/BBB+ | Location: | New York, NY | |
| Loan Purpose: | Acquisition | Year Built / Renovated: | 1983 / 2015 | |
| Borrowers: | 85 Broad Street Property Owner LLC; 85 Broad Street TRS LLC | Occupancy: | 87.1% | |
| Sponsor: | ICR US LP | Occupancy Date: | 4/19/2017 | |
| Interest Rate: | 3.41253% | Number of Tenants: | 12 | |
| Note Date: | 5/24/2017 | 2014 NOI(5): | N/A | |
| Maturity Date: | 6/5/2027 | 2015 NOI(5): | $14,270,387 | |
| Interest-only Period: | 120 months | 2016 NOI(5): | $23,122,035 | |
| Original Term: | 120 months | TTM NOI(6): | $23,906,564 | |
| Original Amortization: | None | UW Economic Occupancy: | 86.8% | |
| Amortization Type: | Interest Only | UW Revenues: | $47,225,377 | |
| Call Protection: | L(11),YM1(16),Def or YM1(86),O(7) | UW Expenses: | $21,294,959 | |
| Lockbox(3): | Hard | UW NOI: | $25,930,418 | |
| Additional Debt(1): | Yes | UW NCF: | $24,028,948 | |
| Additional Debt Balance(1): | $313,600,000 | Appraised Value / Per SF: | $652,000,000 / $583 | |
| Additional Debt Type(1): | Pari Passu, B-Note, Mezzanine | Appraisal Date: | 4/30/2017 | |
| Additional Future Debt Permitted(4): | Yes |
| Escrows and Reserves(7) | Financial Information(1) | |||||
| Initial | Monthly | Initial Cap | Cut-off Date Loan / SF: | $151 | ||
| Taxes: | $0 | Springing | N/A | Maturity Date Loan / SF: | $151 | |
| Insurance: | $0 | Springing | N/A | Cut-off Date LTV: | 25.9% | |
| Replacement Reserves: | $0 | Springing | N/A | Maturity Date LTV: | 25.9% | |
| TI/LC: | $0 | Springing | N/A | UW NCF DSCR: | 4.43x | |
| Upfront Free Rent: | $570,850 | $0 | N/A | UW NCF DSCR: | 4.11x | |
| Upfront Unfunded Lease Obligations: | $8,170,739 | $0 | N/A | UW NOI Debt Yield: | 15.3% | |
| UW NOI Debt Yield: | 14.2% |
Sources and Uses
| Sources | Proceeds | % of Total | Uses | Proceeds | % of Total | |
| Mortgage Loan (A Notes) | $169,000,000 | 25.3% | Purchase Price | $652,000,000 | 97.7% | |
| Mortgage Loan (B Notes) | 189,600,000 | 28.4 | Upfront Reserves | 8,741,590 | 1.3 | |
| Sponsor Equity | 308,786,179 | 46.3 | Closing Costs | 6,644,590 | 1.0 | |
| Total Sources | $667,386,179 | 100.0% | Total Uses | $667,386,179 | 100.0% |
| (1) | The 85 Broad Street loan is a part of a larger split whole loan evidenced by four seniorpari passu notes and the 85 Broad Street Subordinate Companion Loans (as defined below), with an aggregate original principal balance of $358.6 million. The Financial Information presented in the chart above and herein reflects the cut-off date balance of the $169.0 million A Notes (as defined below), but not the $189.6 million 85 Broad Street Subordinate Companion Loans. For a more detailed description of the 85 Broad Street Whole Loan (as defined below), please refer to “Additional Debt” below. |
THE INFORMATION IN THIS COLLATERAL TERM SHEET IS NOT COMPLETE AND MAY BE AMENDED PRIOR TO THE TIME OF SALE. THIS TERM SHEET IS NOT AN OFFER TO SELL THESE SECURITIES AND IT IS NOT A SOLICITATION OF AN OFFER TO BUY THESE SECURITIES IN ANY JURISDICTION WHERE THE OFFER OR SALE IS NOT PERMITTED.
111
Mortgage Loan No. 7 — 85 Broad Street
| (2) | Fitch and KBRA have each indicated that the loan has, in the context of its inclusion in the Initial Pool Balance, credit characteristics consistent with an investment grade obligation. |
| (3) | For a more detailed description of the lockbox, please refer to“Lockbox / Cash Management”below. |
| (4) | For a more detailed description of the additional future debt permitted, please refer to “Additional Debt” below. |
| (5) | The property was built to suit for Goldman Sachs in 1983. The seller bought the property in 2014 following Goldman Sachs vacating the building, and leased up the building from approximately 25% at acquisition to its current occupancy of 87.1%. For more details, please refer to “Operating History and Underwritten Net Cash Flow” below. |
| (6) | Represents the trailing twelve month period ending February 28, 2017. |
| (7) | For a more detailed description of escrows and reserves, please refer to “Escrows and Reserves” below. |
The Loan. The 85 Broad Street loan, which is part of a larger split whole loan, is a first mortgage loan secured by the borrowers’ fee interest in a Class A office building comprising 1,118,512 SF and located at 85 Broad Street in New York, New York.
The whole loan has an outstanding principal balance as of the cut-off date of $358.6 million (the “85 Broad Street Whole Loan”), and is comprised of fourpari passu senior notes: Note A-A-1 ($70,000,000), Note A-A-2 ($20,000,000), Note A-A-3 ($45,000,000) and Note A-A-4 ($34,000,000) (collectively, the “A Notes”), one subordinate Note A-B with an outstanding principal balance of $72.0 million, one non-controlling subordinate Note B-A with an outstanding principal balance of $58.8 million and one initially controlling subordinate Note B-B with an outstanding principal balance of $58.8 million, collectively, the “85 Broad Street Subordinate Companion Loans”).
Note A-A-3 has an outstanding principal balance as of the cut-off date of $45.0 million and is being contributed to the CSAIL 2017-CX9 Commercial Mortgage Trust. Note A-A-1, Note A-A-2 and Note A-B were previously contributed to the CSAIL 2017-C8 Commercial Mortgage Trust. Note A-A-4 was previously contributed to the UBS 2017-C2 Commercial Mortgage Trust. The 85 Broad Street Whole Loan is being serviced pursuant to the pooling and servicing agreement for the CSAIL 2017-C8 Commercial Mortgage Trust. Under the co-lender agreement for the 85 Broad Street Whole Loan, Note B-B is the initial “controlling note” and the holder of Note B-B is the initial “directing holder” under the pooling and servicing agreement for the CSAIL 2017-C8 Commercial Mortgage Trust. Except after the occurrence of certain control termination events, the servicer and special servicer will not be permitted to implement certain major decisions without the consent of the directing holder. After the occurrence of certain control termination events, the holders of Note A-A-3 and Note A-A-4 or their representatives will be entitled, under certain circumstances, to consult with the CSAIL 2017-C8 Commercial Mortgage Trust with respect to certain major decisions.
Note A-A-1, Note A-A-2 and Note A-A-4 accrue interest at the same rate as thepari passu Note A-A-3 and are entitled to payments of interest and principal on apro rata andpari passu basis with Note A-A-3. Note A-B, Note B-A and Note B-B are subordinate notes. For more information see “Description of the Mortgage Pool—The Whole Loans” in the Preliminary Prospectus.
Whole Loan Note Summary
| Original Balance | Cut-off Date Balance | Note Holder | Lead Servicer for Whole Loan (Y/N) | Controlling Piece (Y/N) | |
| Note A-A-1 | $70,000,000 | $70,000,000 | CSAIL 2017-C8 | Y | N |
| Note A-A-2 | 20,000,000 | 20,000,000 | CSAIL 2017-C8 | N | N |
| Note A-A-3 | 45,000,000 | 45,000,000 | CSAIL 2017-CX9 | N | N |
| Note A-A-4 | 34,000,000 | 34,000,000 | UBS 2017-C2 | N | N |
| Note A-B | 72,000,000 | 72,000,000 | CSAIL 2017-C8 Loan-Specific Certificates | N | N |
| Note B-A | 58,800,000 | 58,800,000 | Third Party Investor | N | N |
| Note B-B | 58,800,000 | 58,800,000 | Third Party Investor | N | Y |
| Total | $358,600,000 | $358,600,000 |
THE INFORMATION IN THIS COLLATERAL TERM SHEET IS NOT COMPLETE AND MAY BE AMENDED PRIOR TO THE TIME OF SALE. THIS TERM SHEET IS NOT AN OFFER TO SELL THESE SECURITIES AND IT IS NOT A SOLICITATION OF AN OFFER TO BUY THESE SECURITIES IN ANY JURISDICTION WHERE THE OFFER OR SALE IS NOT PERMITTED.
112
Mortgage Loan No. 7 — 85 Broad Street
85 Broad Street Total Debt Capital Structure

| (1) | Based on an as-is appraised value of $652.0 million as of April 30, 2017 per the appraisal. |
| (2) | Based on the UW NOI of $25,930,418. |
| (3) | Based on the UW NCF of $24,028,948 and the coupon of 3.41253% on the aggregation of the aggregation of A-A-1 Note, A-A-2 Note, A-A-3 Note and A-A-4 Note, the coupon of 3.6930% on the Note A-B, the coupon of 4.0800% on Note B-A and the coupon of 4.6000% on Note B-B. |
| (4) | Implied Equity is based on the as-is appraised value of $652.0 million, less total debt of $358.6 million. |
The Borrowers. The borrowing entities for the loan are 85 Broad Street Property Owner LLC and 85 Broad Street TRS LLC, both of which are Delaware limited liability companies and special purpose entities.
The Sponsor. The loan’s sponsor and nonrecourse carve-out guarantor is ICR US LP, which is required to maintain a minimum net worth of $100.0 million. The maximum aggregate liability of the guarantor for the non-recourse carveouts for bankruptcy will be capped at 15.0% of the original 85 Broad Street Whole Loan plus the borrower’s “recourse liabilities” plus costs of enforcement and collection. ICR US LP is controlled by Ivanhoé Cambridge, the real estate subsidiary of La Caisse de dépôt et placement du Québec (“CDPQ”), one of Canada's leading institutional fund managers. CDPQ is a long-term institutional investor that manages funds primarily for public and parapublic pension and insurance plans. As of December 31, 2016, it held approximately CDN$270.7 billion in net assets.
Ivanhoé Cambridge is a global real estate firm that invests in high-quality properties and companies in select cities around the world. Founded in Québec in 1953, Ivanhoé Cambridge has built a vertically integrated business across Canada. Internationally, the company invests alongside key partners that are leaders in their respective markets. Through subsidiaries and partnerships, Ivanhoé Cambridge holds interests in close to 500 properties, consisting primarily in office, retail, residential and logistics real estate. Ivanhoé Cambridge held more than CDN$55.0 billion in assets as of June 30, 2016.
The Property.The property consists of a 30-story, Class A, platinum LEED certified office building totaling 1,118,512 SF, located at 85 Broad Street in New York, New York. Originally constructed in 1983 as Goldman Sachs’ headquarters, the property was converted to a multi-tenant building after Goldman Sachs vacated in 2011. The property features characteristics including natural light and panoramic views resulting from all four exposed sides, column-free floor plates and a full city block location. The property underwent a $112.0 million ($100 PSF) capital improvement program in 2015, which entailed various
THE INFORMATION IN THIS COLLATERAL TERM SHEET IS NOT COMPLETE AND MAY BE AMENDED PRIOR TO THE TIME OF SALE. THIS TERM SHEET IS NOT AN OFFER TO SELL THESE SECURITIES AND IT IS NOT A SOLICITATION OF AN OFFER TO BUY THESE SECURITIES IN ANY JURISDICTION WHERE THE OFFER OR SALE IS NOT PERMITTED.
113
Mortgage Loan No. 7 — 85 Broad Street
building systems upgrades, lobby and plaza enhancements, elevator modifications and the renovation of tenant amenity spaces. The lobby is finished with marble floors and walls. Investment in new HVAC, electrical and chilled water systems has resulted in the recently awarded LEED platinum certification in January 2017. The property has a security system that includes card-key access in the elevators and security cameras located in the lobby and elevators. The lobby is equipped with a concierge desk and security personnel that patrol the perimeter of the property after hours. The interiors include decorative fluorescent or incandescent light fixtures. The majority of the floors are column-less floors due to the prior trading floor use. Amenities to the tenants include a 976 SF bike room that has space for 84 bicycles, a 10,461 SF cafeteria in the concourse operated by Le Pain Quotidien, a full-service Belgium bistro, and a 14,007 SF wellness center operated by WeWork which is expected to open in August 2017 and be available to all tenants at a nominal rate.
As of April 19, 2017, the property was 87.1% occupied by 10 office tenants and 2 retail tenants. The largest tenant at the property, WeWork, leases 292,956 SF (26.2% of the net rentable area) through August 2033, with two, five-year extension options remaining. WeWork is a New York-based provider of shared office space that brings together entrepreneurs, freelancers, startups, and small businesses, creating both physical and virtual communities where members learn from, grow with, and support each other. The property is WeWork’s first full service location with a wellness center, restaurant and bar, and lounge floor fully operated by the company. The main lobby entrance is located on Broad Street and WeWork is in the process of constructing a private entrance on South William Street. The tenant initially was leasing 253,857 SF in 2015 and expanded in 2016 to the 27th floor. The second largest tenant at the property, Oppenheimer, leases 275,792 SF (24.7% of the net rentable area) through February 2028 with one five or ten-year extension option remaining. Oppenheimer provides a range of financial services including brokerage, investment banking, asset management, lending, and research. Oppenheimer’s Private Client segment, which offers retail brokerage, wealth management, and margin lending to affluent business clients in the US and Latin America makes up the bulk of sales. Oppenheimer has been a tenant at the property since 2011 and is rated B2/B/NR by Moody’s, S&P and Fitch, respectively. The third largest tenant at the property, Nielsen, leases 117,207 SF (10.5% of the net rentable area) through March 2025 with one, five- or ten-year extension option remaining. Founded in 1923, Nielsen operates as an information and measurement company. The company provides media and marketing information, analytics, and manufacturer and retailer expertise about what and where consumers buy, read, watch and listen. Nielsen has been a tenant at the property since 2013 and is rated Ba3/BB+/NR by Moody’s, S&P and Fitch, respectively.
The Market. The property is located on Broad Street between South William Street and Pearl Street, in proximity to Wall Street, Battery Park, the Federal Reserve, the New York Stock Exchange, the National Museum of the American Indian, Federal Hall, the National September 11 Memorial and Museum, St. Paul’s Chapel, New York City Hall and the Fulton Street Transit Center, which is a recently completed $1.4 billion project by the Metropolitan Transit providing access to five different subway lines. Additionally, the property is 0.8 miles from the World Trade Center Transportation Hub, which connects 11 different subway lines, the PATH rail system, the Battery Park City Ferry Terminal, and the Westfield World Trade Center, which opened in August 2016. Santiago Calatrava designed the Westfield World Trade Center, which is now home to over 125 retail shops and restaurants including: Apple, Michael Kors, Breitling and Eataly.
The area offers access to 15 subway lines, 30 local and express bus routes, 20 ferry routes, and the PATH transit system. In addition, the Brooklyn-Battery tunnel and the Brooklyn and Manhattan bridges connect Lower Manhattan with Brooklyn, Queens and Long Island, while the Holland Tunnel, directly north of the district, connects Lower Manhattan to New Jersey. Furthermore, the district is accessible via the FDR Drive, located on the east side of the district, and the West Side Highway.
According to a third party research report, the property is located in Lower Manhattan within the Class A Financial District submarket. As of the first quarter of 2017, the Class A Financial District submarket of New York City had approximately 35.2 million SF of office inventory with a vacancy of 9.7% and asking rents of $53.86 PSF. According to a third party research report as April 2017, the Financial District had the strongest rent growth in Manhattan and the New York Metro in 2016, with rent growth of 10.1%.
THE INFORMATION IN THIS COLLATERAL TERM SHEET IS NOT COMPLETE AND MAY BE AMENDED PRIOR TO THE TIME OF SALE. THIS TERM SHEET IS NOT AN OFFER TO SELL THESE SECURITIES AND IT IS NOT A SOLICITATION OF AN OFFER TO BUY THESE SECURITIES IN ANY JURISDICTION WHERE THE OFFER OR SALE IS NOT PERMITTED.
114
Mortgage Loan No. 7 — 85 Broad Street
According to a third party research report, the estimated 2017 population within a one-, three- and five-mile radius of the property is 82,908, 838,005 and 2,304,923, respectively. The estimated 2017 average household income within a one-, three- and five-mile radius of the property is $189,852, $139,663 and $114,797, respectively.
According to the appraisal, the property’s competitive set consists of the seven properties detailed in the table below.
Competitive Set Summary(1)
| Property | Year Built / Renovated | Total GLA (SF) | Est. Rent PSF(2) | Est. Occ. | Proximity (miles) | Anchor Tenants |
| 85 Broad Street | 1983 / 2015 | 1,118,512(3) | $44.79(3) | 87.1%(3) | N/A | WeWork |
| 225 Liberty Street | 1987 / NAV | 2,200,000 | $70.00 | 97.2% | 0.8 | Rauxa |
| 1 Liberty Street | 1972 / NAV | 2,121,437 | $54.00 | NAV | 0.7 | AON, New Avon |
| 200 Vesey Street | 1985 / NAV | 2,300,000 | $55.00 | 91.0% | 0.9 | Tullett Prebon |
| 28 Liberty Street | 1960 / NAV | 1,898,158 | $58.00 | 77.9% | 0.7 | New York State Attorney General's Office |
| One New York Plaza | 1968 / 1994 | 2,103,750 | $57.00 | 95.3% | 0.2 | Revlon, Inc. |
| 200 Vesey Street | 1985 / NAV | 2,300,000 | $59.00 | 91.0% | 0.9 | Royal Bank of Canada |
| 1 Whitehall Street | 1962 / 1989 | 285,000 | $50.00 | 97.6% | 0.2 | Selligent |
| (1) | Source: Appraisal. |
| (2) | Est. Rent PSF includes leases the appraiser identified for the specific properties for a 12-month period. |
| (3) | Based on the April 19, 2017 underwritten rent roll. |
Historical and Current Occupancy(1)
| 2012 | 2013 | 2014 | 2015 | 2016 | Current(2) |
| 31.3% | 43.1% | 43.1% | 74.8% | 88.7% | 87.1% |
| (1) | Historical Occupancy is provided by the sponsor. Occupancies are as of December 31 of each respective year. The property was built to suit for Goldman Sachs in 1983. The seller bought the property in 2014 following Goldman Sachs vacating the building, and leased up the building from approximately 25.0% at acquisition to its current occupancy of 87.1%. |
| (2) | Based on the April 19, 2017 underwritten rent roll. |
THE INFORMATION IN THIS COLLATERAL TERM SHEET IS NOT COMPLETE AND MAY BE AMENDED PRIOR TO THE TIME OF SALE. THIS TERM SHEET IS NOT AN OFFER TO SELL THESE SECURITIES AND IT IS NOT A SOLICITATION OF AN OFFER TO BUY THESE SECURITIES IN ANY JURISDICTION WHERE THE OFFER OR SALE IS NOT PERMITTED.
115
Mortgage Loan No. 7 — 85 Broad Street
Tenant Summary(1)
| Tenant | Ratings Moody’s/S&P/Fitch(2) | Net Rentable Area (SF) | % of Total NRA | Base Rent PSF | Base Rent | % of Total Base Rent | Lease Expiration Date |
| WeWork(3) | NR / NR / NR | 292,956 | 26.2% | $45.79 | $13,414,234 | 30.8% | 8/31/2033 |
| Oppenheimer(4) | B2 / B / NR | 275,792 | 24.7% | $44.83 | $12,363,838 | 28.4% | 2/28/2028 |
| Nielsen(5) | Ba3 / BB+ / NR | 117,207 | 10.5% | $48.56 | $5,691,743 | 13.1% | 3/31/2025 |
| Vox Media(6) | NR / NR / NR | 85,733 | 7.7% | $48.00 | $4,115,184 | 9.4% | 1/31/2031 |
| Banco Popular(7) | (P)Ba1 / B / A- | 53,229 | 4.8% | $40.85 | $2,174,153 | 5.0% | 2/28/2026 |
| Berkshire Hathaway(8) | Aa2 / AA / A+ | 38,407 | 3.4% | $45.50 | $1,747,519 | 4.0% | 1/31/2024 |
| Year-Up(9) | NR / NR / NR | 38,407 | 3.4% | $41.00 | $1,574,687 | 3.6% | 11/30/2030 |
| Modern Language(10) | NR / NR / NR | 30,534 | 2.7% | $36.85 | $1,125,229 | 2.6% | 5/31/2036 |
| SunGuard Systems(11) | B3 / NR / NR | 12,598 | 1.1% | $42.50 | $535,415 | 1.2% | 10/31/2019 |
| Friedman Vartolo(12) | NR / NR / NR | 8,082 | 0.7% | $51.00 | $412,182 | 0.9% | 2/28/2027 |
| (1) | Based on the underwritten rent roll, including rent increases occurring through May 2018. |
| (2) | Ratings provided are for the parent company of the entity listed in the “Tenant” field whether or not the parent company guarantees the lease. |
| (3) | WeWork occupies 11 suites within the property; each lease has two, five-year renewal options remaining. |
| (4) | Oppenheimer occupies ten suites of which two are storage within the property; each lease has one, 5- or 10-year renewal option remaining. The eight office suites have a one-time termination option effective as of February 1, 2024 to either terminate (i) the highest full floor; (ii) the lowest full floor; or (iii) the entirety of its lease with 18 months’ notice and a penalty equal to the unamortized transaction costs at an interest rate of 8%. |
| (5) | Nielsen occupies four suites within the property, each subject to a separate lease that has one, 5- or 10-year renewal option remaining. Following the 7th anniversary of the rent commencement date, Nielsen has the ability to terminate a portion or the entirety of its lease with 15 months’ notice. The termination payment is the sum of five times the annual rent, tax payments, operating payments and cafeteria rent, the landlord’s contribution, rent, tax and operating payments during the abatement period amortized on a monthly basis with a 7.0% interest rate and brokerage commissions. 50% of the termination payment is due concurrently with the termination notice and the remaining 50% is due on or before the termination date. |
| (6) | Vox Media occupies three suites within the property; each lease has one, five-year renewal option remaining. |
| (7) | Banco Popular occupies two suites within the property; each lease has one, five-year renewal option remaining. |
| (8) | Berkshire Hathaway has one, five-year renewal option remaining. |
| (9) | Year-Up has one, five-year renewal option remaining. |
| (10) | Modern Language has one, five-year renewal option remaining. |
| (11) | SunGuard Systems has one, five-year renewal option remaining. |
| (12) | Friedman Vartolo has one, five-year renewal option remaining. |
THE INFORMATION IN THIS COLLATERAL TERM SHEET IS NOT COMPLETE AND MAY BE AMENDED PRIOR TO THE TIME OF SALE. THIS TERM SHEET IS NOT AN OFFER TO SELL THESE SECURITIES AND IT IS NOT A SOLICITATION OF AN OFFER TO BUY THESE SECURITIES IN ANY JURISDICTION WHERE THE OFFER OR SALE IS NOT PERMITTED.
116
Mortgage Loan No. 7 — 85 Broad Street
Lease Rollover Schedule(1)
| Year | Number of Leases Expiring(2) | NRA Expiring | % of NRA Expiring | Base Rent Expiring | % of Base Rent Expiring | Cumulative NRA Expiring | Cumulative % of NRA Expiring | Cumulative Base Rent Expiring | Cumulative % of Base Rent Expiring |
| Vacant | NAP | 144,836 | 12.9% | NAP | NAP | 144,836 | 12.9% | NAP | NAP |
| MTM | 0 | 0 | 0.0 | $0 | 0.0% | 144,836 | 12.9% | $0 | 0.0% |
| 2017 | 0 | 0 | 0.0 | $0 | 0.0 | 144,836 | 12.9% | $0 | 0.0% |
| 2018 | 0 | 0 | 0.0 | $0 | 0.0 | 144,836 | 12.9% | $0 | 0.0% |
| 2019 | 1 | 12,598 | 1.1 | $535,415 | 1.2 | 157,434 | 14.1% | $535,415 | 1.2% |
| 2020 | 0 | 0 | 0.0 | $0 | 0.0 | 157,434 | 14.1% | $535,415 | 1.2% |
| 2021 | 1 | 484 | 0.0 | $27,012 | 0.1 | 157,918 | 14.1% | $562,427 | 1.3% |
| 2022 | 0 | 0 | 0.0 | $0 | 0.0 | 157,918 | 14.1% | $562,427 | 1.3% |
| 2023 | 0 | 0 | 0.0 | $0 | 0.0 | 157,918 | 14.1% | $562,427 | 1.3% |
| 2024 | 1 | 38,407 | 3.4 | $1,747,519 | 4.0 | 196,325 | 17.6% | $2,309,946 | 5.3% |
| 2025 | 4 | 117,207 | 10.5 | $5,691,743 | 13.1 | 313,532 | 28.0% | $8,001,689 | 18.3% |
| 2026 | 2 | 53,229 | 4.8 | $2,174,153 | 5.0 | 366,761 | 32.8% | $10,175,841 | 23.3% |
| 2027 | 1 | 8,082 | 0.7 | $412,182 | 0.9 | 374,843 | 33.5% | $10,588,023 | 24.3% |
| 2028 & Beyond | 31 | 743,669 | 66.5 | $33,020,556 | 75.7 | 1,118,512 | 100.0% | $43,608,579 | 100.0% |
| Total | 41 | 1,118,512 | 100.0% | $43,608,579 | 100.0% |
| (1) | Based on the underwritten rent roll dated April 19, 2017, base rent including rent steps through May 2018. |
| (2) | Multiple tenants operate under more than one lease. There are 12 tenants at the property. |
Operating History and Underwritten Net Cash Flow
| 2014 | 2015 | 2016 | TTM(1) | Underwritten(2) | PSF | %(3) | |
| Rents in Place(4) | N/A | $19,589,718 | $33,990,919 | $35,096,005 | $43,608,579 | $38.99 | 82.0% |
| Vacancy Gross Up | N/A | 0 | 0 | 0 | 7,162,525 | 6.40 | 13.5 |
| Rent Adjustment(5) | N/A | 12,425,956 | 6,570,969 | 6,463,290 | 0 | 0.00 | 0.0 |
| Gross Potential Rent | N/A | $32,015,674 | $40,561,888 | $41,559,295 | $50,771,104 | $45.39 | 95.5% |
| Total Reimbursements | N/A | 2,121,256 | 2,330,022 | 2,386,220 | 2,415,192 | 2.16 | 4.5 |
| Net Rental Income | N/A | $34,136,930 | $42,891,910 | $43,945,515 | $53,186,296 | $47.55 | 100.0% |
| (Vacancy/Collection Loss) | N/A | 0 | 0 | 0 | (7,162,525) | (6.40) | (13.5) |
| Other Income | N/A | 1,340,413 | 1,299,980 | 1,267,039 | 1,201,605 | 1.07 | 2.3 |
| Effective Gross Income | N/A | $35,477,343 | $44,191,890 | $45,212,554 | $47,225,377 | $42.22 | 88.8% |
| Total Expenses | N/A | $21,206,955 | $21,069,855 | $21,305,990 | $21,294,959 | $19.04 | 45.1% |
| Net Operating Income | N/A | $14,270,387 | $23,122,035 | $23,906,564 | $25,930,418 | $23.18 | 54.9% |
| Total TI/LC, Capex/RR | N/A | 0 | 0 | 0 | 1,901,470 | 1.70 | 4.0 |
| Net Cash Flow | N/A | $14,270,387 | $23,122,035 | $23,906,564 | $24,028,948 | $21.48 | 50.9% |
| Avg. Rents in Place PSF(6) | N/A | $40.87 | $42.01 | $42.68 | $44.79 |
| (1) | Represents the trailing twelve month period ending February 28, 2017. |
| (2) | Rent includes base rent and rent steps through May 2018. |
| (3) | Percentage column represents percent of Net Rental Income for all revenue lines and represents percent of Effective Gross Income for the remainder of fields. |
| (4) | The property was built to suit for Goldman Sachs in 1983. The seller bought the property in 2014 following Goldman Sachs vacating the building, and leased up the building from approximately 25.0% at acquisition to its current occupancy of 87.1%. 2015 cash flows are significantly lower than historical as the seller offered free rent and TI packages in order to attract tenants. The seller also completed a $112 million ($100 PSF) capital improvement program, which entailed numerous building systems upgrades, lobby and plaza enhancements, elevator modifications and tenant amenity spaces. |
| (5) | Rent adjustment is rent from FAS 13 GAAP Adjustment. This adjustment allows for rent payment based on lease term to be included in the operating statements. |
| (6) | The 2015, 2016 and TTM Average Rents in Place PSF are calculated using aggregation of Rents in Place and Rent Adjustment, and actual leased SF at such period. |
THE INFORMATION IN THIS COLLATERAL TERM SHEET IS NOT COMPLETE AND MAY BE AMENDED PRIOR TO THE TIME OF SALE. THIS TERM SHEET IS NOT AN OFFER TO SELL THESE SECURITIES AND IT IS NOT A SOLICITATION OF AN OFFER TO BUY THESE SECURITIES IN ANY JURISDICTION WHERE THE OFFER OR SALE IS NOT PERMITTED.
117
Mortgage Loan No. 7 — 85 Broad Street
Property Management. The property is managed by Callahan Properties.
Escrows and Reserves. At origination, the borrowers deposited into escrow $8,170,739 for unfunded lease obligations and $570,850 for free rent. Provided that no event of default has occurred and is continuing, the lender will be required to disburse funds held in such unfunded lease obligations reserve to the borrower within 15 days after the borrower delivers a request to the lender therefor (but not more than once per month) in increments of at least $5,000, provided that (i) such disbursement is for an approved leasing expense as provided in the related loan documents, (ii) if applicable, the lender has, at its discretion, verified the performance of any construction work associated with such approved leasing expense and (iii) the request is accompanied by certain information and an officer’s certificate as detailed under the related loan documents. If an event of default exists, any such disbursement in an amount of more than $10,000 may, at the lender’s discretion, be made by joint check payable to the borrower and the payee of any such approved leasing expense.
Tax Escrows -During a Cash Management Period (as defined below), the borrowers are required to escrow 1/12th of annual tax payments, currently equal to $787,180.
Insurance Escrows -The loan documents do not require monthly escrows for insurance provided that (i) no event of default under the loan has occurred and is continuing, (ii) the borrowers provide evidence that the insurance coverages required pursuant to the loan documents are being maintained under an acceptable blanket insurance policy and (iii) the borrowers maintain an amount in the insurance escrow equal to six months’ worth of monthly insurance premiums.
Replacement Reserves -During a Cash Management Period, the borrowers are required to escrow for $18,636 ($0.20 PSF annually) for replacement reserves.
TI/LC Reserves -During a Cash Management Period, the borrowers are required to escrow for $139,768 ($1.50 PSF annually) for TI/LC reserves.
Lockbox / Cash Management. The 85 Broad Street Whole Loan is structured with a hard lockbox and springing cash management. Tenants have been directed to remit all payments due under their respective leases directly into the lockbox account. During the continuance of a Cash Management Period, all funds in the lockbox account are required to be swept daily to a cash management account under the control of the lender and disbursed during each interest period of the term of the loan in accordance with the loan documents.
A “Cash Management Period” will commence upon: (i) an event of default under the 85 Broad Street Whole Loan documents; (ii) the failure by the borrowers, after the end of two consecutive calendar quarters, to maintain a debt service coverage ratio of at least 1.20x; (iii) a Primary Tenant Sweep Period (as defined below); or (iv) an approved mezzanine loan exists; and will end with respect to clause (i) above, if such event of default has been cured or waived by the lender; with respect to clause (ii) above, if for two consecutive calendar quarters since the commencement of the existing Cash Management Period (A) no event of default under the 85 Broad Street Whole Loan documents has occurred, (B) no event that constitutes another Cash Management Period has occurred, and (C) the debt service coverage ratio at least equal to 1.20x, and with respect to clause (iii) above, a Primary Tenant Sweep Period Cure (as defined below) has occurred and no event that triggers another Cash Management Period has occurred.
A “Primary Tenant Sweep Period” will commence on the earliest of (i) the earlier of the date that is 12 months prior to (x) the then-scheduled expiration, termination or contraction date of any Primary Tenant (as defined below) lease, whether such lease is in its initial term or any renewal term and (y) the date by which any Primary Tenant is required to exercise its renewal option under any Primary Tenant lease (provided such renewal has not yet been exercised);(ii) any termination, cancellation or surrender of, or receipt by the borrowers of a notice to terminate, cancel or surrender any one of the Primary Tenant leases; (iii) a Primary Tenant “going dark” (i.e. vacates, surrenders or otherwise ceases to operate its business) in all or substantially all of the applicable Primary Tenant premises; (iv) the occurrence of any default (beyond any applicable notice and/or cure period) under any Primary Tenant lease or (v) a Primary Tenant, its corporate parent and/or guarantor becoming the subject of a bankruptcy action.
THE INFORMATION IN THIS COLLATERAL TERM SHEET IS NOT COMPLETE AND MAY BE AMENDED PRIOR TO THE TIME OF SALE. THIS TERM SHEET IS NOT AN OFFER TO SELL THESE SECURITIES AND IT IS NOT A SOLICITATION OF AN OFFER TO BUY THESE SECURITIES IN ANY JURISDICTION WHERE THE OFFER OR SALE IS NOT PERMITTED.
118
Mortgage Loan No. 7 — 85 Broad Street
A “Primary Tenant Sweep Period Cure” will commence (A) with respect to clause (i), (ii), (iv) and (v) above, if a Primary Tenant Replacement Event (as defined below) has occurred; (B) with respect to clause (iii) above, if the Primary Tenant or an acceptable replacement tenant re-opens for business for a continuous period of not less than three months; (C) with respect to clause (iv) above, if the default is cured and no other default (beyond any applicable notice and/or cure period) exists under the Primary Tenant lease; (D) with respect to clause (v) above, if the bankruptcy action is dismissed and the primary tenant lease is affirmed and (E) the date on which the following amounts have accumulated in the Primary Tenant reserve subaccount (exclusive of any amounts on deposit in the Primary Tenant reserve subaccount attributable to the Primary Tenant Sweep Period Cure with respect to any other trigger): (x) $80.00 PSF with respect to any portion of the applicable Primary Tenant premises that has not been re-tenanted and (y) to the extent all or a portion of the applicable Primary Tenant premises has been demised to an acceptable replacement tenant, in the lender’s judgment, sufficient funds to cover all anticipated Primary Tenant re-leasing costs related to the space that has been re-tenanted and all the cost of landlord work required under such replacement tenant lease.
A “Primary Tenant Replacement Event” means (X) either (a) the termination of a Primary Tenant lease and the borrowers entering into one or more new leases that, in the aggregate, demise all of the applicable Primary Tenant premises or (b) the renewal of the applicable Primary Tenant lease for the entire Primary Tenant premises in accordance with its terms as in existence on the date hereof or otherwise on terms and conditions approved in writing by the lender, such approval not to be unreasonably conditioned, withheld or delayed and, (Y) in either instance, in the lender’s judgment, sufficient funds have been accumulated and remain available on deposit in the Primary Tenant reserve subaccount (exclusive of any amounts on deposit attributable to the Primary Tenant Sweep Period Cure with respect to any other trigger) to pay all Primary Tenant re- leasing costs with respect to both such new lease and/or renewal of a Primary Tenant lease.
A “Primary Tenant” means initially either or both of Oppenheimer and WeWork and thereafter any acceptable replacement tenant that leases in excess of 160,000 SF.
Additional Debt.In addition to Note A-A-3, the mortgaged property is also security for thepari passu Note A-A-1, Note A-A-2, Note A-A-4 and the 85 Broad Street Subordinate Companion Loans. The Note A-B has an outstanding principal balance as of the cut-off date of $72.0 million and a coupon of 3.6930%. The Note B-A has an outstanding principal balance as of the cut-off date of $58.8 million and a coupon of 4.0800%. The Note B-B has an outstanding principal balance as of the cut-off date of $58.8 million and a coupon of 4.6000%. The 85 Broad Street Whole Loan (inclusive of the 85 Broad Street Subordinate Companion Loans) has a Cut-off Date LTV of 55.0%, an UW NCF DSCR of 1.75x and an UW NOI Debt Yield of 7.2%.
In addition, the borrowers have the one-time right, at any time following the securitization of the 85 Broad Street Whole Loan, upon no less than 45 business days prior written notice to the lender to obtain a mezzanine loan secured by a pledge of all of the direct ownership interests in the borrowers upon satisfaction of certain terms and conditions which include, without limitation, (i) the mezzanine lender meets a qualified lender provision in the loan documents; (ii) the combined loan-to-value ratio on the origination date of the mezzanine loan does not exceed 55.0%; (iii) the combined debt service coverage ratio is not less than 1.75x, (iv) the combined debt yield is not less than 6.6%; and (v) the lenders enter into an intercreditor agreement in form and substance reasonably acceptable to the mortgage lender and the rating agencies.
THE INFORMATION IN THIS COLLATERAL TERM SHEET IS NOT COMPLETE AND MAY BE AMENDED PRIOR TO THE TIME OF SALE. THIS TERM SHEET IS NOT AN OFFER TO SELL THESE SECURITIES AND IT IS NOT A SOLICITATION OF AN OFFER TO BUY THESE SECURITIES IN ANY JURISDICTION WHERE THE OFFER OR SALE IS NOT PERMITTED.
119
Mortgage Loan No. 8 — Allergan HQ
 |
THE INFORMATION IN THIS COLLATERAL TERM SHEET IS NOT COMPLETE AND MAY BE AMENDED PRIOR TO THE TIME OF SALE. THIS TERM SHEET IS NOT AN OFFER TO SELL THESE SECURITIES AND IT IS NOT A SOLICITATION OF AN OFFER TO BUY THESE SECURITIES IN ANY JURISDICTION WHERE THE OFFER OR SALE IS NOT PERMITTED.
120
Mortgage Loan No. 8 — Allergan HQ
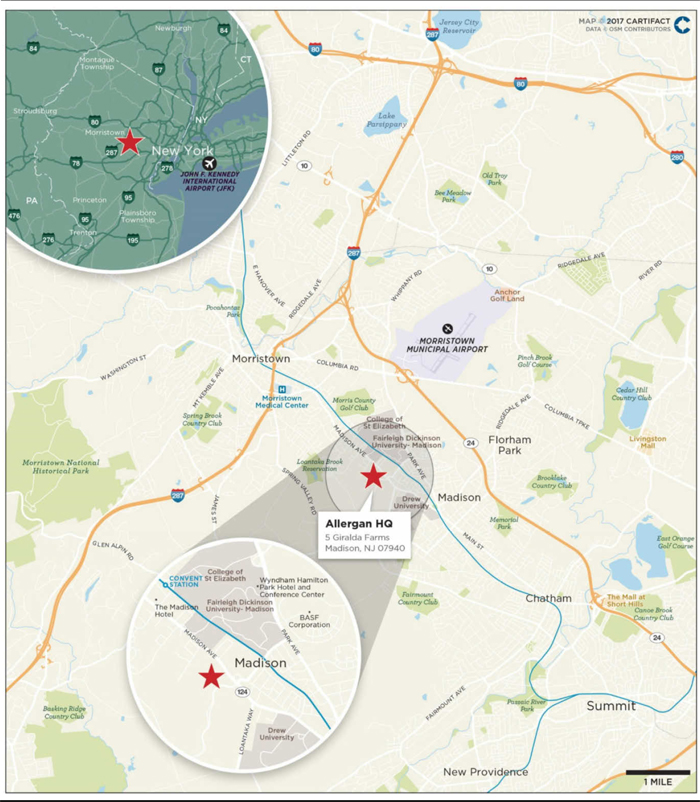 |
THE INFORMATION IN THIS COLLATERAL TERM SHEET IS NOT COMPLETE AND MAY BE AMENDED PRIOR TO THE TIME OF SALE. THIS TERM SHEET IS NOT AN OFFER TO SELL THESE SECURITIES AND IT IS NOT A SOLICITATION OF AN OFFER TO BUY THESE SECURITIES IN ANY JURISDICTION WHERE THE OFFER OR SALE IS NOT PERMITTED.
121
Mortgage Loan No. 8 — Allergan HQ
| Mortgage Loan Information | Property Information | |||
| Mortgage Loan Seller: | Natixis | Single Asset / Portfolio: | Single Asset | |
| Original Principal Balance(1): | $45,000,000 | Title: | Fee | |
| Cut-off Date Principal Balance(1): | $45,000,000 | Property Type - Subtype: | Office - Suburban | |
| % of Pool by IPB: | 5.2% | Net Rentable Area (SF): | 453,680 | |
| Credit Assessment (KBRA)(2): | A | Location: | Madison, NJ | |
| Loan Purpose: | Refinance | Year Built / Renovated: | 1992 / 2016-2017 | |
| Borrower: | Giralda Farms RE LLC | Occupancy(4): | 98.0% | |
| Sponsors: | Menashe Frankel, Yeheskel Frankel, Joel Bergstein, David Weinstein, David Werner and Joseph Friedland | Occupancy Date: | 8/5/2017 | |
| Interest Rate: | 4.26555556% | Number of Tenants: | 2 | |
| Note Date: | 1/9/2017 | 2014 NOI(5): | NAP | |
| Maturity Date: | 2/5/2027 | 2015 NOI(5): | NAP | |
| Interest-only Period: | 120 months | 2016 NOI(5): | NAP | |
| Original Term: | 120 months | TTM NOI(5): | NAP | |
| Original Amortization: | None | UW Economic Occupancy: | 95.0% | |
| Amortization Type: | Interest Only | UW Revenues: | $12,767,344 | |
| Call Protection: | L(31),Def(85),O(4) | UW Expenses: | $4,045,277 | |
| Lockbox(3): | Hard | UW NOI: | $8,722,066 | |
| Additional Debt(1): | Yes | UW NCF: | $8,654,014 | |
| Additional Debt Balance(1): | $70,000,000 | Appraised Value / Per SF(6): | $172,000,000 / $379 | |
| Additional Debt Type(1): | B-Note, Senior Mezzanine, Junior Mezzanine | Appraisal Date(6): | 7/1/2018 | |
| Additional Future Debt Permitted: | No |
| Escrows and Reserves(7) | Financial Information(1) |
| Initial | Monthly | Initial Cap | Cut-off Date Loan / SF: | $99 | ||
| Taxes: | $593,753 | Springing | N/A | Maturity Date Loan / SF: | $99 | |
| Insurance: | $47,573 | $23,787 | N/A | Cut-off Date LTV(6): | 26.2% | |
| Replacement Reserves: | $0 | $5,671 | N/A | Maturity Date LTV(6): | 26.2% | |
| Deferred Maintenance: | $552,438 | $0 | N/A | UW NCF DSCR: | 4.48x | |
| Other: | $62,635,825 | Springing | N/A | UW NCF DSCR: | 4.45x | |
| UW NOI Debt Yield: | 19.4% | |||||
| UW NOI Debt Yield: | 19.2% |
Sources and Uses
| Sources | Proceeds | % of Total | Uses | Proceeds | % of Total | |
| Mortgage Loan (A Note) | $45,000,000 | 39.1% | Payoff Existing Debt | $42,593,073 | 37.0% | |
| Mortgage Loan (B Note) | 50,000,000 | 43.5 | Return of Equity | 5,841,766 | 5.1 | |
| Senior Mezzanine Loan | 10,000,000 | 8.7 | Upfront Reserves | 63,829,588 | 55.5 | |
| Junior Mezzanine Loan | 10,000,000 | 8.7 | Closing Costs | 2,735,573 | 2.4 | |
| Total Sources | $115,000,000 | 100.0% | Total Uses | $115,000,000 | 100.0% |
| (1) | The Allergan HQ loan is part of a larger split whole loan evidenced by one senior note and one subordinate note. The Financial Information presented in the chart above and herein reflects the cut-off date balance of the $45.0 million A Note (as defined below), but not the $50.0 million B Note (as defined |
THE INFORMATION IN THIS COLLATERAL TERM SHEET IS NOT COMPLETE AND MAY BE AMENDED PRIOR TO THE TIME OF SALE. THIS TERM SHEET IS NOT AN OFFER TO SELL THESE SECURITIES AND IT IS NOT A SOLICITATION OF AN OFFER TO BUY THESE SECURITIES IN ANY JURISDICTION WHERE THE OFFER OR SALE IS NOT PERMITTED.
122
Mortgage Loan No. 8 — Allergan HQ
below), the $10.0 million Allergan HQ Senior Mezzanine loan (as define below) or the $10.0 million Allergan HQ Junior Mezzanine loan (as defined below). For a more detailed description of Allergan HQ Whole Loan (as defined below) and mezzanine loans, please refer to “The Loan” and “Additional Debt” below.
| (2) | KBRA has confirmed that the loan has, in the context of tis inclusion in the Initial Poll Balance, credit characteristics consistent with an investment grade obligation. |
| (3) | For a more detailed description of lockbox, please refer to “Lockbox / Cash Management” below. |
| (4) | The Occupancy shown is based on the leased net rentable area (“NRA”). As of August 5, 2017, the property was 2.9% physically occupied. The Allergan lease commenced on July 1, 2017, but the tenant is not expected to take physical occupancy of its premises until September, 2017. |
| (5) | The property was acquired in 2013, and was previously vacant. The property has undergone renovations since the acquisition, which are expected to be completed in 2017. The historical cash flows are not available. |
| (6) | Based on the “as-stabilized” value, which assumes that the Allergan tenant has taken physical occupancy and is paying full unabated rent. The “as-is” value as of September 1, 2017 is $142.0 million, which results in an Appraised Value Per SF, Cut-off Date LTV and Maturity Date LTV of $313, 31.7% and 31.7%, respectively. |
| (7) | For a more detailed description of Escrows and Reserves, please refer to “Escrows and Reserves” below. |
The Loan. The Allergan HQ loan, which is part of a larger split whole loan, is a $45.0 million first mortgage loan secured by the borrower’s fee interest in a 453,680 SF Class A office building located in Madison, New Jersey. The loan has a 10-year term and is interest-only for the term of the loan.
The whole loan has an outstanding principal balance as of cut-off date of $95.0 million (the “Allergan HQ Whole Loan”), which is comprised of two notes identified as Note A (the “A Note”) and Note B (the “B Note”). The two notes have outstanding principal balances as of the cut-off date of $45.0 million and $50.0 million for the A Note and the B Note, respectively. The B Note was sold to an unaffiliated third party investor. Under the related co-lender agreement, prior to a control appraisal period with respect to the related subordinate companion loan, the B Note is the controlling note, and after a control appraisal period occurs with respect to the related subordinate companion loan, the A Note will be the controlling note. The holder of the A Note or its representatives will be required, under certain circumstances, to obtain the consent of the B Note holder with respect to certain major decisions. The Allergan HQ Whole Loan will be serviced pursuant to terms of the pooling and servicing agreement governing CSAIL 2017-CX9. See “Description of the Mortgage Pool—The Whole Loans” in the Preliminary Prospectus.
Whole Loan Note Summary
| Original Balance | Cut-off Date Balance | Note Holder | Lead Servicer for Whole Loan (Y/N) | Controlling Piece (Y/N) | |
| Note A | $45,000,000 | $45,000,000 | CSAIL 2017-CX9 | Y | N |
| Note B | 50,000,000 | 50,000,000 | Third Party Investor | N | Y |
| Total | $95,000,000 | $95,000,000 |
THE INFORMATION IN THIS COLLATERAL TERM SHEET IS NOT COMPLETE AND MAY BE AMENDED PRIOR TO THE TIME OF SALE. THIS TERM SHEET IS NOT AN OFFER TO SELL THESE SECURITIES AND IT IS NOT A SOLICITATION OF AN OFFER TO BUY THESE SECURITIES IN ANY JURISDICTION WHERE THE OFFER OR SALE IS NOT PERMITTED.
123
Mortgage Loan No. 8 — Allergan HQ
Allergan HQ Total Debt Capital Structure
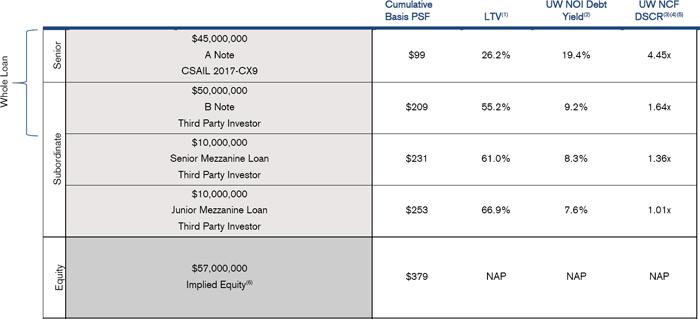
| (1) | Based on an “as-stabilized” appraised value of $172.0 million as of July 1, 2018 per the appraisal. The “as-is” value was $142.0 million as of September 1, 2017, which implies an “as-is” LTV of 31.7% on the A Note, 66.9% on the Allergan HQ Whole Loan, 73.9% on the aggregate of Allergan HQ Whole Loan and the Allergan HQ Senior Mezzanine loan and 81.0% on the total debt. |
| (2) | Based on the UW NOI of $8,722,066. |
| (3) | Based on the UW NCF of $8,654,014 and the coupon of 4.26555556% on the A Note, a coupon of 6.6000% on the B Note, a coupon of 10.5000% on the Allergan HQ Senior Mezzanine loan and a coupon of 5.5000% on the Allergan HQ Junior Mezzanine loan. |
| (4) | The Allergan HQ Junior Mezzanine loan has a fixed amortization schedule. UW NCF DSCR of the Allergan HQ Junior Mezzanine loan is calculated based on the aggregate debt service payable for the Allergan HQ Whole Loan, Allergan HQ Senior Mezzanine loan and Allergan HQ Junior Mezzanine loan for the 12-month period commencing March 2025. |
| (5) | The NCF DSCR for the total debt as of the Cut-off Date is 1.25x. |
| (6) | Implied Equity is based on the as-stabilized appraised value of $172.0 million, less total debt of $115.0 million. |
The Borrower. The borrowing entity for the loan is Giralda Farms RE LLC, a Delaware limited liability company and special purpose entity. Menashe Frankel and Yeheskel Frankel hold the largest equity stake in the borrower through various entities. Individual investors comprise the remaining ownership through various entities.
The Sponsors. The sponsors are Lincoln Equities Group (“LEG”) and Lakestar Properties (“Lakestar”). Based in East Rutherford, New Jersey, LEG operates a commercial real estate portfolio comprising more than 5 million SF of Class A office and commercial facilities throughout the metropolitan region. LEG, in partnership with institutional and high net worth investors, has completed over 25 acquisitions and dispositions totaling approximately $1.5 billion of deal volume in the United States and Europe since 2000. Lakestar is a New Jersey-based real estate investment firm. Over the last 20 years, Lakestar has acquired in excess of 30 assets including shopping malls, regional retail centers, office buildings and apartments throughout the country.
The guarantors are David Werner, Joseph Friedland, Joel Bergstein, David Weinstein, Menashe Frankel, and Yeheskel Frankel, who report a combined net worth as of August 31, 2016 of approximately $146.7 million, and liquidity of approximately $17.6 million.
The Property. The property is a 453,680 SF Class A office building located in Madison, New Jersey. The property was constructed in 1992 and renovated in 2016 and 2017, and consists of three distinct buildings including a main office building featuring 431,495 SF of space, a day care center consisting of 12,985 SF and a carriage house comprising 9,200 SF. The buildings are situated on approximately 50.0 acres within the Giralda Farms Corporate Center, a gated 310-acre campus that is home to five Class A office buildings totaling 1.1 million SF.
THE INFORMATION IN THIS COLLATERAL TERM SHEET IS NOT COMPLETE AND MAY BE AMENDED PRIOR TO THE TIME OF SALE. THIS TERM SHEET IS NOT AN OFFER TO SELL THESE SECURITIES AND IT IS NOT A SOLICITATION OF AN OFFER TO BUY THESE SECURITIES IN ANY JURISDICTION WHERE THE OFFER OR SALE IS NOT PERMITTED.
124
Mortgage Loan No. 8 — Allergan HQ
As of August 5, 2017, the property was 98.0% leased by two tenants. The largest tenant at the property, Allergan Sales, LLC (“Allergan”), leases 431,495 SF (95.1% of the NRA) through June 2030 with two, 5-year extension options remaining. Allergan is a subsidiary of Allergan plc (rated BBB (positive outlook) by S&P), which is one of the largest pharmaceutical companies in the world according to Forbes, with revenue of approximately $14.6 billion in 2016. Following substantial completion of Borrower’s Work (as defined below), the rent commencement date under the lease will be fixed as of July 1, 2018. The borrower is expected to achieve substantial completion of Borrower’s Work in September 2017. However, if substantial completion of Borrower’s Work is not achieved by November 1, 2017, then the rent commencement date will be extended on a day for day basis for each day following November 1, 2017 until the date when substantial completion of Borrower’s Work occurs (but in no event will the rent commencement date be extended beyond October 1, 2018). At origination, the lender reserved amounts for the cost of Borrower’s Work and for Allergan’s free rent through October 1, 2018. The guarantors under the loan also delivered a completion guaranty for such Borrower’s Work and non-recourse carveout guaranties for losses due to, among other things, the failure to complete Borrower’s Work by November 1, 2017 and any extension of the rent commencement date, abatement of rent or additional rent or set off against rent under the Allergan lease as a result of the same. See also “Risk Factors – Risks Relating to the Mortgage Loans – Risks Related to Redevelopment, Expansion and Renovation at the Mortgaged Properties” and “Description of the Mortgage Pool – Tenant Issues” in the Preliminary Prospectus.
The property is expected to serve as Allergan’s new U.S corporate headquarters, moving from Parsippany, New Jersey approximately 12 miles away, as the company required more space for its operations. Allergan’s decision to move its headquarter location to the property is expected to retain over 1,000 jobs in the area and add approximately 300 new jobs. Allergan plans to invest $100 million of its own money for the property renovations. Amenities at the main office building of the property include a 15,000 SF, 345-seat full service cafeteria, a 15,000 SF fitness center with a basketball court, numerous conference/meeting rooms and a 3-level below-grade parking structure with 1,258 spaces. The sponsors are also in the process of completing Borrower’s Work, which is expected to include an above-grade parking deck with additional surface parking that will add an additional 550 parking spaces, for a total of 1,820 parking spaces (4.0 spaces per 1,000 SF).
The sponsors acquired the property vacant in December 2013 for $42.5 million and as of August 1, 2017 had a current reported cost basis of approximately $133.7 million. As of July 20, 2017, the sponsors have spent $25.4 million of the approximately $48.4 million of upfront reserves related to capital improvements taken at loan origination.
The property is located along Route 124 which provides access to downtown Morristown and interchanges with I-287, 2.8 miles north. The property is also located approximately two miles south of an interchange with Route 24 which runs northwest/southeast and connects with I-95 (The New Jersey Turnpike) to the west of the property, which provides access to various localities in New Jersey, as well as Delaware, Pennsylvania, and New York.
The Market. The property is located in Madison, New Jersey in Morris County which is between Morristown (4.2 miles north) and Newark (21.5 miles east) and part of the NY-Newark-Long Island metropolitan statistical area. According to the appraisal, Morris County is located approximately 25 miles west of New York City and is the sixth-wealthiest county in the United States by median household income. Major economic drivers include the presence of both national and international Fortune 500 companies including Bayer, Maersk, Kraft Foods, and ADP. Additionally, the area features a number of colleges and universities including Fairleigh Dickinson University (enrollment of 11,500 students), Drew University, and The College of Saint Elizabeth. According to a third party research report, the estimated 2016 population within a one-, three- and five-mile radius of the property was 8,675, 50,318 and 127,304, respectively. The estimated 2016 average household income within a one-, three- and five-mile radius of the property was $159,154, $165,477 and $161,496, respectively.
According to a third party report, as of the second quarter of 2017, the Northern New Jersey Office market contained 151.9 million SF of office space with an overall vacancy rate of 14.9% and asking rental rates if $25.09 PSF. The appraisal concluded Morristown submarket rents of $27.62 PSF as of the second quarter of 2016. According to the appraisal, the property’s competitive set consists of the five properties detailed in the table below.
THE INFORMATION IN THIS COLLATERAL TERM SHEET IS NOT COMPLETE AND MAY BE AMENDED PRIOR TO THE TIME OF SALE. THIS TERM SHEET IS NOT AN OFFER TO SELL THESE SECURITIES AND IT IS NOT A SOLICITATION OF AN OFFER TO BUY THESE SECURITIES IN ANY JURISDICTION WHERE THE OFFER OR SALE IS NOT PERMITTED.
125
Mortgage Loan No. 8 — Allergan HQ
Competitive Set Summary(1)
| Property | Year Built / Renovated | Total GLA (SF) | Est. Rent PSF | Est. Occ. | Proximity (miles) | Anchor Tenants |
| 14 Sylvan Way | 2013/NAP | 203,000 | $25.80 | 100% | 8.4 | Wyndham Worldwide |
| 45 Waterview Blvd | NAV/NAV | 106,680 | $22.20 | 100% | 11.0 | DSM Nutritional Products |
| 100 College Road West | 2000/NAP | 154,101 | $26.53 | 100% | 45.7 | Sandoz |
| 22 Sylvan Way | 2009/NAP | 249,409 | $23.74 | 100% | 8.3 | Wyndham Worldwide |
| 2 Giralda Farms | 2000/NAP | 146,366 | $23.00 | 100% | 0.8 | Merck |
| (1) | Source: Appraisal. |
Historical and Current Occupancy(1)
| 2013 | 2014 | 2015 | 2016 | Current(2) |
| N/A | N/A | N/A | N/A | 98.0% |
| (1) | Source: Historical Occupancy is not available. |
| (2) | Based on the August 5, 2017 underwritten rent roll. Allergan has not yet taken physical occupancy but expects to take occupancy and move in employees in phases starting in September 2017. Following the substantial completion of Borrower’s Work, the rent commencement date under the Allergan lease will be fixed as of July 1, 2018. |
Tenant Summary(1)
| Tenant | Ratings Moody’s/S&P/Fitch(2) | Net Rentable Area (SF)(3) | % of Total NRA(3) | Base Rent PSF | % of Total Base Rents | Lease Expiration Date |
| Allergan(4) | NA / BBB / BBB- | 431,495 | 95.1% | $22.63 | 97.2% | 6/30/2030 |
| Bright Horizons | NA / NA / NA | 12,985 | 2.9% | $22.00 | 2.8% | 4/30/2022 |
| (1) | Based on the underwritten rent roll which includes rent step through January 2018 for Bright Horizons and rent averaging through the lease term for Allergan. |
| (2) | Ratings provided are for the parent company of the entity listed in the “Tenant” field whether or not the parent company guarantees the lease. The Fitch rating is an issuer default rating for Warner Chilcott, a subsidiary of the parent company which guarantees the lease. |
| (3) | Total NRA includes 9,200 SF for the Carriage House, an on-site house expected to be used to host various events and meetings. The space is marked as vacant in the borrower certified rent roll and no income is attributed to the space in the underwriting. |
| (4) | Allergan has not yet taken physical occupancy but expects to take occupancy and move in employees in phases starting in September 2017. Following the substantial completion of Borrower’s Work, the rent commencement date under Allergan lease will be fixed as of July 1, 2018. A free rent reserve in an amount of $14,176,409 was reserved at the origination of the Allergan HQ Whole Loan. |
THE INFORMATION IN THIS COLLATERAL TERM SHEET IS NOT COMPLETE AND MAY BE AMENDED PRIOR TO THE TIME OF SALE. THIS TERM SHEET IS NOT AN OFFER TO SELL THESE SECURITIES AND IT IS NOT A SOLICITATION OF AN OFFER TO BUY THESE SECURITIES IN ANY JURISDICTION WHERE THE OFFER OR SALE IS NOT PERMITTED.
126
Mortgage Loan No. 8 — Allergan HQ
Lease Rollover Schedule(1)
| Year | Number of Leases Expiring | NRA Expiring(2) | % of NRA Expiring(2) | Base Rent Expiring | % of Base Rent Expiring | Cumulative NRA Expiring(2) | Cumulative % of NRA Expiring(2) | Cumulative Base Rent Expiring | Cumulative % of Base Rent Expiring |
| Vacant | NAP | 9,200 | 2.0% | NAP | NAP | 9,200 | 2.0% | NAP | NAP |
| MTM | 0 | 0 | 0.0 | $0 | 0.0% | 9,200 | 2.0% | $0 | 0.0% |
| 2017 | 0 | 0 | 0.0 | 0 | 0.0 | 9,200 | 2.0% | $0 | 0.0% |
| 2018 | 0 | 0 | 0.0 | 0 | 0.0 | 9,200 | 2.0% | $0 | 0.0% |
| 2019 | 0 | 0 | 0.0 | 0 | 0.0 | 9,200 | 2.0% | $0 | 0.0% |
| 2020 | 0 | 0 | 0.0 | 0 | 0.0 | 9,200 | 2.0% | $0 | 0.0% |
| 2021 | 0 | 0 | 0.0 | 0 | 0.0 | 9,200 | 2.0% | $0 | 0.0% |
| 2022 | 1 | 12,985 | 2.9 | 285,670 | 2.8 | 22,185 | 4.9% | $285,670 | 2.8% |
| 2023 | 0 | 0 | 0.0 | 0 | 0.0 | 22,185 | 4.9% | $285,670 | 2.8% |
| 2024 | 0 | 0 | 0.0 | 0 | 0.0 | 22,185 | 4.9% | $285,670 | 2.8% |
| 2025 | 0 | 0 | 0.0 | 0 | 0.0 | 22,185 | 4.9% | $285,670 | 2.8% |
| 2026 | 0 | 0 | 0.0 | 0 | 0.0 | 22,185 | 4.9% | $285,670 | 2.8% |
| 2027 & Beyond | 1 | 431,495 | 95.1 | 9,765,747 | 97.2 | 453,680 | 100.0% | $10,051,417 | 100.0% |
| Total | 2 | 453,680 | 100.0% | $10,051,417 | 100.0% |
| (1) | Based on the underwritten rent roll. Rent includes base rent and rent step through January 2018 for Bright Horizons and rent averaging through the lease term for Allergan. Following the substantial completion of Borrower’s Work, the rent commencement date under Allergan lease will be fixed as of July 1, 2018. A free rent reserve in an amount of $14,176,409 was reserved at the origination of the Allergan HQ Whole Loan. |
| (2) | Total NRA includes 9,200 SF for the Carriage House, which is currently vacant. |
THE INFORMATION IN THIS COLLATERAL TERM SHEET IS NOT COMPLETE AND MAY BE AMENDED PRIOR TO THE TIME OF SALE. THIS TERM SHEET IS NOT AN OFFER TO SELL THESE SECURITIES AND IT IS NOT A SOLICITATION OF AN OFFER TO BUY THESE SECURITIES IN ANY JURISDICTION WHERE THE OFFER OR SALE IS NOT PERMITTED.
127
Mortgage Loan No. 8 — Allergan HQ
Operating History and Underwritten Net Cash Flow(1)(2)
| Appraisal | Underwritten | PSF | %(3) | |
| Rents in Place | $9,227,129 | $10,051,417 | $22.16 | 74.8% |
| Vacant Income | 0 | 0 | 0.00 | 0.0% |
| Gross Potential Rent | $9,227,129 | $10,051,417 | $22.16 | 74.8% |
| Total Reimbursements | 3,660,786 | 3,387,892 | 7.47 | 25.2% |
| Net Rental Income | $12,887,915 | $13,439,309 | $29.62 | 100.0% |
| (Vacancy/Collection Loss) | (27,254) | (671,965) | (1.48) | (5.0%) |
| Other Income | 0 | 0 | 0.00 | 0.0% |
| Effective Gross Income | $12,860,661 | $12,767,344 | $28.14 | 95.0% |
| Total Expenses | $3,788,607 | $4,045,277 | $8.92 | 31.7% |
| Net Operating Income | $9,072,054 | $8,722,066 | $19.23 | 68.3% |
| Total TI/LC, Capex/RR | 48,870 | 68,052 | 0.15 | 0.5% |
| Net Cash Flow | $9,023,184 | $8,654,014 | $19.08 | 67.8% |
| (1) | The property was acquired in 2013 and underwent renovations since the acquisition, which are expected to be completed in 2017. Thus, historical cash flows are not available. |
| (2) | Based on the underwritten rent roll. Rent includes base rent and rent step through January 2018 for Bright Horizons and rent averaging through the lease term for Allergan, which assumes the timely completion of Borrower’s Work. |
| (3) | Percentage column represents percent of Net Rental Income for all revenue lines and represents percent of Effective Gross Income for the remainder of fields. |
Property Management. The property is managed by Lincoln Equities Group, LLC through its management arm, Linque Management Company, Inc., an affiliate of the sponsors.
Escrows and Reserves. At origination, the borrower deposited $23,477,865 upfront in escrow for tenant improvements allowance required to be paid by the borrower to Allergan, $14,176,409 upfront in escrow for Allergan free rent, $9,784,200 upfront in escrow for borrower’s construction of certain additional parking facilities (“Borrower’s Work”), $6,825,000 upfront in escrow for base building allowance required to be paid by the borrower to Allergan, $5,728,098 upfront in escrow for Allergan leasing commission reserve, $1,903,115 upfront in escrow for FFE&T allowance required to be paid by the borrower to Allergan, $593,753 upfront in escrow for annual real estate taxes, $552,438 upfront in escrow for deferred maintenance, $404,058 upfront in escrow for operating expenses, $135,000 upfront in escrow for valet parking expenses required to be paid by the borrower to Allergan, $104,692 upfront in escrow for Bright Horizons free rent, $97,388 upfront in escrow for Bright Horizons tenant improvement allowance required to be paid by the borrower to Bright Horizons and $47,573 upfront in escrow for annual insurance premiums.
Insurance Escrows – On a monthly basis, the borrower is required to escrow 1/12th of the annual insurance premiums, which currently equates to $23,787.
Replacement Reserves – On a monthly basis, the borrower is required to escrow $5,671 for replacement reserves.
Tax Escrows –So long as, among other conditions, (i) the Allergan lease is in full force and effect with no defaults thereunder, (ii) the Allergan tenant has taken occupancy and is paying operating costs under the lease, (iii) the Allergan tenant is paying all taxes for its leased premises, and (iv) the borrower provides the lender with evidence thereof in form and substance reasonable acceptable to the lender (collectively, the “Tax Escrow Waiver Requirements”), then the borrower is only obligated to escrow, on a monthly bases, an amount equal to 1/12th of the estimated amount of taxes that the borrower is obligated to pay under the Allergan lease for the portion of the property not leased by Allergan (the “Borrower-Allocable Taxes”), which such Borrower-Allocable Taxes will be paid by the borrower directly to the applicable governmental authority or reimbursed by the borrower to the Allergan tenant. Following the date that the Tax Escrow Waiver Requirements fail to be satisfied and until such time as all of the Tax Escrow Waiver Requirements are satisfied again, borrower will be required to escrow Taxes for the entire property. The
THE INFORMATION IN THIS COLLATERAL TERM SHEET IS NOT COMPLETE AND MAY BE AMENDED PRIOR TO THE TIME OF SALE. THIS TERM SHEET IS NOT AN OFFER TO SELL THESE SECURITIES AND IT IS NOT A SOLICITATION OF AN OFFER TO BUY THESE SECURITIES IN ANY JURISDICTION WHERE THE OFFER OR SALE IS NOT PERMITTED.
128
Mortgage Loan No. 8 — Allergan HQ
estimated monthly tax deposit to be made by the borrower during the period that the Tax Escrow Waiver Requirements are satisfied is approximately $3,539.
Lockbox / Cash Management. The Allergan HQ Whole Loan is structured with a hard lockbox and in-place cash management. The Allergan HQ Whole Loan documents requires all rents to be transmitted directly into a lockbox account controlled by the lender (including, without limitation, by sending tenant direction letters to all tenants at origination/new lease execution). All funds in the lockbox account are required to be swept on each business day to a cash management account controlled by the lender, and applied and disbursed in accordance with the Allergan HQ Whole Loan documents. If a Cash Trap Period (as defined below) is occurring, excess cash will be held as additional security for the Allergan HQ Whole Loan. Upon the termination of any Cash Trap Period, excess cash will no longer be held by the lender and, provided that no event of default has occurred and is continuing, all amounts then on deposit in the cash collateral reserve account will be disbursed to the borrower.
A “Cash Trap Period” will commence upon: (i) an event of default under the Allergan HQ Whole Loan documents; (ii) the failure by the borrower, after the end of a calendar quarter, to maintain a debt service coverage ratio of at least 1.10x or (iii) a Primary Tenant Sweep Period (as defined below). The Cash Trap Period will end upon the earlier to occur of: (1) the loan and all other obligations under the loan documents have been repaid in full; (2) there has been a full defeasance of the loan; (3) in the case of a Cash Trap Period triggered by an event described in subclause (ii) above only, for six consecutive months since the commencement of the existing Cash Trap Period (a) no event of default has occurred that has not been cured (and lender has accepted such cure), (b) no event that would trigger another Cash Trap Period has occurred, and (c) the debt service coverage ratio is at least equal to 1.15x ; (4) to the extent that the Cash Trap Period commenced as a result of the occurrence of a Primary Tenant Sweep Period, a Primary Tenant Sweep Period Cure (as defined below) has occurred and no event that would trigger another Cash Trap Period has occurred; or (5) in the case of a Cash Trap Period triggered by an event described in subclause (i) above only, the cure of such event of default and the acceptance by lender of such cure.
A “Primary Tenant Sweep Period” will commence upon: (i) any termination of, or receipt by borrower of a notice to terminate, the Primary Tenant Lease (as defined below); (ii) Primary Tenant (as defined below) becoming the subject of a bankruptcy action; (iii) Primary Tenant “going dark” in all or a portion of the Primary Tenant premises such that Primary Tenant is occupying less than 70.0% of the Primary Tenant premises at any time from and after the second anniversary of the date hereof; (iv) the occurrence of any monetary or material non-monetary default (beyond any applicable notice and/or cure period) by Primary Tenant under the Primary Tenant Lease or (v) the date that a Primary Tenant credit rating downgrade has occurred under the loan documents; provided however, that the continuance of a Primary Tenant Sweep Period will be suspended (but will not be deemed to have been terminated) for so long as the amount deposited in the Primary Tenant reserve subaccount during the continuance of such Primary Tenant Sweep Period is equal to or exceeds $21,574,750.
A “Primary Tenant” means initially Allergan as tenant under the Allergan lease, and thereafter any acceptable replacement tenant thereof occupying all or substantially all of the Primary Tenant premises.
A “Primary Tenant Lease” means initially the Allergan lease, and thereafter the lease of any acceptable replacement tenant occupying all or substantially all of the Primary Tenant premises.
A “Primary Tenant Sweep Period Cure” will have occurred (A) with respect to clause (i) of the definition of “Primary Tenant Sweep Period”, if a Primary Tenant Replacement Event (as defined below) has occurred; (B) with respect to clause (ii) of the definition of “Primary Tenant Sweep Period”, if the bankruptcy action is dismissed and the primary tenant lease is affirmed or the bankruptcy action is not dismissed and the Primary Tenant Lease is assumed by the Primary Tenant pursuant to a final order of the bankruptcy court, and, in connection therewith, the Primary Tenant cures all defaults in the Primary Tenant Lease and the Primary Tenant provides adequate assurance of future performance; (C) with respect to clause (iii) of the definition of “Primary Tenant Sweep Period”, if a Primary Tenant or another tenant re-opens for business and is actually occupying 70.0% or more of the Primary Tenant premises for a continuous period of not less than three months; (D) with respect to clause (iv) of the definition of “Primary Tenant Sweep Period”, the monetary or material non-monetary default is cured and no other monetary or material non-monetary default (beyond any applicable notice and/or cure period) exists under the Primary Tenant Lease and (E)
THE INFORMATION IN THIS COLLATERAL TERM SHEET IS NOT COMPLETE AND MAY BE AMENDED PRIOR TO THE TIME OF SALE. THIS TERM SHEET IS NOT AN OFFER TO SELL THESE SECURITIES AND IT IS NOT A SOLICITATION OF AN OFFER TO BUY THESE SECURITIES IN ANY JURISDICTION WHERE THE OFFER OR SALE IS NOT PERMITTED.
129
Mortgage Loan No. 8 — Allergan HQ
with respect to clause (v) of the definition of “Primary Tenant Sweep Period”, if the applicable credit rating downgrade has been cured.
A “Primary Tenant Replacement Event” means the termination of the Primary Tenant Lease and the borrower entering into a new lease for all of the Primary Tenant premises with an acceptable replacement tenant upon such terms and conditions as are reasonably acceptable to lender in all respects, including, without limitation, the following terms and conditions: (i) a term equal to not less than the greater of (x) five years and (y) a term with an expiration date of the then-current expiration date of the Allergan lease, (ii) an annual net effective rental rate of not less than 94.0% of the annual net effective rental rate under the Allergan lease for each of the years remaining in the Allergan lease term until the then-existing expiration date, and (iii) and such other terms and conditions reasonably acceptable to the lender.
Additional Debt.In addition to the A Note, the property is also security for the B Note. The B Note has an outstanding principal balance as of the cut-off date of $50.0 million and a coupon of 6.6000%. The Allergan HQ Whole Loan (inclusive of the B Note) has a cut-off date LTV of 55.2% based on $172.0 million “as-stabilized” value, an UW NCF DSCR of 1.64x and an UW NOI Debt Yield of 9.2%. The $20.0 million mezzanine debt, which consists of a $10.0 million senior mezzanine loan (the “Allergen HQ Senior Mezzanine”) and a $10.0 million junior mezzanine loan (the “Allergen HQ Junior Mezzanine”), was provided in connection with the financing of the property is secured by the senior mezzanine borrower’s equity interest in the borrower and the junior mezzanine borrower’s equity interest in the Allergen HQ Senior Mezzanine loan borrower, respectively, and are coterminous with the mortgage loan. The Allergen HQ Senior Mezzanine has an outstanding principal balance as of cut-off date of $10.0 million and has a coupon of 10.5000%. Including the Allergen HQ Senior Mezzanine, the cut-off date LTV is 61.0% based on $172.0 million “as-stabilized” value, the UW NCF DSCR is 1.36x and the UW NOI Debt Yield is 8.3%. The Allergen HQ Junior Mezzanine has an outstanding principal balance as of cut-off date of $10.0 million and has a coupon of 5.5000%. Including both the Allergen HQ Senior Mezzanine and the Allergen HQ Junior Mezzanine, the cut-off date LTV is 66.9% based on $172.0 million “as-stabilized” value and the UW NOI Debt Yield is 7.6%. The Allergen HQ Junior Mezzanine has a fixed amortization schedule. The UW NCF DSCR for the Allergen HQ Junior Mezzanine is calculated based on the aggregate debt service payable for the Allergan HQ Whole Loan, the Allergen HQ Senior Mezzanine and the Allergen HQ Junior Mezzanine for the 12-month period commencing March 2025 is 1.01x. The mortgage and mezzanine lenders have entered into an intercreditor agreement as described in the Preliminary Prospectus under “Description of the Mortgage Pool Additional Indebtedness Mezzanine Debt”. The mezzanine loans have been be sold to third party investors.
THE INFORMATION IN THIS COLLATERAL TERM SHEET IS NOT COMPLETE AND MAY BE AMENDED PRIOR TO THE TIME OF SALE. THIS TERM SHEET IS NOT AN OFFER TO SELL THESE SECURITIES AND IT IS NOT A SOLICITATION OF AN OFFER TO BUY THESE SECURITIES IN ANY JURISDICTION WHERE THE OFFER OR SALE IS NOT PERMITTED.
130
(THIS PAGE INTENTIONALLY LEFT BLANK)
131
Mortgage Loan No. 9 — JW Marriott Chicago

THE INFORMATION IN THIS COLLATERAL TERM SHEET IS NOT COMPLETE AND MAY BE AMENDED PRIOR TO THE TIME OF SALE. THIS TERM SHEET IS NOT AN OFFER TO SELL THESE SECURITIES AND IT IS NOT A SOLICITATION OF AN OFFER TO BUY THESE SECURITIES IN ANY JURISDICTION WHERE THE OFFER OR SALE IS NOT PERMITTED.
132
Mortgage Loan No. 9 — JW Marriott Chicago

THE INFORMATION IN THIS COLLATERAL TERM SHEET IS NOT COMPLETE AND MAY BE AMENDED PRIOR TO THE TIME OF SALE. THIS TERM SHEET IS NOT AN OFFER TO SELL THESE SECURITIES AND IT IS NOT A SOLICITATION OF AN OFFER TO BUY THESE SECURITIES IN ANY JURISDICTION WHERE THE OFFER OR SALE IS NOT PERMITTED.
133
Mortgage Loan No. 9 — JW Marriott Chicago
THE INFORMATION IN THIS COLLATERAL TERM SHEET IS NOT COMPLETE AND MAY BE AMENDED PRIOR TO THE TIME OF SALE. THIS TERM SHEET IS NOT AN OFFER TO SELL THESE SECURITIES AND IT IS NOT A SOLICITATION OF AN OFFER TO BUY THESE SECURITIES IN ANY JURISDICTION WHERE THE OFFER OR SALE IS NOT PERMITTED.
134
Mortgage Loan No. 9 — JW Marriott Chicago
| Mortgage Loan Information | Property Information | |||
| Mortgage Loan Seller: | Natixis | Single Asset / Portfolio: | Single Asset | |
| Original Principal Balance(1): | $40,000,000 | Title: | Fee | |
| Cut-off Date Principal Balance(1): | $40,000,000 | Property Type - Subtype: | Hotel – Full Service | |
| % of Pool by IPB: | 4.7% | Net Rentable Area (Rooms): | 610 | |
| Credit Assessment (KBRA)(2): | BBB | Location: | Chicago, IL | |
| Loan Purpose: | Refinance | Year Built / Renovated: | 1914 / 2010 | |
| Borrower: | UST Prime III Hotel Owner, L.P. | Occupancy / ADR / RevPAR: | 76.1% / $270.43 / $205.72 | |
| Sponsor: | Lothar Estein | Occupancy / ADR / RevPAR Date: | 4/30/2017 | |
| Interest Rate: | 4.0441% | Number of Tenants: | N/A | |
| Note Date: | 7/21/2017 | 2014 NOI: | $18,997,021 | |
| Maturity Date: | 8/5/2022 | 2015 NOI: | $20,511,003 | |
| Interest-only Period: | 60 months | 2016 NOI: | $21,191,265 | |
| Original Term: | 60 months | TTM NOI(4): | $21,321,433 | |
| Original Amortization: | None | UW Occupancy / ADR / RevPar: | 76.1% / $270.43 / $205.72 | |
| Amortization Type: | Interest Only | UW Revenues: | $71,959,137 | |
| Call Protection(3): | L(25),Def(31),O(4) | UW Expenses: | $50,733,018 | |
| Lockbox: | Hard | UW NOI: | $21,226,120 | |
| Additional Debt(1): | Yes | UW NCF: | $18,347,754 | |
| Additional Debt Balance(1): | $230,000,000 | Appraised Value / Per Room: | $370,400,000 / $607,213 | |
| Additional Debt Type(1): | Pari Passu, B-Note, Mezzanine | Appraisal Date: | 5/2/2017 | |
| Additional Future Debt Permitted: | No |
| Escrows and Reserves(5) | Financial Information(1) | |||||
| Initial | Monthly | Initial Cap | Cut-off Date Loan / Room: | $130,000 | ||
| Taxes: | $223,974 | $223,974 | N/A | Maturity Date Loan / Room: | $130,000 | |
| Insurance: | $198,332 | $24,791 | N/A | Cut-off Date LTV: | 21.4% | |
| Replacement Reserves: | $0 | Springing | N/A | Maturity Date LTV: | 21.4% | |
| Deferred Maintenance: | $13,554 | $0 | N/A | UW NOI DSCR: | 6.53x | |
| Seasonal Reserve: | $2,000,000 | Springing | N/A | UW NCF DSCR: | 5.64x | |
| UW NOI Debt Yield: | 26.8% | |||||
| UW NCF Debt Yield: | 23.1% | |||||
| Sources and Uses | ||||||
| Sources | Proceeds | % of Total | Uses | Proceeds | % of Total | |
| Whole Mortgage Loan | $203,500,000 | 72.9% | Payoff Existing Debt | $266,411,442 | 95.5% | |
| Mezzanine Loan | 66,500,000 | 23.8 | Upfront Reserves | 2,435,860 | 0.9 | |
| Sponsor Equity | 9,000,000 | 3.2 | Closing Costs | 10,152,699 | 3.6 | |
| Total Sources | $279,000,000 | 100.0% | Total Uses | $279,000,000 | 100.0% |
| (1) | The JW Marriott Chicago loan is a part of a larger split whole loan (the “JW Marriott Chicago Whole Loan”) evidenced by three seniorpari passu notes with an aggregate principal balance as of the cut-off date of $79.3 million and three subordinate promissory notes with an aggregate principal balance of $124.2 million. The JW Marriott Chicago Whole Loan is accompanied by a mezzanine loan with an original principal balance of $66.5 million (the “JW Marriott Chicago Mezzanine Loan”). The financial information presented in the chart above and herein reflects the cut-off date balance of the $79.3 million A Notes, but not the $124.2 million B Notes or the $66.5 million JW Marriott Chicago Mezzanine Loan. For a more detailed description of the JW Marriott Chicago Whole Loan, please refer to “The Loan” and “Additional Debt” below. |
THE INFORMATION IN THIS COLLATERAL TERM SHEET IS NOT COMPLETE AND MAY BE AMENDED PRIOR TO THE TIME OF SALE. THIS TERM SHEET IS NOT AN OFFER TO SELL THESE SECURITIES AND IT IS NOT A SOLICITATION OF AN OFFER TO BUY THESE SECURITIES IN ANY JURISDICTION WHERE THE OFFER OR SALE IS NOT PERMITTED.
135
Mortgage Loan No. 9 — JW Marriott Chicago
| (2) | KBRA has each confirmed that the loan has, in the context of tis inclusion in the Initial Poll Balance, credit characteristics consistent with an investment grade obligation. |
| (3) | The lockout period will be at least 25 payments beginning with and including the first payment date of September 5, 2017. Prepayment of the full JW Marriott Chicago Whole Loan is permitted at any time after the earlier to occur of (i) July 21, 2021 or (ii) the date that is two years after the closing date of the securitization that includes the last note to be securitized. For a more detailed description of lockbox, please refer to “Lockbox / Cash Management” below. |
| (4) | Represents the trailing twelve month period ending April 30, 2017. |
| (5) | For a more detailed description of Escrows and Reserves, please refer to “Escrows and Reserves” below. |
The Loan. The JW Marriott Chicago loan, which is part of a larger split whole loan, is a $40.0 million first mortgage loan secured by the fee interest in a 610 room full service hotel property located in Chicago, Illinois. The loan has a five-year term and is interest-only for the term of the loan. The whole loan has an outstanding principal balance of $203.5 million (the “JW Marriott Chicago Whole Loan”), which is comprised of six notes identified as Note A-1, Note A-2, and Note A-3 (collectively, the “A Notes”), and Note B-1-A, Note B-1-B, and Note B-2 (collectively, the “B Notes”). The six notes have outstanding balances of $40.0 million, $28.5 million, $10.8 million, $37.0 million, $30.0 million, and $57.2 million for Note A-1, Note A-2, Note A-3, Note B-1-A, Note B-1-B, and Note B-2, respectively.
Note A-1 has an outstanding principal balance as of the cut-off date of $40.0 million and is being contributed to the CSAIL 2017-CX9 Commercial Mortgage Trust. Note A-2 was previously securitized in UBS 2017-C3 Commercial Mortgage Trust, Note A-3 is currently held by Natixis and is expected to be contributed to one or more future securitization transactions, and Note B-1-A, Note B-1-B, and Note B-2 were sold to unaffiliated third party investors.
Note A-1 accrues interest at the same rate as thepari passu Note A-2 and Note A-3 and is entitled to payments of interest and principal on apro rata andpari passu basis with Note A-2 and Note A-3, and Note B-1-A, Note B-1-B, and Note B-2 are subordinate notes, as and to the extent described under “Description of the Mortgage Pool–The Whole Loans” in the Preliminary Prospectus. The holders of the A Notes and the B Notes have entered into a co-lender agreement pursuant to which Note B-2 was designated the initial “controlling note”. Unless a control termination event has occurred and subject to certain other conditions, the special servicer with respect to the CSAIL 2017-CX9 Commercial Mortgage Trust will not be permitted to implement certain major decisions over the objection of the holder of Note B-2. The JW Marriott Chicago Whole Loan will be serviced pursuant to terms of the pooling and servicing agreement governing CSAIL 2017-CX9. See “Description of the Mortgage Pool—The Whole Loans” in the Preliminary Prospectus.
Whole Loan Note Summary
| Original Balance | Cut-off Date Balance | Note Holder | Lead Servicer for Whole Loan (Y/N) | Controlling Piece (Y/N) | |
| Note A-1 | $40,000,000 | $40,000,000 | CSAIL 2017-CX9 | Y | N |
| Note A-2 | 28,500,000 | 28,500,000 | UBS 2017-C3 | N | N |
| Note A-3 | 10,800,000 | 10,800,000 | Natixis | N | N |
| Note B-1-A | 37,000,000 | 37,000,000 | Third Party Investor | N | N |
| Note B-1-B | 30,000,000 | 30,000,000 | Third Party Investor | N | N |
| Note B-2 | 57,200,000 | 57,200,000 | Third Party Investor | N | Y |
| Total | $203,500,000 | $203,500,000 |
THE INFORMATION IN THIS COLLATERAL TERM SHEET IS NOT COMPLETE AND MAY BE AMENDED PRIOR TO THE TIME OF SALE. THIS TERM SHEET IS NOT AN OFFER TO SELL THESE SECURITIES AND IT IS NOT A SOLICITATION OF AN OFFER TO BUY THESE SECURITIES IN ANY JURISDICTION WHERE THE OFFER OR SALE IS NOT PERMITTED.
136
Mortgage Loan No. 9 — JW Marriott Chicago
JW Marriott Chicago Total Debt Capital Structure

| (1) | Cumulative basis per room is calculated based on 610 rooms. |
| (2) | Based on an as-is appraised value of $370.4 million ($607,213 per room) as of May 2, 2017 per the appraisal. |
| (3) | Based on the UW NOI of approximately $21.2 million. |
| (4) | Based on the UW NCF of approximately $18.3 million and the coupon of 4.0441% on the aggregation of Note A-1, Note A-2 and Note A-3, the coupon of 4.3000% on the Note B-1-A and Note B-1-B, the coupon of 5.8200% on the Note B-2, and the coupon of 7.5000% on the JW Marriott Chicago Mezzanine Loan. |
| (5) | Implied Equity is based on the as-is appraised value of $370.4 million, less total debt of $270.0 million. |
The Borrower. The borrowing entity for the loan is UST Prime III Hotel Owner, L.P., a Delaware limited partnership and special purpose entity. The borrowing entity is owned by 99% by Lothar Estein.
The Sponsor. The loan’s sponsor is Lothar Estein and nonrecourse carve-out guarantor is Estein Holdings, Ltd., which is 99% owned by Mr. Estein. Mr. Estein the founder and CEO of Estein USA, an investor in US commercial assets and has been involved in commercial real estate investment since 1974 and in US commercial real estate since 1978. Mr. Estein is responsible for the investment of more than $5 billion of equity in real estate investments. The nonrecourse carve-out guarantor is Estein Holdings, Ltd., which is 99% owned by Mr. Estein. Based on its June 2017 balance sheet, Estein Holdings, Ltd. reported total assets of approximately $23.4 million, total equity of approximately $23.4 million, and liquidity of approximately $4.0 million.
THE INFORMATION IN THIS COLLATERAL TERM SHEET IS NOT COMPLETE AND MAY BE AMENDED PRIOR TO THE TIME OF SALE. THIS TERM SHEET IS NOT AN OFFER TO SELL THESE SECURITIES AND IT IS NOT A SOLICITATION OF AN OFFER TO BUY THESE SECURITIES IN ANY JURISDICTION WHERE THE OFFER OR SALE IS NOT PERMITTED.
137
Mortgage Loan No. 9 — JW Marriott Chicago
The Property. The property is a 610-room, JW Marriott-branded luxury hotel property located in Chicago, Illinois. The property originally served as a 22-story, 1,074,385 SF office building with ground level retail that was constructed in 1914. In 2005, the Prime Group Inc (“Prime”) purchased the building for approximately $148.3 million, with $100.2 million allocated to the future JW Marriott Chicago space and $48.1 million allocated to the office/retail space. In 2008, the borrower sponsor entered into a joint venture with Prime, formed the borrower entity, and began converting/renovating the lobby level through the 12th floor, as well as two lower levels. From March 2008 through March 2010, the property underwent a redevelopment and renovation for a total cost of approximately $312.1 million ($511,619 per room) bringing the borrower’s total cost basis to approximately $412.6 million ($676,384 per room). Upon completion of renovations, the property reopened as a JW Marriott Hotel. In 2014, the joint venture sold its interest in the office / retail portion of the property and the borrower sponsor assumed 99% ownership interest in the borrower.
The collateral consists of the hotel that occupies the lobby level through the 12th floor, as well as two lower levels, including 41,797 SF of meeting space spread throughout the lower level, 3rd, and 4th floors. The property contains 18,317 SF of ground floor retail space and office space on floors 13 through 22, both of which are not part of the collateral. The hotel’s entrance, lobby, and elevator service are separate from the office portion of the building. The property is vertically subdivided and subject to a reciprocal easement agreement.
The guestroom unit mix at the property consists of 292 king rooms, 289 queen rooms, 26 suites and three 3/4/5 bay suites. Guestrooms range in size from 420 SF to 2,200 SF and feature flat screen televisions with premium channel selection, a desk with chair, premium bedding, lamps and lounge chairs, and luxury appointments. Guestrooms also offer complementary wireless high-speed Internet access for Marriott Rewards members. Off-site parking is provided via a third-party valet service. Management is budgeting nearly $21.9 million ($35,902 per room) for renovations and upgrades expected to take place over the next five years, the majority of which will include guest rooms renovations in 2020.
The property’s lobby is a two-story, classical entrance lobby that faces Adams Street. The lobby is clad in marble with glass chandeliers and features a Marriott branded casual dining restaurant and bar called the Lobby Lounge, as well as a gift shop. The 2nd floor features the Grand Ballroom and The Florentine Restaurant, a fine dining Italian restaurant, operated by ESquared Hospitality. The 4th floor features the Burnham Ballroom. There are also meeting spaces spread throughout the lower level, 3rd and 4th floors for a total of 41,797 SF of meeting space. Other amenities include Virtual Meeting by Marriott system featuring Cisco TelePresence, a business center, an indoor swimming pool, and the SPA at JW Chicago, a 20,000 SF full-service spa and fitness center open 24 hours. The property is equipped with six passenger elevators that service the hotel floors and two passenger elevators that service the floors with meeting space.
The property is located at 151 West Adams Street in Chicago, Illinois, occupying a full city block between South Wells Street and South LaSalle Street in the Central Loop of the Chicago central business district. The property is the only luxury, five-star hotel in the Chicago Loop and the building has been designated as a historic landmark by the city, state, and federal landmark commissions, and has been added to the National Register of Historic Places.
According to the appraisal, the property generates approximately 60% of its room revenue from transient demand which includes both commercial and leisure and 40% from meeting and group demand. The key corporate/transient demand driver is the property’s close proximity to major national and international corporations located in the Chicago Loop such as such as United Airlines, IBM, Deloitte, MillerCoors, and Exelon. The property is also blocks away from the Willis Tower, the Federal Reserve Bank of Chicago, the Chicago Board of Trade Building, and the headquarters of multiple banks.
Since its opening, the property’s performance has improved year over year, evidenced by increased RevPAR and net cash flow. Per the STR report, the property continues to outperform its competitive set with a 2016 RevPAR penetration of 117.0%. The property achieved 2016 occupancy, ADR, and RevPAR of 74.8%, $273.08, and $204.18, respectively. As of May 2017, the property is performing ahead of budget and management.
THE INFORMATION IN THIS COLLATERAL TERM SHEET IS NOT COMPLETE AND MAY BE AMENDED PRIOR TO THE TIME OF SALE. THIS TERM SHEET IS NOT AN OFFER TO SELL THESE SECURITIES AND IT IS NOT A SOLICITATION OF AN OFFER TO BUY THESE SECURITIES IN ANY JURISDICTION WHERE THE OFFER OR SALE IS NOT PERMITTED.
138
Mortgage Loan No. 9 — JW Marriott Chicago
Historical Occupancy, ADR, RevPAR(1)
Competitive Set | JW Marriott Chicago Hotel | Penetration Factor | |||||||
| Year | Occupancy | ADR | RevPAR | Occupancy | ADR | RevPAR | Occupancy | ADR | RevPAR |
| 2014 | 74.8% | $233.54 | $174.67 | 72.9% | $258.14 | $188.13 | 97.4% | 110.5% | 107.7% |
| 2015 | 72.3% | $242.96 | $175.62 | 75.7% | $267.95 | $202.85 | 104.7% | 110.3% | 115.5% |
| 2016 | 72.1% | $241.94 | $174.44 | 74.8% | $273.08 | $204.18 | 103.7% | 112.9% | 117.0% |
| TTM(2) | 72.7% | $240.28 | $174.64 | 76.1% | $272.34 | $207.20 | 104.7% | 113.3% | 118.6% |
| (1) | Source: Third party provider. The variances between the underwriting, the appraisal, and the above table with respect to Occupancy, ADR, and RevPAR are attributable to variances in reporting methodologies and/or timing differences. The competitive set from 2011 to 2013 included the property, Swissotel Chicago, Fairmont Chicago, Westin Chicago River North, Renaissance Chicago Downtown Hotel, and W Hotel Chicago City Center. The competitive set since 2014 includes the property, Swissotel Chicago, InterContinental Chicago Magnificent Mile, Fairmont Chicago Millennium Park, Westin Chicago River North, Renaissance Chicago Downtown Hotel, Trump Hotel Collection Chicago, and Loews Chicago Hotel. |
| (2) | Based off trailing twelve month period ending May 31, 2017. |
The Market. The property is located in Chicago, Illinois in the Central Loop (“Loop”) submarket. Per a third party research report, the Loop is the city’s official downtown area, and is recognized as the second largest downtown business district in the United States, with approximately 36.0 million SF of office space. The Loop is encircled by elevated (‘L’) train tracks giving the area its name and provides public transport access from the Loop from the surrounding neighborhoods. The Loop is famous for its architecture, with signature skyscrapers and historic buildings such as the Willis Tower (formerly Sears Tower), located two blocks west of the property. Bordering the property to the east is South LaSalle Street which is widely considered the financial center of the Midwestern United States, with the Federal Reserve Bank of Chicago and the Chicago Stock Exchange located on this street. Some of the largest publicly traded companies headquartered in the Loop include AT&T International, United Continental Holdings Inc., Archer Daniels Midland Co., Exelon, and Kraft Heinz Co.
The Chicago central business district has experienced a recent trend of companies moving into the area. Since 2008, 82 companies have established offices in Chicago, representing approximately 6.8 million SF of new office space. The companies are moving from Chicago suburbs, as well as other cities and regions. Most recently, McDonalds announced in the second quarter of 2016 that it would be moving from its suburban Oak Brook corporate campus to a new downtown office at the site of Oprah Winfrey’s former Harpo Studios in the West Loop submarket of the Chicago central business district, totaling almost 500,000 SF of office space in 2018. Other high-profile companies that have moved or announced plans to move to the Chicago central business district since 2012 include Hillshire Brands, GoGo Inc., Kraft Heinz, and Caterpillar. Chicago is well known as a major center of global agricultural commodity trading, which is handled by the Chicago Board of Trade and the Chicago Mercantile Exchange (“CME”).
According to a third party research report, the Chicago metropolitan statistical area (the “Chicago MSA”) is the third largest MSA in the United States in terms of population, with a 2017 estimated population of 9,933,248. Chicago is a major Great Lakes port and is considered the commercial, financial, industrial, and cultural center of the Midwest. According to a third party research report by Colliers, the Chicago MSA benefits from an expanded economy based on finance, insurance, printing and publishing, manufacturing and food processing. The Chicago MSA is also a major warehouse and distribution hub, supported by its comprehensive network of highway, water, rail, and air routes. Chicago is ranked amongst the world’s top 10 most competitive cities for business by The Economist Intelligence Unit and is home to 11 Fortune 500 companies, with an additional 22 Fortune 500 companies headquartered in the Chicago MSA, including Abbott Laboratories, Allstate Corporation, Boeing, Kraft Food, McDonald’s, United Continental, and Walgreen Co.
THE INFORMATION IN THIS COLLATERAL TERM SHEET IS NOT COMPLETE AND MAY BE AMENDED PRIOR TO THE TIME OF SALE. THIS TERM SHEET IS NOT AN OFFER TO SELL THESE SECURITIES AND IT IS NOT A SOLICITATION OF AN OFFER TO BUY THESE SECURITIES IN ANY JURISDICTION WHERE THE OFFER OR SALE IS NOT PERMITTED.
139
Mortgage Loan No. 9 — JW Marriott Chicago
Per a January 2017 Choose Chicago CVB news release, the city hosted over 54 million visitors in 2016, representing a 1.5 million increase in visitors over the previous year. Over 40.65 million people that visited were leisure travelers, representing a 3.4% increase over the previous year. The property benefits from its proximity to many of Chicago’s attractions including 319-acre Grant Park (approximately 0.5 miles away) that is home to landmarks and attractions including the Museum Campus, the site of various museums, and Soldier Field (approximately 1.8 miles away), home of the Chicago Bears. The Art Institute of Chicago (approximately 0.5 miles away), located in the Museum Campus, is one of the oldest and largest museums in the United States and attracts 1.5 million guests per year. Other nearby attractions include Millennium Park (approximately 0.9 miles away), Navy Pier (approximately 2.1 miles away), and Lake Michigan (approximately 1.0 mile away).
According to an industry report as of March 2017, the property is located in the Chicago hospitality market, which consists of 757 hotel properties with a total of 114,155 rooms. The Chicago hospitality market had a weighted average occupancy, ADR, and RevPAR of 69.0%, $144.71, and $99.81, respectively over the trailing 12-month period. The luxury class within the Chicago, Illinois market contained 22 hotels with a lodging inventory of 7,795 rooms. Over the 12-month period ending March 2017, the luxury class market achieved an aggregate occupancy of 72.0% with an ADR of $267.34, reflecting a RevPAR of $192.46. The property had an occupancy, ADR and RevPAR of 75.6%, $272.91 and $206.41, respectively over the trailing 12-month period.
The appraiser identified seven comparable rental properties, ranging from 339 units to 792 units that were constructed between 1929 and 2015. The competitive set reported a weighted average occupancy of approximately 71.9%, with RevPAR ranging from $150.96 to $232.50. RevPAR at the property is above the majority of competitive set. The properties in the appraisal’s competitive set are all located in downtown Chicago within approximately 1.0 mile of the property and are shown in the below table.
Competitive Hotels Profile(1)
Estimated Market Mix | 2016 Estimated Operating Statistics | ||||||||
| Property | Rooms | Year Built | Meeting Space (SF) | Commercial | Meeting & Group | Leisure | Occupancy | ADR | RevPAR |
| JW Marriott Chicago | 610(2) | 1914 | 41,797 | 35% | 40% | 25% | 75.2%(2) | $271.64(2) | $204.18(2) |
| Swissotel Chicago | 661 | 1988 | 38,823 | 25% | 30% | 45% | 70.0% | $235.00 | $164.50 |
| Intercontinental Chicago Magnificent Mile | 792 | 1929 | 45,000 | 35% | 45% | 20% | 68.0% | $222.00 | $150.96 |
| Fairmont Chicago Millennium Park | 687 | 1987 | 63,000 | 35% | 45% | 20% | 70.0% | $242.00 | $169.40 |
| Westin Chicago River North | 429 | 1987 | 28,000 | 40% | 25% | 35% | 80.0% | $260.00 | $208.00 |
| Renaissance Chicago Downtown Hotel | 560 | 1991 | 34,867 | 30% | 45% | 25% | 74.0% | $225.00 | $166.50 |
| Trump Hotel Collection Chicago | 339 | 2008 | 20,000 | 30% | 30% | 40% | 75.0% | $310.00 | $232.50 |
| Loews Chicago Hotel | 400 | 2015 | 20,000 | 30% | 25% | 45% | NAV | NAV | NAV |
| Total(3) | 3,868 | ||||||||
| (1) | Source: Appraisal. |
| (2) | Source: Borrower financials. |
| (3) | Excludes the subject property. |
THE INFORMATION IN THIS COLLATERAL TERM SHEET IS NOT COMPLETE AND MAY BE AMENDED PRIOR TO THE TIME OF SALE. THIS TERM SHEET IS NOT AN OFFER TO SELL THESE SECURITIES AND IT IS NOT A SOLICITATION OF AN OFFER TO BUY THESE SECURITIES IN ANY JURISDICTION WHERE THE OFFER OR SALE IS NOT PERMITTED.
140
Mortgage Loan No. 9 — JW Marriott Chicago
Operating History and Underwritten Net Cash Flow
| 2014 | 2015 | 2016 | TTM(1) | Underwritten | Per Room(2) | %(3) | |
| Occupancy | 73.3% | 76.3% | 75.2% | 76.1% | 76.1% | ||
| ADR | $256.37 | $265.83 | $271.64 | $270.43 | $270.43 | ||
| RevPAR | $188.04 | $202.85 | $204.18 | $205.72 | $205.72 | ||
| Room Revenue | $41,866,542 | $45,164,805 | $45,584,285 | $45,802,808 | $45,803,014 | $75,087 | 63.7% |
| Food and Beverage | 24,093,357 | 23,735,860 | 24,064,458 | 23,936,917 | 23,937,025 | $39,241 | 33.3% |
| Other Departmental Revenues | 2,373,910 | 2,038,828 | 2,294,540 | 2,219,089 | 2,219,099 | $3,638 | 3.1% |
| Total Revenue | $68,333,809 | $70,939,493 | $71,943,283 | $71,958,814 | $71,959,137 | $117,966 | 100.0% |
| Room Expense | 11,359,750 | 11,873,762 | 11,904,811 | 11,953,114 | 11,953,168 | $19,595 | 26.1% |
| Food and Beverage Expense | 17,876,462 | 17,677,508 | 17,400,030 | 17,500,363 | 17,500,442 | $28,689 | 73.1% |
| Other Departmental Expenses | 2,229,959 | 1,587,269 | 1,202,361 | 1,176,034 | 1,176,039 | $1,928 | 53.0% |
| Departmental Expenses | $31,466,171 | $31,138,539 | $30,507,202 | $30,629,511 | $30,629,649 | $50,213 | 42.6% |
| Departmental Profit | $36,867,638 | $39,800,954 | $41,436,081 | $41,329,303 | $41,329,489 | $67,753 | 57.4% |
| Operating Expenses | $14,774,087 | $16,136,011 | $17,272,330 | $17,076,362 | $17,076,434 | $27,994 | 23.7% |
| Gross Operating Profit | $22,093,551 | $23,664,943 | $24,163,751 | $24,252,941 | $24,253,055 | $39,759 | 33.7% |
| Fixed Expenses(4) | 3,096,530 | 3,153,940 | 2,972,486 | 2,931,508 | 3,026,935 | $4,962 | 4.2% |
| Net Operating Income | $18,997,021 | $20,511,003 | $21,191,265 | $21,321,433 | $21,226,120 | $34,797 | 29.5% |
| FF&E | 0 | 0 | 0 | 0 | 2,878,365 | $4,719 | 4.0% |
| Net Cash Flow | $18,997,021 | $20,511,003 | $21,191,265 | $21,321,433 | $18,347,754 | $30,078 | 25.5% |
| (1) | The TTM column represent the trailing twelve month period ending April 30, 2017. |
| (2) | Per room values are based on 610 rooms |
| (3) | % column represents percent of Total Revenue except for Room Expense, Food and Beverage and Other Department Expenses, which are based on their corresponding revenue line items. |
| (4) | The property benefits from the Class L tax incentive program which was effective upon its opening as a hotel in 2010. Under the Class L incentive, assessment levels for the building-portion of the assessment are reduced to 10% for the first 10 years, 15% in year 11, 20% in year 12 and back to the normal assessment in year 13. The property’s current Class L tax benefits will expire in 2022. |
Property Management. The property is managed by Marriott Hotel Services, Inc., (“Marriott”) under an operating agreement with the owner that expires in December 2040, 18 years beyond the loan term. Marriott is a leading global lodging company with more than 6,000 properties in 122 countries and territories, reporting revenues of more than $17 billion in fiscal year 2016.
Escrows and Reserves. At origination, the borrower deposited into escrow $2,000,000 for a seasonal reserve, $223,974 for real estate taxes, $198,332 for insurance premiums, and $13,554 for deferred maintenance.
Tax Escrows – On a monthly basis, the borrower is required to escrow 1/12th of the annual estimated tax payments, which currently equates to $223,974.
Insurance Escrows – On a monthly basis, the borrower is required to escrow 1/12th of the annual estimated insurance payments, which currently equates to $24,791.
FF&E Reserve – On a monthly basis, the borrower is required to escrow an amount equal to 1/12th of four percent of gross income from operations for the previous calendar year. The requirement to fund the FF&E Reserve is waived to the extent management agreement with Marriott is not terminated or a replacement franchise agreement that adequately reserves for furniture, fixtures, and equipment.
Seasonal Reserve – During the months of May through December, the borrower is required to escrow $500,000 into a seasonal reserve. Disbursements are permitted during the months of January through April beginning January 2018.
THE INFORMATION IN THIS COLLATERAL TERM SHEET IS NOT COMPLETE AND MAY BE AMENDED PRIOR TO THE TIME OF SALE. THIS TERM SHEET IS NOT AN OFFER TO SELL THESE SECURITIES AND IT IS NOT A SOLICITATION OF AN OFFER TO BUY THESE SECURITIES IN ANY JURISDICTION WHERE THE OFFER OR SALE IS NOT PERMITTED.
141
Mortgage Loan No. 9 — JW Marriott Chicago
Lockbox / Cash Management. The JW Marriott Chicago loan is structured with a hard lockbox with in place cash management. The loan requires all rents to be transmitted directly into a lockbox account controlled by the lender (including, without limitation, by sending credit card direction letters to all credit card companies at origination/new merchant agreements). All funds in the lockbox account are required to be swept on each business day to a clearing account controlled by the lender, and applied and disbursed in accordance with this loan agreement. If a Cash Sweep Period (as defined below) is occurring, excess cash will be held as additional security for the loan. Upon the termination of any Cash Sweep Period, excess cash will no longer be held by the lender and, provided that no event of default has occurred and is continuing, all amounts then on deposit in the cash collateral reserve account will be disbursed to the borrower.
A “Cash Sweep Period” will occur upon (i) an event of default or (ii) the debt service coverage ratio at the end of any calendar quarter based on the trailing 12-month period falling below 1.15x. A Cash Sweep Period will continue until (A) loan has been repaid in full; (B) there has been a full defeasance of the loan or (C) with regard to clause (ii) above, for six months following the commencement of a Cash Sweep Period (a) no default or event of default has occurred; (b) no event that would trigger another Cash Sweep Period has occurred and (c) the debt service coverage ratio is at least 1.20x.
Tax Abatement.The property benefits from the Class L tax incentive program which was effective upon its opening as a hotel in 2010. The Class L tax incentive program is designed to encourage the preservation and rehabilitation of architecturally significant commercial, industrial and multifamily buildings. Under the Class L tax incentive program, assessment levels for the building-portion of the assessment are reduced to 10% for the first 10 years, 15% in year 11, 20% in year 12 and back to the normal assessment in year 13. The property’s current Class L tax benefits will expire in 2022.
Additional Debt.In addition to Note A-1, the property is also security for thepari passu Note A-2 and Note A-3, the subordinatepari passu Note B-1-A and Note B-1-B, and the subordinate Note B-2. The Note B-1-A and Note B-1-B have an aggregate outstanding principal balance as of the Cut-off Date of approximately $67.0 million and a coupon of 4.3000%. The Note B-2 has an outstanding principal balance as of the Cut-off Date of approximately $57.2 million and a coupon of 5.8200%. The JW Marriott Chicago Whole Loan (inclusive of the Note B-1-A, Note B-1-B, and Note B-2) has a Cut-off Date LTV of 54.9%, an UW NCF DSCR of 1.92x and an UW NOI Debt Yield of 10.4%. A $66.5 million JW Marriott Chicago Mezzanine Loan was provided in connection with the financing of the property that is secured by the JW Marriott Chicago Mezzanine Loan borrower’s equity interest in the borrower and is coterminous with the mortgage loan. The JW Marriott Chicago Mezzanine Loan has a coupon of 7.5000%. Including the JW Marriott Chicago Mezzanine Loan, the Cut-off Date LTV is 72.9%, the UW NCF DSCR is 1.26x and the UW NOI Debt Yield is 7.9%.
THE INFORMATION IN THIS COLLATERAL TERM SHEET IS NOT COMPLETE AND MAY BE AMENDED PRIOR TO THE TIME OF SALE. THIS TERM SHEET IS NOT AN OFFER TO SELL THESE SECURITIES AND IT IS NOT A SOLICITATION OF AN OFFER TO BUY THESE SECURITIES IN ANY JURISDICTION WHERE THE OFFER OR SALE IS NOT PERMITTED.
142
(THIS PAGE INTENTIONALLY LEFT BLANK)
143
Mortgage Loan No. 10 — 300 Montgomery

THE INFORMATION IN THIS COLLATERAL TERM SHEET IS NOT COMPLETE AND MAY BE AMENDED PRIOR TO THE TIME OF SALE. THIS TERM SHEET IS NOT AN OFFER TO SELL THESE SECURITIES AND IT IS NOT A SOLICITATION OF AN OFFER TO BUY THESE SECURITIES IN ANY JURISDICTION WHERE THE OFFER OR SALE IS NOT PERMITTED.
144
Mortgage Loan No. 10 — 300 Montgomery
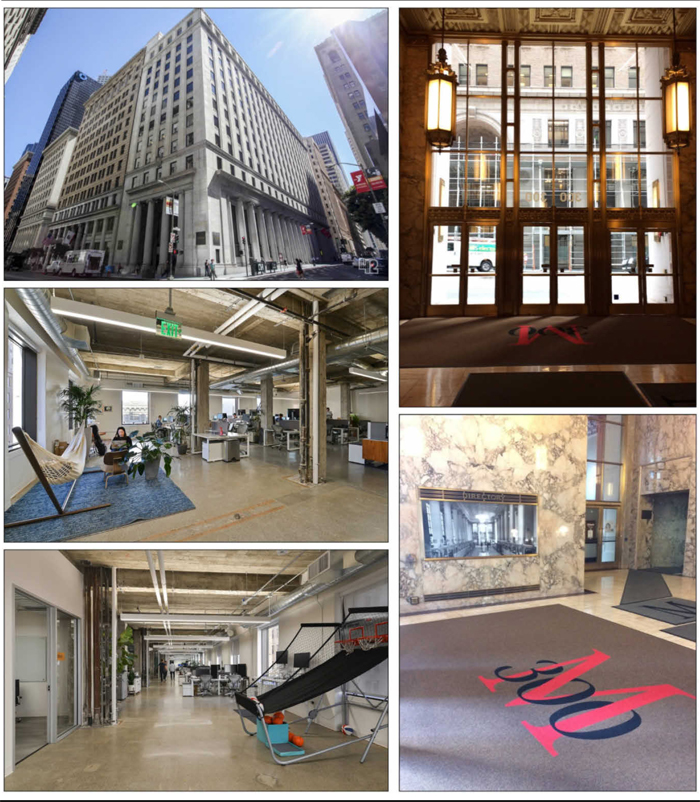
THE INFORMATION IN THIS COLLATERAL TERM SHEET IS NOT COMPLETE AND MAY BE AMENDED PRIOR TO THE TIME OF SALE. THIS TERM SHEET IS NOT AN OFFER TO SELL THESE SECURITIES AND IT IS NOT A SOLICITATION OF AN OFFER TO BUY THESE SECURITIES IN ANY JURISDICTION WHERE THE OFFER OR SALE IS NOT PERMITTED.
145
Mortgage Loan No. 10 — 300 Montgomery

THE INFORMATION IN THIS COLLATERAL TERM SHEET IS NOT COMPLETE AND MAY BE AMENDED PRIOR TO THE TIME OF SALE. THIS TERM SHEET IS NOT AN OFFER TO SELL THESE SECURITIES AND IT IS NOT A SOLICITATION OF AN OFFER TO BUY THESE SECURITIES IN ANY JURISDICTION WHERE THE OFFER OR SALE IS NOT PERMITTED.
146
Mortgage Loan No. 10 — 300 Montgomery
THE INFORMATION IN THIS COLLATERAL TERM SHEET IS NOT COMPLETE AND MAY BE AMENDED PRIOR TO THE TIME OF SALE. THIS TERM SHEET IS NOT AN OFFER TO SELL THESE SECURITIES AND IT IS NOT A SOLICITATION OF AN OFFER TO BUY THESE SECURITIES IN ANY JURISDICTION WHERE THE OFFER OR SALE IS NOT PERMITTED.
147
Mortgage Loan No. 10 — 300 Montgomery
| Mortgage Loan Information | Property Information | |||
| Mortgage Loan Seller: | Natixis | Single Asset / Portfolio: | Single Asset | |
| Original Principal Balance(1): | $36,000,000 | Title: | Fee | |
| Cut-off Date Principal Balance(1): | $36,000,000 | Property Type - Subtype: | Office – CBD | |
| % of Pool by IPB: | 4.2% | Net Rentable Area (SF)(6): | 192,574 | |
| Loan Purpose: | Refinance | Location: | San Francisco, CA | |
| Borrowers: | Downtown Properties VII, LLC; 300 Montgomery Associates | Year Built / Renovated: | 1918 & 1941 / 2015 | |
| Sponsor: | Downtown Properties Holdings, LLC | Occupancy: | 87.9% | |
| Interest Rate: | 3.5700% | Occupancy Date: | 7/19/2017 | |
| Note Date: | 8/23/2017 | Number of Tenants: | 44 | |
| Maturity Date: | 9/5/2027 | 2014 NOI(7): | $3,049,281 | |
| Interest-only Period: | 120 months | 2015 NOI(7): | $4,102,630 | |
| Original Term: | 120 months | 2016 NOI(7): | $5,311,125 | |
| Original Amortization: | None | TTM NOI(7)(8): | $5,461,022 | |
| Amortization Type: | Interest Only | UW Economic Occupancy: | 88.1% | |
| Call Protection(2): | L(24),YM1 (89),O(7) | UW Revenues: | $9,739,155 | |
| Lockbox(3): | Hard | UW Expenses: | $3,391,504 | |
| Additional Debt(4): | Yes | UW NOI: | $6,347,651 | |
| Additional Debt Balance(4): | $30,000,000 | UW NCF: | $6,108,859 | |
| Additional Debt Type(4): | Pari Passu | Appraised Value / Per SF(6)(9): | $119,600,000 / $621 | |
| Additional Future Debt Permitted(5): | Yes – Mezzanine | Appraisal Date: | 5/24/2017 |
| Escrows and Reserves(10) | Financial Information(1) | |||||
| Initial | Monthly | Initial Cap | Cut-off Date Loan / SF(6): | $343 | ||
| Taxes: | $76,794 | Springing | N/A | Maturity Date Loan / SF(6): | $343 | |
| Insurance: | $59,011 | Springing | N/A | Cut-off Date LTV(9): | 55.2% | |
| Replacement Reserves: | $0 | Springing | N/A | Maturity Date LTV(9): | 55.2% | |
| TI/LC: | $1,420,026 | Springing | N/A | UW NOI DSCR: | 2.66x | |
| UW NCF DSCR: | 2.56x | |||||
| UW NOI Debt Yield: | 9.6% | |||||
| UW NCF Debt Yield: | 9.3% |
| Sources and Uses | ||||||
| Sources | Proceeds | % of Total | Uses | Proceeds | % of Total | |
| Whole Mortgage Loan | $66,000,000 | 100.0% | Payoff Existing Debt | $31,979,916 | 48.5% | |
| Return of Equity | 31,842,739 | 48.2 | ||||
| Upfront Reserves | 1,555,831 | 2.4 | ||||
| Closing Costs | 621,513 | 0.9 | ||||
| Total Sources | $66,000,000 | 100.0% | Total Uses | $66,000,000 | 100.0% |
| (1) | The 300 Montgomery loan is part of a larger split whole loan evidenced by twopari passupromissory notes with an aggregate original principal balance of $66,000,000 (collectively, “300 Montgomery Whole Loan”). The Financial Information presented in the chart above is based on the Cut-off Date balances of the promissory notes comprising the 300 Montgomery Whole Loan. |
THE INFORMATION IN THIS COLLATERAL TERM SHEET IS NOT COMPLETE AND MAY BE AMENDED PRIOR TO THE TIME OF SALE. THIS TERM SHEET IS NOT AN OFFER TO SELL THESE SECURITIES AND IT IS NOT A SOLICITATION OF AN OFFER TO BUY THESE SECURITIES IN ANY JURISDICTION WHERE THE OFFER OR SALE IS NOT PERMITTED.
148
Mortgage Loan No. 10 — 300 Montgomery
| (2) | The lockout period will be at least 24 payments beginning with and including the first payment date of October 5, 2017. Prepayment of the full 300 Montgomery Whole Loan is permitted at any time after the earlier to occur of (i) August 23, 2020 or (ii) the date that is two years after the closing date of the securitization that includes the last note to be securitized. |
| (3) | For a more detailed description of lockbox, please refer to “Lockbox / Cash Management” below. |
| (4) | For a more detailed description, please refer to “The Loan” below. |
| (5) | For a more detailed description of additional future debt permitted, please refer to “Additional Debt” below. |
| (6) | The net rentable area (“NRA”) excludes 12,892 SF of un-leasable mezzanine space that the sponsor may convert to common area for tenants. The Appraised Value/Per SF, Cut-off Date Loan / SF and Maturity Date Loan / SF are calculated based on NRA excluding 12,892 of un-leasable mezzanine space. |
| (7) | The increase in TTM NOI from 2014 NOI is primarily due to the lease up of creative spaces including Suite 1200 (formerly unusable space) to Ripple Labs, Inc. (“Ripple Labs”) in August 2014 and Suite 900 to Fundbox, Inc. (“Fundbox”) in January 2016. The sponsor has spent approximately $5.1 million over the last four years to modernize the property and meet the demands of San Francisco’s tenant base in order to achieve higher rent on creative build-out spaces. |
| (8) | Represents the trailing twelve month period ending June 30, 2017. |
| (9) | The hypothetical appraised value without the mezzanine space described in footnote (6) is $111.1 million, which results in a cut-off date LTV and Maturity Date LTV of 59.4%. |
| (10) | For a more detailed description of Escrows and Reserves, please refer to “Escrows and Reserves” below. |
The Loan. The 300 Montgomery loan, which is part of a larger split whole loan is secured by a first mortgage lien on a 192,574 SF Class B office property located at 300 Montgomery Street in San Francisco, California. The 300 Montgomery Whole Loan has an outstanding principal balance as of the cut-off date of $66.0 million, which is evidenced by two notes identified as Note A-1 and Note A-2. The two notes have outstanding balances of $36.0 million and $30.0 million, respectively.
Note A-1 has an outstanding principal balance as of the cut-off date of $36.0 million and is being contributed to the CSAIL 2017-CX9 Commercial Mortgage Trust. Note A-2, which has an outstanding principal balance as of the cut-off Date of $30.0 million, is currently held by Natixis and is expected to be contributed to one or more future securitizations. The holder of Note A-1 will be the controlling noteholder of the 300 Montgomery Whole Loan. The trustee of the CSAIL 2017-CX9 Commercial Mortgage Trust, as the holder of Note A-1 (or, prior to the occurrence and continuance of a control termination event under the pooling and servicing agreement, the directing certificateholder), will be entitled to exercise all of the rights of the controlling noteholder with respect to the 300 Montgomery Whole Loan; however, the holder of Note A-2, will be entitled, under certain circumstances, to consult with respect to certain major decisions. The 300 Montgomery Whole Loan will be serviced pursuant to the terms of the pooling and servicing agreement governing CSAIL 2017-CX9.
Note A-1 accrues interest at the same rate as thepari passu Note A-2 and is entitled to payments of interest and principal on apro rata andpari passu basis with Note A-2, as and to the extent described under “Description of the Mortgage Pool—The Whole Loans” in the Preliminary Prospectus.
Whole Loan Note Summary
| Original Balance | Cut-off Date Balance | Note Holder | Lead Servicer for Whole Loan (Y/N) | |||
| Note A-1 | $36,000,000 | $36,000,000 | CSAIL 2017-CX9 | Y | ||
| Note A-2 | 30,000,000 | 30,000,000 | Natixis | N | ||
| Total | $66,000,000 | $66,000,000 | ||||
The Borrowers. The borrowing entities for the loan are Downtown Properties VII, LLC, a bankruptcy-remote, single-purpose Delaware limited liability company that owns the leased fee interest, and 300 Montgomery Associates, a single purpose California limited partnership that owns the leasehold interest. Both borrowing entities are owned by Downtown Properties Holdings, LLC.
THE INFORMATION IN THIS COLLATERAL TERM SHEET IS NOT COMPLETE AND MAY BE AMENDED PRIOR TO THE TIME OF SALE. THIS TERM SHEET IS NOT AN OFFER TO SELL THESE SECURITIES AND IT IS NOT A SOLICITATION OF AN OFFER TO BUY THESE SECURITIES IN ANY JURISDICTION WHERE THE OFFER OR SALE IS NOT PERMITTED.
149
Mortgage Loan No. 10 — 300 Montgomery
The Sponsor. The loan’s nonrecourse carve-out guarantor is Downtown Properties Holdings, LLC, an affiliate of Gaw Capital Partners, a Hong Kong-based real estate private equity firm founded in 2005 by brothers Goodwin Gaw and Kenneth Gaw. Downtown Properties Holdings, LLC has been managing real estate assets in the United States (Los Angeles and San Francisco, California) and the United Kingdom since 1995 and has over $2.0 billion in gross assets under management including 2.5 million SF of office buildings, over 1,000 hotel rooms, two 18-hole golf courses and a ski resort. According to its balance sheet dated December 31, 2016, Downtown Properties Holdings, LLC has total assets of approximately $524.1 million including approximately $26.9 million in cash and approximately $469.4 million in real estate investments.
The Property. The property is a twelve-story, multi-tenanted, Class B office building totaling 192,574 SF, situated on an entire city block of approximately 0.6 acre at 300 Montgomery Street in San Francisco, California. Originally constructed in 1918, the property features a historic façade with colonnades at ground level and has been renovated over the years. The property has marble covered walls and glazed gold-leaf ceilings with suspended bronze fixtures. Floorplates range from 11,429 SF to 20,699 SF. The ground floor features a US Bank branch and a Walgreens retail store, as well as a large marble lobby that provides access to the upper floor office spaces. US Bank is located at the corner of California Street and Montgomery Street, and has pedestrian access from the street as well as from the office lobby. Walgreens Co. (“Walgreens”) is located at the corner of Montgomery Street and Pine Street and is accessed from the street. In addition, there is 24-hour security and nearby parking. Several of the office suites were modernized to meet the demands of the San Francisco tenant base including open, loft-like creative space, which commands a rent premium. Approximately 42,750 SF (22.2% of the rent rentable area) features creative build-out.
The sponsor purchased the property in 1971 and has since invested approximately $17.3 million in capital improvements, in addition to the approximately $5.0 million in tenant improvements. Approximately $5.1 million has been spent on capital improvement over the past four years alone, including elevator renovation and modernization and common area renovations.
As of July 19, 2017, the property was 87.9% leased by 44 tenants. The property features a tenant mix of government, education, financial, legal, technology, and professional services sectors among others. No tenant represents more than 7.7% of NRA. Additionally, the building features 12,892 SF of vacant mezzanine space, which is not currently marketed for lease and is excluded from the NRA.
The largest tenant at the property, Ripple Labs, leases two suites totaling 14,749 SF (7.7% of the NRA) through August 31, 2019 and October 31, 2020. Ripple Labs has been at the property since 2014 but, due to its expansion, Ripple Labs had a 30,000 SF requirement that could not be accommodated at the property. Ripple Labs moved across the street to the Russ Building in May 2017 and subleases one of its two suites at the property to HackerOne, Inc. and the other one to Grovo Learning, Inc. through the remainder of the lease term. Ripple Labs is a technology company that developed the Ripple payment protocol and exchange network to create a monetary system that was decentralized and enabled individuals and communities to create their own money. The second largest tenant at the property, Consulate General of Brazil, leases 13,000 SF (6.8% of the NRA) through May 31, 2022 with one, five-year extension option remaining. The Consulate General of Brazil in San Francisco has been at the property since 2009 and provides Brazilian nationals and U.S. citizens or foreign nationals residing in the United States with passport and visa services. The Brazilian government is rated Ba2/BB/BB by Moody’s, S&P and Fitch, respectively. The third largest tenant at the property, ELS Educational Services, Inc. (“ELS”), leases 12,303 SF (6.4% of the NRA) through June 30, 2024 with one, five-year extension option remaining. ELS provides English language training in the United States through various language centers. The company was originally founded as a creator and publisher of educational materials, but its current focus is on teaching. ELS has over 80 locations around the world including 54 in the United States, two in Canada, one in Australia and one in India. ELS is a fully-owned subsidiary of Berlitz Language, Inc., a part of Berlitz International, Inc. ELS is headquartered in Princeton, New Jersey and is accredited by ACCET (Accrediting Council for Continuing Education and Training). ELS has operated a training facility at the property since 2014.
The Market. The property is located in the heart of the Financial District in Downtown San Francisco, California, and is situated on an entire block between California Street and Pine Street, at the intersection of Montgomery Street and California Street.
THE INFORMATION IN THIS COLLATERAL TERM SHEET IS NOT COMPLETE AND MAY BE AMENDED PRIOR TO THE TIME OF SALE. THIS TERM SHEET IS NOT AN OFFER TO SELL THESE SECURITIES AND IT IS NOT A SOLICITATION OF AN OFFER TO BUY THESE SECURITIES IN ANY JURISDICTION WHERE THE OFFER OR SALE IS NOT PERMITTED.
150
Mortgage Loan No. 10 — 300 Montgomery
The property is located in the financial district office submarket and features access to public transportation lines, including the BART-Embarcadero (Bay Area Rapid Transit) train station, which is located four blocks west, the Ferry Building Terminal and the California Street cable car line. Additionally, the property is within walking distance of certain San Francisco destinations including the Union Square shopping district, Westfield San Francisco Centre shopping mall, Rincon Park, several museums and AT&T Park, home of the San Francisco Giants major league baseball team. The property is also expected to benefit from the completion of the Transbay Transit Center, a mass-transit hub that is expected to connect eight Bay Area counties through 11 transportation systems including the BART, AC Transit, Amtrak, Caltrain and California’s planned high speed rail system. The Transbay Transit Center consists of two primary components, with the first phase expected to be completed in December 2017. The first phase will include construction of the above-ground portion of the new Transit Center, the below-grade rail levels and the bus ramp connecting the Transit Center to the San Francisco – Oakland Bay Bridge. A timeline has not yet been provided for the construction of phase two, which includes the downtown rail extension. According to the Transbay Joint Powers Authority, the larger development, which is located approximately 0.7 miles southwest of the property, is expected to include 4,400 residential units, approximately 100,000 SF of new retail space and an approximately 6.0 million SF office tower. The project is also expected to feature City Park, a 5.4- acre rooftop public park with a variety of activities and amenities including an open area amphitheater, gardens, open grass areas and restaurant and café. The property is also expected to benefit from the future San Francisco Central Subway expansion that will extend the Muni Metro T Third Line to provide a direct transit link between the Bayshore and Mission Bay areas to SoMa, downtown, and Chinatown.
According to a third party research report, the property is located in in the financial district office submarket of Downtown San Francisco. As of the second quarter of 2017, the financial district office submarket had approximately 29.9 million SF of office inventory with a vacancy of 9.9% and average asking rents of $58.94 PSF. The average contractual rent at the property is currently 18.0 % below the appraiser concluded market rent of $60.88 PSF on a modified gross basis.
According to the appraisal, the property’s competitive set consists of the six properties detailed in the table below.
Competitive Set Summary(1)
| Property | Year Built / Renovated | Total NRA (SF) | Est. Rent PSF | Est. Occ. | Proximity (miles) | Anchor Tenants |
| The Mills Building | 1892 / 2003 | 459,617 | $59.50 | 93.7% | 0.1 | Pocket Gems |
| Pacific Bank Building | 1920 / 2010 | 136,791 | $57.00 | 99.6% | 0.1 | Juniper Square |
| 601 Montgomery Street | 1979 / NAV | 233,628 | $55.00 | 96.2% | 0.2 | Anderies and Comes |
| 300 California Street | 1948 / NAV | 122,600 | $60.00 | 91.9% | 0.1 | Lystable |
| 550 Kearny Street | 1975 / 1981 | 193,011 | $64.00 | 100.0% | 0.2 | BTR Capital |
| 115 Sansome Street | 1913 / 1993 | 117,000 | $72.00 | 85.8% | 0.1 | M Moser Architects |
| (1) | Source: Appraisal. |
Historical and Current Occupancy(1)
| 2013 | 2014 | 2015 | 2016 | Current(2) |
| 84.1% | 89.5% | 95.1% | 91.7% | 87.9% |
| (1) | Source: Historical occupancy is provided by the sponsor. Occupancies are as of December 31 of each respective year. The increase in occupancy from 2013 to Current is primarily because the property was undergoing lease-up after the most recent renovation. |
| (2) | Based on the July 19, 2017 underwritten rent roll. |
THE INFORMATION IN THIS COLLATERAL TERM SHEET IS NOT COMPLETE AND MAY BE AMENDED PRIOR TO THE TIME OF SALE. THIS TERM SHEET IS NOT AN OFFER TO SELL THESE SECURITIES AND IT IS NOT A SOLICITATION OF AN OFFER TO BUY THESE SECURITIES IN ANY JURISDICTION WHERE THE OFFER OR SALE IS NOT PERMITTED.
151
Mortgage Loan No. 10 — 300 Montgomery
Tenant Summary(1)
| Tenant | Ratings Moody’s/S&P/Fitch(2) | Net Rentable Area (SF) | % of Total NRA | Base Rent PSF | Base Rent | % of Total | Lease Expiration Date |
| Ripple Labs | NR/NR/NR | 14,749 | 7.7% | $68.31 | $1,007,520 | 10.8% | Various(3) |
| Consulate General of Brazil | Ba2/BB/BB | 13,000 | 6.8% | $43.26 | $562,380 | 6.0% | 5/31/2022(4) |
| ELS | NR/NR/NR | 12,303 | 6.4% | $46.36 | $570,368 | 6.1% | 6/30/2024(5) |
| Delagnes, Mitchell & Linder | NR/NR/NR | 10,753 | 5.6% | $56.39 | $606,362 | 6.5% | 8/31/2025 |
| Walgreens Co. | Baa2/BBB/BBB | 9,441 | 4.9% | $71.87 | $678,525 | 7.3% | 12/31/2021 |
| Pennbrook Insurance Services | NR/NR/NR | 9,333 | 4.8% | $36.50 | $340,655 | 3.7% | 2/28/2019(6) |
| US Bank | A1/A+/AA | 8,866 | 4.6% | $86.60 | $767,796 | 8.2% | 2/28/2027 |
| Fundbox | NR/NR/NR | 8,346 | 4.3% | $75.32 | $628,653 | 6.8% | 12/31/2020 |
| BSA Architects | NR/NR/NR | 6,655 | 3.5% | $34.50 | $229,598 | 2.5% | 2/28/2019 |
| Captain401 | NR/NR/NR | 6,061 | 3.1% | $62.83 | $380,813 | 4.1% | 10/31/2020 |
| (1) | Based on the underwritten rent roll which includes rent steps of $822,194 through September 2018 and rent averaging through the lease term for US Bank totaling $58,516. |
| (2) | Ratings provided are for the parent company of the entity listed in the “Tenant” field whether or not the parent company guarantees the lease. |
| (3) | Ripple Labs leases two suites, Suite 1200 (11,429 SF) through August 31, 2019 and Suite 1130 (3,320 SF) through October 31, 2020 but vacated in May 2017. Ripple Labs subleases Suite 1200 to HackerOne, Inc. at $73.00 PSF and Suite 1130 to Grovo Learning, Inc. at $71.00 PSF. |
| (4) | In the event diplomatic relations between the United States and Brazil are terminated, suspended or otherwise interrupted, or the Government of Brazil closes its San Francisco Consulate (and does not re-open the Consulate) during the last four years of its lease, Consulate General of Brazil has the option to terminate its lease with 180 days’ prior written notice and a payment of a termination fee equal to the unamortized tenant improvement and leasing commission costs. |
| (5) | ELS has the right to terminate its lease at any time after the 84th full calendar month of the term with one-year notice and payment of a termination fee equal to four months base rent in the 10th lease year ($215,107) plus the unamortized balance of the tenant improvements, plus cost of brokerage commission, and legal fees paid in connection with negotiation and execution of lease and the initial 45-day base rent abatement. The lease is guaranteed by Berlitz Languages, Inc. |
| (6) | Pennbrook Insurance Services subleases four cubicles offices for $5,000 per month. |
THE INFORMATION IN THIS COLLATERAL TERM SHEET IS NOT COMPLETE AND MAY BE AMENDED PRIOR TO THE TIME OF SALE. THIS TERM SHEET IS NOT AN OFFER TO SELL THESE SECURITIES AND IT IS NOT A SOLICITATION OF AN OFFER TO BUY THESE SECURITIES IN ANY JURISDICTION WHERE THE OFFER OR SALE IS NOT PERMITTED.
152
Mortgage Loan No. 10 — 300 Montgomery
Lease Rollover Schedule(1)
| Year | Number of Leases Expiring | NRA Expiring | % of NRA Expiring(3) | Base Rent Expiring | % of Base Rent Expiring | Cumulative NRA Expiring | Cumulative % of NRA Expiring | Cumulative Base Rent Expiring | Cumulative % of Base Rent Expiring | |
| Vacant | NAP | 23,323 | 12.1 | % | NAP | NAP | 23,323 | 12.1% | NAP | NAP |
| MTM | 1 | 1,515 | 0.8 | $96,430 | 1.0% | 24,838 | 12.9% | $96,430 | 1.0% | |
| 2017 | 2 | 4,698 | 2.4 | 203,371 | 2.2 | 29,536 | 15.3% | $299,801 | 3.2% | |
| 2018 | 7 | 13,435 | 7.0 | 649,257 | 7.0 | 42,971 | 22.3% | $949,058 | 10.2% | |
| 2019 | 8 | 40,033 | 20.8 | 2,000,166 | 21.5 | 83,004 | 43.1% | $2,949,224 | 31.7% | |
| 2020 | 17 | 48,379 | 25.1 | 2,813,315 | 30.2 | 131,383 | 68.2% | $5,762,539 | 61.9% | |
| 2021 | 5 | 15,259 | 7.9 | 1,042,410 | 11.2 | 146,642 | 76.1% | $6,804,949 | 73.1% | |
| 2022 | 1 | 13,000 | 6.8 | 562,380 | 6.0 | 159,642 | 82.9% | $7,367,329 | 79.1% | |
| 2023 | 0 | 0 | 0.0 | 0 | 0.0 | 159,642 | 82.9% | $7,367,329 | 79.1% | |
| 2024 | 1 | 12,303 | 6.4 | 570,368 | 6.1 | 171,945 | 89.3% | $7,937,698 | 85.2% | |
| 2025 | 1 | 10,753 | 5.6 | 606,362 | 6.5 | 182,698 | 94.9% | $8,544,059 | 91.8% | |
| 2026 | 0 | 0 | 0.0 | 0 | 0.0 | 182,698 | 94.9% | $8,544,059 | 91.8% | |
| 2027 | 1 | 8,866 | 4.6 | 767,796 | 8.2 | 191,564 | 99.5% | $9,311,855 | 100.0% | |
| 2028 & Beyond(2) | 0 | 1,010 | 0.5 | 0 | 0.0 | 192,574 | 100.0% | $9,311,855 | 100.0% | |
| Total | 44 | 192,574 | 100.0 | % | $9,311,855 | 100.0% | ||||
| (1) | Based on the underwritten rent roll which includes rent steps of $822,194 through September 2018 and rent averaging through the lease term for US Bank totaling $58,516. |
| (2) | 2028 & Beyond includes 1,010 SF of building management and conference room. |
Operating History and Underwritten Net Cash Flow
| 2014 | 2015(1) | 2016(2) | TTM(3) | Underwritten(4) | PSF | %(5) | |
| Rents in Place | $5,822,367 | $6,984,205 | $8,256,786 | $8,576,591 | $9,311,855 | $48.35 | 84.6% |
| Vacant Income | 0 | 0 | 0 | 0 | 1,314,941 | 6.83 | 12.0% |
| Free Rent Adjustments | (102,644) | (71,348) | (55,574) | (123,217) | 0 | 0.00 | 0.0% |
| Gross Potential Rent | $5,719,723 | $6,912,857 | $8,201,213 | $8,453,374 | $10,626,796 | $55.18 | 96.6% |
| Total Reimbursements | 368,514 | 384,932 | 413,298 | 447,171 | 376,748 | 1.96 | 3.4% |
| Net Rental Income | $6,088,238 | $7,297,789 | $8,614,510 | $8,900,545 | $11,003,544 | $57.14 | 100.0% |
| (Vacancy/Collection Loss) | 0 | 0 | 0 | 0 | (1,314,941) | (6.83) | (12.0%) |
| Other Income | 47,305 | 46,914 | 48,931 | 50,552 | 50,552 | 0.26 | 0.5% |
| Effective Gross Income | $6,135,543 | $7,344,703 | $8,663,441 | $8,951,097 | $9,739,155 | $50.57 | 88.5% |
| Total Expenses | $3,086,262 | $3,242,074 | $3,352,316 | $3,490,075 | $3,391,504 | $17.61 | 34.8% |
| Net Operating Income(6) | $3,049,281 | $4,102,630 | $5,311,125 | $5,461,022 | $6,347,651 | $32.96 | 65.2% |
| Total TI/LC, Capex/RR | 0 | 0 | 0 | 0 | 238,792 | 1.24 | 2.5% |
| Net Cash Flow | $3,049,281 | $4,102,630 | $5,311,125 | $5,461,022 | $6,108,859 | $31.72 | 62.7% |
| (1) | The increase in 2015 NOI from 2014 NOI is primarily due to the leased up in particular Suite 1200 (formerly unusable space) to Ripple Labs in August 2014, totaling $685,740 in 2015. |
| (2) | The increase in 2016 NOI from 2015 NOI is primarily due to the leased up in particular Suite 900 to Fundbox in January 2016, totaling $592,566. |
| (3) | Represents the trailing twelve month period ending June 30, 2017. |
| (4) | Rents in Place is underwritten based on the June 19, 2017 rent roll and includes rent steps of $822,194 through September 2018 and rent averaging through the lease term for US Bank totaling $58,516. |
THE INFORMATION IN THIS COLLATERAL TERM SHEET IS NOT COMPLETE AND MAY BE AMENDED PRIOR TO THE TIME OF SALE. THIS TERM SHEET IS NOT AN OFFER TO SELL THESE SECURITIES AND IT IS NOT A SOLICITATION OF AN OFFER TO BUY THESE SECURITIES IN ANY JURISDICTION WHERE THE OFFER OR SALE IS NOT PERMITTED.
153
Mortgage Loan No. 10 — 300 Montgomery
| (5) | Percentage column represents percent of Net Rental Income for all revenue lines and represents percent of Effective Gross Income for the remainder of fields. |
| (6) | The increase of Net Operating Income since 2014 is also because the sponsor has spent approximately $5.1 million over the last four year to modernize the property and meet the demands of San Francisco’s tenant base, and achieve higher rent on creative build-out spaces. |
Property Management. The property is managed by CAC Real Estate Management Co., Inc., which was purchased by CBRE, Inc. in 2013.
Escrows and Reserves. At origination, the borrowers deposited $76,794 upfront in escrow for annual real estate taxes, $59,011 upfront in escrow for annual insurance premiums and $1,420,026 (the “Initial RR Deposit”) upfront for tenant improvements and leasing commissions. $170,921 of the Initial RR Deposit is designated as free rent allocated under the leases in effect at the property. Up to $150,000 of the Initial RR Deposit will be made available to reimburse the borrowers for spec-space work so long as the borrowers certify to the lender that the requested disbursement relates to work that has been incurred at market rates. Up to $600,000 of the Initial RR Deposit will be made available to reimburse the borrowers for spec-space work (not subject to a prior disbursement) for space which is subsequently leased to tenants so long as the borrowers certify that the rent and tenant improvements under such leases together with the spec-space work are at market rates.
TI/LC Reserves – During a Cash Management Period (as defined below), on a monthly basis, the borrowers are required to escrow $16,070 for TI/LC Reserve
Replacement Reserves – During a Cash Management Period, on a monthly basis, the borrowers are required to escrow $3,857 for replacement reserves.
Tax Escrows -The loan documents do not require monthly escrows for real estate taxes provided that (i) no event of default under the loan has occurred, (ii) the borrowers provide to the lender prior to the date on which such taxes would be delinquent, evidence satisfactory (as determined by the lender) that such taxes have been paid, and (iii) the borrowers maintain an amount in the real estate taxes escrow equal to three months’ worth of monthly real estate taxes.
Insurance Escrows -The loan documents do not require monthly escrows for insurance provided that (i) no event of default under the loan has occurred, (ii) the borrowers provide evidence that the insurance coverages required pursuant to the loan documents are being maintained under an acceptable blanket insurance policy and (iii) the borrowers maintain an amount in the insurance escrow equal to three months’ worth of monthly insurance premiums.
Lockbox / Cash Management. The 300 Montgomery loan is structured with a hard lockbox and springing cash management. Tenants have been directed to remit all payments due under their respective leases directly into the lockbox account. Prior to the occurrence of a Cash Management Period, all funds in the lockbox account will be swept to the borrower’s operating account. During a Cash Management Period, all funds in the lockbox account will be swept to a lender-controlled cash management account.
A “Cash Management Period” will commence upon: (i) an event of default; (ii) the failure by the borrowers, after the end of a calendar quarter, to maintain a debt service coverage ratio of at least 1.20x; or (iii) the borrowers obtaining a future mezzanine debt; and will end (1) if the loan and all other obligations under the loan documents have been repaid in full, or (2) with respect to clause (ii) above, if for three consecutive months since the commencement of the existing Cash Management Period (A) no event of default has occurred, (B) no event that constitutes another Cash Management Period has occurred, and (C) the debt service coverage ratio at least equal to 1.25x.
Additional Debt.The borrowers may obtain a mezzanine loan, from an institutional investor wholly acceptable to the lender, secured by a pledge of all of the direct ownership interests in the borrowers upon satisfaction of certain terms and conditions which include, without limitation, (i) the combined loan-to-value ratio on the origination date of the mezzanine loan does not exceed 80.0%; (ii) the combined debt service coverage ratio is not less than 1.50x, (iii) the lender receive a rating agency confirmation from Fitch, S&P and Kroll that the mezzanine financing will not result in a downgrade, withdrawal or qualification of the respective ratings assigned to the CSAIL Series 2017-CX9 Certificates and (iv) the lender enters into an intercreditor agreement in form and substance reasonably acceptable to the mortgage lender and the rating agencies.
THE INFORMATION IN THIS COLLATERAL TERM SHEET IS NOT COMPLETE AND MAY BE AMENDED PRIOR TO THE TIME OF SALE. THIS TERM SHEET IS NOT AN OFFER TO SELL THESE SECURITIES AND IT IS NOT A SOLICITATION OF AN OFFER TO BUY THESE SECURITIES IN ANY JURISDICTION WHERE THE OFFER OR SALE IS NOT PERMITTED.
154
(THIS PAGE INTENTIONALLY LEFT BLANK)
155
Mortgage Loan No. 11 — Center 78
| Mortgage Loan Information | Property Information | |||
| Mortgage Loan Seller: | Natixis | Single Asset / Portfolio: | Single Asset | |
| Original Principal Balance(1): | $35,863,277 | Title: | Fee | |
| Cut-off Date Principal Balance(1): | $35,863,277 | Property Type - Subtype: | Office–Suburban | |
| % of Pool by IPB: | 4.2% | Net Rentable Area (SF): | 372,672 | |
| Loan Purpose: | Refinance | Location: | Warren, NJ | |
| Borrower: | 184 Property Owner, LLC | Year Built / Renovated: | 1982 / 2012, 2015 | |
| Sponsors: | Normandy Real Estate Fund II, LP; Greenfield Acquisition Partners VI, L.P.; GAP VI Parallel Partners, L.P. | Occupancy: | 88.7% | |
| Interest Rate(2): | 4.090059% | Occupancy Date: | 6/22/2017 | |
| Note Date: | 8/9/2017 | Number of Tenants: | 7 | |
| Maturity Date: | 8/9/2027 | 2014 NOI: | N/A | |
| Interest-only Period: | 120 months | 2015 NOI(3): | $1,386,818 | |
| Original Term: | 120 months | 2016 NOI(3): | $818,771 | |
| Original Amortization: | None | TTM NOI(3)(4)(5): | $2,433,278 | |
| Amortization Type: | Interest Only | UW Economic Occupancy: | 88.9% | |
| Call Protection: | L(25),Def (91),O(4) | UW Revenues: | $9,997,347 | |
| Lockbox(3): | Hard | UW Expenses: | $3,648,950 | |
| Additional Debt(1): | Yes | UW NOI(5): | $6,348,397 | |
| Additional Debt Balance(1): | $44,836,723 | UW NCF: | $5,878,829 | |
| Additional Debt Type(1): | Pari Passu, B-Note, Mezzanine | Appraised Value / Per SF: | $94,800,000 / $254 | |
| Additional Future Debt Permitted: | No | Appraisal Date: | 6/1/2017 |
| Escrows and Reserves | Financial Information(1) | |||||
| Initial | Monthly | Initial Cap | Cut-off Date Loan / SF: | $171 | ||
| Taxes: | $55,238 | $55,238 | N/A | Maturity Date Loan / SF: | $171 | |
| Insurance: | $56,892 | $5,172 | N/A | Cut-off Date LTV: | 67.4% | |
| Replacement Reserves: | $0 | $8,075 | N/A | Maturity Date LTV: | 67.4% | |
| TI/LC: | $700,000 | $31,056 | N/A | UW NOI DSCR(2): | 2.01x | |
| Deferred Maintenance: | $7,975 | $0 | N/A | UW NCF DSCR(2): | 1.86x | |
| Primary Tenant Reserve: | $0 | Springing | N/A | UW NOI Debt Yield: | 9.9% | |
| UW NCF Debt Yield: | 9.2% |
Sources and Uses
| Sources | Proceeds | % of Total | Uses | Proceeds | % of Total | |
| Whole Loan (A Notes) | $63,863,277 | 79.1% | Payoff Existing Debt | $47,149,452 | 58.4% | |
| Whole Loan (B Note) | 4,936,723 | 6.1 | Return of Equity | 31,645,460 | 39.2 | |
| Mezzanine Loan | 11,900,000 | 14.7 | Upfront Reserves | 820,105 | 01.0 | |
| Closing Costs | 1,084,983 | 01.3 | ||||
| Total Sources | $80,700,000 | 100.0% | Total Uses | $80,700,000 | 100.0% |
| (1) | The Center 78 loan is a part of a larger split whole loan evidenced by two seniorpari passu notes and the Center 78 Subordinate Companion Loan (as defined below), with an aggregate original principal balance of $68.8 million. The Financial Information presented in the chart above and herein reflects the |
THE INFORMATION IN THIS COLLATERAL TERM SHEET IS NOT COMPLETE AND MAY BE AMENDED PRIOR TO THE TIME OF SALE. THIS TERM SHEET IS NOT AN OFFER TO SELL THESE SECURITIES AND IT IS NOT A SOLICITATION OF AN OFFER TO BUY THESE SECURITIES IN ANY JURISDICTION WHERE THE OFFER OR SALE IS NOT PERMITTED.
156
Mortgage Loan No. 11 — Center 78
cut-off date balance of the approximately $63.9 million A Notes (as defined below), but not the approximately $4.9 million Center 78 Subordinate Companion Loan.
| (2) | The Center 78 loan accrues interest at an interest rate that changes over time, as set forth on Annex H of the Preliminary Prospectus. The Interest Rate shown is the interest rate on September 9, 2017. The UW NCF DSCR with respect to the Center 78 loan is calculated based on the aggregate debt service of the Center 78 Senior Loan (as defined below) for the 12-month period commencing September 2022. The UW NCF DSCR based on the aggregate debt service payable with respect to the Center 78 Senior Loan for the 12-month period commencing September 2017 is 2.22x. |
| (3) | The increase in TTM NOI from 2016 and 2015 NOI is primarily due to the property undergoing lease-up after the most recent renovation. |
| (4) | Represents the trailing twelve month period ending May 31, 2017. |
| (5) | The increase in UW NOI from TTM NOI is primarily due to the expiration of free rent periods for tenants GSK and Continental Casualty Co. |
The Loan. The Center 78 loan, which is part of a larger split whole loan, is a first mortgage loan secured by the borrower’s fee interest in a 372,672 SF Class A office property known as Center 78 and located in Warren, New Jersey.
The whole loan has an outstanding principal balance as of the cut-off date of $68.8 million (the “Center 78 Whole Loan”), and is comprised of twopari passu senior notes, Note A-1 ($35,863,277) and Note A-2 ($28,000,000) (collectively, the “A Notes” or the “Center 78 Senior Loan”) and one subordinate Note B with an outstanding principal balance of approximately $4.9 million (the “Center 78 Subordinate Companion Loan”).
Note A-1, with an outstanding principal balance as of the cut-off date of approximately $35.9 million, is being contributed to the CSAIL 2017-CX9 Commercial Mortgage Trust. Note A-2 was previously contributed to the UBS 2017-C3 Commercial Mortgage Trust. The Center 78 Subordinate Companion Loan (Note B) is currently held by Natixis and is expected to be sold to unaffiliated third party investors. Under the related co-lender agreement, prior to a control appraisal period with respect to the related subordinate companion loan, the Center 78 Subordinate Companion Loan is the controlling note and the holder of Note A-1 will be entitled to replace the special servicer with respect to the Center 78 Whole Loan, and after a control appraisal period occurs with respect to the related subordinate companion loan, Note A-1 will be the controlling note. The holder of Note A-1 will be required under certain circumstances, to obtain the consent of the holder of Note B with respect to certain major decisions. The holder of Note A-2 or their respective representatives will be entitled, under certain circumstances, to consult with respect to certain major decisions. The Center 78 Whole Loan will be serviced pursuant to the pooling and servicing agreement for the CSAIL 2017-CX9 Trust.
Note A-1 accrues interest at the same rate as thepari passu Note A-2 and is entitled to payments of interest and principal on apro rata andpari passu basis with Note A-2, and Note B is a subordinate note, as and to the extent described under “Description of the Mortgage Pool—The Whole Loans” in the Preliminary Prospectus.
Whole Loan Note Summary
| Original Balance | Cut-off Date Balance | Note Holder | Lead Servicer for Whole Loan (Y/N) | Controlling Piece (Y/N) | |
| Note A-1 | $35,863,277 | $35,863,277 | CSAIL 2017-CX9 | Y | N(1) |
| Note A-2 | 28,000,000 | 28,000,000 | UBS 2017-C3 | N | N |
| Note B | 4,936,723 | 4,936,723 | Natixis | N | Y(1) |
| Total | $68,800,000 | $68,800,000 |
| (1) | The holder of the seniorpari passu promissory Note A-1 will have the right to replace the special servicer with respect to the Center 78 Whole Loan. |
THE INFORMATION IN THIS COLLATERAL TERM SHEET IS NOT COMPLETE AND MAY BE AMENDED PRIOR TO THE TIME OF SALE. THIS TERM SHEET IS NOT AN OFFER TO SELL THESE SECURITIES AND IT IS NOT A SOLICITATION OF AN OFFER TO BUY THESE SECURITIES IN ANY JURISDICTION WHERE THE OFFER OR SALE IS NOT PERMITTED.
157
Mortgage Loan No. 11 — Center 78
Center 78 Total Debt Capital Structure
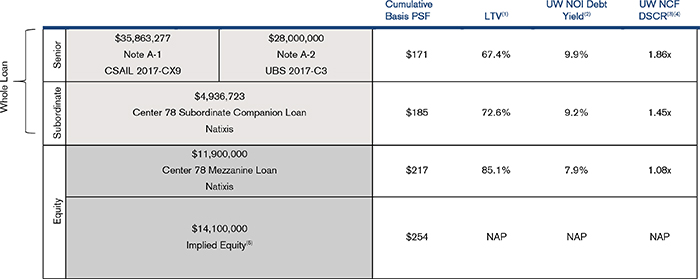
| (1) | Based on an as-is appraised value of $94.8 million ($254 PSF) as of June 1, 2017 per the appraisal. |
| (2) | Based on the UW NOI of approximately $6.3 million. |
| (3) | The UW NCF DSCR of the Center 78 Senior Loan and the Center 78 Subordinate Companion Loan is based on UW NCF of approximately $5.9 million and aggregate debt service payable for the 12-month period commencing September 2022 on the principal balance of the Center 78 Senior Loan and the Center 78 Whole Loan, respectively, as set forth in the non-standard amortization and interest rate schedule set forth in Annex H to the Preliminary Prospectus. The UW NCF DSCR of the Center 78 Mezzanine Loan (as defined below) is calculated based on the aggregate debt service payable for the Center 78 Whole Loan and the Center 78 Mezzanine Loan for the 12 month period commencing September 2022. |
| (4) | The UW NCF DSCR of the Center 78 Senior Loan and the Center 78 Whole Loan, based on UW NCF of approximately $5.9 million and aggregate debt service payable for the 12-month period commencing September 2017 on the principal balance of the Center 78 Senior Loan and the Center 78 Whole Loan, respectively, Center 78 Senior Loan is interest only throughout the loan term and Center 78 Mezzanine Loan is IO-Balloon an will begin to pay principle starting September 2022, as set forth in the non-standard amortization and interest rate schedule set forth in Annex H to the Preliminary Prospectus, are 2.22x and 1.85x, respectively. |
| (5) | Implied Equity is based on the estimated as-is appraised value of $94.8 million, less total debt of $80.7 million. |
The Borrower. The borrowing entity for the loan is 184 Property Owner, LLC, a Delaware limited liability company and special purpose entity. The borrowing entity is indirectly owned by a joint venture between Normandy Real Estate Partners LLC and Greenfield Partners, LLC.
The Sponsors. The loan’s nonrecourse carve-out guarantor is Normandy Real Estate Fund II, LP. The borrower sponsors are (i) Normandy Real Estate Fund II, LP, (ii) Greenfield Acquisition Partners VI, L.P. and (iii) GAP VI Parallel Partners, L.P.
Normandy Real Estate Fund II, LP is controlled by Normandy Real Estate Partners LLC (“Normandy”), which is a private investment firm with over $1.5 billion in equity capital under management, representing over $3.3 billion of total asset value through several discretionary real estate funds backed by institutional investors and pension funds. Normandy’s recent relevant development experiences include 575 Lexington Avenue (NYC), 1370 Broadway (NYC), John Hancock Tower (Boston), and TripAdvisor World Headquarters (Needham, MA), among others. Normandy has a vertically integrated platform with over 120 employees and approximately 14.0 million SF of commercial real estate under management.
Greenfield Acquisition Partners VI, L.P. and GAP VI Parallel Partners, L.P. are indirectly controlled by Greenfield Partners, LLC (“Greenfield Partners”), which was established by Eugene A. Gorab in 1997. Greenfield Partners manages capital on behalf of its principals and limited partners, and has, since inception, secured capital commitments in excess of $4.0 billion across a series of discretionary investment vehicles. Its limited partners include state and corporate pension plans, university endowments, private foundations and high net worth individuals. Greenfield Partners is based in Westport, Connecticut, with additional offices in Chicago, Illinois and Arlington, Virginia.
THE INFORMATION IN THIS COLLATERAL TERM SHEET IS NOT COMPLETE AND MAY BE AMENDED PRIOR TO THE TIME OF SALE. THIS TERM SHEET IS NOT AN OFFER TO SELL THESE SECURITIES AND IT IS NOT A SOLICITATION OF AN OFFER TO BUY THESE SECURITIES IN ANY JURISDICTION WHERE THE OFFER OR SALE IS NOT PERMITTED.
158
Mortgage Loan No. 11 — Center 78
The Property. The property is a four-story, multi-tenanted, Class A, LEED Gold certified office building totaling 372,672 SF, which is situated on a 47.2-acre site, located at 184 Liberty Corner Road in Warren, New Jersey. Originally constructed in 1982, the property was acquired by the sponsors in 2011 for $26.4 million ($71 PSF) and the sponsors invested an additional $43.0 million ($115 PSF) to complete a gut renovation of the property including building upgrades, high-end finishes, a new amenity package to include a café with indoor and outdoor seating, full-service fitness center with shower and locker facility, 100-person conference center, and a sustainable redesign of its landscaping, grounds and access ways. As a result, the property achieved LEED Gold status for Core and Shell in 2013. There are only four LEED GOLD certificated properties in New Jersey, each of which serves as the corporate headquarters of one or more Fortune 500 companies. The green features at the property include a high-efficiency HVAC and plumbing system, LED parking lot and exterior lighting, and a 223 KWH solar plant located on the roof, which can provide up to 11% of the building’s power needs. In addition to the physical attributes that make the property green, the borrower sponsors also developed and implemented sustainable practices that were designed to stay with the project past the development phase.
The functionality and design of the property consists of 30 FT by 30 FT column spacing, divisible and flexible open/closed layouts, nine-foot finished ceilings, and high data capability, all factors that strategically position the property within the market. The property has 1,522 surface parking spaces, which results in a parking ratio of 4.1 spaces per 1,000 SF of net rentable space.
As of June 22, 2017, the property was 88.7% leased by seven tenants. The largest tenant at the property, GlaxoSmithKline Consumer Healthcare Holdings (US) LLC (“GSK”), leases 147,411 SF (39.6% of the net rentable area) through February 28, 2027 with two, five-year extension options remaining. GSK is a science-led global healthcare company that researches, develops and manufactures innovative pharmaceutical medicines, vaccines and consumer healthcare products. GSK has a global presence with commercial operations in more than 150 countries, a network of 87 manufacturing sites, and research and development centers in the United Kingdom, United States of America, Belgium and China. In 2016, GSK reported revenue of $37.8 billion. The property serves as the U.S. headquarters for GSK Consumer Healthcare, a joint venture between GSK and Novartis. Novartis provides healthcare solutions that address the evolving needs of patients and societies. GSK is A2/A+/A by Moody’s, S&P and Fitch, respectively. The second largest tenant at the property, EMC, leases 81,683 SF (21.9% of the net rentable area) through September 30, 2020 with one, five-year extension option remaining. EMC is a global information technology and cloud computing company, and is the largest provider of data storage systems. The company has over 70,000 employees worldwide and has the largest sales and service force within the information infrastructure sector. In 2015, EMC was purchased by Dell for $67.0 billion. Dell reported $61.6 billion in revenue in fiscal year 2017. EMC is rated Ba2/NR/BB+ by Moody’s, S&P and Fitch, respectively. The third largest tenant at the property, Fiserv, leases 40,394 SF (10.8% of the net rentable area) through July 31, 2024 with two, five-year extension options remaining. Fiserv, founded in 1984, is a global financial services technology company with over 13,000 clients including banks, credit unions, retailers and financial institutions, among others. The company is headquartered in Brookfield, Wisconsin and has over 22,000 employees and more than 120 offices in 115 cities. Fiserv provides solutions for mobile and online banking, payments, risk management, data analytics and core account processing. In 2016, Fiserv reported total revenue of $5.5 billion. Fiserv has a right of first offer to lease any office space located on the 3rd floor of the building, subject to the rights granted to other tenants prior to the date of the lease. Fiserv is rated Baa2/BBB/NR by Moody’s, S&P and Fitch, respectively.
The Market. The property is located in Warren, Somerset County, within the central region of New Jersey and is approximately 34.6 miles southwest from New York City and 75.0 miles northeast from Philadelphia. Somerset County is home to several major companies including AT&T, Bloomberg, Johnson & Johnson Research & Development, Verizon Wireless and MetLife; other major employers within Somerset County include Alpharma, Avaya Inc., Catalent Pharma Solutions Inc., Conva Tec and Courier News. Somerset County has historically had a lower unemployment rate than that of the State of New Jersey and the nation. According to a third party research report, the 2016 population within a one-, three- and five-mile radius of the property was 3,282, 30,930 and 78,435, respectively. The estimated 2016 average household income within a one-, three- and five-mile radius of the property was $167,319, $202,127 and $183,471, respectively.
THE INFORMATION IN THIS COLLATERAL TERM SHEET IS NOT COMPLETE AND MAY BE AMENDED PRIOR TO THE TIME OF SALE. THIS TERM SHEET IS NOT AN OFFER TO SELL THESE SECURITIES AND IT IS NOT A SOLICITATION OF AN OFFER TO BUY THESE SECURITIES IN ANY JURISDICTION WHERE THE OFFER OR SALE IS NOT PERMITTED.
159
Mortgage Loan No. 11 — Center 78
The property is located along I-78 with immediate “on and off” accessibility via Exit 33, and is located 3.0 miles east of the interchange with I-287, providing local and regional accessibility along two of New Jersey’s heavily traveled highways and a significant crossroad in the tristate area, according to the appraisal. The property is an approximately 25-minute drive west of the Newark Airport and a 20-minute drive south of Morristown. The property is also located in close proximity of The Bridgewater Commons Mall, a major regional mall featuring large national anchors such as Bloomingdale’s, Macy’s and Lord & Taylor as well as the New Jersey National Golf Club and the Trump National Club in Bedminster.
The I-78 corridor is an active New Jersey office market, which has generated 5.3 million SF of aggregate leasing activity since 2012. Some of the major companies with presence along I-78 include Pfizer, MetLife, Nestle, Alcatel-Lucent, Verizon, Chubb Corp., Sanofi Aventis and L’Oréal. According to a third party research report, the property is located in in the Somerset/I-78 office submarket. As of the second quarter of 2017, the Somerset/I-78 submarket had approximately 25.8 million SF of office inventory with a vacancy of 10.0% and average asking rents of $26.87 PSF.
According to the appraisal, the property’s competitive set consists of the five properties detailed in the table below.
Competitive Set Summary(1)
| Property | Year Built / Renovated | Total GLA (SF) | Est. Rent PSF | Est. Occ. | Proximity (miles) | Anchor Tenants |
| Bridgewater Crossing | 2002 / NAV | 297,380 | $29.00 | 86.6% | 9.3 | Huawei Technologies |
| Somerset Corporate Center | 1997 / NAV | 240,091 | $28.50 | 100.0% | 8.6 | Iconnectiv |
| Connell Corporate Center 3 | 1999 / NAV | 244,179 | $28.00 | 87.2% | 9.3 | Edge Therapeutics |
| 211 Mount Airy Road | 1982 / 2014 | 306,194 | $27.50 | 100.0% | 3.6 | Dallchi Sankyo, Inc. |
| Somerset Corporate Center II | 2000 / NAV | 256,000 | $28.50 | 100.0% | 8.8 | Linde North America Inc. |
| (1) | Source: Appraisal. |
Historical and Current Occupancy(1)
| 2013 | 2014 | 2015 | 2016 | Current(2) |
| 3.7% | 36.5% | 42.4% | 88.7% | 88.7% |
| (1) | Source: Historical occupancy is provided by the sponsor. Occupancies are as of December 31 of each respective year. The increase in occupancy from 2013 to current is primarily due to the property undergoing lease-up after the most recent renovation. |
| (2) | Based on the June 22, 2017 underwritten rent roll. |
THE INFORMATION IN THIS COLLATERAL TERM SHEET IS NOT COMPLETE AND MAY BE AMENDED PRIOR TO THE TIME OF SALE. THIS TERM SHEET IS NOT AN OFFER TO SELL THESE SECURITIES AND IT IS NOT A SOLICITATION OF AN OFFER TO BUY THESE SECURITIES IN ANY JURISDICTION WHERE THE OFFER OR SALE IS NOT PERMITTED.
160
Mortgage Loan No. 11 — Center 78
Tenant Summary(1)
| Tenant | Ratings Moody’s/S&P/Fitch(2) | Net Rentable Area (SF) | % of Total NRA | Base Rent PSF | % of Total Base Rents | Lease Expiration Date |
| GSK | A2/A+/A | 147,411 | 39.6% | $28.29 | 43.4% | 2/28/2027 |
| EMC | Ba2/NR/BB+ | 81,683 | 21.9% | $29.50 | 25.1% | 9/30/2020 |
| Fiserv | Baa2/BBB/NR | 40,394 | 10.8% | $30.23 | 12.7% | 7/31/2024 |
| Continental Casualty Co. | A3/A/A | 25,207 | 6.8% | $29.50 | 7.7% | 6/30/2024 |
| Bellerophon Therapeutics, Inc. | NR/NR/NR | 21,845 | 5.9% | $29.50 | 6.7% | 3/31/2023 |
| UBS | Ba1/A-/A | 13,921 | 3.7% | $30.00 | 4.3% | 2/28/2025(3) |
| Liberty 1 Solar(4) | NR/NR/NR | 0 | 0.0% | N/A | 0.1% | 10/03/2033 |
| (1) | Based on the underwritten rent roll which includes rent steps of $58,725 through July 2018 and rent averaging through the lease term for Fiserv and Continental Casualty Co. totaling $107,668. |
| (2) | Ratings provided are for the parent company of the entity listed in the “Tenant” field whether or not the parent company guarantees the lease. |
| (3) | UBS has a termination option effective February 2023 subject to a 12-month prior notice period and the payment of a termination fee $415,372 ($29.84 PSF). |
| (4) | One tenant, Liberty I Solar, has no square footage but contributes $7,500 to the annual Base Rent. Liberty I Solar operates the solar panel equipment on the building’s rooftop. |
Lease Rollover Schedule(1)
| Year | Number of Leases Expiring | NRA Expiring | % of NRA Expiring | Base Rent Expiring | % of Base Rent Expiring | Cumulative NRA Expiring | Cumulative % of NRA Expiring | Cumulative Base Rent Expiring | Cumulative % of Base Rent Expiring | |||||||||||||||||||
| Vacant | NAP | 42,211 | 11.3 | % | NAP | NAP | 42,211 | 11.3 | % | NAP | NAP | |||||||||||||||||
| MTM | 0 | 0 | 0.0 | $0 | 0.0 | % | 42,211 | 11.3 | % | $0 | 0.0 | % | ||||||||||||||||
| 2017 | 0 | 0 | 0.0 | 0 | 0.0 | % | 42,211 | 11.3 | % | $0 | 0.0 | % | ||||||||||||||||
| 2018 | 0 | 0 | 0.0 | 0 | 0.0 | % | 42,211 | 11.3 | % | $0 | 0.0 | % | ||||||||||||||||
| 2019 | 0 | 0 | 0.0 | 0 | 0.0 | % | 42,211 | 11.3 | % | $0 | 0.0 | % | ||||||||||||||||
| 2020 | 1 | 81,683 | 21.9 | 2,409,649 | 25.1 | % | 123,894 | 33.2 | % | $2,409,649 | 25.1 | % | ||||||||||||||||
| 2021 | 0 | 0 | 0.0 | 0 | 0.0 | % | 123,894 | 33.2 | % | $2,409,649 | 25.1 | % | ||||||||||||||||
| 2022 | 0 | 0 | 0.0 | 0 | 0.0 | % | 123,894 | 33.2 | % | $2,409,649 | 25.1 | % | ||||||||||||||||
| 2023 | 1 | 21,845 | 5.9 | 644,428 | 6.7 | % | 145,739 | 39.1 | % | $3,054,076 | 31.8 | % | ||||||||||||||||
| 2024 | 3 | 65,601 | 17.6 | 1,964,693 | 20.4 | % | 211,340 | 56.7 | % | $5,018,769 | 52.2 | % | ||||||||||||||||
| 2025 | 1 | 13,921 | 3.7 | 417,630 | 4.3 | % | 225,261 | 60.4 | % | $5,436,399 | 56.5 | % | ||||||||||||||||
| 2026 | 0 | 0 | 0.0 | 0 | 0.0 | % | 225,261 | 60.4 | % | $5,436,399 | 56.5 | % | ||||||||||||||||
| 2027 | 3 | 147,411 | 39.6 | 4,169,785 | 43.4 | % | 372,672 | 100.0 | % | $9,606,184 | 99.9 | % | ||||||||||||||||
| 2028 & Beyond(2) | 1 | 0 | 0.0 | 7,500 | 0.1 | % | 372,672 | 100.0 | % | $9,613,684 | 100.0 | % | ||||||||||||||||
| Total | 10 | 372,672 | 100.0 | % | $9,613,684 | 100.0 | % | |||||||||||||||||||||
| (1) | Based on the underwritten rent roll which includes rent steps of $58,725 through July 2018 and rent averaging through the lease term for Fiserv and Continental Casualty Co. totaling $107,668. |
| (2) | One tenant, Liberty I Solar, has no square footage but contributes $7,500 to the Base Rent. |
THE INFORMATION IN THIS COLLATERAL TERM SHEET IS NOT COMPLETE AND MAY BE AMENDED PRIOR TO THE TIME OF SALE. THIS TERM SHEET IS NOT AN OFFER TO SELL THESE SECURITIES AND IT IS NOT A SOLICITATION OF AN OFFER TO BUY THESE SECURITIES IN ANY JURISDICTION WHERE THE OFFER OR SALE IS NOT PERMITTED.
161
Mortgage Loan No. 11 — Center 78
Operating History and Underwritten Net Cash Flow
| 2014(1) | 2015 | 2016 | TTM(2) | Underwritten(3) | PSF | %(4) | |||||||||||||||
| Rents in Place | N/A | $4,231,116 | $7,888,637 | $9,265,917 | $9,613,684 | $25.80 | 85.5 | % | |||||||||||||
| Vacant Income | N/A | 0 | 0 | 0 | 1,245,225 | 3.34 | 11.1 | % | |||||||||||||
| Free Rent Adjustments(5) | N/A | (46,403 | ) | (4,257,162 | ) | (3,759,637 | ) | 0 | 0.00 | 0.0 | % | ||||||||||
| Gross Potential Rent | N/A | $4,184,713 | $3,631,475 | $5,506,280 | $10,858,909 | $29.14 | 96.6 | % | |||||||||||||
| Total Reimbursements | N/A | 171,224 | 169,741 | 236,025 | 378,926 | 1.02 | 3.4 | % | |||||||||||||
| Net Rental Income | N/A | $4,355,937 | $3,801,216 | $5,742,305 | $11,237,835 | $30.15 | 100.0 | % | |||||||||||||
| (Vacancy/Collection Loss) | N/A | 0 | 0 | 0 | (1,245,225 | ) | (3.34 | ) | (11.1 | %) | |||||||||||
| Other Income | N/A | 1,537 | 2,882 | 9,791 | 4,737 | 0.01 | 0.0 | % | |||||||||||||
| Effective Gross Income | N/A | $4,357,474 | $3,804,098 | $5,752,096 | $9,997,347 | $26.83 | 88.9 | % | |||||||||||||
| Total Expenses | N/A | $2,970,656 | $2,985,327 | $3,318,818 | $3,648,950 | $9.79 | 36.5 | % | |||||||||||||
| Net Operating Income(6) | N/A | $1,386,818 | $818,771 | $2,433,278 | $6,348,397 | $17.03 | 63.5 | % | |||||||||||||
| Total TI/LC, Capex/RR | N/A | 0 | 0 | 0 | 469,568 | 1.26 | 4.7 | % | |||||||||||||
| Net Cash Flow | N/A | $1,386,818 | $818,771 | $2,433,278 | $5,878,829 | $15.77 | 58.8 | % | |||||||||||||
| (1) | The property underwent an extensive $43.0 million renovation ($115 PSF) from 2012 to 2014 and as such, historical financial information is unavailable. |
| (2) | Represents the trailing twelve month period ending May 31, 2017. |
| (3) | Rents in Place is underwritten based on the June 22, 2017 rent roll and includes rent steps of $58,725 through July 2018 and rent averaging through the lease term for Fiserv and Continental Casualty Co. totaling $107,668. |
| (4) | Percentage column represents percent of Net Rental Income for all revenue lines and represents percent of Effective Gross Income for the remainder of fields. |
| (5) | GSK and Continental Casualty Co. received nine months and twelve months of free rent, respectively. |
| (6) | The increase in May 31, 2017 TTM Net Operating Income from 2016 Net Operating Income and 2015 Net Operating Income is primarily due to the property undergoing lease-up after the most recent renovation. |
THE INFORMATION IN THIS COLLATERAL TERM SHEET IS NOT COMPLETE AND MAY BE AMENDED PRIOR TO THE TIME OF SALE. THIS TERM SHEET IS NOT AN OFFER TO SELL THESE SECURITIES AND IT IS NOT A SOLICITATION OF AN OFFER TO BUY THESE SECURITIES IN ANY JURISDICTION WHERE THE OFFER OR SALE IS NOT PERMITTED.
162
(THIS PAGE INTENTIONALLY LEFT BLANK)
163
Mortgage Loan No. 12 — The Manhanttan
| Mortgage Loan Information | Property Information |
| Mortgage Loan Seller: | Natixis | Single Asset / Portfolio: | Single Asset | |
| Original Principal Balance: | $32,875,000 | Title: | Fee | |
| Cut-off Date Principal Balance: | $32,875,000 | Property Type - Subtype: | Mixed-use – Office/Retail | |
| % of Pool by IPB: | 3.8% | Net Rentable Area (SF): | 77,851 | |
| Loan Purpose: | Refinance | Location: | Washington, DC | |
| Borrower: | Jemal's Manhattan L.L.C. | Year Built / Renovated: | 1877,1911 / 2016 | |
| Sponsor(1): | Norman Jemal | Occupancy(2): | 95.8% | |
| Interest Rate: | 4.3920% | Occupancy Date: | 8/5/2017 | |
| Note Date: | 7/31/2017 | Number of Tenants: | 8 | |
| Maturity Date: | 8/5/2027 | 2014 NOI(2): | N/A | |
| Interest-only Period: | 120 months | 2015 NOI(2): | N/A | |
| Original Term: | 120 months | 2016 NOI(2): | N/A | |
| Original Amortization: | None | TTM NOI(3)(4): | $1,236,939 | |
| Amortization Type: | Interest Only | UW Economic Occupancy: | 94.9% | |
| Call Protection: | L(25),Def (91),O(4) | UW Revenues: | $3,521,668 | |
| Lockbox: | Hard | UW Expenses: | $827,926 | |
| Additional Debt: | No | UW NOI(4): | $2,693,742 | |
| Additional Debt Balance: | N/A | UW NCF: | $2,561,396 | |
| Additional Debt Type: | N/A | Appraised Value / Per SF(5): | $52,700,000 / $677 | |
| Additional Future Debt Permitted: | No | Appraisal Date: | 8/1/2018 |
| Escrows and Reserves | Financial Information |
| Initial | Monthly | Initial Cap | Cut-off Date Loan / SF: | $422 | ||
| Taxes: | $135,958 | $27,192 | N/A | Maturity Date Loan / SF: | $422 | |
| Insurance: | $7,014 | Springing | N/A | Cut-off Date LTV(4): | 62.4% | |
| Replacement Reserves: | $0 | $1,103 | N/A | Maturity Date LTV(4): | 62.4% | |
| TI/LC: | $350,000 | Springing | $350,000 | UW NOI DSCR: | 1.84x | |
| Free Rent Reserve: | $162,062 | $0 | N/A | UW NCF DSCR: | 1.75x | |
| Outstanding TI/LC: | $693,945 | $0 | N/A | UW NOI Debt Yield: | 8.2% | |
| Tenant Cash Trap Reserve: | $0 | Springing | N/A | UW NCF Debt Yield: | 7.8% |
Sources and Uses
| Sources | Proceeds | % of Total | Uses | Proceeds | % of Total | |
| Mortgage Loan | $32,875,000 | 100.0% | Payoff Existing Debt | $23,517,152 | 71.5% | |
| Return of Equity | 7,735,199 | 23.5 | ||||
| Upfront Reserves | 1,348,979 | 4.1 | ||||
| Closing Costs | 273,669 | 0.8 | ||||
| Total Sources | $32,875,000 | 100.0% | Total Uses | $32,875,000 | 100.0% |
| (1) | The sponsor was involved in litigation. See “Description of the Mortgage Pool—Litigation and Other Considerations” in the Preliminary Prospectus. |
| (2) | Historical occupancies are not available. The borrower began a complete renovation of the property in 2015 totaling $14.4 million. The rehabilitation/restoration of the property included the refurbishing of the historic exterior facades and windows, the implementation of new HVAC and mechanical units, the replacement of the roof, the installation of new store front and exterior lighting, the upgrade of the entire base building services, the installation of new elevator and fire equipment systems, the upgrade of the electrical systems, the pavement of the alleyways, and the tenant improvement |
THE INFORMATION IN THIS COLLATERAL TERM SHEET IS NOT COMPLETE AND MAY BE AMENDED PRIOR TO THE TIME OF SALE. THIS TERM SHEET IS NOT AN OFFER TO SELL THESE SECURITIES AND IT IS NOT A SOLICITATION OF AN OFFER TO BUY THESE SECURITIES IN ANY JURISDICTION WHERE THE OFFER OR SALE IS NOT PERMITTED.
164
Mortgage Loan No. 12 — The Manhanttan
buildouts. The borrower began leasing up the property in 2016. As of August 5, 2017, the property was 95.8% leased and 84.8% occupied. Four retail tenants are currently building out their spaces.
| (3) | Represents the trailing twelve month period ending May 31, 2017. |
| (4) | The increase in UW NOI from TTM NOI is primarily due to the property undergoing lease-up after the most recent renovation. |
| (5) | Based on the “as-stabilized” value, which assumes that all outstanding tenant improvements, leasing commissions and free rent have been paid or escrowed at origination. The “as-is” value as of July 11, 2017 is $49.8million, which results in a Cut-off Date LTV and Maturity Date LTV of 66.0% and 66.0%, respectively. |
The Loan. The Manhattan loan is a $32.875 million first mortgage loan secured by the fee interest in a 77,851 SF mixed-use office/retail complex known as The Manhattan, located in Washington, District of Columbia. The loan has a 10-year term and is interest-only for the term of the loan.
The Borrower. The borrowing entity for the loan is Jemal’s Manhattan L.L.C., a District of Columbia limited liability company and special purpose entity. The borrowing entity is indirectly owned by Norman and Douglas Jemal.
The Sponsor. The loan’s sponsor and nonrecourse carve-out guarantor is Norman Jemal. Norman Jemal and his father Douglas Jemal are the principals of Douglas Development Corporation (“DDC”). DDC is a large real estate developer in the Washington, DC area founded in 1985 with a current portfolio of nearly 10.0 million leasable SF and over 5.0 million SF of developable real estate in the pipeline. DDC is comprised of over 100 full time employees. As of July 31, 2017, Norman Jemal reported net worth and liquidity of approximately $416.0 million and approximately $2.8 million, respectively. Norman Jemal has been involved in litigation. See “Description of the Mortgage Pool—Litigation and Other Considerations” in the Preliminary Prospectus.
The Property. The property is a 77,851 SF mixed-used property consisting of 57,842 SF of office and 20,009 SF of retail, and is comprised of three adjacent buildings located on an 18,271 SF parcel in Washington, DC. The original building was constructed in 1877 and the rest of the site was constructed in 1911. Between 2015 and 2016, the sponsor implemented an extensive renovation of the property totaling $14.4 million, including $7.7 million of base building work and $6.7 million of tenant improvement buildouts. The rehabilitation/restoration of the property included the refurbishing of the historic exterior facades and windows, the implementation of new HVAC and mechanical units, the replacement of the roof, the installation of new store front and exterior lighting, the upgrade of the entire base building services, the installation of new elevator and fire equipment systems, the upgrade of the electrical systems, the pavement of the alleyways, and the tenant improvement buildouts. The borrower began leasing up the property in 2016. As of August 5, 2017, the property was 95.8% leased and 84.8% occupied. Four tenants are currently building out their spaces. The retail component is currently 83.5% leased to six tenants. The office component is currently 100.0% leased to two tenants.
The largest tenant at the property, WeWork, leases 50,680 SF (65.1% of the net rentable area) through December, 2031. Founded in 2010, WeWork is a New York-based provider of shared office space that brings together entrepreneurs, freelancers, startups, and small businesses, creating both physical and virtual communities where members learn from, grow with, and support each other. WeWork’s revenue is primarily generated through membership subscriptions based on the amount of space rented, which can range from a single seat at a shared office desk to large private office space. WeWork currently has 216 locations across the world, including 130 in the United States. WeWork is currently valued at $20 billion after completing its fundraising in early July 2017, securing $760 million in Series G funding. WeWork operates co-working spaces in 17 countries. The second largest tenant at the property, Mothership Strategies, leases 7,162 SF (9.2% of the net rentable area) through November, 2021. Mothership Strategies is a Washington, DC based progressive digital firm that specializes in online fundraising, digital advertising, and grassroots advocacy. The company was founded by three of the digital organizers in the Democratic Party. Mothership Strategies works on campaigns for candidates, ballot initiatives, and specific issues with fundraising and persuasion efforts. Retail tenants include La Colombe coffee shop (3.3% of the net rentable area); Franklin Hall, an American beer hall (7.3% of the net rentable area), two fitness centers, a new wood-fire cooking concept restaurant and a retail store. The two restaurants at the property are operated by experienced local restaurateurs who operate other restaurants in Washington, DC.
THE INFORMATION IN THIS COLLATERAL TERM SHEET IS NOT COMPLETE AND MAY BE AMENDED PRIOR TO THE TIME OF SALE. THIS TERM SHEET IS NOT AN OFFER TO SELL THESE SECURITIES AND IT IS NOT A SOLICITATION OF AN OFFER TO BUY THESE SECURITIES IN ANY JURISDICTION WHERE THE OFFER OR SALE IS NOT PERMITTED.
165
Mortgage Loan No. 12 — The Manhanttan
The Market. The property is located on the south side of Florida Avenue NW, just west of 14th Street NW in the District of Columbia’s East End district. The property is approximately four blocks northwest of the U Street Metrorail station, offering access to downtown Washington, DC, Maryland, and Virginia. The property is also located across the street from a bus stop (serviced by Metro Bus 52, 53, and 54). According to the appraiser, U Street is known for its nightlife scene with attractions that include Lincoln Theatre and U Street Music Hall, two popular music venues in the area. The property is located at the northern end of the 14th Street Corridor. Restaurants within walking distance of the property include Eatonville, Pica Taco, Piola, Judy, Sweetgreen, Fast Gourmet, Martha’s Table, Busboy and Poets, Matchbox, Ted Bulletin, Fainting Goat and Ben’s Chili Bowl. The property is close to three popular grocers: Smucker Farms of Lancaster County (less than a block away), Yes! Organic Market (one-block away) and Trader Joe's (within 0.3 miles). The property is located approximately 1.7 miles north of the White House, approximately 2.6 miles north of the Washington Monument, and approximately 3.3 miles north of the United State Capitol. Other attractions in the area include Howard University, located approximately 0.8 miles east, and Meridian Hill Park, located approximately 0.3 miles west.
According to a third party research report, the property is located in Georgetown/Uptown submarket of Downtown Washington, DC. As of the second quarter of 2017, the Georgetown/Uptown submarket contained 17.3 million SF of office space with an overall office vacancy rate of 9.7% and 11.5 million SF of retail space with an overall retail vacancy rate of 4.7%. The appraisal concluded market rents of $40.00 PSF gross for the office space, $58.00 PSF for ground floor retail space and $42.50 PSF NNN for large retail space. According to the appraisal, the property’s competitive set consists of the eight office properties detailed in the table below.
Competitive Set Summary(1)
| Property | Year Built / Renovated | Total GLA (SF) | Est. Rent PSF | Est. Occ. | Proximity (miles) | Anchor Tenants |
| 1725 Desales Street NW | 1961 / NAV | 70,724 | $44.50 | 87.5% | 1.6 | Washington Express |
| 1234 19th Street NW | 1966 / 2002 | 32,464 | $52.00 | 96.0% | 1.2 | Medical Faculty Associates Inc. |
| 1533 9th Street NW | NAV / 2017 | 3,360 | $50.00 | 34.5% | 1.0 | Atlas Lane Property |
| 1300 L Street NW | 1986 / NAV | 79,294 | $40.25 | 95.1% | 1.3 | Center for Responsive Politics |
| 1707 L Street NW | 1963 / NAV | 102,631 | $46.50 | 97.4% | 1.6 | Institute for Market Transformation |
| 1255 23rd Street Northwest | 1983 / 2008 | 325,000 | $47.00 | 93.1% | 1.7 | Fox Architects |
| 1400 16th Street NW | 1988 / 2010 | 188,000 | $36.00 | 98.5% | 1.0 | Pinchot Institute For Conservation |
| 1614 14th Street NW | 1900 / NAV | 5,889 | $50.00 | 100.0% | 0.6 | Monarch Title |
| (1) | Source: Appraisal. |
Historical and Current Occupancy(1)
| 2013 | 2014 | 2015 | 2016 | Current(2) |
| N/A | N/A | N/A | N/A | 95.8% |
| (1) | Source: Historical Occupancy is not available. Between 2015 and 2016, the sponsor implemented an extensive renovation of the property totaling $14.4 million. |
| (2) | Based on the August 5, 2017 underwritten rent roll. |
THE INFORMATION IN THIS COLLATERAL TERM SHEET IS NOT COMPLETE AND MAY BE AMENDED PRIOR TO THE TIME OF SALE. THIS TERM SHEET IS NOT AN OFFER TO SELL THESE SECURITIES AND IT IS NOT A SOLICITATION OF AN OFFER TO BUY THESE SECURITIES IN ANY JURISDICTION WHERE THE OFFER OR SALE IS NOT PERMITTED.
166
Mortgage Loan No. 12 — The Manhanttan
Tenant Summary(1)
| Tenant | Ratings Moody’s/S&P/Fitch | Net Rentable Area (SF) | % of Total NRA | Base Rent PSF | % of Total Base Rents | Lease Expiration Date |
| WeWork | NA / NA / NA | 50,680 | 65.1% | $40.80 | 65.3% | 12/31/2031 |
| Mothership Strategies | NA / NA / NA | 7,162 | 9.2% | $35.20 | 8.0% | 11/30/2021 |
| Franklin Hall | NA / NA / NA | 5,649 | 7.3% | $41.20 | 7.3% | 12/31/2026 |
| Compass Rose (Maydan) | NA / NA / NA | 2,926 | 3.8% | $58.00 | 5.4% | 12/31/2027 |
| Downtown Fitness (Mint) | NA / NA / NA | 2,869 | 3.7% | $60.00 | 5.4% | 2/28/2027 |
| La Colombe | NA / NA / NA | 2,534 | 3.3% | $46.35 | 3.7% | 12/31/2026 |
| 305 Fitness | NA / NA / NA | 2,023 | 2.6% | $57.00 | 3.6% | 9/30/2027 |
| Ivy Wild Beauty | NA / NA / NA | 700 | 0.9% | $58.00 | 1.3% | 9/1/2027 |
| (1) | Based on the underwritten rent roll, including rent increases occurring through August 2018. |
Lease Rollover Schedule(1)
| Year | Number of Leases Expiring | NRA Expiring | % of NRA Expiring | Base Rent Expiring | % of Base Rent Expiring | Cumulative NRA Expiring | Cumulative % of NRA Expiring | Cumulative Base Rent Expiring | Cumulative % of Base Rent Expiring |
| Vacant | NAP | 3,308 | 4.2% | NAP | NAP | 3,308 | 4.2% | NAP | NAP |
| MTM | 0 | 0 | 0.0 | $0 | 0.0% | 3,308 | 4.2% | $0 | 0.0% |
| 2017 | 0 | 0 | 0.0 | 0 | 0.0 | 3,308 | 4.2% | $0 | 0.0% |
| 2018 | 0 | 0 | 0.0 | 0 | 0.0 | 3,308 | 4.2% | $0 | 0.0% |
| 2019 | 0 | 0 | 0.0 | 0 | 0.0 | 3,308 | 4.2% | $0 | 0.0% |
| 2020 | 0 | 0 | 0.0 | 0 | 0.0 | 3,308 | 4.2% | $0 | 0.0% |
| 2021 | 1 | 7,162 | 9.2 | 252,073 | 8.0 | 10,470 | 13.4% | $252,073 | 8.0% |
| 2022 | 0 | 0 | 0.0 | 0 | 0.0 | 10,470 | 13.4% | $252,073 | 8.0% |
| 2023 | 0 | 0 | 0.0 | 0 | 0.0 | 10,470 | 13.4% | $252,073 | 8.0% |
| 2024 | 0 | 0 | 0.0 | 0 | 0.0 | 10,470 | 13.4% | $252,073 | 8.0% |
| 2025 | 0 | 0 | 0.0 | 0 | 0.0 | 10,470 | 13.4% | $252,073 | 8.0% |
| 2026 | 2 | 8,183 | 10.5 | 350,190 | 11.1 | 18,653 | 24.0% | $602,263 | 19.0% |
| 2027 | 4 | 8,518 | 10.9 | 497,759 | 15.7 | 27,171 | 34.9% | $1,100,022 | 34.7% |
| 2028 & Beyond | 1 | 50,680 | 65.1 | 2,067,744 | 65.3 | 77,851 | 100.0% | $3,167,766 | 100.0% |
| Total | 8 | 77,851 | 100.0% | $3,167,766 | 100.0% |
| (1) | Based on the underwritten rent roll. Rent includes base rent and rent increases occurring through August 2018. |
THE INFORMATION IN THIS COLLATERAL TERM SHEET IS NOT COMPLETE AND MAY BE AMENDED PRIOR TO THE TIME OF SALE. THIS TERM SHEET IS NOT AN OFFER TO SELL THESE SECURITIES AND IT IS NOT A SOLICITATION OF AN OFFER TO BUY THESE SECURITIES IN ANY JURISDICTION WHERE THE OFFER OR SALE IS NOT PERMITTED.
167
Mortgage Loan No. 12 — The Manhanttan
Operating History and Underwritten Net Cash Flow
| 2014 | 2015 | 2016 | TTM(1) | Underwritten(2) | PSF | %(3) | |
| Rents in Place(4) | N/A | N/A | N/A | $2,078,165 | $3,167,766 | $40.69 | 85.3% |
| Rent Adjustments | N/A | N/A | N/A | (609,076) | 0 | 0.00 | 0.0% |
| Vacant Income | N/A | N/A | N/A | 0 | 190,210 | 2.44 | 5.1% |
| Gross Potential Rent | N/A | N/A | N/A | $1,469,089 | $3,357,976 | $43.13 | 90.5% |
| Total Reimbursements | N/A | N/A | N/A | 108,305 | 353,902 | 4.55 | 9.5% |
| Net Rental Income | N/A | N/A | N/A | $1,577,394 | $3,711,878 | $47.68 | 100.0% |
| (Vacancy/Collection Loss) | N/A | N/A | N/A | 0 | (190,210) | (2.44) | (5.1%) |
| Other Income | N/A | N/A | N/A | 0 | 0 | 0.00 | 0.0% |
| Effective Gross Income | N/A | N/A | N/A | $1,577,394 | $3,521,668 | $45.24 | 94.9% |
| Total Expenses | N/A | N/A | N/A | $340,455 | $827,926 | $10.63 | 23.5% |
| Net Operating Income(5) | N/A | N/A | N/A | $1,236,939 | $2,693,742 | $34.60 | 76.5% |
| Total TI/LC, Capex/RR | N/A | N/A | N/A | 0 | 132,347 | 1.70 | 3.8% |
| Net Cash Flow | N/A | N/A | N/A | $1,236,939 | $2,561,396 | $32.90 | 72.7% |
| (1) | Represents the trailing twelve month period ending May 31, 2017. |
| (2) | Underwritten Rents in Place includes base rent and rent steps occurring through August 2018. |
| (3) | Percentage column represents percent of Net Rental Income for all revenue lines and represents percent of Effective Gross Income for the remainder of fields. |
| (4) | The borrower began leasing up the property in 2016. As of August 5, 2017, the property was 95.8% leased and 84.8% occupied. |
| (5) | The increase in UW NOI from TTM NOI is primarily due to the property undergoing lease-up after the most recent renovation. |
THE INFORMATION IN THIS COLLATERAL TERM SHEET IS NOT COMPLETE AND MAY BE AMENDED PRIOR TO THE TIME OF SALE. THIS TERM SHEET IS NOT AN OFFER TO SELL THESE SECURITIES AND IT IS NOT A SOLICITATION OF AN OFFER TO BUY THESE SECURITIES IN ANY JURISDICTION WHERE THE OFFER OR SALE IS NOT PERMITTED.
168
(THIS PAGE INTENTIONALLY LEFT BLANK)
169
Mortgage Loan No. 13 — West Town Mall
| Mortgage Loan Information | Property Information | |||
| Mortgage Loan Seller: | Column | Single Asset / Portfolio: | Single Asset | |
| Original Principal Balance(1): | $30,000,000 | Title: | Fee & Leasehold | |
| Cut-off Date Principal Balance(1): | $30,000,000 | Property Type - Subtype: | Retail – Super Regional Mall | |
| % of Pool by IPB: | 3.5% | Net Rentable Area (SF)(4): | 772,503 | |
| Credit Assessment (Fitch/KBRA)(2): | BBB/A+ | Location: | Knoxville, TN | |
| Loan Purpose: | Refinance | Year Built / Renovated: | 1972 / 2013 | |
| Borrowers: | West Town Mall, LLC | Occupancy: | 93.1% | |
| Sponsors: | Simon Property Group, L.P.; Teachers Insurance and Annuity Association of America | Occupancy Date: | 3/1/2017 | |
| Interest Rate: | 4.3700% | Number of Tenants(4): | 114 | |
| Note Date: | 6/29/2017 | 2014 NOI: | $23,453,621 | |
| Maturity Date: | 7/1/2022 | 2015 NOI: | $23,756,289 | |
| Interest-only Period: | 30 months | 2016 NOI: | $23,421,699 | |
| Original Term: | 60 months | TTM NOI(5): | $23,327,649 | |
| Original Amortization(3): | 360 months | UW Economic Occupancy: | 92.6% | |
| Amortization Type: | IO-Balloon | UW Revenues: | $29,380,918 | |
| Call Protection: | L(26),Def(27),O(7) | UW Expenses: | $6,799,826 | |
| Lockbox: | Hard | UW NOI: | $22,581,092 | |
| Additional Debt: | Yes | UW NCF: | $21,032,932 | |
| Additional Debt Balance(1): | $180,000,000 | Appraised Value / Per SF(4): | $375,000,000 / $485 | |
| Additional Debt Type(1): | Pari Passu, B-Note | Appraisal Date: | 5/24/2017 | |
| Additional Future Debt Permitted: | Yes – PACE Loan (not to exceed $5,000,000) | |||
| Escrows and Reserves | Financial Information(1) | |||||
| Initial | Monthly | Initial Cap | Cut-off Date Loan / SF(4): | $160 | ||
| Taxes: | $0 | Springing | N/A | Maturity Date Loan / SF(4): | $149 | |
| Insurance: | $0 | Springing | N/A | Cut-off Date LTV: | 33.0% | |
| Replacement Reserves: | $0 | Springing | $463,503 | Maturity Date LTV: | 30.7% | |
| TI/LC: | $80,469 | $80,469 | $3,862,515 | UW NOI DSCR: | 2.58x | |
| UW NCF DSCR: | 2.40x | |||||
| UW NOI Debt Yield: | 18.2% | |||||
| UW NCF Debt Yield: | 17.0% | |||||
| Sources and Uses | ||||||
| Sources | Proceeds | % of Total | Uses | Proceeds | % of Total | |
| Mortgage Loan | $210,000,000 | 99.1% | Payoff Existing Debt | $211,109,475 | 99.6% | |
| Sponsor Equity | 1,907,898 | 0.9 | Closing Costs | 717,955 | 0.3 | |
| Upfront Reserves | 80,469 | 0.0 | ||||
| Total Sources | $211,907,898 | 100.0% | Total Uses | $211,907,898 | 100.0% |
| (1) | The West Town Mall loan is a part of a larger split whole loan evidenced by four seniorpari passu A notes with an original balance of $123.9 million and two B Notes with an original principal balance of $86.1 million. The financial information presented in the chart above and herein reflects the cut-off date balance of $123.9 million of A Notes, but not the B Notes. For more information see “Description of the Mortgage Pool – The Whole Loans” in the Preliminary Prospectus. |
THE INFORMATION IN THIS COLLATERAL TERM SHEET IS NOT COMPLETE AND MAY BE AMENDED PRIOR TO THE TIME OF SALE. THIS TERM SHEET IS NOT AN OFFER TO SELL THESE SECURITIES AND IT IS NOT A SOLICITATION OF AN OFFER TO BUY THESE SECURITIES IN ANY JURISDICTION WHERE THE OFFER OR SALE IS NOT PERMITTED.
170
Mortgage Loan No. 13 — West Town Mall
| (2) | Fitch and KBRA have each confirmed that the loan has, in the context of its inclusion in the Initial Pool Balance, credit characteristics consistent with an investment grade obligation. |
| (3) | The West Town Mall Whole Loan is structured with a fixed amortization schedule based on an approximately 360-month amortization period. For more information see “Description of the Mortgage Pool – The Whole Loans” in the Preliminary Prospectus. |
| (4) | Not inclusive of the square footage or number of leases associated with the Dillard’s, Sears, JCPenney and Longhorn Steakhouse boxes. The Dillard’s JCPenney and Sears Auto land and improvements are tenant owned with no attributable base rent. Sears Retail and Longhorn Steakhouse own their respective improvements, but not the underlying land, which is ground leased from the borrower at an underwritten base rent of $0 and $147,500, respectively. |
| (5) | Represents the trailing twelve month period ending May 31, 2017. |
The Loan. The West Town Mall loan, which is part of a larger split whole loan, is a first mortgage loan secured by the fee and leasehold interest in a 772,503 SF super regional mall located in Knoxville, Tennessee. The loan has a five-year term and will amortize on a fixed amortization schedule following an initial interest-only period of 30 months. The West Town Mall loan is a part of a whole loan (the “West Town Mall Whole Loan”) that is evidenced by fourpari passu promissory notes (Note A-2-B, the “Trust A Note” and Notes A-1-A, A-1-B and A-2-A, the “Companion A Notes”, collectively the “West Town Mall Senior Loans”) and two subordinate notes (Notes B-1 and B-2, collectively, the “West Town Mall Subordinate Companion Loans”). The senior Companion A Notes and the West Town Mall Subordinate Companion Loans were contributed to the West Town Mall Trust 2017-KNOX trust that governs the servicing and administration of the West Town Mall Whole Loan and is the controlling note under the related co-lender agreement, the rights of which will be exercised by the related trustee (or, prior to the occurrence and continuance of a control termination event under the related trust and servicing agreement (the “West Town Mall Trust 2017-KNOX Trust and Servicing Agreement”), the directing certificateholder under the West Town Mall Trust 2017-KNOX Trust and Servicing Agreement). However, the CSAIL 2017-CX9 Trust will be entitled, under certain circumstances, to be consulted with respect to certain major decisions (which rights will be exercised by the Directing Certificateholder prior to a Consultation Termination Event). For more information see “Description of the Mortgage Pool – The Whole Loans” in the Preliminary Prospectus.
Whole Loan Note Summary
| Original Balance | Cut-off Date Balance | Note Holder | Lead Servicer for Whole Loan (Y/N) | Controlling Piece (Y/N) | |
| Note A-1-A | $31,950,000 | $31,950,000 | WTOWN 2017-KNOX | Y | N |
| Note A-2-A | 30,000,000 | 30,000,000 | JPMCC 2017-JP7 | N | N |
| Note A-1-B | 31,950,000 | 31,950,000 | WTOWN 2017-KNOX | Y | N |
| Note A-2-B | 30,000,000 | 30,000,000 | CSAIL 2017-CX9 | N | N |
| Note B-1 | 43,050,000 | 43,050,000 | WTOWN 2017-KNOX | Y | Y |
| Note B-2 | 43,050,000 | 43,050,000 | WTOWN 2017-KNOX | Y | Y |
| Total | $210,000,000 | $210,000,000 |
THE INFORMATION IN THIS COLLATERAL TERM SHEET IS NOT COMPLETE AND MAY BE AMENDED PRIOR TO THE TIME OF SALE. THIS TERM SHEET IS NOT AN OFFER TO SELL THESE SECURITIES AND IT IS NOT A SOLICITATION OF AN OFFER TO BUY THESE SECURITIES IN ANY JURISDICTION WHERE THE OFFER OR SALE IS NOT PERMITTED.
171
Mortgage Loan No. 13 — West Town Mall
West Town Mall Total Debt Capital Structure
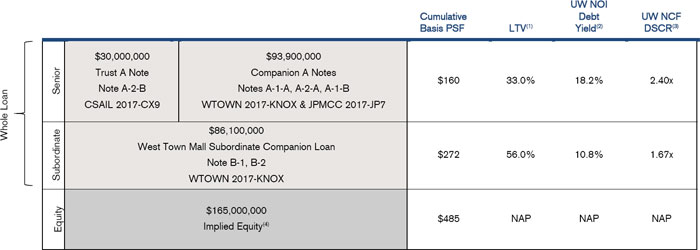
| (1) | Based on an as-is appraised value of $375.0 million as of May 24, 2017 per the appraisal. |
| (2) | Based on the UW NOI of $22,581,092. |
| (3) | Based on the UW NCF of $21,032,932, the coupon of 4.3700% and a fixed amortization schedule on the West Town Mall Whole Loan. |
| (4) | Implied Equity is based on the as-is appraised value of $375.0 million, less total debt of $210.0 million. |
The Borrower. The borrowing entity for the loan is West Town Mall, LLC, a Delaware limited liability company and special purpose entity.
The Sponsors. The borrower is owned by a 50/50 joint venture between affiliates of Simon Property Group, L.P. (“Simon”) and Teachers Insurance and Annuity Association of America, for the benefit of its separate real estate account (“TIAA” and, together with Simon, the “Loan Sponsor”). Simon is a wholly-owned subsidiary of Simon Property Group Inc., a publicly traded REIT (NYSE: SPG, S&P: A) that is focused on retail property ownership and management. Simon is the largest publicly traded owner, operator and developer of retail assets in the world. TIAA, formerly TIAA-CREF (Teachers Insurance and Annuity Association-College Retirement Equities Fund), is a Fortune 100 financial services organization that is the leading provider of retirement financial services for the academic, research, medical, cultural and governmental industries. As of June 30, 2017, TIAA serves over 5 million active and retired employees participating at more than 15,000 institutions and has $954 billion in combined assets under management with holdings in more than 50 countries. Simon has owned the West Town Mall since 1996 via the acquisition of DeBartolo Realty Corporation, which owned the shopping mall at the time of Simon’s acquisition. Simon serves as the nonrecourse carve-out guarantor and loan sponsor for the West Town Mall Whole Loan, subject to the borrower’s right to replace the guarantor with a replacement guarantor in accordance with the loan documents. The liability of Simon under the nonrecourse carve-out guaranty is capped at $42.0 million plus reasonable collection costs.
The Property. The property is an approximately 1.3 million SF super regional mall located in Knoxville, Tennessee. Approximately 772,503 SF of the West Town Mall serve as collateral for the West Town Mall Whole Loan. West Town Mall was originally constructed in 1972 and underwent expansions and renovations in 1985, 1998 and 2013. Furthermore, according to Simon, the property is currently undergoing a renovation at an estimated cost of $15.75 million with an expected completion in April 2018. Upgrades are expected to include improvements and repairs to the floors, lighting, ceilings, skylights, paint, restrooms, furniture, landscaping and signage. In addition to the aforementioned general improvements, the renovation plan includes the renovation of four out of five mall entrances, the construction of a new entrance from the parking garage and a renovation of the food court. The property is located on an approximately 95.7 acre parcel and is Tennessee’s largest enclosed mall. The property benefits from several large-scale anchors, as detailed below, in addition to a diverse mix of both national and local in-line retail tenants. The property contains 6,648 parking spaces split between an indoor parking garage and surface parking lots surrounding the
THE INFORMATION IN THIS COLLATERAL TERM SHEET IS NOT COMPLETE AND MAY BE AMENDED PRIOR TO THE TIME OF SALE. THIS TERM SHEET IS NOT AN OFFER TO SELL THESE SECURITIES AND IT IS NOT A SOLICITATION OF AN OFFER TO BUY THESE SECURITIES IN ANY JURISDICTION WHERE THE OFFER OR SALE IS NOT PERMITTED.
172
Mortgage Loan No. 13 — West Town Mall
property, resulting in an overall parking ratio of 5.0 spaces per 1,000 SF based on the total mall square footage of approximately 1.3 million SF.
The mall includes several anchor tenants, both non-owned and collateral. Non-owned anchors include Dillard’s, JCPenney, and Sears Auto, each of which owns its own underlying land and improvements, as well as Sears Retail, which owns its improvements, but not the underlying land, which is ground leased from the borrower with no attributable underwritten base rent. The Dillard’s, JCPenney and Sears Auto land and improvements, as well as the Sears Retail and Longhorn Steakhouse improvements, are not collateral for the West Town Mall Whole Loan. The largest collateral anchor tenant at the property is Belk (39.6% of net rental area). Belk occupies two separate spaces at the property, Belk Women’s Store and Belk Men Home & Kids. Most recently, in June 2017 Belk executed a 15-year renewal through January 2033 with two, five-year extension options. Belk Women’s Store has been a tenant at the property since 1971, while Belk Men Home & Kids has been a tenant at the property since 1993. Belk has committed to invest approximately $6.0 million on both spaces (approximately $20 PSF) on store upgrades as part of its renewal. In addition, Belk has committed to a 10-year operating covenant, in which Belk is required to regularly and continuously operate a fashion department store in not less than 60.0% of both the Belk Women’s Store and Belk Men Home & Kids store and has agreed not to open a new fashion department store within nine miles of the property. Collectively, the two stores achieved approximately $30.0 million in sales for the trailing 12-month period ending February 28, 2017, resulting in total sales PSF of approximately $98 and an occupancy cost of approximately 5.0%.
Non-Owned Anchors
| Tenant | Ratings(1) Moody’s/S&P/Fitch | Net Rentable Area (SF) | Most Recent Sales(2) | Most Recent Sales PSF(2) |
| Dillard’s(3) | Baa3 / BBB- / BBB- | 233,094 | $33,200,000 | $142 |
| Sears(3) | Caa2 / CCC+ / C | 182,140 | $10,700,000 | $59 |
| JCPenney(3) | B1 / B+ / B+ | 147,282 | $14,500,000 | $99 |
| (1) | Ratings provided are for the parent company of the entity listed in the “Tenant” field whether or not the parent company guarantees the lease. |
| (2) | Dillard’s, Sears and JCPenney sales are based on the loan sponsor’s 2015 estimate. |
| (3) | The Dillard’s, JCPenney and Sears Auto land and improvements, as well as the Sears Retail improvements, are not part of the collateral. |
Collateral Anchors
| Tenant | Ratings(1) Moody’s/S&P/Fitch | Net Rentable Area (SF) | Most Recent Sales(2) | Most Recent Sales PSF(2)(3) |
| Belk Women's Store | NA / NA / NA | 162,501 | $19,252,000 | $118 |
| Belk Men Home & Kids | NA / NA / NA | 143,278 | $10,730,000 | $75 |
| Regal Cinemas(3) | Ba1 / BB- / B+ | 76,580 | $2,652,000 | $294,667 |
| (1) | Ratings provided are for the parent company of the entity listed in the “Tenant” field whether or not the parent company guarantees the lease. |
| (2) | Most Recent Sales and Most Recent Sales PSF are as of February 28, 2017. |
| (3) | Most Recent Sales PSF for Regal Cinemas reflects sales per screen based on a total of nine screens. |
The Market.The property is located within the Knoxville, Tennessee retail market at the southwestern quadrant of Kingston Pike and Morrell Road, just south of Interstate 40 and Interstate 75 in the Knoxville metropolitan area. The property is located approximately 6.5 miles and 6.0 miles west of the Knoxville central business district and the University of Tennessee, respectively. As of year-end 2016, the population within a five-, 10- and 25-mile radius was 126,498, 363,364 and 779,787, respectively, with estimated average household income of approximately $83,709, $71,300 and $67,828, respectively. According to the appraisal, the property serves an approximately 10.0 mile primary trade area and over 10.0 million people visit the property each year. The mall not only draws visitors from the city of Knoxville, but also Alcoa and Louisville to the south and Oak Ridge, Farragut and Lenoir City to the west. According to the appraisal, both the population and number of households in
THE INFORMATION IN THIS COLLATERAL TERM SHEET IS NOT COMPLETE AND MAY BE AMENDED PRIOR TO THE TIME OF SALE. THIS TERM SHEET IS NOT AN OFFER TO SELL THESE SECURITIES AND IT IS NOT A SOLICITATION OF AN OFFER TO BUY THESE SECURITIES IN ANY JURISDICTION WHERE THE OFFER OR SALE IS NOT PERMITTED.
173
Mortgage Loan No. 13 — West Town Mall
the property’s primary trade area are projected to experience moderate growth between 2016 and 2021. As of 2016, household income levels in the property’s primary trade area were approximately 109.0% percent of the Knoxville core-based statistical area average and approximately 110.6% percent of the Tennessee state average. West Town Mall serves as the sole location in the Knoxville market for 40 national retailers and demonstrated strong sales per square foot relative to the competitive set. According to Green Street Advisors, West Town Mall has a Green Street Mall Grade of A-, while four out of five properties identified as the property’s primary competition within a 27 mile radius have a Green Street Mall Grade of B or lower. The fifth property identified by Green Street Advisors was not rated. The appraisal shows the property’s current primary competition consists of five properties as detailed in the table below.
Competitive Set Summary(1)(2)
| Property | Property Type | Year Built / Renovated | Total GLA (SF) | Est. Sales PSF | Est. Occ. | Proximity (miles) | Anchor Tenants |
| West Town Mall(3) | Super Regional Mall | 1972 / 2013 | 1,341,519 | $454 | 96.0% | NAP | Dillard’s, Sears, Belk Women’s Store, JCPenney, Belk Men Home & Kids, Regal Cinemas |
| Pinnacle/Promenade Turkey Creek | Lifestyle Center | 2006 / NAP | 657,264 | NAV | 99.0% | 7.5 | Belk, Regal Cinemas, HH Gegg, Best Buy, Marshall’s, Bed Bath & Beyond |
| Pavilion of Turkey Creek | Power Center | 2000 / NAP | 657,771 | NAV | 100.0% | 7.5 | Walmart, Target, Hobby Lobby, Ross, OfficeMax, DSW, Old Navy, PetSmart |
| Knoxville Center(4) | Super Regional Mall | 1984 / 1997 | 959,091 | $250 | 67.0% | 11.5 | Sears, JCPenney, Belk, Gold’s Gym, Regal Cinemas |
| Foothills Mall | Power Center | 1983 / 2006 | 463,591 | $275 | 92.0% | 12.5 | JCPenney, Belk, Sears, Carmike Cinemas, Goody’s, T.J.Maxx |
| College Square(4) | Super Regional Mall | 1988 / 2016 | 476,745 | $265 | 83.0% | 50.0 | Belk, Kohl’s, Dick’s Sporting Goods, Carmike Cinemas, T.J.Maxx, Planet Fitness |
| (1) | Source: Appraisal. |
| (2) | According to the appraisal, secondary competition includes Hamilton Place Mall (1,167,665 SF), Mall at Johnson City (568,310 SF) and Kingsport Town Center (530,446 SF), where are all located 90 miles or more from West Town Mall. |
| (3) | Total GLA and Estimated Occupancy for West Town Mall are calculated inclusive of temporary tenants and gross leasable area attributable to Dillard’s, Sears, JCPenney and Longhorn Steakhouse. The Dillard’s, JCPenney and Sears Auto land and improvements are tenant-owned with no attributable base rent. Sears Retail and Longhorn Steakhouse own their respective improvements, but not the underlying land, which is ground leased from the borrower at an underwritten base rent of $0 and $147,500, respectively. Collateral occupancy for West Town Mall as of March 1, 2017, exclusive of non-owned anchors and temporary tenants, is 93.1%. |
| (4) | Knoxville Center, College Square and Kingsport Town Center each have a vacant anchor space. Additionally, JCPenney is scheduled to close its location at Knoxville Center in September 2017. |
Historical and Current Occupancy(1)(2)
| 2014 | 2015 | 2016 | Current(3) |
| 93.8% | 92.7% | 90.4% | 93.1% |
| (1) | Source: Historical Occupancy is provided by the sponsor. Occupancies are as of December 31 of each respective year. |
| (2) | Includes collateral tenants only and excludes temporary tenants. |
| (3) | Based on the March 1, 2017 underwritten rent roll. |
THE INFORMATION IN THIS COLLATERAL TERM SHEET IS NOT COMPLETE AND MAY BE AMENDED PRIOR TO THE TIME OF SALE. THIS TERM SHEET IS NOT AN OFFER TO SELL THESE SECURITIES AND IT IS NOT A SOLICITATION OF AN OFFER TO BUY THESE SECURITIES IN ANY JURISDICTION WHERE THE OFFER OR SALE IS NOT PERMITTED.
174
Mortgage Loan No. 13 — West Town Mall
Historical In-line Sales and Occupancy Costs(1)
| 2014 | 2015 | 2016(2) | TTM(2)(3) | |
| In-line Sales PSF | $482 | $526 | $554 | $520 |
| Occupancy Cost | 11.0% | 10.0% | 9.5% | 9.7% |
| (1) | In-line Sales PSF and Occupancy Costs are for comparable tenants less than 10,000 SF that reported full year sales. |
| (2) | 2016 and TTM In-line Sales PSF include a sponsor estimate for Apple sales of approximately $30 million and $30.4 million, respectively. Apple relocated to a larger 8,880 SF suite at the property (from it’s original 5,043 SF suite) and thus, is not considered a comparable tenant for the comparable tenant sales analysis. However, the above 2016 and TTM sales figures include the sponsor provided estimates. |
| (3) | TTM In-line Sales PSF and Occupancy Costs are based on the trailing 12-month period ending February 2017. |
Top Tenant Summary(1)
| Tenant | Ratings Moody’s/ S&P/Fitch(2) | Net Rentable Area (SF) | % of Total NRA | Base Rent PSF | % of Total Base Rent | Most Recent Sales PSF(3) | Lease Expiration Date | ||
| Belk Women's Store | NA / NA / NA | 162,501 | 21.0% | $6.15 | 5.4% | $118 | 1/31/2033 | ||
| Belk Men Home & Kids | NA / NA / NA | 143,278 | 18.5 | $3.49 | 2.7% | $75 | 1/31/2033 | ||
| Regal Cinemas(4) | Ba1 / BB- / B+ | 76,580 | 9.9 | $9.91 | 4.1% | $294,667 | 11/30/2028 | ||
| Anchor Tenants | 382,359 | 49.5% | $5.91 | 12.2% | $85 | ||||
| Victoria's Secret | NA / NA / NA | 15,181 | 2.0% | $44.00 | 3.6% | $508 | 1/31/2018 | ||
| Shoe Dept. Encore | NA / NA / NA | 12,081 | 1.6 | $19.45 | 1.3% | NAP | 6/30/2023 | ||
| Pottery Barn | NA / NA / NA | 11,135 | 1.4 | $27.00 | 1.6% | $320 | 1/31/2019 | ||
| Non-Anchors > 10,000 SF(5) | 38,397 | 5.0% | $31.35 | 6.5% | $428 | ||||
| In-Line Tenants < 10,000 SF | 298,627 | 38.7% | $50.23 | 81.2% | $562 | ||||
| Total / WAV | 719,383 | 93.1% | $25.66 | 100.0% | $291 | ||||
| Vacant | 53,120 | 6.9% | |||||||
| Total / WAV | 772,503 | 100.0% | |||||||
| (1) | Based on the underwritten rent roll dated March 1, 2017, including rent increases occurring through July 2018. |
| (2) | Ratings provided are for the parent company of the entity listed in the “Tenant” field whether or not the parent company guarantees the lease. |
| (3) | Most Recent Sales PSF is as of February 2017 and excludes sales for tenants who reported during the 2016 calendar year but were underwritten as vacant. |
| (4) | Most Recent Sales PSF for Regal Cinemas reflects sales per screen based on a total of nine screens. Additionally, Regal Cinemas, which has a current lease expiration of November 2018, is being underwritten as having a lease expiration of November 2028 per its letter of intent with Simon Property Group. |
| (5) | Non-Anchors represent tenants over 10,000 SF, In-Line Tenants are less than 10,000 SF. Non-Anchors excludes Forever 21, which historically has occupied over 10,000 SF at the property. Forever 21 recently downsized into two individual smaller suites. |
THE INFORMATION IN THIS COLLATERAL TERM SHEET IS NOT COMPLETE AND MAY BE AMENDED PRIOR TO THE TIME OF SALE. THIS TERM SHEET IS NOT AN OFFER TO SELL THESE SECURITIES AND IT IS NOT A SOLICITATION OF AN OFFER TO BUY THESE SECURITIES IN ANY JURISDICTION WHERE THE OFFER OR SALE IS NOT PERMITTED.
175
Mortgage Loan No. 13 — West Town Mall
Lease Rollover Schedule(1)(2)(3)
| Year | Number of Leases Expiring | NRA Expiring | % of NRA Expiring | Base Rent Expiring | % of Base Rent Expiring | Cumulative NRA Expiring | Cumulative % of NRA Expiring | Cumulative Base Rent Expiring | Cum. % of Base Rent Expiring | |
| Vacant | NAP | 53,120 | 6.9% | NAP | NAP | 53,120 | 6.9% | NAP | NAP | |
| 2017 & MTM | 2 | 7,323 | 0.9 | $295,020 | 1.6% | 60,443 | 7.8% | $295,020 | 1.6% | |
| 2018 | 19 | 62,643 | 8.1 | 2,519,855 | 13.6 | 123,086 | 15.9% | $2,814,875 | 15.2% | |
| 2019 | 20 | 70,137 | 9.1 | 3,214,678 | 17.4 | 193,223 | 25.0% | $6,029,553 | 32.7% | |
| 2020 | 12 | 18,328 | 2.4 | 1,079,162 | 5.8 | 211,551 | 27.4% | $7,108,715 | 38.5% | |
| 2021 | 14 | 26,021 | 3.4 | 1,756,091 | 9.5 | 237,572 | 30.8% | $8,864,806 | 48.0% | |
| 2022 | 5 | 12,704 | 1.6 | 672,403 | 3.6 | 250,276 | 32.4% | $9,537,209 | 51.7% | |
| 2023 | 9 | 33,033 | 4.3 | 1,156,272 | 6.3 | 283,309 | 36.7% | $10,693,481 | 57.9% | |
| 2024 | 9 | 17,666 | 2.3 | 1,518,815 | 8.2 | 300,975 | 39.0% | $12,212,296 | 66.1% | |
| 2025 | 6 | 19,078 | 2.5 | 1,027,995 | 5.6 | 320,053 | 41.4% | $13,240,291 | 71.7% | |
| 2026 | 2 | 9,407 | 1.2 | 492,139 | 2.7 | 329,460 | 42.6% | $13,732,430 | 74.4% | |
| 2027 | 7 | 22,787 | 2.9 | 1,073,010 | 5.8 | 352,247 | 45.6% | $14,805,440 | 80.2% | |
| 2028 & Beyond(4) | 9 | 420,256 | 54.4 | 3,656,503 | 19.8 | 772,503 | 100.0% | $18,461,943 | 100.0% | |
| Total | 114 | 772,503 | 100.0% | $18,461,943 | 100.0% | |||||
| (1) | Based on the underwritten rent roll dated March 1, 2017. Rent includes base rent and rent increases occurring through July 2018. |
| (2) | Certain tenants may have termination or contraction options (which may become exercisable prior to the originally stated expiration date of the tenant lease) that are not considered in the above Lease Rollover Schedule. |
| (3) | Lease Rollover Schedule is not inclusive of the square footage or number of leases associated with the Dillard’s, Sears Auto, JCPenney and Longhorn Steakhouse boxes. The Dillard’s and JCPenney land and improvements are tenant owned with no attributable base rent. Sears Retail and Longhorn Steakhouse own their respective improvements, but not the underlying land, which is leased from the borrower at an underwritten base rent of $0 and $147,500, respectively. Underwritten ground rent for the Longhorn Steakhouse ground lease is included in the above Lease Rollover Schedule, reflecting the January 2026 ground lease expiration. |
| (4) | Regal Cinemas has a current lease expiration of November 2018, but was underwritten with a November 2028 lease expiration per its letter of intent. |
THE INFORMATION IN THIS COLLATERAL TERM SHEET IS NOT COMPLETE AND MAY BE AMENDED PRIOR TO THE TIME OF SALE. THIS TERM SHEET IS NOT AN OFFER TO SELL THESE SECURITIES AND IT IS NOT A SOLICITATION OF AN OFFER TO BUY THESE SECURITIES IN ANY JURISDICTION WHERE THE OFFER OR SALE IS NOT PERMITTED.
176
Mortgage Loan No. 13 — West Town Mall
Operating History and Underwritten Net Cash Flow
| 2014 | 2015 | 2016 | TTM(1) | Underwritten(2) | PSF(3) | %(4) | |
| Rents in Place | $19,676,029 | $20,007,423 | $19,757,464 | $19,679,344 | $18,461,943 | $23.90 | 58.2% |
| Vacant Income | 0 | 0 | 0 | 0 | 2,345,065 | 3.04 | 7.4% |
| Gross Potential Rent | $19,676,029 | $20,007,423 | $19,757,464 | $19,679,344 | $20,807,008 | $26.93 | 65.6% |
| Total Reimbursements | 10,608,285 | 10,412,574 | 10,654,186 | 10,431,094 | 10,918,975 | 14.13 | 34.4% |
| Net Rental Income | $30,284,314 | $30,419,997 | $30,411,650 | $30,110,438 | $31,725,983 | $41.07 | 100.0% |
| (Vacancy/Collection Loss) | 0 | 0 | 0 | 0 | (2,345,065) | (3.04) | (7.4%) |
| Other Income | 0 | 0 | 0 | 0 | 0 | 0.00 | 0.0% |
| Effective Gross Income | $30,284,314 | $30,419,997 | $30,411,650 | $30,110,438 | $29,380,918 | $38.03 | 92.6% |
| Total Expenses | $6,830,693 | $6,663,708 | $6,989,951 | $6,782,789 | $6,799,826 | $8.80 | 23.1% |
| Net Operating Income | $23,453,621 | $23,756,289 | $23,421,699 | $23,327,649 | $22,581,092 | $29.23 | 76.9% |
| Total TI/LC, Capex/RR | 0 | 0 | 0 | 0 | 1,548,160 | 2.00 | 5.3% |
| Net Cash Flow | $23,453,621 | $23,756,289 | $23,421,699 | $23,327,649 | $21,032,932 | $27.23 | 71.6% |
| (1) | TTM is the trailing twelve-month period ending May 31, 2017. |
| (2) | Underwritten Rents in Place includes base rent and rent increases occurring through July 2018. Underwritten Rents in Place include space leased by eight tenants accounting for a combined 41,072 SF and approximately $1.3 million in underwritten base rent, for which the tenants have signed leases but are not yet in occupancy. The Dillard’s, JCPenney and Sears Auto land and improvements are tenant owned with no attributable base rent, and thus not included in the Rents in Place. Sears Retail and Longhorn Steakhouse own their respective improvements, but not the underlying land, which is leased from the borrower at an underwritten base rent of $0 and $147,500, respectively. |
| (3) | PSF is based on collateral tenants’ SF. |
| (4) | Percentage column represents percent of Net Rental Income for all revenue lines and represents percent of Effective Gross Income for the remainder of fields. |
THE INFORMATION IN THIS COLLATERAL TERM SHEET IS NOT COMPLETE AND MAY BE AMENDED PRIOR TO THE TIME OF SALE. THIS TERM SHEET IS NOT AN OFFER TO SELL THESE SECURITIES AND IT IS NOT A SOLICITATION OF AN OFFER TO BUY THESE SECURITIES IN ANY JURISDICTION WHERE THE OFFER OR SALE IS NOT PERMITTED.
177
Mortgage Loan No. 14 — Wal-Mart Central
| Mortgage Loan Information | Property Information | |||
| Mortgage Loan Seller: | Natixis | Single Asset / Portfolio: | Single Asset | |
| Original Principal Balance: | $29,509,750 | Title: | Fee | |
| Cut-off Date Principal Balance: | $29,473,305 | Property Type - Subtype: | Retail – Shadow Anchored | |
| % of Pool by IPB: | 3.4% | Net Rentable Area (SF): | 139,377 | |
| Loan Purpose: | Acquisition | Location: | Folsom, CA | |
| Borrower: | Nazareth Retail Holdings, LLC | Year Built / Renovated: | 1992 / N/A | |
| Sponsor: | Mounir Kardosh | Occupancy: | 88.6% | |
| Interest Rate: | 4.3400% | Occupancy Date: | 4/7/2017 | |
| Note Date: | 8/2/2017 | Number of Tenants: | 20 | |
| Maturity Date: | 8/5/2027 | 2014 NOI: | $2,308,856 | |
| Interest-only Period: | None | 2015 NOI: | $2,367,837 | |
| Original Term: | 120 months | 2016 NOI: | $2,628,594 | |
| Original Amortization: | 360 months | TTM NOI(2)(3): | $2,617,450 | |
| Amortization Type: | Balloon | UW Economic Occupancy: | 91.5% | |
| Call Protection: | L(25), Def or YM1(91), O(4) | UW Revenues: | $3,855,441 | |
| Lockbox(1): | Springing | UW Expenses: | $934,378 | |
| Additional Debt: | No | UW NOI(3): | $2,921,062 | |
| Additional Debt Balance: | N/A | UW NCF: | $2,677,153 | |
| Additional Debt Type: | N/A | Appraised Value / Per SF: | $39,680,000 / $285 | |
| Additional Future Debt Permitted: | No | Appraisal Date: | 5/18/2017 |
| Escrows and Reserves | Financial Information | |||||
| Initial | Monthly | Initial Cap | Cut-off Date Loan / SF: | $211 | ||
| Taxes: | $187,999 | $37,600 | N/A | Maturity Date Loan / SF: | $170 | |
| Insurance: | $9,744 | $3,248 | N/A | Cut-off Date LTV: | 74.3% | |
| Replacement Reserves: | $0 | $2,904 | $104,533 | Maturity Date LTV: | 59.8% | |
| TI/LC: | $0 | 17,422 | $627,197 | UW NOI DSCR: | 1.66x | |
| Deferred Maintenance: | $7,500 | $0 | N/A | UW NCF DSCR: | 1.52x | |
| Outstanding TI Reserve: | $133,375 | $0 | N/A | UW NOI Debt Yield: | 9.9% | |
| Free Rent Reserve: | $30,640 | $0 | N/A | UW NCF Debt Yield: | 9.1% | |
| Estoppel Payment Reserve: | $29,727 | $0 | N/A | |||
| Primary Tenant Reserve: | $0 | Springing | N/A |
| Sources and Uses | ||||||
| Sources | Proceeds | % of Total | Uses | Proceeds | % of Total | |
| Mortgage Loan | $29,509,750 | 73.5% | Purchase Price | $39,683,333 | 98.8% | |
| Sponsor Equity | 10,657,773 | 26.5 | Upfront Reserves | 398,985 | 1.0 | |
| Closing Costs | 85,205 | 0.2 | ||||
| Total Sources | $40,167,523 | 100.0% | Total Uses | $40,167,523 | 100.0% |
| (1) | The loan is structured with a springing lockbox and springing cash management. |
| (2) | Represents trailing twelve months ending April 30, 2017. |
| (3) | UW NOI is higher than TTM NOI due to one additional tenant being signed at the property, The Threading Place. In addition, UW NOI includes rent steps through August 2017. |
THE INFORMATION IN THIS COLLATERAL TERM SHEET IS NOT COMPLETE AND MAY BE AMENDED PRIOR TO THE TIME OF SALE. THIS TERM SHEET IS NOT AN OFFER TO SELL THESE SECURITIES AND IT IS NOT A SOLICITATION OF AN OFFER TO BUY THESE SECURITIES IN ANY JURISDICTION WHERE THE OFFER OR SALE IS NOT PERMITTED.
178
Mortgage Loan No. 14 — Wal-Mart Central
The Loan. The Wal-Mart Central loan, is an approximately $29.5 million first mortgage loan secured by the fee interest in a 139,377 SF shadow-anchored retail center located in Folsom, California. The loan has a 10-year term and will amortize on a 30-year schedule.
The Borrower. The borrowing entity for the loan is Nazareth Retail Holdings, LLC, a California limited liability company and special purpose entity. The borrowing entity is 100.0% owned by Mounir Kardosh.
The Sponsor. The loan’s sponsor and nonrecourse carve-out guarantor is Mounir Kardosh. Mounir Kardosh is the founder and CEO of Nazareth Enterprises and began his career in real estate in the 1970s. Nazareth Enterprises is a real estate firm which focuses on commercial and residential real estate acquisitions and development.
The Property. The property is a 139,377 SF shadow-anchored retail center located in Folsom, California. The property was constructed in 1992 and is situated on approximately 12.1 acres, approximately 23 miles northwest of Sacramento. The property is anchored by 24 Hour Fitness and 99 Cents Only, in addition to 43,687 SF of smaller anchors and inline tenants. The property is also anchored by Wal-Mart. There are 753 surface parking spaces at the property which are included in the collateral, resulting in a parking ratio of 5.4 spaces per 1,000 SF of net rentable area.
As of April 7, 2017, the property was approximately 88.6% leased by 20 tenants. The property’s tenancy caters to mid-price point customers with both national and local tenants that include 24 Hour Fitness, 99 Cents Only, Chase Bank and Lab. Corp of America. The largest tenant at the property, 24 Hour Fitness, leases 56,200 SF (40.3% of the net rentable area) through November 2027. 24 Hour Fitness is a leading fitness industry pioneer headquartered in San Ramon, California. 24 Hour Fitness has nearly four million members in more than 400 clubs across the U.S. 24 Hour Fitness has been an anchor at the property since 2007. 24 Hour Fitness is rated B2/B/NR by Moodys, S&P and Fitch, respectively. The second-largest tenant at the property, 99 Cents Only, leases 23,560 SF (16.9% of the net rentable area) through January 2026. 99 Cents Only is a value retail store chain based in Commerce, CA with locations in the southwestern U.S. As of January 27, 2017, 99 Cents operated 390 stores located in the states of California (283 stores), Texas (48 stores), Arizona (38 stores), and Nevada (21 stores). As of the most recent 10-K for 99 Cents Only for the fiscal year ended January 27, 2017, 99 Cents Only reported average annual net sales of $5.2 million per store, representing a 3.2% increase from fiscal year 2016 and 4.2% increase from fiscal year 2015. 99 Cents Only reported gross profit of $601.0 million in fiscal year 2017, compared to $562.0 million in fiscal year 2016 and $618.0 million in fiscal year 2015. 99 Cents Only is rated Caa1/CCC+/NR by Moodys, S&P and Fitch, respectively. The third-largest tenant at the property, Western Dental Services, leases 5,000 SF (3.6% of the net rentable area) through March 2018. Western Dental Services is the number one provider of orthodontic care in California and Arizona, leading in the number of offices and providers as well as the number of patients treated. The company was founded over 100 years ago and has since grown to become one of the largest dental practice management companies in the western United States, with over 200 offices.
The property is located on the southwest corner of Riley Street and Glenn Drive which provides good frontage and access to primary roadways. Primary access to the location is provided by Lincoln Highway, which bisects the southern portion of Folsom, California and provides direct access to and from Sacramento.
The Market. The property is located in the center of Folsom, California in the Folsom/El Dorado Hills submarket in the greater Sacramento market. The city of Folsom has technological and medical presence with employers including, Agilent Technologies, California ISO, Intel, Kaiser Permanente, Mercy Hospital, Micron, Toshiba, and VSP. Professional, management and business, and sales are the main professional sectors for the city. The immediate area surrounding the property is a newer area of development, consisting primarily of small lot single-family developments built during 1995-2000s. Retail and shopping center developments are situated directly east of the property and include big box retail tenants such as Wal-Mart, Target, Lowes, Kohl’s, and anchor tenants such as Trader Joe’s, Starbucks and Bank of America.
THE INFORMATION IN THIS COLLATERAL TERM SHEET IS NOT COMPLETE AND MAY BE AMENDED PRIOR TO THE TIME OF SALE. THIS TERM SHEET IS NOT AN OFFER TO SELL THESE SECURITIES AND IT IS NOT A SOLICITATION OF AN OFFER TO BUY THESE SECURITIES IN ANY JURISDICTION WHERE THE OFFER OR SALE IS NOT PERMITTED.
179
Mortgage Loan No. 14 — Wal-Mart Central
According to the appraisal, the estimated 2016 population within a one-, three- and five-mile radius of the property is 11,374, 83,077 and 150,435, respectively. The radii have shown moderate growth since 2010 and are projected to grow at average annual rates of 1.1%, 1.0% and 1.0%, respectively, through 2021. The estimated 2016 average household income within a one-, three- and five-mile radius of the property is $85,186, $107,372 and $117,348, respectively. The appraisal concluded market rents of $24.00 - $33.00 PSF for in-line spaces, $36.00 PSF for outparcel spaces and $12.00-$21.00 PSF for anchor spaces. According to the appraisal, the Folsom / El Dorado submarket reported an overall vacancy rate of 8.7%. According to the appraisal, the property’s competitive set consists of the five properties detailed in the table below.
Competitive Set Summary(1)
| Property | Year Built / Renovated | Total NRA (SF) | Est. Rent PSF | Est. Occ. | Proximity (miles) | Anchor Tenants |
| Trail Creek Crossing | 2005 / N/A | 25,396 | $25.20 | 71.7% | 1.5 | Peet’s Coffee, T-Mobile, Wayback Burgers |
| Briggs Ranch Plaza | 1994 / N/A | 94,000 | $22.20 | 100.0% | 3.6 | Encare, Inc., 99 Rancho Market, Dollar Tree |
| Folsom Corners | 2006 / N/A | 18,500 | $23.41 | 100.0% | 1.6 | Inchin’s Bamboo Garden |
| Raley's at the Parkway | 2006 / N/A | 66,258 | $27.00 | 96.4% | 3.6 | Fit236, Verizon, Starbucks |
| Broadstone Plaza II | 2001 / N/A | 122,608 | $36.96 | 100.0% | 3.5 | Costa Vida, Ashley Furniture, Babies R Us |
| (1) | Source: Appraisal. |
Historical and Current Occupancy(1)
| 2013 | 2014 | 2015 | 2016 | Current(2) |
| 74.2% | 74.2% | 83.4% | 85.9% | 88.6% |
| (1) | Source: Historical Occupancy is provided by the sponsor. Occupancies are as of December 31 of each respective year. |
| (2) | Based on the April 2017 underwritten rent roll. |
Top Ten Tenant Summary(1)
| Tenant | Ratings Moody’s/S&P/Fitch(2) | Net Rentable Area (SF) | % of Total NRA | Base Rent PSF | % of Total Base Rents | Sales PSF(3) | Occupancy Costs(3) | Lease Expiration Date |
| 24 Hour Fitness | B2 /B / NR | 56,200 | 40.3% | $26.58 | 48.5% | NAV | NAV | 11/30/2027 |
| 99 Cents Only | Caa1 / CCC+/ NR | 23,560 | 16.9% | $11.00 | 8.4% | NAV | NAV | 1/31/2026 |
| Western Dental Services | NA / NA / NA | 5,000 | 3.6% | $38.28 | 6.2% | NAV | NAV | 3/31/2018 |
| Chase Bank | NA / NA / NA | 4,900 | 3.5% | $27.37 | 4.4% | NAV | NAV | 12/31/2018 |
| Waffle Barn | NA / NA / NA | 3,400 | 2.4% | $48.00 | 5.3% | $243 | 19.8% | 11/30/2022 |
| Rock-n-Fire Pizza, Burger and Wings | NA / NA / NA | 3,064 | 2.2% | $30.75 | 3.1% | NAV | NAV | 1/31/2027 |
| Schools Financial CU | NA / NA / NA | 3,000 | 2.2% | $31.20 | 3.0% | NAV | NAV | 2/29/2020 |
| Payless Shoe Source | NA / NA / NA | 3,000 | 2.2% | $24.00 | 2.3% | $161 | 14.9% | 12/31/2018 |
| Happy Day Spa | NA / NA / NA | 2,580 | 1.9% | $24.29 | 2.0% | $180 | 13.5% | 12/31/2019 |
| Lab. Corp of America | NA / NA / NA | 2,572 | 1.8% | $23.52 | 2.0% | NAV | NAV | 4/30/2022 |
| (1) | Based on the underwritten rent roll, including rent increases occurring through August 2018. |
| (2) | Ratings provided are for the parent company of the entity listed in the “Tenant” field whether or not the parent company guarantees the lease. |
| (3) | Sales PSF and Occupancy Costs represent tenants with 12 months reported sales and occupancy costs for the twelve-month period ending in February 2017 for Waffle Barn and Payless Shoe Source, and March 2017 for Happy Day Spa, as provided by the sponsors. |
THE INFORMATION IN THIS COLLATERAL TERM SHEET IS NOT COMPLETE AND MAY BE AMENDED PRIOR TO THE TIME OF SALE. THIS TERM SHEET IS NOT AN OFFER TO SELL THESE SECURITIES AND IT IS NOT A SOLICITATION OF AN OFFER TO BUY THESE SECURITIES IN ANY JURISDICTION WHERE THE OFFER OR SALE IS NOT PERMITTED.
180
Mortgage Loan No. 14 — Wal-Mart Central
Lease Rollover Schedule(1)
| Year | Number of Leases Expiring | NRA Expiring | % of NRA Expiring | Base Rent Expiring | % of Base Rent Expiring | Cumulative NRA Expiring | Cumulative % of NRA Expiring | Cumulative Base Rent Expiring | Cumulative % of Base Rent Expiring |
| Vacant | NAP | 15,930 | 11.4% | NAP | NAP | 15,930 | 11.4% | NAP | NAP |
| MTM | 1 | 3,000 | 2.2 | $72,000 | 2.3% | 18,930 | 13.6% | $72,000 | 2.3% |
| 2017 | 1 | 2,572 | 1.8 | 60,493 | 2.0 | 21,502 | 15.4% | $132,493 | 4.3% |
| 2018 | 4 | 12,990 | 9.3 | 413,082 | 13.4 | 34,492 | 24.7% | $545,576 | 17.7% |
| 2019 | 2 | 4,480 | 3.2 | 115,560 | 3.8 | 38,972 | 28.0% | $661,136 | 21.5% |
| 2020 | 4 | 8,716 | 6.3 | 240,324 | 7.8 | 47,688 | 34.2% | $901,460 | 29.3% |
| 2021 | 3 | 3,265 | 2.3 | 108,864 | 3.5 | 50,953 | 36.6% | $1,010,324 | 32.8% |
| 2022 | 1 | 3,400 | 2.4 | 163,200 | 5.3 | 54,353 | 39.0% | $1,173,524 | 38.1% |
| 2023 | 0 | 0 | 0.0 | 0 | 0.0 | 54,353 | 39.0% | $1,173,524 | 38.1% |
| 2024 | 0 | 0 | 0.0 | 0 | 0.0 | 54,353 | 39.0% | $1,173,524 | 38.1% |
| 2025 | 0 | 0 | 0.0 | 0 | 0.0 | 54,353 | 39.0% | $1,173,524 | 38.1% |
| 2026 | 1 | 23,560 | 16.9 | 259,160 | 8.4 | 77,913 | 55.9% | $1,432,684 | 46.5% |
| 2027 & Beyond | 3 | 61,464 | 44.1 | 1,648,891 | 53.5 | 139,377 | 100.0% | $3,081,576 | 100.0% |
| Total | 20 | 139,377 | 100.0% | $3,081,576 | 100.0% |
| (1) | Based on the underwritten rent roll. Rent includes base rent and rent increases occurring through August 2018. |
Operating History and Underwritten Net Cash Flow
| 2014 | 2015 | 2016 | TTM(1) | Underwritten(2) | PSF | %(3) | |
| Rents in Place | $2,545,763 | $2,566,573 | $2,743,964 | $2,754,750 | $3,081,576 | $22.11 | 73.3% |
| Vacant Income | 0 | 0 | 0 | 0 | 358,577 | $2.57 | 8.5% |
| Gross Potential Rent | $2,545,763 | $2,566,573 | $2,743,964 | $2,754,750 | $3,440,152 | $24.68 | 81.8% |
| Total Reimbursements | 455,121 | 493,161 | 581,143 | 585,853 | 764,663 | $5.49 | 18.2% |
| Net Rental Income | $3,000,884 | $3,059,734 | $3,325,107 | $3,340,603 | $4,204,815 | $30.17 | 100.0% |
| (Vacancy/Collection Loss) | 0 | 0 | 0 | 0 | (358,575) | $(2.57) | (8.5%) |
| Other Income | 751 | 0 | 9,200 | 9,200 | 9,200 | $0.07 | 0.2% |
| Effective Gross Income | $3,001,635 | $3,059,734 | $3,334,306 | $3,349,803 | $3,855,440 | $27.66 | 91.7% |
| Total Expenses | $692,779 | $691,897 | $705,712 | $732,353 | $934,378 | $6.70 | 24.2% |
| Net Operating Income | $2,308,856 | $2,367,837 | $2,628,594 | $2,617,450 | $2,921,062 | $20.96 | 75.8% |
| Total TI/LC, Capex/RR | 0 | 0 | 0 | 0 | 243,910 | $1.75 | 6.3% |
| Net Cash Flow | $2,308,856 | $2,367,837 | $2,628,594 | $2,617,450 | $2,677,152 | $19.21 | 69.4% |
| (1) | The TTM column represents the trailing twelve month period ending April 30, 2017. |
| (2) | Underwritten Rents in Place includes base rent and rent steps occurring through August 2018. |
| (3) | Percentage column represents percent of Net Rental Income for all revenue lines and represents percent of Effective Gross Income for the remainder of fields. |
THE INFORMATION IN THIS COLLATERAL TERM SHEET IS NOT COMPLETE AND MAY BE AMENDED PRIOR TO THE TIME OF SALE. THIS TERM SHEET IS NOT AN OFFER TO SELL THESE SECURITIES AND IT IS NOT A SOLICITATION OF AN OFFER TO BUY THESE SECURITIES IN ANY JURISDICTION WHERE THE OFFER OR SALE IS NOT PERMITTED.
181
Mortgage Loan No. 15 — Acropolis Garden
| Mortgage Loan Information | Property Information | |||
| Mortgage Loan Seller: | Natixis | Single Asset / Portfolio: | Single Asset | |
| Original Principal Balance(1): | $25,000,000 | Title: | Fee | |
| Cut-off Date Principal Balance(1): | $25,000,000 | Property Type - Subtype: | Multifamily – Cooperative | |
| % of Pool by IPB: | 2.9% | Net Rentable Area (Units): | 618 | |
| Credit Assessment (KBRA)(2): | AAA | Location: | Astoria, NY | |
| Loan Purpose: | Refinance | Year Built / Renovated: | 1923 / 1988 | |
| Borrower: | Acropolis Gardens Realty Corp. | Occupancy: | N/A | |
| Sponsor(3): | Acropolis Gardens Realty Corp. | Occupancy Date: | N/A | |
| Number of Tenants: | N/A | |||
| Interest Rate: | 3.7200% | 2014 NOI(5): | N/A | |
| Note Date: | 4/24/2017 | 2015 NOI(5): | $198,948 | |
| Maturity Date: | 5/5/2027 | 2016 NOI(5): | $558,957 | |
| Interest-only Period: | 120 months | UW Economic Occupancy(5): | 96.0% | |
| Original Term: | 120 months | UW Revenues(5): | $14,965,959 | |
| Original Amortization: | None | UW Expenses(5): | $5,787,751 | |
| Amortization Type: | Interest Only | UW NOI(5): | $9,178,209 | |
| Call Protection: | L(28), Def(89), O(3) | UW NCF(5): | $9,015,057 | |
| Lockbox: | NAP | Appraised Value / Per Unit(6): | $177,000,000 / $286,408 | |
| Additional Debt(4): | Yes | Appraisal Date: | 2/16/2017 | |
| Additional Debt Balance(4): | $20,000,001 | |||
| Additional Debt Type(4): | Pari Passu,Subordinate | |||
| Additional Future Debt Permitted: | No | |||
| Escrows and Reserves | Financial Information(1) | |||||
| Initial | Monthly | Initial Cap | Cut-off Date Loan / Room: | $72,816 | ||
| Taxes: | $295,949 | $147,974 | N/A | Maturity Date Loan / Room: | $72,816 | |
| Insurance: | $63,643 | $31,821 | N/A | Cut-off Date LTV(6): | 25.4% | |
| Replacement Reserves: | $0 | $13,596 | N/A | Maturity Date LTV(6): | 25.4% | |
| Deferred Maintenance: | $322,500 | $0 | N/A | UW NOI DSCR: | 5.41x | |
| Common Charge Reserve | $1,651,824 | Springing | N/A | UW NCF DSCR: | 5.31x | |
| UW NOI Debt Yield: | 20.4% | |||||
| UW NCF Debt Yield: | 20.0% |
Sources and Uses
| Sources | Proceeds | % of Total | Uses | Proceeds | % of Total | |
| Whole Mortgage Loan | $45,000,000 | 100.0% | Payoff Existing Debt | $35,855,040 | 79.7% | |
| Closing Cost | 3,108,281 | 6.9 | ||||
| Upfront Reserves | 2,333,915 | 5.2 | ||||
| Return of Equity | 3,702,764 | 8.2 | ||||
| Total Sources | $45,000,000 | 100.0% | Total Uses | $45,000,000 | 100.0% |
| (1) | The Acropolis Garden loan is a part of a larger split whole loan evidenced by twopari passu notes with an aggregate original principal balance of $45.0 million. The Financial Information presented in the chart above and herein reflects the balance of the $45.0 million Acropolis Gardens Whole Loan. |
THE INFORMATION IN THIS COLLATERAL TERM SHEET IS NOT COMPLETE AND MAY BE AMENDED PRIOR TO THE TIME OF SALE. THIS TERM SHEET IS NOT AN OFFER TO SELL THESE SECURITIES AND IT IS NOT A SOLICITATION OF AN OFFER TO BUY THESE SECURITIES IN ANY JURISDICTION WHERE THE OFFER OR SALE IS NOT PERMITTED.
182
Mortgage Loan No. 15 — Acropolis Garden
| (2) | KBRA has confirmed that the loan has, in the context of tis inclusion in the Initial Poll Balance, credit characteristics consistent with an investment grade obligation. |
| (3) | For a more detailed description of the sponsor, please refer to “The Sponsor” below. |
| (4) | A subordinate wraparound lien, secured by the property, is currently outstanding with an outstanding principal balance as of the Cut-off Date of $1.00. Such lien has been subordinated and stood still pursuant to a subordination and standstill agreement between Natixis Real Estate Capital, LLC and Acropolis Associates, LLC, the subordinate lender. |
| (5) | The property has been operating as a cooperative and the historical NOI reflects such operation. The UW NOI is based on the assumption that the property can be leased as a rental project at estimated market rents reflected in the appraisal. The increase in NOI from 2015 to 2016 is primarily due to switching from fuel to gas. For more detailed description of the financial information, please refer to “Operating History and Underwritten Net Cash Flow” below. |
| (6) | The Appraised Value assumes the property is operated as a multifamily rental property and leased at market rent, see “Certain Characteristics of Mortgage Loans Secured by Residential Cooperatives” in the Preliminary Prospectus. |
The Loan.The Acropolis Garden loan, which is part of a larger split whole loan, is a first mortgage loan secured by the borrower’s fee interest in a residential condominium unit owned by a cooperative housing corporation with 618 units, located in Astoria, New York. The Acropolis Garden Whole Loan has an outstanding principal balance of $45.0 million (the “Acropolis Garden Whole Loan”), which is comprised of twopari passunotes, identified as Note A-1 and Note A-2. The two notes have outstanding balances of $25.0 million and $20.0 million for Note A-1 and Note A-2, respectively.
The controlling Note A-1, which has an outstanding principal balance of $25.0 million, is being contributed to the CSAIL 2017-CX9 Commercial Mortgage Trust. The non-controlling Note A-2 has an outstanding principal balance of $20.0 million and was contributed to the CSAIL 2017-C8 Commercial Mortgage Trust. As the holder of Note A-1, the trustee of the CSAIL 2017-CX9 Commercial Mortgage Trust is entitled to exercise all of the rights of the controlling noteholder with respect to the Acropolis Garden Whole Loan.
Pari Passu Note Summary
| Original Balance | Cut-off Date Balance | Note Holder | Controlling Piece | |
| Note A-1 | $25,000,000 | $25,000,000 | CSAIL 2017-CX9 | Yes |
| Note A-2 | $20,000,000 | $20,000,000 | CSAIL 2017-C8 | No |
| Total | $45,000,000 | $45,000,000 |
The Borrower.The borrowing entity for the loan is Acropolis Gardens Realty Corp., a New York corporation and special purpose entity.
The Sponsor.The property is owned in fee simple by the borrower. No individual or entity (other than the borrower) has recourse obligations with respect to the Acropolis Gardens Whole Loan, including pursuant to any guaranty or environmental indemnity.
The Property.The Acropolis Garden property is a residential condominium unit owned by a cooperative housing corporation with 618 units, located in Astoria, New York. The property is comprised of 16 contiguous 5-story apartment buildings built in 1923 and subsequently converted to cooperative ownership in 1988. The property has 543 sold (owner-occupied) units and 75 investor-owned rental apartments, of which 21 are rent controlled and 54 are rent stabilized.
The property contains 16 studio units, 159 one-bedroom units, 411 two-bedroom units and 32 three-bedroom units. Each of the 16 buildings is serviced by four separate entrances. The front portions of the buildings, along 33rd Street and 35th Street were constructed over a full basement, while the interior sides of the buildings, along the interior walkway were constructed over crawl space. There is a large garden in the middle of the property’s ground floor as well as landscaped areas consisting of grass areas, shrubs, trees and plantings located along the 21st Avenue, 33rd Street and 35th Street sidewalks. Common laundry facilities at the property are located on the ground floors of 2156 33rd Street and 2157 35th Street. All apartments have video and intercom systems, which provide access via buzzer actuators. The property does not have on-site parking, but is within walking distance of major commercial/retail corridors in the neighborhood.
THE INFORMATION IN THIS COLLATERAL TERM SHEET IS NOT COMPLETE AND MAY BE AMENDED PRIOR TO THE TIME OF SALE. THIS TERM SHEET IS NOT AN OFFER TO SELL THESE SECURITIES AND IT IS NOT A SOLICITATION OF AN OFFER TO BUY THESE SECURITIES IN ANY JURISDICTION WHERE THE OFFER OR SALE IS NOT PERMITTED.
183
Mortgage Loan No. 15 — Acropolis Garden
Owner-occupied apartments have customized finishes suiting the individual owner occupant and household. The rental apartments have finishes consisting of hardwood floors and painted plaster walls and ceilings. Kitchen finishes consist of tile or linoleum floors, laminate counters, wood wall cabinetry, a 4-burner gas-stove and oven, a refrigerator and steel sink. The bathrooms feature ceramic tile floors, a fiberglass tub and shower, wood vanities and porcelain countertops. Renovated rental apartments have kitchens with marble tile floors, oak wood cabinetry, glass tile back splashes, GE stainless steel appliances and Caesarstone quartz countertops. Bathrooms in the renovated rental apartments have marble tile floors and ceramic tile walls.
The Market. The property is located in the Astoria neighborhood of Queens, New York, which is located in the northwestern portion of the Queens borough of New York City and benefits from its easy access to Manhattan, LaGuardia Airport and the East River waterfront. Subway stations are located throughout the immediate area and provide access to all areas of New York via direct route or connections. Astoria is a residential neighborhood developed with a wide variety of housing types and also provides a cluster of major local commercial/retail strips.
According to third party research report, the Queens County Submarket is ranked 9th within the overall New York market in terms of effective rental growth and ranks 1st in terms of overall occupancy. As of the first quarter of 2017, the submarket had a reported vacancy rate of 2.1% with effective rents of $3,168 per unit per month. The submarket's occupancy rate was above the overall New York market average of 96.5% in first quarter 2017. The appraiser identified 18 comparable rental properties that were constructed between 1901 and 2009 with average rents ranging from $1,400 to $3,400 per unit.
Competitive Set Summary(1)
| Unit Type | Minimum Monthly Rent | Average Monthly Rent | Maximum Monthly Rent |
| Studio | $1,400 | $1,541 | $1,750 |
| One-bedroom | $1,750 | $1,871 | $2,000 |
| Two-bedroom | $2,250 | $2,499 | $2,750 |
| Three-bedroom | $3,000 | $3,226 | $3,400 |
| (1) | Source: Appraisal. |
THE INFORMATION IN THIS COLLATERAL TERM SHEET IS NOT COMPLETE AND MAY BE AMENDED PRIOR TO THE TIME OF SALE. THIS TERM SHEET IS NOT AN OFFER TO SELL THESE SECURITIES AND IT IS NOT A SOLICITATION OF AN OFFER TO BUY THESE SECURITIES IN ANY JURISDICTION WHERE THE OFFER OR SALE IS NOT PERMITTED.
184
Mortgage Loan No. 15 — Acropolis Garden
Operating History and Underwritten Net Cash Flow(1)
| 2015 | 2016 | Underwritten(1) | Per Unit(2) | %(3) | |
| Rents in Place | $5,633,315 | $5,470,421 | $15,452,541 | $25,004 | 100.0% |
| Vacant Income | 0 | 0 | 0 | 0 | 0.0% |
| Gross Potential Rent | $5,633,315 | $5,470,421 | $15,452,541 | $25,004 | 100.0% |
| Total Reimbursements | 0 | 0 | 0 | 0 | 0.0% |
| Net Rental Income | $5,633,315 | $5,470,421 | $15,452,541 | $25,004 | 100.0% |
| (Vacancy/Collection Loss)(4) | 0 | 0 | (623,582) | ($1,009) | (4.0%) |
| Other Income | 0 | 226,401 | 137,000 | 222 | 0.9% |
| Effective Gross Income | $5,633,315 | $5,696,822 | $14,965,959 | $24,217 | 96.9% |
| Total Expenses | $5,434,367 | $5,137,865 | $5,787,751 | $9,365 | 38.7% |
| Net Operating Income | $198,948 | $558,957 | $9,178,209 | $14,851 | 61.3% |
| Total TI/LC, Capex/RR | 0 | 0 | 163,152 | 264 | 1.1% |
| Net Cash Flow | $198,948 | $558,957 | $9,015,057 | $14,587 | 60.2% |
| (1) | Residential cooperatives are generally organized and operated as not-for-profit entities that set maintenance fees to cover current expenses and plan for future capital needs. The property has been operating as a cooperative and the historical NOI reflects such operation. The Underwritten Net Operating Income and the Underwritten Net Cash Flow for the property are the projected net operating income and the projected net cash flow, respectively, reflected in the appraisal. The projected net operating income, in general, equals projected effective gross income at the property assuming such property is operated as a rental property with rents and other income set at the prevailing market rates, reduced by underwritten property operating expenses and a market-rate vacancy assumption – in each case as determined by the appraiser. The rents of 54 rent stabilized units and 21 rent controlled units are assumed to remain below market. The projected net cash flow equals the projected net operating income reduced by the projected replacement reserves – as determined by the property condition report. The projected rental income used in such determinations differs materially from the scheduled monthly maintenance payments from the tenant-shareholders at the property. |
| (2) | Per Units values are based on 618 units. |
| (3) | % column representing percent of Net Rental Income for all revenue lines and represents percent of Effective Gross Income for the remainder of fields. |
| (4) | The vacancy reported reflects the vacancy assumption in the related appraisal for purposes of determining the appraised value of the property as a multifamily rental property. |
THE INFORMATION IN THIS COLLATERAL TERM SHEET IS NOT COMPLETE AND MAY BE AMENDED PRIOR TO THE TIME OF SALE. THIS TERM SHEET IS NOT AN OFFER TO SELL THESE SECURITIES AND IT IS NOT A SOLICITATION OF AN OFFER TO BUY THESE SECURITIES IN ANY JURISDICTION WHERE THE OFFER OR SALE IS NOT PERMITTED.
185