Table of Contents
As filed with the U.S. Securities and Exchange Commission on 04/05/18
UNITED STATES
SECURITIES AND EXCHANGE COMMISSION
Washington, D.C. 20549
FORM N-CSR
CERTIFIED SHAREHOLDER REPORT OF REGISTERED
MANAGEMENT INVESTMENT COMPANIES
Investment Company Act file number 811-23289
Angel Oak Strategic Credit Fund
(Exact name of registrant as specified in charter)
One Buckhead Plaza
3060 Peachtree Rd. NW, Suite 500
Atlanta, Georgia 30305
(Address of principal executive offices) (Zip code)
Dory S. Black, Esq., President
One Buckhead Plaza
3060 Peachtree Rd. NW, Suite 500
Atlanta, Georgia 30305
(Name and address of agent for service)
Copy to:
Douglas P. Dick
Stephen T. Cohen
Dechert LLP
1900 K Street NW
Washington, DC 20006
404-953-4900
Registrant’s telephone number, including area code
Date of fiscal year end: January 31
Date of reporting period: January 31, 2018
Table of Contents
Item 1. Reports to Stockholders.
Table of Contents
ANNUAL REPORT
January 31, 2018

Angel Oak Strategic Credit Fund
Angel Oak Capital Advisors, LLC
One Buckhead Plaza
3060 Peachtree Road NW
Suite 500
Atlanta, GA 30305
(404) 953-4900
Table of Contents
| 1 | ||||
| 5 | ||||
| 6 | ||||
| 7 | ||||
| 8 | ||||
| 9 | ||||
| 10 | ||||
| 11 | ||||
| 12 | ||||
| 13 | ||||
| 20 | ||||
| 21 | ||||
| 25 | ||||
Table of Contents
While 2017 was a big year for passive investors, we believe 2018 will be the year for credit selection. Long positions in risk markets, taken directly in both equities and bonds or indirectly through broad-based indices, paid handsomely in 2017. The strong performance of these asset classes was driven by steady growth, benign inflation, and relatively cautious Federal Reserve (Fed) policy, resulting in lower volatility, tightening credit spreads, and record highs in equity markets.
Looking forward to 2018, we believe the continued unwinding of the Fed’s balance sheet will inevitably favor certain risk assets over others, as volatility increases and the yield curve steepens. Aided by positive fundamental tailwinds, we believe real estate-related assets, predominantly residential, should outperform other credit asset classes in 2018. The supply/demand dislocation in the U.S. housing market and an expansion of the credit box in mortgage lending should benefit home prices and drive U.S. economic growth higher. We believe overweighting exposure to housing and other real estate-related assets should result in outperformance in 2018.
Traditional fixed income sectors, notably the Bloomberg Barclays U.S. Aggregate Bond Index (Bloomberg Barclays Agg.), have much more interest rate risk in the post-crisis period due to fiscal policy and quantitative easing, which makes us cautious toward these sectors. For example, due to growing U.S. government deficits, U.S. Treasury issuance has increased from approximately $4.5 trillion in the pre-crisis period to approximately $14.9 trillion today. U.S. Treasury, agency-guaranteed debentures, and agency-guaranteed mortgage pass-through securities comprise approximately 68% of the Bloomberg Barclays Agg. The structural interest rate sensitivity of many of these instruments has increased as well. For example, in the pre-crisis period, the yield of the Bloomberg Barclays Agg. was typically higher than its duration. That differential reversed after 2008, as rates began declining to historic lows, and the Index’s yield is now much lower than its duration. If interest rates were to rise 100 basis points (bps), an investor in the Bloomberg Barclays Agg. would lose approximately two years of income due to price depreciation.
Given this historical risk imbalance, we favor sectors outside the traditional Bloomberg Barclays Agg., such as non-agency residential mortgage-backed securities, non-agency commercial mortgage-backed securities, asset-backed securities, collateralized loan obligations, and high yield corporate bonds. Angel Oak favors structured credit as the best mechanism to potentially take advantage of unique risk-adjusted total return opportunities and relative value while maintaining a low effective duration profile.
Thank you for your continued support.
Respectfully yours,
Sreeniwas V. Prabhu
Chief Executive Officer and Chief Investment Officer
The opinions expressed are subject to change at any time, are not guaranteed and should not be considered investment advice.
Must be accompanied or preceded by a prospectus.
Mutual fund investing involves risk. Principal loss is possible.
The Angel Oak Funds are distributed by Quasar Distributors, LLC.
Definitions:
Basis Point (bps): One hundredth of one percent. Used to denote the percentage change in a financial instrument.
Bloomberg Barclays U.S. Aggregate Bond Index: An unmanaged index that measures the performance of the investment-grade universe of bonds issued in the United States. The index includes institutionally traded U.S. Treasury, government-sponsored, mortgage and corporate securities. It is not possible to invest directly in an index.
Effective Duration: Measures a portfolio’s sensitivity to changes in interest rates. Generally, the longer the effective duration, the greater the price change relative to interest rate movements.
1
Table of Contents
Angel Oak Strategic Credit Fund
| 1. | How did the Fund perform during the period? |
The Fund officially launched on December 26, 2017 and the Fund made its first investment that same day. For the period from launch through January 31, 2018, the Fund’s Institutional Shares (ASCIX) returned 1.10%. During the same period, the Fund’s benchmark, the Bloomberg Barclays U.S. Aggregate Bond Index, returned -0.78%.
| 2. | What were the main contributors to and detractors from the Fund’s performance during the period? |
Duration and credit strategies benefited the Fund relative to the benchmark. Duration positioning short of the index was a positive contributor to relative performance for the period as the 5 and 10-year U.S. Treasury yields rose 28 and 27 basis points (bps), respectively. Credit strategies benefited the Fund relative to the benchmark for the period as risk assets outperformed traditional fixed income sectors within the Bloomberg Barclays US Aggregate Bond Index. The total returns of non-agency residential mortgage-backed securities (NA RMBS), collateralized loan obligations (CLOs), and commercial mortgage-backed securities (CMBS) were all positive contributors to the Fund.
NA RMBS were the primary contributors to Fund performance for the period. CLOs exhibited strong performance for the period as spreads across the entire CLO capital structure reached their tightest levels of the post-crisis period. CMBS shook off negative retail headlines throughout the period to also have positive performance throughout the period.
| 3. | What is your outlook heading into 2018, and how is the Fund positioned? |
We expect the Federal Open Market Committee (FOMC) to continue its methodical tightening campaign of raising the overnight Fed funds target rate while simultaneously unwinding its balance sheet. However, we believe the FOMC will be less aggressive on the front end of the curve next year, hiking the Fed funds target rate only twice rather than the three times suggested by the “dot plot” data, primarily due to stubbornly low inflation metrics and a flattening yield curve.
We anticipate that new Fed Chair Jerome Powell will implement “Operation Untwist,” reducing policy pressure somewhat on the front end of the curve while driving the long end up by putting price pressure on bond markets from continued unwinding of the balance sheet. This would hopefully stem asset price inflation, notably in equities, without jeopardizing growth or stoking inflation. This curve-steepening strategy, along with the following factors, should help extend the third-longest U.S. expansion on record since 1850:
| • | An unemployment rate declining below 4.0%. |
| • | Above-trend wage growth. |
| • | Ultra-accommodative global central bank policies resulting in inflation targets finally being met or exceeded. |
| • | Strong residential real estate fundamentals, which should lead to further expansion of residential credit. |
Credit spreads (except for agency RMBS) are generally at, or near, 24-month tights. Credit spreads should remain near these levels in 2018, as we expect the economy to maintain a positive trajectory and growth to potentially surprise to the upside. Given the tightness of credit spreads, effective credit selection will be paramount in 2018.
We believe structured credit, led by NA RMBS, will outperform traditional fixed income credit sectors due to positive housing fundamentals, favorable technicals, and low interest rate sensitivity. A recent Morgan Stanley report notes that the millennial generation comprises approximately 88 million people between the ages of 15 and 34. This will be the largest generation in American history, and has been characterized as the age group experiencing the most rapid rate of household formation. Over the next five years, 1.35 million annual household formations are expected – twice the level for the post-crisis period to date. Robust demand is expected amid historically tight supply. For example, inventories of existing homes for sale are at all-time lows. New homes for sale are 20% below long-run averages. Most important for the millennials, this unique supply/demand dynamic exists in an environment where mortgage credit availability is finally expanding. Despite recent increases in certain overheated markets, home prices remain affordable at the national level, and the effective rate of mortgage interest in the U.S. is still at, or near, all-time lows. These positive fundamentals have continued to improve the credit risk profile of NA RMBS, which is why we believe there is still upside potential in these credits. They should also show resiliency even in times of broad credit spread widening. As a result, Angel Oak continues to be overweight NA RMBS in both legacy (i.e. issued prior to 2009) and new issue positions.
2
Table of Contents
Despite the reduction in retail risks in new issue CMBS, credit spreads remain wide compared with comparably rated corporate credit, and we think the CMBS market will continue to present select opportunities in 2018. While negative retail news dominates the headlines, there are many positive tailwinds for commercial real estate, including the recently implemented tax reform, ample balance sheets seeking lending opportunities, and room for capitalization rate compression. The Fund continues to favor the BBB- portion of the capital structure in conduit for the risk adjusted return opportunities it presents.
Even though we have a favorable outlook on CLOs, we acknowledge spreads are at post-crisis tights and lower-rated CLO tranches magnify the risk of losses in a risk-off environment. We continue to favor deals with shorter average lives and large coupons that reduce the price sensitivity to spread widening. Most of these deals will be deleveraging over the next year, which will increase their credit enhancement as we get closer to the end of this credit cycle.
Through the end of 2017, investment grade corporate credit, like all risk assets, was up for the year. However, we are cautious as we look ahead to 2018. Traditional investment grade corporate credits are trading at all-time highs, while yields across this universe are not commensurate with the degree of leverage on company balance sheets. The threat of rising interest rates also creates a headwind for the asset class. On the other hand, we find the banking sector attractive given strong capital and credit profiles, the potential for some marginal regulatory relief, and the backdrop of higher rates, which is generally a favorable scenario for banks. The banking sector has added more than 350 bps of common equity capital since the crisis, in stark contrast to the broader corporate market where leverage has increased to record levels. In addition to a lower leverage profile, credit risk has declined sharply in the face of enhanced loan underwriting standards and increased regulatory oversight.
We see particularly compelling opportunities in community bank subordinated debt (sub-debt), which offers credit spreads 250-400 bps above those of larger institutions with a similar credit profile. Relative to larger banks, community banks have (1) more transparent business models; (2) a low-cost, “sticky” deposit base; (3) lending portfolios tied to local relationships; and (4) balance sheet structures that benefit from higher rates. Additionally, we believe that more-nimble community banks can drive more innovation and higher growth than larger institutions. Community bank sub-debt offers spreads of approximately 350 bps on average, compared with approximately 100 bps for the investment grade corporate bond index.
Past performance is not a guarantee of future results.
Investing involves risk. Principal loss is possible. The Fund’s Shares will not be listed on an exchange in the foreseeable future, if at all. The Fund’s derivative investments have risks, including the imperfect correlation between the value of such instruments and the underlying asset, rate or index, which creates the possibility that the loss on such instruments may be greater than the gain in the value of the underlying asset, rate or index; the loss of principal; the possible default of the other party to the transaction; and illiquidity of the derivative investments. The Fund may invest in illiquid securities and restricted securities. Investments in restricted securities could have the effect of increasing the amount of the Fund’s assets invested in illiquid securities if qualified institutional buyers are unwilling to purchase these securities. The Fund will be subject to risks associated with adverse political and economic developments in foreign countries, including seizure or nationalization of foreign deposits, the imposition of economic sanctions, different legal systems and laws relating to bankruptcy and creditors’ rights and the potential inability to enforce legal judgments, all of which could cause the Fund to lose money on its investments in non-U.S. securities. Changes in interest rates generally will cause the value of fixed-income instruments held by the Fund to vary inversely to such changes. Below investment grade instruments are commonly referred to as “junk” or high-yield instruments and are regarded as predominantly speculative with respect to the issuer’s capacity to pay interest and repay principal. Lower grade instruments may be particularly susceptible to economic downturns. The price paid by the Fund for asset-backed securities, including CLOs, the yield the Fund expects to receive from such securities and the average life of such securities are based on a number of factors, including the anticipated rate of prepayment of the underlying assets. Mortgage-backed securities are subject to the general risks associated with investing in real estate securities; that is, they may lose value if the value of the underlying real estate to which a pool of mortgages relates declines. See the prospectus for a more detailed description of Fund risks.
Definitions:
Basis Point (bps): One hundredth of one percent. Used to denote the percentage change in a financial instrument.
Bloomberg Barclays U.S. Aggregate Bond Index: An unmanaged index that measures the performance of the investment-grade universe of bonds issued in the United States. The index includes institutionally traded U.S. Treasury, government-sponsored, mortgage and corporate securities. It is not possible to invest directly in an index.
Duration: Measures a portfolio’s sensitivity to changes in interest rates. Generally, the longer the duration, the greater the price change relative to interest rate movements.
3
Table of Contents
Spread: The difference in yield between a U.S. Treasury bond and a debt security with the same maturity but of lesser quality.
Tranche: A portion of debt or structured financing. Each portion, or tranche, is one of several related securities offered at the same time but with different risks, rewards, and maturities.
4
Table of Contents
Investment Results – (Unaudited)
Angel Oak Strategic Credit Fund
Total Return Based on a $50,000 Investment
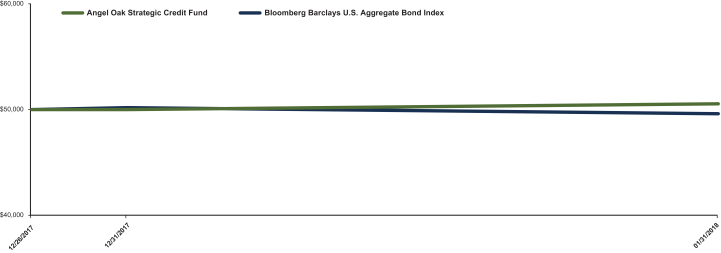
The chart above assumes an initial investment of $50,000 made on December 26, 2017 (commencement of operations). Returns shown include the reinvestment of all dividends. Returns shown do not reflect the deduction of taxes that a shareholder would pay on Fund distributions. In the absence of fee waivers and reimbursements, when they are necessary to keep expenses at the expense cap, total return would be reduced. Past performance is not predictive of future performance. Investment return and principal value will fluctuate so that your shares, when repurchased, may be worth more or less than the original cost. Index returns do not reflect the effects of fees or expenses. It is not possible to invest directly in an index.
Cumulative Returns(1)
(For the period ended January 31, 2018)
| Since Inception(2) | ||||
Angel Oak Strategic Credit Fund | 1.10 | % | ||
Bloomberg Barclays U.S. Aggregate Bond Index(3) | -0.78 | % | ||
(1) Return figures reflect any change in price per share and assume the reinvestment of all distributions.
(2) Inception date is December 26, 2017.
(3) The Bloomberg Barclays U.S. Aggregate Bond Index measures the performance of the investment-grade, fixed-rate bond market, including government and credit securities, agency pass-through securities, asset-backed securities and commercial mortgage-backed securities. Performance figures include the change in value of the bonds in the index and the reinvestment of interest. The index return does not reflect expenses, which have been deducted from the Fund’s return. You cannot invest directly in an Index; however, an individual can invest in exchange-traded funds or other investments vehicles that attempt to track the performance of a benchmark index.
5
Table of Contents
Portfolio Holdings – (Unaudited)
The investment objective of Angel Oak Strategic Credit Fund is to seek total return.
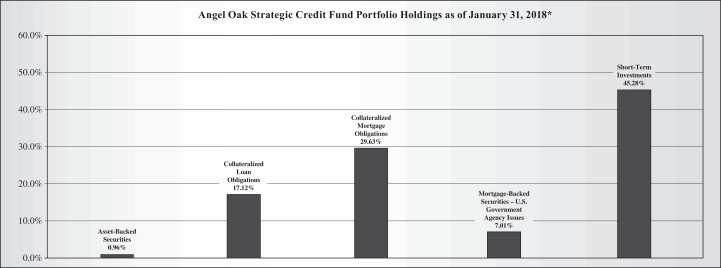
* As a percentage of total investments.
6
Table of Contents
Summary of Fund Expenses – (Unaudited)
As a shareholder of the Fund, you incur ongoing costs, including management fees and other expenses of the Fund. This Example is intended to help you understand your ongoing costs (in dollars) of investing in the Fund and to compare these costs with the ongoing costs of investing in other funds. The Example is based on an investment of $1,000 invested at the beginning of the period, and held for the entire period from December 26, 2017 to January 31, 2018.
Actual Expenses
The first line of the table below provides information about actual account values and actual expenses. You may use the information in this, together with the amount you invested, to estimate the expenses that you paid over the period. Simply divide your account value by $1,000 (for example, an $8,600 account value divided by $1,000 = $8.60), then multiply the result by the number in the first line under the heading entitled “Expenses Paid During the Period” to estimate the expenses you paid on your account during this period.
Hypothetical Example for Comparison Purposes
The second line of the table below provides information about hypothetical account value and hypothetical expenses based on the Fund’s actual expense ratio and an assumed rate of return of 5% per year before expenses, which is not the Fund’s actual return. The hypothetical account value and expenses may not be used to estimate the actual ending account balance or expenses you paid for the period. You may use this information to compare the ongoing costs of investing in the Fund and other funds. To do so, compare this 5% hypothetical example with the 5% hypothetical examples that appear in the shareholder reports of other funds.
Please note that the expenses shown in the table are meant to highlight your ongoing costs only and do not reflect any transactional costs. Therefore, the second line of the table below is useful in comparing ongoing costs only and will not help you determine the relative costs of owning different funds. In addition, if any transactional costs were included, your costs would have been higher.
| Angel Oak Strategic Credit Fund | Beginning Account Value, December 26, 2017 | Ending Account Value, January 31, 2018 | Expenses Paid During Period(1) | Annualized Expense Ratio | ||||
| Actual | $1,000.00 | $1,011.00 | $0.74 | 0.75% | ||||
| Hypothetical(2) | $1,000.00 | $1,021.42 | $3.82 | 0.75% |
(1) Expenses are equal to the Fund’s annualized expense ratio, multiplied by the average account value over the period, multiplied by the number of days (36) in the most recent period and divided by the number of days in the most recent twelve month period (365). The annualized expense ratios reflects fee waiver and expense limitation arrangements, including interest expense, in effect during the period. The “Financial Highlights” tables in the Fund’s financial statements, included in the report, also show the gross expense ratios, without such reimbursements.
(2) Hypothetical assumes 5% annual return before expenses.
7
Table of Contents
Angel Oak Strategic Credit Fund
Schedule of Investments
January 31, 2018
| Principal Amount | Value | |||||||
Asset-Backed Securities – 1.02% | ||||||||
GSAA Home Equity Trust, Series 2006-15, Class AF6, 5.876%, 9/25/2036 (a) | $ | 54,781 | $ | 28,421 | ||||
|
| |||||||
TOTAL ASSET-BACKED SECURITIES – | 28,421 | |||||||
|
| |||||||
Collateralized Loan Obligations – 18.05% | ||||||||
Ares XLIV CLO Ltd., Series 2017-44A, Class E, 9.364% (3 Month LIBOR USD + 8.050%), 10/15/2029 (b)(c) | 500,000 | 503,936 | ||||||
|
| |||||||
TOTAL COLLATERALIZED LOAN OBLIGATIONS – | 503,936 | |||||||
|
| |||||||
Collateralized Mortgage Obligations – 31.26% | ||||||||
Deutsche Alt-A Securities Mortgage Loan Trust, Series 2007-1, Class 1A4B, 1.891% (1 Month LIBOR USD + 0.330%), 8/25/2037 (b) | 109,304 | 88,371 | ||||||
GS Mortgage Securities Trust, Series 2015-GC34, Class D, 2.979%, 10/13/2048 | 500,000 | 379,705 | ||||||
JP Morgan Chase Commercial Mortgage Securities Trust, Series 2015-FL7, Class LAK1, 5.959%, 5/15/2028 (c)(d) | 100,000 | 100,672 | ||||||
JP Morgan Chase Commercial Mortgage Securities Trust, Series 2015-FL7, Class LAK2, 6.877%, 5/15/2028 (c)(d) | 100,000 | 100,672 | ||||||
Residential Asset Securitization Trust, Series 2006-A8, Class 2A7, 6.500%, 8/25/2036 | 330,757 | 203,016 | ||||||
|
| |||||||
TOTAL COLLATERALIZED MORTGAGE OBLIGATIONS – | 872,436 | |||||||
|
| |||||||
Mortgage-Backed Securities – U.S. Government Agency Issues – 7.39% | ||||||||
Federal Home Loan Mortgage Corp., Series 2017-HQA2, Class M2, 4.211% (1 Month LIBOR USD + 2.650%), 12/26/2029 (b) | 100,000 | 103,896 | ||||||
Federal Home Loan Mortgage Corp., Series 2017-HQA3, Class M2, 3.911% (1 Month LIBOR USD + 2.350%), 4/25/2030 (b) | 100,000 | 102,417 | ||||||
|
| |||||||
TOTAL MORTGAGE-BACKED SECURITIES – U.S. GOVERNMENT AGENCY ISSUES – (Cost $206,593) | 206,313 | |||||||
|
| |||||||
| Shares | ||||||||
Short-Term Investments – 47.77% | ||||||||
Money Market Funds – 47.77% | ||||||||
Fidelity Institutional Money Market Government Portfolio, Institutional Class, 1.210% (e) | 1,333,279 | 1,333,279 | ||||||
|
| |||||||
TOTAL SHORT-TERM INVESTMENTS – | 1,333,279 | |||||||
|
| |||||||
TOTAL INVESTMENTS – 105.49% – | 2,944,385 | |||||||
|
| |||||||
Liabilities in Excess of Other Assets – (5.49%) | (153,357 | ) | ||||||
|
| |||||||
NET ASSETS – 100.00% | $ | 2,791,028 | ||||||
|
| |||||||
| (a) | Step-up bond that pays an initial coupon rate for the first period and then a higher coupon rate for the following periods. Rate disclosed is the rate in effect as of January 31, 2018. |
| (b) | Variable or Floating Rate Security based on a reference index and spread. Rate disclosed is the rate in effect as of January 31, 2018. |
| (c) | Security exempt from registration under Rule 144A or Section 4(a)(2) of the Securities Act of 1933. The security may be resold in transactions exempt from registration, normally to qualified institutional buyers. These securities are determined to be liquid by the Adviser, under the procedures established by the Fund’s Board of Trustees, unless otherwise denoted. At January 31, 2018, the value of these securities amounted to $705,280 or 25.27% of net assets. |
| (d) | Variable rate security. The coupon is based on an underlying pool of assets. The rate reported is the rate in effect as of January 31, 2018. |
| (e) | Rate disclosed is the seven day yield as of January 31, 2018. |
See accompanying notes which are an integral part of these financial statements.
8
Table of Contents
Statement of Assets and Liabilities
January 31, 2018
| Strategic Credit Fund | ||||
Assets | ||||
Investments in securities at fair value (cost $2,938,613) | $ | 2,944,385 | ||
Due from Adviser | 46,761 | |||
Receivable for fund shares sold | 30,504 | |||
Interest receivable | 26,219 | |||
|
| |||
Total Assets | 3,047,869 | |||
|
| |||
Liabilities | ||||
Payable for investments purchased | 201,986 | |||
Payable to administrator, fund accountant, and transfer agent | 12,122 | |||
Payable to custodian | 731 | |||
Other accrued expenses | 42,002 | |||
|
| |||
Total Liabilities | 256,841 | |||
|
| |||
Net Assets | $ | 2,791,028 | ||
|
| |||
Net Assets consist of: | ||||
Paid-in capital | $ | 2,766,603 | ||
Accumulated undistributed net investment income | 10,377 | |||
Accumulated net realized gain from investment transactions | 8,276 | |||
Net unrealized appreciation on investments | 5,772 | |||
|
| |||
Net Assets | $ | 2,791,028 | ||
|
| |||
Shares outstanding (unlimited number of shares authorized, no par value) | 110,624 | |||
|
| |||
Net asset value (“NAV”) and offering price per share | $ | 25.23 | ||
|
| |||
See accompanying notes which are an integral part of these financial statements.
9
Table of Contents
For the Period Ended January 31, 2018
| Strategic Credit Fund (a) | ||||
Investment Income | ||||
Interest | $ | 16,957 | ||
|
| |||
Total Investment Income | 16,957 | |||
|
| |||
Expenses | ||||
Audit | 20,003 | |||
Legal | 14,777 | |||
Transfer agent | 5,563 | |||
Administration | 3,921 | |||
Investment Advisory | 3,210 | |||
Fund accounting | 2,638 | |||
Printing | 2,562 | |||
Compliance | 1,609 | |||
Distribution | 1,252 | |||
Custodian | 731 | |||
Miscellaneous | 1,849 | |||
|
| |||
Total Expenses | 58,115 | |||
|
| |||
Fees voluntarily waived by Adviser (See Note 3) | (56,189 | ) | ||
|
| |||
Net operating expenses | 1,926 | |||
|
| |||
Net Investment Income | 15,031 | |||
|
| |||
Realized and Unrealized Gain on Investments | ||||
Net realized gain on investments | 8,276 | |||
Net change in unrealized appreciation on investments | 5,772 | |||
|
| |||
Net realized and unrealized gain on investments | 14,048 | |||
|
| |||
Net increase in net assets resulting from operations | $ | 29,079 | ||
|
| |||
| (a) | Fund commenced operations on December 26, 2017. |
See accompanying notes which are an integral part of these financial statements.
10
Table of Contents
Angel Oak Strategic Credit Fund
Statement of Changes in Net Assets
| For the Period Ended January 31, 2018 (a) | ||||
Increase (Decrease) in Net Assets due to: | ||||
Operations | ||||
Net investment income | $ | 15,031 | ||
Net realized gain on investment transactions | 8,276 | |||
Net change in unrealized appreciation on investments | 5,772 | |||
|
| |||
Net increase in net assets resulting from operations | 29,079 | |||
|
| |||
Distributions | ||||
From net investment income | (4,654 | ) | ||
|
| |||
Total Distributions | (4,654 | ) | ||
|
| |||
Capital Transactions | ||||
Proceeds from shares sold | 2,661,949 | |||
Reinvestment of distributions | 4,654 | |||
|
| |||
Net increase in net assets resulting from capital transactions | 2,666,603 | |||
|
| |||
Total Increase in Net Assets | 2,691,028 | |||
|
| |||
Net Assets | ||||
Beginning of period | 100,000 | |||
|
| |||
End of period | $ | 2,791,028 | ||
|
| |||
Accumulated undistributed net investment income included in net assets at end of period | $ | 10,377 | ||
|
| |||
Share Transactions | ||||
Shares sold | 106,439 | |||
Shares issued in reinvestment of distributions | 185 | |||
|
| |||
Net increase in share transactions | 106,624 | |||
|
| |||
| (a) | Fund commenced operations on December 26, 2017. |
See accompanying notes which are an integral part of these financial statements.
11
Table of Contents
Angel Oak Strategic Credit Fund
Financial Highlights
(For a share outstanding during the period)
| For the Period Ended January 31, 2018 (a) | ||||
Selected Per Share Data: | ||||
Net asset value, beginning of period | $ | 25.00 | ||
|
| |||
Income from investment operations: | ||||
Net investment income | 0.14 | |||
Net realized and unrealized gain on investments | 0.14 | |||
|
| |||
Total from investment operations | 0.28 | |||
|
| |||
Less distributions to shareholders: | ||||
From net investment income | (0.05 | ) | ||
|
| |||
Total Distributions | (0.05 | ) | ||
|
| |||
Net asset value, end of period | $ | 25.23 | ||
|
| |||
Total Return | 1.10 | % (b) | ||
Ratios and Supplemental Data: | ||||
Net assets, end of period (000’s omitted) | $ | 2,791 | ||
Ratio of expenses to average net assets after waiver and reimbursement (c) | 0.75 | % (d) | ||
Ratio of net investment loss to average net assets before waiver and reimbursement | -16.03 | % (d) | ||
Ratio of net investment income to average net assets after waiver and reimbursement | 5.85 | % (d) | ||
Portfolio turnover rate | 69.68 | % (b) | ||
(a) Fund commenced operations on December 26, 2017. |
| |||
(b) Not Annualized. |
| |||
(c) Ratio of expenses to average net assets before waiver and reimbursement | 22.63 | % (d) | ||
(d) Annualized. |
| |||
See accompanying notes which are an integral part of these financial statements.
12
Table of Contents
Angel Oak Strategic Credit Fund
Notes to the Financial Statements
January 31, 2018
NOTE 1. ORGANIZATION
Angel Oak Strategic Credit Fund (the “Trust” or the “Fund”), a Delaware statutory trust organized on August 18, 2017, is a continuously-offered diversified, closed-end management investment company issuing shares, as defined in the Investment Company Act of 1940 (the “1940 Act”), as amended. The Trust’s sole series is the Fund. The Fund was effective December 1, 2017, and commenced operations on December 26, 2017. The Fund offers one class of shares to investors with no front-end or back-end sales charges and no 12b-1 fees. The Trust’s Amended and Restated Agreement and Declaration of Trust authorizes the issuance of an unlimited number of shares. The investment objective of the Fund is to seek total return.
The Fund operates as an “interval fund” pursuant to Rule 23c-3 under the 1940 Act. The Board of Trustees (“Board”) of the Fund has adopted a fundamental policy that the Fund will make quarterly repurchase offers pursuant to Rule 23c-3 under the 1940 Act, as such rule may be amended from time to time, for between 5% and 25% of the shares of beneficial interest (“Shares”) outstanding at net asset value (“NAV”), unless suspended or postponed in accordance with regulatory requirements, and each repurchase pricing shall occur no later than the 14th day after the Repurchase Request Deadline (as defined in the Fund’s Prospectus), or the next business day if the 14th day is not a business day. The Fund will not be required to repurchase Shares at a shareholder’s option nor will Shares be exchangeable for units, interests or shares of any investment of the Fund. In connection with each repurchase offer, it is possible that the Fund may offer to repurchase only the minimum amount of 5% of its outstanding Shares. It is also possible that a repurchase offer may be oversubscribed, with the result that shareholders may only be able to have a portion of their Shares repurchased. The Fund does not currently intend to list its Shares for trading on any national securities exchange. The Fund does not expect any secondary market to develop for the Shares in the foreseeable future. The Shares are, therefore, not readily marketable. Even though the Fund will make quarterly repurchase offers to repurchase a portion of the Shares to try to provide liquidity to shareholders, investors should consider the Shares to be illiquid. The schedule requires the Fund to make repurchase offers every three months. Quarterly repurchases occur in the month of March, June, September, and December. The first repurchase is scheduled to occur in June 2018.
NOTE 2. SIGNIFICANT ACCOUNTING POLICIES
The following is a summary of significant accounting policies consistently followed by the Fund in the preparation of its financial statements in accordance with the generally accepted accounting principles in the United States of America (“GAAP”). The Fund follows the investment company accounting and reporting guidance of the Financial Accounting Standards Board (“FASB”) Accounting Codification Topic 946 “Financial Services-Investment Companies.”
Securities Valuation and Fair Value Measurements – The Fund has adopted authoritative fair valuation accounting standards which establish an authoritative definition of fair value and set out a hierarchy for measuring fair value. These standards require additional disclosures about the various inputs and valuation techniques used to develop the measurements of fair value and a discussion in changes in valuation techniques and related inputs, if any, during the period. In addition, these standards require expanded disclosure for each major category of assets. These inputs are summarized in the three broad levels listed below:
| • | Level 1 – Quoted prices in active markets for identical securities |
| • | Level 2 – Other significant observable inputs (including, but not limited to, quoted prices for similar securities, interest rates, prepayment speeds, credit risk, etc.) |
| • | Level 3 – Significant unobservable inputs (including the Fund’s own assumptions in determining fair value of investments based on the best information available) |
The inputs or methodology used for valuing securities are not an indication of the risks associated with investing in those securities.
Investments in registered open-end management investment companies, including money market funds, will be valued based upon the NAV of such investments and are categorized as Level 1 of the fair value hierarchy.
Fair values for long-term debt securities, including asset-backed securities, collateralized loan obligations, collateralized mortgage obligations, corporate obligations and mortgage-backed securities are normally determined on the basis of valuations provided by independent pricing services. Vendors typically value such securities based on one or more inputs, including but not limited to, benchmark yields, transactions, bids, offers, quotations from dealers and trading systems, new issues, spreads and other relationships observed in the markets among comparable securities; and pricing models such as yield measurers calculated using factors such as
13
Table of Contents
Angel Oak Strategic Credit Fund
Notes to the Financial Statements - (continued)
January 31, 2018
NOTE 2. SIGNIFICANT ACCOUNTING POLICIES – (continued)
cash flows, financial or collateral performance and other reference data. In addition to these inputs, mortgage-backed and asset-backed obligations may utilize cash flows, prepayment information, default rates, delinquency and loss assumptions, collateral characteristics, credit enhancements and specific deal information. Securities that use similar valuation techniques and inputs are categorized as Level 2 of the fair value hierarchy. To the extent the significant inputs are unobservable; the values generally would be categorized as Level 3.
Equity securities, including preferred stocks, that are traded on a national securities exchange, except those listed on the Nasdaq Global Market®, Nasdaq Global Select Market® and the Nasdaq Capital Market® exchanges (collectively, “Nasdaq”), are valued at the last sale price at the close of that exchange. Securities traded on Nasdaq will be valued at the Nasdaq Official Closing Price (“NOCP”). If, on a particular day, an exchange-listed or Nasdaq security does not trade, then: (i) the security shall be valued at the mean between the most recent quoted bid and asked prices at the close of the exchange; or (ii) the security shall be valued at the latest sales price on the Composite Market (defined below) for the day such security is being valued. “Composite Market” means a consolidation of the trade information provided by national securities and foreign exchanges and over-the-counter markets (“OTC”) as published by a pricing service. In the event market quotations or Composite Market pricing are not readily available, Fair Value will be determined in accordance with the procedures adopted by the Board. All equity securities that are not traded on a listed exchange are valued at the last sale price at the close of the over-the counter market. If a non-exchange listed security does not trade on a particular day, then the mean between the last quoted bid and asked price will be used as long as it continues to reflect the value of the security. If the mean is not available, then bid price can be used as long as the bid price continues to reflect the value of the security. Otherwise Fair Value will be determined in accordance with the procedures adopted by the Board. These securities will generally be categorized as Level 3 securities. When using the market quotations or close prices provided by the pricing service and when the market is considered active, the security will be classified as a Level 1 security. Sometimes, an equity security owned by the Fund will be valued by the pricing service with factors other than market quotations or when the market is considered inactive. When this happens, the security will be classified as a Level 2 security.
Short term debt securities having a maturity of 60 days or less are generally valued at amortized cost, provided such amount approximates fair market value. These investments are categorized as Level 2 of the fair value hierarchy. Reverse repurchase agreements and repurchase agreements are priced at their acquisition cost, which represents fair value. These securities will generally be categorized as Level 2 securities.
Financial derivative instruments, such as futures contracts, that are traded on a national securities or commodities exchange are typically valued at the settlement price determined by the relevant exchange. Swaps, such as credit default swaps, interest-rate swaps and currency swaps, are valued by a Pricing Service. To the extent these securities are actively traded and valuation adjustments are not applied, they are categorized as Level 1 of the fair value hierarchy. Over-the-counter financial derivative instruments, such as certain futures contracts or swap agreements, derive their values from underlying asset prices, indices, reference rates, other inputs or a combination of these factors. These instruments are normally valued on the basis of evaluations provided by independent pricing services or broker dealer quotations. Derivatives that use similar valuation techniques as described above are typically categorized as Level 2 of the fair value hierarchy.
Securities may be fair valued in accordance with the fair valuation procedures approved by the Board. The Valuation and Risk Management Oversight Committee is generally responsible for overseeing the Fund’s valuation processes and reports quarterly to the Board. The Valuation and Risk Management Oversight Committee has delegated to the Valuation Committee of Angel Oak Capital Advisors, LLC (the “Adviser”) the day to day responsibilities for making all necessary determinations of the fair value of portfolio securities and other assets for which market quotations are not readily available or if the prices obtained from brokers and dealers or independent pricing services are deemed to be unreliable indicators of market or fair value. Representatives of the Adviser’s Pricing Committee report quarterly to the Valuation and Risk Management Oversight Committee.
14
Table of Contents
Angel Oak Strategic Credit Fund
Notes to the Financial Statements - (continued)
January 31, 2018
NOTE 2. SIGNIFICANT ACCOUNTING POLICIES – (continued)
The following is a summary of the inputs used to value the Fund’s net assets as of January 31, 2018:
| Assets | Level 1 | Level 2 | Level 3 | Total | ||||||||||||
Asset-Backed Securities | $ | – | $ | 28,421 | $ | – | $ | 28,421 | ||||||||
Collateralized Loan Obligations | – | 503,936 | – | 503,936 | ||||||||||||
Collateralized Mortgage Obligations | – | 872,436 | – | 872,436 | ||||||||||||
Mortgage-Backed Securities - U.S. Government Agency Issues | – | 206,313 | – | 206,313 | ||||||||||||
Short-Term Investments | 1,333,279 | – | – | 1,333,279 | ||||||||||||
Total | $ | 1,333,279 | $ | 1,611,106 | $ | – | $ | 2,944,385 | ||||||||
| See the Schedule of Investments for further disaggregation of investment categories. During the period ended January 31, 2018, the Fund did not recognize any transfers to or from Levels 1, 2 or 3. Transfers between levels are recognized at the end of the reporting period. |
Federal Income Taxes – The Fund intends to elect and continue to qualify to be taxed as a “regulated investment company” under Subchapter M of the Internal Revenue Code of 1986, as amended. If so qualified, the Fund generally will not be subject to federal income tax to the extent they distribute substantially all of its net investment income and capital gains to shareholders. The Fund generally intends to operate in a manner such that it will not be liable for federal income or excise taxes.
The Fund has adopted financial reporting rules regarding recognition and measurement of tax positions taken or expected to be taken on a tax return. The Fund recognizes interest and penalties, if any, related to unrecognized tax benefits as income tax expense on the Statement of Operations. During the period ended January 31, 2018, the Fund did not incur any interest or penalties.
Security Transactions and Income Recognition – Investment security transactions are accounted for on trade date. Gains and losses realized on sales of securities are determined on a specific identification basis. Interest income and expense is recorded on an accrual basis. Discounts and premiums on securities purchased are accreted or amortized using the effective yield method, based on each securities estimated life. Dividend income and corporate actions, if any, are recorded on the ex-date. Paydown gains and losses on mortgage-related and other asset-backed securities are recorded as components of interest income on the Statement of Operations. Payments may be received from certain investments held by the Fund may be comprised of dividends, capital gains and return of capital. The Fund originally estimates the expected classification of such payments. The amounts may subsequently be reclassified upon receipt of the information from the issuer. The actual character of distributions to the Fund’s shareholders will be reflected in the Form 1099 received by shareholders after the end of the calendar year.
Dividends and Distributions – Distributions from the Fund’s net investment income are accrued daily and typically paid monthly. The Fund intends to distribute its net realized long term capital gains and net realized short term capital gains, if any, at least annually. Dividends to shareholders, which are determined in accordance with income tax regulations, are recorded on the ex-dividend date. The treatment for financial reporting purposes of distributions made to shareholders during the period from net investment income or net realized capital gains may differ from their ultimate treatment for federal income tax purposes. These differences are caused primarily by differences in the timing of the recognition of certain components of income, expense or realized capital gain for federal income tax purposes. Where such differences are permanent in nature, they are reclassified in the components of the net assets based on their ultimate characterization for federal income tax purposes. Any such reclassifications will have no effect on net assets, results of operations or net asset values per share of the Fund. For the period ended January 31, 2018, there were no reclassifications.
Share Valuation – The NAV per share of the Fund is calculated by dividing the sum of the value of the securities held by the Fund, plus cash and other assets, minus all liabilities (including estimated accrued expenses) by the total number of shares outstanding, rounded to the nearest cent. The Fund’s NAV will not be calculated on the days on which the New York Stock Exchange is closed for trading.
Use of Estimates – The preparation of financial statements in conformity with GAAP requires management to make estimates and assumptions that affect the reported amounts of assets and liabilities and disclosure of contingent assets and liabilities at the date of the financial statements, as well as the reported amounts of revenues and expenses during the period. Actual results could differ from those estimates.
15
Table of Contents
Angel Oak Strategic Credit Fund
Notes to the Financial Statements - (continued)
January 31, 2018
NOTE 2. SIGNIFICANT ACCOUNTING POLICIES – (continued)
Indemnifications – Under the Trust’s organizational documents, the Trust will indemnify its officers and trustees for certain liabilities that may arise from performance of their duties to the Fund. Additionally, in the normal course of business, the Fund enters into contracts that contain a variety of representatives and warranties which provide general indemnifications. The Fund’s maximum exposure under these arrangements is unknown, as this would involve future claims that may be made against the Fund that have not yet occurred.
Repurchase Agreements – Repurchase agreements are transactions by which the Fund purchases a security and simultaneously commits to resell that security to the seller (a bank or securities dealer) at an agreed upon price on an agreed upon date. The resale price reflects the purchase price plus an agreed upon market rate of interest which is unrelated to the coupon rate or the date of maturity of the purchased security. A repurchase agreement is accounted for as an investment by the Fund, collateralized by securities, which are delivered to the Fund’s custodian or to an agent bank under a tri-party agreement. The securities are marked-to-market daily and additional securities are acquired as needed, to ensure that their value equals or exceeds the repurchase price plus accrued interest. Repurchase agreements involve certain risks not associated with direct investments in the underlying securities. In the event of a default or bankruptcy by the seller, the Fund will seek to liquidate such collateral. The exercise of the Fund’s right to liquidate such collateral could involve certain costs or delays, and, to the extent that proceeds from any sale upon a default of the obligation to repurchase were less than the repurchase price, the Fund could suffer a loss. The Fund did not hold any repurchase agreements during the period ended January 31, 2018.
Reverse Repurchase Agreements – A reverse repurchase agreement is the sale by the Fund of a security to a party for a specified price, with the simultaneous agreement by the Fund to repurchase that security from that party on a future date at a higher price. Securities sold under reverse repurchase agreements are reflected as a liability on the Statement of Assets and Liabilities. Interest payments made are recorded as a component of interest expense on the Statement of Operations. Reverse repurchase agreements involve the risk that the counterparty will become subject to bankruptcy or other insolvency proceedings or fail to return a security to the Fund. In such situations, the Fund may incur losses as a result of a possible decline in the value of the underlying security during the period while the Fund seeks to enforce its rights, a possible lack of access to income on the underlying security during this period, or expenses of enforcing its rights. The Fund will segregate assets determined to be liquid by the Adviser or otherwise covered its obligations under reverse repurchase agreement. The Fund did not hold any reverse repurchase agreements during the period ended January 31, 2018.
Mortgage-Backed and Asset-Backed Securities Risks – Prepayment risk is associated with mortgage-backed and asset-backed securities, including collateralized loan obligations (“CLOs”). If interest rates fall, the underlying debt may be repaid ahead of schedule, reducing the value of the Fund’s investments. If interest rates rise, there may be fewer prepayments, which would cause the average bond maturity to rise, increasing the potential for the Fund to lose money. The value of these securities may be significantly affected by changes in interest rates, the market’s perception of issuers, and the creditworthiness of the parties involved. The ability of the Fund to successfully utilize these instruments may depend on the ability of the Fund’s Adviser to forecast interest rates and other economic factors correctly. These securities may have a structure that makes their reaction to interest rate changes and other factors difficult to predict, making their value highly volatile. Certain mortgage-backed securities may be secured by pools of mortgages on single-family, multi-family properties, as well as commercial properties. Similarly, asset-backed securities may be secured by pools of loans, such as corporate loans, student loans, automobile loans and credit card receivables. The credit risk on such securities is affected by homeowners or borrowers defaulting on their loans. The values of assets underlying mortgage-backed and asset-backed securities, including CLOs, may decline and therefore may not be adequate to cover underlying investors. Mortgage-backed securities and other securities issued by participants in housing and commercial real estate finance, as well as other real estate-related markets have experienced extraordinary weakness and volatility in recent years. Possible legislation in the area of residential mortgages, credit cards, corporate loans and other loans that may collateralize the securities in which the Fund may invest could negatively impact the value of the Fund’s investments. To the extent the Fund focuses its investments in particular types of mortgage-backed or asset-backed securities, including CLOs, the Fund may be more susceptible to risk factors affecting such types of securities.
Subordinated Debt of Banks and Diversified Financial Companies – The Fund may invest in subordinated debt securities, sometimes also called “junior debt,” are debt securities for which the issuer’s obligations to make principal and interest payment are secondary to the issuer’s payment obligations to more senior debt securities. Such investments will consist primarily of debt issued by community
16
Table of Contents
Angel Oak Strategic Credit Fund
Notes to the Financial Statements - (continued)
January 31, 2018
NOTE 2. SIGNIFICANT ACCOUNTING POLICIES – (continued)
banks or savings intuitions (or their holding companies), which are subordinated to senior debt issued by the banks and depots held by the bank, but are senior to trust preferred obligations, preferred stock and common stock issued by the bank.
Preferred Stocks – The Fund may invest in preferred stock. Preferred stock is a class of stock having a preference over common stock as to the payment of dividends and the recovery of investment should a company be liquidated, although preferred stock is usually junior to the debt securities of the issuer. Preferred stock typically does not possess voting rights and its market value may change based on changes in interest rates. The fundamental risk of investing in preferred stock is the risk that the value of the stock might decrease. The Fund did not hold any preferred stocks during the period ended January 31, 2018.
Futures Contracts – The Fund may enter into futures contracts to hedge various investments for risk management as well as speculative purposes. Initial margin deposits are made upon entering into futures contracts and can be either cash or securities. Secondary margin limits are required to be maintained while futures are held, as defined by each contract.
During the period a futures contract is open, changes in the value of the contract are recognized as unrealized gains or losses by “marking-to-market” on a daily basis to reflect the fair value of the contract at the end of each day’s trading. Variation margin receivables or payables represent the difference between the change in unrealized appreciation and depreciation on the open contracts and the cash deposits made on the margin accounts. When the contract is closed, the Fund records a realized gain or loss equal to the difference between the proceeds from the closing transaction and the Fund’s cost of entering into a contract. The use of futures contracts involves the risk of illiquid markets or imperfect correlation between the value of the instruments and the underlying securities, or that the counterparty will fail to perform its obligations.
Futures contracts are valued at the settlement price established each day by the board of trade or exchange on which they are traded. Should market conditions move unexpectedly, the Fund may not achieve the anticipated benefits of the futures contract and may realize a loss. The Fund did not hold any futures contracts during the period ended January 31, 2018.
Options – A Fund may purchase call and put options on specific securities, and may write and sell covered or uncovered call and put options for hedging purposes in pursuing its investment objectives. A put option gives the purchaser of the option the right to sell, and obligates the writer to buy, the underlying security at a stated exercise price, typically at any time prior to the expiration of the option for American options or only at expiration for European options. A call option gives the purchaser of the option the right to buy, and obligates the writer to sell, the underlying security at a stated exercise price, typically at any time prior to the expiration of the option. A covered call option is a call option with respect to which the seller of the option owns the underlying security. The sale of such an option exposes the seller during the term of the option to possible loss of opportunity to realize appreciation in the market price of the underlying security or to possible continued holding of a security that might otherwise have been sold to protect against depreciation in the market price of the security. A covered put option is a put option with respect to which cash or liquid securities have been placed in a segregated account on the books of the Fund or with a custodian to fulfill the obligation undertaken. The sale of such an option exposes the seller during the term of the option to a decline in price of the underlying security while depriving the seller of the opportunity to invest the segregated assets.
A Fund may close out a position when writing options by purchasing an option on the same underlying security with the same exercise price and expiration date as the option that it has previously written on the security. In such a case, the applicable Fund will realize a profit or loss if the amount paid to purchase an option is less or more than the amount received from the sale of the option. The Fund did not hold any options during the period ended January 31, 2018.
Swaps – The Fund may enter into swap contracts to hedge various investments for risk management or to pursue its investment objective. The Fund may invest in credit default swaps, total return swaps, interest rate swaps, equity swaps, currency swaps, options on foregoing swaps, and other types of swaps. Such transactions are subject to market risk, liquidity risk, risk of default by the other party to the transaction, known as “counterparty risk,” regulatory risk and risk of imperfect correlation between the value of such instruments and the underlying assets and may involve commissions or other costs. Swap agreements are valued by a pricing service and unrealized appreciation or depreciation is recorded daily as the difference between the prior day and current day closing price. The Fund did not hold any swaps during the period ended January 31, 2018.
17
Table of Contents
Angel Oak Strategic Credit Fund
Notes to the Financial Statements - (continued)
January 31, 2018
NOTE 3. FEES AND OTHER RELATED PARTY TRANSACTIONS
Under the terms of the investment advisory agreement, on behalf of the Fund (the “Agreement”), the Adviser manages the Fund’s investments subject to oversight of the Trustees. As compensation for its management services, the Fund is obligated to pay the Adviser a fee computed and accrued daily and paid monthly at an annual rate of 1.25% of the average daily net assets of the Fund.
The Adviser has voluntarily agreed to waive its fees and/or reimburse certain expenses (exclusive of any taxes, interest on borrowings, dividends on securities sold short, brokerage commissions, acquired fund fees and expenses, expenses incurred in connection with any merger or reorganization and extraordinary expenses) to limit the Operating Expenses after fee waiver/expense reimbursement to 0.75% of the Fund’s average daily net assets (the “Expense Limit”) for the first six months of the Fund’s operations. The Adviser may voluntarily waive fees at different levels, from time to time. The Adviser may not recoup from the Fund any waived amount or reimbursed expenses pursuant to this arrangement. The Adviser may amend or discontinue this waiver at any time without advance notice.
Quasar Distributors, LLC (the “Distributor”) acts as the Fund’s principal underwriter in a continuous public offering of the Fund’s shares. For its services during the period ended January 31, 2018, the fund paid Quasar $1,252.
U.S. Bancorp Fund Services, LLC (“USBFS”), an indirect wholly-owned subsidiary of U.S. Bancorp, serves as the Fund’s Administrator (“Administrator”) and, in that capacity, performs various administrative and accounting services for the Fund. USBFS also serves as the Fund’s fund accountants and transfer agent. The Administrator prepares various federal and state regulatory filings, reports the returns for the Fund; prepares reports and materials to be supplied to the trustees; monitors the activities of the Fund’s custodians; coordinates the preparation and payment of the Fund’s expenses and reviews the Fund’s expense accruals. As compensation for its services, the Administrator is entitled to a monthly fee at an annual rate based upon the average daily net assets of the Fund. U.S. Bank, N.A. (the “Custodian”) serves as custodian to the Fund. Both the Administrator and Custodian are affiliates of the Distributor.
Certain officers, Trustees and shareholders of the Fund are also owners or employees of the Adviser.
NOTE 4. ORGANIZATIONAL AND OFFERING COSTS
Organizational costs consist of costs incurred to establish the Fund and enable it legally to do business. Offering costs include state registration fees and legal fees regarding the preparation of the initial registration statement. Organizational and offering costs were paid by the Adviser and will not be subject to reimbursement by the Fund.
NOTE 5. INVESTMENT TRANSACTIONS
For the period ended January 31, 2018, purchases and sales of investment securities, other than short-term investments and short-term U.S. government obligations, were as follows:
| Purchases | Sales | |
| $2,572,602 | $981,318 |
For the period ended January 31, 2018, there were $484,273 of purchases and $287,500 of sales of U.S. Government securities for the Fund, which are included in the amounts listed in the table above.
NOTE 6. BENEFICIAL OWNERSHIP
The beneficial ownership, either directly or indirectly, of 25% or more of the voting securities of a fund creates a presumption of control of a fund, under Section 2(a)(9) of the 1940 Act. At January 31, 2018, Pershing (“Pershing”) owned, as record shareholder, 92% of the outstanding shares of the Fund.
18
Table of Contents
Angel Oak Strategic Credit Fund
Notes to the Financial Statements - (continued)
January 31, 2018
NOTE 7. FEDERAL TAX INFORMATION
The tax characterization of distributions paid for the period ended January 31, 2018 were as follows:
| 2018 | ||
| Distributions paid from: | ||
| Ordinary Income | $4,654 | |
| Net Long-Term Capital Gain | – | |
| Total | $4,654 |
At January 31, 2018, the components of distributable earnings (accumulated losses) on a tax basis were as follows:
Tax Cost of Investments | $ | 2,938,613 | ||
|
| |||
Unrealized Appreciation | 8,016 | |||
Unrealized Depreciation | (2,244 | ) | ||
|
| |||
Net Unrealized Appreciation (Depreciation) | $ | 5,772 | ||
|
| |||
Undistributed Ordinary Income | 18,653 | |||
Undistributed Long-Term Gain (Loss) | – | |||
|
| |||
Distributable Earnings | $ | 18,653 | ||
Other Accumulated Gain (Loss) | – | |||
|
| |||
Total Accumulated Gain (Loss) | $ | 24,425 | ||
|
|
As of January 31, 2018, the Fund did not have any capital loss carry forwards.
Certain capital losses incurred after October 31 and within the current taxable year, are deemed to arise on the on the first business day of the Fund’s following taxable year. For the tax period ended January 31, 2018, the Fund did not defer any post-October losses.
NOTE 8. NEW ACCOUNTING PRONOUNCEMENTS
In March 2017, the Financial Accounting Standards Board (FASB) issued Accounting Standards Update (ASU) No. 2017-08, Receivables – Nonrefundable Fees and Other Costs (Subtopic 310-20): Premium Amortization on Purchased Callable Debt Securities. The amendments in the ASU shorten the amortization period for certain callable debt securities, held at a premium, to be amortized to the earliest call date. The ASU does not require an accounting change for securities held at a discount; which continues to be amortized to maturity. The ASU is effective for fiscal years and interim periods within those fiscal years beginning after December 15, 2018. Management is currently evaluating the impact, if any, of applying this provision.
NOTE 9. SUBSEQUENT EVENT
Management of the Fund has evaluated the need for disclosures and/or adjustments resulting from subsequent events through the date these financial statements were issued. This evaluation did not result in any subsequent events that necessitated disclosures and/or adjustments.
19
Table of Contents
REPORT OF THE INDEPENDENT PUBLIC ACCOUNTING FIRM
To the Shareholders and Board of Trustees of
Angel Oak Strategic Credit Fund
Opinion on the Financial Statements
We have audited the accompanying statement of assets and liabilities, including the schedule of investments, of Angel Oak Strategic Credit Fund (the “Fund”) as of January 31, 2018, and the related statements of operations, changes in net assets, including the related notes, and the financial highlights for the period December 26, 2017 (commencement of operations) through January 31, 2018 (collectively referred to as the “financial statements”). In our opinion, the financial statements present fairly, in all material respects, the financial position of the Fund as of January 31, 2018, the results of its operations, the changes in its net assets, and the financial highlights for the period then ended, in conformity with accounting principles generally accepted in the United States of America.
Basis for Opinion
These financial statements are the responsibility of the Fund’s management. Our responsibility is to express an opinion on the Fund’s financial statements based on our audit. We are a public accounting firm registered with the Public Company Accounting Oversight Board (United States) (“PCAOB”) and are required to be independent with respect to the Fund in accordance with the U.S. federal securities laws and the applicable rules and regulations of the Securities and Exchange Commission and the PCAOB.
We conducted our audit in accordance with the standards of the PCAOB. Those standards require that we plan and perform the audit to obtain reasonable assurance about whether the financial statements are free of material misstatement, whether due to error or fraud.
Our audit includes performing procedures to assess the risks of material misstatement of the financial statements, whether due to error or fraud, and performing procedures that respond to those risks. Such procedures include examining, on a test basis, evidence regarding the amounts and disclosures in the financial statements and confirmation of securities owned as of January 31, 2018, by correspondence with the custodian and brokers. Our audit also included evaluating the accounting principles used and significant estimates made by management, as well as evaluating the overall presentation of the financial statements. We believe that our audit provides a reasonable basis for our opinion.
We have served as the auditor of one or more investment companies within the Angel Oak Funds since 2012.

COHEN & COMPANY, LTD.
Cleveland, Ohio
March 29, 2018
20
Table of Contents
Additional Information (Unaudited):
1. Shareholder Notification of Federal Tax Status
For the tax period ended January 31, 2018, certain dividends paid by the Fund may be subject to a maximum tax rate of 20% as provided for by the Jobs and Growth Tax Relief Reconciliation Act of 2003. The Fund intends to designate the maximum amount allowable as taxed at a maximum rate of 20%.
For the taxable period ended January 31, 2018, the Fund paid qualified dividend income of 0.00%.
For the taxable period ended January 31, 2018, the percentage of ordinary income dividends paid by the Fund that qualifies for the dividends received deduction available to corporations was 0.00%.
For the taxable period ended January 31, 2018, the Fund did not pay any ordinary income distributions that are designated as short-term capital gain distributions under Internal Revenue Section 871(k)2(c).
For the taxable period ended January 31, 2018, the percentage of taxable ordinary income distributions that are designated as interest related dividends under Internal Revenue 871(k)1(c) was 57.57%.
2. Disclosure of Portfolio Holdings
The Fund will file a complete schedule of portfolio holdings with the Securities and Exchange Commission (“SEC”) for the first and third quarters of each fiscal year on Form N-Q. The Fund’s Form N-Q will be available on the website of the SEC at http://www.sec.gov. The Fund’s Forms N-Q may be reviewed and copied at the Securities and Exchange Commission’s Public Reference Room in Washington, D.C. Information on the operation of the Public Reference Room may be obtained by call 1-800-SEC-0330.
3. Proxy Voting Policies and Procedures
A description of the policies and procedures that the Fund uses to determine how to vote proxies related to portfolio securities and information regarding how the Fund voted those proxies during the most recent twelve month period ended June 30, is available without charge upon request by (1) calling the Funds at (855) 751-4324 and (2) from Trust documents filed with the SEC on the SEC’s website at www.sec.gov.
4. Statement Regarding the Basis for the Approval of the Investment Advisory Agreement
Pursuant to Section 15(c) of the Investment Company Act of 1940, as amended (the “1940 Act”), at the telephonic meeting held on September 6, 2017 and the in-person organizational meeting held on September 28, 2017 (the “Meeting”), the Board of Trustees (the “Board”) of Angel Oak Strategic Credit Fund (the “Fund”) considered the approval of the Investment Advisory Agreement (the “Investment Advisory Agreement” or the “Agreement”) between the Fund and Angel Oak Capital Advisors, LLC (the “Adviser” or “Angel Oak”) for an initial two-year period. The relevant provisions of the 1940 Act specifically provide that it is the duty of the Board to request and evaluate such information as the Board determines is necessary to allow it to properly consider the adoption of the Agreement, and it is the duty of the Adviser to furnish the Trustees with information that is responsive to their request.
Accordingly, in determining whether to adopt the Investment Advisory Agreement between the Adviser and the Fund, the Board requested, and the Adviser provided, information and data relevant to the Board’s consideration. This included materials prepared by the Adviser and by the Fund’s administrator that provided the Board with information regarding the estimated fees and expenses of the Fund, as compared to other similar closed-end funds.
Following their review and consideration, the Trustees determined that the Investment Advisory Agreement with respect to the Fund would enable shareholders of the Fund to obtain high quality services at a cost that is appropriate, reasonable, and in the best interests of the Fund and its shareholders. Accordingly, the Board, including those Trustees who are not considered to be “interested persons” of the Fund, as that term is defined in the 1940 Act (the “Independent Trustees”), unanimously approved the adoption of the Investment Advisory Agreement. In reaching their decision, the Trustees requested and obtained from the Adviser such information as they deemed reasonably necessary to evaluate the Investment Advisory Agreement. The Trustees also carefully considered the profitability data and comparative fee and expense information prepared by Fund management. In considering the Investment Advisory Agreement with respect to the Fund, the Trustees evaluated a number of factors that they believed, in light of their
21
Table of Contents
reasonable business judgment, to be relevant. They based their decision on the following considerations, among others, although they did not identify any one specific consideration or any particular information that was controlling of their decision:
The nature, extent and quality of the advisory services to be provided. The Trustees concluded that Angel Oak is capable of providing high quality services to the Fund, as indicated by the nature and quality of services provided in the past to each series of Angel Oak Funds Trust (the “AOFT Funds”), Angel Oak’s management capabilities demonstrated with respect to the AOFT Funds, the professional qualifications and experience of each of the portfolio managers of the Fund, Angel Oak’s investment and management oversight processes, and the competitive investment performance of the AOFT Funds. The Trustees also determined that Angel Oak proposed to provide investment advisory services that were of the same quality as services provided to the AOFT Funds in the past, and that these services are appropriate in scope and extent in light of the Fund’s proposed operations, the competitive landscape of the investment company business and investor needs. On the basis of the Trustees’ assessment of the nature, extent and quality of the advisory services to be provided by Angel Oak, the Trustees concluded that Angel Oak is capable of generating a level of long-term investment performance that is appropriate in light of the Fund’s investment objective, policies and strategies and competitive with many other comparable investment companies.
The investment performance of the Fund. The Board noted that the Fund had not yet commenced operations, and consequently, the Fund’s performance was not relevant to their considerations. The Board considered the past performance of the AOFT Funds based on materials provided by Angel Oak and information obtained from an independent third-party data provider. The Board noted that the performance of the AOFT Funds reflected positively on Angel Oak’s experience and ability to successfully implement the Fund’s strategies, and they observed that the portfolio management team for the Fund would include individuals currently responsible for the AOFT Funds.
The cost of advisory services to be provided and the level of profitability. On the basis of comparative information derived from the expense data that was provided to the Board, the Trustees determined that the overall projected expense ratio of the Fund is in-line with the average expense ratios for its peer interval funds. In this regard, the Board took into account that there were only a limited number of interval funds in operation, but that the proposed investment advisory fee and projected expense ratio were competitive with those comparable interval funds. The Board noted that the quality of services provided by Angel Oak and the past performance of the AOFT Funds demonstrated that the proposed advisory fees offered an appropriate value for the Fund and its shareholders. The Trustees also noted that Angel Oak had proposed a voluntary commitment for the benefit of shareholders of the Fund to limit the Fund’s operating expenses for the first six months of its operations.
The Board also reviewed the fees that Angel Oak charges its other clients for discretionary portfolio management services, noting that the firm has a variety of account types with different fee arrangements and that the Adviser does not manage any funds that are comparable to the Fund. They took into account the unique management requirements involved in managing a registered investment company as opposed to other types of client accounts.
The Board also focused on Angel Oak’s projected level of profitability with respect to the Fund and noted that Angel Oak’s expected level of profitability was acceptable and not unreasonable. Accordingly, on the basis of the Board’s review of the proposed fees to be charged by Angel Oak for the investment advisory and other services to be provided to the Fund by Angel Oak, and the estimated level of profitability from Angel Oak’s relationship with the Fund, the Board concluded that the proposed level of investment advisory fees and Angel Oak’s projected profitability were appropriate in light of the advisory fees, overall expense ratios and investment performance of comparable investment companies.
The extent to which economies of scale may be realized as the Fund grows and whether the proposed advisory fee reflects possible economies of scale. While it was noted that the Fund’s investment advisory fee will not decrease as the Fund’s assets grow because it will not be subject to investment advisory fee breakpoints, the Trustees concluded that the Fund’s proposed investment advisory fee is appropriate in light of the projected size of the Fund and appropriately reflects the current economic environment for Angel Oak and the competitive nature of the closed-end interval fund market. The Trustees then noted that they will have the opportunity to periodically reexamine whether the Fund has achieved economies of scale and the appropriateness of the investment advisory fee payable to Angel Oak with respect to the Fund, in the future, at which time the implementation of fee breakpoints on the Fund could be considered.
Benefits to Angel Oak from its relationship with the Fund (and any corresponding benefits to the Fund). The Trustees concluded that other benefits that will be derived by Angel Oak from its relationship with the Fund are reasonable and fair and consistent with industry practice and the best interests of the Fund and its shareholders.
Other Considerations. In approving the Investment Advisory Agreement, the Trustees determined that Angel Oak has made a substantial commitment to the recruitment and retention of high quality personnel, and maintains the financial, compliance and operational resources reasonably necessary to manage the Fund in a professional manner that is consistent with the best interests of
22
Table of Contents
the Fund and its shareholders. The Trustees also concluded that Angel Oak has made a significant entrepreneurial commitment to the management and success of the Fund, which entails a substantial financial and professional commitment. The Board also considered matters with respect to the brokerage practices of Angel Oak, including its best-execution procedures, and noted that these were reasonable and consistent with standard industry practice.
Following further discussion and the consideration of questions raised by the Independent Trustees, the Trustees determined that they had received sufficient information relating to the Fund to consider the approval of the Investment Advisory Agreement. It was noted that in making their determinations, the Trustees had considered and relied upon the materials provided to them for use at the Meeting with respect to the proposed contract and the presentation of the representatives of Angel Oak. In reaching their conclusion with respect to the approval of the Investment Advisory Agreement and the level of fees to be paid under the Agreement, the Trustees did not identify any one single factor as being controlling, but rather, the Trustees took note of a combination of factors that had influenced their decision making process. They noted the level and quality of investment advisory services provided by Angel Oak to the AOFT Funds, and they found that these services will benefit the Fund and its shareholders and also reflected management’s overall commitment to the growth and development of the Fund.
5. Compensation of Trustees
Each Trustee who is not an “interested person” of the Fund (i.e., an “Independent Trustee”) receives an annual retainer of $52,000, paid quarterly as well as $8,500 for attending each regularly scheduled meeting in person in connection with his service on the Board of the Fund and other funds advised by the Adviser. Independent Trustees are permitted reimbursement for out-of-pocket expenses incurred in connection with attendance at meetings. The Fund’s Statement of Additional Information includes additional information about the Trustees and is available upon request by calling toll free 1-855-444-9243.
6. Trustees and Officers
The business of the Fund is managed under the direction of the Board. The Board formulates the general policies of the Fund and meets periodically to review the Fund’s performance, monitor investment activities and practices, and discuss other matters affecting the Fund. The Trustees are fiduciaries for the Fund’s shareholders and are governed by the laws of the State of Delaware in this regard. The names and addresses of the Trustees and officers of the Fund are listed below along with a description of their principal occupations over at least the last five years. The address of each Trustee and Officer of the Fund is c/o Angel Oak Capital Advisors, LLC, One Buckhead Plaza, 3060 Peachtree Road NW, Suite 500, Atlanta, GA 30305. The Fund’s Statement of Additional Information includes additional information about the Trustees and is available upon request by calling toll free 1-855-751-4324.
Name and year of birth | Position with the Trust and tenure | Funds in complex overseen by Trustee | Principle occupation(s) during the past five years | Other directorships held during the past five years | ||||
Independent Trustees of the Trust(1) | ||||||||
Ira P. Cohen 1959 | Independent Trustee and Chairman, since 2014; indefinite term | 4 | Executive Vice President, Recognos Financial (investment industry data analysis provider) (since 2015); Independent financial services consultant (since 2005). | Trustee, Valued Advisers Trust (since 2010) (15 portfolios); Trustee, Griffin Institutional Access Real Estate Fund (since April 2014)(1 portfolio); Trustee, Griffin Institutional Access Credit Fund (since January 2017) (1 portfolio). | ||||
Alvin R. Albe, Jr. 1953 | Independent Trustee, since 2014; indefinite term | 4 | Retired; Senior Advisor, The TCW Group, Inc. (asset manager), (2008-2013). | Director, Syntroleum Corporation (renewable energy firm) (1988 – 2014). | ||||
23
Table of Contents
Name and year of birth | Position with the Trust and tenure | Funds in complex overseen by Trustee | Principle occupation(s) during the past five years | Other directorships held during the past five years | ||||
Keith M. Schappert 1951 | Independent Trustee, since 2014; indefinite term | 4 | President, Schappert Consulting LLC (investment industry consulting) (since 2008). | Trustee, Mirae Asset Discovery Funds (since 2010) (6 portfolios); Trustee, Metropolitan Series Fund, Inc. (since 2009) (30 portfolios); Trustee, Met Investors Series Trust (since 2012) (45 portfolios); Director, The Commonfund (investment management) (since 2012); Director, Calamos Asset Management, Inc. (investment management) (since 2012). | ||||
Interested Trustee of the Trust: | ||||||||
Sreeniwas (Sreeni) V. Prabhu 1974 | Interested Trustee, since April 2015; indefinite term | 4 | Chief Investment Officer, Portfolio Manager, Co-Founder, Angel Oak Capital Advisors, LLC (since 2009) | None. | ||||
| (1) | The Trustees of the Trust who are not “interested persons” of the Trust as defined in the 1940 Act (“Independent Trustees”). |
Name and year of birth | Position within Trust | Term of office and length of time served | Principle occupation(s) during past five years | |||||
Officers of the Trust | ||||||||
Dory S. Black, Esq. 1975 | President | Since 2015; indefinite term | General Counsel, Angel Oak (since 2014); General Counsel, EARNEST Partners, LLC (investment management firm) (2014); Vice-President and Assistant General Counsel, GE Asset Management Incorporated (2004 – 2014). | |||||
R. Adam Langley 1967 | Chief Compliance Officer | Since 2015; indefinite term | Chief Compliance Officer, Angel Oak Capital Advisors, LLC (since 2015); Compliance Manager, Invesco Advisers, Ltd. (2013 – 2015); Compliance Officer, Macquarie Group (2013); Chief Compliance Officer, Aspen Partners, Ltd. (2003 – 2013). | |||||
Lu Chang, CFA, FRM 1975 | Secretary | Since 2015; indefinite term | Chief Risk Officer, Angel Oak Capital Advisors, LLC (since 2014); Vice-President and Finance Manager, Wells Fargo Advisors, LLC (investment advisory firm) (2010 – 2014). | |||||
Daniel Fazioli 1981 | Treasurer | Since 2015; indefinite term | Controller, Angel Oak Capital Advisors, LLC (since 2015); Controller, Tang Capital Partners, LP (2014 – 2015); Associate, Goldman Sachs & Company, Inc. (2010 – 2014). | |||||
Each Trustee holds office for an indefinite term and until the earlier of: the Fund’s next meeting of shareholders and the election and qualification of his/her successor; or until the date a trustee dies, resigns or is removed in accordance with the Fund’s Amended and Restated Declaration of Trust and By-laws. Each Trustee shall serve during the lifetime of the Fund until he or she: (a) dies; (b) resigns; (c) has reached the mandatory retirement age, if any, as set by the Trustees; (d) is declared incompetent by a court of appropriate jurisdiction; or (e) is removed, or, if sooner, until the next meeting of shareholders called for the purpose of electing Trustees and until the election and qualification of his or her successor. Each officer holds office at the pleasure of the Board.
24
Table of Contents
ANGEL OAK STRATEGIC CREDIT FUND
Notice of Privacy Policy & Practices
Your privacy is important to us. We are committed to maintaining the confidentiality, integrity and security of your personal information. When you provide personal information, we believe that you should be aware of policies to protect the confidentiality of that information.
We collect the following nonpublic personal information about you:
| • | Information we receive from you on or in applications or other forms, correspondence, or conversations, including, but not limited to, your name, address, phone number, social security number, assets, income and date of birth; and |
| • | Information about your transactions with us, our affiliates, or others, including, but not limited to, your account number and balance, payments history, parties to transactions, cost basis information, and other financial information. |
We do not disclose any nonpublic personal information about our current or former shareholders to nonaffiliated third parties, except as permitted by law. For example, we are permitted by law to disclose all of the information we collect, as described above, to our transfer agent to process your transactions. Furthermore, we restrict access to your nonpublic personal information to those persons who require such information to provide products or services to you. We maintain physical, electronic, and procedural safeguards that comply with federal standards to guard your nonpublic personal information.
In the event that you hold shares of the Fund through a financial intermediary, including, but not limited to, a broker-dealer, bank, or trust company, the privacy policy of your financial intermediary would govern how your nonpublic personal information would be shared with nonaffiliated third parties.
25
Table of Contents
INVESTMENT ADVISER
Angel Oak Capital Advisors, LLC
One Buckhead Plaza
3060 Peachtree Road NW, Suite 500
Atlanta, GA 30305
DISTRIBUTOR
Quasar Distributors, LLC
777 East Wisconsin Avenue
Milwaukee, WI 53202
INDEPENDENT REGISTERED PUBLIC ACCOUNTING FIRM
Cohen & Company, Ltd.
1350 Euclid Avenue, Suite 800
Cleveland, OH 44115
LEGAL COUNSEL
Dechert LLP
1900 K Street NW
Washington, DC 20006
CUSTODIAN
U.S. Bank National Association
1555 North Rivercenter Drive, Suite 302
Milwaukee, WI 53202
ADMINISTRATOR, TRANSFER AGENT, AND FUND ACCOUNTANT
U.S Bancorp Fund Services, LLC
615 East Michigan Street
Milwaukee, WI 53202
This report is intended only for the information of shareholders or those who have received the Fund’s prospectus which contains information about the Fund’s management fee and expenses. Please read the prospectus carefully before investing.
Table of Contents
Item 2. Code of Ethics.
The registrant has adopted a code of ethics that applies to the registrant’s principal executive officer and principal financial officer. The registrant has not made any substantive amendments to its code of ethics during the period covered by this report. The registrant has not granted any waivers from any provisions of the code of ethics during the period covered by this report.
A copy of the registrant’s Code of Ethics is filed herewith.
Item 3. Audit Committee Financial Expert.
The registrant’s board of trustees has determined that there is at least one audit committee financial expert serving on its audit committee. Mr. Alvin Albe, Jr. is the “audit committee financial expert” and is considered to be “independent” as each term is defined in Item 3 of Form N-CSR.
Item 4. Principal Accountant Fees and Services.
The registrant has engaged its principal accountant to perform audit services, audit-related services, tax services and other services during the past two fiscal years. “Audit services” refer to performing an audit of the registrant’s annual financial statements or services that are normally provided by the accountant in connection with statutory and regulatory filings or engagements for those fiscal years. “Audit-related services” refer to the assurance and related services by the principal accountant that are reasonably related to the performance of the audit. “Tax services” refer to professional services rendered by the principal accountant for tax compliance, tax advice, and tax planning. The following table details the aggregate fees billed or expected to be billed for each of the last two fiscal years for audit fees, audit-related fees, tax fees and other fees by the principal accountant.
| FYE 01/31/2018 | ||||
Audit Fees | $ | 17,000 | ||
Audit-Related Fees | $ | 0 | ||
Tax Fees | $ | 3,000 | ||
All Other Fees | $ | 0 | ||
The audit committee has adopted pre-approval policies and procedures that require the audit committee to pre-approve all audit and non-audit services of the registrant, including services provided to any entity affiliated with the registrant.
The percentage of fees billed by Cohen & Company, Ltd. applicable to non-audit services pursuant to waiver of pre-approval requirement were as follows:
| FYE 01/31/2018 | ||||
Audit-Related Fees | 0 | % | ||
Tax Fees | 0 | % | ||
All Other Fees | 0 | % | ||
1
Table of Contents
All of the principal accountant’s hours spent on auditing the registrant’s financial statements were attributed to work performed by full-time permanent employees of the principal accountant. (If more than 50 percent of the accountant’s hours were spent to audit the registrant’s financial statements for the most recent fiscal year, state how many hours were attributed to work performed by persons other than the principal accountant’s full-time, permanent employees.)
The following table indicates the non-audit fees billed or expected to be billed by the registrant’s accountant for services to the registrant and to the registrant’s investment adviser (and any other controlling entity, etc.—not sub-adviser) for the last two years. The audit committee of the board of trustees/directors has considered whether the provision of non-audit services that were rendered to the registrant’s investment adviser is compatible with maintaining the principal accountant’s independence and has concluded that the provision of such non-audit services by the accountant has not compromised the accountant’s independence.
Non-Audit Related Fees | FYE 01/31/2018 | |||
Registrant | $ | 3,000 | ||
Registrant’s Investment Adviser | $ | 0 | ||
Item 5. Audit Committee of Listed Registrants.
The registrant is an issuer as defined in Rule 10A-3 under the Securities Exchange Act of 1934, (the “Act”) and has a separately-designated standing audit committee established in accordance with Section 3(a)(58)(A) of the Act. The independent members of the committee, consisting of all of the independent trustees of the Board, are as follows: Alvin Albe, Jr., Ira Cohen, and Keith Schappert.
Item 6. Investments.
Schedule of Investments is included as part of the report to shareholders filed under Item 1 of this Form.
Item 7. Disclosure of Proxy Voting Policies and Procedures for Closed-End Management Investment Companies.
ANGEL OAK FUNDS TRUST
ANGEL OAK STRATEGIC CREDIT FUND
ANGEL OAK FINANCIAL INSTITUTIONS TRUST
PROXY VOTING POLICIES AND PROCEDURES
The Boards of Trustees of Angel Oak Funds Trust, Angel Oak Strategic Credit Fund, and Angel Oak Financial Institutions Trust (each, a “Trust” and together, the “Trusts”) (the “Board”) recognize that the Board’s right to vote proxies for Trust holdings is an important responsibility and a significant Trust asset. The Board recognizes that the investment adviser of the Trusts and the Trusts’ respective series, if any (each, a “Fund” and together with the Trusts, the “Funds”), Angel Oak Capital Advisors, LLC (the “Adviser”), is in a better position to monitor corporate actions, analyze proxy proposals, make voting decisions and ensure that proxies are submitted in a timely fashion. The Board therefore delegates the authority to vote proxies to the Adviser, subject to the supervision of the Board.
2
Table of Contents
The Board must approve the Adviser’s proxy voting policies and procedures. The Board will monitor the implementation of these policies to ensure that the Adviser’s voting decisions:
| • | are consistent with the Adviser’s fiduciary duty to the Trusts and their shareholders; |
| • | seek to maximize shareholder return and the value of Trust investments; |
| • | promote sound corporate governance; and |
| • | are consistent with each Fund’s investment objective and policies. |
In the event of a conflict between the interests of the Adviser and the Trusts, the Adviser’s policies provide that the conflict may be disclosed to the Board or its delegate, who shall provide direction to vote the proxies. The Board has delegated this authority to the disinterested directors, and the proxy voting direction in such a case shall be determined by a majority of the disinterested directors.
Each Trust will disclose in its annual and semi-annual reports to shareholders that a description (or copy) of the Trust’s proxy voting policies and procedures is available without charge, upon request, by calling toll-free 1-855-751-4324, and by accessing the Securities and Exchange Commission’s (“SEC”) website at http://www.sec.gov. Each Trust will send a description of its proxy voting policies and procedures within three business days of receipt of a request.
Each Trust will file its complete proxy voting record with the SEC on Form N-PX on an annual basis, by no later than August 31 of each year. Each Trust also will disclose in its SAI and annual and semi-annual reports to shareholders that its proxy voting record is available without charge, upon request, by calling toll-free 1-855-751-4324, and by accessing the SEC’s website. Each Trust must send the information disclosed in the Trust’s most recently filed Form N-PX within three business days of receipt of a request.
The Angel Oak Funds Trust will also describe its proxy voting policies and procedures in its Statement of Additional Information (“SAI”) in accordance with SEC requirements.
Item 8. Portfolio Managers of Closed-End Management Investment Companies.
(a)(1) The following provides biographical information about the individuals who are primarily responsible for the day-to-day management of the registrant’s portfolio (“Portfolio Managers”) as of the date of this filing:
Berkin Kologlu is a Managing Director of the Adviser and a Portfolio Manager of the Fund. Mr. Kologlu has over 15 years’ experience in fixed income products and focuses on building and managing strategies within the Collateralized Loan Obligation (CLO) market. He spent the previous six years as an Executive Director at UBS, covering structured products and client solutions. Prior to UBS, Mr. Kologlu worked at Bank of America, where he focused on the structuring and marketing of CLOs and synthetic CDOs backed by corporate credit. Before Bank of America, Mr. Kologlu worked in Turkey as a commercial banker, where he was responsible for lending to large cap corporations. He received his MBA from Duke University’s Fuqua School of Business and his B.S. in Civil Engineering from Bogazici University in Istanbul, Turkey.
3
Table of Contents
Matthew R. Kennedy, CFA is a Senior Portfolio Manager of the Adviser and a Portfolio Manager of the Fund. Mr. Kennedy has over 20 years of capital markets and asset management experience. Prior to joining the Adviser in 2016, Mr. Kennedy spent seven years as a portfolio manager with Rainier Investment Management, LLC, where he served as Director of Fixed Income Management and was responsible for managing the Predecessor High Yield Fund among other clients. Mr. Kennedy began his investment career in 1995 at GE Financial Assurance, where he served as a Senior Analyst and made investment recommendations for investment grade, high yield, and private placement portfolios. From 1991 through 1994, he was a CPA and Auditor at Deloitte & Touche. Mr. Kennedy is a member of the CFA Institute and the Seattle Society of Financial Analysts. He holds the Chartered Financial Analyst designation. Mr. Kennedy received his Bachelor of Arts degree in Business Administration, with specializations in Finance and Accounting, from Washington State University.
Sreeniwas (Sreeni) V. Prabhu is Chief Investment Officer of the Adviser and a Portfolio Manager of the Fund. Prior to co-founding the Adviser in 2009, Mr. Prabhu was the Chief Investment Officer of the $25 billion investment portfolio at Washington Mutual Bank for three years and was also part of the macro asset strategy team at the bank. Prior to joining Washington Mutual Bank, Mr. Prabhu worked for six years at SunTrust Bank in Atlanta, where he was responsible for investment strategies and served as head portfolio manager for the $3 billion commercial mortgage backed securities portfolio. He began his career at SunTrust in 1998 as a bank analyst focused on asset/liability management and liquidity strategies. Mr. Prabhu holds a B.B.A. in Economics from Georgia College and State University and an M.B.A. in Finance from Georgia State University.
Colin McBurnette is a Portfolio Manager of the Adviser and a Portfolio Manager of the Fund. Mr. McBurnette focuses on security and portfolio analytics. Prior to joining the Adviser in 2012, Mr. McBurnette worked for Prodigus Capital Management, where he served on the investment committee and ran the analytics group. He was responsible for acquisition and management of their distressed debt portfolio, as well as the development of their proprietary financial technology platform. Previously, Mr. McBurnette worked in the Real Estate Capital Markets group for Wachovia Bank and Wells Fargo where he focused on risk management for their commercial real estate REPO lines. Mr. McBurnette holds a B.B.A. in Finance and in Real Estate from the University of Georgia.
(a)(2) The following provides information on other accounts managed on a day-to-day basis by the Portfolio Managers listed above as of January 31, 2018:
Berkin Kologlu
| Number and Assets of Other Accounts | Number and Assets of Accounts for which Advisory Fee is Performance Based | |||||||||||||||||||||
Registered Investment Companies | Other Pooled Investment Vehicles | Other Accounts | Registered Investment Companies | Other Pooled Investment Vehicles | Other Accounts | |||||||||||||||||
| 4 | 3 | 4 | 0 | 2 | 0 | |||||||||||||||||
| $6,477,617,494 | $ | 1,247,527,092 | $ | 443,654,178 | $ | 0 | $ | 453,350,957 | $ | 0 | ||||||||||||
4
Table of Contents
Sreeniwas (Sreeni) V. Prabhu
| Number and Assets of Other Accounts | Number and Assets of Accounts for which Advisory Fee is Performance Based | |||||||||||||||||||||
Registered Investment Companies | Other Pooled Investment Vehicles | Other Accounts | Registered Investment Companies | Other Pooled Investment Vehicles | Other Accounts | |||||||||||||||||
| 5 | 3 | 0 | 0 | 2 | 0 | |||||||||||||||||
| $6,608,854,455 | $ | 1,247,527,092 | $ | 0 | $ | 0 | $ | 453,350,957 | $ | 0 | ||||||||||||
Matthew R. Kennedy
| Number and Assets of Other Accounts | Number and Assets of Accounts for which Advisory Fee is Performance Based | |||||||||||||||||||||
Registered Investment Companies | Other Pooled Investment Vehicles | Other Accounts | Registered Investment Companies | Other Pooled Investment Vehicles | Other Accounts | |||||||||||||||||
| 1 | 0 | 0 | 0 | 0 | 0 | |||||||||||||||||
| $52,638,980 | $ | 0 | $ | 0 | $ | 0 | $ | 0 | $ | 0 | ||||||||||||
Colin McBurnette
| Number and Assets of Other Accounts | Number and Assets of Accounts for which Advisory Fee is Performance Based | |||||||||||||||||||
Registered Investment Companies | Other Pooled Investment Vehicles | Other Accounts | Registered Investment Companies | Other Pooled Investment Vehicles | Other Accounts | |||||||||||||||
| 3 | 1 | 5 | 0 | 1 | 0 | |||||||||||||||
| $6,424,978,513 | $ | 146,076,631 | $ | 3,675,409 | $ | 0 | $ | 146,076,631 | $ | 0 | ||||||||||
Potential Conflicts of Interest: Actual or apparent conflicts of interest may arise when a portfolio manager has day-to-day management responsibilities with respect to more than one fund or other account. More specifically, portfolio managers who manage multiple funds and/or other accounts may experience the following potential conflicts: The management of multiple accounts may result in a portfolio manager devoting unequal time and attention to the management of each account. Investment decisions for client accounts are also made consistent with a client’s individual investment objective and needs. Accordingly, there may be circumstances when purchases or sales of securities for one or more client accounts will have an adverse effect on other clients. The Adviser may seek to manage such competing interests by: (1) having a portfolio manager focus on a particular investment discipline; (2) utilizing a quantitative model in managing accounts; and/or (3) reviewing performance differences between similarly managed accounts on a periodic basis to ensure that any such differences are attributable by differences in investment guidelines and timing of cash flows. The Adviser also maintains a Code of Ethics to establish standards and procedures for the detection and prevention of activities by which persons having knowledge of the investments and investment intentions of the Fund may abuse their fiduciary duties to the Fund.
5
Table of Contents
If a portfolio manager identifies a limited investment opportunity that may be suitable for more than one client, the Fund may not be able to take full advantage of that opportunity due to an allocation of filled purchase or sale orders across all eligible accounts. To deal with these situations, the Adviser has adopted procedures for allocating portfolio transactions across multiple accounts.
With respect to securities transactions for clients, the Adviser determines which broker to use to execute each order. However, the Adviser may direct securities transactions to a particular broker/dealer for various reasons including receipt of research or participation interests in initial public offerings that may or may not benefit the Fund. To deal with these situations, the Adviser has adopted procedures to help ensure best execution of all client transactions.
Finally, the appearance of a conflict of interest may arise where the Adviser has an incentive, such as a performance-based management fee, which relates to the management of one but not all accounts for which a portfolio manager has day-to-day management responsibilities.
(a)(3) The following describes how the portfolio managers are compensated as of January 31, 2018:
The Portfolio Managers receive an annual base salary from the Adviser. Mr. Prabhu and Mr. Friedlander has an ownership interest in the Adviser and may receive distributions from the Adviser, which may come from profits generated by the Adviser. Each of the Portfolio Managers is eligible to receive a discretionary bonus, which is based on: profitability of the Adviser; assets under management; investment performance of managed accounts; compliance with the Adviser’s policies and procedures; contribution to the Adviser’s goals and objectives; anticipated compensation levels of competitor firms; effective research; role and responsibilities; client satisfaction; asset retention; teamwork; leadership; and risk management.
(a)(4) The following provides information about the dollar range of equity securities in the registrant beneficially owned by the Portfolio Managers as of January 31, 2018:
Portfolio Manager | Dollar Range of Equity Securities in the Fund | |
| Berkin Kologlu | none | |
| Sreeni V. Prabhu | none | |
| Matthew R. Kennedy | none | |
| Colin McBurnette | none |
Item 9. Purchases of Equity Securities by Closed-End Management Investment Company and Affiliated Purchasers.
There were no purchases made by or on behalf of the Registrant or any “affiliated purchaser,” as defined in Rule 10b-18(a)(3) under the Securities Exchange Act of 1934, as amended, of shares of the Registrant’s equity securities that are registered by the Registrant pursuant to Section 12 of the Exchange Act made in the period covered by this report.
6
Table of Contents
Item 10. Submission of Matters to a Vote of Security Holders.
There have been no material changes since the Fund’s inception to the procedures by which shareholders may recommend nominees to the registrant’s board of trustees.
Item 11. Controls and Procedures.
| (a) | The Registrant’s Principal Executive Officer and Principal Financial Officer have reviewed the Registrant’s disclosure controls and procedures (as defined in Rule 30a-3(c) under the Investment Company Act of 1940 (the “Act”)) as of a date within 90 days of the filing of this report, as required by Rule 30a-3(b) under the Act and Rules 13a-15(b) or 15d-15(b) under the Securities Exchange Act of 1934. Based on their review, such officers have concluded that the disclosure controls and procedures are effective in ensuring that information required to be disclosed in this report is appropriately recorded, processed, summarized and reported and made known to them by others within the Registrant and by the Registrant’s service provider. |
| (b) | There were no changes in the Registrant’s internal control over financial reporting (as defined in Rule 30a-3(d) under the Act) that occurred during the second fiscal quarter of the period covered by this report that have materially affected, or are reasonably likely to materially affect, the Registrant’s internal control over financial reporting. |
Item 12. Disclosure of Securities Lending Activities for Closed-End Management Investment Companies
The registrant did not engage in securities lending activities during the fiscal period reported on this Form N-CSR.
Item 13. Exhibits.
| (a) | (1) Any code of ethics or amendment thereto, that is the subject of the disclosure required by Item 2, to the extent that the registrant intends to satisfy Item 2 requirements through filing an exhibit. Filed herewith |
(2) A separate certification for each principal executive officer and principal financial officer pursuant to Section 302 of the Sarbanes-Oxley Act of 2002. Filed herewith.
(3) Any written solicitation to purchase securities under Rule 23c-1 under the Act sent or given during the period covered by the report by or on behalf of the registrant to 10 or more persons. Not Applicable.
(4) Change in the registrant’s independent public accountant. There was no change in the registrant’s independent public accountant for the period covered by this report.
| (b) | Certifications pursuant to Section 906 of the Sarbanes-Oxley Act of 2002. Filed herewith. |
7
Table of Contents
SIGNATURES
Pursuant to the requirements of the Securities Exchange Act of 1934 and the Investment Company Act of 1940, the registrant has duly caused this report to be signed on its behalf by the undersigned, thereunto duly authorized.
(Registrant) | Angel Oak Strategic Credit Fund | |
| By (Signature and Title)* | /s/ Dory S. Black | |
| Dory S. Black, President (Principal Executive Officer) | ||
Date April 4, 2018 | ||
Pursuant to the requirements of the Securities Exchange Act of 1934 and the Investment Company Act of 1940, this report has been signed below by the following persons on behalf of the registrant and in the capacities and on the dates indicated.
| By (Signature and Title)* | /s/ Dory S. Black | |
| Dory S. Black, President (Principal Executive Officer) | ||
Date April 4, 2018 | ||
| By (Signature and Title)* | /s/ Daniel Fazioli | |
| Daniel Fazioli, Treasurer (Principal Financial Officer) | ||
Date April 4, 2018 | ||
| * | Print the name and title of each signing officer under his or her signature. |
8