Table of Contents
As filed with the U.S. Securities and Exchange Commission on 10/02/2018
UNITED STATES
SECURITIES AND EXCHANGE COMMISSION
Washington, D.C. 20549
FORM N-CSR
CERTIFIED SHAREHOLDER REPORT OF REGISTERED
MANAGEMENT INVESTMENT COMPANIES
Investment Company Act file number 811-23289
Angel Oak Strategic Credit Fund
(Exact name of registrant as specified in charter)
One Buckhead Plaza
3060 Peachtree Rd. NW, Suite 500
Atlanta, Georgia 30305
(Address of principal executive offices) (Zip code)
Dory S. Black, Esq., President
One Buckhead Plaza
3060 Peachtree Rd. NW, Suite 500
Atlanta, Georgia 30305
(Name and address of agent for service)
Copy to:
Douglas P. Dick
Stephen T. Cohen
Dechert LLP
1900 K Street NW
Washington, DC 20006
404-953-4900
Registrant’s telephone number, including area code
Date of fiscal year end: January 31
Date of reporting period: July 31, 2018
Table of Contents
Item 1. Reports to Stockholders.
Table of Contents
SEMI-ANNUAL REPORT
July 31, 2018

Angel Oak Strategic Credit Fund
Angel Oak Capital Advisors, LLC
One Buckhead Plaza
3060 Peachtree Road NW
Suite 500
Atlanta, GA 30305
(404) 953-4900
Table of Contents
| 1 | ||
| 2 | ||
| 3 | ||
| 4 | ||
| 6 | ||
| 7 | ||
| 8 | ||
| 9 | ||
| 10 | ||
| 18 | ||
Table of Contents
Investment Results – (Unaudited)
Angel Oak Strategic Credit Fund
Total Return Based on a $50,000 Investment
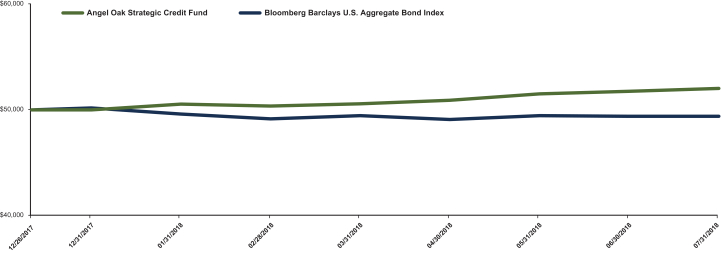
The chart above assumes an initial investment of $50,000 made on December 26, 2017 (commencement of operations). Returns shown include the reinvestment of all dividends. Returns shown do not reflect the deduction of taxes that a shareholder would pay on Fund distributions. In the absence of fee waivers and reimbursements, when they are necessary to keep expenses at the expense cap, total return would be reduced. Past performance is not predictive of future performance. Investment return and principal value will fluctuate so that your shares, when repurchased, may be worth more or less than the original cost. Index returns do not reflect the effects of fees or expenses. It is not possible to invest directly in an index.
Cumulative Returns(1)
(For the period ended July 31, 2018)
| Six Months | Since Inception(2) | |||||||
Angel Oak Strategic Credit Fund | 2.90 | % | 4.04 | % | ||||
Bloomberg Barclays U.S. Aggregate Bond Index(3) | -0.45 | % | -1.22 | % | ||||
(1) Return figures reflect any change in price per share and assume the reinvestment of all distributions.
(2) Inception date is December 26, 2017.
(3) The Bloomberg Barclays U.S. Aggregate Bond Index measures the performance of the investment-grade, fixed-rate bond market, including government and credit securities, agency pass-through securities, asset-backed securities and commercial mortgage-backed securities. Performance figures include the change in value of the bonds in the index and the reinvestment of interest. The index return does not reflect expenses, which have been deducted from the Fund’s return. You cannot invest directly in an Index; however, an individual can invest in exchange-traded funds or other investments vehicles that attempt to track the performance of a benchmark index.
1
Table of Contents
Summary of Fund Expenses – (Unaudited)
As a shareholder of the Fund, you incur ongoing costs, including management fees and other expenses of the Fund. This Example is intended to help you understand your ongoing costs (in dollars) of investing in the Fund and to compare these costs with the ongoing costs of investing in other mutual funds. The Example is based on an investment of $1,000 invested at the beginning of the period, and held for the entire period from February 1, 2018 to July 31, 2018.
Actual Expenses
The first line of the table below provides information about actual account values and actual expenses. You may use the information in this, together with the amount you invested, to estimate the expenses that you paid over the period. Simply divide your account value by $1,000 (for example, an $8,600 account value divided by $1,000 = $8.60), then multiply the result by the number in the first line under the heading entitled “Expenses Paid During the Period” to estimate the expenses you paid on your account during this period.
Hypothetical Example for Comparison Purposes
The second line of the table below provides information about hypothetical account value and hypothetical expenses based on the Fund’s actual expense ratio and an assumed rate of return of 5% per year before expenses, which is not the Fund’s actual return. The hypothetical account value and expenses may not be used to estimate the actual ending account balance or expenses you paid for the period. You may use this information to compare the ongoing costs of investing in the Fund and other funds. To do so, compare this 5% hypothetical example with the 5% hypothetical examples that appear in the shareholder reports of other funds.
Please note that the expenses shown in the table are meant to highlight your ongoing costs only and do not reflect any transactional costs. Therefore, the second line of the table below is useful in comparing ongoing costs only and will not help you determine the relative costs of owning different funds. In addition, if these transactional costs were included, your costs would have been higher.
| Angel Oak Strategic Credit Fund | Beginning Account Value, February 1, 2018 | Ending Account Value, July 31, 2018 | Expenses Paid During Period(1) | Annualized Expense Ratio | ||||
| Actual | $1,000.00 | $1,029.00 | $3.77 | 0.75% | ||||
| Hypothetical(2) | $1,000.00 | $1,021.08 | $3.76 | 0.75% |
(1) Expenses are equal to the Fund’s annualized expense ratio, multiplied by the average account value over the period, multiplied by the number of days (181) in the most recent six month period and divided by the number of days in the most recent twelve month period (365). The annualized expense ratios reflects fee waiver and expense limitation arrangements, including interest expense, in effect during the period. The “Financial Highlights” tables in the Fund’s financial statements, included in the report, also show the gross expense ratios, without such reimbursements.
(2) Hypothetical assumes 5% annual return before expenses.
2
Table of Contents
Portfolio Holdings – (Unaudited)
The investment objective of Angel Oak Strategic Credit Fund is to seek total return.
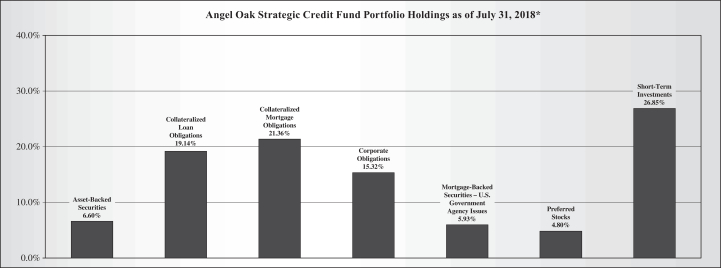
* As a percentage of total investments.
3
Table of Contents
Angel Oak Strategic Credit Fund
Schedule of Investments
July 31, 2018 (Unaudited)
| Principal Amount | Value | |||||||
Asset-Backed Securities – 6.55% |
| |||||||
GSAA Home Equity Trust, Series 2006-15, Class AF6, 5.876%, 9/25/2036 (a) | $ | 53,604 | $ | 27,481 | ||||
GSAA Home Equity Trust, Series 2006-18, Class AF3A, 5.772%, 11/25/2036 (b) | 179,738 | 98,824 | ||||||
Mosaic Solar Loan Trust, Series 2018-1A, Class C, 0.000%, 6/22/2043 (c)(d) | 350,000 | 297,942 | ||||||
|
| |||||||
TOTAL ASSET-BACKED SECURITIES – |
| 424,247 | ||||||
|
| |||||||
Collateralized Loan Obligations – 19.01% |
| |||||||
Ares XLIV CLO Ltd., Series 2017-44A, Class E, | 500,000 | 498,539 | ||||||
MMCF CLO LLC, Series 2017-1A, Class D, | 100,000 | 99,129 | ||||||
Monroe Capital MML CLO VI Ltd., Series 2018-1A, Class E, 9.025% | 250,000 | 245,554 | ||||||
OZLM VI Ltd., Series 2014-6A, Class ES, 10.976% | 300,000 | 293,390 | ||||||
York CLO Ltd., Series 2015-1A, Class F, 9.597% | 100,000 | 94,147 | ||||||
| �� |
|
| ||||||
TOTAL COLLATERALIZED LOAN OBLIGATIONS – |
| 1,230,759 | ||||||
|
| |||||||
Collateralized Mortgage Obligations – 21.21% |
| |||||||
Alternative Loan Trust, Series 2007-20, Class A1, 2.564% (1 Month LIBOR USD + 0.500%), 8/25/2047 (e) | 360,904 | 240,703 | ||||||
American Home Mortgage Investment Trust, Series 2006-2, Class 1A2, 2.384% (1 Month LIBOR USD + 0.320%), 6/25/2046 (e) | 459,988 | 208,492 | ||||||
Deutsche Alt-A Securities Mortgage Loan Trust, Series 2007-1, Class 1A4B, 2.394% (1 Month LIBOR USD + 0.330%), 8/25/2037 (e) | 105,036 | 85,329 | ||||||
JP Morgan Chase Commercial Mortgage Securities Trust, Series 2018-ASH8, Class F, 6.072% (1 Month LIBOR USD + 4.000%), 2/15/2035 (c)(e) | 100,000 | 100,853 | ||||||
RBSSP Resecuritization Trust, Series 2009-10, Class 2A2, 2.000%, 1/26/2037 (b)(c) | 294,590 | 199,594 | ||||||
Residential Accredit Loans, Inc. Trust, Series 2005-QS12, Class A4, 5.500%, 8/25/2035 | 100,685 | 97,147 | ||||||
Residential Asset Securitization Trust, Series 2006-A8, Class 2A7, 6.500%, 8/25/2036 | 325,829 | 199,245 | ||||||
Velocity Commercial Capital Loan Trust, Series 2018-1, Class M6, 7.260%, 4/25/2048 (c) | 242,814 | 241,887 | ||||||
|
| |||||||
TOTAL COLLATERALIZED MORTGAGE OBLIGATIONS – |
| 1,373,250 | ||||||
|
| |||||||
Corporate Obligations – 15.22% |
| |||||||
Financial – 15.22% |
| |||||||
Fidelity & Guaranty Life Holdings, Inc., 5.500%, 5/1/2025 (c) | 100,000 | 97,375 | ||||||
Hunt Cos., Inc., 6.250%, 2/15/2026 (c) | 200,000 | 186,000 | ||||||
Trinitas Capital Management LLC, 7.750%, 6/15/2023 | 300,000 | 297,000 | ||||||
Wand Merger Corp., 8.125%, 7/15/2023 (c) | 100,000 | 104,260 | ||||||
WT Holdings, Inc., 7.000%, 4/30/2023 (c) | 300,000 | 300,750 | ||||||
|
| |||||||
TOTAL CORPORATE OBLIGATIONS – |
| 985,385 | ||||||
|
| |||||||
See accompanying notes which are an integral part of these financial statements.
4
Table of Contents
Angel Oak Strategic Credit Fund
Schedule of Investments – (continued)
July 31, 2018 (Unaudited)
| Principal Amount | Value | |||||||
Mortgage Backed Securities – U.S. Government Agency Issues – 5.89% |
| |||||||
Federal Home Loan Mortgage Corp., Series 2017-HQA2, Class M2, 4.714% (1 Month LIBOR USD + 2.650%), 12/26/2029 (e) | 100,000 | $ | 104,761 | |||||
Federal Home Loan Mortgage Corp., Series 2017-HQA3, Class M2, 4.414% (1 Month LIBOR USD + 2.350%), 4/25/2030 (e) | 100,000 | 102,909 | ||||||
Federal Home Loan Mortgage Corp., Series 2018-HQA1, Class B1, 6.414% (1 Month LIBOR USD + 4.350%), 9/25/2030 (e) | 170,000 | 173,477 | ||||||
|
| |||||||
TOTAL MORTGAGE BACKED SECURITIES – U.S. GOVERNMENT AGENCY ISSUES – |
| 381,147 | ||||||
|
| |||||||
| Shares | ||||||||
Preferred Stocks – 4.76% | ||||||||
Real Estate Investment Trust – 4.76% | ||||||||
Sutherland Asset Management Corp., 6.500%, 4/30/2021 | 12,000 | 308,400 | ||||||
|
| |||||||
TOTAL PREFERRED STOCKS |
| 308,400 | ||||||
|
| |||||||
Short-Term Investments – 26.66% |
| |||||||
Money Market Funds – 26.66% |
| |||||||
Fidelity Institutional Money Market Government Portfolio, Institutional Class, 1.800% (g) | 1,726,370 | 1,726,370 | ||||||
|
| |||||||
TOTAL SHORT-TERM INVESTMENTS |
| 1,726,370 | ||||||
|
| |||||||
TOTAL INVESTMENTS – 99.30% |
| 6,429,558 | ||||||
|
| |||||||
Other Assets in Excess of Liabilities – 0.70% |
| 45,206 | ||||||
|
| |||||||
NET ASSETS – 100.00% |
| $ | 6,474,764 | |||||
|
| |||||||
| (a) | Step-up bond that pays an initial coupon rate for the first period and then a higher coupon rate for the following periods. Rate disclosed is the rate in effect as of July 31, 2018. |
| (b) | Variable Rate Security. The coupon is based on an underlying pool of assets. Rate disclosed is the rate in effect as of July 31, 2018. |
| (c) | Security exempt from registration under Rule 144A or Section 4(a)(2) of the Securities Act of 1933. The security may be resold in transactions exempt from registration, normally to qualified institutional buyers. These securities are determined to be liquid by the Adviser, under the procedures established by the Fund’s Board of Trustees, unless otherwise denoted. At July 31, 2018, the value of these securities amounted to $2,759,420 or 42.62% of net assets. |
| (d) | Principal Only Security. |
| (e) | Variable or Floating Rate Security based on a reference index and spread. Rate disclosed is the rate in effect as of July 31, 2018. |
| (f) | Illiquid Security. At July 31, 2018, the value of these securities amounted to $438,830 or 6.78% of net assets. |
| (g) | Rate disclosed is the seven day yield as of July 31, 2018. |
See accompanying notes which are an integral part of these financial statements.
5
Table of Contents
Statement of Assets and Liabilities
July 31, 2018 (Unaudited)
| Strategic Credit Fund | ||||
Assets | ||||
Investments in securities at fair value (cost $6,462,178) | $ | 6,429,558 | ||
Due from Adviser | 21,483 | |||
Deposit at broker for futures | 8,764 | |||
Interest receivable | 39,287 | |||
|
| |||
Total Assets | 6,499,092 | |||
|
| |||
Liabilities | ||||
Payable for distributions to shareholders | 2,080 | |||
Payable to administrator, fund accountant, and transfer agent | 13,377 | |||
Payable to custodian | 1,413 | |||
Payable to Trustee | 2,265 | |||
Other accrued expenses | 5,193 | |||
|
| |||
Total Liabilities | 24,328 | |||
|
| |||
Net Assets | $ | 6,474,764 | ||
|
| |||
Net Assets consist of: | ||||
Paid-in capital | $ | 6,409,547 | ||
Accumulated undistributed net investment income | 79,018 | |||
Accumulated net realized gain from investment transactions | 18,819 | |||
Net unrealized depreciation on investments | (32,620 | ) | ||
|
| |||
Net Assets | $ | 6,474,764 | ||
|
| |||
Shares outstanding (unlimited number of shares authorized, no par value) | 255,571 | |||
|
| |||
Net asset value (“NAV”) and offering price per share | $ | 25.33 | ||
|
| |||
See accompanying notes which are an integral part of these financial statements.
6
Table of Contents
For the Period Ended July 31, 2018 (Unaudited)
| Strategic Credit Fund | ||||
Investment Income | ||||
Interest | $ | 224,740 | ||
Dividends | 5,037 | |||
|
| |||
Total Investment Income | 229,777 | |||
|
| |||
Expenses | ||||
Investment Advisory | 32,928 | |||
Transfer agent | 20,754 | |||
Administration | 18,555 | |||
Trustee | 16,402 | |||
Audit | 14,708 | |||
Fund accounting | 13,931 | |||
Legal | 12,571 | |||
Distribution | 8,995 | |||
Compliance | 8,526 | |||
Registration | 5,394 | |||
Printing | 4,313 | |||
Custodian | 3,232 | |||
Insurance | 84 | |||
Miscellaneous | 420 | |||
|
| |||
Total Expenses | 160,813 | |||
|
| |||
Fees voluntarily waived by Adviser (See Note 3) | (141,056 | ) | ||
|
| |||
Net operating expenses | 19,757 | |||
|
| |||
Net Investment Income | 210,020 | |||
|
| |||
Realized and Unrealized Gain (Loss) on Investments | ||||
Net realized gain on investments | 7,800 | |||
Net realized gain on futures contracts | 2,743 | |||
Net change in unrealized depreciation on investments | (38,392 | ) | ||
|
| |||
Net realized and unrealized gain (loss) on investments | (27,849 | ) | ||
|
| |||
Net increase in net assets resulting from operations | $ | 182,171 | ||
|
| |||
See accompanying notes which are an integral part of these financial statements.
7
Table of Contents
Angel Oak Strategic Credit Fund
Statement of Changes in Net Assets
| For the Period Ended July 31, 2018 (Unaudited) | For the Period Ended January 31, 2018 (a) | |||||||
Increase (Decrease) in Net Assets due to: | ||||||||
Operations | ||||||||
Net investment income | $ | 210,020 | $ | 15,031 | ||||
Net realized gain on investment transactions and futures contracts | 10,543 | 8,276 | ||||||
Net change in unrealized appreciation (depreciation) on investments | (38,392 | ) | 5,772 | |||||
|
|
|
| |||||
Net increase in net assets resulting from operations | 182,171 | 29,079 | ||||||
|
|
|
| |||||
Distributions | ||||||||
From net investment income | (141,379 | ) | (4,654 | ) | ||||
|
|
|
| |||||
Total Distributions | (141,379 | ) | (4,654 | ) | ||||
|
|
|
| |||||
Capital Transactions | ||||||||
Proceeds from shares sold | 3,508,627 | 2,661,949 | ||||||
Reinvestment of distributions | 134,317 | 4,654 | ||||||
|
|
|
| |||||
Net increase in net assets resulting from capital transactions | 3,642,944 | 2,666,603 | ||||||
|
|
|
| |||||
Total Increase in Net Assets | 3,683,736 | 2,691,028 | ||||||
|
|
|
| |||||
Net Assets | ||||||||
Beginning of period | 2,791,028 | 100,000 | ||||||
|
|
|
| |||||
End of period | $ | 6,474,764 | $ | 2,791,028 | ||||
|
|
|
| |||||
Accumulated undistributed net investment income included in net assets at end of period | $ | 79,018 | $ | 10,377 | ||||
|
|
|
| |||||
Share Transactions | ||||||||
Shares sold | 139,637 | 106,439 | ||||||
Shares issued in reinvestment of distributions | 5,310 | 185 | ||||||
|
|
|
| |||||
Net increase in share transactions | 144,947 | 106,624 | ||||||
|
|
|
| |||||
| (a) | Fund commenced operations on December 26, 2017. |
See accompanying notes which are an integral part of these financial statements.
8
Table of Contents
Angel Oak Strategic Credit Fund
Financial Highlights
(For a share outstanding during each period)
| For the Period Ended July 31, 2018 (Unaudited) | For the Period Ended January 31, 2018 (a) | |||||||
Selected Per Share Data: | ||||||||
Net asset value, beginning of period | $ | 25.23 | $ | 25.00 | ||||
|
|
|
| |||||
Income from investment operations: | ||||||||
Net investment income | 0.84 | 0.14 | ||||||
Net realized and unrealized gain (loss) on investments | (0.12 | ) | 0.14 | |||||
|
|
|
| |||||
Total from investment operations | 0.72 | 0.28 | ||||||
|
|
|
| |||||
Less distributions to shareholders: | ||||||||
From net investment income | (0.62 | ) | (0.05 | ) | ||||
|
|
|
| |||||
Total Distributions | (0.62 | ) | (0.05 | ) | ||||
|
|
|
| |||||
Net asset value, end of period | $ | 25.33 | $ | 25.23 | ||||
|
|
|
| |||||
Total Return | 2.90 | % (b) | 1.10 | % (b) | ||||
Ratios and Supplemental Data: | ||||||||
Net assets, end of period (000’s omitted) | $ | 6,475 | $ | 2,791 | ||||
Ratio of expenses to average net assets after waiver and reimbursement (c) | 0.75 | % (d) | 0.75 | % (d) | ||||
Ratio of net investment income (loss) to average net assets before waiver and reimbursement | 2.62 | % (d) | -16.03 | % (d) | ||||
Ratio of net investment income to average net assets after waiver and reimbursement | 7.97 | % (d) | 5.85 | % (d) | ||||
Portfolio turnover rate | 47.20 | % (b) | 69.68 | % (b) | ||||
(a) Fund commenced operations on December 26, 2017. | ||||||||
(b) Not Annualized. | ||||||||
(c) Ratio of expenses to average net assets before waiver and reimbursement | 6.10 | % (d) | 22.63 | % (d) | ||||
(d) Annualized. | ||||||||
See accompanying notes which are an integral part of these financial statements.
9
Table of Contents
Angel Oak Strategic Credit Fund
Notes to the Financial Statements (Unaudited)
July 31, 2018
NOTE 1. ORGANIZATION
Angel Oak Strategic Credit Fund (the “Trust” or the “Fund”), a Delaware statutory trust organized on August 18, 2017, is a continuously-offered diversified, closed-end management investment company issuing shares, as defined in the Investment Company Act of 1940 (the “1940 Act”), as amended. The Trust’s sole series is the Fund. The Fund was effective on December 1, 2017, and commenced operations on December 26, 2017. The Fund offers one class of shares to investors with no front-end or back-end sales charges and no 12b-1 fees. The Trust’s Agreement and Declaration of Trust authorizes the issuance of an unlimited number of shares. The investment objective of the Fund is to seek total return.
The Fund operates as an “interval fund” pursuant to Rule 23c-3 under the 1940 Act. The Board of Trustees (“Board”) of the Fund has adopted a fundamental policy that the Fund will make quarterly repurchase offers pursuant to Rule 23c-3 under the 1940 Act, as such rule may be amended from time to time, for between 5% and 25% of the shares of beneficial interest (“Shares”) outstanding at net asset value (“NAV”), unless suspended or postponed in accordance with regulatory requirements, and each repurchase pricing shall occur no later than the 14th day after the Repurchase Request Deadline (as defined in the Fund’s Prospectus, or the next business day if the 14th day is not a business day. The Fund will not be required to repurchase Shares at a shareholder’s option nor will Shares be exchangeable for units, interests or shares of any investment of the Fund. In connection with each repurchase offer, it is possible that the Fund may offer to repurchase only the minimum amount of 5% of its outstanding Shares. It is also possible that a repurchase offer may be oversubscribed, with the result that shareholders may only be able to have a portion of their Shares repurchased. The Fund does not currently intend to list its Shares for trading on any national securities exchange. The Fund does not expect any secondary market to develop for the Shares in the foreseeable future. The Shares are, therefore, not readily marketable. Even though the Fund will make quarterly repurchase offers to repurchase a portion of the Shares to try to provide liquidity to shareholders, investors should consider the Shares to be illiquid. The schedule requires the Fund to make repurchase offers every three months. Quarterly repurchases occur in the month of March, June, September, and December.
NOTE 2. SIGNIFICANT ACCOUNTING POLICIES
The following is a summary of significant accounting policies consistently followed by the Fund in the preparation of its financial statements in accordance with the generally accepted accounting principles in the United States of America (“GAAP”). The Fund follows the investment company accounting and reporting guidance of the Financial Accounting Standards Board (“FASB”) Accounting Codification Topic 946 “Financial Services-Investment Companies.”
Securities Valuation and Fair Value Measurements – The Fund has adopted authoritative fair valuation accounting standards which establish an authoritative definition of fair value and set out a hierarchy for measuring fair value. These standards require additional disclosures about the various inputs and valuation techniques used to develop the measurements of fair value and a discussion in changes in valuation techniques and related inputs, if any, during the period. In addition, these standards require expanded disclosure for each major category of assets. These inputs are summarized in the three broad levels listed below:
| • | Level 1 – Quoted prices in active markets for identical securities |
| • | Level 2 – other significant observable inputs (including, but not limited to, quoted prices for similar securities, interest rates, prepayment speeds, credit risk, etc.) |
| • | Level 3 – significant unobservable inputs (including the Fund’s own assumptions in determining fair value of investments based on the best information available) |
The inputs or methodology used for valuing securities are not an indication of the risks associated with investing in those securities.
Investments in registered open-end management investment companies, including money market funds, will be valued based upon the NAV of such investments and are categorized as Level 1 of the fair value hierarchy.
Fair values for long-term debt securities, including asset-backed securities, collateralized loan obligations, collateralized mortgage obligations, corporate obligations and mortgage-backed securities are normally determined on the basis of valuations provided by independent pricing services. Vendors typically value such securities based on one or more inputs, including but not limited to, benchmark yields, transactions, bids, offers, quotations from dealers and trading systems, new issues, spreads and other relationships observed in the markets among comparable securities; and pricing models such as yield measurers calculated using factors such as cash flows, financial or collateral performance and other reference data. In addition to these inputs, mortgage-backed and asset-backed
10
Table of Contents
Angel Oak Strategic Credit Fund
Notes to the Financial Statements – (Unaudited) (continued)
July 31, 2018
NOTE 2. SIGNIFICANT ACCOUNTING POLICIES – (continued)
obligations may utilize cash flows, prepayment information, default rates, delinquency and loss assumptions, collateral characteristics, credit enhancements and specific deal information. Securities that use similar valuation techniques and inputs are categorized as Level 2 of the fair value hierarchy. To the extent the significant inputs are unobservable; the values generally would be categorized as Level 3.
Equity securities, including preferred stocks, that are traded on a national securities exchange, except those listed on the Nasdaq Global Market®, Nasdaq Global Select Market® and the Nasdaq Capital Market® exchanges (collectively, “Nasdaq”), are valued at the last sale price at the close of that exchange. Securities traded on Nasdaq will be valued at the Nasdaq Official Closing Price (“NOCP”). If, on a particular day, an exchange-listed or Nasdaq security does not trade, then: (i) the security shall be valued at the mean between the most recent quoted bid and asked prices at the close of the exchange; or (ii) the security shall be valued at the latest sales price on the Composite Market (defined below) for the day such security is being valued. “Composite Market” means a consolidation of the trade information provided by national securities and foreign exchanges and over-the-counter markets (“OTC”) as published by a pricing service. In the event market quotations or Composite Market pricing are not readily available, Fair Value will be determined in accordance with the procedures adopted by the Board. All equity securities that are not traded on a listed exchange are valued at the last sale price at the close of the over-the counter market. If a non-exchange listed security does not trade on a particular day, then the mean between the last quoted bid and asked price will be used as long as it continues to reflect the value of the security. If the mean is not available, then bid price can be used as long as the bid price continues to reflect the value of the security. Otherwise Fair Value will be determined in accordance with the procedures adopted by the Board. These securities will generally be categorized as Level 3 securities. When using the market quotations or close prices provided by the pricing service and when the market is considered active, the security will be classified as a Level 1 security. Sometimes, an equity security owned by the funds will be valued by the pricing service with factors other than market quotations or when the market is considered inactive. When this happens, the security will be classified as a Level 2 security.
Short term debt securities having a maturity of 60 days or less are generally valued at amortized cost, which approximates fair market value. These investments are categorized as Level 2 of the fair value hierarchy. Reverse repurchase agreements and repurchase agreements are priced at their acquisition cost, which represents fair value. These securities will generally be categorized as Level 2 securities.
Financial derivative instruments, such as futures contracts, that are traded on a national securities or commodities exchange are typically valued at the settlement price determined by the relevant exchange. Swaps, such as credit default swaps, interest-rate swaps and currency swaps, are valued by a Pricing Service. To the extent these securities are actively traded and valuation adjustments are not applied, they are categorized as Level 1 of the fair value hierarchy. Over-the-counter financial derivative instruments, such as certain futures contracts or swap agreements, derive their values from underlying asset prices, indices, reference rates, other inputs or a combination of these factors. These instruments are normally valued on the basis of evaluations provided by independent pricing services or broker dealer quotations. Derivatives that use similar valuation techniques as described above are typically categorized as Level 2 of the fair value hierarchy.
Securities may be fair valued in accordance with the fair valuation procedures approved by the Board. The Valuation and Risk Management Oversight Committee is generally responsible for overseeing the Fund’s valuation processes and reports quarterly to the Board. The Valuation and Risk Management Oversight Committee has delegated to the Valuation Committee of Angel Oak Capital Advisors, LLC (the “Adviser”) the day to day responsibilities for making all necessary determinations of the fair value of portfolio securities and other assets for which market quotations are not readily available or if the prices obtained from brokers and dealers or independent pricing services are deemed to be unreliable indicators of market or fair value. Representatives of the Adviser’s Pricing Committee report quarterly to the Valuation and Risk Management Oversight Committee.
11
Table of Contents
Angel Oak Strategic Credit Fund
Notes to the Financial Statements – (Unaudited) (continued)
July 31, 2018
NOTE 2. SIGNIFICANT ACCOUNTING POLICIES – (continued)
The following is a summary of the inputs used to value the Fund’s net assets as of July 31, 2018:
| Assets | Level 1 | Level 2 | Level 3 | Total | ||||||||||||
Asset-Backed Securities | $ | – | $ | 424,247 | $ | – | $ | 424,247 | ||||||||
Collateralized Loan Obligations | – | 1,230,759 | – | 1,230,759 | ||||||||||||
Collateralized Mortgage Obligations | – | 1,373,250 | – | 1,373,250 | ||||||||||||
Corporate Obligations | – | 985,385 | – | 985,385 | ||||||||||||
Mortgage-Backed Securities – U.S. Government Agency Issues | – | 381,147 | – | 381,147 | ||||||||||||
Preferred Stocks | – | 308,400 | – | 308,400 | ||||||||||||
Short Term Investments | 1,726,370 | – | – | 1,726,370 | ||||||||||||
Total | $ | 1,726,370 | $ | 4,703,188 | $ | – | $ | 6,429,558 | ||||||||
See the Schedule of Investments for further disaggregation of investment categories. During the period ended July 31, 2018, the Fund did not recognize any transfers to or from Levels 1, 2 or 3. Transfers between levels are recognized at the end of the reporting period.
Federal Income Taxes – The Fund intends to elect and continue to qualify to be taxed as a “regulated investment company” under Subchapter M of the Internal Revenue Code of 1986, as amended. If so qualified, the Fund generally will not be subject to federal income tax to the extent they distribute substantially all of its net investment income and capital gains to shareholders. The Fund generally intends to operate in a manner such that it will not be liable for federal income or excise taxes.
The Fund has adopted financial reporting rules regarding recognition and measurement of tax positions taken or expected to be taken on a tax return. The Fund recognizes interest and penalties, if any, related to unrecognized tax benefits as income tax expense on the Statements of Operations. During the period ended July 31, 2018, the Fund did not incur any interest or penalties.
Security Transactions and Income Recognition – Investment security transactions are accounted for on trade date. Gains and losses realized on sales of securities are determined on a specific identification basis. Interest income and expense is recorded on an accrual basis. Discounts and premiums on securities purchased are accreted or amortized using the effective yield method, based on each securities estimated life. Dividend income and corporate actions, if any, are recorded on the ex-date. Paydown gains and losses on mortgage-related and other asset-backed securities are recorded as components of interest income on the Statement of Operations. Payments received from certain investments held by the Fund may be comprised of dividends, capital gains and return of capital. The Fund originally estimates the expected classification of such payments. The amounts may subsequently be reclassified upon receipt of the information from the issuer. The actual character of distributions to the Fund’s shareholders will be reflected in the Form 1099 received by shareholders after the end of the calendar year.
Dividends and Distributions – Distributions from the Fund’s net investment income are accrued daily and typically paid monthly. The Fund intends to distribute its net realized long term capital gains and net realized short term capital gains, if any, at least annually. Dividends to shareholders, which are determined in accordance with income tax regulations, are recorded on the ex-dividend date. The treatment for financial reporting purposes of distributions made to shareholders during the period from net investment income or net realized capital gains may differ from their ultimate treatment for federal income tax purposes. These differences are caused primarily by differences in the timing of the recognition of certain components of income, expense or realized capital gain for federal income tax purposes. Where such differences are permanent in nature, they are reclassified in the components of the net assets based on their ultimate characterization for federal income tax purposes. Any such reclassifications will have no effect on net assets, results of operations or net asset values per share of the Fund. For the period ended January 31, 2018, there were no reclassifications.
Share Valuation – The NAV per share of the Fund is calculated by dividing the sum of the value of the securities held by the Fund, plus cash and other assets, minus all liabilities (including estimated accrued expenses) by the total number of shares outstanding, rounded to the nearest cent. The Fund’s NAV will not be calculated on the days on which the New York Stock Exchange is closed for trading.
12
Table of Contents
Angel Oak Strategic Credit Fund
Notes to the Financial Statements – (Unaudited) (continued)
July 31, 2018
NOTE 2. SIGNIFICANT ACCOUNTING POLICIES – (continued)
Use of Estimates – The preparation of financial statements in conformity with GAAP requires management to make estimates and assumptions that affect the reported amounts of assets and liabilities and disclosure of contingent assets and liabilities at the date of the financial statements, as well as the reported amounts of revenues and expenses during the period. Actual results could differ from those estimates.
Indemnifications – Under the Trust’s organizational documents, the Trust will indemnify its officers and trustees for certain liabilities that may arise from performance of their duties to the Fund. Additionally, in the normal course of business, the Fund enters into contracts that contain a variety of representatives and warranties which provide general indemnifications. The Fund’s maximum exposure under these arrangements is unknown, as this would involve future claims that may be made against the Fund that have not yet occurred.
Repurchase Agreements – Repurchase agreements are transactions by which the Fund purchases a security and simultaneously commits to resell that security to the seller (a bank or securities dealer) at an agreed upon price on an agreed upon date. The resale price reflects the purchase price plus an agreed upon market rate of interest which is unrelated to the coupon rate or the date of maturity of the purchased security. A repurchase agreement is accounted for as an investment by the Fund, collateralized by securities, which are delivered to the Fund’s custodian or to an agent bank under a tri-party agreement. The securities are marked-to-market daily and additional securities are acquired as needed, to ensure that their value equals or exceeds the repurchase price plus accrued interest. Repurchase agreements involve certain risks not associated with direct investments in the underlying securities. In the event of a default or bankruptcy by the seller, the Fund will seek to liquidate such collateral. The exercise of the Fund’s right to liquidate such collateral could involve certain costs or delays, and, to the extent that proceeds from any sale upon a default of the obligation to repurchase were less than the repurchase price, the Fund could suffer a loss. The Fund did not hold any repurchase agreements during the period ended July 31, 2018.
Reverse Repurchase Agreements – A reverse repurchase agreement is the sale by the Fund of a security to a party for a specified price, with the simultaneous agreement by the Fund to repurchase that security from that party on a future date at a higher price. Securities sold under reverse repurchase agreements are reflected as a liability on the Statement of Assets and Liabilities. Interest payments made are recorded as a component of interest expense on the Statement of Operations. Reverse repurchase agreements involve the risk that the counterparty will become subject to bankruptcy or other insolvency proceedings or fail to return a security to the Fund. In such situations, the Fund may incur losses as a result of a possible decline in the value of the underlying security during the period while the Fund seeks to enforce its rights, a possible lack of access to income on the underlying security during this period, or expenses of enforcing its rights. The Fund will segregate assets determined to be liquid by the Adviser or otherwise covered its obligations under reverse repurchase agreement. The Fund did not hold any reverse repurchase agreements during the period ended July 31, 2018.
Mortgage-Backed and Asset-Backed Securities Risks – Prepayment risk is associated with mortgage-backed and asset-backed securities, including collateralized loan obligations (“CLOs”). If interest rates fall, the underlying debt may be repaid ahead of schedule, reducing the value of the Fund’s investments. If interest rates rise, there may be fewer prepayments, which would cause the average bond maturity to rise, increasing the potential for the Fund to lose money. The value of these securities may be significantly affected by changes in interest rates, the market’s perception of issuers, and the creditworthiness of the parties involved. The ability of the Fund to successfully utilize these instruments may depend on the ability of the Fund’s Adviser to forecast interest rates and other economic factors correctly. These securities may have a structure that makes their reaction to interest rate changes and other factors difficult to predict, making their value highly volatile. Certain mortgage-backed securities may be secured by pools of mortgages on single-family, multi-family properties, as well as commercial properties. Similarly, asset-backed securities may be secured by pools of loans, such as corporate loans, student loans, automobile loans and credit card receivables. The credit risk on such securities is affected by homeowners or borrowers defaulting on their loans. The values of assets underlying mortgage-backed and asset-backed securities, including CLOs, may decline and therefore may not be adequate to cover underlying investors. Mortgage-backed securities and other securities issued by participants in housing and commercial real estate finance, as well as other real estate-related markets have experienced extraordinary weakness and volatility in recent years. Possible legislation in the area of residential mortgages, credit cards, corporate loans and other loans that may collateralize the securities in which the Fund may invest could negatively impact the value of the Fund’s investments. To the extent the Fund focuses its investments in particular types of mortgage-backed or asset-backed securities, including CLOs, the Fund may be more susceptible to risk factors affecting such types of securities.
13
Table of Contents
Angel Oak Strategic Credit Fund
Notes to the Financial Statements – (Unaudited) (continued)
July 31, 2018
NOTE 2. SIGNIFICANT ACCOUNTING POLICIES – (continued)
Subordinated Debt of Banks and Diversified Financial Companies – The Fund may invest in subordinated debt securities, sometimes also called “junior debt,” are debt securities for which the issuer’s obligations to make principal and interest payment are secondary to the issuer’s payment obligations to more senior debt securities. Such investments will consist primarily of debt issued by community banks or savings intuitions (or their holding companies), which are subordinated to senior debt issued by the banks and depots held by the bank, but are senior to trust preferred obligations, preferred stock and common stock issued by the bank.
Preferred Stocks – The Fund may invest in preferred stock. Preferred stock is a class of stock having a preference over common stock as to the payment of dividends and the recovery of investment should a company be liquidated, although preferred stock is usually junior to the debt securities of the issuer. Preferred stock typically does not possess voting rights and its market value may change based on changes in interest rates. The fundamental risk of investing in preferred stock is the risk that the value of the stock might decrease.
Futures Contracts – The Fund may enter into futures contracts to hedge various investments for risk management as well as speculative purposes. Initial margin deposits are made upon entering into futures contracts and can be either cash or securities. Secondary margin limits are required to be maintained while futures are held, as defined by each contract.
During the period a futures contract is open, changes in the value of the contract are recognized as unrealized gains or losses by “marking-to-market” on a daily basis to reflect the fair value of the contract at the end of each day’s trading. Variation margin receivables or payables represent the difference between the change in unrealized appreciation and depreciation on the open contracts and the cash deposits made on the margin accounts. When the contract is closed, the Fund records a realized gain or loss equal to the difference between the proceeds from the closing transaction and the Fund’s cost of entering into a contract. The use of futures contracts involves the risk of illiquid markets or imperfect correlation between the value of the instruments and the underlying securities, or that the counterparty will fail to perform its obligations.
Futures contracts are valued at the settlement price established each day by the board of trade or exchange on which they are traded. Should market conditions move unexpectedly, the Fund may not achieve the anticipated benefits of the futures contract and may realize a loss.
Options – A Fund may purchase call and put options on specific securities, and may write and sell covered or uncovered call and put options for hedging purposes in pursuing its investment objectives. A put option gives the purchaser of the option the right to sell, and obligates the writer to buy, the underlying security at a stated exercise price, typically at any time prior to the expiration of the option for American options or only at expiration for European options. A call option gives the purchaser of the option the right to buy, and obligates the writer to sell, the underlying security at a stated exercise price, typically at any time prior to the expiration of the option. A covered call option is a call option with respect to which the seller of the option owns the underlying security. The sale of such an option exposes the seller during the term of the option to possible loss of opportunity to realize appreciation in the market price of the underlying security or to possible continued holding of a security that might otherwise have been sold to protect against depreciation in the market price of the security. A covered put option is a put option with respect to which cash or liquid securities have been placed in a segregated account on the books of the Fund or with a custodian to fulfill the obligation undertaken. The sale of such an option exposes the seller during the term of the option to a decline in price of the underlying security while depriving the seller of the opportunity to invest the segregated assets.
A Fund may close out a position when writing options by purchasing an option on the same underlying security with the same exercise price and expiration date as the option that it has previously written on the security. In such a case, the applicable Fund will realize a profit or loss if the amount paid to purchase an option is less or more than the amount received from the sale of the option. The Fund did not hold any options during the period ended July 31, 2018.
Swaps – The Fund may enter into swap contracts to hedge various investments for risk management or to pursue its investment objective. The Fund may invest in credit default swaps, total return swaps, interest rate swaps, equity swaps, currency swaps, options on foregoing swaps, and other types of swaps. Such transactions are subject to market risk, liquidity risk, risk of default by the other party to the transaction, known as “counterparty risk,” regulatory risk and risk of imperfect correlation between the value of such instruments and the underlying assets and may involve commissions or other costs. Swap agreements are valued by a pricing service and unrealized appreciation or depreciation is recorded daily as the difference between the prior day and current day closing price. The Fund did not hold any swaps during the period ended July 31, 2018.
14
Table of Contents
Angel Oak Strategic Credit Fund
Notes to the Financial Statements – (Unaudited) (continued)
July 31, 2018
NOTE 3. DERIVATIVE TRANSACTIONS
The effect of derivative instruments on the Statement of Operations for the period ended July 31, 2018:
| Derivatives | Type of Derivative Risk | Location of Gain on Derivatives in Income | Realized Gain on Derivatives | |||
| Futures Contracts | Interest Rate | Net realized gain on futures contracts | $2,743 |
| Derivatives | Type of Derivative Risk | Location of Gain (Loss) on Derivatives in Income | Change in Unrealized on Derivatives | |||
| Futures Contracts | Interest Rate | Net change in unrealized appreciation (depreciation) on futures contracts | $ – |
The average monthly notional value of short futures contracts during the period ended July 31, 2018 was $118,736.
NOTE 4. FEES AND OTHER RELATED PARTY TRANSACTIONS
Under the terms of the investment advisory agreement, on behalf of the Fund (the “Agreement”), the Adviser manages the Fund’s investments subject to oversight of the Trustees. As compensation for its management services, the Fund is obligated to pay the Adviser a fee computed and accrued daily and paid monthly at an annual rate of 1.25% of the average daily net assets of the Fund.
The Adviser has voluntarily agreed to waive its fees and/or reimburse certain expenses (exclusive of any taxes, interest on borrowings, dividends on securities sold short, brokerage commissions, acquired fund fees and expenses, expenses incurred in connection with any merger or reorganization and extraordinary expenses) to limit the Operating Expenses after fee waiver/expense reimbursement to 0.75% of the Fund’s average daily net assets (the “Expense Limit”) for the first twelve months of the Fund’s operations. The Adviser may voluntarily waive fees at different levels, from time to time. The Adviser may not recoup from the Fund any waived amount or reimbursed expenses pursuant to this arrangement. The Adviser may amend or discontinue this waiver at any time without advance notice.
Quasar Distributors, LLC (the “Distributor”) acts as the Fund’s principal underwriter in a continuous public offering of the Fund’s shares. For its services during the period ended July 31, 2018, the fund paid Quasar $8,995.
U.S. Bancorp Fund Services, LLC, doing business as U.S. Bank Global Fund Services (“Fund Services”), an indirect wholly-owned subsidiary of U.S. Bancorp, serves as the Fund’s Administrator (“Administrator”) and, in that capacity, performs various administrative and accounting services for the Fund. Fund Services also serves as the Fund’s fund accountants and transfer agent. The Administrator prepares various federal and state regulatory filings, reports the returns for the Fund; prepares reports and materials to be supplied to the trustees; monitors the activities of the Fund’s custodians; coordinates the preparation and payment of the Fund’s expenses and reviews the Fund’s expense accruals. As compensation for its services, the Administrator is entitled to a monthly fee at an annual rate based upon the average daily net assets of the Fund. U.S. Bank, N.A. (the “Custodian”) serves as custodian to the Fund. Both the Administrator and Custodian are affiliates of the Distributor.
Certain officers, Trustees and shareholders of the Fund are also owners or employees of the Adviser.
NOTE 5. ORGANIZATIONAL AND OFFERING COSTS
Organization costs consist of costs incurred to establish the Fund and enable it legally to do business. Offering costs include state registration fees and legal fees regarding the preparation of the initial registration statement. These organization and offering expenses were paid by the Adviser and will not be subject to reimbursement by the Fund.
15
Table of Contents
Angel Oak Strategic Credit Fund
Notes to the Financial Statements – (Unaudited) (continued)
July 31, 2018
NOTE 6. INVESTMENT TRANSACTIONS
For the period ended July 31, 2018, purchases and sales of investment securities, other than short-term investments and short-term U.S. government obligations, were as follows:
| Purchases | Sales | |
| $4,927,041 | $1,889,924 |
For the period ended July 31, 2018, there were $274,635 of purchases and $103,763 of sales of U.S. Government securities for the Fund.
NOTE 7. BENEFICIAL OWNERSHIP
The beneficial ownership, either directly or indirectly, of 25% or more of the voting securities of a fund creates a presumption of control of a fund, under Section 2(a)(9) of the 1940 Act. At July 31, 2018, Pershing (“Pershing”) owned, as record shareholder, 95% of the outstanding shares of the Fund.
NOTE 8. FEDERAL TAX INFORMATION
The tax characterization of distributions paid for the period ended January 31, 2018 were as follows:
| 2018 | ||||
Distributions paid from: | ||||
Ordinary Income | $ | 4,654 | ||
Net Long-Term Capital Gain | – | |||
Total | $ | 4,654 | ||
At January 31, 2018, the components of distributable earnings (accumulated losses) on a tax basis were as follows:
Tax Cost of Investments | $ | 2,938,613 | ||
Unrealized Appreciation | 8,016 | |||
Unrealized Depreciation | (2,244 | ) | ||
Net Unrealized Appreciation (Depreciation) | $ | 5,772 | ||
Undistributed Ordinary Income | 18,653 | |||
Undistributed Long-Term Gain (Loss) | – | |||
Distributable Earnings | $ | 18,653 | ||
Other Accumulated Gain (Loss) | – | |||
Total Accumulated Gain (Loss) | $ | 24,425 |
As of January 31, 2018, the Fund did not have any capital loss carry forwards.
Certain capital losses incurred after October 31 and within the current taxable year, are deemed to arise on the first business day of the Fund’s following taxable year. For the tax period ended January 31, 2018, the Fund did not defer any post-October losses.
16
Table of Contents
Angel Oak Strategic Credit Fund
Notes to the Financial Statements – (Unaudited) (continued)
July 31, 2018
NOTE 9. NEW ACCOUNTING PRONOUNCEMENTS
In March 2017, the Financial Accounting Standards Board (FASB) issued Accounting Standards Update (ASU) No. 2017-08, Receivables – Nonrefundable Fees and Other Costs (Subtopic 310-20): Premium Amortization on Purchased Callable Debt Securities. The amendments in the ASU shorten the amortization period for certain callable debt securities, held at a premium, to be amortized to the earliest call date. The ASU does not require an accounting change for securities held at a discount; which continues to be amortized to maturity. The ASU is effective for fiscal years and interim periods within those fiscal years beginning after December 15, 2018. Management is currently evaluating the impact, if any, of applying this provision.
NOTE 10. SUBSEQUENT EVENT
Management of the Fund has evaluated the need for disclosures and/or adjustments resulting from subsequent events through the date these financial statements were issued. This evaluation did not result in any subsequent events that necessitated disclosures and/or adjustments, other than the below.
Effective September 6, 2018, the Fund offers Class A shares. Class A shares charge a 2.25% front-end sales charge and a 0.25% 12b-1 fee. Class A shares have not commenced operations.
17
Table of Contents
Additional Information (Unaudited)
1. Shareholder Notification of Federal Tax Status
For the tax period ended January 31, 2018, certain dividends paid by the Fund may be subject to a maximum tax rate of 20% as provided for by the Jobs and Growth Tax Relief Reconciliation Act of 2003. The Fund intends to designate the maximum amount allowable as taxed at a maximum rate of 20%.
For the taxable period ended January 31, 2018, the Fund paid qualified dividend income of 0.00%.
For the taxable period ended January 31, 2018, the percentage of ordinary income dividends paid by the Fund that qualifies for the dividends received deduction available to corporations was 0.00%.
For the taxable period ended January 31, 2018, the Fund did not pay any ordinary income distributions that are designated as short-term capital gain distributions under Internal Revenue Section 871(k)2(c).
For the taxable period ended January 31, 2018, the percentage of taxable ordinary income distributions that are designated as interest related dividends under Internal Revenue 871(k)1(c) was 57.57%.
2. Disclosure of Portfolio Holdings
The Fund will file a complete schedule of portfolio holdings with the Securities and Exchange Commission (“SEC”) for the first and third quarters of each fiscal year on Form N-Q. The Fund’s Form N-Q will be available on the website of the SEC at http://www.sec.gov. The Fund’s Forms N-Q may be reviewed and copied at the Securities and Exchange Commission’s Public Reference Room in Washington, D.C. Information on the operation of the Public Reference Room may be obtained by call 1-800-SEC-0330.
3. Proxy Voting Policies and Procedures
A description of the policies and procedures that the Fund uses to determine how to vote proxies related to portfolio securities and information regarding how the Fund voted those proxies during the most recent twelve month period ended June 30, is available without charge upon request by (1) calling the Fund at (855) 751-4324 and (2) from Trust documents filed with the SEC on the SEC’s website at www.sec.gov.
4. Compensation of Trustees
Each Trustee who is not an “interested person” of the Trust (i.e., an “Independent Trustee”) receives an annual retainer of $52,000, paid quarterly as well as $8,500 for attending each regularly scheduled meeting in person in connection with his service on the Board of the Fund and other funds advised by the Adviser. Independent Trustees are permitted reimbursement for out-of-pocket expenses incurred in connection with attendance at meetings. The Fund’s Statement of Additional Information includes additional information about the Trustees and is available upon request by calling toll free 1-855-444-9243.
18
Table of Contents
6. Trustees and Officers
The business of the Fund is managed under the direction of the Board. The Board formulates the general policies of the Fund and meets periodically to review the Fund’s performance, monitor investment activities and practices, and discuss other matters affecting the Fund. The Trustees are fiduciaries for the Fund’s shareholders and are governed by the laws of the State of Delaware in this regard. The names and addresses of the Trustees and officers of the Trust are listed below along with a description of their principal occupations over at least the last five years. The address of each Trustee and Officer of the Trust is c/o Angel Oak Capital Advisors, LLC, One Buckhead Plaza, 3060 Peachtree Road NW, Suite 500, Atlanta, GA 30305. The Fund’s Statement of Additional Information includes additional information about the Trustees and is available upon request by calling toll free 1-855-751-4324.
| Name and year of birth | Position with the Trust and tenure | Funds in complex overseen by Trustee | Principle occupation(s) during the past five years | Other directorships held during the past five years | ||||
Independent Trustees of the Trust(1) | ||||||||
Ira P. Cohen 1959 | Independent Trustee and Chairman, since 2014; indefinite term | 5 | Executive Vice President, Recognos Financial (investment industry data analysis provider) (since 2015); Independent financial services consultant (since 2005). | Trustee, Valued Advisers Trust (since 2010) (15 portfolios); Trustee, Griffin Institutional Access Real Estate Fund (since April 2014)(1 portfolio); Trustee, Griffin Institutional Access Credit Fund (since January 2017) (1 portfolio). | ||||
Alvin R. Albe, Jr. 1953 | Independent Trustee, since 2014; indefinite term | 5 | Retired; Senior Advisor, The TCW Group, Inc. (asset manager), (2008-2013). | Director, Syntroleum Corporation (renewable energy firm) (1988 – 2014). | ||||
Keith M. Schappert 1951 | Independent Trustee, since 2014; indefinite term | 5 | President, Schappert Consulting LLC (investment industry consulting) (since 2008). | Trustee, Mirae Asset Discovery Funds (since 2010) (6 portfolios); Trustee, Metropolitan Series Fund, Inc. (since 2009) (30 portfolios); Trustee, Met Investors Series Trust (since 2012) (45 portfolios); Director, The Commonfund (investment management) (since 2012); Director, Calamos Asset Management, Inc. (investment management) (since 2012). | ||||
Interested Trustee of the Trust: | ||||||||
Sreeniwas (Sreeni) V. Prabhu 1974 | Interested Trustee, since April 2015; indefinite term | 5 | Chief Investment Officer, Portfolio Manager, Co-Founder, Angel Oak Capital Advisors, LLC (since 2009) | None. | ||||
| (1) | The Trustees of the Trust who are not “interested persons” of the Trust as defined in the 1940 Act (“Independent Trustees”). |
19
Table of Contents
| Name and year of birth | Position within Trust | Term of office and length of time served | Principle occupation(s) during past five years | |||||
Officers of the Trust | ||||||||
Dory S. Black, Esq. 1975 | President | Since 2015; indefinite term | General Counsel, Angel Oak (since 2014); General Counsel, EARNEST Partners, LLC (investment management firm) (2014); Vice-President and Assistant General Counsel, GE Asset Management Incorporated (2004 – 2014). | |||||
R. Adam Langley 1967 | Chief Compliance Officer | Since 2015; indefinite term | Chief Compliance Officer, Angel Oak Capital Advisors, LLC (since 2015); Compliance Manager, Invesco Advisers, Ltd. (2013 – 2015); Compliance Officer, Macquarie Group (2013); Chief Compliance Officer, Aspen Partners, Ltd. (2003 – 2013). | |||||
Lu Chang, CFA, FRM 1975 | Secretary | Since 2015; indefinite term | Chief Risk Officer, Angel Oak Capital Advisors, LLC (since 2014); Vice-President and Finance Manager, Wells Fargo Advisors, LLC (investment advisory firm) (2010 – 2014). | |||||
Daniel Fazioli 1981 | Treasurer | Since 2015; indefinite term | Controller, Angel Oak Capital Advisors, LLC (since 2015); Controller, Tang Capital Partners, LP (2014 – 2015); Associate, Goldman Sachs & Company, Inc. (2010 – 2014). | |||||
Each Trustee holds office for an indefinite term and until the earlier of: the Fund’s next meeting of shareholders and the election and qualification of his/her successor; or until the date a trustee dies, resigns or is removed in accordance with the Fund’s Amended and Restated Declaration of Trust and By-laws. Each Trustee shall serve during the lifetime of the Fund until he or she: (a) dies; (b) resigns; (c) has reached the mandatory retirement age, if any, as set by the Trustees; (d) is declared incompetent by a court of appropriate jurisdiction; or (e) is removed, or, if sooner, until the next meeting of shareholders called for the purpose of electing Trustees and until the election and qualification of his or her successor. Each officer holds office at the pleasure of the Board.
20
Table of Contents
INVESTMENT ADVISER
Angel Oak Capital Advisors, LLC
One Buckhead Plaza
3060 Peachtree Road NW, Suite 500
Atlanta, GA 30305
DISTRIBUTOR
Quasar Distributors, LLC
777 East Wisconsin Avenue
Milwaukee, WI 53202
INDEPENDENT REGISTERED PUBLIC ACCOUNTING FIRM
Cohen & Company, Ltd.
1350 Euclid Avenue, Suite 800
Cleveland, OH 44115
LEGAL COUNSEL
Dechert LLP
1900 K Street NW
Washington, DC 20006
CUSTODIAN
U.S. Bank National Association
1555 North Rivercenter Drive, Suite 302
Milwaukee, WI 53202
ADMINISTRATOR, TRANSFER AGENT, AND FUND ACCOUNTANT
U.S Bancorp Fund Services, LLC
615 East Michigan Street
Milwaukee, WI 53202
This report is intended only for the information of shareholders or those who have received the Fund’s prospectus which contains information about the Fund’s management fee and expenses. Please read the prospectus carefully before investing.
Table of Contents
Item 2. Code of Ethics.
Not applicable for semi-annual reports.
Item 3. Audit Committee Financial Expert.
Not applicable for semi-annual reports.
Item 4. Principal Accountant Fees and Services.
Not applicable for semi-annual reports.
Item 5. Audit Committee of Listed Registrants.
Not applicable to registrants who are not listed issuers (as defined in Rule 10A-3 under the Securities Exchange Act of 1934).
Item 6. Investments.
Schedule of Investments is included as part of the report to shareholders filed under Item 1 of this Form.
Item 7. Disclosure of Proxy Voting Policies and Procedures for Closed-End Management Investment Companies.
Not applicable for semi-annual reports.
Item 8. Portfolio Managers of Closed-End Management Investment Companies.
Not applicable for semi-annual reports.
Item 9. Purchases of Equity Securities by Closed-End Management Investment Company and Affiliated Purchasers.
There were no purchases made by or on behalf of the Registrant or any “affiliated purchaser,” as defined in Rule 10b-18(a)(3) under the Securities Exchange Act of 1934, as amended, of shares of the Registrant’s equity securities that are registered by the Registrant pursuant to Section 12 of the Exchange Act made in the period covered by this report.
Item 10. Submission of Matters to a Vote of Security Holders.
There have been no material changes since the Fund’s inception to the procedures by which shareholders may recommend nominees to the registrant’s board of trustees.
Table of Contents
Item 11. Controls and Procedures.
| (a) | The Registrant’s Principal Executive Officer and Principal Financial Officer have reviewed the Registrant’s disclosure controls and procedures (as defined in Rule 30a-3(c) under the Investment Company Act of 1940 (the “Act”)) as of a date within 90 days of the filing of this report, as required by Rule 30a-3(b) under the Act and Rules 13a-15(b) or 15d-15(b) under the Securities Exchange Act of 1934. Based on their review, such officers have concluded that the disclosure controls and procedures are effective in ensuring that information required to be disclosed in this report is appropriately recorded, processed, summarized and reported and made known to them by others within the Registrant and by the Registrant’s service provider. |
| (b) | There were no changes in the Registrant’s internal control over financial reporting (as defined in Rule 30a-3(d) under the Act) that occurred during the second fiscal quarter of the period covered by this report that have materially affected, or are reasonably likely to materially affect, the Registrant’s internal control over financial reporting. |
Item 12. Disclosure of Securities Lending Activities for Closed-End Management Investment Companies
The registrant did not engage in securities lending activities during the fiscal period reported on this Form N-CSR.
Item 13. Exhibits.
| (a) | (1) Any code of ethics or amendment thereto, that is the subject of the disclosure required by Item 2, to the extent that the registrant intends to satisfy Item 2 requirements through filing an exhibit. Not Applicable. |
(2) A separate certification for each principal executive officer and principal financial officer pursuant to Section 302 of the Sarbanes-Oxley Act of 2002. Filed herewith.
(3) Any written solicitation to purchase securities under Rule 23c-1 under the Act sent or given during the period covered by the report by or on behalf of the registrant to 10 or more persons. Not Applicable.
| (1) | Change in the registrant’s independent public accountant. There was no change in the registrant’s independent public accountant for the period covered by this report. |
| (b) | Certifications pursuant to Section 906 of the Sarbanes-Oxley Act of 2002. Furnished herewith. |
Table of Contents
SIGNATURES
Pursuant to the requirements of the Securities Exchange Act of 1934 and the Investment Company Act of 1940, the registrant has duly caused this report to be signed on its behalf by the undersigned, thereunto duly authorized.
| (Registrant) | Angel Oak Strategic Credit Fund | |||||
| By (Signature and Title)* | /s/ Dory S. Black | |||||
| Dory S. Black, President (Principal Executive Officer) | ||||||
| Date | 9/26/2018 | |||||
Pursuant to the requirements of the Securities Exchange Act of 1934 and the Investment Company Act of 1940, this report has been signed below by the following persons on behalf of the registrant and in the capacities and on the dates indicated.
| By (Signature and Title)* | /s/ Dory S. Black | |||
| Dory S. Black, President (Principal Executive Officer) | ||||
| Date | 9/26/2018 | |||
| By (Signature and Title)* | /s/ Daniel Fazioli | |||
| Daniel Fazioli, Treasurer (Principal Financial Officer) | ||||
| Date | 9/26/2018 | |||
* Print the name and title of each signing officer under his or her signature.