As filed with the Securities and Exchange Commission on February 6, 2023
UNITED STATES
SECURITIES AND EXCHANGE COMMISSION
Washington, D.C. 20549
FORM N-CSR
CERTIFIED SHAREHOLDER REPORT OF REGISTERED
MANAGEMENT INVESTMENT COMPANIES
Investment Company Act file number 811-23293
The Cushing Mutual Funds Trust
(Exact name of registrant as specified in charter)
600 N. Pearl Street, Suite 1205
Dallas, TX 75201
(Address of principal executive offices) (Zip code)
Mark Rhodes
600 N. Pearl Street, Suite 1205
Dallas, TX 75201
(Name and address of agent for service)
214-692-6334
Registrant's telephone number, including area code
Date of fiscal year end: November 30
Date of reporting period: November 30, 2022
Item 1. Reports to Stockholders.
Table of Contents
Shareholder Letters (Unaudited) | 1 |
Hypothetical Growth of a $10,000 Investment (Unaudited) | 6 |
Expense Examples (Unaudited) | 8 |
Allocation of Portfolio Assets (Unaudited) | 10 |
Schedules of Investments | 12 |
Statements of Assets & Liabilities | 18 |
Statements of Operations | 19 |
Statements of Changes in Net Assets | 20 |
Financial Highlights | 21 |
Notes to Financial Statements | 25 |
Report of Independent Registered Public Accounting Firm | 35 |
Trustees and Executive Officers (Unaudited) | 37 |
Additional Information (Unaudited) | 39 |
NXG NextGen Infrastructure Fund Shareholder Letter (Unaudited) |
Dear Fellow Shareholder,
For the twelve-month fiscal period ended November 30, 2022 (the “Period”), the NXG NextGen Infrastructure Fund (formerly known as Cushing® NextGen Infrastructure Fund), (Class I shares) (the “Fund”) delivered a -4.19% total return, versus total returns of 7.97% for the S&P Global Infrastructure Index, the Fund’s benchmark index, and -9.23% for the S&P 500 Index . During the period the Fund changed its name to reflect the rebranding of the asset manager.
Market and Strategy Overview
The Fund continues to invest among these themes:
| | ● | Clean & Sustainable Infrastructure – Renewable energy, sustainable and water |
| | ● | Communication & Technology Infrastructure – Data storage, information highway, and payments |
| | ● | Energy Infrastructure – Power and midstream energy |
| | ● | Industrial Infrastructure – Toll roads, freight transportation, ports and airports |
The Period saw a rotation out of high-growth Clean & Sustainable and Communication & Technology names and into more cyclical sectors, such as energy and commodities. The best performing theme for the fund was Energy Infrastructure which benefited from a rally in midstream oil & gas. Underlying oil & gas sector fundamentals remain positive. Key risks to the broader market – higher commodity prices, inflation, and interest rates – could all be relative benefits for midstream. Global demand for hydrocarbons remains resilient. The midstream sector was forced to deal with a “hard landing” in 2020 with the onset of the COVID-19 pandemic. Radical actions were taken, and the sector has reemerged with fortified balance sheets, the highest free cash flow generation in the sector’s history, and an acute focus on shareholder returns.
The quarter saw the passing of the landmark Inflation Reduction Act (IRA) in the US. The bill includes at least $370 billion in benefits to our Clean & Sustainable Infrastructure theme. According to the Energy Information Administration, 82% of new US power capacity additions will be renewables in 2022-241. This legislation will be an even bigger tailwind to this already economic, revolutionary technology. Solar and wind are already the lowest cost of new power generation, at ~$40/MWh unsubsidized2. These credits could reduce the cost up to another 65%, widening the gap to fossil fuel power generation.
Communication & Technology Infrastructure lagged during the period because of the macro trend of growth underperforming. We are firm believers that the secular trends of digitization and the continued development of cloud infrastructure. Global data is doubling every two to three years and 90% of the world’s data has been created since 20193.
Fund Performance & Positioning
The largest contributing sectors to performance were the midstream energy and residential solar equipment. The Fund’s top three biggest contributors were all midstream companies: Energy Transfer (ET), Cheniere Energy (LNG), and Targa Resources (TRGP), which benefitted from increase in strong recovery in demand and subsequent increase in commodity prices.
1 | US Energy Information Administration. “Electric Power Monthly” released 5/24/2022 |
2 | BNEF. “Levelized Cost of Electricity 1H 2022” 6/30/2022 |
3 | BofA. “To the Moon(shots)! – Future Tech Primer” 9/14/2021 |
1
The largest detracting sectors were energy metering & management and data centers. Individually, the Fund’s largest detractors were all Clean & Sustainable Infrastructure companies. Hydrogen company Plug Power (PLUG) was our largest detractor and traded down with other growth stocks and because of disappointing long-term guidance. Fluence Energy (FLNC), and Stem (STEM), both utility-scale battery system providers, underperformed because major cost inflation and US tariffs delaying some projects. We still have conviction in the long-term prospects of these companies and the Fund continues to hold all three names.
Outlook
We believe both that clean energy adoption is on a tremendous growth trajectory and that fossil fuels will be required for years to come. Overall demand for energy has grown consistently for decades and we expect that trend to continue, benefiting Energy Infrastructure and Clean & Sustainable Infrastructure. The digitization of the world is accelerating, and we believe Communication & Technology Infrastructure names are attractively priced.
We truly appreciate your support and look forward to continuing to help you achieve your investment goals.
Sincerely,

Mark Rhodes
Chief Executive Officer and President
The information provided herein represents the opinion of the Fund’s portfolio managers and is not intended to be a forecast of future events, a guarantee of future results, nor investment advice. The opinions expressed are as of the date of this report and are subject to change. The information in this report is not a complete analysis of every aspect of any market, sector, industry, security or the Fund itself. Statements of fact are from sources considered reliable, but the Fund makes no representation or warranty as to their completeness or accuracy. Discussions of specific investments are for illustration only and are not intended as recommendations of individual investments. Please refer to the Schedule of Investments for a complete list of Fund holdings.
Past performance does not guarantee future results. An investment in the Fund involves risks.
The Fund invests in infrastructure companies, which may be subject to a variety of factors that may adversely affect their business or operations, including high interest costs in connection with capital construction and improvement programs, high leverage, costs associated with environmental and other regulations, the effects of economic slowdown, surplus capacity, increased competition from other providers of services, uncertainties concerning the availability of fuel at reasonable prices, the effects of energy conservation policies and other factors. Sustainable infrastructure investments are subject to certain additional risks including high dependency upon on government policies that support renewable power generation and enhance the economic viability of owning renewable electric generation assets; adverse impacts from the reduction or discontinuation of tax benefits and other similar subsidies that benefit sustainable infrastructure companies; dependency on suitable weather condition and risk of damage to components used in the generation of renewable energy by severe weather; adverse changes and volatility in the wholesale market price for electricity in the markets served; the use of newly developed, less proven, technologies and the risk of failure of new technology to perform as anticipated; and dependence on a limited number of suppliers of system components and the occurrence of shortages, delays or component price changes. There is a risk that regulations that provide incentives for renewable energy could change or expire in a manner that adversely impacts the market for sustainable infrastructure companies generally. Technology and communications infrastructure investments are subject to certain additional risks including rapidly changing technologies and existing product obsolescence; short product life cycles; fierce competition; high research and development costs; aggressive pricing and reduced profit margins; the loss of patent, copyright and trademark protections; cyclical market patterns; evolving industry standards; frequent new product introductions and new market entrants; cyber security risks that include, among other things, theft, unauthorized monitoring, release, misuse, loss, destruction or corruption of confidential and highly restricted data, denial of service attacks, unauthorized access to relevant systems, compromises to networks or devices that the information infrastructure companies use, or operational disruption or failures in the physical infrastructure or operating systems, potentially resulting in, among other things, financial losses, violations of applicable privacy and other laws, regulatory fines, penalties, reputational damage, reimbursement or other compensation costs and/or additional compliance costs.
The Fund incurs operating expenses, including advisory fees. Investment returns for the Fund are shown net of fees and expenses.
2
The S&P 500 Index is an unmanaged index of common stocks that is frequently used as a general measure of stock market performance. The S&P Global Infrastructure Index is designed to track 75 companies from around the world chosen to represent the listed infrastructure industry while maintaining liquidity and tradability. To create diversified exposure, the index includes three distinct infrastructure clusters: energy, transportation, and utilities. Net total returns reflect the deduction of applicable withholding taxes. Indices include the reinvestment of dividends and do not include fees or expenses. It is not possible to invest directly in an index.
3
NXG Global Clean Equity Fund Shareholder Letter (Unaudited) |
Dear Fellow Shareholder,
For the twelve-month period ended November 30, 2022 (the “Period”), the Global Clean Equity Fund (Class I shares) (the “Fund”) delivered a total return of -29.61%, versus a -11.62% total return for the MSCI ACWI Net index, the Fund’s benchmark index. This compares to major clean indices of -23.25% for the NASDAQ Clean Edge Green Energy Index and 11.62% for S&P Global Clean Energy Index.
Market and Strategy Overview
The Period was an exceptionally tough period for growth stocks, including clean energy. The underperformance was not all about macro issues though. The Fund was hit with extreme cost inflation and the US names were materially impacted by tariffs. Despite these headwinds earnings estimates for our clean universe increased during the year. At the end of the period, we believe that these headwinds are abating.
The quarter saw the passing of the landmark Inflation Reduction Act (IRA) in the US. The bill includes at least $370 billion in benefits to our Clean & Sustainable Infrastructure theme. According to the Energy Information Administration, 82% of new US power capacity additions will be renewables in 2022-241. This legislation will be an even bigger tailwind to this already economic, revolutionary technology. Solar and wind are already the lowest cost of new power generation, at ~$40/MWh unsubsidized2. These credits could reduce the cost up to another 65%, widening the gap to fossil fuel power generation. The unsubsidized economic advantages of clean energy will drive adoption. We still see plentiful attractive opportunities in the future.
Fund Performance
Top contributing sectors during the period were solar module manufacturers and water metering & pumps. The largest contributor was Maxeon (MAXN), a solar panel manufacturer. Residential solar inverter manufacturers Enphase Energy (ENPH) and SMA Solar (S92 GR) were the second and third largest single name contributors.
The largest detractors were light EV manufacturers and diversified renewable generation. Individually, Indian renewable project developer Azure Power (AZRE) was the largest detractor following an internal investigation and departure of their CEO. The second and third worst performing stocks, Niu Technology (NIU) and NIO (NIO), are both Chinese EV manufacturers that lagged because of increased Chinese regulation and slowing economy. The Fund still owned all three names at the end of the period.
Outlook
We believe both that clean energy adoption is on a tremendous growth trajectory and that fossil fuels will be required for years to come. Overall demand for energy has grown consistently for decades and we expect that trend to continue. The energy crisis is being caused by rising demand, aging fossil fuel plants and supply disruptions. Solar and wind are the cheapest and quickest to market technologies for electricity production. The investment required to repower with low-cost renewables is massive. BNEF estimates that $4.1 trillion in annual spending will be required through 2050 to meet future demand3.
1 | US Energy Information Administration. “Electric Power Monthly” released 5/24/2022 |
2 | BNEF. “Levelized Cost of Electricity 1H 2022” 6/30/2022 |
3 | BNEF, “New Energy Outlook 2022” |
4
We believe that a broad approach to the clean investing will result in better performance. The Fund invests among these themes:
| | ● | Clean Energy – Renewable energy, sustainable and charging |
| | ● | Clean Infrastructure – Electrical transmission, smart cities, and waste |
| | ● | Clean Transportation – New energy vehicles, batteries, and future mobility |
| | ● | Clean Water – Treatment, management, and infrastructure |
We truly appreciate your support and look forward to continuing to help you achieve your investment goals.
Sincerely,

Mark Rhodes
Chief Executive Officer and President
The information provided herein represents the opinion of the Fund’s portfolio managers and is not intended to be a forecast of future events, a guarantee of future results, nor investment advice. The opinions expressed are as of the date of this report and are subject to change. The information in this report is not a complete analysis of every aspect of any market, sector, industry, security or the Fund itself. Statements of fact are from sources considered reliable, but the Fund makes no representation or warranty as to their completeness or accuracy. Discussions of specific investments are for illustration only and are not intended as recommendations of individual investments. Please refer to the Schedule of Investments for a complete list of Fund holdings.
Past performance does not guarantee future results. An investment in the Fund involves risks.
The Fund incurs operating expenses, including advisory fees. Investment returns for the Fund are shown net of fees and expenses.
Mutual fund investing involves risk. Principal loss is possible.
Small-cap and mid-cap companies frequently rely on narrower product lines and niche markets and may be more vulnerable to adverse business or market developments. Securities of these types of companies have limited market liquidity, and their prices may be more volatile. There is a risk that the securities issued by companies of a certain market capitalization may underperform the broader market at any given time.
The MSCI ACWI index is designed to represent performance of the full opportunity set of large- and mid-cap stocks across 23 developed and 27 emerging markets. The NASDAQ Clean Edge Green Energy Index is a modified market capitalization-weighted index designed to track the performance of companies that are manufacturers, developers, distributors and/or installers of clean-energy technologies. The indices include reinvested dividends by do not include fees or expenses. It is not possible to invest directly in an index.
5
NXG NextGen Infrastructure Fund Hypothetical Growth of a $10,000 Investment (Unaudited) |
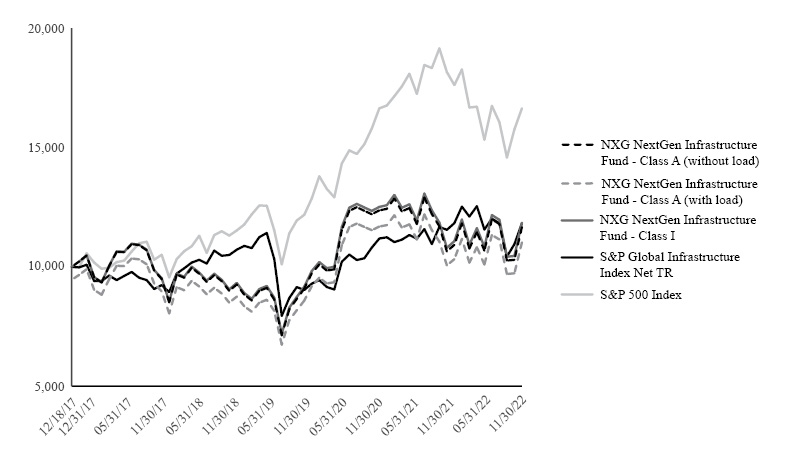
AVERAGE ANNUAL RETURNS |
November 30, 2022 | 1 Year | 5 Year | Since
Inception | Inception
Date |
Class A (without sales load) | -4.46% | n/a | 3.15% | 12/18/17 |
Class A (with sales load) | -9.72% | n/a | 1.99% | 12/18/17 |
| | | | | |
Class I(1) | -4.19% | 4.22% | 7.42% | 3/1/10 |
| | | | | |
S&P Global Infrastructure Index Net TR | 7.97% | 3.27% | 6.07% | 3/1/10 |
| | | | | |
S&P 500 Index | -9.21% | 10.98% | 12.91% | 3/1/10 |
(1) | Performance figures for Class I shares reflect the historical performance of the Predecessor Fund for periods prior to December 18, 2017. |
Performance data quoted represents past performance; past performance does not guarantee future results. The investment return and principal value of an investment will fluctuate so that an investor’s shares, when redeemed, may be worth more or less than their original cost. Current performance of the Fund may be lower or higher than the performance quoted. Performance data current to the most recent month end may be obtained by calling 888-878-4080 or by visiting www.cushingfunds.com.
Class A (with sales load) performance reflects the maximum sales charge of 5.50%. Class I is not subject to a sales charge or maximum deferred sales charge.
The S&P Global Infrastructure Index Net TR is designed to track 75 companies from around the world chosen to represent the listed infrastructure industry while maintaining liquidity and tradability. You cannot invest directly in an index.
The S&P 500 Index is an unmanaged index of common stocks that is frequently used as a general measure of stock market performance.
The graph and table do not reflect the deduction of taxes that a shareholder would pay on Fund distributions or the redemption of the Fund shares.
6
NXG Global Clean Equity Fund Hypothetical Growth of a $10,000 Investment (Unaudited) |
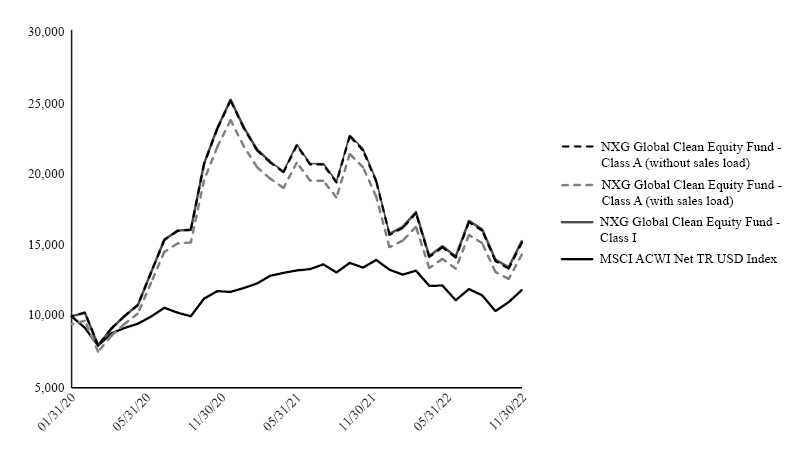
AVERAGE ANNUAL RETURNS |
November 30, 2022 | 1 Year | 5 Year | Since
Inception | Inception
Date |
Class A (without sales load) | -29.81% | n/a | 15.81% | 1/31/20 |
Class A (with sales load) | -33.68% | n/a | 13.53% | 1/31/20 |
| | | | | |
Class I(1) | -29.61% | n/a | 16.10% | 1/31/20 |
| | | | | |
MSCI ACWI Net TR USD Index | -11.62% | n/a | 6.15% | 1/31/20 |
Performance data quoted represents past performance; past performance does not guarantee future results. The investment return and principal value of an investment will fluctuate so that an investor’s shares, when redeemed, may be worth more or less than their original cost. Current performance of the Fund may be lower or higher than the performance quoted. Performance data current to the most recent month end may be obtained by calling 888-878-4080 or by visiting www.cushingfunds.com.
Class A (with sales load) performance reflects the maximum sales charge of 5.50%. Class I is not subject to a sales charge or maximum deferred sales charge.
The MSCI ACWI Index, MSCI’s flagship global equity index, is designed to represent performance of the full opportunity set of large- and mid-cap stocks across 23 developed and 26 emerging markets. You cannot invest directly in an index.
The graph and table do not reflect the deduction of taxes that a shareholder would pay on Fund distributions or the redemption of the Fund shares.
7
NXG NextGen Infrastructure Fund Expense Example (Unaudited) |
The example below is intended to describe the fees and expenses borne by shareholders during the period from June 1, 2022 through November 30, 2022, and the impact of those costs on your investment.
Example
As a shareholder of the Fund, you incur two types of costs: (1) transaction costs, including exchange fees and sales charges (loads) on purchases (as applicable), and (2) ongoing costs, including management fees, distribution and/or service (12b-1) fees, and other Fund expenses (as applicable). This example is intended to help you understand your ongoing costs (in dollars) of investing in the Fund and to compare these costs with the ongoing costs of investing in other mutual funds. The example is based on an investment of $1,000 made at the beginning of the fiscal year and held for the entire period from June 1, 2022 through November 30, 2022.
This example illustrates your Fund’s ongoing costs in two ways:
Actual Expenses
The second and third data columns in the table below provide information about actual account values and actual expenses. You may use the information in these columns, together with the amount you invested, to estimate the expenses that you paid during the period from June 1, 2022 through November 30, 2022. Simply divide your account value by $1,000 (for example, an $8,600 account value divided by $1,000 = 8.6), then multiply the result by the number under the heading entitled “Expenses Paid During Period” to estimate the expenses you paid on your account during this period.
Hypothetical Example for Comparison Purposes
The fourth and fifth data columns in the table below provide information about hypothetical account values and hypothetical expenses based on the Fund’s actual expense ratio and an assumed rate of return of 5% per year before expenses, which is not the Fund’s actual return. The hypothetical account values and expenses may not be used to estimate the actual ending account balances or expenses you paid for the six-month period shown. You may use this information to compare the ongoing costs of investing in the Fund with the ongoing costs of investing in other mutual funds. To do so, compare this 5% hypothetical example with the 5% hypothetical examples that appear in the shareholder reports of the other Funds.
Please note that the expenses shown in the table are meant to highlight your ongoing costs only and do not reflect any transactional costs, such as exchange fees or sales charges (loads). Therefore, the fourth and fifth data columns of the table are useful in comparing ongoing costs only and will not help you determine the relative total costs of owning different funds. In addition, if these transactional costs were included, your costs would have been higher.
Share Class | | Beginning
Account Value
06/01/22 | | | Ending
Account
Value (Based
on Actual
Returns and
Expenses)
11/30/22 | | | Expenses Paid
During Period1 | | | Ending
Account Value
(Based on
Hypothetical
5% Annualized
Return and
Actual
Expenses)
11/30/22 | | | Expenses Paid
During Period1 | | |
Net Expense
Ratio During
Period2
| |
Class A Shares | | $ | 1,000.00 | | | $ | 1,018.20 | | | $ | 7.59 | | | $ | 1,017.55 | | | $ | 7.59 | | | | 1.50 | % |
Class I Shares | | $ | 1,000.00 | | | $ | 1,019.60 | | | $ | 6.33 | | | $ | 1,018.80 | | | $ | 6.33 | | | | 1.25 | % |
1. | Expenses are equal to the Fund’s annualized expense ratio of each class multiplied by the average account value over the period, divided by 365 and multiplied by 183 (to reflect the period). The table above represents the actual expenses incurred during the period. |
2 | . Expenses are equal to the Fund’s annualized expense ratio to reflect the period. |
8
NXG Global Clean Equity Fund Expense Example (Unaudited) |
The example below is intended to describe the fees and expenses borne by shareholders during the period from June 1, 2022 through November 30, 2022, and the impact of those costs on your investment.
Example
As a shareholder of the Fund, you incur two types of costs: (1) transaction costs, including exchange fees and sales charges (loads) on purchases (as applicable), and (2) ongoing costs, including management fees, distribution and/or service (12b-1) fees, and other Fund expenses (as applicable). This example is intended to help you understand your ongoing costs (in dollars) of investing in the Fund and to compare these costs with the ongoing costs of investing in other mutual funds. The example is based on an investment of $1,000 made at the beginning of the fiscal year and held for the entire period from June 1, 2022 through November 30, 2022.
This example illustrates your Fund’s ongoing costs in two ways:
Actual Expenses
The second and third data columns in the table below provide information about actual account values and actual expenses. You may use the information in these columns, together with the amount you invested, to estimate the expenses that you paid during the period from June 1, 2022 through November 30, 2022. Simply divide your account value by $1,000 (for example, an $8,600 account value divided by $1,000 = 8.6), then multiply the result by the number under the heading entitled “Expenses Paid During Period” to estimate the expenses you paid on your account during this period.
Hypothetical Example for Comparison Purposes
The fourth and fifth data columns in the table below provide information about hypothetical account values and hypothetical expenses based on the Fund’s actual expense ratio and an assumed rate of return of 5% per year before expenses, which is not the Fund’s actual return. The hypothetical account values and expenses may not be used to estimate the actual ending account balances or expenses you paid for the six-month period shown. You may use this information to compare the ongoing costs of investing in the Fund with the ongoing costs of investing in other mutual funds. To do so, compare this 5% hypothetical example with the 5% hypothetical examples that appear in the shareholder reports of the other Funds.
Please note that the expenses shown in the table are meant to highlight your ongoing costs only and do not reflect any transactional costs, such as exchange fees or sales charges (loads). Therefore, the fourth and fifth data columns of the table are useful in comparing ongoing costs only and will not help you determine the relative total costs of owning different funds. In addition, if these transactional costs were included, your costs would have been higher.
Share Class | | Beginning
Account Value
06/01/22 | | | Ending
Account
Value (Based
on Actual
Returns and
Expenses)
11/30/22 | | | Expenses Paid
During Period1 | | | Ending
Account Value
(Based on
Hypothetical
5% Annualized
Return and
Actual
Expenses)
11/30/22 | | | Expenses Paid
During Period1 | | |
Net Expense
Ratio During
Period2
| |
Class A Shares | | $ | 1,000.00 | | | $ | 1,022.60 | | | $ | 7.10 | | | $ | 1,018.05 | | | $ | 7.08 | | | | 1.40 | % |
Class I Shares | | $ | 1,000.00 | | | $ | 1,024.80 | | | $ | 5.84 | | | $ | 1,019.30 | | | $ | 5.82 | | | | 1.15 | % |
1. | Expenses are equal to the Fund’s annualized expense ratio of each class multiplied by the average account value over the period, divided by 365 and multiplied by 183 (to reflect the period). The table above represents the actual expenses incurred during the period. |
2. | Expenses are equal to the Fund’s annualized expense ratio to reflect the period. |
9
NXG NextGen Infrastructure Fund Allocation of Portfolio Assets(1) (Unaudited) November 30, 2022
(Expressed as a Percentage of Total Investments) |
Solar Energy Equipment (2) | | | 10.0 | % |
Solar Equipment (2) | | | 8.8 | % |
Large Cap MLP (3) | | | 7.5 | % |
Solar Generation (2) | | | 5.8 | % |
Towers (2)(4) | | | 5.8 | % |
IT Services (2) | | | 5.5 | % |
LNG Midstream (2) | | | 5.2 | % |
Natural Gas Gathering & Processing (3) | | | 4.9 | % |
Solar Developer (2) | | | 4.4 | % |
Diversified Renewable Generation (2) | | | 3.9 | % |
YieldCo (2)(3) | | | 3.9 | % |
Large Cap Diversified C Corps (2)(3) | | | 3.7 | % |
Short-Term | | | 3.6 | % |
Wind Generation (2) | | | 3.5 | % |
Data Centers (2)(4) | | | 3.5 | % |
Industrials (2) | | | 3.4 | % |
Data Center Software (2) | | | 2.7 | % |
Engineering Metering & Management (2) | | | 2.2 | % |
Hydrogen Equipment (2) | | | 2.1 | % |
Electric Vehicle Charging (2) | | | 2.0 | % |
Battery Manufacturer (2) | | | 1.9 | % |
Energy Metering & Management (2) | | | 1.5 | % |
Wind Energy Equipment (2) | | | 1.2 | % |
Renewable Distribution (2) | | | 1.1 | % |
Communication Services (2) | | | 1.0 | % |
Natural Gas Transportation & Storage (2) | | | 0.9 | % |
| | | | 100.0 | % |
(1) | Fund holdings and sector allocations are subject to change and there is no assurance that the Fund will continue to hold any particular security. |
(3) | Master Limited Partnerships and Related Companies |
(4) | Real Estate Investment Trusts |
10
NXG Global Clean Equity Fund Allocation of Portfolio Assets(1) (Unaudited) November 30, 2022
(Expressed as a Percentage of Total Investments) |
Solar Energy Equipment (2) | | | 22.1 | % |
Solar Generation (2) | | | 9.3 | % |
YieldCo (2) | | | 7.8 | % |
Solar Developer (2) | | | 5.0 | % |
Fuel Cell Generation (2) | | | 4.8 | % |
New Energy Vehicle (2) | | | 4.4 | % |
Short-Term Investments | | | 4.3 | % |
Energy Metering & Management (2) | | | 4.2 | % |
Wind Generation (2) | | | 4.0 | % |
Electric Vehicle OEM (2) | | | 3.6 | % |
Diversified Renewable Generation (2) | | | 3.5 | % |
Industrials (2) | | | 3.4 | % |
Utilities (2) | | | 3.1 | % |
Hydrogen Equipment (2) | | | 3.0 | % |
Electric Vehicle Charging (2) | | | 2.5 | % |
Renewable Generation (2) | | | 2.5 | % |
Battery Manufacturer (2) | | | 2.2 | % |
Metering & Pumps (2) | | | 2.2 | % |
Smart Grid (2) | | | 2.2 | % |
Water Tech & Equipment (2) | | | 1.8 | % |
Wind Energy Equipment (2) | | | 1.4 | % |
Solar Materials (2) | | | 1.2 | % |
Solar Equipment (2) | | | 0.9 | % |
Semiconductor Manufacturing (2) | | | 0.6 | % |
| | | | 100.0 | % |
(1) | Fund holdings and sector allocations are subject to change and there is no assurance that the Fund will continue to hold any particular security. |
11
NXG NextGen Infrastructure Fund |
Schedule of Investments | November 30, 2022 |
| Common Stock — 72.5% | | Shares | | | Fair Value | |
| Battery Manufacturer — 1.9% | | | | | | | | |
Freyr Battery(1)(2) | | | 35,796 | | | $ | 488,615 | |
| | | | | | | | | |
| Communication Services — 1.0% | | | | | | | | |
Infrastrutture Wireless Italiane SpA(1) | | | 26,000 | | | | 259,319 | |
| | | | | | | | | |
| Data Centers — 1.1% | | | | | | | | |
Chindata Group Holdings Ltd.(1)(2) | | | 40,428 | | | | 289,465 | |
| | | | | | | | | |
| Data Center Software — 2.7% | | | | | | | | |
Megaport Ltd.(1)(2) | | | 150,000 | | | | 697,327 | |
| | | | | | | | | |
| Diversified Renewable Generation — 3.9% | | | | | | | | |
Renew Energy Global plc(1)(2) | | | 165,862 | | | | 1,006,782 | |
| | | | | | | | | |
| Electric Vehicle Charging — 2.0% | | | | | | | | |
Chargepoint Holdings, Inc.(2) | | | 17,000 | | | | 211,140 | |
Tritium DCFC Ltd.(1)(2) | | | 185,752 | | | | 297,203 | |
| | | | | | | | 508,343 | |
| Energy Metering & Management — 1.5% | | | | | | | | |
Ameresco, Inc.(2) | | | 5,964 | | | | 390,761 | |
| | | | | | | | | |
| Engineering Metering & Management — 2.2% | | | | | | | | |
Fluence Enercy, Inc.(2) | | | 17,698 | | | | 304,052 | |
STEM, Inc.(2) | | | 19,487 | | | | 254,695 | |
| | | | | | | | 558,747 | |
| Hydrogen Equipment — 2.1% | | | | | | | | |
Nel ASA(1)(2) | | | 338,468 | | | | 527,972 | |
| | | | | | | | | |
| Industrials — 3.3% | | | | | | | | |
Plug Power, Inc.(2) | | | 53,875 | | | | 859,845 | |
| | | | | | | | | |
| IT Services — 5.5% | | | | | | | | |
21Vianet Group, Inc.(1)(2) | | | 170,000 | | | | 851,700 | |
GDS Holdings Ltd.(1)(2) | | | 35,500 | | | | 564,450 | |
| | | | | | | | 1,416,150 | |
| Large Cap Diversified C Corps — 2.7% | | | | | | | | |
| Cheniere Energy, Inc. | | | 2,500 | | | | 438,400 | |
| Oneok, Inc. | | | 4,000 | | | | 267,680 | |
| | | | | | | | 706,080 | |
| LNG Midstream — 5.1% | | | | | | | | |
Nextdecade Corporation(2) | | | 25,000 | | | | 135,750 | |
| Targa Resources Corporation | | | 16,000 | | | | 1,190,240 | |
| | | | | | | | 1,325,990 | |
| Natural Gas Transportation & Storage — 0.9% | | | | | | | | |
| Equitrans Midstream Corporation | | | 28,000 | | | | 234,920 | |
| | | | | | | | | |
| Renewable Distribution — 1.1% | | | | | | | | |
Iberdola S.A.(1) | | | 25,375 | | | | 286,673 | |
See Accompanying Notes to the Financial Statements.
12
NXG NextGen Infrastructure Fund |
Schedule of Investments | November 30, 2022 — (Continued) |
| Common Stock — (Continued) | | Shares | | | Fair Value | |
| Solar Developer — 4.4% | | | | | | | | |
Azure Power Global Ltd.(1)(2) | | | 45,133 | | | $ | 257,709 | |
Sunnova Energy International, Inc.(2) | | | 38,122 | | | | 870,325 | |
| | | | | | | | 1,128,034 | |
| Solar Energy Equipment — 9.9% | | | | | | | | |
Enphase Energy, Inc.(2) | | | 1,200 | | | | 384,708 | |
SolarEdge Technologies, Inc.(2) | | | 3,250 | | | | 971,295 | |
Shoals Technologies Group, Inc. (2) | | | 13,422 | | | | 388,835 | |
Sunrun, Inc.(2) | | | 24,682 | | | | 804,140 | |
| | | | | | | | 2,548,978 | |
| Solar Equipment — 8.8% | | | | | | | | |
FTC Solar Inc.(2) | | | 101,995 | | | | 216,229 | |
Maxeon Solar Technologies Ltd.(1)(2) | | | 33,706 | | | | 775,912 | |
SMA Solar Technology AG(1)(2) | | | 18,825 | | | | 1,268,463 | |
| | | | | | | | 2,260,604 | |
| Solar Generation — 5.8% | | | | | | | | |
Altus Power, Inc.(2) | | | 74,104 | | | | 529,844 | |
Scatec ASA(1) | | | 23,032 | | | | 205,235 | |
Solaria Energia y Medio Ambiente, S.A.(1)(2) | | | 26,683 | | | | 481,847 | |
Sunpower Corporation(2) | | | 11,000 | | | | 266,750 | |
| | | | | | | | 1,483,676 | |
| Towers — 1.0% | | | | | | | | |
| SBA Communications Corporation | | | 896 | | | | 268,173 | |
| | | | | | | | | |
| Wind Energy Equipment — 1.2% | | | | | | | | |
Vestas Wind System(1) | | | 11,500 | | | | 298,796 | |
| | | | | | | | | |
| Wind Generation — 3.5% | | | | | | | | |
Orsted A/S(1)(3) | | | 10,242 | | | | 896,794 | |
| | | | | | | | | |
| YieldCo — 0.9% | | | | | | | | |
Atlantica Sustainable Infrastructure plc(1) | | | 8,000 | | | | 223,200 | |
| | | | | | | | | |
| Total Common Stock (Cost $17,153,943) | | | | | | $ | 18,665,244 | |
| | | | | | | | | |
See Accompanying Notes to the Financial Statements.
13
NXG NextGen Infrastructure Fund |
Schedule of Investments | November 30, 2022 — (Continued) |
| Master Limited Partnerships and Related Companies — 16.3% | | Units | | | Fair Value | |
| Large Cap Diversified C Corps — 1.0% | | | | | | | | |
| Plains All American Pipeline, L.P. | | | 20,000 | | | $ | 248,400 | |
| | | | | | | | | |
| Large Cap MLP — 7.4% | | | | | | | | |
| Energy Transfer, L.P. | | | 100,000 | | | | 1,254,000 | |
| MPLX, L.P. | | | 19,098 | | | | 649,141 | |
| | | | | | | | 1,903,141 | |
| Natural Gas Gathering & Processing — 4.9% | | | | | | | | |
| Crestwood Energy Partners, L.P. | | | 31,006 | | | | 918,398 | |
| Western Midstream Partners, L.P. | | | 12,000 | | | | 335,760 | |
| | | | | | | | 1,254,158 | |
| YieldCo — 3.0% | | | | | | | | |
| NextEra Energy Partners, L.P. | | | 9,700 | | | | 780,753 | |
| | | | | | | | | |
| Total Master Limited Partnerships (Cost $2,947,359) | | | | | | $ | 4,186,452 | |
| | | | | | | | | |
| Real Estate Investment Trusts — 7.0% | | | Shares | | | | | |
| Data Centers — 2.3% | | | | | | | | |
| Digital Reality Trust, Inc. | | | 3,600 | | | $ | 404,856 | |
Keppel DC REIT(1) | | | 144,558 | | | | 197,677 | |
| | | | | | | | 602,533 | |
| Towers — 4.7% | | | | | | | | |
| American Tower Corporation | | | 3,725 | | | | 824,156 | |
| Crown Castle International Corporation | | | 2,742 | | | | 387,801 | |
| | | | | | | | 1,211,957 | |
| Total Real Estate Investment Trusts (Cost $2,058,995) | | | | | | $ | 1,814,490 | |
| | | | | | | | | |
Short-Term Investments —
Investment Companies — 3.6% | | | | | | | | |
First American Government Obligations Fund - Class X, 3.67%(4) | | | 463,600 | | | $ | 463,600 | |
First American Treasury Obligations Fund - Class X, 3.75%(4) | | | 463,600 | | | | 463,600 | |
| Total Short-Term Investments (Cost $927,200) | | | | | | $ | 927,200 | |
| Total Investments — 99.4% (Cost $23,087,497) | | | | | | $ | 25,593,386 | |
| Other Assets in Excess of Liabilities — 0.6% | | | | | | | 154,981 | |
Total Net Assets Applicable to Unitholders — 100.0% | | | | | | $ | 25,748,367 | |
Percentages are stated as a percent of net assets.
(1) | Foreign issued security. Foreign concentration is as follows: Cayman Islands 6.62%, Germany 4.93%, and United Kingdom 4.78%. |
(2) | No distribution or dividend was made during the period ended November 30, 2022. As such, it is classified as a non-income producing security as of November 30, 2022. |
(3) | Securities purchased pursuant to Rule 144A of the Securities Act of 1933, as amended, and may be sold only to dealers in that program or other “qualified institutional buyers.” These securities have been deemed to be liquid by the Fund’s adviser under the supervision of the Board of Directors. As of November 30, 2022, the value of these investments was $896,794 or 3.48% of total net assets. |
(4) | Rate reported is the current yield as of November 30, 2022. |
See Accompanying Notes to the Financial Statements.
14
NXG Global Clean Equity Fund |
Schedule of Investments | November 30, 2022 |
| Common Stock — 94.2% | | Shares | | | Fair Value | |
| Battery Manufacturer — 2.2% | | | | | | | | |
Freyr Battery(1)(2) | | | 21,356 | | | $ | 291,509 | |
| | | | | | | | | |
| Diversified Renewable Generation — 3.4% | | | | | | | | |
Renew Energy Global plc(1)(2) | | | 74,469 | | | | 452,027 | |
| | | | | | | | | |
| Electric Vehicle Charging — 2.5% | | | | | | | | |
ChargePoint Holdings, Inc.(2) | | | 8,000 | | | | 99,360 | |
EVGO, Inc.(2) | | | 10,411 | | | | 66,631 | |
Tritium DCFC Ltd.(1)(2) | | | 101,372 | | | | 162,195 | |
| | | | | | | | 328,186 | |
| Electric Vehicle OEM — 3.6% | | | | | | | | |
Nio, Inc.(1)(2) | | | 13,076 | | | | 167,111 | |
Rivian Automotive, Inc.(2) | | | 5,051 | | | | 161,834 | |
Xpeng, Inc.(1)(2) | | | 13,161 | | | | 142,271 | |
| | | | | | | | 471,216 | |
| Energy Metering & Management — 4.1% | | | | | | | | |
Ameresco, Inc.(2) | | | 3,439 | | | | 225,323 | |
Fluence Energy, Inc.(2) | | | 8,500 | | | | 146,030 | |
Stem, Inc.(2) | | | 13,000 | | | | 169,910 | |
| | | | | | | | 541,263 | |
| Fuel Cell Generation — 4.7% | | | | | | | | |
SMA Solar Technology AG(1)(2) | | | 9,165 | | | | 617,554 | |
| | | | | | | | | |
| Hydrogen Equipment — 3.0% | | | | | | | | |
Nel ASA(1)(2) | | | 251,907 | | | | 392,947 | |
| | | | | | | | | |
| Industrials — 3.3% | | | | | | | | |
Plug Power, Inc.(2) | | | 27,416 | | | | 437,559 | |
| | | | | | | | | |
| Metering & Pumps — 2.1% | | | | | | | | |
| Xylem, Inc. | | | 2,500 | | | | 280,875 | |
| | | | | | | | | |
| New Energy Vehicle — 4.3% | | | | | | | | |
NIU Technologies(1)(2) | | | 62,183 | | | | 238,161 | |
Tesla, Inc.(2) | | | 1,700 | | | | 330,990 | |
| | | | | | | | 569,151 | |
| Renewable Distribution — 2.4% | | | | | | | | |
Iberdola S.A.(1) | | | 28,314 | | | | 319,877 | |
| | | | | | | | | |
| Semiconductor Manufacturing — 0.6% | | | | | | | | |
Wolfspeed, Inc.(2) | | | 900 | | | | 81,828 | |
| | | | | | | | | |
| Smart Grid — 2.1% | | | | | | | | |
Itron, Inc.(2) | | | 1,830 | | | | 97,319 | |
Landis & Gyr Group(1) | | | 2,628 | | | | 183,508 | |
| | | | | | | | 280,827 | |
See Accompanying Notes to the Financial Statements.
15
NXG Global Clean Equity Fund |
Schedule of Investments | November 30, 2022 — (Continued) |
| Common Stock — (Continued) | | Shares | | | Fair Value | |
| Solar Developer — 5.0% | | | | | | | | |
Azure Power Global Ltd.(1)(2) | | | 27,123 | | | $ | 154,872 | |
Sunnova Energy International, Inc.(2) | | | 21,760 | | | | 496,781 | |
| | | | | | | | 651,653 | |
| Solar Energy Equipment — 21.8% | | | | | | | | |
Array Technologies, Inc.(2) | | | 5,280 | | | | 110,563 | |
Enphase Energy, Inc.(2) | | | 1,550 | | | | 496,915 | |
First Solar, Inc.(2) | | | 1,040 | | | | 179,431 | |
Maxeon Solar Technologies Ltd.(1)(2) | | | 21,800 | | | | 501,836 | |
Shoals Technology Group, Inc.(2) | | | 8,000 | | | | 231,760 | |
SolarEdge Technologies, Inc.(2) | | | 2,090 | | | | 624,617 | |
Sunrun, Inc.(2) | | | 22,335 | | | | 727,674 | |
| | | | | | | | 2,872,796 | |
| Solar Equipment — 0.9% | | | | | | | | |
FTC Solar, Inc.(2) | | | 55,698 | | | | 118,080 | |
| | | | | | | | | |
| Solar Generation — 9.1% | | | | | | | | |
Altus Power, Inc.(2) | | | 41,128 | | | | 294,065 | |
Scatec ASA(1) | | | 12,015 | | | | 107,064 | |
Solaria Energia y Medio Ambiente, S.A.(1)(2) | | | 33,579 | | | | 606,377 | |
Sunpower Corporation(2) | | | 8,000 | | | | 194,000 | |
| | | | | | | | 1,201,506 | |
| Solar Materials — 1.2% | | | | | | | | |
JinkoSolar Holding Co., Ltd.(1)(2) | | | 3,000 | | | | 153,840 | |
| | | | | | | | | |
| Utilities — 3.1% | | | | | | | | |
Enel S.p.A.(1) | | | 37,809 | | | | 203,972 | |
RWE AG(1) | | | 4,598 | | | | 202,409 | |
| | | | | | | | 406,381 | |
| Water Tech & Equipment — 1.8% | | | | | | | | |
Energy Recovery, Inc.(2) | | | 5,000 | | | | 115,900 | |
Evoqua Water Technologies Corporation(2) | | | 2,748 | | | | 119,511 | |
| | | | | | | | 235,411 | |
| Wind Energy Equipment — 1.4% | | | | | | | | |
Vestas Wind System(1) | | | 7,000 | | | | 181,876 | |
| | | | | | | | | |
| Wind Generation — 3.9% | | | | | | | | |
Orsted A/S(1)(3) | | | 5,930 | | | | 519,233 | |
| | | | | | | | | |
| YieldCo — 7.7% | | | | | | | | |
Atlantica Sustainable Infrastructure plc(1) | | | 14,000 | | | | 390,600 | |
| Clearway Energy, Inc. | | | 3,344 | | | | 118,511 | |
Innergex Renewable Energy(1) | | | 11,719 | | | | 146,711 | |
| NextEra Energy Partners, L.P. | | | 4,435 | | | | 356,973 | |
| | | | | | | | 1,012,795 | |
| Total Common Stock (Cost $10,760,707) | | | | | | $ | 12,418,390 | |
See Accompanying Notes to the Financial Statements.
16
NXG Global Clean Equity Fund |
Schedule of Investments | November 30, 2022 — (Continued) |
Short-Term Investments —
Investment Companies — 4.3% | | Shares | | | Fair Value | |
First American Government Obligations Fund - Class X, 3.67%(4) | | | 279,846 | | | $ | 279,846 | |
First American Treasury Obligations Fund - Class X, 3.75%(4) | | | 279,846 | | | | 279,846 | |
| Total Short-Term Investments (Cost $559,692) | | | | | | $ | 559,692 | |
Total Investments — 98.5% (Cost $11,320,399) | | | | | | $ | 12,978,082 | |
| Other Assets in Excess of Liabilities — 1.5% | | | | | | | 191,050 | |
Total Net Assets Applicable to Unitholders — 100.0% | | | | | | $ | 13,169,132 | |
Percentages are stated as a percent of net assets.
(1) | Foreign issued security. Foreign concentration is as follows: Spain 7.03%, United Kingdom 6.40%, and Germany 6.23%. |
(2) | No distribution or dividend was made during the period ended November 30, 2022. As such, it is classified as a non-income producing security as of November 30, 2022. |
(3) | Securities purchased pursuant to Rule 144A of the Securities Act of 1933, as amended, and may be sold only to dealers in that program or other “qualified institutional buyers.” These securities have been deemed to be liquid by the Fund’s adviser under the supervision of the Board of Directors. As of November 30, 2022, the value of these investments was $519,233 or 3.94% of total net assets. |
(4) | Rate reported is the current yield as of November 30, 2022. |
See Accompanying Notes to the Financial Statements.
17
Cushing Mutual Funds Trust Statements of Assets & Liabilities November 30, 2022 |
| | | NXG NextGen
Infrastructure
Fund | | | NXG Global
Clean Equity
Fund | |
Assets | | | | | | | | |
Investments at fair value (1) | | $ | 25,593,386 | | | $ | 12,978,082 | |
Receivable from Adviser, net | | | 282 | | | | 1,776 | |
Receivable for investments sold | | | — | | | | 176,520 | |
Foreign currency at fair value(2) | | | 45,593 | | | | — | |
Receivable for shares sold | | | 133,250 | | | | 192,050 | |
Interest receivable | | | 751 | | | | 534 | |
Dividends receivable | | | 9,937 | | | | 8,208 | |
Prepaid expenses | | | 65,268 | | | | 15,987 | |
Total assets | | | 25,848,467 | | | | 13,373,157 | |
Liabilities | | | | | | | | |
Payable for investments purchased | | | — | | | | 82,625 | |
Payable for Fund shares redeemed | | | 3,528 | | | | 30,988 | |
Payable for 12b-1 distribution fee | | | 457 | | | | 1,530 | |
Accrued expenses and other liabilities | | | 96,115 | | | | 88,882 | |
Total liabilities | | | 100,100 | | | | 204,025 | |
Net assets | | $ | 25,748,367 | | | $ | 13,169,132 | |
Net Assets Consist of | | | | | | | | |
Additional paid-in capital | | $ | 27,993,317 | | | $ | 17,486,737 | |
Total distributable earnings/(deficits) | | | (2,244,950) | | | | (4,317,605) | |
Net assets | | $ | 25,748,367 | | | $ | 13,169,132 | |
Unlimited shares authorized, no par value | | Class A | | | Class A | |
Net assets | | $ | 558,998 | | | $ | 74,674 | |
Shares issued and outstanding | | | 31,579 | | | | 5,740 | |
Net asset value, redemption price and minimum offering price per share | | $ | 17.70 | | | $ | 13.01 | |
Maximum offering price per share (3) | | $ | 18.73 | | | $ | 13.77 | |
| | | | | | | | | |
| | | Class I | | | Class I | |
Net assets | | $ | 25,189,369 | | | $ | 13,094,458 | |
Shares issued and outstanding | | | 1,397,019 | | | | 998,996 | |
Net asset value, redemption price and minimum offering price per share | | $ | 18.03 | | | $ | 13.11 | |
| | | | | | | | | | | | | |
(1) Investments, at cost | | $ | 23,087,497 | | | $ | 11,320,399 | |
(2) | Foreign currency, at cost |
(3) | The offering price is calculated by dividing the net asset value by 1 minus the maximum sales charge of 5.50% for NextGen and 5.50% for Clean. |
See Accompanying Notes to the Financial Statements.
18
Cushing Mutual Funds Trust Statements of Operations Fiscal Year Ended November 30, 2022 |
| | | NXG NextGen
Infrastructure
Fund | | | NXG Global
Clean Equity
Fund | |
Investment Income | | | | | | | | |
Distributions and dividends | | $ | 634,688 | | | $ | 106,831 | |
Less: return of capital on distributions | | | (455,645) | | | | (78,433) | |
Less: foreign taxes withheld | | | (16,554) | | | | (6,831) | |
Distribution and dividend income | | | 162,489 | | | | 21,567 | |
Interest income | | | 2,877 | | | | 2,377 | |
Total Investment Income | | | 165,366 | | | | 23,944 | |
Expenses | | | | | | | | |
Advisory fees | | | 223,797 | | | | 121,047 | |
Accounting and Administrator fees | | | 121,875 | | | | 112,742 | |
Transfer agent expense | | | 66,352 | | | | 55,099 | |
Professional fees | | | 57,197 | | | | 47,562 | |
Blue sky expense | | | 44,842 | | | | 44,940 | |
Trustees’ fees | | | 42,458 | | | | 24,969 | |
Custodian fees and expenses | | | 21,590 | | | | 15,300 | |
Insurance expense | | | 13,619 | | | | 7,287 | |
Reports to shareholders | | | 11,253 | | | | 7,208 | |
Other expense | | | 4,005 | | | | 757 | |
Registration fees | | | 2,205 | | | | 1,912 | |
12b-1 distribution fee - Class A | | | 1,548 | | | | 247 | |
Total expenses | | | 610,741 | | | | 439,070 | |
Less: expense waived by Adviser | | | (276,074) | | | | (274,296) | |
Net expenses | | | 334,667 | | | | 164,774 | |
Net Investment Loss | | | (169,301) | | | | (140,830) | |
Realized and Unrealized Gain (Loss) on Investments | | | | | | | | |
Net realized loss on investments | | | (4,150,945) | | | | (5,678,416) | |
Net change in unrealized appreciation/(depreciation) on investments and foreign currency | | | 2,540,989 | | | | (613,886) | |
Net Realized and Unrealized Loss on Investments | | | (1,609,956) | | | | (6,292,302) | |
Net Decrease in Net Assets Applicable to Shareholders Resulting from Operations | | $ | (1,779,257) | | | $ | (6,433,132) | |
See Accompanying Notes to the Financial Statements.
19
Cushing Mutual Funds Trust Statements of Changes in Net Assets |
| | | NXG NextGen Infrastructure Fund | | | NXG Global Clean Equity Fund | |
| | | Fiscal Year
Ended
November 30,
2022 | | | Fiscal Year
Ended
November 30,
2021 | | | Fiscal Year
Ended
November 30,
2022 | | | Fiscal Year
Ended
November 30,
2021 | |
Operations | | | | | | | | | | | | | | | | |
Net investment loss | | $ | (169,301) | | | $ | (29,136) | | | $ | (140,830) | | | $ | (66,396) | |
Net realized gain (loss) on investments | | | (4,150,945) | | | | 3,609,853 | | | | (5,678,416) | | | | 2,583,836 | |
Net change in unrealized appreciation/(depreciation) on investments and foreign currency | | | 2,540,989 | | | | (3,551,180) | | | | (613,886) | | | | (2,340,154) | |
Net increase (decrease) in net assets applicable to shareholders resulting from operations | | | (1,779,257) | | | | 29,537 | | | | (6,433,132) | | | | 177,286 | |
Distributions to Class A Shareholders | | | | | | | | | | | | | | | | |
Distributions from distributable earnings | | | (35,446) | | | | (31,545) | | | | (18,284) | | | | (5,527) | |
Return of capital | | | (21,863) | | | | — | | | | (1,363) | | | | — | |
Distributions to Class I Shareholders | | | | | | | | | | | | | | | | |
Distributions from distributable earnings | | | (1,396,182) | | | | (926,454) | | | | (2,041,975) | | | | (310,023) | |
Return of capital | | | (861,180) | | | | — | | | | (152,232) | | | | — | |
Total dividends and distributions to Fund shareholders | | | (2,314,671) | | | | (957,999) | | | | (2,213,854) | | | | (315,550) | |
Capital Share Transactions | | | | | | | | | | | | | | | | |
Proceeds from shareholder subscriptions | | | 865,739 | | | | 25,691,473 | | | | 1,384,577 | | | | 17,751,215 | |
Dividend reinvestments | | | 1,300,543 | | | | 582,756 | | | | 1,071,465 | | | | 200,926 | |
Payments for redemptions | | | (6,871,804) | | | | (6,148,448) | | | | (3,450,188) | | | | (6,034,753) | |
Net increase (decrease) in net assets from capital share transactions | | | (4,705,522) | | | | 20,125,781 | | | | (994,146) | | | | 11,917,388 | |
Total increase (decrease) in net assets | | | (8,799,450) | | | | 19,197,319 | | | | (9,641,132) | | | | 11,779,124 | |
Net Assets | | | | | | | | | | | | | | | | |
Beginning of fiscal year | | | 34,547,817 | | | | 15,350,498 | | | | 22,810,264 | | | | 11,031,140 | |
End of fiscal year | | $ | 25,748,367 | | | $ | 34,547,817 | | | $ | 13,169,132 | | | $ | 22,810,264 | |
See Accompanying Notes to the Financial Statements.
20
NXG NextGen Infrastructure Fund Financial Highlights |
Class A Shares | | Fiscal Year
Ended
November 30,
2022 | | | Fiscal Year
Ended
November 30,
2021 | | | Fiscal Year
Ended
November 30,
2020 | | | Fiscal Year
Ended
November 30,
2019 | | | Period From
December 18,
2017(1)
through
November 30,
2018 | |
Per Common Share Data (2) | | | | | | | | | | | | | | | | | | | | |
Net Asset Value, beginning of period | | $ | 20.08 | | | $ | 19.99 | | | $ | 15.33 | | | $ | 18.08 | | | $ | 20.00 | |
Income from Investment Operations: | | | | | | | | | | | | | | | | | | | | |
Net investment income (loss) (3) | | | (0.11 | ) | | | (0.08 | ) | | | 0.03 | | | | (0.19 | ) | | | 0.12 | |
Net realized and unrealized gain (loss) on investments | | | (0.81 | ) | | | 1.22 | | | | 5.14 | | | | (1.46 | ) | | | (1.07 | ) |
Net increase (decrease) from investment operations | | | (0.92 | ) | | | 1.14 | | | | 5.17 | | | | (1.65 | ) | | | (0.95 | ) |
Less Distributions to Common Stockholders: | | | | | | | | | | | | | | | | | | | | |
Net investment income | | | (0.90 | ) | | | (1.05 | ) | | | (0.51 | ) | | | — | | | | (0.09 | ) |
Return of capital | | | (0.56 | ) | | | — | | | | — | | | | (1.10 | ) | | | (0.88 | ) |
Total distributions to common stockholders | | | (1.46 | ) | | | (1.05 | ) | | | (0.51 | ) | | | (1.10 | ) | | | (0.97 | ) |
Net Asset Value, end of period | | $ | 17.70 | | | $ | 20.08 | | | $ | 19.99 | | | $ | 15.33 | | | $ | 18.08 | |
Total Investment Return (5) | | | (4.46 | )% | | | 5.77 | % | | | 34.34 | % | | | (9.49 | )% | | | (5.06 | )%(4) |
Supplemental Data and Ratios | | | | | | | | | | | | | | | | | | | | |
Net assets applicable to common stockholders, end of period (000’s) | | $ | 559 | | | $ | 864 | | | $ | 436 | | | $ | 444 | | | $ | 252 | |
Ratio of expenses to average net assets before waiver | | | 2.55 | % | | | 2.65 | % | | | 4.02 | % | | | 2.82 | % | | | 2.20 | %(6) |
Ratio of expenses to average net assets after waiver | | | 1.50 | % | | | 1.50 | % | | | 1.50 | % | | | 1.75 | % | | | 1.75 | %(6) |
Ratio of net investment income (loss) to average net assets after waiver | | | (0.64 | )% | | | (0.39 | )% | | | 0.21 | % | | | (1.09 | )% | | | 0.85 | %(6) |
Portfolio turnover rate (7) | | | 241.02 | % | | | 177.18 | % | | | 314.43 | % | | | 74.23 | % | | | 76.11 | %(4) |
(1) | Commencement of operations. |
(2) | Information presented relates to a Class A share outstanding for the entire period. |
(3) | Calculated using average shares outstanding method. |
(5) | Total investment return does not include the impact of the front-end sales load. |
(6) | Annualized for periods less than one full year. |
(7) | Portfolio turnover is calculated on the basis of the fund as a whole. |
See Accompanying Notes to the Financial Statements.
21
NXG NextGen Infrastructure Fund Financial Highlights |
Class I Shares | | Fiscal Year
Ended
November 30,
2022 | | | Fiscal
Year Ended
November 30,
2021 | | | Fiscal
Year Ended
November 30,
2020 | | | Fiscal
Year Ended
November 30,
2019 | | | Fiscal
Year Ended
November 30,
2018(1) | |
Per Common Share Data (2) | | | | | | | | | | | | | | | | | | | | |
Net Asset Value, beginning of fiscal year | | $ | 20.37 | | | $ | 20.22 | | | $ | 15.46 | | | $ | 18.14 | | | $ | 19.51 | |
Income from Investment Operations: | | | | | | | | | | | | | | | | | | | | |
Net investment income (loss) (3) | | | (0.11 | ) | | | (0.03 | ) | | | 0.08 | | | | (0.15 | ) | | | 0.14 | |
Net realized and unrealized gain (loss) on investments | | | (0.77 | ) | | | 1.23 | | | | 5.19 | | | | (1.43 | ) | | | (0.31 | ) |
Net increase (decrease) from investment operations | | | (0.88 | ) | | | 1.20 | | | | 5.27 | | | | (1.58 | ) | | | (0.17 | ) |
Less Distributions to Common Stockholders: | | | | | | | | | | | | | | | | | | | | |
Net investment income | | | (0.90 | ) | | | (1.05 | ) | | | (0.51 | ) | | | — | | | | (0.09 | ) |
Return of capital | | | (0.56 | ) | | | — | | | | — | | | | (1.10 | ) | | | (1.11 | ) |
Total distributions to common stockholders | | | (1.46 | ) | | | (1.05 | ) | | | (0.51 | ) | | | (1.10 | ) | | | (1.20 | ) |
Net Asset Value, end of fiscal year | | $ | 18.03 | | | $ | 20.37 | | | $ | 20.22 | | | $ | 15.46 | | | $ | 18.14 | |
Total Investment Return | | | (4.19 | )% | | | 5.95 | % | | | 34.77 | % | | | (9.07 | )% | | | (1.17 | )% |
Supplemental Data and Ratios | | | | | | | | | | | | | | | | | | | | |
Net assets applicable to common stockholders, end of fiscal year (000’s) | | $ | 25,189 | | | $ | 33,683 | | | $ | 14,915 | | | $ | 13,228 | | | $ | 61,119 | |
Ratio of expenses to average net assets before waiver | | | 2.30 | % | | | 2.39 | % | | | 3.77 | % | | | 2.57 | % | | | 1.91 | % |
Ratio of expenses to average net assets after waiver | | | 1.25 | % | | | 1.25 | % | | | 1.25 | % | | | 1.50 | % | | | 1.50 | % |
Ratio of net investment income (loss) to average net assets after waiver | | | (0.64 | )% | | | (0.13 | )% | | | 0.46 | % | | | (0.84 | )% | | | 0.69 | % |
Portfolio turnover rate (4) | | | 241.02 | % | | | 177.18 | % | | | 314.43 | % | | | 74.23 | % | | | 76.11 | %(5) |
(1) | On December 18, 2017, The Cushing® MLP Infrastructure Fund I (the “Predecessor Fund”) was reorganized into The Cushing® MLP Infrastructure Fund. Information presented prior to December 18, 2017 is that of the Predecessor Fund. Per share amounts for the period prior to December 15, 2017 have been adjusted for a share conversion that occurred effective with the reorganization on December 15, 2017. The effect of the share conversion in connection with the reorganization was to multiply the number of outstanding shares of the Fund by the respective conversion factor of 35.809, with a corresponding decrease in the net asset value per share. This transaction did not change the net assets of the Fund or the value of a shareholder’s investment. |
(2) | Information presented relates to a Class I share outstanding for the entire fiscal year. |
(3) | Calculated using average shares outstanding method. |
(4) | Portfolio turnover is calculated on the basis of the fund as a whole without distinguishing between the classes of shares issued. |
(5) | Covers the period from December 18, 2017 through November 30, 2018, subsequent to the reorganization of the Predecessor Fund into the Fund. |
See Accompanying Notes to the Financial Statements.
22
NXG Global Clean Equity Fund Financial Highlights |
Class A Shares | | Fiscal
Year Ended
November 30,
2022 | | | Fiscal
Year Ended
November 30,
2021 | | | Period From
January 31,
2020(1)
through
November 30,
2020 | |
Per Common Share Data (2) | | | | | | | | | | | | |
Net Asset Value, beginning of period | | $ | 20.93 | | | $ | 20.52 | | | $ | 10.00 | |
Income from Investment Operations: | | | | | | | | | | | | |
Net investment loss (3) | | | (0.17 | ) | | | (0.17 | ) | | | (0.08 | ) |
Net realized and unrealized gain (loss) on investments | | | (5.67 | ) | | | 1.13 | | | | 10.69 | |
Net increase (decrease) from investment operations | | | (5.84 | ) | | | 0.96 | | | | 10.61 | |
Less Distributions to Common Stockholders: | | | | | | | | | | | | |
Net investment income | | | (1.94 | ) | | | (0.55 | ) | | | (0.09 | ) |
Return of capital | | | (0.14 | ) | | | — | | | | — | |
Total distributions to common stockholders | | | (2.08 | ) | | | (0.55 | ) | | | (0.09 | ) |
Net Asset Value, end of period | | $ | 13.01 | | | $ | 20.93 | | | $ | 20.52 | |
Total Investment Return (5) | | | (29.81 | )% | | | 4.65 | % | | | 106.34 | %(4) |
Supplemental Data and Ratios | | | | | | | | | | | | |
Net assets applicable to common stockholders, end of period (000’s) | | $ | 75 | | | $ | 205 | | | $ | 231 | |
Ratio of expenses to average net assets before waiver | | | 3.33 | % | | | 3.18 | % | | | 6.40 | %(6) |
Ratio of expenses to average net assets after waiver | | | 1.40 | % | | | 1.35 | % | | | 1.40 | %(6) |
Ratio of net investment loss to average net assets after waiver | | | (1.24 | )% | | | (0.78 | )% | | | (0.66 | )%(6) |
Portfolio turnover rate (7) | | | 118.40 | % | | | 88.38 | % | | | 39.68 | %(4) |
(1) | Commencement of operations. |
(2) | Information presented relates to a Class A share outstanding for the entire period. |
(3) | Calculated using average shares outstanding method. |
(5) | Total investment return does not include the impact of the front-end sales load. |
(6) | Annualized for periods less than one full year. |
(7) | Portfolio turnover is calculated on the basis of the fund as a whole. |
See Accompanying Notes to the Financial Statements.
23
NXG Global Clean Equity Fund Financial Highlights |
Class I Shares | | Fiscal
Year Ended
November 30,
2022 | | | Fiscal
Year Ended
November 30,
2021 | | | Period From
January 31,
2020(1)
through
November 30,
2020 | |
Per Common Share Data (2) | | | | | | | | | | | | |
Net Asset Value, beginning of period | | $ | 21.02 | | | $ | 20.56 | | | $ | 10.00 | |
Income from Investment Operations: | | | | | | | | | | | | |
Net investment loss (3) | | | (0.14 | ) | | | (0.11 | ) | | | (0.05 | ) |
Net realized and unrealized gain (loss) on investments | | | (5.69 | ) | | | 1.12 | | | | 10.70 | |
Net increase (decrease) from investment operations | | | (5.83 | ) | | | 1.01 | | | | 10.65 | |
Less Distributions to Common Stockholders: | | | | | | | | | | | | |
Net investment income | | | (1.94 | ) | | | (0.55 | ) | | | (0.09 | ) |
Return of capital | | | (0.14 | ) | | | — | | | | — | |
Total distributions to common stockholders | | | (2.08 | ) | | | (0.55 | ) | | | (0.09 | ) |
Net Asset Value, end of period | | $ | 13.11 | | | $ | 21.02 | | | $ | 20.56 | |
Total Investment Return | | | (29.61 | )% | | | 4.89 | % | | | 106.74 | %(4) |
Supplemental Data and Ratios | | | | | | | | | | | | |
Net assets applicable to common stockholders, end of period (000’s) | | $ | 13,094 | | | $ | 22,606 | | | $ | 10,800 | |
Ratio of expenses to average net assets before waiver | | | 3.08 | % | | | 2.93 | % | | | 6.15 | %(5) |
Ratio of expenses to average net assets after waiver | | | 1.15 | % | | | 1.10 | % | | | 1.15 | %(5) |
Ratio of net investment loss to average net assets after waiver | | | (0.99 | )% | | | (0.53 | )% | | | (0.41 | )%(5) |
Portfolio turnover rate (6) | | | 118.40 | % | | | 88.38 | % | | | 39.68 | %(4) |
(1) | Commencement of operations. |
(2) | Information presented relates to a Class I share outstanding for the entire period. |
(3) | Calculated using average shares outstanding method. |
(5) | Annualized for periods less than one full year. |
(6) | Portfolio turnover is calculated on the basis of the fund as a whole. |
See Accompanying Notes to the Financial Statements.
24
Cushing Mutual Funds Trust Notes to Financial Statements November 30, 2022 |
1. Organization
Cushing® Mutual Funds Trust (the “Trust”) was organized as a Delaware statutory trust on September 12, 2017 and is governed by a Declaration of Trust. The Trust is registered under the Investment Company Act of 1940, as amended (the “1940 Act”), as an open-end management investment company, and is comprised of two series (collectively referred to as the “Funds” and each individually, referred to as a “Fund”). These financial statements and notes relate to the NXG NextGen Infrastructure Fund (“NextGen”) and the NXG Global Clean Equity Fund (“Clean”), each series of the Trust. The Funds are managed by Cushing® Asset Management, LP, d/b/a NXG Investment Management (the “Adviser”).
NextGen’s investment objective is to seek current income and capital appreciation. NextGen commenced operations on December 18, 2017 following the completion of the reorganization of The Cushing MLP Infrastructure Fund I (the “Predecessor Fund”) with and into NextGen. The Predecessor Fund commenced operations on March 1, 2010. NextGen offers two classes of shares, Class A and Class I. Class A shares are subject to a maximum 5.50% front-end sales charge. Class I shares have no sales charge. The Fund pays distribution (12b-2) and/or service fees with respect to Class A shares at an annual rate of 0.25% of average daily net assets. The accounting and performance history of the Predecessor Fund were re-designated as that of the Class I Shares of NextGen.
Clean’s investment objective is to seek capital appreciation. Clean commenced operations on January 31, 2020. Clean offers two classes of shares, Class A and Class I. Class A shares are subject to a maximum 5.50% front-end sales charge. Class I shares have no sales charge. The Fund pays distribution (12b-2) and/or service fees with respect to Class A shares at an annual rate of 0.25% of average daily net assets.
2. Significant Accounting Policies
A. Basis of Presentation
The following is a summary of significant accounting policies, consistently followed by the Funds in preparation of the financial statements. Each Fund is considered an investment company and, accordingly, follows the investment company accounting and reporting guidance of the Financial Accounting Standards Board Accounting Standard Codification Topic 946, Financial Services - Investment Companies, which is part of U.S. Generally Accepted Accounting Principles (“U.S. GAAP”).
B. Use of Estimates
The preparation of financial statements in conformity with U.S. GAAP requires management to make estimates and assumptions that affect the reported amount of assets and liabilities, recognition of distribution income and disclosure of contingent assets and liabilities at the date of the financial statements. Actual results could differ from those estimates.
C. Investment Valuation
The Board of Trustees has designated the Adviser as the “valuation designee” for the Funds pursuant to Rule 2a-5 under the 1940 Act. The valuation designee is responsible for making fair value determinations pursuant to Valuation Policies and Procedures adopted by the Adviser and the Trust (the “Valuation Policy”). A committee of voting members comprised of senior personnel of the Adviser considers various pricing issues and establishes fair valuations of portfolio securities and other instruments held by the Funds in accordance with the Valuation Policy (the “Valuation Committee”). The Adviser as valuation designee is subject to monitoring and oversight by the Board of Trustees. As a general principle, the fair value of a portfolio instrument is the amount that an owner might reasonably expect to receive upon the instrument’s current sale. A range of factors and analysis may
25
be considered when determining fair value, including relevant market data, interest rates, credit considerations and/or issuer specific news. The Valuation Committee may consult with and receive input from third parties and will utilize a variety of market data including yields or prices of investments of comparable quality, type of issue, coupon, maturity, rating, indications of value from security dealers, evaluations of anticipated cash flows or collateral, spread over U.S. Treasury obligations, and other information and analysis. In addition, the Valuation Committee may consider valuations provided by valuation firms retained to assist in the valuation of certain of the Funds’ investments. Fair valuation involves subjective judgments. While the Funds’ use of fair valuation is intended to result in calculation of net asset value that fairly reflects values of the Funds’ portfolio securities as of the time of pricing, the Funds cannot guarantee that any fair valuation will, in fact, approximate the amount the Funds would actually realize upon the sale of the securities in question. It is possible that the fair value determined for a portfolio instrument may be materially different from the value that could be realized upon the sale of that instrument.
The valuation designee use the following valuation methods to determine value for investments for which market quotations are available, or if not available, the fair value, as determined in good faith pursuant to the Valuation Policy. The valuation of the portfolio securities of each Fund currently includes the following processes:
(i) The market value of each security listed or traded on any recognized securities exchange or automated quotation system will be the last reported sale price at the relevant valuation date on the composite tape or on the principal exchange on which such security is traded except those listed on the NASDAQ Global Market®, NASDAQ Global Select Market® and the NASDAQ Capital Market® exchanges (collectively, “NASDAQ”). Securities traded on NASDAQ will be valued at the NASDAQ Official Closing Price (“NOCP”). If no sale is reported on that date, the security will be valued at the last reported bid price. If the Valuation Committee (the “Committee”) determines that price is not representative of the actual market price, the Committee may determine the fair value of the security.
(ii) Securities not traded on a U.S. exchange or NASDAQ and foreign securities that are traded on foreign exchanges whose operations are similar to the U.S. over-the-counter market will be valued at prices supplied by a pricing service. If the Committee determines that price is not representative of the actual market price, the Committee may determine the fair value of the security.
(iii) Debt securities will be valued based on evaluated mean prices by an outside pricing service that employs a pricing model that takes into account bids, yield spreads, and/or other market data and specific security characteristics (e.g., credit quality, maturity and coupon rate). If a price cannot be obtained from pricing services, quotes from market makers or brokers may be used. When possible, more than one market maker or broker should be utilized and the mean of bid and ask prices should be used.
(iv) Private Placements in Public Entities (“PIPES”) will be valued using the price of the publicly traded common stock as a baseline, deducting the discount realized on the original purchase and amortizing the difference over the restricted period.
(v) Listed options on debt or equity securities are valued at the last sale price or, if there are no trades for the day, the mean of the closing bid price and ask price. Unlisted options on debt or equity securities are valued based upon their composite bid prices if held long, or their composite ask prices if held short. Futures are valued at the settlement price. Premiums for the sale of options written by an investment company registered under the 1940 Act (a “Registered Fund”) will be included in the assets of such Registered Fund, and the market value of such options will be included as a liability.
(vi) For valuation purposes, quotations of foreign portfolio securities, other assets and liabilities and forward contracts stated in foreign currency are as of the close of regular trading on the Exchange each day the Exchange is open for trading (or earlier as may be specified by the Registered Fund) and translated into U.S. dollar equivalents at the current prevailing market rates as quoted by a pricing service.
26
(vii) Foreign securities are valued using “fair value factors”. Fair value factors consider daily trade activity and price changes for depositary receipts, exchange-traded funds, index futures, foreign currency exchange activity, or other relevant market data.
(viii) Over-the-counter options on foreign securities and currencies are fair valued by obtaining the “last available bid” from a single dealer that is either the writer or purchaser of the option.
(ix) Swaps will be valued using market-based prices provided by pricing services or broker-dealer bid counterparty quotations.
(x) Whenever trading in a listed security held in a portfolio is temporarily suspended, halted or delisted from an exchange, the security may be priced using the last closing price for a period of up to 5 business days. The Committee will continue to monitor the security during this period and, if there is a belief that the last closing price does not reflect the fair value of such security, then the value of such security will be determined by the Committee based on factors the Committee deems relevant. Whenever any such valuation determination is made, the Committee will monitor the market and other sources of information available to it in order to ascertain whether any change in circumstance would suggest a change in the value so determined.
D. Security Transactions, Investment Income and Expenses
Security transactions are accounted for on the date the securities are purchased or sold (trade date). Realized gains and losses are reported on a high cost basis. Interest income is recognized on an accrual basis, including amortization of premiums and accretion of discounts. Distributions and dividends (collectively, referred to as “Distributions”) are recorded on the ex-dividend date.
Distributions received from NextGen’s investments in master limited partnerships (“MLPs”) and real estate investment trusts (“REITs”) generally are comprised of ordinary income, capital gains and return of capital. For financial statement purposes, NextGen uses return of capital and income estimates to allocate the Distribution income received. Such estimates are based on historical information available from each MLP and REIT and other industry sources. These estimates may subsequently be revised based on information received from the MLPs and REITs after their tax reporting periods are concluded, as the actual character of these Distributions is not known until after NextGen’s fiscal year end.
The Funds estimate the allocation of investment income and return of capital for the Distributions received from its portfolio investments within the Statement of Operations. For the fiscal year ended November 30, 2022, NextGen has estimated approximately 73% of the Distributions from its portfolio investments to be return of capital. For the fiscal year ended November 30, 2022, Clean has estimated approximately 73% of the Distributions from its portfolio investments to be return of capital.
Expenses are recorded on an accrual basis. Each Fund offers multiple classes of shares which differ in their respective distribution fees. All shareholders bear the common expenses of each Fund. No class has preferential dividend rights; differences in per share dividend rates are generally due to differences in class-specific expenses. Income, non-class specific expenses, and realized and unrealized gains and losses are allocated daily to each class of shares based on the value of total shares outstanding of each class without distinction between share classes. Expenses attributable to a particular class of shares, such as distribution fees, are allocated directly to that class.
E. Distributions to Shareholders
Distributions to common shareholders are recorded on the ex-dividend date. The character of Distributions to common shareholders made during the period may differ from their ultimate characterization for federal income tax purposes.
27
For the fiscal year ended November 30, 2021, NextGen’s Distributions were 100%, or $957,999 ordinary income. For the fiscal year ended November 30, 2022, NextGen’s Distributions were expected to be 60%, or $1,395,345 ordinary income, 2%, or $36,280 long term capital gain, and 38%, or $883,043 return of capital.
For the fiscal year ended November 30, 2021, Clean’s Distributions were 100%, or $315,550 ordinary income. For the fiscal year ended November 30, 2022, Clean’s Distributions were expected to be 84%, or $1,857,807 ordinary income, 9%, or $202,452 long term capital gain, and 7%, or $153,595 return of capital.
For Federal income tax purposes, Distributions of short-term capital gains are treated as ordinary income distributions. In addition, on an annual basis, each Fund may distribute additional capital gains in the last calendar quarter, if necessary, to meet minimum distribution requirements and thus avoid being subject to excise taxes. The final character of Distributions paid for the fiscal year ended November 30, 2022 will be determined in early 2023.
Each shareholder will automatically be a participant under the Fund’s Dividend Reinvestment Plan (the “DRIP”) and have all income distributions and capital gains distributions automatically reinvested in shares, unless a shareholder otherwise elects to receive distributions in cash. Generally, for U.S. federal income tax purposes, shareholders receiving shares under the DRIP will be treated as having received a distribution equal to the amount of cash they would have received had the shareholder not participated in the DRIP.
F. Federal Income Taxation
Each Fund intends to qualify each year for special tax treatment afforded to a regulated investment company (“RIC”) under Subchapter M of the Internal Revenue Code of 1986, as amended (“IRC”). In order to qualify as a RIC, each Fund must, among other things, satisfy income, asset diversification and distribution requirements. As long as it so qualifies, each Fund will not be subject to U.S. federal income tax to the extent that it distributes annually its investment company taxable income (which includes ordinary income and the excess of net short-term capital gain over net long-term capital loss) and its “net capital gain” (i.e., the excess of net long-term capital gain over net short-term capital loss). Each Fund intends to distribute at least annually, substantially all of such income and gain. If a Fund retains any investment company taxable income or net capital gain, it will be subject to U.S. federal income tax on the retained amount at regular corporate tax rates. In addition, if a Fund fails to qualify as a RIC for any taxable year, it will be subject to U.S. federal income tax on all of its income and gains at regular corporate tax rates.
Each Fund recognizes in the financial statements the impact of a tax position, if that position is more-likely-than-not to be sustained on examination by the taxing authorities, based on the technical merits of the position. Tax benefits resulting from such a position are measured as the amount that has a greater than fifty percent likelihood on a cumulative basis to be sustained on examination.
G. Cash and Cash Equivalents
The Funds consider all highly liquid investments purchased with initial maturity equal to or less than three months to be cash equivalents.
H. Indemnification
Under the Trust’s organizational documents, its officers and trustees are indemnified against certain liabilities arising out of the performance of their duties to the Trust and each Fund. In addition, in the normal course of business, the Trust may enter into contracts that provide general indemnification to other parties. The Trust’s maximum exposure under such indemnification arrangements is unknown, as this would involve future claims that may be made against the Trust that have not yet occurred and may not occur. However, the Trust has not had prior claims or losses pursuant to these contracts and expects the risk of loss to be remote.
28
I. Master Limited Partnerships
At November 30, 2022, NextGen had 16.3% of its net assets invested in MLPs and non-MLP midstream companies. As of November 30, 2022, NextGen invested less than 25% of its total assets in securities of MLPs that qualify as publicly traded partnerships under the IRC. Entities commonly referred to as MLPs are generally organized under state law as limited partnerships or limited liability companies. NextGen invests in MLPs receiving partnership taxation treatment under the IRC, and whose interests or “units” are traded on securities exchanges like shares of corporate stock. To be treated as a partnership for U.S. federal income tax purposes, an MLP whose units are traded on a securities exchange must receive at least 90% of its income from qualifying sources such as interest, dividends, real property rents, gains on dispositions of real property, income and gains from mineral or natural resources activities, income and gains from the transportation or storage of certain fuels, and, in certain circumstances, income and gains from commodities or futures, forwards and options on commodities. Mineral or natural resources activities include exploration, development, production, processing, mining, refining, marketing and transportation (including pipelines) of oil and gas, minerals, geothermal energy, fertilizer, timber or industrial source carbon dioxide. An MLP consists of a general partner and limited partners (or in the case of MLPs organized as limited liability companies, a managing member and members). The general partner or managing member typically controls the operations and management of the MLP and has an ownership stake in the partnership or limited liability company. The limited partners or members, through their ownership of limited partner or member interests, provide capital to the entity, are intended to have no role in the operation and management of the entity and receive cash distributions. NextGen’s investments in MLPs consist only of limited partner or member interest ownership. The MLPs themselves generally do not pay U.S. federal income taxes. Thus, unlike investors in corporate securities, direct MLP investors are generally not subject to double taxation (i.e., corporate level tax and tax on corporate dividends). Currently, most MLPs operate in the energy and/or natural resources sector.
J. Real Estate Investment Trusts
The Funds may own shares of real estate investment trusts (“REITs”) which report information on the source of their distributions annually. The Funds re-characterize distributions received from REIT investments based on information provided by the REITs into the following categories: ordinary income, long-term capital gains, and return of capital. If information is not available on a timely basis from the REITs, the re-characterization will be estimated based on available information, which may include the previous year allocation. If new or additional information becomes available from the REITs at a later date, a re-characterization will be made the following year.
K. Foreign Currency
The Funds may invest in U.S. dollar-denominated and non-U.S. dollar denominated equity and debt securities of foreign issuers. Generally, foreign securities are issued by companies organized outside the U.S. and are traded primarily in markets outside the U.S., but foreign debt securities may be traded on bond markets or over-the-counter markets in the U.S. Foreign securities may be more difficult to sell than U.S. securities. Investments in foreign securities may involve difficulties in receiving or interpreting financial and economic information, possible imposition of taxes, higher brokerage and custodian fees, possible currency exchange controls or other government restrictions, including possible seizure or nationalization of foreign deposits or assets. Foreign securities may also be less liquid and more volatile than U.S. securities. There may also be difficulty in invoking legal protections across borders. In addition, investments in emerging market countries present risks to a greater degree than those presented by investments in countries with developed securities markets and more advanced regulatory systems. NextGen’s and Clean’s investment in foreign securities represented 38.4% and 46.6% of their net assets, respectively, for the fiscal year ended November 30, 2022.
3. Concentrations of Risk
Because NextGen and Clean will be concentrated in the group of industries constituting the energy and energy infrastructure sectors, each Fund will be more susceptible to the risks associated with those sectors than if it were more broadly diversified over numerous industries and sectors of the economy. Companies in the energy
29
and energy infrastructure sectors may be affected by fluctuations in the prices of energy commodities. The highly cyclical nature of the industries in which companies in the energy and energy infrastructure sectors operate may adversely affect the earnings or operating cash flows of such companies or the ability of such companies to borrow money or raise capital needed to fund their continued operations. A significant decrease in the production of energy commodities could reduce the revenue, operating income and operating cash flows of certain companies in the energy and energy infrastructure sectors and, therefore, their ability to make distributions or pay dividends. A sustained decline in demand for energy commodities could adversely affect the revenues and cash flows of certain companies in the energy and energy infrastructure sectors. General changes in market sentiment towards the energy and energy infrastructure sectors may adversely affect NextGen and Clean, and the performance of investments in the energy and energy infrastructure sectors may lag behind the broader market as a whole. The energy markets have experienced significant volatility in recent periods, including a historic drop in the price of crude oil and national gas prices, and may continue to experience relatively high volatility for a prolonged period. Such conditions may negatively impact NextGen and Clean and their respective shareholders. The Adviser may take measures to navigate the conditions of the energy markets, but there is no guarantee that such efforts will be effective or that NextGen’s and Clean’s performance will correlate with any increase in oil and gas prices.
The Funds may invest in non-U.S. companies. Foreign securities may be more difficult to sell than U.S. securities. Investments in foreign securities may involve difficulties in receiving or interpreting financial and economic information, possible imposition of taxes, higher brokerage and custodian fees, possible currency exchange controls or other government restrictions, including possible seizure or nationalization of foreign deposits or assets. Foreign securities may also be less liquid and more volatile than U.S. securities. There may also be difficulty in invoking legal protections across borders. In addition, investments in emerging market countries present risks to a greater degree than those presented by investments in countries with developed securities markets and more advanced regulatory systems. Some of the foreign securities in which the Funds invests will be denominated in a foreign currency. Changes in foreign currency exchange rates will affect the value of securities denominated or quoted in foreign currencies. Exchange rate movements can be large and can endure for extended periods of time, affecting either favorably or unfavorably the value of the Funds’ assets. However, the Funds may engage in foreign currency transactions to attempt to protect themselves against fluctuations in currency exchange rates in relation to the U.S. dollar. Depositary receipts involve many of the same risks as those associated with direct investment in foreign securities. However, the Funds may receive less timely information or have less control than if they invested directly in the foreign issuer.
The global outbreak of COVID-19 (commonly referred to as “coronavirus”) has disrupted economic markets and the prolonged economic impact is uncertain. The ultimate economic fallout from the pandemic, and the long-term impact on economies, markets, industries and individual issuers, are not known. The operational and financial performance of the issuers of securities in which the Funds invest depends on future developments, including the duration and spread of the outbreak, and such uncertainty may in turn adversely affect the value and liquidity of the Funds’ investments, impair the Funds’ ability to satisfy redemption requests, and negatively impact the Funds’ performance.
4. Agreements and Related Party Transactions
Each Fund has entered into an Investment Management Agreement with the Adviser (the “Agreement”).
Under the terms of the Agreement, NextGen and Clean have each agreed to pay the Adviser a fee payable at the end of each calendar month, at an annual rate equal to 0.85% of the average daily net assets of the Fund. The Adviser earned $223,797 and $121,047 in advisory fees for the fiscal year ended November 30, 2022 from NextGen and Clean, respectively.
The Adviser has agreed to temporarily waive or reimburse NextGen and Clean for certain Fund operating expenses such that the total annual Fund operating expenses, (including management fees, but exclusive of any front-end load, deferred sales charge, 12b-1 fees, taxes, brokerage commissions, expenses incurred in
30
connection with any merger or reorganization, acquired fund fees and expenses or extraordinary expenses such as litigation) will not exceed 1.25% for each class of NextGen Class A Shares and Class I Shares, and 1.15% for each class of Clean Class A Shares and Class I Shares, subject to possible recoupment from the applicable Fund in future years on a rolling three year basis (within the three years after the date that such expenses have been waived or reimbursed); provided, however, that such recoupment will not cause the Fund’s expense ratio to exceed the lesser of the expense cap in effect at the time of the waiver or the expense cap in effect at the time of recoupment. Such waiver or reimbursement may not be terminated without the consent of the Board of Trustees before March 31, 2023 and may be modified or terminated by the Adviser at any time thereafter. The Funds have not recorded a liability in the amount of expense reimbursements available for recoupment due to an assessment that such recoupment is not probable as of November 30, 2022.
NextGen
Period Incurred | | Amount
Waived/
Reimbursed | | | Amount
Recouped | | | Amount
Subject to
Potential
Recoupment | | | Expiration
Date | |
November 30, 2020 | | $ | 291,746 | | | $ | — | | �� | $ | 291,746 | | | | November 30, 2023 | |
November 30, 2021 | | | 232,857 | | | | — | | | | 232,857 | | | | November 30, 2024 | |
November 30, 2022 | | | 276,074 | | | | — | | | | 276,074 | | | | November 30, 2025 | |
| | | $ | 800,677 | | | $ | — | | | $ | 800,677 | | | | | |
Clean
Period Incurred | | Amount
Waived/
Reimbursed | | | Amount
Recouped | | | Amount
Subject to
Potential
Recoupment | | | Expiration
Date | |
November 30, 2020 | | $ | 180,528 | | | $ | — | | | $ | 180,528 | | | | November 30, 2023 | |
November 30, 2021 | | | 224,207 | | | | — | | | | 224,207 | | | | November 30, 2024 | |
November 30, 2022 | | | 274,296 | | | | — | | | | 274,296 | | | | November 30, 2025 | |
| | | $ | 679,031 | | | $ | — | | | $ | 679,031 | | | | | |
The Funds have engaged U.S. Bancorp Fund Services, LLC d/b/a U.S. Bank Global Fund Services (“Fund Services”) to serve as the Funds’ administrator and accountant. Fund Services also serves as the Funds’ transfer agent, dividend paying agent, and agent for the automatic dividend reinvestment plan. U.S. Bank, N.A. serves as the Fund’s custodian. Fees paid to trustees for their services to the Funds are reflected as Trustee’ fees on the Statements of Operations.
5. Income Taxes
It is each Fund’s intention to continue to qualify as a RIC under Subchapter M of the IRC and distribute all of its taxable income. Also, in order to avoid the payment of any federal excise taxes, each Fund will distribute substantially all of its net investment income and net realized gains on a calendar year basis. The amount and character of income and capital gain distributions to be paid, if any, are determined in accordance with federal income tax regulations, which may differ from U.S. generally accepted accounting principles. These differences are primarily due to differences in the timing of recognition of gains or losses on investments. Permanent book and tax basis differences resulted in the reclassifications of $116,242 from additional paid-in capital and $116,242 to accumulated net losses for NextGen and $16,626 from additional paid-in capital and $16,626 to accumulated net losses for Clean.
31
The following information is provided on a tax basis as of November 30, 2022:
NextGen
| Cost of investments | | $ | 24,219,888 | |
| Gross unrealized appreciation | | | 4,733,262 | |
| Gross unrealized depreciation | | | (3,360,861 | ) |
| Net unrealized appreciation | | | 1,372,401 | |
| Undistributed ordinary income | | | — | |
| Undistributed long-term gains | | | — | |
| Other accumulated losses | | | (3,617,351 | ) |
| Accumulated net losses | | $ | (2,244,950 | ) |
Clean
| Cost of investments | | $ | 12,734,800 | |
| Gross unrealized appreciation | | | 3,016,632 | |
| Gross unrealized depreciation | | | (2,773,350 | ) |
| Net unrealized appreciation | | | 243,282 | |
| Undistributed ordinary income | | | — | |
| Undistributed long-term gains | | | — | |
| Other accumulated losses | | | (4,560,887 | ) |
| Accumulated net losses | | $ | (4,317,605 | ) |
As of November 30, 2022, NextGen’s capital loss carryforward was comprised of short-term capital loss of $3,253,419 and long-term capital loss of $316,859, and is unlimited. As of November 30, 2022, Clean’s capital loss carryforward was comprised of short-term capital loss of $4,275,332 and long-term capital loss of $207,592, and is unlimited.
Each Fund recognizes the tax benefits of uncertain tax positions only where the position is “more likely than not” to be sustained assuming examination by tax authorities. Management has analyzed each Fund’s tax positions and has concluded that no liability for unrecognized tax benefits should be recorded related to uncertain tax positions taken on U.S. tax returns and state tax returns filed since inception of the Fund. No income tax returns are currently under examination. All tax years beginning with November 30, 2019 remain subject to examination by the tax authorities in the United States. Due to the nature of each Fund’s investments, the Funds may be required to file income tax returns in several states. No Fund is aware of any tax positions for which it is reasonably possible that the total amounts of unrecognized tax benefits will change materially in the next 12 months.
6. Fair Value Measurements
Various inputs that are used in determining the fair value of the Funds’ investments are summarized in the three broad levels listed below:
| | ● | Level 1 — quoted prices in active markets for identical securities |
| | ● | Level 2 — other significant observable inputs (including quoted prices for similar securities, interest rates, prepayment speeds, credit risk, etc.) |
| | ● | Level 3 — significant unobservable inputs (including each Fund’s own assumptions in determining the fair value of investments) The inputs or methodology used for valuing securities are not necessarily an indication of the risk associated with investing in those securities. |
32
These inputs are summarized in the three broad levels listed below.
NextGen
| | | | | | | Fair Value Measurements at Reporting Date Using | |
Description | | Fair Value as of
November 30,
2022 | | | Quoted Prices in
Active Markets
for Identical
Assets
(Level 1) | | | Significant Other
Observable
Inputs
(Level 2) | | | Significant
Unobservable
Inputs
(Level 3) | |
Assets | | | | | | | | | | | | | | | | |
Equity Securities | | | | | | | | | | | | | | | | |
Common Stock (a) | | $ | 18,665,244 | | | $ | 13,742,819 | | | $ | 4,922,425 | | | $ | — | |
Master Limited Partnerships & Related Companies (a) | | | 4,186,452 | | | | 4,186,452 | | | | — | | | | — | |
Real Estate Investment Trusts (a) | | | 1,814,490 | | | | 1,616,813 | | | | 197,677 | | | | — | |
Total Equity Securities | | | 24,666,186 | | | | 19,546,084 | | | | 5,120,102 | | | | — | |
Other | | | | | | | | | | | | | | | | |
Short-Term Investments (a) | | | 927,200 | | | | 927,200 | | | | — | | | | — | |
Total Assets | | $ | 25,593,386 | | | $ | 20,473,284 | | | $ | 5,120,102 | | | $ | — | |
Clean
| | | | | | | Fair Value Measurements at Reporting Date Using | |
Description | | Fair Value as of
November 30,
2022 | | | Quoted Prices in
Active Markets
for Identical
Assets
(Level 1) | | | Significant Other
Observable
Inputs
(Level 2) | | | Significant
Unobservable
Inputs
(Level 3) | |
Assets | | | | | | | | | | | | | | | | |
Equity Securities | | | | | | | | | | | | | | | | |
Common Stock (a) | | $ | 12,418,390 | | | $ | 8,936,863 | | | $ | 3,481,527 | | | $ | — | |
Other | | | | | | | | | | | | | | | | |
Short-Term Investments (a) | | | 559,692 | | | | 559,692 | | | | — | | | | — | |
Total Assets | | $ | 12,978,082 | | | $ | 9,496,555 | | | $ | 3,481,527 | | | $ | — | |
(a) | All other industry classifications are identified in the Schedule of Investments. NextGen and Clean did not hold Level 3 investments at any time during the fiscal year ended November 30, 2022. |
7. Investment Transactions
For the fiscal year ended November 30, 2022, NextGen purchased (at cost) and sold securities (proceeds) in the amount of $63,461,997 and $71,337,508 (excluding short-term securities), respectively.
For the fiscal year ended November 30, 2022, Clean purchased (at cost) and sold securities (proceeds) in the amount of $16,859,090 and $18,003,559 (excluding short-term securities), respectively.
8. Share Transactions
Transactions of shares of NextGen were as follows:
| | Fiscal Year Ended November 30, 2022 | | | Fiscal Year Ended November 30, 2021 | |
Class A Shares | | Amount | | | Shares | | | Amount | | | Shares | |
Sold | | $ | 80,628 | | | | 4,837 | | | $ | 620,361 | | | | 29,573 | |
Dividends Reinvested | | | 33,252 | | | | 1,872 | | | | 26,095 | | | | 1,276 | |
Redeemed | | | (303,622 | ) | | | (18,186 | ) | | | (198,908 | ) | | | (9,597 | ) |
Net Increase (Decrease) | | $ | (189,742 | ) | | | (11,477 | ) | | $ | 447,548 | | | | 21,252 | |
33
| | Fiscal Year Ended November 30, 2022 | | | Fiscal Year Ended November 30, 2021 | |
Class I Shares | | Amount | | | Shares | | | Amount | | | Shares | |
Sold | | $ | 785,111 | | | | 41,610 | | | $ | 25,071,111 | | | | 1,172,594 | |
Dividends Reinvested | | | 1,267,291 | | | | 70,158 | | | | 556,661 | | | | 26,877 | |
Redeemed | | | (6,568,182 | ) | | | (368,330 | ) | | | (5,949,539 | ) | | | (283,669 | ) |
Net Increase (Decrease) | | $ | (4,515,780 | ) | | | (256,562 | ) | | $ | 19,678,233 | | | | 915,802 | |
Transactions of shares of Clean were as follows:
| | Fiscal Year Ended November 30, 2022 | | | Fiscal Year Ended November 30, 2021 | |
Class A Shares | | Amount | | | Shares | | | Amount | | | Shares | |
Sold | | $ | 614,050 | | | | 42,947 | | | $ | 1,333,358 | | | | 57,239 | |
Dividends Reinvested | | | 19,647 | | | | 1,202 | | | | 5,527 | | | | 266 | |
Redeemed | | | (692,486 | ) | | | (48,177 | ) | | | (1,320,475 | ) | | | (58,984 | ) |
Net Increase (Decrease) | | $ | (58,789 | ) | | | (4,028 | ) | | $ | 18,410 | | | | (1,479 | ) |
| | Fiscal Year Ended November 30, 2022 | | | Fiscal Year Ended November 30, 2021 | |
Class I Shares | | Amount | | | Shares | | | Amount | | | Shares | |
Sold | | $ | 770,527 | | | | 51,218 | | | $ | 16,417,857 | | | | 760,227 | |
Dividends Reinvested | | | 1,051,818 | | | | 64,184 | | | | 195,399 | | | | 9,192 | |
Redeemed | | | (2,757,702 | ) | | | (192,051 | ) | | | (4,714,279 | ) | | | (219,185 | ) |
Net Increase (Decrease) | | $ | (935,357 | ) | | | (76,649 | ) | | $ | 11,898,977 | | | | 550,234 | |
9. Subsequent Events
The Funds have evaluated the need for additional disclosures and/or adjustments resulting from subsequent events through the date the financial statements were issued. Based on this evaluation, no adjustments were required to the financial statements of the Funds.
On January 27, 2023, Jerry V. Swank tendered his resignation as a trustee of the Trust, effective upon the election of his successor at a special meeting of shareholders of the Trust expected to occur in 2023.
34
Cushing Mutual Funds Trust Report of Independent Registered Public Accounting Firm |
To the Shareholders and the Board of Trustees of
Cushing Mutual Funds Trust
Opinion on the Financial Statements
We have audited the accompanying statements of assets and liabilities of Cushing Mutual Funds Trust (the “Trust”), (comprising NXG NextGen Infrastructure Fund (formerly, Cushing NextGen Infrastructure Fund) and NXG Global Clean Equity Fund (formerly, Global Clean Equity Fund) (collectively referred to as the “Funds”)) including the schedules of investments, as of November 30, 2022, and the related statements of operations, and changes in net assets, and the financial highlights for each of the periods indicated in the table below and the related notes (collectively referred to as the “financial statements”). In our opinion, the financial statements present fairly, in all material respects, the financial position of each of the Funds comprising Cushing Mutual Funds Trust at November 30, 2022, the results of their operations, changes in net assets and financial highlights for each of the periods indicated in the table below, in conformity with U.S. generally accepted accounting principles.
Funds comprising
the Cushing Mutual
Funds Trust | Statements of operations | Statements of changes
in net assets | Financial highlights |
NXG NextGen Infrastructure Fund (formerly, Cushing NextGen Infrastructure Fund) | For the year ended November 30, 2022. | For each of the two years in the period ended November 30, 2022 | For each of the three years in the period ended November 30, 2022. The financial highlights for the two years in the period ended November 30, 2018 were audited by other auditors whose report dated January 28, 2019, expressed an unqualified opinion on those financial statements and financial highlights. |
NXG Global Clean Equity Fund (formerly, Global Clean Equity Fund) | For the year ended November 30, 2022. | For each of the two years in the period ended November 30, 2022 | For each of the three years in the period ended November 30, 2022 and the period from January 31, 2020 (commencement of operations) through November 30, 2020. |
Basis for Opinion
These financial statements are the responsibility of the Trust’s management. Our responsibility is to express an opinion on each of the Funds’ financial statements based on our audits. We are a public accounting firm registered with the Public Company Accounting Oversight Board (United States) (“PCAOB”) and are required to be independent with respect to the Trust in accordance with the U.S. federal securities laws and the applicable rules and regulations of the Securities and Exchange Commission and the PCAOB.
We conducted our audits in accordance with the standards of the PCAOB. Those standards require that we plan and perform the audit to obtain reasonable assurance about whether the financial statements are free of material misstatement, whether due to error or fraud. The Trust is not required to have, nor were we engaged to perform, an audit of the Trust’s internal control over financial reporting. As part of our audits, we are required to obtain an understanding of internal control over financial reporting but not for the purpose of expressing an opinion on the effectiveness of the Trust’s internal control over financial reporting. Accordingly, we express no such opinion.
Our audits included performing procedures to assess the risks of material misstatement of the financial statements, whether due to error or fraud, and performing procedures that respond to those risks. Such procedures included examining, on a test basis, evidence regarding the amounts and disclosures in the financial statements. Our
35
procedures included confirmation of securities owned as of November 30, 2022, by correspondence with the custodian and brokers. Our audits also included evaluating the accounting principles used and significant estimates made by management, as well as evaluating the overall presentation of the financial statements. We believe that our audits provide a reasonable basis for our opinion.

We have served as the auditor of one or more Cushing investment companies since 2011.
Dallas, Texas
January 27, 2023
36
Cushing Mutual Funds Trust Trustees and Executive Officers (Unaudited) |
Set forth below is information with respect to each of the Trustees and executive officers of the Trust, including their principal occupations during the past five years. The business address of the Fund, its Trustees and executive officers is 600 N. Pearl Street, Suite 1205, Dallas, Texas 75201.
Board of Trustees
Name and
Year of Birth | Position(s) Held
with the Trust | Term of
Office and
Length
of Time
Served(1) | Principal Occupations
During Past Five Years | Number of
Portfolios
in Fund
Complex(2)
Overseen
by Trustee | Other Directorships Held by Trustee
During the Past Five Years |
Independent Trustees | | | | |
Brian R. Bruce
(1955) | Lead Independent Trustee | Trustee
since 2007 | Chief Executive Officer, Hillcrest Asset Management, LLC (2008 – present) (registered investment adviser). | 4 | CM Advisers Family of Funds (2 series) (2003 – present). |
Andrea N. Mullins
(1967) | Trustee and Chair of the Audit Committee | Trustee
since 2021 | Private Investor; Independent Contractor, SWM Advisors (2014 – present). | 4 | Valued Advisers Trust (14 portfolios) (2013 – present) (series trust/mutual funds); Angel Oak Family of Funds (9 portfolios) (2019 – present). |
Ronald P. Trout
(1939) | Trustee and Chairman of the Nominating and Corporate Governance Committee | Trustee
since 2007 | Retired. Previously, founding partner and Senior Vice President of Hourglass Capital Management, Inc. (1989 – to 2002) (investment management company). | 4 | Dorchestor Minerals, L.P. (2008 – present) (acquisition, ownership and administration of natural gas and crude oil royalty, net profits and leasehold interests in the U.S.) |
Interested Trustees | | | | |
Jerry V. Swank
(1951)(3) | Trustee, Chairman of the Board | Trustee
since 2007 | Formerly Managing Partner of the Adviser and founder of Swank Capital, LLC (2000 – 2021). | 4 | E-T Energy Ltd. (2008 – 2014) (developing, operating, producing and selling recoverable bitumen). |
(1) | Each Trustee was elected by Fund shareholders and shall continue to serve as provided for in the Fund’s Declaration of Trust. |
(2) | The “Fund Complex” includes each registered investment company for which the Adviser serves as investment adviser. As of November 30, 2022, there were four funds in the Fund Complex. |
(3) | Mr. Swank is an “interested person” of the Fund, as defined under the 1940 Act, by virtue of his position as Managing Partner of the Adviser. |
37
Executive Officers
The following provides information regarding the executive officers of the Fund who are not Trustees. Officers serve at the pleasure of the Board of Trustees and until his or her successor is appointed and qualified or until his or her earlier resignation or removal.
Name and
Year of Birth | Position(s) Held
with the Trust | Term of
Office and
Length of
Time
Served(1) | Principal Occupations During Past Five Years |
Mark Rhodes
(1958) | Chief Executive Officer and President | Officer since 2022 | Chief Executive Officer of the Adviser (2022 – present); Previously, Principal of Focal Point Consulting Practice (2020 – 2022); Managing Director of Bank of America Merrill Lynch (2015 – 2021); Regional Managing Director of J.P. Morgan (2008 – 2015). |
Blake R. Nelson (1986) | Chief Financial Officer, Treasurer and Secretary | Officer
since 2021 | Chief Financial Officer of the Adviser (2021 – present); Controller of Adviser (2013 – 2021) |
Matthew J. Calabro
(1966) | Chief Compliance Office | Officer since 2021 | Chief Compliance Officer of the Investment Adviser and funds in the fund complex (2021 – present); Director of Institutional Manager Services at Ascendant Compliance Management, LLC (a subsidiary of Compliance Solutions Strategies) (2016 – present). |
38
Cushing Mutual Funds Trust Additional Information (Unaudited) November 30, 2022 |
Certain Changes Occurring During the Prior Fiscal Year
The following information is a summary of certain changes during the most recent fiscal year. This information may not reflect all of the changes that have occurred since you purchased shares of the Fund(s).
Change to each Fund’s Name
Effective as of November 1, 2022, Clean changed its name from Global Clean Equity Fund to NXG Global Clean Equity Fund. There were no changes to the ticker symbols of the Fund’s common shares or to the Fund’s investment adviser, portfolio management personnel, investment objective or strategies in connection with the name change.
Effective as of November 1, 2022, NextGen changed its name from Cushing NextGen Infrastructure Fund to NXG NextGen Infrastructure Fund. There were no changes to the ticker symbols of the Fund’s common shares or to the Fund’s investment adviser, portfolio management personnel, investment objective or strategies in connection with the name change.
Trustee and Executive Officer Compensation
The Trust does not currently compensate any of its trustees who are interested persons or any of its officers. For the fiscal year ended November 30, 2022, the aggregate compensation paid by NextGen and Clean to the independent trustees was $30,494 and $17,847, respectively. The Trust did not pay any special compensation to any of its trustees or officers. The Trust continuously monitors standard industry practices, and this policy is subject to change.
Cautionary Note Regarding Forward-Looking Statements
This report contains “forward-looking statements” as defined under the U.S. federal securities laws. Generally, the words “believe,” “expect,” “intend,” “estimate,” “anticipate,” “project,” “will” and similar expressions identify forward-looking statements, which generally are not historical in nature. Forward-looking statements are subject to certain risks and uncertainties that could cause actual results to materially differ from each Fund’s historical experience and its present expectations or projections indicated in any forward-looking statements. These risks include, but are not limited to, changes in economic and political conditions; regulatory and legal changes; energy industry risk; leverage risk; valuation risk; interest rate risk; tax risk; and other risks discussed in the Trust’s filings with the SEC. You should not place undue reliance on forward-looking statements, which speak only as of the date they are made. The Trust undertakes no obligation to update or revise any forward-looking statements made herein. There is no assurance that each Fund’s investment objective will be attained.
Proxy Voting Policies
A description of the policies and procedures that the Trust uses to determine how to vote proxies relating to portfolio securities owned by each Fund and information regarding how each Fund voted proxies relating to the portfolio of securities during the 12-month period ended June 30 are available to shareholders without charge, upon request by calling the Trust toll-free at (800)236-4424 and on the Trust’s website at www.cushingfunds.com. Information regarding how each Fund voted proxies are also available to shareholders without charge on the SEC’s website at www.sec.gov.
39
Form N-PORT
The Trust files a complete schedule of portfolio holdings of each fund for each month of each fiscal year with the SEC on Form N-PORT. The Trust’s Form N-PORT for the third month of each Fund’s fiscal quarter and statement of additional information are available without charge by visiting the SEC’s website at www.sec.gov. In addition, you may review and copy the Trust’s Form N-PORT at the SEC’s Public Reference Room in Washington D.C. You may obtain information on the operation of the Public Reference Room by calling (800) SEC-0330.
Portfolio Turnover
For the fiscal year ended November 30, 2022, the portfolio turnover rate for NextGen and Clean was 241.02% and 118.40%, respectively. Portfolio turnover may vary greatly from period to period. The Funds do not consider portfolio turnover rate a limiting factor in the Adviser’s execution of investment decisions, and each Fund may utilize investment and trading strategies that may involve high portfolio turnover. A higher portfolio turnover rate results in correspondingly greater brokerage commissions and other transactional expenses that are borne by each Fund.
NextGen was organized and commenced operations as a “non-diversified fund,” which meant that the Fund may invest a greater portion of its assets in a more limited number of issuers than a diversified fund. However, the Fund’s portfolio has been diversified for over three years. As a result, in accordance with the position of the Staff of the SEC, the Fund has changed its status to that of a diversified fund, and will continue to operate as such.
Without the affirmative vote of the holders of a majority of the outstanding voting securities of the Fund voting together as a single class, which is defined by the 1940 Act as the lesser of (i) 67% or more of the Fund’s voting securities present at a meeting, if the holders of more than 50% of the Fund’s outstanding voting securities are present or represented by proxy; or (ii) more than 50% of the Fund’s outstanding voting securities, the Fund will not, with respect to 75% of the value of the Fund’s total assets, purchase any securities (other than obligations issued or guaranteed by the U.S. Government or by its agencies or instrumentalities), if as a result more than 5% of the Fund’s total assets would then be invested in securities of a single issuer or if as a result the Fund would hold more than 10% of the outstanding voting securities of any single issuer.
Privacy Policy
In order to conduct its business, the Trust collects and maintains certain nonpublic personal information about its shareholders of record with respect to their transactions in shares of each Fund’s securities. This information includes the shareholder’s address, tax identification or Social Security number, share balances, and dividend elections.
We do not collect or maintain personal information about shareholders whose share balances of our securities are held in “street name” by a financial institution such as a bank or broker. We do not disclose any nonpublic personal information about you, the Funds’ other shareholders or the Funds’ former shareholders to third parties unless necessary to process a transaction, service an account, or as otherwise permitted by law.
To protect your personal information internally, we restrict access to nonpublic personal information about the Funds’ shareholders to those employees who need to know that information to provide services to our shareholders. We also maintain certain other safeguards to protect your nonpublic personal information.
Statement Regarding the Trust’s Liquidity Risk Management Program
The Trust has adopted and implemented a written liquidity risk management program (the “LRM Program”) and related procedures to manage each Fund’s liquidity in accordance with Rule 22e-4 under the Investment Company Act of 1940, as amended (the “Liquidity Rule”). The Liquidity Rule requires that each Fund establish a liquidity risk management program in order to effectively manage the Fund’s liquidity and shareholder redemptions. The Liquidity Rule is designed to mitigate the risk that a Fund could not meet redemption requests without significantly diluting the interests of its remaining investors.
40
The Board has appointed the Adviser as administrator of the LRM Program and related policies and procedures (the “Program Administrator”). As permitted under the LRM Program, the Program Administrator enlisted the services of U.S. Bancorp Global Fund Services, LLC (“USBFS”), fund administrator to the Trust, to assist with its responsibilities under the Program. Pursuant to this delegation, USBFS handles the day to day operation of the Trust’s LRM Program.
The Liquidity Rule requires the Funds to assess, manage and review their liquidity risk at least annually, considering applicable factors such as investment strategy and liquidity during normal and foreseeable stressed conditions, including whether the strategy is appropriate for an open-end fund and whether the fund has a relatively concentrated portfolio or large positions in particular issuers. Each Fund must also assess its use of borrowings and derivatives, short-term and long-term cash flow projections in normal and stressed conditions, holdings of cash and cash equivalents, and borrowing arrangements and other funding sources.
In accordance with the LRM Program, each of the Fund’s portfolio investments is classified into one of four liquidity categories described below based on a determination of a reasonable expectation for how long it would take to convert the investment to cash (or sell or dispose of the investment) without significantly changing its market value.
| | ● | Highly liquid investments – cash or convertible to cash within three business days or less; |
| | ● | Moderately liquid investments – convertible to cash in three to seven calendar days; |
| | ● | Less liquid investments – can be sold or disposed of, but not settled, within seven calendar days; or |
| | ● | Illiquid investments – cannot be sold or disposed of within seven calendar days |
Liquidity classification determinations take into account a variety of factors, including various market, trading and investment specific considerations, as well as market depth, and generally utilize analysis from a third-party liquidity metrics service.
The Liquidity Rule places a 15% limit on a Fund’s illiquid investments. Specifically, the Liquidity Rule prohibits acquisition of illiquid investments if doing so would result in the Fund holding more than 15% of its net assets in illiquid investments and requires certain reporting anytime a Fund’s holdings of illiquid investments exceed 15% of net assets. The LRM Program includes provisions reasonably designed to comply with the 15% limit on illiquid investments. During the review period, no Fund exceeded the 15% limit on illiquid investments.
The Liquidity Rule also requires funds that do not primarily hold assets that are highly liquid investments to determine and maintain a minimum percentage of the fund’s net assets to be invested in highly liquid investments (highly liquid investment minimum or “HLIM”). The LRM Program includes provisions for determining, periodically reviewing and complying with the HLIM requirement as applicable. During the review period, each Fund primarily held highly liquid investments and therefore was exempt from the requirement to adopt an HLIM and to comply with the related requirements under the Liquidity Rule.
Per the Trust’s LRM Program, the Program Administrator is required to, among other things, provide an annual report to the Board which includes: (1) an assessment of the liquidity risk of each Fund, (2) an assessment of the operation of the LRM Program (and any related policies and procedures, including the Program Administrator Procedures) and the adequacy and effectiveness of their implementation; (3) a review of the operation of each Fund’s highly liquid investment minimum (as applicable) and the adequacy and effectiveness its implementation; (4) a discussion of any occurrences throughout the year when a Fund has exceeded the 15% Limit; (5) any changes to the LRM Program (and any related policies and procedures, including the Program Administrator Procedures) deemed by the Program Administrator to be material; and (6) such other information requested by the Board from time to time.
41
At the November 14, 2022 meeting of the Trust’s Board of Trustees, the Board received a written report prepared by the Program Administrator that addressed the operation of the LRM Program, assessed its adequacy and effectiveness and described any material changes made to the Program. The report included that, during the reporting period, the were no changes made to the LRM Program, there were no material liquidity events that impacted any Fund, and each Fund held sufficient highly liquid assets to meet Fund redemptions. The report concluded that since each Fund seeks to invest in highly liquid investments, its liquidity risk is relatively low and, accordingly, no additional measures should be implemented regarding management of each Fund’s liquidity risk. In addition, the report concluded that the LRM Program was implemented and operated effectively to achieve the goal of assessing and managing each Fund’s liquidity risk.
42
Cushing Mutual Funds Trust |
TRUSTEES Brian R. Bruce
Andrea N. Mullins
Ronald P. Trout
Jerry V. Swank |
EXECUTIVE OFFICERS Mark Rhodes
Chief Executive Officer and President Blake R. Nelson
Chief Financial Officer, Treasurer and Secretary Mathew J. Calabro
Chief Compliance Officer |
INVESTMENT ADVISER Cushing® Asset Management, LP
600 N. Pearl Street, Suite 1205
Dallas, TX 75201 |
ADMINISTRATOR U.S. Bancorp Fund Services, LLC, d/b/a
U.S. Bancorp Global Fund Services
615 East Michigan Street, 3rd Floor
Milwaukee, WI 53202 |
CUSTODIAN U.S. Bank, N.A.
1555 N. River Center Drive, Suite 302
Milwaukee, WI 53212 |
TRANSFER AGENT U.S. Bancorp Fund Services, LLC, d/b/a
U.S. Bancorp Global Fund Services
615 East Michigan Street, 3rd Floor
Milwaukee, WI 53202 |
LEGAL COUNSEL Skadden, Arps, Slate, Meagher & Flom LLP
155 North Wacker Drive
Chicago, IL 60606 |
INDEPENDENT
REGISTERED PUBLIC
ACCOUNTING FIRM Ernst & Young LLP
2323 Victory Avenue, Suite 2000
Dallas, TX 75219 |
NOT FDIC INSURED | NOT BANK GUARANTEED | MAY LOSE VALUE
Cushing Mutual Funds Trust
is distributed by Quasar Distributors, LLC

Item 2. Code of Ethics.
The registrant has adopted a code of ethics that applies to the registrant’s principal executive officer and principal financial officer. The registrant has not granted any waivers from any provisions of the code of ethics during the period covered by this report.
The registrant undertakes to provide to any person without charge, upon request, a copy of its code of ethics by mail when they call the registrant at 1-888-777-2346.
Item 3. Audit Committee Financial Expert.
The registrant’s Board of Trustees has determined that there is at least one audit committee financial expert serving on its audit committee. Ms. Andrea N. Mullins is the “audit committee financial expert” and is considered to be “independent” as each term is defined in Item 3 of Form N-CSR.
Item 4. Principal Accountant Fees and Services.
The registrant has engaged its principal accountant to perform audit services, audit-related services, tax services and other services during the past two fiscal years. “Audit services” refer to performing an audit of the registrant's annual financial statements or services that are normally provided by the accountant in connection with statutory and regulatory filings or engagements for those fiscal years. “Audit-related services” refer to the assurance and related services by the principal accountant that are reasonably related to the performance of the audit. “Tax services” refer to professional services rendered by the principal accountant for tax compliance, tax advice, and tax planning. There were no “other services” provided by the principal accountant. The following table details the aggregate fees billed or expected to be billed for each of the last two fiscal years for audit fees, audit-related fees, tax fees and other fees by the principal accountant.
| | FYE 11/30/2022 | FYE 11/30/2021 |
| Audit Fees | 38,000 | 38,000 |
| Audit-Related Fees | None | None |
| Tax Fees | 17,200 | 19,000 |
| All Other Fees | None | None |
The audit committee has adopted pre-approval policies and procedures that require the audit committee to pre-approve all audit and non-audit services of the registrant, including services provided to any entity affiliated with the registrant.
The percentage of fees billed by Ernst & Young LLP applicable to non-audit services pursuant to waiver of pre-approval requirement were as follows:
| | FYE 11/30/2022 | FYE 11/30/2021 |
| Audit-Related Fees | 0% | 0% |
| Tax Fees | 0% | 0% |
| All Other Fees | 0% | 0% |
All of the principal accountant’s hours spent on auditing the registrant’s financial statements were attributed to work performed by full-time permanent employees of the principal accountant. (If more than 50 percent of the accountant’s hours were spent to audit the registrant's financial statements for the most recent fiscal year, state how many hours were attributed to work performed by persons other than the principal accountant's full-time, permanent employees.)
The following table indicates the non-audit fees billed or expected to be billed by the registrant’s accountant for services to the registrant and to the registrant’s investment adviser (and any other controlling entity, etc.—not sub-adviser) for the last two years. The audit committee of the board of trustees/directors has considered whether the provision of non-audit services that were rendered to the registrant's investment adviser is compatible with maintaining the principal accountant's independence and has concluded that the provision of such non-audit services by the accountant has not compromised the accountant’s independence.
| Non-Audit Related Fees | FYE 11/30/2022 | FYE 11/30/2021 |
| Registrant | 17,200 | 19,000 |
| Registrant’s Investment Adviser | None | None |
Item 5. Audit Committee of Listed Registrants.
Not applicable to open-end investment companies.
Item 6. Investments.
| (a) | Schedule of Investments is included as part of the report to shareholders filed under Item 1 of this Form. |
Item 7. Disclosure of Proxy Voting Policies and Procedures for Closed-End Management Investment Companies.
Not applicable to open-end investment companies.
Item 8. Portfolio Managers of Closed-End Management Investment Companies.
Not applicable to open-end investment companies.
Item 9. Purchases of Equity Securities by Closed-End Management Investment Company and Affiliated Purchasers.
Not applicable to open-end investment companies.
Item 10. Submission of Matters to a Vote of Security Holders.
Not Applicable.
Item 11. Controls and Procedures.
| (a) | The registrant’s President/Principal Executive Officer and Principal Financial Officer have reviewed the registrant's disclosure controls and procedures (as defined in Rule 30a-3(c) under the Investment Company Act of 1940 (the “Act”)) as of a date within 90 days of the filing of this report, as required by Rule 30a-3(b) under the Act and Rules 13a-15(b) or 15d-15(b) under the Securities Exchange Act of 1934. Based on their review, such officers have concluded that the disclosure controls and procedures are effective in ensuring that information required to be disclosed in this report is appropriately recorded, processed, summarized and reported and made known to them by others within the registrant and by the registrant’s service provider. |
| (b) | There were no changes in the registrant's internal control over financial reporting (as defined in Rule 30a-3(d) under the Act) that occurred during the second fiscal quarter of the period covered by this report that has materially affected, or is reasonably likely to materially affect, the registrant's internal control over financial reporting. |
Item 12. Disclosure of Securities Lending Activities for Closed-End Management Investment Companies.
| (a) | Not Applicable. Fund does not participate in securities lending. |
| (b) | Not Applicable. Fund does not participate in securities lending. |
Item 13. Exhibits.
| (a) | (1) Any code of ethics or amendment thereto, that is the subject of the disclosure required by Item 2, to the extent that the registrant intends to satisfy Item 2 requirements through filing an exhibit. Not Applicable. |
(2) A separate certification for each principal executive officer and principal financial officer pursuant to Section 302 of the Sarbanes-Oxley Act of 2002. Filed herewith.
(3) Any written solicitation to purchase securities under Rule 23c-1 under the Act sent or given during the period covered by the report by or on behalf of the registrant to 10 or more persons. Not applicable to open-end investment companies.
(4) Change in the registrant’s independent public accountant. There was no change in the registrant’s independent public accountant for the period covered by this report.
| (b) | Certifications pursuant to Section 906 of the Sarbanes-Oxley Act of 2002. Furnished herewith. |
SIGNATURES
Pursuant to the requirements of the Securities Exchange Act of 1934 and the Investment Company Act of 1940, the registrant has duly caused this report to be signed on its behalf by the undersigned, thereunto duly authorized.
| (Registrant) | The Cushing Mutual Funds Trust | |
| | | |
| By (Signature and Title) | /s/ Mark Rhodes | |
| | Mark Rhodes, President & Chief Executive Officer | |
| | | |
| Date | 02/06/23 | |
Pursuant to the requirements of the Securities Exchange Act of 1934 and the Investment Company Act of 1940, this report has been signed below by the following persons on behalf of the registrant and in the capacities and on the dates indicated.
| By (Signature and Title) | /s/ Mark Rhodes | |
| | Mark Rhodes, President & Chief Executive Officer | |
| | | |
| Date | 02/06/23 | |
| | | |
| By (Signature and Title) | /s/ Blake R. Nelson | |
| | Blake R. Nelson, Chief Financial Officer, Treasurer and Secretary | |
| | | |
| Date | 02/06/23 | |