Exhibit 99.3
|

Special Committee of the Board of Directors NorthStar Real Estate Income Trust, Inc. c/o CNI NSI Advisors, LLC 399 Park Avenue, 18th Floor New York, NY 10022 | November 20, 2017 |
Re: Valuation Services of Certain Assets and Liabilities of NorthStar Real Estate Income Trust, Inc.
Dear Special Committee,
As you requested, we have provided valuation services, set forth below, for the Special Committee (the “Special Committee”) of the Board of Directors (the “Board”) of NorthStar Real Estate Income Trust, Inc. (the “Company” or “NSI”). The valuation services were completed on the Company’s assets and liabilities, which primarily consist of real estate properties, mortgage debt, LP interests, debt marks, and CMBS positions (collectively, the “Investments”). These valuation services were completed in connection with a business combination transaction (the “Transaction”) between NSI (“Nova I”), NorthStar Real Estate Income II, Inc. (“Nova II”), and Colony NorthStar, Inc. or an affiliate thereof (“Constellation”). The Company’s certain assets and liabilities were valued as of March 31, 2017 (the “Valuation Date”).
Our market value estimates are subject to the definition of market value, the General Assumptions and Limiting Conditions, any Extraordinary Assumptions or Hypothetical Conditions, and the Certification as set forth in this appraisal report. The intended user of the report is the Company. Our analyses, opinions, and conclusions were developed, and this report has been prepared in conformity with, the Code of Professional Ethics and Standards of Professional Appraisal Practice of the Appraisal Institute and the Uniform Standards of Professional Appraisal Practice (“USPAP”). This report has been completed under the specific terms in our Engagement Letter. The analysis and conclusions set forth in the report may not be properly understood without additional information contained within our work files.
NorthStar Real Estate Income Trust, Inc.
|
|
The following exhibit details the assets/liabilities considered in our analysis.
| Assets | ||
| Senior Loans | ||
Investment Name | Security Type | |
Palm Springs Boutique Hotel | Whole Loan | |
NYC HotelA-Participation | Whole Loan | |
NYC HotelB-Participation | Whole Loan | |
Minneapolis Area Full Service Hotel Mortgage | Whole Loan | |
Minneapolis Area Full Service Hotel Upsize | Whole Loan | |
Southeast Retail Portfolio | Whole Loan | |
New Jersey Office Mortgage | Whole Loan | |
Chicago Office Complex Mortgage | Whole Loan | |
Southern California Office Mortgage | Whole Loan | |
West Coast Retail Junior Participation | Whole Loan | |
Atlanta Area Hotel Junior Participation | Whole Loan | |
Dallas CBD Office Mortgage | Whole Loan | |
Southwest Retail Junior Participation | Whole Loan | |
Arizona Multifamily Mortgage | Whole Loan | |
| Mezzanine Loans | ||
Investment Name | Security Type | |
NYC Hotel-Senior Mezzanine Loan | Mezzanine | |
NYC Hotel-Junior Mezzanine Loan | Mezzanine | |
NYC Hotel-Junior Capitalized Interest | Mezzanine | |
NYC Hotel-Junior Future Accrued Interest | Mezzanine | |
Texas Office Mezzanine Loan Portfolio | Mezzanine | |
NYC Midtown Hotel Mezzanine Loan Portfolio | Mezzanine | |
NYC Hotel—Wall Street Mezzanine Loan | Mezzanine | |
| CMBS Investments | ||
Investment Name | Security Type | |
CMBS #1 | CMBS | |
CMBS #2 | CMBS | |
CMBS #3 | CMBS | |
CMBS #4 | CMBS | |
CMBS #5 | CMBS | |
CMBS #6 | CMBS | |
CMBS #7 | CMBS | |
CMBS #8 | CMBS | |
CMBS #9 | CMBS | |
CMBS #10 | CMBS | |
CMBS #11 | CMBS | |
CMBS #12 | CMBS | |
CMBS #13 | CMBS | |
CMBS #14 | CMBS | |
2
NorthStar Real Estate Income Trust, Inc.
|
|
| Preferred Investments | ||
Investment Name | Security Type | |
Downtown NYC Office Preferred Equity | Preferred | |
| PE Interests | ||
Investment Name | Security Type | |
Secondary Private Equity Portfolio #1 | PE Fund | |
Secondary Private Equity Portfolio #2 | PE Fund | |
Secondary Private Equity Portfolio #3 | PE Fund | |
Secondary Private Equity Portfolio #4 and Secondary Private Equity Portfolio #4 Add on | PE Fund | |
| Equity | ||
Investment Name | Security Type | |
Southeast Multifamily Equity | Equity | |
Midwest Multifamily Equity | Equity | |
Midwest Student Housing Equity | Equity | |
Southeast Student Housing Equity | Equity | |
Southeast Student Housing Equity II | Equity | |
Midwest Class A Office Equity | Equity | |
Northeast Class A Office Equity | Equity | |
Ohio Industrial Equity Portfolio | Equity | |
Washington D.C. Area Office Portfolio Equity | Equity | |
| Liabilities | ||
| Repurchase Agreements | ||
Investment Name | Security Type | |
Repo CMBS #6 | Repurchase Agreement | |
Repo CMBS #7 | Repurchase Agreement | |
Repo CMBS #8 | Repurchase Agreement | |
Repo CMBS #10 | Repurchase Agreement | |
Repo CMBS #13 | Repurchase Agreement | |
Repo CMBS #11 | Repurchase Agreement | |
Repo CMBS #12 | Repurchase Agreement | |
Minneapolis Area Full Service Hotel Mortgage | Underlying Debt | |
Minneapolis Area Full Service Hotel Upsize | Underlying Debt | |
Southeast Retail Portfolio | Underlying Debt | |
New Jersey Office Mortgage | Underlying Debt | |
Chicago Office Complex Mortgage | Underlying Debt | |
Southern California Office Mortgage | Underlying Debt | |
Arizona Multifamily Mortgage | Underlying Debt | |
3
NorthStar Real Estate Income Trust, Inc.
|
|
Based on conversations with the Company and/or CNI NSI Advisors, LLC (the “Company Advisor”), our scope of services included the following:
| • | Preparation of our analysis on the real estate asset analysis on a desktop basis only; |
| • | A study of each market to measure current market conditions, supply and demand factors, growth patterns, and their effect on each of the real estate assets; |
| • | Completion of the income capitalization approach, by discounted cash flow and also direct capitalization as appropriate, for each of the real estate assets; |
| • | Completion of the sales comparison approach, if applicable or required to produce credible results, for any of the real estate assets; |
| • | Meet and/or talk with relevant members of the Company Advisor’s deal teams to discuss each valuation and the relatedwrite-ups, to understand the Company Advisor’s expectations and intent regarding each investment and to discuss any relevant updates; |
| • | Consider general economic and industry trends and the investment operating and financial results (including audited financial statements, where available); |
| • | To the extent available, obtain financial data for publicly traded or private companies to support appropriate valuation multiples and/or discount rates; |
| • | Consider other facts and data that are pertinent to the investments as disclosed by the Company Advisor; |
| • | Delivery of a range of values with midpoint estimate for each of the assets as well as underlying assumptions used in the analysis as appropriate; |
| • | Discussions with the Special Committee, the Committee Advisor, the Company and the Company Advisor regarding finalization of the fair value estimates of certain assets and liabilities held by the Company; |
4
NorthStar Real Estate Income Trust, Inc.
|
|
The following Exhibit depicts the fair value estimates of the Investments as of the Valuation Date:
Assets | D&P Low | D&P Mid | D&P High | |||||||||
Debt Investments | $ | 612,855,887 | $ | 624,433,772 | $ | 636,206,431 | ||||||
Preferred Investments | 86,886,385 | 89,942,690 | 92,998,995 | |||||||||
CMBS Investments | 103,415,312 | 108,122,468 | 112,829,625 | |||||||||
PE Interests | 97,438,000 | 101,725,500 | 106,013,000 | |||||||||
Operating RE – Gross Values | 791,700,000 | 824,900,000 | 861,300,000 | |||||||||
Downtown NYC Office Equity Kicker | 7,099,172 | 8,306,571 | 9,662,470 | |||||||||
NYC Hotel Equity Kicker | 1,795,726 | 3,819,601 | 5,843,476 | |||||||||
Liabilities | D&P Low | D&P Mid | D&P High | |||||||||
Repurchase Agreements | $ | 25,802,095 | $ | 25,807,595 | $ | 25,813,095 | ||||||
Underlying Debt | 214,211,869 | 216,238,316 | 218,264,762 | |||||||||
Operating RE Debt | 401,850,919 | 401,850,919 | 401,850,919 | |||||||||
Operating RE – Minority Interest | 63,866,780 | 74,079,070 | 85,298,130 | |||||||||
Sincerely,
/s/ Duff & Phelps, LLC
Duff & Phelps, LLC – Ross A. Prindle
THIS LETTER MUST REMAIN ATTACHED TO THE REPORT IN ITS ENTIRETY INCLUDING RELATED EXHIBITS, IN ORDER FOR THE VALUE OPINION(S) SET FORTH TO BE CONSIDERED VALID.
5
NorthStar Real Estate Income Trust, Inc.
|
|
Valuation of Real Estate Debt Investments & Credit Facilities
The value of the debt is calculated by comparing the contractual terms of the mortgage against market terms. Contractual cash flows are projected based on the mortgage terms. A market interest rate is estimated and used to discount the contractual cash flows to the valuation date. The resulting asset (below market) or liability (above market) is the value of the debt as of the Valuation Date.
We have reviewed recently closed transactions and investor surveys for spreads and rates applicable to each of the subject properties. The concluded market interest rates were calculated by using the most applicable treasury rate based on the remaining term of the debt and applying a market-derived spread. If theloan-to-value ratio, based on the outstanding balance and the estimated fair value, was higher than a marketloan-to-value ratio, we created a blended rate by applying a mezzanine rate to the portion of the remaining balance that was above the typical marketloan-to-value ratio. The blended rate, including the mezzanine portion, if applicable, was used as the discount rate in calculating the present value of the remaining contractual payments.
Valuation of Loans & Liabilities
Limited Procedures
In general, our procedures included, but were not limited to the following:
General:
| • | Discussions concerning the history, current state, and future operations of the underlying properties that collateralized the loans with NSI management. |
Economic & Industry Outlook:
| • | Analysis of the economic outlook in general and the condition and outlook of collateral-specific industries. |
Property Performance – Qualitative and Quantitative:
| • | Analysis of financial metrics that included, but was not limited to liquidity, efficiency and leverage ratios, as well as collateral coverage; |
| • | Consideration of the properties’ performance relative to deal thesis, including progress against set milestones; and |
| • | Assessment of key developments (i.e., any proposed transaction). |
Valuation Analysis:
| • | Obtained financial and transaction data for assets similar to the underlying properties to support appropriate valuation multiples and discount rates; |
| • | Selected an appropriate valuation approach based on the properties’ characteristics and financial condition; and |
| • | Where appropriate, estimated an appropriate discount rate to present value the cash flows to arrive at a Fair Value conclusion through benchmarking relevant trade or broker quote data for similar securities (preferably loan data, otherwise bond or CDS data properly adjusted), market indices, and specific underlying asset performance as compared to the benchmarks. |
6
NorthStar Real Estate Income Trust, Inc.
|
|
Other
| • | Analysis of other facts and data considered pertinent to D&P’s analysis. |
Sources of Information
In the course of our analysis, we relied upon financial and other information, including prospective financial data, obtained from NSI and from various public sources.
We reviewed the source documents provided by NSI which included, but were not limited to, the following (where available):
| • | Asset Summary Reports for the underlying properties |
| • | Security term sheets, credit agreements, and other deal documentation; and |
| • | Operating results for the properties, including both historical results and projected results, where available. |
We also used public sources of information, where available, which included, but were not limited to the following:
| • | Bloomberg; |
| • | Capital IQ; and |
| • | Reuters Secondary Market Intelligence (SMi)on-line database. |
Valuation Approaches
Outlined below is a general framework detailing the various approaches D&P considered in our assessment of the property-level loans.
As part of our analysis of a subject security, D&P typically assesses a company’s Enterprise Value1 to develop an understanding of the subject security’s relative positioning as it relates to the capitalization of the company2. This then allows D&P to select a valuation approach or approaches for the subject security that best reflects the characteristics of the security, as well as the financial condition of the company.
Enterprise Value Analysis:
Enterprise Value can be derived using the following valuation approaches:
Income Approach: The Income Approach is a valuation technique that provides an estimation of the Fair Value of an asset or business based on expectations about the cash flows that an asset or business would generate over time. The Income Approach begins with an
| 1 | Enterprise Value is defined as the sum of the market value of a subject company’s interest bearing debt and preferred and common stock, lessnon-operating assets (i.e. cash and marketable securities). |
| 2 | Used only as a gauge to approximate equity cushion and does not express in any way D&P’s opinion on any of the Portfolio Companies’ Enterprise Value. |
7
NorthStar Real Estate Income Trust, Inc.
|
|
estimation of the annual cash flows expected to be generated over a discrete projection period. The estimated cash flows for each of the years in the discrete projection period are then converted to their present value equivalent using a rate of return appropriate for the risk of achieving the projected cash flows. The present value of the estimated cash flows are then added to the present value equivalent of the residual value of the asset (if any) or the business at the end of the discrete projection period to arrive at an estimate of Fair Value.
Market Approach: The Market Approach is a valuation technique that provides an estimation of Fair Value based on market prices in actual transactions and on asking prices for assets or businesses. The valuation process is a comparison and correlation between the subject asset or business and other similar assets or businesses. Considerations such as time and condition of sale and terms of agreements are analyzed for comparable assets or businesses and are adjusted to arrive at an estimation of the Fair Value of the subject asset or business.
Underlying Assets Approach:The Underlying Assets Approach is based on the book value of the company. Assets and liabilities on the company’s balance sheet are adjusted to their Fair Value equivalents.
For asset-based lending, which includes commercial, factoring, equipment, and mortgage loans, D&P will also consider the value of the collateral securing these subject securities. This will often involve reviewing recent appraisals as well as book values.
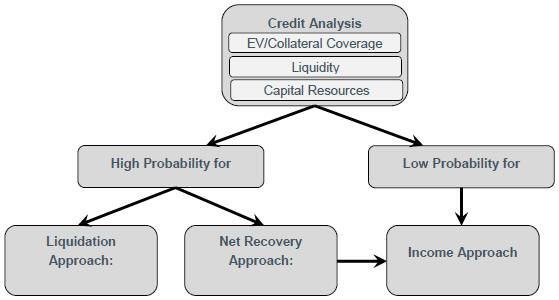
Debt Securities:
In our estimation of a range of Fair Value of a debt security, we consider the Income, Net Recovery, and Liquidation Approaches. These approaches have applications for debt securities that include, but are not limited to, bank loans, senior and subordinated bonds, and mezzanine securities.
Income Approach – Yield Analysis:When an Enterprise Value Analysis and/or an asset collateral analysis indicates there is adequate coverage of a security, the Yield Analysis is generally considered the most appropriate method to estimate Fair Value. The Yield Analysis begins with an estimation of the annual cash flows a subject security is expected to generate over a discrete projection period. The estimated cash flows for each of the years in the discrete projection period are then converted to their present value equivalent using a rate of return appropriate for the risk of achieving the projected cash flows to arrive at an estimate of Fair Value.
Net Recovery Approach: When a preliminary analysis indicates a subject security is no longer performing, or otherwise may not be fully recovered under its legal terms of repayment, a modified version of the Income Approach, known as the Net Recovery Approach can be used to estimate Fair Value. The Net Recovery Approach begins with estimating the expected cash flows to be realized under the payment terms of the subject security, as well as the timing and amount of the recovery value (based on estimated future Enterprise Value). The projected cash flows are then discounted to present value at a rate commensurate with the risks associated with the security to arrive at an estimate of Fair Value.
8
NorthStar Real Estate Income Trust, Inc.
|
|
Liquidation Approach:Often used when the issuer has entered bankruptcy, and/or is no longer considered to be a going concern. In this circumstance, the remaining assets are appraised at Fair Value, and discounted to reflect the amount of time to liquidation, and the uncertainty around the sale of assets in a forced liquidation.
Typically, a comprehensive credit analysis of the subject security will dictate the selection of one of the above-mentioned approaches:
9
NorthStar Real Estate Income Trust, Inc.
|
|
Credit Rating Analysis
Where credit ratings are provided by Moody’s and/or Standard & Poor’s (“S&P”), D&P will typically rely on such ratings with consideration for their relevance based on when they were issued and on the impact of business developments since the ratings date.
When actual credit ratings are not available, D&P estimates a synthetic credit rating based on certain key financial ratios (see below) published by S&P3 representing three year median ratios for all industrial debt issuers rated by S&P. Security credit ratings were estimated by applying a weighted average to applicable financial ratios. D&P also considered adjusting the resulting weighted average credit rating based on qualitative company-specific factors.
D&P considered these synthetic credit ratings when selecting benchmark credit indices to estimate an appropriate range of discount rates.
Standard & Poor’s Rating | AAA | AA | A | BBB | BB | B | ||||||||||||||||||
Operating Income to Sales | 28.20 | % | 25.30 | % | 19.50 | % | 17.00 | % | 17.20 | % | 15.80 | % | ||||||||||||
Return on Capital | 34.20 | % | 25.40 | % | 21.10 | % | 14.10 | % | 12.20 | % | 8.30 | % | ||||||||||||
EBIT Interest Coverage | 30.5x | 18.3x | 11.0x | 5.8x | 3.5x | 1.4x | ||||||||||||||||||
EBITDA Interest Coverage | 33.5x | 20.5x | 14.3x | 7.6x | 5.2x | 2.3x | ||||||||||||||||||
Funds from Operations to Total Debt | 200.70 | % | 73.40 | % | 53.00 | % | 34.00 | % | 25.30 | % | 11.90 | % | ||||||||||||
Free Operating Cash Flow to Total Debt | 157.80 | % | 49.80 | % | 34.00 | % | 17.00 | % | 11.90 | % | 3.20 | % | ||||||||||||
Discretionary Cash Flow to Total Debt | 96.80 | % | 29.40 | % | 22.70 | % | 11.00 | % | 9.10 | % | 2.30 | % | ||||||||||||
Total Debt to EBITDA | 0.4x | 1.1x | 1.5x | 2.3x | 3.0x | 5.3x | ||||||||||||||||||
Total Debt to Capital | 15.10 | % | 34.70 | % | 35.70 | % | 44.70 | % | 50.40 | % | 73.10 | % | ||||||||||||
| 3 | Sourced from Global Credit Portal – Ratings Direct®, “CreditStats: 2009 Adjusted Key U.S. And European Industrial and Utility Financial Ratios”; published August 20, 2010. |
10
NorthStar Real Estate Income Trust, Inc.
|
|
Discount Rate Considerations – Debt
When applying the Income Approach – Yield Analysis, a discount rate range for the loans were estimated by selecting a range of credit spreads, and then adding a LIBOR-based swap rate corresponding to each loan’s time to expected maturity. The swap rate reflects an investor’s required risk-free rate of return over the expected holding period of a security.
kd = Rf + CS
Where:
| kd: | Estimated discount rate; |
| Rf: | LIBOR-based swap rate – equal to thefixed-pay portion of afixed-for-float LIBOR swap agreement, with the term of the agreement set equal to the expected maturity of the security; and |
| CS: | Selected credit spread. |
In our estimation of a range of discount rates, we considered the following approaches:
Yield Calibration Approach:
A discount rate is determined by first estimating the impliedyield-to-maturity (“YTM”) as of the latest date where the security was involved in an arms-length transaction (“Transaction Date”). The YTM as of the Transaction Date provides an observable measurement of compensation a market participant requires to hold a security. Qualifying transactions often consist of: (1) the initial primary market transaction, (2) secondary transactions and (2) amendments where the investment was repriced.
The implied YTM is estimated using the following internal rate of return formula:

Where:
| P0: | Proceeds received at the Transaction Date (net of transaction costs); |
| Pm: | Principal due at maturity; |
| CFt: | Interest payments; and |
| k: | Discount rate such that the sum of the present-valued cash flows equals P0. |
| • | For variable-rate securities, a LIBOR-based swap rate, corresponding to the time to expected maturity, is then subtracted from the implied YTM to derive an implied credit spread as of the Transaction Date. The credit spread as of the Transaction Date is used as a calibration point to derive an implied credit spread as of the Valuation Date. |
Changes in credit spreads of comparable securities and indices are then measured and considered for adjustment to the security’s implied credit spread as of the Transaction Date. Changes are measured by comparing benchmark credit spreads on the Transaction Date to the same benchmark credit spreads as of the Valuation Date. Adding these changes in credit spreads to the security’s implied credit spread as of the Transaction Date gives an indication of risk in the form of an implied credit spread as of Valuation Date.
The implied credit spread is then used as a reference point to select a range of credit spreads that incorporate the changes in credit risk of the comparable benchmarks, while also taking into consideration any changes in the company’s risk profile.
11
NorthStar Real Estate Income Trust, Inc.
|
|
Adding back a LIBOR-based swap rate, corresponding to the time to expected maturity, to the concluded range of credit spreads yields an estimated range of discount rates.
| • | Similarly, for fixed-rate securities, changes in YTMs of comparable securities and indices are measured and considered for adjustment to the security’s implied YTM as of the Transaction Date. The implied YTM is then used as a reference point to select a range of discount rates. |
Build-up Approach:
A discount rate is determined by first assessing credit spreads and YTMs from comparable benchmarks and securities as of the Valuation Date. Based on the level of comparability, size, and risk of the subject security relative to the comparable benchmarks, a premium or discount may be applied.
For variable rate securities, adding back a LIBOR-based swap rate, corresponding to the time to expected maturity, to the concluded range of credit spreads yields an estimated range of discount rates.
Weighted Average Return Approach:
Often used when the subject company’s risk profile has increased substantially, leaving the subject security exposed to not only risks typical of a debt security, but equity as well. In cases where a subject company’s performance has progressively deteriorated over time, the company may no longer possess the earnings power and asset base to support a debt security in its current form.
This approach begins with assessing thepro-forma components of the subject security assuming a refinance as of the Valuation Date. In this instance, the subject company’s current earnings power and/or asset base are used to create a “hybrid” security, consisting of senior debt, subordinated debt and equity components. Rates of return are then estimated and subsequently weighted based on each components relative size within the “hybrid” security. The resulting weighted average rate of return is then leveraged to estimate a range of discount rates for the subject security.
In cases where it appears the subject company can no longer support a leveraged capital structure, or where the leverage through the subject security appears to exceed what the current market can provide, D&P will often consider rates of return that are typical of private equity investments.
12
NorthStar Real Estate Income Trust, Inc.
|
|
Conclusions
Utilizing the approaches and procedures discussed is the preceding sections, we have estimated a Fair Value range for each of the following loans as of March 31, 2017 to be as follows:
| Concluded Range | ||||||||||
Investment Name | Low | High | ||||||||
| 1) | Dallas CBD Office Mortgage | $ | 43,430,000 | $ | 43,430,000 | |||||
| 2) | New Jersey Office Mortgage | $ | 40,000,000 | $ | 40,400,000 | |||||
| 3) | Downtown NYC Office Preferred Equity | $ | 86,886,385 | $ | 92,998,995 | |||||
| 4) | Southern California Office Mortgage | $ | 41,017,244 | $ | 42,260,191 | |||||
| 5) | Texas Office Mezzanine Loan Portfolio | $ | 11,880,000 | $ | 12,240,000 | |||||
| 6) | NYC Midtown Hotel Mezzanine Loan Portfolio | $ | 16,500,000 | $ | 17,160,000 | |||||
| 7) | NYC Hotel—Wall Street Mezzanine Loan | $ | 11,820,000 | $ | 12,180,000 | |||||
| 8) | Minneapolis Area Full Service Hotel Mortgage | $ | 33,810,000 | $ | 34,845,000 | |||||
| 9) | Southeast Retail Portfolio | $ | 147,147,000 | $ | 151,651,500 | |||||
| 10) | Atlanta Area Hotel Junior Participation | $ | 3,349,665 | $ | 3,451,170 | |||||
| 11) | NYC HotelA-Participation | $ | 74,190,924 | $ | 79,745,325 | |||||
| 12) | NYC HotelB-Participation | $ | 25,017,300 | $ | 27,165,250 | |||||
| 13) | NYC Hotel-Senior Mezzanine Loan | $ | 17,017,000 | $ | 18,564,000 | |||||
| 14) | NYC Hotel-Junior Mezzanine Loan | $ | 17,042,807 | $ | 19,380,106 | |||||
| 15) | Chicago Office Complex Mortgage | $ | 85,124,427 | $ | 87,284,946 | |||||
| 16) | West Coast Retail Junior Participation | $ | 5,838,982 | $ | 5,956,942 | |||||
| 17) | Palm Springs Boutique Hotel | $ | 19,253,250 | $ | 19,543,500 | |||||
| 18) | Arizona Multifamily Mortgage | $ | 15,267,500 | $ | 15,655,000 | |||||
| 19) | Southwest Retail Junior Participation | $ | 5,149,788 | $ | 5,293,503 | |||||
|
|
|
| |||||||
Grand Total | $ | 699,742,272 | $ | 729,205,426 | ||||||
|
|
|
| |||||||
13
NorthStar Real Estate Income Trust, Inc.
|
|
Utilizing the approaches and procedures discussed is the preceding sections, we have estimated a Fair Value range for each of the following liabilities as of March 31, 2017 to be as follows:
| Concluded Range | ||||||||||
Liability Name | Low | High | ||||||||
Bank #1 Facility | ||||||||||
| 1) | Southeast Retail Portfolio | $ | 81,756,675 | $ | 83,408,325 | |||||
| 2) | New Jersey Office Mortgage | $ | 17,196,300 | $ | 17,543,700 | |||||
|
|
|
| |||||||
Total | $ | 98,952,975 | $ | 100,952,025 | ||||||
Bank #2 Facility | ||||||||||
| 1) | Minneapolis Area Full Service Hotel Mortgage | $ | 23,908,500 | $ | 24,150,000 | |||||
|
|
|
| |||||||
Total | $ | 23,908,500 | $ | 24,150,000 | ||||||
Bank #3 Facility | ||||||||||
| 1) | Southern California Office Mortgage | $ | 30,708,736 | $ | 31,492,122 | |||||
| 2) | Chicago Office Complex Mortgage | $ | 50,008,658 | $ | 50,766,365 | |||||
| 3) | Arizona Multifamily Mortgage | $ | 10,633,000 | $ | 10,904,250 | |||||
|
|
|
| |||||||
Total | $ | 91,350,394 | $ | 93,162,737 | ||||||
|
|
|
| |||||||
Grand Total | $ | 214,211,869 | $ | 218,264,762 | ||||||
|
|
|
| |||||||
14
NorthStar Real Estate Income Trust, Inc.
|
|
Valuation of Limited Partnership Interests
Introduction
D&P concluded on Fair Value NAVs for NSI’s interest in each of the following Investments:
| • | Secondary Private Equity Portfolio #1; |
| • | Secondary Private Equity Portfolio #2; and |
| • | Secondary Private Equity Portfolio #4. |
Transaction Overview – Secondary Private Equity Portfolio #1
NorthStar Realty Finance Corp. and NorthStar Income (collectively “NorthStar Entities” or the “Company”), through their subsidiaries and Partners (“Class A”), entered into a series of 4 partnerships with Investor 1 (“Investor 1”, or “Class B”) with initial closing on February 15, 2013 (“Secondary Private Equity Portfolio #1 Initial Closing”). These partnerships (“Secondary Private Equity Portfolio #1”) were created for the sole purpose to acquire, hold, and manage interests in certain private equity investment funds contributed into the partnerships by Investor 1. The purchase price of $400.1 million, which was deemed by Management to be Fair Value as it was an orderly transaction with multiple bidders, implied a total Fair Value of $788.9 million as of the Secondary Private Equity Portfolio #1 Initial Closing for the entire portfolio which was equal to Net Asset Value (“NAV”) as of June 30, 2012.
Investor 1 retained a 49.0 percent ownership interest in Secondary Private Equity Portfolio #1 and NorthStar Entities obtained the remaining 51.0 percent. As per the terms of the Secondary Private Equity Portfolio #1 agreements, NorthStar Entities are responsible for the management as well as all future funding commitments for Secondary Private Equity Portfolio #1.
Distributions of proceeds are subject to the following hurdle requirements:
Tranche | Hurdle | Distributions | ||
| Tranche A | 1.5x aggregate amount of all capital contributions made by Class A | Until Tranche A Hurdle is met, Class A will receive 85% of all distributions, and Class B will receive the remaining 15%. | ||
| Tranche B | June 30, 2012 contributed value | After Tranche A Hurdle has been met and until Tranche B hurdle is met, Class A will receive 15% of all distributions, and Class B will receive the remaining 85% | ||
| Tranche C | N/A | After Tranche B Hurdle has been met, Class A will receive 51% of all distributions, and Class B will receive the remaining 49% | ||
According to Management, the estimated NAV of Secondary Private Equity Portfolio #1 as of March 31, 2017 was $351.0 million.
15
NorthStar Real Estate Income Trust, Inc.
|
|
Transaction Overview – Secondary Private Equity Portfolio #2
On June 12, 2013, the NorthStar Entities, through their subsidiaries entered into an agreement with Investor 2 and its subsidiaries (“Investor 2”) to form two partnerships.
These partnerships were created for the sole purpose to acquire, hold, and sell interests in certain private equity investment funds (“Secondary Private Equity Portfolio #2”) acquired from the Seller (“the Seller 1”). The purchase price of $509.8 million, which was deemed by Management to be Fair Value as it was an orderly transaction with multiple bidders, implied a Fair Value of $925.4 million as July 3, 2013 for the whole portfolio which was equal to Net Asset Value (“NAV”) as of September 30, 2012 (starting point for the Secondary Private Equity Portfolio #2 model). Approximately 55.0 percent of the purchase price was funded upfront with the remainder (“Deferred Purchase Price”) to be funded four years following the final closing.
As of the Valuation Date, the NorthStar Entities hold a 30.0 percent ownership interest in the Secondary Private Equity Portfolio #2 and Investor 2 entities hold the remaining 70.0 percent. As per the terms of the investment agreements, the NorthStar Entities and Investor 2 are each responsible for their respective pro rata share of future funding commitments. As part of the transaction, the NorthStar Entities and Investor 2 entered into guarantee agreements (the “Guarantees”) whereby the guarantor unconditionally and irrevocably guaranteed the due and punctual payment, performance and observance of their respective obligations under the agreement to fund any necessary capital. Based on review and discussions with Management, we believe that the Guarantee is specific to the NorthStar Entities and Investor 2, and the projected distributions from the fund are in excess of the deferred purchase price. Hence, in the event of a sale, a market participant would likely not pay to transfer the Guarantees.
100.0 percent of all distributions from the Secondary Private Equity Portfolio #2 Fund Investments post September 30, 2012 through the individual fund closing date will be distributed to NorthStar / Investor 2. Commencing with the calendar quarter after the initial closing, distributions will be made to NorthStar / Investor 2 and the Seller 1 on a quarterly basis as follows (all distributions to the Seller 1 reduce the Deferred Purchase Price):
Period | NorthStar / Investor 2 | Seller 1 Share of Cash Flows / Deferred Payments | ||
| Through 3rd Anniversary of Close | 85% | Greater of (a) 15% of all distributions and (b) 15% of the remaining Deferred Purchase Price per year | ||
| Following the 3rd Anniversary through Year 4 Anniversary | 50% | 50% | ||
| Year 4 | N/A | Remaining Deferred Purchase Price owed | ||
According to Management, the estimated NAV of Secondary Private Equity Portfolio #2 as of March 31, 2017 was $432.6 million.
16
NorthStar Real Estate Income Trust, Inc.
|
|
Transaction Overview – Secondary Private Equity Portfolio #4
On January 25, 2016, PE Investments XVI2NT-I, LLC, as buyer, and NorthStar Real Estate Income Trust Operating Partnership, LP, a Delaware limited liability company, as Guarantor, entered into an agreement to purchase the portfolio of limited partnership interests from the Seller 2 (“the Seller 2”). The purchase price of $16.6 million was adjusted for distributions and contributions occurring prior to close, resulting in an adjusted purchase price of $15.1 million. Approximately 40.0 percent of the purchase price was funded upfront, with the remainder to be funded over the next two years through 50.0 percent cash sweeps on the distributions and two installment payments on December 30, 2016 and December 30, 2017 (“Deferred Purchase Price”). According to Management, the estimated NAV of Secondary Private Equity Portfolio #4 as of March 31, 2017 was $16.9 million.
Valuation Approaches
Outlined below is a general framework detailing the various approaches D&P considered in our assessment of the Investments.
As part of our analysis of a subject security, D&P typically assesses a portfolio company’s Enterprise Value4 to develop an understanding of the subject security’s relative positioning as it relates to the capitalization of the portfolio company5. This then allows D&P to select a valuation approach or approaches for the subject security that best reflects the characteristics of the security, as well as the financial condition of the portfolio company.
Enterprise Value Analysis:
Enterprise Value can be derived using the following valuation approaches:
Income Approach: The Income Approach is a valuation technique that provides an estimation of the Fair Value of an asset or business based on expectations about the cash flows that an asset or business would generate over time. The Income Approach begins with an estimation of the annual cash flows expected to be generated over a discrete projection period. The estimated cash flows for each of the years in the discrete projection period are then converted to their present value equivalent using a rate of return appropriate for the risk of achieving the projected cash flows. The present value of the estimated cash flows are then added to the present value equivalent of the residual value of the asset (if any) or the business at the end of the discrete projection period to arrive at an estimate of Fair Value.
| 4 | Enterprise Value is defined as the sum of the market value of a subject company’s interest bearing debt and preferred and common stock, lessnon-operating assets (i.e. cash and marketable securities). |
| 5 | Used only as a gauge to approximate equity cushion and does not express in any way D&P’s opinion on any of the Portfolio Companies’ Enterprise Value. |
17
NorthStar Real Estate Income Trust, Inc.
|
|
Market Approach: The Market Approach is a valuation technique that provides an estimation of Fair Value based on market prices in actual transactions and on asking prices for assets or businesses. The valuation process is a comparison and correlation between the subject asset or business and other similar assets or businesses. Considerations such as time and condition of sale and terms of agreements are analyzed for comparable assets or businesses and are adjusted to arrive at an estimation of the Fair Value of the subject asset or business.
Underlying Assets Approach:The Underlying Assets Approach is based on the book value of the company. Assets and liabilities on the company’s balance sheet are adjusted to their Fair Value equivalents.
For asset-based lending, which includes commercial, factoring, equipment, and mortgage loans, D&P will also consider the value of the collateral securing these subject securities. This will often involve reviewing recent appraisals as well as book values.
NorthStar Entities Valuation Approach
Given the orderly nature of the transactions, with other bidders, the purchase price as of the Secondary Private Equity Portfolio #1 Initial Close and Secondary Private Equity Portfolio #2 Initial close were deemed to represent Fair Value at inception for each investment.
To estimate the Fair Value of each of the Investments as of the Valuation Date, the NorthStar Entities have employed a discounted cash flow (“DCF”) model. Based on the nature of the Investments, NorthStar Entities concluded that the unit of account for the purposes of estimating Fair Value for financial reporting purposes is their overall interest in the respective JVs (and not any one underlying fund investment interest). Projected gross future cash flows are comprised of future fundings, income earned on the investments and realization of investments. The aggregate cash flows are then run through cash flow waterfalls specific to each of the Investments to determine the respective proportionate value of the NorthStar Entities’ interests, taking into account the specific deal structures. Given the specialized nature of the JVs, a market approach to estimating Fair Value was deemed not feasible, and an income approach was deemed the most appropriate valuation technique.
In developing the DCF analysis, Management utilized certain key assumptions, the main assumption being the NAV growth rate for each fund. These assumptions were developed by reviewing appropriate market benchmark data at the respective Investments’ closing dates. Deal specific factors (portfolio mix, developmental stage of underlying assets, etc.) were then considered relative to market data in developing the assumptions.
The selected rate was then used to grow each fund’s inception NAV to develop cash flow projections. Cash flows each quarter were then“trued-up” for actual distributions and contributions for the quarter.
18
NorthStar Real Estate Income Trust, Inc.
|
|
Duff & Phelps Valuation Approach
For the purposes of our analysis, we considered the Income, Market and Transaction Approaches. ASC 820 provides a practical expedient that allows the Fair Value of a Fund Interest to be estimated using NAV if the underlying investments are reported at Fair Value and are as of the same measurement date as the reporting entity. However, due to the complexities of the waterfalls for the JVs, the amount of effort required to validate individual NAVs as being Fair Value based, and to bring NAV in phase for each measurement date, we concluded that an Income Approach would provide more consistent, reliable, and timely Fair Value estimates. The income approach is calibrated against market factors at entry.
A range of indicated NAVs of the Investments was estimated using the Income Approach. The cash flows provided and detailed above were used in the application of the Income Approach. The cash flows were corroborated with distribution and capital call statements provided by Management for each of the underlying funds of the Investments.
The cash flows were discounted to present value through application of an appropriate discount rate. Specific assumptions and procedures utilized in our analysis are presented below and on the following pages.
Estimation of Secondary Private Equity Portfolio #1 and Secondary Private Equity Portfolio #2 Discount Rate
Required Return on Equity—We used the Capital Asset Pricing Model (“CAPM”) to determine the return on equity for the Secondary Private Equity Portfolio #2 and Secondary Private Equity Portfolio #1, and a buildup approach for Secondary Private Equity Portfolio #4. The CAPM is a generally accepted method for estimating an investor’s return requirement, and hence a company’s cost of equity capital.
CAPM is represented by the following algebraic equation:
| Re | = | Rf + ß (Rm - Rf) + Ssp + A + CRP |
| where: | ||||||
| Re | = | equity rate of return | ||||
| Rf | = | risk-free rate of return | ||||
| ß | = | beta (systematic risk coefficient for the particular investment) | ||||
| (Rm-Rf) | = | equity risk premium expected on equity investments in a diversified portfolio of large capitalization common stocks | ||||
| Ssp | = | small company premium adjustment to the cost of equity due to the size of the Company | ||||
| A | = | alpha to reflect company-specific risk | ||||
| CRP | = | country risk premium adjustment to the cost of equity | ||||
19
NorthStar Real Estate Income Trust, Inc.
|
|
Risk free rate –We concluded on a risk-free rate of 3.5 percent.
Beta–Practical application of the CAPM also relies upon the ability to identify publicly traded companies that have similar risk characteristics as the Secondary Private Equity Portfolio #2 and Secondary Private Equity Portfolio #1 in order to derive meaningful measures of the subject company’s beta.
Equity risk premium – The market risk premium is the expected return in excess of the risk-free rate which investors require for investing in large capitalization stocks, based on the long term premium realized over the risk-free rate. Quantification of the market risk premium has been the subject of considerable research by security analysts. Based on a review of historical and forward-looking market risk premium data, we applied a 5.5 percent premium for the Secondary Private Equity Portfolio #2, and Secondary Private Equity Portfolio #1 as of the Valuation Date.6
Small stock premium – The CAPM rate of return is adjusted by a premium that reflects the extra risk of an investment in a small company. This premium is derived based on a study conducted by Duff & Phelps that examines the historical differences in returns between small and large companies. Given the size of each fund’s operations, we included a small stock premium of approximately 2.7 percent for Secondary Private Equity Portfolio #1 and Secondary Private Equity Portfolio #2.
Alpha– company specific risk premium. We applied an alpha of 0.5 percent to the Secondary Private Equity Portfolio #2 and an alpha of 7.5 percent for the Secondary Private Equity Portfolio #1.
Country Risk Premium– The CAPM rate of return is adjusted by a premium which reflects the additional risk associated with a company’s operations in foreign countries. The CRP does not apply to Secondary Private Equity Portfolio #2 and Secondary Private Equity Portfolio #1.
Based on our analysis of the comparable companies, we determined the required equity rate of return to be 11.0 percent for the Secondary Private Equity Portfolio #2, 18.0 percent for the Secondary Private Equity Portfolio #1.
Estimation of Secondary Private Equity Portfolio #4 Discount Rate
We used the Build Up Approach to determine the return on equity for Secondary Private Equity Portfolio #4. In the Build Up Approach, a discount rate is determined by first assessing credit spreads and YTMs from comparable benchmarks and comparable securities as of the Valuation Date. Based on the level of comparability, size and risk of the subject security relative to the comparable benchmarks, a premium or discount may be applied. For variable rate securities, adding back a LIBOR-based swap rate, corresponding to the time to expected maturity, to the concluded range of credit spreads yields an estimated range of discount rates.
| 6 | Source: Estimated projected market risk premiums per Roger Grabowski and David King, forthcoming “2016 Valuation Handbook – Guide to Cost of Capital”. |
20
NorthStar Real Estate Income Trust, Inc.
|
|
Secondary Private Equity Portfolio #4 differed from Secondary Private Equity Portfolio #1 and Secondary Private Equity Portfolio #2 due to the specific risk profile of the underlying funds. NSI expects approximately 49.3 percent of Secondary Private Equity Portfolio #4’s total future distributions to be received within one year of the Valuation Date, and the remainder to be received within two years of the Valuation Date. The short timeline of these distributions reduces the uncertainty of receiving cash flows compared to a longer timeline. Thus, we determined that an equity rate of return is not applicable to this limited partnership. To estimate a required rate of return for Secondary Private Equity Portfolio #4, we reviewed both United States government treasury yields as of the Valuation Date and Cushman and Wakefield real estate credit spreads as of the Valuation Date.
We took the one year and two year treasury yields as of the Valuation Date and weighted the one year yield at 49.3 percent and the two year yield at 50.7 percent. This weighting reflects the expected time horizon for the remaining distributions. We added an alpha of 3.5 percent to this blended rate to reflect the additional risk associated with the remaining distributions above that of the risk free rate to arrive at our concluded yield from US Treasuries.
We also used Cushman & Wakefield real estate spreads as of March 2017 for Multifamily, Industrial, Office, Hospitality, and Other and weighted them according to the type of property owned by the underlying funds in the Secondary Private Equity Portfolio #4 portfolio. NSI provided us with the breakout by property type of Secondary Private Equity Portfolio #4 as of the Valuation Date. We added the three month USD Libor rate to our blended rate and applied an alpha of 1.0 percent to reflect the additional risk associated with the remaining distributions above that of real estate returns to arrive at the concluded yield from Cushman and Wakefield Spreads.
We then took the average of both the concluded yields from US Treasuries and Cushman and Wakefield Spreads to arrive at a discount rate range of 6.5 percent, with a range of 4.5 percent to 8.5 percent.
Benchmarking
To corroborate our application of the Income Approach, we calculated the internal rate of return (“IRR”) of the projected distributions provided for the Secondary Private Equity Portfolio #2, the Secondary Private Equity Portfolio #1, and Secondary Private Equity Portfolio #4. December 31, 2016 NAVs as provided by Management were used as the starting point for IRR calculations. The Secondary Private Equity Portfolio #2 IRR of the projected cash flows was calculated as 9.5 percent. The Secondary Private Equity Portfolio #1 IRR of the projected cash was calculated as 17.8 percent. The Secondary Private Equity Portfolio #4 IRR of the projected cash was calculated as 0.3 percent.
21
NorthStar Real Estate Income Trust, Inc.
|
|
To verify the reasonableness of the calculated IRRs, we looked at historical returns for various subsets of the FTSE NAREIT U.S. Real Estate Index. The NAREIT index is developed using the prices from the universe of REITs, which trade publicly and therefore have market-clearing pricing updated throughout the trading day. The NCREIF was also considered, but as this is based on individual appraisals of land assets, it tends to be slightly stale compared to the NAREIT. Averaging together the annual compounded returns for the FTSE NAREIT U.S. Real Estate Index from 2006 through the first quarter of 2017, the mean return was calculated to be 7.1 percent.
This data supports the calculated IRRs of the Secondary Private Equity Portfolio #2, the Secondary Private Equity Portfolio #1, and Secondary Private Equity Portfolio #4 with the understanding that the subject investments warrant a different rate of return due to differences in time horizon and liquidity between public REITs and underlying assets of privately-held real estate funds.
22
NorthStar Real Estate Income Trust, Inc.
|
|
Conclusion
Based on the Limited Procedures performed for this analysis, we have estimated the Fair Value NAV of NSI’s interest in the Investments, to be reasonably stated in the range of $57.0 million to $63.0 million for the Secondary Private Equity Portfolio #2, $29.0 million to $31.0 million for the Secondary Private Equity Portfolio #1, and $11.4 million to $12.0 million for Secondary Private Equity Portfolio #4, as of the Valuation Date as summarized on the following page.
| 3/31/2017 Fair Value NAV | ||||||||
(USD in Millions) | ||||||||
| Low | High | |||||||
Interest in Secondary Private Equity Portfolio #2 | $ | 57.0 | $ | 63.0 | ||||
Interest in Secondary Private Equity Portfolio #1 | $ | 29.0 | $ | 31.0 | ||||
Interest in Secondary Private Equity Portfolio #4 | $ | 11.4 | $ | 12.0 | ||||
Therefore, we concluded on a range of $97.4 million to $106.0 million for NSI’s combined limited partnership interests as summarized below:
| Combined Limited Partnership Interests | ||||
(USD in Millions) | ||||
$97.4 | $ | 106.0 | ||
23
NorthStar Real Estate Income Trust, Inc.
|
|
Valuation of CMBS Facilities
Scope of Work
We have estimated Fair Values for each CMBS and CRE CDO position, as well as certain repurchase agreements. Fair Value is defined as stated in ASC §820, Fair Value Measurements, (formerly Statement of Financial Accounting Standards No. 157), which defines Fair Value as “the price that would be received to sell an asset or paid to transfer a liability in an orderly transaction between market participants at the measurement date.” In the course of our analysis of the CMBS, we relied upon financial and other information, including prospective financial information, obtained from Management and from various public, financial industry and market sources. Our conclusion was dependent on such information being complete and accurate in all material respects. The principal sources of information used in performing our analysis included the following: Discussions with Management, NSI’s Portfolio containing all CMBS to be valued provided by Management as of March 31, 2017, as well as financial reports on individual loans and buildings, Contractual terms of the CMBS and CRE CDOs, and 3rd party valuation tools such as Intex and Trepp.
CMBS Summary Methodological Approach
The Prices of the CMBS securities are estimated using a waterfall approach. The future cash flows are estimated through time according to the terms outlined in the prospectus (the “Waterfall”) using market-standard deal modeling software (e.g., Trepp and Intex). We estimate the default rate, loss severity, prepayment, and delinquency assumptions for the underlying assets of the CMBS based on the historical performance of the trust, our understanding of market participants’ expectations, servicer reports, representative indices, and various research reports from investment banks. The future cash flows of the assets are generated according to the waterfall, utilizing our judgment to incorporate the assumptions above. The coupon and principal payments of each tranche are discounted at the estimated rate of return required by investors, based on the characteristics of the CMBS as calculated from the indexes described above, to determine the Fair Value of the Security.
CMBS Market Information
We are actively in touch with various market participants and have examined a range of relevant market color for the CMBS within the NSI Portfolio. Using a hierarchical process we have incorporated this proprietary market color into our analysis. We have also reviewed a number of research reports fromtop-tier investment banks indicating spreads for 2.0/3.0 CMBS as of the Valuation Date. The table below shows representative average spread data compiled from published research reports:
24
NorthStar Real Estate Income Trust, Inc.
|
|
CMBS Market Color
As of The Valuation Date
Credit Type | Spread | |||
AAA | 91 | |||
AA | 131 | |||
A | 182 | |||
BBB- | 451 | |||
Please see the CMBS Estimate of Fair Value table for the summary valuation results for each of the CMBS.
Assets – Estimate of Range of Fair Value
As of March 31, 2017
| D&P Estimate of Range of Fair Value—Net Asset Value | ||||||||||||||||||||||||||
CUSIP | Security Name | Credit Type | CMBS Vintage | Current Balance | Low End of Range | Mid of Range | High End of Range | |||||||||||||||||||
CMBS #1 | CMBS #1 | BB | 2011 | $ | 10,000,000 | $ | 8,791,011 | $ | 9,203,271 | $ | 9,615,531 | |||||||||||||||
CMBS #2 | CMBS #2 | BB | 2013 | $ | 19,914,000 | $ | 15,562,198 | $ | 16,202,850 | $ | 16,843,502 | |||||||||||||||
CMBS #3 | CMBS #3 | BB- | 2013 | $ | 12,802,000 | $ | 9,240,770 | $ | 9,470,701 | $ | 9,700,633 | |||||||||||||||
CMBS #4 | CMBS #4 | B | 2013 | $ | 21,336,000 | $ | 14,733,814 | $ | 15,482,144 | $ | 16,230,474 | |||||||||||||||
CMBS #5 | CMBS #5 | NR | 2013 | $ | 19,914,694 | $ | 8,561,676 | $ | 9,162,229 | $ | 9,762,783 | |||||||||||||||
CMBS #6 | CMBS #6 | BBB- | 2015 | $ | 16,113,000 | $ | 10,649,630 | $ | 11,038,001 | $ | 11,426,372 | |||||||||||||||
CMBS #7 | CMBS #7 | BBB- | 2016 | $ | 6,664,000 | $ | 5,021,731 | $ | 5,214,642 | $ | 5,407,554 | |||||||||||||||
CMBS #8 | CMBS #8 | BBB- | 2016 | $ | 7,000,000 | $ | 5,218,412 | $ | 5,418,131 | $ | 5,617,850 | |||||||||||||||
CMBS #9 | CMBS #9 | BB- | 2015 | $ | 10,000,000 | $ | 4,459,472 | $ | 4,928,244 | $ | 5,397,016 | |||||||||||||||
CMBS #10 | CMBS #10 | BBB- | 2016 | $ | 10,000,000 | $ | 6,727,100 | $ | 6,994,058 | $ | 7,261,015 | |||||||||||||||
CMBS #11 | CMBS #11 | BBB- | 2016 | $ | 4,200,000 | $ | 3,020,625 | $ | 3,138,599 | $ | 3,256,572 | |||||||||||||||
CMBS #12 | CMBS #12 | BBB- | 2017 | $ | 2,230,000 | $ | 1,740,159 | $ | 1,812,364 | $ | 1,884,570 | |||||||||||||||
CMBS #13 | CMBS #13 | BBB- | 2017 | $ | 3,200,000 | $ | 2,494,785 | $ | 2,598,484 | $ | 2,702,184 | |||||||||||||||
CMBS #14 | CMBS #14 | BB- | 2016 | $ | 11,820,000 | $ | 7,193,927 | $ | 7,458,748 | $ | 7,723,569 | |||||||||||||||
|
|
|
|
|
|
|
| |||||||||||||||||||
Total | $ | 155,193,694 | $ | 103,415,312 | $ | 108,122,468 | $ | 112,829,625 | ||||||||||||||||||
|
|
|
|
|
|
|
| |||||||||||||||||||
Liabilities – Estimate of Range of Fair Value
As of March 31, 2017
| D&P Estimate of Range of Fair Value - Net Asset Value | ||||||||||||||||||||||||||
CUSIP | Security Name | Credit Type | CMBS Vintage | Position Notional | Low End of Range | Mid of Range | High End of Range | |||||||||||||||||||
Repo | Repurchase Agreement CMBS #6 | BBB- | 2015 | $ | 7,652,000 | $ | 7,649,164 | $ | 7,652,067 | $ | 7,654,971 | |||||||||||||||
Repo | Repurchase Agreement CMBS #7 | BBB- | 2016 | $ | 3,260,000 | $ | 3,258,329 | $ | 3,259,904 | $ | 3,260,479 | |||||||||||||||
Repo | Repurchase Agreement CMBS #8 | BBB- | 2016 | $ | 4,087,000 | $ | 4,086,342 | $ | 4,086,897 | $ | 4,087,451 | |||||||||||||||
Repo | Repurchase Agreement CMBS #10 | BBB- | 2016 | $ | 5,218,000 | $ | 5,217,160 | $ | 5,217,868 | $ | 5,218,576 | |||||||||||||||
Repo | Repurchase Agreement CMBS #13 | BBB- | 2017 | $ | 1,920,000 | $ | 1,919,691 | $ | 1,919,952 | $ | 1,920,212 | |||||||||||||||
Repo | Repurchase Agreement CMBS #11 | BBB- | 2016 | $ | 2,343,000 | $ | 2,342,623 | $ | 2,342,941 | $ | 2,343,259 | |||||||||||||||
Repo | Repurchase Agreement CMBS #12 | BBB- | 2017 | $ | 1,328,000 | $ | 1,327,786 | $ | 1,327,966 | $ | 1,328,147 | |||||||||||||||
|
|
|
|
|
|
|
| |||||||||||||||||||
Total | $ | 25,808,000 | $ | 25,802,095 | $ | 25,807,595 | $ | 25,813,095 | ||||||||||||||||||
|
|
|
|
|
|
|
| |||||||||||||||||||
25
|
Real Estate Valuation - Operating Real Estate & Downtown NYC Office Preferred Equity
Preferred Equity
Scope of Work
We have identified the problem based on the purpose, intended use of the appraiser’s opinions and conclusions, type and definition of value, effective date of the appraiser’s opinions and conclusions, subject of the assignment and its relevant characteristics, and assignment conditions and have conducted the appropriate scope of work and consider it to be sufficient to produce credible assignment results.
As such, our scope of services related to the Operating Real Estate included the following:
| • | An analysis of the Operating Real Estate completed on a desktop basis only; |
| • | A study of each market to measure current market conditions, supply and demand factors, growth patterns, and their effect on the real estate assets; |
| • | Completion of the income capitalization approach, by discounted cash flow and direct capitalization methods as appropriate, for each of the real estate assets; |
| • | Completion of the sales comparison approach, if applicable or required to produce credible results, for any of the real estate assets; |
| • | Read and discuss recent third party appraisal reports; |
| • | Meet and/or talk with relevant members of the Advisor’s deal teams to discuss valuation and the relatedwrite-ups, to understand the Advisor’s expectations and intent regarding each investment and to discuss any relevant updates; |
| • | Consider general economic and industry trends and the investment operating and financial results (including audited financial statements, where available); |
| • | Consider other facts and data that are pertinent to the investments as disclosed by the Advisor; |
| • | Delivery of a range of values with midpoint estimates for each of the assets as well as underlying assumptions used in the analysis as appropriate. |
| • | Reviewed Company-provided waterfall distribution models, as applicable; |
| • | Applied our estimates of fair value, cash flow projections, equity yield rates, and marketability discounts to Company-provided waterfall distribution models to arrive at the fair value of the Company’s equity interests on anon-consolidated basis; |
26
NorthStar Real Estate Income Trust, Inc.
|
|
Definitions
Leased Fee – An ownership interest held by a landlord with the rights of use and occupancy conveyed by a lease to others. The rights of the lessor (the leased fee owner) and the leased fee are specified by contract terms contained within a lease.
Fee Simple – Absolute ownership unencumbered by any other interest or estate, subject only to the limitations imposed by the governmental powers of taxation, eminent domain, police power, and escheat.
History of the Subject Properties
To the best of our knowledge, none of the subject properties have been involved in any transactions over the past three years. Further, we are unaware of any listings currently involving the subject properties.
Identification of Type of Appraisal and Type of Report
A general outline of our scope of work is presented previously and includes the preparation of an appraisal report in a Restricted Appraisal Report format that complies with Standards Rule2-2(b) of USPAP. The analysis and conclusions set forth in the report may not be understood properly without additional information contained in our work files.
Purpose and Intended Use of the Appraisal
The purpose of this appraisal is to estimate the fair values of the Company’s Investments, as of March 31, 2017 subject to the definition of Fair Value, the General Assumptions and Limiting Conditions, Extraordinary Assumptions, and the Certification as set forth in the attached appraisal report. The intended use of this appraisal is to aid the Board of Directors of NSI I in their financial reporting. The report is intended for the use by NorthStar Real Estate Income I, Inc (the “Company”) and CNI NSI Advisors, LLC (the “Advisor”). This appraisal was completed in connection with a business combination transaction between Nova I, Nova II, and Constellation.
Date of Opinion of Value
The effective date of value is March 31, 2017.
Exposure Time/Marketing Period
Exposure time is defined by USPAP as follows:
27
NorthStar Real Estate Income Trust, Inc.
|
|
The estimated length of time the property interest being appraised would have been offered on the market prior to the hypothetical consummation of a sale at market value on the effective date of the appraisal; a retrospective opinion based upon an analysis of past events assuming a competitive and open market.
We have estimated the exposure and marketing time for each of the subject real estate assets in the portfolio. We have estimated the exposure/marketing time at 6 to 12 months.
Highest and Best Use
As defined by the Appraisal Institute in The Dictionary of Real Estate Appraisal, 6th edition, “highest and best use” is:
The reasonably probable and legal use of vacant land or an improved property, which is physically possible, appropriately supported, financially feasible, and that results in the highest value. The four criteria the highest and best use must meet are:
| • | Legal Permissibility |
| • | Physical Possibility |
| • | Financial Feasibility |
| • | Maximum Productivity |
The above definition of highest and best use applies to use of a site as though vacant, as well as to the property as improved. When a site contains improvements, the highest and best use may be determined to be different from the existing use. The existing use will continue unless and until the land value in its highest and best use exceeds the sum of the value of the entire property in its existing use plus the cost to remove the improvements.
The highest and best use was determined for each of the real estate assets. For the office properties, the highest and best use as vacant was for office development; the highest and best use as improved was for continued use as office properties. For the multifamily properties, the highest and best use as vacant was for multifamily development; the highest and best use as improved was for continued use as multifamily developments. For the industrial properties, the highest and best use as vacant was for industrial development; the highest and best use as improved was for continued use as industrial properties.
28
NorthStar Real Estate Income Trust, Inc.
|
|
VALUATION THEORY
In traditional valuation theory, the three approaches to estimating the value of an asset are the cost approach, sales comparison approach, and income capitalization approach. Each approach assumes valuation of the property at the properties highest and best use. From the indications of these analyses, an opinion of value is reached based upon expert judgment within the outline of the appraisal process. In this analysis, we have considered the income approach as our primary indicator of value, with secondary consideration given to a survey of comparable sales data. We did not use the cost approach as this approach is not typically considered by investors of similar property types.
Sales Comparison Approach
The sales comparison approach estimates value based on what other purchasers and sellers in the market have agreed to as price for comparable improved properties. This approach is based upon the principle of substitution, which states that the limits of prices, rents, and rates tend to be set by the prevailing prices, rents, and rates of equally desirable substitutes.
Income Capitalization Approach
The income capitalization approach simulates the reasoning of an investor who views the cash flows that would result from the anticipated revenue and expense on a property throughout its lifetime. The net income developed in our analysis is the balance of potential income remaining after vacancy and collection loss, and operating expenses. This net income is then capitalized at an appropriate rate to derive an estimate of value or discounted by an appropriate yield rate over a typical projection period in a discounted cash flow analysis. Thus, two key steps are involved: (1) estimating the net income applicable to the subject and (2) choosing appropriate capitalization rates and discount rates. The appropriate rates are ones that will provide both a return on the investment and a return of the investment over the life of a particular property.
Correlation and Conclusion
Each appraisal approach to value is utilized to as a check to the other. Inherent in each is an interpretation of market conditions as they affect the subject property. The quality and the quantity of the data in each approach are considered, along with the relevance of each to the property. For this analysis, we have considered the income approach as our primary indication of value. We have additionally gathered comparable sales throughout the various subject markets as secondary support for our value estimate. For any properties with excess land, we have completed the sales comparison approach to estimate the vacant land value.
29
NorthStar Real Estate Income Trust, Inc.
|
|
INCOME CAPITALIZATION APPROACH
The income capitalization approach is based on the premise that value is created by the expectation of future benefits. We estimated the present value of those benefits to derive an indication of the amount that a prudent, informed purchaser-investor would pay for the right to receive them as of the valuation date.
This approach requires an estimation of the net operating income of a property. The estimated net operating income is then converted to a value indication by use of either the direct capitalization method or the discounted cash flow analysis.
The discounted cash flow (“DCF”) analysis focuses on the operating cash flows expected from the property and the anticipated proceeds of a hypothetical sale at the end of an assumed holding period. These amounts are then discounted to their present value. The discounted present values of the income stream and the reversion are added to obtain a value indication. Because benefits to be received in the future are worth less than the same benefits received in the present, this method weights income projected in the early years more heavily than the income and the sale proceeds to be received later.
Direct capitalization uses a single year’s stabilized net operating income as a basis for a value indication. It converts estimated “stabilized” annual net operating income to a value indication by dividing the income by a capitalization rate. The rate chosen includes a provision for recapture of the investment and should reflect all factors that influence the value of the property, such as tenant quality, property condition, neighborhood change, market trends, interest rates and inflation. The rate may be inferred from local market transactions or, when transaction evidence is lacking, obtained from trade sources.
In some situations, both methods yield similar results. The DCF method is more appropriate for the analysis of investment properties with multiple leases particularly leases with cancellation clauses or renewal options, and especially in volatile markets. The direct capitalization method is normally more appropriate for properties with relatively stable operating histories and expectations.
Direct Capitalization
We have concluded on the market value of the following five (5) Operating Real Estate assets using the direct capitalization approach: Southeast Multifamily Equity, Midwest Multifamily Equity, Midwest Student Housing Equity, Southeast Student Housing Equity, and Southeast Student Housing Equity II.
30
NorthStar Real Estate Income Trust, Inc.
|
|
Discounted Cash Flow Analysis
We have concluded on the value of the following four (4) Operating Real Estate assets using the discounted cash flow method: Washington D.C. Area Office Portfolio Equity, Midwest Class A Office Equity, Northeast Class A Office Equity, and Ohio Industrial Equity Portfolio. We have also concluded on the value of the Downtown NYC Office Preferred Equity asset using the discounted cash flow method.
Leased Status of the Operating Real Estate Assets and Downtown NYC Office Preferred Equity
The four (4) Operating Real Estate assets: Washington D.C. Area Office Portfolio Equity, Midwest Class A Office Equity, Northeast Class A Office Equity, and Ohio Industrial Equity Portfolio; along with Downtown NYC Office Preferred Equity, are encumbered by a variety of net and modified gross leases, and expense reimbursements may vary based on the contractual terms of each lease. We were provided with Argus models reflecting the leased status of each property as of the Valuation Date. Leases at Southeast Multifamily Equity and Midwest Multifamily Equity, the two multi-family residential properties, roll on a staggered basis such that exposure to significant turnover risk is mitigated. Midwest Student Housing Equity, Southeast Student Housing Equity, and Southeast Student Housing Equity II are leased based on the academic year, with complete lease rollover occurring every twelve months, which is typical of the student housing market.
Market Rent Analysis
The factors we considered in determining market rental rates were:
| • | Current contract rent levels at the subject properties |
| • | Recently signed leases at the subject properties |
| • | Asking rates at competitive properties |
| • | Current contract rents and recently signed leases at comparable properties |
Market Rent Estimate
The market rental rates for the Operating Real Estate and Downtown NYC Office Preferred Equity were estimated from market data that was gathered specific to each of the Operating Real Estate and Downtown NYC Office Preferred Equity properties. Market rental rates include escalations as estimated based on our research. Our market rental rate estimates are based a net effective rate; thus, additional concessions have not been applied. Any leases that were recently signed were also considered in our analysis of a market rent estimate.
31
NorthStar Real Estate Income Trust, Inc.
|
|
Reimbursements
For multi-tenant properties, reimbursements were modeled on aproperty-by-property basis to reflect the market. In most cases, a capital reserve was included.
Vacancy and Collection Loss
Vacancy and collection loss have been applied in our analysis on aproperty-by-property basis depending on the tenant mix and market.
Expense Analysis
In estimating operating expenses for the Operating Real Estate properties and Downtown NYC Office Preferred Equity, we have relied upon historical and projected real estate taxes incorporated into the Argus DCF models provided by the client. In the absence of sufficient historical or projected operating expenses at the property level, market data, such as expense levels at comparable properties or survey data, was utilized to estimate operating expenses. Each item of expense was analyzed, and we developed an opinion of a level of expense we believe a typical investor would consider reasonable.
Capital Improvements
The Company has provided us with a schedule of planned capital expenditures on acase-by-case basis. Planned capital expenditures have been modeled in our property-specific cash flow models. Reserves for replacement have been included in our analysis as a capital expense. The amount of the reserve is based on property type and condition.
Operating Statement
In estimating the Operating Real Estate and Downtown NYC Office Preferred Equity’s pro forma operating cash flow, the operating history and budgets within the client provided Argus DCF models have been analyzed, as appropriate. In cases where expenses were not provided in historical data or with the Argus DCF models, expenses have been estimated using expense comparables or market surveys such as IREM.
Discounted Cash Flow Method
As discussed previously, we have completed a discounted cash flow method of analysis for the four (4) Operating Real Estate assets: Washington D.C. Area Office Portfolio Equity, Midwest Class A Office Equity, Northeast Class A Office Equity, and Ohio Industrial Equity Portfolio; along with Downtown NYC Office Preferred Equity. The discounted cash flow method involves the following steps:
| • | Estimate the subject’s Potential Gross Income (PGI) through an analysis of the subject’s actual historic income and an analysis of competitive market rental rates. |
32
NorthStar Real Estate Income Trust, Inc.
|
|
| • | Estimate and deduct vacancy and collection losses from PGI to develop the Effective Gross Income (EGI). |
| • | Develop and subtract operating expenses from EGI to derive the Net Operating Income (NOI). |
| • | Estimate and deduct capital costs (i.e., tenant improvements, leasing commissions, capital repairs and replacements) from the NOI to derive the cash flow. |
| • | Develop the appropriate discount (Yo) and terminal capitalization rate (Rt). |
| • | Convert the cash flow and reversion into present value using the discount rate (Yo). |
In applying the DCF technique, we estimated the operating results over a hypothetical stabilized holding period and assumed the property would be sold at the end of following year for a price calculated by capitalizing the projected following year’s net income. The cash flows were then discounted at a rate reflective of current market conditions, bearing in mind the investment characteristics of the property.
Discounted Cash Flow Assumptions, Forecast, and Conclusion
Exhibits detailing the assumptions applied in the discounted cash flow analysis for each for the four (4) Operating Real Estate assets: Washington D.C. Area Office Portfolio Equity, Midwest Class A Office Equity, Northeast Class A Office Equity, and Ohio Industrial Equity Portfolio; along with Downtown NYC Office Preferred Equity have been provided under separate cover.
Capitalization Rate
The capitalization rate is the factor that converts the stabilized net operating income (NOI) to a present value. It is the ratio of net income to value or sale price.
NOI ÷ Sale Price = Capitalization Rate
The following exhibit details national overall capitalization rates extracted from the PwC Real Estate Investor Survey as of the 1st Quarter 2017, as well as the Situs RERC Report as of the 1st Quarter 2017.
Source | Dated | Market | Property Type | Minimum | Maximum | Average | ||||||||||||
PwC Real Estate Investor Survey | 1st Quarter 2017 | National | Apartment | 3.50 | % | 8.00 | % | 5.33 | % | |||||||||
PwC Real Estate Investor Survey | 4th Quarter 2016 | National | Student Housing | 4.50 | % | 7.50 | % | 6.02 | % | |||||||||
RERC | 1st Quarter 2017 | National | Apartment | 4.00 | % | 6.50 | % | 5.20 | % | |||||||||
RERC | 1st Quarter 2017 | National | Student Housing | 5.30 | % | 6.30 | % | 5.70 | % | |||||||||
In addition to the surveys above, we have considered capitalization rates from recently acquired properties within the Company’s portfolio as well as recent sales pulled from the market with the same or similar tenants to those of the Operating Real Estate properties and Downtown NYC Office Preferred Equity.
33
NorthStar Real Estate Income Trust, Inc.
|
|
Capitalization Rate Conclusion
Capitalization rates were selected on aproperty-by-property basis. Surveys used for each property, as well as comparables pulled from the market have been provided under separate cover.
Terminal Capitalization Rate
The terminal capitalization rate, or residual capitalization rate, is applied at the end of the holding period to estimate the reversionary value. The following exhibit details national terminal capitalization rates extracted from the PwC Real Estate Investor Survey as of the 1st Quarter 2017, as well as the Situs RERC Report as of the 1st Quarter 2017.
Source | Dated | Market | Property Type | Minimum | Maximum | Average | ||||||||||||
PwC Real Estate Investor Survey | 1st Quarter 2017 | National | CBD Office | 4.75 | % | 7.50 | % | 6.11 | % | |||||||||
PwC Real Estate Investor Survey | 1st Quarter 2017 | National | Suburban Office | 6.00 | % | 10.50 | % | 7.39 | % | |||||||||
RERC | 1st Quarter 2017 | National | CBD Office | 5.00 | % | 7.50 | % | 6.10 | % | |||||||||
RERC | 1st Quarter 2017 | National | Suburban Office | 6.30 | % | 8.50 | % | 7.20 | % | |||||||||
PwC Real Estate Investor Survey | 1st Quarter 2017 | National | Warehouse | 5.00 | % | 7.00 | % | 6.03 | % | |||||||||
PwC Real Estate Investor Survey | 1st Quarter 2017 | National | Flex R&D | 6.00 | % | 9.00 | % | 7.33 | % | |||||||||
RERC | 1st Quarter 2017 | National | Warehouse | 5.00 | % | 7.50 | % | 6.20 | % | |||||||||
RERC | 1st Quarter 2017 | National | R&D | 6.00 | % | 8.00 | % | 7.20 | % | |||||||||
RERC | 1st Quarter 2017 | National | Flex R&D | 6.00 | % | 9.50 | % | 7.50 | % | |||||||||
Additional survey data, and our conclusion of terminal rates for each of the Operating Real Estate properties and Downtown NYC Office Preferred Equity, has been provided under separate cover.
Discount Rate
The following exhibit details national discount rates extracted from the PwC Real Estate Investor Survey as of the 1st Quarter 2017, as well as the Situs RERC Report as of the 1st Quarter 2017.
Source | Dated | Market | Property Type | Minimum | Maximum | Average | ||||||||||||
PwC Real Estate Investor Survey | 1st Quarter 2017 | National | CBD Office | 5.50 | % | 9.50 | % | 7.09 | % | |||||||||
PwC Real Estate Investor Survey | 1st Quarter 2017 | National | Suburban Office | 6.00 | % | 10.50 | % | 7.88 | % | |||||||||
RERC | 1st Quarter 2017 | National | CBD Office | 5.30 | % | 10.00 | % | 7.40 | % | |||||||||
RERC | 1st Quarter 2017 | National | Suburban Office | 7.00 | % | 10.00 | % | 8.30 | % | |||||||||
PwC Real Estate Investor Survey | 1st Quarter 2017 | National | Warehouse | 5.50 | % | 9.00 | % | 6.74 | % | |||||||||
PwC Real Estate Investor Survey | 1st Quarter 2017 | National | Flex R&D | 6.75 | % | 10.50 | % | 8.08 | % | |||||||||
RERC | 1st Quarter 2017 | National | Warehouse | 5.80 | % | 10.00 | % | 7.40 | % | |||||||||
RERC | 1st Quarter 2017 | National | R&D | 7.00 | % | 10.00 | % | 8.20 | % | |||||||||
RERC | 1st Quarter 2017 | National | Flex R&D | 7.00 | % | 9.80 | % | 8.30 | % | |||||||||
Additional survey data, and our conclusion of discount rates for each of the Operating Real Estate properties and Downtown NYC Office Preferred Equity, has been provided under separate cover.
34
NorthStar Real Estate Income Trust, Inc.
|
|
RECONCILIATION AND VALUE CONCLUSIONS
The following Exhibit depicts the fair value estimates of the subject properties that comprise the Operating Real Estate.
Northstar Real Estate Income Trust, Inc.
NOVA I Real Property Gross Asset Values
As of March 31, 2017
| Value Conclusions | ||||||||||||||||||
Property Name | Property Type | Year 1 NOI | Low | Mid | High | |||||||||||||
Washington D.C. Area Office Portfolio Equity | Office | $ | 3,998,423 | $ | 81,800,000 | $ | 85,400,000 | $ | 89,300,000 | |||||||||
Southeast Multifamily Equity | Multi | $ | 4,067,818 | $ | 74,000,000 | $ | 77,500,000 | $ | 81,400,000 | |||||||||
Midwest Multifamily Equity | Multi | $ | 6,432,617 | $ | 85,800,000 | $ | 88,700,000 | $ | 91,900,000 | |||||||||
Midwest Student Housing Equity | Multi | $ | 1,894,065 | $ | 31,600,000 | $ | 32,900,000 | $ | 34,400,000 | |||||||||
Southeast Student Housing Equity | Multi | $ | 1,696,408 | $ | 29,500,000 | $ | 30,800,000 | $ | 32,300,000 | |||||||||
Southeast Student Housing Equity II | Multi | $ | 2,157,408 | $ | 37,500,000 | $ | 39,200,000 | $ | 41,100,000 | |||||||||
Midwest Class A Office Equity | Office | $ | 10,020,488 | $ | 174,100,000 | $ | 181,400,000 | $ | 189,300,000 | |||||||||
Northeast Class A Office Equity | Office | $ | 6,869,634 | $ | 129,200,000 | $ | 134,600,000 | $ | 140,400,000 | |||||||||
Ohio Industrial Equity Portfolio | Industrial | $ | 9,481,586 | $ | 148,200,000 | $ | 154,400,000 | $ | 161,200,000 | |||||||||
The total fair value range reflected above is equal to the gross asset value of these operating assets. To derive the net asset value at NSI I’s interest, we deducted the fair value of the loans for all equity and preferred equity properties (Operating Real Estate and Downtown NYC Office Preferred Equity). Once the debt was deducted, we ran the net sales proceeds through a client provided waterfall model to arrive at NSI I’s interest for each asset. Washington D.C. Area Office Portfolio Equity is 100% owned by NSI I, thus no further adjustment was required. The exhibits below depicts the Operating Real Estate and Downtown NYC Office Preferred Equity values at NSI I’s interest.
Northstar Real Estate Income Trust, Inc.
Downtown NYC Office Preferred Equity Preferred Equity Kicker
As of March 31, 2017
Property Name | Low Gross Asset Value | Mid Gross Asset Value | High Gross Asset Value | Low Debt Value | Mid Debt Value | High Debt Value | Low NSI Interest Value | Mid NSI Interest Value | High NSI Interest Value | |||||||||||||||||||||||||||
Downtown NYC Office Preferred Equity | $ | 226,500,000 | $ | 238,500,000 | $ | 251,600,000 | $ | 86,886,385 | $ | 89,942,690 | $ | 92,998,995 | $ | 7,099,172 | $ | 8,306,571 | $ | 9,662,470 | ||||||||||||||||||
|
|
|
|
|
|
|
|
|
|
|
|
|
|
|
|
|
| |||||||||||||||||||
| $ | 226,500,000 | $ | 238,500,000 | $ | 251,600,000 | $ | 86,886,385 | $ | 89,942,690 | $ | 92,998,995 | $ | 7,099,172 | $ | 8,306,571 | $ | 9,662,470 | |||||||||||||||||||
|
|
|
|
|
|
|
|
|
|
|
|
|
|
|
|
|
| |||||||||||||||||||
Northstar Real Estate Income Trust, Inc.
Operating Real Estate Joint Venture Interest Values
As of March 31, 2017
Property Name | Low Gross Asset Value | Mid Gross Asset Value | High Gross Asset Value | Low Debt Value | Mid Debt Value | High Debt Value | Low Minority Interest Value | Mid Minority Interest Value | High Minority Interest Value | Low NSI Interest Value | Mid NSI Interest Value | High NSI Interest Value | ||||||||||||||||||||||||||||||||||||
Washington D.C. Area Office Portfolio Equity | $ | 81,800,000 | $ | 85,400,000 | $ | 89,300,000 | $ | 81,800,000 | $ | 85,400,000 | $ | 89,300,000 | ||||||||||||||||||||||||||||||||||||
Southeast Multifamily Equity | $ | 74,000,000 | $ | 77,500,000 | $ | 81,400,000 | $ | 44,648,158 | $ | 44,648,158 | $ | 44,648,158 | $ | 7,982,467 | $ | 9,548,717 | $ | 11,293,967 | $ | 21,369,375 | $ | 23,303,125 | $ | 25,457,875 | ||||||||||||||||||||||||
Midwest Multifamily Equity | $ | 85,800,000 | $ | 88,700,000 | $ | 91,900,000 | $ | 44,131,922 | $ | 44,131,922 | $ | 44,131,922 | $ | 9,306,305 | $ | 10,393,805 | $ | 11,593,805 | $ | 32,361,772 | $ | 34,174,272 | $ | 36,174,272 | ||||||||||||||||||||||||
Student Housing Equity | $ | 11,345,304 | $ | 12,635,304 | $ | 14,105,304 | $ | 33,471,700 | $ | 36,481,700 | $ | 39,911,700 | ||||||||||||||||||||||||||||||||||||
Midwest Student Housing Equity | $ | 31,600,000 | $ | 32,900,000 | $ | 34,400,000 | $ | 16,788,500 | $ | 16,788,500 | $ | 16,788,500 | ||||||||||||||||||||||||||||||||||||
Southeast Student Housing Equity | $ | 29,500,000 | $ | 30,800,000 | $ | 32,300,000 | $ | 13,081,205 | $ | 13,081,205 | $ | 13,081,205 | ||||||||||||||||||||||||||||||||||||
Southeast Student Housing Equity II | $ | 37,500,000 | $ | 39,200,000 | $ | 41,100,000 | $ | 23,913,291 | $ | 23,913,291 | $ | 23,913,291 | ||||||||||||||||||||||||||||||||||||
Midwest Class A Office Equity | $ | 174,100,000 | $ | 181,400,000 | $ | 189,300,000 | $ | 110,662,621 | $ | 110,662,621 | $ | 110,662,621 | $ | 7,597,050 | $ | 9,695,800 | $ | 11,967,050 | $ | 55,840,329 | $ | 61,041,579 | $ | 66,670,329 | ||||||||||||||||||||||||
Northeast Class A Office Equity | $ | 129,200,000 | $ | 134,600,000 | $ | 140,400,000 | $ | 77,845,690 | $ | 77,845,690 | $ | 77,845,690 | $ | 8,008,997 | $ | 9,804,497 | $ | 11,732,997 | $ | 43,345,313 | $ | 46,949,813 | $ | 50,821,313 | ||||||||||||||||||||||||
Ohio Industrial Equity Portfolio | $ | 148,200,000 | $ | 154,400,000 | $ | 161,200,000 | $ | 70,779,531 | $ | 70,779,531 | $ | 70,779,531 | $ | 19,626,657 | $ | 22,000,947 | $ | 24,605,007 | $ | 57,793,812 | $ | 61,619,522 | $ | 65,815,462 | ||||||||||||||||||||||||
|
|
|
|
|
|
|
|
|
|
|
|
|
|
|
|
|
|
|
|
|
|
|
| |||||||||||||||||||||||||
Totals: | $ | 791,700,000 | $ | 824,900,000 | $ | 861,300,000 | $ | 401,850,919 | $ | 401,850,919 | $ | 401,850,919 | $ | 63,866,780 | $ | 74,079,070 | $ | 85,298,130 | $ | 325,982,301 | $ | 348,970,011 | $ | 374,150,951 | ||||||||||||||||||||||||
|
|
|
|
|
|
|
|
|
|
|
|
|
|
|
|
|
|
|
|
|
|
|
| |||||||||||||||||||||||||
35
NorthStar Real Estate Income Trust, Inc.
|
|
GENERAL ASSUMPTIONS AND LIMITING CONDITIONS
This appraisal report is subject to the following general assumptions and limiting conditions:
| 1. | No investigation has been made of, and no responsibility is assumed for, the legal description or for legal matters including title or encumbrances. Title to the properties is assumed to be good and marketable unless otherwise stated. The properties are further assumed to be free and clear of liens, easements, encroachments and other encumbrances unless otherwise stated, and all improvements are assumed to lie within property boundaries. |
| 2. | Information furnished by others, upon which all or portions of this report are based, is believed to be reliable, but has not been verified in all cases. No warranty is given as to the accuracy of such information. |
| 3. | It is assumed that all required licenses, certificates of occupancy, consents, or other legislative or administrative authority from any local, state, or national government or private entity or organization have been, or can readily be obtained, or renewed for any use on which the value estimates provided in this report are based. |
| 4. | Full compliance with all applicable federal, state and local zoning, use, occupancy, environmental, and similar laws and regulations is assumed, unless otherwise stated. |
| 5. | No responsibility is taken for changes in market conditions and no obligation is assumed to revise this report to reflect events or conditions, which occur subsequent to the appraisal date hereof. |
| 6. | Responsible ownership and competent property management are assumed. |
| 7. | The allocation, if any, in this report of the total valuation among components of the properties applies only to the program of utilization stated in this report. The separate values for any components may not be applicable for any other purpose and must not be used in conjunction with any other appraisal. |
| 8. | Areas and dimensions of the properties were obtained from sources believed to be reliable. Maps or sketches, if included in this report, are only to assist the reader in visualizing the properties and no responsibility is assumed for their accuracy. No independent surveys were conducted. |
| 9. | It is assumed that there are no hidden or unapparent conditions of the properties, subsoil, or structures that affect value. No responsibility is assumed for such conditions or for arranging for engineering studies that may be required to discover them. |
| 10. | No soil analysis or geological studies were ordered or made in conjunction with this report, nor was an investigation made of any water, oil, gas, coal, or other subsurface mineral and use rights or conditions. |
| 11. | Neither Duff & Phelps, LLC nor any individuals signing or associated with this report shall be required by reason of this report to give further consultation, to provide testimony or appear in court or other legal proceedings, unless specific arrangements thereto for have been made. |
36
NorthStar Real Estate Income Trust, Inc.
|
|
| 12. | This appraisal has been made in conformance with, and is subject to, the requirements of the Code of Professional Ethics and Standards of Professional Conduct of the Appraisal Institute and the Uniform Standards of Professional Appraisal Practice. |
| 13. | We have not been engaged nor are we qualified to detect the existence of hazardous material, which may or may not be present on or near the properties. The presence of potentially hazardous substances such as asbestos, urea-formaldehyde foam insulation, industrial wastes, etc. may affect the value of the properties. The value estimate herein is predicated on the assumption that there is no such material on, in, or near the properties that would cause a loss in value. No responsibility is assumed for any such conditions or for any expertise or engineering knowledge required to discover them. The client should retain an expert in this field if further information is desired. |
| 14. | The date of value to which the conclusions and opinions expressed in this report apply is set forth in the opinion letter at the front of this report. Our value opinion is based on the purchasing power of the United States’ dollar as of this date. |
| 15. | The Americans with Disabilities Act (“ADA”) became effective January 26, 1992. We have not made a specific compliance survey and analysis of these properties to determine whether or not it is in conformity with the various detailed requirements of the ADA. It is possible that a compliance survey of the properties along with a detailed study of ADA requirements could reveal that the properties are not in compliance with the act. If so, this would have a negative effect on the property values. We were not furnished with any compliance surveys or any other documents pertaining to this issue and therefore did not consider compliance or noncompliance with the ADA requirements when estimating the value of the properties. |
| 16. | In accordance with our agreement, this report is limited to the value of the Investments. One or more additional issues may exist that could affect the Federal tax treatment of the Investments with respect to which we have prepared this report. This report does not consider or provide a conclusion with respect to any of those issues. With respect to any significant Federal tax issue outside the scope of this report, this report was not written, and cannot be used, by anyone for the purpose of avoiding Federal tax penalties. |
In performing its analyses and rendering this Opinion with respect to the Proposed Transaction, Duff & Phelps, with the Company’s consent:
| 17. | Relied upon the accuracy, completeness, and fair presentation of all information, data, advice, opinions and representations obtained from public sources or provided to it from private sources, including Company management, and did not independently verify such information; |
| 18. | Relied upon the fact that the Board of Directors and the Company have been advised by counsel as to all legal matters with respect to the Proposed Transaction, including whether all procedures required by law to be taken in connection with the Proposed Transaction have been duly, validly and timely taken; |
37
NorthStar Real Estate Income Trust, Inc.
|
|
| 19. | Assumed that any estimates, evaluations, forecasts and projections furnished to Duff & Phelps were reasonably prepared and based upon the best currently available information and good faith judgment of the person furnishing the same, and Duff & Phelps expresses no opinion with respect to such projections or the underlying assumptions; |
| 20. | Assumed that information supplied and representations made by Company management are substantially accurate regarding the Company and the Proposed Transaction |
| 21. | Assumed that the representations and warranties made are substantially accurate; |
| 22. | Assumed that the final versions of all documents reviewed by Duff & Phelps in draft form conform in all material respects to the drafts reviewed; |
| 23. | Assumed that there has been no material change in the assets, liabilities, financial condition, results of operations, business, or prospects of the Company [or the Target] since the date of the most recent financial statements and other information made available to Duff & Phelps, and that there is no information or facts that would make the information reviewed by Duff & Phelps incomplete or misleading; |
| 24. | Assumed that all of the conditions required to implement the Proposed Transaction will be satisfied and that the Proposed Transaction will be completed in accordance with the [Agreement] without any amendments thereto or any waivers of any terms or conditions thereof; and |
| 25. | Assumed that all governmental, regulatory or other consents and approvals necessary for the consummation of the Proposed Transaction will be obtained without any adverse effect on the Company [or the contemplated benefits expected to be derived in the Proposed Transaction]. |
To the extent that any of the foregoing assumptions or any of the facts on which this Opinion is based prove to be untrue in any material respect, this Opinion cannot and should not be relied upon. Furthermore, in Duff & Phelps’ analysis and in connection with the preparation of this Opinion, Duff & Phelps has made numerous assumptions with respect to industry performance, general business, market and economic conditions and other matters, many of which are beyond the control of any party involved in the Proposed Transaction.
Duff & Phelps has prepared this Opinion effective as of the date hereof. This Opinion is necessarily based upon market, economic, financial and other conditions as they exist and can be evaluated as of the date hereof, and Duff & Phelps disclaims any undertaking or obligation to advise any person of any change in any fact or matter affecting this Opinion which may come or be brought to the attention of Duff & Phelps after the date hereof.
Duff & Phelps did not evaluate the Company’s solvency or conduct an independent appraisal or physical inspection of any specific assets or liabilities (contingent or otherwise). Duff & Phelps has not been requested to, and did not, (i) initiate any discussions with, or solicit any indications of interest from, third parties with respect to the Proposed Transaction, the assets, businesses or operations of the Company, or any alternatives to the Proposed Transaction, (ii) negotiate the terms of the Proposed Transaction, and therefore, Duff & Phelps has assumed that such terms are the most beneficial terms, from the Company’s perspective, that could, under the circumstances, be negotiated among the parties to the Agreement and the Transaction, or (iii) advise the Board of Directors or any other party with respect to alternatives to the Proposed Transaction.
38
NorthStar Real Estate Income Trust, Inc.
|
|
Duff & Phelps is not expressing any opinion as to the market price or value of the Company’s common stock [or the Target’s common stock] (or anything else) after the announcement or the consummation of the Proposed Transaction. This Opinion should not be construed as a valuation opinion, credit rating, solvency opinion, an analysis of the Company’s credit worthiness, as tax advice, or as accounting advice. Duff & Phelps has not made, and assumes no responsibility to make, any representation, or render any opinion, as to any legal matter.
In rendering this Opinion, Duff & Phelps is not expressing any opinion with respect to the amount or nature of any compensation to any of the Company’s officers, directors, or employees, or any class of such persons, relative to the consideration to be received by the public shareholders of the Company in the Proposed Transaction, or with respect to the fairness of any such compensation.
This Opinion is furnished solely for the use and benefit of the Board of Directors in connection with its consideration of the Proposed Transaction and is not intended to, and does not, confer any rights or remedies upon any other person, and is not intended to be used, and may not be used, by any other person or for any other purpose, without Duff & Phelps’ express consent. This Opinion (i) does not address the merits of the underlying business decision to enter into the Proposed Transaction versus any alternative strategy or transaction; (ii) does not address any transaction related to the Proposed Transaction; (iii) is not a recommendation as to how the Board of Directors or any stockholder should vote or act with respect to any matters relating to the Proposed Transaction, or whether to proceed with the Proposed Transaction or any related transaction, and (iv) does not indicate that the consideration [paid / received] is the best possibly attainable under any circumstances; instead, it merely states whether the consideration in the Proposed Transaction is within a range suggested by certain financial analyses. The decision as to whether to proceed with the Proposed Transaction or any related transaction may depend on an assessment of factors unrelated to the financial analysis on which this Opinion is based. This letter should not be construed as creating any fiduciary duty on the part of Duff & Phelps to any party.
This Opinion is solely that of Duff & Phelps, and Duff & Phelps’ liability in connection with this letter shall be limited in accordance with the terms set forth in the engagement letter between Duff & Phelps and the Company dated June 17, 2017 (the “Engagement Letter”). This letter is confidential, and its use and disclosure is strictly limited in accordance with the terms set forth in the Engagement Letter.
39
NorthStar Real Estate Income Trust, Inc.
|
|
EXTRAORDINARY ASSUMPTIONS AND HYPOTHETICAL CONDITIONS
When a value opinion is subject to an extraordinary assumption or hypothetical condition, the appraiser must state that condition so that its effect on the value opinion or conclusion is clear. An extraordinary assumption is an assumption that is directly related to a specific assignment, which if found to be false, could alter the appraiser’s opinions or conclusions. Extraordinary assumptions presume as fact otherwise uncertain information about physical, legal, or economic characteristics of the subject properties; or about conditions external to the properties such as market conditions or trends; or about the integrity of data used in an analysis. An extraordinary assumption may be used in an assignment only if:
| • | It is required to property develop credible opinions and conclusions; |
| • | The appraiser has a reasonable basis for the extraordinary assumption; |
| • | Use of the extraordinary assumption results in a credible analysis; and |
| • | The appraiser complies with the disclosure requirements set forth in USPAP for extraordinary assumptions. |
Hypothetical conditions assume conditions contrary to known facts about physical, legal, or economic characteristics of the subject properties; or about conditions external to the property, such as market conditions or trends; or about the integrity of data used in an analysis. A hypothetical condition may be used in an assignment only if:
| • | Use of the hypothetical condition is clearly required for legal purposes, for purposes of reasonable analysis, or for purposes of comparison; |
| • | Use of the hypothetical condition results in a credible analysis; and |
| • | The appraiser complies with the disclosure requirements set forth in USPAP for hypothetical conditions. |
This appraisal is not subject to any hypothetical conditions.
This appraisal is subject to the following extraordinary assumptions:
| • | We have relied on information provided by the client as it relates to building size, year of construction, land size and other physical, financial and economic characteristics. It is an extraordinary assumption of this appraisal that this information is accurate and was not misrepresented. |
40
NorthStar Real Estate Income Trust, Inc.
|
|
| • | We relied on all lease information provided by the client through rent rolls and Argus models, as it relates to current rent amount, rent commencement and expiration dates, rent increase amounts and dates, and other information pertaining to the subject property leases. It is an extraordinary assumption of this appraisal that the information provided within the rent rolls is accurate and reflective of the lease documents. |
| • | We relied on historical operating statements as well as budgets provided by the client to project revenues, expenses, and capital expenditures as it relates to each subject property. It is an extraordinary assumption of this appraisal that the historical and budgeted operating information provided is accurate and reflective of each subject property. |
The use of extraordinary assumptions may have an effect on assignment results.
41
NorthStar Real Estate Income Trust, Inc.
|
|
CERTIFICATION
We certify that, to the best of our knowledge and belief:
| • | The statements of fact contained in this report are true and correct. |
| • | The reported analyses, opinions and conclusions are limited only by the reported assumptions and limiting conditions and is our personal, unbiased professional analyses, opinions and conclusions. |
| • | We have no present or prospective interest in the properties that are the subject of this report and no personal interest with respect to the parties involved. We have no bias with respect to the properties that are the subject of this report or to the parties involved. |
| • | Our engagement in this assignment was not contingent upon developing or reporting predetermined results. |
| • | Our compensation for completing this assignment is not contingent upon the development or reporting of a predetermined value or direction in value that favors the cause of the client, the amount of the value opinion, the attainment of a stipulated result, or the occurrence of a subsequent event directly related to the intended use of this appraisal. |
| • | Our analyses, opinions, and conclusions were developed and this report has been prepared in conformity with the Uniform Standards of Professional Appraisal Practice (USPAP). |
| • | The reported analyses, opinions, and conclusions were developed, and this report has been prepared, in conformity with the requirements of the Code of Professional Ethics & Standards of Professional Appraisal Practice of the Appraisal Institute, which include the Uniform Standards of Professional Appraisal Practice. |
| • | The use of this report is subject to the requirements of the Appraisal Institute relating to review by its duly authorized representatives. |
| • | For the purposes of this analysis, no one has inspected the properties that are the subject of this report and the analysis has been completed on a desktop basis. |
| • | Gregory Dupes, a Vice President with Duff & Phelps, LLC, provided significant real property appraisal assistance to the persons signing this certification by conducting market research and completing the income approach and sales comparison approach for the subject properties. |
| • | We have performed appraisal related services of the Investments within the previous three years. |
42
NorthStar Real Estate Income Trust, Inc.
|
|
| • | As of the date of this report, Gregory A. Dupes and Matthew D. Edmonds have completed the Standards and Ethics Education Requirements for Candidates of the Appraisal Institute. |
| • | As of the date of this report, Michael A. Gibbs, MAI, Daniel P. Carlson, MAI, Michael S. Kendzior, MAI, and Tom R. Jeffries, MAI have completed the continuing education program for Designated Members of the Appraisal Institute. |
| /s/ Michael A. Gibbs | /s/ Daniel P. Carlson | |||
Michael A. Gibbs, MAI Managing Director, Duff & Phelps, LLC South Carolina Certified General Real Estate Appraiser License # CG 5159; Expiration: 6/30/2018 Virginia Certified General Real Estate Appraiser License # 4001014744; Expiration: 2/28/2018 |
Daniel P. Carlson, MAI Managing Director, Duff & Phelps, LLC Pennsylvania Certified General Real Estate Appraiser License # GA003880; Expiration: 6/30/2019 Michigan Certified General Real Estate Appraiser License # 1201075459; Expiration: 7/31/2018
| |||
| /s/ Tom R. Jeffries | /s/ Michael S. Kendzior | |||
Tom R. Jeffries, MAI Director, Duff & Phelps, LLC Missouri Certified General Real Estate Appraiser License # 2013008101; Expiration: 6/30/2018 |
Michael S. Kendzior, MAI Director, Duff & Phelps, LLC New York Certified General Real Estate Appraiser License # 46000022619; Expiration: 6/24/2018 Ohio Certified General Real Estate Appraiser License # 391889; Expiration: 1/15/2018 | |||
43
NorthStar Real Estate Income Trust, Inc.
|
|
| /s/ Matthew D. Edmonds | ||
Matthew D. Edmonds Vice President, Duff & Phelps, LLC Louisiana Certified General Real Estate Appraiser License # G4057; Expiration: 12/31/2017 | ||
44