
Exhibit 99.2 S U P P L E M E N TA L F I N A N C I A L R E P O R T F I R S T Q U A R T E R 2 0 2 1 MAY 5, 2021 1Exhibit 99.2 S U P P L E M E N TA L F I N A N C I A L R E P O R T F I R S T Q U A R T E R 2 0 2 1 MAY 5, 2021 1
CAUTIONARY STATEMENT REGARDING FORWARD-LOOKING STATEMENTS This presentation may contain forward-looking statements within the meaning of the federal securities laws. Forward-looking statements relate to expectations, beliefs, projections, future plans and strategies, anticipated events or trends and similar expressions concerning matters that are not historical facts. In some cases, you can identify forward-looking statements by the and phrases or similar words or phrases which are predictions of or indicate future events or trends and which do not relate solely to historical matters. Forward-looking statements involve known and unknown risks, uncertainties, assumptions and contingencies, many of which are beyond our control, and may cause actual results to differ significantly from those expressed in any forward-looking statement. Among others, the following uncertainties and other factors could cause actual results to differ from those set forth in the forward-looking statements: operating costs and business disruption may be greater than expected; uncertainties regarding the ongoing impact of the novel coronavirus (COVID-19) and its adverse impact on the real estate market, he Los Angeles mixed-use development loan, other hospitality loans, and Dublin development financings), financial tabilize properties; deterioration in the performance of the properties securing our investments (including depletion of interest and other reserves or payment-in-kind concessions in lieu of current interest payment obligations) that may cause deterioration in the performance of our investments and, potentially, principal losses to us; the Company's operating results may differ materially from the information presented in urities and Exchange Commission; the fair value of the Company's investments may be subject to uncertainties; the Company's use of leverage could hinder its ability to make distributions and may significantly impact its liquidity position; the ability to realize substantial efficiencies as well as anticipated strategic and financial benefits, including, but not limited to expected cost savings through the internalization or expected returns on equity and/or yields on investments; adverse impacts on the Company's corporate revolver, including covenant compliance and borrowing base capacity; adverse impacts on the Company's liquidity, including margin calls on master repurchase facilities, debt service or lease payment defaults or deferrals, demands for protective advances and capital expenditures; the timing of and ability to deploy available capital; whether the Company will achieve its anticipated 2021 Distributable Earnings per share (as adjusted), or maintain or the future; the ability of the Company to refinance certain mortgage debt on similar terms to those currently existing or at all; and the impact of legislative, regulatory and competitive changes, and the actions of government authorities and in particular those affecting the commercial real estate finance and mortgage industry or our business. The foregoing list of factors is not exhaustive. Additional information l as in Colony Credit Real er, each of the factors referenced above are likely to also be impacted directly or indirectly by the ongoing impact of COVID-19 and investors are cautioned to interpret substantially all of such statements and risks as being heightened as a result of the ongoing impact of the COVID-19. We caution investors not to unduly rely on any forward-looking statements. The forward-looking statements speak only as of the date of this presentation. Colony Credit Real Estate is under no duty to update any of these forward-looking statements after the date of this presentation, nor to conform prior statements to actual results or revised expectations, and Colony Credit Real Estate does not intend to do so. We caution investors not to unduly rely on any forward-looking statements. The forward-looking statements speak only as of the date of this presentation. Colony Credit Real Estate is under no duty to update any of these forward-looking statements after the date of this presentation, nor to conform prior statements to actual results or revised expectations, and Colony Credit Real Estate does not intend to do so. 2 2CAUTIONARY STATEMENT REGARDING FORWARD-LOOKING STATEMENTS This presentation may contain forward-looking statements within the meaning of the federal securities laws. Forward-looking statements relate to expectations, beliefs, projections, future plans and strategies, anticipated events or trends and similar expressions concerning matters that are not historical facts. In some cases, you can identify forward-looking statements by the and phrases or similar words or phrases which are predictions of or indicate future events or trends and which do not relate solely to historical matters. Forward-looking statements involve known and unknown risks, uncertainties, assumptions and contingencies, many of which are beyond our control, and may cause actual results to differ significantly from those expressed in any forward-looking statement. Among others, the following uncertainties and other factors could cause actual results to differ from those set forth in the forward-looking statements: operating costs and business disruption may be greater than expected; uncertainties regarding the ongoing impact of the novel coronavirus (COVID-19) and its adverse impact on the real estate market, he Los Angeles mixed-use development loan, other hospitality loans, and Dublin development financings), financial tabilize properties; deterioration in the performance of the properties securing our investments (including depletion of interest and other reserves or payment-in-kind concessions in lieu of current interest payment obligations) that may cause deterioration in the performance of our investments and, potentially, principal losses to us; the Company's operating results may differ materially from the information presented in urities and Exchange Commission; the fair value of the Company's investments may be subject to uncertainties; the Company's use of leverage could hinder its ability to make distributions and may significantly impact its liquidity position; the ability to realize substantial efficiencies as well as anticipated strategic and financial benefits, including, but not limited to expected cost savings through the internalization or expected returns on equity and/or yields on investments; adverse impacts on the Company's corporate revolver, including covenant compliance and borrowing base capacity; adverse impacts on the Company's liquidity, including margin calls on master repurchase facilities, debt service or lease payment defaults or deferrals, demands for protective advances and capital expenditures; the timing of and ability to deploy available capital; whether the Company will achieve its anticipated 2021 Distributable Earnings per share (as adjusted), or maintain or the future; the ability of the Company to refinance certain mortgage debt on similar terms to those currently existing or at all; and the impact of legislative, regulatory and competitive changes, and the actions of government authorities and in particular those affecting the commercial real estate finance and mortgage industry or our business. The foregoing list of factors is not exhaustive. Additional information l as in Colony Credit Real er, each of the factors referenced above are likely to also be impacted directly or indirectly by the ongoing impact of COVID-19 and investors are cautioned to interpret substantially all of such statements and risks as being heightened as a result of the ongoing impact of the COVID-19. We caution investors not to unduly rely on any forward-looking statements. The forward-looking statements speak only as of the date of this presentation. Colony Credit Real Estate is under no duty to update any of these forward-looking statements after the date of this presentation, nor to conform prior statements to actual results or revised expectations, and Colony Credit Real Estate does not intend to do so. We caution investors not to unduly rely on any forward-looking statements. The forward-looking statements speak only as of the date of this presentation. Colony Credit Real Estate is under no duty to update any of these forward-looking statements after the date of this presentation, nor to conform prior statements to actual results or revised expectations, and Colony Credit Real Estate does not intend to do so. 2 2
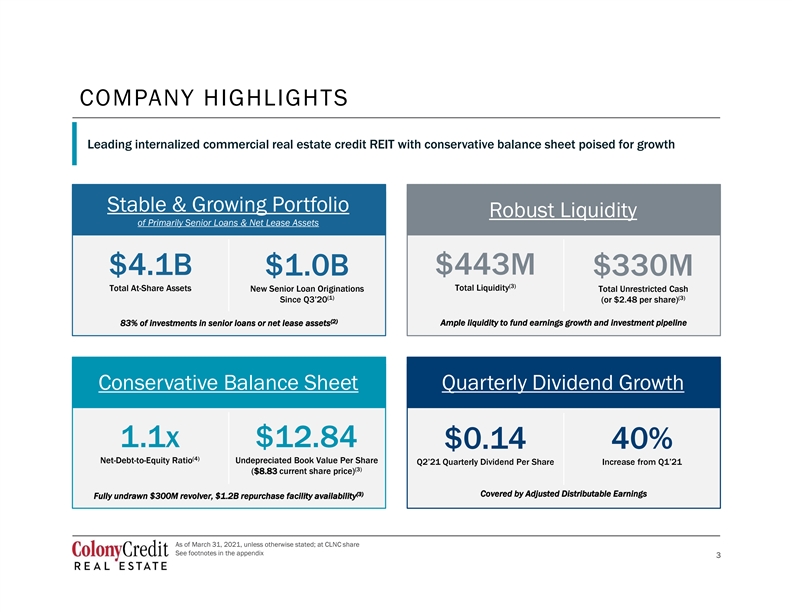
COMPANY HIGHLIGHTS Leading internalized commercial real estate credit REIT with conservative balance sheet poised for growth Stable & Growing Portfolio Robust Liquidity of Primarily Senior Loans & Net Lease Assets $4.1B $443M $1.0B $330M (3) Total At-Share Assets Total Liquidity New Senior Loan Originations Total Unrestricted Cash (1) (3) (or $2.48 per share) (2) 83% of investments in senior loans or net lease assets Ample liquidity to fund earnings growth and investment pipeline Conservative Balance Sheet Quarterly Dividend Growth 1.1x $12.84 $0.14 40% (4) Net-Debt-to-Equity Ratio Undepreciated Book Value Per Share (3) ($8.83 current share price) (3) Covered by Adjusted Distributable Earnings Fully undrawn $300M revolver, $1.2B repurchase facility availability As of March 31, 2021, unless otherwise stated; at CLNC share See footnotes in the appendix 3 3COMPANY HIGHLIGHTS Leading internalized commercial real estate credit REIT with conservative balance sheet poised for growth Stable & Growing Portfolio Robust Liquidity of Primarily Senior Loans & Net Lease Assets $4.1B $443M $1.0B $330M (3) Total At-Share Assets Total Liquidity New Senior Loan Originations Total Unrestricted Cash (1) (3) (or $2.48 per share) (2) 83% of investments in senior loans or net lease assets Ample liquidity to fund earnings growth and investment pipeline Conservative Balance Sheet Quarterly Dividend Growth 1.1x $12.84 $0.14 40% (4) Net-Debt-to-Equity Ratio Undepreciated Book Value Per Share (3) ($8.83 current share price) (3) Covered by Adjusted Distributable Earnings Fully undrawn $300M revolver, $1.2B repurchase facility availability As of March 31, 2021, unless otherwise stated; at CLNC share See footnotes in the appendix 3 3
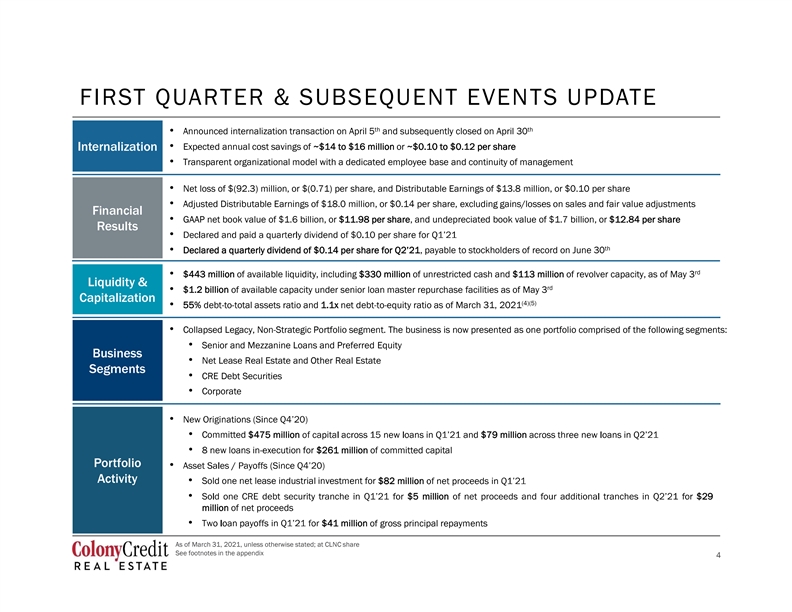
FIRST QUARTER & SUBSEQUENT EVENTS UPDATE th th • Announced internalization transaction on April 5 and subsequently closed on April 30 • Expected annual cost savings of ~$14 to $16 million or ~$0.10 to $0.12 per share I In nt te er rn na alliiz za at tiio on n • Transparent organizational model with a dedicated employee base and continuity of management • Net loss of $(92.3) million, or $(0.71) per share, and Distributable Earnings of $13.8 million, or $0.10 per share • Adjusted Distributable Earnings of $18.0 million, or $0.14 per share, excluding gains/losses on sales and fair value adjustments F Fiin na an nc ciia all • GAAP net book value of $1.6 billion, or $11.98 per share, and undepreciated book value of $1.7 billion, or $12.84 per share R Re es su ullt ts s • th • Declared a quarterly dividend of $0.14 per share for Q2 21, payable to stockholders of record on June 30 rd • $443 million of available liquidity, including $330 million of unrestricted cash and $113 million of revolver capacity, as of May 3 L Liiq qu uiid diit ty y & & rd • $1.2 billion of available capacity under senior loan master repurchase facilities as of May 3 C Ca ap piit ta alliiz za at tiio on n (4)(5) • 55% debt-to-total assets ratio and 1.1x net debt-to-equity ratio as of March 31, 2021 • Collapsed Legacy, Non-Strategic Portfolio segment. The business is now presented as one portfolio comprised of the following segments: • Senior and Mezzanine Loans and Preferred Equity B Bu us siin ne es ss s • Net Lease Real Estate and Other Real Estate S Se eg gm me en nt ts s • CRE Debt Securities • Corporate • • Committed $475 million $79 million • 8 new loans in-execution for $261 million of committed capital P Po or rt tf fo olliio o • A Ac ct tiiv viit ty y • Sold one net lease industrial investment for $82 million • $5 million $29 million of net proceeds • $41 million of gross principal repayments As of March 31, 2021, unless otherwise stated; at CLNC share See footnotes in the appendix 4 4FIRST QUARTER & SUBSEQUENT EVENTS UPDATE th th • Announced internalization transaction on April 5 and subsequently closed on April 30 • Expected annual cost savings of ~$14 to $16 million or ~$0.10 to $0.12 per share I In nt te er rn na alliiz za at tiio on n • Transparent organizational model with a dedicated employee base and continuity of management • Net loss of $(92.3) million, or $(0.71) per share, and Distributable Earnings of $13.8 million, or $0.10 per share • Adjusted Distributable Earnings of $18.0 million, or $0.14 per share, excluding gains/losses on sales and fair value adjustments F Fiin na an nc ciia all • GAAP net book value of $1.6 billion, or $11.98 per share, and undepreciated book value of $1.7 billion, or $12.84 per share R Re es su ullt ts s • th • Declared a quarterly dividend of $0.14 per share for Q2 21, payable to stockholders of record on June 30 rd • $443 million of available liquidity, including $330 million of unrestricted cash and $113 million of revolver capacity, as of May 3 L Liiq qu uiid diit ty y & & rd • $1.2 billion of available capacity under senior loan master repurchase facilities as of May 3 C Ca ap piit ta alliiz za at tiio on n (4)(5) • 55% debt-to-total assets ratio and 1.1x net debt-to-equity ratio as of March 31, 2021 • Collapsed Legacy, Non-Strategic Portfolio segment. The business is now presented as one portfolio comprised of the following segments: • Senior and Mezzanine Loans and Preferred Equity B Bu us siin ne es ss s • Net Lease Real Estate and Other Real Estate S Se eg gm me en nt ts s • CRE Debt Securities • Corporate • • Committed $475 million $79 million • 8 new loans in-execution for $261 million of committed capital P Po or rt tf fo olliio o • A Ac ct tiiv viit ty y • Sold one net lease industrial investment for $82 million • $5 million $29 million of net proceeds • $41 million of gross principal repayments As of March 31, 2021, unless otherwise stated; at CLNC share See footnotes in the appendix 4 4

FINANCIAL OVERVIEW Key Financial Metrics Capital Structure Summary Undepreciated Book Value Per Share Bridge Other debt Mortgage debt (non-recourse) $14.50 (non-recourse) 2% $14.14 ($0.82) 14% $14.00 Master Stockholders' $13.50 ($0.52) repurchase equity facilities (limited 41% $0.04 $12.84 recourse) $13.00 21% $12.50 $12.00 $11.50 Securitization $11.00 12/31/20 Transaction Costs Impairments / FV Adj. Distributable 3/31/21 bonds payable Undepreciated (Internalization) MTM, Sales, CECL Earnings, Net of Undepreciated (non-recourse) BVPS & FX Translation Dividends BVPS 22% * Excludes realized gains / losses on sales and fair value adjustments $ in millions, except per share data; as of March 31, 2021, unless otherwise stated; at CLNC share 5 5FINANCIAL OVERVIEW Key Financial Metrics Capital Structure Summary Undepreciated Book Value Per Share Bridge Other debt Mortgage debt (non-recourse) $14.50 (non-recourse) 2% $14.14 ($0.82) 14% $14.00 Master Stockholders' $13.50 ($0.52) repurchase equity facilities (limited 41% $0.04 $12.84 recourse) $13.00 21% $12.50 $12.00 $11.50 Securitization $11.00 12/31/20 Transaction Costs Impairments / FV Adj. Distributable 3/31/21 bonds payable Undepreciated (Internalization) MTM, Sales, CECL Earnings, Net of Undepreciated (non-recourse) BVPS & FX Translation Dividends BVPS 22% * Excludes realized gains / losses on sales and fair value adjustments $ in millions, except per share data; as of March 31, 2021, unless otherwise stated; at CLNC share 5 5
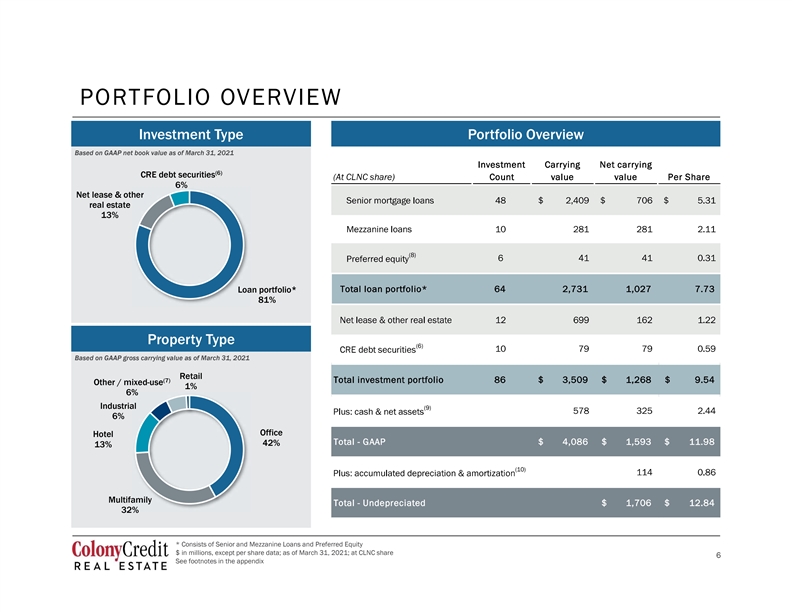
PORTFOLIO OVERVIEW Investment Type Portfolio Overview Based on GAAP net book value as of March 31, 2021 (6) CRE debt securities 6% Net lease & other real estate 13% (8) Loan portfolio* 81% Property Type (6) Based on GAAP gross carrying value as of March 31, 2021 Retail (7) Other / mixed-use 1% 6% Industrial (9) 6% Office Hotel 42% 13% (10) Multifamily 32% * Consists of Senior and Mezzanine Loans and Preferred Equity $ in millions, except per share data; as of March 31, 2021; at CLNC share 6 See footnotes in the appendix 6PORTFOLIO OVERVIEW Investment Type Portfolio Overview Based on GAAP net book value as of March 31, 2021 (6) CRE debt securities 6% Net lease & other real estate 13% (8) Loan portfolio* 81% Property Type (6) Based on GAAP gross carrying value as of March 31, 2021 Retail (7) Other / mixed-use 1% 6% Industrial (9) 6% Office Hotel 42% 13% (10) Multifamily 32% * Consists of Senior and Mezzanine Loans and Preferred Equity $ in millions, except per share data; as of March 31, 2021; at CLNC share 6 See footnotes in the appendix 6

SENIOR AND MEZZANINE LOANS AND PREFERRED EQUITY Overview West Total number of investments 64 Northeast 53% 20% Midwest Total loans & preferred equity $2.7 billion 1% Southwest 21% Average investment size $43 million Southeast Europe 4% % Senior loans floating rate 99% 1% (11) W.A. remaining term 1.3 years Investment Type Based on GAAP gross carrying value as of March 31, 2021 (12) W.A. extended remaining term 3.4 years Preferred Mezzanine (8) equity loans (13) 2% 10% W.A. unlevered all-in yield 5.3% W.A. loan-to-value (senior loans only) 69% Senior mortgage loans W.A. risk ranking 3.6 88% Property Type Based on GAAP gross carrying value as of March 31, 2021 As of 3/31/20 As of 3/31/21 41% 32% 30% 25% 19% 17% 15% 8% 7% 5% 1% 0% Multifamily Office Hotel Other / mixed-use Industrial Retail As of March 31, 2021; at CLNC share See footnotes in the appendix 7 7SENIOR AND MEZZANINE LOANS AND PREFERRED EQUITY Overview West Total number of investments 64 Northeast 53% 20% Midwest Total loans & preferred equity $2.7 billion 1% Southwest 21% Average investment size $43 million Southeast Europe 4% % Senior loans floating rate 99% 1% (11) W.A. remaining term 1.3 years Investment Type Based on GAAP gross carrying value as of March 31, 2021 (12) W.A. extended remaining term 3.4 years Preferred Mezzanine (8) equity loans (13) 2% 10% W.A. unlevered all-in yield 5.3% W.A. loan-to-value (senior loans only) 69% Senior mortgage loans W.A. risk ranking 3.6 88% Property Type Based on GAAP gross carrying value as of March 31, 2021 As of 3/31/20 As of 3/31/21 41% 32% 30% 25% 19% 17% 15% 8% 7% 5% 1% 0% Multifamily Office Hotel Other / mixed-use Industrial Retail As of March 31, 2021; at CLNC share See footnotes in the appendix 7 7
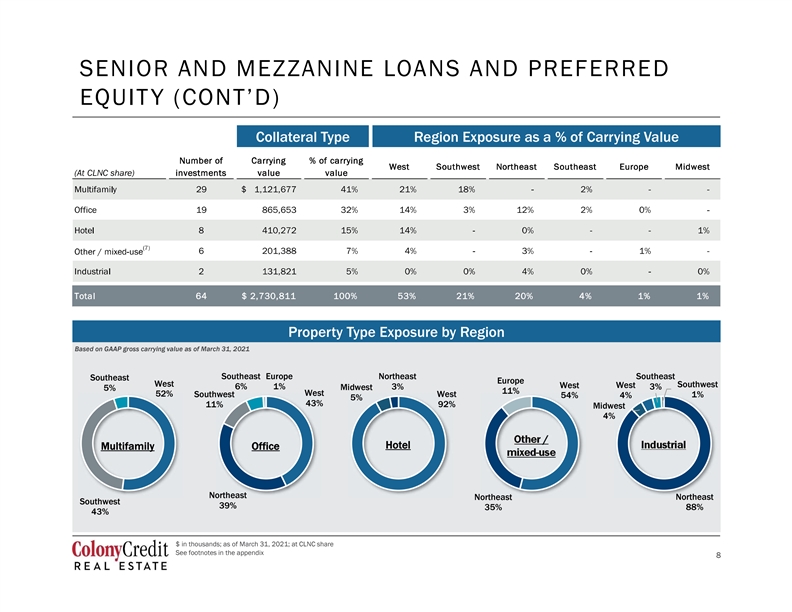
SENIOR AND MEZZANINE LOANS AND PREFERRED Collateral Type Region Exposure as a % of Carrying Value Property Type Exposure by Region Based on GAAP gross carrying value as of March 31, 2021 Southeast Europe Northeast Southeast Southeast Europe West Southwest West West 6% 1% Midwest 3% 3% 5% 11% West 52% Southwest West 1% 54% 4% 5% 43% 11% 92% Midwest 4% Other / Industrial Hotel Multifamily Office mixed-use Northeast Northeast Northeast Southwest 39% 35% 88% 43% $ in thousands; as of March 31, 2021; at CLNC share See footnotes in the appendix 8 8SENIOR AND MEZZANINE LOANS AND PREFERRED Collateral Type Region Exposure as a % of Carrying Value Property Type Exposure by Region Based on GAAP gross carrying value as of March 31, 2021 Southeast Europe Northeast Southeast Southeast Europe West Southwest West West 6% 1% Midwest 3% 3% 5% 11% West 52% Southwest West 1% 54% 4% 5% 43% 11% 92% Midwest 4% Other / Industrial Hotel Multifamily Office mixed-use Northeast Northeast Northeast Southwest 39% 35% 88% 43% $ in thousands; as of March 31, 2021; at CLNC share See footnotes in the appendix 8 8
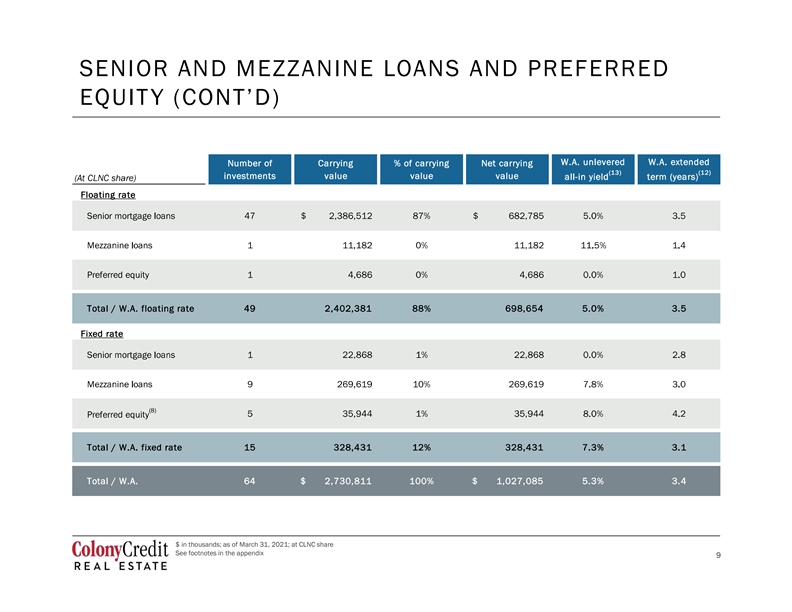
SENIOR AND MEZZANINE LOANS AND PREFERRED $ in thousands; as of March 31, 2021; at CLNC share See footnotes in the appendix 9 9SENIOR AND MEZZANINE LOANS AND PREFERRED $ in thousands; as of March 31, 2021; at CLNC share See footnotes in the appendix 9 9

NET LEASE REAL ESTATE AND OTHER REAL ESTATE (15) Property type W.A. remaining lease term Based on GAAP gross carrying value as of March 31, 2021 Based on GAAP gross carrying value as of March 31, 2021 Northeast Retail 1.1 - 2.0 yrs West 18% Hotel 17% 4% 8% 2.1 - 3.0 yrs 4% 3% Industrial Midwest 20% 10% 3.1 - 4.0 yrs 15% Europe +5.0 yrs 4.1 - 5.0 yrs 45% Office 63% 11% 82% * Financial results in the above table excludes approximately $1. dustrial investment which closed during the quarter; in es approximately $(17)k of net operating losses related to accou 10 $ and rentable square feet in thousands; as of March 31, 2021, unless otherwise stated; at CLNC share 10 See footnotes in the appendixNET LEASE REAL ESTATE AND OTHER REAL ESTATE (15) Property type W.A. remaining lease term Based on GAAP gross carrying value as of March 31, 2021 Based on GAAP gross carrying value as of March 31, 2021 Northeast Retail 1.1 - 2.0 yrs West 18% Hotel 17% 4% 8% 2.1 - 3.0 yrs 4% 3% Industrial Midwest 20% 10% 3.1 - 4.0 yrs 15% Europe +5.0 yrs 4.1 - 5.0 yrs 45% Office 63% 11% 82% * Financial results in the above table excludes approximately $1. dustrial investment which closed during the quarter; in es approximately $(17)k of net operating losses related to accou 10 $ and rentable square feet in thousands; as of March 31, 2021, unless otherwise stated; at CLNC share 10 See footnotes in the appendix
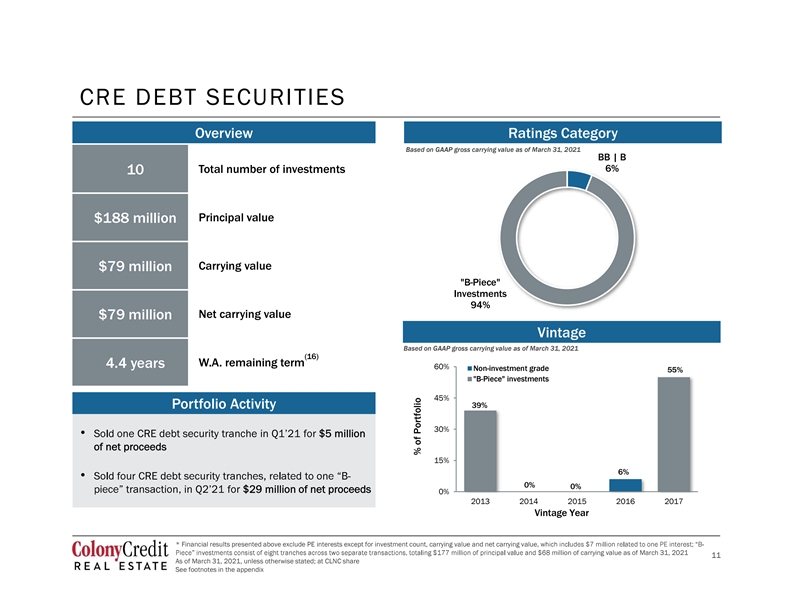
CRE DEBT SECURITIES Overview Ratings Category Based on GAAP gross carrying value as of March 31, 2021 BB | B 6% Total number of investments 10 Principal value $188 million Carrying value $79 million B-Piece Investments 94% Net carrying value $79 million Vintage Based on GAAP gross carrying value as of March 31, 2021 (16) W.A. remaining term 4.4 years 60% Non-investment grade 55% B-Piece investments 45% 39% Portfolio Activity 30% • $5 million of net proceeds 15% 6% • 0% 0% $29 million of net proceeds 0% 2013 2014 2015 2016 2017 Vintage Year * Financial results presented above exclude PE interests except for investment count, carrying value and net carrying value, wh million of carrying value as of March 31, 2021 11 As of March 31, 2021, unless otherwise stated; at CLNC share 11 See footnotes in the appendix % of PortfolioCRE DEBT SECURITIES Overview Ratings Category Based on GAAP gross carrying value as of March 31, 2021 BB | B 6% Total number of investments 10 Principal value $188 million Carrying value $79 million B-Piece Investments 94% Net carrying value $79 million Vintage Based on GAAP gross carrying value as of March 31, 2021 (16) W.A. remaining term 4.4 years 60% Non-investment grade 55% B-Piece investments 45% 39% Portfolio Activity 30% • $5 million of net proceeds 15% 6% • 0% 0% $29 million of net proceeds 0% 2013 2014 2015 2016 2017 Vintage Year * Financial results presented above exclude PE interests except for investment count, carrying value and net carrying value, wh million of carrying value as of March 31, 2021 11 As of March 31, 2021, unless otherwise stated; at CLNC share 11 See footnotes in the appendix % of Portfolio
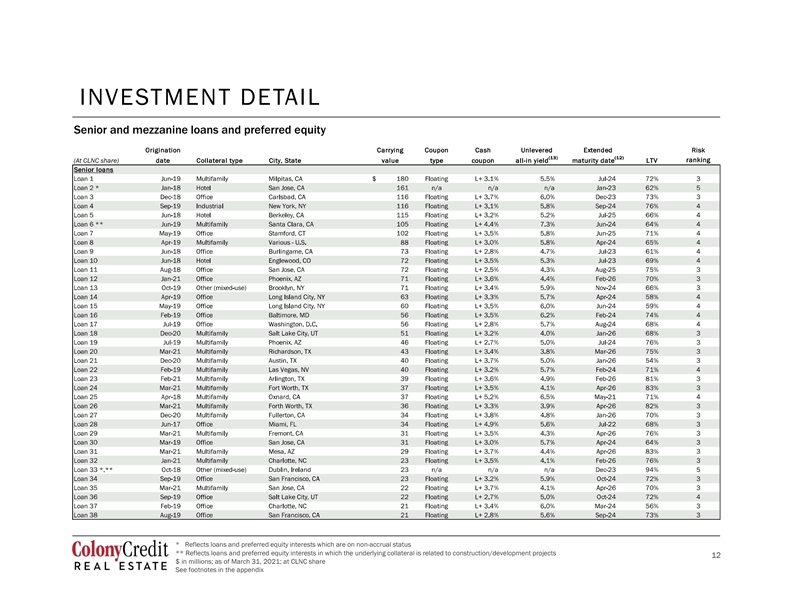
INVESTMENT DETAIL Senior and mezzanine loans and preferred equity * Reflects loans and preferred equity interests which are on non-accrual status ** Reflects loans and preferred equity interests in which the underlying collateral is related to construction/development projects 12 $ in millions; as of March 31, 2021; at CLNC share 12 See footnotes in the appendixINVESTMENT DETAIL Senior and mezzanine loans and preferred equity * Reflects loans and preferred equity interests which are on non-accrual status ** Reflects loans and preferred equity interests in which the underlying collateral is related to construction/development projects 12 $ in millions; as of March 31, 2021; at CLNC share 12 See footnotes in the appendix
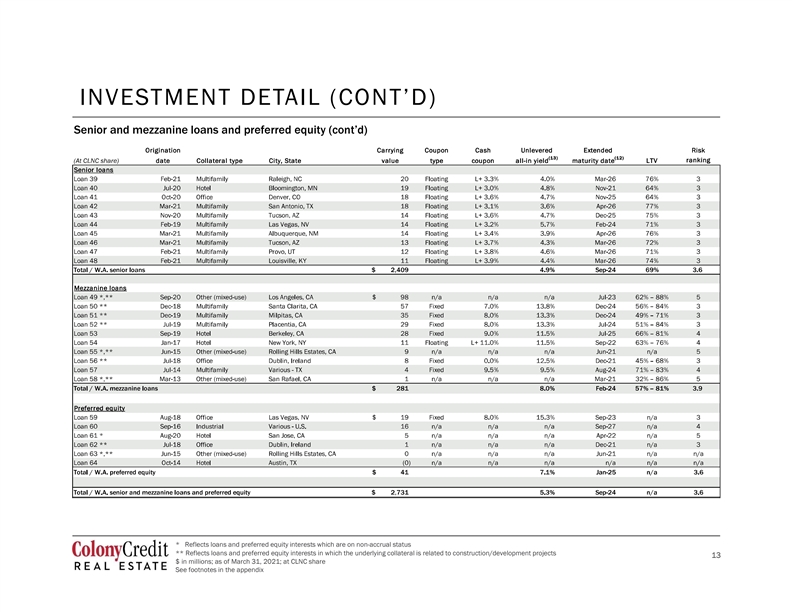
Senior and mezzanine loans * Reflects loans and preferred equity interests which are on non-accrual status ** Reflects loans and preferred equity interests in which the underlying collateral is related to construction/development projects 13 $ in millions; as of March 31, 2021; at CLNC share 13 See footnotes in the appendixSenior and mezzanine loans * Reflects loans and preferred equity interests which are on non-accrual status ** Reflects loans and preferred equity interests in which the underlying collateral is related to construction/development projects 13 $ in millions; as of March 31, 2021; at CLNC share 13 See footnotes in the appendix
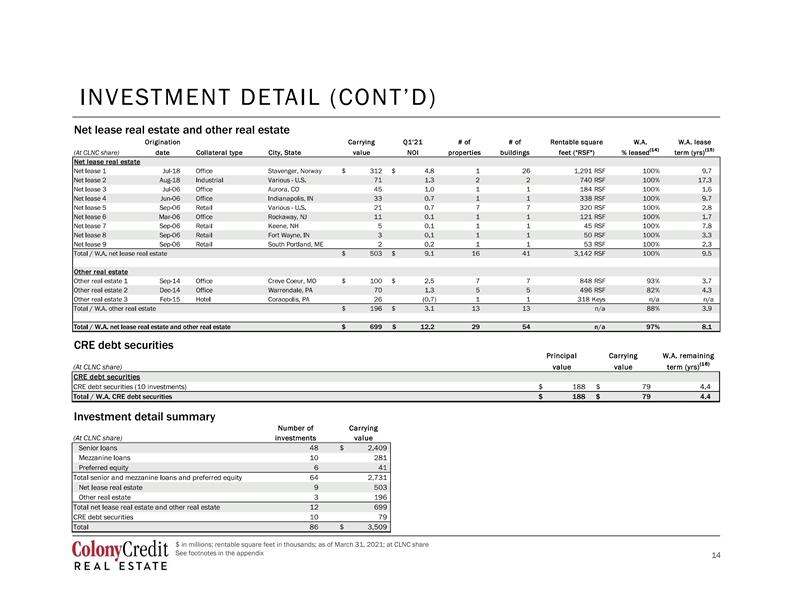
Net lease real estate and other real estate CRE debt securities Investment detail summary $ in millions; rentable square feet in thousands; as of March 31, 2021; at CLNC share See footnotes in the appendix 14 14Net lease real estate and other real estate CRE debt securities Investment detail summary $ in millions; rentable square feet in thousands; as of March 31, 2021; at CLNC share See footnotes in the appendix 14 14

CAPITALIZATION HIGHLIGHTS Conservative and diversified capital structure with a 1.1x net debt-to-equity ratio and embedded capacity under existing financing sources (fully undrawn corporate revolver, $1.2 billion of availability under repo facilities) Overview Capital Structure Total capitalization $3.8 billion (excluding cash) Other debt (non-recourse) 2% Mortgage debt Total outstanding debt $2.2 billion (non-recourse) Stockholders' 14% equity 41% Corporate revolving credit $113 million facility availability (fully undrawn) As of May 3, 2021 Master repurchase facilities $1.2 billion availability ($2.1 billion maximum facilities availability) As of May 3, 2021 (4) Master Net debt-to-equity ratio 1.1x repurchase facilities (limited recourse) Blended all-in cost of Securitization bonds 21% (17) 2.63% payable (non-recourse) financing 22% As of March 31, 2021, unless otherwise stated; at CLNC share See footnotes in the appendix 15 15CAPITALIZATION HIGHLIGHTS Conservative and diversified capital structure with a 1.1x net debt-to-equity ratio and embedded capacity under existing financing sources (fully undrawn corporate revolver, $1.2 billion of availability under repo facilities) Overview Capital Structure Total capitalization $3.8 billion (excluding cash) Other debt (non-recourse) 2% Mortgage debt Total outstanding debt $2.2 billion (non-recourse) Stockholders' 14% equity 41% Corporate revolving credit $113 million facility availability (fully undrawn) As of May 3, 2021 Master repurchase facilities $1.2 billion availability ($2.1 billion maximum facilities availability) As of May 3, 2021 (4) Master Net debt-to-equity ratio 1.1x repurchase facilities (limited recourse) Blended all-in cost of Securitization bonds 21% (17) 2.63% payable (non-recourse) financing 22% As of March 31, 2021, unless otherwise stated; at CLNC share See footnotes in the appendix 15 15
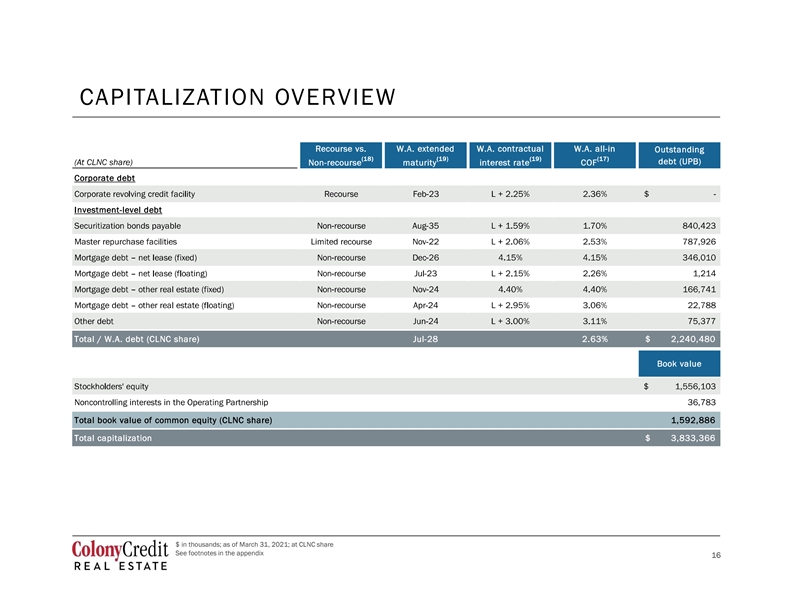
CAPITALIZATION OVERVIEW $ in thousands; as of March 31, 2021; at CLNC share See footnotes in the appendix 16 16CAPITALIZATION OVERVIEW $ in thousands; as of March 31, 2021; at CLNC share See footnotes in the appendix 16 16
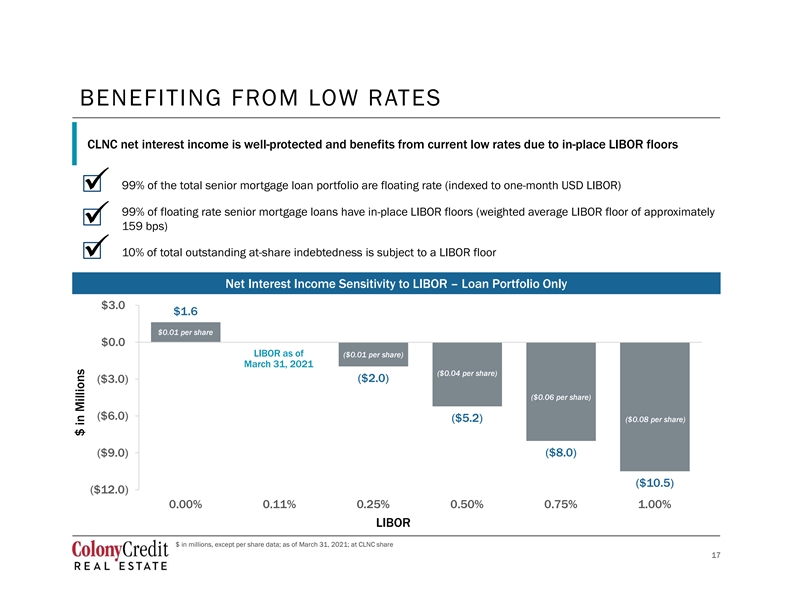
BENEFITING FROM LOW RATES CLNC net interest income is well-protected and benefits from current low rates due to in-place LIBOR floors 99% of the total senior mortgage loan portfolio are floating rate (indexed to one-month USD LIBOR) 99% of floating rate senior mortgage loans have in-place LIBOR floors (weighted average LIBOR floor of approximately 159 bps) 10% of total outstanding at-share indebtedness is subject to a LIBOR floor $3.0 $1.6 $0.01 per share $0.0 LIBOR as of ($0.01 per share) March 31, 2021 ($0.04 per share) ($2.0) ($3.0) ($0.06 per share) ($6.0) ($5.2) ($0.08 per share) ($8.0) ($9.0) ($10.5) ($12.0) 0.00% 0.11% 0.25% 0.50% 0.75% 1.00% LIBOR $ in millions, except per share data; as of March 31, 2021; at CLNC share 17 17 $ in MillionsBENEFITING FROM LOW RATES CLNC net interest income is well-protected and benefits from current low rates due to in-place LIBOR floors 99% of the total senior mortgage loan portfolio are floating rate (indexed to one-month USD LIBOR) 99% of floating rate senior mortgage loans have in-place LIBOR floors (weighted average LIBOR floor of approximately 159 bps) 10% of total outstanding at-share indebtedness is subject to a LIBOR floor $3.0 $1.6 $0.01 per share $0.0 LIBOR as of ($0.01 per share) March 31, 2021 ($0.04 per share) ($2.0) ($3.0) ($0.06 per share) ($6.0) ($5.2) ($0.08 per share) ($8.0) ($9.0) ($10.5) ($12.0) 0.00% 0.11% 0.25% 0.50% 0.75% 1.00% LIBOR $ in millions, except per share data; as of March 31, 2021; at CLNC share 17 17 $ in Millions

APPENDIX 18APPENDIX 18
IMPORTANT NOTE REGARDING NON-GAAP FINANCIAL MEASURES AND DEFINITIONS We present Distributable Earnings, which is a non-GAAP supplemental financial measure of our performance. We believe that Distributable Earnings provides meaningful information to consider in addition to our net income and cash flow from operating activities determined in accordance with U.S. GAAP, and this metric is a useful indicator for investors in evaluating and comparing our operating performance to our peers and our ability to pay dividends. We elected to be taxed as a REIT under the Internal Revenue Code of 1986, as amended, beginning with our taxable year ended December 31, 2018. As a REIT, we are required to distribute substantially all of our taxable income and we believe that dividends are one of the principal reasons investors invest in credit or commercial mortgage REITs such as our company. Over time, Distributable Earnings has been a useful indicator of our dividends per share and we consider that measure in determining the dividend, if any, to be paid. This supplemental financial measure also helps us to evaluate our performance excluding the effects of certain transactions and U.S. GAAP adjustments that we believe are not necessarily indicative of our current portfolio and operations We define Distributable Earnings as U.S. GAAP net income (loss) attributable to our common stockholders (or, without duplication, the owners of the common equity of our direct subsidiaries, such as our operating quity compensation expense, (ii) the expenses incurred in connection with our formation or other strategic transactions, (iii) the incentive fee, (iv) acquisition costs from successful acquisitions, (v) gains or losses from sales of real estate property and impairment write-downs of depreciable real estate, including unconsolidated joint ventures and preferred equity investments, (vi) CECL gains or losses or other similar non-cash items that are included in net income for the current quarter, regardless of whether such items are included in other comprehensive income or loss, or in net income, (ix) one-time events pursuant to changes in U.S. GAAP and (x) certain material non- cash income or expense items that in the judgment of management should not be included in Distributable Earnings. For clauses (ix) and (x), such exclusions shall only be applied after approval by a majority of our independent directors. Distributable Earnings include provision for loan losses when realized. Loan losses are realized when such amounts are deemed nonrecoverable at the time the loan is repaid, or if the underlying asset is sold following foreclosure, or if we determine that it is probable that all amounts due will not be collected; realized loan losses to be included in Distributable Earnings is the difference between the cash received, or expected to be received, and the book value of the asset. Distributable Earnings does not represent net income or cash generated from operating activities and should not be considered as an alternative to U.S. GAAP net income or an indication of our cash flows from operating activities determined in accordance with U.S. GAAP, a measure of our liquidity, or an indication of funds available to fund our cash needs. In addition, our methodology for calculating Distributable Earnings may differ from methodologies employed by other companies to calculate the same or similar non-GAAP supplemental financial measures, and accordingly, our reported Distributable Earnings may not be comparable to the Distributable Earnings reported by other companies. The Company calculates Distributable Earnings per share, which are non-GAAP supplemental financial measures, based on a weighted average number of common shares and operating partnership units (held by members other than the Company or its subsidiaries). re closely linked to the direct results of operations at the property level. NOI excludes historical cost depreciation and amortization, which are based on different useful life estimates depending on the age of the properties, as well as adjustments for the effects of real estate impairment and gains or losses on sales of depreciated properties, which eliminate differences arising from investment and disposition decisions. Additionally, by excluding corporate level expenses or benefits such as interest expense, any gain or loss on early extinguishment of debt and income taxes, which are incurred by the parent entity and are not directly linked to the ope thers, such as capital expenditures and leasing costs, which are s, and transaction costs and administrative costs, may limit the usefulness of NOI. NOI may fail to capture significant trends in these components of U.S. GAAP net income (loss) which further limits its usefulness. NOI should not be considered as an alternative to net income (loss), determined in accordance with U.S. GAAP, as an indicator of operating performance. In addition, our methodology for calculating NOI involves subjective judgment and discretion and may differ from the methodologies used by other companies, when calculating the same or similar supplemental financial measures and may not be comparable with other companies. 19 19IMPORTANT NOTE REGARDING NON-GAAP FINANCIAL MEASURES AND DEFINITIONS We present Distributable Earnings, which is a non-GAAP supplemental financial measure of our performance. We believe that Distributable Earnings provides meaningful information to consider in addition to our net income and cash flow from operating activities determined in accordance with U.S. GAAP, and this metric is a useful indicator for investors in evaluating and comparing our operating performance to our peers and our ability to pay dividends. We elected to be taxed as a REIT under the Internal Revenue Code of 1986, as amended, beginning with our taxable year ended December 31, 2018. As a REIT, we are required to distribute substantially all of our taxable income and we believe that dividends are one of the principal reasons investors invest in credit or commercial mortgage REITs such as our company. Over time, Distributable Earnings has been a useful indicator of our dividends per share and we consider that measure in determining the dividend, if any, to be paid. This supplemental financial measure also helps us to evaluate our performance excluding the effects of certain transactions and U.S. GAAP adjustments that we believe are not necessarily indicative of our current portfolio and operations We define Distributable Earnings as U.S. GAAP net income (loss) attributable to our common stockholders (or, without duplication, the owners of the common equity of our direct subsidiaries, such as our operating quity compensation expense, (ii) the expenses incurred in connection with our formation or other strategic transactions, (iii) the incentive fee, (iv) acquisition costs from successful acquisitions, (v) gains or losses from sales of real estate property and impairment write-downs of depreciable real estate, including unconsolidated joint ventures and preferred equity investments, (vi) CECL gains or losses or other similar non-cash items that are included in net income for the current quarter, regardless of whether such items are included in other comprehensive income or loss, or in net income, (ix) one-time events pursuant to changes in U.S. GAAP and (x) certain material non- cash income or expense items that in the judgment of management should not be included in Distributable Earnings. For clauses (ix) and (x), such exclusions shall only be applied after approval by a majority of our independent directors. Distributable Earnings include provision for loan losses when realized. Loan losses are realized when such amounts are deemed nonrecoverable at the time the loan is repaid, or if the underlying asset is sold following foreclosure, or if we determine that it is probable that all amounts due will not be collected; realized loan losses to be included in Distributable Earnings is the difference between the cash received, or expected to be received, and the book value of the asset. Distributable Earnings does not represent net income or cash generated from operating activities and should not be considered as an alternative to U.S. GAAP net income or an indication of our cash flows from operating activities determined in accordance with U.S. GAAP, a measure of our liquidity, or an indication of funds available to fund our cash needs. In addition, our methodology for calculating Distributable Earnings may differ from methodologies employed by other companies to calculate the same or similar non-GAAP supplemental financial measures, and accordingly, our reported Distributable Earnings may not be comparable to the Distributable Earnings reported by other companies. The Company calculates Distributable Earnings per share, which are non-GAAP supplemental financial measures, based on a weighted average number of common shares and operating partnership units (held by members other than the Company or its subsidiaries). re closely linked to the direct results of operations at the property level. NOI excludes historical cost depreciation and amortization, which are based on different useful life estimates depending on the age of the properties, as well as adjustments for the effects of real estate impairment and gains or losses on sales of depreciated properties, which eliminate differences arising from investment and disposition decisions. Additionally, by excluding corporate level expenses or benefits such as interest expense, any gain or loss on early extinguishment of debt and income taxes, which are incurred by the parent entity and are not directly linked to the ope thers, such as capital expenditures and leasing costs, which are s, and transaction costs and administrative costs, may limit the usefulness of NOI. NOI may fail to capture significant trends in these components of U.S. GAAP net income (loss) which further limits its usefulness. NOI should not be considered as an alternative to net income (loss), determined in accordance with U.S. GAAP, as an indicator of operating performance. In addition, our methodology for calculating NOI involves subjective judgment and discretion and may differ from the methodologies used by other companies, when calculating the same or similar supplemental financial measures and may not be comparable with other companies. 19 19

IMPORTANT NOTE REGARDING NON-GAAP FINANCIAL MEASURES AND DEFINITIONS ce with GAAP. The Company computes pro rata financial information by applying its economic interest to each financial statement line item on an investment-by-investment basis. Similarly, noncontrolling interest rest to each financial statement line item. The Company provides pro rata financial information b economic interest in its investments. However, pro rata financial information as an analytical tool has limitations. Other companies may not calculate their pro rata information in the same methodology, and accordingly, pro rata information. As such, the pro rata financial information should not be considered in isolation or as a substitute for our financial statements as reported under GAAP, but may be used as a supplement to financial information as reported under GAAP. We present loan-to-value which reflects the initial loan amount divided by the as-is appraised value as of the date the loan was originated, or by the current principal amount divided by the appraisal value as of the date of the most recent as-is appraisal. For construction loans, loan-to-value reflects the total commitment amount of the loan divided by the as-completed appraised value, or the total commitment amount of the loan divided by the projected total cost basis. Senior loans reflect the initial loan amount divided by the as-is value as of the date the loan was originated, or the principal amount divided by the appraised value as of the date of the most recent as-is appraisal. ct the total commitment amount of the loan divided by the as completed appraised value, or the total commitment amount of the loan divided by the projected total cost basis. Mezzanine loans include attachment and detachment loan-to-values, respectively. Attachment loan-to-value reflects initial funding of loans senior to our position divided by the as-is value as of the date the loan was originated, or the principal amount divided by the appraised value as of the date of the most recent appraisal. Detachment loan-to-value reflects the cumulative initial funding of our loan and the loans senior to our position divided by the as-is value as of the date the loan was originated, or the cumulative principal amount divided by the appraised value as of the date of the most recent appraisal. Construction mezzanine loans include attachment and detachment loan-to-value, respectively. Attachment loan-to-value reflects the total commitment amount of loans senior to our position divided by as-completed appraised value, or the total commitment amount of loans senior to our position divided by projected total cost basis. Detachment loan-to-value reflect the cumulative commitment amount of our loan and the loans senior to our position divided by as- completed appraised value, or the cumulative commitment amount of our loan and loans senior to our position divided by projected total cost basis. We present risk rankings, which is a supplemental financial disclosure, for loans and preferred equity investments. In addition to reviewing loans and preferred equity for impairments on a quarterly basis, the Company evaluates loans and preferred equity to determine if an allowance for loan loss should be established. In conjunction with this review, the Company assesses the risk factors of each loan and preferred equity investment and assigns a risk rating based on a variety of factors, including, without limitation, underlying real estate performance and asset value, values of comparable properties, durability and quality of property cash flows, sponsor experience and financial wherewithal, and the existence of a risk-mitigating loan structure. Additional key considerations include loan-to-value ratios, debt service coverage ratios, loan structure, real estate and credit market dynamics, and risk of default or pri origination or purchase, loans and preferred equity investmen 20 20IMPORTANT NOTE REGARDING NON-GAAP FINANCIAL MEASURES AND DEFINITIONS ce with GAAP. The Company computes pro rata financial information by applying its economic interest to each financial statement line item on an investment-by-investment basis. Similarly, noncontrolling interest rest to each financial statement line item. The Company provides pro rata financial information b economic interest in its investments. However, pro rata financial information as an analytical tool has limitations. Other companies may not calculate their pro rata information in the same methodology, and accordingly, pro rata information. As such, the pro rata financial information should not be considered in isolation or as a substitute for our financial statements as reported under GAAP, but may be used as a supplement to financial information as reported under GAAP. We present loan-to-value which reflects the initial loan amount divided by the as-is appraised value as of the date the loan was originated, or by the current principal amount divided by the appraisal value as of the date of the most recent as-is appraisal. For construction loans, loan-to-value reflects the total commitment amount of the loan divided by the as-completed appraised value, or the total commitment amount of the loan divided by the projected total cost basis. Senior loans reflect the initial loan amount divided by the as-is value as of the date the loan was originated, or the principal amount divided by the appraised value as of the date of the most recent as-is appraisal. ct the total commitment amount of the loan divided by the as completed appraised value, or the total commitment amount of the loan divided by the projected total cost basis. Mezzanine loans include attachment and detachment loan-to-values, respectively. Attachment loan-to-value reflects initial funding of loans senior to our position divided by the as-is value as of the date the loan was originated, or the principal amount divided by the appraised value as of the date of the most recent appraisal. Detachment loan-to-value reflects the cumulative initial funding of our loan and the loans senior to our position divided by the as-is value as of the date the loan was originated, or the cumulative principal amount divided by the appraised value as of the date of the most recent appraisal. Construction mezzanine loans include attachment and detachment loan-to-value, respectively. Attachment loan-to-value reflects the total commitment amount of loans senior to our position divided by as-completed appraised value, or the total commitment amount of loans senior to our position divided by projected total cost basis. Detachment loan-to-value reflect the cumulative commitment amount of our loan and the loans senior to our position divided by as- completed appraised value, or the cumulative commitment amount of our loan and loans senior to our position divided by projected total cost basis. We present risk rankings, which is a supplemental financial disclosure, for loans and preferred equity investments. In addition to reviewing loans and preferred equity for impairments on a quarterly basis, the Company evaluates loans and preferred equity to determine if an allowance for loan loss should be established. In conjunction with this review, the Company assesses the risk factors of each loan and preferred equity investment and assigns a risk rating based on a variety of factors, including, without limitation, underlying real estate performance and asset value, values of comparable properties, durability and quality of property cash flows, sponsor experience and financial wherewithal, and the existence of a risk-mitigating loan structure. Additional key considerations include loan-to-value ratios, debt service coverage ratios, loan structure, real estate and credit market dynamics, and risk of default or pri origination or purchase, loans and preferred equity investmen 20 20
NOTES REGARDING REPORTABLE SEGMENTS table segments below, which are based on how management reviews and manages its business. During the first quarter of 2021, the Company realigned the business and reportable segment information to reflect how the Chief Operating Decision Makers regularly review and manage the business. As a result, we present our business as one portfolio and through the below business segments. Prior to the realignment noted above, the Company had conducted business through two portfolios, the Core Portfolio and Legacy, Non-Strategic Portfolio, since the third quarter 2019. Since then, we have resolved 56 investments in our Legacy, Non-Strategic Portfolio with the remaining investments representing less than 1% of our total net book value at the end of 2020. As such, we have dissolved the separate segment reporting of Legacy, Non-Strategic Portfolio as of the beginning of the first quarter of 2021. Senior and Mezzanine Loans and Preferred Equity ( Loans & Preferred Equity Portfolio or Loan Portfolio ) The Loan Portfolio also includes acquisition, development and construction loan arrangements accounted for as equity method investments as well as loans and preferred equity interests held through joint ventures with an affiliate of Colony Capital, Inc., which were deconsolidated as a result of the merger and subsequently treated as equity method investments. • Senior mortgage loans may include junior participations in our originated senior mortgage loans for which we have syndicated the senior participations to other investors and retained the junior participations for our portfolio and contiguous mezzanine loans where we own both the senior and junior loan positions. We believe these investments are more similar to the senior mortgage loans we originate than other loan types given their credit quality and risk profile • Mezzanine loans include other subordinated loans • Preferred equity interests include related equity participation interests Net Leased Real Estate and Other Real Estate ( Net Lease and Other Real Estate ) ong-term leases to tenants on a net lease basis, where such tenants are generally responsible for property operating expenses such as insurance, utilities, maintenance capital expenditures and real estate taxes. Other Real Estate investments included direct ownership in commercial real estate, with an emphasis on properties with stable cash flow. Net lease and other real estate includes deferred leasing costs and other net intangibles. CRE Debt Securities Corporate As of March 31, 2021, the Corporate segment included corporate-level asset management and other fees including expenses related to our secured revolving credit facility, related party and general and administrative expenses. 21 21NOTES REGARDING REPORTABLE SEGMENTS table segments below, which are based on how management reviews and manages its business. During the first quarter of 2021, the Company realigned the business and reportable segment information to reflect how the Chief Operating Decision Makers regularly review and manage the business. As a result, we present our business as one portfolio and through the below business segments. Prior to the realignment noted above, the Company had conducted business through two portfolios, the Core Portfolio and Legacy, Non-Strategic Portfolio, since the third quarter 2019. Since then, we have resolved 56 investments in our Legacy, Non-Strategic Portfolio with the remaining investments representing less than 1% of our total net book value at the end of 2020. As such, we have dissolved the separate segment reporting of Legacy, Non-Strategic Portfolio as of the beginning of the first quarter of 2021. Senior and Mezzanine Loans and Preferred Equity ( Loans & Preferred Equity Portfolio or Loan Portfolio ) The Loan Portfolio also includes acquisition, development and construction loan arrangements accounted for as equity method investments as well as loans and preferred equity interests held through joint ventures with an affiliate of Colony Capital, Inc., which were deconsolidated as a result of the merger and subsequently treated as equity method investments. • Senior mortgage loans may include junior participations in our originated senior mortgage loans for which we have syndicated the senior participations to other investors and retained the junior participations for our portfolio and contiguous mezzanine loans where we own both the senior and junior loan positions. We believe these investments are more similar to the senior mortgage loans we originate than other loan types given their credit quality and risk profile • Mezzanine loans include other subordinated loans • Preferred equity interests include related equity participation interests Net Leased Real Estate and Other Real Estate ( Net Lease and Other Real Estate ) ong-term leases to tenants on a net lease basis, where such tenants are generally responsible for property operating expenses such as insurance, utilities, maintenance capital expenditures and real estate taxes. Other Real Estate investments included direct ownership in commercial real estate, with an emphasis on properties with stable cash flow. Net lease and other real estate includes deferred leasing costs and other net intangibles. CRE Debt Securities Corporate As of March 31, 2021, the Corporate segment included corporate-level asset management and other fees including expenses related to our secured revolving credit facility, related party and general and administrative expenses. 21 21

$ in thousands, except share data; as of March 31, 2021, unless otherwise stated 22 22$ in thousands, except share data; as of March 31, 2021, unless otherwise stated 22 22
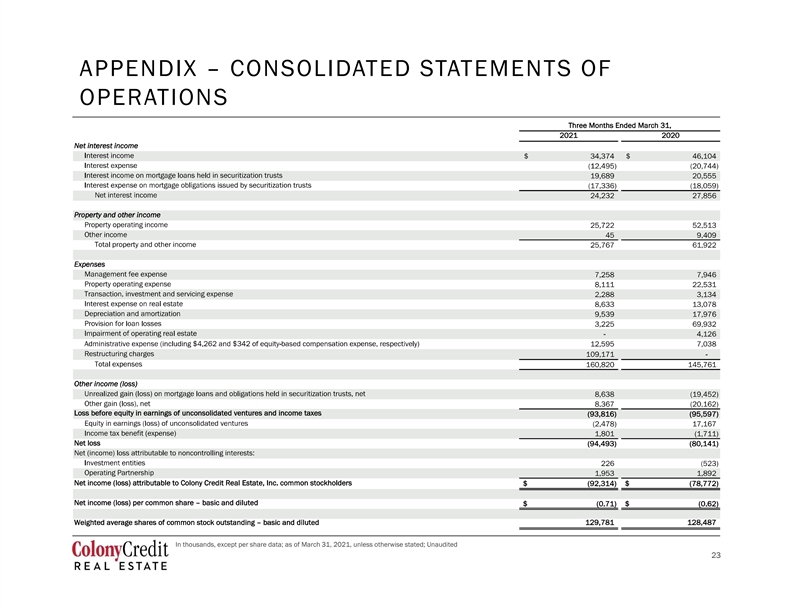
OPERATIONS In thousands, except per share data; as of March 31, 2021, unless otherwise stated; Unaudited 23 23OPERATIONS In thousands, except per share data; as of March 31, 2021, unless otherwise stated; Unaudited 23 23
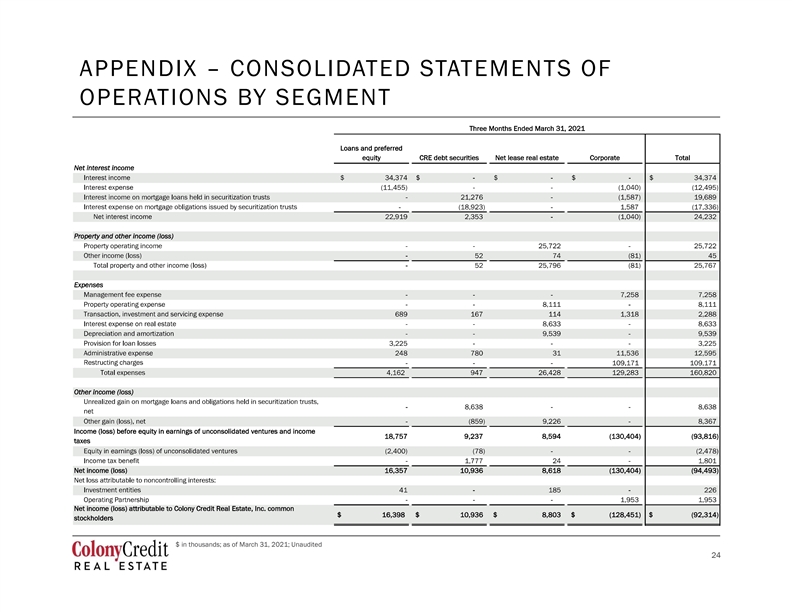
OPERATIONS BY SEGMENT $ in thousands; as of March 31, 2021; Unaudited 24 24OPERATIONS BY SEGMENT $ in thousands; as of March 31, 2021; Unaudited 24 24
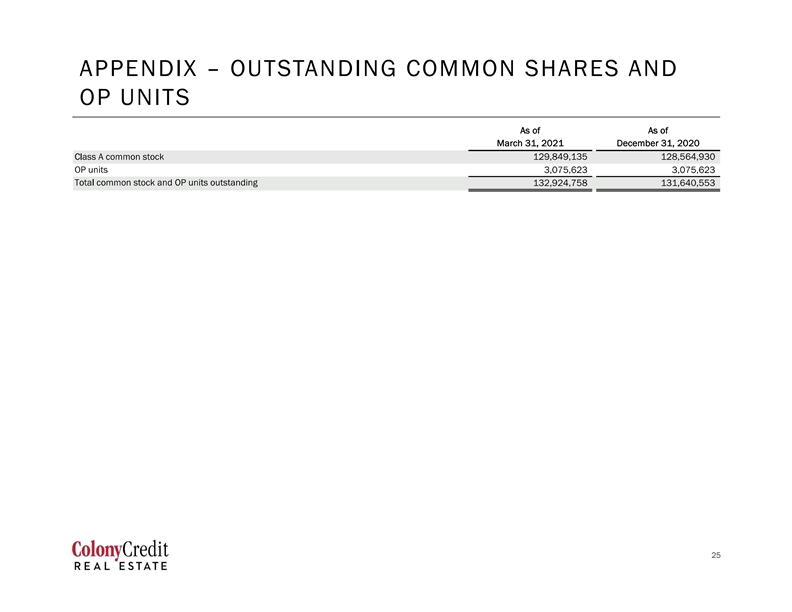
OP UNITS 25 25OP UNITS 25 25

FINANCIAL INFORMATION Reconciliation of consolidated balance sheet to at CLNC share balance sheet In thousands, except per share data; as of March 31, 2021; Unaudited See footnotes in the appendix 26 26FINANCIAL INFORMATION Reconciliation of consolidated balance sheet to at CLNC share balance sheet In thousands, except per share data; as of March 31, 2021; Unaudited See footnotes in the appendix 26 26
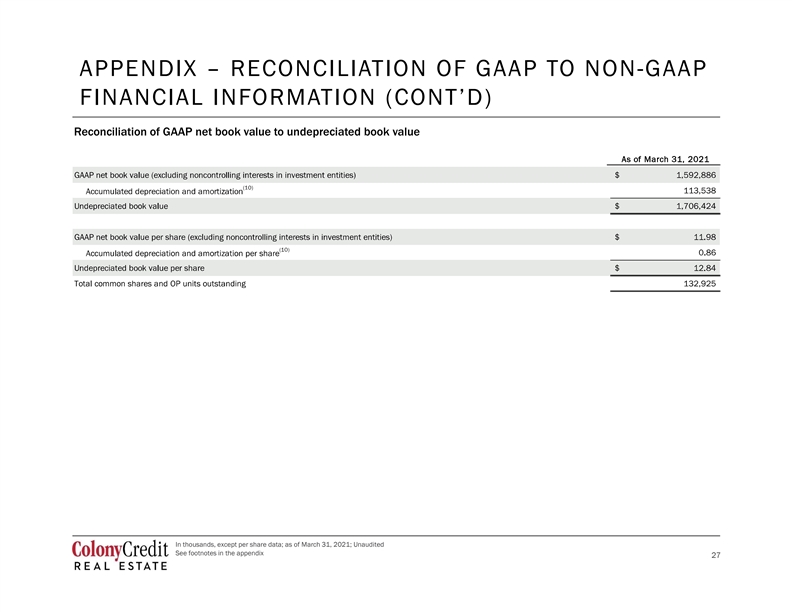
Reconciliation of GAAP net book value to undepreciated book value In thousands, except per share data; as of March 31, 2021; Unaudited See footnotes in the appendix 27 27Reconciliation of GAAP net book value to undepreciated book value In thousands, except per share data; as of March 31, 2021; Unaudited See footnotes in the appendix 27 27
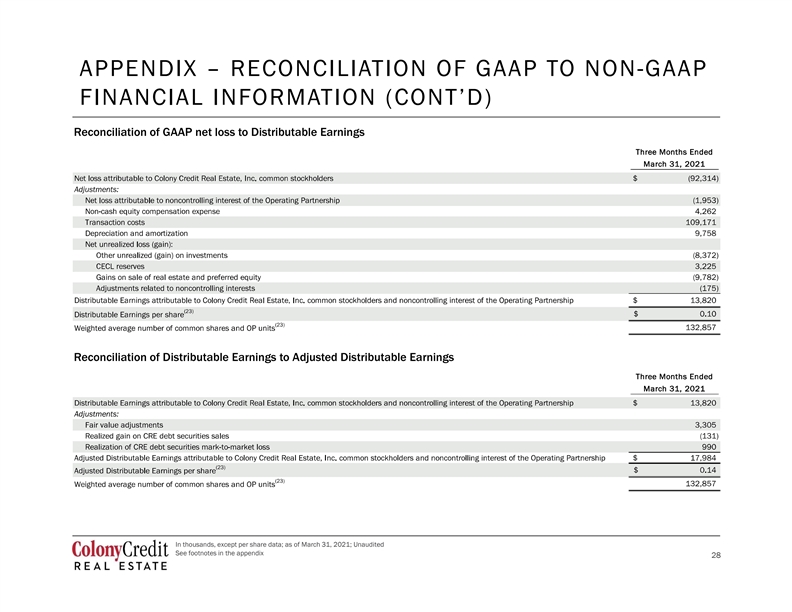
Reconciliation of GAAP net loss to Distributable Earnings Reconciliation of Distributable Earnings to Adjusted Distributable Earnings In thousands, except per share data; as of March 31, 2021; Unaudited See footnotes in the appendix 28 28Reconciliation of GAAP net loss to Distributable Earnings Reconciliation of Distributable Earnings to Adjusted Distributable Earnings In thousands, except per share data; as of March 31, 2021; Unaudited See footnotes in the appendix 28 28
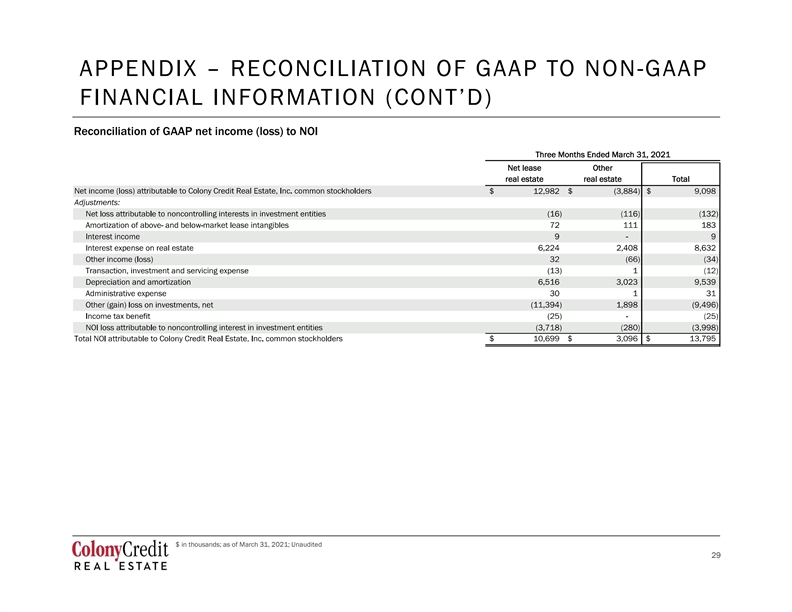
Reconciliation of GAAP net income (loss) to NOI $ in thousands; as of March 31, 2021; Unaudited 29 29Reconciliation of GAAP net income (loss) to NOI $ in thousands; as of March 31, 2021; Unaudited 29 29
1. Amounts presented reflect total committed capital and include both closed and in-execution deals as of May 3, 2021 2. Based on GAAP gross carrying values; excludes cash and net assets 3. As of May 3, 2021 noncontrolling interests in the OP and excludes noncontrolling interests in investment entities 5. Debt-to-asset ratio based on total outstanding secured debt agreements t CLNC share 6. Includes securitization assets which are presented net of the impact from consolidation; includes one private equity secondary interest for approximately $7 million 7. Other / mixed-use includes: (i) commercial and residential development and predevelopment and (ii) mixed-use assets 8. Preferred equity includes approximately $17 million related to equity participation interests 9. Includes cash, restricted cash, net receivables, other assets, due to related party, accrued and other liabilities and escrow deposits payable 10. Represents net accumulated depreciation and amortization on real estate investments, including related intangible assets and liabilities 11. Represents the remaining loan term based on the current contractual maturity date of loans and is weighted by carrying value at CLNC share as of March 31, 2021 12. Represents the remaining loan term based on maximum maturity date assuming all extension options on loans are exercised by the borrower and is weighted by carrying value at CLNC share as of March 31, 2021 13. In addition to the stated cash coupon rate, unlevered all-in yield includes non-cash payment in-kind interest income and the accrual of origination, extension and exit fees. For W.A. calculations, unlevered all-in yield for the loan portfolio assumes the applicable floating benchmark rate as of March 31, 2021 14. Represents the percent leased as of March 31, 2021 and is weighted by carrying value; excludes hotel property type 15. Based on in-place leases (defined as occupied and paying leases) as of March 31, 2021 and assumes that no renewal options are exercised. W.A. calculation based on carrying value; excludes hotel property type 16. W.A. calculation based on carrying value 17. For W.A. calculations, assumes the applicable floating benchmark rate as of March 31, 2021 and is weighted on outstanding debt (UPB) 18. Subject to customary non-recourse carve-outs 19. W.A. calculation based on outstanding debt (UPB) 20. Represents interests in assets held by third party partners 22. Reflects the net impact of securitization assets and related obligations which are consolidated for accounting purposes 23. The Company calculates Distributable Earnings and Adjusted Distributable Earnings per share, which are non-GAAP financial measures, based on a weighted average number of common shares and OP units (held by members other than the Company or its subsidiaries). For the three months ended March 31, 2021, the weighted average number of common shares and OP units was approximately 132.9 million; includes 3.1 million of OP units 30 301. Amounts presented reflect total committed capital and include both closed and in-execution deals as of May 3, 2021 2. Based on GAAP gross carrying values; excludes cash and net assets 3. As of May 3, 2021 noncontrolling interests in the OP and excludes noncontrolling interests in investment entities 5. Debt-to-asset ratio based on total outstanding secured debt agreements t CLNC share 6. Includes securitization assets which are presented net of the impact from consolidation; includes one private equity secondary interest for approximately $7 million 7. Other / mixed-use includes: (i) commercial and residential development and predevelopment and (ii) mixed-use assets 8. Preferred equity includes approximately $17 million related to equity participation interests 9. Includes cash, restricted cash, net receivables, other assets, due to related party, accrued and other liabilities and escrow deposits payable 10. Represents net accumulated depreciation and amortization on real estate investments, including related intangible assets and liabilities 11. Represents the remaining loan term based on the current contractual maturity date of loans and is weighted by carrying value at CLNC share as of March 31, 2021 12. Represents the remaining loan term based on maximum maturity date assuming all extension options on loans are exercised by the borrower and is weighted by carrying value at CLNC share as of March 31, 2021 13. In addition to the stated cash coupon rate, unlevered all-in yield includes non-cash payment in-kind interest income and the accrual of origination, extension and exit fees. For W.A. calculations, unlevered all-in yield for the loan portfolio assumes the applicable floating benchmark rate as of March 31, 2021 14. Represents the percent leased as of March 31, 2021 and is weighted by carrying value; excludes hotel property type 15. Based on in-place leases (defined as occupied and paying leases) as of March 31, 2021 and assumes that no renewal options are exercised. W.A. calculation based on carrying value; excludes hotel property type 16. W.A. calculation based on carrying value 17. For W.A. calculations, assumes the applicable floating benchmark rate as of March 31, 2021 and is weighted on outstanding debt (UPB) 18. Subject to customary non-recourse carve-outs 19. W.A. calculation based on outstanding debt (UPB) 20. Represents interests in assets held by third party partners 22. Reflects the net impact of securitization assets and related obligations which are consolidated for accounting purposes 23. The Company calculates Distributable Earnings and Adjusted Distributable Earnings per share, which are non-GAAP financial measures, based on a weighted average number of common shares and OP units (held by members other than the Company or its subsidiaries). For the three months ended March 31, 2021, the weighted average number of common shares and OP units was approximately 132.9 million; includes 3.1 million of OP units 30 30
COMPANY INFORMATION Colony Credit Real Estate (NYSE: CLNC) is one of the largest publicly traded commercial real estate (CRE) credit REITs, focused on originating, acquiring, financing and managing a diversified portfolio consisting primarily of CRE debt investments and net leased properties predominantly in the United States. CRE debt investments primarily consist of first mortgage loans, which we expect to be the primary investment strategy. Colony Credit Real Estate is organized as a Maryland corporation and taxed as a REIT for U.S. federal income tax purposes. For additional information regarding the Company and its management and business, please refer to www.clncredit.com. Shareholder Information New York Company Website: Investor Relations: Analyst Coverage: 590 Madison Avenue www.clncredit.com ADDO Investor Relations Raymond James rd 33 Floor Lasse Glassen Stephen Laws New York, NY 10022 310-829-5400 901-579-4868 NYSE Ticker: lglassen@addoir.com CLNC B. Riley FBR Matt Howlett Stock & Transfer Agent: Press & Media: 917-538-4762 American Stock & Transfer Owen Blicksilver P.R., Inc. Trust Company (AST) Caroline Luz BTIG 866-751-6317 203-656-2829 Timothy Hayes help@astfinancial.com caroline@blicksilverpr.com 212-738-6199 31 31COMPANY INFORMATION Colony Credit Real Estate (NYSE: CLNC) is one of the largest publicly traded commercial real estate (CRE) credit REITs, focused on originating, acquiring, financing and managing a diversified portfolio consisting primarily of CRE debt investments and net leased properties predominantly in the United States. CRE debt investments primarily consist of first mortgage loans, which we expect to be the primary investment strategy. Colony Credit Real Estate is organized as a Maryland corporation and taxed as a REIT for U.S. federal income tax purposes. For additional information regarding the Company and its management and business, please refer to www.clncredit.com. Shareholder Information New York Company Website: Investor Relations: Analyst Coverage: 590 Madison Avenue www.clncredit.com ADDO Investor Relations Raymond James rd 33 Floor Lasse Glassen Stephen Laws New York, NY 10022 310-829-5400 901-579-4868 NYSE Ticker: lglassen@addoir.com CLNC B. Riley FBR Matt Howlett Stock & Transfer Agent: Press & Media: 917-538-4762 American Stock & Transfer Owen Blicksilver P.R., Inc. Trust Company (AST) Caroline Luz BTIG 866-751-6317 203-656-2829 Timothy Hayes help@astfinancial.com caroline@blicksilverpr.com 212-738-6199 31 31

32 3232 32