UNITED STATES
SECURITIES AND EXCHANGE COMMISSION
Washington, D.C. 20549
FORM 10-Q
|
| |
| ☒ | QUARTERLY REPORT PURSUANT TO SECTION 13 OR 15(d) OF THE SECURITIES EXCHANGE ACT OF 1934 |
For the quarterly period ended March 31, 2020
OR
|
| |
| ☐ | TRANSITION REPORT PURSUANT TO SECTION 13 OR 15(d) OF THE SECURITIES EXCHANGE ACT OF 1934 |
Commission File Number: 001-38377
|
| | | | |
| | COLONY CREDIT REAL ESTATE, INC. | |
| | (Exact Name of Registrant as Specified in Its Charter) | |
| | | | | |
| | Maryland | | 38-4046290 | |
| | (State or Other Jurisdiction of Incorporation or Organization) | | (I.R.S. Employer Identification No.) | |
515 S. Flower Street, 44th Floor
Los Angeles, CA 90071
(Address of Principal Executive Offices, Including Zip Code)
(310) 282-8820
(Registrant’s Telephone Number, Including Area Code)
Securities registered pursuant to Section 12(b) of the Act:
|
| | | | |
| Title of each class | | Trading Symbol(s) | | Name of each exchange on which registered |
| Class A common stock, par value $0.01 per share | CLNC | New York Stock Exchange |
Indicate by check mark whether the registrant (1) has filed all reports required to be filed by Section 13 or 15(d) of the Securities Exchange Act of 1934 during the preceding 12 months (or for such shorter period that the registrant was required to file such reports), and (2) has been subject to such filing requirements for the past 90 days. Yes ☒ No ☐
Indicate by check mark whether the registrant has submitted electronically every Interactive Data File required to be submitted pursuant to Rule 405 of Regulation S-T (§232.405 of this chapter) during the preceding 12 months (or for such shorter period that the registrant was required to submit such files). Yes ☒ No ☐
Indicate by check mark whether the registrant is a large accelerated filer, an accelerated filer, a non-accelerated filer, smaller reporting company, or an emerging growth company. See the definitions of “large accelerated filer,” “accelerated filer,” “smaller reporting company,” and “emerging growth company” in Rule 12b-2 of the Exchange Act. (Check one): |
| | | | | | | |
| Large accelerated filer | ☒ | Accelerated filer | ☐ | Non-accelerated filer | ☐ | Smaller reporting company | ☐ |
| | | | | | | Emerging growth company | ☐ |
If an emerging growth company, indicate by check mark if the registrant has elected not to use the extended transition period for complying with any new or revised financial accounting standards provided pursuant to Section 13(a) of the Exchange Act. ☐
Indicate by check mark whether the registrant is a shell company (as defined in Rule 12b-2 of the Exchange Act). Yes ☐ No ☐
Indicate the number of shares outstanding of each of the registrant’s classes of common stock, as of the latest practicable date:
As of May 7, 2020, Colony Credit Real Estate, Inc. had 128,488,858 shares of Class A common stock, par value $0.01 per share, outstanding
EXPLANATORY NOTE
This Quarterly Report on Form 10-Q of Colony Credit Real Estate, Inc., a Maryland corporation (the “Company”), includes the financial statements and other financial information of (i) the Company and (ii) the Company’s accounting predecessor, which are investment entities in which Colony Capital Operating Company, LLC (“CLNY OP”) or its subsidiaries owned interests ranging from approximately 38% to 100% and that were contributed to the Company on January 31, 2018 in connection with the closing of the Combination (as defined below) and certain intercompany balances between those entities and CLNY OP or its subsidiaries (the “CLNY Investment Entities”).
On January 31, 2018, the Company completed the transactions contemplated by that certain Master Combination Agreement, dated as of August 25, 2017, as amended and restated on November 20, 2017 (the “Combination Agreement”), by and among (i) the Company, (ii) Credit RE Operating Company, LLC, a Delaware limited liability company and wholly-owned subsidiary of the Company (the “OP”), (iii) CLNY OP, a Delaware limited liability company and the operating company of Colony Capital, Inc., formerly Colony NorthStar, Inc. (“Colony Capital”), a Maryland corporation, (iv) NRF RED REIT Corp., a Maryland corporation and indirect subsidiary of CLNY OP (“RED REIT”), (v) NorthStar Real Estate Income Trust, Inc., a Maryland corporation (“NorthStar I”), (vi) NorthStar Real Estate Income Trust Operating Partnership, LP, a Delaware limited partnership and the operating partnership of NorthStar I (“NorthStar I OP”), (vii) NorthStar Real Estate Income II, Inc., a Maryland corporation (“NorthStar II”), and (viii) NorthStar Real Estate Income Operating Partnership II, LP, a Delaware limited partnership and the operating partnership of NorthStar II (“NorthStar II OP”).
Pursuant to the Combination Agreement, (i) CLNY OP contributed and conveyed to the Company a select portfolio of assets and liabilities (the “CLNY Contributed Portfolio”) of CLNY OP (the “CLNY OP Contribution”), (ii) RED REIT contributed and conveyed to the OP a select portfolio of assets and liabilities of RED REIT (the “RED REIT Contribution” and, together with the CLNY OP Contribution, the “CLNY Contributions”), (iii) NorthStar I merged with and into the Company, with the Company surviving the merger (the “NorthStar I Merger”), (iv) NorthStar II merged with and into the Company, with the Company surviving the merger (the “NorthStar II Merger” and, together with the NorthStar I Merger, the “Mergers”), and (v) immediately following the Mergers, the Company contributed and conveyed to the OP the CLNY Contributed Portfolio and the equity interests of each of NorthStar I OP and NorthStar II OP then-owned by the Company in exchange for units of membership interest in the OP (the “Company Contribution” and, collectively with the Mergers and the CLNY Contributions, the “Combination”). To satisfy the condition to completion of the Combination that the Company’s Class A common stock, par value $0.01 per share (the “Class A common stock”), be approved for listing on a national securities exchange in connection with either an initial public offering or a listing, the Class A common stock was approved for listing by the New York Stock Exchange and began trading under the ticker “CLNC” on February 1, 2018.
The CLNY Contributions were accounted for as a reorganization of entities under common control, since both the Company and CLNY Investment Entities were under common control of Colony Capital at the time the contributions were made. Accordingly, the Company’s financial statements for prior periods were recast to reflect the consolidation of the CLNY Investment Entities as if the contribution had occurred on the date of the earliest period presented.
As used throughout this document, the terms the “Company,” “we,” “our” and “us” mean:
| |
| • | Colony Credit Real Estate, Inc. and the consolidated CLNY Investment Entities for periods on or prior to the closing of the Combination on January 31, 2018; and |
| |
| • | The combined operations of Colony Credit Real Estate, Inc., NorthStar I and NorthStar II beginning February 1, 2018, following the closing of the Combination. |
Accordingly, comparisons of the period to period financial information of the Company as set forth herein may not be meaningful because the CLNY Investment Entities represents only a portion of the assets and liabilities Colony Credit Real Estate, Inc. acquired in the Combination and does not reflect any potential benefits that may result from realization of future cost savings from operating efficiencies, or other incremental synergies expected to result from the Combination.
In addition to the financial statements contained herein, you should read and consider the audited financial statements and accompanying notes thereto of the Company for the year ended December 31, 2019 included in our Annual Report on Form 10-K filed with the U.S. Securities and Exchange Commission (the “SEC”) on February 28, 2020.
COLONY CREDIT REAL ESTATE, INC.
FORM 10-Q
TABLE OF CONTENTS
Special Note Regarding Forward-Looking Statements
This Quarterly Report on Form 10-Q may contain forward-looking statements within the meaning of the federal securities laws. Forward-looking statements relate to expectations, beliefs, projections, future plans and strategies, anticipated events or trends and similar expressions concerning matters that are not historical facts. In some cases, you can identify forward-looking statements by the use of forward-looking terminology such as “may,” “will,” “should,” “expects,” “intends,” “plans,” “anticipates,” “believes,” “estimates,” “predicts,” or “potential” or the negative of these words and phrases or similar words or phrases which are predictions of or indicate future events or trends and which do not relate solely to historical matters. Forward-looking statements involve known and unknown risks, uncertainties, assumptions and contingencies, many of which are beyond our control, and may cause actual results to differ significantly from those expressed in any forward-looking statement.
Currently, one of the most significant factors that could cause actual outcomes to differ materially from our forward-looking statements is the potential adverse effect of the current pandemic of the novel coronavirus, or COVID-19, on the financial condition, results of operations, cash flows and performance of the Company, its borrowers and tenants, the real estate market and the global economy and financial markets. The extent to which COVID-19 pandemic impacts us, our borrowers and our tenants will depend on future developments, which are highly uncertain and cannot be predicted with confidence, including the scope, severity and duration of the pandemic, the actions taken to contain the pandemic or mitigate its impact, and the direct and indirect economic effects of the pandemic and containment measures, among others. Moreover, investors are cautioned to interpret many of the risks identified under the section titled “Risk Factors” in our Annual Report on Form 10-K for the fiscal year ended December 31, 2019 as being heightened as a result of the ongoing and numerous adverse impacts of the COVID-19 pandemic.
Among others, the following uncertainties and other factors could cause actual results to differ from those set forth in the forward-looking statements.
| |
| • | operating costs and business disruption may be greater than expected; |
| |
| • | uncertainties regarding the ongoing impact of COVID-19, the severity of the disease, the duration of the COVID-19 outbreak, actions that may be taken by governmental authorities to contain the COVID-19 outbreak or to treat its impact, the potential negative impacts of COVID-19 on the global economy and its adverse impact on the real estate market, the economy and our investments, financial condition and business operations; |
| |
| • | defaults by borrowers in paying debt service on outstanding indebtedness and borrowers’ abilities to manage and stabilize properties; |
| |
| • | deterioration in the performance of the properties securing our investments (including depletion of interest and other reserves or payment-in-kind concessions in lieu of current interest payment obligations) that may cause deterioration in the performance of our investments and, potentially, principal losses to us; |
| |
| • | the fair value of our investments may be subject to uncertainties; |
| |
| • | our use of leverage could hinder our ability to make distributions and may significantly impact our liquidity position; |
| |
| • | given our dependence on our external manager, an affiliate of Colony Capital, Inc., any adverse changes in the financial health or otherwise of our manager or Colony Capital, Inc. could hinder our operating performance and return on stockholder’s investment; |
| |
| • | the ability to realize substantial efficiencies as well as anticipated strategic and financial benefits, including, but not limited to expected returns on equity and/or yields on investments; |
| |
| • | adverse impacts on our corporate revolver, including covenant compliance and borrowing base capacity; |
| |
| • | adverse impacts on our liquidity, including margin calls on master repurchase facilities, debt service or lease payment defaults or deferrals, demands for protective advances and capital expenditures, or our ability to continue to generate liquidity from sales of legacy, non-strategic assets; |
| |
| • | our ability to liquidate our legacy, non-strategic assets within the projected timeframe or at the projected values; |
| |
| • | the timing of and ability to deploy available capital; |
| |
| • | our ability to pay, maintain or grow the dividend in the future; |
| |
| • | the timing of and ability to complete repurchases of our stock; |
| |
| • | our ability to refinance certain mortgage debt on similar terms to those currently existing or at all; |
| |
| • | whether Colony Capital will continue to serve as our external manager or whether we will pursue a strategic transaction related thereto; and the impact of legislative, regulatory and competitive changes |
| |
| • | and the actions of governmental authorities, including the current U.S. presidential administration, and in particular those affecting the commercial real estate finance and mortgage industry or our business. |
The foregoing list of factors is not exhaustive. We urge you to carefully review the disclosures we make concerning risks in the sections entitled “Risk Factors” in our Annual Report on Form 10-K for the year ended December 31, 2019, the section entitled “Risk Factors” in this Form 10-Q for the quarter ended March 31, 2020 and “Management’s Discussion and Analysis of Financial Condition and Results of Operations” herein.
We caution investors not to unduly rely on any forward-looking statements. The forward-looking statements speak only as of the date of this Quarterly Report on Form 10-Q. The Company is under no duty to update any of these forward-looking statements after the date of this Quarterly Report on Form 10-Q, nor to conform prior statements to actual results or revised expectations, and the Company does not intend to do so.
PART I
Item 1. Financial Statements
COLONY CREDIT REAL ESTATE, INC.
CONSOLIDATED BALANCE SHEETS
(in Thousands, Except Share and Per Share Data)
|
| | | | | | | |
| | March 31, 2020 (Unaudited) | | December 31, 2019 |
| Assets | | | |
| Cash and cash equivalents | $ | 393,845 |
| | $ | 69,619 |
|
| Restricted cash | 159,521 |
| | 126,065 |
|
Loans and preferred equity held for investment, net(1) | 2,351,278 |
| | 2,576,332 |
|
| Real estate securities, available for sale, at fair value | 179,572 |
| | 252,824 |
|
| Real estate, net | 1,226,988 |
| | 1,484,796 |
|
| Investments in unconsolidated ventures ($8,764 and $10,283 at fair value, respectively) | 585,994 |
| | 595,305 |
|
| Receivables, net | 41,569 |
| | 46,456 |
|
| Deferred leasing costs and intangible assets, net | 98,507 |
| | 112,762 |
|
| Assets held for sale | 270,680 |
| | 189,470 |
|
| Other assets | 62,643 |
| | 87,707 |
|
| Mortgage loans held in securitization trusts, at fair value | 1,822,991 |
| | 1,872,970 |
|
| Total assets | $ | 7,193,588 |
| | $ | 7,414,306 |
|
| Liabilities | | | |
| Securitization bonds payable, net | $ | 833,671 |
| | $ | 833,153 |
|
| Mortgage and other notes payable, net | 1,152,851 |
| | 1,256,112 |
|
| Credit facilities | 1,260,419 |
| | 1,099,233 |
|
| Due to related party (Note 10) | 10,766 |
| | 11,016 |
|
| Accrued and other liabilities | 145,956 |
| | 140,424 |
|
| Intangible liabilities, net | 10,548 |
| | 22,149 |
|
| Liabilities related to assets held for sale | 10,842 |
| | 294 |
|
| Escrow deposits payable | 49,499 |
| | 74,497 |
|
| Dividends payable | 13,147 |
| | 13,164 |
|
| Mortgage obligations issued by securitization trusts, at fair value | 1,732,388 |
| | 1,762,914 |
|
| Total liabilities | 5,220,087 |
| | 5,212,956 |
|
| Commitments and contingencies (Note 16) |
| |
|
| Equity | | | |
| Stockholders’ equity | | | |
| Preferred stock, $0.01 par value, 50,000,000 shares authorized, no shares issued and outstanding as of March 31, 2020 and 2019 | — |
| | — |
|
| Common stock, $0.01 par value per share | | | |
| Class A, 950,000,000 shares authorized, 128,366,427 and 128,538,703 shares issued and outstanding as of March 31, 2020 and December 31, 2019, respectively | 1,284 |
| | 1,285 |
|
| Additional paid-in capital | 2,907,796 |
| | 2,909,181 |
|
| Accumulated deficit | (959,695 | ) | | (819,738 | ) |
| Accumulated other comprehensive income (loss) | (42,705 | ) | | 28,294 |
|
| Total stockholders’ equity | 1,906,680 |
| | 2,119,022 |
|
| Noncontrolling interests in investment entities | 21,141 |
| | 31,631 |
|
| Noncontrolling interests in the Operating Partnership | 45,680 |
| | 50,697 |
|
| Total equity | 1,973,501 |
| | 2,201,350 |
|
| Total liabilities and equity | $ | 7,193,588 |
| | $ | 7,414,306 |
|
_________________________________________
| |
| (1) | Net of $52.2 million and $272.6 million of allowance for loan losses at March 31, 2020 and December 31, 2019, respectively. See Note 3, “Loans and Preferred Equity Held for Investments, net and Loans Held for Sale” for further details. |
The accompanying notes are an integral part of these consolidated financial statements.
COLONY CREDIT REAL ESTATE, INC.
CONSOLIDATED BALANCE SHEETS
(in Thousands)
The following table presents assets and liabilities of securitization trusts and certain real estate properties that have noncontrolling interests as variable interest entities for which the Company is determined to be the primary beneficiary.
|
| | | | | | | |
| | March 31, 2020 (Unaudited) | | December 31, 2019 |
| Assets | | | |
| Cash and cash equivalents | $ | 11,965 |
| | $ | 14,109 |
|
| Restricted cash | 15,737 |
| | 25,646 |
|
| Loans and preferred equity held for investment, net | 994,306 |
| | 1,016,781 |
|
| Real estate, net | 178,123 |
| | 381,608 |
|
| Receivables, net | 20,668 |
| | 26,044 |
|
| Deferred leasing costs and intangible assets, net | 26,638 |
| | 36,323 |
|
| Assets held for sale | 210,434 |
| | 102,397 |
|
| Other assets | 24,867 |
| | 26,463 |
|
| Mortgage loans held in securitization trusts, at fair value | 1,822,991 |
| | 1,872,970 |
|
| Total assets | $ | 3,305,729 |
| | $ | 3,502,341 |
|
| Liabilities | | | |
| Securitization bonds payable, net | $ | 833,671 |
| | $ | 833,153 |
|
| Mortgage and other notes payable, net | 297,286 |
| | 341,480 |
|
| Credit facilities | 24,847 |
| | 23,882 |
|
| Accrued and other liabilities | 100,764 |
| | 124,969 |
|
| Intangible liabilities, net | 8,751 |
| | 20,230 |
|
| Liabilities related to assets held for sale | 10,842 |
| | 251 |
|
| Escrow deposits payable | 4,128 |
| | 10,485 |
|
| Mortgage obligations issued by securitization trusts, at fair value | 1,732,388 |
| | 1,762,914 |
|
| Total liabilities | $ | 3,012,677 |
| | $ | 3,117,364 |
|
The accompanying notes are an integral part of these consolidated financial statements.
COLONY CREDIT REAL ESTATE, INC.
CONSOLIDATED STATEMENTS OF OPERATIONS
(in Thousands, Except Per Share Data)
(Unaudited)
|
| | | | | | | | |
| | | Three Months Ended March 31, |
| | | 2020 | | 2019 |
| Net interest income | | | | |
| Interest income | | $ | 46,104 |
| | $ | 38,409 |
|
| Interest expense | | (20,744 | ) | | (19,292 | ) |
| Interest income on mortgage loans held in securitization trusts | | 20,555 |
| | 38,476 |
|
| Interest expense on mortgage obligations issued by securitization trusts | | (18,059 | ) | | (35,635 | ) |
| Net interest income | | 27,856 |
| | 21,958 |
|
| | | | | |
| Property and other income | | | | |
| Property operating income | | 52,513 |
| | 63,134 |
|
| Other income | | 9,409 |
| | 177 |
|
| Total property and other income | | 61,922 |
| | 63,311 |
|
| | | | | |
| Expenses | | | | |
| Management fee expense | | 7,946 |
| | 11,358 |
|
| Property operating expense | | 22,531 |
| | 28,180 |
|
| Transaction, investment and servicing expense | | 3,134 |
| | 529 |
|
| Interest expense on real estate | | 13,078 |
| | 13,607 |
|
| Depreciation and amortization | | 17,976 |
| | 27,662 |
|
| Provision for loan losses | | 69,932 |
| | — |
|
| Impairment of operating real estate | | 4,126 |
| | — |
|
| Administrative expense (including $342 and $1,843 of equity-based compensation expense, respectively) | | 7,038 |
| | 6,653 |
|
| Total expenses | | 145,761 |
| | 87,989 |
|
| | | | | |
| Other income (loss) | | | | |
| Unrealized gain (loss) on mortgage loans and obligations held in securitization trusts, net | | (19,452 | ) | | 1,029 |
|
| Realized gain on mortgage loans and obligations held in securitization trusts, net | | — |
| | 48 |
|
| Other loss, net | | (20,162 | ) | | (5,079 | ) |
| Loss before equity in earnings of unconsolidated ventures and income taxes | | (95,597 | ) | | (6,722 | ) |
| Equity in earnings of unconsolidated ventures | | 17,167 |
| | 21,310 |
|
| Income tax benefit (expense) | | (1,711 | ) | | 369 |
|
| Net income (loss) | | (80,141 | ) | | 14,957 |
|
| Net (income) loss attributable to noncontrolling interests: | | | | |
| Investment entities | | (523 | ) | | 298 |
|
| Operating Partnership | | 1,892 |
| | (347 | ) |
| Net income (loss) attributable to Colony Credit Real Estate, Inc. common stockholders | | $ | (78,772 | ) | | $ | 14,908 |
|
| | | | | |
Net income (loss) per common share - basic and diluted (Note 18) | | $ | (0.62 | ) | | $ | 0.11 |
|
| | | | | |
Weighted average shares of common stock outstanding - basic and diluted (Note 18) | | 128,487 |
| | 127,943 |
|
The accompanying notes are an integral part of these consolidated financial statements.
COLONY CREDIT REAL ESTATE, INC.
CONSOLIDATED STATEMENTS OF COMPREHENSIVE INCOME (LOSS)
(in Thousands)
(Unaudited)
|
| | | | | | | | |
| | | Three Months Ended March 31, |
| | | 2020 | | 2019 |
| Net income (loss) | | $ | (80,141 | ) | | $ | 14,957 |
|
| Other comprehensive income (loss) | |
|
| | |
| Unrealized gain (loss) on real estate securities, available for sale | | (75,029 | ) | | 9,758 |
|
| Change in fair value of net investment hedges | | 21,764 |
| | 7,395 |
|
| Foreign currency translation loss | | (19,436 | ) | | (3,310 | ) |
| Total other comprehensive income (loss) | | (72,701 | ) | | 13,843 |
|
| Comprehensive income (loss) | | (152,842 | ) | | 28,800 |
|
| Comprehensive (income) loss attributable to noncontrolling interests: | | | | |
| Investment entities | | (523 | ) | | 298 |
|
| Operating Partnership | | 3,594 |
| | (671 | ) |
| Comprehensive income (loss) attributable to common stockholders | | $ | (149,771 | ) | | $ | 28,427 |
|
The accompanying notes are an integral part of these consolidated financial statements.
COLONY CREDIT REAL ESTATE, INC.
CONSOLIDATED STATEMENTS OF EQUITY
(in Thousands)
(Unaudited)
|
| | | | | | | | | | | | | | | | | | | | | | | | | | | | | | | | | | | | | | | | | | | |
| | Common Stock | | Additional
Paid-in
Capital | | Retained
Earnings
(Accumulated
Deficit) | | Accumulated
Other
Comprehensive
Income | | Total
Stockholders’
Equity | | | Noncontrolling Interests in Investment Entities | | Noncontrolling Interests in the Operating Partnership | | Total
Equity | |
| | Class A | | Class B-3 | |
| | Shares | | Amount | | Shares | | Amount | |
| Balance as of December 31, 2018 | 83,410 |
| | $ | 834 |
| | 44,399 |
| | $ | 444 |
| | $ | 2,899,353 |
| | $ | (193,327 | ) | | $ | (399 | ) | | $ | 2,706,905 |
| | | $ | 72,683 |
| | $ | 65,614 |
| | $ | 2,845,202 |
| |
| Contributions | — |
| | — |
| | — |
| | — |
| | — |
| | — |
| | — |
| | — |
| | | 24 |
| | — |
| | 24 |
| |
| Distributions | — |
| | — |
| | — |
| | — |
| | — |
| | — |
| | — |
| | — |
| | | (394 | ) | | — |
| | (394 | ) | |
| Adjustments related to the Combination | — |
| | — |
| | — |
| | — |
| | — |
| | — |
| | — |
| | — |
| | | — |
| | — |
| | — |
| |
| Conversion of Class B-3 common stock to Class A common stock | 44,399 |
| | 444 |
| | (44,399 | ) | | (444 | ) | | — |
| | — |
| | — |
| | — |
| | | — |
| | — |
| | — |
| |
| Issuance and amortization of equity-based compensation | 800 |
| | 8 |
| | — |
| | — |
| | 1,835 |
| | — |
| | — |
| | 1,843 |
| | | — |
| | — |
| | 1,843 |
| |
| Other comprehensive loss | — |
| | — |
| | — |
| | — |
| | — |
| | — |
| | 13,519 |
| | 13,519 |
| | | — |
| | 324 |
| | 13,843 |
| |
| Dividends and distributions declared ($0.44 per Class A share and $0.15 per Class B-3 share) | — |
| | — |
| | — |
| | — |
| | — |
| | (55,726 | ) | | — |
| | (55,726 | ) | | | — |
| | (1,340 | ) | | (57,066 | ) | |
| Shares canceled for tax withholding on vested stock awards | (96 | ) | | (1 | ) | | — |
| | — |
| | (1,496 | ) | | — |
| | — |
| | (1,497 | ) | | | — |
| | — |
| | (1,497 | ) | |
| Reallocation of equity | — |
| | — |
| | — |
| | — |
| | (23 | ) | | — |
| | — |
| | (23 | ) | | | — |
| | 23 |
| | — |
| |
| Net income (loss) | — |
| | — |
| | — |
| | — |
| | — |
| | 14,908 |
| | — |
| | 14,908 |
| | | (298 | ) | | 347 |
| | 14,957 |
| |
| Balance as of March 31, 2019 | 128,513 |
| | $ | 1,285 |
| | — |
| | $ | — |
| | $ | 2,899,669 |
| | $ | (234,145 | ) | | $ | 13,120 |
| | $ | 2,679,929 |
| | | $ | 72,015 |
| | $ | 64,968 |
| | $ | 2,816,912 |
| |
| | | | | | | | | | | | | | | | | | | | | | | | |
| Balance as of December 31, 2019 | 128,539 |
| | $ | 1,285 |
| | — |
| | $ | — |
| | $ | 2,909,181 |
| | $ | (819,738 | ) | | $ | 28,294 |
| | $ | 2,119,022 |
| | | $ | 31,631 |
| | $ | 50,697 |
| | $ | 2,201,350 |
| |
| Contributions | — |
| | — |
| | — |
| | — |
| | — |
| | — |
| | — |
| | — |
| | | — |
| | — |
| | — |
| |
| Distributions | — |
| | — |
| | — |
| | — |
| | — |
| | — |
| | — |
| | — |
| | | (11,013 | ) | | — |
| | (11,013 | ) | |
| Conversion of Class B-3 common stock to Class A common stock | — |
| | — |
| | — |
| | — |
| | — |
| | — |
| | — |
| | — |
| | | — |
| | — |
| | — |
| |
| Issuance and amortization of equity-based compensation | — |
| | — |
| | — |
| | — |
| | 342 |
| | — |
| | — |
| | 342 |
| | | — |
| | — |
| | 342 |
| |
| Other comprehensive income | — |
| | — |
| | — |
| | — |
| | — |
| | — |
| | (70,999 | ) | | (70,999 | ) | | | — |
| | (1,702 | ) | | (72,701 | ) | |
| Dividends and distributions declared ($0.30 per share) | — |
| | — |
| | — |
| | — |
| | — |
| | (38,541 | ) | | — |
| | (38,541 | ) | | | — |
| | (922 | ) | | (39,463 | ) | |
| Shares canceled for tax withholding on vested stock awards | (173 | ) | | (1 | ) | | — |
| | — |
| | (1,686 | ) | | — |
| | — |
| | (1,687 | ) | | | — |
| | — |
| | (1,687 | ) | |
| Reallocation of equity | — |
| | — |
| | — |
| | — |
| | (41 | ) | | — |
| | — |
| | (41 | ) | | | — |
| | 41 |
| | — |
| |
| Effect of CECL adoption (see Note 2) | — |
| | — |
| | — |
| | — |
| | — |
| | (22,644 | ) | | — |
| | (22,644 | ) | | | — |
| | (542 | ) | | (23,186 | ) | |
| Net income (loss) | — |
| | — |
| | — |
| | — |
| | — |
| | (78,772 | ) | | — |
| | (78,772 | ) | | | 523 |
| | (1,892 | ) | | (80,141 | ) | |
| Balance as of March 31, 2020 | 128,366 |
| | $ | 1,284 |
| | — |
| | $ | — |
| | $ | 2,907,796 |
| | $ | (959,695 | ) | | $ | (42,705 | ) | | $ | 1,906,680 |
| | | $ | 21,141 |
| | $ | 45,680 |
| | $ | 1,973,501 |
| |
The accompanying notes are an integral part of these consolidated financial statements.
COLONY CREDIT REAL ESTATE, INC.
CONSOLIDATED STATEMENTS OF CASH FLOWS
(in Thousands)
(Unaudited)
|
| | | | | | | |
| | Three Months Ended March 31, |
| | 2020 | | 2019 |
| Cash flows from operating activities: | | | |
| Net income (loss) | $ | (80,141 | ) | | $ | 14,957 |
|
| Adjustments to reconcile net income (loss) to net cash provided by operating activities: | | | |
| Equity in earnings of unconsolidated ventures | (17,167 | ) | | (21,310 | ) |
| Depreciation and amortization | 17,976 |
| | 27,662 |
|
| Straight-line rental income | (1,426 | ) | | (1,732 | ) |
| Amortization of above/below market lease values, net | (404 | ) | | (612 | ) |
| Amortization of premium/accretion of discount and fees on investments and borrowings, net | (3,992 | ) | | (2,582 | ) |
| Amortization of deferred financing costs | 3,582 |
| | 2,029 |
|
| Amortization of right-of-use lease assets and operating lease liabilities | 24 |
| | 25 |
|
| Paid-in-kind interest added to loan principal, net of interest received | (3,171 | ) | | (3,258 | ) |
| Distributions of cumulative earnings from unconsolidated ventures | 9,326 |
| | 18,492 |
|
| Unrealized gain on mortgage loans and obligations held in securitization trusts, net | 19,452 |
| | (1,029 | ) |
| Realized (gain) loss on mortgage loans and obligations held in securitization trusts, net | — |
| | (48 | ) |
| Provision for loan losses | 69,932 |
| | — |
|
| Impairment of operating real estate | 4,126 |
| | — |
|
| Amortization of equity-based compensation | 342 |
| | 1,843 |
|
| Mortgage notes above/below market value amortization | (255 | ) | | 87 |
|
| Deferred income tax (benefit) expense | (788 | ) | | (2,693 | ) |
| Other loss | 20,452 |
| | — |
|
| Changes in assets and liabilities: | | | |
| Receivables, net | 6,511 |
| | (4,200 | ) |
| Deferred costs and other assets | 16,680 |
| | 4,778 |
|
| Due to related party | (250 | ) | | (1,169 | ) |
| Other liabilities | (3,605 | ) | | 6,438 |
|
| Net cash provided by operating activities | 57,204 |
| | 37,678 |
|
| Cash flows from investing activities: | | | |
| Acquisition, origination and funding of loans and preferred equity held for investment, net | (37,452 | ) | | (241,693 | ) |
| Repayment on loans and preferred equity held for investment | 160,069 |
| | 172,686 |
|
| Repayment on loans held for sale | 450 |
| | — |
|
| Proceeds from sale of real estate | 160,830 |
| | — |
|
| Acquisition of and additions to real estate, related intangibles and leasing commissions | (11,325 | ) | | (6,242 | ) |
| Investments in unconsolidated ventures | (16,748 | ) | | (5,182 | ) |
| Proceeds from sale of investments in unconsolidated ventures | 1,795 |
| | 34,475 |
|
| Distributions in excess of cumulative earnings from unconsolidated ventures | 16,528 |
| | 65,836 |
|
| Repayment of principal in mortgage loans held in securitization trusts | 6,577 |
| | — |
|
| Net receipts on settlement of derivative instruments | 19,637 |
| | 1,638 |
|
| Deposit on investments | — |
| | (352 | ) |
| Change in escrow deposits | (24,998 | ) | | (2,322 | ) |
| Net cash provided by investing activities | 275,363 |
| | 18,844 |
|
| Cash flows from financing activities: | | | |
| Distributions paid on common stock | (38,558 | ) | | (55,629 | ) |
| Distributions paid on common stock to noncontrolling interests | (922 | ) | | (1,340 | ) |
| Shares canceled for tax withholding on vested stock awards | (1,688 | ) | | — |
|
| Borrowings from mortgage notes | 2,280 |
| | 22,174 |
|
| Repayment of mortgage notes | (76,585 | ) | | (1,509 | ) |
| Borrowings from credit facilities | 249,991 |
| | 714,615 |
|
| Repayment of credit facilities | (88,804 | ) | | (695,260 | ) |
| Repayment of securitization bonds | — |
| | (27,709 | ) |
| Repayment of mortgage obligations issued by securitization trusts | (6,577 | ) | | — |
|
| Payment of deferred financing costs | (1,600 | ) | | (1,593 | ) |
| Contributions from noncontrolling interests | — |
| | 24 |
|
| Distributions to noncontrolling interests | (11,013 | ) | | (394 | ) |
| Net cash provided by (used in) financing activities | 26,524 |
| | (46,621 | ) |
| Effect of exchange rates on cash, cash equivalents and restricted cash | (1,409 | ) | | (7 | ) |
| Net increase (decrease) in cash, cash equivalents and restricted cash | 357,682 |
| | 9,894 |
|
| Cash, cash equivalents and restricted cash - beginning of period | 195,684 |
| | 187,463 |
|
| Cash, cash equivalents and restricted cash - end of period | $ | 553,366 |
| | $ | 197,357 |
|
The accompanying notes are an integral part of these consolidated financial statements.
COLONY CREDIT REAL ESTATE, INC.
CONSOLIDATED STATEMENTS OF CASH FLOWS (Continued)
(in Thousands)
|
| | | | | | | |
| | Three Months Ended March 31, |
| | 2020 | | 2019 |
| Reconciliation of cash, cash equivalents, and restricted cash to consolidated balance sheets | | | |
| Beginning of the period | | | |
| Cash and cash equivalents | $ | 69,619 |
| | $ | 77,317 |
|
| Restricted cash | 126,065 |
| | 110,146 |
|
| Total cash, cash equivalents and restricted cash, beginning of period | $ | 195,684 |
| | $ | 187,463 |
|
| | | | |
| End of the period | | | |
| Cash and cash equivalents | $ | 393,845 |
| | $ | 89,916 |
|
| Restricted cash | 159,521 |
| | 107,441 |
|
| Total cash, cash equivalents and restricted cash, end of period | $ | 553,366 |
| | $ | 197,357 |
|
|
| | | | | |
| | Three Months Ended March 31, |
| | 2020 | | 2019 |
| Supplemental disclosure of non-cash investing and financing activities: | | | |
| Consolidation of securitization trust (VIE asset/liability additions) | — |
| | 24,393 |
|
| Accrual of distribution payable | (17 | ) | | 19,083 |
|
| Foreclosure of loans held for investment, net of provision for loan losses | — |
| | 105,437 |
|
| Right-of-use lease assets and operating lease liabilities | (730 | ) | | 16,959 |
|
| PE Investments sale proceeds receivable | — |
| | 14,453 |
|
| Conversion of Class B-3 common stock to Class A common stock | — |
| | 444 |
|
| Due to Manager for share repurchases | — |
| | 1,497 |
|
The accompanying notes are an integral part of these consolidated financial statements.
COLONY CREDIT REAL ESTATE, INC.
NOTES TO CONSOLIDATED FINANCIAL STATEMENTS
(Unaudited)
| |
| 1. | Business and Organization |
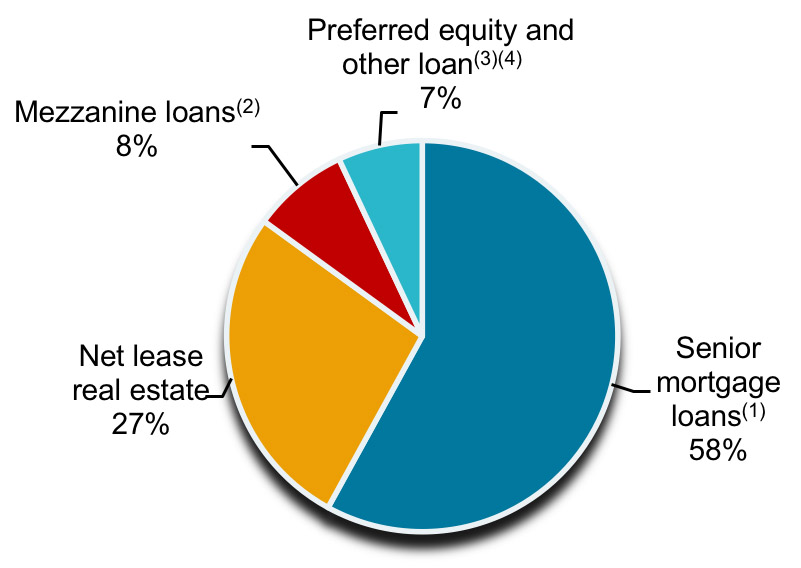
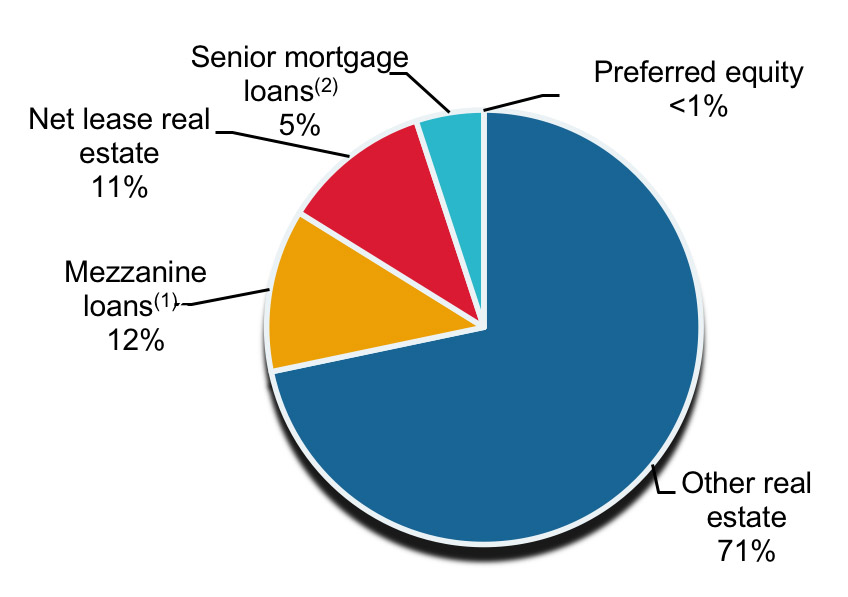
Colony Credit Real Estate, Inc. (together with its consolidated subsidiaries, the “Company”) is a commercial real estate (“CRE”) credit real estate investment trust (“REIT”) focused on originating, acquiring, financing and managing a diversified portfolio consisting primarily of CRE senior mortgage loans, mezzanine loans, preferred equity, debt securities and net leased properties predominantly in the United States. CRE debt investments include senior mortgage loans, mezzanine loans, preferred equity, and participations in such loans and preferred equity interests. CRE debt securities primarily consist of commercial mortgage-backed securities (“CMBS”) (including “B-pieces” of a CMBS securitization pool) or CRE collateralized loan obligations (“CLOs”) (including the junior tranches thereof, collateralized by pools of CRE debt investments). Net leased properties consist of CRE properties with long-term leases to tenants on a net-lease basis, where such tenants generally will be responsible for property operating expenses such as insurance, utilities, maintenance capital expenditures and real estate taxes.
The Company was organized in the state of Maryland on August 23, 2017. On January 31, 2018, the Company completed the transactions contemplated by that certain Master Combination Agreement, dated as of August 25, 2017, as amended and restated on November 20, 2017 (the “Combination Agreement,” as further discussed below). The Company elected to be taxed as a REIT under the Internal Revenue Code of 1986, as amended (the “Code”), beginning with its taxable year ended December 31, 2018. Effective June 25, 2018, the Company changed its name from Colony NorthStar Credit Real Estate, Inc. to Colony Credit Real Estate, Inc. Also on June 25, 2018, Colony NorthStar, Inc. changed its name to Colony Capital, Inc. The Company conducts all of its activities and holds substantially all of its assets and liabilities through its operating subsidiary, Credit RE Operating Company, LLC (the “Operating Partnership” or “OP”). At March 31, 2020, the Company owned 97.7% of the OP, as its sole managing member. The remaining 2.3% is owned by an affiliate of the Company as noncontrolling interests.
The Company is externally managed and has 0 employees. The Company is managed by CLNC Manager, LLC (the “Manager”), a Delaware limited liability company and a wholly-owned and indirect subsidiary of Colony Capital Operating Company, LLC (“CLNY OP”), a Delaware limited liability company and the operating company of Colony Capital. Colony Capital manages capital on behalf of its stockholders, as well as institutional and retail investors in private funds, non-traded and traded REITs and registered investment companies.
The Combination
Pursuant to the Combination Agreement, (i) CLNY OP contributed and conveyed to the Company a select portfolio of assets and liabilities (the “CLNY OP Contributed Portfolio”) of CLNY OP (the “CLNY OP Contribution”), (ii) NRF RED REIT Corp., a Maryland corporation and indirect subsidiary of CLNY OP (“RED REIT”) contributed and conveyed to the OP a select portfolio of assets and liabilities (the “RED REIT Contributed Portfolio” and, together with the CLNY OP Contributed Portfolio, the “CLNY Contributed Portfolio”) of RED REIT (the “RED REIT Contribution” and, together with the CLNY OP Contribution, the “CLNY Contributions”), (iii) NorthStar Real Estate Income Trust, Inc. (“NorthStar I”), a publicly registered non-traded REIT sponsored and managed by a subsidiary of Colony Capital, merged with and into the Company, with the Company surviving the merger (the “NorthStar I Merger”), (iv) NorthStar Real Estate Income II, Inc. (“NorthStar II”), a publicly registered non-traded REIT sponsored and managed by a subsidiary of Colony Capital, merged with and into the Company, with the Company surviving the merger (the “NorthStar II Merger” and, together with the NorthStar I Merger, the “Mergers”), and (v) immediately following the Mergers, the Company contributed and conveyed to the OP the CLNY OP Contributed Portfolio and the equity interests of each of NorthStar Real Estate Income Trust Operating Partnership, LP, a Delaware limited partnership and the operating partnership of NorthStar I, and NorthStar Real Estate Income Operating Partnership II, LP, a Delaware limited partnership and the operating partnership of NorthStar II, then-owned by the Company in exchange for units of membership interest in the OP (the “Company Contribution” and, collectively with the Mergers and the CLNY Contributions, the “Combination”).
On January 18, 2018, the Combination was approved by the stockholders of NorthStar I and NorthStar II. The Combination closed on January 31, 2018 (the “Closing Date”) and the Company’s Class A common stock, par value $0.01 per share (the “Class A common stock”), began trading on the New York Stock Exchange (“NYSE”) on February 1, 2018 under the symbol “CLNC.”
The Combination is accounted for under the acquisition method for business combinations pursuant to Accounting Standards Codification (“ASC”) Topic 805, Business Combinations, with the Company as the accounting acquirer.
COLONY CREDIT REAL ESTATE, INC.
NOTES TO CONSOLIDATED FINANCIAL STATEMENTS (Continued)
(Unaudited)
Segment Realignment
During the third quarter of 2019, the Company realigned the business and reportable segment information to reflect how the Chief Operating Decision Makers (“CODM”) regularly review and manage the business. Refer to Note 17, “Segment Reporting” for further detail.
Impact of COVID-19
At the time of preparation of the first quarter 2020 financial statements, the world is facing a global pandemic, the coronavirus disease 2019, or COVID-19. Efforts to address the pandemic, such as social distancing, closures or reduced capacity of retail and service outlets, hotels, factories and public venues, often mandated by governments, are having a significant impact on the global economy and financial markets across major industries, including many sectors of real estate. Specifically, the Company's loans and preferred equity held for investment and real estate investments in the hospitality and retail sectors have experienced or anticipate a myriad of challenges, including, but not limited to: significant declines in operating cash flows at the Company’s retail and hospitality properties which in turn affect their ability to meet debt service and covenant requirements on investment-level debt (non-recourse to the Company); flexible lease payment terms sought by tenants; potential payment defaults on the Company's loans and preferred equity held for investment; and a distressed market affecting real estate values in general. As the timing of many of the closures and ensuing economic turmoil did not occur until late in the first quarter of 2020, the effects of COVID-19 on the Company's business were not material and adverse in the first quarter of 2020.
However, the Company anticipates more pronounced and material effects on the Company’s financial condition and results of operations in future periods, beginning with the second quarter of 2020.
The sharp decline and volatility in equity and debt markets, and the challenges faced by the Company as a result of the economic fallout from COVID-19 have affected valuation of the Company’s financial assets, carried at fair value, and also represent indicators of potential impairment on certain loans and preferred equity held for investment and held for sale at the end of the first quarter of 2020. The Company’s consideration and assessment of impairment is discussed further in Note 3, “Loans and Preferred Equity Held for Investment, net and Loans Held for Sale” and Note 14, “Fair Value”.
If a general economic downturn resulting from efforts to contain COVID-19 persists, it could have a prolonged material and negative impact on the Company’s financial condition and results of operations. At this time, as the extent and duration of the increasingly broad effects of COVID-19 on the global economy remain unclear, it is difficult for the Company to assess and estimate the impact on the Company's results of operations with any meaningful precision. Accordingly, any estimates of the effects of COVID-19 as reflected and/or discussed in these financial statements are based upon the Company's best estimates using information known to the Company at this time, and such estimates may change in the near term, the effects of which could be material.
| |
| 2. | Summary of Significant Accounting Policies |
The significant accounting policies of the Company are described below. The accounting policies of the Company’s unconsolidated ventures are substantially similar to those of the Company.
Basis of Presentation
The accompanying unaudited interim financial statements have been prepared in accordance with the instructions to Form 10-Q and Article 10 of Regulation S-X. Accordingly, they do not include all information and footnotes required by accounting principles generally accepted in the United States of America (“U.S. GAAP”) for complete financial statements. These statements reflect all normal and recurring adjustments which, in the opinion of management, are necessary to present fairly the financial position, results of operations and cash flows of the Company for the interim periods presented. However, the results of operations for the interim period presented are not necessarily indicative of the results that may be expected for the year ending December 31, 2020, or for any other future period. These interim financial statements should be read in conjunction with the audited consolidated financial statements and notes thereto included in, or presented as exhibits to, the Company’s Annual Report on Form 10-K for the fiscal year ended December 31, 2019.
The Combination
The Combination is accounted for under the acquisition method for business combinations pursuant to ASC Topic 805, Business Combinations. In the Combination, the Company was considered to be the accounting acquirer so all of its assets and liabilities immediately prior to the closing of the Combination are reflected at their historical carrying values. The consideration transferred by the Company established a new accounting basis for the assets acquired, liabilities assumed and noncontrolling interests of NorthStar I and NorthStar II, which were measured at their respective fair values on the Closing Date.
COLONY CREDIT REAL ESTATE, INC.
NOTES TO CONSOLIDATED FINANCIAL STATEMENTS (Continued)
(Unaudited)
Use of Estimates
The preparation of consolidated financial statements in conformity with U.S. GAAP requires management to make estimates and assumptions that affect the amounts reported in the consolidated financial statements and accompanying notes. Actual results could differ from those estimates and assumptions.
Principles of Consolidation
The accompanying consolidated financial statements include the accounts of the Company and its controlled subsidiaries. The portions of the equity, net income and other comprehensive income of consolidated subsidiaries that are not attributable to the parent are presented separately as amounts attributable to noncontrolling interests in the consolidated financial statements.
The Company consolidates entities in which it has a controlling financial interest by first considering if an entity meets the definition of a variable interest entity (“VIE”) for which the Company is deemed to be the primary beneficiary, or if the Company has the power to control an entity through a majority of voting interest or through other arrangements.
Variable Interest Entities
Variable Interest Entities—A VIE is an entity that either (i) lacks sufficient equity to finance its activities without additional subordinated financial support from other parties; (ii) whose equity holders lack the characteristics of a controlling financial interest; or (iii) is established with non-substantive voting rights. A VIE is consolidated by its primary beneficiary, which is defined as the party who has a controlling financial interest in the VIE through (a) power to direct the activities of the VIE that most significantly affect the VIE’s economic performance, and (b) obligation to absorb losses or right to receive benefits of the VIE that could be significant to the VIE. The Company also considers interests held by its related parties, including de facto agents. The Company assesses whether it is a member of a related party group that collectively meets the power and benefits criteria and, if so, whether the Company is most closely associated with the VIE. In performing the related party analysis, the Company considers both qualitative and quantitative factors, including, but not limited to: the amount and characteristics of its investment relative to the related party; the Company’s and the related party’s ability to control or significantly influence key decisions of the VIE including consideration of involvement by de facto agents; the obligation or likelihood for the Company or the related party to fund operating losses of the VIE; and the similarity and significance of the VIE’s business activities to those of the Company and the related party. The determination of whether an entity is a VIE, and whether the Company is the primary beneficiary, may involve significant judgment, including the determination of which activities most significantly affect the entities’ performance, and estimates about the current and future fair values and performance of assets held by the VIE.
Voting Interest Entities—Unlike VIEs, voting interest entities have sufficient equity to finance their activities and equity investors exhibit the characteristics of a controlling financial interest through their voting rights. The Company consolidates such entities when it has the power to control these entities through ownership of a majority of the entities’ voting interests or through other arrangements.
At each reporting period, the Company reassesses whether changes in facts and circumstances cause a change in the status of an entity as a VIE or voting interest entity, and/or a change in the Company’s consolidation assessment.
Changes in consolidation status are applied prospectively. An entity may be consolidated as a result of this reassessment, in which case, the assets, liabilities and noncontrolling interest in the entity are recorded at fair value upon initial consolidation. Any existing equity interest held by the Company in the entity prior to the Company obtaining control will be remeasured at fair value, which may result in a gain or loss recognized upon initial consolidation. However, if the consolidation represents an asset acquisition of a voting interest entity, the Company’s existing interest in the acquired assets, if any, is not remeasured to fair value but continues to be carried at historical cost. The Company may also deconsolidate a subsidiary as a result of this reassessment, which may result in a gain or loss recognized upon deconsolidation depending on the carrying values of deconsolidated assets and liabilities compared to the fair value of any interests retained.
As of March 31, 2020, the Company has identified certain consolidated and unconsolidated VIEs. Assets of each of the VIEs, other than the OP, may only be used to settle obligations of the respective VIE. Creditors of each of the VIEs have no recourse to the general credit of the Company.
Consolidated VIEs
The Company’s operating subsidiary, the OP, is a limited liability company that has governing provisions that are the functional equivalent of a limited partnership. The Company holds the majority of membership interest in the OP, is the managing member of the OP and exercises full responsibility, discretion and control over the day-to-day management of the OP. The noncontrolling
COLONY CREDIT REAL ESTATE, INC.
NOTES TO CONSOLIDATED FINANCIAL STATEMENTS (Continued)
(Unaudited)
interests in the OP do not have substantive liquidation rights, substantive kick-out rights without cause, or substantive participating rights that could be exercised by a simple majority of noncontrolling interest members (including by such a member unilaterally). The absence of such rights, which represent voting rights in a limited partnership equivalent structure, would render the OP to be a VIE. The Company, as managing member, has the power to direct the core activities of the OP that most significantly affect the OP’s performance, and through its majority interest in the OP, has both the right to receive benefits from and the obligation to absorb losses of the OP. Accordingly, the Company is the primary beneficiary of the OP and consolidates the OP. As the Company conducts its business and holds its assets and liabilities through the OP, the total assets and liabilities of the OP represent substantially all of the total consolidated assets and liabilities of the Company.
Other consolidated VIEs include the Investing VIEs (as defined and discussed below) and certain operating real estate properties that have noncontrolling interests. The noncontrolling interests in the operating real estate properties represent third party joint venture partners with ownership ranging from 3.5% to 20.0%. These noncontrolling interests do not have substantive kick-out nor participating rights.
Investing VIEs
The Company’s investments in securitization financing entities (“Investing VIEs”) include subordinate first-loss tranches of securitization trusts, which represent interests in such VIEs. Investing VIEs are structured as pass through entities that receive principal and interest payments from the underlying debt collateral assets and distribute those payments to the securitization trust’s certificate holders, including the most subordinate tranches of the securitization trust. Generally, a securitization trust designates the most junior subordinate tranche outstanding as the controlling class, which entitles the holder of the controlling class to unilaterally appoint and remove the special servicer for the trust, and as such may qualify as the primary beneficiary of the trust.
If it is determined that the Company is the primary beneficiary of an Investing VIE as a result of acquiring the subordinate first-loss tranches of the securitization trust, the Company would consolidate the assets, liabilities, income and expenses of the entire Investing VIE. The assets held by an Investing VIE are restricted and can only be used to fulfill its own obligations. The obligations of an Investing VIE have neither any recourse to the general credit of the Company as the consolidating parent entity of an Investing VIE, nor to any of the Company’s other consolidated entities.
As of March 31, 2020, the Company held subordinate tranches of securitization trusts in 2 Investing VIEs for which the Company has determined it is the primary beneficiary because it has the power to direct the activities that most significantly impact the economic performance of the securitization trusts. The Company’s subordinate tranches of the securitization trusts, which represent the retained interest and related interest income, are eliminated in consolidation. As a result, all of the assets, liabilities (obligations to the certificate holders of the securitization trusts, less the Company’s retained interest from the subordinate tranches of the securitization trusts), income and expenses of the Investing VIEs are presented in the consolidated financial statements of the Company although the Company legally owns the subordinate tranches of the securitization trusts only. Regardless of the presentation, the Company’s consolidated financial statements of operations ultimately reflect the net income attributable to its retained interest in the subordinate tranches of the securitization trusts. Refer to Note 5, “Real Estate Securities, Available for Sale” for further discussion.
The Company elected the fair value option for the initial recognition of the assets and liabilities of its consolidated Investing VIEs. Interest income and interest expense associated with the Investing VIEs are presented separately on the consolidated statements of operations, and the assets and liabilities of the Investing VIEs are separately presented as “Mortgage loans held in securitization trusts, at fair value” and “Mortgage obligations issued by securitization trusts, at fair value,” respectively, on the consolidated balance sheets. Refer to Note 14, “Fair Value” for further discussion.
The Company has adopted guidance issued by the Financial Accounting Standards Board (“FASB”), allowing the Company to measure both the financial assets and liabilities of a qualifying collateralized financing entity (“CFE”), such as its Investing VIEs, using the fair value of either the CFE’s financial assets or financial liabilities, whichever is more observable. A CFE is a VIE that holds financial assets, issues beneficial interests in those assets and has no more than nominal equity, and the beneficial interests have contractual recourse only to the related assets of the CFE. As the liabilities of the Company’s Investing VIEs are marketable securities with observable trade data, their fair value is more observable and is referenced to determine fair value of the assets of its Investing VIEs. Refer to Note 14, “Fair Value” for further discussion.
Unconsolidated VIEs
As of March 31, 2020, the Company identified unconsolidated VIEs related to its securities investments, indirect interests in real estate through real estate private equity funds (“PE Investments”) and CRE debt investments. Based on management’s analysis,
COLONY CREDIT REAL ESTATE, INC.
NOTES TO CONSOLIDATED FINANCIAL STATEMENTS (Continued)
(Unaudited)
the Company determined that it is not the primary beneficiary of the above VIEs. Accordingly, the VIEs are not consolidated in the Company’s financial statements as of March 31, 2020.
Assets of each of the VIEs may only be used to settle obligations of the respective VIE. Creditors of each of the VIEs have no recourse to the general credit of the Company.
The following table presents the Company’s classification, carrying value and maximum exposure of unconsolidated VIEs as of March 31, 2020 (dollars in thousands):
|
| | | | | | | | |
| | | Carrying Value | | Maximum Exposure to Loss |
| Real estate securities, available for sale | | $ | 179,572 |
| | $ | 238,080 |
|
| Investments in unconsolidated ventures | | 499,549 |
| | 531,730 |
|
| Loans and preferred equity held for investment, net | | 17,587 |
| | 17,587 |
|
| Total assets | | $ | 696,708 |
| | $ | 787,397 |
|
The Company did not provide financial support to the unconsolidated VIEs during the three months ended March 31, 2020. As of March 31, 2020, there were no explicit arrangements or implicit variable interests that could require the Company to provide financial support to the unconsolidated VIEs. The maximum exposure to loss of real estate securities, available for sale was determined as the amortized cost, which represents the purchase price of the investments adjusted by any unamortized premiums or discounts as of March 31, 2020. The maximum exposure to loss of investments in unconsolidated ventures and loans and preferred equity held for investment, net was determined as the carrying value plus any future funding commitments. Refer to Note 3, “Loans and Preferred Equity Held for Investment, net and Loans Held for Sale” and Note 16, “Commitments and Contingencies” for further discussion.
Noncontrolling Interests
Noncontrolling Interests in Investment Entities—This represents interests in consolidated investment entities held by third party joint venture partners and prior to the closing of the Combination, such interests held by private funds managed by Colony Capital. Allocation of net income or loss is generally based upon relative ownership interests held by equity owners in each investment entity, or based upon contractual arrangements that may provide for disproportionate allocation of economic returns among equity interests, including using a hypothetical liquidation at book value basis, where applicable and substantive.
Noncontrolling Interests in the Operating Partnership—This represents membership interests in the OP held by RED REIT. Noncontrolling interests in the OP are allocated a share of net income or loss in the OP based on their weighted average ownership interest in the OP during the period. Noncontrolling interests in the OP have the right to require the OP to redeem part or all of the membership units in the OP for cash based on the market value of an equivalent number of shares of Class A common stock at the time of redemption, or at the Company’s election as managing member of the OP, through the issuance of shares of Class A common stock on a 1-for-one basis. At the end of each reporting period, noncontrolling interests in the OP is adjusted to reflect their ownership percentage in the OP at the end of the period, through a reallocation between controlling and noncontrolling interests in the OP, as applicable.
Comprehensive Income (Loss)
The Company reports consolidated comprehensive income (loss) in separate statements following the consolidated statements of operations. Comprehensive income (loss) is defined as the change in equity resulting from net income (loss) and other comprehensive income (“OCI”). The components of OCI include unrealized gain (loss) on CRE debt securities available for sale for which the fair value option was not elected, gain (loss) on derivative instruments used in the Company’s risk management activities used for economic hedging purposes (“designated hedges”), and gain (loss) on foreign currency translation.
Fair Value Measurement
Fair value is based on an exit price, defined as the price that would be received to sell an asset or paid to transfer a liability in an orderly transaction between market participants. Where appropriate, the Company makes adjustments to estimated fair values to appropriately reflect counterparty credit risk as well as the Company’s own credit-worthiness.
The estimated fair value of financial assets and financial liabilities are categorized into a three-tier hierarchy, prioritized based on the level of transparency in inputs used in the valuation techniques, as follows:
Level 1—Quoted prices (unadjusted) in active markets for identical assets or liabilities.
COLONY CREDIT REAL ESTATE, INC.
NOTES TO CONSOLIDATED FINANCIAL STATEMENTS (Continued)
(Unaudited)
Level 2—Observable inputs other than Level 1 prices, such as quoted prices for similar assets or liabilities, quoted prices in non-active markets, or valuation techniques utilizing inputs that are derived principally from or corroborated by observable data directly or indirectly for substantially the full term of the financial instrument.
Level 3—At least one assumption or input is unobservable and it is significant to the fair value measurement, requiring significant management judgment or estimate.
Where the inputs used to measure the fair value of a financial instrument fall into different levels of the fair value hierarchy, the financial instrument is categorized within the hierarchy based on the lowest level of input that is significant to its fair value measurement.
Fair Value Option
The fair value option provides an option to elect fair value as an alternative measurement for selected financial instruments. Gains and losses on items for which the fair value option has been elected are reported in earnings. The fair value option may be elected only upon the occurrence of certain specified events, including when the Company enters into an eligible firm commitment, at initial recognition of the financial instrument, as well as upon a business combination or consolidation of a subsidiary. The election is irrevocable unless a new election event occurs.
The Company has elected the fair value option for PE Investments. The Company has also elected the fair value option to account for the eligible financial assets and liabilities of its consolidated Investing VIEs in order to mitigate potential accounting mismatches between the carrying value of the instruments and the related assets and liabilities to be consolidated. The Company has adopted the measurement alternative allowing the Company to measure both the financial assets and financial liabilities of a qualifying CFE it consolidates using the fair value of either the CFE’s financial assets or financial liabilities, whichever is more observable.
Business Combinations
Definition of a Business—The Company evaluates each purchase transaction to determine whether the acquired assets meet the definition of a business. If substantially all of the fair value of gross assets acquired is concentrated in a single identifiable asset or a group of similar identifiable assets, then the set of transferred assets and activities is not a business. If not, for an acquisition to be considered a business, it would have to include an input and a substantive process that together significantly contribute to the ability to create outputs (i.e., there is a continuation of revenue before and after the transaction). A substantive process is not ancillary or minor, cannot be replaced without significant costs, effort or delay or is otherwise considered unique or scarce. To qualify as a business without outputs, the acquired assets would require an organized workforce with the necessary skills, knowledge and experience that performs a substantive process.
Asset Acquisitions—For acquisitions that are not deemed to be businesses, the assets acquired are recognized based on their cost to the Company as the acquirer and no gain or loss is recognized. The cost of assets acquired in a group is allocated to individual assets within the group based on their relative fair values and does not give rise to goodwill. Transaction costs related to the acquisition of assets are included in the cost basis of the assets acquired.
Business Combinations—The Company accounts for acquisitions that qualify as business combinations by applying the acquisition method. Transaction costs related to the acquisition of a business are expensed as incurred and excluded from the fair value of consideration transferred. The identifiable assets acquired, liabilities assumed and noncontrolling interests in an acquired entity are recognized and measured at their estimated fair values. The excess of the fair value of consideration transferred over the fair values of identifiable assets acquired, liabilities assumed and noncontrolling interests in an acquired entity, net of fair value of any previously held interest in the acquired entity, is recorded as goodwill. Such valuations require management to make significant estimates and assumptions.
Cash and Cash Equivalents
Short-term, highly liquid investments with original maturities of three months or less are considered to be cash equivalents. The Company did not have any cash equivalents at March 31, 2020 or December 31, 2019. The Company’s cash is held with major financial institutions and may at times exceed federally insured limits.
Restricted Cash
Restricted cash consists primarily of borrower escrow deposits, tenant escrow deposits and real estate capital expenditure reserves.
COLONY CREDIT REAL ESTATE, INC.
NOTES TO CONSOLIDATED FINANCIAL STATEMENTS (Continued)
(Unaudited)
Loans and Preferred Equity Held for Investment
The Company originates and purchases loans and preferred equity held for investment. The accounting framework for loans and preferred equity held for investment depends on the Company’s strategy whether to hold or sell the loan, whether the loan was credit-impaired at the time of acquisition, or if the lending arrangement is an acquisition, development and construction loan.
Loans and Preferred Equity Held for Investment
Loans and preferred equity that the Company has the intent and ability to hold for the foreseeable future are classified as held for investment. Originated loans and preferred equity are recorded at amortized cost, or outstanding unpaid principal balance plus exit fees less net deferred loan fees. Net deferred loan fees include unamortized origination and other fees charged to the borrower less direct incremental loan origination costs incurred by the Company. Purchased loans and preferred equity are recorded at amortized cost, or unpaid principal balance plus purchase premium or less unamortized discount. Costs to purchase loans and preferred equity are expensed as incurred.
Interest Income—Interest income is recognized based upon contractual interest rate and unpaid principal balance of the loans and preferred equity investments. Net deferred loan fees on originated loans and preferred equity investments are deferred and amortized as adjustments to interest income over the expected life of the loans and preferred equity investments using the effective yield method. Premium or discount on purchased loans and preferred equity investments are amortized as adjustments to interest income over the expected life of the loans and preferred equity investments using the effective yield method. When a loan or preferred equity investment is prepaid, prepayment fees and any excess of proceeds over the carrying amount of the loan or preferred equity investment is recognized as additional interest income.
The Company has debt investments in its portfolio that contain a payment-in-kind (“PIK”) provision. Contractual PIK interest, which represents contractually deferred interest added to the loan balance that is due at the end of the loan term, is generally recorded on an accrual basis to the extent such amounts are expected to be collected. The Company will generally cease accruing PIK interest if there is insufficient value to support the accrual or management does not expect the borrower to be able to pay all principal and interest due.
Nonaccrual—Accrual of interest income is suspended on nonaccrual loans and preferred equity investments. Loans and preferred equity investments that are past due 90 days or more as to principal or interest, or where reasonable doubt exists as to timely collection, are generally considered nonperforming and placed on nonaccrual. Interest receivable is reversed against interest income when loans and preferred equity investments are placed on nonaccrual status. Interest collected is recognized on a cash basis by crediting income when received; or if ultimate collectability of loan and preferred equity principal is uncertain, interest collected is recognized using a cost recovery method by applying interest collected as a reduction to loan and preferred equity carrying value. Loans and preferred equity investments may be restored to accrual status when all principal and interest are current and full repayment of the remaining contractual principal and interest are reasonably assured.
Loans Held for Sale
Loans that the Company intends to sell or liquidate in the foreseeable future are classified as held for sale. Loans held for sale are carried at the lower of amortized cost or fair value less disposal cost, with valuation changes recognized as impairment loss. Loans held for sale are not subject to allowance for loan losses. Net deferred loan origination fees and loan purchase premiums or discounts are deferred and capitalized as part of the carrying value of the held for sale loan until the loan is sold, therefore included in the periodic valuation adjustments based on lower of cost or fair value less disposal cost.
At March 31, 2020, the Company classified 7 loans in its Legacy, Non-Strategic Portfolio as held for sale. See Note 3, “Loans and Preferred Equity Held for Investment, net and Loans Held for Sale” for further detail.
Acquisition, Development and Construction (“ADC”) Arrangements
The Company provides loans to third party developers for the acquisition, development and construction of real estate. Under an ADC arrangement, the Company participates in the expected residual profits of the project through the sale, refinancing or other use of the property. The Company evaluates the characteristics of each ADC arrangement, including its risks and rewards, to determine whether they are more similar to those associated with a loan or an investment in real estate. ADC arrangements with characteristics implying loan classification are presented as loans held for investment and result in the recognition of interest income. ADC arrangements with characteristics implying real estate joint ventures are presented as investments in unconsolidated joint ventures and are accounted for using the equity method. The classification of each ADC arrangement as either loan receivable or real estate joint venture involves significant judgment and relies on various factors, including market conditions, amount and timing of expected residual profits, credit enhancements in the form of guaranties, estimated fair value of the collateral, and
COLONY CREDIT REAL ESTATE, INC.
NOTES TO CONSOLIDATED FINANCIAL STATEMENTS (Continued)
(Unaudited)
significance of borrower equity in the project, among others. The classification of ADC arrangements is performed at inception, and periodically reassessed when significant changes occur in the circumstances or conditions described above.
Operating Real Estate
Real Estate Acquisitions—Real estate acquired in acquisitions that are deemed to be business combinations is recorded at the fair values of the acquired components at the time of acquisition, allocated among land, buildings, improvements, equipment and lease-related tangible and identifiable intangible assets and liabilities, including forgone leasing costs, in-place lease values and above- or below-market lease values. Real estate acquired in acquisitions that are deemed to be asset acquisitions is recorded at the total value of consideration transferred, including transaction costs, and allocated to the acquired components based upon relative fair value. The estimated fair value of acquired land is derived from recent comparable sales of land and listings within the same local region based on available market data. The estimated fair value of acquired buildings and building improvements is derived from comparable sales, discounted cash flow analysis using market-based assumptions, or replacement cost, as appropriate. The fair value of site and tenant improvements is estimated based upon current market replacement costs and other relevant market rate information.
Real Estate Held for Investment
Real estate held for investment is carried at cost less accumulated depreciation.
Costs Capitalized or Expensed—Expenditures for ordinary repairs and maintenance are expensed as incurred, while expenditures for significant renovations that improve or extend the useful life of the asset are capitalized and depreciated over their estimated useful lives.
Depreciation—Real estate held for investment, other than land, is depreciated on a straight-line basis over the estimated useful lives of the assets, as follows:
|
| | |
| Real Estate Assets | | Term |
| Building (fee interest) | | 7 to 48 years |
| Building leasehold interests | | Lesser of remaining term of the lease or remaining life of the building |
| Building improvements | | Lesser of the useful life or remaining life of the building |
| Land improvements | | 1 to 15 years |
| Tenant improvements | | Lesser of the useful life or remaining term of the lease |
| Furniture, fixtures and equipment | | 2 to 8 years |
Impairment—The Company evaluates its real estate held for investment for impairment periodically or whenever events or changes in circumstances indicate that the carrying amounts may not be recoverable. The Company evaluates real estate for impairment generally on an individual property basis. If an impairment indicator exists, the Company evaluates the undiscounted future net cash flows that are expected to be generated by the property, including any estimated proceeds from the eventual disposition of the property. If multiple outcomes are under consideration, the Company may apply a probability-weighted approach to the impairment analysis. Based upon the analysis, if the carrying value of a property exceeds its undiscounted future net cash flows, an impairment loss is recognized for the excess of the carrying value of the property over the estimated fair value of the property. In evaluating and/or measuring impairment, the Company considers, among other things, current and estimated future cash flows associated with each property, market information for each sub-market, including, where applicable, competition levels, foreclosure levels, leasing trends, occupancy trends, lease or room rates, and the market prices of similar properties recently sold or currently being offered for sale, and other quantitative and qualitative factors. Another key consideration in this assessment is the Company’s assumptions about the highest and best use of its real estate investments and its intent and ability to hold them for a reasonable period that would allow for the recovery of their carrying values. If such assumptions change and the Company shortens its expected hold period, this may result in the recognition of impairment losses.
Real Estate Held for Sale
Real estate is classified as held for sale in the period when (i) management approves a plan to sell the asset, (ii) the asset is available for immediate sale in its present condition, subject only to usual and customary terms, (iii) a program is initiated to locate a buyer and actively market the asset for sale at a reasonable price, and (iv) completion of the sale is probable within one year. Real estate held for sale is stated at the lower of its carrying amount or estimated fair value less disposal cost, with any write-down to fair value less disposal cost recorded as an impairment loss. For any increase in fair value less disposal cost subsequent to classification as held for sale, the impairment loss may be reversed, but only up to the amount of cumulative loss previously recognized.
COLONY CREDIT REAL ESTATE, INC.
NOTES TO CONSOLIDATED FINANCIAL STATEMENTS (Continued)
(Unaudited)
Depreciation is not recorded on assets classified as held for sale. At the time a sale is consummated, the excess, if any, of sale price less selling costs over carrying value of the real estate is recognized as a gain.
If circumstances arise that were previously considered unlikely and, as a result, the Company decides not to sell the real estate asset previously classified as held for sale, the real estate asset is reclassified as held for investment. Upon reclassification, the real estate asset is measured at the lower of (i) its carrying amount prior to classification as held for sale, adjusted for depreciation expense that would have been recognized had the real estate been continuously classified as held for investment, and (ii) its estimated fair value at the time the Company decides not to sell.
At March 31, 2020, the Company classified several of its properties in its Legacy, Non-Strategic Portfolio as held for sale. See Note 6, “Real Estate, net and Real Estate Held for Sale,” Note 17, “Segment Reporting” and Note 19, “Subsequent Events” for further detail.
Foreclosed Properties
The Company receives foreclosed properties in full or partial settlement of loans held for investment by taking legal title or physical possession of the properties. Foreclosed properties are generally recognized at the time the real estate is received at foreclosure sale or upon execution of a deed in lieu of foreclosure. Foreclosed properties are initially measured at fair value. If the fair value of the property is lower than the carrying value of the loan, the difference is recognized as provision for loan loss and the cumulative loss allowance on the loan is charged off. The Company periodically evaluates foreclosed properties for subsequent decrease in fair value, which is recorded as an additional impairment loss. Fair value of foreclosed properties is generally based on third party appraisals, broker price opinions, comparable sales or a combination thereof.
Real Estate Securities
The Company classifies its CRE securities investments as available for sale on the acquisition date, which are carried at fair value. Unrealized gains (losses) are recorded as a component of accumulated OCI in the consolidated statements of equity. However, the Company has elected the fair value option for the assets and liabilities of its consolidated Investing VIEs, and as a result, any unrealized gains (losses) on the consolidated Investing VIEs are recorded in unrealized gain (loss) on mortgage loans and obligations held in securitization trusts, net in the consolidated statements of operations. As of March 31, 2020, the Company held subordinate tranches of 2 securitization trusts, which represent the Company’s retained interest in the securitization trusts, which the Company consolidates under U.S. GAAP. Refer to Note 5, “Real Estate Securities, Available for Sale” for further discussion.
Impairment
CRE securities for which the fair value option is elected are not evaluated for other-than-temporary impairment (“OTTI”) as any change in fair value is recorded in the consolidated statements of operations. Realized losses on such securities are reclassified to realized loss on mortgage loans and obligations held in securitization trust, net as losses occur.
CRE securities for which the fair value option is not elected are evaluated for OTTI quarterly. Impairment of a security is considered to be other-than-temporary when: (i) the holder has the intent to sell the impaired security; (ii) it is more likely than not the holder will be required to sell the security; or (iii) the holder does not expect to recover the entire amortized cost of the security. When a CRE security has been deemed to be other-than-temporarily impaired due to (i) or (ii), the security is written down to its fair value and an OTTI is recognized in the consolidated statements of operations. In the case of (iii), the security is written down to its fair value and the amount of OTTI is then bifurcated into: (a) the amount related to expected credit losses; and (b) the amount related to fair value adjustments in excess of expected credit losses. The portion of OTTI related to expected credit losses is recognized in the consolidated statements of operations. The remaining OTTI related to the valuation adjustment is recognized as a component of accumulated OCI in the consolidated statements of equity. CRE securities which are not high-credit quality are considered to have an OTTI if the security has an unrealized loss and there has been an adverse change in expected cash flow. The amount of OTTI is then bifurcated as discussed above.
Investments in Unconsolidated Ventures
A noncontrolling, unconsolidated ownership interest in an entity may be accounted for using one of (i) equity method where applicable; (ii) fair value option if elected; (iii) fair value through earnings if fair value is readily determinable, including election of net asset value (“NAV”) practical expedient where applicable; or (iv) for equity investments without readily determinable fair values, the measurement alternative to measure at cost adjusted for any impairment and observable price changes, as applicable.
COLONY CREDIT REAL ESTATE, INC.
NOTES TO CONSOLIDATED FINANCIAL STATEMENTS (Continued)
(Unaudited)
Fair value changes of equity method investments under the fair value option are recorded in earnings from investments in unconsolidated ventures. Fair value changes of other equity investments, including adjustments for observable price changes under the measurement alternative, are recorded in other gain (loss).
Equity Method Investments
The Company accounts for investments under the equity method of accounting if it has the ability to exercise significant influence over the operating and financial policies of an entity, but does not have a controlling financial interest. The equity method investment is initially recorded at cost and adjusted each period for capital contributions, distributions and the Company’s share of the entity’s net income or loss as well as other comprehensive income or loss. The Company’s share of net income or loss may differ from the stated ownership percentage interest in an entity if the governing documents prescribe a substantive non-proportionate earnings allocation formula or a preferred return to certain investors. For certain equity method investments, the Company records its proportionate share of income on a one to three month lag. Distributions of operating profits from equity method investments are reported as operating activities, while distributions in excess of operating profits are reported as investing activities in the statement of cash flows under the cumulative earnings approach.
At March 31, 2020 and December 31, 2019, the Company’s investments in unconsolidated joint ventures consisted of investments in PE Investments, senior loans, mezzanine loans and preferred equity held in joint ventures, as well as ADC arrangements accounted for as equity method investments.
Impairment
Evaluation of impairment applies to equity method investments and equity investments under the measurement alternative. If indicators of impairment exist, the Company will first estimate the fair value of its investment. In assessing fair value, the Company generally considers, among others, the estimated enterprise value of the investee or fair value of the investee’s underlying net assets, including net cash flows to be generated by the investee as applicable.
For investments under the measurement alternative, if carrying value of the investment exceeds its fair value, an impairment is deemed to have occurred.
For equity method investments, further consideration is made if a decrease in value of the investment is other-than-temporary to determine if impairment loss should be recognized. Assessment of OTTI involves management judgment, including, but not limited to, consideration of the investee’s financial condition, operating results, business prospects and creditworthiness, the Company’s ability and intent to hold the investment until recovery of its carrying value, or a significant and prolonged decline in traded price of the investee’s equity security. If management is unable to reasonably assert that an impairment is temporary or believes that the Company may not fully recover the carrying value of its investment, then the impairment is considered to be other-than-temporary.
Investments that are other-than-temporarily impaired are written down to their estimated fair value. Impairment loss is recorded in earnings from investments in unconsolidated ventures for equity method investments and in other gain (loss) for investments under the measurement alternative.
Identifiable Intangibles
In a business combination or asset acquisition, the Company may recognize identifiable intangibles that meet either or both the contractual-legal criterion or the separability criterion. An indefinite-lived intangible is not subject to amortization until such time that its useful life is determined to no longer be indefinite, at which point, it will be assessed for impairment and its adjusted carrying amount amortized over its remaining useful life. Finite-lived intangibles are amortized over their useful life in a manner that reflects the pattern in which the intangible is being consumed if readily determinable, such as based upon expected cash flows; otherwise they are amortized on a straight line basis. The useful life of all identified intangibles will be periodically reassessed and if useful life changes, the carrying amount of the intangible will be amortized prospectively over the revised useful life.
Lease Intangibles—Identifiable intangibles recognized in acquisitions of operating real estate properties generally include in-place leases, above- or below-market leases and deferred leasing costs, all of which have finite lives. In-place leases generate value over and above the tangible real estate because a property that is occupied with leased space is typically worth more than a vacant building without an operating lease contract in place. The estimated fair value of acquired in-place leases is derived based on management’s assessment of costs avoided from having tenants in place, including lost rental income, rent concessions and tenant allowances or reimbursements, that hypothetically would be incurred to lease a vacant building to its actual existing occupancy level on the valuation date. The net amount recorded for acquired in-place leases is included in intangible assets and amortized on a straight-line basis as an increase to depreciation and amortization expense over the remaining term of the applicable leases. If an in-place lease is terminated, the unamortized portion is charged to depreciation and amortization expense.
COLONY CREDIT REAL ESTATE, INC.
NOTES TO CONSOLIDATED FINANCIAL STATEMENTS (Continued)
(Unaudited)
The estimated fair value of the above- or below-market component of acquired leases represents the present value of the difference between contractual rents of acquired leases and market rents at the time of the acquisition for the remaining lease term, discounted for tenant credit risks. Above- or below-market operating lease values are amortized on a straight-line basis as a decrease or increase to rental income, respectively, over the applicable lease terms. This includes fixed rate renewal options in acquired leases that are below-market, which are amortized to decrease rental income over the renewal period. Above- or below-market ground lease obligations are amortized on a straight-line basis as a decrease or increase to rent expense, respectively, over the applicable lease terms. If the above- or below-market operating lease values or above- or below-market ground lease obligations are terminated, the unamortized portion of the lease intangibles are recorded in rental income or rent expense, respectively.
Deferred leasing costs represent management’s estimate of the avoided leasing commissions and legal fees associated with an existing in-place lease. The net amount is included in intangible assets and amortized on a straight-line basis as an increase to depreciation and amortization expense over the remaining term of the applicable lease.
Transfers of Financial Assets
Sale accounting for transfers of financial assets requires the transfer of an entire financial asset, a group of financial assets in its entirety or if a component of the financial asset is transferred, that the component meets the definition of a participating interest with characteristics that mirror the original financial asset.
Transfers of financial assets are accounted for as sales when control over the assets has been surrendered. If the Company has any continuing involvement, rights or obligations with the transferred financial asset (outside of standard representations and warranties), sale accounting requires that the transfer meets the following sale conditions: (1) the transferred asset has been legally isolated; (2) the transferee has the right (free of conditions that constrain it from taking advantage of that right) to pledge or exchange the transferred asset; and (3) the Company does not maintain effective control over the transferred asset through an agreement that provides for (a) both an entitlement and an obligation by the Company to repurchase or redeem the asset before its maturity, (b) the unilateral ability by the Company to reclaim the asset and a more than trivial benefit attributable to that ability, or (c) the transferee requiring the Company to repurchase the asset at a price so favorable to the transferee that it is probable the repurchase will occur.
If sale accounting is met, the transferred financial asset is removed from the balance sheet and a net gain or loss is recognized upon sale, taking into account any retained interests. Transfers of financial assets that do not meet the criteria for sale are accounted for as financing transactions, or secured borrowing.
Derivative Instruments and Hedging Activities
The Company uses derivative instruments to manage its foreign currency risk and interest rate risk. The Company does not use derivative instruments for speculative or trading purposes. All derivative instruments are recorded at fair value and included in other assets or other liabilities on a gross basis on the balance sheet. The accounting for changes in fair value of derivatives depends upon whether or not the Company has elected to designate the derivative in a hedging relationship and the derivative qualifies for hedge accounting. The Company has economic hedges that have not been designated for hedge accounting.
Changes in fair value of derivatives not designated as accounting hedges are recorded in the statement of operations in other gain (loss), net.
For designated accounting hedges, the relationships between hedging instruments and hedged items, risk management objectives and strategies for undertaking the accounting hedges as well as the methods to assess the effectiveness of the derivative prospectively and retrospectively, are formally documented at inception. Hedge effectiveness relates to the amount by which the gain or loss on the designated derivative instrument exactly offsets the change in the hedged item attributable to the hedged risk. If it is determined that a derivative is not expected to be or has ceased to be highly effective at hedging the designated exposure, hedge accounting is discontinued.
Cash Flow Hedges—The Company uses interest rate caps and swaps to hedge its exposure to interest rate fluctuations in forecasted interest payments on floating rate debt. The effective portion of the change in fair value of the derivative is recorded in accumulated other comprehensive income, while hedge ineffectiveness is recorded in earnings. If the derivative in a cash flow hedge is terminated or the hedge designation is removed, related amounts in accumulated other comprehensive income (loss) are reclassified into earnings.
COLONY CREDIT REAL ESTATE, INC.
NOTES TO CONSOLIDATED FINANCIAL STATEMENTS (Continued)
(Unaudited)
Net Investment Hedges—The Company uses foreign currency hedges to protect the value of its net investments in foreign subsidiaries or equity method investees whose functional currencies are not U.S. dollars. Changes in the fair value of derivatives used as hedges of net investment in foreign operations, to the extent effective, are recorded in the cumulative translation adjustment account within accumulated other comprehensive income (loss).
At the end of each quarter, the Company reassesses the effectiveness of its net investment hedges and as appropriate, dedesignates the portion of the derivative notional amount that is in excess of the beginning balance of its net investments as undesignated hedges.
Release of accumulated other comprehensive income related to net investment hedges occurs upon losing a controlling financial interest in an investment or obtaining control over an equity method investment. Upon sale, complete or substantially complete liquidation of an investment in a foreign subsidiary, or partial sale of an equity method investment, the gain or loss on the related net investment hedge is reclassified from accumulated other comprehensive income to earnings.
Financing Costs
Financing costs primarily include debt discounts and premiums as well as deferred financing costs. Deferred financing costs represent commitment fees, legal and other third-party costs associated with obtaining financing. Costs related to revolving credit facilities are recorded in other assets and are amortized to interest expense using the straight-line basis over the term of the facility. Costs related to other borrowings are recorded net against the carrying value of such borrowings and are amortized to interest expense using the effective interest method. Unamortized deferred financing costs are expensed to realized gain (loss) when the associated facility is repaid before maturity. Costs incurred in seeking financing transactions, which do not close, are expensed in the period in which it is determined that the financing will not occur.
Revenue Recognition
Property Operating Income
Property operating income includes the following:
Rental Income—Rental income is recognized on a straight-line basis over the noncancellable term of the related lease which includes the effects of minimum rent increases and rent abatements under the lease. Rents received in advance are deferred.
When it is determined that the Company is the owner of tenant improvements, the cost to construct the tenant improvements, including costs paid for or reimbursed by the tenants, is capitalized. For tenant improvements owned by the Company, the amount funded by or reimbursed by the tenants are recorded as deferred revenue, which is amortized on a straight-line basis as additional rental income over the term of the related lease. Rental income recognition commences when the leased space is substantially ready for its intended use and the tenant takes possession of the leased space.
When it is determined that the tenant is the owner of tenant improvements, the Company’s contribution towards those improvements is recorded as a lease incentive, included in deferred leasing costs and intangible assets on the balance sheet, and amortized as a reduction to rental income on a straight-line basis over the term of the lease. Rental income recognition commences when the tenant takes possession of the lease space.
Tenant Reimbursements—In net lease arrangements, the tenant is generally responsible for operating expenses related to the property, including real estate taxes, property insurance, maintenance, repairs and improvements. Costs reimbursable from tenants and other recoverable costs are recognized as revenue in the period the recoverable costs are incurred. When the Company is the primary obligor with respect to purchasing goods and services for property operations and has discretion in selecting the supplier and retains credit risk, tenant reimbursement revenue and property operating expenses are presented on a gross basis in the statements of operations. For certain triple net leases where the lessee self-manages the property, hires its own service providers and retains credit risk for routine maintenance contracts, no reimbursement revenue and expense are recognized.
Hotel Operating Income—Hotel operating income includes room revenue, food and beverage sales and other ancillary services. Revenue is recognized upon occupancy of rooms, consummation of sales and provision of services.
COLONY CREDIT REAL ESTATE, INC.
NOTES TO CONSOLIDATED FINANCIAL STATEMENTS (Continued)
(Unaudited)
Real Estate Securities
Interest income is recognized using the effective interest method with any premium or discount amortized or accreted through earnings based on expected cash flow through the expected maturity date of the security. Changes to expected cash flow may result in a change to the yield which is then applied retrospectively for high-credit quality securities that cannot be prepaid or otherwise settled in such a way that the holder would not recover substantially all of the investment or prospectively for all other securities to recognize interest income.
Foreign Currency
Assets and liabilities denominated in a foreign currency for which the functional currency is a foreign currency are translated using the exchange rate in effect at the balance sheet date and the corresponding results of operations for such entities are translated using the average exchange rate in effect during the period. The resulting foreign currency translation adjustments are recorded as a component of accumulated other comprehensive income or loss in stockholders’ equity. Upon sale, complete or substantially complete liquidation of a foreign subsidiary, or upon partial sale of a foreign equity method investment, the translation adjustment associated with the investment, or a proportionate share related to the portion of equity method investment sold, is reclassified from accumulated other comprehensive income or loss into earnings.
Assets and liabilities denominated in a foreign currency for which the functional currency is the U.S. dollar are remeasured using the exchange rate in effect at the balance sheet date and the corresponding results of operations for such entities are remeasured using the average exchange rate in effect during the period. The resulting foreign currency remeasurement adjustments are recorded in other gain (loss), net on the consolidated statements of operations.
Disclosures of non-U.S. dollar amounts to be recorded in the future are translated using exchange rates in effect at the date of the most recent balance sheet presented.
Equity-Based Compensation
Equity-classified stock awards granted to executive officers and both independent and non-independent directors are based on the closing price of the Class A common stock on the grant date and recognized on a straight-line basis over the requisite service period of the awards.
The compensation expense is adjusted for actual forfeitures upon occurrence. Equity-based compensation is classified within administrative expense in the consolidated statement of operations.
Earnings Per Share
The Company presents both basic and diluted earnings per share (“EPS”) using the two-class method. Basic EPS is calculated by dividing earnings allocated to common shareholders, as adjusted for unallocated earnings attributable to certain participating securities, if any, by the weighted-average number of common shares outstanding during the period. Diluted EPS is based on the weighted-average number of common shares and the effect of potentially dilutive common share equivalents outstanding during the period. The two-class method is an allocation formula that determines earnings per share for each share of common stock and participating securities according to dividends declared and participation rights in undistributed earnings. Under this method, all earnings (distributed and undistributed) are allocated to common shares and participating securities based on their respective rights to receive dividends. The Company has certain share-based payment awards that contain nonforfeitable rights to dividends, which are considered participating securities for the purposes of computing EPS pursuant to the two-class method.
Income Taxes
For U.S. federal income tax purposes, the Company elected to be taxed as a REIT beginning with its taxable year ended December 31, 2018. To qualify as a REIT, the Company must continually satisfy tests concerning, among other things, the real estate qualification of sources of its income, the real estate composition and values of its assets, the amounts it distributes to stockholders and the diversity of ownership of its stock.
To the extent that the Company qualifies as a REIT, it generally will not be subject to U.S. federal income tax to the extent of its distributions to stockholders. The Company believes that all of the criteria to maintain the Company’s REIT qualification have been met for the applicable periods, but there can be no assurance that these criteria will continue to be met in subsequent periods. If the Company were to fail to meet these requirements, it would be subject to U.S. federal income tax and potential interest and penalties, which could have a material adverse impact on its results of operations and amounts available for distributions to its stockholders. The Company’s accounting policy with respect to interest and penalties is to classify these amounts as a component of income tax expense, where applicable.
COLONY CREDIT REAL ESTATE, INC.
NOTES TO CONSOLIDATED FINANCIAL STATEMENTS (Continued)
(Unaudited)
The Company may also be subject to certain state, local and franchise taxes. Under certain circumstances, U.S. federal income and excise taxes may be due on its undistributed taxable income. The Company also holds investments in Europe which are subject to tax in each local jurisdiction.
The Company made joint elections to treat certain subsidiaries as taxable REIT subsidiaries (“TRSs”) which may be subject to taxation by U.S. federal, state and local authorities. In general, a TRS of the Company may perform non-customary services for tenants, hold assets that the Company cannot hold directly and engage in most real estate or non-real estate-related business.
Certain subsidiaries of the Company are subject to taxation by U.S. federal, state and local authorities for the periods presented. Income taxes are accounted for by the asset/liability approach in accordance with U.S. GAAP. Deferred taxes, if any, represent the expected future tax consequences when the reported amounts of assets and liabilities are recovered or paid. Such amounts arise from differences between the financial reporting and tax bases of assets and liabilities and are adjusted for changes in tax laws and tax rates in the period during which such changes are enacted. A provision for income tax represents the total of income taxes paid or payable for the current period, plus the change in deferred taxes. Current and deferred taxes are recorded on the portion of earnings (losses) recognized by the Company with respect to its interest in TRSs. Deferred income tax assets and liabilities are calculated based on temporary differences between the Company’s U.S. GAAP consolidated financial statements and the U.S. federal, state and local tax basis of assets and liabilities as of the consolidated balance sheet date. The Company evaluates the realizability of its deferred tax assets (e.g., net operating loss and capital loss carryforwards) and recognizes a valuation allowance if, based on the available evidence, it is more likely than not that some portion or all of its deferred tax assets will not be realized. When evaluating the realizability of its deferred tax assets, the Company considers estimates of expected future taxable income, existing and projected book/tax differences, tax planning strategies available and the general and industry-specific economic outlook. This realizability analysis is inherently subjective, as it requires the Company to forecast its business and general economic environment in future periods. Changes in estimate of deferred tax asset realizability, if any, are included in income tax benefit (expense) in the consolidated statements of operations.
The Coronavirus Aid, Relief and Economic Security Act (“CARES Act”) was passed on March 27, 2020. Among other things, the CARES Act temporarily removed the 80% limitation on the amount of taxable income that can be offset with a net operating loss (“NOL”) for 2019 and 2020 and allowed for a carryback of net operating losses generated in years 2018 through 2020 to each of the preceding five years. The Company is still evaluating the impact of the CARES Act on its NOLs and did not book any adjustments related to the CARES Act for the quarter ended March 31, 2020.
For the three months ended March 31, 2020 and March 31, 2019, the Company recorded income tax expense of $1.7 million and income tax benefit of $0.4 million, respectively.
Accounting Standards Adopted in 2020
Credit Losses - In June 2016, the FASB issued ASU No. 2016-13, Financial Instruments-Credit Losses, which amends the credit impairment model for financial instruments. The Company adopted ASU 2016-13 using the modified retrospective method on January 1, 2020.
The existing incurred loss model has been replaced with a lifetime current expected credit loss (“CECL”) model for financial instruments carried at amortized cost and off-balance sheet credit exposures, such as loans, loan commitments, held-to-maturity (“HTM”) debt securities, financial guarantees, net investment in leases, reinsurance and trade receivables, which will generally result in earlier recognition of allowance for losses. For available-for-sale (“AFS”) debt securities, unrealized credit losses are recognized as allowances rather than reductions in amortized cost basis and elimination of the OTTI concept will result in more frequent estimation of credit losses. The accounting model for purchased credit impaired loans and debt securities has been simplified, including elimination of some of the asymmetrical treatment between credit losses and credit recoveries, to be consistent with the CECL model for originated and purchased non-credit impaired assets. The existing model for beneficial interests that are not of high credit quality was amended to conform to the new impairment models for HTM and AFS debt securities.
COLONY CREDIT REAL ESTATE, INC.
NOTES TO CONSOLIDATED FINANCIAL STATEMENTS (Continued)
(Unaudited)
Upon adoption of ASU 2016-13 on January 1, 2020 the Company recorded the following (dollars in thousands):
|
| | | | |
| | | Impact of ASU 2016-13 Adoption |
| Assets: | | |
| CECL reserve on Loans and preferred equity held for investment, net | | $ | 21,093 |
|
| Liabilities: | | |
| CECL reserve on Accrued and other liabilities | | 2,093 |
|
| Total Impact of ASU 2016-13 adoption on Accumulated deficit | | $ | 23,186 |
|
The following discussion highlights changes to the Company’s accounting policies as a result of this adoption.
CECL reserve
The CECL reserve for the Company’s financial instruments carried at amortized cost and off-balance sheet credit exposures, such as loans, loan commitments and trade receivables represents a lifetime estimate of expected credit losses. Factors considered by the Company when determining the CECL reserve include loan-specific characteristics such as loan-to-value (“LTV”) ratio, vintage year, loan term, property type, occupancy and geographic location, financial performance of the borrower, expected payments of principal and interest, as well as internal or external information relating to past events, current conditions and reasonable and supportable forecasts.
The CECL reserve is measured on a collective (pool) basis when similar risk characteristics exist for multiple financial instruments. If similar risk characteristics do not exist, the Company measures the CECL reserve on an individual instrument basis. The determination of whether a particular financial instrument should be included in a pool can change over time. If a financial asset’s risk characteristics change, the Company evaluates whether it is appropriate to continue to keep the financial instrument in its existing pool or evaluate it individually.
In measuring the CECL reserve for financial instruments that share similar risk characteristics, the Company primarily applies a probability of default (“PD”)/loss given default (“LGD”) model for instruments that are collectively assessed, whereby the CECL reserve is calculated as the product of PD, LGD and exposure at default (“EAD”). The Company’s model principally utilizes historical loss rates derived from a commercial mortgage backed securities database with historical losses from 1998 through March 2020 provided by a third party, Trepp LLC, forecasting the loss parameters using a scenario-based statistical approach over a reasonable and supportable forecast period of twelve months, followed by a straight-line reversion period of twelve-months back to average historical losses.
For financial instruments assessed outside of the PD/LGD model on an individual basis, including when it is probable that the Company will be unable to collect the full payment of principal and interest on the instrument, the Company applies a discounted cash flow (“DCF”) methodology. For financial instruments where the borrower is experiencing financial difficulty based on the Company’s assessment at the reporting date and the repayment is expected to be provided substantially through the operation or sale of the collateral, the Company may elect to use as a practical expedient the fair value of the collateral at the reporting date when determining the provision for loan losses.
In developing the CECL reserve for its loans and preferred equity held for investment, the Company considers the risk rating of each loan and preferred equity as a key credit quality indicator. The risk ratings are based on a variety of factors, including, without limitation, underlying real estate performance and asset value, values of comparable properties, durability and quality of property cash flows, sponsor experience and financial wherewithal, and the existence of a risk-mitigating loan structure. Additional key considerations include loan-to-value ratios, debt service coverage ratios, loan structure, real estate and credit market dynamics, and risk of default or principal loss. Based on a five-point scale, the Company’s loans and preferred equity held for investment are rated “1” through “5,” from less risk to greater risk, and the ratings are updated quarterly. At the time of origination or purchase, loans and preferred equity held for investment are ranked as a “3” and will move accordingly going forward based on the ratings which are defined as follows:
| |
| 1. | Very Low Risk-The loan is performing as agreed. The underlying property performance has exceeded underwritten expectations with very strong net operating income (”NOI”), debt service coverage ratio, debt yield and occupancy metrics. Sponsor is investment grade, very well capitalized, and employs very experienced management team. |
| |
| 2. | Low Risk-The loan is performing as agreed. The underlying property performance has met or exceeds underwritten expectations with high occupancy at market rents, resulting in consistent cash flow to service the debt. Strong sponsor that is well capitalized with experienced management team. |
COLONY CREDIT REAL ESTATE, INC.
NOTES TO CONSOLIDATED FINANCIAL STATEMENTS (Continued)
(Unaudited)
| |
| 3. | Average Risk-The loan is performing as agreed. The underlying property performance is consistent with underwriting expectations. The property generates adequate cash flow to service the debt, and/or there is enough reserve or loan structure to provide time for sponsor to execute the business plan. Sponsor has routinely met its obligations and has experience owning/operating similar real estate. |
| |
| 4. | High Risk/Delinquent/Potential for Loss-The loan is in excess of 30 days delinquent and/or has a risk of a principal loss. The underlying property performance is behind underwritten expectations. Loan covenants may require occasional waivers/modifications. Sponsor has been unable to execute its business plan and local market fundamentals have deteriorated. Operating cash flow is not sufficient to service the debt and debt service payments may be coming from sponsor equity/loan reserves. |
| |
| 5. | Impaired/Defaulted/Loss Likely-The loan is in default or a default is imminent, and has a high risk of a principal loss, or has incurred a principal loss. The underlying property performance is significantly worse than underwritten expectation and sponsor has failed to execute its business plan. The property has significant vacancy and current cash flow does not support debt service. Local market fundamentals have significantly deteriorated resulting in depressed comparable property valuations versus underwriting. |
The Company also considers qualitative and environmental factors, including, but not limited to, economic and business conditions, nature and volume of the loan portfolio, lending terms, volume and severity of past due loans, concentration of credit and changes in the level of such concentrations in its determination of the CECL reserve.
The Company has elected to not measure a CECL reserve for accrued interest receivable as it is reversed against interest income when a loan or preferred equity investment is placed on nonaccrual status. Loans and preferred equity investments are charged off against the provision for loan losses when all or a portion of the principal amount is determined to be uncollectible.
Changes in the CECL reserve for the Company’s financial instruments are recorded in provision for loan losses on the Statement of Operations with a corresponding offset to the loans and preferred equity held for investment or as a component of other liabilities for future loan fundings recorded on the Company’s consolidated balance sheets. During the three months ended March 31, 2020, the Company recorded $69.9 million in provision for loan losses on the Company’s consolidated statements of operations, with a corresponding offset to the loans and preferred equity held for investment of $67.6 million and $2.3 million in other liabilities for future loan fundings on the Company’s consolidated balance sheets. The Company’s $69.9 million provision for loan losses recorded during the three months ended March 31, 2020 consists of $39.1 million related to two of the Company’s hospitality loans, $29.0 million determined by the PD/LGD model and $1.8 million related to the discounted payoff of loans during the quarter. See Note 3, “Loans and Preferred Equity Held for Investment, net and Loans Held for Sale” for further detail.
Troubled Debt Restructuring (“TDR”)—The Company classifies an individual financial instrument as a TDR when it has a reasonable expectation that the financial instrument’s contractual terms will be modified in a manner that grants concession to the borrower who is experiencing financial difficulty. Concessions could include term extensions, payment deferrals, interest rate reductions, principal forgiveness, forbearance, or other actions designed to maximize the Company’s collection on the financial instrument. The Company determines the CECL reserve for financial instruments that are TDRs individually.
Fair Value Disclosures—In August 2018, the FASB issued ASU No. 2018-13, Fair Value Measurement (Topic 820): Disclosure Framework-Changes to the Disclosure Requirements for Fair Value Measurements. The ASU requires new disclosures of changes in unrealized gains and losses in other comprehensive income for recurring Level 3 fair value measurements of instruments held at the balance sheet date, as well as the range and weighted average or other quantitative information, if more relevant, of significant unobservable inputs for recurring and nonrecurring Level 3 fair values. Certain previously required disclosures are eliminated, specifically around the valuation process required for Level 3 fair values, policy for timing of transfers between levels of the fair value hierarchy, as well as amounts and reason for transfers between Levels 1 and 2. Additionally, the new guidance clarifies or modifies certain existing disclosures, including clarifying that information about measurement uncertainty of Level 3 fair values should be as of the reporting date and requiring disclosures of the timing of liquidity events for investments measured under the NAV practical expedient, but only if the investee has communicated this information or has announced it publicly. The provisions on new disclosures and modification to disclosure of Level 3 measurement uncertainty are to be applied prospectively, while all other provisions are to be applied retrospectively. The Company adopted ASU No. 2018-13 on January 1, 2020.
Related Party Guidance for VIEs—In November 2018, the FASB issued ASU No. 2018-17, Targeted Improvements to Related Party Guidance for Variable Interest Entities. The ASU amends the VIE guidance to align, throughout the VIE model, the evaluation of a decision maker's or service provider's fee held by a related party whether or not they are under common control, in both the assessment of whether a fee qualifies as a variable interest and the determination of a primary beneficiary. Specifically, a decision maker or service provider considers interests in a VIE held by a related party under common control only if it has a direct interest
COLONY CREDIT REAL ESTATE, INC.
NOTES TO CONSOLIDATED FINANCIAL STATEMENTS (Continued)
(Unaudited)
in the related party under common control and considers such indirect interest in the VIE held by the related party under common control on a proportionate basis, rather than its entirety. Transition is generally on a modified retrospective basis, with the cumulative effect adjusted to retained earnings at the beginning of the earliest period presented. The Company adopted ASU No. 2018-17 on January 1, 2020, with no transitional impact upon adoption.
Reference Rate Reform-In March 2020, the FASB issued ASU No. 2020-04, Reference Rate Reform (Topic 848): Facilitation of the Effects of Reference Rate Reform on Financial Reporting. The guidance in Topic 848 is optional, the election of which provides temporary relief for the accounting effects on contracts, hedging relationships and other transactions impacted by the transition from interbank offered rates (such as London Interbank Offered Rate, or LIBOR) that are expected to be discontinued by the end of 2021 to alternative reference rates (such as Secured Overnight Financing Rate, or SOFR). Modification of contractual terms to effect the reference rate reform transition on debt, leases, derivatives and other contracts is eligible for relief from modification accounting and accounted for as a continuation of the existing contract. Topic 848 is effective upon issuance through December 31, 2022, and may be applied retrospectively to January 1, 2020. The Company has elected to apply the hedge accounting expedients related to probability and assessment of effectiveness for future LIBOR-indexed cash flows to assume that the index upon which future hedged transactions will be based matches the index on the corresponding derivatives, which preserves existing derivative treatment and presentation. The Company may elect other practical expedients or exceptions as applicable over time as reference rate reform activities occur.
Future Application of Accounting Standards
Income Tax Accounting—In December 2019, the FASB issued ASU No. 2019-12, Simplifying Accounting for Income Taxes. The ASU simplifies accounting for income taxes by eliminating certain exceptions to the general approach in ASC 740, Income Taxes, and clarifies certain aspects of the guidance for more consistent application. The simplifications relate to intraperiod tax allocations when there is a loss in continuing operations and a gain outside of continuing operations, accounting for tax law or tax rate changes and year-to-date losses in interim periods, recognition of deferred tax liability for outside basis difference when investment ownership changes, and accounting for franchise taxes that are partially based on income. The ASU also provides new guidance that clarifies the accounting for transactions resulting in a step-up in tax basis of goodwill, among other changes. Transition is generally prospective, other than the provision related to outside basis difference which is on a modified retrospective basis with cumulative effect adjusted to retained earnings at the beginning of the period adopted, and franchise tax provision which is on either full or modified retrospective. ASU No. 2019-12 is effective January 1, 2021, with early adoption permitted in an interim period, to be applied to all provisions. The Company is currently evaluating the impact of this new guidance.
Accounting for Certain Equity Investments—In January 2020, the FASB issued ASU No. 2020-01, Clarifying the Interactions between Topic 321 Investments-Equity Securities, Topic 323-Investments Equity Method and Joint Ventures, and Topic 815-Derivatives and Hedging. The ASU clarifies that if as a result of an observable transaction, an equity investment under the measurement alternative is transitioned into equity method and vice versa, an equity method investment is transitioned into measurement alternative, the investment is to be remeasured immediately before and after the transaction, respectively. The ASU also clarifies that certain forward contracts or purchased options to acquire equity securities that are not deemed to be derivatives or in-substance common stock will generally be measured using the fair value principles of ASC 321 before settlement or exercise, and that an entity should not be considering how it will account for the resulting investments upon eventual settlement or exercise. ASU No. 2020-01 is to be applied prospectively, effective January 1, 2021, with early adoption permitted in an interim period. The Company is currently evaluating the impact of this new guidance.
COLONY CREDIT REAL ESTATE, INC.
NOTES TO CONSOLIDATED FINANCIAL STATEMENTS (Continued)
(Unaudited)
| |
| 3. | Loans and Preferred Equity Held for Investment, net and Loans Held for Sale |
The following table provides a summary of the Company’s loans and preferred equity held for investment, net (dollars in thousands):
|
| | | | | | | | | | | | | | | | | | | | | | | | | | |
| | | March 31, 2020 | | December 31, 2019 |
| | | Unpaid Principal Balance | | Carrying Value | | Weighted Average Coupon(1) | | Weighted Average Maturity in Years | | Unpaid Principal Balance | | Carrying Value | | Weighted Average Coupon(1) | | Weighted Average Maturity in Years |
| Fixed rate | | | | | | | | | | | | | | | | |
| Mezzanine loans | | $ | 126,807 |
| | $ | 125,993 |
| | 12.7 | % | | 4.8 | | $ | 223,395 |
| | $ | 222,503 |
| | 12.8 | % | | 4.2 |
| Preferred equity interests | | 116,901 |
| | 116,856 |
| | 12.5 | % | | 6.6 | | 115,384 |
| | 115,313 |
| | 12.5 | % | | 6.9 |
Other loans(2) | | 12,731 |
| | 12,621 |
| | 15.0 | % | | 4.2 | | 12,572 |
| | 12,448 |
| | 15.0 | % | | 4.4 |
| | | 256,439 |
| | 255,470 |
| | | | | | 351,351 |
| | 350,264 |
| | | | |
| Variable rate | | | | | | | | | | | | | | | | |
| Senior loans | | 1,135,358 |
| | 1,130,218 |
| | 5.6 | % | | 3.9 | | 1,462,467 |
| | 1,457,738 |
| | 6.0 | % | | 3.8 |
Securitized loans(3) | | 1,006,495 |
| | 1,002,705 |
| | 5.1 | % | | 4.0 | | 1,006,495 |
| | 1,002,696 |
| | 5.2 | % | | 4.2 |
| Mezzanine loans | | 14,959 |
| | 15,079 |
| | 10.7 | % | | 2.3 | | 38,110 |
| | 38,258 |
| | 11.4 | % | | 2.0 |
| | | 2,156,812 |
| | 2,148,002 |
| | | | | | 2,507,072 |
| | 2,498,692 |
| | | | |
| | | 2,413,251 |
| | 2,403,472 |
| | | | | | 2,858,423 |
| | 2,848,956 |
| | | | |
| | | | | | | | | | | | | | | | | |
| Allowance for loan losses | | NA |
| | (52,194 | ) | | | | | | NA |
| | (272,624 | ) | | | | |
| Loans and preferred equity held for investment, net | | $ | 2,413,251 |
| | $ | 2,351,278 |
| | | | | | $ | 2,858,423 |
| | $ | 2,576,332 |
| | | | |
_________________________________________
| |
| (1) | Calculated based on contractual interest rate. |
| |
| (2) | Includes one corporate term loan secured by the borrower’s limited partnership interests in a fund at March 31, 2020 and December 31, 2019. |
| |
| (3) | Represents loans transferred into securitization trusts that are consolidated by the Company. |
As of March 31, 2020, the weighted average maturity, including extensions, of loans and preferred equity investments was 4.1 years.
The Company had $8.8 million and $9.8 million of interest receivable related to its loans and preferred equity held for investment, net as of March 31, 2020 and December 31, 2019, respectively. This is included in receivables, net on the Company’s consolidated balance sheets.
Activity relating to the Company’s loans and preferred equity held for investment, net was as follows (dollars in thousands):
|
| | | | |
| | | Carrying Value |
| Balance at January 1, 2020 | | $ | 2,576,332 |
|
| Acquisitions/originations/additional funding | | 37,452 |
|
| Loan maturities/principal repayments | | (176,021 | ) |
| Transfer to loans held for sale | | (16,625 | ) |
| Discount accretion/premium amortization | | 2,215 |
|
| Capitalized interest | | 3,171 |
|
Provision for loan losses(1)(2) | | (69,686 | ) |
Effect of CECL adoption(3) | | (21,093 | ) |
| Charge-off | | 15,533 |
|
| Balance at March 31, 2020 | | $ | 2,351,278 |
|
_________________________________________
| |
| (1) | Provision for loan losses excludes $0.2 million determined by the Company’s PD/LGD model for unfunded commitments reported on the consolidated statement of operations, with a corresponding offset to other liabilities recorded on the Company’s consolidated balance sheets. |
| |
| (2) | Includes $28.8 million related to the Company’s PD/LGD model, $36.8 million recorded on four NY hospitality loans and $2.3 million related to the Midwest hospitality loan both of which were evaluated individually and $1.8 million related to the discounted payoff of loans during the quarter. See further discussion in “Nonaccrual and Past Due Loans and Preferred Equity.” |
| |
| (3) | Calculated by the Company’s PD/LGD model upon CECL adoption on January 1, 2020. See Note 2, “Summary of Significant Accounting Polices” for further details. |
COLONY CREDIT REAL ESTATE, INC.
NOTES TO CONSOLIDATED FINANCIAL STATEMENTS (Continued)
(Unaudited)
Nonaccrual and Past Due Loans and Preferred Equity
Loans and preferred equity that are 90 days or more past due as to principal or interest, or where reasonable doubt exists as to timely collection, are generally considered nonperforming and placed on nonaccrual status. At March 31, 2020, other than the NY hospitality loans and the Midwest hospitality loan discussed below, all other loans and preferred equity held for investment remain current on interest payments.
In March 2018, the borrower on the Company’s 4 NY hospitality loans in its Legacy, Non-Strategic Portfolio failed to make all required interest payments and the loans were placed on nonaccrual status. These 4 loans are secured by the same collateral. During 2018, the Company recorded $53.8 million of provision for loan losses to reflect the estimated value to be recovered from the borrower following a sale. During 2019, the Company recorded an additional provision for loan loss of $154.3 million based on significant deterioration in the NY hospitality market, feedback from the sales process and the estimated value to be recovered from the borrower following a potential sale. During the three months ended March 31, 2020 the significant detrimental impact of COVID-19 on the U.S. hospitality industry further contributed to the deterioration of the Company’s 4 NY hospitality loans and as such the Company recorded an additional provision for loan losses of $36.8 million. On April 22, 2020, the Company completed a discounted payoff of the NY hospitality loans and related investment interests.
Within its Legacy, Non-Strategic Portfolio, the Company has other loans secured by regional malls, that it has been closely monitoring, as follows:
| |
| • | The Company placed 1 loan secured by a regional mall (“Midwest Regional Mall”) on non-accrual status during 2019 as collectability of the principal was uncertain; as such, interest collected is recognized using the cost recovery method by applying interest collected as a reduction to loan carrying value. The Company recorded $10.6 million of impairment related to Midwest Regional Mall during 2019. Additionally, this loan was transferred to held for sale during 2019 and remains held for sale as of March 31, 2020. |
| |
| • | During 2018, the Company recorded $8.8 million of provision for loan losses on one loan secured by a regional mall (“Northeast Regional Mall B”) to reflect the estimated fair value of the collateral. During 2019, the Company recognized additional provision for loan losses of $10.5 million on Northeast Regional Mall B. The additional provisions were based on then-current and prospective leasing activity to reflect the estimated fair value of the collateral. During the three months ended March 31, 2020, the Northeast Regional Mall was sold. The Company received $9.2 million in gross proceeds and recognized a gain of $1.8 million. |
| |
| • | Also, during 2019, the Company separately recognized provision for loan losses of $18.5 million on 2 loans secured by 1 regional mall (“West Regional Mall”) to reflect the estimated fair value of the collateral. Subsequent to March 31, 2020, the West Regional Mall loan was sold. The company received $23.5 million in gross proceeds and will recognize a gain of $6.8 million. |
| |
| • | Furthermore, during 2019, the Company recognized a $26.7 million provision for loan losses on 3 loans to 2 separate borrowers (“South Regional Mall A” and “South Regional Mall B”) to reflect the estimated fair value of the collateral. During the three months ended March 31, 2020, the Company accepted a discounted payoff of South Regional Mall A. The Company received $22.0 million in gross proceeds and recognized a loss of $1.6 million. Additionally, during the three months ended March 31, 2020, South Regional Mall B was sold. The Company received $13.5 million in gross proceeds and recognized a gain of $8.7 million. |
Additionally, within its Core Portfolio, the Company placed 1 loan secured by a hotel (“Midwest Hospitality”) on non-accrual status due to a borrower default during the fourth quarter of 2019. During the three months ended March 31, 2020 the Company recorded a specific $2.3 million provision for loan loss on the Midwest Hospitality loan to reflect the estimated fair value of the collateral, which was based on feedback from the sales process and the estimated value to be recovered from the borrower following a potential sale. The Company is sweeping cash from the hotel to amortize the unpaid principal balance of the loan.
The following table provides an aging summary of loans and preferred equity held for investment at carrying values before allowance for loan losses, if any (dollars in thousands):
|
| | | | | | | | | | | | | | | | | | | | |
| | | Current or Less Than 30 Days Past Due | | 30-59 Days Past Due(1) | | 60-89 Days Past Due | | 90 Days or More Past Due(1)(2) | | Total Loans |
| March 31, 2020 | | $ | 2,373,626 |
| | $ | — |
| | $ | — |
| | $ | 29,846 |
| | $ | 2,403,472 |
|
| December 31, 2019 | | 2,558,505 |
| | 32,322 |
| | — |
| | 258,129 |
| | 2,848,956 |
|
_________________________________________
COLONY CREDIT REAL ESTATE, INC.
NOTES TO CONSOLIDATED FINANCIAL STATEMENTS (Continued)
(Unaudited)
| |
| (1) | At December 31, 2019, 30-59 days past due includes 1 loan (Midwest Hospitality) that was placed on non-accrual status during the fourth quarter of 2019 following a borrower default. At March 31, 2020, the Midwest Hospitality loan is 90 days or more past due. |
| |
| (2) | At December 31, 2019, 90 days or more past due loans includes 4 NY hospitality loans to the same borrower and secured by the same collateral with combined carrying value before allowance for loan losses of $258.1 million on nonaccrual status. All other loans in this table remain current on interest payments. The 4 loans were classified as held for sale at March 31, 2020 and sold in April 2020. |
Impaired Loans - 2019
Loans are identified as impaired when it is no longer probable that interest or principal will be collected according to the contractual terms of the original loan agreement. Impaired loans include predominantly loans under nonaccrual, performing and nonperforming TDRs, as well as loans in maturity default. The following table presents impaired loans at December 31, 2019 (dollars in thousands):
|
| | | | | | | | | | | | | | | | | | | | |
| | | Unpaid Principal Balance(1) | | Gross Carrying Value | | |
| | | | With Allowance for Loan Losses(2) | | Without Allowance for Loan Losses | | Total(2) | | Allowance for Loan Losses |
| December 31, 2019 | | $ | 408,058 |
| | $ | 377,421 |
| | $ | 32,322 |
| | $ | 409,743 |
| | $ | 272,624 |
|
_________________________________________
| |
| (1) | Includes 4 NY hospitality loans to the same borrower and secured by the same collateral with combined unpaid principal balance of $257.2 million and gross carrying value of $258.1 million on nonaccrual status. All other loans included in this table remain current on interest payments. The 4 loans were classified as held for sale at March 31, 2020 and sold in April 2020. |
| |
| (2) | Includes unpaid principal balance plus any applicable exit fees less net deferred loan fees. |
Upon adoption of ASU 2016-13 the incurred loss model has been replaced with a lifetime current expected credit loss model for the Company’s loans carried at amortized cost, and as such all loans in the Company’s portfolio maintain an allowance for loan losses at March 31, 2020. See Note 2 “Summary of Significant Accounting Policies—Accounting Standards Adopted in 2020—Credit Losses” for further details.
The average carrying value and interest income recognized on impaired loans for the three months ended March 31, 2019 were as follows (dollars in thousands):
|
| | | | |
| | | Three Months Ended March 31, |
| | | 2019 |
| Average carrying value before allowance for loan losses | | $ | 390,376 |
|
| Interest income | | 1,476 |
|
Allowance for Loan Losses
As of December 31, 2019, the allowance for loan losses was $272.6 million related to $409.7 million in carrying value of loans.
Changes in allowance for loan losses on loans are presented below (dollars in thousands):
|
| | | | | | | | |
| | | Three Months Ended March 31, |
| | | 2020 | | 2019 |
| Allowance for loan losses at beginning of period | | $ | 272,624 |
| | $ | 109,328 |
|
Effect of CECL adoption(1) | | 21,093 |
| | — |
|
Provision for loan losses(2)(3) | | 69,686 |
| | — |
|
| Charge-off | | (15,533 | ) | | (31,696 | ) |
| Transfer to loans held for sale | | (295,676 | ) | | — |
|
| Allowance for loan losses at end of period | | $ | 52,194 |
| | $ | 77,632 |
|
_________________________________________
| |
| (1) | Calculated by the Company’s PD/LGD model upon CECL adoption on January 1, 2020. See Note 2, “Summary of Significant Accounting Policies” for further details. |
| |
| (2) | Provision for loan losses excludes $0.2 million calculated by the Company’s PD/LGD model for unfunded commitments reported on the consolidated statement of operations, with a corresponding offset to other liabilities recorded on the Company’s consolidated balance sheets. |
| |
| (3) | Includes $28.8 million related to the Company’s PD/LGD model, $36.8 million recorded on four NY hospitality loans and $2.3 million related to the Midwest hospitality loan, both of which were evaluated individually, and $1.8 million related to the discounted payoff of loans during the quarter. See further discussion in “Nonaccrual and Past Due Loans and Preferred Equity.” |
COLONY CREDIT REAL ESTATE, INC.
NOTES TO CONSOLIDATED FINANCIAL STATEMENTS (Continued)
(Unaudited)
Loans and Preferred Equity Held for Sale
The following table summarizes the Company’s assets held for sale related to loans and preferred equity (dollars in thousands):
|
| | | | | | | | |
| | | March 31, 2020 | | December 31, 2019 |
| Assets | | | | |
| Loans and preferred equity held for investment, net | | $ | 21,191 |
| | $ | 5,016 |
|
| Total assets held for sale | | $ | 21,191 |
| | $ | 5,016 |
|
At March 31, 2020, the Company has classified 7 loans in its Legacy, Non-Strategic Portfolio as held for sale.
There were 0 assets held for sale that constituted discontinued operations as of March 31, 2020 and December 31, 2019.
Credit Quality Monitoring
Loan and preferred equity investments are typically loans secured by direct senior priority liens on real estate properties or by interests in entities that directly own real estate properties, which serve as the primary source of cash for the payment of principal and interest. The Company evaluates its loan and preferred equity investments at least quarterly and differentiates the relative credit quality principally based on: (i) whether the borrower is currently paying contractual debt service in accordance with its contractual terms; and (ii) whether the Company believes the borrower will be able to perform under its contractual terms in the future, as well as the Company’s expectations as to the ultimate recovery of principal at maturity.
As of March 31, 2020, there were 5 loans to 2 borrowers with contractual payments past due, which were the 4 NY hospitality loans in our Legacy, Non-Strategic Portfolio and the Midwest Hospitality loan in our Core Portfolio, as previously discussed. An additional loan, Midwest Regional Mall, was placed on non-accrual status during the fourth quarter of 2019 as collectability of the principal is uncertain; as such, interest collected is recognized using the cost recovery method by applying interest collected as a reduction to loan carrying value. The NY hospitality and Midwest Regional Mall loans were classified as held for sale as of March 31, 2020. The remaining loans and preferred equity investments were performing in accordance with the contractual terms of their governing documents and were categorized as performing loans. There were 5 loans held for investment with contractual payments past due as of December 31, 2019. For the three months ended March 31, 2020, 0 debt investment contributed more than 10.0% of interest income.
The following table provides a summary by carrying values before any allowance for loan losses of the Company’s loans and preferred equity held for investment by year of origination and credit quality risk ranking (dollars in thousands). Refer to Note 2, “Summary of Significant Accounting Policies—Accounting Standards Adopted in 2020—Credit Losses” for loans risk ranking definitions.
COLONY CREDIT REAL ESTATE, INC.
NOTES TO CONSOLIDATED FINANCIAL STATEMENTS (Continued)
(Unaudited)
|
| | | | | | | | | | | | | | | | | | | | | | | | | | | | |
| | | 2020 | | 2019 | | 2018 | | 2017 | | 2016 | | Prior | | Total |
| Senior loans | | | | | | | | | | | | | | |
| Risk Rankings: | | | | | | | | | | | | | | |
| 3 | | $ | — |
| | $ | 377,975 |
| | $ | 292,224 |
| | $ | 33,581 |
| | $ | — |
| | $ | — |
| | $ | 703,780 |
|
| 4 | | — |
| | 798,721 |
| | 603,534 |
| | — |
| | — |
| | — |
| | 1,402,255 |
|
| 5 | | — |
| | — |
| | — |
| | — |
| | — |
| | 29,846 |
| | 29,846 |
|
| Total Senior loans | | — |
| | 1,176,696 |
| | 895,758 |
| | 33,581 |
| | — |
| | 29,846 |
| | 2,135,881 |
|
| | | | | | | | | | | | | | | |
| Mezzanine loans | | | | | | | | | | | | | | |
| Risk Rankings: | | | | | | | | | | | | | | |
| 3 | | — |
| | — |
| | — |
| | — |
| | — |
| | — |
| | — |
|
| 4 | | — |
| | 69,674 |
| | 51,785 |
| | 12,120 |
| | — |
| | 4,534 |
| | 138,113 |
|
| Total Mezzanine loans | | — |
| | 69,674 |
| | 51,785 |
| | 12,120 |
| | — |
| | 4,534 |
| | 138,113 |
|
| | | | | | | | | | | | | | | |
| Preferred equity interests and other | | | | | | | | | | | | | | |
| Risk Rankings: | | | | | | | | | | | | | | |
| 4 | | — |
| | 12,621 |
| | 116,857 |
| | — |
| | — |
| | — |
| | 129,478 |
|
| Total Preferred equity interests and other | | — |
| | 12,621 |
| | 116,857 |
| | — |
| | — |
| | — |
| | 129,478 |
|
| | | | | | | | | | | | | | | |
| Total Loans and preferred equity held for investment | | $ | — |
| | $ | 1,258,991 |
| | $ | 1,064,400 |
| | $ | 45,701 |
| | $ | — |
| | $ | 34,380 |
| | $ | 2,403,472 |
|
Lending Commitments
The Company has lending commitments to borrowers pursuant to certain loan agreements in which the borrower may submit a request for funding contingent on achieving certain criteria, which must be approved by the Company as lender, such as leasing, performance of capital expenditures and construction in progress with an approved budget. At March 31, 2020, assuming the terms to qualify for future fundings, if any, have been met, total gross unfunded lending commitments was $236.7 million. Refer to Note 16, “Commitments and Contingencies” for further details. During the three months ended March 31, 2020, the Company recorded a $2.3 million allowance for lending commitments in accrued and other liabilities on its consolidated balance sheets in accordance with the new credit losses accounting standard No. 2016-13. See Note 2, “Summary of Significant Accounting Policies” for further details.
| |
| 4. | Investments in Unconsolidated Ventures |
Summary
The Company’s investments in unconsolidated ventures represent noncontrolling equity interests in various entities, as follows (dollars in thousands):
|
| | | | | | | | |
| | | March 31, 2020 | | December 31, 2019 |
| Equity method investments | | $ | 577,230 |
| | $ | 585,022 |
|
| Investments under fair value option | | 8,764 |
| | 10,283 |
|
| Investments in Unconsolidated Ventures | | $ | 585,994 |
| | $ | 595,305 |
|
Equity Method Investments
Investment Ventures
Certain of the Company’s equity method investments are structured as joint ventures with one or more private funds or other investment vehicles managed by Colony Capital with third party joint venture partners. These investment entities are generally capitalized through equity contributions from the members, although certain investments are leveraged through various financing arrangements.
COLONY CREDIT REAL ESTATE, INC.
NOTES TO CONSOLIDATED FINANCIAL STATEMENTS (Continued)
(Unaudited)
The assets of the equity method investment entities may only be used to settle the liabilities of these entities and there is no recourse to the general credit of the Company nor the other investors for the obligations of these investment entities. Neither the Company nor the other investors are required to provide financial or other support in excess of their capital commitments. The Company’s exposure to the investment entities is limited to its equity method investment balance as of March 31, 2020 and December 31, 2019, respectively.
The Company’s investments accounted for under the equity method are summarized below (dollars in thousands):
|
| | | | | | | | | | |
| | | | | Carrying Value |
| Investments | | Description | | March 31, 2020 | | December 31, 2019 |
ADC investments(1)(2) | | Interests in three acquisition, development and construction loans in which the Company participates in residual profits from the projects, and the risk and rewards of the arrangements are more similar to those associated with investments in joint ventures | | $ | 59,047 |
| | $ | 59,576 |
|
Other investment ventures(1) | | Interests in nine investments, each with less than $171.5 million carrying value at March 31, 2020 | | 518,183 |
| | 525,446 |
|
_________________________________________
| |
| (1) | The Company’s ownership interest in ADC investments and other investment ventures varies and represents capital contributed to date and may not be reflective of the Company’s economic interest in the entity because of provisions in operating agreements governing various matters, such as classes of partner or member interests, allocations of profits and losses, preferential returns and guaranty of debt. Each equity method investment has been determined to be a VIE for which the Company was not deemed to be the primary beneficiary or a voting interest entity in which the Company does not have the power to control through a majority of voting interest or through other arrangements. |
| |
| (2) | The Company owns varying levels of stated equity interests in certain ADC investments, as well as profit participation interests in real estate ventures without a stated ownership interest in other ADC investments. |
Impairment
During the year ended December 31, 2019, the Company recognized its proportionate share of impairment loss totaling $14.7 million on 1 senior loan secured by a regional mall (“Southeast Regional Mall”) of which the Company owned 50.0% of the joint venture. Southeast Regional Mall was included in the Company’s Legacy, Non-Strategic Portfolio prior to its sale during the three months ended March 31, 2020. The Company received $13.4 million in gross sales proceeds and recognized a gain of $1.6 million.
Also during the year ended December 31, 2019, the Company recorded its proportionate share of impairment loss totaling $16.1 million on 2 loans and an equity partnership interest secured by residential development projects included in its Legacy, Non-Strategic Portfolio. The impairment losses are as a result of revised property sales expectations. The Company also recorded a $17.6 million impairment loss related to an equity participation interest in a joint venture, within its Core Portfolio, to reflect the estimated fair value of the collateral.
The impairment recorded on each of these investments is included in equity in earnings of unconsolidated ventures on the Company’s consolidated statements of operations.
Investments under Fair Value Option
Private Funds
The Company elected to account for its limited partnership interests, which range from 0.1% to 16.1%, in PE Investments under the fair value option. The Company records equity in earnings for these investments based on a change in fair value of its share of projected future cash flows.
During the three months ended March 31, 2020, the Company received the final $1.8 million in proceeds related to the sale of its PE Investments.
Investments in Unconsolidated Ventures Held for Sale
During the three months ended March 31, 2020, the Company classified one investment in an unconsolidated venture it its Legacy, Non-Strategic Portfolio with a carrying value of $11.5 million as held for sale.
COLONY CREDIT REAL ESTATE, INC.
NOTES TO CONSOLIDATED FINANCIAL STATEMENTS (Continued)
(Unaudited)
| |
| 5. | Real Estate Securities, Available for Sale |
Investments in CRE Securities
CRE securities are composed of CMBS backed by a pool of CRE loans which are typically well-diversified by type and geography. The following table presents CMBS investments as of March 31, 2020 and December 31, 2019 (dollars in thousands):
|
| | | | | | | | | | | | | | | | | | | | | | | | | | | | | | | |
| | | | | | | | | | | | | | | | Weighted Average |
| | | | Principal
Amount(1) | | Total Discount | | Amortized
Cost | | Cumulative Unrealized
on Investments | Fair
Value | | Coupon(2) | | Unleveraged
Current
Yield |
| As of Date: | Count | | Gain | | (Loss) | | | |
| March 31, 2020 | 43 | | $ | 292,284 |
| | $ | (54,204 | ) | | $ | 238,080 |
| | $ | — |
| | $ | (58,508 | ) | | $ | 179,572 |
| | 3.19 | % | | 7.12 | % |
| December 31, 2019 | 43 | | 292,284 |
| | (55,981 | ) | | 236,303 |
| | 17,084 |
| | (563 | ) | | 252,824 |
| | 3.19 | % | | 7.12 | % |
_________________________________________
| |
| (1) | CRE securities serve as collateral for financing transactions including carrying value of $178.3 million as of March 31, 2020 for the CMBS Credit Facilities (refer to Note 9, “Debt,” for further detail). The remainder is unleveraged. |
| |
| (2) | All CMBS are fixed rate. |
The Company recorded an unrealized loss in OCI of $75.0 million for the three months ended March 31, 2020 and an unrealized gain in OCI of $9.8 million for the three months ended March 31, 2019. As of March 31, 2020, the Company held 43 securities with a carrying value of $179.6 million and an unrealized loss of $58.5 million, which were not in an unrealized loss position for a period of greater than 12 months. Based on management’s quarterly evaluation, no OTTI was identified related to these securities. The Company does not intend to sell these securities and it is more likely than not that the Company will not be required to sell these securities prior to recovery of the amortized cost basis, which may be at expected maturity.
As of March 31, 2020, the weighted average contractual maturity of CRE securities was 30.8 years with an expected maturity of 6.2 years.
The Company had $0.7 million and $0.7 million of interest receivable related to its real estate securities, available for sale as of March 31, 2020 and December 31, 2019, respectively. This is included in receivables, net on the Company’s consolidated balance sheets.
Investments in Investing VIEs
The Company is the directing certificate holder of 2 securitization trusts and has the ability to appoint and replace the special servicer on all mortgage loans. As such, U.S. GAAP requires the Company to consolidate the assets, liabilities, income and expenses of the securitization trusts as Investing VIEs. Refer to Note 2, “Summary of Significant Accounting Policies” for further discussion on Investing VIEs.
In July 2019, the Company sold its retained investments in the subordinate tranches of 1 securitization trust for $33.4 million in total proceeds. As a result of the sale, the Company deconsolidated 1 of the securitization trusts with gross assets and liabilities of approximately $1.2 billion and $1.2 billion, respectively.
Other than the securities represented by the Company’s subordinate tranches of the securitization trusts, the Company does not have any claim to the assets or exposure to the liabilities of the securitization trusts. The original issuers, who are unrelated third parties, guarantee the interest and principal payments related to the investment grade securitization bonds in the securitization trusts, therefore these obligations do not have any recourse to the general credit of the Company as the consolidator of the securitization trusts. The Company’s maximum exposure to loss would not exceed the carrying value of its retained investments in the securitization trusts, or the subordinate tranches of the securitization trusts.
As of March 31, 2020, the mortgage loans and the related mortgage obligations held in the securitization trusts had an unpaid principal balance of $1.8 billion and $1.6 billion, respectively. As of December 31, 2019, the mortgage loans and the related mortgage obligations held in the securitization trusts had an unpaid principal balance of $1.8 billion and $1.6 billion, respectively. As of March 31, 2020, across the 2 consolidated securitization trusts, the underlying collateral consisted of 115 underlying commercial mortgage loans, with a weighted average coupon of 4.5% and a weighted average loan to value ratio of 56.7%.
COLONY CREDIT REAL ESTATE, INC.
NOTES TO CONSOLIDATED FINANCIAL STATEMENTS (Continued)
(Unaudited)
The following table presents the assets and liabilities recorded on the consolidated balance sheets attributable to the securitization trust as of March 31, 2020 and December 31, 2019 (dollars in thousands):
|
| | | | | | | | |
| | | March 31, 2020 | | December 31, 2019 |
| Assets | | | | |
| Mortgage loans held in a securitization trust, at fair value | | $ | 1,822,991 |
| | $ | 1,872,970 |
|
| Receivables, net | | 7,081 |
| | 7,020 |
|
| Total assets | | $ | 1,830,072 |
| | $ | 1,879,990 |
|
| Liabilities | | | | |
| Mortgage obligations issued by a securitization trust, at fair value | | $ | 1,732,388 |
| | $ | 1,762,914 |
|
| Accrued and other liabilities | | 6,247 |
| | 6,267 |
|
| Total liabilities | | $ | 1,738,635 |
| | $ | 1,769,181 |
|
The Company elected the fair value option to measure the assets and liabilities of the securitization trusts, which requires that changes in valuations of the securitization trusts be reflected in the Company’s consolidated statements of operations.
The difference between the carrying values of the mortgage loans held in securitization trusts and the carrying value of the mortgage obligations issued by securitization trusts was $90.6 million and $110.1 million as of March 31, 2020 and December 31, 2019, respectively, and approximates the fair value of the Company’s retained investments in the subordinate tranches of the securitization trusts, which are eliminated in consolidation. Refer to Note 14, “Fair Value” for a description of the valuation techniques used to measure fair value of assets and liabilities of the Investing VIEs.
The below table presents net income attributable to the Company’s common stockholders for the three months ended March 31, 2020 and 2019 generated from the Company’s investments in the subordinate tranches of the securitization trusts (dollars in thousands):
|
| | | | | | | | |
| | | Three Months Ended March 31, |
| | | 2020 | | 2019 |
| Statement of Operations | | | | |
| Interest expense | | $ | (185 | ) | | $ | (263 | ) |
| Interest income on mortgage loans held in securitization trusts | | 20,555 |
| | 38,476 |
|
| Interest expense on mortgage obligations issued by securitization trusts | | (18,059 | ) | | (35,635 | ) |
| Net interest income | | 2,311 |
| | 2,578 |
|
| Administrative expense | | (515 | ) | | (359 | ) |
| Unrealized gain (loss) on mortgage loans and obligations held in securitization trusts, net | | (19,452 | ) | | 1,029 |
|
| Realized gain on mortgage loans and obligations held in securitization trusts, net | | — |
| | 48 |
|
| Net income attributable to Colony Credit Real Estate, Inc. common stockholders | | $ | (17,656 | ) | | $ | 3,296 |
|
| |
| 6. | Real Estate, net and Real Estate Held for Sale |
The following table presents the Company’s net lease portfolio, net, as of March 31, 2020, and December 31, 2019 (dollars in thousands):
|
| | | | | | | | |
| | | March 31, 2020 | | December 31, 2019 |
| Land and improvements | | $ | 200,742 |
| | $ | 209,693 |
|
| Buildings, building leaseholds, and improvements | | 860,681 |
| | 899,889 |
|
| Tenant improvements | | 23,543 |
| | 25,077 |
|
| Construction-in-progress | | 1,026 |
| | 415 |
|
| Subtotal | | $ | 1,085,992 |
| | $ | 1,135,074 |
|
| Less: Accumulated depreciation | | (68,977 | ) | | (63,995 | ) |
Less: Impairment(1) | | (23,911 | ) | | (23,911 | ) |
| Net lease portfolio, net | | $ | 993,104 |
| | $ | 1,047,168 |
|
_________________________________________
| |
| (1) | See Note 14, “Fair Value,” for discussion of impairment of real estate. |
COLONY CREDIT REAL ESTATE, INC.
NOTES TO CONSOLIDATED FINANCIAL STATEMENTS (Continued)
(Unaudited)
The following table presents the Company’s portfolio of real estate included in its Legacy, Non-Strategic Portfolio, including foreclosed properties, as of March 31, 2020 and December 31, 2019 (dollars in thousands):
|
| | | | | | | | |
| | | March 31, 2020 | | December 31, 2019 |
| Land and improvements | | $ | 60,994 |
| | $ | 91,997 |
|
| Buildings, building leaseholds, and improvements | | 346,439 |
| | 536,046 |
|
| Tenant improvements | | 24,708 |
| | 38,230 |
|
| Furniture, fixtures and equipment | | 179 |
| | 3,183 |
|
| Construction-in-progress | | 4,665 |
| | 6,325 |
|
| Subtotal | | $ | 436,985 |
| | $ | 675,781 |
|
| Less: Accumulated depreciation | | (30,685 | ) | | (46,079 | ) |
Less: Impairment(1) | | (172,416 | ) | | (192,074 | ) |
| Other portfolio, net | | $ | 233,884 |
| | $ | 437,628 |
|
| |
| (1) | See Note 14, “Fair Value,” for discussion of impairment of real estate. |
For the three months ended March 31, 2020, the Company had 0 single property with rental and other income equal to or greater than 10.0% of total revenue.
At March 31, 2020 and December 31, 2019, the Company held foreclosed properties which are included in real estate, net with a carrying value of $3.1 million and $50.7 million, respectively. At March 31, 2020 and December 31, 2019, the Company held foreclosed properties in assets held for sale of $92.3 million and $57.9 million, respectively.
Depreciation Expense
Depreciation expense on real estate was $12.0 million and $19.9 million for the three months ended March 31, 2020 and March 31, 2019, respectively.
Property Operating Income
For the three months ended March 31, 2020 and 2019, the components of property operating income were as follows (dollars in thousands):
|
| | | | | | | | |
| | | Three Months Ended
March 31, |
| | 2020 | | 2019 |
Lease revenues(1) | | | | |
| Minimum lease revenue | | $ | 41,958 |
| | $ | 44,528 |
|
| Variable lease revenue | | 6,649 |
| | 6,656 |
|
| | | $ | 48,607 |
| | $ | 51,184 |
|
| Hotel operating income | | 3,501 |
| | 11,334 |
|
| | | $ | 52,108 |
| | $ | 62,518 |
|
_________________________________________
| |
| (1) | Excludes net amortization income related to above and below-market leases of $0.8 million and $1.2 million for the three months ended March 31, 2020, respectively. |
COLONY CREDIT REAL ESTATE, INC.
NOTES TO CONSOLIDATED FINANCIAL STATEMENTS (Continued)
(Unaudited)
Minimum Future Rents
Minimum rental amounts due under leases are generally either subject to scheduled fixed increases or adjustments. The following table presents approximate future minimum rental income under noncancellable operating leases, excluding variable lease revenue of tenant reimbursements, to be received over the next five years and thereafter as of March 31, 2020 (dollars in thousands):
|
| | | | |
| Remainder of 2020 | | $ | 87,398 |
|
| 2021 | | 106,896 |
|
| 2022 | | 99,485 |
|
| 2023 | | 84,071 |
|
| 2024 | | 73,324 |
|
| 2025 and thereafter | | 466,713 |
|
Total(1) | | $ | 917,887 |
|
_________________________________________
| |
| (1) | Excludes minimum future rents for real estate that is classified as held for sale totaling $40.9 million through 2046. |
The following table presents approximate future minimum rental income under noncancellable operating leases to be received over the next five years and thereafter as of December 31, 2019 (dollars in thousands):
|
| | | | |
| 2020 | | $ | 120,967 |
|
| 2021 | | 113,170 |
|
| 2022 | | 102,314 |
|
| 2023 | | 85,367 |
|
| 2024 | | 71,714 |
|
| 2025 and thereafter | | 448,812 |
|
| Total | | $ | 942,344 |
|
The rental properties owned at March 31, 2020 are leased under noncancellable operating leases with current expirations ranging from 2020 to 2038, with certain tenant renewal rights. For certain properties, the tenants pay the Company, in addition to the contractual base rent, their pro rata share of real estate taxes and operating expenses. Certain lease agreements provide for periodic rental increases and others provide for increases based on the consumer price index.
Commitments and Contractual Obligations
Ground Lease Obligation
In connection with real estate acquisitions, the Company assumed certain noncancellable operating ground leases as lessee or sublessee with expiration dates through 2055. Rents on certain ground leases are paid directly by the tenants. Ground rent expense for the three months ended March 31, 2020 and 2019 was approximately $0.8 million for both periods.
Refer to Note 16, “Commitments and Contingencies” for the details of future minimum rental payments on noncancellable ground lease on real estate as of March 31, 2020.
Real Estate Asset Acquisitions
The following table summarizes the Company’s real estate asset acquisitions for the year ended December 31, 2019 (dollars in thousands):
|
| | | | | | | | | | | | | | | | | | | | | | | | | | | | | | | |
| | | | | | | Purchase Price Allocation |
| Acquisition Date | Property Type and Location | Number of Buildings | | Purchase Price(1) | | Land and Improvements(2) | | Building and Improvements(2) | | Furniture, Fixtures and Equipment | | Lease Intangible Assets(2) | | Other Assets | | Other Liabilities |
| Year Ended December 31, 2019 |
| June | Retail - Massachusetts(3) | 3 |
| | $ | 21,919 |
| | $ | 9,294 |
| | $ | 6,598 |
| | $ | — |
| | $ | 5,256 |
| | $ | 1,538 |
| | $ | (767 | ) |
| January | Various - in U.S.(3) | 28 |
| | 105,437 |
| | 38,145 |
| | 66,413 |
| | — |
| | 879 |
| | 3,223 |
| | (3,223 | ) |
| | | | | $ | 127,356 |
| | $ | 47,439 |
| | $ | 73,011 |
| | $ | — |
| | $ | 6,135 |
| | $ | 4,761 |
| | $ | (3,990 | ) |
_________________________________________
COLONY CREDIT REAL ESTATE, INC.
NOTES TO CONSOLIDATED FINANCIAL STATEMENTS (Continued)
(Unaudited)
| |
| (1) | Dollar amounts of purchase price and allocation to assets acquired and liabilities assumed are translated using foreign exchange rate as of the respective dates of acquisitions, where applicable. |
| |
| (2) | Useful life of real estate acquired is 4 to 33 years for buildings, 1 to 20 years for site improvements, 1 to 27 years for tenant improvements, 5 to 7 years for furniture, fixtures and equipment, and 1 to 27 years for lease intangibles. |
| |
| (3) | Represents assets acquired by the Company through foreclosure. |
Real Estate Held for Sale
The following table summarizes the Company’s assets and related liabilities held for sale related to real estate (dollars in thousands):
|
| | | | | | | | |
| | | March 31, 2020 | | December 31, 2019 |
| Assets | | | | |
| Real estate, net | | $ | 229,252 |
| | $ | 178,564 |
|
| Deferred leasing costs and intangible assets, net | | 8,722 |
| | 5,890 |
|
| Total assets held for sale | | $ | 237,974 |
| | $ | 184,454 |
|
| | | | | |
| Liabilities | | | | |
| Intangible liabilities, net | | $ | 10,842 |
| | $ | 294 |
|
| Total liabilities related to assets held for sale | | $ | 10,842 |
| | $ | 294 |
|
During the three months ended March 31, 2020, the Company classified several properties in its Legacy, Non-Strategic Portfolio as held for sale.
There were no assets held for sale that constituted discontinued operations as of March 31, 2020 and December 31, 2019.
Real Estate Sales
During the three months ended March 31, 2020, the Company completed the sale of 6 properties, including 3 office, 1 hotel, 1 multifamily and 1 manufactured housing for a total gross sales price of $172.6 million and a total loss on sale of $3.6 million. All properties were included in the Company’s Legacy, Non-Strategic Portfolio.
The real estate sold during the three months ended March 31, 2020 did not constitute discontinued operations.
Refer to Note 19, “Subsequent Events” for further detail on additional real estate sales.
| |
| 7. | Deferred Leasing Costs and Other Intangibles |
The Company’s deferred leasing costs, other intangible assets and intangible liabilities, excluding those related to assets held for sale, at March 31, 2020 and December 31, 2019 are as follows (dollars in thousands):
|
| | | | | | | | | | | | |
| | | March 31, 2020 |
| | | Carrying Amount | | Accumulated Amortization | | Net Carrying Amount |
| Deferred Leasing Costs and Intangible Assets | | | | | | |
| In-place lease values | | $ | 98,820 |
| | $ | (33,841 | ) | | $ | 64,979 |
|
| Deferred leasing costs | | 40,575 |
| | (13,593 | ) | | 26,982 |
|
| Above-market lease values | | 13,045 |
| | (6,499 | ) | | 6,546 |
|
| | | $ | 152,440 |
| | $ | (53,933 | ) | | $ | 98,507 |
|
| Intangible Liabilities | | | | | | |
| Below-market lease values | | $ | 19,492 |
| | $ | (8,944 | ) | | $ | 10,548 |
|
COLONY CREDIT REAL ESTATE, INC.
NOTES TO CONSOLIDATED FINANCIAL STATEMENTS (Continued)
(Unaudited)
|
| | | | | | | | | | | | |
| | | December 31, 2019 |
| | | Carrying Amount | | Accumulated Amortization | | Net Carrying Amount |
| Deferred Leasing Costs and Intangible Assets | | | | | | |
| In-place lease values | | $ | 115,139 |
| | $ | (39,093 | ) | | $ | 76,046 |
|
| Deferred leasing costs | | 42,345 |
| | (13,637 | ) | | 28,708 |
|
| Above-market lease values | | 14,318 |
| | (6,310 | ) | | 8,008 |
|
| | | $ | 171,802 |
| | $ | (59,040 | ) | | $ | 112,762 |
|
| Intangible Liabilities | | | | | | |
| Below-market lease values | | $ | 32,652 |
| | $ | (10,503 | ) | | $ | 22,149 |
|
The following table summarizes the amortization of deferred leasing costs, intangible assets and intangible liabilities for the three months ended March 31, 2020 and 2019 (dollars in thousands):
|
| | | | | | | | |
| | | Three Months Ended March 31, |
| | | 2020 | | 2019 |
| Above-market lease values | | $ | (832 | ) | | $ | (1,013 | ) |
| Below-market lease values | | 1,236 |
| | 1,625 |
|
| Net increase (decrease) to property operating income | | $ | 404 |
| | $ | 612 |
|
| | | | | |
| In-place lease values | | $ | 4,350 |
| | $ | 5,474 |
|
| Deferred leasing costs | | 1,647 |
| | 2,139 |
|
| Other intangibles | | (24 | ) | | 119 |
|
| Amortization expense | | $ | 5,973 |
| | $ | 7,732 |
|
The following table presents the amortization of deferred leasing costs, intangible assets and intangible liabilities, excluding those related to assets and liabilities held for sale, for each of the next five years and thereafter as of March 31, 2020 (dollars in thousands):
|
| | | | | | | | | | | | | | | | | | | | | | | | | | | | |
| | | | | | | | | | | | | | | |
| | | 2020 | | 2021 | | 2022 | | 2023 | | 2024 | | 2025 and thereafter | | Total |
| Above-market lease values | | $ | 1,844 |
| | $ | 1,672 |
| | $ | 1,351 |
| | $ | 696 |
| | $ | 516 |
| | $ | 467 |
| | $ | 6,546 |
|
| Below-market lease values | | (3,347 | ) | | (4,043 | ) | | (2,875 | ) | | (178 | ) | | (44 | ) | | (61 | ) | | (10,548 | ) |
| Net increase (decrease) to property operating income | | $ | (1,503 | ) | | $ | (2,371 | ) | | $ | (1,524 | ) | | $ | 518 |
| | $ | 472 |
| | $ | 406 |
| | $ | (4,002 | ) |
| | | | | | | | | | | | | | | |
| In-place lease values | | $ | 9,632 |
| | $ | 10,269 |
| | $ | 7,500 |
| | $ | 4,680 |
| | $ | 3,737 |
| | $ | 29,161 |
| | $ | 64,979 |
|
| Deferred leasing costs | | 4,712 |
| | 5,047 |
| | 4,252 |
| | 3,086 |
| | 1,863 |
| | 8,022 |
| | 26,982 |
|
| Amortization expense | | $ | 14,344 |
| | $ | 15,316 |
| | $ | 11,752 |
| | $ | 7,766 |
| | $ | 5,600 |
| | $ | 37,183 |
| | $ | 91,961 |
|
COLONY CREDIT REAL ESTATE, INC.
NOTES TO CONSOLIDATED FINANCIAL STATEMENTS (Continued)
(Unaudited)
| |
| 8. | Restricted Cash, Other Assets and Accrued and Other Liabilities |
The following table presents a summary of restricted cash as of March 31, 2020 and December 31, 2019 (dollars in thousands):
|
| | | | | | | | |
| | | March 31, 2020 | | December 31, 2019 |
| Restricted cash: | | | | |
| Margin pledged as collateral | | $ | 83,401 |
| | $ | 19,536 |
|
| Borrower escrow deposits | | 49,499 |
| | 74,496 |
|
| Real estate escrow reserves | | 15,132 |
| | 18,020 |
|
| Capital expenditure reserves | | 7,029 |
| | 8,882 |
|
| Working capital and other reserves | | 3,231 |
| | 4,198 |
|
| Tenant lockboxes | | 1,229 |
| | 933 |
|
| Total | | $ | 159,521 |
| | $ | 126,065 |
|
The following table presents a summary of other assets as of March 31, 2020 and December 31, 2019 (dollars in thousands):
|
| | | | | | | | |
| | | March 31, 2020 | | December 31, 2019 |
| Other assets: | | | | |
| Right-of-use lease asset | | $ | 24,255 |
| | $ | 25,480 |
|
| Prepaid taxes and deferred tax assets | | 22,440 |
| | 21,989 |
|
| Deferred financing costs, net - credit facilities | | 7,815 |
| | 8,382 |
|
| Prepaid expenses | | 6,568 |
| | 5,311 |
|
| Investment deposits and pending deal costs | | 935 |
| | 20,779 |
|
| Other assets | | 621 |
| | 1,644 |
|
| Derivative asset | | 9 |
| | 4,122 |
|
| Total | | $ | 62,643 |
| | $ | 87,707 |
|
The following table presents a summary of accrued and other liabilities as of March 31, 2020 and December 31, 2019 (dollars in thousands):
|
| | | | | | | | |
| | | March 31, 2020 | | December 31, 2019 |
| Accrued and other liabilities: | | | | |
| Derivative liability | | $ | 33,344 |
| | $ | 19,133 |
|
| Current and deferred tax liability | | 28,679 |
| | 31,510 |
|
| Operating lease liability | | 24,295 |
| | 25,495 |
|
| Accounts payable, accrued expenses and other liabilities | | 23,273 |
| | 28,278 |
|
| Interest payable | | 17,103 |
| | 16,259 |
|
| Prepaid rent and unearned revenue | | 14,464 |
| | 16,744 |
|
| Tenant security deposits | | 2,459 |
| | 3,005 |
|
| Unfunded CECL loan allowance | | 2,339 |
| | — |
|
| Total | | $ | 145,956 |
| | $ | 140,424 |
|
COLONY CREDIT REAL ESTATE, INC.
NOTES TO CONSOLIDATED FINANCIAL STATEMENTS (Continued)
(Unaudited)
The following table presents debt as of March 31, 2020 and December 31, 2019 (dollars in thousands):
|
| | | | | | | | | | | | | | | | | | | | | | | | | |
| | | | | | | | | | March 31, 2020 | | December 31, 2019 |
| | Capacity ($) | | Recourse vs.
Non-Recourse(1) | | Final
Maturity | | Contractual
Interest Rate | | Principal
Amount(2) | | Carrying
Value(2) | | Principal
Amount(2) | | Carrying
Value(2) |
| Securitization bonds payable, net | | | | | | | | | | | | | | | |
CLNC 2019-FL1(3) | | | Non-recourse | | Aug-35 | | LIBOR + 1.59% | | $ | 840,423 |
| | $ | 833,671 |
| | $ | 840,423 |
| | $ | 833,153 |
|
| Subtotal securitization bonds payable, net | | | | | | | | | 840,423 |
| | 833,671 |
| | 840,423 |
| | 833,153 |
|
| | | | | | | | | | | | | | | | |
| Mortgage and other notes payable, net | | | | | | | | | | | | | | | |
Net lease 6(4) | | | Non-recourse | | Oct-27 | | 4.45% | | 23,990 |
| | 23,990 |
| | 24,117 |
| | 24,117 |
|
Net lease 5(5) | | | Non-recourse | | Nov-26 | | 4.45% | | 3,406 |
| | 3,317 |
| | 3,422 |
| | 3,329 |
|
Net lease 4(5) | | | Non-recourse | | Nov-26 | | 4.45% | | 7,349 |
| | 7,157 |
| | 7,384 |
| | 7,184 |
|
Net lease 3(5) | | | Non-recourse | | Jun-21 | | 4.00% | | 12,364 |
| | 12,296 |
| | 12,450 |
| | 12,368 |
|
Net lease 6(5) | | | Non-recourse | | Jul-23 | | LIBOR + 2.15% | | 1,550 |
| | 1,510 |
| | 1,658 |
| | 1,615 |
|
Net lease 5(4) | | | Non-recourse | | Aug-26 | | 4.08% | | 31,677 |
| | 31,406 |
| | 31,821 |
| | 31,539 |
|
Net lease 1(5)(6) | | | Non-recourse | | Nov-26 | | 4.45% | | 18,492 |
| | 18,007 |
| | 18,579 |
| | 18,076 |
|
Net lease 1(7) | | | Non-recourse | | Mar-28 | | 4.38% | | 12,166 |
| | 11,716 |
| | 12,221 |
| | 11,758 |
|
Net lease 4(4) | | | Non-recourse | | Apr-21(8) | | LIBOR + 2.50% | | 74,916 |
| | 74,916 |
| | 74,916 |
| | 74,845 |
|
Net lease 1(4) | | | Non-recourse | | Jul-25 | | 4.31% | | 250,000 |
| | 247,090 |
| | 250,000 |
| | 246,961 |
|
Net lease 2(4)(9) | | | Non-recourse | | Jun-25 | | 3.91% | | 152,768 |
| | 154,934 |
| | 181,952 |
| | 184,532 |
|
Net lease 3(4) | | | Non-recourse | | Sep-33 | | 4.77% | | 200,000 |
| | 198,541 |
| | 200,000 |
| | 198,521 |
|
Other real estate 4(5) | | | Non-recourse | | Dec-23 | | 4.84% | | 42,705 |
| | 43,152 |
| | 42,925 |
| | 43,407 |
|
Other real estate 2(5)(10) | | | Non-recourse | | Dec-23 | | 4.94% | | — |
| | — |
| | 42,443 |
| | 42,851 |
|
Other real estate 8(5) | | | Non-recourse | | Jan-24 | | 5.15% | | 15,764 |
| | 16,270 |
| | 15,819 |
| | 16,324 |
|
Other real estate 10(5)(11) | | | Non-recourse | | Dec-20 | | 5.34% | | 11,683 |
| | 11,879 |
| | 11,744 |
| | 11,939 |
|
Other real estate 9(5) | | | Non-recourse | | Nov-26 | | 3.98% | | 23,774 |
| | 23,022 |
| | 23,885 |
| | 23,133 |
|
Other real estate 1(5) | | | Non-recourse | | Oct-24 | | 4.47% | | 108,311 |
| | 109,019 |
| | 108,719 |
| | 109,475 |
|
Other real estate 3(5) | | | Non-recourse | | Jan-25 | | 4.30% | | 74,803 |
| | 74,148 |
| | 75,256 |
| | 74,554 |
|
Other real estate 5(5)(10) | | | Non-recourse | | Apr-23 | | LIBOR + 4.00% | | — |
| | — |
| | 33,498 |
| | 32,801 |
|
Other real estate 6(5)(12) | | | Non-recourse | | Apr-24 | | LIBOR + 2.95% | | 21,500 |
| | 20,922 |
| | 21,500 |
| | 20,825 |
|
Loan 9(13) | | | Non-recourse | | Jun-24 | | LIBOR + 3.00% | | 69,559 |
| | 69,559 |
| | 65,958 |
| | 65,958 |
|
| Subtotal mortgage and other notes payable, net | | | | | | | | | 1,156,777 |
| | 1,152,851 |
| | 1,260,267 |
| | 1,256,112 |
|
| | | | | | | | | | | | | | | | |
| Bank credit facility | | | | | | | | | | | | | | | |
Bank credit facility(14) | $ | 560,000 |
| | Recourse | | Feb-23 (15) | | LIBOR + 2.25% | | 340,000 |
| | 340,000 |
| | 113,500 |
| | 113,500 |
|
| Subtotal bank credit facility | | | | | | | | | 340,000 |
|
| 340,000 |
| | 113,500 |
| | 113,500 |
|
| | | | | | | | | | | | | | | | |
| Master repurchase facilities | | | | | | | | | | | | | | | |
| Bank 1 facility 3 | $ | 400,000 |
| | Limited Recourse(16) | | Apr-23(17) | | LIBOR + 1.93% | (18) | 109,404 |
| | 109,404 |
| | 106,309 |
| | 106,309 |
|
| Bank 2 facility 3 | 200,000 |
| | Limited Recourse(16) | | Oct-22(19) | | LIBOR + 2.50% | (18) | 22,750 |
| | 22,750 |
| | 22,750 |
| | 22,750 |
|
| Bank 3 facility 3 | 600,000 |
| | Limited Recourse(16) | | Apr-22 | | LIBOR + 2.19% | (18) | 222,147 |
| | 222,147 |
| | 265,633 |
| | 265,633 |
|
| Bank 7 facility 1 | 500,000 |
| | Limited Recourse(16) | | Apr-22(20) | | LIBOR + 1.93% | (18) | 199,740 |
| | 199,740 |
| | 221,421 |
| | 221,421 |
|
| Bank 8 facility 1 | 250,000 |
| | Limited Recourse(16) | | Jun-21(21) | | LIBOR + 2.00% | (18) | 168,987 |
| | 168,987 |
| | 164,098 |
| | 164,098 |
|
| Bank 9 facility 1 | 300,000 |
| | (22) | | Nov-23(23) | | (24) | (18) | — |
| | — |
| | — |
| | — |
|
| Subtotal master repurchase facilities | $ | 2,250,000 |
| | | | | | | | 723,028 |
| | 723,028 |
| | 780,211 |
| | 780,211 |
|
| | | | | | | | | | | | | | | | |
COLONY CREDIT REAL ESTATE, INC.
NOTES TO CONSOLIDATED FINANCIAL STATEMENTS (Continued)
(Unaudited)
|
| | | | | | | | | | | | | | | | | | | | | | | | | |
| | | | | | | | | | March 31, 2020 | | December 31, 2019 |
| | Capacity ($) | | Recourse vs.
Non-Recourse(1) | | Final
Maturity | | Contractual
Interest Rate | | Principal
Amount(2) | | Carrying
Value(2) | | Principal
Amount(2) | | Carrying
Value(2) |
| CMBS credit facilities | | | | | | | | | | | | | | | |
| Bank 1 facility 1 | | | Recourse | | (25) | | LIBOR + 1.82% | (18) | 13,477 |
| | 13,477 |
| | 20,375 |
| | 20,375 |
|
| Bank 1 facility 2 | | | Recourse | | (25) | | LIBOR + 3.00% | (18) | 12,907 |
| | 12,907 |
| | 18,834 |
| | 18,834 |
|
| Bank 3 facility |
|
| | Recourse | | (25) | | NA | (26) | — |
| | — |
| | — |
| | — |
|
| Bank 4 facility | | | Recourse | | (25) | | NA | (26) | — |
| | — |
| | — |
| | — |
|
| Bank 5 facility 1 | | | Recourse | | (25) | | NA | (26) | — |
| | — |
| | — |
| | — |
|
| Bank 5 facility 2 | | | Recourse | | (25) | | NA | (26) | — |
| | — |
| | — |
| | — |
|
| Bank 6 facility 1 | | | Recourse | | (25) | | (27) | | 86,035 |
| | 86,035 |
| | 83,584 |
| | 83,584 |
|
| Bank 6 facility 2 | | | Recourse | | (25) | | (27) | | 84,972 |
| | 84,972 |
| | 82,729 |
| | 82,729 |
|
| Subtotal CMBS credit facilities | | | | | | | | | 197,391 |
| | 197,391 |
| | 205,522 |
| | 205,522 |
|
| Subtotal credit facilities | | | | | | | | | 1,260,419 |
| | 1,260,419 |
| | 1,099,233 |
| | 1,099,233 |
|
| | | | | | | | | | | | | | | | |
| Total |
|
| | | | | | | | $ | 3,257,619 |
| | $ | 3,246,941 |
| | $ | 3,199,923 |
| | $ | 3,188,498 |
|
_________________________________________
| |
| (1) | Subject to customary non-recourse carveouts. |
| |
| (2) | Difference between principal amount and carrying value of securitization bonds payable, net and mortgage and other notes payable, net is attributable to deferred financing costs, net and premium/discount on mortgage notes payable. |
| |
| (3) | The Company, through indirect Cayman subsidiaries, securitized commercial mortgage loans originated by the Company. Senior notes issued by the securitization trusts were generally sold to third parties and subordinated notes retained by the Company. These securitizations are accounted for as secured financing with the underlying mortgage loans pledged as collateral. Principal payments from underlying collateral loans must be applied to repay the notes until fully paid off, irrespective of the contractual maturities on the notes. Underlying collateral loans have initial terms of two to three years. |
| |
| (4) | Represents a mortgage note collateralized by an investment in the Company’s Core Portfolio. |
| |
| (5) | Represents a mortgage note collateralized by an investment in the Company’s Legacy, Non-Strategic Portfolio. |
| |
| (6) | Payment terms are periodic payment of principal and interest for debt on 2 properties and periodic payment of interest only with principal at maturity (except for principal repayments to release collateral properties disposed) for debt on 1 property. |
| |
| (7) | Represents a mortgage note collateralized by 3 properties in the Company’s Legacy, Non-Strategic Portfolio. |
| |
| (8) | The current maturity of the mortgage payable is April 2020, with a one-year extension available at the Company’s option, which may be subject to the satisfaction of certain customary conditions set forth in the governing documents. The Company exercised this extension option subsequent to March 31, 2020. |
| |
| (9) | As of March 31, 2020, the outstanding principal of the mortgage payable was NOK 1.6 billion, which translated to $152.8 million. |
| |
| (10) | Represents a mortgage note that was repaid during the first quarter of 2020 in connection with the sale of the collateralized properties. |
| |
| (11) | Represents 2 separate senior mortgage notes with a weighted average maturity of December 2020 and weighted average interest rate of 5.34%. |
| |
| (12) | The current maturity of the mortgage payable is April 2022, with 2 one-year extensions available at the Company’s option, which may be subject to the satisfaction of certain customary conditions set forth in the governing documents. |
| |
| (13) | The current maturity of the note payable is June 2021, with 3 one-year extensions available at the Company’s option, which may be subject to the satisfaction of certain customary conditions set forth in the governing documents. The loan is included in the Company’s Core Portfolio. |
| |
| (14) | Facility size reduced on May 6, 2020 to $450.0 million. |
| |
| (15) | The ability to borrow additional amounts terminates on February 1, 2022 at which time the Company may, at its election, extend the termination date for 2 additional six-month terms. |
| |
| (16) | Recourse solely with respect to 25.0% of the financed amount. |
| |
| (17) | The next maturity date is April 2021, with 2 one-year extensions available at the option of the Company, which may be exercised upon the satisfaction of certain customary conditions set forth in the governing documents. |
| |
| (18) | Represents the weighted average spread as of March 31, 2020. The contractual interest rate depends upon asset type and characteristics and ranges from one-month London Interbank Offered Rates (“LIBOR”) plus 1.10% to 3.00%. |
| |
| (19) | The next maturity date is October 2020, with 2 one-year extension options available, which may be subject to the satisfaction of certain customary conditions set forth in the governing documents. |
| |
| (20) | The next maturity date is April 2021, with a one-year extension available, which may be subject to the satisfaction of certain customary conditions set forth in the governing documents. |
| |
| (21) | The next maturity date is June 2020, with a one-year extension available, which may be subject to the satisfaction of certain customary conditions set forth in the governing documents. |
| |
| (22) | Recourse is either 25.0% or 50.0% depending on loan metrics. |
| |
| (23) | The next maturity date is November 2021, with 2 one-year extension options available, which may be subject to the satisfaction of certain customary conditions set forth in the governing documents. |
| |
| (24) | The interest rate will be determined by the lender in its sole discretion. |
| |
| (25) | The maturity dates on the CMBS Credit Facilities are dependent upon asset type and will typically range from one to three months. |
| |
| (26) | CMBS Credit Facilities are undrawn and fully available. |
| |
| (27) | Bank 6 Facilities 1 and 2 both have fixed and floating rate financing. Bank 6 Facility 1 consists of $22.6 million financed with a fixed rate of 4.50% and $63.4 million financed with a weighted average interest rate of LIBOR plus 1.77%. Bank 6 Facility 2 consists of $45.5 million financed with a fixed rate of 4.50% and $39.5 million financed with a weighted average interest rate of LIBOR plus 1.50%. |
COLONY CREDIT REAL ESTATE, INC.
NOTES TO CONSOLIDATED FINANCIAL STATEMENTS (Continued)
(Unaudited)
Future Minimum Principal Payments
The following table summarizes future scheduled minimum principal payments at March 31, 2020 based on initial maturity dates or extended maturity dates to the extent criteria are met and the extension option is at the borrower’s discretion (dollars in thousands):
|
| | | | | | | | | | | | | | | |
| | Total | | Securitization Bonds Payable, Net | | Mortgage Notes Payable, Net(1) | | Credit
Facilities(1) |
| Remainder of 2020 | $ | 211,060 |
| | $ | — |
| | $ | 13,669 |
| | $ | 197,391 |
|
| 2021 | 258,421 |
| | — |
| | 89,434 |
| | 168,987 |
|
| 2022 | 447,157 |
| | — |
| | 2,520 |
| | 444,637 |
|
| 2023 | 494,529 |
| | — |
| | 45,125 |
| | 449,404 |
|
| 2024 | 217,353 |
| | — |
| | 217,353 |
| | — |
|
| 2025 and thereafter | 1,629,099 |
| | 840,423 |
| | 788,676 |
| | — |
|
| Total | $ | 3,257,619 |
| | $ | 840,423 |
| | $ | 1,156,777 |
| | $ | 1,260,419 |
|
_________________________________________
| |
| (1) | Includes $131.3 million of future minimum principal payments related to assets held for sale. |
Bank Credit Facility
On February 1, 2018, the Company, through subsidiaries, including the OP, entered into a credit agreement with several lenders to provide a revolving credit facility in the aggregate principal amount of up to $400.0 million (the “Bank Credit Facility”). On February 4, 2019, the aggregate amount of revolving commitments was increased to $560.0 million and on May 6, 2020 these commitments were reduced to $450.0 million. The Bank Credit Facility will mature on February 1, 2022, unless the OP elects to extend the maturity date for up to 2 additional six-month terms.
The maximum amount available for borrowing at any time under the Bank Credit Facility is limited to a borrowing base valuation of certain investment assets, with the valuation of such investment assets generally determined according to a percentage of adjusted net book value. At March 31, 2020, the borrowing base valuation was sufficient to support the outstanding principal amount of $340.0 million.
Advances under the Bank Credit Facility accrue interest at a per annum rate equal to, at the applicable borrower’s election, either a LIBOR rate plus a margin of 2.25%, or a base rate determined according to a prime rate or federal funds rate plus a margin of 1.25%. The Company pays a commitment fee of 0.25% or 0.35% per annum of the unused amount (0.25% at March 31, 2020), depending upon the amount of facility utilization.
Substantially all material wholly owned subsidiaries of the Company guarantee the obligations of the Company and any other borrowers under the Bank Credit Facility. As security for the advances under the Bank Credit Facility, the Company pledged substantially all equity interests it owns and granted a security interest in deposit accounts in which the proceeds of investment asset distributions are maintained.
The Bank Credit Facility contains various affirmative and negative covenants including financial covenants that require the Company to maintain minimum tangible net worth, liquidity levels and financial ratios, as specified in the Bank Credit Facility. At March 31, 2020, the Company was in compliance with all of the financial covenants.
Refer to Note 19, “Subsequent Events” for further discussion regarding the status of the Company’s Bank Credit Facility.
Securitization Financing Transactions
Securitization bonds payable, net represent debt issued by securitization vehicles consolidated by the Company. Senior notes issued by these securitization trusts were generally sold to third parties and subordinated notes retained by the Company. Payments from underlying collateral loans must be applied to repay the notes until fully paid off, irrespective of the contractual maturities of the loans.
In October 2019, the Company executed a securitization transaction, through wholly-owned subsidiaries, CLNC 2019-FL1, Ltd. and CLNC 2019-FL1, LLC (collectively, “CLNC 2019-FL1”), which resulted in the sale of $840.4 million of investment grade notes. The securitization reflects an advance rate of 83.5% at a weighted average cost of funds of LIBOR plus 1.59%, and is collateralized by a pool of 22 senior loans originated by the Company.
COLONY CREDIT REAL ESTATE, INC.
NOTES TO CONSOLIDATED FINANCIAL STATEMENTS (Continued)
(Unaudited)
As of March 31, 2020, the Company had $1.0 billion carrying value of CRE debt investments financed with $840.4 million of securitization bonds payable, net.
Master Repurchase Facilities
As of March 31, 2020, the Company, through subsidiaries, had entered into repurchase agreements with multiple global financial institutions to provide an aggregate principal amount of up to $2.3 billion to finance the origination of first mortgage loans and senior loan participations secured by CRE debt investments (“Master Repurchase Facilities”). The Company agreed to guarantee certain obligations under the Master Repurchase Facilities, which contain representations, warranties, covenants, conditions precedent to funding, events of default and indemnities that are customary for agreements of this type. The Master Repurchase Facilities act as revolving loan facilities that can be paid down as assets are repaid or sold and re-drawn upon for new investments. As of March 31, 2020, the Company was in compliance with all of its financial covenants under the Master Repurchase Facilities.
As of March 31, 2020, the Company had $1.0 billion carrying value of CRE debt investments financed with $723.0 million under the master repurchase facilities.
During the three months ended March 31, 2020, the Company received and timely paid a margin call on a hospitality loan and made voluntarily paydowns on 2 other hospitality and 1 retail loan. The lender granted the Company a holiday from future margin calls between three and four months, and it obtained broader discretion to enter into permitted modifications with the borrowers on these three specific loans, if necessary.
Refer to Note 19, “Subsequent Events” for further discussion regarding the status of the Company’s Master Repurchase Facilities.
CMBS Credit Facilities
As of March 31, 2020, the Company entered into 8 master repurchase agreements (collectively the “CMBS Credit Facilities”) to finance CMBS investments. The CMBS Credit Facilities are on a recourse basis and contain representations, warranties, covenants, conditions precedent to funding, events of default and indemnities that are customary for agreements of this type. As of March 31, 2020, the Company had $178.3 million carrying value of CRE securities financed with $172.8 million under its CMBS Credit Facilities. As of March 31, 2020, the Company had $28.5 million carrying value of underlying investments in the subordinate tranches of the securitization trusts financed with $24.6 million under its CMBS Credit Facilities.
During the three months ended March 31, 2020, the Company received and timely paid margin calls on its CMBS master repurchase facilities of $48.9 million.
Refer to Note 19, “Subsequent Events” for further discussion regarding the status of the Company’s CMBS Credit Facilities.
| |
| 10. | Related Party Arrangements |
Management Agreement
On January 31, 2018, the Company and the OP entered into a management agreement (the “Management Agreement”) with the Manager, pursuant to which the Manager manages the Company’s assets and its day-to-day operations. The Manager is responsible for, among other matters, (1) the selection, origination, acquisition, management and sale of the Company’s portfolio investments, (2) the Company’s financing activities and (3) providing the Company with investment advisory services. The Manager is also responsible for the Company’s day-to-day operations and will perform (or will cause to be performed) such services and activities relating to the Company’s investments and business and affairs as may be appropriate. The Management Agreement requires the Manager to manage the Company’s business affairs in conformity with the investment guidelines and other policies that are approved and monitored by the Board of Directors. Each of the Company’s executive officers is also an employee of the Manager or its affiliates. The Manager’s role as Manager will be under the supervision and direction of the Company’s Board of Directors.
The initial term of the Management Agreement expires on the third anniversary of the Closing Date and will be automatically renewed for a one-year term each anniversary date thereafter unless earlier terminated as described below. The Company’s independent directors review the Manager’s performance and the fees that may be payable to the Manager annually and, following the initial term, the Management Agreement may be terminated if there has been an affirmative vote of at least two-thirds of the Company’s independent directors determining that (1) there has been unsatisfactory performance by the Manager that is materially detrimental to the Company or (2) the compensation payable to the Manager, in the form of base management fees and incentive fees taken as a whole, or the amount thereof, is not fair to the Company, subject to the Manager’s right to prevent such termination due to unfair fees by accepting reduced compensation as agreed to by at least two-thirds of the Company’s independent directors. The Company must provide the Manager 180 days’ prior written notice of any such termination.
COLONY CREDIT REAL ESTATE, INC.
NOTES TO CONSOLIDATED FINANCIAL STATEMENTS (Continued)
(Unaudited)
The Company may also terminate the Management Agreement for cause (as defined in the Management Agreement) at any time, including during the initial term, without the payment of any termination fee, with at least 30 days’ prior written notice from the Company’s Board of Directors. Unless terminated for cause, the Manager will be paid a termination fee as described below. The Manager may terminate the Management Agreement if the Company becomes required to register as an investment company under the Investment Company Act with such termination deemed to occur immediately before such event, in which case the Company would not be required to pay a termination fee. The Manager may decline to renew the Management Agreement by providing the Company with 180 days’ prior written notice, in which case the Company would not be required to pay a termination fee. The Manager may also terminate the Management Agreement with at least 60 days’ prior written notice if the Company breaches the Management Agreement in any material respect or otherwise is unable to perform its obligations thereunder and the breach continues for a period of 30 days after written notice to the Company, in which case the Manager will be paid a termination fee as described below.
In November 2019 the Manager, the Company and the OP amended and restated the Management Agreement to modify the “Core Earnings” definition, providing that “unrealized provisions for loan losses and real estate impairments” shall only be applied as exclusions from the definition of Core Earnings if approved by a majority of the independent directors of the Company. Such change became effective during the fourth quarter of 2019 and results in a reduction to Core Earnings which thereby reduces the annual management fee and any incentive fee paid by the Company due to accumulated unrealized provisions for loan losses and real estate impairments to date.
Fees to Manager
Base Management Fee
The base management fee payable to the Manager is equal to 1.5% of the Company’s stockholders’ equity (as defined in the Management Agreement), per annum (0.375% per quarter), payable quarterly in arrears in cash. For purposes of calculating the base management fee, the Company’s stockholders’ equity means: (a) the sum of (1) the net proceeds received by the Company (or, without duplication, the Company’s direct subsidiaries, such as the OP) from all issuances of the Company’s or such subsidiaries’ common and preferred equity securities since inception (allocated on a pro rata basis for such issuances during the calendar quarter of any such issuance), plus (2) the Company’s cumulative Core Earnings (as defined in the Management Agreement) from and after the Closing Date to the end of the most recently completed calendar quarter, less (b)(1) any distributions to the Company’s common stockholders (or owners of common equity of the Company’s direct subsidiaries, such as the OP, other than the Company or any of such subsidiaries), (2) any amount that the Company or any of the Company’s direct subsidiaries, such as the OP, have paid to (x) repurchase for cash the Company’s common stock or common equity securities of such subsidiaries or (y) repurchase or redeem for cash the Company’s preferred equity securities or preferred equity securities of such subsidiaries, in each case since the Closing Date and (3) any incentive fee (as described below) paid to the Manager since the Closing Date.
For the three months ended March 31, 2020 and 2019, the total management fee expense incurred was $7.9 million and $11.4 million, respectively. As of March 31, 2020 and December 31, 2019, $8.2 million and $8.4 million, respectively, of unpaid management fee were included in due to related party in the Company’s consolidated balance sheets.
Incentive Fee
The incentive fee payable to the Manager is equal to the difference between (i) the product of (a) 20% and (b) the difference between (1) Core Earnings (as defined in the Management Agreement) for the most recent 12-month period (or the Closing Date if it has been less than 12 months since the Closing Date), including the current quarter, and (2) the product of (A) common equity (as defined in the Management Agreement) in the most recent 12-month period (or the Closing Date if it has been less than 12 months since the Closing Date), and (B) 7% per annum and (ii) the sum of any incentive fee paid to the Manager with respect to the first three calendar quarters of the most recent 12-month period (or the Closing Date if it has been less than 12 months since the Closing Date), provided, however, that no incentive fee is payable with respect to any calendar quarter unless Core Earnings (as defined in the Management Agreement) is greater than zero for the most recently completed 12 calendar quarters (or the Closing Date if it has been less than 12 calendar quarters since the Closing Date).
The Company did not incur any incentive fees during the three months ended March 31, 2020 and 2019.
Reimbursements of Expenses
Reimbursement of expenses related to the Company incurred by the Manager, including legal, accounting, financial, due diligence and other services are paid on the Company’s behalf by the OP or its designee(s). The Company reimburses the Manager for the Company’s allocable share of the salaries and other compensation of the Company’s chief financial officer and certain of its affiliates’ non-investment personnel who spend all or a portion of their time managing the Company’s affairs, and the Company’s
COLONY CREDIT REAL ESTATE, INC.
NOTES TO CONSOLIDATED FINANCIAL STATEMENTS (Continued)
(Unaudited)
share of such costs are based upon the percentage of such time devoted by personnel of the Manager (or its affiliates) to the Company’s affairs. The Company may be required to pay the Company’s pro rata portion of rent, telephone, utilities, office furniture, equipment, machinery and other office, internal and overhead expenses of the Manager and its affiliates required for the Company’s operations.
For the three months ended March 31, 2020 and 2019, the total reimbursements of expenses incurred by the Manager on behalf of the Company and reimbursable in accordance with the Management Agreement was $2.7 million and is included in administrative expense on the consolidated statements of operations. As of both March 31, 2020 and December 31, 2019, there were $2.7 million of unpaid expenses included in due to related party in the Company’s consolidated balance sheets.
Other Payables to Manager
Other payables to the Manager include Combination related adjustments that consist of certain cash contributions from and distributions to Colony Capital or its subsidiaries on behalf of the CLNY Contributed Portfolio.
For the three months ended March 31, 2020, there were 0 other payables to the Manager. For the three months ended March 31, 2019, the other payables to the Manager was $1.6 million related to tax obligations associated with the vesting of restricted common stock and was included in due to related party in the Company’s consolidated balance sheet as of March 31, 2019. This was paid as of March 31, 2020.
Equity Plan Grants
In March 2019, the Company granted 800,000 shares to the Manager and/or employees thereof under the 2018 Equity Incentive Plan (the “2018 Plan”). In March 2018, the Company granted 978,946 shares to its non-independent directors, officers and the Manager and/or employees thereof under the 2018 Plan. 735,473 shares remain granted and unvested as of March 31, 2020. See Note 11, “Equity-Based Compensation” for further discussion on the 2018 Plan including shares issued to independent directors of the Company. In connection with these grants, the Company recognized share-based compensation expense of $0.2 million and $1.8 million to its Manager within administrative expense in the consolidated statement of operations for the three months ended March 31, 2020 and March 31, 2019, respectively.
Colony Capital, Inc. Internalization Discussions with the Company
On April 1, 2020, Colony Capital reported in Amendment No. 3 to the Schedule 13D filed with the SEC that it has postponed any decision regarding a disposition of its management agreement with the Company until market conditions improve due to ongoing uncertainty surrounding the duration and magnitude of the COVID-19 pandemic and its impact on the global economy.
Investment Activity
All investment acquisitions are approved in accordance with the Company’s investment and related party guidelines, which may include approval by either the audit committee or disinterested members of the Company’s Board of Directors. No investment by the Company will require approval under the related party transaction policy solely because such investment constitutes a co-investment made by and between the Company and any of its subsidiaries, on the one hand, and one or more investment vehicles formed, sponsored, or managed by an affiliate of the Manager on the other hand.
In July 2017, NorthStar II entered into a joint venture with an affiliate of the Manager to make a $60.0 million investment in a $180.0 million mezzanine loan which was originated by such affiliate of the Manager. The transaction was approved by NorthStar II’s board of directors, including all of its independent directors. The investment was purchased by the Company in connection with the Combination. In June 2018, the Company increased its commitment to $101.8 million in connection with the joint venture bifurcating the mezzanine loan into a mezzanine loan and a preferred equity investment. The Company’s interest in both the underlying mezzanine loan and preferred equity investment is 31.8%, and the affiliate entities own the remaining 68.2%. Both the underlying mezzanine loan and preferred equity investment carry a fixed 13.0% interest rate. This investment is recorded in investments in unconsolidated ventures in the Company’s consolidated balance sheets. In July 2019, the Company increased its commitment in the mezzanine loan from $101.8 million to $189.0 million. The Company’s interest in the upsized mezzanine loan is 45.2% and it carries a fixed 13.0% interest rate. As of March 31, 2020, the Company had an unfunded commitment of $32.2 million remaining.
In May 2018, the Company acquired an $89.1 million (at par) preferred equity investment in an investment vehicle that owns a seven-property office portfolio located in the New York metropolitan area from an affiliate of the Company’s Manager. The affiliate has a 27.2% ownership interest in the borrower. The preferred equity investment carries a fixed 12.0% interest rate. This investment is recorded in loans and preferred equity held for investment, net in the Company’s consolidated balance sheets.
COLONY CREDIT REAL ESTATE, INC.
NOTES TO CONSOLIDATED FINANCIAL STATEMENTS (Continued)
(Unaudited)
In July 2018, the Company acquired a $326.8 million Class A office campus located in Norway from an affiliate of the Company’s Manager. In connection with the purchase, the Company assumed senior mortgage financing from a private bond issuance of $197.7 million. The bonds have a five-year term remaining, and carry a fixed interest rate of 3.91%.
In July 2018, the Company entered into a joint venture to invest in a development project for land and a Grade A office building in Ireland. The Company agreed to invest up to $69.9 million of the $139.7 million total commitment. The Company co-invested along with two affiliates of the Manager, with the Company owning 50.0% of the joint venture and the affiliate entities owning the remaining 50.0%. The joint venture invested in a senior mortgage loan of $66.7 million with a fixed interest rate of 12.5% and a maturity date of 3.5 years from origination and common equity.
In October 2018, the Company entered into a joint venture to invest in a mixed-use development project in Ireland. The Company agreed to invest up to $162.4 million of the $266.5 million total commitment. The Company co-invested along with two affiliates of the Manager, with the Company owning 61.0% of the joint venture and the affiliate entities owning the remaining 39.0%. The joint venture invested in a senior mortgage loan with a fixed interest rate of 15.0% and a maturity date of two years from origination.
In October 2018, the Company acquired a $20.0 million mezzanine loan from an affiliate of the Company’s Manager, secured by a pledge of an ownership interest in a luxury condominium development project located in New York, NY. The loan bears interest at 9.5% plus LIBOR. The borrower repaid the loan in February 2020.
| |
| 11. | Equity-Based Compensation |
On January 29, 2018 the Company’s Board of Directors adopted the 2018 Plan. The 2018 Plan permits the grant of awards with respect to 4.0 million shares of the Class A common stock, subject to adjustment pursuant to the terms of the 2018 Plan. Awards may be granted under the 2018 Plan to (x) the Manager or any employee, officer, director, consultant or advisor (who is a natural person) providing services to the Company, the Manager or their affiliates and (y) any other individual whose participation in the 2018 Plan is determined to be in the best interests of the Company. The following types of awards may be made under the 2018 Plan, subject to the limitations set forth in the plan: (i) stock options (which may be either incentive stock options or non-qualified stock options); (ii) stock appreciation rights; (iii) restricted stock awards; (iv) stock units; (v) unrestricted stock awards; (vi) dividend equivalent rights; (vii) performance awards; (viii) annual cash incentive awards; (ix) long-term incentive units; and (x) other equity-based awards.
Shares subject to an award granted under the 2018 Plan will be counted against the maximum number of shares of Class A common stock available for issuance thereunder as one share of Class A common stock for every one share of Class A common stock subject to such an award. Shares subject to an award granted under the 2018 Plan will again become available for issuance under the 2018 Plan if the award terminates by expiration, forfeiture, cancellation, or otherwise without the issuance of such shares (except as set forth in the following sentence). The number of shares of Class A common stock available for issuance under the 2018 Plan will not be increased by (i) any shares tendered or withheld in connection with the purchase of shares upon exercise of a stock option, (ii) any shares deducted or delivered in connection with the Company’s tax withholding obligations, or (iii) any shares purchased by the Company with proceeds from stock option exercises. The shares granted in May 2019 to the independent directors of the Company under the 2018 Plan vest in May 2020. Shares granted to non-independent directors, officers and the Manager under the 2018 Plan vest ratably in three annual installments.
The table below summarizes our awards granted, forfeited or vested under the 2018 Plan during the three months ended March 31, 2020:
|
| | | | | | | | | |
| | Number of Shares | | |
| | Restricted Stock | | Total | | Weighted Average Grant Date Fair Value |
| Unvested Shares at December 31, 2019 | 1,335,590 |
| | 1,335,590 |
| | $ | 17.79 |
|
| Granted | — |
| | — |
| | — |
|
| Vested | (427,841 | ) | | (427,841 | ) | | 17.36 |
|
| Forfeited | (172,276 | ) | | (172,276 | ) | | 17.25 |
|
| Unvested shares at March 31, 2020 | 735,473 |
| | 735,473 |
| | $ | 17.65 |
|
Fair value of equity awards that vested during the three months ended March 31, 2020 and March 31, 2019, determined based on their respective fair values at vesting date, was $2.6 million and $4.9 million, respectively. Fair value of granted awards is determined based on the closing price of the Class A common stock on the date of grant of the awards. Equity-based compensation is classified within administrative expense in the consolidated statement of operations.
COLONY CREDIT REAL ESTATE, INC.
NOTES TO CONSOLIDATED FINANCIAL STATEMENTS (Continued)
(Unaudited)
At March 31, 2020, aggregate unrecognized compensation cost for all unvested equity awards was $7.5 million, which is expected to be recognized over a weighted-average period of 1.7 years.
Authorized Capital
As of March 31, 2020, the Company had the authority to issue up to 1.0 billion shares of stock, at $0.01 par value per share, consisting of 950.0 million shares of Class A common stock and 50.0 million shares of preferred stock. On February 1, 2019, the Class B-3 common stock automatically converted to Class A common stock and each unissued share of Class B-3 common stock was automatically reclassified as one share of Class A common stock.
The Company had 0 shares of preferred stock issued and outstanding as of March 31, 2020.
Dividends
During the three months ended March 31, 2020, the Company declared the following dividends on its common stock:
|
| | | | | | |
| Declaration Date | | Record Date | | Payment Date | | Per Share |
| January 15, 2020 | | January 31, 2020 | | February 10, 2020 | | $0.10 |
| February 14, 2020 | | February 29, 2020 | | March 10, 2020 | | $0.10 |
| March 16, 2020 | | March 31, 2020 | | April 10, 2020 | | $0.10 |
Subsequent to March 31, 2020, the Company and its Board of Directors suspended the Company’s monthly stock dividend beginning with the monthly period ending April 30, 2020. Refer to Note 19, “Subsequent Events” for further discussion regarding the monthly stock dividend.
Stock Repurchase Program
The Company’s Board of Directors authorized a stock repurchase program (the “Stock Repurchase Program”), under which the Company could repurchase up to $300.0 million of its outstanding Class A common stock until March 31, 2020. On February 18, 2020, the Company’s Board of Directors voted to extend the Stock Repurchase Program through March 31, 2021. Under the Stock Repurchase Program, the Company may repurchase shares in open market purchases, through tender offers or otherwise in accordance with all applicable securities laws and regulations, including Rule 10b-18 of the Securities Exchange Act of 1934, as amended.
As of March 31, 2020, the Company had not repurchased any shares under the Stock Repurchase Program.
Accumulated Other Comprehensive Income (Loss)
The following tables present the changes in each component of Accumulated Other Comprehensive Income (Loss) (“AOCI”) attributable to stockholders and noncontrolling interests in the OP, net of immaterial tax effect.
Changes in Components of AOCI - Stockholders
|
| | | | | | | | | | | | | | | |
| (in thousands) | Unrealized gain (loss) on real estate securities, available for sale | | Unrealized gain on net investment hedges | | Foreign currency translation loss | | Total |
| AOCI at December 31, 2019 | $ | 15,909 |
| | $ | 25,872 |
| | $ | (13,487 | ) | | $ | 28,294 |
|
| Other comprehensive income (loss) | (73,273 | ) | | 21,255 |
| | (18,981 | ) | | (70,999 | ) |
| AOCI at March 31, 2020 | $ | (57,364 | ) | | $ | 47,127 |
| | $ | (32,468 | ) | | $ | (42,705 | ) |
COLONY CREDIT REAL ESTATE, INC.
NOTES TO CONSOLIDATED FINANCIAL STATEMENTS (Continued)
(Unaudited)
|
| | | | | | | | | | | | | | | |
| (in thousands) | Unrealized gain (loss) on real estate securities, available for sale | | Unrealized gain on net investment hedges | | Foreign currency translation loss | | Total |
| AOCI at December 31, 2018 | $ | (1,295 | ) | | $ | 11,037 |
| | $ | (10,141 | ) | | $ | (399 | ) |
| Other comprehensive income (loss) | 9,530 |
| | 7,222 |
| | (3,233 | ) | | 13,519 |
|
| AOCI at March 31, 2019 | $ | 8,235 |
| | $ | 18,259 |
| | $ | (13,374 | ) | | $ | 13,120 |
|
Changes in Components of AOCI - Noncontrolling Interests in the OP
|
| | | | | | | | | | | | | | | |
| (in thousands) | Unrealized gain on real estate securities, available for sale | | Unrealized gain (loss) on net investment hedges | | Foreign currency translation gain (loss) | | Total |
| AOCI at December 31, 2019 | $ | 612 |
| | $ | 893 |
| | $ | (801 | ) | | $ | 704 |
|
| Other comprehensive income (loss) | (1,756 | ) | | 509 |
| | (455 | ) | | (1,702 | ) |
| AOCI at March 31, 2020 | $ | (1,144 | ) | | $ | 1,402 |
| | $ | (1,256 | ) | | $ | (998 | ) |
|
| | | | | | | | | | | | | | | |
| (in thousands) | Unrealized gain (loss) on real estate securities, available for sale | | Unrealized gain on net investment hedges | | Foreign currency translation loss | | Total |
| AOCI at December 31, 2018 | $ | (32 | ) | | $ | 268 |
| | $ | (246 | ) | | $ | (10 | ) |
| Other comprehensive income (loss) | 228 |
| | 173 |
| | (77 | ) | | 324 |
|
| AOCI at March 31, 2019 | $ | 196 |
| | $ | 441 |
| | $ | (323 | ) | | $ | 314 |
|
| |
| 13. | Noncontrolling Interests |
Operating Partnership
Noncontrolling interests include the aggregate limited partnership interests in the OP held by RED REIT. Net income (loss) attributable to the noncontrolling interests is based on the limited partners’ ownership percentage of the OP. Net loss attributable to the noncontrolling interests of the OP was $1.9 million for the three months ended March 31, 2020. Net income attributable to the noncontrolling interests of the OP for the three months ended March 31, 2019 was $0.3 million.
Investment Entities
Noncontrolling interests in investment entities represent third-party equity interests in ventures that are consolidated with the Company’s financial statements. Net income attributable to noncontrolling interests in the investment entities for the three months ended March 31, 2020 was $0.5 million. Net loss attributable to noncontrolling interests in the investment entities for the three months ended March 31, 2019 was $0.3 million.
Determination of Fair Value
The following is a description of the valuation techniques used to measure fair value of assets accounted for at fair value on a recurring basis and the general classification of these instruments pursuant to the fair value hierarchy.
PE Investments
The Company accounts for PE Investments at fair value which is determined based on either a valuation model using assumptions for the timing and amount of expected future cash flow for income and realization events for the underlying assets in the funds and discount rate, or pending sales prices, if applicable. This fair value measurement is generally based on unobservable inputs and, as such, is classified as Level 3 of the fair value hierarchy, unless the PE Investments are valued based on pending sales prices, which are classified as Level 2 of the fair value hierarchy. The Company considers cash flow and NAV information provided by general partners of the underlying funds (“GP NAV”) and the implied yields of those funds in valuing its PE Investments. The Company also considers the values derived from the valuation model as a percentage of GP NAV, and compares the resulting
COLONY CREDIT REAL ESTATE, INC.
NOTES TO CONSOLIDATED FINANCIAL STATEMENTS (Continued)
(Unaudited)
percentage of GP NAV to precedent transactions, independent research, industry reports as well as pricing from executed purchase and sale agreements related to the disposition of its PE Investments. The Company may, as a result of that comparison, apply a mark-to-market adjustment. The Company has not elected the practical expedient to measure the fair value of its PE Investments using the NAV of the underlying funds.
Real Estate Securities
CRE securities are generally valued using a third-party pricing service or broker quotations. These quotations are not adjusted and are based on observable inputs that can be validated, and as such, are classified as Level 2 of the fair value hierarchy. Certain CRE securities may be valued based on a single broker quote or an internal price which may have less observable pricing, and as such, would be classified as Level 3 of the fair value hierarchy. Management determines the prices are representative of fair value through a review of available data, including observable inputs, recent transactions as well as its knowledge of and experience in the market.
Investing VIEs
As discussed in Note 5, “Real Estate Securities, Available for Sale,” the Company has elected the fair value option for the financial assets and liabilities of the consolidated Investing VIEs. The Investing VIEs are “static,” that is no reinvestment is permitted and there is very limited active management of the underlying assets. The Company is required to determine whether the fair value of the financial assets or the fair value of the financial liabilities of the Investing VIEs are more observable, but in either case, the methodology results in the fair value of the assets of the securitization trusts being equal to the fair value of their liabilities. The Company has determined that the fair value of the liabilities of the securitization trusts are more observable, since market prices for the liabilities are available from a third-party pricing service or are based on quoted prices provided by dealers who make markets in similar financial instruments. The financial assets of the securitization trusts are not readily marketable and their fair value measurement requires information that may be limited in availability.
In determining the fair value of the trusts’ financial liabilities, the dealers will consider contractual cash payments and yields expected by market participants. Dealers also incorporate common market pricing methods, including a spread measurement to the treasury curve or interest rate swap curve as well as underlying characteristics of the particular security including coupon, periodic and life caps, collateral type, rate reset period and seasoning or age of the security. The Company’s collateralized mortgage obligations are classified as Level 2 of the fair value hierarchy, where a third-party pricing service or broker quotations are available, and as Level 3 of the fair value hierarchy, where internal price is utilized which may have less observable pricing. In accordance with ASC 810, Consolidation, the assets of the securitization trusts are an aggregate value derived from the fair value of the trust’s liabilities, and the Company has determined that the valuation of the trust’s assets in their entirety including its retained interests from the securitizations (eliminated in consolidation in accordance with U.S. GAAP) should be classified as Level 3 of the fair value hierarchy.
Derivatives
Derivative instruments consist of interest rate contracts and foreign exchange contracts that are generally traded over-the-counter, and are valued using a third-party service provider. Quotations on over-the counter derivatives are not adjusted and are generally valued using observable inputs such as contractual cash flows, yield curve, foreign currency rates and credit spreads, and are classified as Level 2 of the fair value hierarchy. Although credit valuation adjustments, such as the risk of default, rely on Level 3 inputs, these inputs are not significant to the overall valuation of its derivatives. As a result, derivative valuations in their entirety are classified as Level 2 of the fair value hierarchy.
COLONY CREDIT REAL ESTATE, INC.
NOTES TO CONSOLIDATED FINANCIAL STATEMENTS (Continued)
(Unaudited)
Fair Value Hierarchy
Financial assets recorded at fair value on a recurring basis are classified in their entirety based on the lowest level of input that is significant to the fair value measurement. The following table presents financial assets that were accounted for at fair value on a recurring basis as of March 31, 2020 and December 31, 2019 by level within the fair value hierarchy (dollars in thousands):
|
| | | | | | | | | | | | | | | | | | | | | | | | | | | | | | | | |
| | | March 31, 2020 | | December 31, 2019 |
| | | Level 1 | | Level 2 | | Level 3 | | Total | | Level 1 | | Level 2 | | Level 3 | | Total |
| Assets: | | | | | | | | | | | | | | | | |
| Investments in unconsolidated ventures - PE Investments | | $ | — |
| | $ | 124 |
| | $ | 8,640 |
| | $ | 8,764 |
| | $ | — |
| | $ | 1,425 |
| | $ | 8,858 |
| | $ | 10,283 |
|
| Real estate securities, available for sale | | — |
| | 179,572 |
| |
|
| | 179,572 |
| | — |
| | 252,824 |
| | — |
| | 252,824 |
|
| Mortgage loans held in securitization trusts, at fair value | | — |
| | — |
| | 1,822,991 |
| | 1,822,991 |
| | — |
| | — |
| | 1,872,970 |
| | 1,872,970 |
|
| Other assets - derivative assets | | — |
| | 9 |
| | — |
| | 9 |
| | — |
| | 4,122 |
| | — |
| | 4,122 |
|
| Liabilities: | | | | | | | | | | | | | | | | |
| Mortgage obligations issued by securitization trusts, at fair value | | $ | — |
| | $ | 1,732,388 |
| | $ | — |
| | $ | 1,732,388 |
| | $ | — |
| | $ | 1,762,914 |
| | $ | — |
| | $ | 1,762,914 |
|
| Other liabilities - derivative liabilities | | — |
| | 33,344 |
| | — |
| | 33,344 |
| | — |
| | 19,133 |
| | — |
| | 19,133 |
|
The following table presents the changes in fair value of financial assets which are measured at fair value on a recurring basis using Level 3 inputs to determine fair value for the three months ended March 31, 2020 and year ended December 31, 2019 (dollars in thousands):
|
| | | | | | | | | | | | | | | | |
| | | Three Months Ended March 31, 2020 | | Year Ended December 31, 2019 |
| | | Investments in unconsolidated ventures - PE Investments | | Mortgage loans held in securitization trusts(1) | | Investments in unconsolidated ventures - PE Investments | | Mortgage loans held in securitization trusts(1) |
| Beginning balance | | $ | 8,858 |
| | $ | 1,872,970 |
| | $ | 160,851 |
| | $ | 3,116,978 |
|
Contributions(2)/purchases | | — |
| | — |
| | 151 |
| | — |
|
| Distributions/paydowns | | (887 | ) | | (6,578 | ) | | (18,407 | ) | | (55,288 | ) |
Deconsolidation of securitization trust(3) | | — |
| | — |
| | — |
| | (1,239,627 | ) |
| Equity in earnings | | 669 |
| | — |
| | — |
| | — |
|
| Sale of investments | | — |
| | — |
| | (48,930 | ) | | (39,848 | ) |
| Transfers out of Level 3 | |
| | — |
| | (84,807 | ) | | — |
|
| Unrealized gain (loss) in earnings | | — |
| | (43,401 | ) | | — |
| | 87,983 |
|
| Realized gain in earnings | |
| | — |
| | — |
| | 2,772 |
|
| Ending balance | | $ | 8,640 |
| | $ | 1,822,991 |
| | $ | 8,858 |
| | $ | 1,872,970 |
|
_________________________________________
| |
| (1) | For the three months ended March 31, 2020, unrealized loss of $43.4 million related to mortgage loans held in securitization trusts, at fair value was offset by unrealized gain of $23.9 million related to mortgage obligations issued by securitization trusts, at fair value. |
| |
| (2) | Includes initial investments, before distribution and contribution closing statement adjustments, and subsequent contributions, including deferred purchase price fundings. |
| |
| (3) | In July 2019, the Company sold its retained investments in the subordinate tranches of 1 securitization trust. As a result of the sale, the Company deconsolidated 1 of the securitization trusts. See Note 5, “Real Estate Securities, Available for Sale” for further information. |
Transfers of assets into or out of Level 3 are presented at their fair values as measured at the end of the reporting period. Assets transferred out of Level 3 represent PE Investments that were valued based on their contracted sales price in March 2019.
As of March 31, 2020 and December 31, 2019, the Company utilized a discounted cash flow model, comparable precedent transactions and other market information to quantify Level 3 fair value measurements on a recurring basis. As of March 31, 2020 and December 31, 2019, the key unobservable inputs used in the analysis of PE Investments included discount rates with a range of 11.0% to 12.0% and timing and amount of expected future cash flows. As of March 31, 2020 and December 31, 2019, the key unobservable inputs used in the valuation of mortgage obligations issued by securitization trusts included yields ranging from
COLONY CREDIT REAL ESTATE, INC.
NOTES TO CONSOLIDATED FINANCIAL STATEMENTS (Continued)
(Unaudited)
14.2% to 34.1% and 15.0% to 16.1%, respectively, and a weighted average life of 5.6 and 5.4 years, respectively. Significant increases or decreases in any one of the inputs described above in isolation may result in significantly different fair value of the financial assets and liabilities using such Level 3 inputs.
For the three months ended March 31, 2020 and March 31, 2019 the Company recorded a net unrealized loss of $19.5 million and a net unrealized gain of $1.0 million respectively, related to mortgage loans held in and mortgage obligations issued by securitization trusts, at fair value. These amounts, when incurred, are recorded as unrealized gain (loss) on mortgage loans and obligations held in securitization trusts, net in the consolidated statements of operations.
For the three months ended March 31, 2020, the company did not record a realized gain on mortgage loans held in securitization trusts, at fair value. For the three months ended March 31, 2019, the Company recorded a de minimis realized gain on mortgage loans held in securitization trusts, at fair value, which represents a recovery of a loss previously recorded in 2018. This amount is recorded as realized gain on mortgage loans and obligations held in securitization trusts, net in the consolidated statements of operations.
Fair Value Option
The Company may elect to apply the fair value option of accounting for certain of its financial assets or liabilities due to the nature of the instrument at the time of the initial recognition of the investment. The Company elected the fair value option for PE Investments and eligible financial assets and liabilities of its consolidated Investing VIEs because management believes it is a more useful presentation for such investments. The Company determined recording the PE Investments based on the change in fair value of projected future cash flow from one period to another better represents the underlying economics of the respective investment. As of March 31, 2020 and December 31, 2019, the Company has elected not to apply the fair value option for any other eligible financial assets or liabilities.
Fair Value of Financial Instruments
In addition to the above disclosures regarding financial assets or liabilities which are recorded at fair value, U.S. GAAP requires disclosure of fair value about all financial instruments. The following disclosure of estimated fair value of financial instruments was determined by the Company using available market information and appropriate valuation methodologies. Considerable judgment is necessary to interpret market data and develop estimated fair value. Accordingly, the estimates presented herein are not necessarily indicative of the amounts the Company could realize on disposition of the financial instruments. The use of different market assumptions and/or estimation methodologies may have a material effect on estimated fair value.
The following table presents the principal amount, carrying value and fair value of certain financial assets and liabilities as of March 31, 2020 and December 31, 2019 (dollars in thousands):
|
| | | | | | | | | | | | | | | | | | | | | | | | |
| | | March 31, 2020 | | December 31, 2019 |
| | | Principal Amount | | Carrying Value | | Fair Value | | Principal Amount | | Carrying Value | | Fair Value |
Financial assets:(1) | | | | | | | | | | | | |
| Loans and preferred equity held for investment, net | | $ | 2,413,251 |
| (2) | $ | 2,351,278 |
| | $ | 2,361,776 |
| | $ | 2,858,423 |
| (2) | $ | 2,576,332 |
| | $ | 2,470,561 |
|
Financial liabilities:(1) | | | | | | | | | | | | |
| Securitization bonds payable, net | | $ | 840,423 |
| | $ | 833,671 |
| | $ | 840,423 |
| | $ | 840,423 |
| | $ | 833,153 |
| | $ | 840,423 |
|
| Mortgage and other notes payable, net | | 1,156,777 |
| | 1,152,851 |
| | 1,156,461 |
| | 1,260,267 |
| | 1,256,112 |
| | 1,260,675 |
|
| Master repurchase facilities | | 1,260,419 |
| | 1,260,419 |
| | 1,260,419 |
| | 1,099,233 |
| | 1,099,233 |
| | 1,099,233 |
|
_________________________________________
| |
| (1) | The fair value of other financial instruments not included in this table is estimated to approximate their carrying value. |
| |
| (2) | Excludes future funding commitments of $236.7 million and $276.6 million as of March 31, 2020 and December 31, 2019, respectively. |
Disclosure about fair value of financial instruments is based on pertinent information available to management as of March 31, 2020. Although management is not aware of any factors that would significantly affect fair value, such amounts have not been comprehensively revalued for purposes of these consolidated financial statements since that date and current estimates of fair value may differ significantly from the amounts presented herein.
Loans and Preferred Equity Held for Investment, Net
For loans and preferred equity held for investment, net, fair values were determined: (i) by comparing the current yield to the estimated yield for newly originated loans with similar credit risk or the market yield at which a third party might expect to purchase
COLONY CREDIT REAL ESTATE, INC.
NOTES TO CONSOLIDATED FINANCIAL STATEMENTS (Continued)
(Unaudited)
such investment; or (ii) based on discounted cash flow projections of principal and interest expected to be collected, which includes consideration of the financial standing of the borrower or sponsor as well as operating results of the underlying collateral. These fair value measurements of CRE debt are generally based on unobservable inputs and, as such, are classified as Level 3 of the fair value hierarchy. Carrying values of loans and preferred equity held for investment are presented net of allowance for loan losses, where applicable.
Securitization Bonds Payable, Net
The Company’s securitization bonds payable, net bear floating rates of interest. As of March 31, 2020, the Company believes the carrying value approximates fair value. These fair value measurements are based on observable inputs, and as such, are classified as Level 2 of the fair value hierarchy.
Mortgage and Other Notes Payable, Net
For mortgage and other notes payable, net, the Company primarily uses rates currently available with similar terms and remaining maturities to estimate fair value. These measurements are determined using comparable U.S. Treasury rates as of the end of the reporting period. These fair value measurements are based on observable inputs, and as such, are classified as Level 2 of the fair value hierarchy.
Master Repurchase Facilities
The Company has amounts outstanding under Master Repurchase Facilities. The Master Repurchase Facilities bear floating rates of interest. As of March 31, 2020, the Company believes the carrying value approximates fair value. These fair value measurements are based on observable inputs, and as such, are classified as Level 2 of the fair value hierarchy.
Other
The carrying values of cash and cash equivalents, receivables, and accrued and other liabilities approximate fair value due to their short term nature and credit risk, if any, are negligible.
Nonrecurring Fair Values
The Company measures fair value of certain assets on a nonrecurring basis when events or changes in circumstances indicate that the carrying value of the assets may not be recoverable. Adjustments to fair value generally result from the application of lower of amortized cost or fair value accounting for assets held for sale or write-down of asset values due to impairment.
The following table summarizes assets carried at fair value on a nonrecurring basis as of March 31, 2020 and December 31, 2019 (dollars in thousands):
|
| | | | | | | | | | | | | | | | | | | | | | | | | | | | | | | | |
| | | March 31, 2020 | | December 31, 2019 |
| | | Level 1 | | Level 2 | | Level 3 | | Total | | Level 1 | | Level 2 | | Level 3 | | Total |
| Loans and preferred equity held for investment, net | | $ | — |
| | $ | — |
| | $ | 2,351,278 |
| | $ | 2,351,278 |
| | $ | — |
| | $ | — |
| | $ | 104,797 |
| | $ | 104,797 |
|
| Loans held for sale | | — |
| | — |
| | 21,191 |
| | 21,191 |
| | — |
| | — |
| | 5,016 |
| | 5,016 |
|
| Real estate, net | | — |
| | — |
| | 344,726 |
| | 344,726 |
| | — |
| | — |
| | 448,690 |
| | 448,690 |
|
| Real estate assets held for sale | | — |
| | — |
| | 162,403 |
| | 162,403 |
| | — |
| | — |
| | 134,966 |
| | 134,966 |
|
| Investments in unconsolidated ventures | | — |
| | — |
| | 195,393 |
| | 195,393 |
| | — |
| | — |
| | 211,024 |
| | 211,024 |
|
| Deferred leasing costs and intangible assets, net | | — |
| | — |
| | 34,005 |
| | 34,005 |
| | — |
| | — |
| | 42,122 |
| | 42,122 |
|
COLONY CREDIT REAL ESTATE, INC.
NOTES TO CONSOLIDATED FINANCIAL STATEMENTS (Continued)
(Unaudited)
The following table summarizes the fair value write-downs to assets carried at nonrecurring fair values during the periods presented (dollars in thousands):
|
| | | | | | | | |
| | | Three Months Ended March 31, |
| | | 2020 | | 2019 |
| Provision for loan losses: | | | | |
| Loans and preferred equity held for investment, net | | $ | 31,499 |
| | $ | — |
|
| Loans held for sale | | 36,783 |
| | — |
|
| Total provision for loan losses | | $ | 68,282 |
| | $ | — |
|
Loans and preferred equity held for investment, net—Provision for loan losses consisted of the Company’s CECL provision for loan losses in the Core Portfolio, as well as one loan that the company individually evaluated for impairment in the Company’s Core Portfolio, which reflected the reduction of the estimated fair value of the collateral. The fair value of the loans collateral was determined by applying a terminal cap rate of 13%. The Company recorded $31.5 million of provision for loan losses in its Core Portfolio during the three months ended March 31, 2020.
Loans held for sale— Provision for loan losses consisted of 1 loan in the Company’s Legacy, Non-Strategic Portfolio. During the three months ended March 31, 2020 the significant detrimental impact of COVID-19 on the U.S. hospitality industry further contributed to the deterioration of the Company’s four NY hospitality loans and as such the Company recorded an additional provision for loan losses of $36.8 million. On April 22, 2020, the Company completed a discounted payoff of the NY hospitality loans and related investment interests.
The Company uses derivative instruments to manage the risk of changes in interest rates and foreign exchange rates, arising from both its business operations and economic conditions. Specifically, the Company enters into derivative instruments to manage differences in the amount, timing, and duration of the Company’s known or expected cash receipts and cash payments, the values of which are driven by interest rates, principally relating to the Company’s investments. Additionally, the Company’s foreign operations expose the Company to fluctuations in foreign exchange rates. The Company enters into derivative instruments to protect the value or fix certain of these foreign denominated amounts in terms of its functional currency, the U.S. dollar. Derivative instruments used in the Company’s risk management activities may be designated as qualifying hedge accounting relationships designated hedges or non-designated hedges.
As of March 31, 2020 and December 31, 2019, fair value of derivative assets and derivative liabilities were as follows (dollars in thousands):
|
| | | | | | | | | | | | | | | | | | | | | | | | |
| | | March 31, 2020 | | December 31, 2019 |
| | | Designated Hedges | | Non-Designated Hedges | | Total | | Designated Hedges | | Non-Designated Hedges | | Total |
| Derivative Assets | | | | | | | | | | | | |
| Foreign exchange contracts | | $ | — |
| | $ | — |
| | $ | — |
| | $ | — |
| | $ | 4,122 |
| | $ | 4,122 |
|
| Interest rate contracts | | — |
| | 9 |
| | 9 |
| | — |
| | — |
| | — |
|
| Included in other assets | | $ | — |
| | $ | 9 |
| | $ | 9 |
| | $ | — |
| | $ | 4,122 |
| | $ | 4,122 |
|
| Derivative Liabilities | | | | | | | | | | | | |
| Foreign exchange contracts | | $ | — |
| | $ | — |
| | $ | — |
| | $ | (2,128 | ) | | $ | (29 | ) | | $ | (2,157 | ) |
| Interest rate contracts | | — |
| | (33,344 | ) | | (33,344 | ) | | — |
| | (16,976 | ) | | (16,976 | ) |
| Included in accrued and other liabilities | | $ | — |
| | $ | (33,344 | ) | | $ | (33,344 | ) | | $ | (2,128 | ) | | $ | (17,005 | ) | | $ | (19,133 | ) |
As of March 31, 2020, the Company posted $14.5 million in net cash collateral to counterparties for its derivative contracts and those counterparties held $33.4 million in cash collateral.
COLONY CREDIT REAL ESTATE, INC.
NOTES TO CONSOLIDATED FINANCIAL STATEMENTS (Continued)
(Unaudited)
The following table summarizes the Company’s interest rate contracts as of March 31, 2020:
|
| | | | | | | | | | | | |
| Type of Derivatives | | Notional Currency | | Notional Amount (in thousands) | | Range of Maturity Dates |
| Designated | | Non-Designated |
| Interest Rate Swap | | USD | | $ | — |
| | $ | 366,730 |
| | April 2020 - August 2028 |
The table below represents the effect of the derivative financial instruments on the consolidated statements of operations and of comprehensive income (loss) for the three months ended March 31, 2020 and 2019 (dollars in thousands):
|
| | | | | | | | |
| | | Three Months Ended March 31, |
| | | 2020 | | 2019 |
| Other gain (loss), net | | | | |
| Non-designated foreign exchange contracts | | $ | (4,084 | ) | | $ | 237 |
|
| Non-designated interest rate contracts | | (16,370 | ) | | (4,083 | ) |
| | | $ | (20,454 | ) | | $ | (3,846 | ) |
| Other income | | | | |
| Non-designated foreign exchange contracts | | $ | 8,738 |
| | $ | — |
|
| | | $ | 8,738 |
| | $ | — |
|
| Accumulated other comprehensive income (loss) | | | | |
| Designated foreign exchange contracts | | $ | 21,764 |
| | $ | 7,395 |
|
| | | $ | 21,764 |
| | $ | 7,395 |
|
During the three months ended March 31, 2020, the Company received $28.2 million from the unwind of its NOK and EUR FX forwards and realized a gain of $8.7 million which is included in other income on its consolidated statements of operations.
At the end of each quarter, the Company reassesses the effectiveness of its net investment hedges and as appropriate, dedesignates the portion of the derivative notional that is in excess of the beginning balance of its net investments as non-designated hedges. Any unrealized gain or loss on the dedesignated portion of net investment hedges is transferred into earnings, recorded in other gain (loss), net. During the three months ended March 31, 2020 and 2019, 0 gain (loss) was transferred from accumulated other comprehensive income (loss).
Offsetting Assets and Liabilities
The Company enters into agreements subject to enforceable netting arrangements with its derivative counterparties that allow the Company to offset the settlement of derivative assets and liabilities in the same currency by derivative instrument type or, in the event of default by the counterparty, to offset all derivative assets and liabilities with the same counterparty. The Company has elected not to net derivative asset and liability positions, notwithstanding the conditions for right of offset may have been met. The Company presents derivative assets and liabilities with the same counterparty on a gross basis on the consolidated balance sheets.
COLONY CREDIT REAL ESTATE, INC.
NOTES TO CONSOLIDATED FINANCIAL STATEMENTS (Continued)
(Unaudited)
The following table sets forth derivative positions where the Company has a right of offset under netting arrangements with the same counterparty as of March 31, 2020 and December 31, 2019 (dollars in thousands):
|
| | | | | | | | | | | | | | | | |
| | | Gross Amounts of Assets (Liabilities) Included on Consolidated Balance Sheets | | Gross Amounts Not Offset on Consolidated Balance Sheets | | Net Amounts of Assets (Liabilities) |
| (Assets) Liabilities | | Cash Collateral Pledged |
| March 31, 2020 | | | | | | | | |
| Derivative Assets | | | | | | | | |
| Interest rate contracts | | $ | 9 |
| | $ | (9 | ) | | $ | — |
| | $ | — |
|
| | | $ | 9 |
| | $ | (9 | ) | | $ | — |
| | $ | — |
|
| Derivative Liabilities | | | | | | | | |
| Interest rate contracts | | $ | (33,344 | ) | | $ | 9 |
| | $ | 33,335 |
| | $ | — |
|
| | | $ | (33,344 | ) | | $ | 9 |
| | $ | 33,335 |
| | $ | — |
|
| | | | | | | | | |
| December 31, 2019 | | | | | | | | |
| Derivative Assets | | | | | | | | |
| Foreign exchange contracts | | $ | 4,122 |
| | $ | (2,157 | ) | | $ | — |
| | $ | 1,965 |
|
| | | $ | 4,122 |
| | $ | (2,157 | ) | | $ | — |
| | $ | 1,965 |
|
| Derivative Liabilities | | | | | | | | |
| Foreign exchange contracts | | $ | (2,157 | ) | | $ | 2,157 |
| | $ | — |
| | $ | — |
|
| Interest rate contracts | | (16,976 | ) | | — |
| | 16,976 |
| | — |
|
| | | $ | (19,133 | ) | | $ | 2,157 |
| | $ | 16,976 |
| | $ | — |
|
| |
| 16. | Commitments and Contingencies |
Lending Commitments
The Company has lending commitments to borrowers pursuant to certain loan agreements in which the borrower may submit a request for funding contingent on achieving certain criteria, which must be approved by the Company as lender, such as leasing, performance of capital expenditures and construction in progress with an approved budget. At March 31, 2020, assuming the terms to qualify for future fundings, if any, have been met, total unfunded lending commitments for loans and preferred equity held for investment was $162.1 million for senior loans, $37.3 million for securitized loans, $1.2 million for corporate term loans and $36.1 million for mezzanine loans. Total unfunded commitments for equity method investments was $32.2 million.
Ground Lease Obligation
The Company’s operating leases are ground leases acquired with real estate.
At March 31, 2020, the weighted average remaining lease terms were 14.2 years for ground leases.
The following table presents lease expense, included in property operating expense, for the three months ended March 31, 2020 and 2019 (dollars in thousands):
|
| | | | | | | | |
| | | Three Months Ended March 31, |
| | | 2020 | | 2019 |
| Operating lease expense: | | | | |
| Minimum lease expense | | $ | 804 |
| | $ | 809 |
|
| Variable lease expense | | — |
| | — |
|
| | | $ | 804 |
| | $ | 809 |
|
COLONY CREDIT REAL ESTATE, INC.
NOTES TO CONSOLIDATED FINANCIAL STATEMENTS (Continued)
(Unaudited)
The operating lease liability was determined using a weighted average discount rate of 5.0%. The following table presents future minimum rental payments, excluding contingent rents, on noncancellable ground leases on real estate as of March 31, 2020 (dollars in thousands):
|
| | | | |
| Remainder of 2020 | | $ | 2,390 |
|
| 2021 | | 3,171 |
|
| 2022 | | 3,199 |
|
| 2023 | | 3,229 |
|
| 2024 | | 2,338 |
|
| 2025 and thereafter | | 21,725 |
|
| Total lease payments | | 36,052 |
|
| Less: Present value discount | | 11,757 |
|
| Operating lease liability (Note 8) | | $ | 24,295 |
|
The following table presents future minimum rental payments, excluding contingent rents, on noncancellable ground leases on real estate as of December 31, 2019 (dollars in thousands):
|
| | | | |
| 2020 | | $ | 3,232 |
|
| 2021 | | 3,216 |
|
| 2022 | | 3,244 |
|
| 2023 | | 3,274 |
|
| 2024 | | 2,383 |
|
| 2025 and thereafter | | 23,079 |
|
| Total lease payments | | 38,428 |
|
| Less: Present value discount | | 12,933 |
|
| Operating lease liability (Note 8) | | $ | 25,495 |
|
Litigation and Claims
The Company may be involved in litigation and claims in the ordinary course of the business. As of March 31, 2020, the Company was not involved in any legal proceedings that are expected to have a material adverse effect on the Company’s results of operations, financial position or liquidity.
Following the Combination, the Company conducted its business through the following 5 operating segments: the loan portfolio, CRE debt securities, net leased real estate, other, and corporate. The Company continually monitors and reviews its segment reporting structure in accordance with authoritative guidance to determine whether any changes have occurred that would impact our reportable segments.
During the third quarter of 2019, the Company realigned the business and reportable segment information to reflect how the CODM regularly review and manage the business. As a result, the Company presents its business segments as follows:
| |
| • | Core Portfolio, which consists of the following 4 segments and remain unchanged from the prior segments: |
| |
| ◦ | Senior and Mezzanine Loans and Preferred Equity—CRE debt investments including senior mortgage loans, mezzanine loans, and preferred equity interests as well as participations in such loans. The segment also includes ADC loan arrangements accounted for as equity method investments. |
| |
| ◦ | CRE Debt Securities securities investments currently consisting of BBB and some BB rated CMBS (including Non-Investment Grade “B-pieces” of a CMBS securitization pool), or CRE CLOs (including the junior tranches thereof, collateralized by pools of CRE debt investments). |
| |
| ◦ | Net Leased Real Estate—direct investments in CRE with long-term leases to tenants on a net lease basis, where such tenants generally will be responsible for property operating expenses such as insurance, utilities, maintenance, capital expenditures and real estate taxes. |
COLONY CREDIT REAL ESTATE, INC.
NOTES TO CONSOLIDATED FINANCIAL STATEMENTS (Continued)
(Unaudited)
| |
| ◦ | Corporate—includes corporate-level asset management and other fees, related party and general and administrative expenses to the Core Portfolio only. |
| |
| • | Legacy, Non-Strategic Portfolio—segment consists of direct investments in operating real estate such as multi-tenant office and multifamily residential assets such as real estate acquired in settlement of loans (“REO”) which the Company plans to exit. It also includes two portfolios of PE Investments and certain retail and other legacy loans originated prior to the Combination. This segment includes corporate-level asset management and other fees, related party and general and administrative expenses related to the Legacy, Non-Strategic Portfolio only. |
There were no changes in the structure of the Company’s internal organization that prompted the change in reportable segments. Prior period amounts have been revised to conform to the current year presentation shown below.
The Company primarily generates revenue from net interest income on the loan, preferred equity and securities portfolios, rental and other income from its net leased, hotel, multi-tenant office, and multifamily real estate assets, as well as equity in earnings of unconsolidated ventures. CRE debt securities include the Company’s investment in the subordinate tranches of the securitization trusts which are eliminated in consolidation. The Company’s income is primarily derived through the difference between revenue and the cost at which the Company is able to finance its investments. The Company may also acquire investments which generate attractive returns without any leverage.
The following tables present segment reporting for the three months ended March 31, 2020 and 2019 (dollars in thousands):
|
| | | | | | | | | | | | | | | | | | | | | | | | | | | | |
| | | Core | | | | |
| | | Senior and MezzanineLoans and Preferred Equity | | CRE Debt Securities | | Net Leased Real Estate | | Corporate(1) | | Total Core Portfolio | | Legacy, Non-Strategic Portfolio | | Total |
| Three months ended March 31, 2020 | | | | | | | | | | | | | | |
| Net interest income (expense) | | $ | 23,483 |
| | $ | 5,543 |
| | $ | — |
| | $ | (1,876 | ) | | $ | 27,150 |
| | $ | 706 |
| | $ | 27,856 |
|
| Property and other income | | 24 |
| | 72 |
| | 30,531 |
| | 5 |
| | 30,632 |
| | 31,290 |
| | 61,922 |
|
| Management fee expense | | — |
| | — |
| | — |
| | (6,516 | ) | | (6,516 | ) | | (1,430 | ) | | (7,946 | ) |
| Property operating expense | | (1 | ) | | — |
| | (3,683 | ) | | — |
| | (3,684 | ) | | (18,847 | ) | | (22,531 | ) |
| Transaction, investment and servicing expense | | (398 | ) | | — |
| | (143 | ) | | (1,673 | ) | | (2,214 | ) | | (920 | ) | | (3,134 | ) |
| Interest expense on real estate | | — |
| | — |
| | (8,461 | ) | | — |
| | (8,461 | ) | | (4,617 | ) | | (13,078 | ) |
| Depreciation and amortization | | — |
| | — |
| | (11,153 | ) | | — |
| | (11,153 | ) | | (6,823 | ) | | (17,976 | ) |
| Provision for loan losses | | (31,499 | ) | | — |
| | — |
| | — |
| | (31,499 | ) | | (38,433 | ) | | (69,932 | ) |
| Impairment of operating real estate | | — |
| | — |
| | — |
| | — |
| | — |
| | (4,126 | ) | | (4,126 | ) |
| Administrative expense | | (363 | ) | | (535 | ) | | (82 | ) | | (3,151 | ) | | (4,131 | ) | | (2,907 | ) | | (7,038 | ) |
| Unrealized gain (loss) on mortgage loans and obligations held in securitization trusts, net | | — |
| | (19,906 | ) | | — |
| | 454 |
| | (19,452 | ) | | — |
| | (19,452 | ) |
| Other loss, net | | — |
| | (16,336 | ) | | (4,084 | ) | | (92 | ) | | (20,512 | ) | | 350 |
| | (20,162 | ) |
| Income (loss) before equity in earnings of unconsolidated ventures and income taxes | | (8,754 | ) | | (31,162 | ) | | 2,925 |
| | (12,849 | ) | | (49,840 | ) | | (45,757 | ) | | (95,597 | ) |
| Equity in earnings of unconsolidated ventures | | 14,074 |
| | — |
| | — |
| | — |
| | 14,074 |
| | 3,093 |
| | 17,167 |
|
| Income tax benefit (expense) | | (361 | ) | | — |
| | 198 |
| | — |
| | (163 | ) | | (1,548 | ) | | (1,711 | ) |
| Net income (loss) | | $ | 4,959 |
| | $ | (31,162 | ) | | $ | 3,123 |
| | $ | (12,849 | ) | | $ | (35,929 | ) | | $ | (44,212 | ) | | $ | (80,141 | ) |
_________________________________________
| |
| (1) | Includes income earned from the CRE securities purchased at a discount, recognized using the effective interest method had the transaction been recorded as an available for sale security, at amortized cost. During the three months ended March 31, 2020, $0.5 million, was attributable to discount accretion income and was eliminated in consolidation in the corporate segment. The corresponding interest expense is recorded in net interest income in the Corporate column. |
COLONY CREDIT REAL ESTATE, INC.
NOTES TO CONSOLIDATED FINANCIAL STATEMENTS (Continued)
(Unaudited)
|
| | | | | | | | | | | | | | | | | | | | | | | | | | | | |
| | | Core | | | |
| | | Senior and MezzanineLoans and Preferred Equity | | CRE Debt Securities | | Net Leased Real Estate | | Corporate(1) | | Total Core Portfolio | | Legacy, Non-Strategic Portfolio | | Total |
| Three months ended March 31, 2019 | | | | | | | | | | | | | | |
| Net interest income (expense) | | $ | 15,882 |
| | $ | 5,312 |
| | $ | — |
| | $ | (2,858 | ) | | $ | 18,336 |
| | $ | 3,622 |
| | $ | 21,958 |
|
| Property and other income | | 93 |
| | 67 |
| | 29,904 |
| | — |
| | 30,064 |
| | 33,247 |
| | 63,311 |
|
| Management fee expense | | — |
| | — |
| | — |
| | (9,086 | ) | | (9,086 | ) | | (2,272 | ) | | (11,358 | ) |
| Property operating expense | | — |
| | — |
| | (8,946 | ) | | — |
| | (8,946 | ) | | (19,234 | ) | | (28,180 | ) |
| Transaction, investment and servicing expense | | (276 | ) | | — |
| | (45 | ) | | 267 |
| | (54 | ) | | (475 | ) | | (529 | ) |
| Interest expense on real estate | | — |
| | — |
| | (8,570 | ) | | — |
| | (8,570 | ) | | (5,037 | ) | | (13,607 | ) |
| Depreciation and amortization | | — |
| | — |
| | (13,084 | ) | | — |
| | (13,084 | ) | | (14,578 | ) | | (27,662 | ) |
| Administrative expense | | (289 | ) | | (387 | ) | | (57 | ) | | (2,905 | ) | | (3,638 | ) | | (3,015 | ) | | (6,653 | ) |
| Unrealized gain on mortgage loans and obligations held in securitization trusts, net | | — |
| | 666 |
| | — |
| | 363 |
| | 1,029 |
| | — |
| | 1,029 |
|
| Realized gain on mortgage loans and obligations held in securitization trusts, net | | — |
| | 48 |
| | — |
| | — |
| | 48 |
| | — |
| | 48 |
|
| Other gain (loss), net | | — |
| | (4,070 | ) | | 235 |
| | 8 |
| | (3,827 | ) | | (1,252 | ) | | (5,079 | ) |
| Income (loss) before equity in earnings of unconsolidated ventures and income taxes | | 15,410 |
| | 1,636 |
| | (563 | ) | | (14,211 | ) | | 2,272 |
| | (8,994 | ) | | (6,722 | ) |
| Equity in earnings of unconsolidated ventures | | 18,368 |
| | — |
| | — |
| | — |
| | 18,368 |
| | 2,942 |
| | 21,310 |
|
| Income tax benefit (expense) | | (12 | ) | | — |
| | 2,382 |
| | (382 | ) | | 1,988 |
| | (1,619 | ) | | 369 |
|
| Net income (loss) | | $ | 33,766 |
| | $ | 1,636 |
| | $ | 1,819 |
| | $ | (14,593 | ) | | $ | 22,628 |
| | $ | (7,671 | ) | | $ | 14,957 |
|
_________________________________________
| |
| (1) | Includes income earned from the CRE securities purchased at a discount, recognized using the effective interest method had the transaction been recorded as an available for sale security, at amortized cost. During the three months ended March 31, 2019, $0.4 million was attributable to discount accretion income and was eliminated in consolidation in the corporate segment. The corresponding interest expense is recorded in net interest income in the Corporate column |
The following table presents total assets by segment as of March 31, 2020 and December 31, 2019 (dollars in thousands):
|
| | | | | | | | | | | | | | | | | | | | | | | | | | | | |
| | | Core | | | | |
| Total Assets | | Senior and Mezzanine Loans and Preferred Equity(1) | | CRE Debt Securities | | Net Leased Real Estate | | Corporate(2) | | Total Core Portfolio | | Legacy, Non-Strategic Portfolio(3) | | Total |
| March 31, 2020 | | $ | 2,361,830 |
| | $ | 2,073,016 |
| | $ | 1,119,067 |
| | $ | 899,259 |
| | $ | 6,453,172 |
| | $ | 740,416 |
| | $ | 7,193,588 |
|
| December 31, 2019 | | 2,464,963 |
| | 2,226,448 |
| | 1,181,609 |
| | 496,714 |
| | 6,369,734 |
| | 1,044,572 |
| | 7,414,306 |
|
_________________________________________
| |
| (1) | Includes investments in unconsolidated ventures totaling $577.2 million and $585.0 million as of March 31, 2020 and December 31, 2019, respectively. |
| |
| (2) | Includes cash, unallocated receivables, deferred costs and other assets, net and the elimination of the subordinate tranches of the securitization trusts in consolidation. |
| |
| (3) | Includes PE Investments totaling $8.8 million and $10.3 million as of March 31, 2020 and December 31, 2019, respectively. |
COLONY CREDIT REAL ESTATE, INC.
NOTES TO CONSOLIDATED FINANCIAL STATEMENTS (Continued)
(Unaudited)
Geography
Geography is generally defined as the location in which the income producing assets reside or the location in which income generating services are performed. Geography information on total income includes equity in earnings of unconsolidated ventures. Geography information on total income and long lived assets are presented as follows (dollars in thousands):
|
| | | | | | | | |
| | | Three Months Ended March 31, |
| | | 2020 | | 2019 |
| Total income by geography: | | | | |
| United States | | $ | 124,953 |
| | $ | 148,790 |
|
| Europe | | 20,795 |
| | 12,681 |
|
| Other | | — |
| | 35 |
|
Total(1) | | $ | 145,748 |
| | $ | 161,506 |
|
|
| | | | | | | | |
| | | March 31, 2020 | | December 31, 2019 |
| Long-lived assets by geography: | | | | |
| United States | | $ | 1,062,789 |
| | $ | 1,282,189 |
|
| Europe | | 262,706 |
| | 315,369 |
|
Total(2) | | $ | 1,325,495 |
| | $ | 1,597,558 |
|
_________________________________________
| |
| (1) | Includes interest income, interest income on mortgage loans held in securitization trusts, property and other income and equity in earnings of unconsolidated ventures. |
| |
| (2) | Long-lived assets are comprised of real estate and real estate related intangible assets, and excludes financial instruments and assets held for sale. |
The Company’s net income (loss) and weighted average shares outstanding for the three months ended March 31, 2020 and 2019 consist of the following (dollars in thousands, except per share data):
|
| | | | | | | | |
| | | Three Months Ended March 31, |
| | | 2020 | | 2019 |
| Net income (loss) | | $ | (80,141 | ) | | $ | 14,957 |
|
| Net (income) loss attributable to noncontrolling interests: | | | | |
| Investment Entities | | (523 | ) | | 298 |
|
| Operating Partnership | | 1,892 |
| | (347 | ) |
| Net income (loss) attributable to Colony Credit Real Estate, Inc. common stockholders | | $ | (78,772 | ) | | $ | 14,908 |
|
| | | | | |
| Numerator: | | | | |
| Net income allocated to participating securities (nonvested shares) | | $ | (322 | ) | | $ | (466 | ) |
| Net income (loss) attributable to common stockholders | | $ | (79,094 | ) | | $ | 14,442 |
|
| | | | | |
| Denominator: | | | | |
Weighted average shares outstanding(1)(2) | | 128,487 |
| | 127,943 |
|
| | | | | |
Net income (loss) per common share - basic and diluted(2) | | $ | (0.62 | ) | | $ | 0.11 |
|
_________________________________________
| |
| (1) | For earnings per share, the Company assumes 44.4 million shares of Class B-3 common stock were outstanding prior to January 31, 2018 to reflect the standalone pre-merger financial information of the CLNY Investment Entities, the Company’s predecessor for accounting purposes. On February 1, 2019, the Class B-3 common stock automatically converted to Class A common stock on a 1-for-one basis. |
| |
| (2) | Excludes 3,075,623 CLNC OP Units, which are redeemable for cash, or at the Company’s option, shares of Class A common stock on a 1-for-one basis, and therefore would not be dilutive. |
COLONY CREDIT REAL ESTATE, INC.
NOTES TO CONSOLIDATED FINANCIAL STATEMENTS (Continued)
(Unaudited)
Dividends
The COVID-19 pandemic has caused extraordinary volatility and unprecedented market conditions, including actual and unanticipated consequences to the Company and certain investments, which may continue. Having paid monthly dividends on its common stock through March 31, 2020, the Company and its Board of Directors determined it was prudent and in the Company’s best interests to conserve available liquidity and suspended the Company’s monthly stock dividend beginning with the monthly period ending April 30, 2020. The Board of Directors will evaluate dividends in future periods based upon customary considerations, including market conditions. Importantly, the Company continues to monitor its taxable income to ensure that the Company meets the minimum distribution requirements to maintain its status as a REIT for the year ending December 31, 2020.
Protective Advance
The Company holds a $189.0 million investment in a mezzanine loan and preferred equity investment in a development project in Los Angeles County which includes a hospitality and retail renovation and a new condominium tower construction. The Company’s investment is held in a joint venture with affiliates of its Manager (the “Mezzanine Lender”). On April 30, 2020, the Company made its pro-rata $12.9 million share of the Mezzanine Lender’s $34.7 million protective advance to the senior lender while reserving all rights and remedies as Mezzanine Lender. In addition, the Company may fund approximately $2.5 million, representing its ratable share among other funding joint venture participants, of an approximate $5.1 million shortfall to the protective advance as a result of a single investor non-funding event.
Hedge Unwinds
In April 2020, the Company unwound a portion of its interest rate swaps and in connection with this expects to realize a loss of approximately $16.4 million during the second quarter of 2020, which was previously recorded as an unrealized loss as of March 31, 2020. The Company also called back $15.9 million in net cash collateral to counterparties for its derivative contracts. As of May 7, 2020, those counterparties held $17.4 million in cash collateral.
Bank Credit Facility and Master Repurchase Facilities
On May 6, 2020, the Company amended its Bank Credit Facility to: (i) reduce the minimum tangible net worth covenant requirement from $2.1 billion to $1.5 billion, providing portfolio management flexibilities as a result of any disruptions in investments caused by COVID-19 or other factors; (ii) reduce the facility size from $560.0 million to $450.0 million (noting current borrowings of $299.0 million); (iii) limit dividends in line with taxable income and restrict stock repurchases, each for liquidity preservation purpose; and (iv) focus new investments on senior mortgages.
In addition, on May 7, 2020, the Company amended the tangible net worth covenant under all six of the Company’s Master Repurchase Facilities consistent with the Bank Credit Facility.
CMBS Credit Facilities
In April 2020, the Company consolidated its CMBS Credit Facilities with one existing counterparty bank. With doing so, the Company paid down its CMBS Credit Facilities borrowing advance rate to a blended borrowing advance rate of 62% and extended the repurchase date on all such borrowings to June 30, 2020. This $73.9 million paydown allows for a 15% additional loss on a bond specific basis before further margin calls. As of May 7, 2020, the Company had $123.5 million outstanding under its CMBS Credit Facilities. The financing bears a fixed interest rate of 4.50%.
Investment Sales
Subsequent to March 31, 2020, the Company sold 2 loans in its Legacy, Non-Strategic Portfolio for total gross proceeds of $23.5 million. The Company will recognize a gain of approximately $6.8 million during the second quarter of 2020.
Additionally, the Company sold 1 real estate property in its Legacy, Non-Strategic Portfolio for total gross proceeds of $1.0 million. The Company will recognize a loss of approximately $0.1 million.
On April 22, 2020, the Company completed a discounted payoff of its 4 NY hospitality loans and related investment interests. The Company recorded $36.8 million of provision for loan losses during the three months ended March 31, 2020.
Item 2. Management’s Discussion and Analysis of Financial Condition and Results of Operations
The following discussion should be read in conjunction with our unaudited consolidated financial statements and the accompanying notes thereto, which are included in Item 1 of this Quarterly Report, as well as the information contained in our Form 10-K for the year ended December 31, 2019, which is accessible on the SEC’s website at www.sec.gov.
Introduction
We are a commercial real estate (“CRE”) credit real estate investment trust (“REIT”) focused on originating, acquiring, financing and managing a diversified portfolio consisting primarily of CRE debt investments, CRE debt securities and net leased properties predominantly in the United States. CRE debt investments include senior mortgage loans, mezzanine loans, preferred equity, and participations in such loans and preferred equity interests. CRE debt securities primarily consist of commercial mortgage-backed securities (“CMBS”) (including “B-pieces” of a CMBS securitization pool) or CRE collateralized loan obligations (“CLOs”) (collateralized by pools of CRE debt investments). Net leased properties consist of CRE properties with long-term leases to tenants on a net-lease basis, where such tenants generally will be responsible for property operating expenses such as insurance, utilities, maintenance capital expenditures and real estate taxes.
We were organized in the state of Maryland on August 23, 2017. On January 31, 2018, the Combination among the CLNY Contributed Portfolio, NorthStar I and NorthStar II was completed in an all-stock exchange. We elected to be taxed as a REIT under the Internal Revenue Code of 1986, as amended, beginning with our taxable year ended December 31, 2018. We conduct all of our activities and hold substantially all of our assets and liabilities through our operating subsidiary, Credit RE Operating Company, LLC (the “OP”). At March 31, 2020, we owned 97.7% of the OP, as its sole managing member. The remaining 2.3% is owned primarily by our affiliate as noncontrolling interests.
We are externally managed by a subsidiary of Colony Capital, a New York Stock Exchange (“NYSE”)-listed global real estate and investment management firm. As of March 31, 2020, Colony Capital owned approximately 36.5% of our common equity on a fully diluted basis.
Our Manager
We are externally managed by our manager, CLNC Manager, LLC (our “Manager”). Our Manager is a subsidiary of Colony Capital. Over the past 28 years, Colony Capital and its predecessors have made over $100 billion of investments. Colony Capital’s senior management team has a long track record and extensive experience managing and investing in our target assets and other real estate-related investments through a variety of credit cycles and market conditions. Colony Capital’s global footprint and corresponding network provides its investment and asset management teams with proprietary market knowledge, sourcing capabilities and the local presence required to identify, execute and manage complex transactions, although Colony Capital and its predecessors have not been immune to national and local economic trends that are unrelated to its management of assets. Colony Capital’s history of external management includes its previous management of Colony Financial, Inc. (“Colony Financial”), an externally managed commercial mortgage REIT listed on the NYSE and focused on secondary loan acquisitions, high-yielding originations and real estate equity, and its management of various non-traded REITs (previously including NorthStar I and NorthStar II) and registered investment companies.
Colony Capital is headquartered in Los Angeles, with key offices in Boca Raton, New York, Paris and London. Its operations are broad and diverse and include the management of real estate, both owned and on behalf of a diverse set of institutional and individual investors. Colony Capital’s management team has diverse backgrounds. On March 25, 2020, the board of directors of the Company approved the appointment of Michael J. Mazzei as Chief Executive Officer and President of the Company and Andrew E. Witt as Chief Operating Officer of the Company (transitioning from his role as Interim Chief Executive Officer and President), in each instance, effective April 1, 2020. Neale W. Redington, a 11-year veteran of Colony Capital, serves as our Chief Financial Officer and Treasurer. In addition, supporting our business, David A. Palamé, a 13-year veteran of Colony Capital, serves as our General Counsel and Secretary, and Frank V. Saracino, a five-year veteran of Colony Capital, serves as our Chief Accounting Officer.
We draw on Colony Capital’s substantial real estate investment platform and relationships to source, underwrite, structure and manage a robust pipeline of investment opportunities as well as to access debt and equity capital to fund our operations. We believe we can originate, acquire, finance and manage investments with attractive in-place cash flows and the potential for meaningful capital appreciation over time. We also benefit from Colony Capital’s portfolio management, finance and administration functions, which provide us with legal, compliance, investor relations, asset valuation, risk management and information technology services. Colony Capital also has a captive, fully functional, separate asset management company that engages primarily in loan servicing for performing, sub-performing and non-performing commercial loans, including senior secured loans, revolving lines of credit, loan participations, subordinated loans, unsecured loans and mezzanine debt. Colony Capital’s asset management company is a commercial special servicer rated by both Standard & Poor’s and Fitch’s rating services.
On April 1, 2020, Colony Capital reported in Amendment No. 3 to Schedule 13D (filed with the SEC) that it has postponed any decision regarding a disposition of its management agreement with the Company until market conditions improve due to ongoing uncertainty surrounding the duration and magnitude of the COVID-19 pandemic and its impact on the global economy.
Our operating segments include the Senior and Mezzanine Loans and Preferred Equity, CRE Debt Securities, Net Leased Real Estate, Corporate and Legacy, Non-Strategic Portfolio. Our target assets, as more fully described below, are included in different operating segments. Senior mortgage loans, mezzanine loans and preferred equity are included in the loan portfolio segment.
Our Target Assets
We have not closed any new investments in 2020 through the date hereof and are primarily focused on existing investments and commitments. Generally, our investment strategy is to originate and selectively acquire our target assets, which consist of the following:
| |
| • | Senior Mortgage Loans. We focus on originating and selectively acquiring senior mortgage loans that are backed by CRE assets. These loans are secured by a first mortgage lien on a commercial property and provide mortgage financing to a commercial property developer or owner. The loans may vary in duration, bear interest at a fixed or floating rate and amortize, if at all, over varying periods, often with a balloon payment of principal at maturity. Senior mortgage loans include junior participations in our originated senior loans for which we have syndicated the senior participations to other investors and retained the junior participations for our portfolio. We believe these junior participations are more like the senior mortgage loans we originate than other loan types given their credit quality and risk profile. |
| |
| • | Mezzanine Loans. We may originate or acquire mezzanine loans, which are structurally subordinate to senior loans, but senior to the borrower’s equity position. Mezzanine loans may be structured such that our return accrues and is added to the principal amount rather than paid on a current basis. We may also pursue equity participation opportunities in instances when the risk-reward characteristics of the investment warrant additional upside participation in the possible appreciation in value of the underlying assets securing the investment. |
| |
| • | Preferred Equity. We may make investments that are subordinate to senior and mezzanine loans, but senior to the common equity in the mortgage borrower. Preferred equity investments may be structured such that our return accrues and is added to the principal amount rather than paid on a current basis. We also may pursue equity participation opportunities in preferred equity investments, like such participations in mezzanine loans. |
| |
| • | CRE Debt Securities. We may make investments that consist of bonds comprising certain tranches of CRE securitization pools, such as CMBS (including Non-Investment Grade “B-pieces” of a CMBS securitization pool) or CRE CLOs (including the junior tranches thereof, collateralized by pools of CRE debt instruments). These bonds may be investment grade or below investment grade and are collateralized by CRE debt, typically secured by senior mortgage loans and may be fixed rate or floating rate securities. Due to their first-loss position, CMBS B-pieces are typically offered at a discount to par. These investments typically carry a 10-year weighted average life due to prepayment restrictions. We generally intend to hold these investments through maturity, but may, from time to time, opportunistically sell positions should liquidity become available or be required. |
| |
| • | Net Leased Real Estate. We may also invest directly in well-located commercial real estate with long-term leases to tenants on a net lease basis, where such tenants generally will be responsible for property operating expenses such as insurance, utilities, maintenance capital expenditures and real estate taxes. In addition, tenants of our properties typically pay rent increases based on: (1) increases in the consumer price index (typically subject to ceilings), (2) fixed increases, or (3) additional rent calculated as a percentage of the tenants’ gross sales above a specified level. We believe that a portfolio of properties under long-term, net lease agreements generally produces a more predictable income stream than many other types of real estate portfolios, while continuing to offer the potential for growth in rental income. |
The allocation of our capital among our target assets will depend on prevailing market conditions at the time we invest and may change over time in response to different prevailing market conditions. In addition, in the future, we may invest in assets other than our target assets or change our target assets. With respect to all our investments, we invest so as to maintain our qualification as a REIT for U.S. federal income tax purposes and our exclusion or exemption from regulation under the Investment Company Act of 1940, as amended (the “Investment Company Act”).
We believe that events in the financial markets from time to time, including the current and potential impacts of the COVID-19 pandemic, have created and will create significant dislocation between price and intrinsic value in certain asset classes as well as a supply and demand imbalance of available credit to finance these assets. We believe that our Manager’s in-depth understanding of CRE and real estate-related investments, and in-house underwriting, asset management and resolution capabilities, provides the Company and management with a sophisticated full-service value-add platform to regularly evaluate our investments and determine primary, secondary or alternative disposition strategies. This includes intermediate servicing and complex and creative
negotiating, restructuring of non-performing investments, foreclosure considerations, intense management or development of owned real estate, in each case to reposition and achieve optimal value realization for the Company and its stockholders. Depending on the nature of the underlying investment, we may pursue repositioning strategies through judicious capital investment in order to extract maximum value from the investment or recognize unanticipated losses to reinvest resulting liquidity in higher-yielding performing investments.
Our Business Segments
Following the Combination, we conducted our business through the following five operating segments: the loan portfolio, CRE debt securities, net leased real estate, other, and corporate. We continually monitor and review our segment reporting structure in accordance with authoritative guidance to determine whether any changes have occurred that would impact our reportable segments.
During the third quarter of 2019, we realigned the business and reportable segment information to reflect how the Chief Operating Decision Makers regularly review and manage the business. As a result, effective for the quarter ended September 30, 2019, we present our business segments as follows:
| |
| • | Core Portfolio, which consists of the following four segments and remain unchanged from the prior segments: |
| |
| ◦ | Senior and Mezzanine Loans and Preferred Equity—CRE debt investments including senior mortgage loans, mezzanine loans, and preferred equity interests as well as participations in such loans. The segment also includes acquisition, development and construction (“ADC”) arrangements accounted for as equity method investments. |
| |
| ◦ | CRE Debt Securities— securities investments currently consisting of BBB and some BB rated CMBS (including Non-Investment Grade “B-pieces” of a CMBS securitization pool) or CRE CLOs (including the junior tranches thereof, collateralized by pools of CRE debt investments). |
| |
| ◦ | Net Leased Real Estate—direct investments in commercial real estate with long-term leases to tenants on a net lease basis, where such tenants generally will be responsible for property operating expenses such as insurance, utilities, maintenance, capital expenditures and real estate taxes. |
| |
| ◦ | Corporate—includes corporate-level asset management and other fees including expenses related to our secured revolving credit facility, related party and general and administrative expenses to the Core Portfolio only. |
| |
| • | Legacy, Non-Strategic Portfolio—segment consists of direct investments in operating real estate such as multi-tenant office and multifamily residential assets such as real estate acquired in settlement of loans which we plan to exit. It also includes two portfolios of private equity funds (“PE Investments”) and certain retail and other legacy loans originated prior to the Combination. This segment also includes corporate-level asset management and other fees including expenses related to secured revolving credit facility, related party and general and administrative expenses related to the Legacy, Non-Strategic Portfolio only. |
There were no changes in the structure of our internal organization that prompted the change in reportable segments. Prior year amounts have been revised to conform to the current year presentation. Accordingly, we realigned the discussion and analysis of our portfolio and results of operations to reflect these reportable segments.
Significant Developments - Core Portfolio
During the three months ended March 31, 2020 and through May 7, 2020, significant developments affecting our business and results of operations of our Core Portfolio included the following:
| |
| • | Generated U.S. GAAP net loss of $(35.0) million, or $(0.27) per share and Core Earnings of $46.2 million, or $0.35 per share; |
| |
| • | Dividend payments of $39.5 million for the three months ended March 31, 2020; and suspended monthly dividends beginning with the monthly period ended April 30, 2020; |
| |
| • | At March 31, 2020 our current expected credit loss reserve (“CECL”) calculated by our probability of default (“PD”)/loss given default (“LGD”) model for our outstanding loans and future loan funding commitments is $52.2 million, or $0.41 per share, which is 2.0% of the aggregate commitment amount of our loan portfolio; |
| |
| • | Three loans totaling $67.8 million in carrying value repaid in full during the three months ended March 31, 2020, consisting of two senior loans and one mezzanine construction loan; |
| |
| • | We modified our Bank Credit Facility and Master Repurchase Facilities in anticipation of COVID-19 uncertainties; |
| |
| • | We also modified certain aspects of our CMBS Credit Facilities. These modifications were done in conjunction with paydowns of those facilities, which totaled $73.9 million. We also paid a total of $48.9 million in margin calls; |
| |
| • | Made a protective advance totaling $12.9 million on our Los Angeles Mixed-use project. See “Los Angeles Construction Loan and Preferred Equity Investment” in “Our Core Portfolio” below; and |
| |
| • | In April 2020, we unwound a portion of our interest rate swaps and in connection with this we will realize a loss of $16.4 million during the second quarter of 2020, which was previously recorded as an unrealized loss as of March 31, 2020. |
Significant Developments - Legacy, Non-Strategic Portfolio
During the three months ended March 31, 2020 and through May 7, 2020, significant developments affecting our business and results of operations of our Legacy, Non-Strategic Portfolio included the following:
| |
| • | Generated U.S. GAAP net loss of $(43.8) million, or $(0.35) per share, and Legacy, Non-Strategic Earnings loss of $(34.7) million, or $(0.26) per share; |
| |
| • | Sold ten investments (five real estate properties and five loans) for a total gross sales price of $254 million and a net loss of $3.6 million; |
| |
| • | Subsequent to March 31, 2020, sold two loans for total gross proceeds of $23.5 million and a projected gain on sale of $6.8 million and one real estate property for total gross proceeds of $1.0 million and a projected loss on sale of $0.1 million; |
| |
| • | During the three months ended March 31, 2020, given the immediate and significant detrimental impact of COVID-19, we recorded a $36.8 million provision for loan loss related to our four NY hospitality loans. On April 22, 2020, we closed on a discounted payoff of the total investment interests, realizing on such provision for loan loss; and |
| |
| • | Classified 19 operating real estate properties and three loans totaling $139 million as held for sale; |
Impact of COVID-19
Since its discovery in December 2019, a new strain of coronavirus, which causes the viral disease known as COVID-19, has spread throughout the world, including the United States. The outbreak has been declared to be a pandemic by the World Health Organization, and the Health and Human Services Secretary has declared a public health emergency in the United States in response to the outbreak. Considerable uncertainty still surrounds COVID-19 and its potential effects, and the extent of and effectiveness of any responses taken on a national and local level.
Accordingly, the COVID-19 pandemic has negatively impacted CRE credit REITs across the industry, as well as other companies that own and operate commercial real estate investments, including our company. As we manage the impact and uncertainties of the COVID-19 pandemic, cash preservation, liquidity and investment and portfolio management are our key priorities.
We are working closely with our borrowers and tenants to address the impact of COVID-19 on their business. To the extent that certain borrowers are experiencing significant financial dislocation we may have and may continue to consider the use of interest and other reserves and/or replenishment obligations of the borrower and/or guarantors to meet current interest payment obligations, for a limited period. Similarly, we may evaluate converting certain current interest payment obligations to payment-in-kind as a potential bridge period solution. We have in limited cases allowed some portions of current interest to convert to payment-in-kind.
We have also taken various steps to mitigate the impact of COVID-19 on our liquidity, including aggregate net draws of $226.5 million on our revolving credit facility during the first quarter as a precautionary measure to increase cash on hand. As of the date of this report, we have approximately $255 million in cash on hand, representing substantially all of our available capacity. We have also agreed to certain margin holidays or rollover extensions on our Master Repurchase Facilities and CMBS Credit Facility financing, as described in further detail in “Liquidity and Capital Resources” below.
The COVID-19 pandemic has created uncertainties that have and will negatively impact our future operating results, liquidity and financial condition. However, we believe there are too many uncertainties to predict and quantify the full impact. The potential concerns and risks include, but are not limited to, mortgage borrower’s ability to make monthly payments, lessees’ capacity to pay their rent, and the resulting impact on us to meet our obligations. Therefore, there can be no assurances that we will not need to take impairment charges in future quarters or experience further declines in revenues and net income, which could be material. For more information, refer to “Part II - Item 1A. Risk Factors” and “COVID-19 Update” in “Our Core Portfolio”, “Our Legacy, Non-Strategic Portfolio” and “Liquidity and Capital Resources” sections below for further discussion regarding the COVID-19 pandemic and its impact on our future operating results, liquidity and financial condition.
Internal Controls
We are pleased to report that the state of health and well-being of the Manager’s employees is strong. Our Manager instituted a full remote work policy in early March that will be in effect through June 1, 2020, at the earliest.
Our internal control framework, which includes controls over financial reporting and disclosure, continues to operate effectively. Considering the COVID-19 pandemic, we have supplemented our framework by instituting certain entity level procedures and controls that ensure communication amongst our team that enhances our ability to prevent and detect material errors and/or omissions.
Results of Operations Summary
The following tables present our results of operations for the three months ended March 31, 2020 and 2019 (dollars in thousands):
|
| | | | | | | | | | | | | | | | | | | | | | | | |
| | | Three Months Ended March 31, |
| | | 2020 | | 2019 |
| | | Core Portfolio | | Legacy, Non-Strategic Portfolio | | Total | | Core Portfolio | | Legacy, Non-Strategic Portfolio | | Total |
| Net interest income | | $ | 27,150 |
| | $ | 706 |
| | $ | 27,856 |
| | $ | 18,336 |
| | $ | 3,622 |
| | $ | 21,958 |
|
| Property and other income | | 30,632 |
| | 31,290 |
| | 61,922 |
| | 30,064 |
| | 33,247 |
| | 63,311 |
|
| Management fee expense | | (6,516 | ) | | (1,430 | ) | | (7,946 | ) | | (9,086 | ) | | (2,272 | ) | | (11,358 | ) |
| Property operating expense | | (3,684 | ) | | (18,847 | ) | | (22,531 | ) | | (8,946 | ) | | (19,234 | ) | | (28,180 | ) |
| Transaction, investment and servicing expense | | (2,214 | ) | | (920 | ) | | (3,134 | ) | | (54 | ) | | (475 | ) | | (529 | ) |
| Interest expense on real estate | | (8,461 | ) | | (4,617 | ) | | (13,078 | ) | | (8,570 | ) | | (5,037 | ) | | (13,607 | ) |
| Depreciation and amortization | | (11,153 | ) | | (6,823 | ) | | (17,976 | ) | | (13,084 | ) | | (14,578 | ) | | (27,662 | ) |
| Provision for loan losses | | (31,499 | ) | | (38,433 | ) | | (69,932 | ) | | — |
| | — |
| | — |
|
| Impairment of operating real estate | | — |
| | (4,126 | ) | | (4,126 | ) | | — |
| | — |
| | — |
|
| Administrative expense | | (4,131 | ) | | (2,907 | ) | | (7,038 | ) | | (3,638 | ) | | (3,015 | ) | | (6,653 | ) |
| Unrealized gain on mortgage loans and obligations held in securitization trusts, net | | (19,452 | ) | | — |
| | (19,452 | ) | | 1,029 |
| | — |
| | 1,029 |
|
| Realized gain (loss) on mortgage loans and obligations held in securitization trusts, net | | — |
| | — |
| | — |
| | 48 |
| | — |
| | 48 |
|
| Other gain (loss) on investments, net | | (20,512 | ) | | 350 |
| | (20,162 | ) | | (3,827 | ) | | (1,252 | ) | | (5,079 | ) |
| Income (loss) before equity in earnings of unconsolidated ventures and income taxes | | (49,840 | ) | | (45,757 | ) | | (95,597 | ) | | 2,272 |
| | (8,994 | ) | | (6,722 | ) |
| Equity in earnings (loss) of unconsolidated ventures | | 14,074 |
| | 3,093 |
| | 17,167 |
| | 18,368 |
| | 2,942 |
| | 21,310 |
|
| Income tax benefit (expense) | | (163 | ) | | (1,548 | ) | | (1,711 | ) | | 1,988 |
| | (1,619 | ) | | 369 |
|
| Net income (loss) | | $ | (35,929 | ) | | $ | (44,212 | ) | | $ | (80,141 | ) | | $ | 22,628 |
| | $ | (7,671 | ) | | $ | 14,957 |
|
See “Our Core Portfolio” and “Our Legacy, Non-Strategic Portfolio” sections for further discussion of our portfolio and results of operations.
Our Core Portfolio
As of March 31, 2020, our Core Portfolio, including our senior and mezzanine loans and preferred equity, CRE debt securities, net leased real estate and corporate segments, consisted of 110 investments representing approximately $4.2 billion in book value (excluding cash, cash equivalents and certain other assets). Our senior and mezzanine loans and preferred equity consisted of 53 senior mortgage loans, mezzanine loans, preferred equity investments and other loans and had a weighted average cash coupon of 6.3% and a weighted average all-in unlevered yield of 7.5%. Our CRE debt securities portfolio had a weighted average cash coupon of 3.7%. Our net leased real estate consisted of approximately 13.1 million total square feet of space and total first quarter net operating income (“NOI”) of that portfolio was approximately $17.6 million.
As of March 31, 2020, our Core Portfolio consisted of the following investments (dollars in thousands):
|
| | | | | | | | | | | | | | | | | | | |
| | | Count(1) | | Book value (Consolidated) | | Book value (at CLNC share)(2) | | Net book value (Consolidated)(3) | | Net book value (at CLNC share)(4) |
| Core Portfolio | | | | | | | | | | |
Senior mortgage loans(5) | | 35 |
| | $ | 2,281,164 |
| | $ | 2,281,164 |
| | $ | 663,979 |
| | $ | 663,979 |
|
Mezzanine loans(5) | | 9 |
| | 318,182 |
| | 318,182 |
| | 318,182 |
| | 318,182 |
|
Preferred equity and other loans(5)(6) | | 9 |
| | 267,783 |
| | 267,783 |
| | 267,783 |
| | 267,783 |
|
| CRE debt securities | | 51 |
| | 270,175 |
| | 270,175 |
| | 72,783 |
| | 72,783 |
|
| Net leased real estate | | 6 |
| | 1,059,563 |
| | 1,045,596 |
| | 326,212 |
| | 321,123 |
|
| Total/Weighted average Core Portfolio | | 110 |
| | $ | 4,196,867 |
| | $ | 4,182,900 |
| | $ | 1,648,939 |
| | $ | 1,643,850 |
|
________________________________________
| |
| (1) | Count for net leased real estate represents number of investments. |
| |
| (2) | Book value at our share represents the proportionate book value based on ownership by asset as of March 31, 2020. |
| |
| (3) | Net book value represents book value less any associated financing as of March 31, 2020. |
| |
| (4) | Net book value at our share represents the proportionate book value based on asset ownership less any associated financing based on ownership as of March 31, 2020. |
| |
| (5) | Senior mortgage loans, mezzanine loans, and preferred equity include investments in joint ventures whose underlying interest is in a loan or preferred equity. |
| |
| (6) | Preferred equity balances include $28.0 million of book value at our share attributable to related equity participation interests. |
The following charts illustrate the diversification of our Core Portfolio (not including CRE Debt Securities) based on investment type, underlying property type, and geography, as of March 31, 2020 (percentages based on book value at our share, which represents the proportionate book value based on our ownership by asset):
|
| | |
| Investment Type | | Property Type |
| | |
_________________________________________
| |
| (1) | Senior mortgage loans include junior participations in our originated senior mortgage loans for which we have syndicated the senior participations to other investors and retained the junior participations for our portfolio and contiguous mezzanine loans where we own both the senior and junior loan positions. We believe these investments are more similar to the senior mortgage loans we originate than other loan types given their credit quality and risk profile. |
| |
| (2) | Mezzanine loans include other subordinated loans. |
| |
| (3) | Preferred equity balances include $28.0 million of book value at our share attributable to related equity participation interests. |
| |
| (4) | Other contains one corporate term loan secured by the borrower’s limited partnership interests in a fund. |
| |
| (5) | Other includes commercial and residential development and predevelopment assets, one corporate term loan secured by the borrower’s limited partnership interests in a fund, and a preferred equity investment in a loan origination platform. |
Underwriting Process
We use a rigorous investment and underwriting process that has been developed and utilized by our Manager’s and its affiliates’ senior management teams leveraging their extensive commercial real estate expertise over many years and real estate cycles. The underwriting process focuses on some or all of the following factors designed to ensure each investment is evaluated appropriately: (i) macroeconomic conditions that may influence operating performance; (ii) fundamental analysis of underlying real estate, including tenant rosters, lease terms, zoning, necessary licensing, operating costs and the asset’s overall competitive position in its market; (iii) real estate market factors that may influence the economic performance of the investment, including leasing conditions and overall competition; (iv) the operating expertise and financial strength and reputation of a tenant, operator, partner or borrower; (v) the cash flow in place and projected to be in place over the term of the investment and potential return; (vi) the appropriateness of the business plan and estimated costs associated with tenant buildout, repositioning or capital improvements; (vii) an internal and third-party valuation of a property, investment basis relative to the competitive set and the ability to liquidate an investment through a sale or refinancing; (viii) review of third-party reports including appraisals, engineering and environmental reports; (ix) physical inspections of properties and markets; (x) the overall legal structure of the investment, contractual implications and the lenders’ rights; and (xi) the tax and accounting impact.
Loan Risk Rankings
In addition to reviewing loans and preferred equity held for investment for impairment quarterly, the Company evaluates loans and preferred equity held for investment to determine if an allowance for loan loss should be established. In conjunction with this review, the Company assesses the risk factors of each senior and mezzanine loans and preferred equity and assigns a risk rating based on a variety of factors, including, without limitation, underlying real estate performance and asset value, values of comparable properties, durability and quality of property cash flows, sponsor experience and financial wherewithal, and the existence of a risk-mitigating loan structure. Additional key considerations include loan-to-value ratios, debt service coverage ratios, loan structure, real estate and credit market dynamics, and risk of default or principal loss. Based on a five-point scale, the Company’s loans and preferred equity held for investment are rated “1” through “5,” from less risk to greater risk. At the time of origination or purchase, loans and preferred equity held for investment are ranked as a “3” and will move accordingly going forward based on the ratings which are defined as follows
| |
| 1. | Very Low Risk—The loan is performing as agreed. The underlying property performance has exceeded underwritten expectations with very strong NOI, debt service coverage ratio, debt yield and occupancy metrics. Sponsor is investment grade, very well capitalized, and employs very experienced management team. |
| |
| 2. | Low Risk—The loan is performing as agreed. The underlying property performance has met or exceeds underwritten expectations with high occupancy at market rents, resulting in consistent cash flow to service the debt. Strong sponsor that is well capitalized with experienced management team. |
| |
| 3. | Average Risk—The loan is performing as agreed. The underlying property performance is consistent with underwriting expectations. The property generates adequate cash flow to service the debt, and/or there is a sufficient reserve or loan structure to provide time for sponsor to execute the business plan. Sponsor has routinely met its obligations and has experience owning/operating similar real estate. |
| |
| 4. | High Risk/Delinquent/Potential for Loss—The loan is in excess of 30 days delinquent and/or has a risk of a principal loss. The underlying property performance is behind underwritten expectations. Loan covenants may require occasional waivers/modifications. Sponsor has been unable to execute its business plan and local market fundamentals have deteriorated. Operating cash flow is not sufficient to service the debt and debt service payments may be coming from sponsor equity/loan reserves. |
| |
| 5. | Impaired/Defaulted/Loss Likely—The loan is in default or a default is imminent, and has a high risk of a principal loss, or has incurred a principal loss. The underlying property performance is significantly worse than underwritten expectation and sponsor has failed to execute its business plan. The property has significant vacancy and current cash flow does not support debt service. Local market fundamentals have significantly deteriorated resulting in depressed comparable property valuations versus underwriting. |
Our average risk ranking was impacted by the current and potential future effects of the COVID 19 pandemic. As mentioned above, management considers several risk factors when assigning our risk rating each quarter. Management believes that the impact of the COVID-19 pandemic adds significant risk to our portfolio which is represented in our current period loan risk rankings which yielded an average rating of 3.8, as a number of assets moved from average risk (3) to high risk (4) during the quarter.
Senior and Mezzanine Loans and Preferred Equity
Our senior and mezzanine loans and preferred equity consists of senior mortgage loans, mezzanine loans and preferred equity interests, some of which have equity participation interests.
33 senior and mezzanine loans and preferred equity interests totaling $1.7 billion in carrying value at our share in our Core Portfolio increased from a prior risk ranking of (3) to a risk ranking of (4). The following table provides a summary of our senior and mezzanine loans and preferred equity in our Core Portfolio based on our internal risk rankings as of March 31, 2020 (dollars in thousands):
|
| | | | | | | | | | | | | | | | | | | | | | |
| | | | | Carrying Value (at CLNC share)(1) | | |
| Risk Ranking | | Count(1) | | Senior mortgage loans(2) | | Mezzanine loans | | Preferred equity and other loans | | Total | | % of Core Portfolio |
| 3 | | 11 |
| | $ | 696,279 |
| | $ | — |
| | $ | — |
| | $ | 696,279 |
| | 24.3 | % |
| 4 | | 37 |
| | 1,585,066 |
| | 159,671 |
| | 235,730 |
| | 1,980,467 |
| | 69.1 | % |
| 5 | | 3 |
| | 27,500 |
| | 130,831 |
| | 31,703 |
| | 190,034 |
| | 6.6 | % |
| | | 51 |
| | $ | 2,308,845 |
| | $ | 290,502 |
| | $ | 267,433 |
| | $ | 2,866,780 |
| | 100.0 | % |
| | | | | | | | | | | | | |
| Weighted average risk ranking | | | | | | | | | | | | 3.8 |
|
___________________________________
| |
| (1) | Count excludes two equity participations held in joint ventures with a combined carrying value (at CLNC share) of $0.3 million which were not assigned risk rankings. |
| |
| (2) | Includes one mezzanine loan totaling $27.7 million where we are also the senior lender. |
The following table provides asset level detail for senior and mezzanine loans and preferred equity included in our Core Portfolio as of March 31, 2020 (dollars in thousands):
|
| | | | | | | | | | | | | | | | | | | | | | | | | | |
| | | Collateral type | | Origination Date | | City, State | | Carrying value(1) | | Principal balance | | Coupon type | | Cash Coupon(2) | | Unlevered all-in yield(3) | | Extended maturity date | | Loan-to-value(4) | | Q1 2020/Q4 2019 Risk ranking(5) |
| Senior loans | | | | | | | | | | | | | | | | |
| Loan 1 | | Hotel | | 1/2/2018 | | San Jose, CA | | $ | 173,434 |
| | $ | 173,485 |
| | Floating | | 4.3% | | 5.3% | | 1/9/2023 | | 62% | | 4/3 |
| Loan 2 | | Multifamily | | 6/21/2019 | | Milpitas, CA | | 172,905 |
| | 175,567 |
| | Floating | | 3.1% | | 5.5% | | 7/9/2024 | | 72% | | 3/3 |
Loan 3(6) | | Other (Mixed-use) | | 10/17/2018 | | Dublin, Ireland | | 171,386 |
| | 171,006 |
| | Fixed | | 8.0% | | 15.0% | | 12/31/2023 | | 96% | | 4/3 |
| Loan 4 | | Hotel | | 10/29/2018 | | San Diego, CA | | 136,520 |
| | 142,661 |
| | Floating | | 4.8% | | 6.9% | | 10/9/2024 | | 71% | | 4/4 |
| Loan 5 | | Hotel | | 6/28/2018 | | Berkeley, CA | | 117,256 |
| | 120,000 |
| | Floating | | 3.2% | | 5.2% | | 7/9/2025 | | 66% | | 4/3 |
| Loan 6 | | Industrial | | 9/19/2019 | | New York, NY | | 113,343 |
| | 116,000 |
| | Floating | | 3.1% | | 5.8% | | 9/19/2024 | | 76% | | 3/3 |
|
| | | | | | | | | | | | | | | | | | | | | | | | | | |
| | | Collateral type | | Origination Date | | City, State | | Carrying value(1) | | Principal balance | | Coupon type | | Cash Coupon(2) | | Unlevered all-in yield(3) | | Extended maturity date | | Loan-to-value(4) | | Q1 2020/Q4 2019 Risk ranking(5) |
| Loan 7 | | Office | | 12/7/2018 | | Carlsbad, CA | | 110,876 |
| | 113,384 |
| | Floating | | 3.7% | | 6.1% | | 12/9/2023 | | 73% | | 3/3 |
Loan 8(6) | | Multifamily | | 6/18/2019 | | Santa Clara, CA | | 98,181 |
| | 99,905 |
| | Floating | | 4.4% | | 7.3% | | 6/18/2024 | | 64% | | 4/3 |
| Loan 9 | | Multifamily | | 4/11/2019 | | Various - U.S. | | 91,405 |
| | 92,000 |
| | Floating | | 3.0% | | 5.9% | | 4/9/2024 | | 65% | | 4/3 |
| Loan 10 | | Office | | 5/31/2019 | | Stamford, CT | | 88,048 |
| | 89,599 |
| | Floating | | 3.5% | | 5.8% | | 6/9/2025 | | 71% | | 4/3 |
| Loan 11 | | Hotel | | 6/25/2018 | | Englewood, CO | | 72,505 |
| | 73,000 |
| | Floating | | 3.5% | | 5.3% | | 7/9/2023 | | 69% | | 4/3 |
| Loan 12 | | Office | | 6/27/2018 | | Burlingame, CA | | 73,159 |
| | 73,250 |
| | Floating | | 2.8% | | 5.1% | | 7/9/2023 | | 61% | | 3/3 |
| Loan 13 | | Other (Mixed-use) | | 10/24/2019 | | Brooklyn, NY | | 66,126 |
| | 69,032 |
| | Floating | | 3.4% | | 5.9% | | 11/9/2024 | | 66% | | 4/3 |
| Loan 14 | | Office | | 8/28/2018 | | San Jose, CA | | 65,594 |
| | 65,753 |
| | Floating | | 2.5% | | 4.5% | | 8/28/2025 | | 66% | | 3/3 |
| Loan 15 | | Office | | 4/5/2019 | | Long Island City, NY | | 62,030 |
| | 62,981 |
| | Floating | | 3.3% | | 5.8% | | 4/9/2024 | | 58% | | 4/3 |
| Loan 16 | | Office | | 5/29/2019 | | Long Island City, NY | | 60,173 |
| | 62,104 |
| | Floating | | 3.5% | | 6.0% | | 6/9/2024 | | 59% | | 4/3 |
| Loan 17 | | Office | | 2/13/2019 | | Baltimore, MD | | 53,995 |
| | 54,623 |
| | Floating | | 3.5% | | 6.2% | | 2/9/2024 | | 74% | | 4/3 |
| Loan 18 | | Office | | 7/12/2019 | | Washington, D.C. | | 49,930 |
| | 50,486 |
| | Floating | | 2.8% | | 5.7% | | 8/9/2024 | | 68% | | 4/3 |
| Loan 19 | | Multifamily | | 7/1/2019 | | Phoenix, AZ | | 43,014 |
| | 43,249 |
| | Floating | | 2.7% | | 5.0% | | 7/9/2024 | | 76% | | 4/3 |
| Loan 20 | | Multifamily | | 10/9/2018 | | Dupont, WA | | 40,296 |
| | 40,500 |
| | Floating | | 3.3% | | 5.6% | | 11/9/2023 | | 82% | | 3/3 |
| Loan 21 | | Multifamily | | 2/8/2019 | | Las Vegas, NV | | 37,919 |
| | 38,237 |
| | Floating | | 3.2% | | 5.9% | | 2/9/2024 | | 71% | | 4/3 |
| Loan 22 | | Multifamily | | 5/22/2018 | | Henderson, NV | | 37,642 |
| | 37,700 |
| | Floating | | 3.3% | | 5.3% | | 6/9/2023 | | 73% | | 4/3 |
| Loan 23 | | Multifamily | | 4/26/2018 | | Oxnard, CA | | 35,614 |
| | 36,500 |
| | Floating | | 5.2% | | 7.2% | | 5/9/2021 | | 71% | | 4/3 |
| Loan 24 | | Office | | 9/26/2019 | | Salt Lake City, UT | | 35,804 |
| | 36,241 |
| | Floating | | 2.7% | | 5.0% | | 10/9/2024 | | 72% | | 4/3 |
| Loan 25 | | Multifamily | | 5/3/2019 | | North Phoenix, AZ | | 35,822 |
| | 36,187 |
| | Floating | | 3.4% | | 5.6% | | 5/9/2024 | | 81% | | 4/3 |
| Loan 26 | | Office | | 6/16/2017 | | Miami, FL | | 33,576 |
| | 33,241 |
| | Floating | | 4.9% | | 6.2% | | 7/9/2022 | | 68% | | 3/3 |
| Loan 27 | | Hotel | | 11/8/2013 | | Bloomington, MN | | 27,500 |
| | 29,587 |
| | n/a(7) | | n/a(7) | | n/a(7) | | 1/9/2020 | | 100% | | 5/4 |
| Loan 28 | | Office | | 3/28/2019 | | San Jose, CA | | 29,552 |
| | 29,741 |
| | Floating | | 3.0% | | 5.9% | | 4/9/2024 | | 64% | | 4/3 |
| Loan 29 | | Multifamily | | 1/11/2019 | | Tempe, AZ | | 26,275 |
| | 26,342 |
| | Floating | | 2.9% | | 5.2% | | 2/9/2024 | | 79% | | 4/3 |
| Loan 30 | | Office | | 1/15/2019 | | Santa Barbara, CA | | 25,001 |
| | 26,236 |
| | Floating | | 3.2% | | 5.7% | | 2/9/2024 | | 80% | | 3/3 |
| Loan 31 | | Office | | 9/16/2019 | | San Francisco, CA | | 22,526 |
| | 22,841 |
| | Floating | | 3.4% | | 6.1% | | 10/9/2024 | | 72% | | 3/3 |
| Loan 32 | | Multifamily | | 12/21/2018 | | Phoenix, AZ | | 21,771 |
| | 21,828 |
| | Floating | | 2.9% | | 5.2% | | 1/9/2023 | | 73% | | 4/3 |
| Loan 33 | | Office | | 8/27/2019 | | San Francisco, CA | | 20,252 |
| | 20,507 |
| | Floating | | 2.8% | | 5.6% | | 9/9/2024 | | 73% | | 3/3 |
| Loan 34 | | Office | | 2/26/2019 | | Charlotte, NC | | 18,752 |
| | 18,960 |
| | Floating | | 3.4% | | 6.0% | | 3/9/2024 | | 56% | | 3/3 |
| Loan 35 | | Multifamily | | 2/8/2019 | | Las Vegas, NV | | 12,982 |
| | 13,084 |
| | Floating | | 3.2% | | 5.9% | | 2/9/2024 | | 71% | | 4/3 |
| Total/Weighted average senior loans | | $ | 2,281,164 |
| | $ | 2,315,817 |
| | | | | | 6.4% | | 3/15/2024 | | 70% | | 3.7/3.1 |
| | | | | | | | | | | | | | | | | | | | | | | |
| Mezzanine loans | | | | | | | | | | | | | | | | |
Loan 36(6) | | Other (Mixed-use) | | 7/14/2017 | | Los Angeles, CA | | $ | 130,831 |
| | $ | 136,461 |
| | Fixed | | 10.0% | | 13.0% | | 7/9/2022 | | 55% – 81% | | 5/4 |
Loan 37(6) | | Multifamily | | 12/26/2018 | | Santa Clarita, CA | | 49,240 |
| | 52,159 |
| | Fixed | | 7.0% | | 13.8% | | 12/26/2024 | | 56% – 84% | | 4/3 |
Loan 38(6) | | Office | | 7/20/2018 | | Dublin, Ireland | | 36,668 |
| | 34,424 |
| | Fixed | | —% | | 12.5% | | 12/20/2021 | | 45% – 68% | | 4/2 |
| Loan 39 | | Hotel | | 9/23/2019 | | Berkeley, CA | | 27,680 |
| | 28,773 |
| | Fixed | | 9.0% | | 11.5% | | 7/9/2025 | | 66% – 81% | | 4/3 |
| Loan 40 | | Other (Mixed-use) | | 3/19/2013 | | San Rafael, CA | | 18,735 |
| | 18,743 |
| | n/a(7) | | n/a(7) | | n/a(7) | | 6/30/2020 | | 32% – 86% | | 4/4 |
| Loan 41 | | Multifamily | | 7/11/2019 | | Placentia, CA | | 21,310 |
| | 22,612 |
| | Fixed | | 8.0% | | 13.3% | | 7/11/2024 | | 51% - 84% | | 4/3 |
| Loan 42 | | Hotel | | 1/9/2017 | | New York, NY | | 11,338 |
| | 12,000 |
| | Floating | | 11.0% | | 12.3% | | 1/9/2022 | | 63% – 76% | | 4/3 |
| Loan 43 | | Multifamily | | 12/3/2019 | | Milpitas, CA | | 18,109 |
| | 18,728 |
| | Fixed | | 8.0% | | 13.3% | | 12/3/2024 | | 49% – 71% | | 4/3 |
| Loan 44 | | Multifamily | | 7/30/2014 | | Various - TX | | 4,271 |
| | 4,534 |
| | Fixed | | 9.5% | | 9.5% | | 8/11/2024 | | 71% – 83% | | 4/3 |
| Total/Weighted average mezzanine loans | | $ | 318,182 |
| | $ | 328,434 |
| | | | | | 12.1% | | 4/5/2023 | | 54% – 78% | | 4.4/3.3 |
|
| | | | | | | | | | | | | | | | | | | | | | | | | | |
| | | Collateral type | | Origination Date | | City, State | | Carrying value(1) | | Principal balance | | Coupon type | | Cash Coupon(2) | | Unlevered all-in yield(3) | | Extended maturity date | | Loan-to-value(4) | | Q1 2020/Q4 2019 Risk ranking(5) |
| | | | | | | | | | | | | | | | | | | | | | | |
| Preferred equity & other loans | | | | | | | | | | | | | | | | |
| Loan 45 | | Industrial | | 9/1/2016 | | Various - U.S. | | $ | 100,560 |
| | $ | 98,386 |
| | Fixed | | 14.1% | | 14.2% | | 9/2/2027 | | n/a | | 4/3 |
| Loan 46 | | Office | | 5/8/2018 | | Various - N.Y. | | 78,351 |
| | 99,190 |
| | Fixed | | 7.0% | | 12.0% | | 6/5/2027 | | n/a | | 4/4 |
Loan 47(6) | | Other (Mixed-use) | | 7/14/2017 | | Los Angeles, CA | | 31,703 |
| | 26,789 |
| | Fixed | | 10.0% | | 13.0% | | 7/9/2022 | | n/a | | 5/4 |
Loan 48(6)(8) | | Industrial | | 9/1/2016 | | Various - U.S. | | 24,300 |
| | — |
| | n/a | | n/a | | n/a | | 9/2/2027 | | n/a | | 4/3 |
| Loan 49 | | Office | | 8/22/2018 | | Las Vegas, NV | | 17,101 |
| | 17,711 |
| | Fixed | | 8.0% | | 15.5% | | 9/9/2023 | | n/a | | 4/3 |
| Loan 50 | | Other | | 6/28/2019 | | Various - U.S. | | 11,769 |
| | 12,731 |
| | Fixed | | 10.0% | | 15.3% | | 5/28/2024 | | n/a | | 4/3 |
Loan 51(8) | | Office | | 7/20/2018 | | Dublin, Ireland | | 3,650 |
| | — |
| | n/a | | n/a | | n/a | | 12/20/2021 | | n/a | | 4/2 |
| Loan 52 | | Other | | 5/2/2019 | | Various - U.S. | | 333 |
| | — |
| | n/a | | n/a | | n/a | | n/a | | n/a | | n/a |
Loan 53(8) | | Hotel | | 10/24/2014 | | Austin, TX | | 16 |
| | — |
| | Fixed | | n/a | | 0.0% | | n/a | | n/a | | n/a |
Total/Weighted average preferred equity & other loans(9) | | $ | 267,783 |
| | $ | 254,807 |
| | | | | | 12.0% | | 5/6/2026 | | — | | 4.1/3.4 |
| | | | | | | | | | | | | | | | | | | | | | | |
| Total/Weighted average senior and mezzanine loans and preferred equity - Core Portfolio | | $ | 2,867,129 |
| | $ | 2,899,058 |
| | | | | | 7.5% | | 4/19/2024 | | — | | 3.8/3.1 |
_________________________________________
| |
| (1) | Represents carrying values at our share as of March 31, 2020. |
| |
| (2) | Represents the stated coupon rate for loans; for floating rate loans, does not include USD 1-month London Interbank Offered Rate (“LIBOR”) which was 0.99% as of March 31, 2020. |
| |
| (3) | In addition to the stated cash coupon rate, unlevered all-in yield includes non-cash payment in-kind interest income and the accrual of origination, extension and exit fees. Unlevered all-in yield for the loan portfolio assumes the applicable floating benchmark rate as of March 31, 2020 for weighted average calculations. |
| |
| (4) | Except for construction loans, senior loans reflect the initial loan amount divided by the as-is value as of the date the loan was originated, or the principal amount divided by the appraised value as of the date of the most recent as-is appraisal. Mezzanine loans include attachment loan-to-value and detachment loan-to-value, respectively. Attachment loan-to-value reflects initial funding of loans senior to our position divided by the as-is value as of the date the loan was originated, or the principal amount divided by the appraised value as of the date of the most recent appraisal. Detachment loan-to-value reflects the cumulative initial funding of our loan and the loans senior to our position divided by the as-is value as of the date the loan was originated, or the cumulative principal amount divided by the appraised value as of the date of the most recent appraisal. |
| |
| (5) | On a quarterly basis, the Company’s senior and mezzanine loans and preferred equity are rated “1” through “5,” from less risk to greater risk. Represents risk ranking as of March 31, 2020 and December 31, 2019, respectively. |
| |
| (6) | Construction senior loans’ loan-to-value reflect the total commitment amount of the loan divided by the as completed appraised value, or the total commitment amount of the loan divided by the projected total cost basis. Construction mezzanine loans include attachment loan-to-value and detachment loan-to-value, respectively. Attachment loan-to-value reflects the total commitment amount of loans senior to our position divided by as-completed appraised value, or the total commitment amount of loans senior to our position divided by projected total cost basis. Detachment loan-to-value reflect the cumulative commitment amount of our loan and the loans senior to our position divided by as-completed appraised value, or the cumulative commitment amount of our loan and loans senior to our position divided by projected total cost basis. |
| |
| (7) | Loans 27 and 40 are on non-accrual status as of March 31, 2020; as such, no income is being recognized. |
| |
| (8) | Represents equity participation interests related to senior loans, mezzanine loans and/or preferred equity investments. |
| |
| (9) | Weighted average calculation for preferred equity and other loans excludes equity participation interests. |
The following table details the types of properties securing our senior and mezzanine loans and preferred equity included in our Core Portfolio and geographic distribution as of March 31, 2020 (dollars in thousands):
|
| | | | | | | | | | | | | | | |
| | | Book value (at CLNC share) | | |
| Collateral property type | | Senior mortgage loans | | Mezzanine loans and preferred equity (1) | | Total | | % of Total |
| Office | | $ | 749,268 |
| | $ | 135,770 |
| | $ | 885,038 |
| | 31.0 | % |
| Multifamily | | 653,836 |
| | 92,939 |
| | 746,775 |
| | 26.0 | % |
| Hotel | | 527,207 |
| | 39,042 |
| | 566,249 |
| | 19.7 | % |
| Industrial | | 113,343 |
| | 124,860 |
| | 238,203 |
| | 8.3 | % |
Other(2) | | 237,510 |
| | 193,354 |
| | 430,864 |
| | 15.0 | % |
| Total | | $ | 2,281,164 |
| | $ | 585,965 |
| | $ | 2,867,129 |
| | 100.0 | % |
| | | | | | | | | |
| | | | | | | | | |
| | | Book value (at CLNC share) | | |
| Region | | Senior mortgage loans | | Mezzanine loans and preferred equity (1) | | Total | | % of Total |
| US West | | $ | 1,282,213 |
| | $ | 351,354 |
| | $ | 1,633,567 |
| | 57.0 | % |
| US Northeast | | 493,645 |
| | 94,334 |
| | 587,979 |
| | 20.5 | % |
| US Southwest | | 254,092 |
| | 16,582 |
| | 270,674 |
| | 9.4 | % |
| US Southeast | | 52,328 |
| | 31,086 |
| | 83,414 |
| | 2.9 | % |
| US Midwest | | 27,500 |
| | 40,194 |
| | 67,694 |
| | 2.4 | % |
| Europe | | 171,386 |
| | 40,317 |
| | 211,703 |
| | 7.4 | % |
US Other(3) | | — |
| | 12,098 |
| | 12,098 |
| | 0.4 | % |
| Total | | $ | 2,281,164 |
| | $ | 585,965 |
| | $ | 2,867,129 |
| | 100.0 | % |
_________________________________________
| |
| (1) | Mezzanine loans and preferred equity also contains one corporate term loan secured by the borrower’s limited partnership interests in a fund and a preferred equity investment in a loan origination platform. |
| |
| (2) | Other includes commercial and residential development and predevelopment assets, one corporate term loan secured by the borrower’s limited partnership interests in a fund, and a preferred equity investment in a loan origination platform. |
| |
| (3) | US Other contains one corporate term loan secured by the borrower’s limited partnership interests in a fund and a preferred equity investment in a loan origination platform. |
The following charts illustrate the diversification of our senior and mezzanine loans and preferred equity included in our Core Portfolio based on interest rate category, property type, and geography as of March 31, 2020 (percentages based on book value at our share, which represents the proportionate book value based on our ownership by asset):
|
| | |
| Interest Rate Category | | Property Type |
| | |
_________________________________________
| |
| (1) | Other includes commercial and residential development and predevelopment assets, one corporate term loan secured by the borrower’s limited partnership interests in a fund, and a preferred equity investment in a loan origination platform. |
| |
| (2) | Other contains one corporate term loan secured by the borrower’s limited partnership interests in a fund and a preferred equity investment in a loan origination platform. |
COVID-19 Update
We collected 99.0% of April interest payments on our Core Portfolio. Most of our borrowers paid on time utilizing cash from operations, while some utilized interest and other reserves. See table below (dollars in thousands):
|
| | | | | | | | | | | | | | | | | | | | |
| | | Carrying Values at March 31, 2020 | | | | |
| Collateral property type | | April Interest - Paid(1) | | April Interest - Utilized Reserves(2) | | April Interest - Delinquent | | Total | | Count(3) | | Average Risk Ranking |
| Hotel | | $ | 100,185 |
| | $ | 438,548 |
| | $ | 27,500 |
| | $ | 566,233 |
| | 7 | | 4.1 |
| Industrial | | 238,203 |
| | — |
| | — |
| | 238,203 |
| | 3 | | 3.5 |
| Multifamily | | 746,775 |
| | — |
| | — |
| | 746,775 |
| | 16 | | 3.7 |
| Office | | 885,038 |
| | — |
| | — |
| | 885,038 |
| | 19 | | 3.6 |
Other(4) | | 430,531 |
| | — |
| | — |
| | 430,531 |
| | 6 | | 3.8 |
| Total | | $ | 2,400,732 |
| | $ | 438,548 |
| | $ | 27,500 |
| | $ | 2,866,780 |
| | 51 | | 3.8 |
| | | | | | | | | | | | | |
| % of Total | | 83.7 | % | | 15.3 | % | | 1.0 | % | | 100.0 | % | | | | |
| | | | | | | | | | | | | |
| | | Carrying Values at March 31, 2020 | | | | |
| Senior loans, mezzanine loans and preferred equity | | April Interest - Paid(1) | | April Interest - Utilized Reserves(2) | | April Interest - Delinquent | | Total | | Count(3) | | Average Risk Ranking |
Senior mortgage loans(5) | | $ | 1,854,135 |
| | $ | 427,210 |
| | $ | 27,500 |
| | $ | 2,308,845 |
| | 36 | | 3.7 |
| Mezzanine loans | | 279,164 |
| | 11,338 |
| | — |
| | 290,502 |
| | 8 | | 4.5 |
| Preferred equity and other loans | | 267,433 |
| | — |
| | — |
| | 267,433 |
| | 7 | | 4.1 |
| Total | | $ | 2,400,732 |
| | $ | 438,548 |
| | $ | 27,500 |
| | $ | 2,866,780 |
| | 51 | | 3.8 |
| | | | | | | | | | | | | |
| % of Total | | 83.7 | % | | 15.3 | % | | 1.0 | % | | 100.0 | % | | | | |
_________________________________________
| |
| (1) | Includes three multifamily senior loans with a total carrying value of $164.7 million in which the borrower needed to contribute cash to satisfy the April 2020 debt service due to net operating income shortfalls of the property. |
| |
| (2) | Includes one hospitality senior loan with a carrying value of $117.3 million in which the company made a property protection advance for April 2020 debt service. |
| |
| (3) | Count excludes two equity participations held in joint ventures with a combined carrying value (at CLNC share) of $0.3 million which were not assigned risk rankings. |
| |
| (4) | Other includes five loans totaling $418.7 million secured by commercial and residential development and predevelopment properties and one $11.8 million corporate term loan secured by the borrower’s limited partnership interests in a fund. |
| |
| (5) | Includes one mezzanine loan totaling $27.7 million where we are also the senior lender. |
We expect borrowers will experience difficulty to make their loan payments over the next several quarters. We are particularly concerned with and focused on loans collateralized by hotels as well as mezzanine loans and preferred equity investments that are subordinate to senior loans provided by other lenders. Failure of our borrowers to meet their loan obligations will not only impact our financial results but may also trigger repayments under our bank credit and master repurchase facilities. Our asset management team is having discussions with borrowers to remain informed on a reasonably current basis, seek to identify issues and address potential value preserving solutions, which may include a loan modification. For the three months ended March 31, 2020, we recorded a specific provision for loan loss of $2.3 million on a loan secured by a hotel with an unpaid principal balance of $29.8 million. This loan was placed on non-accrual status during 2019 and is the only loan in our Core Portfolio that was delinquent in April. We believe that it is too early to predict and quantify the full impact of principal loss, however if the current economic climate persists there is a potential for further losses or permanent impairment in future quarters.
Los Angeles Construction Loan and Preferred Equity Investment
We hold a $189.0 million commitment in a mezzanine loan and preferred equity investment in a development project in Los Angeles County which includes a hospitality and retail renovation and a new condominium tower construction. (the “Mixed-use Project”).
Our investment interests are held through a joint venture (the “Mezzanine Lender”) with affiliates of our Manager. The Mezzanine Lender maintains total commitments to the mezzanine loan and preferred equity investment of approximately $513.2 million of which our commitment is $189.0 million.
In April 2020, the senior mortgage lender notified the borrower developer that the Mixed-use Project loan funding is out of balance, due to cost overruns from certain hard and soft costs and senior loan interest reserve shortfalls projected through completion. On April 30, 2020, the Mezzanine Lender made a protective advance to the senior mortgage lender of $34.7 million, of which our share was $12.9 million. In addition, we may fund approximately $2.5 million, representing our ratable share among other funding joint venture participants, of an approximate $5.1 million shortfall to the protective advance as a result of the single investor non-funding event. We have a remaining unfunded commitment of $32.2 million, which is composed of $16.3 million of cash and the remaining to be funded from an interest reserve. It is anticipated that these current overruns may be further compounded by the impact of COVID-19, with actual and potential construction delays or other factors. Furthermore, once stages of the project are completed, diminished hotel and conference facility demand and slower pace of condominium sales could result in negative carry costs. As such, the borrower may require significant additional capital to complete and operate the Mixed-use Project.
The borrower, the senior mortgage lender and the Mezzanine Lender are in active dialogue regarding future funding requirements to complete the Mixed-use Project. The senior mortgage lender and Mezzanine Lender parties are considering options that include sourcing additional capital commitments from outside investors.
We believe it is possible that all or a part of the Mezzanine Lender’s interest is sold, and/or that additional commitments, if any, are obtained at a greater cost of capital and/or senior to the Mezzanine Lender’s investment interest. Consequently, the liquidity shortfall combined with uncertain market conditions as a result of COVID-19, may have a negative impact on the Mezzanine Lender’s investment interest and may result in an investment loss. (See Loans 36 and 47 in the table above). If additional funding sources are not available and/or the borrower is unable to fund current and future deficiencies, the Mezzanine Lender may be required to fund ongoing shortfalls. If the Mezzanine Lender determines it is unable or unwilling to fund beyond its remaining commitment it could result in a default under the senior mortgage loan and a foreclosure on all interests subordinate to the senior mortgage loan including the Mezzanine Lender and our investment.
Dublin, Ireland Senior Predevelopment Loan
We hold a $171.5 million co-lender interest (61%) in a senior mortgage loan in the amount of $266.5 million. The senior mortgage loan is also held by private investment vehicles managed by Colony Capital. The senior mortgage is Euro denominated and is for a fully entitled land acquisition for a mixed-use development project in Dublin, Ireland (Project Dockland).
As a result of delays in the Irish government zoning authorities providing updated guidelines and a framework for waterfront development, the borrower had to pause the submission of its final development application. Consequently, Project Dockland is six to nine months behind schedule. The effects of this delay may be further exacerbated by the COVID-19 impact on construction schedules and the ability of the borrower to obtain a senior secured development construction facility. COVID-19 may also negatively impact future demands for office and residential space. We and our senior mortgage co-lenders are in discussions with the borrower to address these uncertainties.
Accordingly, project delays combined with uncertain market conditions as a result of COVID-19, may have a negative impact on the senior lender’s investment interest and may result in a future valuation impairment or investment loss. (See Loan 3 in the table).
Refer to “COVID-19 Update” in “Liquidity and Capital Resources” below for further discussion regarding the COVID-19 pandemic and its impact on our future operating results, liquidity and financial condition.
Payment-In-Kind (“PIK”) Interest Income
We have debt investments in our portfolio that contain a PIK provision. Contractual PIK interest, which represents contractually deferred interest added to the loan balance that is due at the end of the loan term, is generally recorded on an accrual basis to the extent such amounts are expected to be collected. During the first quarter of 2020 we recorded $8.4 million of total PIK interest. We will generally cease accruing PIK interest if there is insufficient value to support the accrual or management does not expect the borrower to be able to pay all principal and interest due.
CRE Debt Securities
The following table presents an overview of our CRE debt securities in our Core Portfolio as of March 31, 2020 (dollars in thousands):
|
| | | | | | | | | | | | | | | | | | |
| | | | | | | Weighted Average(1) |
CRE Debt Securities by ratings category(2) | | Number of Securities | | Book value | | Cash coupon | | Unlevered all-in yield | | Remaining term | | Ratings |
| Investment grade rated (BBB) | | 39 |
| | $ | 158,711 |
| | 3.2 | % | | 6.4 | % | | 6.3 |
| | BBB- |
| Non-investment grade rated (BB) | | 4 |
| | 20,861 |
| | 3.3 | % | | 12.1 | % | | 4.9 |
| | BB | B |
| “B-pieces” of CMBS securitization pools | | 8 |
| | 90,603 |
| | 4.6 | % | | 10.1 | % | | 5.6 |
| | — |
| Total/Weighted Average | | 51 |
| | $ | 270,175 |
| | 3.7 | % | | 8.1 | % | | 6.0 |
| | — |
_________________________________________
| |
| (1) | Weighted average metrics weighted by book value, except for cash coupon which is weighted by principal balance. |
| |
| (2) | As of March 31, 2020, all CRE debt securities consisted of CMBS. |
COVID-19 Update
Consistent with the overall market, our CRE debt securities (CMBS), which we mark-to-market, lost significant value for the three months ended March 31, 2020. We expect continued challenges to CRE debt security values, with possible permanent losses resulting from delinquencies and potential defaults in underlying loans, in particular, with respect to loans secured by hotel and retail properties. Further losses not only impact our financial results but may also trigger further repayments under our CMBS master repurchase facilities.
Refer to “COVID-19 Update” in “Liquidity and Capital Resources” below for further discussion regarding the COVID-19 pandemic and its impact on our future operating results, liquidity and financial condition.
Net Leased Real Estate
Our net leased real estate investment strategy focuses on direct ownership in commercial real estate with an emphasis on properties with stable cash flow, which may be structurally senior to a third-party partner’s equity. In addition, we may own net leased real estate investments through joint ventures with one or more partners. As part of our net leased real estate strategy, we explore a variety of real estate investments including multi-tenant office, multifamily, student housing and industrial. These properties are typically well-located with strong operating partners and we believe offer both attractive cash flow and returns.
As of March 31, 2020, $1.0 billion, or 25.0% of our assets were invested in net leased real estate properties included in our Core Portfolio and these properties were 97.6% occupied. The following table presents our net leased real estate investments included in our Core Portfolio as of March 31, 2020 (dollars in thousands):
|
| | | | | | | | | | | |
| | | Count | | Carrying Value(1) | | NOI/EBITDA for the three months ended March 31, 2020 (2) |
| Net leased real estate | | 6 |
| | $ | 1,045,596 |
| | $ | 17,577 |
|
| Total/Weighted average net leased real estate - Core Portfolio | | 6 |
| | $ | 1,045,596 |
| | $ | 17,577 |
|
________________________________________
| |
| (1) | Represents carrying values at our share as of March 31, 2020; includes real estate tangible assets, deferred leasing costs and other intangible assets less intangible liabilities. |
| |
| (2) | Net operating income is defined as property operating income excluding above/below market lease amortization less property operating expense. EBITDA is defined as net property operating income excluding interest, tax expense, depreciation and amortization. Please refer to “Non-GAAP Supplemental Financial Measures” for further information on NOI/EBITDA. |
The following table provides asset-level detail of our net leased real estate included in our Core Portfolio as of March 31, 2020:
|
| | | | | | | | | | | | | | | | |
| | | Collateral type | | City, State | | Number of Properties | | Number of Buildings | | Rentable square feet (“RSF”) / units/keys | | Weighted average % leased(1) | | Weighted average lease term (yrs)(2) |
| Net leased real estate | | | | | | | | | | | | | | |
| Net lease 1 | | Industrial | | Various - U.S. | | 22 |
| | 22 |
| | 6,697,304 RSF | | 88% | | 4.7 |
| Net lease 2 | | Office | | Stavenger, Norway | | 1 |
| | 26 |
| | 1,290,926 RSF | | 100% | | 10.2 |
| Net lease 3 | | Industrial | | Various - U.S. | | 2 |
| | 2 |
| | 2,787,343 RSF | | 100% | | 18.3 |
| Net lease 4 | | Industrial | | Various - OH | | 23 |
| | 23 |
| | 1,834,422 RSF | | 99% | | 3.6 |
| Net lease 5 | | Office | | Aurora, CO | | 1 |
| | 1 |
| | 183,529 RSF | | 100% | | 2.7 |
| Net lease 6 | | Office | | Indianapolis, IN | | 1 |
| | 1 |
| | 338,000 RSF | | 100% | | 5.8 |
| Total/Weighted average net leased real estate | | 50 |
| | 75 |
| | 13,131,524 RSF | | 96% | | 9.5 |
________________________________________
| |
| (1) | Represents the percent leased as of March 31, 2020. Weighted average calculation based on carrying value at our share as of March 31, 2020. |
| |
| (2) | Based on in-place leases (defined as occupied and paying leases) as of March 31, 2020 and assumes that no renewal options are exercised. Weighted average calculation based on carrying value at our share as of March 31, 2020. |
The following charts illustrate the concentration of our net leased real estate portfolio included in Core Portfolio based on property type and geography as of March 31, 2020 (percentages based on book value at our share, which represents the proportionate book value based on our ownership by asset):
COVID-19 Update
We collected 94.8% of total April rents from our net leased real estate portfolio, with unpaid rents of approximately $0.4 million. We met all April mortgage obligations securing the properties within our net lease real estate portfolio. We believe these properties will continue to perform but caution that COVID-19 events could result in lease modifications, impairment and the inability to make our mortgage payments, all which could result in defaults under our mortgage obligations or trigger repayments under our bank credit facility.
During March 2020 we unwound our NOK FX Future contracts related to Net Lease 2 (Stavenger, Norway). Subsequently, likely due to weak demand and storage shortages for oil, the NOK experienced a depreciation versus the U.S. dollar.
Refer to “COVID-19 Update” in “Liquidity and Capital Resources” below for further discussion regarding the COVID-19 pandemic and its impact on our future operating results, liquidity and financial condition.
Results of Operations - Core Portfolio
The following table summarizes our Core Portfolio results of operations for the three months ended March 31, 2020 and 2019 (dollars in thousands):
|
| | | | | | | | | | | | | | | |
| | | Three Months Ended March 31, | | Increase (Decrease) |
| | | 2020 | | 2019 | | Amount | | % |
| Net interest income | | | | | | | | |
| Interest income | | $ | 44,400 |
| | $ | 32,998 |
| | $ | 11,402 |
| | 34.6 | % |
| Interest expense | | (19,746 | ) | | (17,503 | ) | | (2,243 | ) | | 12.8 | % |
| Interest income on mortgage loans held in securitization trusts | | 20,555 |
| | 38,476 |
| | (17,921 | ) | | (46.6 | )% |
| Interest expense on mortgage obligations issued by securitization trusts | | (18,059 | ) | | (35,635 | ) | | 17,576 |
| | (49.3 | )% |
| Net interest income | | 27,150 |
| | 18,336 |
| | 8,814 |
| | 48.1 | % |
| | | | | | | | | |
| Property and other income | | | | | | | | |
| Property operating income | | 21,512 |
| | 29,903 |
| | (8,391 | ) | | (28.1 | )% |
| Other income | | 9,120 |
| | 161 |
| | 8,959 |
| | n.m. |
|
| Total property and other income | | 30,632 |
| | 30,064 |
| | 568 |
| | 1.9 | % |
| | | | | | | | | |
| Expenses | | | | | | | | |
| Management fee expense | | 6,516 |
| | 9,086 |
| | (2,570 | ) | | (28.3 | )% |
| Property operating expense | | 3,684 |
| | 8,946 |
| | (5,262 | ) | | (58.8 | )% |
| Transaction, investment and servicing expense | | 2,214 |
| | 54 |
| | 2,160 |
| | n.m. |
|
| Interest expense on real estate | | 8,461 |
| | 8,570 |
| | (109 | ) | | (1.3 | )% |
| Depreciation and amortization | | 11,153 |
| | 13,084 |
| | (1,931 | ) | | (14.8 | )% |
| Provision for loan losses | | 31,499 |
| | — |
| | 31,499 |
| | n.m. |
|
| Administrative expense | | 4,131 |
| | 3,638 |
| | 493 |
| | 13.6 | % |
| Total expenses | | 67,658 |
| | 43,378 |
| | 24,280 |
| | 56.0 | % |
| | | | | | | | | |
| Other income (loss) | | | | | | | | |
| Unrealized gain (loss) on mortgage loans and obligations held in securitization trusts, net | | (19,452 | ) | | 1,029 |
| | (20,481 | ) | | n.m. |
|
| Realized gain on mortgage loans and obligations held in securitization trusts, net | | — |
| | 48 |
| | (48 | ) | | n.m. |
|
| Other loss, net | | (20,512 | ) | | (3,827 | ) | | (16,685 | ) | | n.m. |
|
| Income (loss) before equity in earnings of unconsolidated ventures and income taxes | | (49,840 | ) | | 2,272 |
| | (52,112 | ) | | n.m. |
|
| Equity in earnings of unconsolidated ventures | | 14,074 |
| | 18,368 |
| | (4,294 | ) | | (23.4 | )% |
| Income tax benefit (expense) | | (163 | ) | | 1,988 |
| | (2,151 | ) | | n.m. |
|
| Net income | | $ | (35,929 | ) | | $ | 22,628 |
| | $ | (58,557 | ) | | n.m. |
|
Comparison of Core Portfolio for Three Months Ended March 31, 2020 and 2019
Net Interest Income
Interest income
Interest income increased by $11.4 million to $44.4 million for the three months ended March 31, 2020, as compared to the three months ended March 31, 2019. The increase was primarily due to a $17.9 million increase from originations, acquisitions and refinancings of loans in 2019 and 2020. This was partially offset by a decrease of $5.7 million related to the repayment of loan investments.
Interest expense
Interest expense increased by $2.2 million to $19.7 million for the three months ended March 31, 2020, as compared to the three months ended March 31, 2019. The increase was primarily due to a $5.0 million increase from originations, acquisitions and refinancings of loans in 2019 and 2020 and a $3.1 million increase related to the Company executing a securitization transaction collateralized by a pool of 21 senior loans. This was partially offset by $4.1 million decrease resulting from the repayment of securitization bonds payable and loan investments.
Interest income on mortgage loans and obligations held in securitization trusts, net
Interest income on mortgage loans and obligations held in securitization trusts, net decreased by $0.3 million for the three months ended March 31, 2020, as compared to the three months ended March 31, 2019, primarily due to the sale and deconsolidation of a retained investment in the subordinate tranches of one securitization trust in the third quarter of 2019.
Property and other income
Property operating income
Property operating income decreased by $8.4 million to $21.5 million for the three months ended March 31, 2020, as compared to the three months ended March 31, 2019. The decrease was primarily due to a $6.9 million reduction in operating income due to the sale of a hotel in the fourth quarter of 2019 and $1.1 million in lease expirations.
Other income
Other income increased by $9.0 million for the three months ended March 31, 2020, as compared to the three months ended March 31, 2019, primarily due to unwinding of certain NOK FX forward contracts in the first quarter.
Expenses
Management fee expense
Management fee expense decreased by $2.6 million to $6.5 million for the three months ended March 31, 2020, as compared to the three months ended March 31, 2019. The decrease is due to the reduction in stockholders’ equity (as defined in the Management Agreement) as of March 31, 2020 compared to March 31, 2019. The reduction in stockholders’ equity is primarily due to a fourth quarter 2019 amendment to our definition of core earnings in the Management Agreement.
Property operating expense
Property operating expense decreased by $5.3 million to $3.7 million for the three months ended March 31, 2020, as compared to the three months ended March 31, 2019. The decrease resulted from the sale of a hotel during the fourth quarter of 2019.
Transaction, investment and servicing expense
Transaction, investment and servicing expense increased by $2.2 million to $2.2 million for the three months ended March 31, 2020, as compared to the three months ended March 31, 2019, primarily due to $0.9 million in legal costs incurred associated with exploring the internalization of the management of the company and other value-enhancing opportunities and a $0.8 million decrease in tax refunds received.
Interest expense on real estate
Interest expense on real estate decreased by $0.1 million to $8.5 million for the three months ended March 31, 2020, as compared to the three months ended March 31, 2019.
Depreciation and amortization
Depreciation and amortization expense decreased by $1.9 million to $11.2 million for the three months ended March 31, 2020, as compared to the three months ended March 31, 2019. This was primarily due to a $0.9 million decrease resulting from the sale of a hotel during the fourth quarter of 2019 and a $0.8 million decrease due to fully depreciated assets during the quarter.
Provision for loan losses
Provision for loan losses increased by $31.5 million for the three months ended March 31, 2020, as compared to the three months ended March 31, 2019. The was primarily due to the Company recording $29.2 million in CECL reserves in accordance with ASU No. 2016-13, Financial Instruments-Credit Losses.
Administrative expense
Administrative expense increased by $0.5 million to $4.1 million for the three months ended March 31, 2020, as compared to the three months ended March 31, 2019. This increase was primarily due to higher audit fees and higher indirect costs reimbursed to our Manager.
Other income (loss)
Unrealized gain (loss) on mortgage loans and obligations held in securitization trusts, net
During the three months ended March 31, 2020 and 2019, we recorded an unrealized loss of $19.5 million on mortgage loans and obligations held in securitization trusts, net which represents the change in fair value of the assets and liabilities of the securitization trusts consolidated as a result of our investment in the subordinate tranches of these securitization trusts acquired in the Combination.
Other loss, net
Other loss, net increased by $16.7 million for the three months ended March 31, 2020, as compared to the three months ended March 31, 2019. The decrease was primarily due to a $12.3 million unrealized loss on non-designated interest rate swap contracts entered into in 2018 and a $4.3 million unrealized loss on non-designated foreign exchange contracts entered into during 2018.
Equity in earnings of unconsolidated ventures
Equity in earnings of unconsolidated ventures decreased by $4.3 million to $14.1 million for the three months ended March 31, 2020, as compared to the three months ended March 31, 2019. This was primarily due to a decrease of $3.2 million related to the repayment of equity method investments and a $0.7 million decrease related to one equity method investment backed by a mezzanine loan that was placed on non-accrual status
Income tax benefit (expense)
Income tax benefit decreased by $2.2 million to an income tax expense of $0.2 million for the three months ended March 31, 2020, as compared to the three months ended March 31, 2019, primarily due to a $2.7 million reduction in the deferred income tax benefit on one of our net lease portfolios acquired in 2018, partially offset by a $0.4 million decrease to income tax provision on a hotel acquired through the legal foreclosure process in the third quarter of 2018, and subsequently sold in December 2019.
Our Legacy, Non-Strategic Portfolio
As of March 31, 2020, our Legacy, Non-Strategic Portfolio consisted of 51 investments representing approximately $583.0 million in book value (excluding cash, cash equivalents and certain other assets). Our loan portfolio consisted of four senior mortgage loans, six mezzanine loans and one preferred equity investment and had a weighted average cash coupon of 0.6% and a weighted average all-in unlevered yield of 1.1%. Our owned real estate portfolio (including net leased and other real estate) consisted of approximately 4.3 million total square feet of space and the total first quarter NOI of that portfolio was approximately $8.8 million (based on leases in place as of March 31, 2020).
As of March 31, 2020, our Legacy, Non-Strategic Portfolio consisted of the following investments (dollars in thousands):
|
| | | | | | | | | | | | | | | | | | | |
| | | Count(1) | | Book value (Consolidated) | | Book value (at CLNC share)(2) | | Net book value (Consolidated)(3) | | Net book value (at CLNC share)(4) |
| Legacy, Non-Strategic Portfolio | | | | | | | | | | |
Senior mortgage loans(5) | | 4 |
| | $ | 28,139 |
| | $ | 28,139 |
| | $ | 12,314 |
| | $ | 12,314 |
|
Mezzanine loans(5) | | 6 |
| | 62,909 |
| | 62,863 |
| | 62,909 |
| | 62,863 |
|
Preferred equity(5) | | 1 |
| | 687 |
| | 687 |
| | 687 |
| | 687 |
|
| Net leased real estate | | 6 |
| | 59,375 |
| | 59,375 |
| | 4,049 |
| | 4,049 |
|
| Other real estate | | 30 |
| | 423,153 |
| | 375,320 |
| | 124,612 |
| | 112,221 |
|
| Private equity interests | | 4 |
| | 8,764 |
| | 8,764 |
| | 8,764 |
| | 8,764 |
|
| Total/Weighted average Legacy, Non-Strategic Portfolio | | 51 |
| | $ | 583,027 |
| | $ | 535,148 |
| | $ | 213,335 |
| | $ | 200,898 |
|
________________________________________
| |
| (1) | Count for net leased and other real estate represents number of investments. |
| |
| (2) | Book value at our share represents the proportionate book value based on ownership by asset as of March 31, 2020. |
| |
| (3) | Net book value represents book value less any associated financing as of March 31, 2020. |
| |
| (4) | Net book value at our share represents the proportionate book value based on asset ownership less any associated financing based on ownership as of March 31, 2020. |
| |
| (5) | Senior mortgage loans, mezzanine loans, and preferred equity include investments in joint ventures whose underlying interest is in a loan or preferred equity. |
The following charts illustrate the diversification of our Legacy, Non-Strategic Portfolio (not including private equity interests) based on investment type, underlying property type, and geography, as of March 31, 2020 (percentages based on book value at our share, which represents the proportionate book value based on our ownership by asset):
|
| | |
| Investment Type | | Property Type |
| | |
_________________________________________
| |
| (1) | Mezzanine loans include other subordinated loans. |
| |
| (2) | Senior mortgage loans include junior participations in our originated senior mortgage loans for which we have syndicated the senior participations to other investors and retained the junior participations for our portfolio and contiguous mezzanine loans where we own both the senior and junior loan positions. We believe these investments are more similar to the senior mortgage loans we originate than other loan types given their credit quality and risk profile. |
(3) Other includes commercial and residential development and predevelopment assets.
Legacy, Non-Strategic Portfolio: Senior and Mezzanine Loans and Preferred Equity
Our Legacy, Non-Strategic Portfolio includes senior mortgage loans, mezzanine loans and preferred equity interests.
The following table provides a summary of senior and mezzanine loans and preferred equity included in our Legacy, Non-Strategic Portfolio as of March 31, 2020 (dollars in thousands):
|
| | | | | | | | | | | | | | | | | | | | | | |
| | | | | | | | | Weighted Average(1) |
| | | Count | | Book value (at CLNC share)(2) | | Principal balance (2) | | Cash coupon(3) | | Unlevered all-in yield(4) | | Remaining Term(5) | | Extended Remaining Term(6) |
| Senior loans | | 4 | | $ | 28,139 |
| | $ | 181,578 |
| | 0.9 | % | | 3.5 | % | | 0.1 |
| | 0.1 |
|
| Mezzanine loans | | 6 | | 62,863 |
| | 196,063 |
| | 0.3 | % | | — | % | | 0.5 |
| | 1.4 |
|
| Preferred equity | | 1 | | 687 |
| | — |
| | — |
| | — |
| | — |
| | — |
|
| Total/Weighted average senior and mezzanine loans and preferred equity - Legacy, Non-Strategic Portfolio | | 11 | | $ | 91,689 |
| | $ | 377,641 |
| | 0.6 | % | | 1.1 | % | | 0.4 |
| | 1.0 |
|
_________________________________________
| |
| (1) | Weighted average metrics weighted by book value at our share, except for cash coupon which is weighted by principal balance at our share. |
| |
| (2) | Book value and principal balance at our share represents the proportionate value based on ownership by asset as of March 31, 2020. |
| |
| (3) | Represents the stated coupon rate for loans; for floating rate loans, assumes USD 1-month LIBOR which was 0.99% as of March 31, 2020. |
| |
| (4) | In addition to the stated cash coupon rate, unlevered all-in yield includes non-cash payment in-kind interest income and the accrual of origination, extension and exit fees. Unlevered all-in yield for the loan portfolio assumes the applicable floating benchmark rate as of March 31, 2020 for weighted average calculations. |
| |
| (5) | Represents the remaining term based on the current contractual maturity date of loans. |
| |
| (6) | Represents the remaining term based on a maximum maturity date assuming all extension options on loans are exercised by the borrower. |
The following table details senior and mezzanine loans and preferred equity included in our Legacy, Non-Strategic Portfolio by fixed or floating rate as of March 31, 2020 (dollars in thousands):
|
| | | | | | | | | | | | | | | | | | | | | | | |
| | | | | | | | | Weighted Average(1) |
| | | Number of loans | | Book value (at CLNC share)(2) | | Principal balance(2) | | Spread to LIBOR | | All-in unlevered yield(3) | | Remaining term(4) | | Extended remaining term(5) |
| Floating rate loans | | 4 |
| | $ | 16,625 |
| | $ | 167,904 |
| | 1.1 | % | | 5.9% |
| | 0.1 |
| | 0.1 |
|
Fixed rate loans(6) | | 7 |
| | 75,064 |
| | 209,737 |
| | — |
| | — | % | | 0.4 |
| | 1.2 |
|
| Total/ Weighted average | | 11 |
| | $ | 91,689 |
| | $ | 377,641 |
| | — |
| | 1.1 | % | | 0.4 |
| | 1.0 |
|
_________________________________________
| |
| (1) | Weighted average metrics weighted by book value at our share, except for spread to LIBOR, which is weighted by principal balance value at our share. Book and principal balances at share exclude a de minimis amount of noncontrolling interest. See the table located above in “Our Portfolio” for further information. |
| |
| (2) | Book value and principal balance at our share represents the proportionate value based on ownership by asset as of March 31, 2020. |
| |
| (3) | In addition to cash coupon, all-in unlevered yield includes the amortization of deferred origination fees, purchase price premium and discount, loan origination costs and accrual of both extension and exit fees. For weighted average calculations, all-in yield for the loan portfolio assumes the USD 1-month LIBOR as of March 31, 2020, which was 0.99%. |
| |
| (4) | Represents the remaining term in years based on the original maturity date or current extension maturity date of loans. |
| |
| (5) | Represents the remaining term in years based on a maximum maturity date assuming all extension options on loans are exercised by the borrower. |
| |
| (6) | Includes one preferred equity investment. |
The following table details the types of properties securing senior and mezzanine loans and preferred equity included in our Legacy, Non-Strategic Portfolio and geographic distribution as of March 31, 2020 (dollars in thousands):
|
| | | | | | | |
| Collateral property type | | Book value | | % of total |
Other(1) | | $ | 70,532 |
| | 76.9 | % |
| Retail | | 21,157 |
| | 23.1 | % |
| Total | | $ | 91,689 |
| | 100.0 | % |
| | | | | |
| Region | | Book value | | % of total |
| West | | $ | 87,157 |
| | 95.1 | % |
| Northeast | | 4,021 |
| | 4.4 | % |
| Midwest | | 500 |
| | 0.5 | % |
| Southeast | | 11 |
| | — | % |
| Total | | $ | 91,689 |
| | 100.0 | % |
_________________________________________
| |
| (1) | Other includes commercial and residential development and predevelopment assets. |
The following charts illustrate the diversification of senior and mezzanine loans and preferred equity included in our Legacy, Non-Strategic Portfolio based on interest rate category, property type, and geography as of March 31, 2020 (percentages based on book value at our share, which represents the proportionate book value based on our ownership by asset):
|
| | |
| Interest Rate Category | | Property Type |
| | |
_________________________________________
| |
| (1) | Other includes commercial and residential development and predevelopment assets. |
In March 2018, the borrower on our four NY hospitality loans in our Legacy, Non-Strategic Portfolio failed to make all required interest payments and the loans were placed on nonaccrual status. These four loans are secured by the same collateral. During 2018, we recorded $53.8 million of provision for loan losses to reflect the estimated value to be recovered from the borrower following a sale. During 2019, we recorded an additional provision for loan loss of $154.3 million based on significant deterioration in the NY hospitality market, feedback from the sales process and the estimated value to be recovered from the borrower following a potential sale. During the three months ended March 31, 2020 the significant detrimental impact of COVID-19 on the U.S. hospitality industry further contributed to the deterioration of our four NY hospitality loans and as such we recorded an additional provision for loan losses of $36.8 million. On April 22, 2020, we completed a discounted payoff of the NY hospitality loans and related investment interests.
Within our Legacy, Non-Strategic Portfolio, we have certain other loans secured by regional malls, that we have been closely monitoring, as follows:
| |
| • | We placed one loan secured by a regional mall (“Midwest Regional Mall”) on non-accrual status during 2019 as collectability of the principal was uncertain; as such, interest collected is recognized using the cost recovery method by applying interest collected as a reduction to loan carrying value. We recorded $10.6 million of impairment related to Midwest Regional Mall during 2019. Additionally, this loan was transferred to held for sale during 2019 and remains held for sale as of March 31, 2020. |
| |
| • | During 2018, we recorded $8.8 million of provision for loan losses on one loan secured by a regional mall (“Northeast Regional Mall B”) to reflect the estimated fair value of the collateral. During 2019, we recognized additional provision for loan losses of $10.5 million on Northeast Regional Mall B. The additional provisions were based on then-current and prospective leasing activity to reflect the estimated fair value of the collateral. During the three months ended March 31, 2020, the Northeast Regional Mall was sold. We received $9.2 million in gross proceeds and recognized a gain of $1.8 million. |
| |
| • | Also, during 2019, we separately recognized provision for loan losses of $18.5 million on two loans secured by one regional mall (“West Regional Mall”) to reflect the estimated fair value of the collateral. Subsequent to March 31, 2020, the West Regional Mall loan was sold. We received $23.5 million in gross proceeds and will recognize a gain of $6.8 million. |
| |
| • | Furthermore, during 2019, we recognized a $26.7 million provision for loan losses on three loans to two separate borrowers (“South Regional Mall A” and “South Regional Mall B”) to reflect the estimated fair value of the collateral. During the three months ended March 31, 2020, we accepted a discounted payoff of South Regional Mall A. We received $22.0 million in gross proceeds and recognized a loss of $1.6 million. Additionally, during the three months ended March 31, 2020 South Regional Mall B was sold. We received $13.5 million in gross proceeds and recognized a gain of $8.7 million. |
Impairment of Loans and Preferred Equity Held in Joint Ventures
During the year ended December 31, 2019, we recognized our proportionate share of impairment loss totaling $14.7 million on one senior loan secured by a regional mall (“Southeast Regional Mall”) of which we owned 50.0% of the joint venture. Southeast Regional Mall was included in our Legacy, Non-Strategic Portfolio prior to its sale during the three months ended March 31, 2020. We received $13.4 million in gross sales proceeds and recognized a gain of $1.6 million.
COVID-19 Update
During the three months ended March 31, 2020 and through May 7, 2020, we sold 12 loans generating gross proceeds of $104.7 million. Our four remaining loans are on non-accrual, of which three have paid April interest and one is in forbearance. We have reviewed the remaining loans in our Legacy, Non-Strategic portfolio, and believe that it is too early to predict and quantify the full impact of principal loss. However, further losses or permanent impairment in future quarters are possible.
Legacy, Non-Strategic Portfolio: Owned Real Estate
Our owned real estate includes direct ownership in commercial real estate with an emphasis on properties with stable cash flow, which may be structurally senior to a third-party partner’s equity. In addition, we own operating real estate investments through joint ventures with one or more partners. These properties are typically well-located with strong operating partners.
As of March 31, 2020, $434.7 million, or 81.2%, of our Legacy, Non-Strategic Portfolio was invested in owned real estate and was 89.0% occupied. The following table provides a summary of net leased and other real estate included in our Legacy, Non-Strategic Portfolio as of March 31, 2020 (dollars in thousands):
|
| | | | | | | | | | | |
| | | Count | | Carrying Value(1) | | NOI/EBITDA for the three months ended March 31, 2020(2) |
| Net leased real estate | | 6 |
| | $ | 59,375 |
| | $ | 1,810 |
|
| Other real estate | | 30 |
| | 375,320 |
| | 6,942 |
|
| Total/Weighted average owned real estate - Legacy, Non-Strategic Portfolio | | 36 |
| | $ | 434,695 |
| | $ | 8,752 |
|
________________________________________
| |
| (1) | Represents carrying values at our share as of March 31, 2020; includes real estate tangible assets, deferred leasing costs and other intangible assets less intangible liabilities. |
| |
| (2) | Excludes NOI/EBITDA of $2.2 million that relates to five properties that sold during the first quarter. Please refer to “Non-GAAP Supplemental Financial Measures” for further information on NOI/EBITDA. |
The following table provides asset-level details of our net leased and other real estate included in our Legacy, Non-Strategic Portfolio as of March 31, 2020:
|
| | | | | | | | | | | | | | | | |
| | | Collateral type | | City, State | | Number of properties | | Number of buildings | | RSF / units/keys | | Weighted average % leased(1) | | Weighted average lease term (yrs)(2) |
| Net leased real estate | | | | | | | | | | | | | | |
| Net lease 1 | | Retail | | Various - U.S. | | 7 |
| | 7 |
| | 319,600 RSF | | 100% | | 4.0 |
| Net lease 2 | | Office | | Columbus, OH | | 1 |
| | 1 |
| | 199,122 RSF | | 52% | | 6.7 |
| Net lease 3 | | Office | | Rockaway, NJ | | 1 |
| | 1 |
| | 121,038 RSF | | 100% | | 2.8 |
| Net lease 4 | | Retail | | Keene, NH | | 1 |
| | 1 |
| | 45,471 RSF | | 100% | | 8.8 |
| Net lease 5 | | Retail | | Fort Wayne, IN | | 1 |
| | 1 |
| | 50,000 RSF | | 100% | | 4.4 |
| Net lease 6 | | Retail | | South Portland, ME | | 1 |
| | 1 |
| | 52,900 RSF | | 100% | | 3.5 |
| Total/Weighted average net leased real estate | | 12 |
| | 12 |
| | 788,131 RSF | | 87% | | 4.9 |
| | | | | | | | | | | | | | | |
| Other real estate | | | | | | | | | | | | | | |
| Other real estate 1 | | Office | | Creve Coeur, MO | | 7 |
| | 7 |
| | 847,604 RSF | | 93% | | 4.3 |
| Other real estate 2 | | Office | | Warrendale, PA | | 5 |
| | 5 |
| | 496,414 RSF | | 100% | | 4.9 |
| Other real estate 3 | | Multifamily | | New Orleans, LA | | 1 |
| | 1 |
| | 375 Units | | 92% | | n/a |
| Other real estate 4 | | Hotel | | Coraopolis, PA | | 1 |
| | 1 |
| | 318 Keys | | n/a | | n/a |
| Other real estate 5 | | Multifamily | | Kalamazoo, MI | | 1 |
| | 24 |
| | 584 Units | | 95% | | n/a |
| Other real estate 6 | | Multifamily | | Cayce, SC | | 1 |
| | 1 |
| | 466 Units | | 81% | | n/a |
| Other real estate 7 | | Multifamily | | Central, SC | | 1 |
| | 10 |
| | 469 Units | | 98% | | n/a |
| Other real estate 8 | | Office | | Omaha, NE | | 1 |
| | 1 |
| | 404,865 RSF | | 67% | | 1.1 |
| Other real estate 9 | | Office | | Greensboro, NC | | 1 |
| | 1 |
| | 129,717 RSF | | 88% | | 2.3 |
| Other real estate 10 | | Multifamily | | Gillette, WY | | 1 |
| | 6 |
| | 139 Units | | 88% | | n/a |
| Other real estate 11 | | Office | | Greensboro, NC | | 1 |
| | 1 |
| | 86,321 RSF | | 85% | | 1.4 |
| Other real estate 12 | | Office | | Winston Salem, NC | | 1 |
| | 1 |
| | 140,132 RSF | | 43% | | 1.2 |
| Other real estate 13 | | Office | | Bath, ME | | 1 |
| | 1 |
| | 37,623 RSF | | 100% | | 0.8 |
| Other real estate 14 | | Office | | Topeka, KS | | 1 |
| | 1 |
| | 194,989 RSF | | 71% | | 3.1 |
| Other real estate 15 | | Retail | | Anchorage, AK | | 1 |
| | 1 |
| | 343,995 RSF | | 65% | | 1.0 |
| Other real estate 16 | | Office | | Greensboro, NC | | 1 |
| | 2 |
| | 58,978 RSF | | 22% | | 0.6 |
| Other real estate 17 | | Retail | | West Columbia, SC | | 1 |
| | 1 |
| | 52,375 RSF | | 58% | | 0.8 |
| Other real estate 18 | | Office | | Greensboro, NC | | 1 |
| | 1 |
| | 48,042 RSF | | 31% | | 0.3 |
| Other real estate 19 | | Office | | Greensboro, NC | | 1 |
| | 1 |
| | 47,690 RSF | | 67% | | 0.8 |
| Other real estate 20 | | Office | | Greensboro, NC | | 1 |
| | 1 |
| | 47,211 RSF | | 10% | | — |
| Other real estate 21 | | Office | | Greensboro, NC | | 1 |
| | 4 |
| | 42,123 RSF | | 51% | | 0.5 |
| Other real estate 22 | | Office | | Anchorage, AK | | 1 |
| | 5 |
| | 11,475 RSF | | 100% | | 1.3 |
| Other real estate 23 | | Office | | Greensboro, NC | | 1 |
| | 1 |
| | 34,060 RSF | | 40% | | 0.3 |
| Other real estate 24 | | Office | | Greensboro, NC | | 1 |
| | 1 |
| | 34,903 RSF | | 46% | | 0.6 |
| Other real estate 25 | | Office | | Greensboro, NC | | 1 |
| | 1 |
| | 26,563 RSF | | 55% | | 0.2 |
| Other real estate 26 | | Multifamily | | Evansville, WY | | 1 |
| | 1 |
| | 191 Units | | 41% | | n/a |
| Other real estate 27 | | Office | | Greensboro, NC | | 1 |
| | 1 |
| | 32,905 RSF | | 100% | | 6.0 |
| Other real estate 28 | | Office | | Greensboro, NC | | 1 |
| | 1 |
| | 35,224 RSF | | 44% | | 0.3 |
| Other real estate 29 | | Office | | Greensboro, NC | | 1 |
| | 1 |
| | 23,145 RSF | | 63% | | 1.0 |
| Other real estate 30 | | Office | | Topeka, KS | | 1 |
| | 1 |
| | 194,989 RSF | | 71% | | 3.1 |
| Total/Weighted average other real estate | | | | | | 40 |
| | 85 |
| | n/a | | 83% | | 2.4 |
| | | | | | | | | | | | | | | |
| Total/Weighted average owned real estate - Legacy, Non-Strategic Portfolio | | 52 |
| | 97 |
| |
| | | | |
________________________________________
| |
| (1) | Represents the percent leased as of March 31, 2020. Weighted average calculation based on carrying value at our share as of March 31, 2020. |
| |
| (2) | Based on in-place leases (defined as occupied and paying leases) as of March 31, 2020 and assumes that no renewal options are exercised. Weighted average calculation based on carrying value at our share as of March 31, 2020. |
The following charts illustrate the concentration of our net leased real estate included in our Legacy, Non-Strategic Portfolio based on property type and geography as of March 31, 2020 (percentages based on book value at our share, which represents the proportionate book value based on our ownership by asset):
The following charts illustrate the diversification of our other real estate included in our Legacy, Non-Strategic Portfolio based on property type and geography as of March 31, 2020 (percentages based on book value at our share, which represents the proportionate book value based on our ownership by asset):
COVID-19 Update
We collected 79.9% of total April rents across our Legacy, Non-Strategic Portfolio. In particular, nine properties net leased to a national retail chain, representing $0.5 million, did not pay April rent. Tenants that did not pay April rent were primarily retail related businesses. The carrying value at our share for those properties is $32.0 million. We reviewed our Legacy, Non-Strategic owned real estate portfolio and our asset management team is in active discussions with all lessees to remediate the delinquent rents and determine the long-term implications. See table below:
|
| | | | | | | | | | | |
| (Dollars in thousands) | | April 2020 Rent |
| | | Billed | | Collected | | % Collected |
| Office | | $ | 4,099 |
| | $ | 3,690 |
| | 90.0 | % |
| Student Housing | | 804 |
| | 613 |
| | 76.2 | % |
| Multifamily | | 696 |
| | 650 |
| | 93.4 | % |
| Retail | | 653 |
| | 54 |
| | 8.3 | % |
| Industrial | | 11 |
| | — |
| | — | % |
| Hotel | | — |
| | — |
| | n/a |
|
| | | $ | 6,263 |
| | $ | 5,007 |
| | 79.9 | % |
We met all of our April mortgage obligations securing the properties within our Legacy, Non-Strategic portfolio. We caution that known and unknown COVID-19 events could result in lease modifications, impairment and the inability to make our mortgage payments, all which could result in default under our mortgage obligations.
Refer to “COVID-19 Update” in “Liquidity and Capital Resources”, respectively, below for further discussion regarding the COVID-19 pandemic and its impact on our future operating results, liquidity and financial condition.
Results of Operations - Legacy, Non-Strategic Portfolio
The following table summarizes our Legacy, Non-Strategic Portfolio results of operations for the three months ended March 31, 2020 and 2019 (dollars in thousands):
|
| | | | | | | | | | | | | | | |
| | | Three Months Ended March 31, | | Increase (Decrease |
| | | 2020 | | 2019 | | Amount | | % |
| Net interest income | | | | | | | | |
| Interest income | | $ | 1,704 |
| | $ | 5,411 |
| | $ | (3,707 | ) | | (68.5 | )% |
| Interest expense | | (998 | ) | | (1,789 | ) | | 791 |
| | (44.2 | )% |
| Net interest income | | 706 |
| | 3,622 |
| | (2,916 | ) | | (80.5 | )% |
| | | | | | | | | |
| Property and other income | | | | | | | | |
| Property operating income | | 31,001 |
| | 33,231 |
| | (2,230 | ) | | (6.7 | )% |
| Other income | | 289 |
| | 16 |
| | 273 |
| | n.m. |
|
| Total property and other income | | 31,290 |
| | 33,247 |
| | (1,957 | ) | | (5.9 | )% |
| | | | | | | | | |
| Expenses | | | | | | | | |
| Management fee expense | | 1,430 |
| | 2,272 |
| | (842 | ) | | (37.1 | )% |
| Property operating expense | | 18,847 |
| | 19,234 |
| | (387 | ) | | (2.0 | )% |
| Transaction, investment and servicing expense | | 920 |
| | 475 |
| | 445 |
| | 93.7 | % |
| Interest expense on real estate | | 4,617 |
| | 5,037 |
| | (420 | ) | | (8.3 | )% |
| Depreciation and amortization | | 6,823 |
| | 14,578 |
| | (7,755 | ) | | (53.2 | )% |
| Provision for loan losses | | 38,433 |
| | — |
| | 38,433 |
| | n.m. |
|
| Impairment of operating real estate | | 4,126 |
| | — |
| | 4,126 |
| | n.m. |
|
| Administrative expense | | 2,907 |
| | 3,015 |
| | (108 | ) | | (3.6 | )% |
| Total expenses | | 78,103 |
| | 44,611 |
| | 33,492 |
| | 75.1 | % |
| | | | | | | | | |
| Other income | | | | | | | | |
| Other gain (loss), net | | 350 |
| | (1,252 | ) | | 1,602 |
| | n.m. |
|
| Loss before equity in earnings of unconsolidated ventures and income taxes | | (45,757 | ) | | (8,994 | ) | | (36,763 | ) | | n.m. |
|
| Equity in earnings of unconsolidated ventures | | 3,093 |
| | 2,942 |
| | 151 |
| | 5.1 | % |
| Income tax expense | | (1,548 | ) | | (1,619 | ) | | 71 |
| | (4.4 | )% |
| Net income (loss) | | $ | (44,212 | ) | | $ | (7,671 | ) | | $ | (36,541 | ) | | n.m. |
|
Comparison of Legacy, Non-Strategic Portfolio for Three Months Ended March 31, 2020 and 2019
Net Interest Income
Interest income
Interest income decreased by $3.7 million to $1.7 million for the three months ended March 31, 2020, as compared to the three months ended March 31, 2019. This decrease was primarily due to $1.4 million related to the sale and repayment of loan investments, $0.9 million related to the sale of one foreclosed loan investment and $0.4 million due to placing one retail loan on nonaccrual status.
Interest expense
Interest expense decreased by $0.8 million to $1.0 million for the three months ended March 31, 2020, as compared to the three months ended March 31, 2019. The decrease was primarily due to a $1.0 million decrease related to borrowings on the revolving credit facility.
Property and other income
Property operating income
Property operating income decreased by $2.2 million to $31.0 million for the three months ended March 31, 2020, as compared to the three months ended March 31, 2019. The decrease was primarily due to a $1.4 million decrease related to 10 real estate properties sold within the past twelve months.
Other income
Other income increased by $0.3 million to $0.3 million for the three months ended March 31, 2020, as compared to the three months ended March 31, 2019. The Company recorded $0.3 million in extension fees related to a held for sale operating real estate property.
Expenses
Management fee expense
Management fee expense decreased by $0.8 million to $1.4 million for the three months ended March 31, 2020, as compared to the three months ended March 31, 2019. The decrease is due to the reduction in stockholders’ equity (as defined in the Management Agreement) as of March 31, 2020 compared to March 31, 2019. The reduction in stockholders’ equity is primarily due to a fourth quarter 2019 amendment to our definition of core earnings in the Management Agreement, as well as distributions declared and paid.
Property operating expense
Property operating expense decreased by $0.4 million to $18.8 million for the three months ended March 31, 2020, as compared to the three months ended March 31, 2019.
Transaction, investment and servicing expense
Transaction, investment and servicing expense increased by $0.4 million to $0.9 million for the three months ended March 31, 2020, as compared to the three months ended March 31, 2019, primarily as a result of $0.4 million of legal costs incurred associated with exploring the internalization of the management of the company and other value-enhancing opportunities.
Interest expense on real estate
Interest expense on real estate decreased by $0.4 million to $4.6 million for the three months ended March 31, 2020, as compared to the three months ended March 31, 2019. The decrease resulted from real estate properties sold within the past twelve months.
Depreciation and amortization
Depreciation and amortization expense decreased by $7.8 million to $6.8 million for the three months ended March 31, 2020, as compared to the three months ended March 31, 2019. This was primarily due to a $5.2 million decrease related to 27 real estate properties classified as held for sale in 2019 and 2020.
Provision for loan losses
Provision for loan losses of $38.4 million was recorded for the three months ended March 31, 2020, which is primarily attributable to the Company recording an additional provision of $36.8 million for our four NY hospitality loans due to the detrimental impact of COVID-19 on the hospitality industry.
Impairment of operating real estate
Impairment of operating real estate of $4.1 million for the three months ended March 31, 2020 is resulting from a reduction in the holding period of certain properties sold during the period.
Administrative expense
Administrative expense decreased by $0.1 million to $2.9 million for the three months ended March 31, 2020, as compared to the three months ended March 31, 2019.
Other income
Other gain, net
Other loss, net decreased by $1.6 million to other gain for the three months ended March 31, 2020, as compared to the three months ended March 31, 2019. The increase was primarily due to $1.2 million related to professional fees associated with the sale of our PE Investments in 2019 and $0.5 million related to gain on sale of one real estate property.
Equity in earnings of unconsolidated ventures
Equity in earnings of unconsolidated ventures increased by $0.2 million to $3.1 million for the three months ended March 31, 2020, as compared to the three months ended March 31, 2019. This was primarily due to $3.8 million gain on the sale of a senior loan held in a joint venture and various PE Investments, partially offset by $3.7 million related to placing two senior loans held in joint ventures on nonaccrual status.
Income tax expense
Income tax expense decreased by $0.1 million to $1.5 million for the three months ended March 31, 2020, as compared to the three months ended March 31, 2019.
Non-GAAP Supplemental Financial Measures
Core Earnings/Legacy, Non-Strategic Earnings
We present Core Earnings/Legacy, Non-Strategic Earnings, which is a non-GAAP supplemental financial measure of our performance. Our Core Earnings are generated by the Core Portfolio and Legacy, Non-Strategic Earnings are generated by the Legacy, Non-Strategic Portfolio. We believe that Core Earnings/Legacy, Non-Strategic Earnings provides meaningful information to consider in addition to our net income and cash flow from operating activities determined in accordance with U.S. GAAP. This supplemental financial measure helps us to evaluate our performance excluding the effects of certain transactions and U.S. GAAP adjustments that we believe are not necessarily indicative of our current portfolio and operations. For information on the fees we pay our Manager, see Note 10, “Related Party Arrangements” to our consolidated financial statements included in this Form 10-Q. In addition, we believe that our investors also use Core Earnings/Legacy, Non-Strategic Earnings or a comparable supplemental performance measure to evaluate and compare the performance of us and our peers, and as such, we believe that the disclosure of Core Earnings/Legacy, Non-Strategic Earnings is useful to our investors.
We define Core Earnings/Legacy, Non-Strategic Earnings as U.S. GAAP net income (loss) attributable to our common stockholders (or, without duplication, the owners of the common equity of our direct subsidiaries, such as our OP) and excluding (i) non-cash equity compensation expense, (ii) the expenses incurred in connection with our formation or other strategic transactions, (iii) the incentive fee, (iv) acquisition costs from successful acquisitions, (v) gains or losses from sales of real estate property and impairment write-downs of depreciable real estate, including unconsolidated joint ventures and preferred equity investments, (vi) CECL reserves determined by probability of default/loss given default (“PD/LGD”) model, (vii) depreciation and amortization, (viii) any unrealized gains or losses or other similar non-cash items that are included in net income for the current quarter, regardless of whether such items are included in other comprehensive income or loss, or in net income, (ix) one-time events pursuant to changes in U.S. GAAP and (x) certain material non-cash income or expense items that in the judgment of management should not be included in Core Earnings/Legacy, Non-Strategic Earnings. For clauses (ix) and (x), such exclusions shall only be applied after discussions between our Manager and our independent directors and after approval by a majority of our independent directors. U.S. GAAP net income (loss) attributable to our common stockholders and Core Earnings/Legacy, Non-Strategic Earnings include provision for loan losses.
Prior to the third quarter of 2019, Core Earnings reflected adjustments to U.S. GAAP net income to exclude impairment of real estate and provision for loan losses. During the third quarter of 2019, we revised our definition of Core Earnings to include the provision for loan losses while excluding realized losses of sales of real estate property and impairment write-downs of preferred equity investments. This was approved by a majority of our independent directors.
Core Earnings/Legacy, Non-Strategic Earnings does not represent net income or cash generated from operating activities and should not be considered as an alternative to U.S. GAAP net income or an indication of our cash flows from operating activities determined in accordance with U.S. GAAP, a measure of our liquidity, or an indication of funds available to fund our cash needs, including our ability to make cash distributions. In addition, our methodology for calculating Core Earnings/Legacy, Non-Strategic Earnings may differ from methodologies employed by other companies to calculate the same or similar non-GAAP supplemental financial measures, and accordingly, our reported Core Earnings may not be comparable to the Core Earnings reported by other companies.
The following table presents a reconciliation of net income (loss) attributable to our common stockholders to Core Earnings/Legacy, Non-Strategic Earnings attributable to our common stockholders and noncontrolling interest of the Operating Partnership (dollars and share amounts in thousands, except per share data) for the three months ended March 31, 2020:
|
| | | | | | | | | | | | |
| | | Three Months Ended March 31, 2020 |
| | | Total | | Legacy, Non-Strategic Portfolio | | Core Portfolio |
| Net income (loss) attributable to Colony Credit Real Estate, Inc. common stockholders | | $ | (78,772 | ) | | $ | (43,774 | ) | | $ | (34,998 | ) |
| Adjustments: | | | | | | |
| Net income (loss) attributable to noncontrolling interest of the Operating Partnership | | (1,892 | ) | | (1,049 | ) | | (843 | ) |
| Non-cash equity compensation expense | | 342 |
| | 154 |
| | 188 |
|
| Transaction costs | | 1,865 |
| | 684 |
| | 1,181 |
|
| Depreciation and amortization | | 17,510 |
| | 6,131 |
| | 11,379 |
|
| Net unrealized loss (gain) on investments: | |
|
| | | | |
| Impairment of operating real estate and preferred equity | | 4,126 |
| | 4,126 |
| | — |
|
| Other unrealized loss | | 40,360 |
| | 34 |
| | 40,326 |
|
CECL reserves(2) | | 29,000 |
| | (153 | ) | | 29,153 |
|
| Gains on sales of real estate | | (452 | ) | | (452 | ) | | — |
|
| Adjustments related to noncontrolling interests | | (589 | ) | | (376 | ) | | (213 | ) |
| Core Earnings (Loss) / Legacy, Non-Strategic Earnings (Loss) attributable to Colony Credit Real Estate, Inc. common stockholders and noncontrolling interest of the Operating Partnership | | $ | 11,498 |
| | $ | (34,675 | ) | | $ | 46,173 |
|
Core Earnings (Loss) / Legacy, Non-Strategic Earnings (Loss) per share(1) | | $ | 0.09 |
| | $ | (0.26 | ) | | $ | 0.35 |
|
Weighted average number of common shares and OP units(1) | | 131,563 |
| | 131,563 |
| | 131,563 |
|
_________________________________________
| |
| (1) | We calculate Core Earnings (Loss) / Legacy, Non-Strategic Earnings (Loss) per share, a non-GAAP financial measure, based on a weighted-average number of common shares and OP units (held by members other than us or our subsidiaries). For the three months ended March 31, 2020, weighted average number of common shares includes 3.1 million OP units. |
(2) Includes $29.0 million in provision for loan losses calculated by the company’s PD/LGD model and excludes $40.7 million which was evaluated individually and included in Core Earnings.
NOI and EBITDA
We believe NOI and EBITDA are useful measures of operating performance of our net leased and other real estate portfolios as they are more closely linked to the direct results of operations at the property level. NOI and EBITDA excludes historical cost depreciation and amortization, which are based on different useful life estimates depending on the age of the properties, as well as adjusts for the effects of real estate impairment and gains or losses on sales of depreciated properties, which eliminate differences arising from investment and disposition decisions. Additionally, by excluding corporate level expenses or benefits such as interest expense, any gain or loss on early extinguishment of debt and income taxes, which are incurred by the parent entity and are not directly linked to the operating performance of the Company’s properties, NOI and EBITDA provide a measure of operating performance independent of the Company’s capital structure and indebtedness. However, the exclusion of these items as well as others, such as capital expenditures and leasing costs, which are necessary to maintain the operating performance of the Company’s properties, and transaction costs and administrative costs, may limit the usefulness of NOI and EBITDA. NOI and EBITDA may fail to capture significant trends in these components of U.S. GAAP net income (loss) which further limits its usefulness.
NOI and EBITDA should not be considered as an alternative to net income (loss), determined in accordance with U.S. GAAP, as an indicator of operating performance. In addition, our methodology for calculating NOI involves subjective judgment and discretion and may differ from the methodologies used by other companies, when calculating the same or similar supplemental financial measures and may not be comparable with other companies.
The following table presents a reconciliation of net income (loss) attributable to our common stockholders to NOI/EBITDA attributable to our common stockholders (dollars in thousands) for the three months ended March 31, 2020:
|
| | | | | | | | | | | | |
| | | Three Months Ended March 31, 2020 |
| | | Total | | Legacy, Non-Strategic Portfolio | | Core Portfolio |
| Net income (loss) attributable to Colony Credit Real Estate, Inc. common stockholders | | $ | 111 |
| | $ | (3,077 | ) | | $ | 3,188 |
|
| Adjustments: | | — |
| | | | |
| Net income (loss) attributable to noncontrolling interest in investment entities | | 145 |
| | 210 |
| | (65 | ) |
| Amortization of above- and below-market lease intangibles | | (404 | ) | | (399 | ) | | (5 | ) |
| Interest expense on real estate | | 13,076 |
| | 4,615 |
| | 8,461 |
|
| Other income | | (9,280 | ) | | (261 | ) | | (9,019 | ) |
| Transaction, investment and servicing expense | | 201 |
| | 58 |
| | 143 |
|
| Depreciation and amortization | | 17,976 |
| | 6,823 |
| | 11,153 |
|
| Impairment of operating real estate | | 4,126 |
| | 4,126 |
| | — |
|
| Administrative expense | | 91 |
| | 9 |
| | 82 |
|
| Other (gain) loss on investments, net | | 3,733 |
| | (351 | ) | | 4,084 |
|
| Income tax benefit | | (198 | ) | | — |
| | (198 | ) |
| NOI/EBITDA attributable to noncontrolling interest in investment entities | | (1,070 | ) | | (823 | ) | | (247 | ) |
| Total NOI/EBITDA attributable to Colony Credit Real Estate, Inc. common stockholders | | $ | 28,507 |
| | $ | 10,930 |
| | $ | 17,577 |
|
Liquidity and Capital Resources
Overview
Our primary liquidity needs include commitments to repay borrowings, finance our assets and operations, meet future funding obligations, make distributions to our stockholders and fund other general business needs. We use significant cash to make additional investments, meet commitments to existing investments, repay the principal of and interest on our borrowings and pay other financing costs, make distributions to our stockholders and fund our operations, which includes making payments to our Manager in accordance with the management agreement.
Our primary sources of liquidity include cash on hand, cash generated from our operating activities and cash generated from asset sales and investment maturities. However, subject to maintaining our qualification as a REIT and our Investment Company Act exclusion, we may use several sources to finance our business, including bank credit facilities (including term loans and revolving facilities), master repurchase facilities and securitizations, as described below. In addition to our current sources of liquidity, there may be opportunities from time to time to access liquidity through public offerings of debt and equity securities. We also invested in a number of our assets through co-investments with other investment vehicles managed by affiliates of our Manager and/or other third parties, which has and may allow us to pool capital to access larger transactions and diversify investment exposure.
Financing Strategy
We have a multi-pronged financing strategy that includes an up to $560 million secured revolving credit facility, up to approximately $2.3 billion in secured revolving repurchase facilities, non-recourse securitization financing, commercial mortgages and other asset-level financing structures. In addition, we may use other forms of financing, including additional warehouse facilities, public and private secured and unsecured debt issuances and equity or equity-related securities issuances by us or our subsidiaries. We may also finance a portion of our investments through the syndication of one or more interests in a whole loan or securitization. We will seek to match the nature and duration of the financing with the underlying asset’s cash flow, including using hedges, as appropriate.
Debt-to-Equity Ratio
The following table presents our debt-to-equity ratio:
|
| | | | |
| | | March 31, 2020 | | December 31, 2019 |
Debt-to-equity ratio(1) | | 1.5x | | 1.4x |
_________________________________________
| |
| (1) | Represents (i) total outstanding secured debt less cash and cash equivalents of $393.8 million to (ii) total equity, in each case, at period end. |
Potential Sources of Liquidity
Bank Credit Facilities
We use bank credit facilities (including term loans and revolving facilities) to finance our business. These financings may be collateralized or non-collateralized and may involve one or more lenders. Credit facilities typically have maturities ranging from two to five years and may accrue interest at either fixed or floating rates.
On February 1, 2018, the OP (together with certain subsidiaries of the OP from time to time party thereto as borrowers, collectively, the “Borrowers”) entered into a credit agreement (the “Bank Credit Facility”) with JPMorgan Chase Bank, N.A., as administrative agent, and the several lenders from time to time party thereto (the “Lenders”), pursuant to which the Lenders agreed to provide a revolving credit facility in the aggregate principal amount of up to $400.0 million. On February 4, 2019, the aggregate amount of revolving commitments was increased to $560.0 million, and on May 6, 2020 these commitments were reduced to $450.0 million.
Advances under the Bank Credit Facility accrue interest at a per annum rate equal to, at the applicable Borrower’s election, either a LIBOR rate plus a margin of 2.25%, or a base rate determined according to a prime rate or federal funds rate plus a margin of 1.25%. An unused commitment fee at a rate of 0.25% or 0.35%, per annum, depending on the amount of facility utilization, applies to un-utilized borrowing capacity under the Bank Credit Facility. Amounts owing under the Bank Credit Facility may be prepaid at any time without premium or penalty, subject to customary breakage costs in the case of borrowings with respect to which a LIBOR rate election is in effect.
The maximum amount available for borrowing at any time under the Bank Credit Facility is limited to a borrowing base valuation of certain investment assets, with the valuation of such investment assets generally determined according to a percentage of adjusted net book value. As of the date hereof, the borrowing base valuation is sufficient to support the outstanding borrowings. The Bank Credit Facility will mature on February 1, 2022, unless the OP elects to exercise the extension options for up to two additional terms of six months each, subject to the terms and conditions in the Bank Credit Facility, resulting in a latest maturity date of February 1, 2023.
The obligations of the Borrowers under the Bank Credit Facility are guaranteed by substantially all material wholly owned subsidiaries of the OP pursuant to a Guarantee and Collateral Agreement with the OP and certain subsidiaries of the OP in favor of JPMorgan Chase Bank, N.A., as administrative agent (the “Guarantee and Collateral Agreement”) and, subject to certain exceptions, secured by a pledge of substantially all equity interests owned by the Borrowers and the guarantors, as well as by a security interest in deposit accounts of the Borrowers and the Guarantors (as such terms are defined in the Guarantee and Collateral Agreement) in which the proceeds of investment asset distributions are maintained.
The Bank Credit Facility contains various affirmative and negative covenants, including, among other things, the obligation of the Company to maintain REIT status and be listed on the NYSE, and limitations on debt, liens and restricted payments. In addition, the Bank Credit Facility includes the following financial covenants applicable to the OP and its consolidated subsidiaries: (a) consolidated tangible net worth of the OP must be greater than or equal to the sum of (i) $1.5 billion and (ii) 50% of the proceeds received by the OP from any offering of its common equity and of the proceeds from any offering by the Company of its common equity to the extent such proceeds are contributed to the OP, excluding any such proceeds that are contributed to the OP within ninety (90) days of receipt and applied to acquire capital stock of the OP; (b) the OP’s earnings before interest, income tax, depreciation, and amortization plus lease expenses to fixed charges for any period of four (4) consecutive fiscal quarters must be not less than 1.50 to 1.00; (c) the OP’s interest coverage ratio must be not less than 3.00 to 1.00; and (d) the OP’s ratio of consolidated total debt to consolidated total assets must be not more than 0.70 to 1.00. The Bank Credit Facility also includes customary events of default, including, among other things, failure to make payments when due, breach of covenants or representations, cross default to material indebtedness or material judgment defaults, bankruptcy matters involving any Borrower or any Guarantor and certain change of control events. Further, we may not make distributions in excess of amounts required to maintain REIT status and may not repurchase shares, among other provisions. The occurrence of an event of default will limit the ability of the OP and its subsidiaries to make distributions and may result in the termination of the credit facility, acceleration of repayment obligations and the exercise of remedies by the Lenders with respect to the collateral.
Refer to “COVID-19 Update” below for further discussion regarding the COVID-19 pandemic and its impact on our future operating results, liquidity and financial condition.
Master Repurchase Facilities and CMBS Credit Facilities
Currently, our primary source of financing is our Master Repurchase Facilities, which we use to finance the origination of senior loans, and CMBS Credit Facilities, which we use to finance the purchase of securities. Repurchase agreements effectively allow us to borrow against loans, participations and securities that we own in an amount generally equal to (i) the market value of such loans, participations and/or securities multiplied by (ii) the applicable advance rate. Under these agreements, we sell our loans, participations and securities to a counterparty and agree to repurchase the same loans and securities from the counterparty at a
price equal to the original sales price plus an interest factor. During the term of a repurchase agreement, we receive the principal and interest on the related loans, participations and securities and pay interest to the lender under the master repurchase agreement. We intend to maintain formal relationships with multiple counterparties to obtain master repurchase financing on favorable terms.
Refer to “COVID-19 Update” below for further discussion regarding the COVID-19 pandemic and its impact on our future operating results, liquidity and financial condition.
The following table presents a summary of our Master Repurchase, CMBS and Bank Credit Facilities as of March 31, 2020 (dollars in thousands):
|
| | | | | | | | | | | | | | |
| | | Maximum Facility Size | | Current Borrowings | | Weighted Average Final Maturity (Years) | | Weighted Average Interest Rate |
| Master Repurchase Facilities | | | | | | | | |
| Bank 1 | | $ | 400,000 |
| | $ | 109,404 |
| | 3.1 |
| | LIBOR + 1.93% |
|
| Bank 2 | | 200,000 |
| | 22,750 |
| | 2.5 |
| | LIBOR + 2.50% |
|
| Bank 3 | | 600,000 |
| | 222,147 |
| | 2.1 |
| | LIBOR + 2.19% |
|
| Bank 7 | | 500,000 |
| | 199,740 |
| | 2.1 |
| | LIBOR + 1.93% |
|
| Bank 8 | | 250,000 |
| | 168,987 |
| | 1.2 |
| | LIBOR + 2.00% |
|
| Bank 9 | | 300,000 |
| | — |
| | 3.6 |
| | — |
|
| Total Master Repurchase Facilities | | 2,250,000 |
| | 723,028 |
| | | | |
| | | | | | | | | |
| CMBS Credit Facilities | | | | | | | | |
| Bank 1 | | 26,384 |
| | 26,384 |
| | (1 | ) | | LIBOR + 2.40% |
|
| Bank 6 | | 171,007 |
| | 171,007 |
| | (1 | ) | | (2) |
Bank 3(3) | | — |
| | — |
| | — |
| | — |
|
Bank 4(3) | | — |
| | — |
| | — |
| | — |
|
Bank 5(3) | | — |
| | — |
| | — |
| | — |
|
| Total CMBS Credit Facilities | | 197,391 |
| | 197,391 |
| | | | |
| | | | | | | | | |
| Bank Credit Facility | | 560,000 |
| | 340,000 |
| | 2.8 |
| | LIBOR + 2.25% |
|
| | | | | | | | | |
| Total Facilities | | $ | 3,007,391 |
| | $ | 1,260,419 |
| | | | |
_________________________________________
| |
| (1) | The maturity dates on CMBS Credit Facilities are dependent upon asset type and will typically range from one to three months. |
| |
| (2) | Bank 6 Facilities 1 and 2 both have fixed and floating rate financing. Bank 6 Facility 1 consists of $22.6 million financed with a fixed rate of 4.50% and $63.4 million financed with a weighted average interest rate of LIBOR plus 1.77%. Bank 6 Facility 2 consists of $45.5 million financed with a fixed rate of 4.50% and $39.5 million financed with a weighted average interest rate of LIBOR plus 1.50%. |
| |
| (3) | Amounts can be drawn under the Bank 3, Bank 4, and Bank 5 CMBS Credit Facilities, but we have not yet utilized them. |
Securitizations
We may seek to utilize non-recourse long-term securitizations of our investments in mortgage loans, especially loan originations, to the extent consistent with the maintenance of our REIT qualification and exclusion from the Investment Company Act in order to generate cash for funding new investments. This would involve conveying a pool of assets to a special purpose vehicle (or the issuing entity), which would issue one or more classes of non-recourse notes pursuant to the terms of an indenture. The notes would be secured by the pool of assets. In exchange for the transfer of assets to the issuing entity, we would receive the cash proceeds on the sale of non-recourse notes and a 100% interest in the equity of the issuing entity. The securitization of our portfolio investments might magnify our exposure to losses on those portfolio investments because any equity interest we retain in the issuing entity would be subordinate to the notes issued to investors and we would, therefore, absorb all of the losses sustained with respect to a securitized pool of assets before the owners of the notes experience any losses.
In October 2019, we executed a securitization transaction through our subsidiaries, CLNC 2019-FL1, which resulted in the sale of $840 million of investment grade notes. The securitization reflects an advance rate of 83.5% at a weighted average cost of funds of LIBOR plus 1.59%, and is collateralized by a pool of 22 senior loans, which we originated.
Other potential sources of financing
In the future, we may also use other sources of financing to fund the acquisition of our target assets, including secured and unsecured forms of borrowing and selective wind-down and dispositions of assets. We may also seek to raise equity capital or issue debt securities in order to fund our future investments.
COVID-19 Update
As of May 7, 2020, we have approximately $255 million cash on hand. During the three months ended March 31, 2020, we prudently drew $226.5 million on our bank facility with $340.0 million outstanding and $29.0 million of availability. While we have significant cash on hand, the COVID-19 pandemic is negatively impacting our liquidity position and outlook, and we expect it will continue to do so over the near-to-medium term.
The most notable impact relates to the financial condition of our borrowers and their ability to make their monthly mortgage payments and remain in compliance with loan covenants and terms. Failure of our borrowers to meet their loan obligations may trigger repayments to our Bank Credit and Master Repurchase Facilities.
Secondly, if our operating real estate lessees are unable to make monthly rent payments, we would be unable to make our monthly mortgage payments which could result in defaults under these obligations or trigger repayments under our Bank Credit Facility. If these events were to occur, we may not have sufficient available cash to repay amounts due.
Given the ongoing impact of the COVID-19 pandemic to the underlying value of our investments, and related uncertainty in our ability to meet certain financial covenants, on May 6, 2020 we amended our Bank Credit Facility to: (i) reduce the minimum tangible net worth covenant requirement from $2.1 billion to $1.5 billion, providing portfolio management flexibilities as a result of any disruptions in investments caused by COVID-19 or other factors; (ii) reduce the facility size from $560.0 million to $450.0 million (noting current borrowings of $299.0 million); (iii) limit dividends in line with taxable income and restrict stock repurchases, each for liquidity preservation purpose; and (iv) focus new investments on senior mortgages.
Additionally, on May 7, 2020 we amended the minimum tangible net worth covenant under all six of our Master Repurchase Facilities consistent with the Bank Credit Facility. For the three months ended March 31, 2020, we received and timely paid a margin call on a hospitality loan and made voluntarily paydowns on two other hospitality and one retail loan. The lender granted us a holiday from future margin calls between three and four months, and we obtained broader discretion to enter into permitted modifications with the borrowers on these three specific loans, if necessary.
For the three months ended March 31, 2020, we received and paid margin calls on our CMBS Credit Facilities of $48.9 million. Subsequent to March 31, 2020, we consolidated our CMBS Credit Facilities borrowings with one existing counterparty bank. In connection with the consolidation, we paid down the CMBS Credit Facilities borrowing advance rate to a blended borrowing advance rate of 62% and extended the repurchase date on all such borrowings to June 30, 2020. This $73.9 million paydown allows for a 15% additional loss on a bond specific basis before further margin calls. As of May 7, 2020, we had $123.5 million outstanding under our CMBS Credit Facilities. The financing bears a fixed interest rate of 4.50%
We are in discussions regarding similar modification agreements with our Master Repurchase Facility lenders. It is uncertain whether we will we reach any agreement due to the limited and temporary holiday and permitted modification periods described above, and the continuing impact of the COVID-19 pandemic. As such, we may receive additional margin calls, experience additional pressures or events of default under our financing agreements that will negatively impact our liquidity position.
We are also re-assessing capital needs in our owned real estate portfolio (both Core and Legacy, Non-Strategic) where we expect to limit any investment of additional capital.
Investment Sales
During the three months ended March 31, 2020 and through May 7, 2020, we sold 12 loans generating net proceeds of $104.7 million. We currently classify 26 owned real estate properties as held for sale with a total net carry value of $227.1 million at March 31, 2020. While we are proceeding with active marketing of these assets, given the COVID-19 pandemic we may be unable to sell these properties in the near to medium-term. Further, any completed sales may result in an investment loss.
Additionally, we are evaluating asset sales from our Core Portfolio. While these sales are expected to generate liquidity, completion of these sales is uncertain and may result in lower than expected proceeds or an investment loss.
Dividend
The COVID-19 pandemic has caused extraordinary volatility and unprecedented market conditions, including actual and unanticipated consequences to us and certain of our investments, which may continue. Having paid monthly dividend payments with respect to our common stock through March 31, 2020, we and the Board of Directors determined it was prudent and in our best interests to conserve available liquidity and suspend our monthly dividend beginning with the monthly period ending April 30, 2020. The Board of Directors will evaluate dividends in future periods based upon customary considerations, including market conditions. Importantly, we continue to monitor its taxable income to ensure that we meet the minimum distribution requirements to maintain its status as a REIT for the annual period ending December 31, 2020.
Cash Flows
The following presents a summary of our consolidated statements of cash flows for the three months ended March 31, 2020 and 2019 (dollars in thousands):
|
| | | | | | | | | | | | |
| | | Three Months Ended March 31, | | |
| Cash flow provided by (used in): | | 2020 | | 2019 | | Change |
| Operating activities | | $ | 57,204 |
| | $ | 37,678 |
| | $ | 19,526 |
|
| Investing activities | | 275,363 |
| | 18,844 |
| | 256,519 |
|
| Financing activities | | 26,524 |
| | (46,621 | ) | | 73,145 |
|
Operating Activities
Cash inflows from operating activities are generated primarily through interest received from loans receivable and securities, property operating income from our real estate portfolio, and distributions of earnings received from unconsolidated ventures. This is partially offset by payment of interest expenses for credit facilities and mortgage payable, and operating expenses supporting our various lines of business, including property management and operations, loan servicing and workout of loans in default, investment transaction costs, as well as general administrative costs.
Our operating activities generated net cash inflows of $57.2 million and $37.7 million for the three months ended March 31, 2020 and 2019, respectively. Net cash provided by operating activities increased $19.5 million for the three months ended March 31, 2020 compared to the three months ended March 31, 2019, primarily due to higher net interest income earned on our loan and CRE debt securities portfolio and lower management fees incurred during the three months ended March 31, 2020.
We believe cash flows from operations, available cash balances and our ability to generate cash through short- and long-term borrowings are sufficient to fund our operating liquidity needs.
Investing Activities
Investing activities include cash outlays for acquisition of real estate, disbursements on new and/or existing loans, and contributions to unconsolidated ventures, which are partially offset by repayments and sales of loan receivables, distributions of capital received from unconsolidated ventures, proceeds from sale of real estate, as well as proceeds from maturity or sale of securities.
Investing activities generated net cash inflows of $275.4 million and $18.8 million for the three months ended March 31, 2020 and 2019, respectively. Net cash provided by investing activities in 2020 resulted primarily from proceeds from sale of real estate of $160.8 million, repayment on loan and preferred equity held for investment of $160.1 million, net receipts on settlement of derivative instruments of $19.6 million and distributions in excess of cumulative earnings from unconsolidated ventures of $16.5 million, partially offset by future fundings on our loans and preferred equity held for investment, net of $37.5 million, change in escrow deposits of $25.0 million, investments in unconsolidated ventures of $16.7 million and additions to real estate of $11.3 million.
Net cash provided by investing activities for the three months ended March 31, 2019 resulted primarily from repayment on loans and preferred equity held for investment of $172.7 million, distributions in excess of cumulative earnings from unconsolidated ventures of $65.8 million, proceeds from sale of investments in unconsolidated ventures of $34.5 million and net receipts on settlement of derivative instruments of $1.6 million, partially offset by acquisition, origination and funding of loans and preferred equity held for investment, net of $241.7 million, acquisition of and additions to real estate, related intangibles and leasing commissions of $6.2 million, investment in unconsolidated ventures of $5.2 million and change in escrow deposits of $2.3 million.
Financing Activities
We finance our investing activities largely through borrowings secured by our investments along with capital from third party or affiliated co-investors. We also have the ability to raise capital in the public markets through issuances of common stock, as well as draw upon our corporate credit facility, to finance our investing and operating activities. Accordingly, we incur cash outlays for payments on third party debt, dividends to our common stockholders as well as distributions to our noncontrolling interests.
Financing activities generated net cash inflow of $26.5 million for the three months ended March 31, 2020 compared to net cash outflow of $46.6 million for the three months ended March 31, 2019. Net cash provided by financing activities in 2020 resulted primarily from borrowings from credit facilities in the amount of $250.0 million and borrowings from mortgage notes in the amount of $2.3 million, partially offset by repayment of credit facilities in the amount of $88.8 million, repayment of mortgage notes in the amount of $76.6 million, distributions paid on common stock and noncontrolling interests of $39.5 million and distributions to noncontrolling interests in the amount of $11.0 million.
Net cash used in financing activities for the three months ended March 31, 2019 resulted primarily from repayment of credit facilities in the amount of $695.3 million, distributions paid on common stock in the amount of $57.0 million, repayment of securitization bonds in the amount of $27.7 million, payment of deferred financing costs in the amount of $1.6 million and repayment of mortgage notes in the amount of $1.5 million, partially offset by borrowings from credit facilities in the amount of $714.6 million and borrowings from mortgage notes in the amount of $22.2 million.
Contractual Obligations, Commitments and Contingencies of the Company
The following table sets forth the known contractual obligations of the Company on an undiscounted basis. This table excludes obligations of the Company that are not fixed and determinable, including the Management Agreement (dollars in thousands):
|
| | | | | | | | | | | | | | | | | | | | |
| | | Payments Due by Period |
| | | Total | | Less than a Year | | 1-3 Years | | 3-5 Years | | More than 5 Years |
Bank credit facility(1) | | $ | 361,837 |
| | $ | 11,786 |
| | $ | 350,051 |
| | $ | — |
| | $ | — |
|
Secured debt(2) | | 2,419,363 |
| | 810,832 |
| | 469,409 |
| | 331,579 |
| | 807,543 |
|
Securitization bonds payable(3) | | 943,465 |
| | 30,842 |
| | 335,433 |
| | 577,190 |
| | — |
|
Ground lease obligations(4) | | 36,052 |
| | 3,183 |
| | 6,380 |
| | 5,333 |
| | 21,156 |
|
| | | $ | 3,760,717 |
| | $ | 856,643 |
| | $ | 1,161,273 |
| | $ | 914,102 |
| | $ | 828,699 |
|
Lending commitments(5) | | 270,579 |
| | | | | | | | |
| Total | | $ | 4,031,296 |
| | | | | | | | |
_________________________________________
| |
| (1) | Future interest payments were estimated based on the applicable index at March 31, 2020 and unused commitment fee of 0.35% per annum, assuming principal is repaid on the current maturity date of February 2022. |
| |
| (2) | Amounts include minimum principal and interest obligations through the initial maturity date of the collateral assets. Interest on floating rate debt was determined based on the applicable index at March 31, 2020. |
| |
| (3) | The timing of future principal payments was estimated based on expected future cash flows of underlying collateral loans. Repayments are estimated to be earlier than contractual maturity only if proceeds from underlying loans are repaid by the borrowers. |
| |
| (4) | The Company assumed noncancellable operating ground leases as lessee or sublessee in connection with net lease properties acquired through the CLNY Contributions. The amounts represent minimum future base rent commitments through initial expiration dates of the respective leases, excluding any contingent rent payments. Rents paid under ground leases are recoverable from tenants. |
| |
| (5) | Future lending commitments may be subject to certain conditions that borrowers must meet to qualify for such fundings. Commitment amount assumes future fundings meet the terms to qualify for such fundings. |
Guarantees and Off-Balance Sheet Arrangements
As of March 31, 2020, we were not dependent on the use of any off-balance sheet financing arrangements for liquidity. We have made investments in unconsolidated ventures. Our investments in unconsolidated joint ventures consisted of investments in PE Investments, senior loans, mezzanine loans and preferred equity held in joint ventures, as well as acquisition, development and construction arrangements accounted for as equity method investments. In each case, our exposure to loss is limited to the carrying value of our investment.
Our Investment Strategy
Our objective is to generate consistent and attractive risk-adjusted returns to our stockholders. We seek to achieve this objective primarily through cash distributions and the preservation of invested capital and secondarily through capital appreciation. We believe our diversified investment strategy across the CRE capital stack provides flexibility through economic cycles to achieve attractive risk-adjusted returns. This approach is driven by a disciplined investment strategy, focused on:
| |
| • | capitalizing on asset level underwriting experience and market analytics to identify investments with pricing dislocations and attractive risk-return profiles; |
| |
| • | originating and structuring CRE senior mortgage loans, mezzanine loans and preferred equity with attractive return profiles relative to the underlying value and financial operating performance of the real estate collateral, given the strength and quality of the sponsorship; |
| |
| • | identifying appropriate CRE debt securities investments based on the performance of the underlying real estate assets, the impact of such performance on the credit return profile of the investments and our expected return on the investments; |
| |
| • | identifying net leased real estate investments based on property location and purpose, tenant credit quality, market lease rates and potential appreciation of, and alternative uses for, the real estate; |
| |
| • | creating capital appreciation opportunities through active asset management and equity participation opportunities; and |
| |
| • | structuring transactions with a prudent amount of leverage, if any, given the risk of the underlying asset’s cash flows, attempting to match the structure and duration of the financing with the underlying asset’s cash flows, including through the use of hedges, as appropriate. |
The period for which we intend to hold our investments will vary depending on the type of asset, interest rates, investment performance, micro and macro real estate environment, capital markets and credit availability, among other factors. We generally expect to hold debt investments until the stated maturity and equity investments in accordance with each investment’s proposed business plan. We may sell all or a partial ownership interest in an investment before the end of the expected holding period if we believe that market conditions have maximized its value to us or the sale of the asset would otherwise be in the best interests of our stockholders.
Our investment strategy is dynamic and flexible, enabling us to adapt to shifts in economic, real estate and capital market conditions and to exploit market inefficiencies. We may expand or change our investment strategy or target assets over time in response to opportunities available in different economic and capital market conditions. This flexibility in our investment strategy allows us to employ a customized, solutions-oriented approach, which we believe is attractive to borrowers and tenants. We believe that our diverse portfolio, our ability to originate, acquire and manage our target assets and the flexibility of our investment strategy positions us to capitalize on market inefficiencies and generate attractive long-term risk-adjusted returns for our stockholders through a variety of market conditions and economic cycles.
We have not acquired any investments in 2020 and currently are primarily focused on existing investments and commitments.
Underwriting, Asset and Risk Management
Our Manager closely monitors our portfolio and actively manages risks associated with, among other things, our assets and interest rates. Prior to investing in any particular asset, our Manager’s underwriting team, in conjunction with third party providers, undertakes a rigorous asset-level due diligence process, involving intensive data collection and analysis, to ensure that we understand fully the state of the market and the risk-reward profile of the asset. Prior to making a final investment decision, our Manager focuses on portfolio diversification to determine whether a target asset will cause our portfolio to be too heavily concentrated with, or cause too much risk exposure to, any one borrower, real estate sector, geographic region, source of cash flow for payment or other geopolitical issues. If our Manager determines that a proposed acquisition presents excessive concentration risk, it may determine not to acquire an otherwise attractive asset.
For each asset that we acquire, our Manager’s asset management team engages in active management of the asset, the intensity of which depends on the attendant risks. The asset manager works collaboratively with the underwriting team to formulate a strategic plan for the particular asset, which includes evaluating the underlying collateral and updating valuation assumptions to reflect changes in the real estate market and the general economy. This plan also generally outlines several strategies for the asset to extract the maximum amount of value from each asset under a variety of market conditions. Such strategies may vary depending on the type of asset, the availability of refinancing options, recourse and maturity, but may include, among others, the restructuring of non-performing or sub-performing loans, the negotiation of discounted pay-offs or other modification of the terms governing a loan, and the foreclosure and management of assets underlying non-performing loans in order to reposition them for profitable disposition. Our Manager and its affiliates will continuously track the progress of an asset against the original business plan to ensure that the attendant risks of continuing to own the asset do not outweigh the associated rewards. Under these circumstances, certain assets will require intensified asset management in order to achieve optimal value realization.
Our Manager’s asset management team engages in a proactive and comprehensive on-going review of the credit quality of each asset it manages. In particular, for debt investments on at least an annual basis, the asset management team will evaluate the financial wherewithal of individual borrowers to meet contractual obligations as well as review the financial stability of the assets securing such debt investments. Further, there is ongoing review of borrower covenant compliance including the ability of borrowers to meet certain negotiated debt service coverage ratios and debt yield tests. For equity investments, the asset management team, with the assistance of third party property managers, monitors and reviews key metrics such as occupancy, same store sales, tenant payment rates, property budgets and capital expenditures. If through this analysis of credit quality, the asset management team encounters declines in credit not in accord with the original business plan, the team evaluates the risks and determine what changes, if any, are required to the business plan to ensure that the attendant risks of continuing to hold the investment do not outweigh the associated rewards.
In addition, the audit committee of our Board of Directors, in consultation with management, periodically reviews our policies with respect to risk assessment and risk management, including key risks to which we are subject, including credit risk, liquidity risk and market risk, and the steps that management has taken to monitor and control such risks.
Inflation
Virtually all of our assets and liabilities are interest rate sensitive in nature. As a result, interest rates and other factors influence our performance significantly more than inflation does. A change in interest rates may correlate with the inflation rate. Substantially all of the leases at our multifamily and student housing properties allow for monthly or annual rent increases which provide us with the opportunity to achieve increases, where justified by the market, as each lease matures. Such types of leases generally minimize the risks of inflation on our multifamily and student housing properties.
Refer to Item 3, “Quantitative and Qualitative Disclosures About Market Risk” for additional details.
Critical Accounting Policies
Our consolidated financial statements are prepared in accordance with accounting principles generally accepted in the United States, or U.S. GAAP, which requires the use of estimates and assumptions that involve the exercise of judgment and that affect the reported amounts of assets and liabilities at the date of the consolidated financial statements and the reported amounts of revenues and expenses during the reporting period. There have been no material changes to our critical accounting policies since the filing of our Annual Report on Form 10-K for the fiscal year ended December 31, 2019.
Recent Accounting Updates
For recent accounting updates, refer to Note 2, “Summary of Significant Accounting Policies” in our accompanying consolidated financial statements included in Part I, Item 1, “Financial Statements.”
Item 3. Quantitative and Qualitative Disclosures About Market Risk
Our primary market risks are interest rate risk, prepayment risk, extension risk, credit risk, real estate market risk, capital market risk and foreign currency risk, either directly through the assets held or indirectly through investments in unconsolidated ventures, with each risk heightened as a result of the ongoing and numerous adverse impacts of the COVID-19 pandemic. As stated in the “Impact of COVID-19” section in “Item 2. Management’s Discussion and Analysis of Financial Condition and Results of Operations”, us and our Manager are taking steps to mitigate certain risks associated with COVID-19, provided to the extent to which the COVID-19 pandemic impacts us, our business, our borrowers and our tenants will depend on future developments, which are highly uncertain and cannot be predicted with confidence, including the scope, severity and duration of the pandemic, the actions taken by us or others to contain the pandemic or mitigate its impact, and the direct and indirect economic efforts of the pandemic and containment measures, among others.
Interest Rate Risk
Interest rate risk relates to the risk that the future cash flow of a financial instrument will fluctuate because of changes in market interest rates. Interest rate risk is highly sensitive to many factors, including governmental, monetary and tax policies, domestic and international economic and political considerations and other factors beyond our control. Credit curve spread risk is highly sensitive to the dynamics of the markets for loans and securities we hold. Excessive supply of these assets combined with reduced demand will cause the market to require a higher yield. This demand for higher yield will cause the market to use a higher spread over the U.S. Treasury securities yield curve, or other benchmark interest rates, to value these assets.
As U.S. Treasury securities are priced to a higher yield and/or the spread to U.S. Treasuries used to price the assets increases, the price at which we could sell some of our fixed rate financial assets may decline. Conversely, as U.S. Treasury securities are priced to a lower yield and/or the spread to U.S. Treasuries used to price the assets decreases, the value of our fixed rate financial assets may increase. Fluctuations in LIBOR may affect the amount of interest income we earn on our floating rate borrowings and interest expense we incur on borrowings indexed to LIBOR, including under credit facilities and investment-level financing.
We utilize a variety of financial instruments on some of our investments, including interest rate swaps, caps, floors and other interest rate exchange contracts, in order to limit the effects of fluctuations in interest rates on their operations. The use of these types of derivatives to hedge interest-earning assets and/or interest-bearing liabilities carries certain risks, including the risk that losses on a hedge position will reduce the funds available for distribution and that such losses may exceed the amount invested in such instruments. A hedge may not perform its intended purpose of offsetting losses of rising interest rates. Moreover, with respect to certain of the instruments used as hedges, there is exposure to the risk that the counterparties may cease making markets and quoting prices in such instruments, which may inhibit the ability to enter into an offsetting transaction with respect to an open position. Our profitability may be adversely affected during any period as a result of changing interest rates.
As of March 31, 2020, a hypothetical 100 basis point increase in the applicable interest rate benchmark on our loan portfolio would decrease interest income by $12.7 million annually, net of interest expense.
Prepayment risk
Prepayment risk is the risk that principal will be repaid at a different rate than anticipated, resulting in a less than expected return on an investment. As prepayments of principal are received, any premiums paid on such assets are amortized against interest income, while any discounts on such assets are accreted into interest income. Therefore, an increase in prepayment rates has the following impact: (i) accelerates amortization of purchase premiums, which reduces interest income earned on the assets; and conversely, (ii) accelerates accretion of purchase discounts, which increases interest income earned on the assets.
Extension risk
The weighted average life of assets is projected based on assumptions regarding the rate at which borrowers will prepay or extend their mortgages. If prepayment rates decrease or extension options are exercised by borrowers at a rate that deviates significantly from projections, the life of fixed rate assets could extend beyond the term of the secured debt agreements. This in turn could negatively impact liquidity to the extent that assets may have to be sold and losses may be incurred as a result.
Credit risk
Investment in loans held for investment is subject to a high degree of credit risk through exposure to loss from loan defaults. Default rates are subject to a wide variety of factors, including, but not limited to, borrower financial condition, property performance, property management, supply/demand factors, construction trends, consumer behavior, regional economics, interest rates, the strength of the U.S. economy and other factors beyond our control, all of which may be detrimentally impacted by the COVID-19 pandemic. All loans are subject to a certain probability of default. We manage credit risk through the underwriting process, acquiring investments at the appropriate discount to face value, if any, and establishing loss assumptions. Performance of the loans is carefully monitored, including those held through joint venture investments, as well as external factors that may affect their value.
We are also subject to the credit risk of the tenants in our properties, including business closures, occupancy levels, meeting rent or other expense obligations, lease concessions, among other factors, all of which may be detrimentally impacted by the COVID-19 pandemic. We seek to undertake a rigorous credit evaluation of the tenants prior to acquiring properties. This analysis includes an extensive due diligence investigation of the tenants’ businesses, as well as an assessment of the strategic importance of the underlying real estate to the respective tenants’ core business operations. Where appropriate, we may seek to augment the tenants’ commitment to the properties by structuring various credit enhancement mechanisms into the underlying leases. These mechanisms could include security deposit requirements or guarantees from entities that are deemed credit worthy.
We are working closely with our borrowers and tenants to address the impact of COVID-19 on their business. Our Manager’s in-depth understanding of CRE and real estate-related investments, and in-house underwriting, asset management and resolution capabilities, provides us and management with a sophisticated full-service platform to regularly evaluate our investments and determine primary, secondary or alternative strategies to manage the credit risks described above. This includes intermediate servicing and complex and creative negotiating, restructuring of non-performing investments, foreclosure considerations, intense management or development of owned real estate, in each case to manage the risks faced to achieve value realization events in our interests and our stockholders. Solutions considered due to the impact of the COVID-19 pandemic may include defensive loan or lease modifications, temporary interest or rent deferrals or forbearances, converting current interest payment obligations to payment-in-kind, repurposing reserves and/or covenant waivers. Depending on the nature of the underlying investment and credit risk, we may pursue repositioning strategies through judicious capital investment in order to extract value from the investment or limit losses.
There can be no assurance that the measures taken will be sufficient to address the negative impact the COVID-19 pandemic may have on our future operating results, liquidity and financial condition.
Real estate market risk
We are exposed to the risks generally associated with the commercial real estate market. The market values of commercial real estate are subject to volatility and may be affected adversely by a number of factors, including, but not limited to, national, regional and local economic conditions, as well as changes or weakness in specific industry segments, and other macroeconomic factors beyond our control, including the COVID-19 pandemic, which could affect occupancy rates, capitalization rates and absorption rates. This in turn could impact the performance of tenants and borrowers. We seek to manage these risks through their underwriting due diligence and asset management processes and the solutions oriented process described above.
Capital markets risk
We are exposed to risks related to the debt capital markets, specifically the ability to finance our business through borrowings under secured revolving repurchase facilities, secured and unsecured warehouse facilities or other debt instruments. We seek to
mitigate these risks by monitoring the debt capital markets to inform their decisions on the amount, timing and terms of their borrowings.
The COVID-19 pandemic has had a direct and volatile impact on the global markets, including the commercial real estate equity and debt capital markets. The disruption caused by COVID-19 pandemic has led to a negative impact on asset valuations and significant constraints on liquidity in the capital markets, which may lead to restrictions on lending activity, downward pressure on covenant compliance or requirements to post margin or repayments under master repurchase financing arrangements. Our Master Repurchase Facilities are partial recourse and margin call provisions do not permit valuation adjustments based on capital markets events, rather they are limited to collateral-specific credit marks generally determined on a commercially reasonable basis. We have timely met margin calls, primarily under our CMBS Credit Facilities.
We have taken steps to negotiate amendments to our Bank Credit Facility and certain Master Repurchase Facilities, including to adjust certain covenants (such as the tangible net worth covenant), reduce advance rates on certain financed assets, obtain margin call holidays and permitted modification flexibilities, in an effort to mitigate the risk of future compliance issues, including margin calls, under our financing arrangements.
We continue to explore similar solutions with financing counterparties to strengthen our financing arrangements, with the understanding that any existing or future amendments may not be sufficient to fully address the impacts of COVID-19 on our business or financing arrangements.
Foreign Currency Risk
We have foreign currency rate exposures related to our foreign currency-denominated investments held by our foreign subsidiaries. Changes in foreign currency rates can adversely affect the fair values and earning of our non-U.S. holdings. We generally mitigate this foreign currency risk by utilizing currency instruments to hedge our net investments in our foreign subsidiaries. The type of hedging instruments that we employ on our foreign subsidiary investments are forwards.
At March 31, 2020, we had approximately NOK 842.9 million and €159.5 million or a total of $255.9 million, in net investments in our European subsidiaries. A 1.0% change in these foreign currency rates would result in a $2.6 million increase or decrease in translation gain or loss included in other comprehensive income in connection with our European subsidiaries.
A summary of the foreign exchange contracts in place at March 31, 2020, including notional amount and key terms, is included in Note 15, “Derivatives,” to Part I, Item 1, “Financial Statements.” The maturity dates of these instruments approximate the projected dates of related cash flows for specific investments. Termination or maturity of currency hedging instruments may result in an obligation for payment to or from the counterparty to the hedging agreement. We are exposed to credit loss in the event of non-performance by counterparties for these contracts. To manage this risk, we select major international banks and financial institutions as counterparties and perform a quarterly review of the financial health and stability of our trading counterparties. Based on our review at March 31, 2020, we do not expect any counterparty to default on its obligations.
Item 4. Controls and Procedures
Evaluation of Disclosure Controls and Procedures
We maintain disclosure controls and procedures, as defined in Rules 13a-15(e) and 15d-15(e) under the Exchange Act, that are designed to ensure that information required to be disclosed in our Exchange Act reports is recorded, processed, summarized and reported within the time periods specified in the SEC’s rules and forms, and that such information is accumulated and communicated to our management, including our Chief Executive Officer and Chief Financial Officer, as appropriate, to allow timely decisions regarding required disclosure.
As required by Rule 13a-15(b) under the Exchange Act, our management carried out an evaluation, under the supervision and with the participation of our Chief Executive Officer and Chief Financial Officer, of the effectiveness of our disclosure controls and procedures. Based on this evaluation, our Chief Executive Officer and Chief Financial Officer concluded that as of March 31, 2020, our disclosure controls and procedures were effective at providing reasonable assurance regarding the reliability of the information required to be disclosed by us in reports that we file under the Exchange Act is recorded, processed, summarized and reported within the time periods specified in SEC rules and forms.
Changes in Internal Control over Financial Reporting
There have been no changes in our internal control over financial reporting (as defined in Rules 13a-15(f) and 15d-15(f) under the Exchange Act) during the most recent fiscal quarter that materially affected, or are reasonably likely to materially affect, our internal control over financial reporting.
We are pleased to report that the state of health and well-being of employees is strong. Our external manager instituted a full remote work policy in early March that will be in effect through June 1, 2020, at the earliest.
Our internal control framework, which includes controls over financial reporting and disclosure, continues to operate effectively. Considering the COVID-19 pandemic, we have supplemented our framework by instituting certain entity level procedures and controls that ensure communication amongst our team that enhances our ability to prevent and detect material errors and/or omissions.
PART II
Item 1. Legal Proceedings
Neither the Company nor our Manager is currently subject to any material legal proceedings. We anticipate that we may from time to time be involved in legal actions arising in the ordinary course of business, the outcome of which we would not expect to have a material adverse effect on our financial position, results of operations or cash flow.
Item 1A. Risk Factors
The novel coronavirus pandemic, measures intended to prevent its spread and government actions to mitigate its economic impact has had and may continue to have a material adverse effect on our business, results of operations and financial condition.
The COVID-19 pandemic is causing significant disruptions to the U.S. and global economies and has contributed to volatility and negative pressure in financial markets. The outbreak has led governments and other authorities around the world to impose measures intended to control its spread, including restrictions on freedom of movement and business operations such as travel bans, border closings, business closures, quarantines and shelter-in-place orders. The actual and potential impact and duration of COVID-19 or another pandemic have and are expected to continue to have significant repercussions across regional, national and global economies and financial markets, and have triggered a period of regional, national and global economic slowdown and may trigger a longer term recession. The impact of the pandemic and measures to prevent its spread have negatively impacted us and could further negatively impact our business. To the extent current conditions persist or worsen, we expect there to be a materially negative effect on the value of our assets and our results of operations, and, in turn, cash available for distribution to our stockholders. Moreover, many risk factors set forth in the Company’s Annual Report on Form 10-K for the year ended December 31, 2019 should be interpreted as heightened risks as a result of the ongoing and numerous adverse impacts of the COVID-19 pandemic.
Difficulty accessing debt and equity capital on attractive terms, or at all, and severe disruption or instability in the global financial markets or deteriorations in credit and financing conditions may affect our ability to access capital necessary to fund business operations or replace liabilities on a timely basis. This may also adversely affect the valuation of financial assets and liabilities, any of which could result in the inability to make payments under our credit and other borrowing facilities, affect our ability to meet liquidity, net worth, and leverage covenants under such facilities or have a material adverse effect on the value of investments we hold. In addition, the insolvency of one or more of our counterparties could reduce the amount of financing available to us, which would make it more difficult for us to leverage the value of our assets and obtain substitute financing on attractive terms or at all. Recently, we have experienced declines in the value of our target assets, as well as adverse developments with respect to the terms and cost of financing available to us, and have received margin calls, default notices and deficiency letters from certain of our financing counterparties. Any or all of these impacts could result in reduced net investment income and cash flow, as well as an impairment of our investments, which reductions and impairments could be material. Declines in asset values, specifically retail, office and multifamily residential assets, may also impact our ability to liquidate our legacy, non-strategic assets within the projected timeframe or at the projected values.
Additionally, we expect the economic impacts of the pandemic will impact the financial stability of the mortgage loans and mortgage loan borrowers underlying the residential and commercial securities and loans that we own. As a result, we anticipate an increase in the number of borrowers who become delinquent or default on their loans, or who will seek concessions or forbearance. Elevated levels of delinquency or default would have an adverse impact on our income and the value of our assets and may require us to repay amounts under our master repurchase facilities and we can provide no assurance that we will have funds available to make such payments. Any forced sales of loans, securities or other assets that secure our repurchase and other financing arrangements in the current environment would likely be on terms less favorable to us than might otherwise be available in a regularly functioning market and could result in deficiency judgments and other claims against us.
Our loans collateralized by hotels, retail properties and mezzanine loans and preferred equity interests are disproportionately impacted by the effects of COVID-19. In particular, we hold a $189.0 million commitment in a mezzanine loan and preferred equity investment on a development project in Los Angeles County (which includes a hospitality and retail renovation and a new condominium tower construction) for which loan funding was out of balance in April 2020. Although this deficiency has been funded, if there are further overruns or delays in opening or decreased demand for the hospitality or retail space or condominium sales, we may not be able to fund any other deficiencies, which could result in a default under the senior mortgage loan and a foreclosure on all interests subordinate to the senior mortgage loan, including our interest in the mezzanine loan. In addition, our retail borrowers have been materially impacted by shelter-in-place orders, and, for example, nine properties net leased to a national retail chain did not pay April rent, and the default rate in future periods likely will increase.
In response to the pandemic, the U.S. government has taken various actions to support the economy and the continued functioning of the financial markets. The Federal Reserve has announced its commitment to purchase unlimited amounts of U.S. Treasuries, mortgage-backed securities, municipal bonds and other assets. In addition, President Trump signed into law the Coronavirus Aid, Relief, and Economic Security (CARES) Act, which will provide billions of dollars of relief to individuals, businesses, state and
local governments, and the health care system suffering the impact of the pandemic, including mortgage loan forbearance and modification programs to qualifying borrowers who have difficulty making their loan payments. There can be no assurance as to how, in the long term, these and other actions by the U.S. government will affect the efficiency, liquidity and stability of the financial and mortgage markets. To the extent the financial or mortgage markets do not respond favorably to any of these actions, or such actions do not function as intended, our business, results of operations and financial condition may continue to be materially adversely affected. Moreover, certain actions taken by U.S. or other governmental authorities, including the Federal Reserve, that are intended to ameliorate the macroeconomic effects of COVID-19 may harm our business. Decreases in short-term interest rates, such as those announced by the Federal Reserve late in our 2019 fiscal year and during the first fiscal quarter of 2020, may have a negative impact on our results, as we have certain assets and liabilities which are sensitive to changes in interest rates. These market interest rate declines may negatively affect our results of operations. In addition, as interest rates continue to decline as a result of demand for U.S. Treasury securities and the activities of the Federal Reserve, prepayments on our assets are likely to increase due to refinancing activity, which could have a material adverse effect on our result of operations.
The rapid development and fluidity of the circumstances resulting from this pandemic preclude any prediction as to the ultimate adverse impact of COVID-19 on our business. Nevertheless, COVID-19 and the current financial, economic and capital markets environment, and future developments in these and other areas present material uncertainty and risk with respect to our performance, financial condition, results of operations and cash flows.
Our inability to access funding or the terms on which such funding is available could have a material adverse effect on our financial condition, particularly in light of ongoing market dislocations resulting from the COVID-19 pandemic.
Our ability to fund our operations, meet financial obligations and finance target asset acquisitions may be impacted by our ability to secure and maintain our master repurchase agreements with our counterparties. Because repurchase agreements are short-term commitments of capital, lenders may respond to market conditions making it more difficult for us to renew or replace on a continuous basis our maturing short-term borrowings and have and may continue to impose more onerous conditions when rolling such financings. If we are not able to renew our existing facilities or arrange for new financing on terms acceptable to us, or if we default on our covenants or are otherwise unable to access funds under our financing facilities or if we are required to post more collateral or face larger haircuts, we may have to curtail our asset acquisition activities and/or dispose of assets.
Issues related to financing are exacerbated in times of significant dislocation in the financial markets, such as those being experienced now related to the COVID-19 pandemic. It is possible our lenders will become unwilling or unable to provide us with financing and we could be forced to sell our assets at an inopportune time when prices are depressed. In addition, if the regulatory capital requirements imposed on our lenders change, they may be required to significantly increase the cost of the financing that they provide to us. Our lenders also have revised and may continue to revise their eligibility requirements for the types of assets they are willing to finance or the terms of such financings, including haircuts and requiring additional collateral in the form of cash, based on, among other factors, the regulatory environment and their management of actual and perceived risk, particularly with respect to assignee liability. Moreover, the amount of financing we receive under our repurchase agreements will be directly related to our lenders’ valuation of our target assets that cover the outstanding borrowings. Typically, repurchase agreements grant the lender the absolute right to reevaluate the fair market value of the assets that cover outstanding borrowings at any time. If a lender determines in its sole discretion that the value of the assets has decreased, it has the right to initiate a margin call. These valuations may be different than the values that we ascribe to these assets and may be influenced by recent asset sales and distressed levels by forced sellers. A margin call requires us to transfer additional assets to a lender without any advance of funds from the lender for such transfer or to repay a portion of the outstanding borrowings. We have experienced this phenomenon in recent weeks.
In recent weeks, we have observed a mark-down of a portion of our mortgage assets by the counterparties to our financing arrangements, resulting in us having to pay cash or securities to satisfy higher than historical levels of margin calls. Significant margin calls could have a material adverse effect on our results of operations, financial condition, business, liquidity and ability to make distributions to our stockholders, and could cause the value of our common stock to decline. In addition, we have also experienced an increase in haircuts on financings we have rolled. As haircuts are increased, we will be required to post additional collateral. We may also be forced to sell assets at significantly depressed prices to meet such margin calls and to maintain adequate liquidity. As a result of the ongoing COVID-19 pandemic, we have experienced margins calls well beyond historical norms. These trends, if continued, will have a negative adverse impact on our liquidity.
In connection with the market disruptions resulting from the COVID-19 pandemic, we changed our interest rate hedging strategy and closed out of, or terminated a portion of our interest rate hedges, incurring realized losses. As a result, interest rate risk exposure that is associated with certain of our assets and liabilities is no longer being hedged in the manner that we previously used to address interest rate risk and our revised strategy to address interest rate risk may not be effective and could result in the incurrence of future realized losses.
In response to the recent market dislocations resulting from the global pandemic of COVID-19, we made the determination that certain of our interest rate hedges were no longer effective in hedging asset market values and, as of March 27, 2020, had terminated or closed out a portion of our outstanding interest rate hedges and, overall, incurred realized losses. While we are monitoring market conditions and determining when we believe it would be appropriate and effective to re-implement interest rate hedging strategies, including by taking into account our future business activities and assets and liabilities, we will be exposed to the impact that changes in benchmark interest rates may have on the value of the loans, securities and other assets we own that are sensitive to interest rate changes, as well as long-term debt obligations that are sensitive to interest rate changes. Moreover, to the extent the value of loans and securities we own fluctuate as a result of changes in benchmark interest rates, we may be exposed to margin calls under lending facilities that we use to finance these assets. In the past, our interest rate hedging strategy was intended to be a source of liquidity in meeting margin calls that resulted from asset valuation changes attributable to changes in benchmark interest rates; however, because we have terminated or closed out a portion of our outstanding interest rate hedges, we will not be able to rely on these hedges as such a source of liquidity. Operating our business and maintaining a portfolio of interest rate sensitive loans, securities and other assets without an interest rate risk hedging program in place could expose us to losses and liquidity risks, which could be material and which could negatively impact our results of operations and financial condition. There can be no assurance that future market conditions and our financial condition in the future will enable us to re-establish an effective interest rate risk hedging program, even if in the future we believe it would otherwise be appropriate or desirable to do so.
We may pay taxable dividends in our common stock and cash, in which case stockholders may sell shares of our common stock to pay tax on such dividends, placing downward pressure on the market price of our common stock.
We generally must distribute annually at least 90% of our REIT taxable income (subject to certain adjustments and excluding any net capital gain), in order to qualify as a REIT, and any REIT taxable income that we do not distribute will be subject to U.S. corporate income tax at regular rates. In April 2020, the Board of Directors of the Company determined it was prudent to conserve available liquidity and suspend the Company’s monthly stock dividend beginning with the monthly period ending April 30, 2020. The Board of Directors will evaluate dividends in future periods based upon customary consideration, such as our cash balances, and cash flows and market conditions and could consider paying future dividends in shares of common stock, cash, or a combination of shares of common stock and cash.
On August 11, 2017, the IRS issued Revenue Procedure 2017-45, authorizing elective stock dividends to be made by public REITs. Pursuant to this revenue procedure, effective for distributions declared on or after August 11, 2017, the IRS will treat the distribution of stock pursuant to an elective stock dividend as a distribution of property under Section 301 of the Code (i.e., as a dividend to the extent of our earnings and profits), as long as at least 20% of the total dividend is available in cash and certain other requirements outlined in the revenue procedure are met.
If we make a taxable dividend payable in cash and common stock, taxable stockholders receiving such dividends will be required to include the full amount of the dividend as ordinary income to the extent of our current and accumulated earnings and profits, as determined for U.S. federal income tax purposes. As a result, stockholders may be required to pay income tax with respect to such dividends in excess of the cash dividends received. If a U.S. stockholder sells the common stock that it receives as a dividend in order to pay this tax, the sales proceeds may be less than the amount included in income with respect to the dividend, depending on the market price of our common stock at the time of the sale. Furthermore, with respect to certain non-U.S. stockholders, we may be required to withhold U.S. federal income tax with respect to such dividends, including in respect of all or a portion of such dividend that is payable in common stock. If we make a taxable dividend payable in cash and our common stock and a significant number of our stockholders determine to sell shares of our common stock in order to pay taxes owed on dividends, it may put downward pressure on the trading price of our common stock.
Item 2. Unregistered Sales of Equity Securities and Use of Proceeds
There were no sales of unregistered securities of our Company during the three months ended March 31, 2020, other than those previously disclosed in filings with the SEC.
Purchases of Equity Securities by Issuer
The Company did not purchase any of its Class A common stock during the three months ended March 31, 2020.
The Company’s Board of Directors authorized a stock repurchase program (the “Stock Repurchase Program”), under which the Company could repurchase up to $300.0 million of its outstanding Class A common stock until March 31, 2020. On February 18,
2020, the Company’s Board of Directors voted to extend the Stock Repurchase Program through March 31, 2021. Under the Stock Repurchase Program, the Company may repurchase shares in open market purchases, through tender offers or otherwise in accordance with all applicable securities laws and regulations, including Rule 10b-18 of the Securities Exchange Act of 1934, as amended.
Item 3. Defaults Upon Senior Securities
None.
Item 4. Mine Safety Disclosures
Not applicable.
Item 5. Other Information
Bank Credit Facility - Third Amendment to Credit Agreement
On May 6, 2020, the Operating Partnership entered into the Third Amendment and Waiver (the “Amendment”) to that certain Credit Agreement, dated as of February 1, 2018 (as amended, supplemented or otherwise modified from time to time prior to the date hereof, including pursuant to the First Amendment, dated as of November 19, 2018, and the Second Amendment, dated as of December 17, 2018, the “Credit Agreement”), with JPMorgan Chase Bank, N.A., as administrative agent, and the several lenders from time to time party thereto (the “Lenders”). As set forth in further detail below and the Amendment, the Amendment (i) reduces the consolidated tangible net worth covenant from $2.105 billion to $1.5 billion, subject to certain adjustments, (ii) places an incremental limitation on determining maximum borrowing base availability, (iii) reduces the aggregate amount of revolving commitments available under the Credit Agreement from $560 million to $450 million, (iv) removes the Operating Partnership’s option to increase the revolving commitments under the Credit Agreement, and (v) imposes certain other restricted payment and investment limitations.
The Amendment provides that the revolving commitments available under the Credit Agreement shall be reduced upon the consolidated tangible net worth of the Operating Partnership and its consolidated subsidiaries falling below certain thresholds. The Amendment reduces the consolidated tangible net worth covenant from (A) the sum of (i) $2,105,000,000 and (ii) 50% of the proceeds received by Operating Partnership from any offering of its common equity and of the proceeds from any offering by the Company of its common equity to the extent such proceeds are contributed to the Operating Partnership, excluding any such proceeds that are contributed to the Operating Partnership within ninety (90) days of receipt and applied to acquire capital stock of the Operating Partnership to (B) the sum of (i) $1,500,000,000 and (ii) 75% of the proceeds received by the Operating Partnership after the Amendment from any offering of its common equity and of the proceeds from any offering by the Company of its common equity to the extent such proceeds are contributed to the Operating Partnership, excluding any such proceeds that are contributed to the Operating Partnership within 90 days of receipt and applied to acquire capital stock of the Operating Partnership.
The maximum amount available for borrowing under the Credit Agreement at any time is limited by a borrowing base of certain investment assets, with the valuation of such investment assets generally determined according to a percentage of adjusted net book value. Pursuant to the Amendment, the borrowing base availability is reduced from 100% to 90%. If the Operating Partnership elects to extend the initial maturity date beyond February 1, 2022, the borrowing base availability is further reduced to 80%.
Additionally, the Amendment further limits the Operating Partnership’s ability to make restricted payments and certain investments, provided the Operating Partnership and its subsidiaries are permitted to make new investments in senior mortgages that are otherwise customarily eligible for issuance through collateralized loan obligation securitizations to support such collateralized loan obligation securitizations.
No other material terms of the Credit Agreement were changed.
The foregoing summary does not purport to be a complete description and is qualified in its entirety by reference to (i) the Amendment, which is filed as an exhibit to this Form 10-Q, and (ii) the Credit Agreement, as amended, which is filed as exhibits 10.2, 10.3 and 10.4 to the Company’s Annual Report on Form 10-K for the year ended December 31, 2019.
Master Repurchase Facility - Citibank, N.A. - Amendment to Guaranty - Tangible Net Worth Covenant
On April 23, 2018, NSREIT CB Loan, LLC, CB Loan NT-II, LLC, CLNC Credit 3, LLC, and CLNC Credit 4, LLC (collectively, “CB Seller”), each an indirect subsidiary of the Company, entered into a Master Repurchase Agreement (the “Citi Repurchase Agreement”) with Citibank, N.A. (“Citibank”). The Citi Repurchase Agreement provides up to $400.0 million to finance first mortgage loans, senior loan participations and other commercial mortgage loan debt instruments secured by commercial real estate, as described in more detail in the Citi Repurchase Agreement and related ancillary documents.
In connection with the Citi Repurchase Agreement, the Operating Partnership, as guarantor, entered into a Guaranty with Citibank (the “Citi Guaranty”), under which the Operating Partnership agreed to a partial recourse guaranty of CB Seller’s payment and performance obligations under the Citi Repurchase Agreement.
On May 7, 2020, the Operating Partnership and Citibank entered into a First Amendment to Guaranty (the “Citi Guaranty Amendment”), under which Citibank agreed to reduce the minimum consolidated tangible net worth of the Operating Partnership from $2.105 billion to $1.5 billion, plus 75% of the net cash proceeds of any equity issuance thereafter received by the Operating Partnership. The adjusted tangible net worth threshold provides for portfolio management flexibilities as a result of any disruptions in investments caused by COVID-19 or other factors.
The foregoing summary does not purport to be a complete description and is qualified in its entirety by reference to (i) the Citi Guaranty Amendment, which is filed as an exhibit to this Form 10-Q, and (ii) the Citi Repurchase Agreement and the Citi Guaranty, which are filed as exhibits to the Company’s Current Report on Form 8-K filed on April 25, 2018.
Master Repurchase Facility - Barclays Bank PLC - Amendment to Guaranty - Tangible Net Worth Covenant
On April 26, 2018, CLNC Credit 7, LLC (“BB Seller”), an indirect subsidiary of the Company, entered into a Master Repurchase Agreement (the “BB Repurchase Agreement”) with Barclays Bank PLC (“Barclays”). The BB Repurchase Agreement provides up to $500.0 million to finance first mortgage loans, mezzanine loans, senior loan participations and other commercial mortgage loan debt instruments secured by commercial real estate, as described in more detail in the BB Repurchase Agreement and related ancillary documents.
In connection with the BB Repurchase Agreement, the Operating Partnership, as guarantor, entered into a Guaranty with Barclays (the “BB Guaranty”), under which the Operating Partnership agreed to a partial recourse guaranty of BB Seller's payment and performance obligations under the BB Repurchase Agreement.
On May 7, 2020, the Operating Partnership and Barclays entered into an Amendment to Guaranty (the “BB Guaranty Amendment”), under which Barclays agreed to reduce the minimum consolidated tangible net worth of the Operating Partnership from $2.105 billion to $1.5 billion, plus 75% of the net cash proceeds of any equity issuance thereafter received by the Operating Partnership. The adjusted tangible net worth threshold provides for portfolio management flexibilities as a result of any disruptions in investments caused by COVID-19 or other factors.
The foregoing summary does not purport to be a complete description and is qualified in its entirety by reference to (i) the BB Guaranty Amendment, which is filed as an exhibit to this Form 10-Q, and (ii) the BB Repurchase Agreement and the BB Guaranty, which are filed as exhibits to the Company’s Current Report on Form 8-K filed on May 2, 2018.
Master Repurchase Facility - Goldman Sachs Bank USA - Amendment to Guaranty - Tangible Net Worth Covenant
On June 19, 2018, CLNC Credit 6, LLC (“GS Seller”), an indirect subsidiary of the Company, entered into a Master Repurchase Agreement (the “GS Repurchase Agreement”) with Goldman Sachs Bank USA (“Goldman Sachs”). The GS Repurchase Agreement provides up to $250.0 million to finance first mortgage loans, mezzanine loans, senior loan participations and other commercial mortgage loan debt instruments secured by commercial real estate, as described in more detail in the GS Repurchase Agreement and related ancillary documents.
In connection with the GS Repurchase Agreement, the Operating Partnership, as guarantor, entered into a Guaranty with Goldman Sachs (the “GS Guaranty”), under which the Operating Partnership agreed to a partial recourse guaranty of GS Seller’s payment and performance obligations under the GS Repurchase Agreement.
On May 7, 2020, the Operating Partnership and Goldman Sachs entered into an Amendment to Guaranty (the “GS Guaranty Amendment”), under which Goldman Sachs agreed to reduce the minimum consolidated tangible net worth of the Operating Partnership from $2.105 billion to $1.5 billion, plus 75% of the net cash proceeds of any equity issuance thereafter received by the Operating Partnership. The adjusted tangible net worth threshold provides for portfolio management flexibilities as a result of any disruptions in investments caused by COVID-19 or other factors.
The foregoing summary does not purport to be a complete description and is qualified in its entirety by reference to (i) the GS Guaranty Amendment, which is filed as an exhibit to this Form 10-Q, and (ii) the GS Repurchase Agreement and the GS Guaranty, which are filed as exhibits to the Company’s Current Report on Form 8-K filed on June 25, 2018.
Master Repurchase Facility - Deutsche Bank AG - Amendment to Guaranty - Tangible Net Worth Covenant
On October 23, 2018, DB Loan NT-II, LLC, and CLNC Credit 5, LLC (collectively, “DB Seller”), each an indirect subsidiary of the Company, entered into a Master Repurchase Agreement (the “DB Repurchase Agreement”) with Deutsche Bank AG, Cayman Islands Branch (“DB”). The DB Repurchase Agreement provides up to $200.0 million to finance first mortgage loans, senior loan
participations and other commercial mortgage loan debt instruments secured by commercial real estate, as described in more detail in the DB Repurchase Agreement and related ancillary documents.
In connection with the DB Repurchase Agreement, the Operating Partnership, as guarantor, entered into a Guaranty with DB (the “DB Guaranty”), under which the Operating Partnership agreed to a partial recourse guaranty of DB Seller’s payment and performance obligations under the DB Repurchase Agreement.
On May 7, 2020, the Operating Partnership and DB entered into an Amendment to Guaranty (the “DB Guaranty Amendment”), under which DB agreed to reduce the minimum consolidated tangible net worth of the Operating Partnership from $2.105 billion to $1.5 billion, plus 75% of the net cash proceeds of any equity issuance thereafter received by the Operating Partnership. The adjusted tangible net worth threshold provides for portfolio management flexibilities as a result of any disruptions in investments caused by COVID-19 or other factors.
The foregoing summary does not purport to be a complete description and is qualified in its entirety by reference to (i) the DB Guaranty Amendment, which is filed as an exhibit to this Form 10-Q, and (ii) the DB Repurchase Agreement and the DB Guaranty, which are filed as exhibits to the Company’s Current Report on Form 8-K filed on October 25, 2018.
Master Repurchase Facility - Wells Fargo Bank, National Association - Amendment to Guarantee Agreement - Tangible Net Worth Covenant
On November 2, 2018, CLNC Credit 8, LLC (“WLS Seller”), an indirect subsidiary of the Company, entered into a Master Repurchase and Securities Contract (the “WLS Repurchase Agreement”) with Wells Fargo Bank, National Association (“Wells”). The WLS Repurchase Agreement provides up to $300.0 million to finance first mortgage loans, senior loan participations and other commercial mortgage loan debt instruments secured by commercial real estate, as described in more detail in the WLS Repurchase Agreement and related ancillary documents.
In connection with the WLS Repurchase Agreement, the Operating Partnership, as guarantor, entered into a Guarantee Agreement with Wells (the “WLS Guarantee”), under which the Operating Partnership agreed to a partial recourse guaranty of WLS Seller’s payment and performance obligations under the WLS Repurchase Agreement.
On May 7, 2020, the Operating Partnership and Wells entered into an Amendment to Guarantee Agreement (the “WLS Guarantee Amendment”), under which Wells agreed to reduce the minimum consolidated tangible net worth of the Operating Partnership from $2.105 billion to $1.5 billion, plus 75% of the net cash proceeds of any equity issuance thereafter received by the Operating Partnership. The adjusted tangible net worth threshold provides for portfolio management flexibilities as a result of any disruptions in investments caused by COVID-19 or other factors.
The foregoing summary does not purport to be a complete description and is qualified in its entirety by reference to (i) the WLS Guarantee Amendment, which is filed as an exhibit to this Form 10-Q, and (ii) the WLS Repurchase Agreement and the WLS Guarantee, which are filed as exhibits to the Company’s Current Report on Form 8-K filed on October 25, 2018.
Master Repurchase Facility - Morgan Stanley Bank, N.A. - Omnibus Amendment to Transaction Documents - Tangible Net Worth Covenant
On April 23, 2019, MS Loan NT-I, LLC, MS Loan NT-II, LLC, CLNC Credit 1, LLC, CLNC Credit 2, LLC, CLNC Credit 1EU, LLC and CLNC Credit 1UK, LLC (collectively, “MS Seller”), each an indirect subsidiary of the Company, entered into a Second Amended and Restated Master Repurchase and Securities Contract Agreement (the “MS Repurchase Agreement”) with Morgan Stanley Bank, N.A. (“Morgan Stanley”). As described in more detail in the Repurchase Agreement documentation, the Repurchase Agreement provides up to $600.0 million to finance first mortgage loans, senior loan participations and other commercial mortgage loan debt instruments secured by commercial real estate: $500 million for commercial real estate that may be located in the United States, and $100 million for commercial real estate that may be located in Belgium, France, Germany, Ireland, Luxembourg, the Netherlands, the United Kingdom, Spain, or any other jurisdiction approved by Morgan Stanley. The transactions contemplated under the Repurchase Agreement may be denominated in U.S. Dollars, Pounds Sterling, Euro or any other currency approved by Morgan Stanley.
In connection with the MS Repurchase Agreement, the Operating Partnership, as guarantor, MS Seller and Morgan Stanley entered into a Ratification, Reaffirmation and Confirmation of Transaction Documents (the “MS Ratification Agreement”), which ratified the Operating Partnership’s obligations under an Amended and Restated Guaranty Agreement with Morgan Stanley (the “MS Guaranty”), under which the Operating Partnership agreed to a partial recourse guaranty of MS Seller’s payment and performance obligations under the MS Repurchase Agreement.
On May 7, 2020, the Operating Partnership and Morgan Stanley entered into an Omnibus Amendment to Transaction Documents (the “MS TNW Amendment”), under which Morgan Stanley agreed to reduce the minimum consolidated tangible net worth of the Operating Partnership from $2.105 billion to $1.5 billion, plus 75% of the net cash proceeds of any equity issuance thereafter
received by the Operating Partnership. The adjusted tangible net worth threshold provides for portfolio management flexibilities as a result of any disruptions in investments caused by COVID-19 or other factors.
The foregoing summary does not purport to be a complete description and is qualified in its entirety by reference to (i) the MS TNW Amendment, which is filed as an exhibit to this Form 10-Q, (ii) the MS Repurchase Agreement and MS Ratification Agreement, which are filed as exhibits to the Company’s Current Report on Form 8-K filed on April 26, 2019, and (iii) the MS Guaranty, which is filed as an exhibit to the Company’s Current Report on Form 8-K filed on April 25, 2018.
Item 6. Exhibits
EXHIBIT INDEX
|
| | |
| Exhibit Number | | Description of Exhibit |
| 2.1 | | Amended and Restated Master Combination Agreement, dated as of November 20, 2017, among Colony Capital Operating Company, LLC, NRF RED REIT Corp., NorthStar Real Estate Income Trust, Inc., NorthStar Real Estate Income Trust Operating Partnership, LP, NorthStar Real Estate Income II, Inc., NorthStar Real Estate Income Operating Partnership II, LP, Colony NorthStar Credit Real Estate, Inc. and Credit RE Operating Company, LLC (incorporated by reference to Exhibit 2.1 to the Company’s Registration Statement on Form S-4 (No. 333-221685) effective December 6, 2017) |
| 3.1 | | |
| 3.2 | | |
| 10.1* | | First Omnibus Amendment, dated as of February 14, 2020, to the Second Amended and Restated Master Repurchase and Securities Contract Agreement, dated as of April 23, 2019, by and among MS Loan NT-I, LLC, MS Loan NT-II, LLC, CLNC Credit 1, LLC, CLNC Credit 2, LLC, CLNC Credit 1EU, LLC, CLNC Credit 1UK, LLC and Morgan Stanley Bank, N.A. |
| 10.2* | | Third Amendment and Waiver, dated as of May 6, 2020, to Credit Agreement, dated as of February 1, 2018, among Credit RE Operating Company, LLC, the several lenders from time to time parties thereto and JPMorgan Chase Bank, N.A., as administrative agent |
| 10.3* | | |
| 10.4* | | |
| 10.5* | | |
| 10.6* | | |
| 10.7* | | |
| 10.8* | | |
| 31.1* | | |
| 31.2* | | |
| 32.1* | | |
| 32.2* | | |
| 101.INS* | | XBRL Instance Document - the instance document does not appear in the Interactive Data File because its XBRL tags are embedded within the Inline XBRL document |
| 101.SCH* | | Inline XBRL Taxonomy Extension Schema Document |
| 101.CAL* | | Inline XBRL Taxonomy Extension Calculation Linkbase Document |
| 101.DEF* | | Inline XBRL Taxonomy Extension Definition Linkbase Document |
| 101.LAB* | | Inline XBRL Taxonomy Extension Label Linkbase Document |
| 101.PRE* | | Inline XBRL Taxonomy Extension Presentation Linkbase Document |
| 104 | | Cover Page Interactive Data File (formatted as Inline XBRL and contained in Exhibit 101) |
______________________________________
* Filed herewith
SIGNATURES
Pursuant to the requirements of Section 13 or 15(d) of the Securities Exchange Act of 1934, the Registrant has duly caused this report to be signed on its behalf by the undersigned thereunto duly authorized.
Dated: May 8, 2020
|
| | |
| COLONY CREDIT REAL ESTATE, INC. |
| | | |
| By: | | /s/ Michael J. Mazzei |
| | | Michael J. Mazzei |
| | | Chief Executive Officer and President |
| | | (Principal Executive Officer) |
| | | |
| By: | | /s/ Neale W. Redington |
| | | Neale W. Redington |
| | | Chief Financial Officer (Principal Financial Officer) |
| | | |
| By: | | /s/ Frank V. Saracino |
| | | Frank V. Saracino |
| | | Chief Accounting Officer (Principal Accounting Officer) |