| FREE WRITING PROSPECTUS | ||
| FILED PURSUANT TO RULE 433 | ||
| REGISTRATION FILE NO.: 333-207340-05 | ||
October 20, 2017 FREE WRITING PROSPECTUS COLLATERAL TERM SHEET $743,403,651 (Approximate Total Mortgage Pool Balance) UBS 2017-C5 UBS Commercial Mortgage Securitization Corp.DepositorUBS AG Cantor Commercial Real Estate Lending, L.P. Ladder Capital Finance LLC Natixis Real Estate Capital LLC Société Générale Rialto Mortgage Finance, LLC Sponsors and Mortgage Loan Sellers UBS Securities LLC Cantor Fitzgerald & Co. Société Générale Co-Lead Managers and Joint Bookrunners NATIXIS Academy Securities Co-Managers The depositor has filed a registration statement (including a prospectus) with the Securities and Exchange Commission (’’SEC’’) (SEC File No. 333-207340) for the offering to which this communication relates. Before you invest, you should read the prospectus in the registration statement and other documents the depositor has filed with the SEC for more complete information about the depositor, the issuing entity and this offering. You may get these documents for free by visiting EDGAR on the SEC Web site at www.sec.gov. Alternatively, the depositor, any underwriter, or any dealer participating in the offering will arrange to send you the prospectus after filing if you request it by calling toll free 1-877-713-1030 (8 a.m. – 5 p.m. EST). The Offered Certificates referred to in these materials and the asset pool backing them are subject to modification or revision (including the possibility that one or more classes of certificates may be split, combined or eliminated at any time prior to issuance or availability of a final prospectus) and are offered on a “when, as and if issued” basis.
STATEMENT REGARDING THIS FREE WRITING PROSPECTUS
Nothing in this document constitutes an offer of securities for sale in any jurisdiction where the offer or sale is not permitted. The information contained herein is preliminary as of the date hereof, supersedes any such information previously delivered to you and will be superseded by any such information subsequently delivered prior to the time of sale and ultimately by the final prospectus relating to the offered certificates. These materials are subject to change, completion, supplement or amendment from time to time.
This free writing prospectus has been prepared by the underwriters for information purposes only and does not constitute, in whole or in part, a prospectus for the purposes of Directive 2003/71/EC (as amended) and/or Part VI of the Financial Services and Markets Act 2000, as amended, or other offering document.
STATEMENT REGARDING ASSUMPTIONS AS TO SECURITIES, PRICING ESTIMATES AND OTHER INFORMATION
This free writing prospectus contains certain forward-looking statements. If and when included in this free writing prospectus, the words “expects”, “intends”, “anticipates”, “estimates” and analogous expressions and all statements that are not historical facts, including statements about our beliefs or expectations, are intended to identify forward-looking statements. Any forward-looking statements are made subject to risks and uncertainties which could cause actual results to differ materially from those stated. Those risks and uncertainties include, among other things, declines in general economic and business conditions, increased competition, changes in demographics, changes in political and social conditions, regulatory initiatives and changes in customer preferences, many of which are beyond our control and the control of any other person or entity related to this offering. The forward- looking statements made in this free writing prospectus are made as of the date stated on the cover. We have no obligation to update or revise any forward-looking statement.
The attached information contains certain tables and other statistical analyses (the “Computational Materials”) that have been prepared in reliance upon information furnished by the Mortgage Loan Sellers. Numerous assumptions were used in preparing the Computational Materials, which may or may not be reflected herein. As such, no assurance can be given as to the Computational Materials’ accuracy, appropriateness or completeness in any particular context; or as to whether the Computational Materials and/or the assumptions upon which they are based reflect present market conditions or future market performance. The Computational Materials should not be construed as either projections or predictions or as legal, tax, financial or accounting advice. You should consult your own counsel, accountant and other advisors as to the legal, tax, business, financial and related aspects of a purchase of the offered certificates. Any weighted average lives, yields and principal payment periods shown in the Computational Materials are based on prepayment and/or loss assumptions, and changes in such prepayment and/or loss assumptions may dramatically affect such weighted average lives, yields and principal payment periods. In addition, it is possible that prepayments or losses on the underlying assets will occur at rates higher or lower than the rates shown in the attached Computational Materials. The specific characteristics of the offered certificates may differ from those shown in the Computational Materials due to differences between the final underlying assets and the preliminary underlying assets used in preparing the Computational Materials. The principal amount and designation of any security described in the Computational Materials are subject to change prior to issuance. None of UBS Securities LLC, Cantor Fitzgerald & Co., SG Americas Securities, LLC, Natixis Securities Americas LLC or Academy Securities, Inc., or any of their respective affiliates, make any representation or warranty as to the actual rate or timing of payments or losses on any of the underlying assets or the payments or yield on the offered certificates. The information in this presentation is based upon management forecasts and reflects prevailing conditions and management’s views as of this date, all of which are subject to change. In preparing this presentation, we have relied upon and assumed, without independent verification, the accuracy and completeness of all information available from public sources or which was provided to us by or on behalf of the Mortgage Loan Sellers or which was otherwise reviewed by us.
IMPORTANT NOTICE REGARDING THE OFFERED CERTIFICATES
The offered certificates described herein are not suitable investments for all investors. In particular, you should not purchase any class of offered certificates unless you understand and are able to bear the prepayment, credit, liquidity and market risks associated with such class of certificates. For those reasons and for the reasons set forth under the heading “Risk Factors” in the Preliminary Prospectus, the yield to maturity and the aggregate amount and timing of distributions on the offered certificates are subject to material variability from period to period and give rise to the potential for significant loss over the life of such certificates. The interaction of these factors and their effects are impossible to predict and are likely to change from time to time. As a result, an investment in the offered certificates involves substantial risks and uncertainties and should be considered only by sophisticated institutional investors with substantial investment experience with similar types of securities and who have conducted appropriate due diligence on the mortgage loans and the certificates. Potential investors are advised and encouraged to review the Preliminary Prospectus in full and to consult with their legal, tax, accounting and other advisors prior to making any investment in the offered certificates described in this free writing prospectus.
This free writing prospectus is not to be construed as an offer to sell or the solicitation of any offer to buy any security in any jurisdiction where such an offer or solicitation would be illegal. The information contained in this free writing prospectus may not pertain to any securities that will actually be sold. The information contained in this free writing prospectus may be based on assumptions regarding market conditions and other matters as reflected in this free writing prospectus. We make no representations regarding the reasonableness of such assumptions or the likelihood that any of such assumptions will coincide with actual market conditions or events, and this free writing prospectus should not be relied upon for such purposes. The Underwriters and their respective affiliates, officers, directors, partners and employees, including persons involved in the preparation or issuance of this free writing prospectus may, from time to time, have long or short positions in, and buy or sell, the offered certificates mentioned in this free writing prospectus or derivatives thereof (including options). Information contained in this free writing prospectus is current as of the date appearing on this free writing prospectus only. None of UBS Securities LLC, Cantor Fitzgerald & Co., SG Americas Securities, LLC, Natixis Securities Americas LLC or Academy Securities, Inc. provides accounting, tax or legal advice.
THE INFORMATION IN THIS COLLATERAL TERM SHEET IS NOT COMPLETE AND MAY BE AMENDED PRIOR TO THE TIME OF SALE. THIS TERM SHEET IS NOT AN OFFER TO SELL THESE SECURITIES AND IT IS NOT A SOLICITATION OF AN OFFER TO BUY THESE SECURITIES IN ANY JURISDICTION WHERE THE OFFER OR SALE IS NOT PERMITTED.
2
The issuing entity will be relying upon an exclusion or exemption from the definition of “investment company” under the Investment Company Act of 1940, as amended (the “Investment Company Act”), contained in Section 3(c)(5) of the Investment Company Act or Rule 3a-7 under the Investment Company Act, although there may be additional exclusions or exemptions available to the issuing entity. The issuing entity is being structured so as not to constitute a “covered fund” for purposes of the Volcker Rule under the Dodd-Frank Act (both as defined in “Risk Factors—Other Risks Relating to the Certificates—Legal and Regulatory Provisions Affecting Investors Could Adversely Affect the Liquidity of the Offered Certificates” in the Preliminary Prospectus). See also “Legal Investment” in the Preliminary Prospectus.
The information contained herein supersedes any previous such information delivered to any prospective investor and will be superseded by information delivered to such prospective investor prior to the time of sale.
IMPORTANT NOTICE RELATING TO AUTOMATICALLY-GENERATED EMAIL DISCLAIMERS
Any legends, disclaimers or other notices that may appear at the bottom of any email communication to which this free writing prospectus is attached relating to (1) these materials not constituting an offer (or a solicitation of an offer), (2) any representation that these materials are accurate or complete and may not be updated or (3) these materials possibly being confidential, are not applicable to these materials and should be disregarded. Such legends, disclaimers or other notices have been automatically generated as a result of these materials having been sent via Bloomberg or another system.
THE INFORMATION IN THIS COLLATERAL TERM SHEET IS NOT COMPLETE AND MAY BE AMENDED PRIOR TO THE TIME OF SALE. THIS TERM SHEET IS NOT AN OFFER TO SELL THESE SECURITIES AND IT IS NOT A SOLICITATION OF AN OFFER TO BUY THESE SECURITIES IN ANY JURISDICTION WHERE THE OFFER OR SALE IS NOT PERMITTED.
3
UBS 2017-C5
Capitalized terms used but not defined herein have the meanings assigned to them in the preliminary prospectus expected to be dated October 25, 2017 relating to the offered certificates (hereinafter referred to as the “Preliminary Prospectus”).
| KEY FEATURES OF SECURITIZATION |
| Offering Terms: | |
| Co-Lead Managers and Joint Bookrunners: | UBS Securities LLC Cantor Fitzgerald & Co.
|
| Co-Managers: | Natixis Securities Americas LLC Academy Securities, Inc. |
| Mortgage Loan Sellers: | UBS AG, by and through its branch office at 1285 Avenue of the Americas, New York, New York (“UBS AG”) 37.6%, Cantor Commercial Real Estate Lending, L.P. (“CCRE”) 18.4%, Ladder Capital Finance LLC (“LCF”) 14.9%, Natixis Real Estate Capital LLC (“Natixis”) 11.0%, Société Générale (“SG”) 10.6%, Rialto Mortgage Finance, LLC (“RMF”) 7.5% |
| Master Servicer: | Midland Loan Services, a Division of PNC Bank, National Association |
| Operating Advisor: | Park Bridge Lender Services LLC |
| Asset Representations Reviewer: | Park Bridge Lender Services LLC |
| Special Servicer: | Midland Loan Services, a Division of PNC Bank, National Association |
| Trustee: | Wells Fargo Bank, National Association |
| Certificate Administrator: | Wells Fargo Bank, National Association |
| Rating Agencies: | Fitch Ratings, Inc., Kroll Bond Rating Agency, Inc., Moody’s Investors Service, Inc. and S&P Global Ratings, Inc. |
| U.S. Credit Risk Retention: | UBS AG is expected to act as the“retaining sponsor”for this securitization and intends to satisfy the U.S. credit risk retention requirement through the purchase by KKR Real Estate Credit Opportunity Partners Aggregator I L.P., as a third party purchaser (as defined in Regulation RR), from the initial purchasers, on the Closing Date, of an “eligible horizontal residual interest”. The aggregate estimated fair value of the “eligible horizontal residual interest” will equal at least 5% of this estimated fair value of all of the Certificates (other than the Class R certificates) issued by the issuing entity. The pooling and servicing agreement will include the required provisions applicable to an operating advisor necessary for the securitization to comply with the credit risk retention rules utilizing the “third party purchaser” option. See “Operating Advisor” below. For additional information, see “Credit Risk Retention” below. |
| EU Credit Risk Retention: | The transaction is not structured to satisfy the EU risk retention and due diligence requirements. |
| Determination Date: | The 11th day of each month, or if such 11th day is not a business day, the succeeding business day, commencing in December 2017. |
| Distribution Date: | The 4th business day following the Determination Date in each month, commencing in December 2017. |
| Cut-off Date: | The mortgage loans will be considered part of the trust fund as of their respective cut-off dates. The cut-off date with respect to each mortgage loan is the respective due date for the monthly debt service payment that is due in November 2017 (or, in the case of any mortgage loan that has its first due date after November 2017, the date that would have been its due date in November 2017 under the terms of that mortgage loan if a monthly debt service payment were scheduled to be due in that month). |
| Closing Date: | On or about November 8, 2017 |
| Clean-up Call: | 1.0%
|
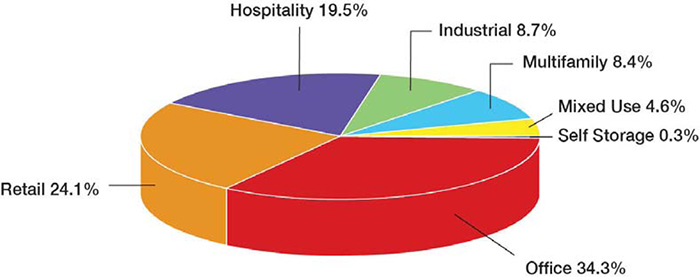
| Distribution of Collateral by Property Type | |
THE INFORMATION IN THIS COLLATERAL TERM SHEET IS NOT COMPLETE AND MAY BE AMENDED PRIOR TO THE TIME OF SALE. THIS TERM SHEET IS NOT AN OFFER TO SELL THESE SECURITIES AND IT IS NOT A SOLICITATION OF AN OFFER TO BUY THESE SECURITIES IN ANY JURISDICTION WHERE THE OFFER OR SALE IS NOT PERMITTED.
4
UBS 2017-C5
| TRANSACTION HIGHLIGHTS |
| Mortgage Loan Sellers | Number of Mortgage Loans | Number of Mortgaged Properties | Aggregate Cut-off Date Balance | % of Outstanding Pool Balance(1) |
| UBS AG | 17 | 56 | $279,553,812 | 37.6% |
| Cantor Commercial Real Estate Lending, L.P. | 11 | 12 | $136,465,789 | 18.4% |
| Ladder Capital Finance LLC | 7 | 24 | $111,094,306 | 14.9% |
| Natixis Real Estate Capital LLC | 4 | 14 | $81,722,688 | 11.0% |
| Société Générale | 4 | 19 | $78,550,000 | 10.6% |
| Rialto Mortgage Finance, LLC | 6 | 6 | $56,017,057 | 7.5% |
| Total | 49 | 131 | $743,403,651 | 100.0% |
| Pooled Collateral Facts: | |
| Initial Outstanding Pool Balance: | $743,403,651 |
| Number of Mortgage Loans: | 49 |
| Number of Mortgaged Properties: | 131 |
| Average Mortgage Loan Cut-off Date Balance: | $15,171,503 |
| Average Mortgaged Property Cut-off Date Balance: | $5,674,837 |
| Weighted Average Mortgage Rate: | 4.346% |
| Weighted Average Mortgage Loan Original Term to Maturity Date or ARD (months): | 110 |
| Weighted Average Mortgage Loan Remaining Term to Maturity Date or ARD (months): | 108 |
| Weighted Average Mortgage Loan Seasoning (months): | 2 |
| % of Mortgaged Properties Leased to a Single Tenant: | 24.0% |
| % of Mortgaged Properties Leased to a Single Tenant Excluding Portfolio(2): | 6.4% |
| Credit Statistics: | |
| Weighted Average Mortgage Loan U/W NCF DSCR(3): | 2.37x |
| Weighted Average Mortgage Loan Cut-off Date LTV(3)(4): | 54.6% |
| Weighted Average Mortgage Loan Maturity Date or ARD LTV(3)(4): | 49.6% |
| Weighted Average U/W NOI Debt Yield(3): | 12.2% |
| Amortization Overview: | |
| % Mortgage Loans with Amortization through Maturity Date or ARD: | 28.7% |
| % Mortgage Loans which pay Interest Only through Maturity Date or ARD: | 44.8% |
| % Mortgage Loans which pay Interest Only followed by Amortization through Maturity Date or ARD: | 26.5% |
| Weighted Average Remaining Amortization Term (months)(5): | 354 |
| (1) | Unless otherwise indicated, all references to “% of Outstanding Pool Balance” in this Term Sheet reflect a percentage of the aggregate principal balance of the mortgage pool as of the Cut-off Date, after application of all payments of principal due during or prior to November 2017. |
| (2) | Excludes mortgage loans secured by multiple properties leased to the same tenant. |
| (3) | With respect to any mortgage loan that is part of a whole loan, unless otherwise indicated, LTV, DSCR and Debt Yield calculations in this Term Sheet include any related pari passu companion loans and exclude any subordinate companion loans, as applicable. Additionally, LTV, DSCR and Debt Yield figures in this Term Sheet are calculated for mortgage loans without regard to any additional indebtedness that may be incurred at a future date. |
| (4) | With respect to mortgage loan secured by the mortgaged property identified on Annex A-1 to the Preliminary Prospectus as the 237 Park Avenue, the Cut-off Date LTV and Maturity Date LTV has been calculated based on the “As-Is Assuming Reserves” value of $1,310,000,000 as of May 22, 2017, which assumes upfront reserves of $81,365,605 for capital expenditures and tenant improvements and leasing costs for recently signed leases in addition to a $7,500,000 escrow and letters of credit in an aggregate amount of $8,500,000 to cover interest and free rent payments, specifically for a portion of the free rent provided to The New York and Presbyterian Hospital and Her Majesty the Queen in Right of Canada spaces. With respect to the AHIP Northeast Portfolio III Mortgage Loan, the Cut-off Date LTV Ratio and Maturity Date LTV is based on the Appraised Value of $87.5 million, which assumes the “As-Complete” appraised value as of June 1, 2018 for the Fairfield Inn & Suites Baltimore – White Marsh Mortgaged Property, the SpringHill Suites – Bellport Mortgaged Property and the Hampton Inn Baltimore – White Marsh Mortgaged Property, and June 1, 2019 for the Homewood Suites – Egg Harbor Mortgaged Property. The Cut-off Date LTV Ratio and LTV Ratio at Maturity or ARD with respect to the Mortgage Loan based on the aggregate $82.5 million “As-Is” appraised value is 63.5% and 58.2%, respectively. With respect to the mortgage loan secured by the mortgaged property identified on Annex A-1 to the Preliminary Prospectus as DoubleTree Wilmington, the Cut-off Date LTV and Maturity Date LTV has been calculated based on the “As-Complete” value of $42.4 million as of September 20, 2018, which assumes the completion of a Property Improvement Plan which has been reserved for. The Cut-off Date LTV Ratio and LTV Ratio at Maturity or ARD based on the $37.0 million “As-Is” appraised value are 74.3% and 61.5%, respectively. With respect to the mortgage loan secured by the mortgaged property identified on Annex A-1 to the Preliminary Prospectus as Holiday Inn Express Tallahassee, the Cut-off Date LTV and Maturity Date LTV has been calculated based on the “Upon Completion” value of $14,000,000 as of April 1, 2018, which assumes the completion of a Property Improvement Plan (“PIP”). At origination, the borrower deposited $1,034,000 into a PIP reserve to cover the cost of such PIP. The Cut-off Date LTV Ratio and LTV Ratio at Maturity or ARD based on the $13.0 million “As-Is” appraised value are 71.9% and 54.3%, respectively. For additional information, see “Description of the Mortgage Pool—Mortgage Pool Characteristics – Appraised Value” in the Preliminary Prospectus and the footnotes to Annex A-1 in the Preliminary Prospectus. |
| (5) | Excludes mortgage loans that are interest-only for the full loan term. |
THE INFORMATION IN THIS COLLATERAL TERM SHEET IS NOT COMPLETE AND MAY BE AMENDED PRIOR TO THE TIME OF SALE. THIS TERM SHEET IS NOT AN OFFER TO SELL THESE SECURITIES AND IT IS NOT A SOLICITATION OF AN OFFER TO BUY THESE SECURITIES IN ANY JURISDICTION WHERE THE OFFER OR SALE IS NOT PERMITTED.
5
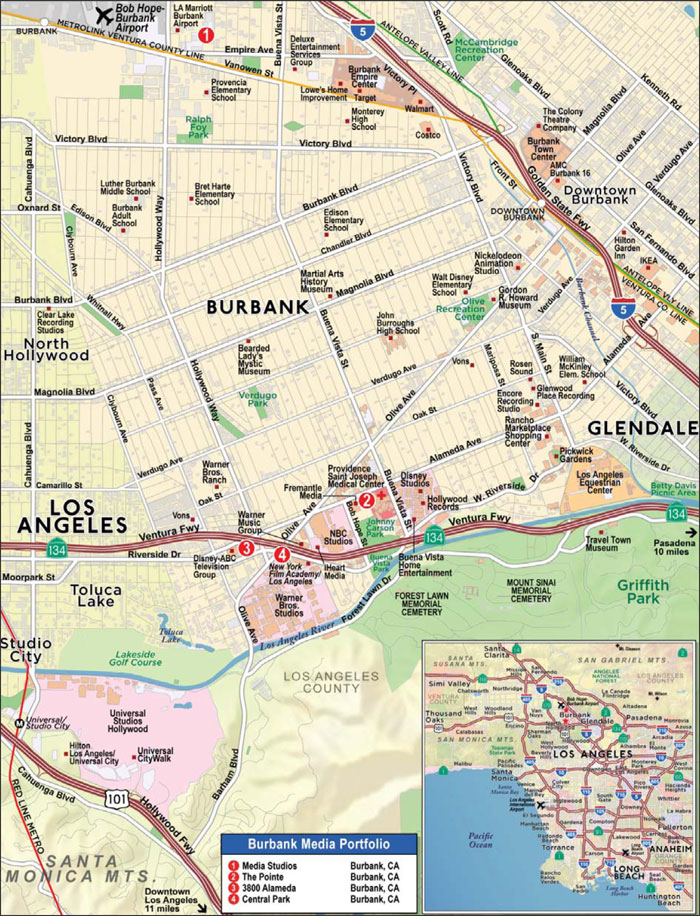
| Burbank, CA | Collateral Asset Summary – Loan No. 1 Burbank Office Portfolio
| Cut-off Date Balance: Cut-off Date LTV Ratio: UW NCF DSCR: UW NOI Debt Yield: | $40,000,000 36.5% 4.64x 18.1% |
THE INFORMATION IN THIS COLLATERAL TERM SHEET IS NOT COMPLETE AND MAY BE AMENDED PRIOR TO THE TIME OF SALE. THIS TERM SHEET IS NOT AN OFFER TO SELL THESE SECURITIES AND IT IS NOT A SOLICITATION OF AN OFFER TO BUY THESE SECURITIES IN ANY JURISDICTION WHERE THE OFFER OR SALE IS NOT PERMITTED.
6
| Burbank, CA | Collateral Asset Summary – Loan No. 1 Burbank Office Portfolio
| Cut-off Date Balance: Cut-off Date LTV Ratio: UW NCF DSCR: UW NOI Debt Yield: | $40,000,000 36.5% 4.64x 18.1% |
THE INFORMATION IN THIS COLLATERAL TERM SHEET IS NOT COMPLETE AND MAY BE AMENDED PRIOR TO THE TIME OF SALE. THIS TERM SHEET IS NOT AN OFFER TO SELL THESE SECURITIES AND IT IS NOT A SOLICITATION OF AN OFFER TO BUY THESE SECURITIES IN ANY JURISDICTION WHERE THE OFFER OR SALE IS NOT PERMITTED.
7
| Burbank, CA | Collateral Asset Summary – Loan No. 1 Burbank Office Portfolio
| Cut-off Date Balance: Cut-off Date LTV Ratio: UW NCF DSCR: UW NOI Debt Yield: | $40,000,000 36.5% 4.64x 18.1% |
THE INFORMATION IN THIS COLLATERAL TERM SHEET IS NOT COMPLETE AND MAY BE AMENDED PRIOR TO THE TIME OF SALE. THIS TERM SHEET IS NOT AN OFFER TO SELL THESE SECURITIES AND IT IS NOT A SOLICITATION OF AN OFFER TO BUY THESE SECURITIES IN ANY JURISDICTION WHERE THE OFFER OR SALE IS NOT PERMITTED.
8
| Burbank, CA | Collateral Asset Summary – Loan No. 1 Burbank Office Portfolio
| Cut-off Date Balance: Cut-off Date LTV Ratio: UW NCF DSCR: UW NOI Debt Yield: | $40,000,000 36.5% 4.64x 18.1% |
| Mortgage Loan Information | Property Information | |||||||
| Mortgage Loan Seller(1): | UBS AG | Single Asset/Portfolio: | Portfolio | |||||
| Credit Assessment (Fitch/KBRA/Moody’s/S&P): | [ ] | Location: | Burbank, CA | |||||
| General Property Type: | Office | |||||||
| Original Balance(2): | $40,000,000 | Detailed Property Type: | CBD | |||||
| Cut-off Date Balance(2): | $40,000,000 | Title Vesting: | Fee | |||||
| % of Initial Pool Balance: | [.]% | Year Built/Renovated: | Various | |||||
| Loan Purpose: | Acquisition | Size: | 2,087,579 SF | |||||
| Borrower Sponsors: | Blackstone Property Partners; The Worthe Real Estate Group, Inc. | Cut-off Date Balance per SF(2): | $182 | |||||
| Maturity Date Balance per SF(2): | $182 | |||||||
| Mortgage Rate: | 3.5410% | Property Manager:
| The Worthe Real Estate Group, Inc. (borrower-related)
| |||||
| Note Date: | 9/19/2017 | |||||||
| First Payment Date: | 11/6/2017 | |||||||
| Maturity Date: | 10/6/2024 | |||||||
| Original Term to Maturity: | 84 months | |||||||
| Original Amortization Term: | 0 months | |||||||
| IO Period: | 84 months | |||||||
| Seasoning: | 1 month | Underwriting and Financial Information | ||||||
| Prepayment Provisions(3): | YM0.5 (25); DEF/YM0.5 (52); O (7) | UW NOI(6): | $68,486,656 | |||||
| Lockbox/Cash Mgmt Status: | Hard/Springing | UW NOI Debt Yield(2): | 18.1% | |||||
| Additional Debt Type(2)(4): | Pari Passu/Subordinate Debt | UW NOI Debt Yield at Maturity(2): | 18.1% | |||||
| Additional Debt Balance(2)(4): | $339,000,000/$281,000,000 | UW NCF DSCR(2): | 4.64x | |||||
| Future Debt Permitted (Type): | No (N/A) | Most Recent NOI(6): | $54,023,848 (6/30/2017 TTM) | |||||
| Reserves(5) | 2nd Most Recent NOI(6): | $44,798,547 (12/31/2016) | ||||||
| Type | Initial | Monthly | Cap | 3rd Most Recent NOI(6): | $34,442,280 (12/31/2015) | |||
| RE Tax: | $0 | Springing | N/A | Most Recent Occupancy(7): | 92.4% (8/31/2017) | |||
| Insurance: | $0 | Springing | N/A | 2nd Most Recent Occupancy: | 88.8% (12/31/2016) | |||
| Replacements: | $0 | Springing | N/A | 3rd Most Recent Occupancy: | 88.4% (12/31/2015) | |||
| TI/LC: | $14,151,048 | Springing | N/A | Appraised Value (as of): | $1,038,000,000 (8/24/2017) | |||
| Window Repairs Reserve: | $18,000,000 | $0 | N/A | Cut-off Date LTV Ratio(2): | 36.5% | |||
| Free Rent Reserve: | $3,617,000 | Springing | N/A | Maturity Date LTV Ratio(2): | 36.5% | |||
| Sources and Uses | ||||||
| Sources | Proceeds | % of Total | Uses | Proceeds | % of Total | |
| Loan Amount(2): | $660,000,000 | 63.5% | Purchase Price: | $1,027,500,000 | 98.9% | |
| Borrower Equity: | $378,783,040 | 36.5% | Reserves: | $35,768,047 | 3.4% | |
| Prorations(8): | ($42,173,543) | (4.1%) | ||||
| Closing Costs: | $17,688,535 | 1.7% | ||||
| Total Sources: | $1,038,783,040 | 100.0% | Total Uses: | $1,038,783,039 | 100.0% | |
| (1) | The Burbank Office Portfolio Whole Loan (as defined below) was co-originated by Deutsche Bank AG, New York Branch and UBS AG. |
| (2) | The Burbank Office Portfolio Mortgage Loan (as defined below) is part of the Burbank Office Portfolio Whole Loan, which is comprised of ninepari passusenior promissory notes with an aggregate principal balance of $379,000,000 and two subordinate promissory notes with an aggregate principal balance of $281,000,000. The Cut-off Date Balance per SF, Maturity Date Balance per SF, UW NOI Debt Yield, UW NOI Debt Yield at Maturity, UW NCF DSCR, Cut-off Date LTV Ratio and Maturity Date LTV Ratio presented above are based on the aggregate principal balance of the promissory notes comprising the Burbank Office Portfolio Senior Loan, without regard to the Burbank Office Portfolio Subordinate Companion Loans (as defined below). The Cut-off Date Balance per SF, Maturity Date Balance per SF, UW NOI Debt Yield, UW NOI Debt Yield at Maturity, UW NCF DSCR, Cut-off Date LTV Ratio and Maturity Date LTV Ratio numbers based on the entire $660,000,000 Burbank Office Portfolio Whole Loan are $316, $316, 10.4%, 10.4%, 2.67x, 63.6% and 63.6%, respectively. |
| (3) | Prior to the open prepayment date of April 6, 2024, the Burbank Office Portfolio Whole Loan can be prepaid with (i) defeasance after the earlier to occur of (a) November 6, 2020 and (b) the first monthly payment date following the end of the two-year period commencing on the closing date of the securitization of the last Burbank Office Portfolio Whole Loan promissory note or (ii) yield maintenance. Partial release is permitted. See “Release of Property” below for further discussion of release requirements. |
| (4) | See “The Mortgage Loan” and “Additional Secured Indebtedness (not including trade debts)” below for further discussion of additional debt. |
| (5) | See “Escrows and Reserves” below for further discussion of reserve requirements. |
| (6) | The increase in UW NOI over historical periods is primarily driven by the expiration of rent abatements, recently executed leases and leases going into effect. See “Cash Flow Analysis” for further discussion of historical operating performance. |
| (7) | Includes Lopez Accounting Group (552 SF), which took occupancy at the Central Park Property on September 1, 2017, and Turner Broadcasting (5,435 SF), which has a rent commencement date of January 1, 2018. |
| (8) | Includes credits for rent and parking abatements, leasing costs, capital improvements that are the responsibility of certain separate joint ventures comprised of affiliates of The Worthe Real Estate Group, Inc. and certain third parties, balance sheet cash purchased by the borrower sponsors and prorations for rents, taxes, operating expenses and security deposits. |
THE INFORMATION IN THIS COLLATERAL TERM SHEET IS NOT COMPLETE AND MAY BE AMENDED PRIOR TO THE TIME OF SALE. THIS TERM SHEET IS NOT AN OFFER TO SELL THESE SECURITIES AND IT IS NOT A SOLICITATION OF AN OFFER TO BUY THESE SECURITIES IN ANY JURISDICTION WHERE THE OFFER OR SALE IS NOT PERMITTED.
9
| Burbank, CA | Collateral Asset Summary – Loan No. 1 Burbank Office Portfolio
| Cut-off Date Balance: Cut-off Date LTV Ratio: UW NCF DSCR: UW NOI Debt Yield: | $40,000,000 36.5% 4.64x 18.1% |
The Mortgage Loan. The largest mortgage loan (the “Burbank Office Portfolio Mortgage Loan”) is part of a whole loan (the “Burbank Office Portfolio Whole Loan”) with an original principal balance of $660,000,000. The Burbank Office Portfolio Whole Loan is secured by the first priority fee mortgages encumbering a four-property portfolio of office developments totaling 2,087,579 SF located in Burbank, California within the Burbank Media District (collectively, the “Burbank Office Portfolio Properties”). The Burbank Office Portfolio Whole Loan was co-originated by UBS AG, by and through its branch office at 1285 Avenue of the Americas, New York, New York (“UBS AG”) and Deutsche Bank AG, New York Branch (“DBNY”). The Burbank Office Portfolio Whole Loan is comprised of (i) a senior loan, evidenced by nine seniorpari passunotes, with an aggregate outstanding principal balance of $379,000,000 (collectively, the “Burbank Office Portfolio Senior Loan”) and (ii) a subordinate companion loan, evidenced by two subordinate notes, with an aggregate outstanding principal balance of $281,000,000 (the “Burbank Office Portfolio Subordinate Companion Loans”), each as described below. Promissory Notes A-2-C1-A and A-2-C2-C, with an aggregate outstanding principal balance of $40,000,000, represents the Burbank Office Portfolio Mortgage Loan and will be included in the UBS 2017-C5 Trust. Promissory Notes A-1-S and A-2-S, with an aggregate outstanding principal balance of $179,000,000, and the Burbank Office Portfolio Subordinate Companion Loans, are expected to be contributed to the DBUBS 2017-BRBK Trust. The remaining seniorpari passuPromissory Notes A-1-C1, A-1-C2, A-2-C1-B, A-2-C2-A and A-2-C2-B, with an aggregate principal balance of $160,000,000, (the “Burbank Office Portfolio Pari Passu Companion Loans”) are currently held by UBS AG and DBNY, or affiliates thereof, and are expected to be contributed to one or more future securitization transactions or may be otherwise transferred at any time. The Burbank Office Portfolio Whole Loan will be serviced pursuant to the trust and servicing agreement for the DBUBS 2017-BRBK Trust. See “Description of the Mortgage Pool—The Whole Loans—The Non-Serviced AB Whole Loans” and “Pooling and Servicing Agreement” in the Preliminary Prospectus.
| Burbank Office Portfolio Whole Loan Summary | ||||
| Note | Original Balance | Cut-off Date Balance | Anticipated Note Holder | Controlling Piece |
| Note A-1-S | $127,400,000 | $127,400,000 | DBUBS 2017-BRBK | Yes |
| Note A-1-C1 | $50,000,000 | $50,000,000 | DBNY | No |
| Note A-1-C2 | $50,000,000 | $50,000,000 | DBNY | No |
| Note A-2-S | $51,600,000 | $51,600,000 | DBUBS 2017-BRBK | No |
| Note A-2-C1-A | $30,000,000 | $30,000,000 | UBS 2017-C5 | No |
| Note A-2-C2-B | $20,000,000 | $20,000,000 | UBS AG | No |
| Note A-2-C2-A | $25,000,000 | $25,000,000 | UBS AG | No |
| Note A-2-C2-B | $15,000,000 | $15,000,000 | UBS AG | No |
| Note A-2-C2-C | $10,000,000 | $10,000,000 | UBS 2017-C5 | No |
| Note B-1 | $168,600,000 | $168,600,000 | DBUBS 2017-BRBK | No |
| Note B-2 | $112,400,000 | $112,400,000 | DBUBS 2017-BRBK | No |
| Total | $660,000,000 | $660,000,000 | ||
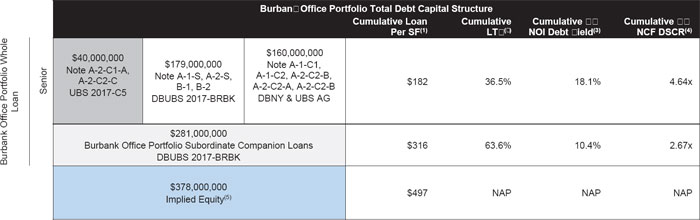
| (1) | Cumulative Loan Per SF is calculated based on 2,087,579 SF. |
| (2) | Based on the “as-is” appraised value of $1.038 billion ($497 PSF) as of August 24, 2017 per the appraisal. |
| (3) | Based on the UW NOI of $68,486,656. |
| (4) | Based on the UW NCF of $63,159,124 and the coupon of 3.5410% on the Burbank Office Portfolio Whole Loan. |
| (5) | Implied Equity is based on the “as-is” appraised value of $1.038 billion, less debt of $660.0 million. |
The Borrowers and the Borrower Sponsors. The borrowers are 3800 Alameda Owner, LLC, Catalina Media Development, LLC, 3500 Partners, LLC, 3100 Partners, LLC, 2255 Partners LLC, and MSN III and IV LLC, each a Delaware limited liability company, and Avon Empire Partners, LLC, a California limited liability company (collectively, the “Burbank Office Portfolio Borrower”), each a single-purpose entity structured to be bankruptcy remote. Blackstone Property Partners Lower Fund 1 L.P., an affiliate of the Blackstone Property Partners borrower sponsor, is the nonrecourse carve-out guarantor (the “Burbank Office Group Guarantor”). Notwithstanding anything to the contrary, so long as one or more entities affiliated with Blackstone Property Partners is the guarantor or substitute guarantor, the Burbank Office Group Guarantor will not be required to maintain a minimum net worth, excluding its interest in the Burbank Office Portfolio Properties, of $150,000,000. See “Description of the Mortgage Pool—Non-Recourse Carveout Limitation” in the Preliminary Prospectus.
The borrower sponsors are Blackstone Property Partners (“Blackstone”) and The Worthe Real Estate Group, Inc. (“Worthe”). Blackstone is the largest private equity real estate investment manager in the world with $104 billion of real estate assets under management through its debt strategy businesses.
THE INFORMATION IN THIS COLLATERAL TERM SHEET IS NOT COMPLETE AND MAY BE AMENDED PRIOR TO THE TIME OF SALE. THIS TERM SHEET IS NOT AN OFFER TO SELL THESE SECURITIES AND IT IS NOT A SOLICITATION OF AN OFFER TO BUY THESE SECURITIES IN ANY JURISDICTION WHERE THE OFFER OR SALE IS NOT PERMITTED.
10
| Burbank, CA | Collateral Asset Summary – Loan No. 1 Burbank Office Portfolio
| Cut-off Date Balance: Cut-off Date LTV Ratio: UW NCF DSCR: UW NOI Debt Yield: | $40,000,000 36.5% 4.64x 18.1% |
The breadth of Blackstone’s portfolio includes premier properties in many top locations in the U.S., Europe, Asia and Latin America, with a diverse mix of hospitality, office, retail, industrial, and residential investments, with aggregate value of gross assets of approximately $200 billion. Blackstone’s portfolio includes approximately 222 million SF of office space globally, making it one of the largest owners of office properties in the U.S. Worthe is a real estate development firm specializing in media and technology campuses in Los Angeles. With an existing portfolio of 37 assets totaling approximately 5.4 million SF, Worthe is the largest owner and manager of real estate by square footage in Burbank and currently manages the Burbank Office Portfolio Properties. In connection with the origination of the Burbank Office Portfolio Whole Loan, Blackstone, through one or more affiliates, acquired an 80.0% interest in each of the Burbank Office Portfolio Properties from certain separate joint ventures comprised of affiliates of Worthe and certain third parties and Worthe, through one or more affiliates, acquired or retained the remaining 20.0% interest in each property in the Burbank Office Portfolio Properties.
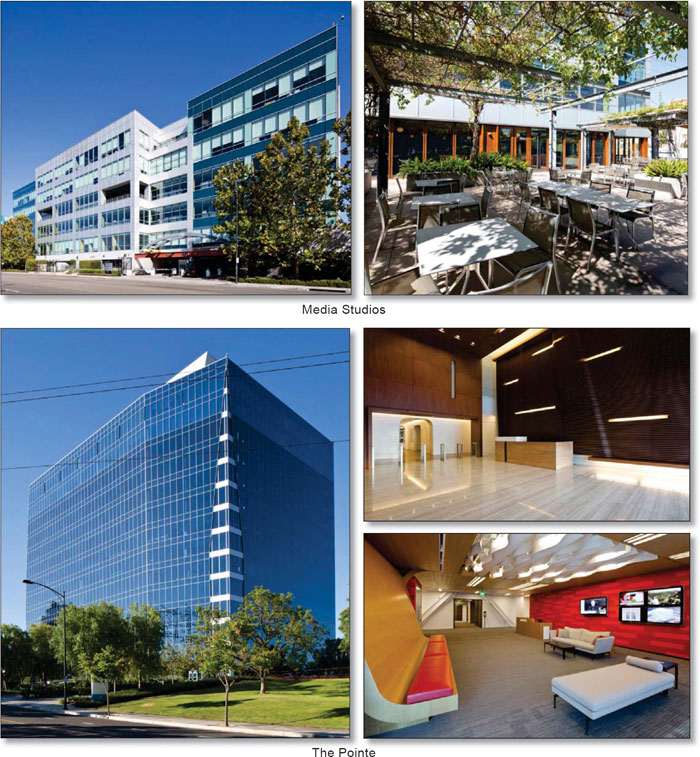
The Properties. The Burbank Office Portfolio Properties are comprised of four office properties totaling 2,087,579 SF located in Burbank, California in the Burbank Media District. The Burbank Office Portfolio Properties were constructed between 1969 and 2009 and range in size from 256,159 SF to 926,365 SF. The Burbank Office Portfolio Properties are approximately 92.4% occupied as of August 31, 2017 and are leased to 53 tenants, including many prominent media and entertainment companies. Approximately 68.1% of the total NRA is leased to investment grade tenants. Excluding The Pointe Property, which was developed in 2009, the Burbank Office Portfolio has a 10-year historical occupancy average of 96.0%.
The following tables present certain information relating to the Burbank Office Portfolio Properties:
| Portfolio Summary | |||||||||
| Property Name | Location | Year Built/ Renovated | Net Rentable Area (SF)(1) | UW NCF | % of UW NCF | Allocated Cut-off Date Balance(2) | % of Allocated Cut-off Date Balance | Appraised Value | Allocated Cut-off Date LTV Ratio(2) |
| Media Studios | Burbank, CA | 1996-2006/N/A | 926,365 | $22,575,888 | 35.7% | $143,244,773 | 37.8% | $410,000,000 | 34.9% |
| The Pointe | Burbank, CA | 2009/N/A | 480,167 | $18,626,181 | 29.5% | $122,083,939 | 32.2% | $325,000,000 | 37.6% |
| 3800 Alameda | Burbank, CA | 1984/2008 | 424,888 | $13,797,326 | 21.8% | $69,856,591 | 18.4% | $183,000,000 | 38.2% |
| Central Park | Burbank, CA | 1984/N/A | 256,159 | $8,159,730 | 12.9% | $43,814,697 | 11.6% | $120,000,000 | 36.5% |
| Total/Wtd. Avg. | 2,087,579 | $63,159,124 | 100.0% | $379,000,000 | 100.0% | $1,038,000,000 | 36.5% | ||
| (1) | Information is based on the underwritten rent roll. |
| (2) | Based on the Burbank Office Portfolio Senior Loan amount. |
The Media Studios Property is comprised of five, Class A office buildings totaling 926,365 SF and is 85.9% occupied as of August 31, 2017. Phase I was completed in 1996 and Phases II through V were completed between 1998 and 2006, and the buildings range in size between 95,430 SF and 230,145 SF. Situated on 14.8 acres, the property is LEED Gold Certified and has also received Energy Star recognition in recent years. The Media Studios Property contains a 209-seat, 12,000 SF dual-screen screening room, two full-service commissary facilities, and a 12,000 SF fitness center equipped with locker rooms and showers. Additional amenities on site include a jogging track, sand volleyball court, putting green, basketball courts, landscaped gardens, public art installations and a shuttle service. Wi-Fi network connectivity is provided throughout the campus for the outdoor seating plazas and picnic areas. Parking at the property is provided via 2,960 spaces (3.3 spaces per 1,000 SF). The largest tenants at the Media Studios Property are Kaiser Foundation Health Plan (S&P: AA-), which comprises 21.0% of property NRA and 24.5% of property UW Base Rent, and Walt Disney Pictures (Fitch/Moody’s/S&P: A/A2/A+), which comprises 16.2% of property NRA and 18.9% of property UW Base Rent.
The Pointe Property is a 480,167 SF Class A, 14-story office building and is 95.6% occupied as of August 31, 2017. Built in 2009, the property is LEED Gold Certified and has received Energy Star recognition in recent years. The property features panoramic views with floor-to-ceiling glass windows, outdoor seating and dining patio, and a full-service health club. In addition, The Pointe Property contains two electric vehicle charging stations and a full-service detailing center for car washes and details. Parking at the property is provided via 1,391 spaces (2.9 spaces per 1,000 SF). The Pointe Property’s largest tenant is Legendary (Fitch/S&P: BBB/BB), which utilizes its space at the property for its headquarters operations. Legendary, which comprises 22.0% of property NRA and 23.2% of property UW Base Rent, is a media company with film, television, digital, and comics productions, that have realized gross ticket sales, in aggregate, of over $10 billion worldwide at box offices.
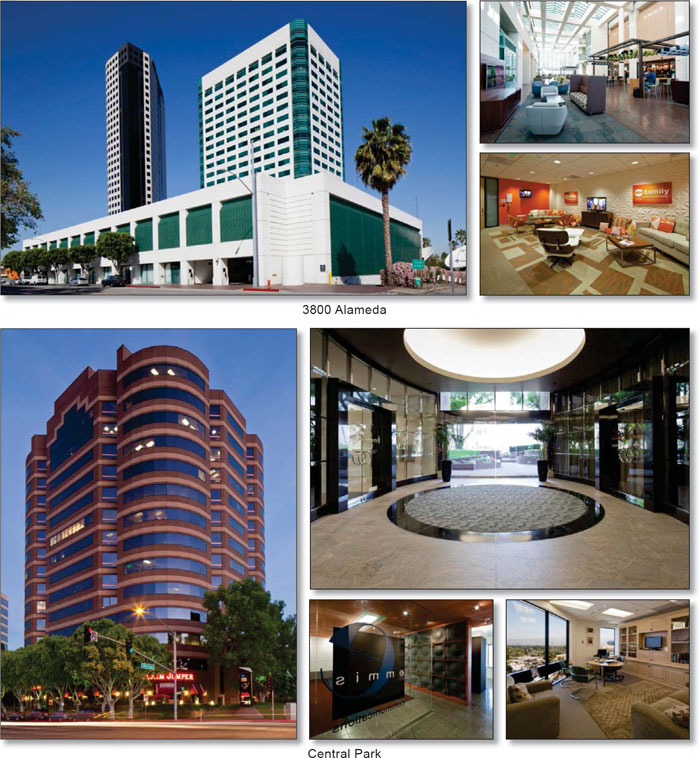
The 3800 Alameda Property is a 424,888 SF Class A, 21-story office building and is 100.0% occupied as of August 31, 2017. The property was built in 1984 and redeveloped in 2008. Disney (NYSE: DIS; Fitch/Moody’s/S&P: A/A2/A+) is the primary tenant at the property (98.3% of property NRA, 98.8% of property UW Base Rent) and its corporate headquarters are located approximately 1.2 miles away. The 3800 Alameda property serves as the world headquarters for Radio Disney and broadcasting home for ESPN, Disney Channel, Disney Junior, Disney XD and Freeform. There are transmission facilities in the lobby and subterranean levels that are utilized by Disney and its affiliated channels in addition to numerous satellite dishes installed on the adjacent seven-story parking structure, which is also collateral for the 3800 Alameda property. In total, there are approximately 12 networks transmitted from the property. Over the past 20 years, Disney has invested approximately $40.0 million into the property, including $9.0 million since 2008. Parking at the property is provided via 1,084 spaces (2.6 spaces per 1,000 SF).
The Central Park property is a 256,159 SF Class A, 14-story office building situated on 1.5 acres and is 97.3% occupied as of August 31, 2017. The property was built in 1984 and there are current plans for a $1.5 million renovation to the lobby slated for 2018. The property features a City National Bank on the ground floor, full-service Claim Jumper Restaurant, and a full-service car wash and detailing service center. Parking at the property is provided via 734 spaces (2.9 spaces per 1,000 SF). The largest tenant at the Central Park Property is Turner Broadcasting (Fitch/Moody’s/S&P: BBB+/Baa2/BBB), which comprises 24.7% of property NRA and 25.0% of property UW Base Rent.
THE INFORMATION IN THIS COLLATERAL TERM SHEET IS NOT COMPLETE AND MAY BE AMENDED PRIOR TO THE TIME OF SALE. THIS TERM SHEET IS NOT AN OFFER TO SELL THESE SECURITIES AND IT IS NOT A SOLICITATION OF AN OFFER TO BUY THESE SECURITIES IN ANY JURISDICTION WHERE THE OFFER OR SALE IS NOT PERMITTED.
11
| Burbank, CA | Collateral Asset Summary – Loan No. 1 Burbank Office Portfolio
| Cut-off Date Balance: Cut-off Date LTV Ratio: UW NCF DSCR: UW NOI Debt Yield: | $40,000,000 36.5% 4.64x 18.1% |
The following table presents certain information relating to the leases at the Burbank Office Portfolio Properties:
| Tenant Summary(1) | ||||||||
| Tenant Name | Property | Credit Rating (Fitch/Moody’s/ S&P)(2) | Tenant SF | Approximate % of SF | Annual UW Base Rent | % of Total Annual Base UW Rent | Annual UW Base Rent PSF(3) | Lease Expiration |
| Disney | 3800 Alameda | A/A2/A+ | 417,731 | 20.0% | $17,734,050 | 21.5% | $42.45 | Various(4) |
| Kaiser Foundation Health Plan | Media Studios | NR/NR/AA- | 194,145 | 9.3% | $7,804,629 | 9.5% | $40.20 | 5/31/2024 |
| Warner Bros. | Central Park/The Pointe | BBB+/Baa2/BBB | 162,047 | 7.8% | $7,395,121 | 9.0% | $45.64 | Various(5) |
| Walt Disney Pictures | Media Studios | A/A2/A+ | 149,840 | 7.2% | $6,015,360 | 7.3% | $40.15 | Various(6) |
| Legendary | The Pointe | BBB/NR/BB | 105,522 | 5.1% | $5,092,656 | 6.2% | $48.26 | Various(7) |
| Yahoo(8) | Media Studios | A-/Baa1/BBB+ | 105,400 | 5.0% | $4,340,568 | 5.3% | $41.18 | 5/31/2020 |
| Hasbro | Media Studios | BBB+/Baa1/BBB | 80,000 | 3.8% | $3,165,717 | 3.8% | $39.57 | 1/31/2027 |
| FremantleMedia(9) | The Pointe | NR/NR/BBB+ | 72,328 | 3.5% | $3,361,082 | 4.1% | $46.47 | 10/31/2024 |
| Turner Broadcasting | Central Park | BBB+/Baa2/BBB | 63,283 | 3.0% | $2,658,911 | 3.2% | $42.02 | 2/29/2024 |
| TiVo Corporation(10) | Media Studios | NR/NR/NR | 61,732 | 3.0% | $3,294,637 | 4.0% | $53.37 | 6/30/2019 |
| Subtotal/Wtd. Avg. | 1,412,028 | 67.6% | $60,862,732 | 73.9% | $43.10 | |||
| Remaining Tenants(11) | 517,161 | 24.8% | $21,498,744 | 26.1% | $41.57 | |||
| Vacant Space | 158,390 | 7.6% | $0 | 0.0% | $0.00 | |||
| Total/Wtd. Avg. | 2,087,579 | 100.0% | $82,361,475 | 100.0% | $42.69 | |||
| (1) | Information is based on the underwritten rent roll. |
| (2) | Ratings provided are for the parent company of the entity listed in the “Tenant Name” field whether or not the parent company guarantees the lease. |
| (3) | Total/Wtd. Avg. Annual UW Base Rent PSF excludes vacant space. |
| (4) | Disney leases 357,820 SF and 59,911 SF at the 3800 Alameda Property, with lease expirations on March 27, 2021 and March 27, 2023, respectively. |
| (5) | Warner Bros. leases 99,853 SF at The Pointe Property with lease expirations on November 30, 2025 and 60,092 SF and 2,102 SF at the Central Park Property, with lease expirations on June 30, 2022, and December 31, 2017, respectively. Warner Bros. has the option to terminate 99,853 SF of its space at The Pointe Property on December 31, 2022 upon 12 months’ written notice and payment of a termination fee. |
| (6) | Walt Disney Pictures leases 131,172 SF and 18,668 SF at the Media Studios Property, with lease expirations on May 31, 2021 and April 30, 2022, respectively. |
| (7) | Legendary leases 70,018 SF and 35,504 SF at The Pointe Property, with lease expirations on October 31, 2024 and March 31, 2025, respectively. |
| (8) | Yahoo is currently dark but paying rent. |
| (9) | FremantleMedia has the option to terminate its lease on August 31, 2020 upon written notice by May 31, 2019. |
| (10) | TiVo Corporation subleases 6,881 SF to Jones Lang LaSalle at the Media Studios Property. The sublease is coterminous with TiVo Corporation’s lease with an expiration date of June 30, 2019. |
| (11) | Includes Lopez Accounting Group (552 SF), which took occupancy at the Central Park Property on September 1, 2017, and Turner Broadcasting (5,435 SF), which has a rent commencement date of January 1, 2018. |
The following table presents certain information relating to the lease rollover schedule at the Burbank Office Portfolio Properties:
| Lease Rollover Schedule(1)(2) | ||||||||
| Year | # of Leases Rolling | SF Rolling | Approx. % of Total SF Rolling | Approx. Cumulative % of SF Rolling | UW Base Rent PSF Rolling(3) | Total UW Base Rent Rolling | Approx. % of Total Rent Rolling | Approx. Cumulative % of Total Rent Rolling |
| MTM | 0 | 0 | 0.0% | 0.0% | $0.00 | $0 | 0.0% | 0.0% |
| 2017 | 2 | 20,621 | 1.0% | 1.0% | $43.39 | $894,797 | 1.1% | 1.1% |
| 2018 | 7 | 21,968 | 1.1% | 2.0% | $32.42 | $712,294 | 0.9% | 2.0% |
| 2019 | 12 | 136,665 | 6.5% | 8.6% | $47.29 | $6,462,928 | 7.8% | 9.8% |
| 2020 | 10 | 153,456 | 7.4% | 15.9% | $41.18 | $6,319,707 | 7.7% | 17.5% |
| 2021 | 24 | 584,705 | 28.0% | 43.9% | $42.79 | $25,020,075 | 30.4% | 47.8% |
| 2022 | 15 | 193,351 | 9.3% | 53.2% | $42.90 | $8,295,186 | 10.1% | 57.9% |
| 2023 | 7 | 119,380 | 5.7% | 58.9% | $44.05 | $5,258,128 | 6.4% | 64.3% |
| 2024 | 12 | 403,458 | 19.3% | 78.3% | $43.16 | $17,414,635 | 21.1% | 85.4% |
| 2025 | 5 | 135,357 | 6.5% | 84.7% | $46.95 | $6,354,445 | 7.7% | 93.2% |
| 2026 | 0 | 0 | 0.0% | 84.7% | $0.00 | $0 | 0.0% | 93.2% |
| 2027 | 6 | 113,795 | 5.5% | 90.2% | $41.20 | $4,688,890 | 5.7% | 98.9% |
| 2028 & Beyond | 7 | 46,433 | 2.2% | 92.4% | $20.25 | $940,392 | 1.1% | 100.0% |
| Vacant | 0 | 158,390 | 7.6% | 100.0% | $0.00 | $0 | 0.0% | 100.0% |
| Total/Wtd. Avg. | 107 | 2,087,579 | 100.0% | $42.69 | $82,361,475 | 100.0% | ||
| (1) | Information is based on the underwritten rent roll. |
| (2) | Certain tenants may have lease termination options that are exercisable prior to the originally stated expiration date of the subject lease and that are not considered in the lease rollover schedule. |
| (3) | Wtd. Avg. UW Base Rent PSF Rolling excludes vacant space. |
THE INFORMATION IN THIS COLLATERAL TERM SHEET IS NOT COMPLETE AND MAY BE AMENDED PRIOR TO THE TIME OF SALE. THIS TERM SHEET IS NOT AN OFFER TO SELL THESE SECURITIES AND IT IS NOT A SOLICITATION OF AN OFFER TO BUY THESE SECURITIES IN ANY JURISDICTION WHERE THE OFFER OR SALE IS NOT PERMITTED.
12
| Burbank, CA | Collateral Asset Summary – Loan No. 1 Burbank Office Portfolio
| Cut-off Date Balance: Cut-off Date LTV Ratio: UW NCF DSCR: UW NOI Debt Yield: | $40,000,000 36.5% 4.64x 18.1% |
The Market. The Burbank Office Portfolio Properties are located within the Burbank Media District submarket within the larger Los Angeles North market area. According to the appraisal, the Los Angeles North office market contains a total inventory of approximately 55.4 million SF across 600 buildings. As of the second quarter 2017, the office submarket had a direct vacancy rate of 11.3% and a weighted average rental rate of $32.21 PSF, compared to 11.7% and $31.56 PSF, respectively as of year-end 2016. The Burbank Media District submarket contains a total inventory of 3.3 million SF across 19 buildings, a direct vacancy rate of 11.3%, a direct weighted average rental rate of $41.52 PSF and registered 88,569 SF of net absorption in the second quarter of 2017. As of the August 31, 2017 rent roll, the Burbank Office Portfolio has a vacancy rate of 7.6% and a weighted average rental rate of $42.69 PSF.
According to the appraisal, Burbank is the central hub of the global entertainment industry and is the location for three major studios: Disney, Warner Bros., and Comcast’s NBCUniversal. Burbank is also home to over 700 media-related corporations, including television networks, broadcasting companies and music labels. Other entertainment-related companies in the city include Clear Channel, BET, Photo-Cam Motion Picture Laboratories, Broadcast Equipment Rental Corporation (the largest video equipment rental facility in the nation), DC Comics, Rhino Entertainment, Sony, Playboy Enterprises, and Fremantle. The appraisal did not forecast any new construction over the next several years.
The following table presents certain office market information of the East Valley/Tri-Cities grouping within the Los Angeles North market as of the second quarter of 2017:
| Office Market and Submarket Overview(1) | ||||||
| Submarket | Inventory (SF) | Number of Buildings | Direct Vacancy Rate | Overall Vacancy Rate | Direct Net Absorption 2Q2017 | Direct Wtd. Avg. Rental Rate (PSF) |
| Burbank Media District | 3,333,707 | 19 | 11.3% | 11.9% | 88,569 | $41.52 |
| Universal City/Studio City | 1,884,655 | 16 | 3.7% | 3.9% | (7,679) | $34.08 |
| Burbank - City Center | 3,122,300 | 34 | 12.7% | 18.8% | 168,593 | $37.08 |
| Glendale | 5,918,006 | 42 | 11.1% | 11.0% | (6,803) | $32.16 |
| Pasadena | 7,497,885 | 60 | 14.1% | 15.6% | (196,006) | $39.84 |
| Pasadena East | 1,167,737 | 10 | 22.3% | 22.3% | 8,034 | $24.72 |
| North Hollywood | 1,171,666 | 13 | 4.9% | 5.2% | 50,433 | $34.44 |
| Total/Wtd. Avg. | 24,095,956 | 194 | 11.9% | 13.3% | 105,141 | $13.33 |
| (1) | Information is based on the appraisals. |
Operating History and Underwritten Net Cash Flow. The following table presents certain information relating to the historical operating performance and the Underwritten Net Cash Flow at the Burbank Office Portfolio Properties:
| Cash Flow Analysis | |||||||||||
| 2014 | 2015(1) | 2016(1) | 6/30/2017 TTM(1) | UW(1) | UW PSF | ||||||
| Gross Potential Rent | $67,639,603 | $68,834,347 | $76,592,277 | $69,584,091(2) | $95,053,054(3) | $45.53 | |||||
| Total Recoveries | $1,854,343 | $2,141,190 | $2,957,882 | $2,308,227 | $2,376,993 | $1.14 | |||||
| Other Income(4) | $7,989,377 | $9,375,318 | $10,645,375 | $10,621,644 | $10,017,115 | $4.80 | |||||
| Less Vacancy & Credit Loss | ($15,247,577) | ($19,053,673) | ($17,348,782) | $0 | ($6,813,889) | ($3.26) | |||||
| Effective Gross Income | $62,235,747 | $61,297,183 | $72,846,752 | $82,513,963 | $100,633,272 | $48.21 | |||||
| Total Operating Expenses | $25,988,009 | $26,854,903 | $28,048,205 | $28,490,114 | $32,146,616 | $15.40 | |||||
| Net Operating Income | $36,247,737 | $34,442,280 | $44,798,547 | $54,023,848 | $68,486,656 | $32.81 | |||||
| Capital Expenditures | $0 | $0 | $0 | $0 | $521,895 | $0.25 | |||||
| TI/LC | $0 | $0 | $0 | $0 | $4,805,637 | $2.30 | |||||
| Net Cash Flow | $36,247,737 | $34,442,280 | $44,798,547 | $54,023,848 | $63,159,124 | $30.25 | |||||
| Occupancy % | 97.8%(5) | 88.4% | 88.8% | 91.7% | 92.4% | ||||||
| NOI DSCR(6) | 2.66x | 2.53x | 3.29x | 3.97x | 5.03x | ||||||
| NCF DSCR(6) | 2.66x | 2.53x | 3.29x | 3.97x | 4.64x | ||||||
| NOI Debt Yield(6) | 9.6% | 9.1% | 11.8% | 14.3% | 18.1% | ||||||
| NCF Debt Yield(6) | 9.6% | 9.1% | 11.8% | 14.3% | 16.7% | ||||||
| (1) | The increase in UW NOI over historical periods is primarily driven by the expiration of rent abatements, recently executed leases and leases going into effect. The 3800 Alameda Property had rent abatements of $10.4 million, $11.2 million and $11.4 million in 2014, 2015 and 2016, respectively. UW NOI does not include a deduction for base rent abatements because base rent abatements for the underwritten leases either do not have any base rent abatements or the remaining abated rent amounts were substantially reserved at origination in the unfunded obligations reserve. |
| (2) | 6/30/2017 TTM Gross Potential Rent is shown net of rent rebates. |
| (3) | UW Gross Potential Rent is based on the underwritten rent roll and includes (i) for non-investment grade tenants, rent steps through October 1, 2018 of $2,480,650, (ii) for investment grade tenants, the average base rent over their respective lease terms of $3,397,039, and (iii) vacancy gross up of $6,813,889. |
| (4) | Other Income includes parking revenue and other miscellaneous income. |
| (5) | 2014 Occupancy excludes The Pointe Property, which was developed in 2009 but in a lease up until 2015. |
| (6) | Debt service coverage ratios and debt yields are based on the Burbank Office Portfolio Senior Loan totaling $379,000,000 and exclude the Burbank Office Portfolio Subordinate Companion Loans. |
THE INFORMATION IN THIS COLLATERAL TERM SHEET IS NOT COMPLETE AND MAY BE AMENDED PRIOR TO THE TIME OF SALE. THIS TERM SHEET IS NOT AN OFFER TO SELL THESE SECURITIES AND IT IS NOT A SOLICITATION OF AN OFFER TO BUY THESE SECURITIES IN ANY JURISDICTION WHERE THE OFFER OR SALE IS NOT PERMITTED.
13
| Burbank, CA | Collateral Asset Summary – Loan No. 1 Burbank Office Portfolio
| Cut-off Date Balance: Cut-off Date LTV Ratio: UW NCF DSCR: UW NOI Debt Yield: | $40,000,000 36.5% 4.64x 18.1% |
Escrows and Reserves. The Burbank Office Portfolio Borrower deposited in escrow $18,000,000 for window repairs, $14,151,048 for outstanding tenant allowances and $3,617,000 for outstanding free rent and during the continuance of a Cash Sweep Period (as defined below), is required to escrow monthly (i) 1/12 of the annual estimated tax payments, (ii) 1/12 of the annual insurance premiums, (iii) 1/12 of the amount equal to the aggregate net rentable square footage of the Burbank Office Portfolio Properties (if applicable, excluding the net rentable square footage of any released property) times $0.25 for capital expenditures (the “Monthly Replacement Reserve Deposit”), subject to a cap of an amount equal to the Monthly Replacement Reserve Deposit times 12 and (iv) 1/12 of the amount equal to the aggregate net rentable square footage of the Burbank Office Portfolio Properties (if applicable, excluding the net rentable square footage of any released property) times $1.25 for tenant improvements and leasing commissions (the “Monthly Rollover Reserve Deposit”), subject to a cap of an amount equal to the Monthly Rollover Reserve Deposit times 12. Upon the cure of a Cash Sweep Period, such monthly deposits for tax, insurance, capital expenditures and tenant improvements and leasing commissions will be waived and the amounts in such reserve accounts will be released to the Burbank Office Portfolio Borrower.
Lockbox and Cash Management. A hard lockbox is in place with respect to the Burbank Office Portfolio Whole Loan. The Burbank Office Portfolio Whole Loan has springing cash management during the continuance of a Cash Sweep Period (as defined below). During the continuance of a Cash Sweep Period, funds in the lockbox account are required to be transferred to the cash management account up to two times per week and such funds in the cash management account are required to be applied on each monthly payment date to fund the required reserves deposits as described above under “Escrows and Reserves,” pay debt service on the Burbank Office Portfolio Whole Loan, pay operating expenses for the Burbank Office Portfolio and disburse the remainder to an account to be held by the lender as additional security for the Burbank Office Portfolio Whole Loan (or upon the cure of a Cash Sweep Period,provided that no event of default has occurred and is continuing, to the Burbank Office Portfolio Borrower).
A “Cash Sweep Period” will occur upon (i) an event of default, (ii) any bankruptcy action involving the Burbank Office Portfolio Borrower, the guarantor or any TRS Entity (as defined below), or (iii) the debt yield for the Burbank Office Portfolio Whole Loan falling below 7.0% for two consecutive calendar quarters. A Cash Sweep Period will continue until, in regard to clause (i) above, the cure of such event of default and acceptance of such cure by the lender, in regard to clause (ii) above, in the event of an involuntary bankruptcy action, upon the filing being discharged, stayed or dismissed within 90 days of such filing, or in regard to clause (iii) above, (a) the debt yield for the Burbank Office Portfolio Whole Loan is equal to or greater than 7.0% for two consecutive calendar quarters or (b) the Burbank Office Portfolio Borrower prepays the Burbank Office Portfolio Whole Loan in an amount sufficient to achieve a debt yield equal to or greater than 7.0%.
Additional Secured Indebtedness (not including trade debts). In addition to the Burbank Office Portfolio Mortgage Loan, the Burbank Office Portfolio Properties also secure seven additionalpari passusenior notes, which combined with the Burbank Office Portfolio Mortgage Loan comprise the Burbank Office Portfolio Senior Loan in the aggregate principal amount of $379,000,000, and two subordinate notes with an aggregate principal balance of $281,000,000 comprising the Burbank Office Portfolio Subordinate Companion Loans. The Burbank Office Portfolio Subordinate Companion Loans are coterminous with the Burbank Office Portfolio Senior Loan and accrue interest at 3.5410%. The Burbank Office Portfolio Mortgage Loan along with the other notes that comprise the Burbank Office Portfolio Senior Loan are eachpari passu in right of payment and the Burbank Office Portfolio Senior Loan is senior in right of payment to the Burbank Office Portfolio Subordinate Companion Loans. The holders of the Burbank Office Portfolio Mortgage Loan, the other notes that comprise the Burbank Office Portfolio Senior Loan and the Burbank Office Portfolio Subordinate Companion Loans have entered into a co-lender agreement which sets forth the allocation of collections on the Burbank Office Portfolio Whole Loan. See “Description of the Mortgage Pool—The Whole Loans—The Non-Serviced AB Whole Loans” in the Preliminary Prospectus.
Mezzanine Loan and Preferred Equity.Not permitted.
Release of Property. The Burbank Office Portfolio Borrower may obtain the release of any Burbank Office Portfolio Property,providedthat, among other things, (i) no event of default has occurred and is continuing, (ii) the Burbank Office Portfolio Borrower pays the Release Amount (as defined below) along with any yield maintenance premium, (iii) the debt yield with respect to the remaining Burbank Office Portfolio Properties is no less than the greater of (a) the debt yield at origination of the Burbank Office Portfolio Whole Loan and (b) the debt yield immediately prior to the release,provided,however, that the debt yield is not required to be greater than 10.0%. In the event that such debt yield requirement is not satisfied and the release of such property is in connection with a sale of such property to a third party, the Burbank Office Portfolio Borrower will be permitted to obtain the release of such property upon the payment of an amount equal to the greater (i) of the Release Amount and (ii) the lesser of (a) lender’s allocation of 100% of the net sales proceeds for such property and (b) an amount necessary to, after giving effect to such release, satisfy the debt yield requirement set forth above, along with any yield maintenance premium required. For the purposes of calculating the debt yield relating to the release of one or more properties, the Burbank Office Portfolio Borrower may elect to deliver a letter of credit in the maximum aggregate amount of $15,000,000 as additional collateral for the Burbank Office Portfolio Whole Loan to be counted against the outstanding principal balance of the Burbank Office Portfolio Whole Loan.
The “Release Amount” is an amount equal to (i) for The Pointe Property, 110%, and (ii) for the Media Studios Property, 3800 Alameda Property and Central Park Property, 105%, of the Allocated Cut-off Date Balance of such property (identified in the “Portfolio Summary” chart above).
Release of Parcel. The Burbank Office Portfolio Borrower may obtain the release of any unimproved non-income producing land located at any Burbank Office Portfolio Property, for which no value was attributed to such unimproved non-income producing land in the applicable appraisal, without any requirements to pay any portion of any allocated loan amount, Release Amount, prepayment fees or yield maintenance premium,provided that certain terms and conditions as specified in the loan agreement are satisfied.
TRS Entities.The Central Park Property, The Pointe Property and two parcels of the Media Studios Property have taxable REIT subsidiary (“TRS”) structures in place with respect to certain café, fitness and transportation elements of the applicable parcels (individually, a “TRS Entity”, and collectively, the “TRS Entities”). Each TRS Entity is a special purpose, bankruptcy remote, Delaware limited liability company. The TRS Entities have mortgaged their respective interests and are non-borrower parties to the loan agreement and other loan documents with respect to all applicable representations, warranties and covenants. The TRS Entities are not, however, obligors under the notes.
Terrorism Insurance. The Burbank Office Portfolio Borrower is required to obtain insurance against acts of terrorism for loss resulting from perils and acts of terrorism in amounts and with terms and conditions applicable to commercial property, general liability, business income and umbrella liability insurance required pursuant to the Burbank Office Portfolio Whole Loan documents.
THE INFORMATION IN THIS COLLATERAL TERM SHEET IS NOT COMPLETE AND MAY BE AMENDED PRIOR TO THE TIME OF SALE. THIS TERM SHEET IS NOT AN OFFER TO SELL THESE SECURITIES AND IT IS NOT A SOLICITATION OF AN OFFER TO BUY THESE SECURITIES IN ANY JURISDICTION WHERE THE OFFER OR SALE IS NOT PERMITTED.
14
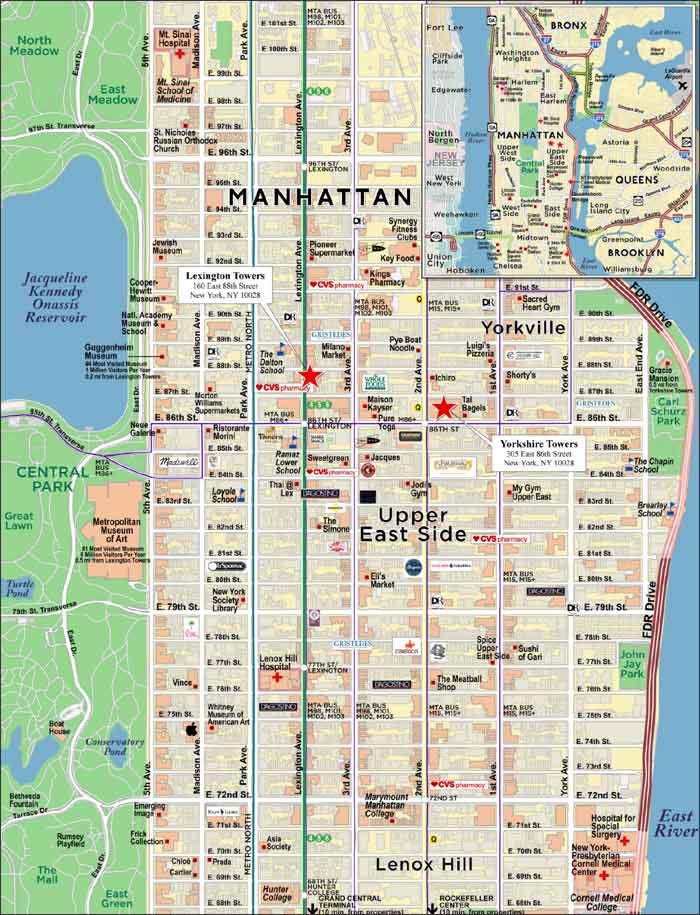
| New York, NY 10028 | Collateral Asset Summary – Loan No. 2 Yorkshire & Lexington Towers | Cut-off Date Balance: Cut-off Date LTV Ratio: UW NCF DSCR: UW NOI Debt Yield: | $40,000,000 22.5% 4.28x 12.0% |
THE INFORMATION IN THIS COLLATERAL TERM SHEET IS NOT COMPLETE AND MAY BE AMENDED PRIOR TO THE TIME OF SALE. THIS TERM SHEET IS NOT AN OFFER TO SELL THESE SECURITIES AND IT IS NOT A SOLICITATION OF AN OFFER TO BUY THESE SECURITIES IN ANY JURISDICTION WHERE THE OFFER OR SALE IS NOT PERMITTED.
15
| New York, NY 10028 | Collateral Asset Summary – Loan No. 2 Yorkshire & Lexington Towers | Cut-off Date Balance: Cut-off Date LTV Ratio: UW NCF DSCR: UW NOI Debt Yield: | $40,000,000 22.5% 4.28x 12.0% |
THE INFORMATION IN THIS COLLATERAL TERM SHEET IS NOT COMPLETE AND MAY BE AMENDED PRIOR TO THE TIME OF SALE. THIS TERM SHEET IS NOT AN OFFER TO SELL THESE SECURITIES AND IT IS NOT A SOLICITATION OF AN OFFER TO BUY THESE SECURITIES IN ANY JURISDICTION WHERE THE OFFER OR SALE IS NOT PERMITTED.
16
| New York, NY 10028 | Collateral Asset Summary – Loan No. 2 Yorkshire & Lexington Towers | Cut-off Date Balance: Cut-off Date LTV Ratio: UW NCF DSCR: UW NOI Debt Yield: | $40,000,000 22.5% 4.28x 12.0% |
| Mortgage Loan Information | Property Information | ||||||
| Mortgage Loan Seller: | UBS AG | Single Asset/Portfolio: | Portfolio | ||||
| Credit Assessment (Fitch/KBRA/Moody’s/S&P): | [ ] | Location: | New York, NY 10028 | ||||
| General Property Type: | Multifamily | ||||||
| Original Balance(1): | $40,000,000 | Detailed Property Type: | High Rise | ||||
| Cut-off Date Balance(1): | $40,000,000 | Title Vesting: | Fee | ||||
| % of Initial Pool Balance: | [ ]% | Year Built/Renovated: | Various/2014-2017 | ||||
| Loan Purpose: | Refinance | Size: | 827 Units | ||||
| Borrower Sponsors: | The Chetrit Group LLC; Stellar Management LLC | Cut-off Date Balance per Unit(1): | $241,838 | ||||
| Mortgage Rate: | 2.7400% | Maturity Date Balance per Unit(1): | $241,838 | ||||
| Note Date: | 10/3/2017 |
Property Manager: |
Jumeaux Management LLC (borrower-related) | ||||
| First Payment Date: | 11/6/2017 | ||||||
| Maturity Date: | 10/6/2022 | ||||||
| Original Term to Maturity: | 60 months | ||||||
| Original Amortization Term: | 0 months | ||||||
| IO Period: | 60 months | ||||||
| Seasoning: | 1 month | ||||||
| Prepayment Provisions: | LO (25); DEF (28); O (7) | Underwriting and Financial Information | |||||
| Lockbox/Cash Mgmt Status: | Soft/Springing | UW NOI(4): | $23,948,124 | ||||
| Additional Debt Type(2): | Pari Passu/Subordinate Debt/Mezzanine | UW NOI Debt Yield(1): | 12.0% | ||||
| Additional Debt Balance(2): | $160,000,000/$200,000,000/$150,000,000 | UW NOI Debt Yield at Maturity(1): | 12.0% | ||||
| Future Debt Permitted (Type): | No (N/A) | UW NCF DSCR(1): | 4.28x | ||||
| Reserves(3) | Most Recent NOI(4): | $12,322,089 (6/30/2017 TTM) | |||||
| Type | Initial | Monthly | Cap | 2nd Most Recent NOI: | $9,556,571 (12/31/2016) | ||
| RE Tax: | $2,724,408 | $681,102 | N/A | 3rd Most Recent NOI: | $10,053,207 (12/31/2015) | ||
| Insurance: | $89,787 | $29,929 | N/A | Most Recent Occupancy: | 92.0% (9/24/2017) | ||
| Replacements: | $0 | $11,369 | (3) | 2nd Most Recent Occupancy: | 78.7% (12/31/2016) | ||
| TI/LC: | $0 | $12,640 | N/A | 3rd Most Recent Occupancy: | 67.0% (12/31/2015) | ||
| Debt Service Shortfall: | $2,000,000 | $0 | N/A | Appraised Value (as of)(5): | $890,000,000 (8/15/2017) | ||
| Renovation/Tenant Buyout: | $3,500,000 | $0 | N/A | Cut-off Date LTV Ratio(1)(5): | 22.5% | ||
| Holdback Reserve Funds: | $4,102,064 | $0 | N/A | Maturity Date LTV Ratio(1)(5): | 22.5% | ||
| Sources and Uses | ||||||
| Sources | Proceeds | % of Total | Uses | Proceeds | % of Total | |
| Loan Amount(1): | $400,000,000 | 72.7% | Loan Payoff: | $394,073,271 | 71.6% | |
| Mezzanine Loans(1): | $150,000,000 | 27.3% | Reserves: | $12,416,259 | 2.3% | |
| Closing Costs: | $19,423,650 | 3.5% | ||||
| Return of Equity: | $124,086,820 | 22.6% | ||||
| Total Sources: | $550,000,000 | 100.0% | Total Uses: | $550,000,000 | 100.0% | |
| (1) | The Yorkshire & Lexington Towers Mortgage Loan (as defined below) is part of the Yorkshire & Lexington Towers Whole Loan (as defined below), which is comprised of ninepari passupromissory notes with an aggregate original principal balance of $200,000,000 and one subordinate promissory note with an original principal balance of $200,000,000. The Yorkshire & Lexington Towers Whole Loan is accompanied by the Yorkshire & Lexington Towers Mezzanine Loans (as defined below) with an aggregate original principal balance of $150,000,000. The Cut-off Date Balance per Unit, Maturity Date Balance per Unit, UW NOI Debt Yield, UW NOI Debt Yield at Maturity, UW NCF DSCR, Cut-off Date LTV Ratio and Maturity Date LTV Ratio presented above are based on the aggregate principal balance of the promissory notes comprising the Yorkshire & Lexington Towers Senior Loan (as defined below), without regard to the Yorkshire & Lexington Towers Subordinate Companion Loan (as defined below). The Cut-off Date Balance per Unit, Maturity Date Balance per Unit, UW NOI Debt Yield, UW NOI Debt Yield at Maturity, UW NCF DSCR, Cut-off Date LTV Ratio and Maturity Date LTV based on the Yorkshire & Lexington Towers Whole Loan is $483,676, $483,676, 6.0%, 6.0%, 1.68x, 44.9% and 44.9%, respectively. The Cut-off Date Balance per Unit, Maturity Date Balance per Unit, UW NOI Debt Yield, UW NOI Debt Yield at Maturity, UW NCF DSCR, Cut-off Date LTV Ratio and Maturity Date LTV based on the Yorkshire & Lexington Towers Whole Loan and the Yorkshire & Lexington Towers Mezzanine Loans are $665,054, $665,054, 4.4%, 4.4%, 1.04x, 61.8% and 61.8%, respectively. |
| (2) | See “The Mortgage Loan”, “Additional Secured Indebtedness (not including trade debts)”and “Mezzanine Loan and Preferred Equity” below for further discussion of additional debt. |
| (3) | See “Escrows and Reserves” below for further discussion of reserve requirements. |
| (4) | The increase in NOI is driven by a combination of higher occupancy levels and higher rental rates due to the conversion of rent stabilized units into free market units, unit renovations, and improved property amenities. UW NOI is underwritten to the occupancy as of the September 24, 2017 rent roll of 92.0%, compared to occupancy of 83.6% as of June 30, 2017. See “Cash Flow Analysis”table below for further discussion of the Yorkshire & Lexington Towers Properties’ (as defined below) operating performance. See “Risk Factors—Risks Relating to the Mortgage Loans—Multifamily Properties Have Special Risks” in the Preliminary Prospectus. |
| (5) | The Cut-off Date LTV Ratio and Maturity Date LTV Ratio numbers presented above are based on the aggregate “as-is” appraised value of the Yorkshire & Lexington Towers Properties of $890.0 million, as of August 15, 2017. The appraisal concluded an aggregate “as stabilized” appraised value, which assumes that the borrower sponsors’ investments related to tenant buyout costs, recapture and renovation of rent regulated units, leasing costs, and in-unit renovations of market rate and rent regulated units have been completed, of $1.03 billion as of September 1, 2020. Based on the aggregate “as stabilized” appraised value and the Yorkshire & Lexington Towers Senior Loan, the Cut-off Date LTV Ratio and Maturity Date LTV Ratio are 19.4% and 19.4%, respectively. Based on the aggregate “as stabilized” appraised value and the Yorkshire & Lexington Towers Whole Loan, the Cut-off Date LTV Ratio and Maturity Date LTV Ratio are 38.8% and 38.8%, respectively. Based on the aggregate “as stabilized” appraised value and the Yorkshire & Lexington Towers Whole Loan and Yorkshire & Lexington Towers Mezzanine Loans, the Cut-off Date LTV Ratio and Maturity Date LTV Ratio are 53.4% and 53.4%, respectively. |
THE INFORMATION IN THIS COLLATERAL TERM SHEET IS NOT COMPLETE AND MAY BE AMENDED PRIOR TO THE TIME OF SALE. THIS TERM SHEET IS NOT AN OFFER TO SELL THESE SECURITIES AND IT IS NOT A SOLICITATION OF AN OFFER TO BUY THESE SECURITIES IN ANY JURISDICTION WHERE THE OFFER OR SALE IS NOT PERMITTED.
17
| New York, NY 10028 | Collateral Asset Summary – Loan No. 2 Yorkshire & Lexington Towers | Cut-off Date Balance: Cut-off Date LTV Ratio: UW NCF DSCR: UW NOI Debt Yield: | $40,000,000 22.5% 4.28x 12.0% |
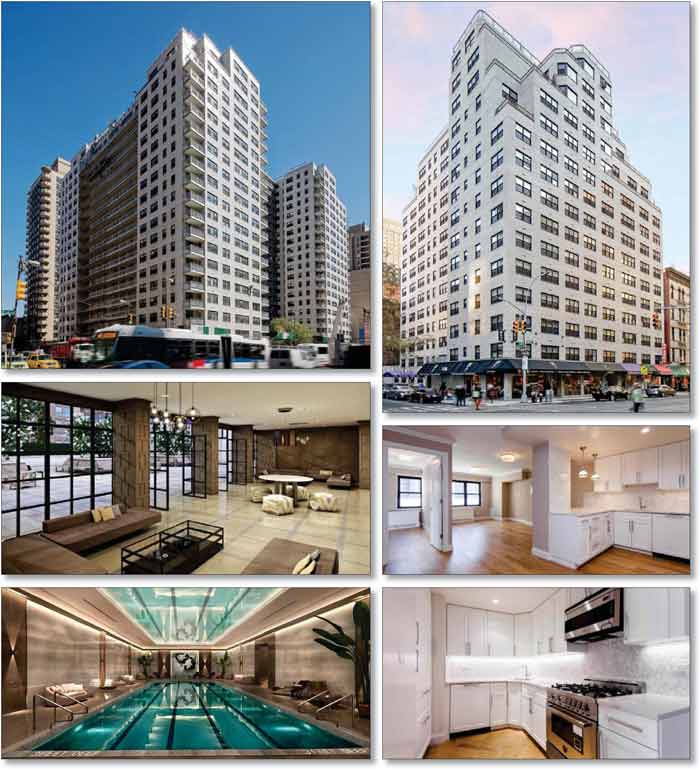
The Mortgage Loan. The second largest mortgage loan (the “Yorkshire & Lexington Towers Mortgage Loan”) is part of a whole loan (the “Yorkshire & Lexington Towers Whole Loan”) evidenced by ninepari passu promissory notes with an aggregate original principal balance of $200,000,000 (collectively, the “Yorkshire & Lexington Towers Senior Loan”) and by one subordinate companion note with an original principal balance of $200,000,000 (the “Yorkshire & Lexington Towers Subordinate Companion Loan”). The Yorkshire & Lexington Towers Whole Loan is secured by a first priority mortgage encumbering the borrowers’ fee interest in a two-property, 827-unit high rise multifamily portfolio located at 305 East 86th Street (the “Yorkshire Towers Property”) and 160 East 88th Street (the “Lexington Towers Property”) in New York, New York (collectively, the “Yorkshire & Lexington Towers Properties”). The Yorkshire & Lexington Towers Whole Loan was co-originated by UBS AG, by and through its branch office of 1285 Avenue of the Americas, New York, New York (“UBS AG”) and Natixis Real Estate Capital LLC (“Natixis”). Promissory Note A-4, with an original principal balance of $40,000,000, represents the Yorkshire & Lexington Towers Mortgage Loan and will be included in the UBS 2017-C5 Trust. Promissory Notes A-1, A-2 and A-3, with an aggregate original principal balance of $80,000,000, are currently held by Natixis, or an affiliate thereof, and are expected to be contributed to one or more future securitization transactions or may be otherwise transferred at any time. Promissory Notes A-5, A-6, A-7, A-8-1 and A-8-2, with an aggregate original principal balance of $80,000,000, are currently held by UBS AG, or an affiliate thereof, and are expected to be contributed to one or more future securitization transactions or may be otherwise transferred at any time. The Yorkshire & Lexington Towers Subordinate Companion Loan is held by Natixis, but may be otherwise transferred at any time. The lenders provide no assurances that any of the non-securitized notes will not be split further. The Yorkshire & Lexington Towers Whole Loan will initially be serviced pursuant to the pooling and servicing agreement for the UBS 2017-C5 Trust, and from and after the securitization of Promissory Note A-1, will be serviced pursuant to the pooling and servicing agreement of such securitization trust. See “Description of the Mortgage Pool—The Whole Loans—The Serviced AB Whole Loans” and “Pooling and Servicing Agreement” in the Preliminary Prospectus.
| Yorkshire & Lexington Towers Whole Loan Summary | ||||
| Note | Original Balance | Cut-off Date Balance | Anticipated Note Holder | Controlling Piece |
| Note A-1 | $40,000,000 | $40,000,000 | Natixis | No |
| Note A-2 | $20,000,000 | $20,000,000 | Natixis | No |
| Note A-3 | $20,000,000 | $20,000,000 | Natixis | No |
| Note A-4 | $40,000,000 | $40,000,000 | UBS 2017-C5 | No |
| Note A-5 | $40,000,000 | $40,000,000 | UBS AG | No |
| Note A-6 | $20,000,000 | $20,000,000 | UBS AG | No |
| Note A-7 | $10,000,000 | $10,000,000 | UBS AG | No |
| Note A-8-1 | $5,000,000 | $5,000,000 | UBS AG | No |
| Note A-8-2 | $5,000,000 | $5,000,000 | UBS AG | No |
| Yorkshire & Lexington Towers Subordinate Companion Loan | $200,000,000 | $200,000,000 | Natixis | Yes |
| Total | $400,000,000 | $400,000,000 | ||
The proceeds of the Yorkshire & Lexington Towers Whole Loan, together with two mezzanine loans with an aggregate original principal balance of $150,000,000 (collectively, the “Yorkshire & Lexington Towers Mezzanine Loans”), were used to refinance the Yorkshire & Lexington Towers Properties, fund reserves, pay closing costs, and return equity to the borrower sponsors.
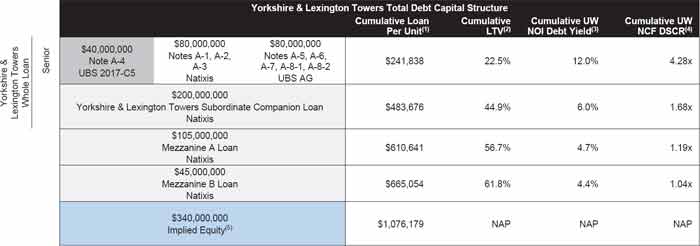
| (1) | Cumulative Basis Per Unit is calculated based on 827 units. |
| (2) | Based on the aggregate “as-is” appraised value of $890.0 million ($1,076,179 per unit), as of August 15, 2017. |
| (3) | Based on the UW NOI of $23,948,124. |
| (4) | Based on UW NCF of $23,764,985 and the coupon of 2.74000% on the Yorkshire & Lexington Towers Senior Loan, 4.25000% on the Yorkshire & Lexington Towers Subordinate Companion Loan, 5.45215% on the Yorkshire & Lexington Towers Mezzanine A Loan and 6.50000% on the Yorkshire & Lexington Towers Mezzanine B Loan. |
| (5) | Implied Equity is based on the “as-is” appraised value of $890.0 million, less total debt of $550.0 million. |
THE INFORMATION IN THIS COLLATERAL TERM SHEET IS NOT COMPLETE AND MAY BE AMENDED PRIOR TO THE TIME OF SALE. THIS TERM SHEET IS NOT AN OFFER TO SELL THESE SECURITIES AND IT IS NOT A SOLICITATION OF AN OFFER TO BUY THESE SECURITIES IN ANY JURISDICTION WHERE THE OFFER OR SALE IS NOT PERMITTED.
18
| New York, NY 10028 | Collateral Asset Summary – Loan No. 2 Yorkshire & Lexington Towers | Cut-off Date Balance: Cut-off Date LTV Ratio: UW NCF DSCR: UW NOI Debt Yield: | $40,000,000 22.5% 4.28x 12.0% |
The Borrowers and the Borrower Sponsors. The borrowers are CF E 88 LLC, SM E 88 LLC, CF E 86 LLC, SM E 86 LLC and LSG E 86 LLC (collectively, the “Yorkshire & Lexington Towers Borrower”), five tenants-in-common, each a single-purpose Delaware limited liability company structured to be bankruptcy remote with two independent directors. The nonrecourse carve-out guarantors of the Yorkshire & Lexington Towers Whole Loan are Jacob Chetrit and Laurence Gluck (collectively, the “Yorkshire & Lexington Towers Guarantors”). Jacob Chetrit has been involved in a prior deed in lieu of foreclosure and Laurence Gluck is currently subject to litigation, as described under “Description of the Mortgage Pool—Default History, Bankruptcy Issues and Other Proceedings” and “Description of the Mortgage Pool—Litigation and Other Considerations” in the Preliminary Prospectus, respectively.
Jacob Chetrit is a principal of the Chetrit Group, a real estate development firm based in New York City with over 30 years of experience in real estate acquisition and development. Some of Chetrit Group’s projects include the purchase, repositioning and sale of the 100-story Sears Tower, the multifamily and retail development of Columbus Square, the 91-unit condominium and retail development of 135 West 52nd Street, and the 420-key Empire Hotel. Laurence Gluck is the founder of Stellar Management, a real estate development and management firm founded in 1985. Based in New York City, Stellar Management owns and manages a portfolio of over 12,000 apartments in 100 buildings located across New York City and Miami and over two million SF of office space. Prior to founding Stellar Management, Laurence Gluck served as a real estate attorney at Proskauer, Rose, Goetz & Mendellsohn and later as a partner at Dreyer & Traub. Laurence Gluck is also a member of the Board of Governors of the Real Estate Board of New York. The borrower sponsors of the Yorkshire & Lexington Towers Whole Loan are The Chetrit Group LLC and Stellar Management LLC (individually and collectively, the “Yorkshire & Lexington Towers Borrower Sponsors”).
The Properties. The following table represents each property comprising the Yorkshire & Lexington Towers Properties by descending Allocated Cut-off Date Loan Amount:
| Yorkshire & Lexington Towers Properties Summary | ||||||||||
| Property Name | Allocated Cut-off Date | % of Allocated Cut-off Date Loan Amount | Year Built/ Renovated | No. of Units(2) | No. of Free Market Units(2) | No. of Rent Stabilized Units(2) | Avg. Unit Size (SF) | Occupancy(2) | Appraised Value(3) | Allocated Cut-off Date LTV Ratio(1) |
| Yorkshire Towers | $167,400,000 | 83.7% | 1964/2014-2017 | 690 | 448 | 242 | 895 | 93.0% | $745,000,000 | 22.5% |
| Lexington Towers | $32,600,000 | 16.3% | 1963/2014-2017 | 137 | 65 | 72 | 841 | 86.9% | $145,000,000 | 22.5% |
| Total/Wtd. Avg. | $200,000,000 | 100.0% | 827 | 513 | 314 | 886 | 92.0% | $890,000,000 | 22.5% | |
| (1) | Based on the Yorkshire & Lexington Towers Senior Loan amount. |
| (2) | Information is based on the underwritten rent roll. |
| (3) | Based on the aggregate “as-is” appraised value of $890.0 million ($1,076,179 per unit), as of August 15, 2017. |
Yorkshire Towers Property. The Yorkshire Towers Property is a 21-story apartment building situated on the northeast corner of East 86th Street and Second Avenue within the Upper East Side of Manhattan totaling 674,399 net rentable SF, which is comprised of 690 residential units including five employee/management units (617,810 SF, 91.6% of property NRA), five commercial units (23,589 SF, 3.5% of property NRA) and a 168-space parking garage (33,000 SF, 4.9% of property NRA) leased to a local parking operator. Situated on a 1.45-acre site, the Yorkshire Towers Property was constructed in 1964 and recently renovated from 2014 to 2017. The five commercial units include a CVS (19,813 SF), two doctor’s offices (2,399 SF), a dry cleaners (762 SF) and a vacant unit (615 SF). The Yorkshire Towers Property residential unit mix includes 96 studios, 328 one-bedroom units, 208 two-bedroom units, 57 three-bedroom units, and one four-bedroom unit, with an average unit size of 895 SF. There are 448 free market units (64.9% of residential units) totaling 392,652 SF, or 876 SF per unit, and 242 rent stabilized units (35.1% of residential units) totaling 225,158 SF, or 930 SF per unit. See “Risk Factors—Risks Relating to the Mortgage Loans—Multifamily Properties Have Special Risks” in the Preliminary Prospectus. According to the underwritten rent roll dated September 24, 2017, the rent stabilized units and free market units are 100.0% and 89.3% occupied, respectively.
The Yorkshire Towers Property features laundry facilities on each floor, which are managed by a third party laundry operator pursuant to a lease, a health club including a fitness center, heated indoor swimming pool, men’s and women’s locker rooms with saunas and indoor children’s playroom, storage units, resident lounge, outdoor landscaped terrace, security cameras throughout, valet service, on-site surface parking, and 24/7 doorman. All units feature nearly 9-foot ceiling heights, and full kitchen appliances, and many units include a private balcony. Renovated units feature hardwood flooring in a herringbone pattern, marble countertop kitchens, Bosch stainless steel appliances including a refrigerator, dishwasher, microwave, gas-fired stove and oven, California style closets, and Bosch washer and dryer.
Prior ownership completed approximately $14.3 million ($20,761 per unit) in renovations at the Yorkshire Towers Property, which included installation of new cooling towers, electrical updates, local law 11 repairs, and the conversion of the boilers to a dual-fired system. Between 2014 and 2017, the Yorkshire & Lexington Towers Borrower Sponsors invested approximately $16.4 million ($23,806 per unit) towards capital improvements at the Yorkshire Towers Property, for a cumulative total of approximately $30.7 million ($44,567 per unit). Improvements included renovations to the hallways, lobby, interior and exterior common areas, retail space, gym and pool, updating the main entrance, installing new elevator cabs, and completing numerous apartment renovations. A total of 63 rent stabilized units have been recaptured and renovated over the past 35 months, which equates to approximately 23 unitsper annum. The upgrades have averaged approximately $75,000 per unit.
Lexington Towers Property. The Lexington Towers Property is a 15-story apartment building situated on the southeast corner of East 88th Street and Lexington Avenue within the Upper East Side of Manhattan totaling 132,938 net rentable SF, which is comprised of 137 residential units including one employee unit (115,188 SF, 86.6% of property NRA), seven commercial units (8,864 SF, 6.7% of property NRA) and a 36-space parking garage (8,886 SF, 6.7% of property NRA) leased to a local parking operator. Situated on a 0.31-acre site, the Lexington Towers Property was constructed in 1963 and renovated from 2014 to 2017. The seven commercial units include a Le Pain Quotidien (2,714 SF), a doctor’s office (1,320 SF), a nail salon and spa (1,220 SF), a clothing store (913 SF) and three vacant units (2,697 SF). The Lexington Towers Property residential unit mix includes 43 studios, 70 one-bedroom units, 16 two-bedroom units, seven three-bedroom units, and one four-bedroom unit, with an average unit size of 841 SF. There are 65 free market units (47.4% of residential units) totaling 54,948 SF, or 845 SF per unit, and 72 rent stabilized units (52.6% of residential units) totaling 60,240 SF, or 837 SF per unit. See “Risk Factors—Risks Relating to the Mortgage Loans—Multifamily Properties Have Special Risks” in the Preliminary Prospectus. According to the underwritten rent roll dated September 24, 2017, the rent stabilized units and free market units are 100.0% and 72.3% occupied, respectively.
THE INFORMATION IN THIS COLLATERAL TERM SHEET IS NOT COMPLETE AND MAY BE AMENDED PRIOR TO THE TIME OF SALE. THIS TERM SHEET IS NOT AN OFFER TO SELL THESE SECURITIES AND IT IS NOT A SOLICITATION OF AN OFFER TO BUY THESE SECURITIES IN ANY JURISDICTION WHERE THE OFFER OR SALE IS NOT PERMITTED.
19
| New York, NY 10028 | Collateral Asset Summary – Loan No. 2 Yorkshire & Lexington Towers | Cut-off Date Balance: Cut-off Date LTV Ratio: UW NCF DSCR: UW NOI Debt Yield: | $40,000,000 22.5% 4.28x 12.0% |
The Lexington Towers Property features laundry facilities on each floor, which are managed by a third party laundry operator pursuant to a lease, a newly renovated fitness center, security cameras throughout, on-site surface parking, and 24/7 doorman. All units feature hardwood floors, nearly 9-foot ceiling heights, and full kitchen appliances, and many units include a private balcony. Renovated units feature hardwood flooring in a herringbone pattern, granite countertop kitchens, stainless steel appliances including a refrigerator, dishwasher, microwave, gas-fired stove and oven, California style closets, and Bosch washer and dryer.
The prior owners completed approximately $2.9 million ($21,081 per unit) in renovations at the Lexington Towers Property, which included boiler and chiller replacement, local law 11 repairs, installation of security cameras, electrical upgrades, condensate pipe relining, and modernization of the elevators. Between 2014 and 2017, the Yorkshire & Lexington Towers Borrower Sponsors invested approximately $3.3 million ($24,323 per unit) towards capital improvements at the Lexington Towers Property, for a cumulative total of approximately $6.2 million ($45,404 per unit). Improvements included renovations to the hallways, lobby, interior and exterior common areas, a newly constructed fitness center, updating the main entrance, and completing apartment renovations. A total of six rent stabilized units have been recaptured and renovated over the past 35 months, which equates to approximately two unitsper annum. The upgrades have averaged approximately $75,000 per unit.
Going forward, the Yorkshire & Lexington Towers Borrower Sponsors have indicated that they intend to reconfigure unit layouts at the Yorkshire & Lexington Towers Properties into more efficient floorplans, modernize dated units through renovation as they become available, and convert rent stabilized units to free market units. At loan origination, $3.5 million was reserved for a portion of renovations and tenant buyouts. Additionally, a debt service reserve was collected at loan origination in the amount of $2.0 million that will be available to be used solely for renovations and tenant buyouts if the Yorkshire & Lexington Towers Properties achieves a debt service coverage ratio (in the aggregate taking into account both the Yorkshire & Lexington Towers Whole Loan and the Yorkshire & Lexington Towers Mezzanine Loans) based on the trailing twelve-month period of 1.10x.
The tables below show the apartment mix at the Yorkshire & Lexington Towers Properties:
| Yorkshire & Lexington Towers Properties Unit Mix Summary(1) | |||||||||||
| Unit Type | No. of Units | % of Total Units | Avg. Unit Size (SF) | Occupancy (%) | No. of Rent Stabilized Units | Rent Stabilized Unit Occupancy (%) | Avg. In Place Monthly Rent Per Rent Stabilized Unit | No. of Free Market Units | Free Market Unit Occupancy (%) | Avg. In Place Monthly Rent Per Free Market Unit | Avg. Monthly Market Rent Per Unit(2) |
| Studio | 139 | 16.8% | 571 | 93.5% | 55 | 100.0% | $1,750 | 84 | 89.3% | $2,903 | $3,468 |
| 1 BR / 1 BA | 389 | 47.0% | 786 | 93.6% | 161 | 100.0% | $1,858 | 228 | 89.0% | $3,897 | $4,775 |
| 1 BR / 1.5 BA | 9 | 1.1% | 1,035 | 66.7% | 4 | 100.0% | $2,358 | 5 | 40.0% | $4,825 | $6,291 |
| 2 BR / 1 BA | 3 | 0.4% | 878 | 100.0% | 0 | NAP | NAP | 3 | 100.0% | $4,417 | $5,333 |
| 2 BR / 1.5 BA | 4 | 0.5% | 905 | 100.0% | 1 | 100.0% | $2,687 | 3 | 100.0% | $5,133 | $5,500 |
| 2 BR / 2 BA | 216 | 26.1% | 1,120 | 92.6% | 84 | 100.0% | $2,367 | 132 | 87.9% | $5,072 | $6,808 |
| 2 BR / 2.5 BA | 1 | 0.1% | 1,266 | 100.0% | 0 | NAP | NAP | 1 | 100.0% | $8,000 | $7,692 |
| 3 BR / 2 BA | 59 | 7.1% | 1,344 | 79.7% | 9 | 100.0% | $3,089 | 50 | 76.0% | $7,580 | $8,165 |
| 3 BR / 2.5 BA | 1 | 0.1% | 1,322 | 0.0% | 0 | NAP | NAP | 1 | 0.0% | NAP | $8,033 |
| 3 BR / 3 BA | 3 | 0.4% | 1,216 | 100.0% | 0 | NAP | NAP | 3 | 100.0% | $7,633 | $7,387 |
| 3 BR / 3.5 BA | 1 | 0.1% | 1,237 | 100.0% | 0 | NAP | NAP | 1 | 100.0% | $7,495 | $7,516 |
| 4 BR / 3 BA | 1 | 0.1% | 1,725 | 100.0% | 0 | NAP | NAP | 1 | 100.0% | $10,300 | $10,481 |
| 4 BR / 3.5 BA | 1 | 0.1% | 1,908 | 100.0% | 0 | NAP | NAP | 1 | 100.0% | $14,000 | $11,593 |
| Total/Wtd. Avg. | 827 | 100.0% | 886 | 92.0% | 314 | 100.0% | $2,020 | 513 | 87.1% | $4,443 | $5,386 |
| (1) | Information is based on the underwritten rent roll. |
| (2) | Avg. Monthly Market Rent Per Unit is based on the appraisal. |
THE INFORMATION IN THIS COLLATERAL TERM SHEET IS NOT COMPLETE AND MAY BE AMENDED PRIOR TO THE TIME OF SALE. THIS TERM SHEET IS NOT AN OFFER TO SELL THESE SECURITIES AND IT IS NOT A SOLICITATION OF AN OFFER TO BUY THESE SECURITIES IN ANY JURISDICTION WHERE THE OFFER OR SALE IS NOT PERMITTED.
20
| New York, NY 10028 | Collateral Asset Summary – Loan No. 2 Yorkshire & Lexington Towers | Cut-off Date Balance: Cut-off Date LTV Ratio: UW NCF DSCR: UW NOI Debt Yield: | $40,000,000 22.5% 4.28x 12.0% |
| Yorkshire Towers Property Unit Mix Summary(1) | |||||||||||
| Unit Type | No. of Units | % of Total Units | Avg. Unit Size (SF) | Occupancy (%) | No. of Rent Stabilized Units | Rent Stabilized Unit Occupancy (%) | Avg. In Place Monthly Rent Per Rent Stabilized Unit | No. of Free Market Units | Free Market Unit Occupancy (%) | Avg. In Place Monthly Rent Per Free Market Unit | Avg. Monthly Market Rent Per Unit(2) |
| Studio | 96 | 11.6% | 546 | 97.9% | 31 | 100.0% | $1,699 | 65 | 96.9% | $2,862 | $3,299 |
| 1 BR / 1 BA | 328 | 39.7% | 785 | 94.5% | 129 | 100.0% | $1,860 | 199 | 91.0% | $3,889 | $4,744 |
| 2 BR / 1 BA | 3 | 0.4% | 878 | 100.0% | 0 | NAP | NAP | 3 | 100.0% | $4,417 | $5,303 |
| 2 BR / 1.5 BA | 1 | 0.1% | 815 | 100.0% | 0 | NAP | NAP | 1 | 100.0% | $4,250 | $4,924 |
| 2 BR / 2 BA | 203 | 24.5% | 1,112 | 92.6% | 75 | 100.0% | $2,381 | 128 | 88.3% | $5,101 | $6,716 |
| 2 BR / 2.5 BA | 1 | 0.1% | 1,266 | 100.0% | 0 | NAP | NAP | 1 | 100.0% | $8,000 | $7,649 |
| 3 BR / 2 BA | 53 | 6.4% | 1,337 | 77.4% | 7 | 100.0% | $2,915 | 46 | 73.9% | $7,362 | $8,077 |
| 3 BR / 2.5 BA | 1 | 0.1% | 1,322 | 0.0% | 0 | NAP | NAP | 1 | 0.0% | NAP | $7,987 |
| 3 BR / 3 BA | 2 | 0.2% | 1,168 | 100.0% | 0 | NAP | NAP | 2 | 100.0% | $7,200 | $7,057 |
| 3 BR / 3.5 BA | 1 | 0.1% | 1,237 | 100.0% | 0 | NAP | NAP | 1 | 100.0% | $7,495 | $7,474 |
| 4 BR / 3 BA | 1 | 0.1% | 1,725 | 100.0% | 0 | NAP | NAP | 1 | 100.0% | $10,300 | $10,422 |
| Total/Wtd. Avg. | 690 | 83.4% | 895 | 93.0% | 242 | 100.0% | $2,031 | 448 | 89.3% | $4,422 | $5,410 |
| (1) | Information is based on the underwritten rent roll. |
| (2) | Avg. Monthly Market Rent Per Unit is based on the appraisal. |
| Lexington Towers Property Unit Mix Summary(1) | |||||||||||
| Unit Type | No. of Units | % of Total Units | Avg. Unit Size (SF) | Occupancy (%) | No. of Rent Stabilized Units | Rent Stabilized Unit Occupancy (%) | Avg. In Place Monthly Rent Per Rent Stabilized Unit | No. of Free Market Units | Free Market Unit Occupancy (%) | Avg. In Place Monthly Rent Per Free Market Unit | Avg. Monthly Market Rent Per Unit(2) |
| Studio | 43 | 5.2% | 626 | 83.7% | 24 | 100.0% | $1,816 | 19 | 63.2% | $3,114 | $3,913 |
| 1 BR / 1 BA | 61 | 7.4% | 789 | 88.5% | 32 | 100.0% | $1,849 | 29 | 75.9% | $3,961 | $4,932 |
| 1 BR / 1.5 BA | 9 | 1.1% | 1,035 | 66.7% | 4 | 100.0% | $2,358 | 5 | 40.0% | $4,825 | $6,471 |
| 2 BR / 1.5 BA | 3 | 0.4% | 935 | 100.0% | 1 | 100.0% | $2,687 | 2 | 100.0% | $5,575 | $5,846 |
| 2 BR / 2 BA | 13 | 1.6% | 1,258 | 92.3% | 9 | 100.0% | $2,252 | 4 | 75.0% | $3,950 | $7,862 |
| 3 BR / 2 BA | 6 | 0.7% | 1,405 | 100.0% | 2 | 100.0% | $3,700 | 4 | 100.0% | $9,433 | $8,781 |
| 3 BR / 3 BA | 1 | 0.1% | 1,311 | 100.0% | 0 | NAP | NAP | 1 | 100.0% | $8,500 | $8,194 |
| 4 BR / 3.5 BA | 1 | 0.1% | 1,908 | 100.0% | 0 | NAP | NAP | 1 | 100.0% | $14,000 | $11,925 |
| Total/Wtd. Avg. | 137 | 16.6% | 841 | 86.9% | 72 | 100.0% | $1,980 | 65 | 72.3% | $4,625 | $5,255 |
| (1) | Information is based on the underwritten rent roll. |
| (2) | Avg. Monthly Market Rent Per Unit is based on the appraisal. |
The Market. The Yorkshire & Lexington Towers Properties are located in the Upper East Side neighborhood of New York, New York. The Upper East Side neighborhood is bordered by Central Park and the East River and stretches from 59th to 96th Streets and is home some of New York’s oldest cultural institutions, including the Metropolitan Museum of Art, The Guggenheim Museum, The Museum of the City of New York, the Whitney Museum of American Art and the Frick Collection, as well as upscale retailers and Michelin-starred restaurants. The Yorkshire Towers Property and Lexington Towers Property are located approximately five blocks and three blocks away from Central Park, respectively, and three blocks and five blocks away from Carl Shurz Park, respectively. The Yorkshire & Lexington Towers Properties are within two blocks of Whole Foods and Fairway Market and are located near a variety of retail stores including Gap, Urban Outfitters, Banana Republic, LOFT, CVS, Duane Reade, Best Buy, Modell’s Sporting Goods, Petco, East 86th Street Cinema and AMC Lowes Orpheum 7. Both private and public schools are located throughout the Upper East Side neighborhood, adding to the area’s attraction to families. In addition, the Upper East Side is home to several hospitals including Mount Sinai, Lenox Hill, Memorial Sloan-Kettering Cancer Center, Metropolitan, Gracie Square Hospital, Manhattan Eye, Ear and Throat, and Doctors Hospital.
The Yorkshire & Lexington Towers Properties are served by numerous transportation options via the 4, 5 and 6 subway lines as well as the Q subway line, New York City’s newest subway line extension along Second Avenue, with a station situated at East 86th Street on the corner of the Yorkshire Towers Property and approximately two blocks from the Lexington Towers Property, with connections to the F subway line at East 63rd Street. In addition, the M1, M2, M3 and M4 buses along East 86th Street, providing north/south service to upper and lower Manhattan, while the M72 and M79 buses provide crosstown service to the west side of Manhattan. Metro-North at Grand Central Terminal and the 125th Street Station connect the Upper East Side to locations outside of Manhattan. Additional access to the Yorkshire & Lexington Towers Properties is provided by Park Avenue (within three blocks to the west), a north/south thoroughfare that runs parallel to Madison Avenue to the west and Lexington Avenue to the east, and the Franklin D. Roosevelt East River Drive (within five blocks to the east), a freeway-standard parkway that begins north of the Battery Park Underpass at South and Broad Streets and runs along the entire length of the East River to the Triborough Bridge connecting with Harlem River Drive.
According to a third party market research report, the estimated 2017 population and average household income within a one-, three-, and five-mile radius of the Yorkshire Towers Property is 223,511, 1,227,080, and 2,936,240, respectively, and $168,900, $129,618, and $108,388, respectively. According to a third party market research report, the estimated 2017 population and average household income within a one-, three-, and five-mile radius of the Lexington Towers Property is 239,420, 1,234,297, and 2,884,223, respectively, and $165,737, $129,064, and $108,766, respectively.
THE INFORMATION IN THIS COLLATERAL TERM SHEET IS NOT COMPLETE AND MAY BE AMENDED PRIOR TO THE TIME OF SALE. THIS TERM SHEET IS NOT AN OFFER TO SELL THESE SECURITIES AND IT IS NOT A SOLICITATION OF AN OFFER TO BUY THESE SECURITIES IN ANY JURISDICTION WHERE THE OFFER OR SALE IS NOT PERMITTED.
21
| New York, NY 10028 | Collateral Asset Summary – Loan No. 2 Yorkshire & Lexington Towers | Cut-off Date Balance: Cut-off Date LTV Ratio: UW NCF DSCR: UW NOI Debt Yield: | $40,000,000 22.5% 4.28x 12.0% |
According to a third party market research report, as of the first quarter of 2017, the Manhattan rental market exhibited average rents of $2,328 for studios, $3,098 for one-bedrooms, $4,098 for two-bedrooms, and $5,261 for three-bedrooms. The market saw a vacancy rate of 1.92% as of the first quarter of 2017, compared to 2.06% as of the fourth quarter of 2016 and 1.77% as of the first quarter of 2016. According to a third party market research report, the Yorkshire & Lexington Towers Properties are located in the Upper East Side apartment submarket, which exhibited an effective rent of $4,247 per unit and a vacancy rate of 2.3%, as of the second quarter of 2017. There are 452 units scheduled to be delivered to the Upper East Side submarket over the next four years.
Comparable rental properties to the Yorkshire & Lexington Towers Properties are shown in the table below:
| Yorkshire & Lexington Towers Properties Comparable Rentals Summary | ||||||
| Property Name/Location | Year Built/ Renovated | Occupancy (%) | Number of Units | Unit Type | Avg. Unit Size (SF)(1) | Avg. Monthly Rent per Unit(1) |
Yorkshire Towers Property 305 East 86th Street New York, NY | 1964/2014-2017 | 93.0%(2) | 690(2) | Studio One Bedroom Two Bedroom Three Bedroom Four Bedroom | 546 781 1,025 1,275 1,725 | $2,880 $3,975 $5,357 $7,414 $10,300 |
Lexington Towers Property 160 East 88th Street New York, NY | 1963/2014-2017 | 86.9%(2) | 137(2) | Studio One Bedroom Two Bedroom Three Bedroom Four Bedroom | 610 820 1,089 1,408 1,908 | $3,321 $4,420 $5,199 $9,246 $14,000 |
Gracehouse 1571-1597 Second Avenue New York, NY | 1963/N/A | 100.0% | 177 | Studio One Bedroom Two Bedroom Three Bedroom | 500 650 1,000 1,159 | $2,502 $2,802 $3,803 $5,505 |
The Wimbledon 200 East 82nd Street New York, NY | 1980/N/A | 98.7% | 231 | Studio One Bedroom Two Bedroom Three Bedroom | 480 799 985 1,742 | $3,445 $4,982 $6,875 $12,143 |
Adams Tower 351-355 East 84th Street New York, NY | 1970/N/A | 98.4% | 184 | One Bedroom Two Bedroom Three Bedroom | 922 1,250 1,600 | $4,227 $6,548 $8,971 |
Strathmore 400 East 84th Street New York, NY | 1996/N/A | 96.6% | 180 | One Bedroom Two Bedroom Three Bedroom | 740 1,207 1,658 | $4,688 $7,926 $11,153 |
The Ventura 240 East 86th Street New York, NY | 1999/N/A | 98.0% | 246 | Studio One Bedroom Two Bedroom Three Bedroom | 534 723 1,044 1,293 | $3,491 $4,602 $7,238 $8,645 |
Claridge House 201 East 87th Street New York, NY | 1975/N/A | 97.8% | 402 | Studio One Bedroom Two Bedroom Three Bedroom | 500 600 1,100 1,200 | $3,035 $3,695 $5,751 $8,349 |
The Colorado 201 East 86th Street New York, NY | 1987/N/A | N/A | 187 | Studio One Bedroom Two Bedroom Three Bedroom | 450 663 959 1,277 | $2,696 $3,383 $6,493 $10,707 |
Source:Appraisal
| (1) | Avg. Unit Size (SF) and Avg. Monthly Rent per Unit for the Yorkshire & Lexington Towers Properties are based on the underwritten rent roll and only include the 448 free market units, exclusive of the 242 rent stabilized units for the Yorkshire Towers Property and 65 free market units, exclusive of the 72 rent stabilized units for the Lexington Towers Property. |
| (2) | Information is based on the underwritten rent roll. |
THE INFORMATION IN THIS COLLATERAL TERM SHEET IS NOT COMPLETE AND MAY BE AMENDED PRIOR TO THE TIME OF SALE. THIS TERM SHEET IS NOT AN OFFER TO SELL THESE SECURITIES AND IT IS NOT A SOLICITATION OF AN OFFER TO BUY THESE SECURITIES IN ANY JURISDICTION WHERE THE OFFER OR SALE IS NOT PERMITTED.
22
| New York, NY 10028 | Collateral Asset Summary – Loan No. 2 Yorkshire & Lexington Towers | Cut-off Date Balance: Cut-off Date LTV Ratio: UW NCF DSCR: UW NOI Debt Yield: | $40,000,000 22.5% 4.28x 12.0% |
Operating History and Underwritten Net Cash Flow. The following table presents certain information relating to the historical and forecasted operating performance and the Underwritten Net Cash Flow at the Yorkshire & Lexington Towers Properties:
| Cash Flow Analysis | ||||||||
| 2014(1) | 2015 | 2016 | 6/30/2017 TTM | UW | Appraisal Stabilized Year 4(2) | Stabilized UW Year 4(3) | UW Per Unit | |
| Gross Potential Rent(4)(5) | N/A | $18,619,740 | $20,916,142 | $23,920,451 | $35,873,277 | $44,649,193 | $44,808,378 | $43,378 |
| Total Other Income(6) | N/A | $4,492,920 | $3,013,861 | $3,183,115 | $7,284,878 | $7,318,294 | $7,239,421 | $8,809 |
| Less Vacancy & Concessions(7) | N/A | ($180,604) | ($1,647,218) | ($1,639,254) | ($5,074,133) | ($1,705,390) | ($1,344,251) | ($6,136) |
| Effective Gross Income | N/A | $22,932,055 | $22,282,785 | $25,464,312 | $38,084,023 | $50,262,097 | $50,703,547 | $46,051 |
| Total Operating Expenses | N/A | $12,878,848 | $12,726,214 | $13,142,223 | $14,135,899 | $16,235,888 | $16,576,405 | $17,093 |
| Net Operating Income | N/A | $10,053,207 | $9,556,571 | $12,322,089 | $23,948,124 | $34,026,209 | $34,127,142 | $28,958 |
| Capital Expenditures | N/A | $0 | $0 | $0 | $183,139 | $263,191 | $183,139 | $221 |
| Net Cash Flow | N/A | $10,053,207 | $9,556,571 | $12,322,089 | $23,764,985 | $33,763,018 | $33,944,003 | $28,736 |
| Occupancy % | N/A | 67.0% | 78.7% | 83.6% | 92.0%(5) | 96.2% | 97.0% | |
| NOI DSCR(8) | N/A | 1.81x | 1.72x | 2.22x | 4.31x | 6.12x | 6.14x | |
| NCF DSCR(8) | N/A | 1.81x | 1.72x | 2.22x | 4.28x | 6.08x | 6.11x | |
| NOI Debt Yield(8) | N/A | 5.0% | 4.8% | 6.2% | 12.0% | 17.0% | 17.1% | |
| NCF Debt Yield(8) | N/A | 5.0% | 4.8% | 6.2% | 11.9% | 16.9% | 17.0% | |
| (1) | The Yorkshire & Lexington Towers Properties were acquired in 2014. As such, historical information is not available. |
| (2) | Appraisal Stabilized Year 4 information is based on the appraisal, forecasting operating performance for September 1, 2020 to September 1, 2021 under the following assumptions: annual rent growth rates of 1.5% for Years 1 and 2 and 3.0% for Years 3 and 4 for rent stabilized units, and 0.0% for Year 1 and 4.0% in Years 2 to 4 for free market units, stabilized occupancy rate of 97.0%, real estate tax expenses at 5.75% annually, and operating expenses growing at 3.5% annually. |
| (3) | Stabilized UW Year 4 information is projected based on the following assumptions: annual rent growth rates of 1.5% for Years 1 and 2 and 3.0% for Years 3 and 4 for rent stabilized units, and 0.0% for Year 1 and 4.0% in Years 2 to 4 for free market units, rent-regulated units are converted to free market status at a rate of 10%per annum (32 units in the first year and 220 units over holding period), stabilized occupancy rate of 97.0%, rent regulated units are converted to free market status at a recapture rate of 10%per annum(25 units for Year 1 and 170 units over the holding period at the Yorkshire Towers Property and seven units for Year 1 and 50 units over the holding period at the Lexington Towers Property), real estate tax expenses growing at 5.75% annually at the Yorkshire Towers Property and 8.00% annually at the Lexington Towers Property, and operating expenses growing at 3.5% annually. See “Description of the Mortgage Pool—Litigation and Other Considerations” in the Preliminary Prospectus. |
| (4) | Gross Potential Rent has been increasing due to higher asking rents for 69 rent regulated units that have been converted and renovated into free market units over the last 35 months ending August 2017 in combination with property-wide improvements, unit reconfigurations, and renovations of existing free market rents with new finishes. |
| (5) | UW Gross Potential Rent is underwritten to the September 24, 2017 rent roll, which reflects physical occupancy of 92.0% and includes the gross up of vacant space based on the appraisal’s concluded market rents of $4,683,815 and credit loss of ($253,990). UW Gross Potential Rent excludes four management units and two employee units with assumed rental rates of $1 per month. |
| (6) | Total Other Income includes contractual rent paid by the laundry operator of $234,000 at the Yorkshire & Lexington Towers Properties, contractual rent paid by six commercial tenants at the Yorkshire Towers Property of $5,278,134, contractual rent paid by six commercial tenants at the Lexington Towers Property of $1,127,432, eight storage leases at the Yorkshire Towers Property of $12,000, straight-line rent of $414,930 for CVS Pharmacy at the Yorkshire Towers Property and other non-rental income such as late fees, and pet fees. Total Other Rental Income was lower in 2015, 2016, and 6/30/2017 TTM primarily due to the CVS Pharmacy lease commencing May 2017 and A&P, a previous retail tenant, vacating in 2015. |
| (7) | Vacancy & Concessions increased in 2016 over 2015 due to leasing incentives offered while the lobbies, hallways, roofs, and apartment units underwent renovation and construction. |
| (8) | Debt service coverage ratios and debt yields are based on the Yorkshire & Lexington Towers Senior Loan. |
Escrows and Reserves.The Yorkshire & Lexington Towers Borrower deposited $2,724,408 upfront in escrow for annual real estate taxes, $89,787 upfront in escrow for annual insurance premiums, $2,000,000 upfront for debt service, $3,500,000 upfront for unit renovations and tenant buyouts relating to renovations to residential units in connection with the deregulation of such units from rent regulatory laws and units not subject to rent regulation laws, and $4,102,064 upfront for the holdback reserve funds. The Yorkshire & Lexington Towers Borrower will be required to escrow monthly (a) 1/12 of the annual estimated tax payments, (b) 1/12 of the annual estimated insurance premiums, (c) 1/12 of $0.15 PSF of retail and garage space (excluding CVS so long as (i) no event of default exists under the Yorkshire & Lexington Towers Whole Loan, (ii) the CVS lease is in full force and effect and (iii) no default exists under the CVS lease beyond all applicable notice and cure periods) for commercial replacement reserves, (d) 1/12 of $250 per free market residential unit for residential replacement reserves subject to a cap calculated on a quarterly basis equal to the product of (x) $750 and (y) the number of free market residential units at the Yorkshire & Lexington Towers Properties at the time of calculation, and (e) $1.00 PSF of retail space (excluding garage space and CVS (with respect to CVS, so long as (i) no event of default exists under the Yorkshire & Lexington Towers Whole Loan, (ii) the CVS lease is in full force and effect and (iii) no default exists under the CVS lease beyond all applicable notice and cure periods)) for tenant improvements and leasing commissions.
During any period that amounts on deposit in the holdback reserve funds exceed an amount equal to five times the difference of (x) $38,000,000 and (y) the gross income from operations of the Yorkshire & Lexington Towers Properties, in the aggregate, at the time of calculation (the “Holdback Threshold Amount”), andprovided that no event of default has occurred or is continuing, funds on deposit in the holdback reserve funds in excess of the Holdback Threshold Amount, if any, will be (i) during a Cash Management Trigger Event (as defined below), transferred to the cash management account or (ii) returned to the Yorkshire & Lexington Towers Borrower. The lenders will not be required to disburse holdback reserve funds more than once each calendar month and each disbursement must be at least $250,000 (or a lesser amount if the total remaining balance in the holdback reserve funds is less than $250,000, in which case only one disbursement of the amount remaining in the holdback reserve funds will be made).
Provided that no event of default has occurred or is continuing, the Yorkshire & Lexington Towers Borrower may, upon written request to the lenders made at least three business days prior to the monthly payment date, request for funds held in the debt service reserve to be applied to the monthly debt service payment due under the Yorkshire & Lexington Towers Whole Loan and the Yorkshire & Lexington Towers Mezzanine Loans,provided that the Yorkshire & Lexington Towers Borrower delivers, among other conditions detailed in the loan documents, evidence of a shortfall between net operating income and the monthly debt service payment for the month of disbursement. In the event the Yorkshire & Lexington Towers Properties achieves a debt service coverage ratio (in the aggregate taking into account both the Yorkshire & Lexington Towers Whole Loan and the Yorkshire & Lexington Towers Mezzanine Loans) based on the trailing twelve-month period of greater than 1.10x (the “Debt Service Shortfall Reserve Transfer Date”), all funds remaining on deposit in the debt service reserve will be transferred to the renovation and tenant buyout reserve. In the event the balance of the renovation and tenant buyout
THE INFORMATION IN THIS COLLATERAL TERM SHEET IS NOT COMPLETE AND MAY BE AMENDED PRIOR TO THE TIME OF SALE. THIS TERM SHEET IS NOT AN OFFER TO SELL THESE SECURITIES AND IT IS NOT A SOLICITATION OF AN OFFER TO BUY THESE SECURITIES IN ANY JURISDICTION WHERE THE OFFER OR SALE IS NOT PERMITTED.
23
| New York, NY 10028 | Collateral Asset Summary – Loan No. 2 Yorkshire & Lexington Towers | Cut-off Date Balance: Cut-off Date LTV Ratio: UW NCF DSCR: UW NOI Debt Yield: | $40,000,000 22.5% 4.28x 12.0% |
reserve falls below $500,000, the Yorkshire & Lexington Towers Borrower is required to deposit with the lenders an additional amount necessary to achieve a balance of at least $1,000,000. After November 6, 2019, the Yorkshire & Lexington Towers Borrower may request a portion of the funds in the renovation and tenant buyout reserve (subject to a cap) be disbursed for replacements (subject to the conditions for disbursement of funds from the commercial replacement reserve and/or residential replacement reserve, as applicable).
Lockbox and Cash Management. A soft lockbox is in place with respect to the Yorkshire & Lexington Towers Whole Loan;provided,however, that a hard lockbox is in place with respect to the commercial tenants. The Yorkshire & Lexington Towers Whole Loan has springing cash management. Prior to the continuance of a Cash Management Trigger Event (as defined below) for the Yorkshire & Lexington Towers Whole Loan, all funds in the lockbox account will be disbursed to the Yorkshire & Lexington Towers Borrower.
During the continuance of a Cash Management Trigger Event for the Yorkshire & Lexington Towers Whole Loan, funds in the lockbox account are required to be applied on each monthly payment date to fund the required reserves deposits as described above under “Escrows and Reserves,” to pay debt service on the Yorkshire & Lexington Towers Whole Loan, to pay operating expenses not otherwise paid or reserved for as described above under “Escrows and Reserves” and referenced in the annual budget approved by the lenders together with other amounts incurred by the Yorkshire & Lexington Towers Borrower in connection with the operation and maintenance of the Yorkshire & Lexington Towers Properties, to pay debt service on the Yorkshire & Lexington Towers Mezzanine Loans, and during the continuance of a Cash Sweep Trigger Event (as defined below), to disburse the remainder to an account to be held by the lenders as additional security for the Yorkshire & Lexington Towers Whole Loan (the “Excess Cash Flow Account”). During the continuance of an event of default under the Yorkshire & Lexington Towers Mezzanine Loans, funds on deposit in the Excess Cash Flow Account will be allocated to the applicable mezzanine loan subaccount. Provided that no event of default under the Yorkshire & Lexington Towers Mezzanine Loans and Cash Sweep Trigger Event has occurred and is continuing, funds on deposit in the Excess Cash Flow Account may be disbursed to the Yorkshire & Lexington Towers Borrower in accordance with the loan documents.
A “Cash Management Trigger Event” will occur upon (i) an event of default under the Yorkshire & Lexington Towers Whole Loan, (ii) an event of default under the Yorkshire & Lexington Towers Mezzanine Loans, (iii) any bankruptcy action involving the Yorkshire & Lexington Towers Borrower, the Yorkshire & Lexington Towers Borrower Sponsors, the Yorkshire & Lexington Towers Guarantors, or the property manager, (iv) the date (a) following the Debt Service Shortfall Reserve Transfer Date but prior to the second anniversary of the first payment date, the debt service coverage ratio (in the aggregate taking into account both the Yorkshire & Lexington Towers Whole Loan and the Yorkshire & Lexington Towers Mezzanine Loans) based on the trailing twelve-month period falling below 1.05x and (b) after the second anniversary of the first payment date, the debt service coverage ratio based on the trailing twelve-month period falling below 1.10x (the “DSCR Cash Management Trigger Event Threshold”), or (v) any indictment for fraud or misappropriation of funds by the Yorkshire & Lexington Towers Borrower, the Yorkshire & Lexington Towers Borrower Sponsors, the Yorkshire & Lexington Towers Guarantors, or the property manager. A Cash Management Trigger Event will continue until, in regard to clause (i) and (ii) above, the cure of such event of default and acceptance of such cure by the lenders, in regard to clause (iii) above, the filing being discharged, stayed or dismissed within 60 days for the Yorkshire & Lexington Towers Borrower, the Yorkshire & Lexington Towers Borrower Sponsors, or the Yorkshire & Lexington Towers Guarantors, or within 120 days for the property manager, and the lenders’ determination that such filing does not materially affect the monetary obligations of the Yorkshire & Lexington Towers Borrower, the Yorkshire & Lexington Towers Borrower Sponsors, the Yorkshire & Lexington Towers Guarantors, or the property manager, in regard to clause (iv) above, (a) the date the debt service coverage ratio (in the aggregate taking into account both the Yorkshire & Lexington Towers Whole Loan and the Yorkshire & Lexington Towers Mezzanine Loans) based on the trailing twelve-month period is greater than the DSCR Cash Management Trigger Event Threshold for two consecutive quarters or (b) the Yorkshire & Lexington Towers Borrower delivers to the lenders the DSCR Trigger Cure Deposit (as defined below) (collectively, the “DSCR Cure Event”), or in regard to clause (v) above, the dismissal of the related indictment for the Yorkshire & Lexington Towers Borrower, the Yorkshire & Lexington Towers Borrower Sponsors, or the Yorkshire & Lexington Towers Guarantors, or replacement of the property manager with a qualified manager pursuant to the loan documents.
A “DSCR Trigger Cure Deposit” means a deposit with the lenders in the form of cash or a letter of credit equal to (A) an amount that if used to repay the Yorkshire & Lexington Towers Whole Loan and Yorkshire & Lexington Towers Mezzanine Loans,pro-rata, results in a debt service coverage ratio greater than the DSCR Cash Management Trigger Event Threshold for two consecutive quarters or (B) the positive difference between (x) the amount of net operating income necessary to achieve a debt service coverage ratio over a twelve month period equal to the DSCR Cash Management Trigger Event Threshold and (y) the lesser of (i) the amount of net operating income necessary to achieve a debt service coverage ratio of 1.00x and (ii) the net operating income over a twelve month period.
A “Cash Sweep Trigger Event” will occur upon (i) an event of default under the Yorkshire & Lexington Towers Whole Loan, (ii) any bankruptcy action involving the Yorkshire & Lexington Towers Borrower, the Yorkshire & Lexington Towers Borrower Sponsors, the Yorkshire & Lexington Towers Guarantors, or the property manager, or (iii) the date (a) following the Debt Service Shortfall Reserve Transfer Date but prior to the second anniversary of the first payment date, the debt service coverage ratio (in the aggregate taking into account both the Yorkshire & Lexington Towers Whole Loan and the Yorkshire & Lexington Towers Mezzanine Loans) based on the trailing twelve-month period falling below 1.05x and (b) after the second anniversary of the first payment date, the debt service coverage ratio based on the trailing twelve-month period falling below 1.10x. A Cash Sweep Trigger Event will continue until, in regard to clause (i) above, the cure of such event of default and acceptance of such cure by the lenders, in regard to clause (ii) above, the filing being discharged, stayed or dismissed within 60 days for the Yorkshire & Lexington Towers Borrower, the Yorkshire & Lexington Towers Borrower Sponsors, or the Yorkshire & Lexington Towers Guarantors, or within 120 days for the property manager, and lenders’ determination that such filing does not materially affect the monetary obligations of the Yorkshire & Lexington Towers Borrower, the Yorkshire & Lexington Towers Borrower Sponsors, the Yorkshire & Lexington Towers Guarantors, or the property manager, or in regard to clause (iii) above, a DSCR Cure Event.
Additional Secured Indebtedness (not including trade debts). In addition to the Yorkshire & Lexington Towers Mortgage Loan, the Yorkshire & Lexington Towers Properties also secure the other notes that comprise the Yorkshire & Lexington Towers Senior Loan, which have an aggregate Cut-off Date principal balance of $160,000,000, and the Yorkshire & Lexington Towers Subordinate Companion Loan, which has a Cut-off Date principal balance of $200,000,000. The Yorkshire & Lexington Towers Subordinate Companion Loan is coterminous with the Yorkshire & Lexington Towers Senior Loan and accrues interest at 4.2500%per annum. The Yorkshire & Lexington Towers Mortgage Loan along with the other notes that comprise the Yorkshire & Lexington Towers Senior Loan are eachpari passuin right of payment and the Yorkshire & Lexington Towers Senior Loan is senior in right of payment to the Yorkshire & Lexington Towers Subordinate Companion Loan. The holders of the Yorkshire & Lexington Towers Mortgage Loan, the other notes that comprise the Yorkshire & Lexington Towers Senior Loan and the Yorkshire & Lexington Towers Subordinate Companion Loan have entered into a co-lender agreement which sets forth the allocation of collections on the Yorkshire & Lexington Towers Whole Loan. See “Description of the Mortgage Pool—The Whole Loans—The Serviced AB Whole Loans”in the Preliminary Prospectus.
THE INFORMATION IN THIS COLLATERAL TERM SHEET IS NOT COMPLETE AND MAY BE AMENDED PRIOR TO THE TIME OF SALE. THIS TERM SHEET IS NOT AN OFFER TO SELL THESE SECURITIES AND IT IS NOT A SOLICITATION OF AN OFFER TO BUY THESE SECURITIES IN ANY JURISDICTION WHERE THE OFFER OR SALE IS NOT PERMITTED.
24
| New York, NY 10028 | Collateral Asset Summary – Loan No. 2 Yorkshire & Lexington Towers | Cut-off Date Balance: Cut-off Date LTV Ratio: UW NCF DSCR: UW NOI Debt Yield: | $40,000,000 22.5% 4.28x 12.0% |
Mezzanine Loan and Preferred Equity. The Yorkshire & Lexington Towers Mezzanine Loans refer to two mezzanine loans, with an aggregate original principal amount of $150,000,000, which funded concurrently with the funding of the Yorkshire & Lexington Towers Mortgage Loan. The Mezzanine A loan has an original principal amount of $105,000,000, and accrues interest at a rate of 5.45215%per annum and is senior to the Mezzanine B loan. The Mezzanine B loan has an original principal amount of $45,000,000, and accrues interest at a rate of 6.50000%per annum. The Yorkshire & Lexington Towers Mezzanine Loans are co-terminus with the Yorkshire & Lexington Towers Whole Loan and are interest-only for their full terms. The Yorkshire & Lexington Towers Mezzanine Loans are currently held by Natixis, and are expected to be sold to one or more third party investors. The Yorkshire & Lexington Towers Mezzanine Loans and the Yorkshire & Lexington Towers Whole Loan are subject to an intercreditor agreement between the Yorkshire & Lexington Towers Mezzanine Loans lenders and the Yorkshire & Lexington Towers Whole Loan lenders. The Yorkshire & Lexington Towers Mezzanine Loans may be transferred at any time subject to the requirement and limitations set forth in the related mezzanine intercreditor agreements.
The following table presents certain information relating to the Yorkshire & Lexington Towers Mezzanine Loans:
| Mezzanine Debt Summary | |||||||
| Mezzanine Debt Cut-off Date Principal Balance | Mezzanine Debt Interest Rate | Original Term to Maturity (mos.) | Original Amort Term (mos.) | Original IO Term (mos.) | Total Debt UW NCF DSCR | Total Debt UW NOI Debt Yield | Total Debt Cut-off Date LTV |
| $105,000,000 | 5.45215% | 60 | 0 | 60 | 1.19x | 4.7% | 56.7% |
| $45,000,000 | 6.50000% | 60 | 0 | 60 | 1.04x | 4.4% | 61.8% |
Release of Property. The Yorkshire & Lexington Towers Borrower may obtain the release of the Lexington Towers Property,providedthat, among other things, (i) no event of default has occurred and is continuing, (ii) the Yorkshire & Lexington Towers Borrower pays an amount equal to the greater of (a) 125% of the allocated loan amount (identified in the “Yorkshire & Lexington Towers Properties Summary” chart above) and (b) the net sales proceeds applicable to Lexington Towers Property, (iii) the debt service coverage ratio with respect to the remaining Yorkshire Towers Property is no less than the greater of (a) 1.05x and (b) the debt service coverage ratio immediately preceding the release of the Lexington Towers Property, (iv) the debt yield with respect to the remaining Yorkshire Towers Property is no less than the greater of (a) 4.4% and (b) the debt yield immediately preceding the release of the Lexington Towers Property and (v) the loan-to-value ratio with respect to the remaining Yorkshire Towers Property is no greater than the lesser of (a) 61.8% and (b) the loan-to-value ratio immediately preceding the release of the Lexington Towers Property.
Terrorism Insurance.The Yorkshire & Lexington Towers Borrower is required to obtain and maintain property insurance, commercial general liability insurance, and business income or rental loss insurance that covers perils of terrorism and acts of terrorism, both foreign and domestic.
THE INFORMATION IN THIS COLLATERAL TERM SHEET IS NOT COMPLETE AND MAY BE AMENDED PRIOR TO THE TIME OF SALE. THIS TERM SHEET IS NOT AN OFFER TO SELL THESE SECURITIES AND IT IS NOT A SOLICITATION OF AN OFFER TO BUY THESE SECURITIES IN ANY JURISDICTION WHERE THE OFFER OR SALE IS NOT PERMITTED.
25
| Various | Collateral Asset Summary – Loan No. 3 Griffin Portfolio
| Cut-off Date Balance: Cut-off Date LTV Ratio: UW NCF DSCR: UW NOI Debt Yield: | $40,000,000 61.5% 2.49x 10.2% |
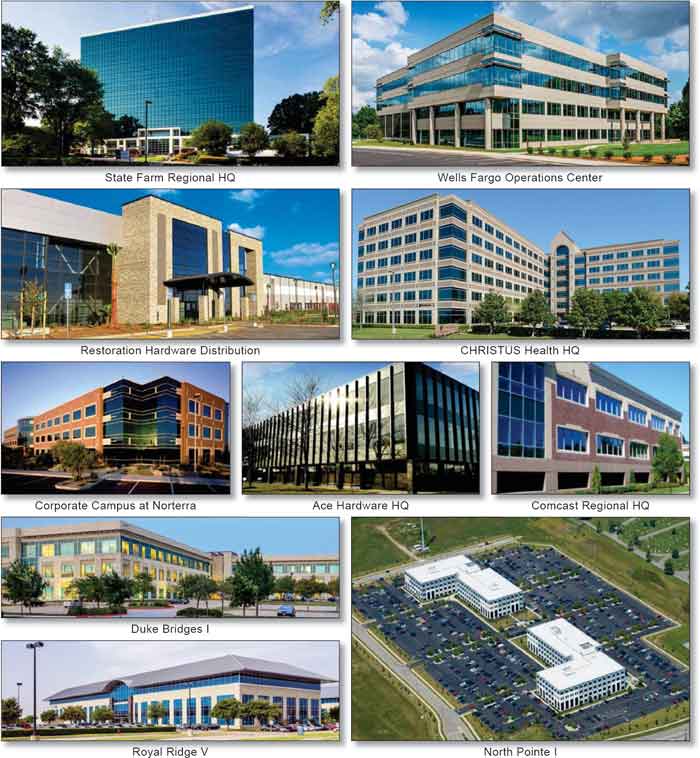
THE INFORMATION IN THIS COLLATERAL TERM SHEET IS NOT COMPLETE AND MAY BE AMENDED PRIOR TO THE TIME OF SALE. THIS TERM SHEET IS NOT AN OFFER TO SELL THESE SECURITIES AND IT IS NOT A SOLICITATION OF AN OFFER TO BUY THESE SECURITIES IN ANY JURISDICTION WHERE THE OFFER OR SALE IS NOT PERMITTED.
26
| Various | Collateral Asset Summary – Loan No. 3 Griffin Portfolio
| Cut-off Date Balance: Cut-off Date LTV Ratio: UW NCF DSCR: UW NOI Debt Yield: | $40,000,000 61.5% 2.49x 10.2% |
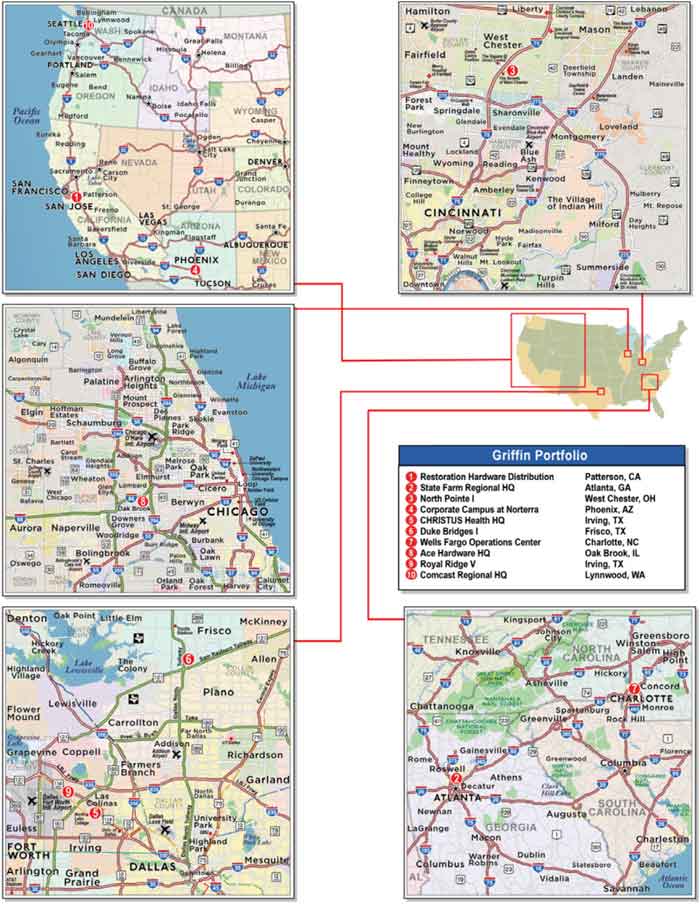
THE INFORMATION IN THIS COLLATERAL TERM SHEET IS NOT COMPLETE AND MAY BE AMENDED PRIOR TO THE TIME OF SALE. THIS TERM SHEET IS NOT AN OFFER TO SELL THESE SECURITIES AND IT IS NOT A SOLICITATION OF AN OFFER TO BUY THESE SECURITIES IN ANY JURISDICTION WHERE THE OFFER OR SALE IS NOT PERMITTED.
27
| Various | Collateral Asset Summary – Loan No. 3 Griffin Portfolio
| Cut-off Date Balance: Cut-off Date LTV Ratio: UW NCF DSCR: UW NOI Debt Yield: | $40,000,000 61.5% 2.49x 10.2% |
| Mortgage Loan Information | Property Information | ||||||
| Mortgage Loan Seller(1): | UBS AG | Single Asset/Portfolio: | Portfolio | ||||
| Credit Assessment (Fitch/KBRA/Moody’s/S&P): | [ ] | Location: | Various | ||||
| General Property Type: | Various | ||||||
| Original Balance(2): | $40,000,000 | Detailed Property Type: | Various | ||||
| Cut-off Date Balance(2): | $40,000,000 | Title Vesting(6): | Fee | ||||
| % of Initial Pool Balance: | [.]% | Year Built/Renovated: | Various | ||||
| Loan Purpose: | Recapitalization | Size: | 3,708,698 SF | ||||
| Borrower Sponsor: | Griffin Capital Essential Asset REIT Inc. | Cut-off Date Balance per SF(2): | $101 | ||||
| Mortgage Rate: | 3.7700% | Maturity Date Balance per SF(2): | $101 | ||||
| Note Date: | 9/29/2017 | Property Manager:
| Griffin Capital Essential Asset Property Management, LLC (borrower-related)
| ||||
| First Payment Date: | 11/1/2017 | ||||||
| Maturity Date: | 10/1/2027 | ||||||
| Original Term to Maturity: | 120 months | ||||||
| Original Amortization Term: | 0 months | ||||||
| IO Period: | 120 months | ||||||
| Seasoning: | 1 month | ||||||
| Prepayment Provisions(3): | LO (24); YM1 (90); O (6) | Underwriting and Financial Information | |||||
| Lockbox/Cash Mgmt Status: | Hard/Springing | UW NOI: | $38,310,729 | ||||
| Additional Debt Type(2)(4): | Pari Passu | UW NOI Debt Yield(2): | 10.2% | ||||
| Additional Debt Balance(2)(4): | $335,000,000 | UW NOI Debt Yield at Maturity(2): | 10.2% | ||||
| Future Debt Permitted (Type): | No (N/A) | UW NCF DSCR(2): | 2.49x | ||||
| Reserves(5) | Most Recent NOI: | $36,689,111 (6/30/2017 TTM) | |||||
| Type | Initial | Monthly | Cap | 2nd Most Recent NOI: | $36,419,432 (12/31/2016) | ||
| RE Tax: | $930,000 | $466,667 | N/A | 3rd Most Recent NOI(7): | $26,778,722 (12/31/2015) | ||
| Insurance: | $0 | Springing | N/A | Most Recent Occupancy: | 98.4% (Various) | ||
| Replacements: | $0 | Springing | Springing | 2nd Most Recent Occupancy: | 100.0% (12/31/2016) | ||
| TI/LC: | $0 | Springing | Springing | 3rd Most Recent Occupancy: | 100.0% (12/31/2015) | ||
| T-Mobile Work Reserve: | $3,653,980 | $0 | N/A | Appraised Value (as of)(8): | $610,000,000 (9/21/2017) | ||
| Unfunded Obligations Reserve: | $2,003,531 | $0 | N/A | Cut-off Date LTV Ratio(2)(8): | 61.5% | ||
| Joinder Reserve: | $77,275,000 | $0 | N/A | Maturity Date LTV Ratio(2)(8): | 61.5% | ||
| Sources and Uses | ||||||
| Sources | Proceeds | % of Total | Uses | Proceeds | % of Total | |
| Loan Amount(2): | $375,000,000 | 100.0% | Return of Equity(9): | $286,278,632 | 76.3% | |
| Reserves: | $6,587,511 | 1.8% | ||||
| Joinder Reserve: | $77,275,000 | 20.6% | ||||
| Closing Costs: | $4,858,857 | 1.3% | ||||
| Total Sources: | $375,000,000 | 100.0% | Total Uses: | $375,000,000 | 100.0% | |
| (1) | The Griffin Portfolio Whole Loan (as defined) was originated by Bank of America, N.A. (“BAML”). UBS AG acquired sixpari passu notes, with an aggregate original principal balance of $131,250,000, from BAML and has re-underwritten such mortgage loan in accordance with the procedures described under “Transaction Parties—The Sponsors and Mortgage Loan Sellers—UBS AG, New York Branch” in the Preliminary Prospectus. |
| (2) | The Griffin Portfolio Mortgage Loan (as defined) is part of the Griffin Portfolio Whole Loan, which is comprised of tenpari passupromissory notes with an aggregate principal balance of $375,000,000. The Cut-off Date Balance per SF, Maturity Date Balance per SF, UW NOI Debt Yield, UW NOI Debt Yield at Maturity, UW NCF DSCR, Cut-off Date LTV Ratio and Maturity Date LTV Ratio numbers presented above are based on the aggregate principal balance of the promissory notes comprising the Griffin Portfolio Whole Loan. |
| (3) | Partial release and substitution is permitted. See “Release of Property” below for further discussion of release requirements. |
| (4) | See “The Mortgage Loan” below for further discussion of additional debt. |
| (5) | See “Escrows and Reserves” below for further discussion of reserve requirements. |
| (6) | See “The Properties” and “Escrows and Reserves” below for further discussion of the title to the State Farm Regional HQ Property. |
| (7) | The 3rd Most Recent NOI includes partial year cash flow for the Restoration Hardware Distribution Property as the single tenant lease rent recommencement was in August 2015 and excludes the Royal Ridge V Property as the single tenant lease rent commencement was in December 2015. |
| (8) | The Appraised Value represents the “as-is portfolio value” conclusion, which includes a portfolio premium to the portfolio properties if sold together on a bulk basis. The sum of the “as-is” appraised values on a stand-alone basis is $592,060,000. The Cut-off Date LTV Ratio and Maturity Date LTV Ratio based on the aggregate stand-alone appraised “as-is” values are 63.3% and 63.3%, respectively. |
| (9) | Proceeds from the Griffin Portfolio Whole Loan were used to return equity to the borrower sponsor to pay down a portion of the borrower sponsor’s credit facility. The borrower sponsor maintains a current cost basis in the Griffin Portfolio Properties (as defined below) of approximately $522.5 million. |
The Mortgage Loan. The third largest mortgage loan (the “Griffin Portfolio Mortgage Loan”) is part of a whole loan (the “Griffin Portfolio Whole Loan”) in the aggregate original principal amount of $375,000,000. The Griffin Portfolio Whole Loan is secured by the first priority fee mortgage encumbering one industrial and nine office properties located across eight states (the “Griffin Portfolio Properties”). The Griffin Portfolio Whole Loan was originated by BAML and UBS AG acquired, from BAML, sixpari passu notes, each as described below, in the aggregate original principal balance of $131,250,000. Promissory Notes A-2-3 and A-2-5, with an aggregate original principal balance of $40,000,000, collectively represent the Griffin Portfolio Mortgage Loan and will be
THE INFORMATION IN THIS COLLATERAL TERM SHEET IS NOT COMPLETE AND MAY BE AMENDED PRIOR TO THE TIME OF SALE. THIS TERM SHEET IS NOT AN OFFER TO SELL THESE SECURITIES AND IT IS NOT A SOLICITATION OF AN OFFER TO BUY THESE SECURITIES IN ANY JURISDICTION WHERE THE OFFER OR SALE IS NOT PERMITTED.
28
| Various | Collateral Asset Summary – Loan No. 3 Griffin Portfolio
| Cut-off Date Balance: Cut-off Date LTV Ratio: UW NCF DSCR: UW NOI Debt Yield: | $40,000,000 61.5% 2.49x 10.2% |
included in the UBS 2017-C5 Trust. The table below summarizes the remaining promissory notes, which are currently held by BAML, UBS AG and KeyBank National Association, or affiliates thereof, and are expected to be contributed to one or more future securitization transactions or may be otherwise transferred at any time. The Griffin Portfolio Whole Loan will be serviced pursuant to the pooling and servicing agreement related to the expected securitization of the controllingpari passu Promissory Note A-1-1. See “Description of the Mortgage Pool—The Whole Loans—The Serviced Pari Passu Whole Loans” and “Pooling and Servicing Agreement” in the Preliminary Prospectus.
| Griffin Portfolio Whole Loan Summary | ||||
| Note | Original Balance | Cut-off Date Balance | Anticipated Note Holder | Controlling Piece |
| Note A-1-1 | $100,000,000 | $100,000,000 | BAML | Yes |
| Note A-1-2 | $96,250,000 | $96,250,000 | BAML | No |
| Note A-1-3 | $10,000,000 | $10,000,000 | BAML | No |
| Note A-2-1 | $35,000,000 | $35,000,000 | UBS AG | No |
| Note A-2-2 | $30,000,000 | $30,000,000 | UBS AG | No |
| Note A-2-3 | $25,000,000 | $25,000,000 | UBS 2017-C5 | No |
| Note A-2-4 | $20,000,000 | $20,000,000 | UBS AG | No |
| Note A-2-5 | $15,000,000 | $15,000,000 | UBS 2017-C5 | No |
| Note A-2-6 | $6,250,000 | $6,250,000 | UBS AG | No |
| Note A-3 | $37,500,000 | $37,500,000 | KeyBank National Association | No |
| Total | $375,000,000 | $375,000,000 | ||
The Borrowers and the Borrower Sponsor. The borrowers are WR Griffin Patterson, LLC, The GC Net Lease (Frisco Parkwood) Investors, LLC, The GC Net Lease (West Chester) Investors, LLC, The GC Net Lease (Lynnwood I) Investors, LLC, The GC Net Lease (Phoenix Deer Valley) Investors, LLC, The GC Net Lease (Atlanta Perimeter) Investors, LLC, The GC Net Lease (Charlotte Research) Investors, L.P., The GC Net Lease (Irving Carpenter) Investors, LLC, The GC Net Lease (Oak Brook) Investors, LLC and The GC Net Lease (Irving) Investors, LLC (collectively, the “Griffin Portfolio Borrower”). Each borrowing entity is a single-purpose Delaware limited liability company, with the exception of The GC Net Lease (Charlotte Research) Investors, L.P., which is a Delaware limited partnership, structured to be bankruptcy remote with at least two independent directors. The Griffin Portfolio Borrower is indirectly wholly-owned by the borrower sponsor and nonrecourse carve-out guarantor, Griffin Capital Essential Asset REIT Inc. (the “Griffin Portfolio Guarantor”), of which, no shareholder owns or is permitted to own more than a 9.8% interest therein.
The sponsor of the Griffin Portfolio Guarantor is Griffin Capital Company, LLC (“Griffin”), a privately-held investment asset management firm based in El Segundo, California with approximately $9.5 billion in assets under management, as of June 30, 2017. Founded in 1995, Griffin is led by a team of senior executives with more than two decades of investment and real estate experience and who collectively have executed more than 650 transactions valued at over $22 billion. As of June 30, 2017, the Griffin Portfolio Guarantor had total assets of approximately $2.8 billion, a net worth of approximately $1.2 billion and liquidity of approximately $54 million.
The Properties.The Griffin Portfolio Properties are comprised of nine Class A office buildings and one distribution center totaling 3,708,698 SF. The Griffin Portfolio Properties range in size from 87,385 SF to 1,501,387 SF, with an average size of 370,870 SF and were constructed between 1971 and 2015. Located across eight different states and occupied by tenants from a diverse range of industries including insurance, wireless telecommunications, healthcare, and retail, no single property accounts for more than 16.1% of the portfolio UW Base Rent. Investment grade tenants, including State Farm (Moody’s/S&P: Aa1/AA), General Electric Co. (Fitch/Moody’s/S&P: AA-/A1/AA-), and Wells Fargo Bank (Fitch/Moody’s/S&P: A+/A2/A), account for approximately 40.7% of portfolio NRA and 55.2% of portfolio UW Base Rent. The Griffin Portfolio consists of predominantly mission-critical facilities utilized as either regional or corporate headquarters locations or business essential distribution centers.
The Restoration Hardware Distribution Property is 1,501,387 SF (40.5% of portfolio NRA) distribution center located in Patterson, California, which is 100.0% leased to Restoration Hardware through August 31, 2030. Restoration Hardware (NYSE: RH) sells upscale home and outdoor furnishings, garden products, hardware, bathware, lighting, textiles, and more through approximately 85 retail and outlet stores in the United States and Canada. As of the fiscal year ended January 31, 2017, Restoration Hardware had total revenues of approximately $2.1 billion and net income of $5.4 million. The Restoration Hardware Distribution Property was built-to-suit for Restoration Hardware in 2015, and features cross-dock configuration with 39-foot clear heights. The Restoration Hardware Distribution Property is one of the company’s four furniture fulfillment centers and is strategically located adjacent to I-5 approximately 76 miles southeast of Oakland, within the Central Valley. Restoration Hardware’s lease provides for three, five-year renewal options, no termination options and annual rent steps of 2.0%.
The State Farm Regional HQ Property is comprised of two Class A suburban office buildings located in Atlanta, Georgia totaling 584,785 SF (15.8% of portfolio NRA). 64 Perimeter Center consists of a 15-story, 384,575 SF building built and renovated in 1985 and 2012, respectively, and includes a café on the 2nd floor, an entire 15th floor breakroom with market café and 1,146 parking spaces in a six-story garage. 66 Perimeter Center consists of an eight-story, 200,201 SF building built and renovated in 1971 and 2012, respectively, and includes a fitness center on the ground floor and 766 surface parking spaces. State Farm leases 503,201 SF (86.0% of property NRA, 90.6% of property UW Base Rent) at the State Farm Regional HQ Property through December 31, 2023 with annual rent steps of 2.5% and has three, five-year renewal options and no termination options. The State Farm Regional HQ Property houses State Farm’s largest concentration of employees in Atlanta and is the primary training site for all regional operations. Additionally, State Farm has invested approximately $60 PSF in their space since 2008.
The State Farm Regional HQ Property is subject to a revenue bond lease structure with the Dunwoody Development Authority, whereby for purposes of being able to offer a tax abatement, the Dunwoody Development Authority has sold revenue bonds to the Griffin Portfolio Borrower in exchange for the fee interest in the State Farm Regional HQ Property and leases the property back to the Griffin Portfolio Borrower at an amount equal to the payments called for by the revenue bonds. The lease and the revenue bonds are co-terminous. The lender has obtained a collateral assignment and subordination of the bond lease documents from the Dunwoody Development Authority. The Griffin Portfolio Borrower deposited at loan origination $77,275,000 with respect to the State Farm Regional HQ Property in connection with a joinder from the Dunwoody Development Authority joining the fee interest to the Griffin Portfolio Borrower’s leasehold interest in the State Farm Regional HQ Property as collateral for the Griffin Portfolio Whole Loan. The Griffin Portfolio
THE INFORMATION IN THIS COLLATERAL TERM SHEET IS NOT COMPLETE AND MAY BE AMENDED PRIOR TO THE TIME OF SALE. THIS TERM SHEET IS NOT AN OFFER TO SELL THESE SECURITIES AND IT IS NOT A SOLICITATION OF AN OFFER TO BUY THESE SECURITIES IN ANY JURISDICTION WHERE THE OFFER OR SALE IS NOT PERMITTED.
29
| Various | Collateral Asset Summary – Loan No. 3 Griffin Portfolio
| Cut-off Date Balance: Cut-off Date LTV Ratio: UW NCF DSCR: UW NOI Debt Yield: | $40,000,000 61.5% 2.49x 10.2% |
Borrower has received the executed joinder and upon delivery to the lender, among other documents as specified in the loan documents, such reserve is anticipated to be released to the Griffin Portfolio Borrower. See “Description of the Mortgage Pool—Certain Terms of the Mortgage Loans—Fee & Leasehold Estates; Ground Leases” in the Preliminary Prospectus.
The North Pointe I Property is comprised of two suburban Class A office buildings located in West Chester, Ohio totaling 409,798 SF (11.0% of portfolio NRA). The North Pointe I Property was built-to-suit for General Electric Co. (NYSE: GE) in 2010, and its space is utilized as GE Aviation’s Product Engineering Center and Worldwide Call Center, which houses approximately 1,700 employees and operates 24/7, 365 days a year. General Electric Co. leases 100.0% of the property through March 31, 2020 with annual rent steps of 2.0% and has four, five-year renewal options and no termination options. Since 2010, General Electric Co. has invested approximately $15 million ($37 PSF) into the North Pointe I Property beyond the landlord’s provided tenant allowance. The North Pointe I Property provides for 1,715 parking spaces (4.2 spaces per 1,000 SF).
The following tables present certain information relating to the Griffin Portfolio Properties:
| Portfolio Summary | ||||||||
| Property Name | Location | Year Built/ Renovated | Net Rentable Area (SF)(1) | UW NCF | Allocated | % of | Appraised Value(3) | Allocated Cut-off Date LTV Ratio(3) |
| Restoration Hardware Distribution | Patterson, CA | 2015/N/A | 1,501,387 | $5,666,121 | $78,000,000 | 20.8% | $120,000,000 | 65.0% |
| State Farm Regional HQ | Atlanta, GA | 1971 & 1985/2012 | 584,785 | $7,067,365 | $69,461,000 | 18.5% | $122,000,000 | 56.9% |
| North Pointe I | West Chester, OH | 2010/N/A | 409,798 | $4,401,038 | $39,650,000 | 10.6% | $61,000,000 | 65.0% |
| Corporate Campus at Norterra | Phoenix, AZ | 2000/N/A | 232,648 | $3,573,164 | $39,000,000 | 10.4% | $60,000,000 | 65.0% |
| CHRISTUS Health HQ | Irving, TX | 1997/2012 | 253,340 | $3,490,579 | $36,198,500 | 9.7% | $55,690,000 | 65.0% |
| Duke Bridges I | Frisco, TX | 2005/N/A | 158,135 | $2,937,681 | $27,475,500 | 7.3% | $42,270,000 | 65.0% |
| Wells Fargo Operations Center | Charlotte, NC | 1984/2014 | 155,579 | $2,478,560 | $26,975,000 | 7.2% | $41,500,000 | 65.0% |
| Ace Hardware HQ | Oak Brook, IL | 1974/2012 | 206,030 | $2,463,507 | $22,750,000 | 6.1% | $35,000,000 | 65.0% |
| Royal Ridge V | Irving, TX | 2004/N/A | 119,611 | $1,999,560 | $21,385,000 | 5.7% | $32,900,000 | 65.0% |
| Comcast Regional HQ | Lynnwood, WA | 2007/N/A | 87,385 | $1,575,427 | $14,105,000 | 3.8% | $21,700,000 | 65.0% |
| Total/Wtd. Avg. | 3,708,698 | $35,653,002 | $375,000,000 | 100.0% | $610,000,000 | 61.5% | ||
| (1) | Information is based on the underwritten rent roll. |
| (2) | Based on the Griffin Portfolio Whole Loan amount. |
| (3) | Total Appraised Value and Wtd. Avg. Cut-off Date LTV Ratio are based on the “as-is portfolio value” conclusion, which includes a portfolio premium to the portfolio properties if sold together on a bulk basis. The sum of the “as-is” appraised values on a stand-alone basis is $592,060,000. The Cut-off Date LTV Ratio based on the aggregate stand-alone appraised “as-is” values is 63.3%. |
THE INFORMATION IN THIS COLLATERAL TERM SHEET IS NOT COMPLETE AND MAY BE AMENDED PRIOR TO THE TIME OF SALE. THIS TERM SHEET IS NOT AN OFFER TO SELL THESE SECURITIES AND IT IS NOT A SOLICITATION OF AN OFFER TO BUY THESE SECURITIES IN ANY JURISDICTION WHERE THE OFFER OR SALE IS NOT PERMITTED.
30
| Various | Collateral Asset Summary – Loan No. 3 Griffin Portfolio
| Cut-off Date Balance: Cut-off Date LTV Ratio: UW NCF DSCR: UW NOI Debt Yield: | $40,000,000 61.5% 2.49x 10.2% |
The following table presents certain information relating to the leases at the Griffin Portfolio Properties:
| Tenant Summary(1) | ||||||||
| Tenant Name | Property | Credit Rating (Fitch/Moody’s/ S&P)(2) | Tenant SF | Approximate % of SF | Annual UW Base Rent | % of Total Annual UW Base Rent | Annual UW Base Rent PSF(3) | Lease Expiration |
| Restoration Hardware(4) | Restoration Hardware Distribution | NR/NR/NR | 1,501,387 | 40.5% | $6,781,152 | 16.1% | $4.52 | 8/31/2030 |
| State Farm | State Farm Regional HQ | NR/Aa1/AA | 503,201 | 13.6% | $6,801,718 | 16.1% | $13.52 | 12/31/2023 |
| General Electric Co. | North Pointe I | AA-/A1/AA- | 409,798 | 11.0% | $5,151,942 | 12.2% | $12.57 | 3/31/2020 |
| CHRISTUS Health | CHRISTUS Health HQ | NR/NR/NR | 247,721 | 6.7% | $5,363,160 | 12.7% | $21.65 | 11/30/2024 |
| Cigna Health Care | Corporate Campus at Norterra | A-/Baa1/A | 232,648 | 6.3% | $3,941,057 | 9.3% | $16.94 | 7/31/2023 |
| Ace Hardware Corporation | Ace Hardware HQ | NR/NR/NR | 206,030 | 5.6% | $2,917,385 | 6.9% | $14.16 | 11/30/2024 |
| T-Mobile West | Duke Bridges I | NR/NR/BB | 158,135 | 4.3% | $3,044,099 | 7.2% | $19.25 | 4/30/2027 |
| Wells Fargo Bank | Wells Fargo Operations Center | A+/A2/A | 155,579 | 4.2% | $2,761,527 | 6.6% | $17.75 | 1/31/2025(5) |
| NEC | Royal Ridge V | NR/Baa2/BBB- | 119,611 | 3.2% | $2,990,275 | 7.1% | $25.00 | 3/31/2026(6) |
| Comcast | Comcast Regional HQ | A-/A3/A- | 87,385 | 2.4% | $1,620,118 | 3.8% | $18.54 | 7/31/2027(7) |
| Subtotal/Wtd. Avg. | 3,621,495 | 97.6% | $41,372,433 | 98.1% | $11.42 | |||
| Remaining Tenants | 15,889 | 0.4% | $786,371 | 1.9% | $49.49 | |||
| Management Office/Fitness Centers | 10,281 | 0.3% | $0 | 0.0% | $0.00 | |||
| Vacant Space | 61,033 | 1.6% | $0 | 0.0% | $0.00 | |||
| Total/Wtd. Avg. | 3,708,698 | 100.0% | $42,158,803 | 100.0% | $11.59 | |||
| (1) | Information is based on the underwritten rent roll. |
| (2) | Ratings provided are for the parent company of the entity listed in the “Tenant Name” field whether or not the parent company guarantees the lease. |
| (3) | Wtd. Avg. Annual UW Base Rent PSF excludes vacant space and building space, such as management office and fitness centers, for which no rent is collected. |
| (4) | Restoration Hardware occupies industrial space as a distribution center. |
| (5) | Wells Fargo Bank has a one-time option to terminate its lease effective January 31, 2023 with prior written notice no later than April 30, 2022 and a termination fee of approximately $1,491,930. |
| (6) | NEC has a one-time option to terminate its lease effective March 31, 2024 with at least 12 months’ prior written notice and a termination fee of approximately $2,695,119 and three months of then applicable operating expenses. |
| (7) | Comcast has a one-time option to terminate its lease effective November 30, 2024 with prior written notice no later than August 31, 2023 and a termination fee equal to five months of base rent and unamortized tenant improvement and leasing commissions and rent abatement costs. Comcast’s termination option will be null and void upon any extension and renewal of its initial lease term. |
The following table presents certain information relating to the lease rollover schedule at the Griffin Portfolio Properties:
| Lease Rollover Schedule(1)(2) | ||||||||
| Year | # of Leases Rolling | SF Rolling | Approx. % of Total SF Rolling | Approx. Cumulative % of SF Rolling | UW Base Rent PSF Rolling(3) | Total UW Base Rent Rolling | Approx. % of Total Rent Rolling | Approx. Cumulative % of Total Rent Rolling |
| MTM | 0 | 0 | 0.0% | 0.0% | $0.00 | $0 | 0.0% | 0.0% |
| 2017 | 0 | 0 | 0.0% | 0.0% | $0.00 | $0 | 0.0% | 0.0% |
| 2018 | 3 | 3,233 | 0.1% | 0.1% | $16.65 | $53,820 | 0.1% | 0.1% |
| 2019 | 0 | 0 | 0.0% | 0.1% | $0.00 | $0 | 0.0% | 0.1% |
| 2020(4) | 3 | 412,184 | 11.1% | 11.2% | $12.57 | $5,151,942 | 12.2% | 12.3% |
| 2021 | 0 | 0 | 0.0% | 11.2% | $0.00 | $0 | 0.0% | 12.3% |
| 2022 | 0 | 0 | 0.0% | 11.2% | $0.00 | $0 | 0.0% | 12.3% |
| 2023 | 9 | 748,505 | 20.2% | 31.4% | $15.27 | $11,432,041 | 27.1% | 39.5% |
| 2024 | 2 | 453,751 | 12.2% | 43.6% | $18.25 | $8,280,544 | 19.6% | 59.1% |
| 2025 | 1 | 155,579 | 4.2% | 47.8% | $17.75 | $2,761,527 | 6.6% | 65.7% |
| 2026 | 2 | 119,611 | 3.2% | 51.0% | $25.36 | $3,033,560 | 7.2% | 72.9% |
| 2027 | 3 | 245,520 | 6.6% | 57.7% | $19.00 | $4,664,217 | 11.1% | 83.9% |
| 2028 & Beyond(5) | 3 | 1,509,282 | 40.7% | 98.4% | $4.52 | $6,781,152 | 16.1% | 100.0% |
| Vacant | 0 | 61,033 | 1.6% | 100.0% | $0.00 | $0 | 0.0% | 100.0% |
| Total/Wtd. Avg. | 26 | 3,708,698 | 100.0% | $11.59 | $42,158,803 | 100.0% | ||
| (1) | Information is based on the underwritten rent roll. |
| (2) | Certain tenants may have lease termination options that are exercisable prior to the originally stated expiration date of the subject lease and that are not considered in the lease rollover schedule. |
| (3) | 2020, 2028 & Beyond and Wtd. Avg. UW Base Rent PSF Rolling excludes vacant space and building space, such as management office and fitness centers, for which no rent is collected. |
| (4) | Includes 2,386 SF of fitness center space for which no rent is collected. |
| (5) | Includes 7,895 SF of management office and fitness center space for which no rent is collected. |
THE INFORMATION IN THIS COLLATERAL TERM SHEET IS NOT COMPLETE AND MAY BE AMENDED PRIOR TO THE TIME OF SALE. THIS TERM SHEET IS NOT AN OFFER TO SELL THESE SECURITIES AND IT IS NOT A SOLICITATION OF AN OFFER TO BUY THESE SECURITIES IN ANY JURISDICTION WHERE THE OFFER OR SALE IS NOT PERMITTED.
31
| Various | Collateral Asset Summary – Loan No. 3 Griffin Portfolio
| Cut-off Date Balance: Cut-off Date LTV Ratio: UW NCF DSCR: UW NOI Debt Yield: | $40,000,000 61.5% 2.49x 10.2% |
The Market. The Griffin Portfolio Properties are geographically diverse, located across eight states. One property is located in California (40.5% of NRA), one property is located in Georgia (15.8%) and three properties are located in Texas (14.3%), with no other state representing more than 11.0% of NRA.
The following table presents certain demographic information relating to the Griffin Portfolio Properties:
| Demographic Summary(1) | |||||
| Property Name | Location | Estimated 2017 Population | Estimated 2017 Average Household Income | ||
| 3-Mile Radius | 5-Mile Radius | 3-Mile Radius | 5-Mile Radius | ||
| Restoration Hardware Distribution | Patterson, CA | 21,828 | 25,727 | $70,296 | $70,412 |
| State Farm Regional HQ | Atlanta, GA | 101,478 | 253,831 | $114,286 | $113,591 |
| North Pointe I | West Chester, OH | 45,888 | 130,679 | $103,400 | $105,841 |
| Corporate Campus at Norterra | Phoenix, AZ | 45,028 | 139,930 | $90,117 | $84,956 |
| CHRISTUS Health HQ | Irving, TX | 95,560 | 226,747 | $88,384 | $78,026 |
| Duke Bridges I | Frisco, TX | 95,550 | 275,209 | $130,166 | $138,479 |
| Wells Fargo Operations Center | Charlotte, NC | 83,299 | 190,359 | $63,948 | $68,375 |
| Ace Hardware HQ | Oak Brook, IL | 72,494 | 292,527 | $127,665 | $117,906 |
| Royal Ridge V | Irving, TX | 35,357 | 165,228 | $112,173 | $99,649 |
| Comcast Regional HQ | Lynnwood, WA | 139,202 | 326,004 | $88,748 | $93,168 |
| (1) | Information is based on third party market research reports. |
Operating History and Underwritten Net Cash Flow. The following table presents certain information relating to the historical operating performance and the Underwritten Net Cash Flow at the Griffin Portfolio Properties:
| Cash Flow Analysis | |||||||||||||
| 2014(1) | 2015(2) | 2016 | 6/30/2017 TTM | UW | UW PSF | ||||||||
| Gross Potential Rent(3) | N/A | $28,945,010 | $40,014,721 | $41,038,947 | $45,573,634 | $12.29 | |||||||
| Total Recoveries(4) | N/A | $8,286,631 | $12,164,850 | $11,783,658 | $13,125,514 | $3.54 | |||||||
| Other Income | N/A | $461,007 | $288,903 | $256,280 | $261,221 | $0.07 | |||||||
| Less Vacancy & Credit Loss | N/A | $0 | $0 | $0 | ($4,053,927) | ($1.09) | |||||||
| Effective Gross Income | N/A | $37,692,649 | $52,468,474 | $53,078,885 | $54,906,442 | $14.80 | |||||||
| Total Operating Expenses(5) | N/A | $10,913,927 | $16,049,042 | $16,389,774 | $16,595,713 | $4.47 | |||||||
| Net Operating Income | N/A | $26,778,722 | $36,419,432 | $36,689,111 | $38,310,729 | $10.33 | |||||||
| Capital Expenditures | N/A | $0 | $0 | $0 | $591,601 | $0.16 | |||||||
| TI/LC | N/A | $0 | $0 | $0 | $2,066,126 | $0.56 | |||||||
| Net Cash Flow | N/A | $26,778,722 | $36,419,432 | $36,689,111 | $35,653,002 | $9.61 | |||||||
| Occupancy % | N/A | 100.0% | 100.0% | 98.4%(6) | 93.1% | ||||||||
| NOI DSCR(7) | N/A | 1.87x | 2.54x | 2.56x | 2.67x | ||||||||
| NCF DSCR(7) | N/A | 1.87x | 2.54x | 2.56x | 2.49x | ||||||||
| NOI Debt Yield(7) | N/A | 7.1% | 9.7% | 9.8% | 10.2% | ||||||||
| NCF Debt Yield(7) | N/A | 7.1% | 9.7% | 9.8% | 9.5% | ||||||||
| (1) | 2014 financial information is not available as the Griffin Portfolio Sponsor acquired the Griffin Portfolio Properties between 2013 and 2016. |
| (2) | 2015 financial information includes partial year cash flow for the Restoration Hardware Distribution Property as the single tenant lease rent recommencement was in August 2015 and excludes the Royal Ridge V Property as the single tenant lease rent commencement was in December 2015. |
| (3) | UW Gross Potential Rent is based on the underwritten rent roll and includes (i) for investment grade tenants, the average base rent over their respective lease terms of $1,589,396 and (ii) vacancy gross up of $1,825,435. |
| (4) | All leases at the properties are triple net leases, with the exception of NEC and CHRISTUS Health, which have full service gross plus electric leases. |
| (5) | The State Farm Regional HQ Property is currently subject to a revenue bond lease structure whereby until the Griffin Office & Industrial Borrower exercises its right to repurchase the fee interest from the local development authority, the State Farm Regional HQ Property will benefit from a property tax abatement. UW Operating Expenses are underwritten to the property’s full unabated taxes. |
| (6) | 6/30/2017 TTM Occupancy % is based on the underwritten rent rolls as of September 1, 2017 and November 1, 2017. |
| (7) | Debt service coverage ratios and debt yields are based on the Griffin Office & Industrial Whole Loan. |
Escrows and Reserves. The Griffin Portfolio Borrower deposited in escrow at loan origination (i) $930,000 for taxes, (ii) $3,653,980 for landlord obligations due to T-Mobile and (iii) $2,003,531 for unfunded landlord obligations and is required to escrow monthly (x) 1/12 of the annual estimated tax payments and (y) 1/12 of the annual insurance premiums,providedthat such monthly tax and insurance payments will be waived if (a) such taxes and insurance premiums are paid for directly by all tenants and the blanket insurance policies in place are satisfactory to the lender, (b) no event of default has occurred and is continuing and (c) no Debt Yield Sweep Period (as defined below) has occurred and is continuing.
The Griffin Portfolio Borrower deposited at loan origination $77,275,000 with respect to the State Farm Regional HQ Property in connection with a joinder from the Dunwoody Development Authority joining the fee interest to the Griffin Portfolio Borrower’s leasehold interest in the State Farm Regional HQ Property as collateral for the Griffin Portfolio Whole Loan. The Griffin Portfolio Borrower has received the executed joinder and upon delivery to the lender, among other documents as specified in the loan documents, such reserve is anticipated to be released to the Griffin Portfolio Borrower.
THE INFORMATION IN THIS COLLATERAL TERM SHEET IS NOT COMPLETE AND MAY BE AMENDED PRIOR TO THE TIME OF SALE. THIS TERM SHEET IS NOT AN OFFER TO SELL THESE SECURITIES AND IT IS NOT A SOLICITATION OF AN OFFER TO BUY THESE SECURITIES IN ANY JURISDICTION WHERE THE OFFER OR SALE IS NOT PERMITTED.
32
| Various | Collateral Asset Summary – Loan No. 3 Griffin Portfolio
| Cut-off Date Balance: Cut-off Date LTV Ratio: UW NCF DSCR: UW NOI Debt Yield: | $40,000,000 61.5% 2.49x 10.2% |
During the continuation of a Debt Yield Sweep Period, the Griffin Portfolio Borrower is required to establish an account for replacement reserve escrows (the “Replacement Reserve Account”), and on each monthly payment date, deposit 1/12 of $0.10 PSFper annum of industrial space and 1/12 of $0.20 PSFper annum of office space (the “Monthly Replacement Reserve Escrow”), subject to a cap of two years’ worth of collections (the “Replacement Reserve DY Sweep Cap”),provided that the Griffin Portfolio Borrower is required to resume monthly payments if, at any time during the loan term, the balance of the Replacement Reserve Account is less than the Replacement Reserve DY Sweep Cap or an event of default occurs. On each monthly payment date occurring in October 2022 and thereafter, the Griffin Portfolio Borrower is required to deposit Monthly Replacement Reserve Escrow into the Replacement Reserve Account, subject to a cap of one years’ worth of collections (the “Replacement Reserve Midterm Sweep Cap”),provided that the Griffin Portfolio Borrower is required to resume monthly payments if, at any time during the loan term, the balance of the Replacement Reserve Account is less than the Replacement Reserve Midterm Sweep Cap or an event of default occurs. The funds held in the Replacement Reserve Account are attributable towards each of the Replacement Reserve DY Sweep Cap and Replacement Reserve Midterm Sweep Cap and such amounts are not exclusive of each other.
Upon any tenant electing to exercise early termination or the occurrence of a Debt Yield Sweep Period, the Griffin Portfolio Borrower is required to establish an account for tenant improvement and leasing commissions escrows (the “Leasing Reserve Account”). During the continuation of a Debt Yield Sweep Period, on each monthly payment date, the Griffin Portfolio Borrower is required to deposit 1/12 of $0.50 PSFper annum of industrial space and 1/12 of $1.00 PSFper annum of office space (the “Monthly Leasing Reserve Escrow”), subject to a cap of two years’ worth of collections (the “Leasing Reserve DY Sweep Cap”),provided that the Griffin Portfolio Borrower is required to resume monthly payments if, at any time during the loan term, the balance of the Leasing Reserve Account is less than the Leasing Reserve DY Sweep Cap or an event of default occurs. On each monthly payment date occurring in October 2022 and thereafter, the Griffin Portfolio Borrower is required to deposit Monthly Leasing Reserve Escrow into the Leasing Reserve Account, subject to a cap of one years’ worth of collections (the “Leasing Reserve Midterm Sweep Cap”),provided that the Griffin Portfolio Borrower is required to resume monthly payments if, at any time during the loan term, the balance of the Leasing Reserve Account is less than the Leasing Reserve Midterm Sweep Cap or an event of default occurs. The funds held in the Leasing Reserve Account are attributable towards each of the Leasing Reserve DY Sweep Cap and Leasing Reserve Midterm Sweep Cap and such amounts are not exclusive of each other.
A “Debt Yield Sweep Period” commences on the first day of the month following the debt yield falling below 7.5% in a calendar quarter and will expire on the last day of the month during which the debt yield equals or exceeds 7.5% in a calendar quarter.
Lockbox and Cash Management. A hard lockbox is in place with respect to the Griffin Portfolio Whole Loan. The Griffin Portfolio Whole Loan has springing cash management (i.e., has cash management only after the initial occurrence of a Cash Sweep Period (as defined below)). On a daily basis, funds on deposit will be transferred to the Griffin Portfolio Borrower’s operating account,provided that during the continuation of a Cash Sweep Period, funds in the lockbox account are required to be transferred to a cash management account and be applied on each monthly payment date to pay debt service on the Griffin Portfolio Whole Loan, to fund the required reserves deposits as described above under “Escrows and Reserves,” and fund operating expenses not otherwise paid or reserved for as described above under “Escrows and Reserves” and referenced in the annual budget approved by the lender, together with other amounts incurred by the Griffin Portfolio Borrower in connection with the operation and maintenance of the Griffin Portfolio Properties reasonably approved by the lender, while the remaining deposits will be held as additional security for the Griffin Portfolio Whole Loan (the “Excess Cash Reserve Account”). Upon the commencement of a T-Mobile Sweep Period (as defined below), funds held in the Excess Cash Reserve Account are required to be deposited into the T-Mobile Work Reserve.
A “Cash Sweep Period” will commence upon (i) any period of time during which an event of default is continuing, (ii) a Debt Yield Sweep Period, (iii) a Restoration Hardware Sweep Period (as defined below), (iv) a State Farm Sweep Period (as defined below), or (v) a T-Mobile Sweep Period.
A “Restoration Hardware Sweep Period” will commence upon (i) Restoration Hardware being in monetary default under its lease beyond notice and cure periods, (ii) Restoration Hardware terminating vacating, or going dark in at least 50% of its space or giving written notice that it intends to do so, (iii) any termination or cancellation of the Restoration Hardware lease and/or the lease fails to be in full force and effect, (iv) any bankruptcy or similar insolvency of Restoration Hardware or its assets are subject to similar proceedings, and (v) Restoration Hardware failing to renew or extend its lease prior to its extension deadline, or if no such date exists, the date that is 12 months prior to the then applicable expiration. The Restoration Hardware Sweep Period will expire upon receipt of evidence of each of the following (as applicable): (i) Restoration Hardware has cured all defaults under its lease, (ii) Restoration Hardware has revoked or rescinded all cancellation or termination notices and reaffirms the lease is in full force and effect, (iii) Restoration Hardware has extended or renewed its lease, (iv) Restoration Hardware is no longer insolvent or subject to bankruptcy proceedings, and (v) Restoration Hardware is paying full, unabated rent (or if rent is abated, the Griffin Portfolio Borrower has deposited such amount of abated rent with the lender), and if cure is in regards to clause (ii) or (v) above, at least 85% of the Restoration Hardware space being re-leased to an acceptable replacement tenant who is in physical occupancy of the space, open to the public and paying full rent. Notwithstanding the foregoing, a Restoration Hardware Sweep Period will be cured if and when $9,008,322 is deposited into the Excess Cash Reserve Account.
A “State Farm Sweep Period” will commence upon (i) State Farm being in monetary default under its lease beyond notice and cure periods, (ii) State Farm terminating, vacating, or going dark in at least 50% of its space or gives written notice that it intends to do so, (iii) any termination or cancellation of the State Farm lease and/or the lease fails to be in full force and effect, (iv) any bankruptcy or similar insolvency of State Farm or its assets are subject to similar proceedings, and (v) State Farm failing to renew or extend its lease prior to its extension deadline, or if no such date exists, the date that is 12 months prior to the then applicable expiration. The State Farm Sweep Period will expire upon receipt of evidence showcasing each of the following (as applicable): (i) State Farm has cured all defaults under its lease, (ii) State Farm has revoked or rescinded all cancellation or termination notices and reaffirms the lease is in full force and effect, (iii) State Farm has extended or renewed its lease, (iv) State Farm is no longer insolvent or subject to bankruptcy proceedings, and (v) State Farm is paying full, unabated rent (or if rent is abated, the Griffin Portfolio Borrower has deposited such amount of abated rent with the lender), and if cure is in regards to clauses (ii) or (v) above, at least 85% of the State Farm space being re-leased to an acceptable replacement tenant who is in physical occupancy of the space, open to the public and paying full rent. Notwithstanding the foregoing, a State Farm Sweep Period will be cured if and when $35 PSFper annum is deposited into the Excess Cash Reserve Account.
A “T-Mobile Sweep Period” will commence upon T-Mobile delivering notice that it is exercising its right to require the Griffin Portfolio Borrower to construct a parking structure for the tenant and will end when sufficient funds have been deposited into the T-Mobile Work Reserve.
Additional Secured Indebtedness (not including trade debts). Not permitted.
Mezzanine Loan and Preferred Equity.Not permitted.
THE INFORMATION IN THIS COLLATERAL TERM SHEET IS NOT COMPLETE AND MAY BE AMENDED PRIOR TO THE TIME OF SALE. THIS TERM SHEET IS NOT AN OFFER TO SELL THESE SECURITIES AND IT IS NOT A SOLICITATION OF AN OFFER TO BUY THESE SECURITIES IN ANY JURISDICTION WHERE THE OFFER OR SALE IS NOT PERMITTED.
33
| Various | Collateral Asset Summary – Loan No. 3 Griffin Portfolio
| Cut-off Date Balance: Cut-off Date LTV Ratio: UW NCF DSCR: UW NOI Debt Yield: | $40,000,000 61.5% 2.49x 10.2% |
Release of Property. Any time after the expiration of the yield maintenance lockout period, the Griffin Portfolio Borrower may obtain the release of one or more of the Griffin Portfolio Properties (individually or collectively, the “Release Property”),provided that among other things, (i) no event of default has occurred and is continuing, (ii) prior notice is given not less than 30 days and not more than 90 days identifying the Release Property and specifying a date, (iii) the Griffin Portfolio Borrower prepays in an amount equal to the Release Amount (as defined below) with any applicable yield maintenance premium, (iv) after release, each remaining borrower remains a single-purpose entity, (v) the debt yield with respect to the remaining Griffin Portfolio Properties is no less than the greater of (a) the debt yield at origination of the Griffin Portfolio Whole Loan and (b) the debt yield immediately prior to the release, and (vi) simultaneously with the property release, the Griffin Portfolio Borrower conveys fee title of the applicable Release Property to a person other than the Griffin Portfolio Borrower or any of its affiliates pursuant to an arm’s length sale;provided,however, that if a tenant has vacated, cancelled its lease, given notice to terminate or terminated its lease, or an event of default has occurred with respect to the applicable Release Property, such that a material adverse effect will result, such Release Property may be released without the requirement of an arm’s length sale,provided that among other conditions (a) the lender receives payment of a release price equal 120% of the Allocated Cut-off Date Balance for the applicable Release Property and (b) the aggregate allocated loan amounts for all Released Properties during the loan term must not exceed $84,375,000.
The “Release Amount” is an amount equal to 110% of the Allocated Cut-off Date Balance (identified in the “Portfolio Summary” chart above).
Substitution.At any time after the earlier of the full disposition of the Griffin Portfolio Mortgage Loan by lender or the second anniversary of the closing date, the Griffin Portfolio Borrower may replace one of more of the Griffin Portfolio Properties (individually or collectively, the “Replaced Property”) with one more or more replacement properties (individually or collectively, the “Replacement Property”),provided that among other things, (i) no event of default has occurred and is continuing, (ii) each Replaced Property has less than two years remaining on the lease term for such property or the substitution cures a Cash Sweep Period, (iii) the aggregate allocated loan amounts for all Replaced Properties during the loan term does not exceed $84,375,000, (iv) the Griffin Portfolio Borrower gives lender no less than 60 days’ prior written notice of a substitution, (v) the Griffin Portfolio Borrower delivers to lender current appraisals of the Replacement Property and Replaced Property, showcasing that the “as-is” market value of the Replacement Property is equal to or greater than the “as-is” market value of the Replaced Property, (vi) the Replacement Property must have a net operating income (“NOI”) equal to or greater than the NOI of the Replaced Property immediately prior to the substitution, (vii) the Replacement Property must be owned in fee by a newly formed single-purpose bankruptcy remote entity or acceptable “recycled entity” satisfying conditions set forth in the loan agreement, (viii) the Replacement Property must satisfy current environmental and engineering standards and, if it does not, the Griffin Portfolio Borrower is required to deposit 115% of the amount required to fund corrective measures, (ix) the Replacement Property must be Class A office or industrial property, (x) each lease at the Replacement Property must have an average remaining lease term of no less than five years, (xi) the Replacement Property must be leased to a tenant with credit (or whose guarantor under its respective lease has credit) that is equal to or better than the tenant at the Replaced Property, (xii) the Griffin Portfolio Borrower pays a fee of 0.25% of the Allocated Cut-off Date Balance of the Replaced Property, (xiii) the delivery of a legal opinion covering compliance in all respects with all laws, rules and regulations governing REMICs, and (xiii) receipt of a rating agency confirmation.
Terrorism Insurance. The Griffin Portfolio Borrower is required to obtain insurance against acts of terrorism for loss resulting from perils and acts of terrorism in amounts and with terms and conditions applicable to commercial property, general liability, business income and umbrella liability insurance required pursuant to the Griffin Portfolio Mortgage Loan documents.
THE INFORMATION IN THIS COLLATERAL TERM SHEET IS NOT COMPLETE AND MAY BE AMENDED PRIOR TO THE TIME OF SALE. THIS TERM SHEET IS NOT AN OFFER TO SELL THESE SECURITIES AND IT IS NOT A SOLICITATION OF AN OFFER TO BUY THESE SECURITIES IN ANY JURISDICTION WHERE THE OFFER OR SALE IS NOT PERMITTED.
34
425 106th Ave NE Bellevue, WA, 98004 | Collateral Asset Summary – Loan No. 4 Centre 425 Bellevue | Cut-off Date Balance: Cut-off Date LTV Ratio: UW NCF DSCR: UW NOI Debt Yield: | $40,000,000 29.7% 3.85x 16.2% |
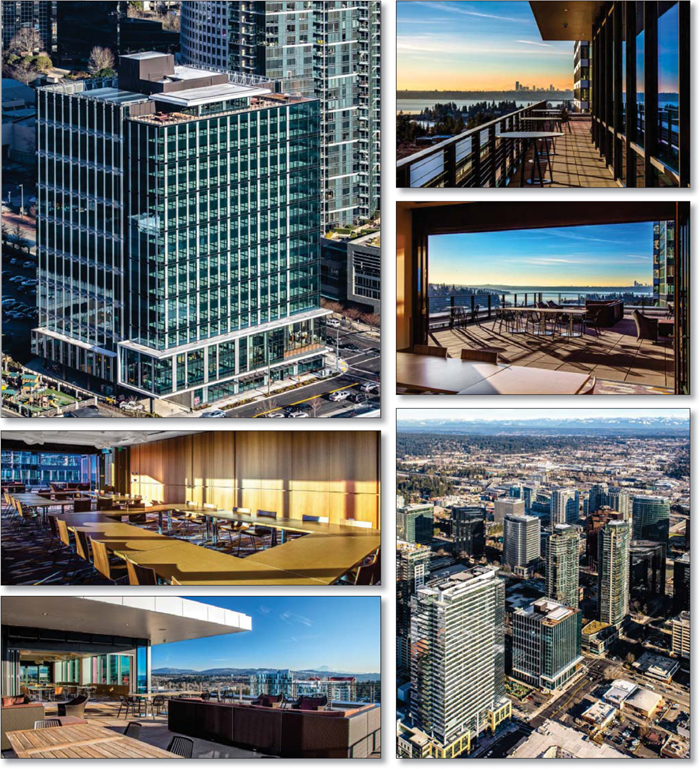
THE INFORMATION IN THIS COLLATERAL TERM SHEET IS NOT COMPLETE AND MAY BE AMENDED PRIOR TO THE TIME OF SALE. THIS TERM SHEET IS NOT AN OFFER TO SELL THESE SECURITIES AND IT IS NOT A SOLICITATION OF AN OFFER TO BUY THESE SECURITIES IN ANY JURISDICTION WHERE THE OFFER OR SALE IS NOT PERMITTED.
35
425 106th Ave NE Bellevue, WA, 98004 | Collateral Asset Summary – Loan No. 4 Centre 425 Bellevue | Cut-off Date Balance: Cut-off Date LTV Ratio: UW NCF DSCR: UW NOI Debt Yield: | $40,000,000 29.7% 3.85x 16.2% |
THE INFORMATION IN THIS COLLATERAL TERM SHEET IS NOT COMPLETE AND MAY BE AMENDED PRIOR TO THE TIME OF SALE. THIS TERM SHEET IS NOT AN OFFER TO SELL THESE SECURITIES AND IT IS NOT A SOLICITATION OF AN OFFER TO BUY THESE SECURITIES IN ANY JURISDICTION WHERE THE OFFER OR SALE IS NOT PERMITTED.
36
425 106th Ave NE Bellevue, WA, 98004 | Collateral Asset Summary – Loan No. 4 Centre 425 Bellevue | Cut-off Date Balance: Cut-off Date LTV Ratio: UW NCF DSCR: UW NOI Debt Yield: | $40,000,000 29.7% 3.85x 16.2% |
| Mortgage Loan Information | Property Information | |||||
| Mortgage Loan Seller: | Natixis | Single Asset/Portfolio: | Single Asset | |||
| Credit Assessment (Fitch/KBRA/Moody’s/S&P): | [ ] | Location: | Bellevue, WA, 98004 | |||
| General Property Type: | Office | |||||
| Original Balance(1): | $40,000,000 | Detailed Property Type: | CBD | |||
| Cut-off Date Balance(1): | $40,000,000 | Title Vesting: | Fee | |||
| % of Initial Pool Balance: | [ ]% | Year Built/Renovated: | 2017/N/A | |||
| Loan Purpose: | Acquisition | Size: | 356,909 SF | |||
| Borrower Sponsors: | Aby Rosen; Michael Fuchs; David Edelstein | Cut-off Date Balance per SF(1): | $263 | |||
| Mortgage Rate: | 4.1510% | Maturity Date Balance per SF(1): | $263 | |||
| Note Date: | 10/18/2017 | Property Manager: | SW Property Management LLC | |||
| First Payment Date: | 12/7/2017 | |||||
| Anticipated Repayment Date(2): | 11/7/2027 | |||||
| Maturity Date(2): | 1/30/2033 | |||||
| Original Term to ARD(2): | 120 months | |||||
| Original Amortization Term: | 0 months | |||||
| IO Period: | 120 months | |||||
| Seasoning: | 0 months | |||||
| Prepayment Provisions(3): | LO (24); DEF/YM1 (89); O (7) | Underwriting and Financial Information | ||||
| Lockbox/Cash Mgmt Status: | Hard/In Place | UW NOI: | $15,265,716 | |||
| Additional Debt Type(1)(4): | Pari Passu/Subordinate Debt/Mezzanine | UW NOI Debt Yield(1): | 16.2% | |||
| Additional Debt Balance(1)(4): | $54,000,000/$114,450,000/$57,600,000 | UW NOI Debt Yield at Maturity(1): | 16.2% | |||
| Future Debt Permitted (Type): | No (N/A) | UW NCF DSCR(1): | 3.85x | |||
| Reserves(5) | Most Recent NOI(6): | N/A | ||||
| Type | Initial | Monthly | Cap | 2nd Most Recent NOI(6): | N/A | |
| RE Tax: | $149,734 | $149,734 | N/A | 3rd Most Recent NOI(6): | N/A | |
| Insurance: | $102,289 | $17,204 | N/A | Most Recent Occupancy: | 100.0% (11/1/2017) | |
| Condominium: | $0 | 1/12 of Condominium Assessment | N/A | 2nd Most Recent Occupancy(6): | N/A | |
| Replacements: | $0 | Springing | N/A | 3rd Most Recent Occupancy(6): | N/A | |
| TI/LC: | $1,871,090 | $0 | N/A | Appraised Value (as of): | $316,000,000 (10/1/2017) | |
| Free Rent: | $10,923,817 | $0 | N/A | Cut-off Date LTV Ratio(1): | 29.7% | |
| Seller Credit Reserve: | $5,000,000 | $0 | N/A | Maturity Date LTV Ratio(1): | 29.7% | |
| Sources and Uses | ||||||
| Sources | Proceeds | % of Total | Uses | Proceeds | % of Total | |
| Loan Amount(1): | $208,450,000 | 61.8% | Purchase Price: | $313,000,000 | 92.7% | |
| Mezzanine Loan(1): | $57,600,000 | 17.1% | Reserves: | $18,046,930 | 5.3% | |
| Borrower Equity: | $71,491,629 | 21.2% | Closing Costs: | $6,494,699 | 1.9% | |
| Total Sources: | $337,541,629 | 100.0% | Total Uses: | $337,541,629 | 100.0% | |
| (1) | The Centre 425 Bellevue Mortgage Loan (as defined below) is part of the Centre 425 Bellevue Whole Loan (as defined below), which is comprised of two seniorpari passupromissory notes with an aggregate original principal balance of $94,000,000 and one subordinate promissory note with an original principal balance of $114,450,000. The Centre 425 Bellevue Whole Loan is accompanied by the Centre 425 Bellevue Mezzanine Loan (as defined below) with an original principal balance of $57,600,000. The Cut-off Date Balance per SF, Maturity Date Balance per SF, UW NOI Debt Yield, UW NOI Debt Yield at Maturity, UW NCF DSCR, Cut-off Date LTV Ratio and Maturity Date LTV Ratio presented above are based on the aggregate principal balance of the promissory notes comprising the Centre 425 Bellevue Senior Loan (as defined below), without regard to the Centre 425 Bellevue Subordinate Companion Loan (as defined below). The Cut-off Date Balance per SF, Maturity Date Balance per SF, UW NOI Debt Yield, UW NOI Debt Yield at Maturity, UW NCF DSCR, Cut-off Date LTV Ratio and Maturity Date LTV Ratio based on the Centre 425 Bellevue Whole Loan are $584, $584, 7.3%, 7.3%, 1.69x, 66.0% and 66.0%, respectively. The Cut-off Date Balance per SF, Maturity Date Balance per SF, UW NOI Debt Yield, UW NOI Debt Yield at Maturity, UW NCF DSCR, Cut-off Date LTV Ratio and Maturity Date LTV Ratio based on the Centre 425 Bellevue Whole Loan and the Centre 425 Bellevue Mezzanine Loan are $745, $745, 5.7%, 5.7%, 1.15x, 84.2% and 84.2%, respectively. |
| (2) | The Centre 425 Bellevue Whole Loan has an anticipated repayment date (“ARD”) of November 7, 2027 and a stated maturity date of January 30, 2033. Prior to the ARD, the Centre 425 Bellevue Whole Loan accrues interest at a fixed rate equal to 4.2646751771% (the “Initial Interest Rate”)per annum. In the event that the Centre 425 Bellevue Whole Loan is not repaid in full by the ARD then, from and after the ARD, the Centre 425 Bellevue Whole accrues interest atper annumrate equal to the sum of (i) 4.2646751771%, plus (ii) the lessor of (x) 4.0000% and (y) 3.5000% plus the amount (if any) by which the 10-year treasury rate exceeds 2.5000% (the “Adjusted Interest Rate”). |
| (3) | After the lockout period, defeasance or yield maintenance in whole, but not in part, of the Centre 425 Bellevue Whole Loan, is permitted on or after the date that is the earlier to occur of (i) the closing date of the securitization that includes that lastpari passu note to be securitized and (ii) three years after the Centre 425 Bellevue Whole Loan origination. Open prepayment is permitted on or after May 7, 2027. |
| (4) | See “The Mortgage Loan”, “Additional Secured Indebtedness (not including trade debts)”and “Mezzanine Loan and Preferred Equity” below for further discussion of additional debt. |
| (5) | See“Escrows and Reserves”below for further discussion of reserve requirements. |
| (6) | Historical financials are not available as the Centre 425 Bellevue Property was completed in 2017. |
The Mortgage Loan. The fourth largest mortgage loan (the “Centre 425 Bellevue Mortgage Loan”) is part of a whole loan (the “Centre 425 Bellevue Whole Loan”) evidenced by two seniorpari passupromissory notes with an aggregate original principal balance of $94,000,000 (collectively, the “Centre 425 Bellevue Senior Loan”) and one subordinate note with an original principal balance of $114,450,000 (the “Centre 425 Bellevue Subordinate Companion Loan”). The Centre 425 Bellevue Whole Loan is secured by a first priority mortgage encumbering the borrower’s fee interest in the commercial
THE INFORMATION IN THIS COLLATERAL TERM SHEET IS NOT COMPLETE AND MAY BE AMENDED PRIOR TO THE TIME OF SALE. THIS TERM SHEET IS NOT AN OFFER TO SELL THESE SECURITIES AND IT IS NOT A SOLICITATION OF AN OFFER TO BUY THESE SECURITIES IN ANY JURISDICTION WHERE THE OFFER OR SALE IS NOT PERMITTED.
37
425 106th Ave NE Bellevue, WA, 98004 | Collateral Asset Summary – Loan No. 4 Centre 425 Bellevue | Cut-off Date Balance: Cut-off Date LTV Ratio: UW NCF DSCR: UW NOI Debt Yield: | $40,000,000 29.7% 3.85x 16.2% |
condominium unit within a newly constructed 16-story, 356,909 SF Class A office building located on a 0.88-acre site in Bellevue, Washington (the “Centre 425 Bellevue Property”) approximately ten miles from Seattle. Promissory Note A-2, with an original principal balance of $40,000,000, represents the Centre 425 Bellevue Mortgage Loan and will be included in the UBS 2017-C5 Trust. Promissory Note A-1, with an original principal balance of $54,000,000, is currently held by Natixis, and is expected to be contributed to one or more future securitization trusts. The Centre 425 Bellevue Whole Loan will initially be serviced pursuant to the pooling and servicing agreement for the UBS 2017-C5 Trust, and from and after the securitization of Promissory Note A-1, will be serviced pursuant to the respective pooling and servicing agreement of the related future securitization trust. See “Description of the Mortgage Pool—The Whole Loans—The Serviced AB Whole Loans”and“Pooling and Servicing Agreement”in the Preliminary Prospectus.
| Centre 425 Bellevue Whole Loan Summary | ||||
| Note | Original Balance | Cut-off Date Balance | Anticipated Note Holder | Controlling Piece |
| Note A-1 | $54,000,000 | $54,000,000 | Natixis | No |
| Note A-2 | $40,000,000 | $40,000,000 | UBS 2017-C5 | No |
| Centre 425 Bellevue Subordinate Companion Loan | $114,450,000 | $114,450,000 | Natixis | Yes |
| Total | $208,450,000 | $208,450,000 | ||
The Centre 425 Bellevue Whole Loan has a 10-year term until the ARD and is interest only for the term of the loan. The ARD is November 7, 2027 and the final maturity date is January 30, 2033. If the Centre 425 Bellevue Whole Loan has not been paid down in full by the ARD, the Centre 425 Bellevue Whole Loan will enter a six-year hyper-amortization period in which all excess cash flow, after payments of reserves and operating expenses, will be used to pay down the loan. The payment of the additional interest (which will be the difference between the interest accrued at the Adjusted Interest Rate and the Initial Interest Rate) will be deferred until the entire principal balance of the loan is paid in full. The proceeds of the Centre 425 Bellevue Whole Loan, along with a mezzanine loan with an original principal balance of $57,600,000 (the “Centre 425 Bellevue Mezzanine Loan”), were used to acquire the Centre 425 Bellevue Property, fund reserves and pay closing costs.
Following the lockout period, on any date before May 7, 2027, the Centre 425 Bellevue Borrower has the right to defease the Centre 425 Bellevue Whole Loan in whole or to prepay all or any portion of the Centre 425 Bellevue Whole Loan,provided that the Centre 425 Bellevue Borrower also pays an amount equal to the greater of the yield maintenance premium or 1.0% of the then outstanding principal balance (the prepayment premium). The lockout period will expire on the earlier to occur of (i) two years after the closing date of the securitization that includes the last Centre 425 Bellevue Whole Loan note to be securitized or (ii) three years after loan origination. The Centre 425 Bellevue Whole Loan is prepayable without penalty on or after May 7, 2027.
The Borrower and the Borrower Sponsors.The borrower is Starvue LLC (the “Centre 425 Bellevue Borrower”), a Delaware limited liability company and single purpose entity with two independent directors. Legal counsel to the Centre 425 Bellevue Borrower delivered a non-consolidation opinion in connection with the origination of the Centre 425 Bellevue Whole Loan.
The borrower sponsors are Aby Rosen, Michael Fuchs, and David Edelstein. Mr. Rosen and Mr. Fuchs founded RFR Holding LLC (“RFR”), a Manhattan based real estate investment, development and management company, in 1991. RFR has a diverse portfolio of office, retail, residential, and hospitality assets in New York City, Connecticut, Las Vegas, Miami, Israel and Germany. Notably, RFR’s portfolio includes 375 Park Avenue (The Seagram Building) and 390 Park Avenue (Lever House). Mr. Edelstein is the president of TriStar Capital. Mr. Edelstein began his career in real estate in the 1970s and made a career in buying and selling residential buildings and shopping plazas, including the Miracle Mile Shops in Las Vegas and the Lincoln Road Pedestrian Mall in South Beach. Mr. Edelstein also developed the 408-room W South Beach in Miami Beach, Florida.
The Property. The Centre 425 Bellevue Property is the commercial condominium unit within a newly developed, LEED Silver, 16-story Class A office building comprised of approximately 356,909 SF, including approximately 1,991 SF of ground floor retail space. Amenities include The 425 Exchange, a two-story gathering and collaborative workspace, the Vue, an outdoor deck and rooftop lounge area offering views of Seattle, Lake Washington and Mount Rainier, a 105-person capacity Conference Center, a Wellness Center with high end athletic club, locker room and showers, as well as a bike storage center with full showers, changing rooms and lockers. Parking is provided by a controlled access, 8.5-level subterranean garage with a total of 695 parking spaces for a ratio of 1.90 spaces per 1,000 SF of net rentable area. The Centre 425 Bellevue Property comprises one of two condominium units within the Centre 425 Bellevue building. The other condominium unit comprises 6,213 SF of ground level retail owned by Bank of America (the “Bank Unit”) and is not included in the collateral. Bank of America was originally on the site, and as part of the development agreement remained on site within the ground level of the new development. The Centre 425 Bellevue Property represents the commercial unit that includes the entire remainder of the building site including the office portion, retail portion, garage, land and airspace (the “Commercial Unit”).
The Centre 425 Bellevue Property is located in the Bellevue central business district’s pedestrian corridor at the corner of NE 4th St and 106th Ave NE providing walking access to residential, restaurant and retail amenities including the Bellevue Downtown Park, Bellevue Collection, Lincoln Square and the Bravern. Nearly 50 sit-down restaurants and an additional approximately 20 grab n’ go food outlets are located within three blocks of the Centre 425 Bellevue Property. The Centre 425 Bellevue Property is also located in proximity of local highways and mass transit. Interstate 405, located 0.5 miles away, provides primary regional access. Additionally, I-90 is located approximately 2.5 miles south and SR 520 is 2.1 miles north. The Bellevue Transit Center is two blocks away and additional transit accessibility will be provided in the future by Sound Transit’s East Link Extension Light Rail Project, which is scheduled to be completed in 2023.
As of November 1, 2017, the Centre 425 Bellevue Property was 100.0% leased by two tenants, Amazon Corporate (“Amazon”) and Starbucks.
Major Tenants.
Amazon (354,918 SF, 99.4% of NRA, 99.4% of underwritten base rent). Amazon is an internet-based retailer and provider of cloud computing services. As of October 9, 2017, Amazon had a market capitalization of $478.0 billion. Amazon is rated Baa1/AA- by Moody’s and S&P, respectively. Amazon employs over 341,000 people, having added more than 110,000 employees over the past year, primarily in their fulfillment centers around the world. Amazon employs over 24,000 in the Seattle area. According to the borrower sponsors, Amazon has not disclosed what business groups will be in the Centre 425 Bellevue office, but based on the handful of Bellevue-based roles posted on Amazon jobs site it appears that many of the roles are engineering related roles focused on merchandising technologies, eCommerce platform, and shipping. In addition, Amazon has mentioned a target density of 135 SF per employee, which translates to roughly 2,600 employees.
THE INFORMATION IN THIS COLLATERAL TERM SHEET IS NOT COMPLETE AND MAY BE AMENDED PRIOR TO THE TIME OF SALE. THIS TERM SHEET IS NOT AN OFFER TO SELL THESE SECURITIES AND IT IS NOT A SOLICITATION OF AN OFFER TO BUY THESE SECURITIES IN ANY JURISDICTION WHERE THE OFFER OR SALE IS NOT PERMITTED.
38
425 106th Ave NE Bellevue, WA, 98004 | Collateral Asset Summary – Loan No. 4 Centre 425 Bellevue | Cut-off Date Balance: Cut-off Date LTV Ratio: UW NCF DSCR: UW NOI Debt Yield: | $40,000,000 29.7% 3.85x 16.2% |
Amazon leases 354,918 SF space located on floors 2 to 16 of the Centre 425 Bellevue Property through September 2033 with three five-year renewal options remaining. Amazon took full occupancy of its space in October 2017. Amazon is also obligated to purchase a total of 828 monthly parking permits and pay an initial rate of $225 per tenant parking permit per month for each tenant parking permit obtained. Amazon guarantees the full and complete payment of all monetary sums payable under its lease. The guarantor’s maximum cumulative liability for tenant lease obligations under the guaranty will be $190,000,000 (the “Guaranty Cap”) through the sixth year of the lease term and on each annual anniversary thereafter, the Guaranty Cap will be reduced by $19,000,000 with respect to tenant lease obligations accruing after the applicable annual anniversary.
At origination, approximately $10.9 million of rent credit with respect to the Amazon’s lease was escrowed and will be applied toward base rent, Amazon’s share of operating costs and parking rent first payable after the commencement date.
Starbucks (1,991 SF, 0.6% of NRA, 0.6% of underwritten base rent). Starbucks is a roaster, marketer, and retailer of specialty coffee worldwide. Starbucks operates retail locations worldwide and sells whole bean coffees through its sales group, direct response business, supermarkets, and on the World Wide Web. Starbucks also produces and sells bottled coffee drinks and a line of ice creams. As of October 18, 2017, Starbucks had a market capitalization of $79.7 billion. Starbucks is rated A/A2/A by Fitch/Moody’s/S&P.
Starbucks occupies 1,991 SF of retail space on the ground floor of the Centre 425 Bellevue Property through June 2027, with two five-year renewal options. Starbucks took occupancy of their space on April 5, 2017 and the rent commenced on June 30, 2017. Starbucks may terminate its lease at the end of the fifth lease year subject to the payment of a termination fee equal to the unamortized portion of the tenant allowance and leasing commissions plus nine months’ rent, capped at $180,000.
The following table presents certain information relating to the leases at the Centre 425 Bellevue Property:
| Tenant Summary(1) | |||||||
| Tenant Name | Credit Rating (Fitch/Moody’s/S&P) | Tenant SF | Approximate % of SF | Annual UW Base Rent(2) | % of Total Annual UW Base Rent | Annual UW Base Rent PSF(2) | Lease Expiration |
| Amazon(3) | NR/Baa1/AA- | 354,918 | 99.4% | $13,611,815 | 99.4% | $38.35 | 9/30/2033 |
| Starbucks(4) | A/A2/A | 1,991 | 0.6% | $79,441 | 0.6% | $39.90 | 6/30/2027 |
| Subtotal/Wtd. Avg. | 356,909 | 100.0% | $13,691,256 | 100.0% | $38.36 | ||
| Vacant Space | 0 | 0.0% | $0 | 0.0% | $0.00 | ||
| Total/Wtd. Avg. | 356,909 | 100.0% | $13,691,256 | 100.0% | $38.36 | ||
| (1) | Based on the underwritten rent roll. |
| (2) | Annual UW Base Rent and Annual UW Base Rent PSF represent Amazon and Starbucks’s average rent over the term of the Centre 425 Bellevue Whole Loan. As of November 1, 2017, Amazon and Starbucks’ current rental rates are $34.63 and $39.90 PSF, respectively. |
| (3) | The lease is guaranteed by Amazon.com, Inc. the rated entity. |
| (4) | The entity on the lease is Starbucks Corporation, which is the rated entity. Starbucks has a one-time lease termination option at the end of the fifth lease year subject to the payment of a termination fee equal to the unamortized portion of the tenant allowance and leasing commissions plus nine months’ rent, capped at $180,000 |
The following table presents certain information relating to the lease rollover schedule at the Centre 425 Bellevue Property:
| Lease Rollover Schedule(1) | ||||||||
| Year | # of Leases Rolling | SF Rolling | Approx. % of Total SF Rolling | Approx. Cumulative % of SF Rolling | UW Base Rent PSF Rolling(2) | Total UW Base Rent Rolling(2) | Approx. % of Total Base Rent Rolling | Approx. Cumulative % of Total Base Rent Rolling |
| MTM | 0 | 0 | 0.0% | 0.0% | $0.00 | $0 | 0.0% | 0.0% |
| 2017 | 0 | 0 | 0.0% | 0.0% | $0.00 | $0 | 0.0% | 0.0% |
| 2018 | 0 | 0 | 0.0% | 0.0% | $0.00 | $0 | 0.0% | 0.0% |
| 2019 | 0 | 0 | 0.0% | 0.0% | $0.00 | $0 | 0.0% | 0.0% |
| 2020 | 0 | 0 | 0.0% | 0.0% | $0.00 | $0 | 0.0% | 0.0% |
| 2021 | 0 | 0 | 0.0% | 0.0% | $0.00 | $0 | 0.0% | 0.0% |
| 2022 | 0 | 0 | 0.0% | 0.0% | $0.00 | $0 | 0.0% | 0.0% |
| 2023 | 0 | 0 | 0.0% | 0.0% | $0.00 | $0 | 0.0% | 0.0% |
| 2024 | 0 | 0 | 0.0% | 0.0% | $0.00 | $0 | 0.0% | 0.0% |
| 2025 | 0 | 0 | 0.0% | 0.0% | $0.00 | $0 | 0.0% | 0.0% |
| 2026 | 0 | 0 | 0.0% | 0.0% | $0.00 | $0 | 0.0% | 0.0% |
| 2027 | 1 | 1,991 | 0.6% | 0.6% | $39.90 | $79,441 | 0.6% | 0.6% |
| 2028 & Beyond | 1 | 354,918 | 99.4% | 100.0% | $38.35 | $13,611,815 | 99.4% | 100.0% |
| Vacant | 0 | 0 | 0.0% | 100.0% | $0.00 | $0 | 0.0% | 100.0% |
| Total/Wtd. Avg. | 2 | 356,909 | 100.0% | $38.36 | $13,691,256 | 100.0% | ||
| (1) | Based on the underwritten rent roll. |
| (2) | UW Base Rent PSF Rolling and Total UW Base Rent Rolling represent Amazon and Starbucks’ average rent over the term of the Centre 425 Bellevue Whole Loan. As of November 1, 2017, Amazon and Starbucks’ current rental rates are $34.63 and $39.90 PSF, respectively. |
THE INFORMATION IN THIS COLLATERAL TERM SHEET IS NOT COMPLETE AND MAY BE AMENDED PRIOR TO THE TIME OF SALE. THIS TERM SHEET IS NOT AN OFFER TO SELL THESE SECURITIES AND IT IS NOT A SOLICITATION OF AN OFFER TO BUY THESE SECURITIES IN ANY JURISDICTION WHERE THE OFFER OR SALE IS NOT PERMITTED.
39
425 106th Ave NE Bellevue, WA, 98004 | Collateral Asset Summary – Loan No. 4 Centre 425 Bellevue | Cut-off Date Balance: Cut-off Date LTV Ratio: UW NCF DSCR: UW NOI Debt Yield: | $40,000,000 29.7% 3.85x 16.2% |
The Market.The Centre 425 Bellevue Property is located in Bellevue, approximately ten miles east of Seattle, Washington, across Lake Washington, in Seattle’s Eastside market. Bellevue has a population of over 140,000 and combines small town accessibility with metropolitan attributes. Bellevue was ranked the second best US city to live in by USA Today in 2014. Bellevue is home to five of the top 25 largest public companies in Washington including Puget Sound Energy, a regional electric and natural gas utility; PACCAR, a manufacturer of trucks and other heavy equipment; Western Wireless and T-Mobile USA, wireless communication companies; and Esterline Technologies, a diversified manufacturing company. As the region’s tech companies attract young talent to live on the Eastside, demand has initiated a transformation of Bellevue from a bedroom community with small employers into one of the most highly sought after live/work/play neighborhoods in the Puget Sound region. According to the appraisal, the area has experienced significant in-migration, with the population within one-mile of the Centre 425 Bellevue Property increasing 29.9% between 2010 and 2017. The estimated 2017 population within a one-, three- and five-mile radius of the Centre 425 Bellevue Property is 21,164, 81,976 and 245,880, respectively. Estimated 2017 average household income within a one-, three- and five-mile radius of the Centre 425 Bellevue Property is $123,857, $146,168 and $146,218, respectively. Bellevue has also established itself as the region’s premier retail destination in the Pacific Northwest offering over 4.5 million SF with another 200,000 SF coming online by year-end 2017. Major retail developments include the 1.5 million SF Bellevue Square Mall, which is located five minutes walking distance from the Centre 425 Bellevue Property, is anchored by one of the top-three performing Nordstrom’s in the US, features many high-end luxury brands such as Tiffany & Co., Michael Kors, and Ted Baker London and includes a new 365 by Whole Foods Market. Other nearby retail includes Lincoln Square, a mixed-use pedestrian retail and entertainment lifestyle development and Bellevue Place, which features specialty boutique retail, dining, and art galleries. Entertainment and cultural attractions include the Bellevue art Museum, Meydenbauer Center Theatre, and Bellevue Botanical Gardens.
According to a third party market report, the Centre 425 Bellevue Property is located in the Bellevue central business district submarket, which is the largest submarket within the Eastside primary office area, containing 10.7 million SF. Bellevue central business district includes a tenant base representing both corporate users and technology based firms including Microsoft, Salesforce, Expedia, PACCAR and WeWork among others. The submarket has a vacancy rate of 14.7% with 312,189 SF of year to date absorption and no deliveries for 2017. The submarket boasts the highest average rental rates on the Eastside at $41.56 PSF. The Class A inventory in the submarket consists of 29 buildings totaling 9.2 million SF with a vacancy rate of 16.1% and average asking rental rate of $42.67 PSF.
The appraisal identified seven comparable recent office leases ranging in tenant size from 3,619 SF to 367,543 SF. The comparable leases are all located in buildings similar in class to the Centre 425 Bellevue Property, and are in the Centre 425 Bellevue Property’s general competitive market according to the appraisal. The comparable leases have terms ranging from 3.3 to 16.0 years and exhibit a range of rents from $33.00 PSF to $41.00 PSF.
The following table presents certain information relating to the directly competitive buildings at the Centre 425 Bellevue Property:
| Comparable Office Leases | |||||||
| Property Name | Year Built | Tenant Name | Lease Size (SF) | Lease Date | Lease Term (Yrs.) | Initial Rent/SF | Lease Type |
| Centre 425 Bellevue | 2017 | Amazon(1) | 354,918(1) | October 2017(1) | 16.0(1) | $38.35(1) | NNN |
| 929 Office Tower | 2015 | AdColony Salesforce Asking | 26,077 85,000 | January 2017 March 2016 | 7.0 10.0 | $34.00 $35.00 $33.00-$38.00 | NNN NNN NNN |
| 400 Lincoln Square | 2016 | Pokemon Epic Games Samsung WeWork Asking | 102,112 24,865 24,178 81,497 | November 2017 July 2017 March 2017 February 2017 | 12.5 7.5 7.0 15.5 | $42.00 $38.75 $40.75 $38.50 $37.00-$40.00 | NNN NNN NNN NNN NNN |
| Lincoln Square Office | 2007 | Microsoft (Renewal) | 211,362 | October 2017 | 6.0 | $35.50 | NNN |
| Civica Office Commons | 2001 | Expedia Morgan Stanley Asking | 47,985 23,222 | September 2016 September 2016 | 3.3 5.5 | $33.50 $36.00 $34.00-$36.00 | NNN NNN NNN |
Bellevue Place Bank of America | 1988 | Comerica Asking | 3,619 | March 2017 | 5.0 | $39.50 $39.00-$41.00 | NNN NNN |
| Urban Union | 2016 | Amazon | 286,300 | January 2017 | 16.0 | $35.17 | NNN |
| Midtown 21 | 2017 | Amazon | 367,543 | September 2017 | 16.0 | $35.00 | NNN |
Source:Appraisal
| (1) | Based on the underwritten rent roll and the Amazon lease. |
THE INFORMATION IN THIS COLLATERAL TERM SHEET IS NOT COMPLETE AND MAY BE AMENDED PRIOR TO THE TIME OF SALE. THIS TERM SHEET IS NOT AN OFFER TO SELL THESE SECURITIES AND IT IS NOT A SOLICITATION OF AN OFFER TO BUY THESE SECURITIES IN ANY JURISDICTION WHERE THE OFFER OR SALE IS NOT PERMITTED.
40
425 106th Ave NE Bellevue, WA, 98004 | Collateral Asset Summary – Loan No. 4 Centre 425 Bellevue | Cut-off Date Balance: Cut-off Date LTV Ratio: UW NCF DSCR: UW NOI Debt Yield: | $40,000,000 29.7% 3.85x 16.2% |
Operating History and Underwritten Net Cash Flow.The following table presents certain information relating to the historical operating performance and the Underwritten Net Cash Flow at the Centre 425 Bellevue Property:
| Cash Flow Analysis | |||||
| 2014(1) | 2015(1) | 2016(1) | UW | UW PSF | |
| Gross Potential Rent(2) | N/A | N/A | N/A | $13,691,256 | $38.36 |
| Total Recoveries | N/A | N/A | N/A | $6,198,423 | $17.37 |
| Less Vacancy & Concessions | N/A | N/A | N/A | ($663,839) | ($1.86) |
| Other Income(3) | N/A | N/A | N/A | $2,238,300 | $6.27 |
| Effective Gross Income | N/A | N/A | N/A | $21,464,140 | $60.14 |
| Total Operating Expense | N/A | N/A | N/A | $6,198,423 | $17.37 |
| Net Operating Income | N/A | N/A | N/A | $15,265,716 | $42.77 |
| Capital Expenditures | N/A | N/A | N/A | $35,691 | $0.10 |
| TI/LC | N/A | N/A | N/A | $0 | $0.00 |
| Net Cash Flow | N/A | N/A | N/A | $15,230,026 | $42.67 |
| Occupancy % | N/A | N/A | N/A | 100.0% | |
| NOI DSCR(4) | N/A | N/A | N/A | 3.86x | |
| NCF DSCR(4) | N/A | N/A | N/A | 3.85x | |
| NOI Debt Yield(4) | N/A | N/A | N/A | 16.2% | |
| NCF Debt Yield(4) | N/A | N/A | N/A | 16.2% | |
| (1) | Historical financials are not available as the Centre 425 Bellevue Property was completed in 2017. |
| (2) | UW Gross Potential Rent is based on the in place rent totaling $12,370,251, and includes rent averaging over the term of the Centre 425 Bellevue Mortgage Loan totaling $1,321,005. |
| (3) | UW Other Income consists of parking income per the Amazon lease (828 parking spaces at $225). |
| (4) | Debt service coverage ratios and debt yields are based on the Centre 425 Bellevue Senior Loan. |
Escrows and Reserves.At origination, the Centre 425 Bellevue Borrower deposited $149,734 upfront in escrow for annual real estate taxes, $102,289 upfront in escrow for annual insurance premiums, $10,923,817 for outstanding free rent, $1,871,090 for outstanding tenant improvements and leasing commissions, and $5,000,000 in the seller credit reserve. Provided that no event of default has occurred and is continuing, the lender will disburse on each payment date into the clearing account the lesser of (i) the amount on deposit in the seller credit reserve subaccount and (ii) $100,000.
On a monthly basis, the Centre 425 Bellevue Borrower is required to escrow (i) 1/12 of the annual estimated tax payments, which currently equates to $149,734, (ii) 1/12 of the annual estimated insurance payments, which currently equates to $17,204, (iii) 1/12 of the condominium assessments and (iv) commencing on the 37th payment date, an amount initially equal to $2,974 for a replacement reserve but the lender may reassess the amount of the monthly payment required from time to time in its reasonable discretion.
Lockbox and Cash Management.The Centre 425 Bellevue Whole Loan is structured with a hard lockbox and in place cash management. Funds deposited into the lockbox account are required to be swept on a daily basis into a cash management account controlled by the lender and applied and disbursed in accordance with the Centre 425 Bellevue Whole Loan documents. Following the occurrence of a Cash Sweep Period (as defined below), excess cash will be held as additional collateral for the Centre 425 Bellevue Whole Loan. Upon the termination of any Cash Sweep Period, excess cash will no longer be held by the lender and,provided that no event of default has occurred and is continuing (and no other Cash Sweep Period is then in effect), all amounts then on deposit in the lockbox account will be disbursed to the Centre 425 Bellevue Borrower.
A “Cash Sweep Period” will commence upon: (i) the occurrence of an event of default, (ii) the Centre 425 Bellevue Whole Loan debt service coverage ratio falling below 1.05x at the end of any calendar quarter, (iii) the commencement of a Primary Tenant Sweep Period (as defined below) and (iv) the failure by the Centre 425 Bellevue Borrower to repay the Centre 425 Bellevue Whole Loan in full at least one month prior to the ARD. A Cash Sweep Period will end with respect to clause (ii) above, if for three consecutive months (a) no default or event of default has occurred, (b) no event that would trigger another Cash Sweep Period has occurred, and (c) the Centre 425 Bellevue Whole Loan debt service coverage ratio is at least 1.15x; and, with respect to clause (iii) above, a Primary Tenant Sweep Period Cure (as defined below) has occurred (and no other Cash Sweep Period is then continuing).
A “Primary Tenant Sweep Period” will commence upon: (i) any termination of a Primary Tenant (as defined below) lease,provided,however, that the Primary Tenant Sweep Period will commence upon the date that is twelve months prior to the date set forth in the notice for the lease to terminate provide if such period is less than twelve months the Primary Tenant Sweep Period will commence immediately, (ii) the Primary Tenant has become the subject of a bankruptcy action, (iii) the Primary Tenant has gone dark in a majority of the Primary Tenant premises,provided,however, that the Primary Tenant Sweep Period will not be triggered under this subsection (iii) if the Amazon Lease Guaranty (as defined below) with respect to the Primary Tenant lease is in place and the Amazon.com, Inc., maintains a senior long-term debt rating by a S&P or Moody’s of at least A-, provided further that notwithstanding the foregoing, in the event the Primary Tenant is dark in a majority of the Primary Tenant premises during the last twelve months of the term of the loan the Primary Tenant Sweep Period will be triggered regardless if the Amazon Lease Guaranty is in place or the Amazon.com, Inc. has an A- rating or above, or (iv) the occurrence of any monetary or material non-monetary default under the Primary Tenant lease.
A “Primary Tenant Sweep Period Cure” will commence (a) if a Primary Tenant Replacement Event (as defined below) has occurred and such acceptable replacement tenant has delivered an acceptable tenant estoppel and adequate sums are on deposit in the Primary Tenant reserve subaccount with respect to all tenant improvements, leasing commissions and free rent periods still due under any lease for an acceptable replacement tenant; with respect to clause (i) above, if the Primary Tenant Replacement Event Debt Service Coverage Ratio (as defined below) is greater than 1.15x, (b) with respect to clause (ii) above, if the bankruptcy action is dismissed and the Primary Tenant lease is affirmed, (c) with respect to clause (iii) above, if the Primary Tenant or another tenant re-opens for business for a continuous period of not less than three months, or (d) with respect to clause (iv) above, if the monetary or
THE INFORMATION IN THIS COLLATERAL TERM SHEET IS NOT COMPLETE AND MAY BE AMENDED PRIOR TO THE TIME OF SALE. THIS TERM SHEET IS NOT AN OFFER TO SELL THESE SECURITIES AND IT IS NOT A SOLICITATION OF AN OFFER TO BUY THESE SECURITIES IN ANY JURISDICTION WHERE THE OFFER OR SALE IS NOT PERMITTED.
41
425 106th Ave NE Bellevue, WA, 98004 | Collateral Asset Summary – Loan No. 4 Centre 425 Bellevue | Cut-off Date Balance: Cut-off Date LTV Ratio: UW NCF DSCR: UW NOI Debt Yield: | $40,000,000 29.7% 3.85x 16.2% |
material non-monetary default is cured and no other monetary or material non-monetary default (beyond any applicable notice and/or cure period) exists under the Primary Tenant lease.
A “Primary Tenant” means Amazon as a tenant under the Amazon Lease (as defined below) and thereafter any acceptable replacement tenants occupying all or substantially all of the Primary Tenant premises under a lease that qualifies as a Material Lease (as defined below).
A “Primary Tenant Replacement Event” means the termination of the Primary Tenant lease and the Centre 425 Bellevue Borrower entering into one or more new leases for all or substantially all of the Primary Tenant premises with acceptable replacement tenant(s) and upon such terms and conditions as are reasonably acceptable to the lender in all respects.
A “Primary Tenant Replacement Event Debt Service Coverage Ratio” as of any date, is the ratio calculated by the lender of (i) the net operating income of the Centre 425 Bellevue Property calculated based on (x) the in-place rent roll of the Centre 425 Bellevue Property for the succeeding twelve month period and (y) expenses for the previous twelve month period commencing with the most recently completed calendar month after deducting therefrom deposits to (but not withdrawals from) any reserves required under the loan agreement to (ii) the debt service for the Centre 425 Bellevue Whole Loan and the Centre 425 Bellevue Mezzanine Loan debt service with respect to such twelve month period.
An “Amazon Lease” means the certain lease agreement, dated October 5, 2016 by and between SWB-I Bellevue, LLC, a Delaware limited liability company, as landlord, and Amazon, as tenant, as the same may be amended, modified, supplemented or replaced from time to time.
An “Amazon Lease Guaranty” means the certain limited guaranty of lease, dated September 30, 2016 by and between SWB-I Bellevue, LLC, a Delaware limited liability company, as landlord, and Amazon.com, Inc., a Delaware corporation, as guarantor, as the guarantor, as the same may be amended, modified, supplemented or replaced from time to time.
A “Material Lease” means the (x) Amazon Lease or (y) all leases which individually or in the aggregate with respect to the same tenant and its affiliates (i) constitute 10.0% or more of the property’s gross leasable area, (ii) have a gross annual rent of 10.0% or more of the total annual rents, or (iii) demise at least one full floor of the improvements.
Additional Secured Indebtedness (not including trade debts).In addition to the Centre 425 Bellevue Mortgage Loan, the Centre 425 Bellevue Property also secures the other note that comprises the Centre 425 Bellevue Senior Loan, which has a Cut-off Date principal balance of $54,000,000 and the Centre 425 Bellevue Subordinate Companion Loan, which has a Cut-off Date principal balance of $114,450,000. The Centre 425 Bellevue Subordinate Companion Loan is coterminous with the Centre 425 Bellevue Senior Loan and accrues interest at 4.3580388% per annum. The Centre 425 Bellevue Mortgage Loan along with the other note that comprises the Centre 425 Bellevue Senior Loan are eachpari passu in right of payment and the Centre 425 Bellevue Senior Loan is senior in right of payment to the Centre 425 Bellevue Subordinate Companion Loan. The holders of the Centre 425 Bellevue Mortgage Loan, the other note that comprises the Centre 425 Bellevue Senior Loan and the Centre 425 Bellevue Subordinate Companion Loan have entered into a co-lender agreement which sets forth the allocation of collections on the Centre 425 Bellevue Whole Loan. See “Description of the Mortgage Pool—The Whole Loans—The Serviced AB Whole Loans”in the Preliminary Prospectus.
Mezzanine Loan and Preferred Equity. The Centre 425 Bellevue Mezzanine Loan is secured by the equity in the Centre 425 Bellevue Borrower. The Centre 425 Bellevue Mezzanine Loan has an original principal balance $57,600,000, has an interest only coupon of 7.2500% through the full term, and is coterminous with the Centre 425 Bellevue Whole Loan. Including the Centre 425 Bellevue Subordinate Companion Loan and the Centre 425 Bellevue Mezzanine Loan, the cumulative Cut-off Date LTV ratio, cumulative UW NCF DSCR and cumulative UW NOI Debt Yield are 84.2%, 1.15x and 5.7%, respectively. The mortgage and mezzanine lenders have entered into an intercreditor agreement.
Release of Property. Not permitted.
Terrorism Insurance.The Centre 425 Bellevue Whole Loan documents require that the “all risk” insurance policy required to be maintained by the Centre 425 Bellevue Borrower provides coverage for terrorism in an amount equal to the full replacement cost of the Centre 425 Bellevue Property. The Centre 425 Bellevue Whole Loan documents also require loss of rent and business interruption insurance covering no less than the 18-month period following the occurrence of a casualty event, together with an extended period of indemnity endorsement of not less than six months which provides that after the physical loss to the Centre 425 Bellevue Property has been repaired, the continued loss of income will be insured until such income either returns to the same level it was at prior to the loss, or the expiration of 24 months from the date that the Centre 425 Bellevue Property is damaged, whichever first occurs, and notwithstanding that the policy may expire prior to the end of such period.
THE INFORMATION IN THIS COLLATERAL TERM SHEET IS NOT COMPLETE AND MAY BE AMENDED PRIOR TO THE TIME OF SALE. THIS TERM SHEET IS NOT AN OFFER TO SELL THESE SECURITIES AND IT IS NOT A SOLICITATION OF AN OFFER TO BUY THESE SECURITIES IN ANY JURISDICTION WHERE THE OFFER OR SALE IS NOT PERMITTED.
42
| Various | Collateral Asset Summary – Loan No. 5 ExchangeRight Net Leased | Cut-off Date Balance: Cut-off Date LTV Ratio: UW NCF DSCR: UW NOI Debt Yield: | $36,860,000 61.2% 2.23x 9.3% |
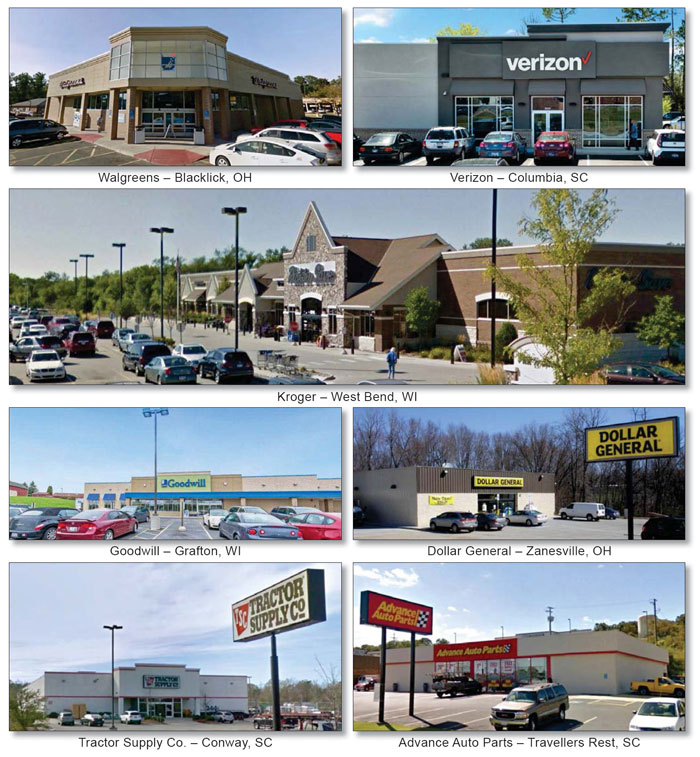
THE INFORMATION IN THIS COLLATERAL TERM SHEET IS NOT COMPLETE AND MAY BE AMENDED PRIOR TO THE TIME OF SALE. THIS TERM SHEET IS NOT AN OFFER TO SELL THESE SECURITIES AND IT IS NOT A SOLICITATION OF AN OFFER TO BUY THESE SECURITIES IN ANY JURISDICTION WHERE THE OFFER OR SALE IS NOT PERMITTED.
43
| Various | Collateral Asset Summary – Loan No. 5 ExchangeRight Net Leased | Cut-off Date Balance: Cut-off Date LTV Ratio: UW NCF DSCR: UW NOI Debt Yield: | $36,860,000 61.2% 2.23x 9.3% |
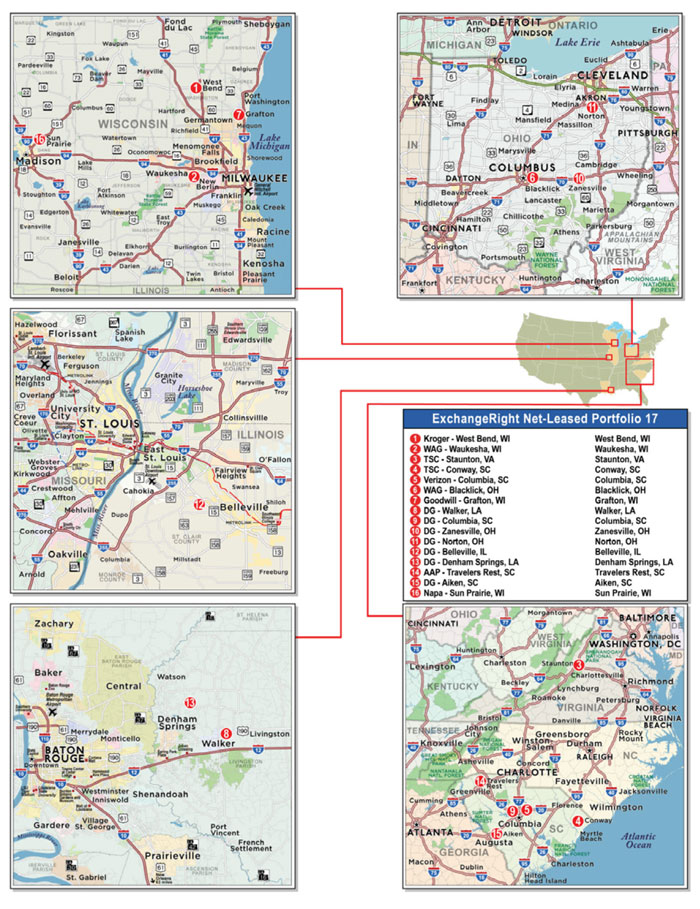
THE INFORMATION IN THIS COLLATERAL TERM SHEET IS NOT COMPLETE AND MAY BE AMENDED PRIOR TO THE TIME OF SALE. THIS TERM SHEET IS NOT AN OFFER TO SELL THESE SECURITIES AND IT IS NOT A SOLICITATION OF AN OFFER TO BUY THESE SECURITIES IN ANY JURISDICTION WHERE THE OFFER OR SALE IS NOT PERMITTED.
44
| Various | Collateral Asset Summary – Loan No. 5 ExchangeRight Net Leased | Cut-off Date Balance: Cut-off Date LTV Ratio: UW NCF DSCR: UW NOI Debt Yield: | $36,860,000 61.2% 2.23x 9.3% |
| Mortgage Loan Information | Property Information | |||||||
| Mortgage Loan Seller: | Société Générale | Single Asset/Portfolio: | Portfolio | |||||
| Credit Assessment (Fitch/KBRA/Moody’s/S&P): | [ ] | Location(2): | Various | |||||
| General Property Type: | Retail | |||||||
| Original Balance: | $36,860,000 | Detailed Property Type: | Single Tenant | |||||
| Cut-off Date Balance: | $36,860,000 | Title Vesting: | Fee | |||||
| % of Initial Pool Balance: | [ ]% | Year Built/Renovated(2): | Various | |||||
| Loan Purpose: | Acquisition | Size: | 248,882 SF | |||||
Borrower Sponsors:
| ExchangeRight Real Estate, LLC; David Fisher; Joshua Ungerecht; Warren Thomas | Cut-off Date Balance per SF: | $148 | |||||
| Maturity Date Balance per SF: | $148 | |||||||
Property Manager:
| NLP Management, LLC (borrower-related) | |||||||
| Mortgage Rate: | 3.9930% | |||||||
| Note Date: | 8/10/2017 | |||||||
| First Payment Date: | 10/1/2017 | |||||||
| Maturity Date: | 9/1/2027 | |||||||
| Original Term to Maturity: | 120 months | |||||||
| Original Amortization Term: | 0 months | |||||||
| IO Period: | 120 months | Underwriting and Financial Information | ||||||
| Seasoning: | 2 months | UW NOI: | $3,415,642 | |||||
| Prepayment Provisions: | LO (26); DEF (90); O (4) | UW NOI Debt Yield: | 9.3% | |||||
| Lockbox/Cash Mgmt Status: | Hard/Springing | UW NOI Debt Yield at Maturity: | 9.3% | |||||
| Additional Debt Type: | N/A | UW NCF DSCR: | 2.23x | |||||
| Additional Debt Balance: | N/A | Most Recent NOI(3): | N/A | |||||
| Future Debt Permitted (Type): | No (N/A) | 2nd Most Recent NOI(3): | N/A | |||||
| Reserves(1) | 3rd Most Recent NOI(3): | N/A | ||||||
| Type | Initial | Monthly | Cap | Most Recent Occupancy: | 100.0% (11/1/2017) | |||
| RE Tax: | $179,394 | $25,337 | N/A | 2nd Most Recent Occupancy: | 100.0% (12/31/2016) | |||
| Insurance: | $22,227 | $2,778 | N/A | 3rd Most Recent Occupancy: | 100.0% (12/31/2015) | |||
| Replacements: | $124,766 | $981 | N/A | Appraised Value (as of): | $60,275,000 (Various) | |||
| TI/LC: | $500,000 | Springing | N/A | Cut-off Date LTV Ratio: | 61.2% | |||
| Deferred Maintenance: | $171,909 | $0 | N/A | Maturity Date LTV Ratio: | 61.2% | |||
| Sources and Uses | ||||||
| Sources | Proceeds | % of Total | Uses | Proceeds | % of Total | |
| Loan Amount: | $36,860,000 | 59.9% | Purchase Price: | $59,940,561 | 97.3% | |
| Borrower Equity: | $24,721,345 | 40.1% | Reserves: | $998,296 | 1.6% | |
| Closing Costs: | $642,488 | 1.0% | ||||
| Total Sources: | $61,581,345 | 100.0% | Total Uses: | $61,581,345 | 100.0% | |
| (1) | See“Escrows and Reserves” below for further discussion of reserve requirements. |
| (2) | See“The Properties” below for further discussion of property information. |
| (3) | Historical cash flows are unavailable as the ExchangeRight Net Leased Portfolio Properties (as defined below) were acquired by the borrower sponsors between March 28, 2017 and June 30, 2017. The sellers of the ExchangeRight Net Leased Portfolio Properties did not provide historical operating statements to the ExchangeRight Net Leased Portfolio Borrower (as defined below). |
The Mortgage Loan. The fifth largest mortgage loan (the “ExchangeRight Net Leased Portfolio Mortgage Loan”) is evidenced by a single promissory note with an original principal balance of $36,860,000 and is secured by first priority fee mortgages encumbering 16 cross-collateralized, single tenant retail properties located in South Carolina, Wisconsin, Ohio, Louisiana, Illinois, and Virginia (collectively, the “ExchangeRight Net Leased Portfolio Properties”). The ExchangeRight Net Leased Portfolio Mortgage Loan was originated on August 10, 2017 by Société Générale. The ExchangeRight Net Leased Portfolio Mortgage Loan accrues interest at an interest rate of 3.9930%per annum. The ExchangeRight Net Leased Portfolio Mortgage Loan had an initial term of 120 months, has a remaining term of 118 months as of the Cut-off Date and requires payments of interest only through the ExchangeRight Net Leased Portfolio Mortgage Loan term. The ExchangeRight Net Leased Portfolio Mortgage Loan matures on September 1, 2027. The proceeds of the ExchangeRight Net Leased Portfolio Mortgage Loan, along with approximately $24.7 million of borrower sponsors cash equity, were used to purchase the ExchangeRight Net Leased Portfolio Properties, fund reserves, and pay closing costs.
Following the lockout period, on any date before June 1, 2027, the borrower sponsors have the right to defease the ExchangeRight Net Leased Portfolio Mortgage Loan in whole, but not in part. The lockout period will expire two years after the closing date of this securitization. The assumed lockout period of 26 payments is based on the closing date of the UBS 2017-C5 transaction in November 2017. In addition, the ExchangeRight Net Leased Portfolio Mortgage Loan is prepayable without penalty on or after June 1, 2027.
THE INFORMATION IN THIS COLLATERAL TERM SHEET IS NOT COMPLETE AND MAY BE AMENDED PRIOR TO THE TIME OF SALE. THIS TERM SHEET IS NOT AN OFFER TO SELL THESE SECURITIES AND IT IS NOT A SOLICITATION OF AN OFFER TO BUY THESE SECURITIES IN ANY JURISDICTION WHERE THE OFFER OR SALE IS NOT PERMITTED.
45
| Various | Collateral Asset Summary – Loan No. 5 ExchangeRight Net Leased | Cut-off Date Balance: Cut-off Date LTV Ratio: UW NCF DSCR: UW NOI Debt Yield: | $36,860,000 61.2% 2.23x 9.3% |
The Borrower and the Borrower Sponsors.The borrower is ExchangeRight Net Leased Portfolio 17 DST (the “ExchangeRight Net Leased Portfolio Borrower”), a Delaware Statutory Trust. At origination of the ExchangeRight Net Leased Portfolio Mortgage Loan, the ExchangeRight Net Leased Portfolio Properties were conveyed and assumed from ExchangeRight Net Leased Portfolio 17, LLC to and by the ExchangeRight Net Leased Portfolio Borrower. The ExchangeRight Net Leased Portfolio Borrower has master leased the ExchangeRight Net Leased Portfolio Properties to ExchangeRight NLP 17 Master Lessee, LLC (the “Master Lessee”), a Delaware limited liability company, which is an affiliate of the borrower sponsors. The Master Lessee is structured as a special purpose entity in which the borrower sponsors have a 100% ownership interest. The Master Lessee’s interest in the master lease and all tenant rents are collaterally assigned to the lender. The master lease is subordinate to the ExchangeRight Net Leased Portfolio Mortgage Loan. There is one independent trustee for the ExchangeRight Net Leased Portfolio Borrower and one independent manager for the Master Lessee. Legal counsel to the ExchangeRight Net Leased Portfolio Borrower delivered a non-consolidation opinion in connection with the origination of the ExchangeRight Net Leased Portfolio Mortgage Loan. ExchangeRight Real Estate, LLC (“ExchangeRight”), David Fisher, Joshua Ungerecht and Warren Thomas are the guarantors of certain nonrecourse carveouts under the ExchangeRight Net Leased Portfolio Mortgage Loan. See“Description of the Mortgage Pool—Mortgage Pool Characteristics—Tenancies-in-Common or Diversified Ownership” in the Preliminary Prospectus.
The borrower sponsors are ExchangeRight, David Fisher, Joshua Ungerecht and Warren Thomas. David Fisher, Joshua Ungerecht and Warren Thomas are managing members of ExchangeRight, which has more than $900.0 million in assets located across 28 states including 265 single-tenant retail properties and 52 apartment communities consisting of over 6,500 units. ExchangeRight’s focus is in providing long-term stable income and asset preservation through long-term net-leased portfolios backed by investment grade corporations.
The Properties.The ExchangeRight Net Leased Portfolio Properties comprise 16 cross-collateralized, single tenant retail properties totaling 248,882 SF located in South Carolina (five properties), Wisconsin (four properties), Ohio (three properties), Louisiana (two properties), Illinois (one property), and Virginia (one property). Built between 1989 and 2017, the ExchangeRight Net Leased Portfolio Properties range in size from 5,342 SF to 63,133 SF. The borrower sponsors acquired the ExchangeRight Net Leased Portfolio Properties between March 28, 2017 and June 30, 2017 for a combined purchase price of approximately $60.0 million. As of November 1, 2017, the ExchangeRight Net Leased Portfolio Properties were 100.0% occupied.
The ExchangeRight Net Leased Portfolio Properties are 100.0% occupied by eight tenants at 16 different locations including nationally recognized investment grade tenants, such as Dollar General (rated Baa2/BBB by Moody’s/S&P), Kroger (rated BBB/Baa1/BBB by Fitch/Moody’s/S&P), Walgreens (rated BBB/Baa2/BBB by Fitch/Moody’s/S&P), Advance Auto Parts (rated Baa2/BBB- by Moody’s/S&P), and Verizon Wireless (rated A-/Baa1/BBB+ by Fitch/Moody’s/S&P). Investment grade tenants occupy 12 of the 16 properties, representing 70.0% of NRA and 76.2% of underwritten base rent (leases are directly with rated entities or are guaranteed by such entities). The largest property, Kroger - West Bend, WI, comprises approximately 63,133 SF (25.4% of the total net rentable area) and $1,136,678 of the underwritten base rent (29.9% of underwritten base rent). Other than Kroger - West Bend, WI, no individual property accounts for more than 9.9% of NRA and 10.5% of the underwritten base rent. All leases are NNN or NN and the average remaining lease term for the ExchangeRight Net Leased Portfolio Properties is approximately 12.8 years (including termination options). Leases representing approximately 85.9% of NRA and 83.8% of the underwritten base rent expire after the ExchangeRight Net Leased Portfolio Mortgage Loan maturity date.
The following table presents certain information relating to the ExchangeRight Net Leased Portfolio Properties:
| Property Summary(1) | |||||||
| Property Name | Allocated Cut-off Date Loan Amount | % of Allocated Cut-off Date Loan Amount | Year Built/ Renovated | Occupancy | Tenant SF | Allocated Cut-off Date LTV | Appraised Value |
| Kroger - West Bend, WI | $11,183,861 | 30.3% | 2010/N/A | 100.0% | 63,133 | 61.4% | $18,200,000 |
| Walgreens - Waukesha, WI | $3,935,632 | 10.7% | 1999/N/A | 100.0% | 15,615 | 61.5% | $6,400,000 |
| Tractor Supply Co. - Staunton, VA | $3,318,738 | 9.0% | 2006/N/A | 100.0% | 22,676 | 60.9% | $5,450,000 |
| Tractor Supply Co. - Conway, SC | $3,211,890 | 8.7% | 2006/N/A | 100.0% | 24,738 | 61.2% | $5,250,000 |
| Verizon - Columbia, SC | $3,142,017 | 8.5% | 2016/N/A | 100.0% | 6,254 | 60.4% | $5,200,000 |
| Walgreens - Blacklick, OH | $3,016,293 | 8.2% | 2001/2009 | 100.0% | 14,489 | 61.6% | $4,900,000 |
| Goodwill - Grafton, WI | $1,905,963 | 5.2% | 1996/2012 | 100.0% | 22,000 | 60.5% | $3,150,000 |
| Dollar General- Walker, LA | $1,155,784 | 3.1% | 2012/N/A | 100.0% | 12,526 | 61.6% | $1,875,000 |
| Dollar General - Norton, OH | $852,200 | 2.3% | 2013/N/A | 100.0% | 9,327 | 60.9% | $1,400,000 |
| Dollar General - Denham Springs, | $848,425 | 2.3% | 2017/N/A | 100.0% | 9,187 | 60.6% | $1,400,000 |
| Dollar General - Zanesville, OH | $846,013 | 2.3% | 2016/N/A | 100.0% | 9,289 | 60.4% | $1,400,000 |
| Dollar General - Belleville, IL | $785,555 | 2.1% | 2015/N/A | 100.0% | 9,126 | 61.4% | $1,280,000 |
| Dollar General - Columbia, SC | $744,080 | 2.0% | 2013/N/A | 100.0% | 9,153 | 61.0% | $1,220,000 |
| Advanced Auto Parts - Travelers | $743,035 | 2.0% | 2001/N/A | 100.0% | 6,891 | 61.9% | $1,200,000 |
| Dollar General - Aiken, SC | $723,283 | 2.0% | 2016/N/A | 100.0% | 9,136 | 60.3% | $1,200,000 |
| Napa Auto Parts - Sun Prairie, WI | $447,231 | 1.2% | 1989/2017 | 100.0% | 5,342 | 59.6% | $750,000 |
| Total/Wtd. Avg. | $36,860,000 | 100.0% | 100.0% | 248,882 | 61.2% | $60,275,000 | |
| (1) | The ExchangeRight Net Leased Portfolio Properties comprise 16 single tenant retail properties. |
THE INFORMATION IN THIS COLLATERAL TERM SHEET IS NOT COMPLETE AND MAY BE AMENDED PRIOR TO THE TIME OF SALE. THIS TERM SHEET IS NOT AN OFFER TO SELL THESE SECURITIES AND IT IS NOT A SOLICITATION OF AN OFFER TO BUY THESE SECURITIES IN ANY JURISDICTION WHERE THE OFFER OR SALE IS NOT PERMITTED.
46
| Various | Collateral Asset Summary – Loan No. 5 ExchangeRight Net Leased | Cut-off Date Balance: Cut-off Date LTV Ratio: UW NCF DSCR: UW NOI Debt Yield: | $36,860,000 61.2% 2.23x 9.3% |
The following table presents certain information relating to the leases at the ExchangeRight Net Leased Portfolio Properties:
| Tenant Summary(1) | |||||||
| Tenant Name | Credit Rating (Fitch/Moody’s/S&P)(2) | Tenant SF | Approximate % of SF | Annual UW Base Rent | % of Total Annual UW Base Rent | Annual UW Base Rent PSF | Lease Expiration |
| Tenants | |||||||
| Dollar General | NR/Baa2/BBB | 67,744 | 27.2% | $650,814 | 17.1% | $9.61 | Various(3) |
| Kroger | BBB/Baa1/BBB | 63,133 | 25.4% | $1,136,678 | 29.9% | $18.00 | 12/31/2030(4) |
| Tractor Supply | NR/NR/NR | 47,414 | 19.1% | $642,504 | 16.9% | $13.55 | 5/31/2032(5) |
| Walgreens | BBB/Baa2/BBB | 30,104 | 12.1% | $708,000 | 18.6% | $23.52 | Various(6) |
| Goodwill | NR/NR/NR | 22,000 | 8.8% | $212,930 | 5.6% | $9.68 | 8/31/2027(7) |
| Advanced Auto Parts | NR/Baa2/BBB- | 6,891 | 2.8% | $78,540 | 2.1% | $11.40 | 12/31/2026(8) |
| Verizon | A-/Baa1/BBB+ | 6,254 | 2.5% | $324,450 | 8.5% | $51.88 | 1/31/2027(9) |
| Napa Auto Parts | NR/NR//NR | 5,342 | 2.1% | $48,000 | 1.3% | $8.99 | 8/10/2037(10) |
| Subtotal/Wtd. Avg. | 248,882 | 100.0% | $3,801,916 | 100.0% | $15.28 | ||
| Vacant Space | 0 | 0.0% | $0 | 0.0% | $0.00 | ||
| Total/Wtd. Avg. | 248,882 | 100.0% | $3,801,916 | 100.0% | $15.28 | ||
| (1) | Information is based on the underwritten rent roll. |
| (2) | Certain ratings are those of the parent company whether or not the parent company guarantees the lease. |
| (3) | Dollar General is a tenant at seven of the ExchangeRight Net Leased Portfolio Properties and leases (i) 12,526 SF at the Dollar General - Walker, LA property under a lease that expires on June 30, 2028 and has three five-year renewal options, (ii) 9,327 SF at the Dollar General - Norton, OH property under a lease that expires on April 30, 2029 and has four five-year renewal options, (iii) 9,289 SF at the Dollar General - Zanesville, OH property under a lease that expires on March 31, 2031 and has three five-year renewal options, (iv) 9,187 SF at the Dollar General - Denham Springs, LA property under a lease that expires on June 30, 2032 and has three five-year lease renewal options, (v) 9,153 SF at the Dollar General - Columbia, SC property under a lease that expires on June 30, 2028 and has five five-year renewal options, (vi) 9,136 SF at the Dollar General - Aiken, SC property under a lease that expires on March 31, 2031 and has five five-year renewal options, and (vii) 9,126 SF at the Dollar General - Belleville, IL property under a lease that expires on October 31, 2030 and has three five-year renewal options. |
| (4) | Kroger has four five-year renewal options. |
| (5) | Tractor Supply is a tenant at two of the ExchangeRight Net Leased Portfolio Properties and leases (i) 24,738 SF at the Tractor Supply - Conway, SC property under a lease that expires on May 31, 2032 and has four five-year renewal options and (ii) 22,676 SF at the Tractor Supply - Staunton, VA property under a lease that expires on May 31, 2032 and has four five-year renewal options. |
| (6) | Walgreens is a tenant at two of the ExchangeRight Net Leased Portfolio Properties and leases (i) 15,615 SF at the Walgreens - Waukesha, WI property and (ii) 14,489 SF at the Walgreens - Blacklick, OH property. Walgreens (i) has the right terminate its lease at the Walgreens - Waukesha, WI property, effective as of December 31, 2028 and every five years thereafter until the lease expires on December 31, 2068 and (ii) has the right terminate its lease at the Walgreens - Blacklick, OH property, effective as of August 31, 2028 and every five years thereafter until the lease expires on August 31, 2068. |
| (7) | Goodwill has three five-year renewal options. |
| (8) | Advance Auto Parts has two five-year renewal options. |
| (9) | Verizon has two five-year renewal options. |
| (10) | Napa Auto Parts has four five-year renewal options. |
The following table presents certain information relating to the lease rollover schedule at the ExchangeRight Net Leased Portfolio Properties:
| Lease Rollover Schedule(1) | ||||||||
| Year | # of Leases Rolling | SF Rolling | Approx. % of Total SF Rolling | Approx. Cumulative % of SF Rolling | UW Base Rent PSF Rolling | Total UW Base Rent Rolling | Approx. % of Total Base Rent Rolling | Approx. Cumulative % of Total Base Rent Rolling |
| MTM | 0 | 0 | 0.0% | 0.0% | $0.00 | $0 | 0.0% | 0.0% |
| 2017 | 0 | 0 | 0.0% | 0.0% | $0.00 | $0 | 0.0% | 0.0% |
| 2018 | 0 | 0 | 0.0% | 0.0% | $0.00 | $0 | 0.0% | 0.0% |
| 2019 | 0 | 0 | 0.0% | 0.0% | $0.00 | $0 | 0.0% | 0.0% |
| 2020 | 0 | 0 | 0.0% | 0.0% | $0.00 | $0 | 0.0% | 0.0% |
| 2021 | 0 | 0 | 0.0% | 0.0% | $0.00 | $0 | 0.0% | 0.0% |
| 2022 | 0 | 0 | 0.0% | 0.0% | $0.00 | $0 | 0.0% | 0.0% |
| 2023 | 0 | 0 | 0.0% | 0.0% | $0.00 | $0 | 0.0% | 0.0% |
| 2024 | 0 | 0 | 0.0% | 0.0% | $0.00 | $0 | 0.0% | 0.0% |
| 2025 | 0 | 0 | 0.0% | 0.0% | $0.00 | $0 | 0.0% | 0.0% |
| 2026 | 1 | 6,891 | 2.8% | 2.8% | $11.40 | $78,540 | 2.1% | 2.1% |
| 2027 | 2 | 28,254 | 11.4% | 14.1% | $19.02 | $537,380 | 14.1% | 16.2% |
| 2028 & Beyond | 13 | 213,737 | 85.9% | 100.0% | $14.91 | $3,185,996 | 83.8% | 100.0% |
| Vacant | 0 | 0 | 0.0% | 100.0% | $0.00 | $0 | 0.0% | 100.0% |
| Total/Wtd. Avg. | 16 | 248,882 | 100.0% | $15.28 | $3,801,916 | 100.0% | ||
| (1) | Information is based on the underwritten rent roll. |
THE INFORMATION IN THIS COLLATERAL TERM SHEET IS NOT COMPLETE AND MAY BE AMENDED PRIOR TO THE TIME OF SALE. THIS TERM SHEET IS NOT AN OFFER TO SELL THESE SECURITIES AND IT IS NOT A SOLICITATION OF AN OFFER TO BUY THESE SECURITIES IN ANY JURISDICTION WHERE THE OFFER OR SALE IS NOT PERMITTED.
47
| Various | Collateral Asset Summary – Loan No. 5 ExchangeRight Net Leased | Cut-off Date Balance: Cut-off Date LTV Ratio: UW NCF DSCR: UW NOI Debt Yield: | $36,860,000 61.2% 2.23x 9.3% |
The Market. The ExchangeRight Net Leased Portfolio Properties are located across six states and 12 distinct markets. The following table presents certain market information relating to the ExchangeRight Net Leased Portfolio Properties:
| Market Summary | ||||
| Property Name | Market(1) | Market Vacancy(1) | Rental Rate PSF | |
| Actual(2) | Market(1)(3) | |||
| Kroger - West Bend, WI | Milwaukee | 12.7% | $18.00 | $18.00 |
| Walgreens - Waukesha, WI | Milwaukee | 12.7% | $25.62 | $25.50 |
| Tractor Supply Co. - Staunton, VA | Staunton-Waynesboro | 5.8% | $14.40 | $14.50 |
| Tractor Supply Co. - Conway, SC | Myrtle Beach-Conway | 3.7% | $12.77 | $12.75 |
| Verizon - Columbia, SC | Columbia | 10.9% | $51.88 | $52.00 |
| Walgreens - Blacklick, OH | Columbus | 4.8% | $21.26 | $24.28(3) |
| Goodwill - Grafton, WI | Milwaukee | 12.7% | $9.68 | $10.00 |
| Dollar General - Walker, LA | Baton Rouge | 4.5% | $10.05 | $10.00 |
| Dollar General - Norton, OH | Akron | 3.1% | $9.95 | $11.48(3) |
| Dollar General - Denham, LA Springs, LA | Baton Rouge | 4.5% | $9.91 | $10.00 |
| Dollar General - Zanesville, OH | Zanesville | 4.8% | $9.85 | $9.00 |
| Dollar General - Belleville, IL | St. Louis | 12.2% | $9.38 | $9.50 |
| Dollar General - Columbia, SC | Columbia | 10.9% | $9.36 | $9.50 |
| Advanced Auto Parts - Travelers Rest, SC | Greenville | 13.4% | $11.40 | $11.25 |
| Dollar General - Aiken, SC | Augusta-Richmond | 4.1% | $8.56 | $8.50 |
| Napa Auto Parts - Sun Prairie, WI | Madison | 18.9% | $8.99 | $9.00 |
| Wtd. Avg.(4) | 9.5% | $15.28 | $15.51 | |
| (1) | Information is based on the appraisals. |
| (2) | Information is based on the underwritten rent roll. |
| (3) | Information is based on the appraisals surveyed comparable first generation rents for similar properties. |
| (4) | Wtd. Avg. Market Vacancy is based on each property’s allocated cut-off date loan amount as referenced in the Portfolio Summary table above. |
Operating History and Underwritten Net Cash Flow. The following table presents certain information relating to the historical operating performance and the Underwritten Net Cash Flow at the ExchangeRight Net Leased Portfolio Properties:
| Cash Flow Analysis | ||||||
| 2014(1) | 2015(1) | 2016(1) | UW | UW PSF | ||
| Gross Potential Rent(2) | N/A | N/A | N/A | $3,801,916 | $15.28 | |
| Total Recoveries(3) | N/A | N/A | N/A | $342,827 | $1.38 | |
| Less Vacancy & Credit Loss | N/A | N/A | N/A | ($264,610) | ($1.06) | |
| Effective Gross Income | N/A | N/A | N/A | $3,880,133 | $15.59 | |
| Total Operating Expenses(4) | N/A | N/A | N/A | $464,491 | $1.87 | |
| Net Operating Income | N/A | N/A | N/A | $3,415,642 | $13.72 | |
| Capital Expenditures | N/A | N/A | N/A | $31,493 | $0.13 | |
| TI/LC | N/A | N/A | N/A | $58,559 | $0.24 | |
| Net Cash Flow | N/A | N/A | N/A | $3,325,590 | $13.36 | |
| Occupancy % | 100.0% | 100.0% | 100.0% | 100.0% | ||
| NOI DSCR | N/A | N/A | N/A | 2.29x | ||
| NCF DSCR | N/A | N/A | N/A | 2.23x | ||
| NOI Debt Yield | N/A | N/A | N/A | 9.3% | ||
| NCF Debt Yield | N/A | N/A | N/A | 9.0% | ||
| (1) | Historical cash flows are unavailable as the ExchangeRight Net Leased Portfolio Properties were acquired by the borrower sponsors between March 28, 2017 and June 30, 2017. The sellers of the ExchangeRight Net Leased Portfolio Properties did not provide historical operating statements to the ExchangeRight Net Leased Portfolio Borrower. |
| (2) | UW Gross Potential Rent is based on in-place rent per lease. |
| (3) | UW Total Recoveries are underwritten based on tenant leases. There are no reimbursements at three of the properties as tenants pay their respective property expenses directly. |
| (4) | UW Total Operating Expenses include real estate taxes, actual insurance premiums, repairs and maintenance and management fees calculated as 3.0% of ExchangeRight Net Leased Portfolio Properties effective gross income. |
Escrows and Reserves. The ExchangeRight Net Leased Portfolio Mortgage Loan documents provide for upfront escrows in the amount of $179,394 for real estate taxes, $22,227 for insurance premiums, $124,766 for outstanding replacement reserves, $500,000 for tenant improvement and leasing commissions, and $171,909 for deferred maintenance. Additionally, the ExchangeRight Net Leased Portfolio Mortgage Loan documents provide for ongoing monthly escrows of $25,337 for real estate taxes, $2,778 for insurance premiums and other assessments and $981 for replacement reserves, and, if an event of default is continuing, $14,518 for tenant improvement and leasing commissions (“TI/LC”).
THE INFORMATION IN THIS COLLATERAL TERM SHEET IS NOT COMPLETE AND MAY BE AMENDED PRIOR TO THE TIME OF SALE. THIS TERM SHEET IS NOT AN OFFER TO SELL THESE SECURITIES AND IT IS NOT A SOLICITATION OF AN OFFER TO BUY THESE SECURITIES IN ANY JURISDICTION WHERE THE OFFER OR SALE IS NOT PERMITTED.
48
| Various | Collateral Asset Summary – Loan No. 5 ExchangeRight Net Leased | Cut-off Date Balance: Cut-off Date LTV Ratio: UW NCF DSCR: UW NOI Debt Yield: | $36,860,000 61.2% 2.23x 9.3% |
Notwithstanding the foregoing, the ExchangeRight Net Leased Portfolio Borrower will not be required to provide monthly real estate taxes and insurance premiums, which are solely the obligation of such tenant and paid directly to the relevant taxing authority or insurance company by such tenant in accordance with such tenant’s lease, for so long as (i) no event of default has occurred and is continuing, (ii) the ExchangeRight Net Leased Portfolio Borrower provides proof of payment by the tenant (or the ExchangeRight Net Leased Portfolio Borrower) directly to the taxing authority or the applicable insurance company on or before 15 days prior to the delinquency date of such taxes, (iii) the lease(s) with the applicable tenant(s) will be and continue to be in full force and effect and will not be subject to any default beyond any applicable grace or notice and cure period by either the ExchangeRight Net Leased Portfolio Borrower or the tenant, and (iv) no material adverse change has, in the lender’s reasonable determination, occurred with respect to the applicable tenant such that the ability to timely pay the taxes or insurance premiums that the applicable tenant is required to pay pursuant to its lease has, been materially jeopardized. In addition, the ExchangeRight Net Leased Portfolio Borrower is not required to make deposits into a capital reserve subaccount with respect to the aggregate number of rentable SF at the ExchangeRight Net Leased Portfolio Properties for which the tenants are obligated under their applicable leases to pay capital expenses for their respective premises, for so long as (i) no event of default has occurred and be continuing, (ii) the ExchangeRight Net Leased Portfolio Borrower provides proof of payment by all applicable tenants of the payment of all such capital expenses promptly following request by the lender, (iii) the leases with the applicable tenants are and continue to be in full force and effect and are not be subject to any default beyond any applicable grace or notice and cure period, and (iv) no material adverse change has, in the lender’s reasonable determination, occurred with respect to the applicable tenant such that the ability to timely pay the capital expenses for its respective premises pursuant to its lease has been materially jeopardized. If an event of default has occurred and is continuing, the ExchangeRight Net Leased Portfolio Borrower is required to deposit $14,518 on a monthly basis into the TI/LC reserve and any sum or termination fee payable to the ExchangeRight Net Leased Portfolio Borrower.
Lockbox and Cash Management.The ExchangeRight Net Leased Portfolio Mortgage Loan is structured with a hard lockbox and springing cash management. All rents are required to be paid directly into an eligible account maintained by the ExchangeRight Net Leased Portfolio Borrower at a local bank selected by the ExchangeRight Net Leased Portfolio Borrower, which is required at all times to be an eligible institution. Without in any way limiting the foregoing, if the ExchangeRight Net Leased Portfolio Borrower, Master Lessee or manager receive any rents, then (i) such amounts will be deemed to be collateral for the ExchangeRight Net Leased Portfolio Mortgage Loan and will be held in trust by the ExchangeRight Net Leased Portfolio Borrower, Master Lessee or the manager, as applicable, for the benefit, and as the property, of the lender, (ii) such amounts may not be commingled with any other funds or property of the ExchangeRight Net Leased Portfolio Borrower, Master Lessee, or manager, and (iii) the ExchangeRight Net Leased Portfolio Borrower, Master Lessee, or manager, as applicable, is required to deposit such amounts into a clearing account within two business days of receipt. Funds deposited into the clearing account will be swept by the clearing bank on a daily basis into the Master Lessee’s operating account at the clearing bank, unless a Cash Management Period (as defined below) is continuing, in which event such funds will be swept on a daily basis into an eligible account at a deposit bank controlled by the lender. To the extent any Cash Management Period expires or terminates, any funds deposited into the clearing account will be swept by the clearing bank on a daily basis into Master Lessee’s operating account by the lender’s delivery of a notice to the clearing bank, with the lender being entitled to send a subsequent notice to the clearing bank upon the occurrence of a subsequent Cash Management Period to redirect all amounts from the clearing account to the deposit account.
A “Cash Management Period” will commence upon the lender giving notice to the clearing bank of the occurrence of any of the following: (i) the maturity date, (ii) a default or an event of default, (iii) if, as of the last day of any calendar quarter during the term, the debt service coverage ratio is less than 1.50x or (iv) on September 1, 2024, to the extent a qualified transfer (i.e., the transfer of all outstanding ownership interest in the ExchangeRight Net Leased Portfolio Borrower to an approved transferee (that is not Delaware statutory trust) and the replacement of a guarantor with an acceptable replacement guarantor) has not occurred as of such date; and will end upon the lender giving notice to the clearing bank that the sweeping of funds into the deposit account may cease, which notice the lender will only be required to give if (1) the ExchangeRight Net Leased Portfolio Mortgage Loan and all other obligations under the loan documents have been repaid in full or (2) the maturity date has not occurred and (A) with respect to the matters described in clause (ii) above, such event of default has been cured and no other event of default has occurred and is continuing, (B) with respect to the matter described in clause (iii) above, the lender has determined that the ExchangeRight Net Leased Portfolio Properties have achieved a debt service coverage ratio of at least 1.55x for two consecutive calendar quarters, or (C) with respect to the matter described in clause (iv) above, a qualified transfer has occurred.
Right of First Refusal. Each sole tenant at the Walgreens - Waukesha, WI property, the Walgreens - Blacklick, OH property and Tractor Supply - Conway, SC property has a right of first refusal to purchase the related property in the event of a proposed sale of such property to an unaffiliated third party. Each right of first refusal has been subordinated to the ExchangeRight Net Leased Portfolio Mortgage Loan and does not apply to a transfer in connection with a foreclosure, deed-in-lieu of foreclosure or other enforcement action under the ExchangeRight Net Leased Portfolio Mortgage Loan documents.
Additional Secured Indebtedness (not including trade debts).Not permitted.
Mezzanine Loan and Preferred Equity.Not permitted.
Release of Property. Not permitted.
Terrorism Insurance.The ExchangeRight Net Leased Portfolio Mortgage Loan documents require that an “all risk” insurance policy be maintained by the ExchangeRight Net Leased Portfolio Borrower and such policy must provide coverage for terrorism in an amount equal to the full replacement cost of the ExchangeRight Net Leased Portfolio Properties,provided that such coverage is available. The ExchangeRight Net Leased Portfolio Mortgage Loan documents also require business interruption insurance covering no less than the 12-month period following the occurrence of a casualty event, together with a 90-day extended period of indemnity.
THE INFORMATION IN THIS COLLATERAL TERM SHEET IS NOT COMPLETE AND MAY BE AMENDED PRIOR TO THE TIME OF SALE. THIS TERM SHEET IS NOT AN OFFER TO SELL THESE SECURITIES AND IT IS NOT A SOLICITATION OF AN OFFER TO BUY THESE SECURITIES IN ANY JURISDICTION WHERE THE OFFER OR SALE IS NOT PERMITTED.
49
| Various | Collateral Asset Summary – Loan No. 6 National Office Portfolio | Cut-off Date Balance: Cut-off Date LTV Ratio: UW NCF DSCR: UW NOI Debt Yield: | $34,959,306 64.2% 1.64x 11.1% |
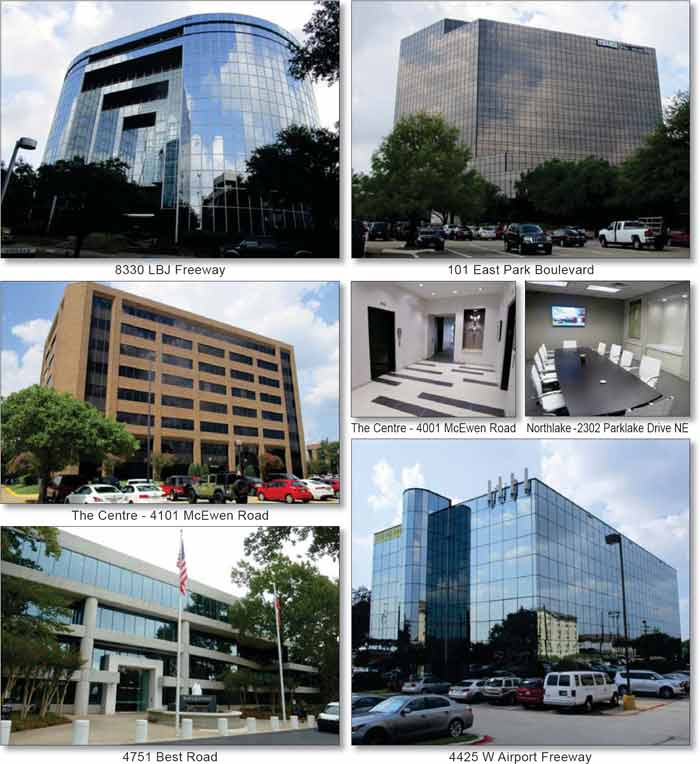
THE INFORMATION IN THIS COLLATERAL TERM SHEET IS NOT COMPLETE AND MAY BE AMENDED PRIOR TO THE TIME OF SALE. THIS TERM SHEET IS NOT AN OFFER TO SELL THESE SECURITIES AND IT IS NOT A SOLICITATION OF AN OFFER TO BUY THESE SECURITIES IN ANY JURISDICTION WHERE THE OFFER OR SALE IS NOT PERMITTED.
50
| Various | Collateral Asset Summary – Loan No. 6 National Office Portfolio | Cut-off Date Balance: Cut-off Date LTV Ratio: UW NCF DSCR: UW NOI Debt Yield: | $34,959,306 64.2% 1.64x 11.1% |
THE INFORMATION IN THIS COLLATERAL TERM SHEET IS NOT COMPLETE AND MAY BE AMENDED PRIOR TO THE TIME OF SALE. THIS TERM SHEET IS NOT AN OFFER TO SELL THESE SECURITIES AND IT IS NOT A SOLICITATION OF AN OFFER TO BUY THESE SECURITIES IN ANY JURISDICTION WHERE THE OFFER OR SALE IS NOT PERMITTED.
51
| Various | Collateral Asset Summary – Loan No. 6 National Office Portfolio | Cut-off Date Balance: Cut-off Date LTV Ratio: UW NCF DSCR: UW NOI Debt Yield: | $34,959,306 64.2% 1.64x 11.1% |
| Mortgage Loan Information | Property Information | ||||||
| Mortgage Loan Seller: | Ladder Capital Finance, LLC | Single Asset/Portfolio: | Portfolio | ||||
| Credit Assessment (Fitch/KBRA/Moody’s/S&P): | [ ] | Location: | Various | ||||
| General Property Type: | Office | ||||||
| Original Balance(1): | $35,000,000 | Detailed Property Type: | Suburban | ||||
| Cut-off Date Balance(1): | $34,959,306 | Title Vesting: | Fee | ||||
| % of Initial Pool Balance: | [ ]% | Year Built/Renovated: | Various | ||||
| Loan Purpose: | Refinance | Size: | 2,572,700 SF | ||||
| Borrower Sponsor: | Andrew J. Segal | Cut-off Date Balance per SF(1): | $72 | ||||
| Mortgage Rate: | 4.6100% | Maturity Date Balance per SF(1): | $58 | ||||
| Note Date: | 10/6/2017 | Property Manager: | Boxer Property Management Corporation (borrower-related) | ||||
| First Payment Date: | 11/6/2017 | ||||||
| Maturity Date: | 10/6/2027 | ||||||
| Original Term to Maturity: | 120 months | ||||||
| Original Amortization Term: | 360 months | ||||||
| IO Period: | 0 months | ||||||
| Seasoning: | 1 month | ||||||
| Prepayment Provisions(2): | LO (25); DEF (91); O (4) | Underwriting and Financial Information | |||||
| Lockbox/Cash Mgmt Status: | Hard/Springing | UW NOI(5): | $20,578,171 | ||||
| Additional Debt Type(1)(3): | Pari Passu | UW NOI Debt Yield(1): | 11.1% | ||||
| Additional Debt Balance(1)(3): | $149,825,595 | UW NOI Debt Yield at Maturity(1): | 13.7% | ||||
| Future Debt Permitted (Type): | Yes (Mezzanine) | UW NCF DSCR(1): | 1.64x | ||||
| Reserves(4) | Most Recent NOI(5): | $16,618,026 (TTM 8/31/2017) | |||||
| Type | Initial | Monthly | Cap | 2nd Most Recent NOI: | $14,293,715 (12/31/2016) | ||
| RE Tax: | $2,076,255 | $337,483 | N/A | 3rd Most Recent NOI: | $16,387,470 (12/31/2015) | ||
| Insurance: | $271,808 | $20,908 | N/A | Most Recent Occupancy: | 77.5% (8/31/2017) | ||
| Replacements: | $150,000 | $53,598 | $1,157,715 | 2nd Most Recent Occupancy: | 72.1% (12/31/2016) | ||
| TI/LC: | $7,176,724 | $0 | $3,859,050 | 3rd Most Recent Occupancy: | 70.7% (12/31/2015) | ||
| Outstanding TI/LC: | $2,575,793 | $0 | N/A | Appraised Value (as of): | $287,750,000 (Various) | ||
| Deferred Maintenance: | $196,044 | $0 | N/A | Cut-off Date LTV Ratio(1): | 64.2% | ||
| Free Rent Reserve: | $1,656,704 | $0 | N/A | Maturity Date LTV Ratio(1): | 52.2% | ||
| Sources and Uses | ||||||
| Sources | Proceeds | % of Total | Uses | Proceeds | % of Total | |
| Loan Amount(1): | $185,000,000 | 99.7% | Loan Payoff: | $169,099,307 | 91.2% | |
| Borrower Equity: | $500,000 | 0.3% | Reserves: | $14,103,328 | 7.6% | |
| Closing Costs: | $2,297,365 | 1.2% | ||||
| Total Sources: | $185,500,000 | 100.0% | Total Uses: | $185,500,000 | 100.0% | |
| (1) | The National Office Portfolio Mortgage Loan (as defined below) is part of the National Office Portfolio Whole Loan (as defined below), which is comprised of sixpari passupromissory notes with an aggregate principal balance of $185,000,000. The Cut-off Date Balance per SF, Maturity Date Balance per SF, UW NOI Debt Yield, UW NOI Debt Yield at Maturity, UW NCF DSCR, Cut-off Date LTV Ratio and Maturity Date LTV Ratio presented above are based on the aggregate principal balance of the promissory notes comprising the National Office Portfolio Whole Loan. |
| (2) | Prior to the open prepayment date of July 6, 2027, the National Office Portfolio Whole Loan can be prepaid with (i) defeasance after the earlier to occur of (a) October 6, 2021 and (b) the first monthly payment date following the end of the two-year period commencing on the closing date of the securitization of the last National Office Portfolio Whole Loan promissory note to be securitized. Partial release is not permitted. |
| (3) | See “The Mortgage Loan” and “Mezzanine Loan and Preferred Equity” below for further discussion of additional debt. |
| (4) | See “Escrows and Reserves” below for further discussion of reserve requirements and caps. |
| (5) | The increase in Net Operating Income from TTM 8/31/2017 to UW is primarily due to an increase in portfolio-wide occupancy from 72.1% as of 12/31/2016 to 77.5% as of 8/31/2017. |
The Mortgage Loan. The sixth largest mortgage loan (the “National Office Portfolio Mortgage Loan”) is part of a whole loan (the “National Office Portfolio Whole Loan”) evidenced by sixpari passu promissory notes with an aggregate original principal balance of $185,000,000. The National Office Portfolio Whole Loan is secured by a first priority fee mortgage encumbering an 18-property portfolio of office properties totaling 2,572,700 SF located throughout the Dallas, Texas metropolitan statistical area (“MSA”) (1,605,894 SF; 62.4% of NRA), the Atlanta, Georgia MSA (490,913 SF; 19.1% of NRA), the Phoenix, Arizona MSA (263,681 SF; 10.2% of NRA), and the Chicago, Illinois MSA (212,212 SF; 8.2% of NRA) (collectively, the “National Office Portfolio Properties” or “National Office Portfolio”). The National Office Portfolio Whole Loan was originated by Ladder Capital Finance LLC, by and through its branch office at 345 Park Avenue, New York, New York (“LCF”). Promissory Note A-5-A, with an original principal balance of $35,000,000, represents the National Office Portfolio Mortgage Loan and will be included in the UBS 2017-C5 Trust. Promissory Notes A-1-A, A-1-B, A-2, A-3 and A-4-A, with an aggregate original principal balance of $150,000,000, are currently held by LCF or an affiliate, and are expected to be contributed to one or more future securitization transactions or may be otherwise transferred at any time. The National Office Portfolio Whole Loan will be serviced pursuant to the pooling and servicing agreement for the UBS 2017-C5 Trust until the controllingpari passu Promissory Note A-1-A is securitized, whereupon the National Office Portfolio Whole Loan will be serviced pursuant to the pooling and servicing agreement for such future securitization. See “Description of the Mortgage Pool—The Whole Loans—The Serviced Pari Passu Whole Loans” and “Pooling and Servicing Agreement” in the Preliminary Prospectus.
THE INFORMATION IN THIS COLLATERAL TERM SHEET IS NOT COMPLETE AND MAY BE AMENDED PRIOR TO THE TIME OF SALE. THIS TERM SHEET IS NOT AN OFFER TO SELL THESE SECURITIES AND IT IS NOT A SOLICITATION OF AN OFFER TO BUY THESE SECURITIES IN ANY JURISDICTION WHERE THE OFFER OR SALE IS NOT PERMITTED.
52
| Various | Collateral Asset Summary – Loan No. 6 National Office Portfolio | Cut-off Date Balance: Cut-off Date LTV Ratio: UW NCF DSCR: UW NOI Debt Yield: | $34,959,306 64.2% 1.64x 11.1% |
| National Office Portfolio Whole Loan Summary | ||||
| Note | Original Balance | Cut-off Date Balance | Anticipated Note Holder | Controlling Piece |
| Note A-1-A | $35,000,000 | $34,959,306 | LCF | Yes |
| Note A-1-B | $20,000,000 | $19,976,746 | LCF | No |
| Note A-2 | $30,000,000 | $29,965,119 | LCF | No |
| Note A-3 | $30,000,000 | $29,965,119 | LCF | No |
| Note A-4-A | $35,000,000 | $34,959,306 | LCF | No |
| Note A-5-A | $35,000,000 | $34,959,306 | UBS 2017-C5 | No |
| Total | $185,000,000 | $184,784,901 | ||
The Borrower and the Borrower Sponsor. The borrower is JBA Portfolio, LLC (the “National Office Portfolio Borrower”), a single-purpose Delaware limited liability company structured to be bankruptcy remote. Andrew J. Segal is the borrower sponsor and nonrecourse carve-out guarantor.
Andrew J. Segal is the Chairman & CEO of Boxer Property, which specializes in acquiring underperforming assets and engaging in an aggressive leasing program to attract smaller commercial tenants. The Boxer Property portfolio currently includes 90 properties totaling 12,005,023 SF office space, 1265 hotel keys, and 1,090,395 SF of retail. The properties are located in Texas, Illinois, Georgia, Arizona, Colorado, Massachusetts, California, Ohio, New Jersey, and Minnesota.
The Properties. The National Office Portfolio Properties are comprised of 18 office properties totaling 2,572,700 SF located throughout the Dallas, Texas MSA (1,605,894 SF; 62.4% of NRA; 64.0% UW NOI), the Atlanta, Georgia MSA (490,913 SF; 19.1% of NRA; 17.8% UW NOI), the Phoenix, Arizona MSA (263,681 SF; 10.2% of NRA; 4.7% UW NOI), and the Chicago, Illinois MSA (212,212 SF; 8.2% of NRA; 13.5% UW NOI). The National Office Portfolio Properties were constructed between 1973 and 1987 and range in size from 46,769 SF to 381,383 SF. The National Office Portfolio Properties are 77.5% occupied as of August 31, 2017 and are leased to more than 1,000 tenants.
The following table present certain information relating to the National Office Portfolio Properties:
| Portfolio Summary | |||||||||
| Property Name | Location | Year Built/ Renovated | Net Rentable Area (SF)(1) | UW NCF | % of UW NCF | Allocated Cut-off Date | % of Whole Loan | Appraised Value | Allocated Cut-off Date LTV Ratio(2) |
| 8330 LBJ Freeway | Dallas, TX | 1984/2010 | 381,383 | $3,200,440 | 17.2% | $34,212,175 | 18.5% | $42,750,000 | 80.0% |
| 101 East Park Boulevard | Plano, TX | 1983/2012 | 225,445 | $2,678,991 | 14.4% | $26,788,816 | 14.5% | $36,100,000 | 74.2% |
| 13601 Preston Road | Dallas, TX | 1973/2009 | 261,975 | $2,018,081 | 10.8% | $21,520,948 | 11.6% | $27,500,000 | 78.3% |
| 1750 East Golf Road | Schaumburg, IL | 1985/2013 | 212,212 | $2,623,222 | 14.1% | $17,479,653 | 9.5% | $35,400,000 | 49.4% |
| 14800 Quorum Drive | Addison, TX | 1981/2011 | 103,877 | $828,328 | 4.4% | $9,708,699 | 5.3% | $13,550,000 | 71.7% |
| 1995 North Park Place | Atlanta, GA | 1985/2013 | 99,920 | $824,186 | 4.4% | $8,629,954 | 4.7% | $12,200,000 | 70.7% |
| Northlake - 2295 Parklake Dr NE | Atlanta, GA | 1973/2014 | 121,528 | $935,783 | 5.0% | $8,522,080 | 4.6% | $10,600,000 | 80.4% |
| 4751 Best Road | Atlanta, GA | 1987/2013 | 93,084 | $809,188 | 4.3% | $8,090,582 | 4.4% | $11,900,000 | 68.0% |
| The Centre - 4099 McEwen Road | Farmers Branch, TX | 1979/2013 | 123,711 | $727,275 | 3.9% | $7,029,817 | 3.8% | $11,800,000 | 59.6% |
| The Centre - 4101 McEwen Road | Farmers Branch, TX | 1979/2013 | 124,326 | $551,675 | 3.0% | $7,029,817 | 3.8% | $12,100,000 | 58.1% |
| 11225 North 28th Drive | Phoenix, AZ | 1982/2011 | 135,501 | $391,454 | 2.1% | $6,580,340 | 3.6% | $9,070,000 | 72.6% |
| 10000 North 31st Ave | Phoenix, AZ | 1982/2012 | 128,180 | $375,262 | 2.0% | $5,909,121 | 3.2% | $9,900,000 | 59.7% |
| The Centre - 4001 McEwen Road | Farmers Branch, TX | 1980/2013 | 95,192 | $591,253 | 3.2% | $5,493,605 | 3.0% | $10,000,000 | 54.9% |
| 4425 W Airport Fwy | Irving, TX | 1981/2015 | 85,212 | $558,699 | 3.0% | $4,638,600 | 2.5% | $8,400,000 | 55.2% |
| Northlake - 2302 Parklake Dr NE | Atlanta, GA | 1979/2014 | 111,223 | $147,597 | 0.8% | $4,095,233 | 2.2% | $11,800,000 | 34.7% |
| Northlake - 2305&2309 Parklake Dr NE | Atlanta, GA | 1973/2014 | 65,158 | $578,297 | 3.1% | $3,362,086 | 1.8% | $5,880,000 | 57.2% |
| 12100 Ford Road | Farmers Branch, TX | 1979/2012 | 158,004 | $391,528 | 2.1% | $3,096,396 | 1.7% | $12,500,000 | 24.8% |
| The Centre - 4000N&S McEwen Road | Farmers Branch, TX | 1979/2013 | 46,769 | $417,387 | 2.2% | $2,596,977 | 1.4% | $6,300,000 | 41.2% |
| Total/Wtd. Avg. | 2,572,700 | $18,648,646 | 100.0% | $184,784,901 | 100.0% | $287,750,000 | 64.2% | ||
| (1) | Information is based on the underwritten rent roll. |
| (2) | Based on the National Office Portfolio Whole Loan principal amount outstanding as of the Cut-off Date. |
THE INFORMATION IN THIS COLLATERAL TERM SHEET IS NOT COMPLETE AND MAY BE AMENDED PRIOR TO THE TIME OF SALE. THIS TERM SHEET IS NOT AN OFFER TO SELL THESE SECURITIES AND IT IS NOT A SOLICITATION OF AN OFFER TO BUY THESE SECURITIES IN ANY JURISDICTION WHERE THE OFFER OR SALE IS NOT PERMITTED.
53
| Various | Collateral Asset Summary – Loan No. 6 National Office Portfolio | Cut-off Date Balance: Cut-off Date LTV Ratio: UW NCF DSCR: UW NOI Debt Yield: | $34,959,306 64.2% 1.64x 11.1% |
The four largest properties (by NRA) in the National Office Portfolio (collectively making up approximately 56.4% of the National Office Portfolio’s UW NCF) are summarized below:
The 8330 LBJ Freeway property consists of 381,383 SF of Class B office space in two eight- and 12-story office buildings and, as of August 31, 2017, was 85.3% occupied. Built in 1984, the buildings within the property include two common conference rooms, an 85-seat stadium style auditorium, a fitness center and on-site café. The 8330 LBJ Freeway property is located 0.1 miles north of I-635 and 0.2 miles west of I-75. The largest tenant at the 8330 LBJ Freeway property is Trinity Universal Insurance Co, which occupies 84,114 SF (22.1% of the NRA of the 8330 LBJ Freeway property) and comprises 22.0% of the 8330 LBJ Freeway property’s underwritten base rent (3.1% of the National Office Portfolio’s underwritten base rent).
The 13601 Preston Road property consists of a 261,975 SF Class C, midrise office building, and as of August 31, 2017, was 82.0% occupied. Built in 1973, the building is located on the north side of Alpha Road, approximately 550 feet west of Preston Road. The 13601 Preston Road property is located in North Dallas, which is located immediately north of LBJ Freeway between Preston Road and Montfort Drive. The 13601 Preston Road property is located adjacent to the north of the current Dallas Midtown, an over $4 billion redevelopment of the former Valley View mall and less than one-mile east of the North Dallas Tollway and Galleria Mall. The largest tenant at the 13601 Preston Road property is AT&T, which occupies 13,358 SF (5.1% of the NRA of the 13601 Preston Road property) and comprises 5.9% of the13601 Preston Road property’s underwritten base rent (0.5% of the National Office Portfolio’s underwritten base rent).
The 101 East Park Boulevard property consists of a 225,445 SF Class C, 13-story office building and, as of August 31, 2017, was 76.9% occupied. Built in 1983, the building is located at the southwest corner of Park Boulevard and Republic Drive in Plano, Collin County, Texas. The largest tenant at the 101 East Park Boulevard property is M. White & Associates, LLC, which occupies 24,896 SF (11% of the NRA of the 101 East Park Boulevard property) and represents 11.2% of the 13601 Preston Road property’s underwritten base rent (1.1% of the National Office Portfolio’s underwritten base rent).
The 1750 East Golf Road property consists of a Class B, 12-story office building encompassing 212,212 rentable SF and 244,050 gross SF. Additionally, there is a two-story parking garage at the rear of the 1750 East Golf Road property that contains 295 parking spaces, with an additional 417 surface parking spaces surrounding the improvements. The 1750 East Golf Road property was constructed in 1985 and the 1750 East Golf Road property’s site consists of approximately 357,192 SF or approximately 8.20 acres of land. The 1750 East Golf Road property is located on the north side of East Golf Road, opposite the Woodfield Mall. The 1750 East Golf Road property benefits from its location near the core of the commercial district of Schaumburg and to the city of Chicago, O’Hare International Airport, and the growing industrial, residential, office and retail sectors of the Schaumburg, Rolling Meadows, Elk Grove Village, Hoffman Estates, and Barrington areas. The largest tenant at the 1750 East Golf Road property is Career Education Corporation, which occupies 116,387 SF (54.8% of the NRA of the 1750 East Golf Road property) and comprises 56.5% of the 1750 East Golf Road property’s underwritten base rent (6.6% of the National Office Portfolio’s underwritten base rent).
The following table presents certain information relating to the major leases at the National Office Portfolio Properties:
| Tenant Summary(1) | ||||||||
| Tenant Name | Property | Credit Rating (Fitch/ Moody’s/ S&P)(2) | Tenant SF | Approximate % of SF | Annual UW Base Rent | % of Total Annual UW Base Rent | Annual UW Base Rent PSF(3) | Lease Expiration |
| Career Education Corporation | 1750 East Golf Road | NR/NR/NR | 116,387 | 4.5% | $3,176,713 | 8.8% | $27.29 | 5/31/2020 |
| Trinity Universal Insurance Co | 8330 LBJ Freeway | A-/A3/A- | 84,114 | 3.3% | $1,387,881 | 3.9% | $16.50 | 6/30/2025 |
| Assurance Agency, Ltd(4) | 1750 East Golf Road | NR/NR/NR | 63,113 | 2.5% | $1,716,198 | 4.8% | $27.19 | 9/30/2023 |
| Nurtur Health Inc(5) | The Centre - 4001 McEwen Road | NR/NR/NR | 47,780 | 1.9% | $788,370 | 2.2% | $16.50 | 12/31/2020 |
| Centene Corporation(5) | The Centre - 4000N&S McEwen Road | NR/NR/NR | 46,769 | 1.8% | $748,304 | 2.1% | $16.00 | 12/31/2020 |
| Subtotal/Wtd. Avg. | 358,163 | 13.9% | $7,817,466 | 21.7% | $21.83 | |||
| Remaining Tenants | 1,635,654 | 63.6% | $28,172,756 | 78.3% | $17.22 | |||
| Vacant Space | 578,883 | 22.5% | $0 | 0.0% | $0.00 | |||
| Total/Wtd. Avg. | 2,572,700 | 100.0% | $35,990,222 | 100.0% | $18.05 | |||
| (1) | Information is based on the underwritten rent roll. |
| (2) | Ratings provided are for the parent company of the entity listed in the “Tenant Name” field whether or not the parent company guarantees the lease. |
| (3) | Wtd. Avg. Annual UW Base Rent PSF excludes vacant space. |
| (4) | Assurance Agency, Ltd has a one-time termination option right effective September 30, 2019 with 12 months’ notice and payment of a termination fee. |
| (5) | Centene Corporation and Nurtur Health Inc are affiliates. |
THE INFORMATION IN THIS COLLATERAL TERM SHEET IS NOT COMPLETE AND MAY BE AMENDED PRIOR TO THE TIME OF SALE. THIS TERM SHEET IS NOT AN OFFER TO SELL THESE SECURITIES AND IT IS NOT A SOLICITATION OF AN OFFER TO BUY THESE SECURITIES IN ANY JURISDICTION WHERE THE OFFER OR SALE IS NOT PERMITTED.
54
| Various | Collateral Asset Summary – Loan No. 6 National Office Portfolio | Cut-off Date Balance: Cut-off Date LTV Ratio: UW NCF DSCR: UW NOI Debt Yield: | $34,959,306 64.2% 1.64x 11.1% |
The following table presents certain information relating to the lease rollover schedule at the National Office Portfolio Properties:
| Lease Rollover Schedule(1)(2) | ||||||||
| Year | # of Leases Rolling | SF Rolling | Approx. % of Total SF Rolling | Approx. Cumulative % of SF Rolling | UW Base Rent PSF Rolling(3) | Total UW Base Rent Rolling | Approx. % of Total Base Rent Rolling | Approx. Cumulative % of Total Base Rent Rolling |
| MTM/Other | 51 | 39,513 | 1.5% | 1.5% | $6.85 | $270,677 | 0.8% | 0.8% |
| 2017 | 109 | 85,872 | 3.3% | 4.9% | $16.82 | $1,444,085 | 4.0% | 4.8% |
| 2018 | 497 | 472,242 | 18.4% | 23.2% | $17.17 | $8,109,026 | 22.5% | 27.3% |
| 2019 | 136 | 237,336 | 9.2% | 32.5% | $16.53 | $3,923,323 | 10.9% | 38.2% |
| 2020 | 129 | 453,555 | 17.6% | 50.1% | $19.60 | $8,888,453 | 24.7% | 62.9% |
| 2021 | 48 | 169,035 | 6.6% | 56.7% | $16.28 | $2,752,426 | 7.6% | 70.5% |
| 2022 | 41 | 125,942 | 4.9% | 61.5% | $18.23 | $2,295,525 | 6.4% | 76.9% |
| 2023 | 16 | 178,109 | 6.9% | 68.5% | $21.88 | $3,897,421 | 10.8% | 87.7% |
| 2024 | 7 | 31,737 | 1.2% | 69.7% | $18.26 | $579,435 | 1.6% | 89.4% |
| 2025 | 7 | 105,069 | 4.1% | 73.8% | $16.72 | $1,756,997 | 4.9% | 94.2% |
| 2026 | 5 | 11,420 | 0.4% | 74.2% | $20.78 | $237,306 | 0.7% | 94.9% |
| 2027 | 3 | 29,575 | 1.1% | 75.4% | $24.76 | $732,317 | 2.0% | 96.9% |
| 2028 & Beyond | 5 | 54,412 | 2.1% | 77.5% | $20.28 | $1,103,231 | 3.1% | 100.0% |
| Vacant | 0 | 578,883 | 22.5% | 100.0% | $0.00 | $0 | 0.0% | 100.0% |
| Total/Wtd. Avg. | 1,054 | 2,572,700 | 100.00% | $18.05 | $35,990,222 | 100.0% | ||
| (1) | Information is based on the underwritten rent roll. |
| (2) | Certain tenants may have lease termination options that are exercisable prior to the originally stated expiration date of the subject lease and that are not considered in the lease rollover schedule. |
| (3) | Wtd. Avg. UW Base Rent PSF Rolling excludes vacant space. |
The Market. The National Office Portfolio Properties are located across the Dallas, Texas MSA (ten properties), the Atlanta, Georgia MSA (five properties), the Phoenix, Arizona MSA (two properties), and suburban Chicago, Illinois (one property).
Dallas:
There are 10 National Office Portfolio Properties located in the Dallas, Texas MSA totaling 1,605,894 SF (62.4% of total portfolio SF), which generate $11,963,658 in UW NCF (64.2% of total UW Base Rent). According to the appraisal, the Dallas/Fort Worth office market has an inventory of 359.2 million SF of office space with 705,773 SF of positive absorption. As of second quarter 2017, the Dallas-Fort Worth MSA office market is 85.7% occupied with an average asking rent of $24.64 PSF. The properties are located in several submarkets: LBJ Freeway, Richardson/Plano, Las Colinas, and Mid Cities, which are discussed below.
According to the appraisal, the LBJ Freeway office submarket contains a total inventory of approximately 22.6 million SF of office space across 265 buildings. As of the second quarter 2017, the LBJ Freeway office submarket had a direct vacancy rate of 22.1% and a weighted average rental rate of $21.83 PSF. The Richardson/Plano office submarket contains a total inventory of 40.8 million SF of office space across 1,371 buildings. As of the second quarter of 2017, the Richardson Plano office submarket had a direct vacancy rate of 15.3% and a direct weighted average rental rate of $24.20 PSF. The Las Colinas submarket contains a total inventory of 39.8 million SF of office space across 433 buildings. As of the second quarter of 2017, the Las Colinas office submarket had a direct vacancy rate of 14.5% and a direct weighted average rental rate of $25.03 PSF. The Mid-Cities office submarket contains a total inventory of approximately 40.3 million SF of office space across 2,578 buildings. As of the second quarter 2017, the Mid-Cities office submarket had a direct vacancy rate of 13.3% and a weighted average rental rate of $21.73 PSF.
THE INFORMATION IN THIS COLLATERAL TERM SHEET IS NOT COMPLETE AND MAY BE AMENDED PRIOR TO THE TIME OF SALE. THIS TERM SHEET IS NOT AN OFFER TO SELL THESE SECURITIES AND IT IS NOT A SOLICITATION OF AN OFFER TO BUY THESE SECURITIES IN ANY JURISDICTION WHERE THE OFFER OR SALE IS NOT PERMITTED.
55
| Various | Collateral Asset Summary – Loan No. 6 National Office Portfolio | Cut-off Date Balance: Cut-off Date LTV Ratio: UW NCF DSCR: UW NOI Debt Yield: | $34,959,306 64.2% 1.64x 11.1% |
The following table presents certain market information relating to the National Office Portfolio Properties located in Dallas:
| Dallas Office Market and Submarket Overview(1) | ||||||
| Submarket | Inventory (SF) | Number of Buildings | Direct Vacancy Rate | Under Construction SF | Direct Net Absorption 2Q2017 | Direct Wtd. Avg. Rental Rate (PSF) |
| Central Expressway | 15,138,655 | 273 | 10.1% | 0 | (21,167) | $26.76 |
| Dallas CBD | 33,673,630 | 142 | 22.2% | 261,400 | 46,078 | $25.30 |
| East Dallas | 13,811,706 | 1,138 | 7.5% | 307,320 | 327,684 | $23.97 |
| Far North Dallas | 58,461,548 | 1,078 | 13.0% | 6,096,673 | 1,077,183 | $27.55 |
| Ft Worth CB0 | 11,799,154 | 115 | 9.9% | 280,489 | 80,968 | $25.90 |
| Las Colinas | 39,798,523 | 433 | 14.5% | 845,749 | 783,960 | $25.03 |
| LBJ Freeway | 22,597,412 | 265 | 22.1% | 0 | (34,659) | $21.83 |
| Lewisville/Denton | 13,056,352 | 914 | 8.4% | 157,154 | (87,630) | $22.38 |
| Mid-Cities | 40,307,595 | 2,578 | 13.3% | 752,298 | (139,772) | $21.73 |
| North Fort Worth | 6,591,010 | 570 | 6.0% | 67,003 | 45,818 | $21.33 |
| Northeast Ft Worth | 5,403,275 | 338 | 35.9% | 0 | 7,546 | $19.19 |
| Preston Center | 5,889,257 | 147 | 8.6% | 179,617 | (15,430) | $36.52 |
| Richardson/Plano | 40,752,851 | 1,371 | 15.3% | 866,960 | (8,030) | $24.20 |
| South Ft Worth | 19,857,571 | 1,638 | 8.2% | 170,594 | 17,573 | $23.29 |
| Southwest Dallas | 7,263,160 | 798 | 7.4% | 65,300 | 76,085 | $18.47 |
| Stemmons Freeway | 15,173,102 | 284 | 22.1% | 0 | 108,906 | $16.75 |
| Uptown/Turtle Creek | 14,705,908 | 297 | 10.7% | 1,315,778 | 136,852 | $37.17 |
| Total/Wtd. Avg. | 364,280,709 | 12,379 | 14.3% | 11,366,335 | 2,401,965 | $24.72 |
| (1) | Information is based on the appraisals. |
Atlanta:
There are five National Office Portfolio Properties located in the Atlanta, Georgia MSA totaling 490,913 SF (19.1% of total portfolio SF) which generate $3,295,050 in UW NCF (20.6% of total UW Rent). As of the second quarter 2017, the Atlanta office submarket is 88.1% occupied with an average asking rent of $22.71 PSF. Total office inventory in the Atlanta market area amounted to 307,054,764 SF in 16,077 buildings for the same period. Quoted rents in the market are on average $22.71 PSF, and have seen a steady increase since a 10-year low of $18.78 PSF in 2012. In the Atlanta market, there is currently 5,273,668 SF of office space under construction. The properties are located in several submarkets: Northlake, South Atlanta, and Northwest Atlanta, which are discussed below.
According to the appraisal, the Northlake office submarket contains a total inventory of approximately 29.8 million SF across 2,308 buildings. As of the second quarter 2017, the Northlake office submarket had a direct vacancy rate of 10.0% and a weighted average rental rate of $18.67 PSF. The South Atlanta office submarket contains a total inventory of 24.7 million SF of office space across 2,560 buildings. As of the second quarter 2017, the South Atlanta office submarket had a direct vacancy rate of 10.3% and a direct weighted average rental rate of $16.70 PSF. The Northwest Atlanta office submarket contains a total inventory of 50.2 million SF of office space across 3,185 buildings. As of the second quarter 2017, the Northwest Atlanta office submarket had a direct vacancy rate of 12.0% and a weighted average rental rate of $21.65 PSF.
THE INFORMATION IN THIS COLLATERAL TERM SHEET IS NOT COMPLETE AND MAY BE AMENDED PRIOR TO THE TIME OF SALE. THIS TERM SHEET IS NOT AN OFFER TO SELL THESE SECURITIES AND IT IS NOT A SOLICITATION OF AN OFFER TO BUY THESE SECURITIES IN ANY JURISDICTION WHERE THE OFFER OR SALE IS NOT PERMITTED.
56
| Various | Collateral Asset Summary – Loan No. 6 National Office Portfolio | Cut-off Date Balance: Cut-off Date LTV Ratio: UW NCF DSCR: UW NOI Debt Yield: | $34,959,306 64.2% 1.64x 11.1% |
The following table presents certain market information relating to the National Office Portfolio Properties located in Atlanta:
| Atlanta Office Market and Submarket Overview(1) | ||||||
| Submarket | Inventory (SF) | Number of Buildings | Direct Vacancy Rate | Under Construction SF | Direct Net Absorption 2Q2017 | Direct Wtd. Avg. Rental Rate (PSF) |
| Buckhead | 23,584,561 | 419 | 13.10% | 147,617 | 120,211 | $32.73 |
| Central Perimeter | 33,859,359 | 679 | 12.80% | 1,281,966 | 22,899 | $26.81 |
| Downtown Atlanta | 36,473,635 | 393 | 12.50% | 131,300 | 86,887 | $23.92 |
| Midtown Atlanta | 25,263,495 | 433 | 9.30% | 1,822,149 | 219,663 | $28.86 |
| North Fulton | 36,894,628 | 1871 | 11.70% | 587,734 | (55,162) | $21.94 |
| Northeast Atlanta | 40,168,223 | 3,385 | 15.20% | 139,497 | 75,626 | $17.04 |
| Northlake | 29,818,728 | 2,308 | 10.00% | 319,066 | (244,795) | $18.67 |
| Northwest Atlanta | 50,157,394 | 3185 | 12.00% | 762,139 | 157,831 | $21.65 |
| South Atlanta | 24,714,942 | 2,560 | 10.30% | 60,000 | 224,395 | $16.70 |
| West Atlanta | 6,119,799 | 844 | 12.90% | 22,200 | (16,231) | $19.21 |
| Total | 307,054,764 | 16,077 | 12.10% | 5,273,668 | 591,324 | $22.63 |
| (1) | Information is based on the appraisals. |
Operating History and Underwritten Net Cash Flow. The following table presents certain information relating to the historical operating performance and the Underwritten Net Cash Flow at the National Office Portfolio Properties:
| Cash Flow Analysis | ||||||
| 2014 | 2015 | 2016 | 8/31/2017 TTM(1) | UW(1)(2)(3) | UW PSF | |
| Gross Potential Rent | $42,129,832 | $44,419,786 | $42,402,377 | $43,350,092 | $45,744,828 | $17.78 |
| Total Recoveries | $1,053,998 | $1,438,663 | $1,599,768 | $1,768,146 | $2,773,638 | $1.08 |
| Other Income | $675,665 | $835,275 | $680,692 | $707,505 | $707,505 | $0.28 |
| Less Vacancy & Credit Loss | ($12,422,571) | ($12,813,958) | ($12,620,315) | ($11,220,908) | ($10,595,946) | ($4.12) |
| Effective Gross Income | $31,436,924 | $33,879,766 | $32,062,523 | $34,604,835 | $38,630,025 | $15.02 |
| Total Operating Expenses | $16,957,854 | $17,492,296 | $17,768,808 | $17,986,810 | $18,051,854 | $7.02 |
| Net Operating Income | $14,479,070 | $16,387,470 | $14,293,715 | $16,618,026 | $20,578,171 | $8.00 |
| Tenant Improvements | $0 | $0 | $0 | $0 | $643,175 | $0.25 |
| Leasing Commissions | $0 | $0 | $0 | $0 | $643,175 | $0.25 |
| Replacement Reserves | $0 | $0 | $0 | $0 | $643,175 | $0.25 |
| Net Cash Flow | $14,479,070 | $16,387,470 | $14,293,715 | $16,618,026 | $18,648,646 | $7.25 |
| Occupancy % | 66.3% | 70.7% | 72.1% | 75.3% | 78.2% | |
| NOI DSCR(4) | 1.27x | 1.44x | 1.25x | 1.46x | 1.81x | |
| NCF DSCR(4) | 1.27x | 1.44x | 1.25x | 1.46x | 1.64x | |
| NOI Debt Yield(4) | 7.8% | 8.9% | 7.7% | 9.0% | 11.1% | |
| NCF Debt Yield(4) | 7.8% | 8.9% | 7.7% | 9.0% | 10.1% | |
| (1) | The increase in Net Operating Income from TTM 8/31/2017 to UW is primarily due to an increase in portfolio-wide occupancy from 72.1% as of 12/31/2016 to 77.5% as of 8/31/2017. |
| (2) | UW Gross Potential Rent is based on the underwritten rent roll as of August 31, 2017. |
| (3) | UW Total Recoveries represent utility reimbursement due from tenants under their leases. The increase in UW Total Recoveries when compared to the TTM is due to the gross up of vacant spaces on the rent roll. On a net basis, LCF has underwritten reimbursements of approximately $2.25 million, consistent with the TTM Utility Reimbursements of $2.0 million. |
| (4) | Debt service coverage ratios and debt yields are based on the National Office Portfolio Whole Loan. |
Escrows and Reserves. The National Office Portfolio Whole Loan documents provide for escrows in the amount of $2,076,255 for upfront tax reserves and $337,483 to be collected on a monthly basis. The National Office Portfolio Whole Loan documents also provide for upfront insurance premium reserves of $271,808 and $20,908 to be collected on a monthly basis. At origination, a replacement reserve was established in the amount of $150,000. Throughout the loan term $53,598 per month ($0.02 PSF) will be collected on an ongoing basis. Such reserve is capped at $1,157,715 ($0.45 PSF), however, collections will resume if the reserve is drawn down upon. In addition, every four years the National Office Portfolio Borrower will be required to provide a summary of the capital expenditures for the prior four-year period, and if such expenditures exceeded $0.45PSF, the National Office Portfolio Borrower will be required to make additional deposits into the replacement reserve during the following 24 months equal to 1/24th of such excess. At origination, $196,044 was collected to complete all deferred maintenance items identified by the engineer. The National Office Portfolio Borrower has covenanted to complete all repairs within 180 days of origination with the exception of the fire/life safety/ADA items which are to be completed within 60 days of origination.
At origination, $7,176,724 ($2.79 PSF) was collected upfront for future TI / LCs in connection with new leases at the National Office Portfolio Properties. If such reserve falls below $3,859,050 ($1.50 PSF), the National Office Portfolio Borrower is required to replenish such reserve at a rate of $0.50 PSF per year ($1,286,350) to the cap of $3,859,050 ($1.50 PSF). The National Office Portfolio Borrower is permitted to use TI/LC reserve funds to renovate vacant space without having a tenant for a cost up to $10 PSF for a cumulative square footage not to exceed the aggregate cap of 150,000 SF during the loan term. At origination, $2,575,793 was collected in connection with outstanding obligations owed by the National Office Portfolio Borrower to tenants and
THE INFORMATION IN THIS COLLATERAL TERM SHEET IS NOT COMPLETE AND MAY BE AMENDED PRIOR TO THE TIME OF SALE. THIS TERM SHEET IS NOT AN OFFER TO SELL THESE SECURITIES AND IT IS NOT A SOLICITATION OF AN OFFER TO BUY THESE SECURITIES IN ANY JURISDICTION WHERE THE OFFER OR SALE IS NOT PERMITTED.
57
| Various | Collateral Asset Summary – Loan No. 6 National Office Portfolio | Cut-off Date Balance: Cut-off Date LTV Ratio: UW NCF DSCR: UW NOI Debt Yield: | $34,959,306 64.2% 1.64x 11.1% |
$1,656,704 was collected in connection with free rent owed tenants. Funds will be disbursed based on the schedule within the related National Office Portfolio Properties Loan agreement.
Lockbox and Cash Management. A hard lockbox is in place with respect to the National Office Portfolio Whole Loan. The National Office Portfolio Whole Loan has springing cash management during the continuance of a Cash Flow Sweep Event (as defined below). On a daily basis, funds on deposit in the lockbox account will be transferred to the National Office Portfolio Borrower’s operating account, provided, that during the continuance of a Cash Flow Sweep Event, funds deposited into the lockbox account are required to be swept on a daily basis into a cash management account controlled by the lender and applied and disbursed in accordance with the National Office Portfolio Whole Loan documents, with any excess cash held by the lender as additional collateral for the National Office Portfolio Whole Loan. Upon the termination of any Cash Flow Sweep Event, excess cash will no longer be held by the lender and, provided that no other Cash Flow Sweep Event is then in effect, all amounts then on deposit in the lockbox account will be disbursed to the National Office Portfolio Borrower.
A “Cash Flow Sweep Event” will occur if (i) an event of default occurs under the loan documents, (ii) an event of default occurs under the management agreement, and (iii) the debt service coverage ratio falls below 1.15x, based on trailing three-month income (a “DSCR Sweep Event”). A Cash Flow Sweep Event will continue until, in regard to clause (i) above, the cure of such event of default, or (ii) in regard to clause (ii) above, a replacement manager acceptable to the lender is put in place, or in regard to clause (iii) above, the debt service coverage ratio is in excess of 1.25x for two consecutive quarters.
In the event a DSCR Sweep Event occurs, in lieu of establishing the clearing management account, the National Office Portfolio Borrower may elect to post cash collateral in the sum of $209,000 per month during the DSCR Sweep Event with the lender (such deposit, the “Sweep Event Deposit”), to be held as additional collateral for the National Office Portfolio Whole Loan and applied in accordance with the loan documents;provided that if the National Office Portfolio Borrower makes such election, upon the National Office Portfolio Borrower’s failure to make any monthly Sweep Event Deposit, the National Office Portfolio Borrower will be required to establish the cash management account and the National Office Portfolio will be subject to in-place cash management. Provided that another Cash Flow Sweep Event is not then occurring, upon the date that the DSCR Sweep Event is cured (by the debt service coverage ratio being in excess of 1.25x for two consecutive quarters) the Sweep Event Deposit will be returned in full to the National Office Portfolio Borrower, andprovided that no other Cash Flow Sweep Event then exists, any amounts in the cash management account will be returned to the National Office Portfolio Borrower.
Beal Bank Pledge. The National Office Portfolio Properties were collateral under a large corporate facility that Boxer F2, L.P. has with Beal Bank USA, a Nevada Thrift (“Beal Bank”), in the amount of $464,000,000 (the “Beal Bank Facility”). In connection with funding of the National Office Portfolio Whole Loan, each National Office Portfolio Property was released from the Beal Bank Facility and dropped into a newly-formed SPE subsidiary of the Beal Bank Facility borrower. The Beal Bank Facility will continue to provide that the parent of the National Office Portfolio Borrower (i.e. the Beal Bank borrower) will be required to submit any and all distributions received from the National Office Portfolio Whole Loan borrower to Beal Bank, including periodic distributions and net proceeds of any sale or refinancing. These remaining obligations of the parent company are secured by a pledge to Beal Bank of ownership interests in the National Office Portfolio Whole Loan borrower (the “Beal Pledge”). The Beal Pledge does not secure any principal amount or regular payments and may only be foreclosed upon in the event of the failure of the parent to make the required payments of distributions to Beal Bank (the parent is only obligated to make distributions to Beal Bank if it receives distributions from the property owner) or upon the occurrence of an event of default under the National Office Portfolio Whole Loan. The Beal Pledge is subject to an intercreditor agreement with the National Office Portfolio Whole Loan lender which will permit Beal Bank to foreclose upon the equity in the National Office Portfolio Whole Loan borrower as long as the foreclosing party is Beal Bank or another qualified transferee (provided that Beal Bank or such other qualified transferee has assets (in name or under management or advisement in excess) of $1 billion and capital surplus/equity or market capitalization of at least $400 million). Beal Bank also has additional cure rights beyond the National Office Portfolio Borrower cure periods and consistent with customary intercreditor provisions. Beal Bank has an option to purchase the National Office Portfolio Properties in the event that (i) the National Office Portfolio Whole Loan has been accelerated or (ii) the lender under the National Office Portfolio Whole Loan has received written notice from the National Office Portfolio Borrower that it will no longer perform under the loan. Beal Bank is pre-approved as an assuming National Office Portfolio Borrower pursuant to the National Office Portfolio Whole Loan documents as long as it is a qualified transferee at the time of the assumption (and meets the required net worth and capital surplus/equity or market capitalization test); Beal Bank is otherwise required to satisfy all of the assumption requirements in the National Office Portfolio Whole Loan documents in connection with an exercise of its purchase option for the National Office Portfolio Properties.
Mezzanine Loan and Preferred Equity.In connection with a sale of the properties and assumption of the loan by the purchaser, the loan documents permit mezzanine financing from an institutional lender subject to: (i) no event of default under the related loan documents has occurred and is continuing, (ii) a maximum combined loan-to-value ratio up to 70%, (iii) a minimum combined net operating income debt yield of 11.12%, (iv) the lender’s review and approval of (a) the terms and conditions of the mezzanine loan and the mezzanine loan documents and (b) the structure of the mezzanine borrower, (v) the receipt of a rating agency confirmation from each of the applicable rating agencies that the mezzanine financing will not result in a downgrade, withdrawal or qualification of the respective ratings assigned to the Series 2017-C5 certificates or any other securities evidencing an interest in a National Office Portfolio companion loan, and (vi) the execution of an intercreditor agreement acceptable to the lender.
Release of Property. Not permitted.
Release of Parcel.Not permitted.
Terrorism Insurance. The National Office Portfolio Borrower is required to obtain insurance against acts of terrorism for loss resulting from perils and acts of terrorism in amounts and with terms and conditions applicable to commercial property, general liability, business income and umbrella liability insurance required pursuant to the National Office Portfolio Whole Loan documents.
THE INFORMATION IN THIS COLLATERAL TERM SHEET IS NOT COMPLETE AND MAY BE AMENDED PRIOR TO THE TIME OF SALE. THIS TERM SHEET IS NOT AN OFFER TO SELL THESE SECURITIES AND IT IS NOT A SOLICITATION OF AN OFFER TO BUY THESE SECURITIES IN ANY JURISDICTION WHERE THE OFFER OR SALE IS NOT PERMITTED.
58
| New York, NY | Collateral Asset Summary – Loan No. 7 Delshah NYC Portfolio | Cut-off Date Balance: Cut-off Date LTV Ratio: U/W NCF DSCR: U/W NOI Debt Yield: | $28,000,000 51.9% 1.70x 7.3% |
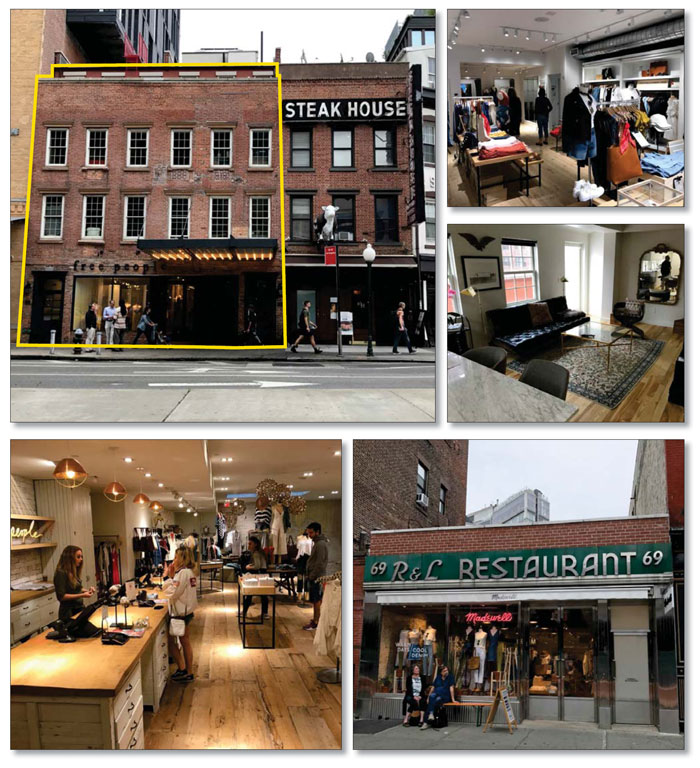
THE INFORMATION IN THIS COLLATERAL TERM SHEET IS NOT COMPLETE AND MAY BE AMENDED PRIOR TO THE TIME OF SALE. THIS TERM SHEET IS NOT AN OFFER TO SELL THESE SECURITIES AND IT IS NOT A SOLICITATION OF AN OFFER TO BUY THESE SECURITIES IN ANY JURISDICTION WHERE THE OFFER OR SALE IS NOT PERMITTED.
59
| New York, NY | Collateral Asset Summary – Loan No. 7 Delshah NYC Portfolio | Cut-off Date Balance: Cut-off Date LTV Ratio: U/W NCF DSCR: U/W NOI Debt Yield: | $28,000,000 51.9% 1.70x 7.3% |
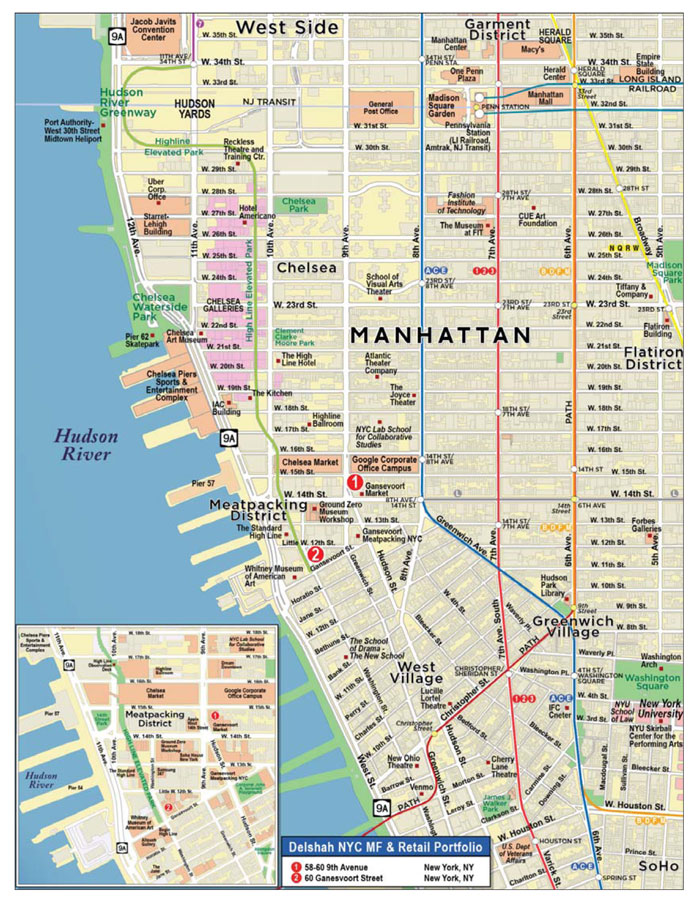
THE INFORMATION IN THIS COLLATERAL TERM SHEET IS NOT COMPLETE AND MAY BE AMENDED PRIOR TO THE TIME OF SALE. THIS TERM SHEET IS NOT AN OFFER TO SELL THESE SECURITIES AND IT IS NOT A SOLICITATION OF AN OFFER TO BUY THESE SECURITIES IN ANY JURISDICTION WHERE THE OFFER OR SALE IS NOT PERMITTED.
60
| New York, NY | Collateral Asset Summary – Loan No. 7 Delshah NYC Portfolio | Cut-off Date Balance: Cut-off Date LTV Ratio: U/W NCF DSCR: U/W NOI Debt Yield: | $28,000,000 51.9% 1.70x 7.3% |
| Mortgage Loan Information | Property Information | ||||||
| Mortgage Loan Seller: | CCRE | Single Asset/Portfolio: | Portfolio | ||||
Credit Assessment (Fitch/KBRA/Moody’s/S&P) | [ ] | Location | New York, NY | ||||
| General Property Type: | Various | ||||||
| Original Balance: | $28,000,000 | Detailed Property Type: | Various | ||||
| Cut-off Date Balance: | $28,000,000 | Title Vesting: | Fee | ||||
| % of Initial Pool Balance: | [.]% | Year Built/Renovated: | Various | ||||
| Loan Purpose: | Refinance | Size: | 13,250 SF | ||||
| Borrower Sponsor: | Michael K. Shah | Cut-off Date Balance per SF: | $2,113 | ||||
| Mortgage Rate: | 4.2500% | Maturity Date Balance per SF: | $2,113 | ||||
| Note Date | 8/4/2017 | Property Manager:
| Delshah Management, LLC (borrower-related) | ||||
| First Payment Date: | 9/6/2017 | ||||||
| Maturity Date: | 8/6/2022 | ||||||
| Original Term to Maturity: | 60 months | ||||||
| Original Amortization Term: | 0 months | ||||||
| IO Period: | 60 months | ||||||
| Seasoning: | 3 months | Underwriting and Financial Information | |||||
| Prepayment Provisions: | LO (27); DEF (27); O (6) | UW NOI(4): | $2,049,637 | ||||
| Lockbox/Cash Mgmt Status(1): | Soft/Springing | UW NOI Debt Yield: | 7.3% | ||||
| Additional Debt Type: | N/A | UW NOI Debt Yield at Maturity: | 7.3% | ||||
| Additional Debt Balance: | N/A | UW NCF DSCR: | 1.70x | ||||
| Future Debt Permitted (Type): | No (N/A) | Most Recent NOI(4): | $1,592,183 (8/31/2017 TTM) | ||||
| Reserves(2) | 2nd Most Recent NOI(5): | N/A | |||||
| Type | Initial | Monthly | Cap | 3rd Most Recent NOI(5): | N/A | ||
| RE Tax: | $45,325 | $22,663 | N/A | Most Recent Occupancy: | 100.0% (8/31/2017) | ||
| Insurance: | $23,712 | $2,635 | N/A | 2nd Most Recent Occupancy(5): | N/A | ||
| Deferred Maintenance: | $15,000 | $0 | N/A | 3rd Most Recent Occupancy(5): | N/A | ||
| Replacement: | $0 | $228 | N/A | Appraised Value (as of): | $53,900,000 (6/7/2017) | ||
| TI/LC: | $0 | Springing | N/A | Cut-off Date LTV Ratio: | 51.9% | ||
| Other(3): | $2,057,375 | $0 | N/A | Maturity Date LTV Ratio: | 51.9% | ||
| Sources and Uses | ||||||
| Sources | Proceeds | % of Total | Uses | Proceeds | % of Total | |
| Loan Amount: | $28,000,000 | 100.0% | Loan Payoff: | $20,515,489 | 73.3% | |
| Reserves: | $2,141,412 | 7.6% | ||||
| Closing Costs: | $1,338,682 | 4.8% | ||||
| Return of Equity(6): | $4,004,417 | 14.3% | ||||
| Total Sources: | $28,000,000 | 100.0% | Total Uses: | $28,000,000 | 100.0% | |
| (1) | See “Lockbox and Cash Management” below for further discussion of cash management status. |
| (2) | See “Escrows and Reserves” below for further discussion of reserve requirements. |
| (3) | Other Reserve includes a Free People Reserve ($1,364,750) and a Free People Rent Credit Reserve ($692,625). At origination, the borrower deposited an additional $669,125 with Free People’s attorney in connection with a dispute between the tenant and the Delshah NYC Portfolio Borrowers (as defined below and as described under “Description of the Mortgage Pool—Litigation and Other Considerations” in the Preliminary Prospectus and “Escrows and Reserves” below). |
| (4) | UW NOI is based on the underwritten rent roll and includes (i) $121,800 of rent steps through November 2018 and (ii) $297,600 of UW Base Rent attributed to the three multifamily units. |
| (5) | Historical cash flows and historical occupancy are not available due to the acquisition of the Delshah NYC Portfolio Properties (as defined below) in 2013 and the subsequent gut renovations prior to the execution of new leases with the current tenants. |
| (6) | The borrower sponsor acquired (i) the Ninth Avenue Property (as defined below) for $18.2 million and invested approximately $8.0 million in capital improvements and (ii) the Gansevoort Property (as defined below) for $8.6 million and invested approximately $536,000 in capital improvements. |
The Mortgage Loan. The seventh largest mortgage loan (the “Delshah NYC Portfolio Mortgage Loan”) is evidenced by a single promissory note with an original principal balance of $28,000,000 and is secured by a first priority fee mortgage encumbering a mixed use, retail/multifamily building located at 58-60 Ninth Avenue, New York, New York (the “Ninth Avenue Property”) and a retail property located at 69 Gansevoort Street, New York, New York (the “Gansevoort Property,” and together with the Ninth Avenue Property, the “Delshah NYC Portfolio” or “Delshah NYC Portfolio Properties”). The proceeds of the Delshah NYC Portfolio Mortgage Loan were used to refinance existing debt, return equity to the borrower sponsor, fund reserves and pay closing costs.
The Borrowers and the Borrower Sponsor. The borrowers are Delshah 60 Ninth LLC and Delshah Gansevoort 69, LLC (collectively, the “Delshah NYC Portfolio Borrowers”), each a single purpose, New York limited liability company with one independent director in its organizational structure. The nonrecourse guarantor and borrower sponsor of the Delshah NYC Portfolio Mortgage Loan is Michael K. Shah.
Michael K. Shah is the founder and managing partner of Delshah Capital, a full-service, vertically integrated commercial real estate private equity and asset management firm specializing in acquiring, developing and managing multi-family, retail and office properties throughout New York City. Michael K. Shah oversees all aspects of the company operations including acquisitions, legal strategy, asset management and property management. Since its inception in 2006, the firm has grown to own a portfolio of over 2.0 million SF valued at more than $800.0 million. The current portfolio contains 17 real
THE INFORMATION IN THIS COLLATERAL TERM SHEET IS NOT COMPLETE AND MAY BE AMENDED PRIOR TO THE TIME OF SALE. THIS TERM SHEET IS NOT AN OFFER TO SELL THESE SECURITIES AND IT IS NOT A SOLICITATION OF AN OFFER TO BUY THESE SECURITIES IN ANY JURISDICTION WHERE THE OFFER OR SALE IS NOT PERMITTED.
61
| New York, NY | Collateral Asset Summary – Loan No. 7 Delshah NYC Portfolio | Cut-off Date Balance: Cut-off Date LTV Ratio: U/W NCF DSCR: U/W NOI Debt Yield: | $28,000,000 51.9% 1.70x 7.3% |
estate assets, composed of 1,200 residential units and 10 retail units across the five boroughs of New York City. The borrower is currently subject to a dispute with a tenant. See “Description of the Mortgage Pool—Litigation and Other Considerations”in the Preliminary Prospectus.
The Properties. The Delshah NYC Portfolio Properties consist of the retail/multifamily Ninth Avenue Property and the retail Gansevoort Property, both of which are located in the Meatpacking District in Lower Manhattan, New York City.
The Ninth Avenue Property is a 100.0% leased, four-story, 10,300 SF mixed-use property located on the eastern side of Ninth Avenue between West 14th Street and West 15th Street. The Ninth Avenue Property’s first floor and below grade space are leased to Free People of PA LLC (“Free People”) (6,800 SF; 51.3% of total NRA), a subsidiary of Urban Outfitters, Inc. (“Urban Outfitters”). The Ninth Avenue Property also has three, 100.0% occupied multifamily units located on the second, third and fourth floors. Each floor consists of a full-floor, recently renovated two-bedroom multifamily unit ranging between 1,100 SF and 1,200 SF.
The Ninth Avenue Property features 34 feet of frontage on Ninth Avenue and is situated directly across the street from the Apple store and Chelsea Market and is also adjacent to Google’s NYC Headquarters. The borrower sponsor acquired the Ninth Avenue Property in April 2013 for approximately $18.2 million and subsequently invested approximately $8.0 million in capital improvements through 2014. The capital improvements were used to renovate the retail space and gut renovate the three multifamily units.
The Gansevoort Property is situated on the northern side of Gansevoort Street between Greenwich Street and Washington Street. The Gansevoort Property was built in 1940 and was gut renovated and shop-fitted by the sole tenant in 2013. The building is comprised of 2,950 SF of above grade rentable retail space and has 6,993 SF of additional air rights. The Gansevoort Property is 100.0% occupied by Madewell Inc. (“Madewell”) (2,950 SF; 22.3% of total NRA), a subsidiary of J. Crew Group, Inc. (“J. Crew;” rated Caa2 by Moody’s and CCC+ by S&P). The Gansevoort Property is located near the entrance of the High Line and the Whitney Museum of American Art. The borrower sponsor acquired the Gansevoort Property in August 2013 for approximately $8.6 million and invested approximately $536,000 into the Gansevoort Property.
Delshah NYC Portfolio Summary
| |||||||||
| Property Name | Address | Property Sub-Type | Year Built / Renovated | Allocated Loan Amount | % of Allocated Loan Amount(1) | Net Rentable Area (SF)(2) | Allocated Loan Amount PSF | Occupancy(2) | Appraised Value |
| Ninth Avenue Property | 58-60 9th Avenue New York, NY 10011 | Retail / Multifamily | 1920/2014 | $19,500,000 | 69.6% | 10,300 | $1,893 | 100.0% | $36,800,000 |
| Gansevoort Property | 69 Gansevoort Street New York, NY 10014 | Single Tenant | 1940/2013 | $8,500,000 | 30.4% | 2,950 | $2,881 | 100.0% | $17,100,000 |
| Total / Wtd. Avg. | $28,000,000 | 100.0% | 13,250 | $2,113 | 100.0% | $53,900,000 | |||
| (1) | Pursuant to the Delshah NYC Portfolio Mortgage Loan documents, partial release of an individual Delshah NYC Portfolio Property is not permitted. |
| (2) | Based on the underwritten rent roll dated August 31, 2017. |
Major Tenants.
Free People (6,800 SF, 51.3% of total NRA, 58.1% of underwritten base rent). Free People is a clothing brand that originally started in 1970 in West Philadelphia across the street from the University of Pennsylvania and changed its name to Urban Outfitters a year later. Free People was later revived as the Urban Outfitter’s wholesale label in 1984 and opened its first brick-and-mortar store in Paramus, New Jersey in 2002. In addition to its 131 Free People stores, as a wholesale line, Free People sells its brand in over 1,400 specialty stores worldwide including department stores such as Nordstrom and Bloomingdales. Free People continues to be a subsidiary of Urban Outfitters (NASDAQ: URBN), which is headquartered in Philadelphia, Pennsylvania and has a portfolio of global consumer brands consisting of Urban Outfitters, Anthropologie, Free People, BHLDN, Terrain and the Vetri Family, a group of restaurants. Free People executed a 10-year lease at the Ninth Avenue Property in March 2015 with a lease term commencement in November 2016 and a lease expiration in January 2027. In addition, the lease provides for two five-year renewal options.
Madewell (2,950 SF, 22.3% of total NRA, 29.6% of underwritten base rent). Madewell was originally founded in 1937 as an outfitter for factory workers and fishermen. The brand shut down in 1989 and was acquired and reopened under the J. Crew brand in 2006, as a clothing line dedicated to women. J. Crew is a men and women’s clothing store that was founded in 1983 and opened its first store in 1989. As of August 23, 2017, J. Crew operates 274 J. Crew retail stores, 119 Madewell stores, 182 factory stores and accompanying online retail websites. Madewell executed a 10-year lease at the Gansevoort Property in October 2015 with a lease commencement in October 2016, a lease expiration in January 2027 and provides for two five-year renewal options.
THE INFORMATION IN THIS COLLATERAL TERM SHEET IS NOT COMPLETE AND MAY BE AMENDED PRIOR TO THE TIME OF SALE. THIS TERM SHEET IS NOT AN OFFER TO SELL THESE SECURITIES AND IT IS NOT A SOLICITATION OF AN OFFER TO BUY THESE SECURITIES IN ANY JURISDICTION WHERE THE OFFER OR SALE IS NOT PERMITTED.
62
| New York, NY | Collateral Asset Summary – Loan No. 7 Delshah NYC Portfolio | Cut-off Date Balance: Cut-off Date LTV Ratio: U/W NCF DSCR: U/W NOI Debt Yield: | $28,000,000 51.9% 1.70x 7.3% |
The following table presents certain information relating to the leases at the Delshah NYC Portfolio Properties:
| Tenant Summary(1) | ||||||||
| Tenant Name | Property | Credit Rating (Fitch/Moody’s/ S&P)(2) | Tenant SF | Approximate % of SF | Annual UW Base Rent | % of Total Annual UW Base Rent | Annual UW Base Rent PSF | Lease Expiration |
| Free People | Ninth Avenue Property | NR/NR/NR | 6,800 | 51.3% | $1,405,693 | 58.1% | $206.72 | 1/31/2027(3) |
| Madewell | Gansevoort Property | NR/Caa2/CCC+ | 2,950 | 22.3% | $716,108 | 29.6% | $242.75 | 1/31/2027(4) |
| Subtotal/Wtd. Avg. | 9,750 | 73.6% | $2,121,800 | 87.7% | $217.62 | |||
| Multifamily Units(5) | Ninth Avenue Property | 3,500 | 26.4% | $297,600 | 12.3% | $85.03 | Various | |
| Total/Wtd. Avg. | 13,250 | 100.0% | $2,419,400 | 100.0% | $182.60 | |||
| (1) | Information is based on the underwritten rent roll dated August 31, 2017. |
| (2) | Certain ratings are those of the parent company whether or not the parent guarantees the lease. |
| (3) | Free People has two five-year extension options. |
| (4) | Madewell has two five-year extension options. J. Crew Group, Inc. guaranties the lease. |
| (5) | The Ninth Avenue Property contains three multifamily units located on the second, third and fourth floors of the property. Each unit is leased for one-year terms. |
The following table presents certain information relating to the lease rollover schedule at the Delshah NYC Portfolio Properties:
| Lease Rollover Schedule(1)(2) | ||||||||
| Year | # of Leases Rolling | SF Rolling | Approx. % of Total SF Rolling | Approx. Cumulative % of SF Rolling | UW Base Rent PSF Rolling(3) | Total UW Base Rent Rolling(3) | Approx. % of Total Rent Rolling | Approx. Cumulative % of Total Rent Rolling(3) |
| MTM | 0 | 0 | 0.0% | 0.0% | $0.00 | $0 | 0.0% | 0.0% |
| 2017 | 0 | 0 | 0.0% | 0.0% | $0.00 | $0 | 0.0% | 0.0% |
| 2018 | 0 | 0 | 0.0% | 0.0% | $0.00 | $0 | 0.0% | 0.0% |
| 2019 | 0 | 0 | 0.0% | 0.0% | $0.00 | $0 | 0.0% | 0.0% |
| 2020 | 0 | 0 | 0.0% | 0.0% | $0.00 | $0 | 0.0% | 0.0% |
| 2021 | 0 | 0 | 0.0% | 0.0% | $0.00 | $0 | 0.0% | 0.0% |
| 2022 | 0 | 0 | 0.0% | 0.0% | $0.00 | $0 | 0.0% | 0.0% |
| 2023 | 0 | 0 | 0.0% | 0.0% | $0.00 | $0 | 0.0% | 0.0% |
| 2024 | 0 | 0 | 0.0% | 0.0% | $0.00 | $0 | 0.0% | 0.0% |
| 2025 | 0 | 0 | 0.0% | 0.0% | $0.00 | $0 | 0.0% | 0.0% |
| 2026 | 0 | 0 | 0.0% | 0.0% | $0.00 | $0 | 0.0% | 0.0% |
| 2027(3) | 2 | 9,750 | 100.0% | 100.0% | $217.62 | $2,121,800 | 100.0% | 100.0% |
| 2028 & Beyond | 0 | 0 | 0.0% | 100.0% | $0.00 | $0 | 0.0% | 100.0% |
| Vacant | 0 | 0 | 0.0% | 100.0% | $0.00 | $0 | 0.0% | 100.0% |
| Total/Wtd. Avg. | 2 | 9,750 | 100.0% | $217.62 | $2,121,800 | 100.0% | 100.0% | |
| (1) | Information is based on the underwritten rent roll dated August 31, 2017 and only reflects the commercial tenants of the Delshah NYC Portfolio Properties. The Ninth Avenue Property also contain three multifamily units that are 100.0% occupied on one-year lease terms with current annual rent totaling $297,600. |
| (2) | Certain tenants may have lease termination options that are exercisable prior to the originally stated expiration date of the subject lease and that are not considered in the lease rollover schedule. |
| (3) | See “Major Tenant Cash Trap Period” under “Lockbox and Cash Management” below. |
THE INFORMATION IN THIS COLLATERAL TERM SHEET IS NOT COMPLETE AND MAY BE AMENDED PRIOR TO THE TIME OF SALE. THIS TERM SHEET IS NOT AN OFFER TO SELL THESE SECURITIES AND IT IS NOT A SOLICITATION OF AN OFFER TO BUY THESE SECURITIES IN ANY JURISDICTION WHERE THE OFFER OR SALE IS NOT PERMITTED.
63
| New York, NY | Collateral Asset Summary – Loan No. 7 Delshah NYC Portfolio | Cut-off Date Balance: Cut-off Date LTV Ratio: U/W NCF DSCR: U/W NOI Debt Yield: | $28,000,000 51.9% 1.70x 7.3% |
The Market. The Delshah NYC Portfolio Properties are located in the West Village/Downtown apartment submarket and the Greenwich Village retail submarket.
The Delshah NYC Portfolio Properties are located in the Meatpacking District on the far west side of Manhattan, bordered to the north by Chelsea and to the south by the West Village. The Meatpacking District has become the epicenter of fashion, art and technology and the main point of entry onto the High Line. The Meatpacking District received its name due to the high number of slaughterhouses and packing plants located in the area at the turn of the 20th century, but has steadily transformed into a destination location for high-end boutiques including Christian Louboutin, Alexander McQueen, Stella McCartney, Hermes and Theory. The Meatpacking District also has a vibrant social scene with restaurants, bars and night clubs. In addition, the Meatpacking District and Chelsea have emerged as a destination for technology, media and creative industry with companies such as Google, Twitter, Apple, Samsung, Uber and Tesla all having a prominent presence in the neighborhood. Additional features to the neighborhood are the High Line linear park, which opened in 2009 and the Whitney Museum of American Art, which opened in 2015. According to a third party research report, the 2016 demographics within the Meatpacking District, such as population, average household income, median household income were 290,473, $112,900 and $73,608 respectively.
As of the first quarter of 2017, within the West Village/Downtown apartment submarket, there were 25,461 total units, with an average vacancy rate of 4.0% and an average asking rent per unit of $4,350.
As of the first quarter of 2017, the Greenwich Village retail submarket had approximately 2.7 million SF of supply, with 84,090 SF vacant indicating a vacancy rate of 3.1% and total average asking rents of $122.39 PSF. Average ground floor retail rents in the Meatpacking District and the West Village range from $300.00 to $375.00 PSF and $375.00 to $525.00 PSF respectively.
Retail lease comparables for the Delshah NYC Portfolio Properties range from $235.00 to $284.00 PSF.
Retail Lease Comparable(1)
| ||||||||||
| Property Name | Location | Net Rentable Area (SF) | Year Built | Tenant Name | Lease Size (SF) | Lease Date | Term | Rent PSF | Lease Type | |
| Subject: Free People | 58-60 Ninth Avenue | 6,800(2)(3) | 1920 | Free People | 6,800(2) | 11/9/2016(2) | 10.0 | $206.72(2) | Net | |
| Subject: Madewell | 69 Gansevoort Street | 2,950(2) | 1940 | Madewell | 2,950(2) | 10/13/2016(2) | 10.0 | $242.75(2) | Net | |
| Ted Baker | 115-121 Wooster | 7,875 | 1900 | Ted Baker | 7,875 | 1/1/2016 | 10.0 | $235.00 | Net | |
| Hermes | 46 Gansevoort Street | 10,000 | 1941 | Hermes | 10,000 | 1/1/2018 | 10.0 | $284.00 | Net | |
| Indochino | 424 Broom Street | 4,100 | 1900 | Indochino | 4,100 | 6/26/2016 | 5.0 | $275.00 | Net | |
| Intermix | 810 Washington Street | 2,125 | 1940 | Intermix | 2,125 | 9/1/2016 | 10.0 | $225.00 | NNN | |
| Sweetgreen | 32 Gansevoort Street | 10,100 | 1910 | Sweetgreen | 1,915 | 8/1/2016 | 10.0 | $240.00 | NNN | |
(1) | Information is based on the appraisal. |
| (2) | Based on the underwritten rent roll. |
| (3) | The Ninth Avenue Property Net Rentable Area only reflects retail SF. |
THE INFORMATION IN THIS COLLATERAL TERM SHEET IS NOT COMPLETE AND MAY BE AMENDED PRIOR TO THE TIME OF SALE. THIS TERM SHEET IS NOT AN OFFER TO SELL THESE SECURITIES AND IT IS NOT A SOLICITATION OF AN OFFER TO BUY THESE SECURITIES IN ANY JURISDICTION WHERE THE OFFER OR SALE IS NOT PERMITTED.
64
| New York, NY | Collateral Asset Summary – Loan No. 7 Delshah NYC Portfolio | Cut-off Date Balance: Cut-off Date LTV Ratio: U/W NCF DSCR: U/W NOI Debt Yield: | $28,000,000 51.9% 1.70x 7.3% |
Operating History and Underwritten Net Cash Flow.The following table presents certain information relating to the historical operating performance and the Underwritten Net Cash Flow at the Delshah NYC Portfolio Properties:
Cash Flow Analysis
| ||||||
| 2014(1) | 2015(1) | 2016(1) | 8/31/2017 TTM | UW | UW PSF | |
| Gross Potential Rent(2) | N/A | N/A | N/A | $1,933,876 | $2,419,400 | $182.60 |
| Total Recoveries | N/A | N/A | N/A | $71,433 | $82,341 | $6.21 |
| Less Vacancy & Credit Loss(3) | N/A | N/A | N/A | $0 | ($75,052) | ($5.66) |
| Effective Gross Income | N/A | N/A | N/A | $2,005,309 | $2,426,689 | $183.15 |
| Total Operating Expenses | N/A | N/A | N/A | $413,126 | $377,052 | $28.46 |
| Net Operating Income | N/A | N/A | N/A | $1,592,183 | $2,049,637 | $154.69 |
| Capital Expenditures | N/A | N/A | N/A | $0 | $2,738 | $0.21 |
| TI/LC | N/A | N/A | N/A | $0 | $0 | $0.00 |
| Net Cash Flow | N/A | N/A | N/A | $1,592,183 | $2,046,900 | $154.48 |
| Occupancy % | N/A | N/A | N/A | 100.0% | 97.0% | |
| NOI DSCR | N/A | N/A | N/A | 1.32x | 1.70x | |
| NCF DSCR | N/A | N/A | N/A | 1.32x | 1.70x | |
| NOI Debt Yield | N/A | N/A | N/A | 5.7% | 7.3% | |
| NCF Debt Yield | N/A | N/A | N/A | 5.7% | 7.3% | |
| (1) | Historical cash flows are unavailable due to the acquisition of the Delshah NYC Portfolio Properties in 2013 and the subsequent renovations and execution of new leases with the current tenants. |
| (2) | UW Gross Potential Rent is underwritten based on the underwritten rent roll and includes (i) $121,800 of rent steps through November 2018 and (ii) $297,600 of UW Base Rent attributed to the three multifamily units. |
| (3) | The appraisal concluded a 3.0% general vacancy rate and CCRE is underwriting a 3.0% vacancy. As of the underwritten rent roll dated August 31, 2017, the Delshah NYC Properties are 100.0% occupied. |
Escrows and Reserves. The Delshah NYC Portfolio Borrowers deposited (i) $45,325 upfront in escrow for annual real estate taxes and is required to escrow monthly 1/12 of the annual estimated tax payments, (ii) $23,712 upfront in escrow for annual insurance premiums and is required to escrow monthly 1/12 of the annual estimated insurance premiums, (iii) $15,000 upfront for an immediate repair reserve, (iv) an ongoing monthly replacement reserve of approximately $228, (v) an ongoing monthly TI/LC reserve of approximately $813, (vi) $1,364,750 upfront for a Free People Reserve and (vii) $692,625 upfront for a Free People Rent Credit Reserve. Separately, the Delshah NYC Portfolio Borrowers deposited $669,125 was deposited at loan origination with Free People’s attorney as a result of a stipulation filed and approved by the Supreme Court of the State of New York, New York County in connection with a dispute between the Delshah NYC Portfolio Borrowers and the tenant. Upon delivery of the final unappealable order of the decision rendered by the court adjudicating the aforementioned dispute, it is anticipated that certain amounts in the Free People Reserve and the Free People Rent Credit Reserve will be transferred to the tenant and any remaining amounts returned to the Delshah NYC Portfolio Borrowers. See “Description of the Mortgage Pool—Litigation and Other Considerations” in the Preliminary Prospectus.
Lockbox and Cash Management.The Delshah NYC Portfolio Mortgage Loan is structured with a soft lockbox and springing cash management. The Delshah NYC Portfolio Borrowers are required to collect all rent from the tenants and within two business days transmit such rent directly into the clearing account maintained by the Delshah NYC Portfolio Borrowers at a local bank selected by the borrowers. Except during a Cash Management Period (as defined below), funds deposited into the clearing account will be swept by the clearing bank on a daily basis into an account designated by the Delshah NYC Portfolio Borrowers’ at the clearing bank. During a Cash Management Period, funds deposited into the clearing account are required to be swept by the clearing bank on a daily basis into a lender controlled lockbox account and applied and disbursed by the lender in accordance with the loan documents and any excess funds will be maintained as additional collateral.
A “Cash Management Period” will commence upon (a) the occurrence of any of the following, (i) any event of default; (ii) any bankruptcy action of the Delshah NYC Portfolio Borrowers, principal, guarantor or property manager has occurred; (iii) the commencement of a Major Tenant Cash Trap Period (as defined below); or (iv) failure by the Delshah NYC Portfolio Borrowers, after the end of two consecutive calendar quarters, to maintain an debt service coverage ratio of at least 1.15x, and (b) terminate, upon lender giving notice to the Delshah NYC Portfolio Borrowers and clearing bank that the Cash Management Period has ended and, in the case of clause (i), the event of default has been cured and no other event of default is continuing; in the case of clause (ii), with respect to a bankruptcy action of the property manager only, the Delshah NYC Portfolio Borrowers have replaced the manager with a qualified manager under an acceptable replacement management agreement; in the case of clause (iii), such Major Tenant Cash Trap Period has terminated and no other Cash Management Period is then continuing; and in the case of clause (iv), the debt service coverage ratio is at least 1.15x for two consecutive calendar quarters and no other Cash Management Period is then in effect or event that would trigger another Cash Management Period has occurred.
A “Major Tenant Cash Trap Period” will commence on (i) the date on which a Major Tenant (as described below) discontinues its business at its premises or vacatesi.e. “goes dark” at the premises (unless the tenant is paying all monetary obligations and is not otherwise in default or the Delshah NYC Portfolio Borrowers have deposited into an excess cash reserve account, the sum (calculated by lender) equal to the excess cash that would have been deposited with the lender if this tenant had paid all of its monetary obligations under the lease); (ii) the earlier of (x) the date that is twelve months prior to the then current expiration of the Major Lease or (y) the date upon which a Major Tenant gives notice of its intention not to exercise any remaining renewal options under its lease; (iii) the date on which a Major Tenant terminates its lease or delivers to Delshah NYC Portfolio Borrowers a written notice or otherwise indicates its intention to terminate; (iv) the occurrence of a monetary or material non-monetary default by a Major Tenant under its lease (excluding any non-payment during a rent abatement period); and (v) the date upon which a Major Tenant (or its parent company, if such parent is the guarantor on such Major Lease) becomes a debtor in any bankruptcy or insolvency proceedings. A Major Tenant Cash Trap Period will terminate, in the case of clause (i), the applicable Major Tenant has renewed or extended its lease for a term no less than five years beyond the stated maturity date (or the Delshah NYC Portfolio Borrowers have deposited in an excess cash reserve an amount equal to the greater of (x) twelve months of excess cash calculated from the
THE INFORMATION IN THIS COLLATERAL TERM SHEET IS NOT COMPLETE AND MAY BE AMENDED PRIOR TO THE TIME OF SALE. THIS TERM SHEET IS NOT AN OFFER TO SELL THESE SECURITIES AND IT IS NOT A SOLICITATION OF AN OFFER TO BUY THESE SECURITIES IN ANY JURISDICTION WHERE THE OFFER OR SALE IS NOT PERMITTED.
65
| New York, NY | Collateral Asset Summary – Loan No. 7 Delshah NYC Portfolio | Cut-off Date Balance: Cut-off Date LTV Ratio: U/W NCF DSCR: U/W NOI Debt Yield: | $28,000,000 51.9% 1.70x 7.3% |
date the tenant has gone dark and (y) $60.00 PSF for the space leased by such Major Tenant; in the case of clause (ii), the date on which the Major Tenant (or its parent, if applicable) ceases to be a debtor in a bankruptcy or insolvency proceeding; in the case of clause (iii), the Delshah NYC Portfolio Borrowers have entered into on or more leases with one or more replacement tenants reasonably satisfactory to lender, each at a net effective rental rate of no less than $180.00 PSF, which rental rate produces a debt service coverage ratio of at least 1.15x and no other Cash Management Period is then continuing.
A “Major Tenant” means any tenant under a “Major Lease”, which means (i) the Madewell lease (and any replacement lease thereof), (ii) the Free People lease (and any replacement lease thereof), and/or (iii) any other non-residential lease (a) which, either individually or when taken together with any other lease with the same tenant or its affiliates, demises in excess of 2,000 SF at the Delshah NYC Portfolio Property or (b) made with a tenant that is paying base rent in an amount equal to or exceeding 15.0% of the gross income from operations.
Additional Secured Indebtedness.Not permitted.
Mezzanine Loan and Preferred Equity.Not permitted.
Release of Property.Not permitted.
Terrorism Insurance.The Delshah NYC Portfolio Mortgage Loan documents require “all risk” insurance / umbrella coverage in an amount equal to 100% of the full replacement cost and a commercial general liability insurance policy with a limit of not less than $10,000,000 in the aggregate. Terrorism coverage is required, which may be included in the property insurance policy or a stand-alone policy covering terrorist acts.
THE INFORMATION IN THIS COLLATERAL TERM SHEET IS NOT COMPLETE AND MAY BE AMENDED PRIOR TO THE TIME OF SALE. THIS TERM SHEET IS NOT AN OFFER TO SELL THESE SECURITIES AND IT IS NOT A SOLICITATION OF AN OFFER TO BUY THESE SECURITIES IN ANY JURISDICTION WHERE THE OFFER OR SALE IS NOT PERMITTED.
66
237 Park Avenue New York, NY 10017 | Collateral Asset Summary – Loan No. 8 237 Park Avenue | Cut-off Date Balance: Cut-off Date LTV Ratio: UW NCF DSCR: UW NOI Debt Yield: | $25,390,000 26.6% 4.10x 16.4% |
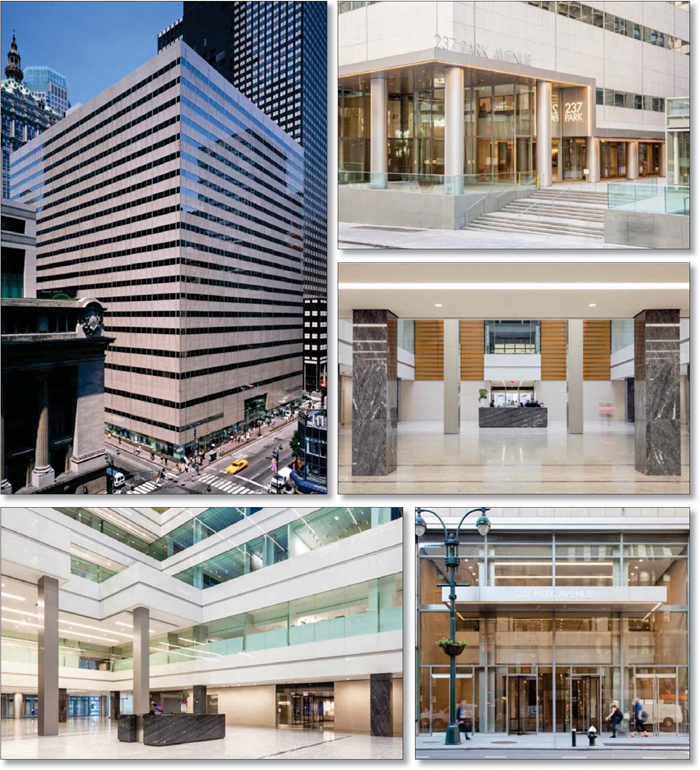
THE INFORMATION IN THIS COLLATERAL TERM SHEET IS NOT COMPLETE AND MAY BE AMENDED PRIOR TO THE TIME OF SALE. THIS TERM SHEET IS NOT AN OFFER TO SELL THESE SECURITIES AND IT IS NOT A SOLICITATION OF AN OFFER TO BUY THESE SECURITIES IN ANY JURISDICTION WHERE THE OFFER OR SALE IS NOT PERMITTED.
67
237 Park Avenue New York, NY 10017 | Collateral Asset Summary – Loan No. 8 237 Park Avenue | Cut-off Date Balance: Cut-off Date LTV Ratio: UW NCF DSCR: UW NOI Debt Yield: | $25,390,000 26.6% 4.10x 16.4% |
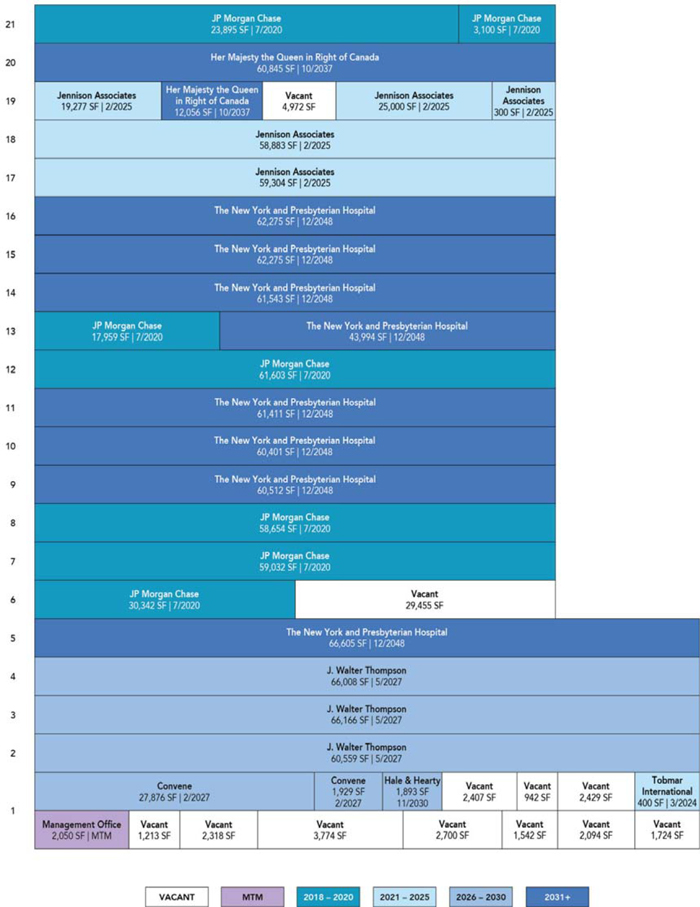
THE INFORMATION IN THIS COLLATERAL TERM SHEET IS NOT COMPLETE AND MAY BE AMENDED PRIOR TO THE TIME OF SALE. THIS TERM SHEET IS NOT AN OFFER TO SELL THESE SECURITIES AND IT IS NOT A SOLICITATION OF AN OFFER TO BUY THESE SECURITIES IN ANY JURISDICTION WHERE THE OFFER OR SALE IS NOT PERMITTED.
68
237 Park Avenue New York, NY 10017 | Collateral Asset Summary – Loan No. 8 237 Park Avenue | Cut-off Date Balance: Cut-off Date LTV Ratio: UW NCF DSCR: UW NOI Debt Yield: | $25,390,000 26.6% 4.10x 16.4% |
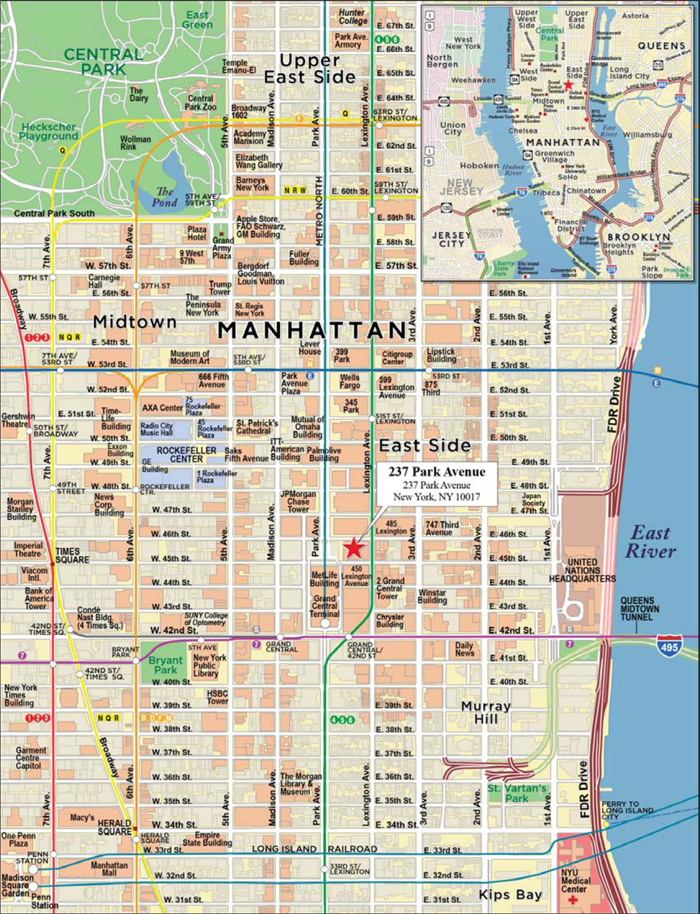
THE INFORMATION IN THIS COLLATERAL TERM SHEET IS NOT COMPLETE AND MAY BE AMENDED PRIOR TO THE TIME OF SALE. THIS TERM SHEET IS NOT AN OFFER TO SELL THESE SECURITIES AND IT IS NOT A SOLICITATION OF AN OFFER TO BUY THESE SECURITIES IN ANY JURISDICTION WHERE THE OFFER OR SALE IS NOT PERMITTED.
69
237 Park Avenue New York, NY 10017 | Collateral Asset Summary – Loan No. 8 237 Park Avenue | Cut-off Date Balance: Cut-off Date LTV Ratio: UW NCF DSCR: UW NOI Debt Yield: | $25,390,000 26.6% 4.10x 16.4% |
| Mortgage Loan Information | Property Information | ||||||
| Mortgage Loan Seller(1): | Société Générale | Single Asset/Portfolio: | Single Asset | ||||
| Credit Assessment (Fitch/KBRA/Moody’s/S&P): | [ ] | Location: | New York, NY 10017 | ||||
| General Property Type: | Office | ||||||
| Original Balance(2): | $25,390,000 | Detailed Property Type: | CBD | ||||
| Cut-off Date Balance(2): | $25,390,000 | Title Vesting: | Fee/Leasehold | ||||
| % of Initial Pool Balance: | [ ]% | Year Built/Renovated: | 1914/2017 | ||||
| Loan Purpose: | Refinance | Size: | 1,251,717 SF | ||||
| Borrower Sponsors: | RXR Group; Walton Street Group | Cut-off Date Balance per SF(2): | $278 | ||||
| Mortgage Rate: | 3.7515436% | Maturity Date Balance per SF(2): | $278 | ||||
| Note Date: | 7/26/2017 | Property Manager:
| RXR Property Management LLC (borrower-related) | ||||
| First Payment Date: | 9/9/2017 | ||||||
| Maturity Date: | 8/9/2027 | ||||||
| Original Term to Maturity: | 120 months | ||||||
| Original Amortization Term: | 0 months | ||||||
| IO Period: | 120 months | ||||||
| Seasoning: | 3 months | ||||||
| Prepayment Provisions: | LO (27); DEF (86); O (7) | Underwriting and Financial Information | |||||
| Lockbox/Cash Mgmt Status: | Hard/Springing | UW NOI(5): | $57,166,479 | ||||
| Additional Debt Type(3): | Pari Passu/Subordinate Debt/Mezzanine | UW NOI Debt Yield(2): | 16.4% | ||||
| Additional Debt Balance(3): | $322,610,000/$345,200,000/$87,800,000 | UW NOI Debt Yield at Maturity(2): | 16.4% | ||||
| Future Debt Permitted (Type): | Yes (Mezzanine) | UW NCF DSCR(2): | 4.10x | ||||
| Reserves(4) | Most Recent NOI: | $19,845,834 (12/31/2016) | |||||
| Type | Initial | Monthly | Cap | 2nd Most Recent NOI: | $19,489,476 (12/31/2015) | ||
| RE Tax: | $0 | Springing | N/A | 3rd Most Recent NOI: | $32,393,944 (12/31/2014) | ||
| Insurance: | $0 | Springing | N/A | Most Recent Occupancy(5): | 95.6% (6/29/2017) | ||
| Replacements: | $0 | Springing | N/A | 2nd Most Recent Occupancy: | 63.5% (12/31/2016) | ||
| TI/LC: | $0 | Springing | N/A | 3rd Most Recent Occupancy: | 63.1% (12/31/2015) | ||
| Outstanding TI/LC: | $81,365,605 | $0 | N/A | Appraised Value (as of)(6): | $1,310,000,000 (5/22/2017) | ||
| Interest Reserve: | $7,500,000 | $0 | N/A | Cut-off Date LTV Ratio(2)(6): | 26.6% | ||
| JPM Reserve: | $0 | Springing | (4) | Maturity Date LTV Ratio(2)(6): | 26.6% | ||
| Sources and Uses | ||||||
| Sources | Proceeds | % of Total | Uses | Proceeds | % of Total | |
| Loan Amount(2): | $693,200,000 | 88.8% | Loan Payoff: | $628,164,189 | 80.4% | |
| Mezzanine Loan(2): | $87,800,000 | 11.2% | Reserves: | $88,865,605 | 11.4% | |
| Closing Costs: | $41,379,906 | 5.3% | ||||
| Return of Equity: | $22,590,300 | 2.9% | ||||
| Total Sources: | $781,000,000 | 100.0% | Total Uses: | $781,000,000 | 100.0% | |
| (1) | The 237 Park Avenue Whole Loan was co-originated by Société Générale and Morgan Stanley Bank, N.A. (collectively, the “Lenders”). |
| (2) | The 237 Park Avenue Mortgage Loan (as defined below) is part of the 237 Park Avenue Whole Loan (as defined below), which is comprised of 14 seniorpari passupromissory notes with an aggregate original principal balance of $348.0 million and fourpari passu subordinate notes with an aggregate original principal balance of $345.2 million. The 237 Park Avenue Whole Loan is accompanied by the 237 Park Avenue Mezzanine Loan (as defined below) with an outstanding aggregate principal balance of $87.8 million. The Cut-off Date Balance PSF, Maturity Date Balance PSF, UW NOI Debt Yield, UW NOI Debt Yield at Maturity, UW NCF DSCR, Cut-off Date LTV Ratio and Maturity Date LTV Ratio numbers presented above are based on the aggregate principal balance of the promissory notes comprising the 237 Park Avenue Mortgage Loan and the 237 Park Avenue Pari Passu Companion Loan (as defined below). The Cut-off Date Balance PSF, Maturity Date Balance PSF, UW NOI Debt Yield, UW NOI Debt Yield at Maturity, UW NCF DSCR, Cut-off Date LTV Ratio and Maturity Date LTV based on the 237 Park Avenue Whole Loan are $554, $554, 8.2%, 8.2%, 2.06x, 52.9% and 52.9%, respectively. |
| (3) | See “The Mortgage Loan”, “Additional Secured Indebtedness (not including trade debts)”and “Mezzanine Loan and Preferred Equity” below for further discussion of additional debt. |
| (4) | See“Escrows and Reserves”below for further discussion of reserve requirements. |
| (5) | The increase in UW NOI is due to a new lease, in which New York and Presbyterian Hospital (“NYP”) leases 479,016 SF, representing approximately 35.9% of underwritten base rent for a period of 30 years, bringing the overall occupancy to 95.6%. |
| (6) | Appraised Value (as of), Cut-off Date LTV Ratio and Maturity Date LTV Ratio, with respect to the 237 Park Avenue Whole Loan, is based on the “As-Is Assuming Reserves” value of $1,310,000,000 as of May 22, 2017, which assumes upfront reserves of $81,365,605 for capital expenditures and tenant improvements and leasing costs for recently signed leases in addition to a $7,500,000 escrow and letters of credit in an aggregate amount of $8,500,000 to cover interest and free rent payments, specifically for a portion of the free rent provided to NYP and Her Majesty the Queen in Right of Canada spaces. The Cut-off Date LTV Ratio and Maturity Date LTV Ratio based on the $1.2 billion “As-Is” appraised value are 29.0% and 29.0%, respectively. |
The Mortgage Loan. The eighth largest mortgage loan (the “237 Park Avenue Mortgage Loan”) is part of a whole loan (the “237 Park Avenue Whole Loan”) secured by the 237 Park Avenue Fee Borrower’s (as defined below) fee interest in the 237 Park Avenue Property (as defined below), the condominium units owned by the 237 Park Avenue Declarant Borrower (as defined below), the revenues from the 237 Park Avenue Property, and all other tangible and intangible property in respect of which the Lenders are granted a lien under the 237 Park Avenue Whole Loan documents, and all proceeds of the foregoing and the collateral assignment of the purchase money note, the purchase money mortgage and the purchase sale agreement each relating to NYP’s purchase of its condominium units at the 237 Park Avenue Property. The 237 Park Avenue Property is a 21-story, 1,251,717 SF Class A office
THE INFORMATION IN THIS COLLATERAL TERM SHEET IS NOT COMPLETE AND MAY BE AMENDED PRIOR TO THE TIME OF SALE. THIS TERM SHEET IS NOT AN OFFER TO SELL THESE SECURITIES AND IT IS NOT A SOLICITATION OF AN OFFER TO BUY THESE SECURITIES IN ANY JURISDICTION WHERE THE OFFER OR SALE IS NOT PERMITTED.
70
237 Park Avenue New York, NY 10017 | Collateral Asset Summary – Loan No. 8 237 Park Avenue | Cut-off Date Balance: Cut-off Date LTV Ratio: UW NCF DSCR: UW NOI Debt Yield: | $25,390,000 26.6% 4.10x 16.4% |
building that occupies the entire city block bound by Lexington Avenue and Park Avenue between 45th and 46thStreets in Midtown Manhattan (the “237 Park Avenue Property”), adjacent to Grand Central Terminal.
The 237 Park Avenue Whole Loan consists of (i) a loan whose proceeds were used to refinance the prior mortgage loan, make deposits into the reserve funds, pay costs and expenses in connection with the origination of the loan, and fund any working capital requirements of the 237 Park Avenue Property (the “Senior Lien Loan”) and (ii) a loan whose proceeds are to be used for the cost of future improvements (the “Building Loan”). The Building Loan was created in order to comply with New York lien law and is subordinate to the Senior Lien Loan in terms of lien priority. The Senior Lien Loan and the Building Loan are treated as one loan below. The 237 Park Avenue Whole Loan is comprised of (i) a senior loan, comprised of 14pari passu notes, with an aggregate outstanding principal balance of $348.0 million and (ii) subordinate companion loans, comprised of fourpari passu notes, with an aggregate outstanding principal balance as of the Cut-off Date of $345.2 million (collectively, the “237 Park Avenue Subordinate Companion Loan”), each as described below. Senior Note A-2-C2, Senior Note A-2-C3, Building Note A-2-C2 and Building Note A-2-C3, with an aggregate outstanding principal balance as of the Cut-off Date of $25.39 million, will be contributed to the UBS 2017-C5 Trust. The remaining 10 notes (collectively, the “237 Park Avenue Pari Passu Companion Loan”) have an aggregate outstanding principal balance as of the Cut-off Date of $322.61 million. The controlling senior Note A-1-S (along with three other senior 237 Park Avenue Pari Passu Companion Loan notes and the 237 Park Avenue Subordinate Companion Loan) were contributed to the MSSG Trust 2017-237P, which governs the servicing and administration of the 237 Park Avenue Whole Loan and is the controlling note under the related intercreditor agreement, the rights of which will be exercised by the related trustee (or, prior to the occurrence and continuance of a control termination event under the related trust and servicing agreement (the “MSSG Trust 2017-237P Trust and Servicing Agreement”), the directing certificate holder under the MSSG Trust 2017-237P Trust and Servicing Agreement). Société Générale provides no assurances that any non-securitized notes will not be split further. See “Description of the Mortgage Pool—The Whole Loans—The Non-Serviced AB Whole Loans” and “Pooling and Servicing Agreement” in the Preliminary Prospectus.
The 237 Park Avenue Whole Loan has a 10-year term and is interest only for the term of the loan. The 237 Park Avenue Whole Loan had an initial term of 120 months and has a remaining term of 117 months as of the Cut-off Date. The 237 Park Avenue Whole Loan matures on August 9, 2027. The proceeds of the 237 Park Avenue Whole Loan, along with one mezzanine loan with a principal balance as of the Cut-off Date of $87,800,000 (the “237 Park Avenue Mezzanine Loan”), were used to refinance the 237 Park Avenue Property, fund reserves, pay closing costs and return equity to the borrower sponsors.
| 237 Park Avenue Whole Loan Summary | ||||
| Note(1) | Original Balance | Cut-off Date Balance | Anticipated Note Holder(2) | Controlling Piece |
| Senior Note A-1-S | $74,378,041 | $74,378,041 | MSSG Trust 2017-237P | Yes |
| Senior Note A-1-C1 | $60,411,124 | $60,411,124 | MSBAM 2017-C34 | No |
| Senior Note A-1-C2 | $60,411,124 | $60,411,124 | Morgan Stanley Bank, N.A. | No |
| Senior Note A-2-S | $40,049,714 | $40,049,714 | MSSG Trust 2017-237P | No |
| Senior Note A-2-C1 | $43,147,721 | $43,147,721 | UBS 2017-C4 | No |
| Senior Note A-2-C2 | $10,955,206 | $10,955,206 | UBS 2017-C5 | No |
| Senior Note A-2-C3 | $10,955,206 | $10,955,206 | UBS 2017-C5 | No |
| Building Note A-1-S | $11,811,959 | $11,811,959 | MSSG Trust 2017-237P | No |
| Building Note A-1-C1 | $9,593,876 | $9,593,876 | MSBAM 2017-C34 | No |
| Building Note A-1-C2 | $9,593,876 | $9,593,876 | Morgan Stanley Bank, N.A. | No |
| Building Note A-2-S | $6,360,286 | $6,360,286 | MSSG Trust 2017-237P | No |
| Building Note A-2-C1 | $6,852,279 | $6,852,279 | UBS 2017-C4 | No |
| Building Note A-2-C2 | $1,739,794 | $1,739,794 | UBS 2017-C5 | No |
| Building Note A-2-C3 | $1,739,794 | $1,739,794 | UBS 2017-C5 | No |
| Senior Note B-1-S | $193,629,711 | $193,629,711 | MSSG Trust 2017-237P | No |
| Senior Note B-2-S | $104,262,152 | $104,262,152 | MSSG Trust 2017-237P | No |
| Building Note B-1-S | $30,750,289 | $30,750,289 | MSSG Trust 2017-237P | No |
| Building Note B-2-S | $16,557,848 | $16,557,848 | MSSG Trust 2017-237P | No |
| Total | $693,200,000 | $693,200,000 | ||
| (1) | The B-Notes are subordinate to the A-Notes. |
| (2) | The promissory notes currently held by Société Générale and Morgan Stanley Bank, N. A. are expected to be contributed to future securitization transactions or may be otherwise transferred at any time. |
Following the lockout period, on any date before February 9, 2027, the 237 Park Avenue Borrower has the right to defease the 237 Park Avenue Whole Loan in whole, but not in part. The lockout period will expire on the earlier to occur of (i) two years after the closing date of the securitization that includes the last 237 Park Avenue Whole Loan note to be securitized or (ii) 36 months after loan origination. The 237 Park Avenue Whole Loan is prepayable without penalty on or after February 9, 2027.
THE INFORMATION IN THIS COLLATERAL TERM SHEET IS NOT COMPLETE AND MAY BE AMENDED PRIOR TO THE TIME OF SALE. THIS TERM SHEET IS NOT AN OFFER TO SELL THESE SECURITIES AND IT IS NOT A SOLICITATION OF AN OFFER TO BUY THESE SECURITIES IN ANY JURISDICTION WHERE THE OFFER OR SALE IS NOT PERMITTED.
71
237 Park Avenue New York, NY 10017 | Collateral Asset Summary – Loan No. 8 237 Park Avenue | Cut-off Date Balance: Cut-off Date LTV Ratio: UW NCF DSCR: UW NOI Debt Yield: | $25,390,000 26.6% 4.10x 16.4% |
The Borrowers and the Borrower Sponsors.The borrowers are 237 Park Owner LLC (the “237 Park Avenue Fee Borrower”) and 237 Park LH Owner LLC (the “237 Park Avenue Declarant Borrower”, together with the 237 Park Avenue Fee Borrower, the “237 Park Avenue Borrower”), a wholly owned subsidiary of the 237 Park Avenue Fee Borrower, each a Delaware limited liability company and single purpose entity with two independent directors. Legal counsel to the 237 Park Avenue Borrower delivered a non-consolidation opinion in connection with the origination of the 237 Park Avenue Whole Loan.
The nonrecourse carve-out guarantors are RXR Real Estate Value Added Fund LP, RXR Real Estate Value Added Fund Parallel LP, RXR Real Estate Value Added Fund Parallel II LP, RXR Real Estate Value Added Fund Parallel II (REIT) LP and RXR Real Estate Value Added Fund Parallel III LP, each a Delaware limited partnership, Walton Street Real Estate Partners VII, L.P., Walton Street Real Estate Fund VII-Q, L.P., Walton Street Real Estate Fund VII-NUS-SRD, L.P., Walton Street Real Estate Fund VII, L.P., Walton Street Real Estate Fund VII-E, L.P., Walton Street Real Estate Investors VII, L.P., Walton Street Real Estate Partners VII-NGE, L.P. and WSC Capital Holdings VII, L.P., each a Delaware limited partnership. The guarantors are affiliates of the borrower sponsors, RXR Realty Inc. (“RXR”) and Walton Street Capital LLC (“Walton Street”).
RXR is a fully-integrated real estate company with expertise in investment management, property management, development, design, construction, leasing and financing with a core focus on the New York Tri-State area with investments in properties valued at $15.4 billion encompassing 23.0 million SF.
Walton Street is a private equity real estate investment firm. Since its founding in 1994, affiliates of Walton Street have received total equity commitments of over $8.4 billion from public and corporate pension plans, foreign institutions, insurance companies and banks, endowments and foundations, trusts, and high net worth individuals. Affiliates of Walton Street have invested and/or committed to invest over $7.5 billion of equity in more than 300 separate transactions.
The Property. The 237 Park Avenue Property is a 21-story Class A office building comprised of approximately 1,251,717 SF, including approximately 19,618 SF of ground floor retail space. The 237 Park Avenue is located on the entire city block bound by Lexington Avenue and Park Avenue between 45th and 46th Streets in Midtown Manhattan, adjacent to Grand Central Terminal which provides access to transportation including subway service along the nearby 4, 5, 6, 7 and S lines and Metro-North Railroad. Penn Station and the Port Authority are also accessible via the subway, connecting the 237 Park Avenue Property to all major rail lines in the tri-state area, namely the Long Island Rail Road and New Jersey Transit. Originally built in 1914, the 237 Park Avenue Property was redeveloped into its current structure in 1981, and underwent a $65.8 million renovation and repositioning between 2013 and March 2017. The renovation included office floor repositioning and a complete redevelopment of the 237 Park Avenue Property’s entrances, lobby, atrium and retail component, including the renovation of a retail space along an outdoor public plaza on the western side of the 237 Park Avenue Property (“Depew Place”) as well as landlord improvements to tenant-specific spaces.
As of June 29, 2017, the 237 Park Avenue Property was 95.6% leased, with the office portion being 97.2% leased by a roster of tenants, with concentrations in the healthcare, financial services, advertising and government sectors. Approximately 92.8% of the 237 Park Avenue Property’s net rentable area (“NRA”) is leased by investment grade tenants, which contribute approximately 97.9% of the 237 Park Avenue Property’s underwritten gross rent. The 237 Park Avenue Property averaged occupancy of 92.6% from 2006 through 2012. After acquiring the 237 Park Avenue Property in October 2013, the borrower sponsors commenced a $65.8 million renovation and repositioning of the 237 Park Avenue Property, which was completed in March 2017. As part of the repositioning plan, the borrower sponsors vacated all of the retail space at Depew Place in order to renovate Depew Place and partially reconfigure the lobby.
Since November 1, 2015, the borrower sponsors have been able to either renew existing tenants or sign new leases for 62.0% of the 237 Park Avenue Property. As of June 29, 2017, the weighted average remaining lease term at the 237 Park Avenue Property was 17.5 years. In June 2017, NYP (38.3% of GLA, 37.0% of underwritten base rent) executed an agreement whereby NYP would occupy space at the 237 Park Avenue Property for at least 31.5 years. Headquartered at the 237 Park Avenue Property since 1979, J. Walter Thompson (“JWT”) (15.4% of GLA, 15.9% of underwritten base rent) signed a 10.4-year extension that commenced in January 2017. Her Majesty the Queen in Right of Canada (5.8% of GLA, 6.9% of underwritten base rent) signed a 21-year lease in August 2016.
The condominium units included in the collateral for the 237 Park Avenue Whole Loan are subject to a ground lease between the 237 Park Avenue Fee Borrower, as ground lessor, and the 237 Park Avenue Declarant Borrower, as ground lessee. The ground lease expires on April 27, 2057. The 237 Park Avenue Declarant Borrower is obligated to pay a base rent of $10.00per annum for the entire term of the ground lease.
Major Tenants.
The New York and Presbyterian Hospital (479,016 SF, 38.3% of NRA, 37.0% of underwritten base rent). NYP is a comprehensive, integrated academic health care delivery system provider, which delivers quality care and service to patients in the New York metro area. Altogether the NYP campuses handle over 2.2 million outpatient and inpatient visits each year, including inpatient admissions and more than 286,000 emergency room visits and over 15,000 birth deliveries. The facilities employ a total of more than 23,700 people, including approximately 6,500 physicians.
On May 15, 2017, NYP executed an agreement to purchase and hold a leasehold condominium interest in a portion of the 237 Park Avenue Property for a term of 31.5 years, subject to a 10-year (or two five-year) extension term(s), which purchase was completed on June 29, 2017. The units encompass the entire 5th, 9th, 10th, 11th, 14th, 15th and 16th floors of the 237 Park Avenue Property and a portion of the 13th (collectively, the “NYP Unit”). The purchase price for the NYP Unit is required to be paid in monthly installments pursuant to a purchase money note, secured by a purchase money mortgage. In addition to the monthly payments under the purchase money note, NYP will also be responsible for NYP’spro rata share of operating expenses of the 237 Park Avenue Property payable to the condo association in accordance with the terms of the condominium documents. NYP will not be required to make payments under the purchase money note and purchase money mortgage until January 12, 2019. Assignments of the purchase money note, the purchase money mortgage note and the purchase documents relating to NYP’s purchase of condominium units are included in the collateral for the 237 Park Avenue Mortgage Loan.
At origination, approximately $87.0 million of tenant improvement, leasing commission and landlord work obligations costs remained with respect to NYP, of which $13.4 million was drawn at loan origination and the remaining $73.6 million was escrowed. There are also approximately $1.5 million of tenant allowances that were not escrowed.
THE INFORMATION IN THIS COLLATERAL TERM SHEET IS NOT COMPLETE AND MAY BE AMENDED PRIOR TO THE TIME OF SALE. THIS TERM SHEET IS NOT AN OFFER TO SELL THESE SECURITIES AND IT IS NOT A SOLICITATION OF AN OFFER TO BUY THESE SECURITIES IN ANY JURISDICTION WHERE THE OFFER OR SALE IS NOT PERMITTED.
72
237 Park Avenue New York, NY 10017 | Collateral Asset Summary – Loan No. 8 237 Park Avenue | Cut-off Date Balance: Cut-off Date LTV Ratio: UW NCF DSCR: UW NOI Debt Yield: | $25,390,000 26.6% 4.10x 16.4% |
JP Morgan Chase (254,585 SF, 20.3% of NRA, 23.8% of underwritten base rent). Founded in 1823 and headquartered in New York City, JP Morgan Chase (“JPM”) is one of the largest financial services firms in the world. The company has more than 5,350 bank branches across the U.S. and is also among the nation’s largest mortgage lenders and credit card issuers. Active in approximately 60 countries, the company also boasts formidable investment banking and asset management operations.
J. Walter Thompson (192,733 SF, 15.4% of NRA, 15.9% of underwritten base rent). JWT is a wholly owned subsidiary of WPP Group, a world-wide leader in marketing communications. Established in 1864 and headquartered at the 237 Park Avenue Property since 1979, JWT has more than 200 offices in over 90 countries, employing nearly 10,000 marketing professionals. WPP Group reported 2016 revenues of £14.4 billion (a 17.6% year-over-year increase) with over 205,000 employees in 3,000 offices in 112 countries.
Jennison Associates (162,764 SF, 13.0% of NRA, 14.4% of underwritten base rent). Jennison Associates (“Jennison”) is an indirect wholly owned subsidiary of Prudential Financial, Inc. Founded in 1969, Jennison manages equity, fixed income and multi-asset portfolios across several styles, geographies and capitalizations. With roughly 347 employees in two offices, Jennison is responsible for $164.3 billion in assets under management as of March 31, 2017. Jennison, a tenant at the 237 Park Avenue Property since 1982, signed an extension term through February 28, 2025, which commences March 1, 2020 and includes tenant improvement allowance of approximately $3.0 million, which Jennison may elect to receive as a credit against future rent payments.
Her Majesty the Queen in Right of Canada (72,901 SF, 5.8% of NRA, 6.9% of underwritten base rent). The 237 Park Avenue Property is home to the Permanent Mission of Canada to the United Nations and the Consulate General of Canada in New York, both of which recently consolidated into the 237 Park Avenue Property, on a lease through October 1, 2037, from their former locations. The consulate general is a satellite office of Canada’s embassy to the United States, located in Washington D.C. Her Majesty the Queen in Right of Canada signed a 21-year lease in August 2016 that allows for free rent through November 1, 2017 and has approximately $7.2 million of tenant improvement allowance, leasing commission and landlord work remaining, which was escrowed at origination.
The following table presents certain information relating to the leases at the 237 Park Avenue Property:
| Tenant Summary(1) | |||||||
| Tenant Name | Credit Rating (Fitch/Moody’s/S&P)(2) | Tenant SF(3) | Approximate % of SF(3) | Annual UW Base Rent | % of Total Annual UW Base Rent | Annual UW Base Rent PSF(4) | Lease Expiration |
| Tenants | |||||||
| The New York and Presbyterian Hospital(3) | NR/AA/Aa3 | 479,016 | 38.3% | $31,136,040 | 37.0% | $65.00 | 12/29/2048 |
| JP Morgan Chase(4) | A-/A+/A3 | 254,585 | 20.3% | $20,011,417 | 23.8% | $78.60 | 7/31/2020 |
| J. Walter Thompson | BBB /BBB+/NR | 192,733 | 15.4% | $13,346,760 | 15.9% | $69.25 | 5/31/2027 |
| Jennison Associates | A/A-/Baa1 | 162,764 | 13.0% | $12,129,119 | 14.4% | $74.52 | 2/28/2025 |
| Her Majesty the Queen in Right of Canada(5) | AAA/AAA/Aaa | 72,901 | 5.8% | $5,777,263 | 6.9% | $79.25 | 10/31/2037 |
| Convene | NR/NR/NR | 29,805 | 2.4% | $1,533,464 | 1.8% | $51.45 | 2/28/2027 |
| Hale & Hearty | NR/NR/NR | 1,893 | 0.2% | $166,376 | 0.2% | $87.89 | 11/30/2030 |
| Tobmar International | NR/NR/NR | 400 | 0.0% | $33,116 | 0.0% | $82.79 | 3/31/2024 |
| Subtotal/Wtd. Avg. | 1,194,097 | 95.4% | $84,133,554 | 100.0% | $70.46 | ||
| Management Office Space | 2,050 | 0.2% | $0 | 0.0% | $0.00 | ||
| Vacant Space | 55,570 | 4.4% | $0 | 0.0% | $0.00 | ||
| Total/Wtd. Avg.(6) | 1,251,717 | 100.0% | $84,133,554 | 100.0% | $70.46 | ||
| (1) | Based on the underwritten rent roll dated June 29, 2017. |
| (2) | Ratings provided are for the parent company of the entity listed in the “Tenant Name” field whether or not the parent company guarantees the lease. |
| (3) | NYP’s lease commenced June 29, 2017. NYP does not yet occupy its space and is expected to commence paying rent in January 2019. |
| (4) | JPM currently occupies 79,562 SF of its premise and subleases 58,654 SF to Stifel, Nicolaus & Company, Incorporated. 116,369 SF is dark. |
| (5) | Her Majesty the Queen in Right of Canada is in a free rent period and is expected to commence paying rent November 1, 2017. |
| (6) | Annual UW Base Rent PSF excludes vacant space and management office space. |
THE INFORMATION IN THIS COLLATERAL TERM SHEET IS NOT COMPLETE AND MAY BE AMENDED PRIOR TO THE TIME OF SALE. THIS TERM SHEET IS NOT AN OFFER TO SELL THESE SECURITIES AND IT IS NOT A SOLICITATION OF AN OFFER TO BUY THESE SECURITIES IN ANY JURISDICTION WHERE THE OFFER OR SALE IS NOT PERMITTED.
73
237 Park Avenue New York, NY 10017 | Collateral Asset Summary – Loan No. 8 237 Park Avenue | Cut-off Date Balance: Cut-off Date LTV Ratio: UW NCF DSCR: UW NOI Debt Yield: | $25,390,000 26.6% 4.10x 16.4% |
The following table presents certain information relating to the lease rollover schedule at the 237 Park Avenue Property:
| Lease Rollover Schedule(1)(2) | ||||||||
| Year | # of Leases Rolling | SF Rolling | Approx. % of Total SF Rolling | Approx. Cumulative % of SF Rolling | UW Base Rent PSF Rolling(4) | Total UW Base Rent Rolling(4) | Approx. % of Total Base Rent Rolling | Approx. Cumulative % of Total Base Rent Rolling |
| MTM | 1 | 2,050 | 0.2% | 0.2% | $0.00 | $0 | 0.0% | 0.0% |
| 2017 | 0 | 0 | 0.0% | 0.2% | $0.00 | $0 | 0.0% | 0.0% |
| 2018 | 0 | 0 | 0.0% | 0.2% | $0.00 | $0 | 0.0% | 0.0% |
| 2019 | 0 | 0 | 0.0% | 0.2% | $0.00 | $0 | 0.0% | 0.0% |
| 2020(3) | 4 | 254,585 | 20.3% | 20.5% | $78.60 | $20,011,417 | 23.8% | 23.8% |
| 2021 | 0 | 0 | 0.0% | 20.5% | $0.00 | $0 | 0.0% | 23.8% |
| 2022 | 0 | 0 | 0.0% | 20.5% | $0.00 | $0 | 0.0% | 23.8% |
| 2023 | 0 | 0 | 0.0% | 20.5% | $0.00 | $0 | 0.0% | 23.8% |
| 2024 | 1 | 400 | 0.0% | 20.5% | $82.79 | $33,116 | 0.0% | 23.8% |
| 2025 | 5 | 162,764 | 13.0% | 33.5% | $74.52 | $12,129,119 | 14.4% | 38.2% |
| 2026 | 0 | 0 | 0.0% | 33.5% | $0.00 | $0 | 0.0% | 38.2% |
| 2027 | 3 | 222,538 | 17.8% | 51.3% | $66.87 | $14,880,224 | 17.7% | 55.9% |
| 2028 & Beyond | 11 | 553,810 | 44.2% | 95.5% | $66.95 | $37,079,679 | 44.0% | 100.0% |
| Vacant | 0 | 55,570 | 4.4% | 100.0% | $0.00 | $0 | 0.0% | 100.0% |
| Total/Wtd. Avg. | 25 | 1,251,717 | 100.0% | $70.46 | $84,133,554 | 100.0% | ||
| (1) | Based on the underwritten rent roll dated June 29, 2017. |
| (2) | Certain tenants may have termination or contraction options (which may become exercisable prior to the originally stated expiration date of the tenant lease) that are not considered in the above Lease Rollover Schedule. |
| (3) | JPM currently occupies 79,562 SF of its premise and subleases 58,654 SF to Stifel, Nicolaus & Company, Incorporated. 116,369 SF is dark. |
| (4) | UW Base Rent PSF Rolling and Total UW Base Rent Rolling exclude vacant space and management office space. |
The Market.The 237 Park Avenue Property is situated on the entire city block bounded by Park Avenue, Lexington Avenue, East 45th Street and East 46th Street in the Plaza District neighborhood of Midtown Manhattan (the “Neighborhood”), which is home to the headquarters of 28 Fortune 500 companies. The Neighborhood is comprised of many of New York’s well-known landmarks, restaurants, hotels, retail shops and tourist attractions including Grand Central Terminal, Fifth Avenue, St. Patrick’s Cathedral, and Rockefeller Center, and is within short walking distance to the United Nations, Radio City Music Hall, the Museum of Modern Art, the New York Public Library, and Central Park. The Neighborhood is accessible via several transportation hubs, contributing to the appeal for a diverse array of businesses including domestic and international banking, legal services, manufacturing, securities/holdings, printing and publishing, advertising, and communications.
According to the appraisal, the 237 Park Avenue Property is located within the Park Avenue submarket of the larger Midtown Manhattan office market and is considered to be one of the premier office corridors in the United States due to its central location, strength of its tenant base, proximity to Grand Central Terminal and other amenities. As of the first quarter 2017, the Class A office space in the Neighborhood had a direct vacancy rate of 9.4% and average asking rents of $99.69 PSF, above the direct primary Midtown Manhattan average of $88.93 PSF. According to the appraisal, as of the first quarter 2017, the Park Avenue submarket consisted of approximately 21.8 million SF of Class A office space and had a direct vacancy rate of 9.2% and overall direct weighted average asking rents of $101.41 PSF.
The appraisal identified 10 comparable recent office leases ranging in tenant size from 13,389 SF to 219,000 SF. The comparable leases are all located in buildings similar in class to the 237 Park Avenue Property, and are in the 237 Park Avenue Property’s general competitive market according to the appraisal. The comparable leases have terms ranging from 5.5 to 15 years and exhibit a range of rents from $72.50 PSF to $108.50 PSF, with an average of $82.20 PSF, prior to adjustments. After adjustments for rent concessions, the comparables’ rents range from $75.93 PSF to $108.37 PSF, with an average of $86.72 PSF. Free rent concessions ranged from 3 to 14 months. Tenant improvement allowances ranged from $30.00 PSF to $115.00 PSF.
The appraisal identified 35 comparable office properties totaling approximately 32.5 million SF that exhibited a gross rental range of $55.00 PSF to $185.00 PSF and a weighted average occupancy rate of approximately 91.7% for direct space. Of the 35 buildings surveyed, six are considered directly competitive with the 237 Park Avenue Property in terms of building classification, asking rents, rentable office area and current occupancy. The directly competitive properties exhibited a gross rental range of $65.00 PSF to $105.00 PSF and a weighted average direct occupancy of approximately 94.1%, compared to 91.7% for all competitive buildings compared with the 237 Park Avenue Property, and 91.3% for Class A space within Midtown as a whole.
| Historical and Current Occupancy(1) | |||||||||||
| 2006 | 2007 | 2008 | 2009 | 2010 | 2011 | 2012 | 2013 | 2014 | 2015 | 2016 | 6/29/2017(2) |
| 98.7% | 98.7% | 98.7% | 94.6% | 89.2% | 87.4% | 81.0% | 79.9% | 75.8% | 63.1% | 63.5% | 95.6% |
| (1) | Based on annual average occupancy except for 2013 occupancy, which reflects occupancy at year end and unless otherwise specified. |
| (2) | The increase in occupancy is due to a new lease, in which NYP leases 479,016 SF or 38.3% of net rentable area for a period of 30 years. |
The appraisal identified 35 comparable office properties totaling approximately 32.5 million SF that exhibited a gross rental range of $55.00 PSF to $185.00 PSF and a weighted average occupancy rate of approximately 91.7% for direct space.
Of the 35 buildings surveyed, six are considered directly competitive with the 237 Park Avenue Property in terms of building classification, asking rents, rentable office area and current occupancy. The directly competitive properties exhibited a gross rental range of $65.00 PSF to $105.00 PSF and a
THE INFORMATION IN THIS COLLATERAL TERM SHEET IS NOT COMPLETE AND MAY BE AMENDED PRIOR TO THE TIME OF SALE. THIS TERM SHEET IS NOT AN OFFER TO SELL THESE SECURITIES AND IT IS NOT A SOLICITATION OF AN OFFER TO BUY THESE SECURITIES IN ANY JURISDICTION WHERE THE OFFER OR SALE IS NOT PERMITTED.
74
237 Park Avenue New York, NY 10017 | Collateral Asset Summary – Loan No. 8 237 Park Avenue | Cut-off Date Balance: Cut-off Date LTV Ratio: UW NCF DSCR: UW NOI Debt Yield: | $25,390,000 26.6% 4.10x 16.4% |
weighted average direct occupancy of approximately 94.1%, compared to 91.7% for all competitive buildings compared with the 237 Park Avenue Property, and 91.3% for Class A space within Midtown as a whole.
The following table presents certain information relating to the directly competitive buildings at the 237 Park Avenue Property:
| Directly Competitive Buildings | |||||||
| Property | Office Area (NRA) | Direct Available SF | Sublease Available SF | % Occupied (Direct) | % Occupied (Total) | Direct Asking Rent (PSF)(2) | |
| Low | High | ||||||
| 90 Park Avenue | 785,000 | 31,072 | 7,090 | 96.0% | 95.1% | $89.00 | $95.00 |
| 100 Park Avenue | 825,815 | 86,149 | 0 | 89.6% | 89.6% | $70.00 | $85.00 |
| 200 Park Avenue | 2,254,274 | 88,047 | 0 | 96.1% | 96.1% | $86.00 | $96.00 |
| 230 Park Avenue | 1,335,947 | 114,540 | 13,194 | 91.4% | 90.4% | $78.00 | $105.00 |
| 330 Madison Avenue | 717,443 | 27,655 | 6,075 | 96.1% | 95.3% | $81.00 | $90.00 |
| 340 Madison Avenue | 714,869 | 41,150 | 10,872 | 94.2% | 92.9% | $65.00 | $75.00 |
| Total/Wtd. Avg. | 6,633,348 | 388,613 | 37,231 | 94.1% | 93.6% | $65.00 | $105.00 |
Source:Appraisal
| (1) | Total/Wtd. Avg. Direct Asking Rent (PSF) Low and High for the competitive set represent the minimum and maximum asking rent among the directly competitive buildings to the 237 Park Avenue Property. |
Operating History and Underwritten Net Cash Flow.The following table presents certain information relating to the historical operating performance and the Underwritten Net Cash Flow at the 237 Park Avenue Property:
| Cash Flow Analysis | |||||
| 2014 | 2015 | 2016 | UW | UW PSF(1) | |
| Rents in Place(1) | $54,714,662 | $44,225,564 | $44,924,392 | $84,133,554 | $67.21 |
| Vacant Income | $0 | $0 | $0 | $0 | $0.00 |
| IG Tenant Rent Steps(2) | $0 | $0 | $0 | $1,133,398 | $0.91 |
| Gross Potential Rent(3) | $54,714,662 | $44,225,564 | $44,924,392 | $85,266,952 | $68.12 |
| Total Reimbursements(4) | $5,785,750 | $3,118,477 | $3,845,113 | $2,597,181 | $2.07 |
| Less Vacancy & Credit Loss | $0 | $0 | $0 | $0 | $0.00 |
| Other Income(5) | $1,740,592 | $1,662,309 | $1,672,279 | $1,039,742 | $0.83 |
| Effective Gross Income | $62,241,004 | $49,006,350 | $50,441,783 | $88,903,875 | $71.03 |
| Total Operating Expenses | $29,847,060 | $29,516,874 | $30,595,950 | $31,737,396 | $25.36 |
| Net Operating Income(6) | $32,393,944 | $19,489,476 | $19,845,834 | $57,166,479 | $45.67 |
| Capital Expenditures | $0 | $0 | $0 | $312,929 | $0.25 |
| TI/LC | $0 | $0 | $0 | $2,608,515 | $2.08 |
| Net Cash Flow(6) | $32,393,944 | $19,489,476 | $19,845,834 | $54,245,035 | $43.34 |
| Occupancy % | 75.8% | 63.1% | 63.5% | 95.6% | |
| NOI DSCR(7) | 2.45x | 1.47x | 1.50x | 4.32x | |
| NCF DSCR(7) | 2.45x | 1.47x | 1.50x | 4.10x | |
| NOI Debt Yield(7) | 9.3% | 5.6% | 5.7% | 16.4% | |
| NCF Debt Yield(7) | 9.3% | 5.6% | 5.7% | 15.6% | |
| (1) | Underwritten Rents in Place is based on the rent roll as of June 1, 2017, and includes rent steps of $143,596 through July 1, 2018. |
| (2) | Net present value step rent credit for two investment-grade tenants (NYP and Her Majesty the Queen in Right of Canada) through the tenants’ lease expirations. |
| (3) | No straight line rent credit has been assumed. |
| (4) | Underwritten Total Reimbursements is based on the current rent roll and includes utility reimbursements. Breakdown of recoveries in 2017 Budget is based on the breakdown in underwritten recoveries for presentation purposes. Actual breakdown of 2017 Budget recoveries is not available. |
| (5) | UW Other Income and UW PSF Other Income have been underwritten based on the Year 1 Projections. |
| (6) | The increase in UW Net Operating Income and UW Net Cash Flow is due a new lease, in which NYP leased 479,016 SF or 35.9% of underwritten base rent for a period of 30-years bringing the overall occupancy to 95.6%. |
| (7) | Debt service coverage ratios and debt yields are based on the 237 Park Avenue Mortgage Loan and the 237 Park Avenue Pari Passu Companion Loan in the aggregate. |
Escrows and Reserves.The 237 Park Avenue Whole Loan documents provide for upfront escrows in the amount of $7,500,000 for interest payments in addition to the $8,500,000 delivered by 237 Park Avenue Borrower in the form of three letters of credit and $81,365,605 for outstanding tenant improvements, leasing commissions and contractor work. The 237 Park Avenue Whole Loan documents also provide for ongoing monthly reserve deposits of (i) 1/12 of the next succeeding payments for taxes and insurance (unless the 237 Park Avenue Property is insured as part of a “blanket” policy reasonably acceptable to the Lenders in which case the insurance reserve is waived), (ii) to the extent the 237 Park Avenue Property generates sufficient cash flow, springing monthly rollover reserve deposits of $156,465,provided that if a JPM Reserve Period (as defined below) is continuing such monthly amount will be reduced by $1.50 PSF of the JPM premises, (iii) an amount equal to the monthly base rent then payable by JPM (“JPM Reserve Funds”) (up to a cap in an amount equal to $60.00 PSF of the JPM premises (“JPM Reserve Cap”) as adjusted pursuant to the 237 Park Avenue Whole Loan documents) upon the occurrence of a JPM Reserve Period, (iv) to the extent the 237 Park Avenue Property generates sufficient cash flow, $20,862 for annual replacements
THE INFORMATION IN THIS COLLATERAL TERM SHEET IS NOT COMPLETE AND MAY BE AMENDED PRIOR TO THE TIME OF SALE. THIS TERM SHEET IS NOT AN OFFER TO SELL THESE SECURITIES AND IT IS NOT A SOLICITATION OF AN OFFER TO BUY THESE SECURITIES IN ANY JURISDICTION WHERE THE OFFER OR SALE IS NOT PERMITTED.
75
237 Park Avenue New York, NY 10017 | Collateral Asset Summary – Loan No. 8 237 Park Avenue | Cut-off Date Balance: Cut-off Date LTV Ratio: UW NCF DSCR: UW NOI Debt Yield: | $25,390,000 26.6% 4.10x 16.4% |
and alterations to the 237 Park Avenue Property (in the case of (i) through (iv) such amounts will be reserved during a Cash Sweep Period (as defined below)) and (v) springing Supplemental Interest Reserve Funds (as defined below) if the 237 Park Avenue Borrower incurs additional mezzanine debt or preferred equity. In addition, in the event the 237 Park Avenue Borrower receives a lease termination fee in excess of $1,000,000, the 237 Park Avenue Borrower is required to immediately deposit such lease termination fee with the Lenders to be utilized for tenant improvements, tenant improvement allowances, leasing commissions and legal costs reasonably approved by the Lenders associated with re-leasing the terminated space.
“Supplemental Interest Reserve Funds” equals an amount determined by multiplying (i) the number of monthly payment dates occurring from the date of such deposit until such time that NYP begins making rent payments by (ii) the quotient of (A) $2,000,000 if the additional mezzanine debt or preferred equity equals $69,000,000 (or, in the event the additional mezzanine debt or preferred equity is less than $69,000,000, a prorated deposit amount based on multiplying (x) the actual balance of the mezzanine debt or preferred equity by (y) the quotient obtained by dividing $2,000,000 by $69,000,000) divided by (B) eighteen.
Lockbox and Cash Management.The 237 Park Avenue Whole Loan is structured with a hard lockbox and springing cash management. The 237 Park Avenue Borrower was required to send tenant direction letters to all tenants instructing them to deposit all rents and other payments into the lockbox account controlled by the Lenders. So long as no Cash Sweep Period or JPM Reserve Period exists, funds deposited into the lockbox account will be disbursed to the 237 Park Avenue Borrower’s operating account on each business day. During a Cash Sweep Period or JPM Reserve Period, the funds in the lockbox account will be transferred to a lender-controlled cash management account to be disbursed in accordance with the 237 Park Avenue Whole Loan documents.
A “Cash Sweep Period” means a period (A) commencing upon the earliest, whether or not any Cash Sweep Period has previously occurred and ended, of (i) the occurrence of an event of default or a mezzanine event of default, or (ii) the occurrence of a Debt Yield Threshold Event (as defined below); and (B) expiring upon (x) with regard to any Cash Sweep Period commenced in connection with clause (A)(i) above, the cure (if applicable) of such event of default and/or mezzanine event of default, as the case may be, and (y) with regard to any Cash Sweep Period commenced in connection with clause (A)(ii) above, (1) the date on which the debt yield cure condition is satisfied, (2) the delivery to the Lenders and the mezzanine lenders of letters of credit inpro rataamounts which, if applied to reduce the outstanding principle balance of the 237 Park Avenue Whole Loan and the 237 Park Avenue Mezzanine Loan, respectively, would cause the debt yield cure condition to be satisfied or (3) with respect to a Debt Yield Threshold Event that resulted from a failure to satisfy the Debt Yield Threshold with respect to the cumulative mezzanine debt yield, the delivery to the mezzanine lenders of cash prepayment in the amount which, if applied to the outstanding principal balance of the 237 Park Avenue Mezzanine Loan, would cause the debt yield cure condition to be satisfied.
A “JPM Reserve Period” will commence upon the date that is 15 months prior to the expiration of the JPM lease assuming no replacement leases have been executed and delivered by the 237 Park Avenue Borrower and will terminate upon the earlier to occur of (a) the amount of JPM Reserve Funds on deposit being equal to JPM Reserve Cap, (b) the 237 Park Avenue Borrower entering into one or more replacement leases for the entire JPM premises, or (c) JPM renewing its lease for its entire leased premises.
A “Debt Yield Threshold Event” will commence upon the debt yield falling below the Debt Yield Threshold as of the last day of the calendar quarter immediately preceding the applicable date of determination. Commencing with the third quarter of calendar year 2017, within 45 days following the end of each calendar quarter, the 237 Park Avenue Borrower will calculate each debt yield specified by the Debt Yield Threshold for purposes of determining whether a Debt Yield Threshold Event has occurred and will submit such calculations to the Lenders, and such calculation will be subject to the Lenders’ reasonable approval.
The “Debt Yield Threshold” is equal to (a) 7.464% with respect to the debt yield, and (b) 6.625% with respect to the cumulative senior mezzanine debt yield.
Additional Secured Indebtedness (not including trade debts).In addition to the 237 Park Avenue Mortgage Loan, the 237 Park Avenue Property also secures the 237 Park Avenue Pari Passu Companion Loan and 237 Park Avenue Subordinate Companion Loan. The 237 Park Avenue Whole Loan is comprised of 18pari passu notes, with an aggregate outstanding principal balance of $693.2 million. The 237 Park Avenue Subordinate Companion Loan is comprised of fourpari passu notes, with an aggregate outstanding principal balance as of the Cut-off Date of $345.2 million. The controlling senior Note A-1-S, along with three other senior 237 Park Avenue Pari Passu Companion Loan notes and the 237 Park Avenue Subordinate Companion Loan, were contributed to the MSSG 2017-237P transaction, which governs the servicing and administration of the 237 Park Avenue Whole Loan and is the controlling note under the related intercreditor agreement, the rights of which will be exercised by the related trustee (or, prior to the occurrence and continuance of a control termination event under the MSSG 2017-237P Trust and Servicing Agreement, the directing certificate holder under the MSSG 2017-237P Trust and Servicing Agreement). See “Description of the Mortgage Pool—The Whole Loans—The Non-Serviced AB Whole Loans” in the Preliminary Prospectus.
Mezzanine Loan and Preferred Equity. The 237 Park Avenue Mezzanine Loan is secured by the equity in the 237 Park Avenue Fee Borrower pledged by the direct equity owners of the 237 Park Avenue Fee Borrower. The 237 Park Avenue Mezzanine Loan has an aggregate outstanding principal balance $87.8 million, has an interest-only coupon of 5.25% throughout the full term, and is coterminous with the 237 Park Avenue Whole Loan. Including the 237 Park Avenue Subordinate Companion Loan and the 237 Park Avenue Mezzanine Loan, the cumulative Cut-off Date LTV, cumulative UW NCF DSCR and cumulative UW NOI Debt Yield are 59.6%, 1.75x and 7.3%, respectively. The Lenders and the mezzanine lenders have entered into an intercreditor agreement. In addition, the 237 Park Avenue Borrower is permitted to incur additional indebtedness in the form of one mezzanine loan or preferred equity transaction in the maximum aggregate principal amount of not more than $69,000,000, contingent on the satisfaction of requirements described in the 237 Park Avenue Whole Loan documents.
Release of Property. The NYP tenant has a right of first offer to purchase any space that becomes available in the other condominium units at the 237 Park Avenue Property. If NYP exercises its right of first offer to purchase available space, the 237 Park Avenue Borrower will obtain a release of the lien of the mortgage on the applicable accepted offer space subject to the satisfaction of the conditions set forth in the loan agreement, including, without limitation, satisfaction of the closing conditions under the NYP purchase and sale agreement and the delivery of a collateral assignment of the purchase money note and purchase money mortgage relating to the accepted offer space in substantially the same form as the collateral assignment delivered to lenders at loan origination. The 237 Park Avenue Borrower is not required to pay any release price in connection with any such release as the collateral assignment of the purchase money note and purchase money mortgage serves as collateral for the accepted offer space and is not required to deliver any REMIC opinion in connection therewith.
THE INFORMATION IN THIS COLLATERAL TERM SHEET IS NOT COMPLETE AND MAY BE AMENDED PRIOR TO THE TIME OF SALE. THIS TERM SHEET IS NOT AN OFFER TO SELL THESE SECURITIES AND IT IS NOT A SOLICITATION OF AN OFFER TO BUY THESE SECURITIES IN ANY JURISDICTION WHERE THE OFFER OR SALE IS NOT PERMITTED.
76
237 Park Avenue New York, NY 10017 | Collateral Asset Summary – Loan No. 8 237 Park Avenue | Cut-off Date Balance: Cut-off Date LTV Ratio: UW NCF DSCR: UW NOI Debt Yield: | $25,390,000 26.6% 4.10x 16.4% |
Terrorism Insurance. The 237 Park Avenue Whole Loan documents require that the “all risk” insurance policy required to be maintained by the 237 Park Avenue Borrower provides coverage for terrorism in an amount equal to the full replacement cost of the 237 Park Avenue Property. The 237 Park Avenue Whole Loan documents also require loss of rent and business interruption insurance covering no less than the 24-month period following the occurrence of a casualty event, together with an extended period of indemnity endorsement which provides that after the physical loss to the improvements and personal property has been repaired, the continued loss of income will be insured until such income either returns to the same level it was at prior to the loss, or the expiration of 12 months from the date that the 237 Park Avenue Property is repaired or replaced and operations are resumed, whichever first occurs, and notwithstanding that the policy may expire prior to the end of such period; and in an amount equal to 100% of the projected gross income from the 237 Park Avenue Property for a period of 24 months.
THE INFORMATION IN THIS COLLATERAL TERM SHEET IS NOT COMPLETE AND MAY BE AMENDED PRIOR TO THE TIME OF SALE. THIS TERM SHEET IS NOT AN OFFER TO SELL THESE SECURITIES AND IT IS NOT A SOLICITATION OF AN OFFER TO BUY THESE SECURITIES IN ANY JURISDICTION WHERE THE OFFER OR SALE IS NOT PERMITTED.
77
| Totowa, NJ | Collateral Asset Summary – Loan No. 9 Totowa Commerce Center | Cut-off Date Balance: Cut-off Date LTV Ratio: UW NCF DSCR: UW NOI Debt Yield: | $25,000,000 74.8% 1.55x 9.7% |
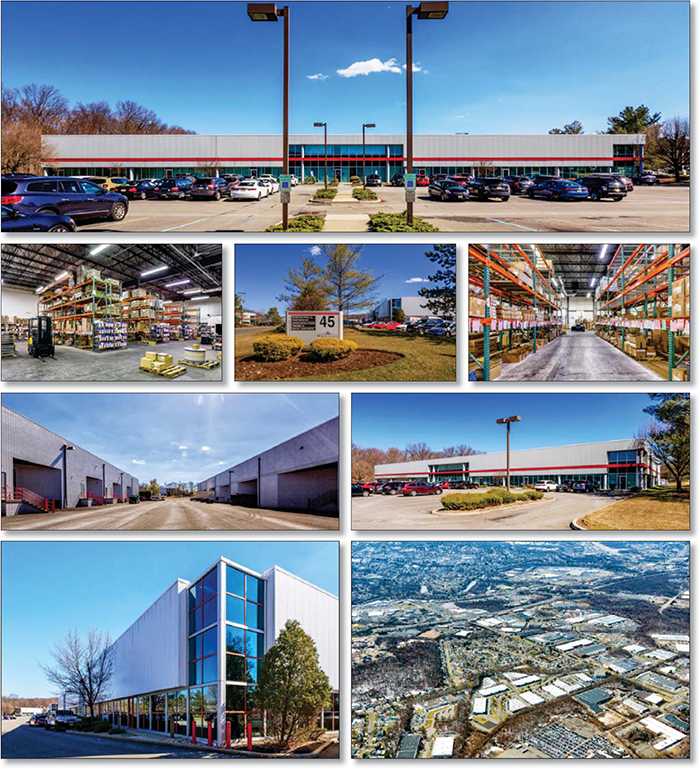
THE INFORMATION IN THIS COLLATERAL TERM SHEET IS NOT COMPLETE AND MAY BE AMENDED PRIOR TO THE TIME OF SALE. THIS TERM SHEET IS NOT AN OFFER TO SELL THESE SECURITIES AND IT IS NOT A SOLICITATION OF AN OFFER TO BUY THESE SECURITIES IN ANY JURISDICTION WHERE THE OFFER OR SALE IS NOT PERMITTED.
78
| Totowa, NJ | Collateral Asset Summary – Loan No. 9 Totowa Commerce Center | Cut-off Date Balance: Cut-off Date LTV Ratio: UW NCF DSCR: UW NOI Debt Yield: | $25,000,000 74.8% 1.55x 9.7% |
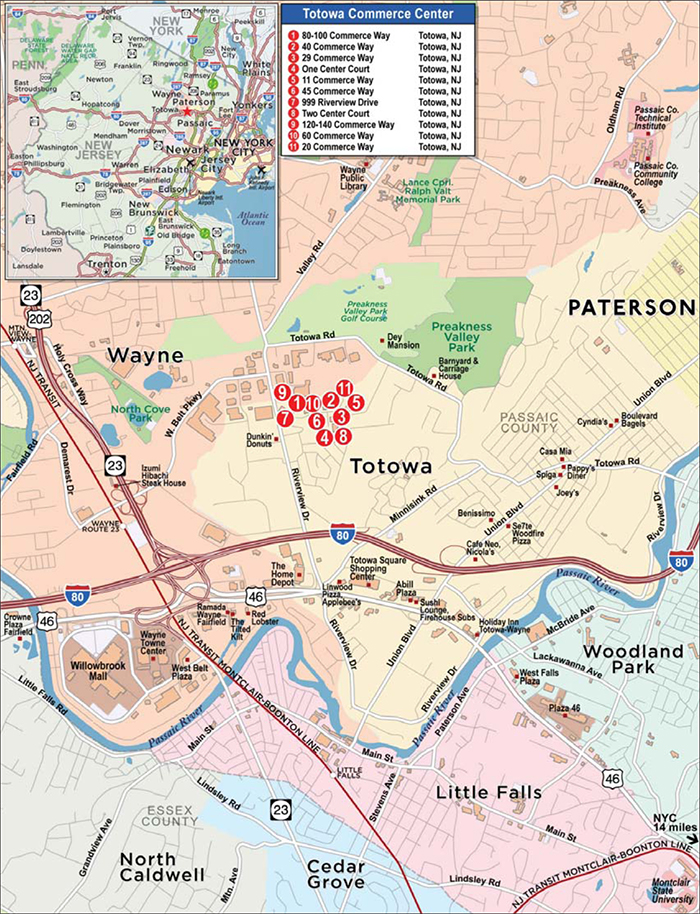
THE INFORMATION IN THIS COLLATERAL TERM SHEET IS NOT COMPLETE AND MAY BE AMENDED PRIOR TO THE TIME OF SALE. THIS TERM SHEET IS NOT AN OFFER TO SELL THESE SECURITIES AND IT IS NOT A SOLICITATION OF AN OFFER TO BUY THESE SECURITIES IN ANY JURISDICTION WHERE THE OFFER OR SALE IS NOT PERMITTED.
79
| Totowa, NJ | Collateral Asset Summary – Loan No. 9 Totowa Commerce Center | Cut-off Date Balance: Cut-off Date LTV Ratio: UW NCF DSCR: UW NOI Debt Yield: | $25,000,000 74.8% 1.55x 9.7% |
| Mortgage Loan Information | Property Information | |||||||
| Mortgage Loan Seller: | Natixis | Single Asset/Portfolio: | Portfolio | |||||
| Credit Assessment (Fitch/KBRA/Moody’s/S&P): | [ ] | Location: | Totowa, NJ | |||||
| General Property Type: | Various | |||||||
| Original Balance(1): | $25,000,000 | Detailed Property Type: | Various | |||||
| Cut-off Date Balance(1): | $25,000,000 | Title Vesting: | Fee | |||||
| % of Initial Pool Balance: | [ ]% | Year Built/Renovated: | Various | |||||
| Loan Purpose: | Acquisition | Size: | 507,779 SF | |||||
| Borrower Sponsors: | Jeffrey Greenberg; Steven Greenberg | Cut-off Date Balance per SF(1): | $102 | |||||
| Mortgage Rate: | 4.2050% | Maturity Date Balance per SF(1): | $93 | |||||
| Note Date: | 9/20/2017 | Property Manager:
| Totowa Commerce Operating, LLC
| |||||
| First Payment Date: | 11/5/2017 | |||||||
| Maturity Date: | 10/5/2027 | |||||||
| Original Term to Maturity: | 120 months | |||||||
| Original Amortization Term: | 360 months | |||||||
| IO Period: | 60 months | |||||||
| Seasoning: | 1 month | Underwriting and Financial Information | ||||||
| Prepayment Provisions: | LO (25); DEF (92); O (3) | UW NOI: | $5,035,300 | |||||
| Lockbox/Cash Mgmt Status: | Hard/Springing | UW NOI Debt Yield(1): | 9.7% | |||||
| Additional Debt Type: | Pari Passu | UW NOI Debt Yield at Maturity(1): | 10.7% | |||||
| Additional Debt Balance: | $26,750,000 | UW NCF DSCR(1): | 2.13x (IO) 1.55x (P&I) | |||||
| Future Debt Permitted (Type): | No (N/A) | Most Recent NOI: | $5,179,373 (6/30/2017 TTM) | |||||
| Reserves(2) | 2nd Most Recent NOI: | $5,126,942 (12/31/2016) | ||||||
| Type | Initial | Monthly | Cap | 3rd Most Recent NOI: | $5,098,479 (12/31/2015) | |||
| RE Tax: | $0 | $117,676 | N/A | Most Recent Occupancy(3): | 85.5% (7/24/2017) | |||
| Insurance: | $13,553 | $13,553 | N/A | 2nd Most Recent Occupancy: | 90.9% (12/31/2016) | |||
| Replacements: | $0 | $7,061 | (2) | 3rd Most Recent Occupancy: | 92.6% (12/31/2015) | |||
| Deferred Maintenance: | $15,438 | $0 | N/A | Appraised Value (as of)(4): | $69,150,000 (8/2/2017) | |||
| TI/LC: | $702,638 | $21,157 | (2) | Cut-off Date LTV Ratio(1): | 74.8% | |||
| Free Rent: | $83,262 | $0 | N/A | Maturity Date LTV Ratio(1): | 68.2% | |||
| Sources and Uses | ||||||
| Sources | Proceeds | % of Total | Uses | Proceeds | % of Total | |
| Loan Amount: | $51,750,000 | 75.5% | Purchase Price: | $66,500,000 | 97.0% | |
| Borrower Equity: | $16,780,111 | 24.5% | Reserves: | $814,891 | 1.2% | |
| Closing Costs: | $1,215,221 | 1.8% | ||||
| Total Sources: | $68,530,111 | 100.0% | Total Uses: | $68,530,111 | 100.0% | |
| (1) | The Totowa Commerce Center Mortgage Loan (as defined below) is part of the Totowa Commerce Center Whole Loan (as defined below), which is comprised of twopari passu promissory notes with an aggregate original principal balance of $51,750,000. The Cut-off Date Balance per SF, Maturity Date Balance per SF, UW NOI Debt Yield, UW NOI Debt Yield at Maturity, UW NCF DSCR, Cut-off Date LTV Ratio and Maturity Date LTV Ratio presented above are based on the Totowa Commerce Center Whole Loan. |
| (2) | See“Escrows and Reserves”below for further discussion of reserve requirements. |
| (3) | The Totowa Commerce Center Portfolio (as defined below) is 89.4% leased as of July 24, 2017. Most recent occupancy does not include space leased to Atlantic Inertial Systems Inc. (“Atlantic Inertial”) (3.9% of NRA), as the tenant is currently dark. |
| (4) | The appraised value includes the value of a 5.8-acre vacant land parcel, valued at $750,000. |
The Mortgage Loan. The ninth largest mortgage loan (the “Totowa Commerce Center Mortgage Loan”) is part of a whole loan (the “Totowa Commerce Center Whole Loan”) evidenced by twopari passupromissory notes with an aggregate original principal balance of $51,750,000. The Totowa Commerce Center Whole Loan is secured by a first priority fee mortgage encumbering a 507,779 SF, eleven-property portfolio consisting of ten industrial flex properties and one office property, located in Totowa, New Jersey (each a “Totowa Commerce Center Property”, and collectively, the “Totowa Commerce Center Properties” or the “Totowa Commerce Center Portfolio”). Promissory Note A-1, with an original principal balance of $25,000,000, represents the Totowa Commerce Center Mortgage Loan and will be included in the UBS 2017-C5 Trust. Promissory Note A-2, with an original principal balance of $26,750,000, is currently held by Natixis, and is expected to be contributed to one or more future securitization trusts. See “Description of the Mortgage Pool—The Whole Loans—The Serviced Pari Passu Whole Loans”in the Preliminary Prospectus.
| Totowa Commerce Center Whole Loan Summary | ||||
| Note | Original Balance | Cut-off Date Balance | Anticipated Note Holder | Controlling Piece |
| Note A-1 | $25,000,000 | $25,000,000 | UBS 2017-C5 | Yes |
| Note A-2 | $26,750,000 | $26,750,000 | Natixis | No |
| Total | $51,750,000 | $51,750,000 | ||
THE INFORMATION IN THIS COLLATERAL TERM SHEET IS NOT COMPLETE AND MAY BE AMENDED PRIOR TO THE TIME OF SALE. THIS TERM SHEET IS NOT AN OFFER TO SELL THESE SECURITIES AND IT IS NOT A SOLICITATION OF AN OFFER TO BUY THESE SECURITIES IN ANY JURISDICTION WHERE THE OFFER OR SALE IS NOT PERMITTED.
80
| Totowa, NJ | Collateral Asset Summary – Loan No. 9 Totowa Commerce Center | Cut-off Date Balance: Cut-off Date LTV Ratio: UW NCF DSCR: UW NOI Debt Yield: | $25,000,000 74.8% 1.55x 9.7% |
The proceeds of the Totowa Commerce Center Whole Loan, together with $16,780,111 of borrower equity, were used to acquire the Totowa Commerce Center Properties, fund reserves and pay closing costs.
Following the lockout period, the Totowa Commerce Center Borrowers (as defined below) have the right to defease the Totowa Commerce Center Whole Loan in whole or in part (see “Release of Property” section) on any date before August 5, 2027. The lockout period will expire on the earlier to occur of (i) two years after the closing date of the securitization that includes the last Totowa Commerce Center Whole Loan note to be securitized or (ii) four years after the Totowa Commerce Center Whole Loan origination. In addition, the Totowa Commerce Center Whole Loan is prepayable without penalty on or after August 5, 2027.
The Borrowers and the Borrower Sponsors.The borrowers are Totowa Beacon LLC, Totowa II LLC, Totowa III, LLC and Totowa IV, LLC (collectively, the “Totowa Commerce Center Borrowers”), four tenants-in-common, each a Delaware limited liability company. Each tenant-in-common is a single purpose entity, and the managing members of each tenant-in-common are the guarantors of certain nonrecourse carveouts under the Totowa Commerce Center Whole Loan. Legal counsel to the Totowa Commerce Center Borrowers delivered a non-consolidation opinion in connection with the origination of the Totowa Commerce Center Whole Loan.
The borrower sponsors are Jeffrey Greenberg and Steven Greenberg. The borrower sponsors are the principals of Heritage Capital Group, LLC, a real estate investment, development and management company that has been in business for over seventy years and three generations. Heritage Capital Group, LLC has owned and managed properties in twenty states ranging from multi-tenant industrial, multi-tenant office, multi-tenant retail, large single-tenanted buildings and multifamily properties. As of June 1, 2017, the borrower sponsors have a total net worth and liquidity of $61.7 million and $16.1 million, respectively.
The Properties.The Totowa Commerce Center Properties consist of ten industrial flex properties and one office property located in Totowa, New Jersey. The Totowa Commerce Center Properties are 89.4% leased and 85.5% occupied as of July 24, 2017 by 47 tenants. The Totowa Commerce Center Properties were built between 1987 and 1999, and the borrower sponsors have invested $771,536 in capital expenditures since 2014. The Totowa Commerce Center Properties have a granular rent roll, with no tenant accounting for greater than 6.1% of NRA or 7.5% of underwritten base rent.
The following table presents certain information relating to the Totowa Commerce Center Properties:
| Property Summary | ||||||||
| Property Name | Location | Year Built/ Renovated | Net Rentable Area (SF)(1) | % Office | Allocated Cut-off Date Balance(2) | % of Allocated Cut-off Date Balance | Appraised Value | Occupancy(1)(3) |
| 11 Commerce Way | Totowa, NJ | 1989/N/A | 47,207 | 72.0% | $2,985,105 | 11.9% | $8,040,312 | 100.0% |
| 20 Commerce Way | Totowa, NJ | 1992/N/A | 44,894 | 83.0% | $690,536 | 2.8% | $1,859,944 | 46.3% |
| 29 Commerce Way | Totowa, NJ | 1990/N/A | 50,969 | 63.0% | $3,158,967 | 12.6% | $8,508,607 | 100.0% |
| 40 Commerce Way | Totowa, NJ | 1987/N/A | 50,822 | 69.0% | $3,174,448 | 12.7% | $8,550,304 | 100.0% |
| 45 Commerce Way | Totowa, NJ | 1992/2016 | 51,849 | 51.0% | $2,787,605 | 11.2% | $7,508,352 | 100.0% |
| 60 Commerce Way | Totowa, NJ | 1988/2016 | 50,943 | 70.0% | $705,669 | 2.8% | $1,900,703 | 43.6% |
| 80-100 Commerce Way | Totowa, NJ | 1996/N/A | 47,294 | 84.0% | $3,265,515 | 13.1% | $8,795,591 | 100.0% |
| 120-140 Commerce Way | Totowa, NJ | 1994/N/A | 35,765 | 72.0% | $1,565,035 | 6.3% | $4,215,386 | 77.0% |
| One Center Court | Totowa, NJ | 1999/N/A | 39,245 | 37.0% | $2,995,435 | 12.0% | $8,068,138 | 100.0% |
| Two Center Court | Totowa, NJ | 1998/N/A | 30,600 | 58.0% | $1,820,198 | 7.3% | $4,902,662 | 100.0% |
| 999 Riverview Drive | Totowa, NJ | 1988/N/A | 58,191 | 100.0% | $1,851,486 | 7.4% | $6,800,000 | 78.4% |
| Total/Wtd. Avg. | 507,779 | 70.2% | $25,000,000 | 100.0% | $69,150,000 | 85.5% | ||
| (1) | Information is based on the underwritten rent roll. |
| (2) | Based on thepro rata balances of the $25.0 million Note A-1. |
| (3) | The Totowa Commerce Center Properties are 89.4% leased. The most recent occupancy does not include space leased to Atlantic Inertial Systems Inc. (3.9% of NRA), as the tenant is currently dark. |
Major Tenants.
WestRock Converting Company (30,868 SF, 6.1% of NRA, 7.5% of underwritten base rent). WestRock Converting Company (“WestRock”) (BBB by S&P / Baa2 stable by Moody’s) is a corrugated packaging company formed in May 2015 with the merger of MeadWestvaco and RockTenn. WestRock is the second largest American packaging company and one of the world’s largest paper and packaging companies. Based on the company’s most recent annual report, the company’s net revenue and total assets were reported at $14.2 billion and $23.0 billion, respectively. WestRock leases two spaces at the Totowa Commerce Center Properties. WestRock’s lease at the One Center Court property commenced on December 27, 2000 and expires on February 29, 2020 with one three-year renewal option. The tenant has a termination option with a termination date of April 30, 2018 and a termination fee of $104,592. WestRock’s lease at the 29 Commerce Way property commenced on January 1, 2015 and expires on May 31, 2022 with one three-year renewal option. The tenant has a termination option with a termination date of June 1, 2020 and a termination fee of $214,658.
Cervalis Holdings LLC (28,130 SF, 5.5% of NRA, 5.8% of underwritten base rent). Cervalis Holdings LLC (“Cervalis”) is a colocation, cloud computing and managed services company, which was acquired by CyrusOne in 2015. The Cervalis division of Cyrus has four data centers throughout the New York Metropolitan Area located in Wappingers Falls, New York; Totowa, New Jersey; Stamford, Connecticut and Norwalk, Connecticut. Based on the company’s most recent annual report, the company’s net revenue and total assets were reported at $399.3 million and $2.2 billion, respectively. Cervalis’ lease at the 29 Commerce Way property commenced on February 1, 2014 and expires on February 28, 2020, with one five-year renewal option.
Coram Alternate Site Services (26,125 SF, 5.1% of NRA, 5.9% of underwritten base rent). Coram Alternate Site Services (“Coram”) is an industry leader in infusion care and the infusion provider of CVS. Coram has more than 30 years of experience and cares for patients through a national network of 90+ locations, including 70+ infusion suites nationwide. Coram provides infusion therapies and services to more than 45,000 patients each month. CVS (BBB+
THE INFORMATION IN THIS COLLATERAL TERM SHEET IS NOT COMPLETE AND MAY BE AMENDED PRIOR TO THE TIME OF SALE. THIS TERM SHEET IS NOT AN OFFER TO SELL THESE SECURITIES AND IT IS NOT A SOLICITATION OF AN OFFER TO BUY THESE SECURITIES IN ANY JURISDICTION WHERE THE OFFER OR SALE IS NOT PERMITTED.
81
| Totowa, NJ | Collateral Asset Summary – Loan No. 9 Totowa Commerce Center | Cut-off Date Balance: Cut-off Date LTV Ratio: UW NCF DSCR: UW NOI Debt Yield: | $25,000,000 74.8% 1.55x 9.7% |
by S&P / Baa1 by Moody’s), acquired Coram in 2014. Coram leases 26,125 SF at the 11 Commerce Way property. Coram’s lease commenced on October 3, 1989 and expires on June 30, 2019, with one five-year renewal option.
The following table presents certain information relating to the tenants at the Totowa Commerce Center Properties:
| Tenant Summary(1) | ||||||||
| Tenant Name | Credit Rating (Fitch/Moody’s/S&P)(2) | Property | Tenant SF | Approximate % of SF | Annual UW Base Rent | % of Total Annual UW Base Rent | Annual UW Base Rent PSF(3) | Lease Expiration |
| Major Tenants | ||||||||
| WestRock | NR/Baa2/BBB | Various | 30,868 | 6.1% | $434,718 | 7.5% | $14.08 | Various(4) |
| Cervalis | NR/NR/NR | 29 Commerce Way | 28,130 | 5.5% | $337,560 | 5.8% | $12.00 | 2/28/2020(5) |
| Coram | NR/Baa1/BBB+ | 11 Commerce Way | 26,125 | 5.1% | $343,021 | 5.9% | $13.13 | 6/30/2019(6) |
| Subtotal/Wtd. Avg. | 85,123 | 16.8% | $1,115,299 | 19.2% | $13.10 | |||
| Other Tenants | 349,034 | 68.7% | $4,687,744 | 80.8% | $13.43 | |||
| Vacant(7) | 73,622 | 14.5% | $0 | 0.0% | $0.00 | |||
| Total/Wtd. Avg. | 507,779 | 100.0% | $5,803,043 | 100.0% | $13.37 | |||
| (1) | Information is based on the underwritten rent roll. Annual UW Base Rent includes rent steps through September 2018. |
| (2) | Certain ratings are those of the parent company whether or not the parent guarantees the lease. |
| (3) | Wtd. Avg. Annual UW Base Rent PSF excludes vacant space. |
| (4) | WestRock’s lease at the One Center Court property expires on February 29, 2020 with one three-year renewal option. The tenant has a termination option with a termination date of April 30, 2018 and a termination fee of $104,592. WestRock’s lease at the 29 Commerce Way property expires on May 31, 2022 with one three-year renewal option. The tenant has a termination option with a termination date of June 1, 2020 and a termination fee of $214,658. |
| (5) | Cervalis has one five-year renewal option. |
| (6) | Coram has one five-year renewal option. The Coram lease is guaranteed by CVS. The above ratings reflect CVS credit ratings. |
| (7) | Vacant Tenant SF includes space leased to Atlantic Inertial (3.9% of NRA), as the tenant is currently dark. |
The following table presents certain information relating to the lease rollover schedule at the Totowa Commerce Center Properties:
| Lease Rollover Schedule(1) | ||||||||
| Year | # of Leases Rolling | SF Rolling | Approx. % of Total SF Rolling | Approx. Cumulative % of SF Rolling | UW Base Rent PSF Rolling(2) | Total UW Base Rent Rolling | Approx. % of Total Base Rent Rolling | Approx. Cumulative % of Total Base Rent Rolling |
| MTM | 1 | 2,727 | 0.5% | 0.5% | $13.25 | $36,133 | 0.6% | 0.6% |
| 2017 | 2 | 9,486 | 1.9% | 2.4% | $16.45 | $156,029 | 2.7% | 3.3% |
| 2018 | 9 | 64,373 | 12.7% | 15.1% | $13.76 | $885,498 | 15.3% | 18.6% |
| 2019 | 8 | 73,066 | 14.4% | 29.5% | $13.71 | $1,001,472 | 17.3% | 35.8% |
| 2020 | 12 | 123,841 | 24.4% | 53.9% | $12.00 | $1,485,565 | 25.6% | 61.4% |
| 2021 | 9 | 89,159 | 17.6% | 71.4% | $13.31 | $1,186,627 | 20.4% | 81.9% |
| 2022 | 8 | 36,721 | 7.2% | 78.7% | $15.57 | $571,820 | 9.9% | 91.7% |
| 2023 | 0 | 0 | 0.0% | 78.7% | $0.00 | $0 | 0.0% | 91.7% |
| 2024 | 1 | 13,503 | 2.7% | 81.3% | $13.20 | $178,240 | 3.1% | 94.8% |
| 2025 | 2 | 13,681 | 2.7% | 84.0% | $15.50 | $212,056 | 3.7% | 98.5% |
| 2026 | 0 | 0 | 0.0% | 84.0% | $0.00 | $0 | 0.0% | 98.5% |
| 2027 | 1 | 7,600 | 1.5% | 85.5% | $11.79 | $89,604 | 1.5% | 100.0% |
| 2028 & Beyond | 0 | 0 | 0.0% | 85.5% | $0.00 | $0 | 0.0% | 100.0% |
| Vacant(3) | 0 | 73,622 | 14.5% | 100.0% | $0.00 | $0 | 0.0% | 100.0% |
| Total/Wtd. Avg. | 53 | 507,779 | 100.0% | $13.37 | $5,803,043 | 100.0% | ||
| (1) | Information is based on the underwritten rent roll. |
| (2) | Wtd. Avg. UW Base Rent PSF Rolling excludes vacant space. |
| (3) | Vacant SF Rolling includes space leased to Atlantic Inertial (3.9% of NRA), as the tenant is currently dark. |
The Market. The Totowa Commerce Center Properties are located in Totowa, New Jersey, which is located within the New York-Jersey City, NY-NJ-PA metropolitan statistical area. The Totowa Commerce Center Properties are centrally located along the Boston/Washington, District of Columbia Corridor, approximately 25 miles west of Manhattan, New York. This location provides easy access to the surrounding region via I-80, NJ Turnpike (I-95), the Garden State Parkway, and Routes 46, 3, 19, 21, 17, and 23.
According to a third party research report, the Totowa Commerce Center Properties are located in the Northern New Jersey Flex Industrial Market as of the second quarter of 2017. The Northern New Jersey Flex Industrial Market contains 1,614 buildings totaling 63.4 million SF of flex industrial space. The flex industrial market reported a vacancy rate of 11.1% and asking rental rates of $12.17 per SF as of second quarter of 2017.
THE INFORMATION IN THIS COLLATERAL TERM SHEET IS NOT COMPLETE AND MAY BE AMENDED PRIOR TO THE TIME OF SALE. THIS TERM SHEET IS NOT AN OFFER TO SELL THESE SECURITIES AND IT IS NOT A SOLICITATION OF AN OFFER TO BUY THESE SECURITIES IN ANY JURISDICTION WHERE THE OFFER OR SALE IS NOT PERMITTED.
82
| Totowa, NJ | Collateral Asset Summary – Loan No. 9 Totowa Commerce Center | Cut-off Date Balance: Cut-off Date LTV Ratio: UW NCF DSCR: UW NOI Debt Yield: | $25,000,000 74.8% 1.55x 9.7% |
The following table presents certain information relating to the directly competitive buildings at the Totowa Commerce Center Portfolio:
| Comparable Industrial Flex Leases | ||||||||
| Property Name | Distance to Subject | Year Built | Tenant Name | Lease Size (SF) | Lease Date | Lease Term (Yrs.) | Initial Rent/SF | Lease Type |
| Fairfield Business Center | 7.0 miles | 1974 | Project LLC | 2,895 | August, 2017 | 5.0 | $10.00 | NNN |
| Fairfield Business Center | 7.0 miles | 1974 | Sandream Enterprises | 8,505 | December, 2016 | 5.1 | $8.25 | NNN |
| 17 Madison Road | 6.5 miles | 1979 | Tadbik, NJ | 30,792 | May, 2015 | 5.3 | $8.21 | NNN |
| Wayne Business Center | 7.4 miles | 1968 | Trotec Laser | 1,500 | February, 2015 | 3.0 | $10.00 | NNN |
Source:Appraisal
Operating History and Underwritten Net Cash Flow. The following table presents certain information relating to the historical operating performance and the Underwritten Net Cash Flow at the Totowa Commerce Center Properties:
| Cash Flow Analysis | ||||||
| 2014 | 2015 | 2016 | 6/30/2017 TTM | UW | UW PSF | |
| Base Rent | $5,572,999 | $6,114,211 | $6,015,075 | $6,046,729 | $6,885,978 | $13.56 |
| Total Recoveries | $1,972,782 | $2,179,111 | $2,036,079 | $2,018,888 | $2,029,711 | $4.00 |
| Other Income | $37,698 | $63,287 | $37,761 | $44,264 | $15,012 | $0.03 |
| Less Vacancy & Credit Loss | ($455,899) | ($327,894) | ($223,271) | ($179,769) | ($1,082,935) | ($2.13) |
| Effective Gross Income | $7,127,580 | $8,028,715 | $7,865,644 | $7,930,112 | $7,847,766 | $15.46 |
| Total Operating Expenses | $3,002,023 | $2,930,236 | $2,738,702 | $2,750,739 | $2,812,466 | $5.54 |
| Net Operating Income | $4,125,557 | $5,098,479 | $5,126,942 | $5,179,373 | $5,035,300 | $9.92 |
| Capital Expenditures | $0 | $0 | $0 | $0 | $84,736 | $0.17 |
| TI/LC | $0 | $0 | $0 | $0 | $253,890 | $0.50 |
| Net Cash Flow | $4,125,557 | $5,098,479 | $5,126,942 | $5,179,373 | $4,696,674 | $9.25 |
| Occupancy % | 91.9% | 92.6% | 90.9% | 85.5%(1) | 87.9%(1) | |
| NOI DSCR (P&I)(2) | 1.36x | 1.68x | 1.69x | 1.70x | 1.66x | |
| NCF DSCR (P&I)(2) | 1.36x | 1.68x | 1.69x | 1.70x | 1.55x | |
| NOI Debt Yield(2) | 8.0% | 9.9% | 9.9% | 10.0% | 9.7% | |
| NCF Debt Yield(2) | 8.0% | 9.9% | 9.9% | 10.0% | 9.1% | |
| (1) | The Totowa Commerce Center Portfolio is 89.4% leased. 6/30/2017 TTM Occupancy % and UW Occupancy % do not include space leased to Atlantic Inertial (3.9% of NRA), as the tenant is currently dark. |
| (2) | Debt service coverage ratios and debt yields are based on the Totowa Commerce Center Whole Loan. |
Escrows and Reserves.At origination, the Totowa Commerce Center Borrowers deposited $13,553 upfront in escrow for annual insurance premiums, $15,438 upfront in escrow for deferred maintenance, $702,638 upfront for outstanding tenant improvements and leasing commissions (“TI/LC”) and $83,262 for a free rent reserve.
On a monthly basis, the Totowa Commerce Center Borrowers are required to escrow (i) 1/12 of annual estimated tax payments, currently equal to $117,676, (ii) 1/12 of annual estimated insurance premiums, currently equal to $13,553, (iii) $7,061 for a replacement reserve and (iv) $21,157 for TI/LC. The aggregate balance of TI/LC reserve and the replacement reserve is subject to a cap in an amount of $500,000. If the aggregate balance of TI/LC reserve and the replacement reserve falls below $250,000, the Totowa Commerce Center Borrowers are required to escrow on a monthly basis $21,157 until the cap is met.
Lockbox and Cash Management.The Totowa Commerce Center Whole Loan is structured with a hard lockbox and springing cash management. The Totowa Commerce Center Whole Loan requires all rents to be directly deposited by tenants of the Totowa Commerce Center Properties into a clearing account. Prior to the occurrence of a Cash Management Period (as defined below), all funds in the lockbox account are swept to the Totowa Commerce Center Borrowers’ operating account. During a Cash Management Period, all funds in the lockbox account will be swept to a lender-controlled cash management account.
A “Cash Management Period” will commence upon the occurrence of any of the following: (i) an event of default, (ii) the failure by the Totowa Commerce Center Borrowers, after the end of a calendar quarter, to maintain a debt service coverage ratio of at least 1.05x, or (iii) an Atlantic Inertial Sweep Period (as defined below). A Cash Management Period will end, with respect to clause (ii) above, if for three consecutive months (a) no event of default has occurred, (b) no event that would trigger another Cash Management Period has occurred, and (c) the debt service coverage ratio is at least equal to 1.05x, or with respect to clause (iii) above, an Atlantic Inertial Sweep Period Cure (as defined below) has occurred and no other event that would trigger another Cash Management Period has occurred.
An “Atlantic Inertial Sweep Period” will commence upon the receipt by the lender of notice that Commercenter Realty Associates L.L.C. (“Commercenter Realty”) has objected to a requested disbursement from the Atlantic improvement escrow.
An “Atlantic Inertial Sweep Period Cure” means the receipt by the lender of evidence wholly satisfactory to the lender of the deposit of funds into the Atlantic Inertial reserve subaccount that when added to the total amount of disbursements made from the Atlantic Inertial improvement escrow equals $297,810.
THE INFORMATION IN THIS COLLATERAL TERM SHEET IS NOT COMPLETE AND MAY BE AMENDED PRIOR TO THE TIME OF SALE. THIS TERM SHEET IS NOT AN OFFER TO SELL THESE SECURITIES AND IT IS NOT A SOLICITATION OF AN OFFER TO BUY THESE SECURITIES IN ANY JURISDICTION WHERE THE OFFER OR SALE IS NOT PERMITTED.
83
| Totowa, NJ | Collateral Asset Summary – Loan No. 9 Totowa Commerce Center | Cut-off Date Balance: Cut-off Date LTV Ratio: UW NCF DSCR: UW NOI Debt Yield: | $25,000,000 74.8% 1.55x 9.7% |
Additional Secured Indebtedness (not including trade debts).Not permitted.
Release of Property. Following the lockout period, the Totowa Commerce Center Borrowers can release a portion of the Totowa Commerce Center Properties consisting of (i) vacant land that has approximately 30,000 SF of buildability and (ii) the 999 Riverview Drive property,provided that among others: (i) no event of default exists, (ii) the purchaser is not affiliated to the Totowa Commerce Center Borrowers, (iii) after the partial release, the debt yield is not less than the greater of (x) the debt yield immediately preceding partial release and (y) the debt yield at origination, (iv) after partial release, the loan-to-value ratio is not greater than the lessor of (x) the loan-to-value ratio immediately preceding partial release and (y) the loan-to-value ratio at origination and (v) the Totowa Commerce Center Borrowers deliver to the lender 115% of the allocated cut-off date balance (identified in the “Portfolio Summary” chart above) of the release parcel.
Terrorism Insurance.The Totowa Commerce Center Whole Loan documents require that the “all risk” insurance policy required to be maintained by the Totowa Commerce Center Borrowers provide coverage for terrorism in an amount equal to the full replacement cost of the Totowa Commerce Center Properties. The Totowa Commerce Center Whole Loan documents also require loss of rent and business interruption insurance covering no less than the 18-month period following the occurrence of a casualty event, together with an extended period of indemnity endorsement of not less than six months which provides that after the physical loss to the Totowa Commerce Center Properties have been repaired, the continued loss of income will be insured until such income either returns to the same level it was at prior to the loss, or the expiration of 24 months from the date that the Totowa Commerce Center Properties are damaged, whichever first occurs, and notwithstanding that the policy may expire prior to the end of such period.
THE INFORMATION IN THIS COLLATERAL TERM SHEET IS NOT COMPLETE AND MAY BE AMENDED PRIOR TO THE TIME OF SALE. THIS TERM SHEET IS NOT AN OFFER TO SELL THESE SECURITIES AND IT IS NOT A SOLICITATION OF AN OFFER TO BUY THESE SECURITIES IN ANY JURISDICTION WHERE THE OFFER OR SALE IS NOT PERMITTED.
84
30950 Russell Ranch Road Westlake Village, CA 91362
| Collateral Asset Summary – Loan No. 10 Residence Inn Los Angeles | Cut-off Date Balance: Cut-off Date LTV Ratio: UW NCF DSCR: UW NOI Debt Yield: | $24,829,085 43.4% 3.15x 19.9% |
THE INFORMATION IN THIS COLLATERAL TERM SHEET IS NOT COMPLETE AND MAY BE AMENDED PRIOR TO THE TIME OF SALE. THIS TERM SHEET IS NOT AN OFFER TO SELL THESE SECURITIES AND IT IS NOT A SOLICITATION OF AN OFFER TO BUY THESE SECURITIES IN ANY JURISDICTION WHERE THE OFFER OR SALE IS NOT PERMITTED.
85
30950 Russell Ranch Road Westlake Village, CA 91362
| Collateral Asset Summary – Loan No. 10 Residence Inn Los Angeles | Cut-off Date Balance: Cut-off Date LTV Ratio: UW NCF DSCR: UW NOI Debt Yield: | $24,829,085 43.4% 3.15x 19.9% |
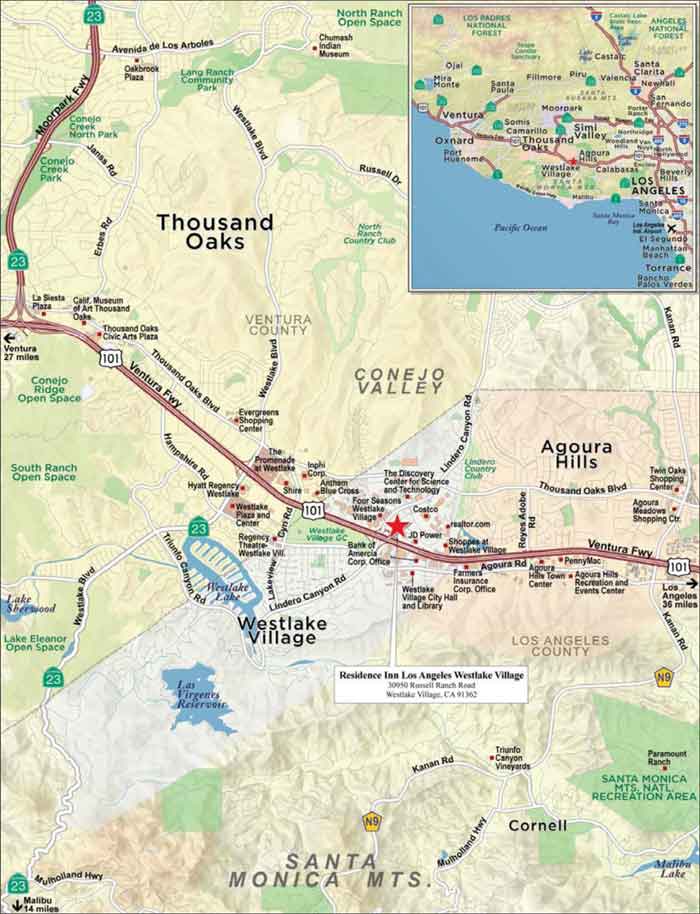
THE INFORMATION IN THIS COLLATERAL TERM SHEET IS NOT COMPLETE AND MAY BE AMENDED PRIOR TO THE TIME OF SALE. THIS TERM SHEET IS NOT AN OFFER TO SELL THESE SECURITIES AND IT IS NOT A SOLICITATION OF AN OFFER TO BUY THESE SECURITIES IN ANY JURISDICTION WHERE THE OFFER OR SALE IS NOT PERMITTED.
86
30950 Russell Ranch Road Westlake Village, CA 91362
| Collateral Asset Summary – Loan No. 10 Residence Inn Los Angeles | Cut-off Date Balance: Cut-off Date LTV Ratio: UW NCF DSCR: UW NOI Debt Yield: | $24,829,085 43.4% 3.15x 19.9% |
| Mortgage Loan Information | Property Information | ||||||
| Mortgage Loan Seller: | Rialto Mortgage Finance, LLC | Single Asset/Portfolio: | Single Asset | ||||
| Credit Assessment (Fitch/KBRA/Moody’s/S&P): | [ ] | Location: | Westlake Village, CA 91362 | ||||
| General Property Type: | Hospitality | ||||||
| Original Balance: | $25,000,000 | Detailed Property Type: | Extended Stay | ||||
| Cut-off Date Balance: | $24,829,085 | Title Vesting: | Fee | ||||
| % of Initial Pool Balance: | [ ]% | Year Built/Renovated: | 2007/2014 | ||||
| Loan Purpose: | Refinance | Size: | 160 Rooms | ||||
| Borrower Sponsor: | Huntington Hotel Group, LP | Cut-off Date Balance per Room: | $155,182 | ||||
| Mortgage Rate: | 4.0600% | Maturity Date Balance per Room: | $124,383 | ||||
| Note Date: | 6/8/2017 | Property Manager:
| Westlake HHG Hotel, LLC (borrower-related)
| ||||
| First Payment Date: | 7/6/2017 | ||||||
| Maturity Date: | 6/6/2027 | ||||||
| Original Term to Maturity: | 120 months | Underwriting and Financial Information | |||||
| Original Amortization Term: | 360 months | UW NOI: | $4,928,612 | ||||
| IO Period: | 0 months | UW NOI Debt Yield: | 19.9% | ||||
| Seasoning: | 5 months | UW NOI Debt Yield at Maturity: | 24.8% | ||||
| Prepayment Provisions: | LO (24); YM1 (90); O (6) | UW NCF DSCR: | 3.15x | ||||
| Lockbox/Cash Mgmt Status: | Springing/Springing | Most Recent NOI: | $4,987,532 (8/31/2017 TTM) | ||||
| Additional Debt Type: | N/A | 2nd Most Recent NOI(2): | $5,525,582 (12/31/2016) | ||||
| Additional Debt Balance: | N/A | 3rd Most Recent NOI(2): | $4,184,424 (12/31/2015) | ||||
| Future Debt Permitted (Type): | No (N/A) | Most Recent Occupancy(2): | 89.1% (8/31/2017) | ||||
| Reserves(1) | 2nd Most Recent Occupancy(2): | 91.7% (12/31/2016) | |||||
| Type | Initial | Monthly | Cap | 3rd Most Recent Occupancy(2): | 87.6% (12/31/2015) | ||
| RE Tax: | $55,371 | $26,367 | N/A | Appraised Value (as of): | $57,200,000 (3/21/2017) | ||
| Insurance: | $42,185 | $4,464 | N/A | Cut-off Date LTV Ratio: | 43.4% | ||
| FF&E: | $0 | $32,606 | $1,173,819 | Maturity Date LTV Ratio: | 34.8% | ||
| Sources and Uses | ||||||
| Sources | Proceeds | % of Total | Uses | Proceeds | % of Total | |
| Loan Amount: | $25,000,000 | 100.0% | Loan Payoff: | $24,556,061 | 98.2% | |
| Reserves: | $97,556 | 0.4% | ||||
| Closing Costs: | $326,628 | 1.3% | ||||
| Return of Equity: | $19,754 | 0.1% | ||||
| Total Sources: | $25,000,000 | 100.0% | Total Uses: | $25,000,000 | 100.0% | |
| (1) | See“Escrows and Reserves” below for further discussion of reserve requirements. |
| (2) | 2016 performance was skewed upward due to increased hotel demand as a result of the relocation of residents who were affected by the Porter Ranch gas leak, which occurred between October 2015 and February 2016. The Porter Ranch gas leak affected residents living near the Aliso Canyon Oil Field in Porter Ranch, which is located approximately 38.9 miles from the Residence Inn Los Angeles Westlake Village Property (as defined below). The Residence Inn Los Angeles Westlake Village Property received increased demand between the months of January and April and as of the 8/31/ 2017 TTM, demand and operations at the Residence Inn Los Angeles Westlake Village Property have stabilized and the RevPAR is expected to continue at the levels of the current 8/31/2017 TTM, which is higher than the underwritten RevPAR. |
The Mortgage Loan. The tenth largest mortgage loan (the “Residence Inn Los Angeles Westlake Village Mortgage Loan”) is evidenced by a promissory note with an original principal amount of $25,000,000, secured by a first priority fee mortgage encumbering a 160-room extended stay hospitality property located in Westlake Village, Los Angeles County, California (the “Residence Inn Los Angeles Westlake Village Property”) under the Marriott flag. The proceeds of the Residence Inn Los Angeles Westlake Village Mortgage Loan were used to refinance an existing loan, fund reserves, pay closing costs and return approximately $19,754 of equity to the borrower sponsor.
The Borrower and the Borrower Sponsor.The borrower is Westlake HHG Hotel Development, LP (the “Residence Inn Los Angeles Westlake Village Borrower”), a single purpose Texas limited partnership structured to be bankruptcy remote, with two independent directors. The non-recourse carveout guarantor and borrower sponsor is Huntington Hotel Group, LP a professional developer, owner and manager of hotel properties based in Irving, Texas, that was founded by Kevin Keefer and Brent Andrus. Kevin Keefer has over 30 years of experience in the development, management and financing of hotel properties. Brent Andrus has served Marriott in senior operating positions and later as the top marketing/sales executive for their Courtyard Hotel Division.
The Property.The Residence Inn Los Angeles Westlake Village Property is a 160-room, three-story, extended stay hotel located in the county of Los Angeles, situated northeast of the intersection formed by Lindero Canyon Road and U.S. Highway 101, on a 5.68-acre site. Residence Inn Los Angeles Westlake Village Property amenities include an outdoor pool and whirlpool, a fitness center, a lobby workstation, a meeting center, a market pantry, guest laundry rooms, a sport court, an outdoor patio and barbecue area, vending areas and two meeting rooms. The guestroom mix includes 63 king rooms, 64 one-bedroom suites and 33 two-bedroom suites. In-room amenities include iron and ironing board, luggage rack, kitchenette with coffeemaker, make-up mirror and hairdryer. Parking is provided by 160 surface level parking spaces or 1.00 parking space per room.
THE INFORMATION IN THIS COLLATERAL TERM SHEET IS NOT COMPLETE AND MAY BE AMENDED PRIOR TO THE TIME OF SALE. THIS TERM SHEET IS NOT AN OFFER TO SELL THESE SECURITIES AND IT IS NOT A SOLICITATION OF AN OFFER TO BUY THESE SECURITIES IN ANY JURISDICTION WHERE THE OFFER OR SALE IS NOT PERMITTED.
87
30950 Russell Ranch Road Westlake Village, CA 91362
| Collateral Asset Summary – Loan No. 10 Residence Inn Los Angeles | Cut-off Date Balance: Cut-off Date LTV Ratio: UW NCF DSCR: UW NOI Debt Yield: | $24,829,085 43.4% 3.15x 19.9% |
The Residence Inn Los Angeles Westlake Village Property was developed by the Residence Inn Los Angeles Westlake Village Borrower in 2007 as the Residence Inn Los Angeles Westlake Village and has undergone renovations since its opening, with the last renovation completed in 2014. The renovations in 2013/2014 involved soft goods upgrades of the guestrooms, new smart TV’s, and the redesign of the hotel’s public areas at a total cost of approximately $2,779,000 ($17,370 per room).
The Residence Inn Los Angeles Westlake Village Property is under a franchise agreement between Marriott International, Inc., and the Residence Inn Los Angeles Westlake Village Borrower, dated January 26, 2004. The existing term expires on August 7, 2027 with one 10-year renewal option through August 7, 2037.
| Residence Inn Los Angeles Westlake Village Market Historical Occupancy, ADR, RevPAR | |||||||||
| Competitive Set(1) | Residence Inn Los Angeles Westlake Village | Penetration Factor | |||||||
| Year | Occupancy | ADR | RevPAR | Occupancy | ADR | RevPAR | Occupancy | ADR | RevPAR |
| 8/31/2015 TTM | 77.5% | $139.18 | $107.80 | 86.5% | $162.28 | $140.36 | 111.7% | 116.6% | 130.2% |
| 8/31/2016 TTM | 86.2% | $157.43 | $135.67 | 91.2% | $186.78 | $170.38 | 105.8% | 118.6% | 125.6% |
| 8/31/2017 TTM | 79.8% | $155.52 | $124.07 | 88.8% | $189.44 | $168.31 | 111.4% | 121.8% | 135.7% |
Source:Industry Report
| (1) | The competitive set includes Sheraton Hotel Agoura Hills, Hyatt Regency Westlake Plaza, La Quinta Inns & Suites Thousand Oaks Newbury, Hilton Garden Inn Calabasas, Hampton Inn Suites Agoura Hills and Homewood Suites Agoura Hills. |
The Market.The Residence Inn Los Angeles Westlake Village Property is located within the Los Angeles-Long Beach combined statistical area (the “CSA” or the “Los Angeles CSA”) in Westlake Village, Los Angeles County, California. The Residence Inn Los Angeles Westlake Village Property is located in a suburb of the city of Los Angeles, situated directly northeast of the intersection formed by Lindero Canyon Road and U.S. Highway 101. Located just north of the Los Angeles basin, the San Fernando Valley spans approximately 345 square miles; it is bounded by the San Gabriel Mountains to the northeast, the Santa Susana Mountains to the northwest, and the Santa Monica Mountains to the south. Major employers include Kaiser Permanente, University of Southern California, Northup Grumman Corporation, Target Corporation and Ralphs/Food 4 Less.
According to the appraisal, the movie industry represents a significant source of revenue and employment for the Los Angeles area. Over 70% of the entertainment industry jobs in the greater Los Angeles area are located in the San Fernando Valley. Los Angeles still contains most of the ancillary production companies related to pre- and post-filming. Disney, Warner Brothers, Universal Studios, and DreamWorks Animation are all headquartered in the San Fernando Valley. ABC, CBS, and NBC, as well as several cable networks, also have major facilities in the San Fernando Valley. The healthcare sector is also important to the greater Los Angeles area’s economy. Major employers in the market include Anthem BlueCross of California, Cedars-Sinai Health System, and Northeast Valley Health Corporation. The Los Angeles Convention Center (“LACC”) is one of the key contributors to the economic and cultural vitality of Los Angeles. The LACC features two exhibit halls and a 299-seat theatre for a total of roughly 720,000 SF of exhibit space, as well as 64 meeting rooms totaling 147,000 SF of meeting space. Additional features include a full service business center, food courts, and 5,600 onsite parking spaces.
The Residence Inn Los Angeles Westlake Village Property is also located within close proximity to the Guitar Center, J.D. Power (approximately 1.0 mile), Dole (approximately 1.0 mile), Chip Johnson Insurance (approximately 2.0 miles), The Canyon Entertainment Venue (approximately 4.0 miles), The Cheesecake Factory Inc. (approximately 7.0 miles), Paramount Ranch (approximately 6.0 miles), Amgen (approximately 8.0 miles), and the Warner Center (approximately 15.0 miles). Other demand generators include, the Hollywood Walk of Fame, The Grove, numerous beaches and the NFL football teams the Rams and the Chargers. Universal Studios, which is located approximately 29.0 miles from the Residence Inn Los Angeles Westlake Village Property, offers multiple attractions including a cinema-based theme park, studios tours, shopping, restaurants, a cinema, and an amphitheater and Universal CityWalk.
Primary regional access through the area is provided by east/west Interstate 10, which extends to such cities as Palm Springs to the east and Santa Monica to the west. North/south Interstate 405 is a bypass of Interstate 5 to the west and provides access to Costa Mesa to the south, connecting with Interstate 5 at San Fernando to the north. North/south Interstate 110 is another major route that traverses the greater Los Angeles area, providing access to such cities as Pasadena to the north and San Pedro to the south. North/south Interstate 5 extends parallel to the Pacific Ocean and U.S. Highway 101, passing through such cities as San Diego to the south and Stockton to the north.
THE INFORMATION IN THIS COLLATERAL TERM SHEET IS NOT COMPLETE AND MAY BE AMENDED PRIOR TO THE TIME OF SALE. THIS TERM SHEET IS NOT AN OFFER TO SELL THESE SECURITIES AND IT IS NOT A SOLICITATION OF AN OFFER TO BUY THESE SECURITIES IN ANY JURISDICTION WHERE THE OFFER OR SALE IS NOT PERMITTED.
88
30950 Russell Ranch Road Westlake Village, CA 91362
| Collateral Asset Summary – Loan No. 10 Residence Inn Los Angeles | Cut-off Date Balance: Cut-off Date LTV Ratio: UW NCF DSCR: UW NOI Debt Yield: | $24,829,085 43.4% 3.15x 19.9% |
Competitive properties to the Residence Inn Los Angeles Westlake Village Property are shown in the table below:
| Property | Rooms | Year Opened | 2015 | 2015 Average ADR | 2015 RevPAR | 2016 | 2016 Average ADR | 2016 RevPAR |
| Residence Inn Los Angeles Westlake Village(1) | 160 | 2007 | 87.6% | $169.29 | $148.23 | 91.7% | $191.72 | $175.86 |
| Homewood Suites by Hilton Agoura Hills | 125 | 2007 | 80.0%-85.0% | $140.00-$150.00 | $115.00-$120.00 | 90.0%-95.0% | $150.00-$160.00 | $140.00-$150.00 |
| TownePlace Suites by Marriott Thousand Oaks Ventura County | 93 | 2007 | 80.0%-85.0% | $125.00-$130.00 | $105.00-$110.00 | 80.0%-85.0% | $140.00-$150.00 | $115.00-$120.00 |
| Courtyard by Marriott Thousand Oaks Ventura County | 120 | 2006 | 80.0%-85.0% | $140.00-$150.00 | $115.00-$120.00 | 85.0%-90.0% | $160.00-$170.00 | $140.00-$150.00 |
| Hampton Inn & Suites Agoura Hills | 94 | 2002 | 85.0%-90.0% | $130.00-$140.00 | $120.00-$125.00 | 90.0%-95.0% | $140.00-$150.00 | $130.00-$140.00 |
Source: Appraisal.
| (1) | Based on the underwritten operating statements. 2016 Occupancy, Average ADR and RevPAR for the Residence Inn Los Angeles Westlake Village Property was skewed upward due to the relocation of residents who were affected by the Porter Ranch gas leak, which occurred between October 2015 and February 2016. The Porter Ranch gas leak affected residents living near the Aliso Canyon Oil Field in Porter Ranch, which is located approximately 38.9 miles from the Residence Inn Los Angeles Westlake Village Property. |
Demand segments for the competitive properties to the Residence Inn Los Angeles Westlake Village Property are shown in the table below:
| Demand Segments | |||||
| Property Name | Rooms | Commercial % | Meeting & Group % | Leisure % | Extended Stay % |
| Residence Inn Los Angeles Westlake Village | 160 | 20% | 15% | 15% | 50% |
| Homewood Suites by Hilton Agoura Hills | 125 | 15% | 20% | 20% | 45% |
| TownePlace Suites by Marriott Thousand Oaks Ventura County | 93 | 15% | 15% | 30% | 40% |
| Courtyard by Marriott Thousand Oaks Ventura County | 120 | 50% | 10% | 35% | 5% |
| Hampton Inn & Suites Agoura Hills | 94 | 45% | 5% | 45% | 5% |
Source: Appraisal.
According the appraisal, the largest demand driver for the Residence Inn Los Angeles Westlake Village Property is the extended stay demand. Extended-stay patrons usually prefer hotels located near shopping centers, restaurants, entertainment venues, and service-retail uses such as grocery stores, dry cleaners, and fueling stations. Extended-stay demand in the market is generated by nearby companies requiring long-term stays, as well as by the leisure attractions, which prompt visitors to stay for longer periods of time.
Commercial demand is the second largest demand driver for the Residence Inn Los Angeles Westlake Village Property. Commercial demand in the Residence Inn Los Angeles Westlake Village Property’s market is generated by the multitude of businesses located within the nearby Warner Center office park and the surrounding Central and West San Fernando Valley, including such companies as WellPoint (Blue Shield and Blue Cross), Amgen Corp., and Baxter Corp.
Meeting & group and leisure are both the third largest demand driver for Residence Inn Los Angeles Westlake Village Property. Meeting and group demand is generated by the same companies that create commercial demand through training activities and social corporate events. Additionally, high school and youth sports teams, social, military, educational and religious groups, and social events, such as weddings and family reunions, contribute to this demand segment. Tourism in Greater Los Angeles is a primary factor related to leisure demand. The entertainment industry, theme parks, sporting venues, and numerous beaches all draw visitors to the area.
The appraisal identified five hotels in some stage of the development process in the Westlake Village market area. The proposed TownePlace Suites by Marriott Thousand Oaks Agoura Hills and the proposed Courtyard by Marriott Thousand Oaks Agoura Hills are expected to be competitive based on their Marriott brand affiliations and locations after their assumed openings in 2019 or 2020, respectively; however, the developers are still in the early permitting process, and the timeline for these hotels’ construction has not been finalized.
THE INFORMATION IN THIS COLLATERAL TERM SHEET IS NOT COMPLETE AND MAY BE AMENDED PRIOR TO THE TIME OF SALE. THIS TERM SHEET IS NOT AN OFFER TO SELL THESE SECURITIES AND IT IS NOT A SOLICITATION OF AN OFFER TO BUY THESE SECURITIES IN ANY JURISDICTION WHERE THE OFFER OR SALE IS NOT PERMITTED.
89
30950 Russell Ranch Road Westlake Village, CA 91362
| Collateral Asset Summary – Loan No. 10 Residence Inn Los Angeles | Cut-off Date Balance: Cut-off Date LTV Ratio: UW NCF DSCR: UW NOI Debt Yield: | $24,829,085 43.4% 3.15x 19.9% |
Operating History and Underwritten Net Cash Flow. The following table presents certain information relating to the historical operating performance and the Underwritten Net Cash Flow at the Residence Inn Los Angeles Westlake Village Property.
| Cash Flow Analysis | ||||||||||||
| 2014 | 2015(2) | 2016(2) | 8/31/2017 TTM | UW | UW per Room | |||||||
| Occupancy | 84.7% | 87.6% | 91.7% | 89.1% | 86.0% | |||||||
| ADR | $147.89 | $169.29 | $191.72 | $187.60 | $191.68 | |||||||
| RevPAR | $125.24 | $148.23 | $175.86 | $167.20 | $164.85 | |||||||
| Rooms Revenue | $7,313,878 | $8,656,702 | $10,298,535 | $9,764,544 | $9,627,000 | $60,169 | ||||||
| Food & Beverage | $0 | $0 | $0 | $0 | $0 | $0 | ||||||
| Other Income | $121,094 | $165,179 | $175,136 | $146,492 | $144,429 | $903 | ||||||
| Total Revenue | $7,434,972 | $8,821,881 | $10,473,671 | $9,911,036 | $9,771,429 | $61,071 | ||||||
| Total Expenses | $4,300,209 | $4,637,457 | $4,948,089 | $4,923,504 | $4,842,816 | $30,268 | ||||||
| Net Operating Income | $3,134,763 | $4,184,424 | $5,525,582 | $4,987,532 | $4,928,612 | $30,804 | ||||||
| FF&E(3) | $297,399 | $352,875 | $418,947 | $396,441 | $390,857 | $2,443 | ||||||
| Net Cash Flow | $3,837,364 | $3,831,549 | $5,106,635 | $4,591,091 | $4,537,755 | $28,361 | ||||||
| NOI DSCR | 2.17x | 2.90x | 3.83x | 3.46x | 3.42x | |||||||
| NCF DSCR | 1.97x | 2.66x | 3.54x | 3.18x | 3.15x | |||||||
| NOI Debt Yield | 12.6% | 16.9% | 22.3% | 20.1% | 19.9% | |||||||
| NCF Debt Yield | 11.4% | 15.4% | 20.6% | 18.5% | 18.3% | |||||||
| (1) | 2016 performance was skewed upward due to increased hotel demand as a result of the relocation of residents who were affected by the Porter Ranch gas leak, which occurred between October 2015 and February 2016. The Porter Ranch gas leak affected residents living near the Aliso Canyon Oil Field in Porter Ranch, which is located approximately 38.9 miles from the Residence Inn Los Angeles Westlake Village Property. The Residence Inn Los Angeles Westlake Village Property received increased demand between the months of January and April and as of the 8/31/2017 TTM, demand and operations at the Residence Inn Los Angeles Westlake Village Property have stabilized and the RevPAR is expected to continue at the levels of the current 8/31/2017 TTM, which is higher than the UW RevPAR. |
| (2) | Historical and UW FF&E figures are based on 4% of Total Revenue. |
Escrows and Reserves.At loan origination, the Residence Inn Los Angeles Westlake Village Borrower deposited in escrow $55,371 for real estate taxes and $42,185 for insurance premiums and is required to escrow monthly 1/12 of the annual estimate tax payments and 1/12 of the annual estimated insurance premiums. The Residence Inn Los Angeles Westlake Village Borrower is not required to make monthly insurance premium payments so long as (i) the Residence Inn Los Angeles Westlake Village Borrower maintains a blanket insurance policy and it is in full force and effect and delivers to the lender not less than 30 days prior to the expiration day of the blanket insurance policy, certificates of insurance evidencing that the blanket insurance policy has been paid in full and (ii) no event of default exists. The Residence Inn Los Angeles Westlake Borrower is required to deposit monthly for furniture, fixtures and equipment the greater of (i) 1/12 of an amount equal to 4.0% of the gross income from the prior calendar year and (ii) the aggregate amount, if any, to be reserved under the management agreement and franchise agreement (if any), currently estimated at $32,606 (the “FF&E Reserve”). The FF&E Reserve is capped at $1,173,819. Funds on deposit in the FF&E Reserve may be used by the Residence Inn Los Angeles Westlake Borrower for the completion of any FF&E work.
After the occurrence of a Franchise Trigger Event (as defined below), all available excess cash flow will be deposited into a property improvement plan reserve (the “PIP Reserve”) to pay or reimburse the Residence Inn Los Angeles Westlake Village Borrower for completion of all property improvement plan or other work required by the franchisor (or any replacement franchisor) (the “PIP Work”).
Lockbox and Cash Management.The Residence Inn Los Angeles Westlake Village Mortgage Loan provides for a springing lockbox and springing cash management. During the occurrence and continuance of a Cash Management Trigger Event (as defined below) for the Residence Inn Los Angeles Westlake Village Mortgage Loan, the Residence Inn Los Angeles Westlake Village Borrower is required to instruct tenants and credit card processors to deposit rents and other amounts due into the lockbox account and funds in the lockbox account are required to be transferred to the cash management account each business day. All funds in the cash management are required to be applied on each monthly payment date in accordance with the Residence Inn Los Angeles Westlake Village Mortgage Loan documents. All excess cash flow will be applied as follows (i) to the extent a Cash Sweep Event (as defined below) exists on account of a Franchise Trigger Event as described in the “Escrows and Reserves”section, into the PIP Reserve, (ii) to the extent a Cash Sweep Event exists for any other reason, into a lender controlled account as additional security for the Residence Inn Los Angeles Westlake Village Mortgage Loan, and/or (iii) to the extent no Cash Sweep Event exists, to the Residence Inn Los Angeles Westlake Village Borrower. To the extent no Cash Management Trigger Event exists, the requirement that credit card processors and tenants deposit rents and other amounts due directly to the lockbox will be suspended until the occurrence of any subsequent Cash Management Trigger Event(s).
A “Cash Management Trigger Event” will occur upon (i) an event of default, (ii) the Residence Inn Los Angeles Westlake Village Borrower’s second late debt service payment in a 12-month period, (iii) any bankruptcy action of the Residence Inn Los Angeles Westlake Village Borrower, the guarantor or the property manager, (iv) the debt service coverage ratio based on the trailing 12-month period falling below 1.15x, or (v) a Franchise Trigger Event. A Cash Management Trigger Event will continue until, in regard to clause (i) above, such event of default has been cured or waived, in regard to clause (ii) above, when the Residence Inn Los Angeles Westlake Village Borrower makes 12 consecutive monthly debt service payments, in regard to clause (iii) above, when such bankruptcy petition has been discharged, stayed, or dismissed within 30 days of such filing among other conditions for Residence Inn Los Angeles Westlake Village Borrower or guarantor and within 120 days for the property manager (or, solely with respect to the bankruptcy of the property manager, when the Residence Inn Los Angeles Westlake Village Borrower has replaced the property manager with a qualified property manager acceptable to the lender), in regard to clause (iv) above, the date the trailing 12-month amortizing net operating income debt service coverage ratio is greater than 1.15x for two consecutive calendar quarters, or in regard to clause (v) above, the Residence Inn Los Angeles Westlake Village Borrower (a)
THE INFORMATION IN THIS COLLATERAL TERM SHEET IS NOT COMPLETE AND MAY BE AMENDED PRIOR TO THE TIME OF SALE. THIS TERM SHEET IS NOT AN OFFER TO SELL THESE SECURITIES AND IT IS NOT A SOLICITATION OF AN OFFER TO BUY THESE SECURITIES IN ANY JURISDICTION WHERE THE OFFER OR SALE IS NOT PERMITTED.
90
30950 Russell Ranch Road Westlake Village, CA 91362
| Collateral Asset Summary – Loan No. 10 Residence Inn Los Angeles | Cut-off Date Balance: Cut-off Date LTV Ratio: UW NCF DSCR: UW NOI Debt Yield: | $24,829,085 43.4% 3.15x 19.9% |
extends or renews the franchise agreement or enters into a new franchise agreement with a franchisor approved by the lender and (b) all PIP Work has been completed and paid in full and the lender has received an acceptable comfort letter from the franchisor.
A “Cash Sweep Event” will occur upon (i) an event of default, (ii) any bankruptcy action of Residence Inn Los Angeles Westlake Village Borrower, guarantor or property manager, (iii) the debt service ratio based on the trailing 12-month period falling below 1.15x, or (iv) the occurrence of a Franchise Trigger Event. A Cash Sweep Event will continue until, in regard to clause (i) above, such event of default has been cured or waived, in regard to clause (ii) above, such bankruptcy petition has been discharged, stayed, or dismissed within 30 days of such filing among other conditions for the Residence Inn Los Angeles Westlake Village Borrower or guarantor and within 120 days for the property manager (or, solely with respect to the bankruptcy of the property manager, when the Residence Inn Los Angeles Westlake Village Borrower has replaced the property manager with a qualified property manager acceptable to the lender), in regard to clause (iii) above, the date the trailing 12-month amortizing net operating income debt service coverage ratio is greater than 1.15x for two consecutive calendar quarters, or in regard to clause (iv) above, the Residence Inn Los Angeles Westlake Village Borrower (a) extends or renews the franchise agreement or enters into a new franchise agreement with a franchisor approved by the lender and (b) all PIP Work has been completed and paid in full and the lender has received an acceptable comfort letter from the franchisor.
A “Franchise Trigger Event” will occur upon the earlier of (i) the date the franchise agreement expires or is terminated for any reason, (ii) the Residence Inn Los Angeles Westlake Village Borrower receives any notice of termination of the franchise agreement, (iii) on any date that occurs twelve months prior to the current expiration date of the franchise agreement, or (iv) any failure to complete any PIP work.
Additional Secured Indebtedness (not including trade debts). Not permitted.
Mezzanine Loan and Preferred Equity. Not permitted.
Release of Property. Not permitted.
Terrorism Insurance.The Residence Inn Los Angeles Westlake Village Borrower is required to obtain and maintain property insurance, commercial general liability insurance, and business income or rental loss insurance that covers perils of terrorism and acts of terrorism, both foreign and domestic.
THE INFORMATION IN THIS COLLATERAL TERM SHEET IS NOT COMPLETE AND MAY BE AMENDED PRIOR TO THE TIME OF SALE. THIS TERM SHEET IS NOT AN OFFER TO SELL THESE SECURITIES AND IT IS NOT A SOLICITATION OF AN OFFER TO BUY THESE SECURITIES IN ANY JURISDICTION WHERE THE OFFER OR SALE IS NOT PERMITTED.
91