Filed Pursuant to Rule 424(b)(3)
Registration No. 333- 237992
KALEYRA, INC.
SUPPLEMENT NO. 2 TO
PROSPECTUS DATED MAY 8, 2020
THE DATE OF THIS SUPPLEMENT IS FEBRUARY 16, 2021
This prospectus supplement (this “Supplement No. 2”) is part of the prospectus of Kaleyra, Inc. (the “Company”), dated May 8, 2020 (as amended from time to time, the “Prospectus”). This Supplement No. 2 is being filed to update and supplement the information contained in the Prospectus with the information contained in our Current Report on Form 8-K, filed with the Securities and Exchange Commission on February 16, 2021 (the “Current Report”), other than the information included in Item 2.02 and Item 7.01 and Exhibits 99.1 and 99.2, which were furnished and not filed with the SEC. Accordingly, we have attached the Current Report to this prospectus supplement.
This prospectus supplement updates and supplements the information in the Prospectus and is not complete without, and may not be delivered or utilized except in combination with, the Prospectus, including any amendments or supplements thereto. This prospectus supplement should be read in conjunction with the Prospectus and if there is any inconsistency between the information in the Prospectus and this prospectus supplement, you should rely on the information in this prospectus supplement.
Our Common Stock and Public Warrants are listed on the NYSE American Stock Exchange under the symbols “KLR” and “KLR.WS,” respectively. On February 12, 2021, the last reported sales price of our Common Stock was $15.82 per share and the last reported sales price of our Public Warrants was $4.90 per warrant.
Investing in our securities involves a high degree of risk. You should review carefully the risks and uncertainties described under the heading “Risk Factors” beginning on page 3 of the Prospectus before buying our common stock and warrant.
Neither the SEC nor any state securities commission has approved or disapproved of these securities or passed upon the adequacy or accuracy of this prospectus supplement or the accompanying prospectus. Any representation to the contrary is a criminal offense.
UNITED STATES
SECURITIES AND EXCHANGE COMMISSION
WASHINGTON, D.C. 20549
FORM 8-K
CURRENT REPORT
PURSUANT TO SECTION 13 OR 15(d)
OF THE SECURITIES EXCHANGE ACT OF 1934
Date of Report (Date of earliest event reported): February 10, 2021
KALEYRA, INC.
(Exact Name of Registrant as Specified in Charter)
Delaware | 001-38320 | 82-3027430 | ||
(State or other jurisdiction of incorporation) | (Commission File Number) | (IRS Employer Identification No.) |
Via Marco D’Aviano, 2, Milano MI, Italy | 20131 | |||
(Address of Principal Executive Offices) | (Zip Code) |
+39 02 288 5841
(Registrant’s telephone number, including area code)
Check the appropriate box below if the Form 8-K filing is intended to simultaneously satisfy the filing obligation of the registrant under any of the following provisions (see General Instruction A.2. below):
☐ | Written communications pursuant to Rule 425 under the Securities Act (17 CFR 230.425) |
☐ | Soliciting material pursuant to Rule 14a-12 under the Exchange Act (17 CFR 240.14a-12) |
☐ | Pre-commencement communications pursuant to Rule 14d-2(b) under the Exchange Act (17 CFR 240.14d-2(b)) |
☐ | Pre-commencement communications pursuant to Rule 13e-4(c) under the Exchange Act (17 CFR 240.13e 4(c)) |
Securities registered pursuant to Section 12(b) of the Act:
Title of each class | Trading Symbols | Name of each exchange on which registered | ||
Common Stock, par value $0.0001 per share | KLR | NYSE American LLC | ||
Warrants, at an exercise price of $11.50 per share of Common Stock | KLR WS | NYSE American LLC |
Indicate by check mark whether the registrant is an emerging growth company as defined in Rule 405 of the Securities Act of 1933 (§230.405 of this chapter) or Rule 12b-2 of the Securities Exchange Act of 1934 (§240.12b-2 of this chapter).
Emerging growth company ☒
If an emerging growth company, indicate by check mark if the registrant has elected not to use the extended transition period for complying with any new or revised financial accounting standards provided pursuant to Section 13(a) of the Exchange Act. ☐
Item 2.02 | Results of Operations and Financial Condition. |
On February 16, 2021, Kaleyra, Inc. (the “Company”) issued a press release announcing its financial results for the quarter and fiscal year ended December 31, 2020. A copy of the Company’s press release is attached as Exhibit 99.1 to this Current Report and is incorporated herein by reference.
The information contained in this Item 2.02, including Exhibit 99.1 attached hereto, shall not be deemed “filed” with the Securities and Exchange Commission nor incorporated by reference in any registration statement filed by the Company under the Securities Act of 1933, as amended.
Item 5.02 | Departure of Directors or Certain Officers; Election of Directors; Appointment of Certain Officers; Compensatory Arrangements of Certain Officers. |
Chief Executive Officer and Chief Financial Officer RSU Awards
On February 10, 2021, the Compensation Committee of the Board of Directors of the Company (the “Committee”) approved an award of 115,000 restricted stock units (“RSUs”) to Mr. Dario Calogero, the Company’s Chief Executive Officer, with such award to vest over 16 quarters beginning May 1, 2021, and then on August 1, November 1 and February 1, ending February 1, 2025. The Company will withhold shares of stock subject to the RSUs at the time of vesting for the purposes of satisfying any tax withholding obligations which arise in connection with the vesting of such RSUs issued to Mr. Calogero. The RSU award is being made using the form of Notice of RSU Grant and RSU Agreement previously filed by the Company as Exhibit 10.11 to the Current Report on Form 8-K as filed with the SEC on December 2, 2019, and the above summary of the terms of these RSUs is qualified in its entirety by reference to such form.
On February 10, 2021 the Committee also approved an award of 60,000 RSUs to Mr. Giacomo Dall’Aglio, the Company’s Chief Financial Officer, with such award to vest over 16 quarters beginning May 1, 2021, and then on August 1, November 1 and February 1, ending February 1, 2025. Also, the Company will withhold shares of stock subject to the RSUs at the time of vesting for the purposes of satisfying any tax withholding obligations which arise in connection with the vesting of such RSUs issued to Mr. Dall’Aglio. The RSU award is being made using the form of Notice of RSU Grant and RSU Agreement previously filed by the Company as Exhibit 10.11 to the Current Report on Form 8-K as filed with the SEC on December 2, 2019, and the above summary of the terms of these restricted stock units is qualified in its entirety by reference to such form.
Item 7.01 | Regulation FD Disclosure |
The Company will host a conference call to discuss its fourth quarter and fiscal year end 2020 financial results on February 16, 2021, at 8:00 a.m. Eastern time. On February 16, 2021, the Company posted an investor presentation to the Investor Relations section of its website www.kaleyra.com, in connection with the earnings call for the quarter and fiscal year ended December 31, 2020. A copy of the investor presentation is being furnished as Exhibit 99.2 to this Current Report on Form 8-K.
The information contained in, or incorporated into, this Item 7.01 of this Report, including Exhibit 99.2 attached hereto, is furnished under Item 7.01 of Form 8-K and shall not be deemed “filed” for the purposes of Section 18 of the Exchange Act or otherwise subject to the liabilities of that section, and shall not be deemed to be incorporated by reference into the filings of the Company under the Securities Act or the Exchange Act regardless of any general incorporation language in such filings.
This Report shall not be deemed an admission as to the materiality of any information in this Report that is being disclosed pursuant to Regulation FD.
Please refer to Exhibit 99.2 for a discussion of certain forward-looking statements included therein and the risks and uncertainties related thereto.
Item 9.01 | Financial Statements and Exhibits. |
(a) Not applicable.
(b) Not applicable.
(c) Not applicable.
(d) Exhibits.
The exhibits required by this item are set forth on the Exhibit Index attached hereto.
Exhibit | ||
99.1 | Press Release dated February 16, 2021. | |
99.2 | Investor Presentation slideshow in use beginning February 16, 2021. | |
104 | Cover Page Interactive Data File (embedded within the Inline XBRL document). |
SIGNATURE
Pursuant to the requirements of the Securities Exchange Act of 1934, the registrant has duly caused this report to be signed on its behalf by the undersigned hereunto duly authorized.
Dated: February 16, 2021
By: | /s/ Dario Calogero | |
Name: | Dario Calogero | |
Title: | Chief Executive Officer and President |
Exhibit 99.1
Kaleyra Announces Highest Quarterly Revenue for Fourth Quarter and Full Year 2020 Financial Results Exceeding Revenue Guidance
Total fourth quarter revenue of $44.3 million, a 16% increase from Q3 and up 24% from the same period a year ago
Revenue from US Customers was $6.9 million, up over 100% from the same period a year ago
Delivered 7.1 billion billable messages and connected 1.4 billion voice calls
New York and Vienna, VA – February 16, 2021 - Kaleyra, Inc. (NYSE: KLR) (KLR WS) (“Kaleyra” or the “Company”) a rapidly growing cloud communications software provider delivering a secure system of application programming interfaces (APIs) and connectivity solutions in the API/Communications Platform as a Service (CPaaS) market, today announced financial results for the fourth quarter and full year ended December 31, 2020.
“We once again have exceeded our revenue guidance and delivered our strongest quarter ever. The fourth quarter was an excellent finish to a challenging year, and our continued success in this environment serves to validate the strength of our model and strategy. As enterprise customers are increasingly looking for new ways to engage with their customers, our platform and strong value proposition have made Kaleyra a mission critical addition to their customer outreach,” commented Dario Calogero, Kaleyra’s Founder and Chief Executive Officer. “We are thrilled to begin 2021 with a high level of momentum provided by strong execution from our entire team, our robust platform of flexible APIs, and our unwavering commitment to helping our customers succeed.”
Fourth Quarter 2020 Financial Highlights
• | Revenue: Total revenue for the fourth quarter of 2020 was $44.3 million, a 16% increase when compared to Q3 revenue of $38.3 million and up 24% compared to $35.6 million in the fourth quarter of 2019. |
• | Gross Profit: Gross profit for the fourth quarter of 2020 was $7.8 million, a 5% increase when compared to Q3 gross profit of $7.5 million and down 3% compared to $8.1 million for the fourth quarter of 2019. Gross margin for the fourth quarter of 2020 was 18%. Declining volumes in the first half of the year caused by COVID created a negative residual effect on margins in the fourth quarter. |
• | Net Loss: Net loss for the fourth quarter of 2020 was $(4.5) million, or $(0.15) per share, based on 29.7 million weighted-average shares outstanding. During the fourth quarter of 2019, net loss was $(3.6) million, or $(0.25) per share, based on 14.3 million weighted-average shares outstanding. |
• | Adjusted EBITDA comparable to previous year: Adjusted EBITDA comparable to previous year was $3.1 million for the fourth quarter of 2020, compared to $5.6 million for the fourth quarter of 2019. The decline in adjusted EBITDA is attributed to the increased headcount, predominantly in engineering talent, that has been hired to execute on emerging growth opportunities to develop and deliver new products and services. |
1
Full Year 2020 Financial Highlights
• | Revenue: Total revenue for the full year 2020 was $147.4 million, a 14% increase when compared to 2019 revenue of $129.6 million |
• | Gross Profit: Gross profit for the full year 2020 was $24.4 million, a 7% decrease when compared to 2019 gross profit of $26.4 million. |
• | Net Loss: Net loss for the full year 2020 was $(26.8) million, compared to 2019 net loss of $(5.5) million. |
• | Adjusted EBITDA comparable to previous year: Adjusted EBITDA comparable to previous year was $7.5 million for the full year 2020, compared to $11.1 million for the full year 2019. |
• | Liquidity: As of December 31, 2020, cash and cash equivalents were $33.0 million. Cash used in operating activities was $11.5 million during the full year 2020, compared with cash provided in operating activities of $6.5 million during the full year 2019. |
• | Liabilities: Total liabilities were reduced by $30.2 million, down 19% since December 31, 2019. |
Recent Business Highlights
• | In Q4, Kaleyra delivered 7.1 billion billable messages, a 13% increase from the previous period, and connected 1.4 billion voice calls, up 100% period over period. For the full year 2020, Kaleyra processed nearly 26 billion billable SMS messages and 4 billion voice calls. |
• | Winner of the 2021 Juniper Research Future Digital Award for Telco Innovation in the category of Best RCS Provider. |
• | A new strategic partnership with WebEngage, India’s leading marketing automation services provider for B2C businesses, combining Kaleyra’s global cloud communication services with WebEngage’s world-class marketing automation and customer data platform capabilities. |
Financial Outlook
Kaylera’s outlook assumes that the Company’s largest markets, Italy and India, will continue to see improvements in their economies coming out of the COVID-19 pandemic. It also takes into consideration that there could still be continued pressure on transaction levels in certain regions and on certain business lines. As of February 16, 2021, Kaleyra is providing guidance for its first quarter and full year 2021 as follows:
• | First Quarter 2021 Guidance: Total revenue is expected to be in the range of $40.5 - $41.5 million, absent an accelerated wave of COVID cases and shutdowns. |
• | Full Year 2021 Guidance: Total revenue is expected to be in the range of $183 - $185 million, above our previous guidance. |
2
Quarterly Conference Call
Management will conduct an investor conference call that same day at 8:00 a.m. EST (5:00 a.m. PST) to discuss these results. Questions will be taken after management’s presentation. A live webcast of the call and the replay will be available in the Investors section of the Kaleyra website at https://investors.kaleyra.com/news-events/ir-calendar.
To Participate via Telephone:
US: 877-407-0792
International: 201-689-8263
Conference ID: 13716315
Replay of the call:
US: 844-512-2921
International: 412-317-6671
Start Date: Tuesday February 16, 2020, 10:00 a.m. ET
End Date: Tuesday March 2, 2020, 11:59 p.m. ET
About Kaleyra Inc.
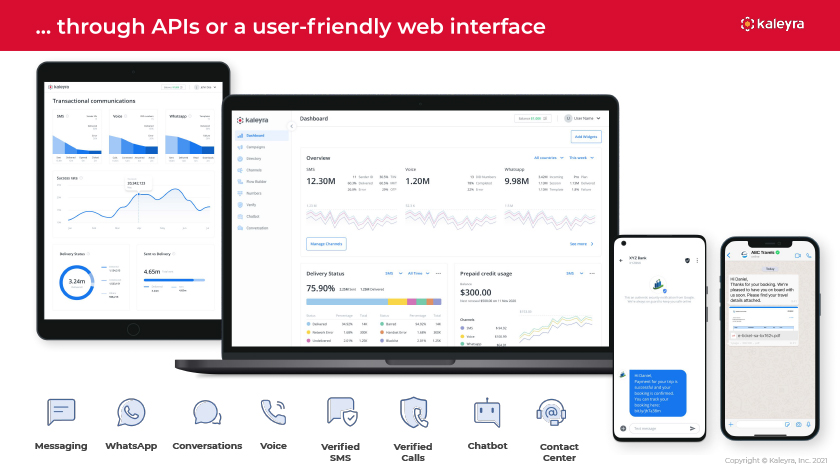
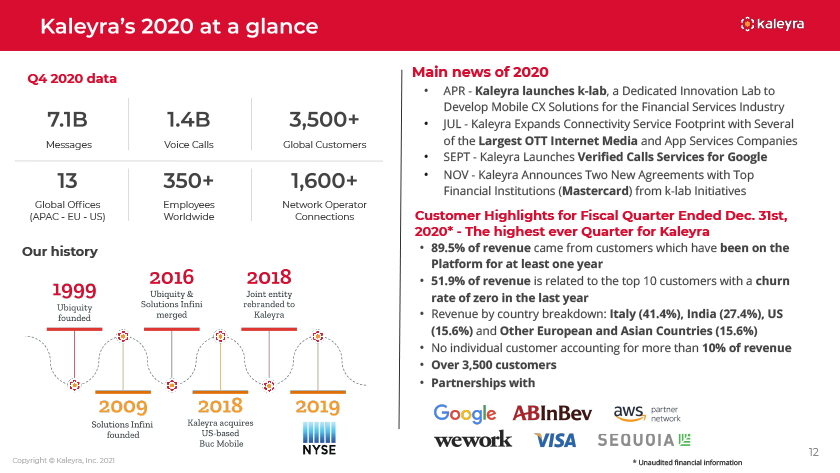
Kaleyra, Inc. (NYSE American: KLR) (KLR WS), is a global group providing mobile communication services for financial institutions and enterprises of all sizes worldwide. Through its proprietary platform, Kaleyra manages multi-channel integrated communication services on a global scale, comprising of messages, push notifications, e-mail, instant messaging, voice services and chatbots. Kaleyra’s technology today makes it possible to safely and securely manage billions of messages monthly with a reach to hundreds of MNOs and over 190 countries. For more information: https://www.kaleyra.com/.
Forward-Looking Statements
This press release contains forward-looking statements within the meaning of U.S. federal securities laws. Such forward-looking statements include, but are not limited to, statements regarding the financial statements of Kaleyra, its product and customer developments, its expectations, hopes, beliefs, intentions, plans, prospects or strategies regarding the future revenues and the business plans of Kaleyra’s management team, and the impact of the COVID-19 pandemic on its business and financial performance. Any statements contained herein that are not statements of historical fact may be deemed to be forward-looking statements. In addition, any statements that refer to projections, forecasts or other characterizations of future events or circumstances, including any underlying assumptions, are forward-looking statements. The words “anticipate,” “believe,” “continue,” “could,” “estimate,” “expect,” “intends,” “may,” “might,” “plan,” “possible,” “potential,” “predict,” “project,” “should,” “would” and similar expressions may identify forward-looking statements, but the absence of these words does not mean that a statement is not forward-looking. The forward-looking statements contained in this press release are based on certain assumptions and analyses made by the management of Kaleyra in light of their respective experience and perception of historical trends, current conditions and expected future developments and their potential effects on Kaleyra as well as other factors they believe are appropriate in the circumstances. There can be no assurance that future developments affecting Kaleyra will be those anticipated. These forward-looking statements involve a number of risks, uncertainties (some of which are beyond the control of the parties) or other assumptions that may cause actual results or performance to be materially different from those expressed or implied by these forward-looking statements, including the mix of services utilized by Kaleyra’s customers and such customers’ needs for these services, market acceptance of new service offerings, the ability of Kaleyra to expand what it does for existing customers as well as to add new customers, that Kaleyra will have sufficient capital to operate as anticipated, and the impact that the novel coronavirus and the illness, COVID-19, that it causes, as well as governmental responses to deal with the spread of this illness and the reopening of economies that have been closed as part of these responses, may have on Kaleyra’s operations, the demand for Kaleyra’s products, global supply chains and economic activity in general. Should one or more of these risks or uncertainties materialize or should any of the assumptions being made prove incorrect, actual results may vary in material respects from those projected in these forward-looking statements. We undertake no obligation to update or revise any forward-looking statements, whether as a result of new information, future events or otherwise, except as may be required under applicable securities laws.
3
Non-GAAP Financial Measure and Related Information
This press release includes reference to Adjusted EBITDA, a financial measure that is not prepared in accordance with accounting principles generally accepted in the United States (“GAAP”). Adjusted EBITDA is defined as of any date of calculation, as the consolidated pro forma earnings/(loss) of Kaleyra and its subsidiaries, before finance income and finance cost (including bank charges), tax, depreciation and amortization, plus (i) transaction expenses, (ii) without duplication of clause (i), severance or change of control payments, (iii) any expenses related to company restructuring, (iv) the Adjusted EBITDA for pre-acquisition period of subsidiaries, (v) any compensation expenses relating to stock options, restricted stock units, restricted stock or similar equity interests as may be issued by Kaleyra or any of its subsidiaries to its or their employees and (vi) any provision for the write down of assets. Management uses Adjusted EBITDA, among other reasons, as it is a metric for determining whether there will be an earnout payment in accordance with the terms of the Stock Purchase Agreement. This non-GAAP financial measure is not a measure prepared in accordance with GAAP and might not be consistent with similar measures used by other companies. It shall not be considered as an alternative to any other measures of performance prepared under GAAP.
Investor Contacts
Michael Bowen
ICR, Inc.
Michael.Bowen@icrinc.com
ir@kaleyra.com
203-682-8299
Marc P. Griffin
ICR, Inc.
Marc.Griffin@icrinc.com
ir@kaleyra.com
646-277-1290
4
KALEYRA, INC.
Condensed Consolidated Balance Sheets
(Unaudited, in thousands)
December 31, 2020 | December 31, 2019 | |||||||
ASSETS | ||||||||
Current assets: | ||||||||
Cash and cash equivalents | $ | 32,970 | $ | 16,103 | ||||
Restricted cash | — | 20,894 | ||||||
Short-term investments | 4,843 | 5,124 | ||||||
Trade receivables, net | 43,651 | 39,509 | ||||||
Prepaid expenses | 1,447 | 648 | ||||||
Other current assets | 2,134 | 4,224 | ||||||
|
|
|
| |||||
Total current assets | 85,045 | 86,502 | ||||||
Property and equipment, net | 6,726 | 3,393 | ||||||
Intangible assets, net | 7,574 | 9,353 | ||||||
Goodwill | 16,657 | 16,953 | ||||||
Deferred tax assets | 703 | — | ||||||
Other long-term assets | 1,797 | 1,203 | ||||||
|
|
|
| |||||
Total assets | $ | 118,502 | $ | 117,404 | ||||
|
|
|
| |||||
LIABILITIES AND STOCKHOLDERS’ EQUITY (DEFICIT) | ||||||||
Current liabilities: | ||||||||
Accounts payable | $ | 51,768 | $ | 63,320 | ||||
Debt for forward share purchase agreements | 483 | 34,013 | ||||||
Notes payable | — | 1,667 | ||||||
Notes payable due to related parties | 7,500 | 9,411 | ||||||
Lines of credit | 5,273 | 3,627 | ||||||
Current portion of bank and other borrowings | 10,798 | 7,564 | ||||||
Deferred revenue | 3,666 | 1,397 | ||||||
Preference shares | — | 683 | ||||||
Preference shares due to related parties | — | 1,847 | ||||||
Payroll and payroll related accrued liabilities | 3,292 | 1,038 | ||||||
Other current liabilities | 5,988 | 1,379 | ||||||
|
|
|
| |||||
Total current liabilities | 88,768 | 125,946 | ||||||
Long-term portion of bank and other borrowings | 31,974 | 16,134 | ||||||
Long-term portion of notes payable | 2,700 | — | ||||||
Long-term portion of notes payable due to related parties | — | 7,500 | ||||||
Long-term portion of employee benefit obligation | 1,886 | 1,398 | ||||||
Deferred tax liabilities | — | 2,045 | ||||||
Other long-term liabilities | 603 | 3,155 | ||||||
|
|
|
| |||||
Total liabilities | 125,931 | 156,178 | ||||||
|
|
|
| |||||
Stockholders’ equity (deficit): | ||||||||
Common stock | 3 | 2 | ||||||
Additional paid-in capital | 93,628 | 2,143 | ||||||
Treasury stock, at cost | (30,431 | ) | — | |||||
Accumulated other comprehensive income (loss) | (2,826 | ) | 74 | |||||
Accumulated deficit | (67,803 | ) | (40,993 | ) | ||||
|
|
|
| |||||
Total stockholders’ equity (deficit) | (7,429 | ) | (38,774 | ) | ||||
|
|
|
| |||||
Total liabilities and stockholders’ equity (deficit) | $ | 118,502 | $ | 117,404 | ||||
|
|
|
|
5
KALEYRA, INC.
Condensed Consolidated Statements of Operations
(Unaudited, in thousands, except per share data)
Three Months Ended December 31, | Year ended December 31, | |||||||||||||||
2020 | 2019 | 2020 | 2019 | |||||||||||||
Revenue | $ | 44,268 | $ | 35,633 | $ | 147,368 | $ | 129,558 | ||||||||
Cost of revenue | 36,421 | 27,560 | 122,932 | 103,205 | ||||||||||||
|
|
|
|
|
|
|
| |||||||||
Gross profit | 7,847 | 8,073 | 24,436 | 26,353 | ||||||||||||
|
|
|
|
|
|
|
| |||||||||
Operating expenses: | ||||||||||||||||
Research and development | 2,330 | 1,441 | 9,745 | 5,310 | ||||||||||||
Sales and marketing | 2,711 | 1,639 | 12,866 | 6,031 | ||||||||||||
General and administrative | 7,458 | 6,764 | 28,195 | 17,431 | ||||||||||||
|
|
|
|
|
|
|
| |||||||||
Total operating expenses | 12,499 | 9,844 | 50,806 | 28,772 | ||||||||||||
|
|
|
|
|
|
|
| |||||||||
Loss from operations | (4,652 | ) | (1,771 | ) | (26,370 | ) | (2,419 | ) | ||||||||
Other income, net | 21 | 30 | 112 | 136 | ||||||||||||
Financial income (expense), net | (448 | ) | (233 | ) | (1,475 | ) | (439 | ) | ||||||||
Foreign currency income (loss) | (558 | ) | (115 | ) | (1,353 | ) | (517 | ) | ||||||||
|
|
|
|
|
|
|
| |||||||||
Loss before income tax expense (benefit) | (5,637 | ) | (2,089 | ) | (29,086 | ) | (3,239 | ) | ||||||||
Income tax expense (benefit) | (1,111 | ) | 1,554 | (2,276 | ) | 2,273 | ||||||||||
|
|
|
|
|
|
|
| |||||||||
Net loss | $ | (4,526 | ) | $ | (3,643 | ) | $ | (26,810 | ) | $ | (5,512 | ) | ||||
|
|
|
|
|
|
| �� | |||||||||
Net loss per common share, basic and diluted | $ | (0.15 | ) | $ | (0.25 | ) | $ | (1.09 | ) | $ | (0.48 | ) | ||||
|
|
|
|
|
|
|
| |||||||||
Weighted-average shares used in computing net loss per common share, basic and diluted | 29,690,742 | 14,322,326 | 24,652,004 | 11,603,381 | ||||||||||||
|
|
|
|
|
|
|
|
6
KALEYRA, INC.
Condensed Consolidated Statements of Cash Flows
(Unaudited, in thousands)
Year Ended December 31, | ||||||||
2020 | 2019 | |||||||
Cash Flows from Operating Activities: | ||||||||
Net loss | $ | (26,810 | ) | $ | (5,512 | ) | ||
Adjustments to reconcile net loss to net cash provided by (used in) operating activities: | ||||||||
Depreciation and amortization | 2,773 | 2,648 | ||||||
Stock-based compensation and preference share | 19,415 | 2,070 | ||||||
Non-cash settlement of preference share liability | (2,486 | ) | — | |||||
Allowance for doubtful accounts | 361 | 716 | ||||||
Fair value changes on marketable securities | (6 | ) | — | |||||
Employee benefit obligation | 527 | 315 | ||||||
Non-cash interest expense | 191 | 657 | ||||||
Deferred taxes | (2,009 | ) | (14 | ) | ||||
Change in operating assets and liabilities: | ||||||||
Trade receivables | (1,016 | ) | (10,427 | ) | ||||
Other current assets | 1,197 | (2,039 | ) | |||||
Other long-term assets | (497 | ) | 47 | |||||
Accounts payable | (11,832 | ) | 15,145 | |||||
Other current liabilities | 6,821 | 251 | ||||||
Deferred revenue | 2,219 | (64 | ) | |||||
Long-term liabilities | (304 | ) | 2,660 | |||||
|
|
|
| |||||
Net cash provided by (used in) operating activities | (11,456 | ) | 6,453 | |||||
|
|
|
| |||||
Cash Flows from Investing Activities: | ||||||||
Purchase of short-term investments | (7,917 | ) | (5,868 | ) | ||||
Sale of short-term investments | 8,156 | 3,882 | ||||||
Purchase of property and equipment | (1,163 | ) | (1,413 | ) | ||||
Sale of property and equipment | 16 | 38 | ||||||
Capitalized software development costs | (2,411 | ) | (602 | ) | ||||
Purchase of intangible assets | (6 | ) | (16 | ) | ||||
Cash, cash equivalents and restricted cash acquired in the reverse merger | — | 21,666 | ||||||
|
|
|
| |||||
Net cash provided by (used in) investing activities | (3,325 | ) | 17,687 | |||||
|
|
|
| |||||
Cash Flows from Financing Activities: | ||||||||
Payment of deferred consideration for the acquisition of Buc Mobile | — | (4,000 | ) | |||||
Payment of deferred consideration for the acquisition of Solutions Infini | — | (5,097 | ) | |||||
Change in line of credit | 1,277 | 1,973 | ||||||
Borrowings on term loans | 24,436 | 16,670 | ||||||
Repayments on term loans | (8,651 | ) | (4,844 | ) | ||||
Repayments on notes payable | (11,478 | ) | — | |||||
Repurchase of common stock in connection with forward share purchase agreements | (30,431 | ) | — | |||||
Payments related to forward share purchase agreements | (1,452 | ) | — | |||||
Proceeds from issuance of stock in public offering, net of issuance costs | 36,152 | — | ||||||
|
|
|
| |||||
Net cash provided by financing activities | 9,853 | 4,702 | ||||||
|
|
|
| |||||
Effect of exchange rate changes on cash, cash equivalents and restricted cash | 901 | (52 | ) | |||||
|
|
|
| |||||
Net increase (decrease) in cash, cash equivalents and restricted cash | (4,027 | ) | 28,790 | |||||
Cash, cash equivalents and restricted cash, beginning of period | 36,997 | 8,207 | ||||||
|
|
|
| |||||
Cash, cash equivalents and restricted cash, end of period | $ | 32,970 | $ | 36,997 | ||||
|
|
|
|
7
KALEYRA, Inc.
Adjusted EBITDA Reconciliation of GAAP to Non-GAAP Financial Information
For the Year and the Three Months Ended December 31, 2020 and 2019
(Unaudited, in millions)
Years Ended December 31, | Three Months Ended December 31, | |||||||||||||||
Adjusted EBITDA | 2020 | 2019 | 2020 | 2019 | ||||||||||||
Net loss | $ | (26.8 | ) | $ | (5.5 | ) | $ | (4.5 | ) | $ | (3.6 | ) | ||||
Other income, net | (0.1 | ) | (0.1 | ) | (0.0 | ) | (0.0 | ) | ||||||||
Financial income (expense), net | 1.5 | 0.4 | 0.4 | 0.2 | ||||||||||||
Foreign currency income (loss) | 1.4 | 0.5 | 0.6 | 0.1 | ||||||||||||
Income tax expense (benefit) | (2.3 | ) | 2.3 | (1.1 | ) | 1.6 | ||||||||||
Loss from operations | $ | (26.4 | ) | $ | (2.4 | ) | $ | (4.7 | ) | $ | (1.8 | ) | ||||
Depreciation and amortization | 2.8 | 2.6 | 0.9 | 0.7 | ||||||||||||
Stock-based compensation, preference shares and others | 20.3 | 2.1 | 4.0 | 1.6 | ||||||||||||
Transaction and one-off costs | 6.5 | 8.3 | 1.4 | 4.6 | ||||||||||||
Company restructuring | 0.0 | 0.5 | 0.0 | 0.5 | ||||||||||||
Adjusted EBITDA | $ | 3.2 | $ | 11.1 | $ | 1.6 | $ | 5.6 | ||||||||
Costs not comparable to previous year (1) | 4.3 | 0.0 | 1.5 | 0.0 | ||||||||||||
Adjusted EBITDA comparable to PY | $ | 7.5 | $ | 11.1 | $ | 3.1 | $ | 5.6 |
(1) | These costs represent public company costs that were not incurred in 2019. These costs are expected to occur going forward. |
8
AMERICAN Copyright © Ka eyra, Inc. 2021
Exhibit 99.2
INVESTOR PRESENTATION This communication is for informationa purposes on y. The information contained herein does not purport to be a -inc usive. The data contained herein is derived from various interna and externa sources. No representation is made as to the reasonab eness of the assumptions made within or the accuracy or comp eteness of any projections, mode ing or back-testing or any other information contained herein. Any data on past performance, mode ing or back-testing contained herein is no indication as to future performance. Ka eyra, Inc. ( Ka eyra or, the Company ) assumes no ob igation to update the information in this communication. This presentation is not an offer to buy or the so icitation of an offer to se Ka eyra securities. FORWARD OOKING STATEMENTS This presentation contains forward- ooking statements within the meaning of U.S. federa securities aws. Such forward- ooking statements inc ude, but are not imited to, statements regarding the expectations, hopes, be iefs, intentions, p ans, prospects or strategies regarding the future business pans of Kaeyra’s management team and the Company’s financia resu ts. Any statements contained herein that are not statements of historica fact may be deemed to be forward- ooking statements. In addition, any statements that refer to projections, forecasts or other characterizations of future events or circumstances, inc uding any under ying assumptions, are forward- ooking statements. The words anticipate, be ieve, continue, cou d, estimate, expect, intends, may, might, p an, possib e, potentia , predict, project, shoud, wou d and simi ar expressions may identify forward- ooking statements, but the absence of these words does not mean that a statement is not forward- ooking. The forward- ooking statements contained in this presentation are based on certain assumptions of Ka eyra’s management in ight of its experience and perception of historica trends, current conditions and expected future deve opments and their potentia effects on Ka eyra as we as other factors Ka eyra’s management be ieves are appropriate in the circumstances. There can be no assurance that future deve opments affecting Ka eyra wi be those anticipated. These forward- ooking statements invo ve a number of risks, uncertainties (some of which are beyond the contro of Ka eyra) or other assumptions that may cause actua resu ts or performance to be materia y different from those expressed or imp ied by these forward- ooking statements. Shou d one or more of these risks or uncertainties materia ize, or shou d any of the assumptions being made prove incorrect, actua resu ts may vary in materia respects from those projected in these forward- ooking statements. Ka eyra undertakes no ob igation to update or revise any forward- ooking statements, whether as a resu t of new information, future events or otherwise, except as may be required under app icab e securities aws. Certain industry and market data information in this presentation is based on the estimates of Ka eyra’s management. Ka eyra’s management obtained the industry, market and competitive position data used throughout this presentation from interna estimates and research as we as from industry pub ications and research, surveys and studies conducted by third parties. Ka eyra’s management be ieves these estimates to be accurate as of the date of this presentation. However, this information may prove to be inaccurate because of the method by which management obtained some of the data for its estimates or because this information cannot a ways be verified due to the imits on the avai abi ity and re iabi ity of raw data, the vo untary nature of the data gathering process. NON-GAAP FINANCIA MEASURE AND RE ATED INFORMATION This presentation inc udes reference to Adjusted EBITDA, a financia measure that is not prepared in accordance with U.S. genera y accepted accounting princip es ( GAAP ). Adjusted EBITDA is defined as of any date of ca cu ation, the conso idated pro forma earnings of Ka eyra and its subsidiaries, before finance income and finance cost (inc uding bank charges), tax, depreciation and amortization ca cu ated from the unaudited conso idated financia statements of such party and its subsidiaries, p us (i) transaction expenses, (ii) without dup ication of c ause (i), severance or change of contro payments, (iii) any expenses re ated to company restructuring, (iv) the Adjusted EBITDA for pre-acquisition period of subsidiaries, (v) any compensation expenses re ating to stock options, restricted stock units, restricted stock or simi ar equity interests as may be issued by Ka eyra or any of its subsidiaries to its or their emp oyees and (vi) any provision for the write down of assets. The pre-2019 pro forma earnings of Ka eyra, which is an Ita ian company, and its subsidiaries, which inc ude subsidiaries outside of the U.S., may not be prepared in conformance with Artic e 11 of Regu ation S-X of the U.S. Securities and Exchange Commission (the SEC ). Ka eyra’s management be ieves that this non-GAAP measure of Ka eyra’s financia resu ts wi provide usefu information to investors regarding certain financia and business trends re ating to Ka eyra’s anticipated financia condition and resu ts of operations. Investors shou d not re y on any sing e financia measure to eva uate Ka eyra’s anticipated business. Certain of the financia metrics in this presentation can be found in Ka eyra’s Form 10-K for the fisca year ended December 31, 2019, fi ed with the SEC on Apri 22, 2020, and in Ka eyra’s Form 10-K for the year ended December 31, 2020 that wi be fi ed with the SEC no ater than March 16, 2021, and the reconci iation of Adjusted EBITDA can be found on s ide 25 of this presentation. TRADEMARKS AND INTE ECTUA PROPERTY A trademarks, service marks, and trade names of Ka eyra and its subsidiaries or affi iates used herein are trademarks, service marks, or registered trademarks of Ka eyra as noted herein. Any other product, company names, or ogos mentioned herein are the trademarks and/or inte ectua property of their respective owners. 2 Copyright © Ka eyra, Inc. 2021
We’re a Communication P atform as a Service, or , for short.
Founded in 1999 and isted on the NYSE in 2019.
Companies need to communicate with their customers: Ka eyra offers a wide variety of , that deve opers and enterprises can access through APIs or a user-friend y web interface. Messaging WhatsApp Voice Chatbot Numbers Conversations F ow Bui der ook Up Emai Contact Center Push Verify Notifications Video WebRTC Verified SMS Verified Ca s Copyright © Ka eyra, Inc. 2021
through APis or a user-friend y web interface De ve )‘Status SentV’ De ry e 4.65m T tf a..r-1s SMS Voice Whatsapp .. F owBudOer 12.30M 1.20M 9.98M .o M P ...... very SftmOfe ) De ivery Status Prepaid credit usage 75.90% $300.00 S Trave sO [)Hi Danie , Thanks oryourbook ng.We’re p easedtohaveyouonboardwith ussoon.Pk asefindyourtrave detai sa ac::hed . .. e-ticket-sa·b 16Zv.pdf G @ J. Messaging WhatsApp Conversations Voice Verified Verified Chatbot Contact SMS Ca s Center
Whether it’s for OTPs, transactiona a erts, promotiona communications, video app ications, or making phone ca s to customers, a most any enterprise makes use of communication services. We cater to businesses across many vertica s inc uding financia services, e-commerce, retai , hea thcare, trave , education. Hea thcare (virtua visit) Financia Services (OTP) Trave (C ick-to-Ca )
CPaaS market is expected to reach $25.9 bi ion in 2025 from $7.2 bi ion in 2020 CAGR . 5% 29 Average Expected CAGR: 29.5% Source: Juniper Research, CPaaS-2020-2025-Deep-Dive-Data-and-Forecasting Copyright © Ka eyra, Inc. 2021 How the adjacent markets wi evo ve A2P Messaging Market(1) The size of the goba A2P messaging market wi grow from $61B in 2019 to $78B in 2022 Contact Centers Market(2) CCaaS experiences robust growth that achieves a revenue CAGR of 29% over the 2019-2024 forecast period ($5 bi ion to $17.9 bi ion). Chatbots Usage(3) Chatbots interactions to reach $2.8 bi ion by 2023, as Conversationa AI becomes the future of Hea thcare, increasing from an estimated $21 mi ion in 2018, with an average annua growth of 167%. Hea thcare to represent 10% of a chatbot interactions across key vertica s such as banking, eCommerce and socia media by 2023. Video Conferencing Market (4) The g oba video conferencing market size was $5.32 bi ion in 2019 and is projected to reach $10.92 bi ion by 2027, exhibiting a CAGR of 9.7% during the forecast period. (1) Statista estimates, Credence Research (2020) (2) Gartner, Forecast Ana ysis: Contact Centers, Wor dwide (2021) (3) Source: Juniper Research (2020) (4) Source: Fortune Business Insights (2020) 8
A CPaaS reduces the immense compexity of c oud communications by estab ishing connections between businesses and network operators/carriers. Indeed, building a network of carriers is difficult and takes years of negotiations. Thanks to CPaaS, businesses access a variety of communication too s without building expensive back-end infrastructure. NETWORK OPERATORS—END USERS BUSINESSES 9 Copyright © Ka eyra, Inc. 2021
C oud And On-premise In ine with customers’ needs, Ka eyra continues investing in its data centers whi e enab ing pub ic c oud (99.99% uptime), hybrid c oud, private c oud and on-premise dep oyments Connectivity Ka eyra is a network operator itse f, O O (Other icensed Operator). It has over 1600 network connections and 210 direct carrier connections to ensure high qua ity, unmatched pricing, and de ivery efficiency High De iverabi ity Inte igent high-priority routing assures unpara e ed speed/throughput, consistency and pricing Sca abi ity With the abi ity to transmit high vo umes of messages and easi y hand e traffic spikes, Ka eyra answers to the requests of g oba customers for sca abi ity and flexibi ity APIs or UI based, for deve opers and business users P atform functiona ity is avai ab e through easy-to-use, frequent y-updated APIs a ong with error ogs; or through a user-friend y web interface. 10 Copyright © Ka eyra, Inc. 2021
24/7 G oba support*—Average Support Response Time: 30 mins —99% Ca Answer Rate—Dedicated support to the top 150 customers—Detai ed technica documentation An exce ent company to work with, fantastic team of re ationship managers, he p is never too far when you are working with Ka eyra. We have been working with Ka eyra for 3 years now and every time there is he p needed, they have provided us with exce ent and qua ity services. I have been using for 8 months to integrate the sms service for my bookings in the android app. I was amazed to see that with on y one ine of code, sms was working. I tried Whatsapp and audio ca features. *Ka eyra’s statistics as of December 2020 Copyright © Ka eyra, Inc. 2021
Q4 2020 data Messages Voice Ca s G oba Customers G oba Offices Emp oyees Network Operator (APAC—EU—US) Wor dwide Connections Our history Copyright © Ka eyra, Inc. 2021 Main news of 2020 APR—Ka eyra aunches k- ab, a Dedicated Innovation ab to Deve op Mobi e CX So utions for the Financia Services Industry JU —Ka eyra Expands Connectivity Service Footprint with Severa of the argest OTT Internet Media and App Services Companies SEPT—Ka eyra aunches Verified Ca s Services for Goog e NOV—Ka eyra Announces Two New Agreements with Top Financia Institutions (Mastercard) from k- ab Initiatives Customer High ights for Fisca Quarter Ended Dec. 31st, 2020*—The highest ever Quarter for Ka eyra 89.5% of revenue came from customers which have been on the P atform for at east one year 51.9% of revenue is re ated to the top 10 customers with a churn rate of zero in the ast year Revenue by country breakdown: Ita y (41.4%), India (27.4%), US (15.6%) and Other European and Asian Countries (15.6%) No individua customer accounting for more than 10% of revenue Over 3,500 customers Partnerships with 12 * Unaudited financia information
Dario Ca ogero Ashish Agarwa Giacomo Da ’Ag io Aniketh Jain Chief Executiv Chief Techno ogy Officer cia Officer Chief Revenue Officer Fi ippo Monastra Soren Schafft Nico a Junior Vitto Chief of Staff Genera Manager, Connectivity and Chief Product Officer Industry So utions 13 Copyright © Ka eyra, Inc. 2021
Avi Katz, Ph.D Dario Ca ogero Emi io Hirsch, Ph.D Matteo odrini John Miku sky Nei Miotto Chairman Director Director Director Director . 14 Copyright © Ka eyra, Inc. 2021
The highest ever quarter for Ka eyra, tota ing $44.3M in revenue High y predictab e revenue with 65% of K R’s growth in Q4 2020 coming from its existing customers No individua customer accounting for more than 10% of revenue About 48% of revenue generated in Europe, 27% from India and 16% from the US Q4 2020 Revenue Sp it Q4 2020 Geographic Mix Some of our customers Copyright © Ka eyra, Inc. 2021
FINANCIA OVERVIEW
Revenue* Gross Margin* Adj. EBITDA(1) Reduction in Tota iabi ities* Highest ever quarter y revenue Overperforming the guidance previous y disc osed to the market Over 65% of quarter y growth from existing customers Recovering from the effect of the COVID-19 pandemic, despite soft ockdown in some geographies Benefit from the renegotiation of agreements in premium services in Ita y Increased penetration in the US connectivity market Backs out $4.0M of stock-based compensation and $1.4M of transaction and one-off costs Inc udes $1.5M initia pub ic company comp iance costs not inc uded in Q4 2019 Comparab e Adj. EBITDA was $3.1M before pub ic company comp iance costs, considering a so about $1.3M in personne cash-costs to strengthen our growth A portion of the new sources procured on the market have been used to sett e a most a the iabi ities deriving from the business combination (deSPAC process); Now the Group can be focused on organic and externa growth 17 * Unaudited financia information Copyright © Ka eyra, Inc. 2021 1See definition on s ide 2 and reconci iation of non-GAAP measures on s ide 25
Revenue* Gross Margin* Adj. EBITDA(1) Reduction in Tota iabi ities* Overperforming the guidance previous y disc osed to the market Over 80% of annua growth from existing customers Addition of a arge new enterprise customer Strong and consistent annua revenue growth Recovering from the effect of the COVID-19 pandemic Benefit from the renegotiation of agreements in premium services in Ita y Increased penetration in the US connectivity market Backs out $20.3M of stock-based compensation and others and $6.5M of transaction and one-off costs Inc udes $4.3M initia pub ic company comp iance costs not inc uded in YE 2019 Comparab e Adj. EBITDA was $7.5M before pub ic costs, considering a so about $6.3M in personne cash-costs to strengthen our growth A portion of the new sources procured on the market have been used to sett e a most a the iabi ities deriving from the business combination (deSPAC process); Now the Group can be focused on organic and externa growth 18 * Unaudited financia information Copyright © Ka eyra, Inc. 2021 1See definition on s ide 2 and reconci iation of non-GAAP measures on s ide 25
Messages Voice Ca s An increase in Enterprise business, partia y offset by a change in the geographic mix in Connectivity business Increase in vo umes in the Indian region, the growth in data returning to a situation pre-COVID-19 Voice service carries higher gross margins than messaging 7.6% 100% Copyright © Ka eyra, Inc. 2021
Strong historica top ine growth with a robust pipe ine for future growth via new product roadmap, M&A and industry tai winds Conso idated Revenue* | $ in Mi ions AGR % C 24 2018PF 2019 2020 YoY Growth % 27% 32% 14% Gross Margin % 20% 20% 17% Adjusted EBITDA | $ in Mi ions Adjusted EBITDA amounted to $4.2 mi ion, $7.4 mi ion, $11.1 mi ion and $3.2 mi ion as of December 31, 2017PF, 2018PF, 2019 and 2020, respective y. Note: Figures derived from US GAAP financia s, except as otherwise indicated. PF refers to Pro Forma adjusted for subsidiaries acquired, the conso idated financia s of such party and its subsidiaries and re ated finance and transaction fees. Revenue represented on a pro forma basis to inc ude the impact of organic growth on y (exc udes the impact of acquisitions). 20 Copyright © Ka eyra, Inc. 2021 * Unaudited financia information
Ownership Summary: December 31, 2020 Ownership Shares Percent Management and Affi iates 13,602,949 44.9% GigCapita Sponsors and Affi iates 4,136,832 13.7% Investors Associated with DeSPAC process 1,666,930 5.5% Imp ied Retai F oat 10,881,976 35.9% Shares Outstanding 30,288,687 100.0% (*) assuming no shares se ing by the management of Ka eyra Copyright © Ka eyra, Inc. 2021
APPENDIX
ANNUA AND QUARTER Y CONSO IDATED STATEMENTS OF OPERATIONS* The fo owing tab e shows the audited financia year conso idated statements of operations prepared in accordance with US GAAP. ($in Mi ion) Q4 FY 2020 Q4 FY 2019 2020 2019 Revenue $44.3 $35.6 $147.4 $129.6 Cost of revenue $36.4 $27.6 $122.9 $103.2 Gross profit $7.8 $8.1 $24.4 $26.4 Research and deve opment $2.3 $1.4 $9.7 $5.3 Sa es and marketing $2.7 $1.6 $12.9 $6.0 Genera and administrative $7.5 $6.8 $28.2 $17.4 oss of equity investments $0.0 $0.0 $0.0 $0.0 Tota operating expenses $12.5 $9.8 $50.8 $28.8 oss from operations ($4.7) ($1.8) ($26.4) ($2.4) Otherfinanda expens net ($1.0) ($0.3) ($2.7) ($0.8) oss before income taxes ($5.6) ($2.1) ($29.1) ($3.2) Income tax expense (benefit) ($1.1) $1.6 ($2.3) $2.3 Net oss ($4.5) ($3.6) ($26.8) ($5.5) Net oss per common share basic and di uted ($0.2) ($0.3) ($1.1) ($0.5) Weighted average shares, basic and di uted 29,690J42 14,322,326 24,652,004 11,603,381 Copyright © Ka eyra, Inc. 2021 * Unaudited financia information
BA ANCE SHEET* ($in Mi ion) Cash and cash equiva ents $16.1 $33.0 NM Restricted cash $20.9 $0.0 {100%) Short-term investments $5.1 $4.8 (5%) Trade receivab es, net $39.5 $43.7 10% Prepaid expenses $0.6 $1.4 NM Other current assets $4.2 $2.1 (49%) TOTA CURRENT ASSETS $86.5 $85.0 (2%) Property and equipment, net $3.4 $6.7 98% Intangib e assets, net $9.4 $7.6 {19%) Goodwi $17.0 $16.7 {2%) Deferred tax asset s $0.0 $0.7 100% Other ong-term assets $1.2 $1.8 49% TOTA ASSETS $117.4 $118.5 1% * Unaudited financia information ($in Mi ion) Accounts payab e $63.3 $51.8 (18%) Debt for forward share purchase agreements $34.0 $0.5 (99%) Notes payab e $1.7 $0.0 (100%) Notes payab e due to re ated parties $9.4 $7.5 (20%) ines of credit $3.6 $5.3 45% Current portion of bank and other borrowings $7.6 $10.8 43% Deferred revenue $1.4 $3.7 162% Preference shares $0.7 $0.0 (100%) Preference shares due to re ated parties $1.8 $0.0 (100%) Payro and payro re ated accrued iabi ities $1.0 $3.3 NM Other current iabi ities $1.4 $6.0 NM TOTA CURRENT IABI ITIES $125.9 $88.8 (311%) ong-term portion of bank and other borrowings $16.1 $32.0 98% ong-term portion of notes payab e $0.0 $2.7 100% ong-term portion of notes payab e due to re ated parties $7.5 $0.0 (100%) ong-term portion of emp oyee benefit ob igation $1.4 $1.9 35% Deferred tax iabi ities $2.0 $0.0 NM Other ong-term iabi ities $3.2 $0.6 (81%) TOTA IABI ITIES $156.2 $125.9 (19%) Common stock $0.0 $0.0 50% Additiona paid-in capita $2.1 $93.6 NM Trea sury stock $0.0 ($30.4) (100%) Accumu ated other comprehensive ( oss) income $0.1 ($2.8) NM Accumu ated deficit ($41.0) ($67.8) 65% TOTA STOCKHO DERS’ EQUITY (DEFICIT) ($38.8) ($7.4) (81%) TOTA IABI ITIES AND STOCKHO DERS’ EQUITY (DEFICIT) $117.4 $118.5 1% Note: Figures derived from US GMP financia s, except as otherwise indicated. Copyright © Ka eyra, Inc. 2021
The fo owing tab e shows the reconci iation of the unaudited Non-GAAP Adjusted EBITDA as reported in the investors presentation. The unaudited figures have been derived from financia s prepared in accordance with US GAAP. (1) These costs represent pub ic company costs that were not incurred in 2019. Most of these costs are expected to occur going forward. Note: Management uses non-GAAP financia measures such as Adjusted EBITDA to eva uate period-to-period comparisons. Management be ieves these measures provide usefu information about the Company’s operating resu ts and financia performance. These non-GAAP financia measures are not measures prepared in accordance with GAAP and might not be consistent with simi ar measures used by other companies. These non-GAAP financia measures sha not considered as an a ternative to any other measures of performance prepared under genera y accepted accounting princip es. Copyright © Ka eyra, Inc. 2021
Thank You For further detai s, scan this QR code: investors@ka eyra.com Copyright © Ka eyra, Inc. 2021