UNITED STATES
SECURITIES AND EXCHANGE COMMISSION
Washington, D.C. 20549
FORM N-CSR
CERTIFIED SHAREHOLDER REPORT OF REGISTERED
MANAGEMENT INVESTMENT COMPANIES
Investment Company Act file number: 811-23306
Collaborative Investment Series Trust
(Exact name of registrant as specified in charter)
8000 Town Centre Dr. Suite 400 Broadview Heights, OH 44147
(Address of principal executive offices) (Zip code)
Citi Fund Services Ohio, Inc., 4400 Easton Commons, Suite 200, Columbus, OH 43219
(Name and address of agent for service)
Registrant’s telephone number, including area code: (440) 922-0066
Date of fiscal year end: March 31
Date of reporting period: March 31, 2022
Item 1. Reports to Stockholders.
Tuttle Capital Management, LLC
155 Lockwood Rd.
Riverside, CT 06878
1-866-904-0406
www.fomoetf.com
Annual Shareholder Report
FOMO ETF (FOMO)
March 31, 2022
TABLE OF CONTENTS
1 | |
2 | |
3 | |
4 | |
6 | |
7 | |
8 | |
9 | |
10 | |
21 | |
23 | |
25 | |
27 |
Annual Shareholder Report | 1
Dear Shareholders,
On behalf of the entire team, we want to express our appreciation for the confidence you have placed in The FOMO ETF (“FOMO” or the “Fund”). The following information pertains to the fiscal period of May 24, 2021 through March 31, 2022. FOMO makes it possible for investors to participate in what is currently trending while attempting to reduce the risk of speculation. FOMO is agile, built to move in and out of trending areas. In addition, FOMO constantly attempts to cut through the noise and chatter so investors don’t have to.
The Fund had negative performance during the period ending on March 31, 2022. The market price for FOMO decreased 16.52%.
We appreciate your investment in FOMO.
Sincerely,
Matthew Tuttle
Chief Executive Officer
Tuttle Capital Management, LLC
This material represents the Advisor’s assessment of the Fund and market environment as of March 31, 2022 and should not be relied upon by the reader as research, tax or investment advice, is subject to change at any time based upon economic, market, or other conditions and the Advisor undertakes no obligation to update the views expressed herein. Any discussions of specific securities should not be considered a recommendation to buy or sell those securities. The views expressed above (including any forward-looking statement) may not be relied upon as investment advice or as an indication of the Fund’s trading intent. Information about the Fund’s holdings, asset allocation or country diversification is historical and is not an indication of future Fund composition, which may vary.
Past performance is no guarantee of future results. Investment return and principal value will vary. Investors’ shares when redeemed may be worth more or less than original cost. Returns do not reflect the deduction of taxes a shareholder would pay on distributions or redemption of Fund’s shares. The Fund’s prospectus contains more complete information, including fees, expenses and risks involved in investing in newly public companies and should be read carefully before investing.
Annual Shareholder Report | 2
INVESTMENT OBJECTIVE
FOMO ETF seeks to provide capital appreciation.
FUND PERFORMANCE (AS OF MARCH 31, 2022) | Average | Expense |
| Inception(b) | Total |
FOMO ETF (FOMO) - Total Return (at Net Asset Value)(c) | -16.45% | 0.90% |
FOMO ETF (FOMO) - Total Return (at Market Value)(d) | -16.52% | N/A |
S&P 500 Index(e) | 9.24% | N/A |
Hypothetical Growth of a $10,000 Investment (*)

Past performance does not guarantee future results. Return calculations assume the reinvestment of distributions and do not reflect taxes that a shareholder would pay on Fund distributions or on the redemption of Fund shares. The performance data quoted represent past performance and current returns may be lower or higher. The investment return and principal value will fluctuate so that an investor’s shares, when redeemed may be worth more or less than the original cost. The performance above reflects any fee reductions during the applicable periods. If such fee reductions had not occurred, the quoted performance would be lower. To obtain performance information current to the most recent month-end, please call 1-866-904-0406 or visit http://www.fomoetf.com.
* The chart represents historical performance of a hypothetical investment of $10,000 in FOMO ETF and represents the reinvestment of dividends and capital gains in the Fund.
(a) The total expense ratio reflects the gross expense ratio as reported in the Fund’s Prospectus dated May 23, 2021. Please see the Fund’s most recent prospectus for details. Additional information pertaining to the Fund’s expense ratio as of March 31, 2022 can be found in the Financial Highlights.
(b) Commencement of operations May 24, 2021.
(c) Net asset value total return is calculated assuming an initial investment made at the net asset value at the beginning of the period, reinvestment of all distributions, including dividends and return of capital, at net asset value during the period, if any, and redemption on the last day of the period at net asset value. This percentage is not an indication of the performance of a shareholder’s investment in the Fund based on market value due to differences between the market price of the shares and the net asset value per share of the Fund.
(d) Market value total return is calculated assuming an initial investment made at the market value at the beginning of the period, reinvestment of all distributions, including dividends and return of capital, at net asset value during the period, if any, and redemption on the last day of the period at market value. Market value is determined by the composite closing price. Composite closing security price is defined as the last reported sale price from any primary listing market (e.g., Cboe) or participating regional exchanges or markets. The composite closing price is the last reported sale price from any of the eligible sources, regardless of volume and not an average price and may have occurred on a date prior to the close of the reporting period. Market value may be greater or less than net asset value, depending on the Fund’s closing price on the listing market.
(e) The S&P 500 Index measures the performance of 500 widely held stocks in US equity market. Standard and Poor’s chooses member companies for the index based on market size, liquidity and industry group representation. Included are the stocks of industrial,financial, utility and transportation companies. Since mid 1989, this composition has been more flexible and the number of issues in each sector has varied. It is market capitalization-weighted. Index returns, unlike the Fund’s returns, do not reflect any fees or expenses. Investors cannot invest directly in an index.
Annual Shareholder Report | 3
As a Fund shareholder, you may incur two types of costs: (1) transaction costs, including commissions on trading, as applicable; and (2) ongoing costs, including advisory fees and other Fund expenses. These examples are intended to help you understand your ongoing costs (in dollars) of investing in a Fund and to compare these costs with the ongoing costs of investing in other funds.
The expense examples below are based on an investment of $1,000 invested at the beginning of the period and held for the six-month period ended March 31, 2022.
Actual Expenses
The table below provides information about actual account values and actual expenses. You may use this information, together with the amount you invested, to estimate the expenses that you paid over the period. Simply divide your account value by $1,000 (for example, an $8,600 account value divided by $1,000 = 8.6), then multiply the result by the number in the table under the heading entitled “Expenses Paid During Period” to estimate the expenses you paid on your account during this period.
Hypothetical Example for Comparison Purposes
The table below provides information about hypothetical account values and hypothetical expenses based on the Fund’s actual expense ratio and an assumed rate of return of 5% per year before expenses, which is not the Fund’s actual return. The hypothetical account values and expenses may not be used to estimate the actual ending account balance or expenses you paid for the period. You may use this information to compare this 5% hypothetical example with the 5% hypothetical examples that appear in the shareholder reports of other funds.
Please note that the expenses shown in the table are meant to highlight your ongoing costs only and do not reflect any transactional costs, such as sales charges (loads), redemption fees, or exchange fees. Further, the expenses do not include any brokerage commissions on investors’ purchases or redemptions of Fund shares as described in the Fund’s prospectus. Therefore, the table is useful in comparing ongoing costs only, and will not help you determine the relative total costs of owning different funds. In addition, if these transactional costs were included, your costs would have been higher
|
| Beginning | Ending | Expenses | Annualized |
FOMO ETF | Actual | $1,000.00 | $873.80 | $ 4.20 | 0.90% |
| Hypothetical | 1,000.00 | 1,020.44 | 4.53 | 0.90 |
(a) Expenses are equal to the Fund’s annualized expense ratio multiplied by the average account value over the period, multiplied by 182/365 (the number of days in the more recent fiscal half-year divided by the number of days in the fiscal year).
See notes which are an integral part of the Financial Statements.
Annual Shareholder Report | 4
Portfolio of Investments Summary Table | Percentage of |
Communication Services | 14.7 |
Consumer Discretionary | 1.7 |
Consumer Staples | 3.7 |
Energy | 10.2 |
Financials | 3.6 |
Industrials | 5.5 |
Information Technology | 19.0 |
Materials | 3.9 |
Exchange-Traded Funds | 37.7 |
Total | 100.0 |
Portfolio holdings and allocations are subject to change. As of March 31, 2022, percentages in the table above are based on total investments. Such total investments may differ from the percentages set forth in the following Portfolio of Investments which are computed using the Fund’s total net assets.
Portfolio of Investments
Shares | | | Fair Value ($) | | |
| Common Stocks — 33.6% | | | ||
| Communication Services — 7.9% | | | ||
| 89 | | Alphabet, Inc., Class A(a) | 247,540 | |
| 6,240 |
| Twitter, Inc.(a) | 241,426 |
|
|
|
|
| 488,966 |
|
| Consumer Discretionary — 0.9% | | | ||
| 6,122 |
| GrowGeneration Corp.(a) | 56,384 |
|
| Consumer Staples — 2.0% | | | ||
| 215 | | Costco Wholesale Corp. | 123,808 | |
| Energy — 5.5% | | | ||
| 4,571 | | Cameco Corp. | 133,016 | |
| 2,500 | | Halliburton Co. | 94,675 | |
| 2,000 |
| Occidental Petroleum Corp. | 113,480 |
|
|
|
|
| 341,171 |
|
| Financials — 1.9% | | | ||
| 787 |
| Silvergate Capital Corp., Class A(a) | 118,498 |
|
| Industrials — 3.0% | | | ||
| 6,441 |
| Plug Power, Inc.(a) | 184,277 |
|
See notes which are an integral part of the Financial Statements.
Annual Shareholder Report | 5
Portfolio of Investments (continued)March 31, 2022
FOMO ETF
Shares | | | Fair Value ($) | | |
| Information Technology — 10.3% | | | ||
| 307 | | Enphase Energy, Inc.(a) | 61,946 | |
| 808 | | Microsoft Corp. | 249,115 | |
| 924 | | NVIDIA Corp. | 252,123 | |
| 110 |
| Palo Alto Networks, Inc.(a) | 68,476 |
|
|
|
|
| 631,660 |
|
| Materials — 2.1% | | | ||
| 477 | | CVR Partners, LP | 65,812 | |
| 3,258 |
| Vale SA, ADR | 65,127 |
|
|
|
|
| 130,939 |
|
| Total Common Stocks (Cost $2,082,449) | 2,075,703 |
| ||
| | | | | |
| Exchange-Traded Funds — 20.4% | | | ||
| 678 | | Invesco QQQ Trust Series 1 | 245,802 | |
| 6,449 | | ProShares Bitcoin Strategy ETF(a) | 184,183 | |
| 4,500 | | ProShares UltraPro Short QQQ(a) | 151,515 | |
| 545 | | SPDR S&P 500 ETF Trust | 246,144 | |
| 2,667 | | SPDR S&P Biotech ETF(a) | 239,710 | |
| 4,896 |
| VanEck Gold Miners ETF (USA) | 187,762 |
|
|
|
|
| 1,255,116 |
|
| Total Exchange-Traded Funds (Cost $1,245,715) | 1,255,116 |
| ||
| | | | ||
| Total Investments — 54.0% (Cost $3,328,164) | 3,330,819 |
| ||
| Other Assets in Excess of Liabilities — 46.0% | 2,839,654 |
| ||
| Net Assets — 100.0% | 6,170,473 |
| ||
(a) Non-income producing security.
ADR — American Depositary Receipt
ETF — Exchange-Traded Fund
LP — Limited Partnership
S&P — Standard and Poor’s
SPDR — Standard & Poor’s Depositary Receipts
See notes which are an integral part of the Financial Statements.
Annual Shareholder Report | 6
| ||
Assets: | | |
Investments, at value (Cost $3,328,164) | $3,330,819 | |
Cash | 2,028,083 | |
Dividends and interest receivable | 10,935 | |
Receivable due from advisor | 27,845 | |
Receivable for investments sold | 1,748,300 | |
Prepaid expenses | 3,758 | |
Total Assets | 7,149,740 | |
Liabilities: | | |
Payable for investments purchased | 949,213 | |
Accrued expenses: | | |
Administration | 1,017 | |
Custodian | 5,539 | |
Fund accounting | 2,818 | |
Trustee | 800 | |
Other | 19,880 | |
Total Liabilities | 979,267 | |
Net Assets | $6,170,473 | |
Net Assets consist of: | | |
Paid in Capital | $7,535,882 | |
Total Distributable Earnings/(Deficit) | (1,365,409 | ) |
Net Assets | $6,170,473 | |
| | |
Net Assets: | $6,170,473 | |
Shares of Beneficial Interest Outstanding | 300,000 | |
Net Asset Value (offering and redemption price per share): | $20.57 | |
See notes which are an integral part of the Financial Statements.
Annual Shareholder Report | 7
| FOMO ETF(a) | |
Investment Income: | | |
Dividend income (Net of foreign taxes withheld of $3,192) | $59,331 | |
Interest income | 8 | |
Total Investment Income | 59,339 | |
Expenses: | | |
Advisory | 40,950 | |
Administration | 9,540 | |
Compliance services | 750 | |
Custodian | 39,841 | |
Fund accounting | 21,267 | |
Legal and audit | 26,000 | |
Printing | 3,933 | |
Treasurer | 150 | |
Trustee | 2,822 | |
Other | 12,309 | |
Total Expenses before fee reductions | 157,562 | |
Expenses contractually waived and/or reimbursed by the Advisor | (111,355 | ) |
Total Net Expenses | 46,207 | |
Net Investment Income (Loss) | 13,132 | |
Realized and Unrealized Gains (Losses) from Investments: | | |
Net realized gains (losses) from investment transactions | (1,363,996 | ) |
Net realized gains (losses) from in-kind transactions | 119,554 | |
Net realized gains (losses) from written options transactions | (2,239 | ) |
Net realized gains (losses) from securities sold short | 33 | |
Change in unrealized appreciation/(depreciation) on investments | 2,655 | |
Net Realized and Unrealized Gains (Losses) from Investments: | (1,243,993 | ) |
Change in Net Assets Resulting From Operations | $(1,230,861 | ) |
(a) For the period from the commencement of operations on May 24, 2021 through March 31, 2022.
See notes which are an integral part of the Financial Statements.
Annual Shareholder Report | 8
| ||
| For the period | |
From Investment Activities: | | |
Operations: | | |
Net investment income (loss) | $13,132 | |
Net realized gains (losses) from investment transactions | (1,246,648 | ) |
Change in unrealized appreciation/(depreciation) on investments | 2,655 | |
Change in net assets resulting from operations | (1,230,861 | ) |
Distributions to Shareholders From: | | |
Earnings | (88,069 | ) |
Change in net assets from distributions | (88,069 | ) |
Capital Transactions: | | |
Proceeds from shares issued | 11,288,549 | |
Cost of shares redeemed | (3,799,146 | ) |
Change in net assets from capital transactions | 7,489,403 | |
Change in net assets | 6,170,473 | |
Net Assets: | | |
Beginning of period | — | |
End of period | $6,170,473 | |
Share Transactions: | | |
Issued | 450,000 | |
Redeemed | (150,000 | ) |
Change in shares | 300,000 | |
(a) Commencement of operations.
See notes which are an integral part of the Financial Statements.
Annual Shareholder Report | 9
FOMO ETF | May 24, 2021(a) | |
Net Asset Value, Beginning of Period | $25.00 | |
| ||
Net Investment Income (Loss)(b) | 0.05 | |
Net Realized and Unrealized Gains (Losses) from Investments | (4.13 | ) |
Total from Investment Activities | (4.08 | ) |
| ||
Distributions from Net Investment Income | (0.35 | ) |
Distributions from Net Realized Gains from Investments | — | |
Total Distributions | (0.35 | ) |
| ||
Net Asset Value, End of Period | $20.57 | |
Net Assets at End of Period (000’s) | $6,170 | |
| ||
Total Return at NAV(c)(d) | (16.45)% | |
Total Return at Market(d)(e) | (16.52)% | |
| ||
Ratio of Net Expenses to Average Net Assets(f)(g) | 0.90% | |
Ratio of Gross Expenses to Average Net Assets(f)(g)(h) | 3.07% | |
Ratio of Net Investment Income (Loss) to Average Net Assets(f)(i) | 0.26% | |
Portfolio Turnover(d)(j) | 3,711% | |
(a) Commencement of operations.
(b) Calculated based on average shares method.
(c) Net asset value total return is calculated assuming an initial investment made at the net asset value at the beginning of the period, reinvestment of all dividends and distributions at net asset value during the period, if any, and redemption on the last day of the period at net asset value. This percentage is not an indication of the performance of a shareholder’s investment in the Fund based on market value due to differences between the market price of the shares and the net asset value per share of the Fund.
(d) Not annualized for periods less than one year.
(e) Market value total return is calculated assuming an initial investment made at the market value at the beginning of the period, reinvestment of all dividends and distributions at net asset value during the period, if any, and redemption on the last day of the period at market value. Market value is determined by the composite closing price. Composite closing security price is defined as the last reported sale price from any primary listing market (e.g., Cboe BZX) or participating regional exchanges or markets. The composite closing price is the last reported sale price from any of the eligible sources, regardless of volume and not an average price and may have occurred on a date prior to the close of the reporting period. Market value may be greater or less than net asset value, depending on the Fund’s closing price on the listing market.
(f) Annualized for periods less than one year.
(g) Excludes expenses of the investment companies in which the Fund invests.
(h) If applicable, certain fees were waived and/or reimbursed. If such waivers/reimbursements had not occurred, the ratio would have been as indicated.
(i) Recognition of net investment income by the Fund is affected by the timing of the declaration of dividends by the underlying investment companies in which the Fund invests. The ratio does not include net investment income of the underlying investment companies.
(j) Excludes the impact of in-kind transactions.
Annual Shareholder Report | 10
(1) Organization
Collaborative Investment Series Trust (the “Trust”) was organized on July 26, 2017 as a Delaware statutory trust. The Trust is registered under the Investment Company Act of 1940 (the “1940 Act”) as an open-end management investment company and thus is determined to be an investment company for accounting purposes. The Trust is comprised of several funds and is authorized to issue an unlimited number of shares of beneficial interest (“Shares”) in one or more series representing interests in separate portfolios of securities. The accompanying financial statements are those of FOMO ETF (the “Fund”). The Fund is a diversified actively-managed exchange-traded fund whose investment objective is to seek to provide capital appreciation. The Fund’s prospectus provides a description of the Fund’s investment objectives, policies, and strategies. The assets of the Fund are segregated and a shareholder’s interest is limited to the Fund in which shares are held. The Fund commenced operations on May 24, 2021.
Under the Trust’s organizational documents, its officers and Board of Trustees (the “Board”) are indemnified against certain liabilities arising out of the performance of their duties to the Fund. In addition, in the normal course of business, the Trust may enter into contracts with vendors and others that provide for general indemnifications. The Trust’s maximum exposure under these arrangements is unknown, as this would involve future claims that may be made against the Trust. However, based on experience, the Trust expects that risk of loss to be remote.
(2) Significant Accounting Policies
Shares of the Fund are listed and traded on the Cboe BZX Exchange, Inc. (“CBOE”). Market prices for the Shares may be different from their net asset value (“NAV”). The Fund issues and redeems Shares on a continuous basis at NAV only in large blocks of Shares, currently 25,000 Shares, called “Creation Units”. Creation Units are issued and redeemed principally in-kind for securities included in a specified universe. Once created, Shares generally trade in the secondary market at market prices that change throughout the day in amounts less than a Creation Unit. Shares of the Fund may only be purchased or redeemed by certain financial institutions (“Authorized Participants”). An Authorized Participant is either (i) a broker-dealer or other participant in the clearing process through the Continuous Net Settlement System of the National Securities Clearing Corporation or (ii) a DTC participant and, in each case, must have executed a Participant Agreement with Foreside Fund Services, LLC (the “Distributor”). Most retail investors do not qualify as Authorized Participants nor have the resources to buy and sell whole Creation Units. Therefore, they are unable to purchase or redeem the shares directly from the Fund.
The following is a summary of significant accounting policies consistently followed by the Fund in the preparation of its financial statements. These policies are in conformity with generally accepted accounting principles in
Annual Shareholder Report | 11
Notes to Financial Statements (continued)March 31, 2022
the United States of America (“GAAP”). The Fund is an investment company and accordingly follows the investment company accounting and reporting guidance of the Financial Accounting Standards Board (“FASB”) Accounting Standards Codification Topic 946 “Financial Services – Investment Companies”. The preparation of financial statements in conformity with GAAP requires management to make estimates and assumptions that affect the amounts of assets and liabilities and disclosure of contingent assets and liabilities at the date of the financial statements and the reported amounts of income and expenses for the period. Actual results could differ from those estimates.
A. Investment Valuations
The Fund holds investments at fair value. Fair value is defined as the price that would be expected to be received to sell an asset or paid to transfer a liability in an orderly transaction between market participants at the measurement date. The valuation techniques used to determine fair value are further described below.
Security values are ordinarily obtained through the use of independent pricing services in accordance with procedures adopted by the Board. Pursuant to these procedures, the Fund may use a pricing service, bank, or broker-dealer experienced in such matters to value the Fund’s securities. When reliable market quotations are not readily available for any security, the fair value of that security will be determined by a committee established by the Board in accordance with procedures adopted by the Board. The fair valuation process is designed to value the subject security at the price the Fund would reasonably expect to receive upon its current sale. Additional consideration is given to securities that have experienced a decrease in the volume or level of activity or to circumstances that indicate that a transaction is not orderly.
The Trust has a three-tier fair value hierarchy that is dependent upon the various “inputs” used to determine the value of the Fund’s investments. The valuation techniques described below maximize the use of observable inputs and minimize the use of unobservable inputs in determining fair value. These inputs are summarized in the three broad levels listed below:
• Level 1 - Quoted prices in active markets for identical assets that the Fund has the ability to access.
• Level 2 - Other observable pricing inputs at the measurement date (including quoted prices for similar securities, interest rates, prepayment speeds, credit risk, etc.).
• Level 3 - Significant unobservable pricing inputs at the measurement date (including the Fund’s own assumptions in determining the fair value of investments).
Annual Shareholder Report | 12
Notes to Financial Statements (continued)March 31, 2022
The inputs or methodology used for valuing investments are not necessarily an indication of the risk associated with investing in those investments.
Common stocks and exchange-traded funds (“ETFs”) traded on a recognized securities exchange are valued at that day’s last traded price or official closing price, as applicable, on the exchange where the security is primarily traded. Funds traded on a recognized exchange for which there were no sales on that day may be valued at the last traded price. In each of these situations, valuations are typically categorized as Level 1 in the fair value hierarchy.
The Fund did not hold any Level 2 or Level 3 investments during the period ended March 31, 2022.
The following table provides the fair value measurement as of March 31, 2022, while the breakdown, by category, of investments is disclosed in the Portfolio of Investments for the Fund:
| Level 1 | | Total |
FOMO ETF | | | |
Common Stocks(1) | $2,075,703 | | $2,075,703 |
Exchange-Traded Funds | 1,255,116 | | 1,255,116 |
Total Investments | $3,330,819 | | $3,330,819 |
(1) Please see the Portfolio of Investments for industry classifications.
B. Security Transactions and Related Income
Investment transactions are accounted for no later than the first calculation of the NAV on the business day following the trade date. For financial reporting purposes, however, security transactions are accounted for on the trade date on the last business day of the reporting period. Securities gains and losses are calculated on the identified cost basis. Interest income and expenses are accrued daily. Dividends, less foreign tax withholding, if any, are recorded on the ex-dividend date. Investment income from non-U.S. sources received by the Fund is generally subject to non-U.S. withholding taxes at rates ranging up to 30%. Such withholding taxes may be reduced or eliminated under the terms of applicable U.S. income tax treaties. The Fund may be subject to foreign taxes on gains in investments or currency repatriation. The Fund accrues such taxes, as applicable, based on its current interpretation of tax rules in the foreign markets in which it invests.
C. Cash
Idle cash may be swept into various interest bearing overnight demand deposits and is classified as cash on the Statement of Assets and Liabilities. The Fund maintains cash in bank deposit accounts which, at times, may exceed United States federally insured limit of $250,000. Amounts swept overnight are available on the next business day.
Annual Shareholder Report | 13
Notes to Financial Statements (continued)March 31, 2022
D. Dividends and Distributions to Shareholders
Distributions are recorded on the ex-dividend date. The Fund intends to distribute to its shareholders any net investment income and net realized capital gains, if any, at least annually. The amount of dividends from net investment income and net realized gains is determined in accordance with federal income tax regulations, which may differ from GAAP. These “book/tax” differences are considered either temporary or permanent in nature. To the extent these differences are permanent in nature (e.g., distributions and income received from pass-through investments), such amounts are reclassified within the capital accounts based on their nature for federal income tax purposes; temporary differences do not require reclassification.
The Fund may own shares of ETFs that may invest in real estate investments trusts (“REITs”) which report information on the source of their distributions annually. Distributions received from investments in REITs in excess of income from underlying investments are recorded as realized gain and/or as a reduction to the cost of the ETF.
The Fund may utilize earnings and profits distributed to shareholders on redemption of shares as part of the dividends paid deduction.
E. Allocation of Expenses
Expenses directly attributable to a Fund are charged to that Fund. Expenses not directly attributable to a Fund are allocated proportionally among all Funds within the Trust in relation to the net assets of each Fund or on another reasonable basis.
F. Short Sales
The Fund may engage in short sales against the box (i.e., where the Fund owns or has an unconditional right to acquire at no additional cost a security substantially similar to the security sold short) for hedging purposes to limit exposure to a possible market decline in the value of its portfolio securities. In a short sale, the Fund sells a borrowed security and has a corresponding obligation to the lender to return the identical security. The Fund may also incur an interest expense if a security that has been sold short has an interest payment. When the Fund engages in a short sale, the Fund records a liability for securities sold short and records an asset equal to the proceeds received. The amount of the liability is subsequently marked to market to reflect the market value of the securities sold short. To borrow the security, the Fund also may be required to pay a premium, which would increase the cost of the security sold. There were no open short positions as of March 31, 2022.
G. Securities Lending
For the purpose of achieving income, the Fund may lend portfolio securities, provided (1) the loan is secured continuously by collateral consisting of U.S. Government securities or cash or cash equivalents (cash, U.S. Government
Annual Shareholder Report | 14
Notes to Financial Statements (continued)March 31, 2022
securities, negotiable certificates of deposit, bankers’ acceptances or letters of credit) maintained on a daily mark-to-market basis in an amount at least equal to the current market value of the securities loaned, (2) the Fund may at any time call the loan and obtain the return of securities loaned, (3) the Fund will receive any interest or dividends received on the loaned securities, and (4) the aggregate value of the securities loaned will not at any time exceed one-third of the total assets of the lending Fund. Gain or loss in the value of securities loaned that may occur during the term of the loan will be for the account of the Fund.
Cash collateral received in connection with securities lending is held on behalf of the Fund in a demand deposit cash account at Citibank, N.A. (the “Securities Lending Agent”). Such investments are subject to risk of payment delays or default on the part of the issuer or counterparty or otherwise may not generate sufficient interest to support the costs associated with securities lending. The Fund could also experience delays in recovering its securities and possible loss of income or value if the borrower fails to return the borrowed securities, although the Fund is indemnified from this risk by contract with the Securities Lending Agent. The Fund pays the Securities Lending Agent a portion of the gross revenues received from securities lending activities. Such fees are netted against “Securities lending income” on the Statement of Operations. The Fund did not have securities on loan as of March 31, 2022.
H. Derivative Instruments
All open derivative positions at period end are reflected on the Fund’s Portfolio of Investments. The following is a description of the derivative instruments utilized by the Fund, including the primary underlying risk exposure related to each instrument type.
Options Contracts:
Purchased Options Contracts – The Fund pays a premium which is included in “Investments” on the Statement of Assets and Liabilities and marked to market to reflect the current value of the option. Premiums paid for purchasing options that expire are treated as realized losses. When a put option is exercised or closed, premiums paid for purchasing options are offset against proceeds to determine the realized gain/loss on the transaction. The Fund bears the risk of loss of the premium and change in value should the counterparty not perform under the contract.
Written Options Contracts – The Fund receives a premium which is recorded as a liability and is subsequently adjusted to the current value of the options written. Premiums received from writing options that expire are treated as realized gains. Premiums received from writing options that are either exercised or closed are offset against the proceeds received or the amount paid on the transaction to determine realized gains or losses. The risk associated with writing an option is that the Fund bears the market risk of an
Annual Shareholder Report | 15
Notes to Financial Statements (continued)March 31, 2022
unfavorable change in the price of an underlying asset and is required to buy or sell an underlying asset under the contractual terms of the option at a price different from the current value.
As of March 31, 2022, the Fund did not hold any options contracts. The monthly average notional amount for the contracts held during the period ended March 31, 2022 were as follows:
| Monthly Average |
Purchased Options Contracts: | |
FOMO ETF | $375 |
(a) For the period when the Fund held purchased options contracts from January 1, 2022 through January 31, 2022.
| Monthly Average |
Written Options Contracts: | |
FOMO ETF | $463 |
(a) For the period when the Fund held written options contracts from January 1, 2022 through January 31, 2022.
Summary of Derivative Instruments:
The following is a summary of the effect of derivative instruments on the Statement of Operations, categorized by risk exposure, for the period ended March 31, 2022.
Fund | Net Realized | |
Purchased | Written | |
Equity Risk Exposure: | | |
FOMO ETF | $(21,346) | $(2,239) |
(3) Investment Advisory and Other Contractual Services
A. Investment Advisory Fees
Tuttle Capital Management, LLC (the “Advisor”), serves as the Fund’s investment advisor pursuant to an investment advisory agreement. Subject at all times to the oversight and approval of the Board, the Advisor is responsible for the overall management of the Fund. The Fund pays the Advisor a management fee of 0.80% of its average daily net assets, calculated daily and paid monthly.
Annual Shareholder Report | 16
Notes to Financial Statements (continued)March 31, 2022
The Advisor has contractually agreed to reduce its fees and/or reimburse the expenses for the Fund (excluding front-end or contingent deferred loads, brokerage fees and commissions, acquired fund fees and expenses, fees and expenses associated with instruments in other collective investment vehicles or derivative instruments (including for example options and swap fees and expenses), borrowing costs (such as interest and dividend expense on securities sold short), taxes, other fees related to underlying investments (such as option fees and expenses or swap fees and expenses), or extraordinary expenses such as litigation (which may include indemnification of Fund officers and Trustees or contractual indemnification of Fund Service providers (other than the Advisor)) in order to ensure that net annual fund operating expenses will not exceed 0.90% of the Fund’s average daily net assets (“Expense Cap”). These fee waivers and expense reimbursements are subject to possible recoupment from the Fund within the three years of the date on which the waiver or reimbursement occurs, if such recoupment can be achieved within the lesser of the foregoing expense limits or the expense limits in place at the time of recoupment. The Expense Cap will remain in effect for the Fund until at least July 31, 2022. The Expense Cap may be terminated earlier only upon approval by the Board, on 60 days’ written notice to the Advisor. More information about the Fund’s fee waiver and Expense Cap agreement is available in the “Management of the Fund” section of the Fund’s prospectus.
As of March 31, 2022, the Advisor may recoup amounts from the Fund as follows:
| Expires | Total |
FOMO ETF | $111,355 | $111,355 |
B. Administration, Custodian, Transfer Agent and Accounting Fees
Citi Fund Services Ohio, Inc. (“Citi”) serves as administrator and dividend disbursing agent for the Fund pursuant to a Services Agreement. Citibank, N.A. serves as the custodian and transfer agent pursuant to a Global Custodial and Agency Services Agreement.
Collaborative Fund Services LLC (“CFS”) provides the Fund with various management and legal administrative services. For these services, the Fund pays CFS 0.10% of the Fund’s average daily net assets, calculated daily and paid monthly, and is subject to a minimum monthly fee of $1,000.
C. Distribution and Shareholder Services Fees
Foreside Fund Services, LLC is the principal underwriter and distributor for the Fund’s Shares. The Distributor is compensated by the Advisor in accordance with a Distribution Services Agreement between the Advisor and the Distributor.
Annual Shareholder Report | 17
Notes to Financial Statements (continued)March 31, 2022
D. Compliance Services
Beacon Compliance Consulting provides compliance services to the Trust and receives a monthly fee paid by the Fund for these services.
E. Treasurer Fees
The Treasurer of the Trust receives a fee that is calculated monthly using the net assets at month-end and is paid by the Fund on a quarterly basis. During the period ended March 31, 2022, the Fund paid a total of $150 to the Treasurer.
F. General
Certain trustees and officers of the Trust are officers, directors and/or trustees of the above companies and, except for the Treasurer, receive no compensation from the Fund for their services.
(4) Investment Transactions
Purchases and sales of investments, excluding in-kind transactions and short-term investments, for the period ended March 31, 2022 were as follows:
| Purchases | Sales |
FOMO ETF | $184,994,837 | $187,822,387 |
Purchases and sales of in-kind transactions for the period ended March 31, 2022 were as follows:
| Purchases | Sales |
FOMO ETF | $11,076,984 | $3,696,494 |
There were no purchases or sales of U.S. government securities during the period ended March 31, 2022.
(5) Capital Share Transactions
Shares are issued and redeemed by the Fund only in aggregations of a specified number of shares or multiples thereof at NAV. Except when aggregated in Creation Units, shares of the Fund are not redeemable. Transactions in shares for the Fund are disclosed in detail on the Statement of Changes in Net Assets.
The consideration for the purchase of Creation Units of a Fund generally consists of the in-kind deposit of a designated basket of securities, which constitutes an optimized representation of the securities of that Fund’s specified universe, and an amount of cash. Investors purchasing and redeeming Creation Units may be charged a transaction fee to cover the transfer and other transactional costs it incurs to issue or redeem Creation Units. The standard transaction fee charge is $250.
Annual Shareholder Report | 18
Notes to Financial Statements (continued)March 31, 2022
From time to time, settlement of securities related to in-kind contributions or in-kind redemptions may be delayed. In such cases, securities related to in-kind transactions are reflected as a receivable or a payable on the Statement of Assets and Liabilities.
As of March 31, 2022, there were no unsettled in-kind capital transactions.
(6) Federal Income Taxes
It is the policy of the Fund to qualify as a regulated investment company by complying with the provisions available to certain investment companies, as defined in applicable sections of the Internal Revenue Code of 1986, as amended, and to make distributions of net investment income and net realized capital gains sufficient to relieve it from all, or substantially all, federal income taxes.
Management of the Fund has reviewed the tax positions taken in tax years that remain subject to examination by all major tax jurisdictions, including U.S. federal (i.e., all open tax years and the interim tax period since then). Management believes that there is no tax liability resulting from unrecognized tax benefits related to uncertain tax positions taken.
As of and during the period ended March 31, 2022, the Fund did not have a liability for any unrecognized tax benefits. The Fund recognizes interest and penalties, if any, related to unrecognized tax benefits as income tax expense on the Statement of Operations. During the period, the Fund did not incur any interest of penalties.
As of March 31, 2022, the tax cost of securities and the breakdown of unrealized appreciation/(depreciation) for the Fund were as follows:
| Tax Cost of | Unrealized | Unrealized | Net Unrealized |
FOMO ETF | $3,371,804 | $49,026 | $(90,011) | $(40,985) |
The difference between book-basis and tax-basis unrealized appreciation/(depreciation) is primarily attributable to wash sale activity.
The tax character of distributions paid during the fiscal period ended March 31, 2022 were as follows:
| Distributions paid from | |||
| Ordinary | Net Capital | Total Taxable | Total |
FOMO ETF | $88,069 | $— | $88,069 | $88,069 |
Annual Shareholder Report | 19
Notes to Financial Statements (continued)March 31, 2022
As of March 31, 2022, the components of distributable earnings/(deficit) on a tax basis were as follows:
| Undistributed | Undistributed | Distributable | Accumulated | Unrealized | Total |
FOMO ETF | $7,809 | $— | $7,809 | $(1,332,233) | $(40,985) | $(1,365,409) |
As of the fiscal period ended March 31, 2022, the Fund has net capital loss carryforwards (“CLCFs”) not subject to expiration as summarized in the table below.
| Short Term Amount | Total |
FOMO ETF | $1,332,233 | $1,332,233 |
Under current law, capital losses and specified ordinary losses realized after October 31 and non-specified ordinary losses incurred after December 31 (ordinary losses collectively known as “late year ordinary loss”) may be deferred and treated as occurring on the first business day of the following fiscal year. As of the fiscal period ended March 31, 2022, the Fund had no deferred losses.
Permanent Tax Differences:
As of March 31, 2022, the following reclassifications were made on the Statement of Assets and Liabilities, relating primarily to redemptions in-kind:
| Total | Paid in |
FOMO ETF | $(46,479) | $46,479 |
(7) Investment Risks
ETF Risk
The NAV of a Fund can fluctuate up or down, and you could lose money investing in the Fund if the prices of the securities owned by the Fund decline. In addition, the Fund may be subject to the following risks: (1) the market price of the Fund’s shares may trade above or below its NAV; (2) an active trading market for a Fund’s shares may not develop or be maintained; or (3) trading of the Fund’s shares may be halted if the listing exchange’s officials deem such action appropriate, the shares are delisted from the exchange, or the activation of market-wide “circuit breakers” (which are tied to large decreases in stock prices) halts stock trading generally.
Annual Shareholder Report | 20
Notes to Financial Statements (continued)March 31, 2022
Market Risk
Overall market risks may also affect the value of the Fund. Factors such as domestic economic growth and market conditions, interest rate levels and political events affect the securities markets. Local, regional or global events such as war, acts of terrorism, the spread of infectious illness or other public health issue, recessions and depressions, or other events could have a significant impact on the Fund and its investments and could result in increased premiums or discounts to the Fund’s NAV, and may impair market liquidity, thereby increasing liquidity risk. The Fund could lose money over short periods due to short-term market movements and over longer periods during more prolonged market downturns. During a general market downturn, multiple asset classes may be negatively affected. Changes in market conditions and interest rates can have the same impact on all types of securities and instruments.
An outbreak of infectious respiratory illness caused by a novel coronavirus known as COVID-19 was first detected in China in December 2019 and has now been detected globally. This coronavirus has resulted in travel restrictions, closed international borders, enhanced health screenings at ports of entry and elsewhere, disruption of and delays in healthcare service preparation and delivery, prolonged quarantines, cancellations, supply chain disruptions, and lower consumer demand, as well as general concern and uncertainty. The impact of COVID-19, and other infectious illness outbreaks that may arise in the future, could adversely affect the economies of many nations or the entire global economy, individual issuers and capital markets in ways that cannot necessarily be foreseen. In addition, the impact of infectious illnesses in emerging market countries may be greater due to generally less established healthcare systems. Public health crises caused by the COVID-19 outbreak may exacerbate other pre-existing political, social and economic risks in certain countries or globally. The duration of the COVID-19 outbreak and its effects cannot be determined with certainty.
(8) Subsequent Events
The Board approved the reorganization of the Fund into a new series of Investment Managers Series Trust II at a meeting held on February 16, 2022. The reorganization is subject to the approval of the Fund’s shareholders. Fund shareholders will receive a combined prospectus/proxy statement with more information regarding the reorganization.
Management of the Fund has evaluated the need for disclosures and/or adjustments resulting from subsequent events through the date these financial statements were issued. Based upon this evaluation, no additional disclosures or adjustments were required to the financial statements as of March 31, 2022.
Annual Shareholder Report | 21
To the Shareholders of FOMO ETF and
Board of Trustees of Collaborative Investment Series Trust
Opinion on the Financial Statements
We have audited the accompanying statement of assets and liabilities, including the portfolio of investments, of FOMO ETF (the “Fund”), a series of Collaborative Investment Series Trust, as of March 31, 2022, the related statements of operations and changes in net assets, the related notes, and the financial highlights for the period from May 24, 2021 (commencement of operations) through March 31, 2022 (collectively referred to as the “financial statements”). In our opinion, the financial statements present fairly, in all material respects, the financial position of the Fund as of March 31, 2022, the results of its operations, the changes in net assets, and the financial highlights for the period from May 24, 2021 (commencement of operations) through March 31, 2022, in conformity with accounting principles generally accepted in the United States of America.
Basis for Opinion
These financial statements are the responsibility of the Fund’s management. Our responsibility is to express an opinion on the Fund’s financial statements based on our audit. We are a public accounting firm registered with the Public Company Accounting Oversight Board (United States) (“PCAOB”) and are required to be independent with respect to the Fund in accordance with the U.S. federal securities laws and the applicable rules and regulations of the Securities and Exchange Commission and the PCAOB.
We conducted our audit in accordance with the standards of the PCAOB. Those standards require that we plan and perform the audit to obtain reasonable assurance about whether the financial statements are free of material misstatement whether due to error or fraud.
Our audit included performing procedures to assess the risks of material misstatement of the financial statements, whether due to error or fraud, and performing procedures that respond to those risks. Such procedures included examining, on a test basis, evidence regarding the amounts and disclosures in the financial statements. Our procedures included confirmation of securities owned as of March 31, 2022, by correspondence with the custodian and brokers; when replies were not received from brokers, we performed other auditing procedures. Our audit also included evaluating the accounting principles used and significant estimates made by management, as well as evaluating the overall presentation of the financial statements. We believe that our audit provides a reasonable basis for our opinion.
Annual Shareholder Report | 22
Report of Independent Registered Public Accounting Firm (continued)
We have served as the auditor of one or more investment companies advised by Tuttle Capital Management, LLC since 2020.

COHEN & COMPANY, LTD.
Milwaukee, Wisconsin
May 26, 2022
Annual Shareholder Report | 23
Other Federal Income Tax Information
During the fiscal period ended March 31, 2022, the following percentage of the total ordinary income distributions paid by the Fund qualifies for the distributions received deduction available to corporate shareholders:
| Distributions Received Deduction |
FOMO ETF | 2.03% |
For the fiscal period ended March 31, 2022, distributions paid by the Fund may be subject to a maximum tax rate of 15%, as provided by the Jobs and Growth Relief Reconciliation Act of 2003. The Fund intends to designate the maximum amount allowable as taxed at a maximum rate of 15%. Complete information will be reported in conjunction with your 2022 Form 1099-DIV.
During the fiscal period ended March 31, 2022, the percentage of Qualified Dividend Income is as follows:
| Qualified |
FOMO ETF | 0.14% |
Annual Shareholder Report | 24
Additional Information (continued)March 31, 2022 (Unaudited)
PORTFOLIO HOLDINGS
The Fund files a complete schedule of investments with the Securities and Exchange Commission (“SEC”) for the first and third quarters of each fiscal year on Form N-PORT. The Form N-PORT filing must be made within 60 days of the end of the quarter. These filings are available on the SEC’s web site at http://www.sec.gov. You may also obtain copies by calling the Fund at 1-866-904-0406, free of charge.
PREMIUM/DISCOUNT INFORMATION
The Fund’s website at http://www.fomoetf.com shows the previous day’s closing NAV and closing market price for the Fund’s ETF Shares. The website also discloses, in the Premium/Discount section, how frequently the Fund’s ETF Shares traded at a premium or discount to NAV (based on closing NAVs and market prices) and the magnitudes of such premiums and discounts.
PROXY VOTING
The Fund’s proxy voting policies, procedures and voting records relating to common stock securities in the Fund’s investment portfolio are available without charge, upon request, by calling the Fund’s toll-free telephone number 1-866-904-0406. The Fund will send this information within three business days of receipt of the request, by first class mail or other means designed to ensure prompt delivery.
The Fund’s proxy information is also available on the SEC’s website at http://www.sec.gov. Information regarding how the Fund voted proxies relating to portfolio securities for the most recent 12-month period ended June 30 is available without charge, upon request by calling 1-866-904-0406 or referring to the SEC’s web site at http://www.sec.gov.
Annual Shareholder Report | 25
Name Address and | Position(s) | Term of | Principal | Number of | Other |
Dean Drulias, Esq. | Trustee | Indefinite/ | Attorney | 17 | None |
Shawn Orser | Trustee | Indefinite/ | CEO, Seaside Advisory (6/2016-Present); Executive Vice President, Seaside Advisory (2009-6/2016). | 17 | None |
Fredrick Stoleru | Trustee | Indefinite/ | Chief Executive Officer and President of Atlas Resources LLC since February 2017, Senior Vice President, Atlas Energy, 2015-2017, Vice President of the General Partner of Atlas Growth Partners, L.P. since 2013 | 17 | None |
Ronald Young Jr. | Trustee | Indefinite/ | President – Young Consulting, Inc. (2008-Present); President – Tri State LED, Inc. | 17 | None |
Annual Shareholder Report | 26
Board of Trustees and Trust Officers (Unaudited) (continued)
Interested Trustees and Officers
Name, Address and | Position(s) | Term of | Principal | Number of | Other |
Gregory Skidmore | Trustee and President | Indefinite/ November 2017 - present | President, Belpointe Asset Management, LLC since 2007. | 17 | None |
Kyle R Bubeck | Chief | Since October 2021 | President and Founder of Beacon Compliance Consulting Inc. (since 2010); CFO and CCO of Trendstar Advisors, LLC (2003 to 2009) | N/A | N/A |
William McCormick | Treasurer | Since October 2021 | Senior Wealth Advisor – Belpointe Asset Management (since 2019); Wealth Advisor – Advisory Services Network (2016 to 2019) | N/A | N/A |
Brad Rundbaken Year of Birth: 1970 | Secretary | Since October 2021 | Manager – Collaborative Fund Services, LLC (since 2018); Wealth Advisor – Belpointe Asset Management (2015 to 2018) | N/A | N/A |
* The term of office for each Trustee and officer listed above will continue indefinitely until the individual resigns or is removed.
** The term “Fund Complex” applies only to the Collaborative Investment Series Trust.
The Fund’s SAI references additional information about the Trustees and is available free of charge, upon request, by calling toll free 1-866-904-0406.
Annual Shareholder Report | 27
PRIVACY NOTICE
COLLABORATIVE INVESTMENT SERIES TRUST
FACTS | WHAT DOES THE COLLABORATIVE INVESTMENT SERIES TRUST DO WITH YOUR PERSONAL INFORMATION? |
| |
Why? | Financial companies choose how they share your personal information. Federal law gives consumers the right to limit some, but not all sharing. Federal law also requires us to tell you how we collect, share, and protect your personal information. Please read this notice carefully to understand what we do. |
| |
What? | The types of personal information we collect and share depends on the product or service that you have with us. This information can include: •Social Security number and wire transfer instructions •account transactions and transaction history •investment experience and purchase history When you are no longer our customer, we continue to share your information as described in this notice. |
| |
How? | All financial companies need to share customers’ personal information to run their everyday business. In the section below, we list the reasons financial companies can share their customers’ personal information; the reasons the Collaborative Investment Series Trust chooses to share; and whether you can limit this sharing. |
Reasons we can share your | Do we share | Can you limit |
For our everyday business purposes - such as to process your transactions, maintain your account(s), respond to court orders and legal investigations, or report to credit bureaus. | YES | NO |
For our marketing purposes - to offer our products and services to you. | NO | We don’t |
For joint marketing with other financial companies. | NO | We don’t |
For our affiliates’ everyday business purposes - information about your transactions and records. | NO | We don’t |
Annual Shareholder Report | 28
Reasons we can share your | Do we share | Can you limit |
For our affiliates’ everyday business purposes - information about your credit worthiness. | NO | We don’t |
For our affiliates to market to you | NO | We don’t |
For non-affiliates to market to you | NO | We don’t |
QUESTIONS? | Call 1-800-595-4866 | |
What we do: | |
How does the Collaborative Investment Series Trust protect my personal information? | To protect your personal information from unauthorized access and use, we use security measures that comply with federal law. These measures include computer safeguards and secured files and buildings. Our service providers are held accountable for adhering to strict policies and procedures to prevent any misuse of your nonpublic personal information. |
How does the Collaborative Investment Series Trust collect my personal information? | We collect your personal information, for example, when you •open an account or deposit money •direct us to buy securities or direct us to sell your securities •seek advice about your investments We also collect your personal information from others, such as credit bureaus, affiliates, or other companies. |
Why can’t I limit all sharing? | Federal law gives you the right to limit only: •sharing for affiliates’ everyday business purposes – information about your creditworthiness. •affiliates from using your information to market to you. •sharing for nonaffiliates to market to you. State laws and individual companies may give you additional rights to limit sharing. |
Annual Shareholder Report | 29
Definitions | |
Affiliates | Companies related by common ownership or control. They can be financial and non-financial companies. •The Collaborative Investment Series Trust does not share with affiliates. |
Non-affiliates | Companies not related by common ownership or control. They can be financial and non-financial companies. •The Collaborative Investment Series Trust does not share with non-affiliates so they can market to you. |
Joint marketing | A formal agreement between nonaffiliated financial companies that together market financial products or services to you. •The Collaborative Investment Series Trust doesn’t jointly market. |
Investment Advisor
Tuttle Capital Management, LLC
155 Lockwood Rd.
Riverside, CT 06878
Distributor
Foreside Fund Services, LLC
Three Canal Plaza, Suite 100
Portland, ME 04101
Custodian and Transfer Agent
Citibank, N.A.
388 Greenwich Street
New York, NY 10048
Legal Counsel
Thompson Hine LLP
41 South High Street, Suite 1700
Columbus, OH 43215
Independent Registered Public Accounting Firm
Cohen & Company, Ltd.
342 North Water Street, Suite 830
Milwaukee, WI 53202
Administrator, Accountant and Dividend Disbursing Agent
Citi Fund Services Ohio, Inc.
4400 Easton Commons, Suite 200
Columbus, OH 43219
This report is provided for the general information of the Fund’s shareholders. It is not authorized for distribution unless preceded or accompanied by an effective prospectus, which contains more complete information about the Fund.
5/22
Tuttle Capital Management, LLC
155 Lockwood Rd.
Riverside, CT 06878
1-866-904-0406
www.rspyetf.com
Annual Shareholder Report
Revere Sector Opportunity ETF (RSPY)
March 31, 2022
TABLE OF CONTENTS
1 | |
2 | |
3 | |
4 | |
5 | |
6 | |
7 | |
8 | |
9 | |
19 | |
21 | |
23 | |
25 |
Annual Shareholder Report | 1
Dear Shareholders,
On behalf of the entire team, we want to express our appreciation for the confidence you have placed in The Revere Sector Opportunity ETF (“RSPY” or the “Fund”). The following information pertains to the fiscal period of August 23, 2021 through March 31, 2022. RSPY uses a proprietary process overlayed across the eleven sectors of the S&P 500 Index. We identify expected leadership through technical and macro analysis as well as options intelligence.
The Fund had positive performance during the period ending on March 31, 2022. The market price for RSPY increased .12%.
We appreciate your investment in RSPY.
Sincerely,
Matthew Tuttle
Chief Executive Officer
Tuttle Capital Management, LLC
This material represents the Advisor’s assessment of the Fund and market environment as of March 31, 2022 and should not be relied upon by the reader as research, tax or investment advice, is subject to change at any time based upon economic, market, or other conditions and the Advisor undertakes no obligation to update the views expressed herein. Any discussions of specific securities should not be considered a recommendation to buy or sell those securities. The views expressed above (including any forward-looking statement) may not be relied upon as investment advice or as an indication of the Fund’s trading intent. Information about the Fund’s holdings, asset allocation or country diversification is historical and is not an indication of future Fund composition, which may vary.
Past performance is no guarantee of future results. Investment return and principal value will vary. Investors’ shares when redeemed may be worth more or less than original cost. Returns do not reflect the deduction of taxes a shareholder would pay on distributions or redemption of Fund’s shares. The Fund’s prospectus contains more complete information, including fees, expenses and risks involved in investing in newly public companies and should be read carefully before investing.
Annual Shareholder Report | 2
INVESTMENT OBJECTIVE
Revere Sector Opportunity ETF seeks to provide capital appreciation.
FUND PERFORMANCE (AS OF MARCH 31, 2022) | Average | Expense |
| Inception(b) | Total |
Revere Sector Opportunity ETF (RSPY) - Total Return | 0.04% | 1.15% |
Revere Sector Opportunity ETF (RSPY) - Total Return | 0.12% | N/A |
S&P 500 Index(e) | 2.00% | N/A |
Hypothetical Growth of a $10,000 Investment (*)
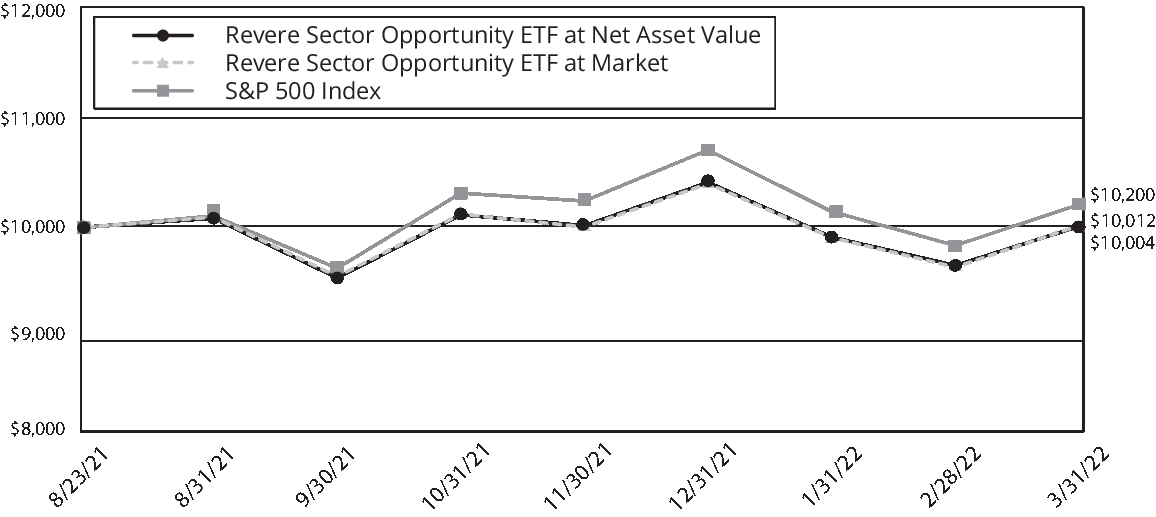
Past performance does not guarantee future results. Return calculations assume the reinvestment of distributions and do not reflect taxes that a shareholder would pay on Fund distributions or on the redemption of Fund shares. The performance data quoted represent past performance and current returns may be lower or higher. The investment return and principal value will fluctuate so that an investor’s shares, when redeemed may be worth more or less than the original cost. The performance above reflects any fee reductions during the applicable periods. If such fee reductions had not occurred, the quoted performance would be lower. To obtain performance information current to the most recent month-end, please call 1-866-904-0406 or visit http://www.rspyetf.com.
* The chart represents historical performance of a hypothetical investment of $10,000 in Revere Sector Opportunity ETF and represents the reinvestment of dividends and capital gains in the Fund.
(a) The total expense ratio reflects the gross expense ratio as reported in the Fund’s Prospectus dated August 16, 2021. Please see the Fund’s most recent prospectus for details. Additional information pertaining to the Fund’s expense ratio as of March 31, 2022 can be found in the Financial Highlights.
(b) Commencement of operations August 23, 2021.
(c) Net asset value total return is calculated assuming an initial investment made at the net asset value at the beginning of the period, reinvestment of all distributions, including dividends and return of capital, at net asset value during the period, if any, and redemption on the last day of the period at net asset value. This percentage is not an indication of the performance of a shareholder’s investment in the Fund based on market value due to differences between the market price of the shares and the net asset value per share of the Fund.
(d) Market value total return is calculated assuming an initial investment made at the market value at the beginning of the period, reinvestment of all distributions, including dividends and return of capital, at net asset value during the period, if any, and redemption on the last day of the period at market value. Market value is determined by the composite closing price. Composite closing security price is defined as the last reported sale price from any primary listing market (e.g., NYSE Arca) or participating regional exchanges or markets. The composite closing price is the last reported sale price from any of the eligible sources, regardless of volume and not an average price and may have occurred on a date prior to the close of the reporting period. Market value may be greater or less than net asset value, depending on the Fund’s closing price on the listing market.
(e) The S&P 500 Index measures the performance of 500 widely held stocks in US equity market. Standard and Poor’s chooses member companies for the index based on market size, liquidity and industry group representation. Included are the stocks of industrial, financial, utility and transportation companies. Since mid 1989, this composition has been more flexible and the number of issues in each sector has varied. It is market capitalization-weighted. Index returns, unlike the Fund’s returns, do not reflect any fees or expenses. Investors cannot invest directly in an index.
Annual Shareholder Report | 3
As a Fund shareholder, you may incur two types of costs: (1) transaction costs, including commissions on trading, as applicable; and (2) ongoing costs, including advisory fees and other Fund expenses. These examples are intended to help you understand your ongoing costs (in dollars) of investing in the Fund and to compare these costs with the ongoing costs of investing in other funds.
The expense examples below are based on an investment of $1,000 invested at the beginning of the period and held for the six-month period ended March 31, 2022.
Actual Expenses
The table below provides information about actual account values and actual expenses. You may use this information, together with the amount you invested, to estimate the expenses that you paid over the period. Simply divide your account value by $1,000 (for example, an $8,600 account value divided by $1,000 = 8.6), then multiply the result by the number in the table under the heading entitled “Expenses Paid During Period” to estimate the expenses you paid on your account during this period.
Hypothetical Example for Comparison Purposes
The table below provides information about hypothetical account values and hypothetical expenses based on the Fund’s actual expense ratio and an assumed rate of return of 5% per year before expenses, which is not the Fund’s actual return. The hypothetical account values and expenses may not be used to estimate the actual ending account balance or expenses you paid for the period. You may use this information to compare this 5% hypothetical example with the 5% hypothetical examples that appear in the shareholder reports of other funds.
Please note that the expenses shown in the table are meant to highlight your ongoing costs only and do not reflect any transactional costs, such as sales charges (loads), redemption fees, or exchange fees. Further, the expenses do not include any brokerage commissions on investors’ purchases or redemptions of Fund shares as described in the Fund’s prospectus. Therefore, the table is useful in comparing ongoing costs only, and will not help you determine the relative total costs of owning different funds. In addition, if these transactional costs were included, your costs would have been higher.
|
| Beginning | Ending | Expenses | Annualized |
Revere Sector | Actual | $1,000.00 | $1,048.40 | $ 5.36 | 1.05% |
| Hypothetical | 1,000.00 | 1,019.70 | 5.29 | 1.05 |
(a) Expenses are equal to the Fund’s annualized expense ratio multiplied by the average account value over the period, multiplied by 182/365 (the number of days in the more recent fiscal half-year divided by the number of days in the fiscal year).
See notes which are an integral part of the Financial Statements.
Annual Shareholder Report | 4
Exchange-Traded Funds | 100.0 |
Total | 100.0 |
Portfolio holdings and allocations are subject to change. As of March 31, 2022, percentages in the table above are based on total investments. Such total investments may differ from the percentages set forth in the following Portfolio of Investments which are computed using the Fund’s total net assets.
Portfolio of Investments
| Shares | Fair Value ($) | | ||
| Exchange-Traded Funds — 99.3% | | |||
| 10,878 | | Communication Services Select | 748,189 | |
| 4,129 | | Consumer Discretionary Select | 763,865 | |
| 8,989 | | Consumer Staples Select Sector SPDR Fund ETF | 682,175 | |
| 8,528 | | Energy Select Sector SPDR Fund ETF | 651,880 | |
| 25,646 | | Financial Select Sector SPDR | 982,755 | |
| 7,894 | | Health Care Select Sector SPDR | 1,081,399 | |
| 6,218 | | Industrial Select Sector SPDR | 640,330 | |
| 2,338 | | Materials Select Sector SPDR | 206,095 | |
| 3,061 | | Real Estate Select Sector SPDR | 147,907 | |
| 12,161 | | Technology Select Sector SPDR | 1,932,748 | |
| 2,880 |
| Utilities Select Sector SPDR Fund ETF | 214,445 |
|
|
|
|
| 8,051,788 |
|
| Total Exchange-Traded Funds (Cost $7,991,342) | 8,051,788 |
| ||
| | | | ||
| Total Investments — 99.3% (Cost $7,991,342) | 8,051,788 |
| ||
| Other Assets in Excess of Liabilities — 0.7% | 57,194 |
| ||
| Net Assets — 100.0% | 8,108,982 |
| ||
ETF — Exchange-Traded Fund
SPDR — Standard & Poor’s Depositary Receipts
See notes which are an integral part of the Financial Statements.
Annual Shareholder Report | 5
|
| |
Assets: | | |
Investments, at value (Cost $7,991,342) | $8,051,788 | |
Cash | 89,612 | |
Receivable for securities lending income | 43 | |
Receivable due from advisor | 1,563 | |
Prepaid expenses | 383 | |
Total Assets | 8,143,389 | |
Liabilities: | | |
Accrued expenses: | | |
Administration | 1,027 | |
Custodian | 3,002 | |
Exchange listing fee | 2,466 | |
Fund accounting | 2,393 | |
Legal and audit | 21,050 | |
Trustee | 1,450 | |
Other | 3,019 | |
Total Liabilities | 34,407 | |
Net Assets | $8,108,982 | |
Net Assets consist of: | | |
Paid in Capital | $8,075,650 | |
Total Distributable Earnings/(Deficit) | 33,332 | |
Net Assets | $8,108,982 | |
| | |
Net Assets: | $8,108,982 | |
Shares of Beneficial Interest Outstanding | 325,000 | |
Net Asset Value (offering and redemption price per share): | $24.95 | |
See notes which are an integral part of the Financial Statements.
Annual Shareholder Report | 6
| Revere | |
Investment Income: | | |
Dividend income | $71,486 | |
Securities lending income | 66 | |
Total Investment Income | 71,552 | |
Expenses: | | |
Advisory | 40,495 | |
Administration | 7,043 | |
Compliance services | 750 | |
Custodian | 3,227 | |
Exchange listing fee | 6,027 | |
Fund accounting | 11,203 | |
Legal and audit | 26,000 | |
Printing | 5,115 | |
Treasurer | 150 | |
Trustee | 3,130 | |
Other | 4,236 | |
Total Expenses before fee reductions | 107,376 | |
Expenses contractually waived and/or reimbursed by the Advisor | (62,400 | ) |
Total Net Expenses | 44,976 | |
Net Investment Income (Loss) | 26,576 | |
Realized and Unrealized Gains (Losses) from Investments: | | |
Net realized gains (losses) from investment transactions | (34,721 | ) |
Change in unrealized appreciation/(depreciation) on investments | 60,446 | |
Net Realized and Unrealized Gains (Losses) from Investments: | 25,725 | |
Change in Net Assets Resulting From Operations | $52,301 | |
(a) For the period from the commencement of operations on August 23, 2021 through March 31, 2022.
See notes which are an integral part of the Financial Statements.
Annual Shareholder Report | 7
| ||
| For the period | |
From Investment Activities: | | |
Operations: | | |
Net investment income (loss) | $26,576 | |
Net realized gains (losses) from investment transactions | (34,721 | ) |
Change in unrealized appreciation/(depreciation) on investments | 60,446 | |
Change in net assets resulting from operations | 52,301 | |
Distributions to Shareholders From: | | |
Earnings | (18,969 | ) |
Change in net assets from distributions | (18,969 | ) |
Capital Transactions: | | |
Proceeds from shares issued | 8,075,650 | |
Change in net assets from capital transactions | 8,075,650 | |
Change in net assets | 8,108,982 | |
Net Assets: | | |
Beginning of period | — | |
End of period | $8,108,982 | |
Share Transactions: | | |
Issued | 325,000 | |
Change in shares | 325,000 | |
(a) Commencement of operations.
See notes which are an integral part of the Financial Statements.
Annual Shareholder Report | 8
Revere Sector Opportunity ETF | August 23, 2021(a) | |
Net Asset Value, Beginning of Period | $25.00 | |
| | |
Net Investment Income (Loss)(b) | 0.09 | |
Net Realized and Unrealized Gains (Losses) from Investments(c) | (0.08 | ) |
Total from Investment Activities | 0.01 | |
| | |
Distributions from Net Investment Income | (0.06 | ) |
Distributions from Net Realized Gains from Investments | — | |
Total Distributions | (0.06 | ) |
| | |
Net Asset Value, End of Period | $24.95 | |
Net Assets at End of Period (000’s) | $8,109 | |
| | |
Total Return at NAV(d)(e) | 0.04% | |
Total Return at Market(e)(f) | 0.12% | |
| | |
Ratio of Net Expenses to Average Net Assets(g)(h) | 1.05% | |
Ratio of Gross Expenses to Average Net Assets(g)(h)(i) | 2.51% | |
Ratio of Net Investment Income (Loss) to Average Net Assets(g)(j) | 0.62% | |
Portfolio Turnover(e)(k) | 40% | |
(a) Commencement of operations.
(b) Calculated based on average shares method.
(c) Realized and unrealized gains (losses) per share are balancing amounts necessary to reconcile the change in net asset value per share for the period, and may not accord with the aggregate gains and losses in the Statement of Operations due to share transactions for the period.
(d) Net asset value total return is calculated assuming an initial investment made at the net asset value at the beginning of the period, reinvestment of all dividends and distributions at net asset value during the period, if any, and redemption on the last day of the period at net asset value. This percentage is not an indication of the performance of a shareholder’s investment in the Fund based on market value due to differences between the market price of the shares and the net asset value per share of the Fund.
(e) Not annualized for periods less than one year.
(f) Market value total return is calculated assuming an initial investment made at the market value at the beginning of the period, reinvestment of all dividends and distributions at net asset value during the period, if any, and redemption on the last day of the period at market value. Market value is determined by the composite closing price. Composite closing security price is defined as the last reported sale price from any primary listing market (e.g., NYSE Arca) or participating regional exchanges or markets. The composite closing price is the last reported sale price from any of the eligible sources, regardless of volume and not an average price and may have occurred on a date prior to the close of the reporting period. Market value may be greater or less than net asset value, depending on the Fund’s closing price on the listing market.
(g) Annualized for periods less than one year.
(h) Excludes expenses of the investment companies in which the Fund invests.
(i) If applicable, certain fees were waived and/or reimbursed. If such waivers/reimbursements had not occurred, the ratio would have been as indicated.
(j) Recognition of net investment income by the Fund is affected by the timing of the declaration of dividends by the underlying investment companies in which the Fund invests. The ratio does not include net investment income of the underlying investment companies.
(k) Excludes the impact of in-kind transactions.
Annual Shareholder Report | 9
(1) Organization
Collaborative Investment Series Trust (the “Trust”) was organized on July 26, 2017 as a Delaware statutory trust. The Trust is registered under the Investment Company Act of 1940 (the “1940 Act”) as an open-end management investment company and thus is determined to be an investment company for accounting purposes. The Trust is comprised of several funds and is authorized to issue an unlimited number of shares of beneficial interest (“Shares”) in one or more series representing interests in separate portfolios of securities. The accompanying financial statements are those of Revere Sector Opportunity ETF (the “Fund”). The Fund is a diversified actively-managed exchange-traded fund whose investment objective is to seek to provide capital appreciation. The Fund is a “fund of funds”, which means that the Fund invests primarily in other exchange-traded funds (the “Underlying Funds”). Underlying Funds invest in stocks, bonds and other securities and reflect varying amounts of potential investment risk and reward. The Underlying Funds record their investments at fair value. Periodically, the Fund will adjust its asset allocation as it seeks to achieve its investment objective. The Fund’s prospectus provides a description of the Fund’s investment objectives, policies, and strategies. The assets of the Fund are segregated and a shareholder’s interest is limited to the Fund in which shares are held. The Fund commenced operations on August 23, 2021.
Under the Trust’s organizational documents, its officers and Board of Trustees (the “Board”) are indemnified against certain liabilities arising out of the performance of their duties to the Fund. In addition, in the normal course of business, the Trust may enter into contracts with vendors and others that provide for general indemnifications. The Trust’s maximum exposure under these arrangements is unknown, as this would involve future claims that may be made against the Trust. However, based on experience, the Trust expects that risk of loss to be remote.
(2) Significant Accounting Policies
Shares of the Fund are listed and traded on the New York Stock Exchange Arca, Inc. (“NYSE Arca”). Market prices for the Shares may be different from their net asset value (“NAV”). The Fund issues and redeems Shares on a continuous basis at NAV only in large blocks of Shares, currently 25,000 Shares, called “Creation Units”. Creation Units are issued and redeemed principally in-kind for securities included in a specified universe. Once created, Shares generally trade in the secondary market at market prices that change throughout the day in amounts less than a Creation Unit. Shares of the Fund may only be purchased or redeemed by certain financial institutions (“Authorized Participants”). An Authorized Participant is either (i) a broker-dealer or other participant in the clearing process through the Continuous Net Settlement System of the National Securities Clearing Corporation or (ii) a DTC participant and, in each case, must have executed a Participant Agreement with Foreside Fund Services, LLC (the “Distributor”). Most retail investors do not qualify as Authorized Participants nor have the resources to buy and sell whole Creation Units. Therefore, they are unable to purchase or redeem the shares directly from the Fund.
Annual Shareholder Report | 10
Notes to Financial Statements (continued)March 31, 2022
The following is a summary of significant accounting policies consistently followed by the Fund in the preparation of its financial statements. These policies are in conformity with generally accepted accounting principles in the United States of America (“GAAP”). The Fund is an investment company and accordingly follows the investment company accounting and reporting guidance of the Financial Accounting Standards Board (“FASB”) Accounting Standards Codification Topic 946 “Financial Services – Investment Companies”. The preparation of financial statements in conformity with GAAP requires management to make estimates and assumptions that affect the amounts of assets and liabilities and disclosure of contingent assets and liabilities at the date of the financial statements and the reported amounts of income and expenses for the period. Actual results could differ from those estimates.
A. Investment Valuations
The Fund holds investments at fair value. Fair value is defined as the price that would be expected to be received to sell an asset or paid to transfer a liability in an orderly transaction between market participants at the measurement date. The valuation techniques used to determine fair value are further described below.
Security values are ordinarily obtained through the use of independent pricing services in accordance with procedures adopted by the Board. Pursuant to these procedures, the Fund may use a pricing service, bank, or broker-dealer experienced in such matters to value the Fund’s securities. When reliable market quotations are not readily available for any security, the fair value of that security will be determined by a committee established by the Board in accordance with procedures adopted by the Board. The fair valuation process is designed to value the subject security at the price the Fund would reasonably expect to receive upon its current sale. Additional consideration is given to securities that have experienced a decrease in the volume or level of activity or to circumstances that indicate that a transaction is not orderly.
The Trust has a three-tier fair value hierarchy that is dependent upon the various “inputs” used to determine the value of the Fund’s investments. The valuation techniques described below maximize the use of observable inputs and minimize the use of unobservable inputs in determining fair value. These inputs are summarized in the three broad levels listed below:
• Level 1 - Quoted prices in active markets for identical assets that the Fund has the ability to access.
• Level 2 - Other observable pricing inputs at the measurement date (including quoted prices for similar securities, interest rates, prepayment speeds, credit risk, etc.).
• Level 3 - Significant unobservable pricing inputs at the measurement date (including the Fund’s own assumptions in determining the fair value of investments).
Annual Shareholder Report | 11
Notes to Financial Statements (continued)March 31, 2022
The inputs or methodology used for valuing investments are not necessarily an indication of the risk associated with investing in those investments.
Exchange-traded funds (“ETFs”) traded on a recognized securities exchange are valued at that day’s last traded price or official closing price, as applicable, on the exchange where the fund is primarily traded. Funds traded on a recognized exchange for which there were no sales on that day may be valued at the last traded price. In each of these situations, valuations are typically categorized as Level 1 in the fair value hierarchy.
The Fund did not hold any Level 2 or Level 3 investments during the period ended March 31, 2022.
The following table provides the fair value measurement as of March 31, 2022, while the breakdown, by category, of investments is disclosed in the Portfolio of Investments for the Fund:
| Level 1 | | Total |
Revere Sector Opportunity ETF | | | |
Exchange-Traded Funds | $8,051,788 | | $8,051,788 |
Total Investments | $8,051,788 | | $8,051,788 |
B. Security Transactions and Related Income
Investment transactions are accounted for no later than the first calculation of the NAV on the business day following the trade date. For financial reporting purposes, however, security transactions are accounted for on the trade date on the last business day of the reporting period. Securities gains and losses are calculated on the identified cost basis. Interest income and expenses are accrued daily. Dividends, less foreign tax withholding, if any, are recorded on the ex-dividend date. Investment income from non-U.S. sources received by the Fund is generally subject to non-U.S. withholding taxes at rates ranging up to 30%. Such withholding taxes may be reduced or eliminated under the terms of applicable U.S. income tax treaties. The Fund may be subject to foreign taxes on gains in investments or currency repatriation. The Fund accrues such taxes, as applicable, based on its current interpretation of tax rules in the foreign markets in which it invests.
C. Cash
Idle cash may be swept into various interest bearing overnight demand deposits and is classified as cash on the Statement of Assets and Liabilities. The Fund maintains cash in bank deposit accounts which, at times, may exceed United States federally insured limit of $250,000. Amounts swept overnight are available on the next business day.
Annual Shareholder Report | 12
Notes to Financial Statements (continued)March 31, 2022
D. Dividends and Distributions to Shareholders
Distributions are recorded on the ex-dividend date. The Fund intends to distribute to its shareholders any net investment income and net realized capital gains, if any, at least annually. The amount of dividends from net investment income and net realized gains is determined in accordance with federal income tax regulations, which may differ from GAAP. These “book/tax” differences are considered either temporary or permanent in nature. To the extent these differences are permanent in nature (e.g., distributions and income received from pass-through investments), such amounts are reclassified within the capital accounts based on their nature for federal income tax purposes; temporary differences do not require reclassification.
The Fund may own shares of ETFs that may invest in real estate investments trusts (“REITs”) and master limited partnerships (“MLPs”) which report information on the source of their distributions annually. Distributions received from investments in REITs or MLPs in excess of income from underlying investments are recorded as realized gain and/or as a reduction to the cost of the ETF.
The Fund may utilize earnings and profits distributed to shareholders on redemption of shares as part of the dividends paid deduction.
E. Allocation of Expenses
Expenses directly attributable to a Fund are charged to that Fund. Expenses not directly attributable to a Fund are allocated proportionally among all Funds within the Trust in relation to the net assets of each Fund or on another reasonable basis.
F. Securities Lending
For the purpose of achieving income, the Fund may lend portfolio securities, provided (1) the loan is secured continuously by collateral consisting of U.S. Government securities or cash or cash equivalents (cash, U.S. Government securities, negotiable certificates of deposit, bankers’ acceptances or letters of credit) maintained on a daily mark-to-market basis in an amount at least equal to the current market value of the securities loaned, (2) the Fund may at any time call the loan and obtain the return of securities loaned, (3) the Fund will receive any interest or dividends received on the loaned securities, and (4) the aggregate value of the securities loaned will not at any time exceed one-third of the total assets of the lending Fund. Gain or loss in the value of securities loaned that may occur during the term of the loan will be for the account of the Fund.
Cash collateral received in connection with securities lending is held on behalf of the Fund in a demand deposit cash account at Citibank, N.A. (the “Securities Lending Agent”). Such investments are subject to risk of payment delays or default on the part of the issuer or counterparty or otherwise may not generate sufficient interest to support the costs associated with securities lending. The
Annual Shareholder Report | 13
Notes to Financial Statements (continued)March 31, 2022
Fund could also experience delays in recovering its securities and possible loss of income or value if the borrower fails to return the borrowed securities, although the Fund is indemnified from this risk by contract with the Securities Lending Agent. The Fund pays the Securities Lending Agent a portion of the gross revenues received from securities lending activities. Such fees are netted against “Securities lending income” on the Statement of Operations. The Fund did not have securities on loan as of March 31, 2022.
(3) Investment Advisory and Other Contractual Services
A. Investment Advisory Fees
Tuttle Capital Management, LLC (the “Advisor”), serves as the Fund’s investment advisor pursuant to an investment advisory agreement. Subject at all times to the oversight and approval of the Board, the Advisor is responsible for the overall management of the Fund. The Fund pays the Advisor a management fee of 0.95% of its average daily net assets, calculated daily and paid monthly.
Revere Wealth Management, LLC (“Revere”) serves as subadvisor for the Fund and is paid for its services directly by the Advisor, not the Fund. Revere’s contractual fee is 0.7125% of the Fund’s average daily net assets.
The Advisor has contractually agreed to reduce its fees and/or reimburse the expenses for the Fund (excluding front-end or contingent deferred loads, brokerage fees and commissions, acquired fund fees and expenses, fees and expenses associated with instruments in other collective investment vehicles or derivative instruments (including for example options and swap fees and expenses), borrowing costs (such as interest and dividend expense on securities sold short), taxes, other fees related to underlying investments (such as option fees and expenses or swap fees and expenses), or extraordinary expenses such as litigation (which may include indemnification of Fund officers and Trustees or contractual indemnification of Fund Service providers (other than the Advisor)) in order to ensure that net annual fund operating expenses will not exceed 1.05% of the Fund’s average daily net assets (“Expense Cap”). These fee waivers and expense reimbursements are subject to possible recoupment from the Fund within the three years of the date on which the waiver or reimbursement occurs, if such recoupment can be achieved within the lesser of the foregoing expense limits or the expense limits in place at the time of recoupment. The Expense Cap will remain in effect for the Fund until at least July 31, 2022. The Expense Cap may be terminated earlier only upon approval by the Board, on 60 days’ written notice to the Advisor. More information about the Fund’s fee waiver and Expense Cap agreement is available in the “Management of the Fund” section of the Fund’s prospectus.
As of March 31, 2022, the Advisor may recoup amounts from the Fund as follows:
| Expires | Total |
Revere Sector Opportunity ETF | $62,400 | $62,400 |
Annual Shareholder Report | 14
Notes to Financial Statements (continued)March 31, 2022
B. Administration, Custodian, Transfer Agent and Accounting Fees
Citi Fund Services Ohio, Inc. (“Citi”) serves as administrator and dividend disbursing agent for the Fund pursuant to a Services Agreement. Citibank, N.A. serves as the custodian and transfer agent pursuant to a Global Custodial and Agency Services Agreement.
Collaborative Fund Services LLC (“CFS”) provides the Fund with various management and legal administrative services. For these services, the Fund pays CFS 0.12% of the Fund’s average daily net assets, calculated daily and paid monthly, and is subject to a minimum monthly fee of $1,000.
C. Distribution and Shareholder Services Fees
Foreside Fund Services, LLC is the principal underwriter and distributor for the Fund’s Shares. The Distributor is compensated by the Advisor in accordance with a Distribution Services Agreement between the Advisor and the Distributor.
D. Compliance Services
Beacon Compliance Consulting provides compliance services to the Trust and receives a monthly fee paid by the Fund for these services.
E. Treasurer Fees
The Treasurer of the Trust receives a fee that is calculated monthly using the net assets at month-end and is paid by the Fund on a quarterly basis. During the period ended March 31, 2022, the Funds paid a total of $150 to the Treasurer.
F. General
Certain trustees and officers of the Trust are officers, directors and/or trustees of the above companies and, except for the Treasurer, receive no compensation from the Fund for their services.
(4) Investment Transactions
Purchases and sales of investments, excluding in-kind transactions and short-term investments, for the period ended March 31, 2022 were as follows:
| Purchases | Sales |
Revere Sector Opportunity ETF | $2,745,035 | $2,782,398 |
Purchases and sales of in-kind transactions for the period ended March 31, 2022 were as follows:
| Purchases | Sales |
Revere Sector Opportunity ETF | $8,063,425 | $ — |
Annual Shareholder Report | 15
Notes to Financial Statements (continued)March 31, 2022
There were no purchases or sales of U.S. government securities during the period ended March 31, 2022.
(5) Capital Share Transactions
Shares are issued and redeemed by the Fund only in aggregations of a specified number of shares or multiples thereof at NAV. Except when aggregated in Creation Units, shares of the Fund are not redeemable. Transactions in shares for the Fund are disclosed in detail on the Statement of Changes in Net Assets.
The consideration for the purchase of Creation Units of a Fund generally consists of the in-kind deposit of a designated basket of securities, which constitutes an optimized representation of the securities of that Fund’s specified universe, and an amount of cash. Investors purchasing and redeeming Creation Units may be charged a transaction fee to cover the transfer and other transactional costs it incurs to issue or redeem Creation Units. The standard transaction fee charge is $250.
From time to time, settlement of securities related to in-kind contributions or in-kind redemptions may be delayed. In such cases, securities related to in-kind transactions are reflected as a receivable or a payable on the Statement of Assets and Liabilities.
As of March 31, 2022, there were no unsettled in-kind capital transactions.
(6) Federal Income Taxes
It is the policy of the Fund to qualify as a regulated investment company by complying with the provisions available to certain investment companies, as defined in applicable sections of the Internal Revenue Code of 1986, as amended, and to make distributions of net investment income and net realized capital gains sufficient to relieve it from all, or substantially all, federal income taxes.
Management of the Fund has reviewed the tax positions taken in tax years that remain subject to examination by all major tax jurisdictions, including U.S. federal (i.e., all open tax years and the interim tax period since then). Management believes that there is no tax liability resulting from unrecognized tax benefits related to uncertain tax positions taken.
As of and during the period ended March 31, 2022, the Fund did not have a liability for any unrecognized tax benefits. The Fund recognizes interest and penalties, if any, related to unrecognized tax benefits as income tax expense on the Statement of Operations. During the period, the Fund did not incur any interest of penalties.
Annual Shareholder Report | 16
Notes to Financial Statements (continued)March 31, 2022
As of March 31, 2022, the tax cost of securities and the breakdown of unrealized appreciation/(depreciation) for the Fund were as follows:
| Tax Cost of | Unrealized | Unrealized | Net Unrealized |
Revere Sector | $7,991,342 | $240,465 | $(180,019) | $60,446 |
The tax character of distributions paid during the fiscal period ended March 31, 2022 were as follows:
| Distributions paid from | |||
| Ordinary | Net | Total Taxable | Total |
Revere Sector | $18,969 | $— | $18,969 | $18,969 |
As of March 31, 2022, the components of distributable earnings/(deficit) on a tax basis were as follows:
| Undistributed | Undistributed | Distributable | Accumulated | Unrealized | Total |
Revere Sector Opportunity ETF | $7,607 | $— | $7,607 | $(34,721) | $60,446 | $33,332 |
As of the fiscal period ended March 31, 2022, the Fund has net capital loss carryforwards (“CLCFs”) not subject to expiration as summarized in the table below.
| Short Term Amount | Total |
Revere Sector Opportunity ETF | $34,721 | $34,721 |
Under current law, capital losses and specified ordinary losses realized after October 31 and non-specified ordinary losses incurred after December 31 (ordinary losses collectively known as “late year ordinary loss”) may be deferred and treated as occurring on the first business day of the following fiscal year. As of the fiscal period ended March 31, 2022, the Fund had no deferred losses.
Annual Shareholder Report | 17
Notes to Financial Statements (continued)March 31, 2022
(7) Investment Risks
ETF Risk
The NAV of a Fund can fluctuate up or down, and you could lose money investing in the Fund if the prices of the securities owned by the Fund decline. In addition, the Fund may be subject to the following risks: (1) the market price of the Fund’s shares may trade above or below its NAV; (2) an active trading market for a Fund’s shares may not develop or be maintained; or (3) trading of the Fund’s shares may be halted if the listing exchange’s officials deem such action appropriate, the shares are delisted from the exchange, or the activation of market-wide “circuit breakers” (which are tied to large decreases in stock prices) halts stock trading generally.
Market Risk
Overall market risks may also affect the value of the Fund. Factors such as domestic economic growth and market conditions, interest rate levels and political events affect the securities markets. Local, regional or global events such as war, acts of terrorism, the spread of infectious illness or other public health issue, recessions and depressions, or other events could have a significant impact on the Fund and its investments and could result in increased premiums or discounts to the Fund’s NAV, and may impair market liquidity, thereby increasing liquidity risk. The Fund could lose money over short periods due to short-term market movements and over longer periods during more prolonged market downturns. During a general market downturn, multiple asset classes may be negatively affected. Changes in market conditions and interest rates can have the same impact on all types of securities and instruments.
An outbreak of infectious respiratory illness caused by a novel coronavirus known as COVID-19 was first detected in China in December 2019 and has now been detected globally. This coronavirus has resulted in travel restrictions, closed international borders, enhanced health screenings at ports of entry and elsewhere, disruption of and delays in healthcare service preparation and delivery, prolonged quarantines, cancellations, supply chain disruptions, and lower consumer demand, as well as general concern and uncertainty. The impact of COVID-19, and other infectious illness outbreaks that may arise in the future, could adversely affect the economies of many nations or the entire global economy, individual issuers and capital markets in ways that cannot necessarily be foreseen. In addition, the impact of infectious illnesses in emerging market countries may be greater due to generally less established healthcare systems. Public health crises caused by the COVID-19 outbreak may exacerbate other pre-existing political, social and economic risks in certain countries or globally. The duration of the COVID-19 outbreak and its effects cannot be determined with certainty.
Annual Shareholder Report | 18
Notes to Financial Statements (continued)March 31, 2022
(8) Subsequent Events
The Board approved the reorganization of the Fund into a new series of Investment Managers Series Trust II at a meeting held on February 16, 2022. The reorganization is subject to the approval of the Fund’s shareholders. Fund shareholders will receive a combined prospectus/proxy statement with more information regarding the reorganization.
Management of the Fund has evaluated the need for disclosures and/or adjustments resulting from subsequent events through the date these financial statements were issued. Based upon this evaluation, no additional disclosures or adjustments were required to the financial statements as of March 31, 2022.
Annual Shareholder Report | 19
To the Shareholders of Revere Sector Opportunity ETF and
Board of Trustees of Collaborative Investment Series Trust
Opinion on the Financial Statements
We have audited the accompanying statement of assets and liabilities, including the portfolio of investments, of Revere Sector Opportunity ETF (the “Fund”), a series of Collaborative Investment Series Trust, as of March 31, 2022, the related statements of operations and changes in net assets, the related notes, and the financial highlights for the period from August 23, 2021 (commencement of operations) through March 31, 2022 (collectively referred to as the “financial statements”). In our opinion, the financial statements present fairly, in all material respects, the financial position of the Fund as of March 31, 2022, the results of its operations, the changes in net assets, and the financial highlights for the period from August 23, 2021 (commencement of operations) through March 31, 2022, in conformity with accounting principles generally accepted in the United States of America.
Basis for Opinion
These financial statements are the responsibility of the Fund’s management. Our responsibility is to express an opinion on the Fund’s financial statements based on our audit. We are a public accounting firm registered with the Public Company Accounting Oversight Board (United States) (“PCAOB”) and are required to be independent with respect to the Fund in accordance with the U.S. federal securities laws and the applicable rules and regulations of the Securities and Exchange Commission and the PCAOB.
We conducted our audit in accordance with the standards of the PCAOB. Those standards require that we plan and perform the audit to obtain reasonable assurance about whether the financial statements are free of material misstatement whether due to error or fraud.
Our audit included performing procedures to assess the risks of material misstatement of the financial statements, whether due to error or fraud, and performing procedures that respond to those risks. Such procedures included examining, on a test basis, evidence regarding the amounts and disclosures in the financial statements. Our procedures included confirmation of securities owned as of March 31, 2022, by correspondence with the custodian. Our audit also included evaluating the accounting principles used and significant estimates made by management, as well as evaluating the overall presentation of the financial statements. We believe that our audit provides a reasonable basis for our opinion.
Annual Shareholder Report | 20
Report of Independent Registered Public Accounting Firm (continued)
We have served as the auditor of one or more investment companies advised by Tuttle Capital Management, LLC since 2020.

COHEN & COMPANY, LTD.
Milwaukee, Wisconsin
May 26, 2022
Annual Shareholder Report | 21
Other Federal Income Tax Information
During the fiscal period ended March 31, 2022, the following percentage of the total ordinary income distributions paid by the Fund qualifies for the distributions received deduction available to corporate shareholders:
| Distributions Received Deduction |
Revere Sector Opportunity ETF | 100% |
For the fiscal period ended March 31, 2022, distributions paid by the Fund may be subject to a maximum tax rate of 15%, as provided by the Jobs and Growth Relief Reconciliation Act of 2003. The Fund intends to designate the maximum amount allowable as taxed at a maximum rate of 15%. Complete information will be reported in conjunction with your 2022 Form 1099-DIV.
During the fiscal period ended March 31, 2022, the percentage of Qualified Dividend Income is as follows:
| Qualified |
Revere Sector Opportunity ETF | 100% |
Annual Shareholder Report | 22
Additional Information (continued)March 31, 2022 (Unaudited)
PORTFOLIO HOLDINGS
The Fund files a complete schedule of investments with the Securities and Exchange Commission (“SEC”) for the first and third quarters of each fiscal year on Form N-PORT. The Form N-PORT filing must be made within 60 days of the end of the quarter. These filings are available on the SEC’s web site at http://www.sec.gov. You may also obtain copies by calling the Fund at 1-866-904-0406, free of charge.
PREMIUM/DISCOUNT INFORMATION
The Fund’s website at http://www.rspyetf.com shows the previous day’s closing NAV and closing market price for the Fund’s ETF Shares. The website also discloses, in the Premium/Discount section, how frequently the Fund’s ETF Shares traded at a premium or discount to NAV (based on closing NAVs and market prices) and the magnitudes of such premiums and discounts.
PROXY VOTING
The Fund’s proxy voting policies, procedures and voting records relating to common stock securities in the Fund’s investment portfolio are available without charge, upon request, by calling the Fund’s toll-free telephone number 1-866-904-0406. The Fund will send this information within three business days of receipt of the request, by first class mail or other means designed to ensure prompt delivery.
The Fund’s proxy information is also available on the SEC’s website at http://www.sec.gov. Information regarding how the Fund voted proxies relating to portfolio securities for the most recent 12-month period ended June 30 is available without charge, upon request by calling 1-866-904-0406 or referring to the SEC’s web site at http://www.sec.gov.
Annual Shareholder Report | 23
Name Address and | Position(s) | Term of | Principal | Number of | Other |
Dean Drulias, Esq. | Trustee | Indefinite/ | Attorney | 17 | None |
Shawn Orser | Trustee | Indefinite/ | CEO, Seaside Advisory (6/2016-Present); Executive Vice President, Seaside Advisory (2009-6/2016). | 17 | None |
Fredrick Stoleru | Trustee | Indefinite/ | Chief Executive Officer and President of Atlas Resources LLC since February 2017, Senior Vice President, Atlas Energy, 2015-2017, Vice President of the General Partner of Atlas Growth Partners, L.P. since 2013 | 17 | None |
Ronald Young Jr. | Trustee | Indefinite/ | President – Young Consulting, Inc. (2008-Present); President – Tri State LED, Inc. (2010-Present). | 17 | None |
Annual Shareholder Report | 24
Board of Trustees and Trust Officers (Unaudited) (continued)
Interested Trustees and Officers
Name, Address and | Position(s) | Term of | Principal | Number of | Other |
Gregory Skidmore | Trustee and President | Indefinite/ November 2017 - present | President, Belpointe Asset Management, LLC since 2007. | 17 | None |
Kyle R Bubeck | Chief Compliance Officer | Since October | President and Founder of Beacon Compliance Consulting Inc. (since 2010); CFO and CCO of Trendstar Advisors, LLC (2003 to 2009) | N/A | N/A |
William McCormick | Treasurer | Since October | Senior Wealth Advisor – Belpointe Asset Management (since 2019); Wealth Advisor – Advisory Services Network (2016 to 2019) | N/A | N/A |
Brad Rundbaken | Secretary | Since October | Manager – Collaborative Fund Services, LLC (since 2018); Wealth Advisor – Belpointe Asset Management (2015 to 2018) | N/A | N/A |
* The term of office for each Trustee and officer listed above will continue indefinitely until the individual resigns or is removed.
** The term “Fund Complex” applies only to the Collaborative Investment Series Trust.
The Fund’s SAI references additional information about the Trustees and is available free of charge, upon request, by calling toll free 1-866-904-0406.
Annual Shareholder Report | 25
PRIVACY NOTICE
COLLABORATIVE INVESTMENT SERIES TRUST
FACTS | WHAT DOES THE COLLABORATIVE INVESTMENT SERIES TRUST DO WITH YOUR PERSONAL INFORMATION? |
| |
Why? | Financial companies choose how they share your personal information. Federal law gives consumers the right to limit some, but not all sharing. Federal law also requires us to tell you how we collect, share, and protect your personal information. Please read this notice carefully to understand what we do. |
| |
What? | The types of personal information we collect and share depends on the product or service that you have with us. This information can include: •Social Security number and wire transfer instructions •account transactions and transaction history •investment experience and purchase history When you are no longer our customer, we continue to share your information as described in this notice. |
| |
How? | All financial companies need to share customers’ personal information to run their everyday business. In the section below, we list the reasons financial companies can share their customers’ personal information; the reasons the Collaborative Investment Series Trust chooses to share; and whether you can limit this sharing. |
Reasons we can share your | Do we share | Can you limit |
For our everyday business purposes - such as to process your transactions, maintain your account(s), respond to court orders and legal investigations, or report to credit bureaus. | YES | NO |
For our marketing purposes - to offer our products and services to you. | NO | We don’t |
For joint marketing with other financial companies. | NO | We don’t |
For our affiliates’ everyday business purposes - information about your transactions and records. | NO | We don’t |
Annual Shareholder Report | 26
Reasons we can share your | Do we share | Can you limit |
For our affiliates’ everyday business purposes - information about your credit worthiness. | NO | We don’t |
For our affiliates to market to you | NO | We don’t |
For non-affiliates to market to you | NO | We don’t |
QUESTIONS? | Call 1-800-595-4866 | |
What we do: | |
How does the Collaborative Investment Series Trust protect my personal information? | To protect your personal information from unauthorized access and use, we use security measures that comply with federal law. These measures include computer safeguards and secured files and buildings. Our service providers are held accountable for adhering to strict policies and procedures to prevent any misuse of your nonpublic personal information. |
How does the Collaborative Investment Series Trust collect my personal information? | We collect your personal information, for example, when you •open an account or deposit money •direct us to buy securities or direct us to sell your securities •seek advice about your investments We also collect your personal information from others, such as credit bureaus, affiliates, or other companies. |
Why can’t I limit all sharing? | Federal law gives you the right to limit only: •sharing for affiliates’ everyday business purposes – information about your creditworthiness. •affiliates from using your information to market to you. •sharing for nonaffiliates to market to you. State laws and individual companies may give you additional rights to limit sharing. |
Annual Shareholder Report | 27
Definitions | |
Affiliates | Companies related by common ownership or control. They can be financial and non-financial companies. •The Collaborative Investment Series Trust does not share with affiliates. |
Non-affiliates | Companies not related by common ownership or control. They can be financial and non-financial companies. •The Collaborative Investment Series Trust does not share with non-affiliates so they can market to you. |
Joint marketing | A formal agreement between nonaffiliated financial companies that together market financial products or services to you. •The Collaborative Investment Series Trust doesn’t jointly market. |
Investment Advisor
Tuttle Capital Management, LLC
155 Lockwood Rd.
Riverside, CT 06878
Investment Subadvisor
Revere Wealth Management, LLC
650 Fifth Avenue, 35th Floor
New York, NY 10019
Distributor
Foreside Fund Services, LLC
Three Canal Plaza, Suite 100
Portland, ME 04101
Custodian and Transfer Agent
Citibank, N.A.
388 Greenwich Street
New York, NY 10048
Legal Counsel
Thompson Hine LLP
41 South High Street, Suite 1700
Columbus, OH 43215
Independent Registered Public Accounting Firm
Cohen & Company, Ltd.
342 North Water Street, Suite 830
Milwaukee, WI 53202
Administrator, Accountant and Dividend Disbursing Agent
Citi Fund Services Ohio, Inc.
4400 Easton Commons, Suite 200
Columbus, OH 43219
This report is provided for the general information of the Fund’s shareholders. It is not authorized for distribution unless preceded or accompanied by an effective prospectus, which contains more complete information about the Fund.
5/22
Item 2. Code of Ethics.
(a) As of the end of the period covered by the report, the registrant has adopted a code of ethics that applies to the registrant’s Principal Executive Officer and Principal Financial Officer.
(b) Not applicable.
(c) During the period covered by the report, with respect to the registrant’s code of ethics that applies to its Principal Executive Officer and Principal Financial Officer: there have been no amendments to a provision that relates to any element of the code of ethics definition enumerated in paragraph (b) of this Item 2.
(d) During the period covered by the report, with respect to the registrant’s code of ethics that applies to its Principal Executive Officer and Principal Financial Officer: there have been no waivers granted from a provision that relates to any element of the code of ethics definition enumerated in paragraph (b) of this Item 2.
(e) Not applicable.
Item 3. Audit Committee Financial Expert.
The registrant’s board of Trustees has determined that Fred Stoleru is an audit committee financial expert, as defined in Item 3 of Form N-CSR. Mr. Stoleru is independent for purposes of this Item 3.
Item 4. Principal Accountant Fees and Services.
(a) Audit Fees billed to the registrant by its principal accountants for the two most recent fiscal years:
Period ended 2022: $26,000
(b) Audit-Related Fees billed to the registrant by its principal accountants for the two most recent fiscal years:
Period ended 2022: $6,000
(c) Tax Fees billed to the registrant by its principal accountants for the two most recent fiscal years:
Period ended 2022: $ -
Fees for 2021 related to the review of the registrant’s tax returns. Amount requiring approval of the registrant’s audit committee pursuant to paragraph (c)(7)(ii) of Rule 2-01 of Regulation S-X, $0.
(d) All other fees billed to the registrant by its principal accountants for the two most recent fiscal years:
Period Ended 2022: $ -
Amount requiring approval of the registrant’s audit committee pursuant to paragraph (c)(7)(ii) of Rule 2-01 of Regulation S-X, $0 and $0 respectively.
(e)(1) The Registrant’s audit committee has reviewed the scope and plan of the independent public accountants’ annual and interim examinations, approve the services (other than the annual audit) to be performed for the Registrant by the independent public accountants and approve the fees and other compensation payable to the independent accountants.
(f) Not applicable.
(g) Not applicable.
(h) The registrant’s Audit Committee has considered whether the provision of non-audit services that were rendered to registrant’s investment adviser (not including any sub adviser whose role is primarily portfolio management and is subcontracted with or overseen by another investment adviser), and any entity controlling, controlled by, or under common control with the investment adviser that provide ongoing services to the registrant that were not pre-approved pursuant to paragraph (c)(7)(ii) of Rule 2-01 of Regulation S-X is compatible with maintaining the principal account’s independence.
Item 5. Audit Committee of Listed Registrants.
Not applicable.
Item 6. Investments.
(a) The schedules of investments are included as part of the report to shareholders filed under Item 1 of this form.
(b) Not applicable.
Item 7. Disclosure of Proxy Voting Policies and Procedures for Closed-End Management Investment Companies.
Not applicable.
Item 8. Portfolio Managers of Closed-End Management Investment Companies.
Not applicable.
Item 9. Purchases of Equity Securities by Closed-End Management Investment Company and Affiliated Purchasers.
Not applicable.
Item 10. Submission of Matters to a Vote of Security Holders.
Not applicable.
Item 11. Controls and Procedures.
(a) The registrant’s Principal Executive Officer and Principal Financial Officer have concluded that the registrant’s disclosure controls and procedures (as defined in Rule 30a-3(c) under the Act) are effective in design and operation and are sufficient to form the basis of the certifications required by Rule 30a-2 under the Act, based on their evaluation of these disclosure controls and procedures within 90 days of the filing of this report on Form N-CSR.
(b) There were no changes in the registrant’s internal control over financial reporting (as defined in Rule 30a-3(d) under the Act (17 CFR 270.30a-3(d)) that occurred during the period covered by this report that have materially affected or are reasonably likely to materially affect, the registrant’s internal control over financial reporting.
Item 12. Disclosure of Securities Lending Activities for Closed-End Management Investment Companies.
Not applicable.
Item 12. Exhibits.
| (a)(1) | The code of ethics that is the subject of the disclosure required by Item 2 is attached hereto. |
| (a)(2) | Certifications pursuant to Rule 30a-2(a) are attached hereto. |
| (a)(3) | Not applicable. |
| (a)(4) | Not applicable. |
| (b) | Certifications pursuant to Rule 30a-2(b) are furnished herewith. |
SIGNATURES
Pursuant to the requirements of the Securities Exchange Act of 1934 and the Investment Company Act of 1940, the registrant has duly caused this report to be signed on its behalf by the undersigned, thereunto duly authorized.
| (Registrant) | Collaborative Investment Series Trust |
| By (Signature and Title) | /s/ Gregory Skidmore |
| Gregory Skidmore, Trustee, President and Principal Executive Officer of the Trust |
| Date | 6/3/2022 |
Pursuant to the requirements of the Securities Exchange Act of 1934 and the Investment Company Act of 1940, this report has been signed below by the following persons on behalf of the registrant and in the capacities and on the dates indicated.
| By (Signature and Title) | /s/ Gregory Skidmore |
| Gregory Skidmore, Trustee, President and Principal Executive Officer of the Trust |
| Date | 6/3/2022 |
| By (Signature and Title) | /s/ Bill McCormick |
| Bill McCormick, Treasurer and Principal Financial Officer of the Trust |
| Date | 6/4/2022 |