
Shareholder Letter Q1 2019 | May 7, 2019 Exhibit 99.2
To Our Fellow Shareholders red violet works passionately to drive innovative solutions into the market, enabling our customers to run their organizations with confidence. We kicked off 2019 in strong fashion, achieving $5.7 million in revenue in Q1, a 72% increase year-over-year, and a $0.7 million improvement in net loss to $1.4 million for the quarter. Our adjusted gross margin was 53%, and we improved our adjusted EBITDA by $1.0 million to negative $0.4 million, while adding 393 new customers in the quarter. It was yet another quarter of sequential record revenue and a significantly improved bottom line with solid margin expansion. Given that we experienced our traditional seasonality in the fourth quarter of 2018, which tends to be our slowest quarter in terms of sequential revenue growth, we saw our pace of growth resume in Q1 and we fully expect that trend to continue throughout the year. Many of our current shareholders already know our story. Most people do not. So, let’s pause for a moment to tell you a bit about who we are, and where we are going as a company. The road traveled From day one, we set out to build our technology with an eye towards the future. During these early times, our operational roadmap was already clearly defined. Our initial goal was to simply follow the path that we had traveled twice before successfully, providing information solutions to the risk management industry, including financial services, insurance companies, corporate risk departments, law enforcement, government, law firms, collection agencies and debt buyers, for purposes such as due diligence, risk mitigation, and identity verification. We knew that this familiar path was the shortest distance to profitability, delivering solutions to our previous customers and taking back market share from the competition who continues to use our legacy technologies. Our technology roadmap demanded the integration of versatility, greater scalability, extensibility, and dynamism into all that we build, laying the Q1 2019 2 What drives us Big data presents big challenges. We love big challenges. Technological innovation over the past two decades has generated mammoth amounts of data – disparate, structured and unstructured – challenging organizations in their quest to transform this data into actionable insights. Putting it simplistically, we aggregate, assimilate, analyze and link this data, thereby transforming it into intelligence for use by organizations to solve for a variety of challenges, from basic to extremely complex. We call it data fusion. Our management team has done this twice before, building two information solution providers and selling them for an aggregate of approximately $1 billion. In doing so, we accomplished many successes, and we learned from our mistakes. Technology and modern data science techniques have changed radically over the years, and the volume and variety of data has expanded dramatically. When we started the company, we knew that this time was different. We believed that, with these seismic shifts in technology and data, an extraordinary opportunity was presented – to build a cloud-based, next-generation technology platform, with both traditional and novel data sets integrated, and informed by artificial intelligence and machine learning.
groundwork for the application of future technologies and innovative solutions to address larger existing and emerging industries and, thus, larger addressable markets. Our platform was designed to be data and industry agnostic, so that we could deliver solutions not only to the risk management industry that we served for two decades, but also the marketing industry and ultimately every organization in need of data-driven, actionable insights. Early years were spent hiring exceptional team members, building our cloud-based, technology platform, CORE™, and amassing a multitude of data sets. As one can imagine, this development phase is the most cost- intensive phase of the business, representing a significant barrier to entry, along with requisite knowledge and experience in building the technology, the ability to identify and acquire the right data assets, and the expertise needed to fuse the data. We are excited to say that the development phase is behind us. Sure, we will continually work to enhance all areas of the business, especially our technology and solutions, but with the lion’s share of development work behind us, moving forward, with each passing quarter, we expect to see a significant improvement in financial metrics as revenue scales and cost of revenue does not. We believe that in order to be successful, a company must have great people, great products, great partners, and great customers. We have, and continue to invest in, all four. Our Seattle-based technology team is best-in-class. Comprised of data scientists and engineers, and in collaboration with our stellar infrastructure team, these talented individuals are responsible for supporting our analytics platform, receiving, fusing and updating data, applying analytic and decision-making capabilities, and delivering real-time solutions to our customers at scale. Our products and solutions are winning head-to-head challenges against the competition, while we continue to integrate new data and enhance functionality and performance to further differentiate our offerings. We’ve built strong relationships with top-tier data suppliers and strategic industry alliances, with concerted effort on ensuring alignment of each party’s objectives and the achievement of future goals. As demonstrated by our revenue growth and retention, we maintain enduring customer relationships by first understanding our customers’ needs, and then providing the right solution and a level of service that the competition is either unwilling or unable to provide. Throughout 2018, we completed our transition from a development-stage company to a sales-driven company. We recently met our near-term goal of staffing our sales force, ending the year with 43 quality sales representatives. The increased number and caliber of our sales team has resulted in greater sales effectiveness, as reflected in our Q1 2019 revenue numbers. With an average of three to six months for a new sales representative to become productive, we expect to see increased sales productivity and thus increased revenue throughout 2019. While we will continue to expand the sales team as opportunity dictates, we’ve strengthened our focus on enhancing the capacity and effectiveness of the team, increasing ROI from current personnel throughout the sales organization, with the goal of creating even greater operating margin for the business. Q1 2019 3

Leveraging our model We employ a fixed cost of revenue business model that generates tremendous leverage. Historically, as our previous companies evolved, upwards of 80-90% adjusted gross margins were achieved. For Q1 2019, our adjusted gross margin increased to 53% compared to 39% in the same period last year. We expect our gross margin to consistently increase over time. We license the majority of our raw data assets under long-term, flat-fee unlimited use contracts. (We also generate proprietary data sets internally.) Our cost of revenue includes costs related to our data assets and our cloud infrastructure. We utilize the cloud to deliver efficiencies to our customers. With enormous elasticity, we have great scalability and flexibility in deploying additional servers during peak or intensive production periods and to reduce the quantity of servers back to a steady state. This enables us to increase system efficiency, control costs, and to pass on these efficiencies to our customers. As our revenue scales, each incremental dollar of revenue provides nearly 100% contribution margin and significantly reduces our burn rate as we drive to profitability. Our powerful platform and information solutions Our platform is designed for ease of access and use of our solutions in a variety of ways, without any material cost to our customers for integration into their workflow. Customers access our solutions through an online interface, API, batch processing, and through custom integrations. For online transactions, customers query our platform through an intuitive, easy-to-use interface, designed for seamless interaction, smarter questions, and better data-driven decisioning. We serve not only end-user customers, but we also power the back end of various companies, many of which are leaders in their specific industries. Through the integration of our information and underlying analytics into their products and solutions, we directly support and foster the growth of their businesses. Our platform’s versatility lends itself to just about any data-driven challenge, both small and large – the law enforcement investigator that solved a crime by using our solutions to link a consumer to a single Internet Protocol (IP) address at a specific point in time, to the multi-billion dollar company leveraging our platform and data to perform large-scale entity resolution of millions of businesses and consumers. Q1 2019 4 *A reconciliation of non-GAAP financial measures used in this letter to their nearest GAAP equivalents is provided at the end of this letter.
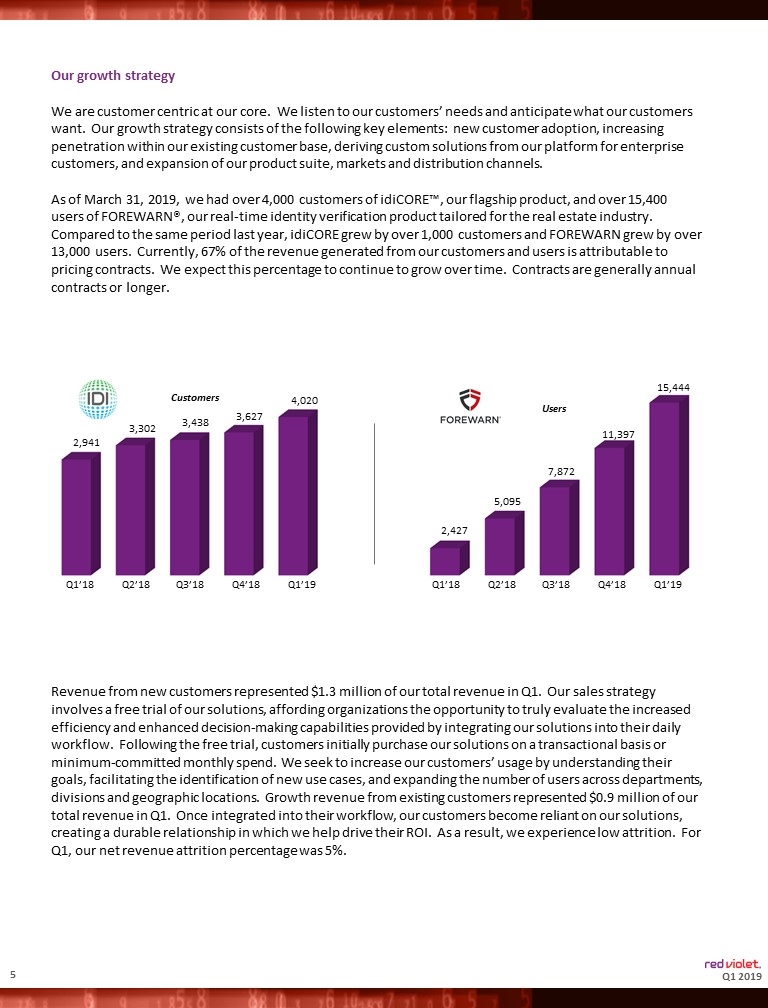
Our growth strategy We are customer centric at our core. We listen to our customers’ needs and anticipate what our customers want. Our growth strategy consists of the following key elements: new customer adoption, increasing penetration within our existing customer base, deriving custom solutions from our platform for enterprise customers, and expansion of our product suite, markets and distribution channels. As of March 31, 2019, we had over 4,000 customers of idiCORE™, our flagship product, and over 15,400 users of FOREWARN®, our real-time identity verification product tailored for the real estate industry. Compared to the same period last year, idiCORE grew by over 1,000 customers and FOREWARN grew by over 13,000 users. Currently, 67% of the revenue generated from our customers and users is attributable to pricing contracts. We expect this percentage to continue to grow over time. Contracts are generally annual contracts or longer. Revenue from new customers represented $1.3 million of our total revenue in Q1. Our sales strategy involves a free trial of our solutions, affording organizations the opportunity to truly evaluate the increased efficiency and enhanced decision-making capabilities provided by integrating our solutions into their daily workflow. Following the free trial, customers initially purchase our solutions on a transactional basis or minimum-committed monthly spend. We seek to increase our customers’ usage by understanding their goals, facilitating the identification of new use cases, and expanding the number of users across departments, divisions and geographic locations. Growth revenue from existing customers represented $0.9 million of our total revenue in Q1. Once integrated into their workflow, our customers become reliant on our solutions, creating a durable relationship in which we help drive their ROI. As a result, we experience low attrition. For Q1, our net revenue attrition percentage was 5%. Q1 2019 5 2,941 3,302 3,438 3,627 4,020 Customers Q1’18 Q2’18 Q3’18 Q4’18 Q1’19 2,427 5,095 7,872 11,397 Users Q1’18 Q2’18 Q3’18 Q4’18 Q1’19 15,444

The road ahead We are pleased with our progress to date. But there is still much work to do. We have a multi-year product roadmap that we are executing upon and it is still early days. We are making significant inroads in the risk management industry, are advancing our expansion into the marketing industry, and are planning our entrance into new markets and verticals, all made possible by our unique and differentiated platform. Our technology enables our entrée into various new industries, even where others may have already paved the way. Our platform affords optionality as to where we desire to go. Self-service data analytics (code-free analytical tools), data-driven consumer modeling platforms, and behavioral-based predictive analytics are just a few potential paths. Whether we simply compete in these new markets, significantly improve upon existing offerings, or offer entirely new ways of addressing market needs, the opportunities abound. This is not a zero-sum game. New technologies are driving new business models and revolutionizing traditional models. From fintech to bricks and mortar, all industries are dependent upon the increasing utilization of data-driven insights. Our challenges lie not in a lack of opportunities, but in prioritizing the multitude of opportunities immediately before us. And as we turn cash flow positive, which we expect to occur in the near term, we will reinvest in the business to drive long-term growth. Moving forward, we plan to be more visible to our investor base. We will do this in a variety of ways, including a plan to institute conference calls later in the year to accompany our earnings announcements, as well as including supplemental operating metrics in our earnings releases that we feel are important to understanding the health of the business. These are extremely exciting times for red violet. And none of this is possible without the incredible team we have assembled. Their dedication and hard work is remarkable and I am proud to be associated with each and every member of the team. Thank you to our loyal customers and shareholders for continuing to support us during the growth of this amazing company. Derek Dubner CEO Q1 2019 6
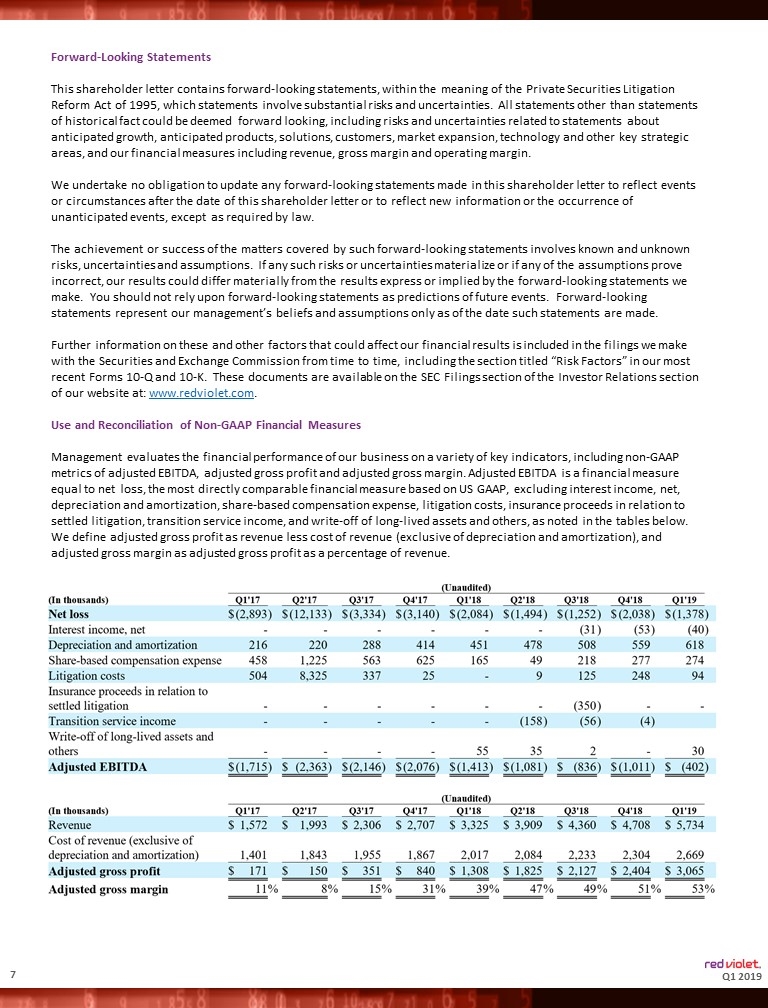
Forward-Looking Statements This shareholder letter contains forward-looking statements, within the meaning of the Private Securities Litigation Reform Act of 1995, which statements involve substantial risks and uncertainties. All statements other than statements of historical fact could be deemed forward looking, including risks and uncertainties related to statements about anticipated growth, anticipated products, solutions, customers, market expansion, technology and other key strategic areas, and our financial measures including revenue, gross margin and operating margin. We undertake no obligation to update any forward-looking statements made in this shareholder letter to reflect events or circumstances after the date of this shareholder letter or to reflect new information or the occurrence of unanticipated events, except as required by law. The achievement or success of the matters covered by such forward-looking statements involves known and unknown risks, uncertainties and assumptions. If any such risks or uncertainties materialize or if any of the assumptions prove incorrect, our results could differ materially from the results express or implied by the forward-looking statements we make. You should not rely upon forward-looking statements as predictions of future events. Forward-looking statements represent our management’s beliefs and assumptions only as of the date such statements are made. Further information on these and other factors that could affect our financial results is included in the filings we make with the Securities and Exchange Commission from time to time, including the section titled “Risk Factors” in our most recent Forms 10-Q and 10-K. These documents are available on the SEC Filings section of the Investor Relations section of our website at: www.redviolet.com. Use and Reconciliation of Non-GAAP Financial Measures Management evaluates the financial performance of our business on a variety of key indicators, including non-GAAP metrics of adjusted EBITDA, adjusted gross profit and adjusted gross margin. Adjusted EBITDA is a financial measure equal to net loss, the most directly comparable financial measure based on US GAAP, excluding interest income, net, depreciation and amortization, share-based compensation expense, litigation costs, insurance proceeds in relation to settled litigation, transition service income, and write-off of long-lived assets and others, as noted in the tables below. We define adjusted gross profit as revenue less cost of revenue (exclusive of depreciation and amortization), and adjusted gross margin as adjusted gross profit as a percentage of revenue. Q1 2019 7
We present adjusted EBITDA, adjusted gross profit and adjusted gross margin as supplemental measures of our operating performance because we believe they provide useful information to our investors as they eliminate the impact of certain items that we do not consider indicative of our cash operations and ongoing operating performance. In addition, we use them as an integral part of our internal reporting to measure the performance of our business, evaluate the performance of our senior management and measure the operating strength of our business. Adjusted EBITDA, adjusted gross profit and adjusted gross margin are measures frequently used by securities analysts, investors and other interested parties in their evaluation of the operating performance of companies similar to ours and are indicators of the operational strength of our business. Adjusted EBITDA eliminates the uneven effect of considerable amounts of non-cash depreciation and amortization, share-based compensation expense and the impact of other items. Adjusted gross profit and adjusted gross margin are calculated by using cost of revenue (exclusive of depreciation and amortization). Adjusted EBITDA, adjusted gross profit and adjusted gross margin are not intended to be performance measures that should be regarded as an alternative to, or more meaningful than, either loss before income taxes or net loss as indicators of operating performance or to cash flows from operating activities as a measure of liquidity. The way we measure adjusted EBITDA, adjusted gross profit and adjusted gross margin may not be comparable to similarly titled measures presented by other companies, and may not be identical to corresponding measures used in our various agreements. About red violet® At red violet, we believe that time is your most valuable asset. Through powerful analytics, we transform data into intelligence, in a fast and efficient manner, so that our clients can spend their time on what matters most - running their organizations with confidence. Through leading-edge, proprietary technology and a massive data repository, our analytics and information solutions harness the power of data fusion, uncovering the relevance of disparate data points and converting them into comprehensive and insightful views of people, businesses, assets and their interrelationships. We empower clients across markets and industries to better execute all aspects of their business, from managing risk, recovering debt, identifying fraud and abuse, and ensuring legislative compliance, to identifying and acquiring customers. At red violet, we are dedicated to making the world a safer place and reducing the cost of doing business. For more information, please visit www.redviolet.com. Investor relations contact: Camilo Ramirez, ir@redviolet.com Q1 2019 8


