- ACET Dashboard
- Financials
- Filings
-
Holdings
- Transcripts
- ETFs
- Insider
- Institutional
- Shorts
-
8-K Filing
Adicet Bio (ACET) 8-KRegulation FD Disclosure
Filed: 19 Feb 20, 8:06am

Targeting the biology of aging to treat aging-related diseases Corporate Presentation February 2020 Exhibit 99.1
Forward-looking statements This presentation has been prepared by resTORbio, Inc. (“we,” ”us,” “our,” “resTORbio,” or the “Company”) and is made for informational purposes only and does not constitute an offer to sell or a solicitation of an offer to buy securities. This presentation may contain “forward-looking statements” within the meaning of the Private Securities Litigation Reform Act of 1995, including, but not limited to, statements regarding the safety, efficacy and regulatory and clinical progress of our product candidates, including RTB101 alone and in combination with a rapalog, such as everolimus or sirolimus. All such forward-looking statements are based on management’s current expectations of future events and are subject to a number of risks and uncertainties that could cause actual results to differ materially and adversely from those set forth in or implied by such forward-looking statements. The use of words such as, but not limited to, “may,” “might,” “will,” “should,” “expect,” “plan,” “anticipate,” “believe,” “estimate,” “project,” “intend,” “future,” “potential,” or “continue,” and other similar words or expressions are intended to identify forward-looking statements. Forward-looking statements are neither historical facts nor assurances of future performance. Instead, they are based on our current beliefs, expectations and assumptions regarding the future of our business, future plans and strategies, our clinical results and other future conditions. All statements other than statements of historical facts contained in this presentation, including statements regarding future results of operations and financial position, business strategy, current and prospective product candidates, ongoing and planned clinical trials and preclinical activities, including the initiation, timing, enrollment, progress and results of our preclinical and clinical studies and our research and development programs, product approvals, research and development costs, current and prospective collaborations, the timing and likelihood of success of our Phase 1b/2a clinical trial of RTB101, alone or in combination with sirolimus, in Parkinson’s disease and the timing or likelihood of regulatory progress, results, filings and approvals, expectations regarding market acceptance and size, plans and objectives of management for future operations, and future results of anticipated product candidates, are forward-looking statements. New risks and uncertainties may emerge from time to time, and it is not possible to predict all risks and uncertainties. No representations or warranties (expressed or implied) are made about the accuracy of any such forward-looking statements. These statements are also subject to a number of material risks and uncertainties that are discussed in the section entitled "Risk Factors" in resTORbio’s annual report on Form 10-K for the fiscal year ended December 31, 2018, as well as discussions of potential risks, uncertainties, and other important factors in resTORbio's subsequent filings with the Securities and Exchange Commission. Any forward-looking statement speaks only as of the date on which it was made. Neither we, nor our affiliates, advisors or representatives, undertake any obligation to publicly update or revise any forward-looking statement, whether as a result of new information, future events or otherwise, except as required by law. Certain information contained in this presentation relates to or is based on studies, publications, surveys and other data obtained from third-party sources and the Company’s own internal estimates and research. While we believe these third-party sources to be reliable as of the date of this presentation, we have not independently verified, and we make no representation as to the adequacy, fairness, accuracy or completeness of any information obtained from third-party sources. In addition, all of the market data included in this presentation involves a number of assumptions and limitations, and there can be no guarantee as to the accuracy or reliability of such assumptions. Finally, while we believe our own internal research is reliable, such research has not been verified by any independent source.
resTORbio highlights Extensive preclinical data demonstrate that TORC1 inhibition may ameliorate multiple aging related diseases, including neurodegenerative diseases TORC1 inhibition may be a promising approach for the treatment of Parkinson’s disease (PD) Ameliorates levodopa-induced dyskinesia in preclinical PD models Induces lysosomal biogenesis and autophagy, clears alpha-synuclein aggregates and is neuroprotective in preclinical PD models Lead candidate, RTB101, is an oral, selective and potent TORC1 inhibitor that has been observed in preclinical models to cross the blood brain barrier and induce autophagy in neurons Ongoing Phase 1b/2a clinical trial of RTB101 +/- sirolimus for PD Safety, tolerability and cerebrospinal fluid (CSF) exposure data are expected by mid-2020 in PD patients RTB101 has the potential to alleviate levodopa-induced dyskinesia and may offer the first opportunity to slow disease progression by inducing autophagy in the brain of PD patients In interim data from three cohorts in the Phase 1b/2a study we observed that RTB101 is well tolerated, crosses the blood brain barrier, and reaches concentrations in cerebrospinal fluid observed to inhibit the activity of TORC1 and induce autophagy in neuronal cells Sirolimus at the dose of 2 mg, alone or in combination with RTB101, was not detected in the CSF Cash, cash equivalents and marketable securities of $117.3 million as of September 30, 2019
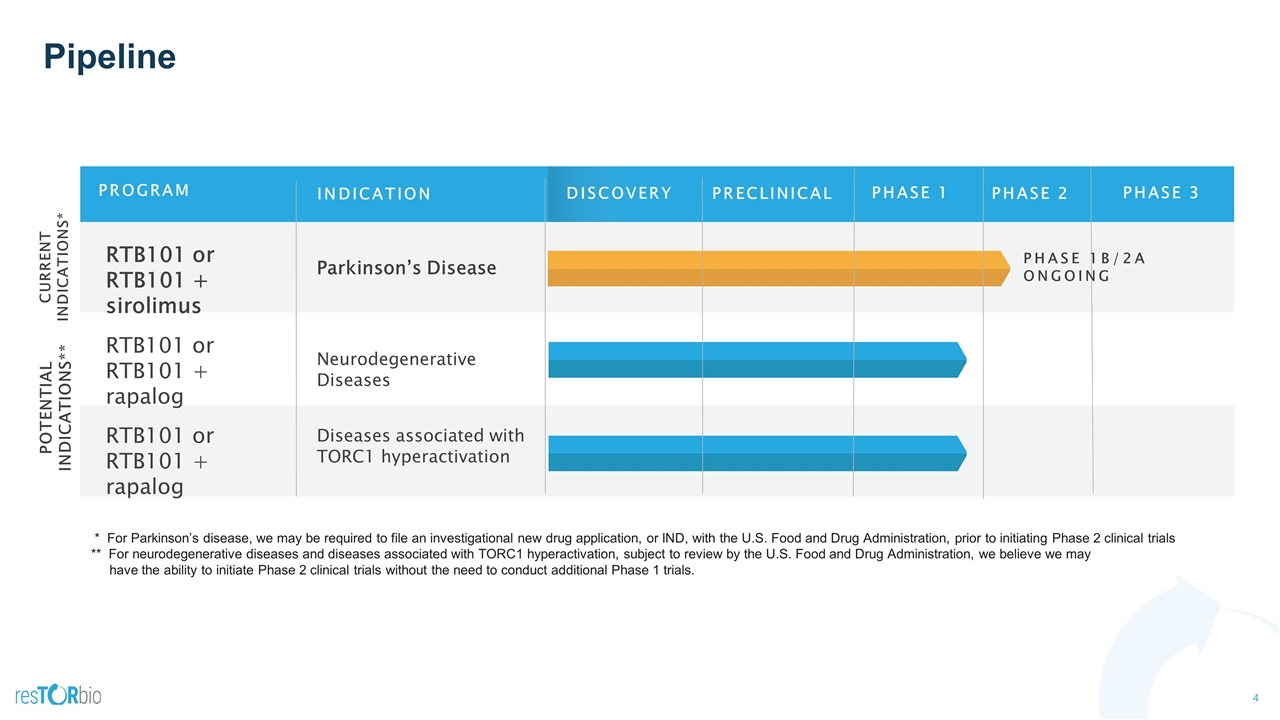
Pipeline * For Parkinson’s disease, we may be required to file an investigational new drug application, or IND, with the U.S. Food and Drug Administration, prior to initiating Phase 2 clinical trials ** For neurodegenerative diseases and diseases associated with TORC1 hyperactivation, subject to review by the U.S. Food and Drug Administration, we believe we may have the ability to initiate Phase 2 clinical trials without the need to conduct additional Phase 1 trials. RTB101 or RTB101 + sirolimus RTB101 or RTB101 + rapalog RTB101 or RTB101 + rapalog Parkinson’s Disease Neurodegenerative Diseases Diseases associated with TORC1 hyperactivation CURRENT INDICATIONS* POTENTIAL INDICATIONS** PHASE 1B/2A ONGOING PROGRAM INDICATION PRECLINICAL PHASE 1 PHASE 2 PHASE 3 DISCOVERY
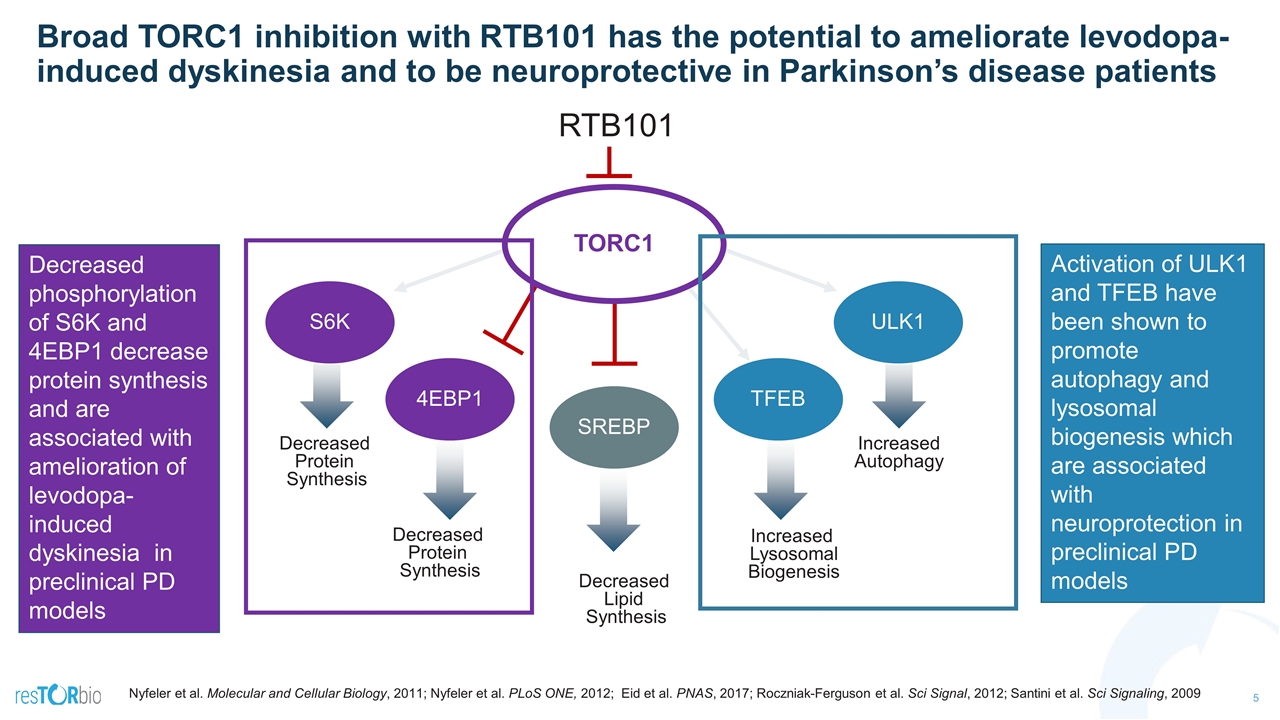
Broad TORC1 inhibition with RTB101 has the potential to ameliorate levodopa-induced dyskinesia and to be neuroprotective in Parkinson’s disease patients Decreased Lipid Synthesis Decreased Protein Synthesis SREBP 4EBP1 S6K Increased Autophagy Increased Lysosomal Biogenesis ULK1 TFEB TORC1 Decreased Protein Synthesis Decreased phosphorylation of S6K and 4EBP1 decrease protein synthesis and are associated with amelioration of levodopa-induced dyskinesia in preclinical PD models Activation of ULK1 and TFEB have been shown to promote autophagy and lysosomal biogenesis which are associated with neuroprotection in preclinical PD models RTB101 Nyfeler et al. Molecular and Cellular Biology, 2011; Nyfeler et al. PLoS ONE, 2012; Eid et al. PNAS, 2017; Roczniak-Ferguson et al. Sci Signal, 2012; Santini et al. Sci Signaling, 2009
Parkinson’s Disease: Disease modification Neurodegenerative Diseases
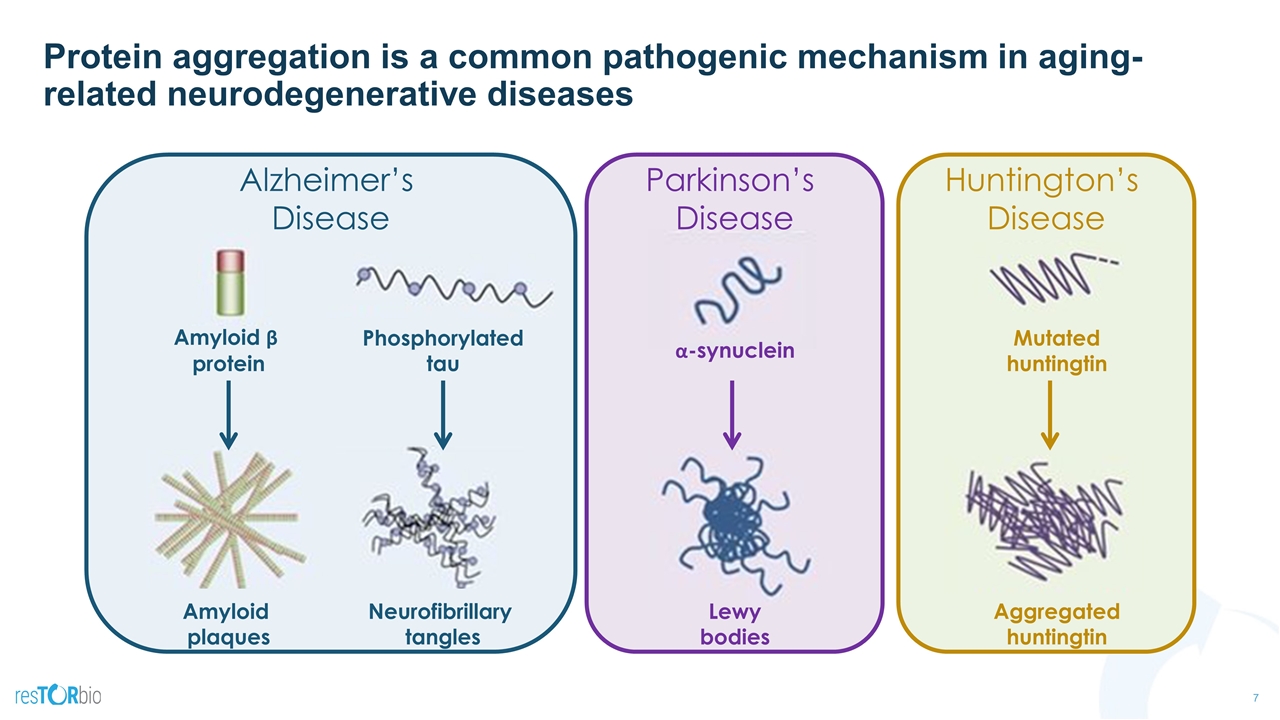
Protein aggregation is a common pathogenic mechanism in aging-related neurodegenerative diseases Alzheimer’s Disease Huntington’s Disease Amyloid plaques Neurofibrillary tangles Lewy bodies Aggregated huntingtin Amyloid β protein Phosphorylated tau α-synuclein Mutated huntingtin Parkinson’s Disease
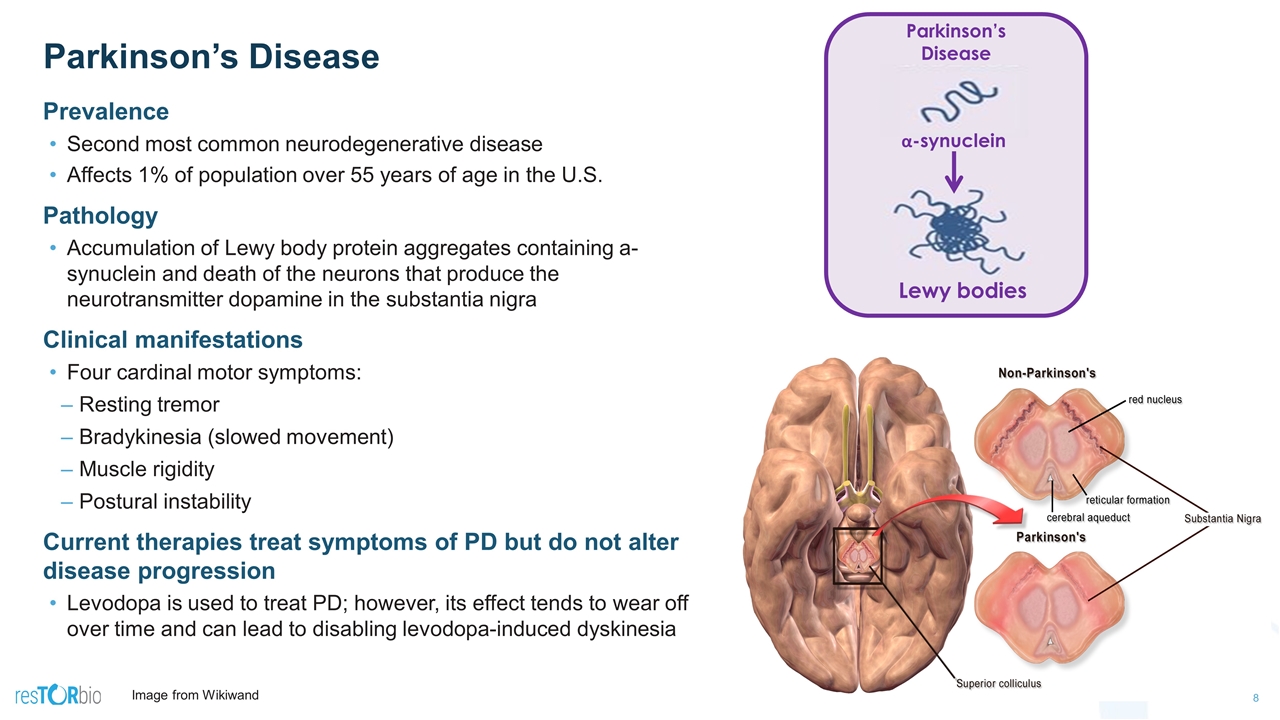
Parkinson’s Disease Image from Wikiwand Prevalence Second most common neurodegenerative disease Affects 1% of population over 55 years of age in the U.S. Pathology Accumulation of Lewy body protein aggregates containing a-synuclein and death of the neurons that produce the neurotransmitter dopamine in the substantia nigra Clinical manifestations Four cardinal motor symptoms: Resting tremor Bradykinesia (slowed movement) Muscle rigidity Postural instability Current therapies treat symptoms of PD but do not alter disease progression Levodopa is used to treat PD; however, its effect tends to wear off over time and can lead to disabling levodopa-induced dyskinesia Parkinson’s Disease Lewy bodies α-synuclein
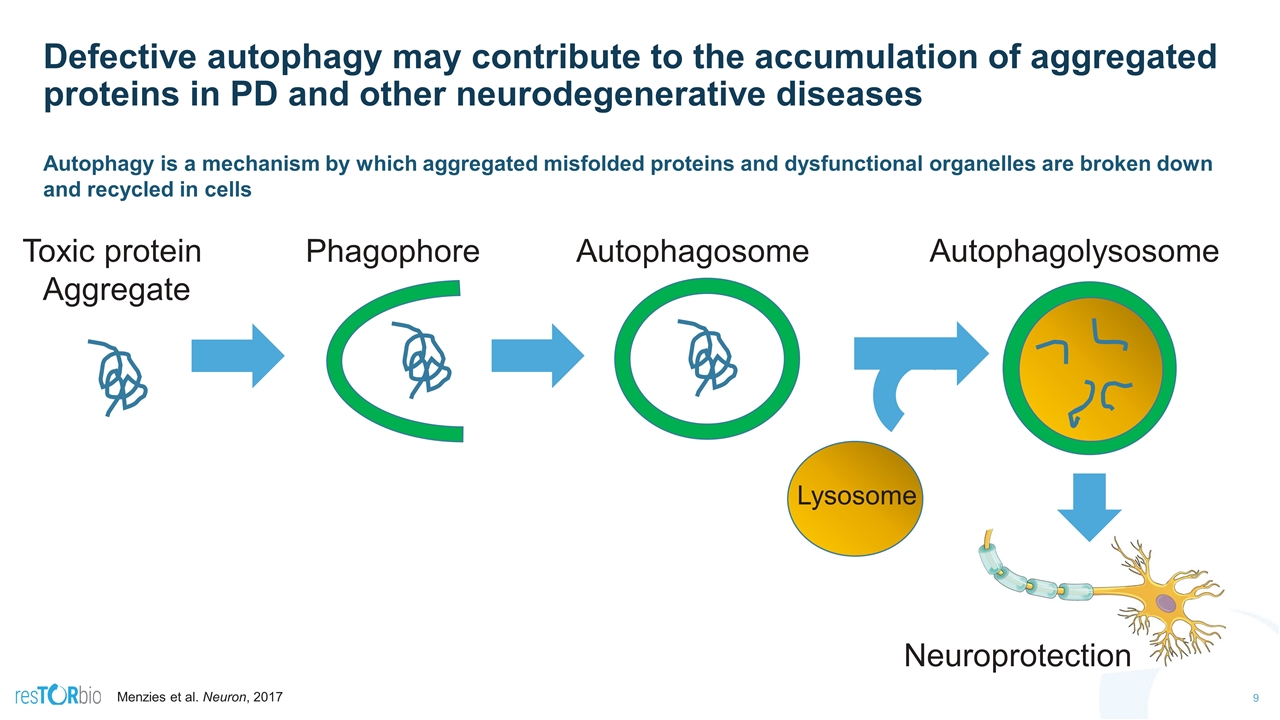
Autophagy is a mechanism by which aggregated misfolded proteins and dysfunctional organelles are broken down and recycled in cells Defective autophagy may contribute to the accumulation of aggregated proteins in PD and other neurodegenerative diseases Toxic protein Aggregate Autophagosome Phagophore Autophagolysosome Lysosome Menzies et al. Neuron, 2017 Neuroprotection
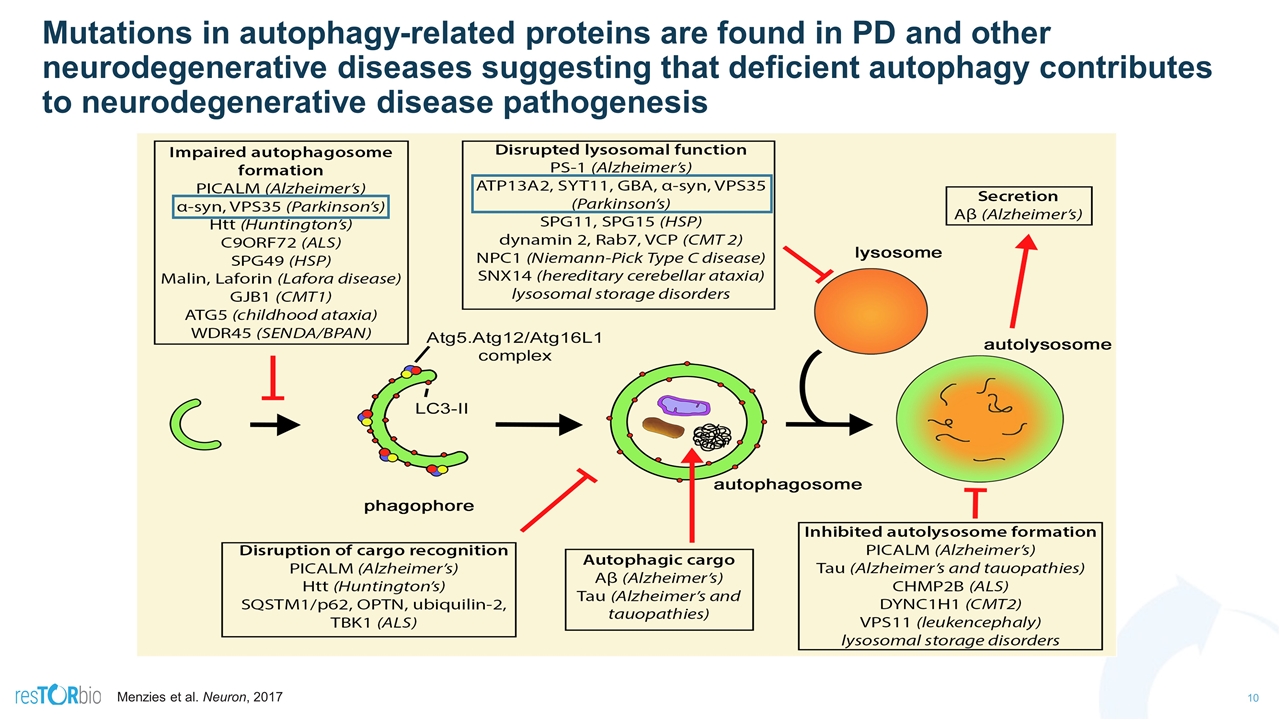
Mutations in autophagy-related proteins are found in PD and other neurodegenerative diseases suggesting that deficient autophagy contributes to neurodegenerative disease pathogenesis Menzies et al. Neuron, 2017
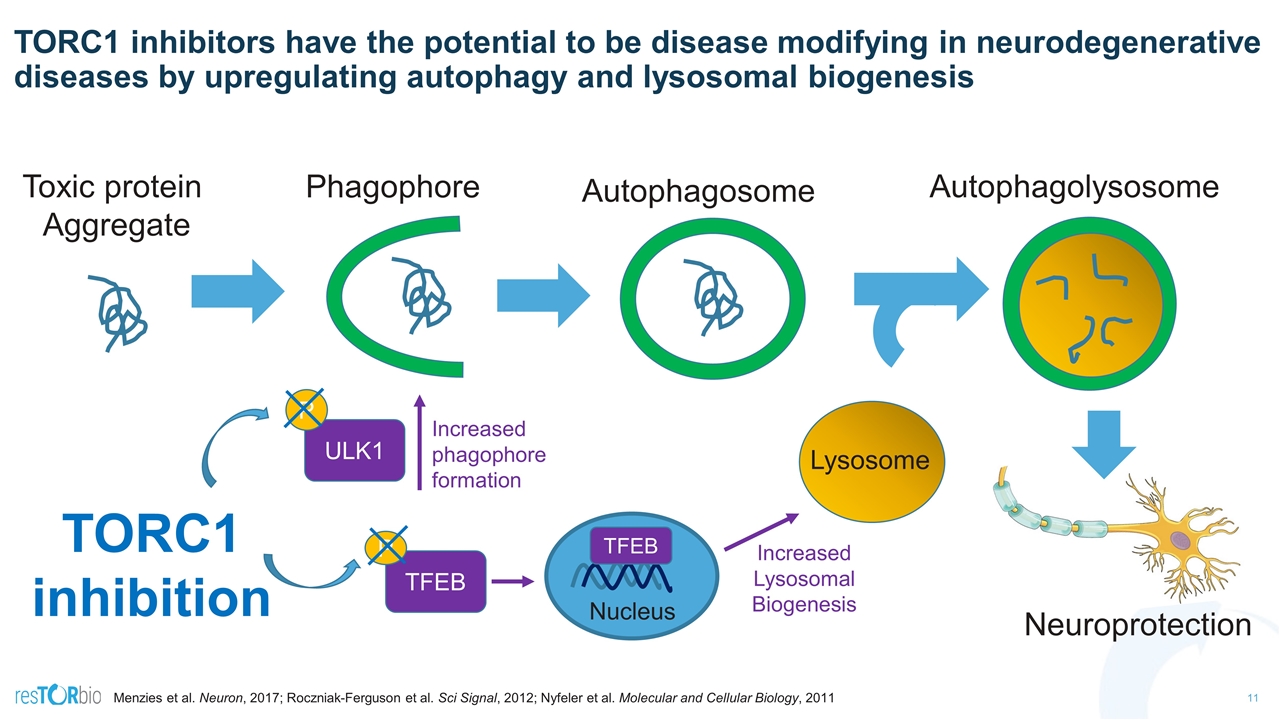
TORC1 inhibitors have the potential to be disease modifying in neurodegenerative diseases by upregulating autophagy and lysosomal biogenesis Toxic protein Aggregate Autophagosome Phagophore Autophagolysosome Lysosome TORC1 inhibition Menzies et al. Neuron, 2017; Roczniak-Ferguson et al. Sci Signal, 2012; Nyfeler et al. Molecular and Cellular Biology, 2011 Increased phagophore formation Increased Lysosomal Biogenesis Neuroprotection TFEB P ULK1 P TFEB Nucleus

TORC1 inhibition is neuroprotective in PD pre-clinical models In a rat PD model that overexpresses a-syn in the substantia nigra, the TORC1 inhibitor CCI-779 started 3 weeks after adenoviral delivery of a-syn (3w) and given every other day for 5 weeks was shown (A) to correct impaired TFEB function (as reflected by increased TFEB nuclear translocation), (B) decreased striatal a-syn levels (both monomeric and high molecular weight (HMW) aggregates), (C) increased dopaminergic neuron survival and (D) improved motor function. A. B. C. D. *p < 0.05 compared with the 3-wk α-syn group #p < 0.05 compared with α-syn+vehicle group Decressac et al. PNAS, 2013 Increased TFEB nuclear translocation Clearance of toxic a-syn aggregates Improved Neuronal Survival Improved Motor Performance
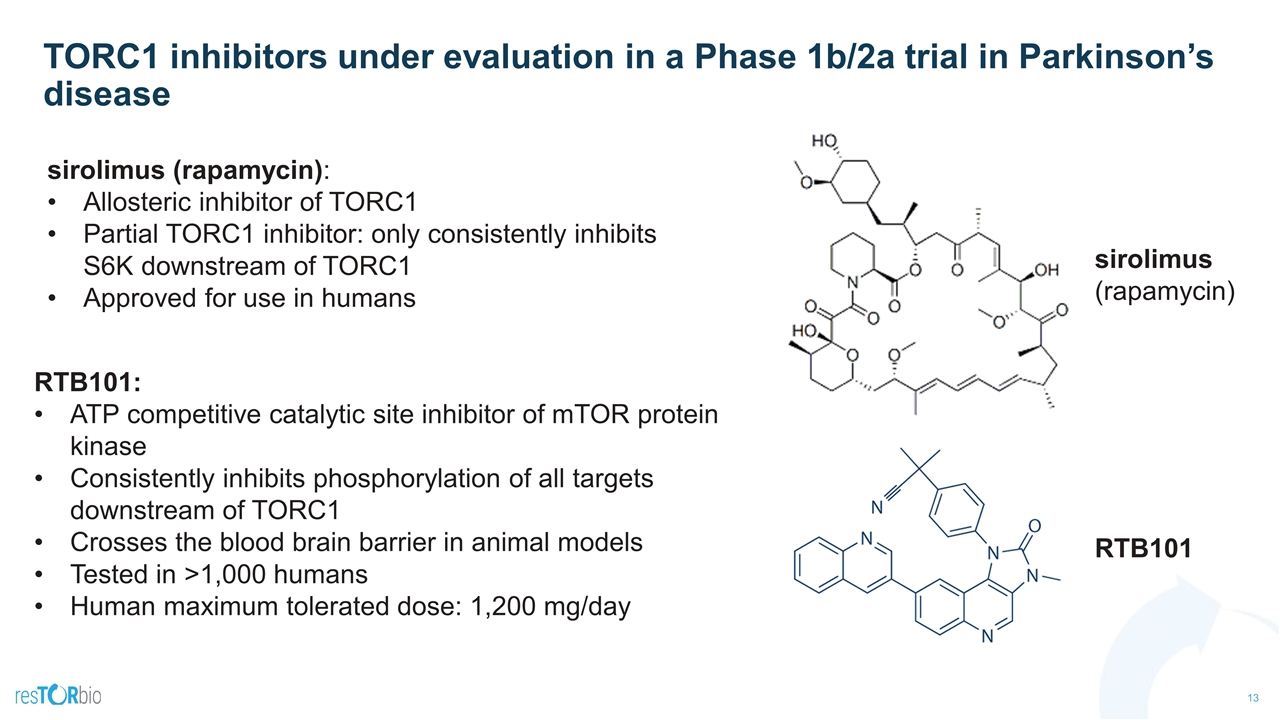
TORC1 inhibitors under evaluation in a Phase 1b/2a trial in Parkinson’s disease sirolimus (rapamycin): Allosteric inhibitor of TORC1 Partial TORC1 inhibitor: only consistently inhibits S6K downstream of TORC1 Approved for use in humans sirolimus (rapamycin) RTB101: ATP competitive catalytic site inhibitor of mTOR protein kinase Consistently inhibits phosphorylation of all targets downstream of TORC1 Crosses the blood brain barrier in animal models Tested in >1,000 humans Human maximum tolerated dose: 1,200 mg/day RTB101
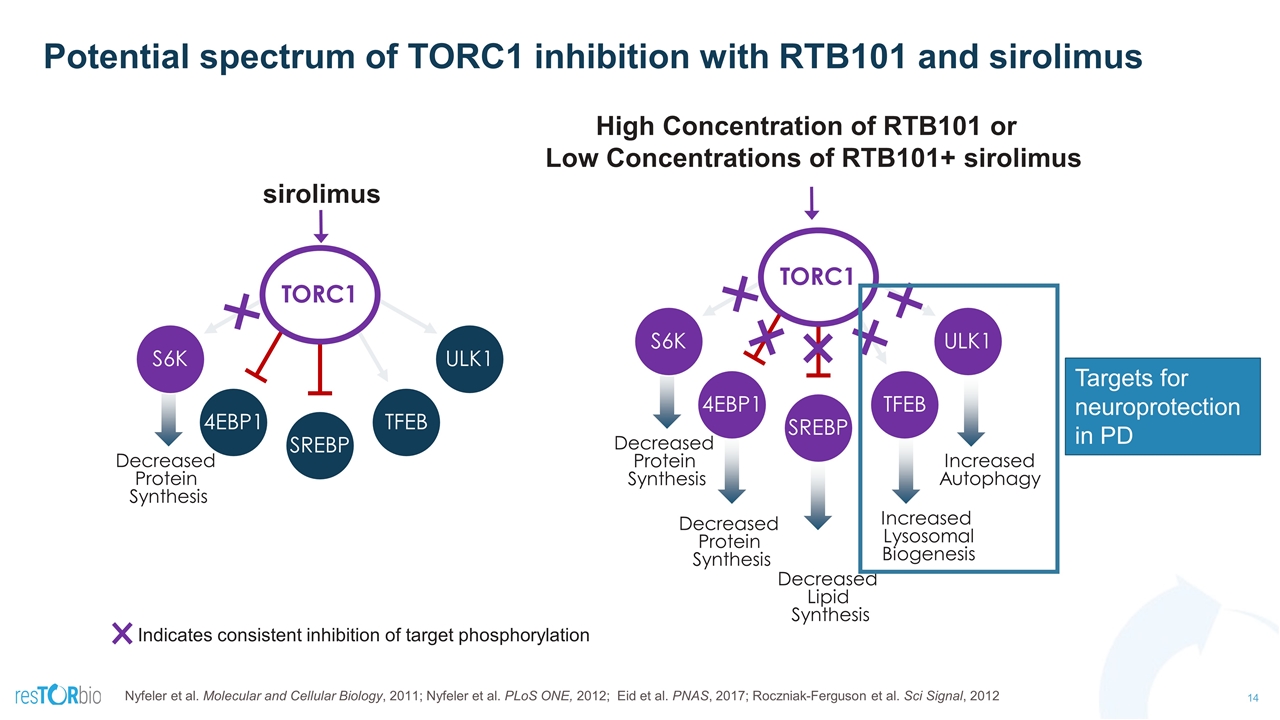
Potential spectrum of TORC1 inhibition with RTB101 and sirolimus Nyfeler et al. Molecular and Cellular Biology, 2011; Nyfeler et al. PLoS ONE, 2012; Eid et al. PNAS, 2017; Roczniak-Ferguson et al. Sci Signal, 2012 sirolimus High Concentration of RTB101 or Low Concentrations of RTB101+ sirolimus ULK1 TFEB SREBP 4EBP1 S6K TORC1 Decreased Protein Synthesis Increased Lysosomal Biogenesis Decreased Lipid Synthesis Decreased Protein Synthesis ULK1 TFEB SREBP 4EBP1 S6K TORC1 Decreased Protein Synthesis Targets for neuroprotection in PD Increased Autophagy Indicates consistent inhibition of target phosphorylation
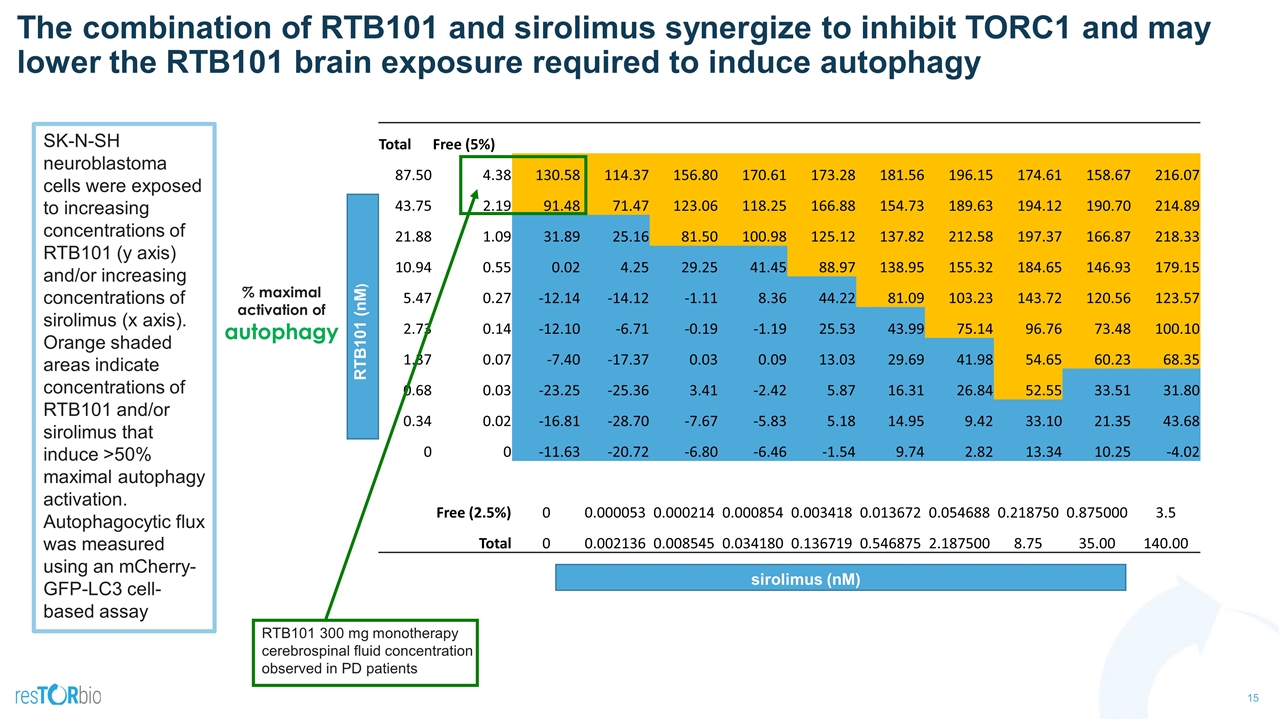
The combination of RTB101 and sirolimus synergize to inhibit TORC1 and may lower the RTB101 brain exposure required to induce autophagy Total Free (5%) 87.50 4.38 130.58 114.37 156.80 170.61 173.28 181.56 196.15 174.61 158.67 216.07 43.75 2.19 91.48 71.47 123.06 118.25 166.88 154.73 189.63 194.12 190.70 214.89 21.88 1.09 31.89 25.16 81.50 100.98 125.12 137.82 212.58 197.37 166.87 218.33 10.94 0.55 0.02 4.25 29.25 41.45 88.97 138.95 155.32 184.65 146.93 179.15 5.47 0.27 -12.14 -14.12 -1.11 8.36 44.22 81.09 103.23 143.72 120.56 123.57 2.73 0.14 -12.10 -6.71 -0.19 -1.19 25.53 43.99 75.14 96.76 73.48 100.10 1.37 0.07 -7.40 -17.37 0.03 0.09 13.03 29.69 41.98 54.65 60.23 68.35 0.68 0.03 -23.25 -25.36 3.41 -2.42 5.87 16.31 26.84 52.55 33.51 31.80 0.34 0.02 -16.81 -28.70 -7.67 -5.83 5.18 14.95 9.42 33.10 21.35 43.68 0 0 -11.63 -20.72 -6.80 -6.46 -1.54 9.74 2.82 13.34 10.25 -4.02 Free (2.5%) 0 0.000053 0.000214 0.000854 0.003418 0.013672 0.054688 0.218750 0.875000 3.5 Total 0 0.002136 0.008545 0.034180 0.136719 0.546875 2.187500 8.75 35.00 140.00 RTB101 (nM) sirolimus (nM) SK-N-SH neuroblastoma cells were exposed to increasing concentrations of RTB101 (y axis) and/or increasing concentrations of sirolimus (x axis). Orange shaded areas indicate concentrations of RTB101 and/or sirolimus that induce >50% maximal autophagy activation. Autophagocytic flux was measured using an mCherry-GFP-LC3 cell-based assay % maximal activation of autophagy RTB101 300 mg monotherapy cerebrospinal fluid concentration observed in PD patients
Parkinson’s Disease: Levodopa-induced dyskinesia Neurodegenerative Diseases

Advantage of PD as a clinical indication for TORC1 inhibitors: levodopa-induced dyskinesia (LID) is a potential clinical endpoint that can be assessed in a shorter time frame than disease progression LID is a disabling side effect of chronic levodopa treatment associated with significantly impaired quality of life and increased health care costs1 Most common dyskinesias: chorea (jerky involuntary movements, especially around the face, shoulders, and hips) dystonia (involuntary muscle contraction leading to twisting, repetitive movements, or abnormal posture in affected muscle or muscle group) Average time to onset of dyskinesia estimated at 6.5 years1 > 90% of PD patients will have LID after 15 years of levodopa therapy3 1 and figure Calabresi et al., 2010; 2 Tran et al., 2018; 3 Ahlskog and Muenter 2001 and Hely et al 2005
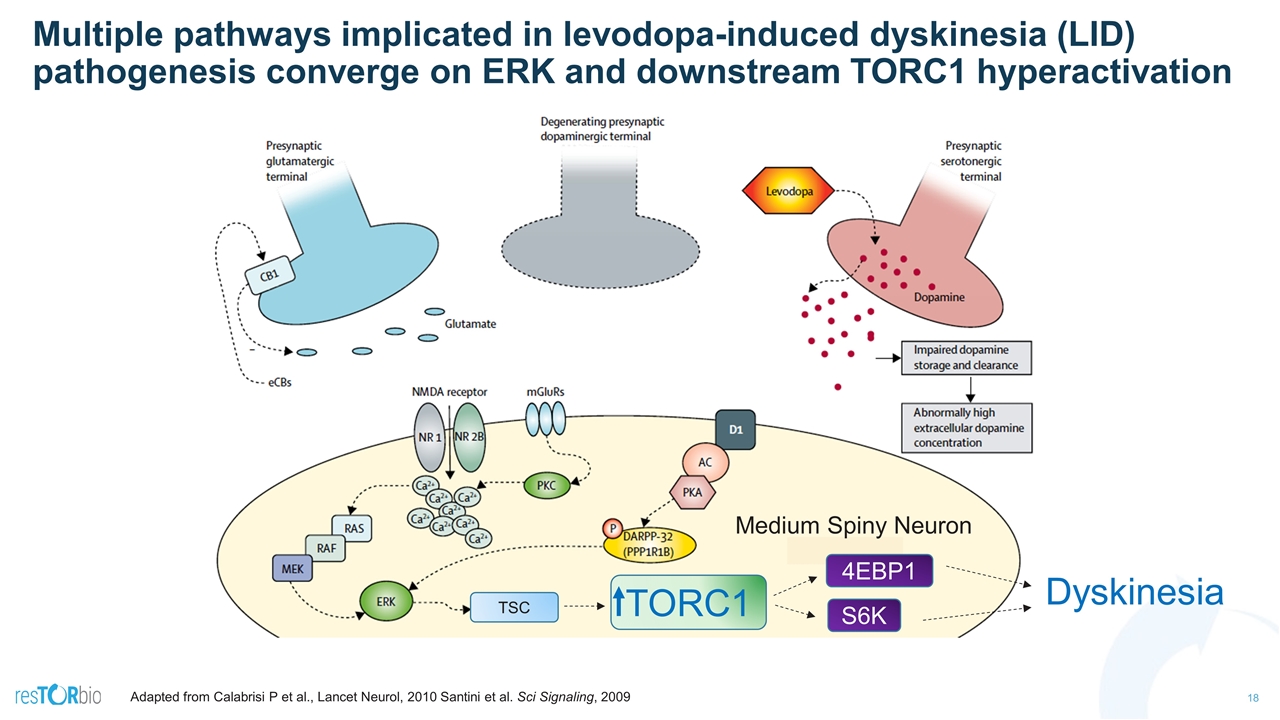
Multiple pathways implicated in levodopa-induced dyskinesia (LID) pathogenesis converge on ERK and downstream TORC1 hyperactivation TSC TORC1 Dyskinesia Adapted from Calabrisi P et al., Lancet Neurol, 2010 Santini et al. Sci Signaling, 2009 Medium Spiny Neuron 4EBP1 S6K
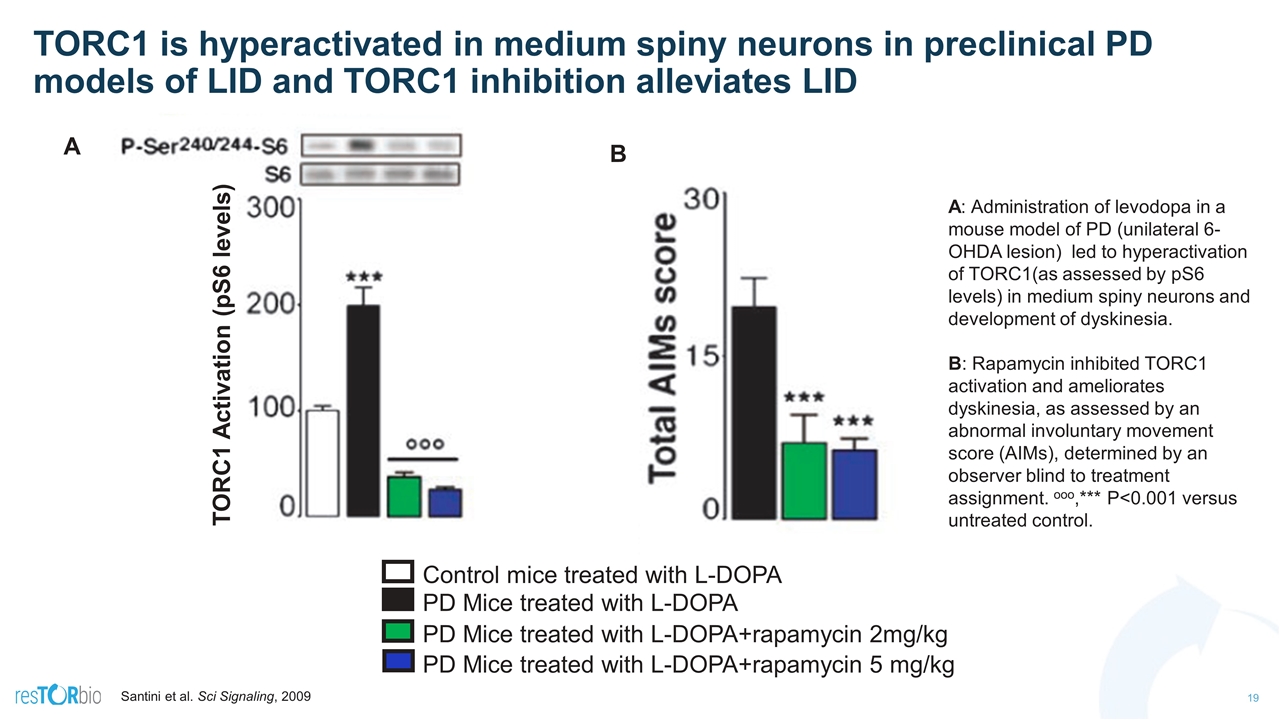
TORC1 is hyperactivated in medium spiny neurons in preclinical PD models of LID and TORC1 inhibition alleviates LID A: Administration of levodopa in a mouse model of PD (unilateral 6-OHDA lesion) led to hyperactivation of TORC1(as assessed by pS6 levels) in medium spiny neurons and development of dyskinesia. B: Rapamycin inhibited TORC1 activation and ameliorates dyskinesia, as assessed by an abnormal involuntary movement score (AIMs), determined by an observer blind to treatment assignment. ooo,*** P<0.001 versus untreated control. Santini et al. Sci Signaling, 2009 A B TORC1 Activation (pS6 levels) Control mice treated with L-DOPA PD Mice treated with L-DOPA PD Mice treated with L-DOPA+rapamycin 2mg/kg PD Mice treated with L-DOPA+rapamycin 5 mg/kg
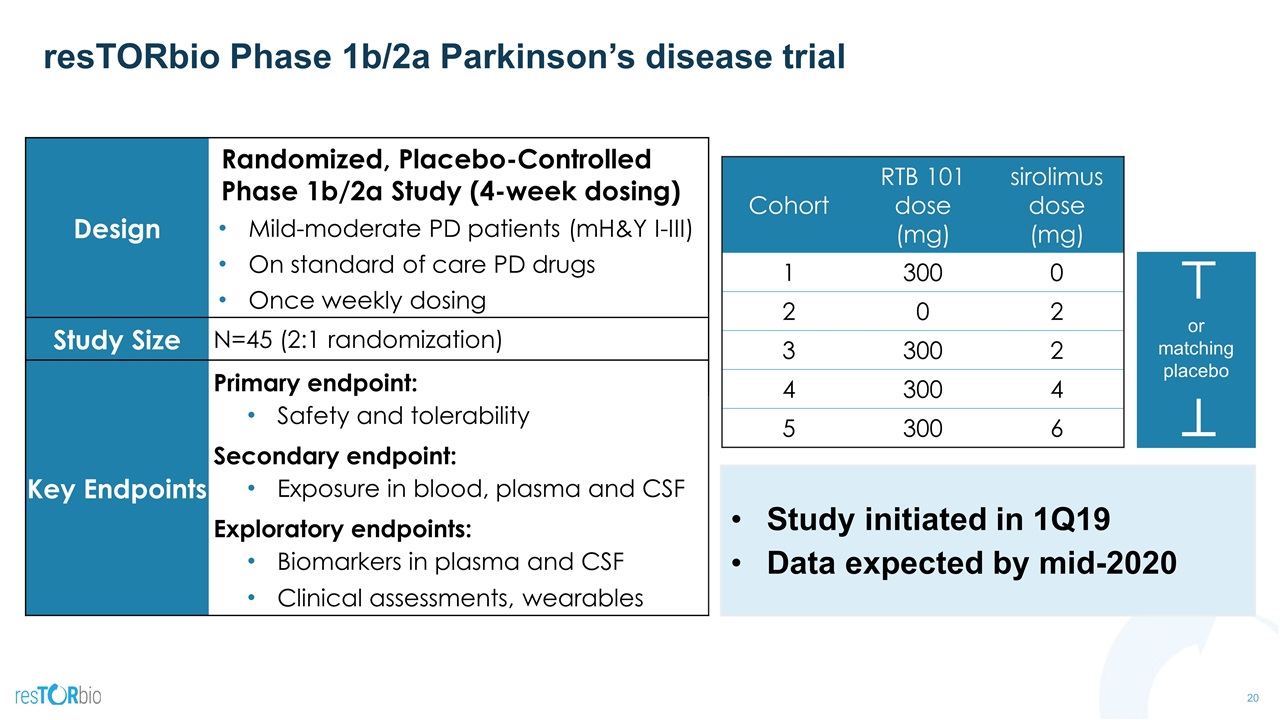
resTORbio Phase 1b/2a Parkinson’s disease trial Study initiated in 1Q19 Data expected by mid-2020 Cohort RTB 101 dose (mg) sirolimus dose (mg) 1 300 0 2 0 2 3 300 2 4 300 4 5 300 6 Design Randomized, Placebo-Controlled Phase 1b/2a Study (4-week dosing) Mild-moderate PD patients (mH&Y I-III) On standard of care PD drugs Once weekly dosing Study Size N=45 (2:1 randomization) Key Endpoints Primary endpoint: Safety and tolerability Secondary endpoint: Exposure in blood, plasma and CSF Exploratory endpoints: Biomarkers in plasma and CSF Clinical assessments, wearables or matching placebo
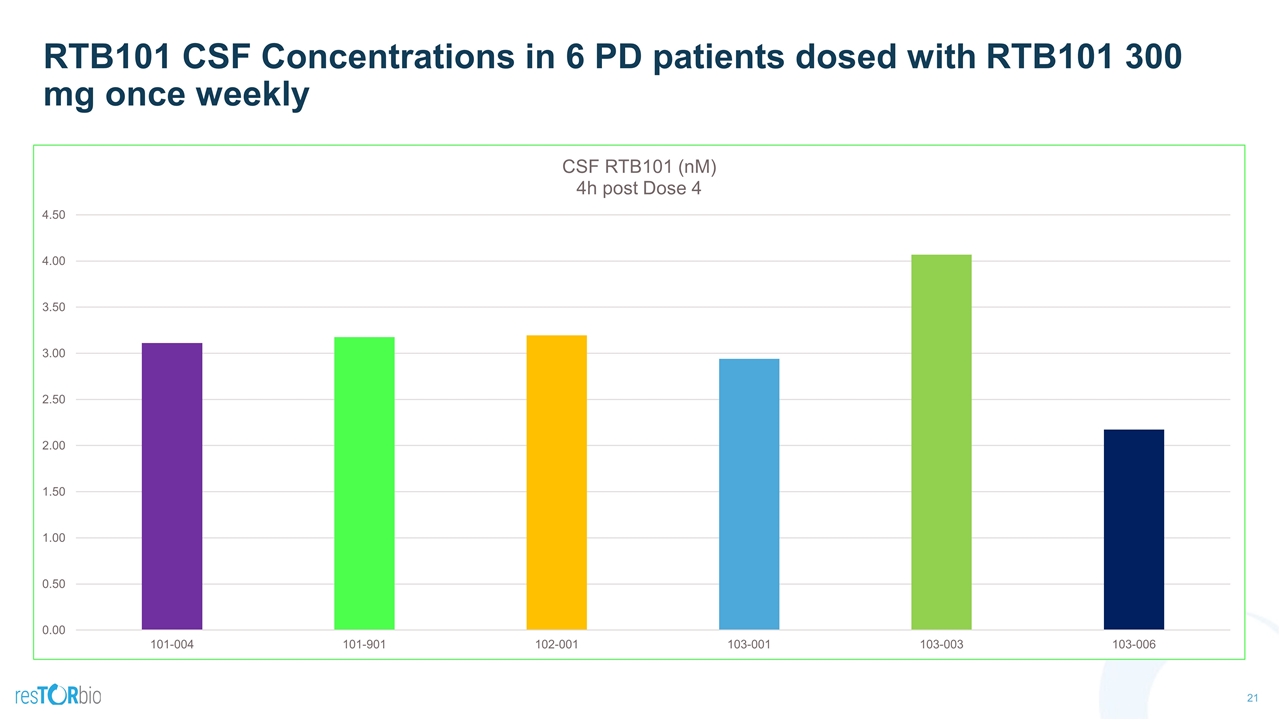
RTB101 CSF Concentrations in 6 PD patients dosed with RTB101 300 mg once weekly
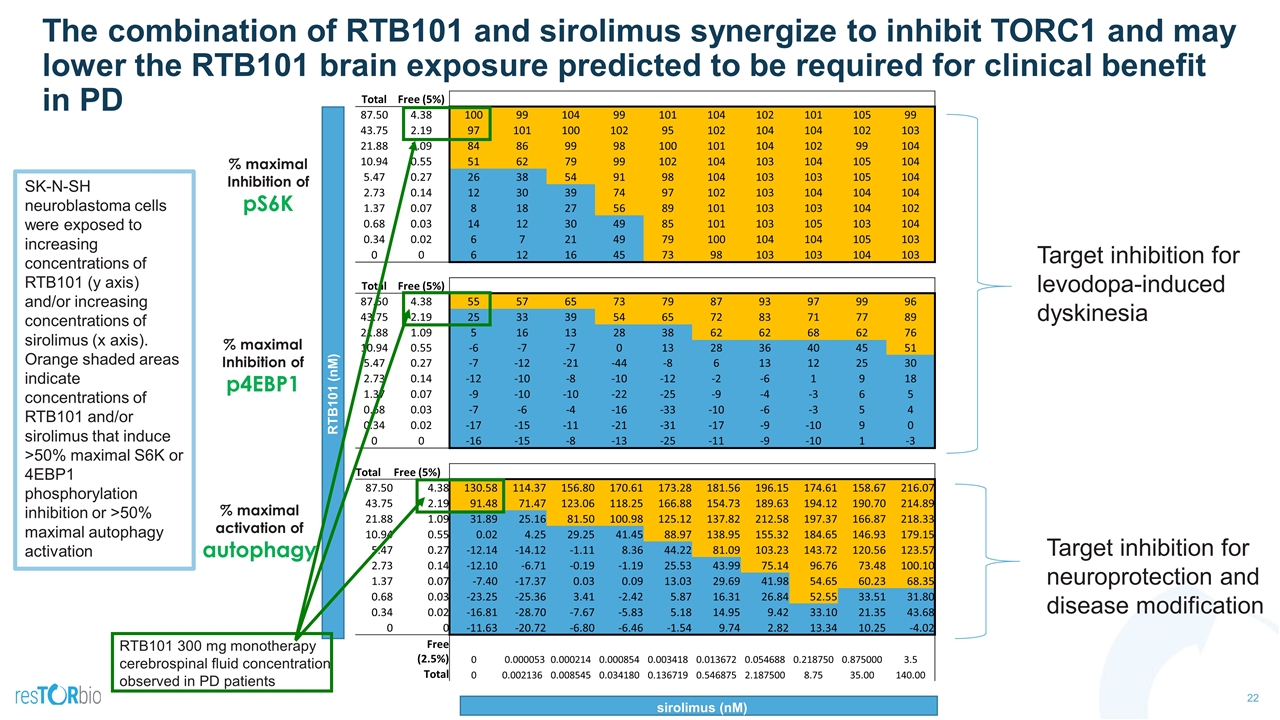
The combination of RTB101 and sirolimus synergize to inhibit TORC1 and may lower the RTB101 brain exposure predicted to be required for clinical benefit in PD Total Free (5%) 87.50 4.38 100 99 104 99 101 104 102 101 105 99 43.75 2.19 97 101 100 102 95 102 104 104 102 103 21.88 1.09 84 86 99 98 100 101 104 102 99 104 10.94 0.55 51 62 79 99 102 104 103 104 105 104 5.47 0.27 26 38 54 91 98 104 103 103 105 104 2.73 0.14 12 30 39 74 97 102 103 104 104 104 1.37 0.07 8 18 27 56 89 101 103 103 104 102 0.68 0.03 14 12 30 49 85 101 103 105 103 104 0.34 0.02 6 7 21 49 79 100 104 104 105 103 0 0 6 12 16 45 73 98 103 103 104 103 Total Free (5%) 87.50 4.38 55 57 65 73 79 87 93 97 99 96 43.75 2.19 25 33 39 54 65 72 83 71 77 89 21.88 1.09 5 16 13 28 38 62 62 68 62 76 10.94 0.55 -6 -7 -7 0 13 28 36 40 45 51 5.47 0.27 -7 -12 -21 -44 -8 6 13 12 25 30 2.73 0.14 -12 -10 -8 -10 -12 -2 -6 1 9 18 1.37 0.07 -9 -10 -10 -22 -25 -9 -4 -3 6 5 0.68 0.03 -7 -6 -4 -16 -33 -10 -6 -3 5 4 0.34 0.02 -17 -15 -11 -21 -31 -17 -9 -10 9 0 0 0 -16 -15 -8 -13 -25 -11 -9 -10 1 -3 Total Free (5%) 87.50 4.38 130.58 114.37 156.80 170.61 173.28 181.56 196.15 174.61 158.67 216.07 43.75 2.19 91.48 71.47 123.06 118.25 166.88 154.73 189.63 194.12 190.70 214.89 21.88 1.09 31.89 25.16 81.50 100.98 125.12 137.82 212.58 197.37 166.87 218.33 10.94 0.55 0.02 4.25 29.25 41.45 88.97 138.95 155.32 184.65 146.93 179.15 5.47 0.27 -12.14 -14.12 -1.11 8.36 44.22 81.09 103.23 143.72 120.56 123.57 2.73 0.14 -12.10 -6.71 -0.19 -1.19 25.53 43.99 75.14 96.76 73.48 100.10 1.37 0.07 -7.40 -17.37 0.03 0.09 13.03 29.69 41.98 54.65 60.23 68.35 0.68 0.03 -23.25 -25.36 3.41 -2.42 5.87 16.31 26.84 52.55 33.51 31.80 0.34 0.02 -16.81 -28.70 -7.67 -5.83 5.18 14.95 9.42 33.10 21.35 43.68 0 0 -11.63 -20.72 -6.80 -6.46 -1.54 9.74 2.82 13.34 10.25 -4.02 Free (2.5%) 0 0.000053 0.000214 0.000854 0.003418 0.013672 0.054688 0.218750 0.875000 3.5 Total 0 0.002136 0.008545 0.034180 0.136719 0.546875 2.187500 8.75 35.00 140.00 RTB101 (nM) sirolimus (nM) Target inhibition for levodopa-induced dyskinesia Target inhibition for neuroprotection and disease modification SK-N-SH neuroblastoma cells were exposed to increasing concentrations of RTB101 (y axis) and/or increasing concentrations of sirolimus (x axis). Orange shaded areas indicate concentrations of RTB101 and/or sirolimus that induce >50% maximal S6K or 4EBP1 phosphorylation inhibition or >50% maximal autophagy activation % maximal Inhibition of pS6K % maximal Inhibition of p4EBP1 % maximal activation of autophagy RTB101 300 mg monotherapy cerebrospinal fluid concentration observed in PD patients
Huntington’s disease Neurodegenerative Diseases
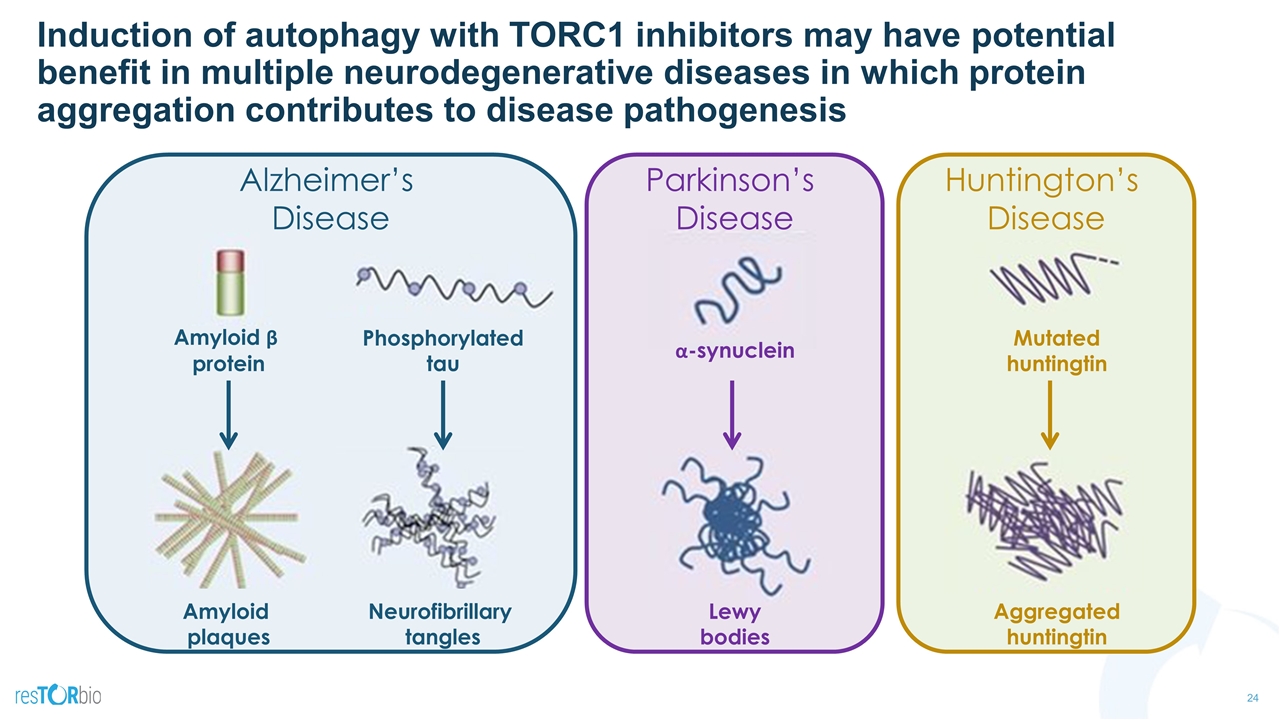
Induction of autophagy with TORC1 inhibitors may have potential benefit in multiple neurodegenerative diseases in which protein aggregation contributes to disease pathogenesis Alzheimer’s Disease Huntington’s Disease Amyloid plaques Neurofibrillary tangles Lewy bodies Aggregated huntingtin Amyloid β protein Phosphorylated tau α-synuclein Mutated huntingtin Parkinson’s Disease
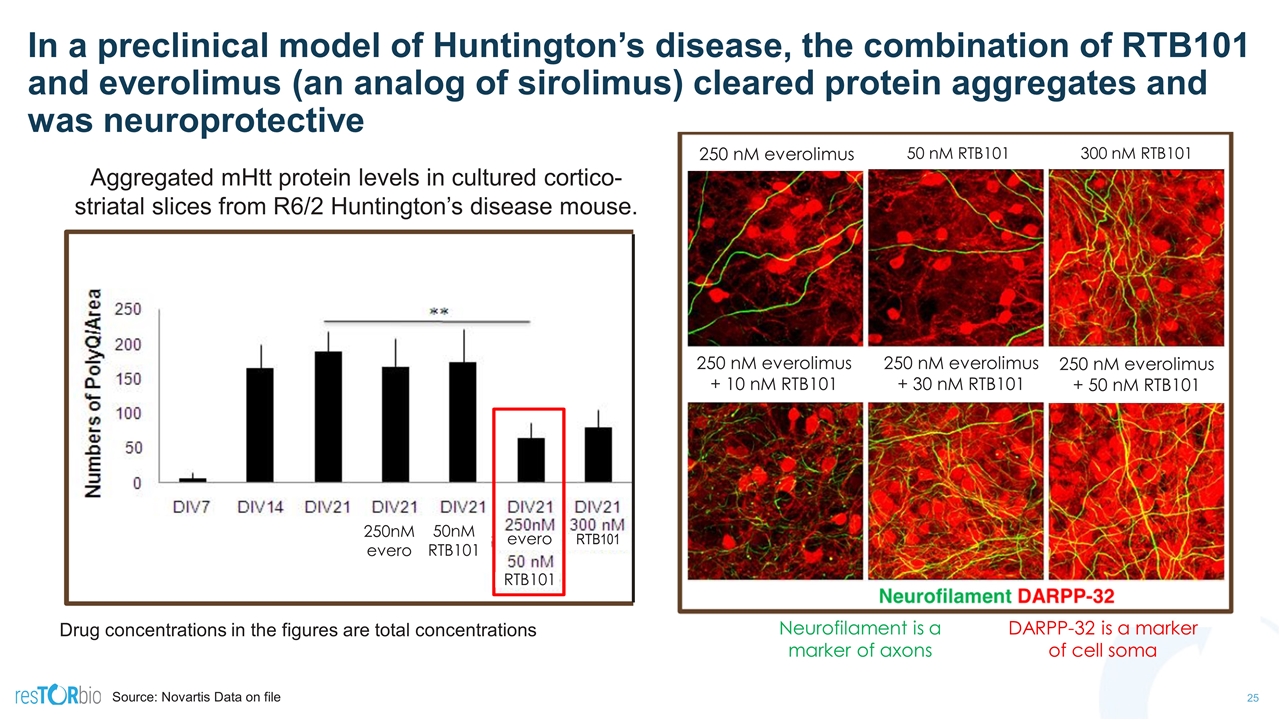
In a preclinical model of Huntington’s disease, the combination of RTB101 and everolimus (an analog of sirolimus) cleared protein aggregates and was neuroprotective Source: Novartis Data on file 250nM evero RTB evero RTB101 RTB101 Aggregated mHtt protein levels in cultured cortico-striatal slices from R6/2 Huntington’s disease mouse. 250 nM everolimus 300 nM RTB101 50 nM RTB101 250 nM everolimus + 10 nM RTB101 250 nM everolimus + 30 nM RTB101 250 nM everolimus + 50 nM RTB101 Neurofilament is a marker of axons DARPP-32 is a marker of cell soma 50nM RTB101 Drug concentrations in the figures are total concentrations
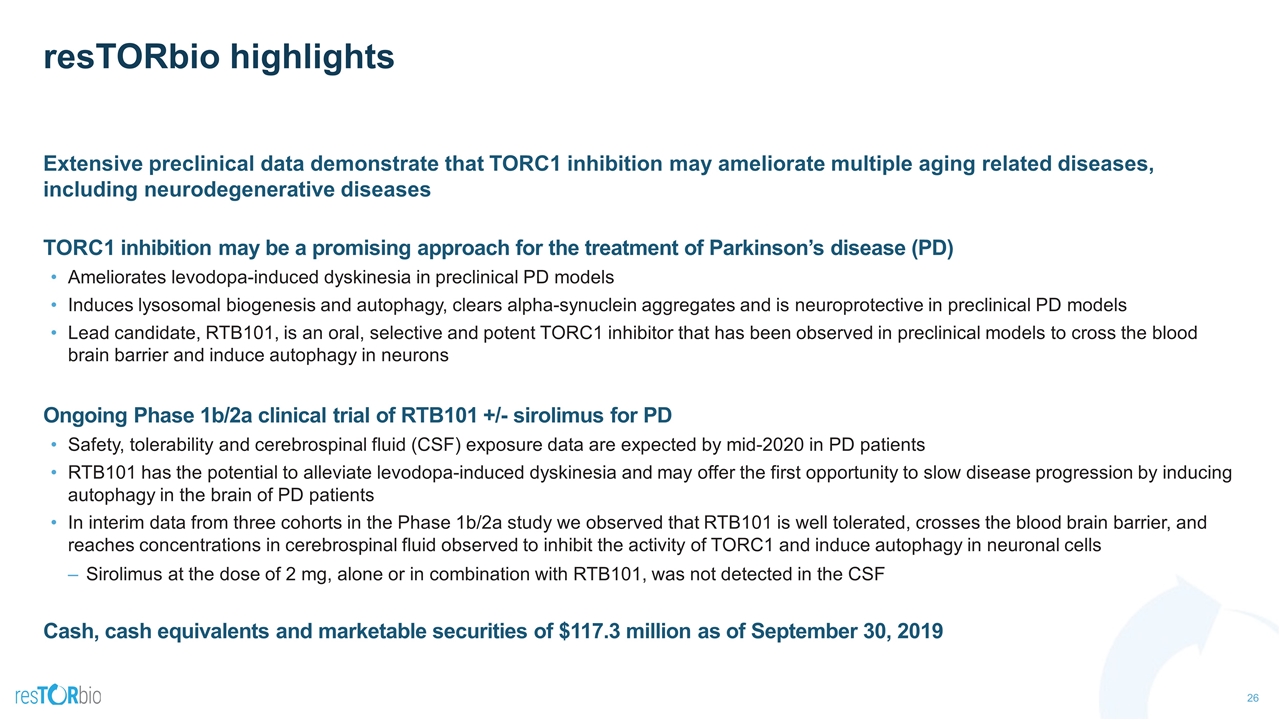
resTORbio highlights Extensive preclinical data demonstrate that TORC1 inhibition may ameliorate multiple aging related diseases, including neurodegenerative diseases TORC1 inhibition may be a promising approach for the treatment of Parkinson’s disease (PD) Ameliorates levodopa-induced dyskinesia in preclinical PD models Induces lysosomal biogenesis and autophagy, clears alpha-synuclein aggregates and is neuroprotective in preclinical PD models Lead candidate, RTB101, is an oral, selective and potent TORC1 inhibitor that has been observed in preclinical models to cross the blood brain barrier and induce autophagy in neurons Ongoing Phase 1b/2a clinical trial of RTB101 +/- sirolimus for PD Safety, tolerability and cerebrospinal fluid (CSF) exposure data are expected by mid-2020 in PD patients RTB101 has the potential to alleviate levodopa-induced dyskinesia and may offer the first opportunity to slow disease progression by inducing autophagy in the brain of PD patients In interim data from three cohorts in the Phase 1b/2a study we observed that RTB101 is well tolerated, crosses the blood brain barrier, and reaches concentrations in cerebrospinal fluid observed to inhibit the activity of TORC1 and induce autophagy in neuronal cells Sirolimus at the dose of 2 mg, alone or in combination with RTB101, was not detected in the CSF Cash, cash equivalents and marketable securities of $117.3 million as of September 30, 2019

Targeting the biology of aging to treat aging-related diseases Corporate Presentation February 2020