As filed with the Securities and Exchange Commission on November 9, 2020
Registration No. 333-
UNITED STATES
SECURITIES AND EXCHANGE COMMISSION
WASHINGTON, D.C. 20549
FORM
S-1
REGISTRATION STATEMENT
UNDER
THE SECURITIES ACT OF 1933
FISKER INC.
(Exact Name of Registrant as Specified in Its Charter)
Delaware | 001-38625 | 82-3100340 | ||
(State or Other Jurisdiction of | (Primary Standard Industrial | (I.R.S. Employer | ||
Incorporation or Organization) | Classification Code Number) | Identification Number) |
1888 Rosecrans Avenue
Manhattan Beach, CA 90266
(833) 434-7537
(Address, Including Zip Code, and Telephone Number, Including Area Code, of Registrant’s Principal Executive Offices)
Henrik Fisker
Chief Executive Officer
1888 Rosecrans Avenue
Manhattan Beach, CA 90266
(833) 434-7537
(Name, Address Including Zip Code, and Telephone Number Including Area Code, of Agent for Service)
COPIES TO:
Mitchell Zuklie, Esq.
Albert Vanderlaan, Esq.
Orrick, Herrington & Sutcliffe LLP
1000 Marsh Road
Menlo Park, CA 94025
(650) 614-7400
Approximate date of commencement of proposed sale to the public:
From time to time after the effective date of this registration statement.
If any of the securities being registered on this form are to be offered on a delayed or continuous basis pursuant to Rule 415 under the Securities Act of 1933, check the following box. ☒
If this form is filed to register additional securities for an offering pursuant to Rule 462(b) under the Securities Act, please check the following box and list the Securities Act registration statement number of the earlier effective registration statement for the same offering. ☐
If this form is a post-effective amendment filed pursuant to Rule 462(c) under the Securities Act, check the following box and list the Securities Act registration statement number of the earlier effective registration statement for the same offering. ☐
If this form is a post-effective amendment filed pursuant to Rule 462(d) under the Securities Act, check the following box and list the Securities Act registration statement number of the earlier effective registration statement for the same offering. ☐
Indicate by check mark whether the registrant is a large accelerated filer, an accelerated filer, a
non-accelerated
filer, or a smaller reporting company. See the definitions of “large accelerated filer,” “accelerated filer,” “smaller reporting company,” and “emerging growth company” inRule 12b-2
of the Exchange Act.| Large accelerated filer | ☐ | Accelerated filer | ☒ | |||
| Non-accelerated filer | ☐ | Smaller reporting company | ☒ | |||
| Emerging Growth Company | ☒ |
If an emerging growth company, indicate by check mark if the registrant has elected not to use the extended transition period for complying with any new or revised financial accounting standards provided pursuant to Section 7(a)(2)(B) of the Securities Act. ☐
CALCULATION OF REGISTRATION FEE
Title of Each Class of Securities to be Registered | Amount to be Registered (1) | Proposed Maximum Offering Price Per Share | Proposed Maximum Aggregate Offering Price | Amount of Registration Fee | ||||
Class A Common Stock, par value $0.00001 per share | 152,185,596 (2) | $10.64 (3) | $1,619,254,741.44 | $176,660.69 | ||||
Warrants to purchase Class A Common Stock | 9,360,000 (4) | — | — | — (5) | ||||
Total | $176,660.69 | |||||||
(1) | Pursuant to Rule 416 under the Securities Act of 1933, as amended (the “Securities Act”), the registrant is also registering an indeterminate number of additional shares of Class A Common Stock that may become issuable as a result of any stock dividend, stock split, recapitalization or other similar transaction. |
(2) | Consists of (i) 114,311,142 shares of Class A Common Stock registered for sale by the selling securityholders named in this registration statement (including the shares referred to in the following clause (ii)), (ii) 9,360,000 shares of Class A Common Stock issuable upon exercise of 9,360,000 Private Warrants (as defined below), (iii) 18,400,000 shares of Class A Common Stock issuable upon the exercise of 18,400,000 Public Warrants (as defined below) and (iv) 19,474,454 shares of Class A Common Stock issuable upon the exercise of 19,474,454 Magna Warrants (as defined below). |
(3) | Pursuant to Rule 457(c) under the Securities Act, and solely for the purpose of calculating the registration fee, the proposed maximum offering price per share is $10.64, which is the average of the high and low prices of the Class A Common Stock on November 6, 2020 on the New York Stock Exchange (“NYSE”). |
(4) | Represents the resale of 9,360,000 Private Warrants. |
(5) | In accordance with Rule 457(i), the entire registration fee for the Private Warrants is allocated to the shares of Class A Common Stock underlying the Private Warrants, and no separate fee is payable for the Private Warrants. |
The registrant hereby amends this registration statement on such date or dates as may be necessary to delay its effective date until the registrant shall file a further amendment which specifically states that this registration statement shall thereafter become effective in accordance with Section 8(a) of the Securities Act of 1933 or until this registration statement shall become effective on such date as the Securities and Exchange Commission, acting pursuant to said Section 8(a), may determine.
The information in this preliminary prospectus is not complete and may be changed. Neither we nor the selling securityholders may sell these securities until the registration statement filed with the Securities and Exchange Commission becomes effective. This preliminary prospectus is not an offer to sell these securities and it is not soliciting an offer to buy these securities in any state where the offer or sale is not permitted.
SUBJECT TO COMPLETION, DATED NOVEMBER 9, 2020
PRELIMINARY PROSPECTUS

Fisker Inc.
Up to 133,785,596 Shares of Class A Common Stock
Up to 47,234,454 Shares of Class A Common Stock Issuable Upon Exercise of Warrants
Up to 9,360,000 Warrants
This prospectus relates to the issuance by us of up to an aggregate of up to 47,234,454 shares of our Class A Common Stock, $0.00001 par value per share (“Class A Common Stock”), which consists of (i) up to 9,360,000 shares of Class A Common Stock that are issuable upon the exercise of 9,360,000 warrants (the “Private Warrants”) originally issued in a private placement in connection with the IPO (as defined below) of Spartan Energy Acquisition Corp. (“Spartan”), at an exercise price of $11.50 per share of Class A Common Stock, (ii) up to 18,400,000 shares of Class A Common Stock that are issuable upon the exercise of 18,400,000 warrants (the “Public Warrants”) originally issued in the IPO of Spartan, at an exercise price of $11.50 per share of Class A Common Stock and (iii) up to 19,474,454 shares of Class A Common Stock that are issuable upon the exercise of 19,474,454 warrants originally issued in a private placement to Magna International Inc. in connection with entering into a cooperation agreement, at an exercise price of $0.01 per share of Class A Common Stock (the “Magna Warrants,” and, collectively with the Private Warrants and the Public Warrants, the “Warrants”).
This prospectus also relates to the resale from time to time by the Selling Securityholders named in this prospectus (the “Selling Securityholders”) of up to 133,785,596 shares of Class A Common Stock, including (i) 28,356,906 shares of Class A Common Stock issued pursuant to the Business Combination Agreement (as defined below) as Merger Consideration (as defined below), (ii) 13,358,824 Conversion Shares (as defined below), (iii) 9,360,000 shares of Class A Common Stock that may be issued upon exercise of the Private Warrants, (iv) 13,235,412 Executive Shares (as defined below), (v) up to 19,474,454 shares of Class A Common Stock that may be issued upon exercise of the Magna Warrants, and (vi) 50,000,000 PIPE Shares (as defined below).
This prospectus provides you with a general description of such securities and the general manner in which we and the Selling Securityholders may offer or sell the securities. More specific terms of any securities that we and the Selling Securityholders may offer or sell may be provided in a prospectus supplement that describes, among other things, the specific amounts and prices of the securities being offered and the terms of the offering. The prospectus supplement may also add, update or change information contained in this prospectus.
We will not receive any proceeds from the sale of shares of Class A Common Stock or Private Warrants by the Selling Securityholders or of shares of Class A Common Stock by us pursuant to this prospectus, except with respect to amounts received by us upon exercise of the Warrants. However, we will pay the expenses, other than any underwriting discounts and commissions, associated with the sale of securities pursuant to this prospectus.
We are registering the securities for resale pursuant to the Selling Securityholders’ registration rights under certain agreements between us and the Selling Securityholders. Our registration of the securities covered by this prospectus does not mean that either we or the Selling Securityholders will issue, offer or sell, as applicable, any of the securities. The Selling Securityholders may offer and sell the securities covered by this prospectus in a number of different ways and at varying prices. We provide more information about how the Selling Securityholders may sell the shares or Warrants in the section entitled “.”
Plan of Distribution
You should read this prospectus and any prospectus supplement or amendment carefully before you invest in our securities.
Our Class A Common Stock and Public Warrants are listed on the NYSE under the symbols “FSR” and “FSR WS,” respectively. On November 6, 2020, the closing price of our Class A Common Stock was $10.86 and the closing price for our Public Warrants was $2.81.
See the section entitled “
” beginning on page 8 of this prospectus to read about factors you should consider before buying our securities.
Neither the Securities and Exchange Commission nor any state securities commission has approved or disapproved of these securities or determined if this prospectus is truthful or complete. Any representation to the contrary is a criminal offense.
The date of this prospectus is , 2020.
TABLE OF CONTENTS
| ii | ||
| iii | ||
| v | ||
| 1 | ||
| 8 | ||
| 34 | ||
| 34 | ||
| 34 | ||
| 36 | ||
| 37 | ||
| 38 | ||
| 48 | ||
| 49 | ||
| 50 | ||
| 63 | ||
| 87 | ||
| 95 | ||
| 110 | ||
| 114 | ||
| 116 | ||
| 130 | ||
| 133 | ||
| 138 | ||
| 145 | ||
| 147 | ||
| 147 | ||
| 147 | ||
| 147 | ||
| F-1 | ||
i
ABOUT THIS PROSPECTUS
This prospectus is part of a registration statement on
Form S-1
that we filed with the Securities and Exchange Commission (the “SEC”) using the “shelf” registration process. Under this shelf registration process, the Selling Securityholders may, from time to time, sell the securities offered by them described in this prospectus. We will not receive any proceeds from the sale by such Selling Securityholders of the securities offered by them described in this prospectus. This prospectus also relates to the issuance by us of the shares of Class A Common Stock issuable upon the exercise of any Warrants. We will receive proceeds from any exercise of the Warrants for cash.Neither we nor the Selling Securityholders have authorized anyone to provide you with any information or to make any representations other than those contained in this prospectus or any applicable prospectus supplement or any free writing prospectuses prepared by or on behalf of us or to which we have referred you. Neither we nor the Selling Securityholders take responsibility for, and can provide no assurance as to the reliability of, any other information that others may give you. Neither we nor the Selling Securityholders will make an offer to sell these securities in any jurisdiction where the offer or sale is not permitted.
We may also provide a prospectus supplement or post-effective amendment to the registration statement to add information to, or update or change information contained in, this prospectus. You should read both this prospectus and any applicable prospectus supplement or post-effective amendment to the registration statement together with the additional information to which we refer you in the sections of this prospectus entitled “.”
Where You Can Find More Information
On October 29, 2020 (the “Closing Date”), Spartan, our predecessor company, consummated the previously announced merger pursuant to that certain Business Combination Agreement, dated July 10, 2020 (the “Business Combination Agreement”), by and among Spartan, Spartan Merger Sub Inc., a wholly-owned subsidiary of Spartan incorporated in the State of Delaware (“Merger Sub”), and Fisker Group Inc. (f/k/a Fisker Inc.), a Delaware corporation (“Legacy Fisker”). Pursuant to the terms of the Business Combination Agreement, a Business Combination between the Company and Legacy Fisker was effected through the merger of Merger Sub with and into Legacy Fisker, with Legacy Fisker surviving as the surviving company and as a wholly-owned subsidiary of Spartan (the “Merger” and, collectively with the other transactions described in the Business Combination Agreement, the “Business Combination”). On the Closing Date, and in connection with the closing of the Business Combination (the “Closing”), Spartan Energy Acquisition Corp. changed its name to Fisker Inc.
Unless the context indicates otherwise, references in this prospectus to the “Company,” “Fisker,” “we,” “us,” “our” and similar terms refer to Fisker Inc. (f/k/a Spartan Energy Acquisition Corp.) and its consolidated subsidiaries (including Legacy Fisker). References to “Spartan” refer to our predecessor company prior to the consummation of the Business Combination.
ii
FREQUENTLY USED TERMS
Unless the context indicates otherwise, the following terms have the following meanings when used in this prospectus:
“” means that certain Amended and Restated Registration Rights, dated as of October 29, 2020, among the Company, the Former Sponsor (as defined below), Magna (as defined below), Henrik Fisker, Dr. Geeta Gupta and certain former stockholders of Legacy Fisker.
A&R
Registration Rights Agreement
“” or “” means our board of directors.
Board
Board of Directors
“” means the transactions contemplated by the Merger Agreement, pursuant to which Merger Sub was merged with and into Legacy Fisker (the “”), with Legacy Fisker surviving the Merger as the Company’s wholly owned subsidiary, which transactions were consummated on October 29, 2020.
Business Combination
Merger
“” means that certain Agreement and Plan of Merger, dated as of July 10, 2020, by and among the Company, Merger Sub and Legacy Fisker.
Business Combination Agreement
“” means the shares of our Class A common stock, par value $0.00001 per share.
Class
A Common Stock
“” means the shares of our Class B common stock, par value $0.00001 per share.
Class
B Common Stock
“” means the closing of the Business Combination on October 29, 2020.
Closing
“” means the Class A Common Stock and the Class B Common Stock.
Common Stock
“” means the 13,358,824 shares of Class A Common Stock issued upon conversion of Founder Shares at the closing of the Business Combination, which include 12,946,324 shares that are held by the Former Sponsor, 150,000 shares that are held by Robert C. Reeves, 150,000 shares that are held by John M. Stice, 75,000 shares that are held by John J. MacWilliams, and 37,500 shares that are held by Jan C. Wilson.
Conversion Shares
“” means the General Corporation Law of the State of Delaware.
DGCL
“” means the Securities Exchange Act of 1934, as amended.
Exchange Act
“” means 13,235,412 shares of Class A Common Stock underlying 13,235,412 shares of Class B Common Stock held in the aggregate by Henrik Fisker (6,617,706 shares individually) and Dr. Geeta Gupta (6,617,706 shares individually).
Executive Shares
“” means Spartan Energy Acquisition Sponsor LLC, a Delaware limited liability company.
Former
Sponsor
“” means the 13,800,000 shares of Class B Common Stock purchased by the Former Sponsor in connection with the Company’s IPO, of which 441,176 were forfeited and cancelled in connection with consummation of the Business Combination.
Founder Shares
“” means the Former Sponsor and Robert C. Reeves, John M. Stice, John J. MacWilliams and Jan C. Wilson, the Company’s independent directors prior to the Business Combination.
Initial Stockholders
“” means the Company’s initial public offering, consummated on August 14, 2018, through the sale of 55,200,000 public units (including 7,200,000 units sold pursuant to the underwriters’ full exercise of their over-allotment option) at $10.00 per unit.
IPO
“” means the 28,356,906 shares of Class A Common Stock issued to the former securityholders of Legacy Fisker pursuant to the transactions contemplated by the Merger Agreement.
Merger Consideration
iii
“” means the private placement of 50,000,000 shares of Class A Common Stock with a limited number of “qualified institutional buyers” (as defined in Rule 144A of the Securities Act) and “accredited investors” (as defined by Rule 501 of Regulation D) pursuant to Section 4(a)(2) of the Securities Act, for gross proceeds to the Company in an aggregate amount of approximately $500,000,000.
PIPE Financing
“” means certain “qualified institutional buyers” (as defined in Rule 144A of the Securities Act) and “accredited investors” (as defined by Rule 501 of Regulation D).
PIPE Investors
“” means the 50,000,0000 shares of Class A Common Stock purchased by the PIPE Investors pursuant to the Subscription Agreements.
PIPE Shares
“” means the warrants that were issued to the Company’s Former Sponsor on the IPO closing date, each of which is exercisable for one share of Class A Common Stock at an exercise price of $11.50 per share, in accordance with its terms.
Private Warrants
“” means shares of Class A Common Stock included in the units issued in the IPO.
public shares
“” means holders of public shares, including the Initial Stockholders to the extent the Initial Stockholders hold public shares, provided, that the Initial Stockholders will be considered a “public stockholder” only with respect to any public shares held by them.
public stockholders
“” or “” means one share of Class A Common Stock
public units
units
and one-third of
one Public Warrant of the Company sold in the IPO.“” means the warrants included in the public units issued in the IPO, each of which is exercisable for one share of Class A Common Stock at an exercise price of $11.50 per share, in accordance with its terms.
Public Warrants
“” means the Securities Act of 1933, as amended.
Securities Act
“” means the persons listed in the table in the “Selling Securityholders” section of this prospectus, and the pledgees, donees, transferees, assignees, successors and others who later come to hold any of the Selling Securityholders’ interest in Class A Common Stock or Private Warrants in accordance with the terms of the A&R Registration Rights Agreement or the Subscription Agreements, as applicable, and in each case other than through a public sale.
Selling Securityholders
“” means, collectively, those certain subscription agreements entered into on July 10, 2020, as amended or modified, between the Company and certain investors, including certain employees and affiliates of the Former Sponsor, pursuant to which such investors agreed to purchase an aggregate of 50,000,000 shares of Class A Common Stock in the PIPE Shares.
Subscription Agreements
iv
FORWARD-LOOKING STATEMENTS
This prospectus and any accompanying prospectus supplement, or some of the information incorporated herein by reference, contains statements that are forward-looking and as such are not historical facts. These forward-looking statements include, without limitation, statements regarding future financial performance, business strategies, expansion plans, future results of operations, estimated revenues, losses, projected costs, prospects, plans and objectives of management. These forward-looking statements are based on our management’s current expectations, estimates, projections and beliefs, as well as a number of assumptions concerning future events, and are not guarantees of performance. Such statements can be identified by the fact that they do not relate strictly to historical or current facts. When used in this prospectus and any accompanying prospectus supplement, words such as “may,” “should,” “could,” “would,” “expect,” “plan,” “anticipate,” “intend,” “believe,” “estimate,” “continue,” “project” or the negative of such terms or other similar expressions may identify forward-looking statements, but the absence of these words does not mean that a statement is not forward-looking. Forward-looking statements in this prospectus and any accompanying prospectus supplement and in any document incorporated by reference in this prospectus may include, for example, statements about:
| • | our ability to maintain the listing of our Class A Common Stock on the NYSE following the Business Combination; |
| • | our ability to recognize the anticipated benefits of the Business Combination, which may be affected by, among other things, competition and our to grow and manage growth profitably following the Business Combination; |
| • | our ability to enter into binding contracts with OEMs or tier-one suppliers in order to execute on our business plan; |
| • | our ability to execute our business model, including market acceptance of our planned products and services; |
| • | that we have identified a material weakness in our internal control over financial reporting which, if not corrected, could affect the reliability of our consolidated financial statements; |
| • | our expansion plans and opportunities; |
| • | our expectations regarding future expenditures; |
| • | our ability to raise capital in the future; |
| • | our ability to attract and retain qualified employees and key personnel; |
| • | the possibility that we may be adversely affected by other economic, business or competitive factors; |
| • | changes in applicable laws or regulations; |
| • | the outcome of any known and unknown litigation and regulatory proceedings; |
| • | the possibility that COVID-19 may adversely affect the results of our operations, financial position and cash flows; and |
| • | other factors detailed under the section entitled “ Risk Factors |
The forward-looking statements contained in this prospectus and in any document incorporated by reference are based on current expectations and beliefs concerning future developments and their potential effects on the Company. There can be no assurance that future developments affecting us will be those that we have anticipated. These forward-looking statements involve a number of risks, uncertainties, some of which are beyond our control, or other assumptions that may cause actual results or performance to be materially different from those expressed or implied by these forward-looking statements. These risks and uncertainties include, but are not limited to, those factors described in the section entitled “” and in our periodic filings with the SEC. Our SEC filings are available publicly on the SEC website at www.sec.gov. Should one or more of these risks or uncertainties materialize, or should any of our assumptions prove incorrect, actual results may vary in material respects from those projected in these forward-looking statements. Accordingly, forward-looking statements in this prospectus and in any document incorporated herein by reference should not be relied upon as representing our views as of any subsequent date, and we undertake no obligation to update or revise any forward-looking statements, whether as a result of new information, future events or otherwise, except as may be required under applicable securities laws.
Risk Factors
v
SUMMARY
This summary highlights selected information appearing elsewhere in this prospectus. Because it is a summary, it may not contain all of the information that may be important to you. To understand this offering fully, you should read this entire prospectus carefully, including the information set forth under the heading “” and our financial statements.
Risk Factors
The Company
We are building a technology-enabled, asset-light automotive business model that we believe will be among the first of its kind and aligned with the future state of the automotive industry. This involves a focus on vehicle development, customer experience, sales and service to change the personal mobility experience through technological innovation, ease of use and flexibility. We combine the legendary design and engineering expertise of Henrik Fisker – the visionary behind the iconic BMW Z8 sports car and the famed Aston Martin DB9 and V8 Vantage, and – to develop high quality electric vehicles with strong emotional appeal by engaging the consumer’s senses through the overall experience of Fisker vehicles. Central to our business model is the Fisker Flexible Platform Agnostic Design
(“FF-PAD”),
a proprietary process that allows the development and design of a vehicle to be adapted to any given electric vehicle (“EV”) platform in the specific segment size. The process focuses on selecting industry leading vehicle specifications and adapting the design to crucial hard points on a third-party supplied EV platform and outsourced manufacturing to reduce development cost and time to market. We believe we are well-positioned through our global premium EV brand, our renowned design capabilities and sustainability focus.Background
Spartan was originally known as Spartan Energy Acquisition Corp. On October 29, 2020, we consummated the Business Combination with Legacy Fisker pursuant to the Business Combination Agreement dated as of July 10, 2020 among us, Legacy Fisker and Merger Sub. In connection with the Closing of the Business Combination, we changed our name to Fisker Inc. Legacy Fisker was deemed to be the accounting acquirer in the Merger based on an analysis of the criteria outlined in Accounting Standards Codification 805. While we were the legal acquirer in the Merger, because Legacy Fisker was deemed the accounting acquirer, the historical financial statements of Legacy Fisker became the historical financial statements of the combined company, upon the consummation of the Merger.
Immediately prior to the effective time of the Merger (the “Effective Time”), each share of Legacy Fisker preferred stock (“Legacy Fisker Preferred Stock”) that was issued and outstanding was automatically converted into a share of Legacy Fisker Common Stock, par value $0.00001 per share (“Legacy Fisker Common Stock”), such that each converted share of Legacy Fisker Preferred Stock was no longer outstanding and ceased to exist, and each holder of Legacy Fisker Preferred Stock thereafter ceased to have any rights with respect to such securities.
Also immediately prior to the Effective Time, the outstanding principal and unpaid accrued interest due on Legacy Fisker’s outstanding convertible notes (“Legacy Fisker Convertible Notes”) immediately prior to the Effective Time were automatically converted into shares of Legacy Fisker Common Stock in accordance with the terms of such Legacy Fisker Convertible Notes, and such converted Legacy Fisker Convertible Notes were no longer outstanding and ceased to exist, and any liens securing obligations under the Legacy Fisker Convertible Notes were released.
At the Effective Time, (i) each share of Legacy Fisker Common Stock was converted into and exchanged for 2.7162 shares (the “Exchange Ratio”) of our Class A Common Stock and (ii) each share of Legacy Fisker Founders Stock was converted into and exchanged for 2.7162 shares of our Class B Common Stock.
At the Effective Time, all shares of Legacy Fisker Common Stock and Legacy Fisker Preferred Stock held in the treasury of Legacy Fisker were canceled without any conversion thereof and no payment or distribution was made with respect thereto.
1
At the Effective Time, each share of common stock, par value $0.00001 per share, of Merger Sub issued and outstanding immediately prior to the Effective Time was converted into and exchanged for one validly issued, fully paid and nonassessable share of Legacy Fisker Common Stock.
Each Legacy Fisker option that was outstanding immediately prior to the Effective Time, whether vested or unvested, was converted into an option to purchase a number of shares of Common Stock (such option, an “Exchanged Option”) equal to the product (rounded up or down to the nearest whole number, with a fraction of 0.5 rounded up) of (i) the number of shares of Legacy Fisker Common Stock subject to such Legacy Fisker option immediately prior to the Effective Time and (ii) the Exchange Ratio, at an exercise price per share (rounded up or down to the nearest whole cent, with a fraction of $0.005 rounded up) equal to (A) the exercise price per share of such Legacy Fisker option immediately prior to the Effective Time, divided by (B) the Exchange Ratio. Except as specifically provided in the Business Combination Agreement, following the Effective Time, each Exchanged Option will continue to be governed by the same terms and conditions (including vesting and exercisability terms) as were applicable to the corresponding former Legacy Fisker option immediately prior to the Effective Time.
No certificates or scrip or shares representing fractional shares of Common Stock were issued upon the exchange of Legacy Fisker Common Stock. Any fractional shares were rounded up or down to the nearest whole share of Common Stock, with a fraction of 0.5 rounded up. No cash settlements were made with respect to fractional shares eliminated by such rounding.
Pursuant to our prior amended and restated certificate of incorporation, each share of Spartan’s Class B Common Stock, par value $0.0001 per share (the “Class B Common Stock”), converted into one share of Spartan’s Class A Common Stock, par value $0.0001 per share (the “Class A Common Stock”), at the Closing. After the Closing and following the effectiveness of our second amended and restated certificate of incorporation (“Certificate of Incorporation”), (i) each share of Class A Common Stock was automatically reclassified, redesignated and changed into one validly issued, fully paid and
non-assessable
share of newly authorized Class A Common Stock, without any further action by us or any stockholder and (ii) each share of Class B Common Stock was automatically reclassified, redesignated and changed into one validly issued, fully paid andnon-assessable
share of newly authorized Class B Common Stock, without any further action by us or any stockholder.On October 29, 2020, a number of purchasers (each, a “Subscriber”) purchased from the Company an aggregate of 50,000,000 shares of Class A Common Stock (the “PIPE Shares”), for a purchase price of $10.00 per share and an aggregate purchase price of $500 million, pursuant to separate subscription agreements (each, a “Subscription Agreement”) entered into effective as of July 10, 2020. Pursuant to the Subscription Agreements, the Company gave certain registration rights to the Subscribers with respect to the PIPE Shares. The sale of PIPE Shares was consummated concurrently with the Closing.
On October 14, 2020, Fisker and Spartan entered into a Cooperation Agreement with Magna International Inc. (“Magna”) setting forth certain terms for the development of a full electric vehicle (the “Cooperation Agreement”). Pursuant to the terms of the Cooperation Agreement, we issued the Magna Warrants to Magna on October 29, 2020.
Our Class A Common Stock and Public Warrants are currently listed on the NYSE under the symbols “FSR” and “FSR WS,” respectively.
The rights of holders of our Class A Common Stock, Class B Common Stock and Warrants are governed by our second amended and restated certificate of incorporation (the “Certificate of Incorporation”), our amended and restated bylaws (the “Bylaws”) and the Delaware General Corporation Law (the “DGCL”), and, in the case of the Warrants, the Warrant Agreement, dated May 15, 2018, between Spartan and the Continental Stock Transfer & Trust Company (the “Warrant Agreement”). See the sections entitled “” and “.”
Description of Capital Stock
Selling Securityholders
2
Corporate Information
We were originally incorporated in the State of Delaware in October 13, 2017 as a special purpose acquisition company, formed for the purpose of effecting a merger, capital stock exchange, asset acquisition, stock purchase, recapitalization, reorganization or similar Business Combination with one or more businesses. Spartan completed its IPO in August 2018. In October 2020, our wholly-owned subsidiary merged with and into Legacy Fisker, with Legacy Fisker surviving the merger as a wholly-owned subsidiary of Spartan. In connection with the Merger, we changed our name to Fisker Inc. Our principal executive offices are located at 1888 Rosecrans Avenue, Manhattan Beach, CA 90266. Our telephone number is
(833) 434-7537.
Our website address is www.fiskerinc.com. Information contained on our website or connected thereto does not constitute part of, and is not incorporated by reference into, this prospectus or the registration statement of which it forms a part.3
The Offering
| Issuer | Fisker Inc. (f/k/a Spartan Energy Acquisition Corp.) | |
Issuance of Class A Common Stock | ||
| Shares of Class A Common Stock Offered by us | 47,234,454 shares of Class A Common Stock issuable upon exercise of the Warrants, consisting of (i) 9,360,000 shares of Class A Common Stock that are issuable upon the exercise of 9,360,000 Private Warrants, (ii) 18,400,000 shares of Class A Common Stock that are issuable upon the exercise of 18,400,000 Public Warrants and (iii) 19,474,454 shares of Class A Common Stock that are issuable upon the exercise of 19,474,454 Magna Warrants | |
| Shares of Common Stock Outstanding Prior to Exercise of All Warrants | 277,258,103 shares (as of October 30, 2020) | |
| Shares of Common Stock Outstanding Assuming Exercise of All Warrants | 324,492,557 shares (based on the total shares outstanding as of October 30, 2020) | |
| Exercise Price of Private Warrants and Public Warrants | $11.50 per share, subject to adjustments as described herein | |
| Exercise Price of Magna Warrants | $0.01 per share, subject to adjustments as described herein | |
| Use of proceeds | We will receive up to an aggregate of approximately $261.5 million from the exercise of the Warrants, assuming the exercise in full of all of the Warrants for cash. We expect to use the net proceeds from the exercise of the Warrants for general corporate purposes. See “ Use of Proceeds | |
Resale of Class A Common Stock and Warrants | ||
| Shares of Class A Common Stock Offered by the Selling Securityholders | 133,785,596 shares of Class A Common Stock (including up to 9,360,000 shares of Class A Common Stock that may be issued upon exercise of the Private Warrants and 19,474,454 shares of Class A Common Stock that may be issued upon exercise of 19,474,454 Magna Warrants) | |
| Warrants Offered by the Selling Securityholders | 9,360,000 Private Warrants | |
| Redemption | The Warrants are redeemable in certain circumstances. See “ Description of Capital Stock—Warrants | |
4
| Use of Proceeds | We will not receive any proceeds from the sale of shares of Class A Common Stock or Private Warrants (assuming the cashless exercise provision is used) by the Selling Securityholders | |
Lock-Up Restrictions | Certain of our stockholders are subject to certain restrictions on transfer until the termination of applicable lock-up periods. See “Plan of Distribution – Lock-up Agreements | |
| Market for Class A Common Stock and Warrants | Our Class A Common Stock and Warrants are currently traded on the NYSE under the symbols, “FSR” and “FSR WS,” respectively | |
| Risk Factors | See “ Risk Factors | |
5
Summary Risk Factors
An investment in shares of our common stock involves a high degree of risk. If any of the factors enumerated below or in the section entitled “Risk Factors” occurs, our business, financial condition, liquidity, results of operations and prospects could be materially and adversely affected.
| • | Our ability to develop, manufacture and obtain required regulatory approvals for a car of sufficient quality and appeal to customers on schedule and on a large scale is unproven. |
| • | We are substantially reliant on our relationships with OEMs, suppliers and service providers for the parts and components in our vehicles, as well as for the manufacture of our initial vehicles. If any of these OEMs, suppliers or service partners choose to not do business with us, then we would have significant difficulty in procuring and producing our vehicles and our business prospects would be significantly harmed. |
| • | Our relationship with one or more OEMs and automotive suppliers is integral to our platform procurement and manufacturing plan, but we do not have any binding commitments from an OEM or automotive supplier to participate in a platform sharing arrangement or manufacturing activities and we may not be able to obtain such commitments. We therefore are seeking alternative arrangements with a number of OEMs, component suppliers, and manufacturers, which we may not be successful in obtaining. |
| • | If we are unable to contract with OEMs or suppliers on platform sharing and manufacturing of our vehicles, we would need to develop our own platform and manufacturing facilities, which may not be feasible and, if feasible at all, would significantly increase our capital expenditure and would significantly delay production of our vehicles. |
| • | Manufacturing in collaboration with partners is subject to risks. |
| • | There are complex software and technology systems that need to be developed in coordination with vendors and suppliers in order to reach production for our electric vehicles, and there can be no assurance such systems will be successfully developed. |
| • | We may experience significant delays in the design, manufacture, regulatory approval, launch and financing of our vehicles, which could harm our business and prospects. |
| • | We are dependent on our suppliers, a significant number of which are single or limited source suppliers, and the inability of these suppliers to deliver necessary components of our vehicles in a timely manner and at prices and volumes acceptable to us could have a material adverse effect on our business, prospects and operating results. |
| • | If any of our suppliers become economically distressed or go bankrupt, we may be required to provide substantial financial support or take other measures to ensure supplies of components or materials, which could increase our costs, affect our liquidity or cause production disruptions. |
| • | Our vehicles will make use of lithium-ion battery cells, which have been observed to catch fire or vent smoke and flame. |
| • | We have a limited operating history and face significant challenges as a new entrant into the automotive industry. Fisker vehicles are in development and we do not expect our first vehicle to be produced until the fourth quarter of 2022, at the earliest, if at all. |
| • | We are an early stage company with a history of losses, and expect to incur significant expenses and continuing losses for the foreseeable future. |
| • | Our EMaaS business model has yet to be tested and any failure to commercialize our strategic plans would have an adverse effect on our operating results and business, harm our reputation and could result in substantial liabilities that exceed our resources. |
| • | Our operating and financial results forecast relies in large part upon assumptions and analyses developed by us. If these assumptions or analyses prove to be incorrect, our actual operating results may be materially different from our forecasted results. |
| • | We may not be able to accurately estimate the supply and demand for our vehicles, which could result in a variety of inefficiencies in our business and hinder our ability to generate revenue. If we fail to accurately predict our manufacturing requirements, we could incur additional costs or experience delays. |
| • | We could experience cost increases or disruptions in supply of raw materials or other components used in our vehicles. If we are unable to establish an arrangement for the sustainable supply of batteries for our vehicles, our business would be materially and adversely harmed. |
| • | If our vehicles fail to perform as expected, our ability to develop, market, and sell or lease our electric vehicles could be harmed. |
6
| • | Our services may not be generally accepted by our users. If we are unable to provide quality customer service, our business and reputation may be materially and adversely affected. |
| • | The automotive market is highly competitive, and we may not be successful in competing in this industry. |
| • | The automotive industry and its technology are rapidly evolving and may be subject to unforeseen changes. Developments in alternative technologies, including but not limited to hydrogen, may adversely affect the demand for our electric vehicles. |
| • | Reservations for our vehicles are cancellable. |
| • | We may be subject to risks associated with autonomous driving technology. |
| • | We have identified material weaknesses in our internal control over financial reporting which, if not corrected, could affect the reliability of our consolidated financial statements and have other adverse consequences. |
| • | The unavailability, reduction or elimination of government and economic incentives could have a material adverse effect on our business, prospects, financial condition and operating results. |
| • | We may not be able to obtain or agree on acceptable terms and conditions for all or a significant portion of the government grants, loans and other incentives for which we may apply. As a result, our business and prospects may be adversely affected. |
| • | Insufficient warranty reserves to cover future warranty claims could materially adversely affect our business, prospects, financial condition and operating results. |
| • | Our distribution model is different from the predominant current distribution model for automobile manufacturers, which makes evaluating our business, operating results and future prospects difficult. |
| • | We may face regulatory limitations on our ability to sell vehicles directly which could materially and adversely affect our ability to sell our electric vehicles. |
| • | We will initially depend on revenue generated from a single model and in the foreseeable future will be significantly dependent on a limited number of models. |
| • | We are highly dependent on the services of Henrik Fisker, our Chief Executive Officer. |
| • | Our business plans require a significant amount of capital. In addition, our future capital needs may require us to sell additional equity or debt securities that may dilute our stockholders or introduce covenants that may restrict our operations or our ability to pay dividends. |
| • | Failure of information security and privacy concerns could subject us to penalties, damage our reputation and brand, and harm our business and results of operations. |
| • | Interruption or failure of our information technology and communications systems could impact our ability to effectively provide our services. |
| • | We face risks related to natural disasters, health epidemics, including the recent COVID 19 pandemic, and other outbreaks, which could significantly disrupt our operations. |
| • | We may not be able to prevent others from unauthorized use of our intellectual property, which could harm our business and competitive position. |
| • | Our patent applications may not issue as patents, which may have a material adverse effect on our ability to prevent others from commercially exploiting products similar to ours. |
| • | We may be subject to damages resulting from claims that we or our employees have wrongfully used or disclosed alleged trade secrets of our employees’ former employers. |
| • | Our vehicles are subject to motor vehicle standards and the failure to satisfy such mandated safety standards would have a material adverse effect on our business and operating results. |
| • | We are subject to substantial regulation and unfavorable changes to, or our failure to comply with, these regulations could substantially harm our business and operating results. |
| • | The dual class structure of our Common Stock has the effect of concentrating voting control with Henrik Fisker and Dr. Geeta Gupta, our co-founders, members of our Board of Directors and Chief Executive Officer and Chief Financial Officer, respectively. This will limit or preclude your ability to influence corporate matters, including the outcome of important transactions, including a change in control. |
| • | Henrik Fisker and Dr. Geeta Gupta are married to each other. The separation or divorce of the couple in the future could adversely affect our business. |
7
RISK FACTORS
Investing in our securities involves risks. Before you make a decision to buy our securities, in addition to the risks and uncertainties discussed above under “Forward-Looking Statements,” you should carefully consider the specific risks set forth herein. If any of these risks actually occur, it may materially harm our business, financial condition, liquidity and results of operations. As a result, the market price of our securities could decline, and you could lose all or part of your investment. Additionally, the risks and uncertainties described in this prospectus or any prospectus supplement are not the only risks and uncertainties that we face. Additional risks and uncertainties not presently known to us or that we currently believe to be immaterial may become material and adversely affect our business.
Our ability to develop, manufacture and obtain required regulatory approvals for a car of sufficient quality and appeal to customers on schedule and on a large scale is unproven.
Our business depends in large part on our ability to develop, manufacture, market and sell or lease our electric vehicles. Initially, we plan to manufacture vehicles in collaboration with one or more automotive component and engineering services suppliers, including large original equipment manufacturers (“OEMs”) or
tier-one
automotive suppliers. We recently entered into a Cooperation Agreement with Magna, an industry-leading OEM, but we have not yet executed definitive supply or manufacturing agreements with any OEM ortier-one
automotive supplier for the supply of parts for production of the Fisker Ocean, or any of our other future vehicle offerings. If we are unable to negotiate and finalize such supply and manufacturing agreements with an OEM or atier-one
automotive supplier, we will not be able to produce any vehicles and will not be able to generate any revenue, or the vehicles may become more expensive to deliver with a higher bill of materials, which would have a material adverse effect on our business, prospects, operating results and financial condition.The continued development and the ability to start manufacturing our vehicles, including the Fisker Ocean, are and will be subject to risks, including with respect to:
| • | our ability to secure necessary funding; |
| • | our ability to negotiate and execute definitive agreements with our various suppliers for hardware, software, or services necessary to engineer or manufacture our vehicles; |
| • | our ability to accurately manufacture vehicles within specified design tolerances; |
| • | obtaining required regulatory approvals and certifications; |
| • | compliance with environmental, safety, and similar regulations; |
| • | securing necessary components, services, or licenses on acceptable terms and in a timely manner; |
| • | delays by us in delivering final component designs to our suppliers; |
| • | our ability to attract, recruit, hire, retain and train skilled employees; |
| • | quality controls that prove to be ineffective or inefficient; |
| • | delays or disruptions in our supply chain including raw material supplies; |
| • | our ability to maintain arrangements on reasonable terms with its manufacturing partners and suppliers, engineering service providers, delivery partners, and after sales service providers; and |
8
| • | other delays, backlog in manufacturing and research and development of new models, and cost overruns. |
Our ability to develop, manufacture and obtain required regulatory approvals for a vehicle of sufficient quality and appeal to customers on schedule and on a large scale is unproven, and the business plan is still evolving. We may be required to introduce new vehicle models and enhanced versions of existing models. To date, we have limited experience, as a company, designing, testing, manufacturing, marketing and selling or leasing our electric vehicles and therefore cannot assure you that we will be able to meet customer expectations. Any failure to develop such manufacturing processes and capabilities within our projected costs and timelines would have a material adverse effect on our business, prospects, operating results and financial condition.
We are substantially reliant on our relationships with OEMs, suppliers and service providers for the parts and components in our vehicles, as well as for the manufacture of our initial vehicles. If any of these OEMs, suppliers or service partners choose to not do business with us, then we would have significant difficulty in procuring and producing our vehicles and our business prospects would be significantly harmed.
We have entered into a number of
non-binding
agreements with third parties in order to implement our asset-light business model and will need to enter into definitive agreements with one or more OEMs and suppliers in order to produce the Fisker Ocean and other vehicles in a manner contemplated by our business plan. Furthermore, we have explored and intend to secure alternative suppliers and providers for many of the most material aspects of our business model.Collaboration with third parties for the manufacturing of vehicles is subject to risks with respect to operations that are outside our control. We could experience delays to the extent our current or future partners do not continue doing business with us, meet agreed upon timelines, experience capacity constraints or otherwise are unable to deliver components or manufacture vehicles as expected. There is risk of potential disputes with partners, and we could be affected by adverse publicity related to our partners whether or not such publicity is related to their collaboration with us. Our ability to successfully build a premium brand could also be adversely affected by perceptions about the quality of our partners’ vehicles or other vehicles manufactured by the same partner. In addition, although we intend to be involved in material decisions in the supply chain and manufacturing process, given that we also rely on our partners to meet our quality standards, there can be no assurance that we will be able to maintain high quality standards.
We may in the future enter into strategic alliances, including joint ventures or minority equity investments, with various third parties to further our business purpose. These alliances could subject us to a number of risks, including risks associated with sharing proprietary information,
non-performance
by the third party, and increased expenses in establishing new strategic alliances, any of which may materially and adversely affect our business.To sell or lease Fisker vehicles as currently contemplated, we will need to enter into certain additional agreements and arrangements that are not currently in place. These include entering into definitive agreements with third party service partners for fleet management, vehicle storage, dockside collection, mobile fleet servicing, financing and end of lease collections. If we are unable to enter into such definitive agreements, or if we are only able to do so on terms that are unfavorable to us, we may have a material adverse effect on our business, prospects, operating results and financial condition.
Our relationship with one or more OEMs and automotive suppliers is integral to our platform procurement and manufacturing plan, but we do not have any binding commitments from an OEM or automotive supplier to participate in a platform sharing arrangement or manufacturing activities and we may not be able to obtain such commitments. We therefore are seeking alternative arrangements with a number of OEMs, component suppliers, and manufacturers, which we may not be successful in obtaining.
To manufacture our vehicles as currently contemplated, we will need to enter into definitive agreements and arrangements that are not currently in place. Although we (i) have recently entered into a Collaborative Agreement with Magna setting forth certain terms for the development of a full electric vehicle and (ii) have a
9
historic working relationship with Volkswagen Aktiengesellschaft ("VW") to source the Modularer
E-Antriebs-Baukasten
(“MEB”) platform, including the Fisker Ocean prototype built on the MEB platform by Italdesign Giugiaro S.p.A. ("IDG"), we do not have a definitive agreement with Magna, VW or any other OEM to use a platform and commercially manufacture our vehicles, and as a result, we may not be able to implement our business strategy in the timeframe anticipated, or at all. If we are unable to enter into definitive agreements or are only able to do so on terms that are unfavorable to us, we may not be able to timely identify adequate strategic relationship opportunities, or form strategic relationships, and consequently, we may not be able to fully carry out our business plans. Accordingly, investors should not place undue reliance on our statements about our production plans or their feasibility in the timeframe anticipated, or at all.If we are unable to contract with OEMs or suppliers on platform sharing and manufacturing of our vehicles, we would need to develop our own platform and manufacturing facilities, which may not be feasible and, if feasible at all, would significantly increase our capital expenditure and would significantly delay production of our vehicles.
We may be unable to enter into definitive agreements with OEMs and suppliers for platform sharing and manufacturing on terms and conditions acceptable to us and therefore we may need to contract with other third parties or establish our own production capacity. There can be no assurance that in such event that we would be able to partner with other third parties or establish our own production capacity to meet our needs on acceptable terms, or at all. The expense and time required to complete any transition and to assure that vehicles manufactured at facilities of new third-party partners comply with our quality standards and regulatory requirements would likely be greater than currently anticipated. If we need to develop our own manufacturing and production capabilities, which may not be feasible, it would significantly increase our capital expenditures and would significantly delay production of our vehicles. This may require that we attempt to raise or borrow money, which may not be successful. Also, it may require that we change the anticipated pricing of our vehicles, which would adversely affect our margins and cash flows. Any of the foregoing could adversely affect our business, results of operations, financial condition and prospects.
Manufacturing in collaboration with partners is subject to risks.
Our business model relies on outsourced manufacturing of our vehicles. The cost of tooling a manufacturing facility with a collaboration partner is high, but such cost will not be known until we enter into a vehicle manufacturing agreement. Collaboration with third parties to manufacture vehicles is subject to risks that are outside of our control. We could experience delays if our partners do not meet agreed upon timelines or experience capacity constraints. There is risk of potential disputes with partners, which could stop or slow vehicle production, and we could be affected by adverse publicity related to our partners, whether or not such publicity is related to such third parties’ collaboration with us. Our ability to successfully build a premium brand could also be adversely affected by perceptions about the quality of our partners’ products. In addition, we cannot guarantee that our suppliers will not deviate from agreed-upon quality standards.
We may be unable to enter into agreements with manufacturers on terms and conditions acceptable to us and therefore we may need to contract with other third parties or significantly add to our own production capacity. We may not be able to engage other third parties or establish or expand our own production capacity to meet our needs on acceptable terms, or at all. The expense and time required to adequately complete any transition may be greater than anticipated. Any of the foregoing could adversely affect our business, results of operations, financial condition and prospects.
There are complex software and technology systems that need to be developed in coordination with vendors and suppliers in order to reach production for our electric vehicles, and there can be no assurance such systems will be successfully developed.
Fisker vehicles will use a substantial amount of third-party and
in-house
software codes and complex hardware to operate. The development of such advanced technologies are inherently complex, and we will need to coordinate with our vendors and suppliers in order to reach production for our electric vehicles. Defects and errors may be revealed over time and our control over the performance of third-party services and systems may be limited. Thus, our potential inability to develop the necessary software and technology systems may harm our competitive position.10
We are relying on third-party suppliers to develop a number of emerging technologies for use in our products, including lithium ion battery technology. These technologies are not today, and may not ever be, commercially viable. There can be no assurances that our suppliers will be able to meet the technological requirements, production timing, and volume requirements to support our business plan. In addition, the technology may not comply with the cost, performance useful life and warranty characteristics we anticipate in our business plan. As a result, our business plan could be significantly impacted and we may incur significant liabilities under warranty claims which could adversely affect our business, prospects, and results of operations.
We may experience significant delays in the design, manufacture, regulatory approval, launch and financing of our vehicles, which could harm our business and prospects.
Any delay in the financing, design, manufacture, regulatory approval or launch of our vehicles, including entering into agreements for platform sharing, supply of component parts, and manufacturing, could materially damage our brand, business, prospects, financial condition and operating results and could cause liquidity constraints. Vehicle manufacturers often experience delays in the design, manufacture and commercial release of new products. To the extent we delay the launch of our vehicles, our growth prospects could be adversely affected as we may fail to establish or grow our market share. We rely on third-party suppliers for the provision and development of the key components and materials used in our vehicles. To the extent our suppliers experience any delays in providing us with or developing necessary components, we could experience delays in delivering on our timelines.
Prior to mass production of the Fisker Ocean, we will need the vehicle to be fully designed and engineered and be approved for sale according to differing requirements, including but not limited to regulatory requirements, in the different geographies we intend to launch our vehicles. If we encounter delays in any of these matters, we may consequently delay our deliveries of the Fisker Ocean.
We are dependent on our suppliers, a significant number of which are single or limited source suppliers, and the inability of these suppliers to deliver necessary components of our vehicles in a timely manner and at prices and volumes acceptable to us could have a material adverse effect on its business, prospects and operating results.
While we plan to obtain components from multiple sources whenever possible, many of the components used in our vehicles will be purchased by us from a single source. While we believe that we may be able to establish alternate supply relationships and can obtain or engineer replacement components for our single source components, we may be unable to do so in the short term (or at all) at prices or quality levels that are acceptable to us. In addition, we could experience delays if our suppliers do not meet agreed upon timelines or experience capacity constraints.
Any disruption in the supply of components, whether or not from a single source supplier, could temporarily disrupt production of our vehicles until an alternative supplier is able to supply the required material. Changes in business conditions, unforeseen circumstances, governmental changes, and other factors beyond our control or which we do not presently anticipate, could also affect our suppliers’ ability to deliver components to us on a timely basis. Any of the foregoing could materially and adversely affect our results of operations, financial condition and prospects.
If any of our suppliers become economically distressed or go bankrupt, we may be required to provide substantial financial support or take other measures to ensure supplies of components or materials, which could increase our costs, affect our liquidity or cause production disruptions.
We expect to purchase various types of equipment, raw materials and manufactured component parts from our suppliers. If these suppliers experience substantial financial difficulties, cease operations, or otherwise face business disruptions, we may be required to provide substantial financial support to ensure supply continuity or would have to take other measures to ensure components and materials remain available. Any disruption could affect our ability to deliver vehicles and could increase our costs and negatively affect our liquidity and financial performance.
11
Our vehicles will make use of
lithium-ion
battery cells, which have been observed to catch fire or vent smoke and flame.The battery packs within our vehicles will make use of
lithium-ion
cells. On rare occasions,lithium-ion
cells can rapidly release the energy they contain by venting smoke and flames in a manner that can ignite nearby materials as well as otherlithium-ion
cells. While the battery pack is designed to contain any single cell’s release of energy without spreading to neighboring cells, once our vehicles are commercially available, a field or testing failure of battery packs in our vehicles could occur, which could result in bodily injury or death and could subject us to lawsuits, product recalls, or redesign efforts, all of which would be time consuming and expensive and could harm our brand image. Also, negative public perceptions regarding the suitability oflithium-ion
cells for automotive applications, the social and environmental impacts of cobalt mining, or any future incident involvinglithium-ion
cells, such as a vehicle or other fire, could seriously harm our business and reputation.We have a limited operating history and face significant challenges as a new entrant into the automotive industry. Fisker vehicles are in development and we do not expect our first vehicle to be produced until the fourth quarter of 2022, at the earliest, if at all.
Fisker was incorporated in September 2016 and we have a short operating history in the automobile industry, which is continuously evolving. We have no experience as an organization in high volume manufacturing of the planned electric vehicles. We cannot assure you that we or our partners will be able to develop efficient, automated, cost-efficient manufacturing capability and processes, and reliable sources of component supplies that will enable us to meet the quality, price, engineering, design and production standards, as well as the production volumes, required to successfully mass market the Fisker Ocean and future vehicles. You should consider our business and prospects in light of the risks and significant challenges we face as a new entrant into our industry, including, among other things, with respect to our ability to:
| • | design and produce safe, reliable and quality vehicles on an ongoing basis; |
| • | obtain the necessary regulatory approvals in a timely manner; |
| • | build a well-recognized and respected brand; |
| • | establish and expand our customer base; |
| • | successfully market not just our vehicles but also our other services, including our Flexee lease and other services we intend to provide; |
| • | properly price our services, including our charging solutions, financing and lease options, and successfully anticipate the take-rate and usage of such services by users; |
| • | successfully service our vehicles after sales and maintain a good flow of spare parts and customer goodwill; |
| • | improve and maintain our operational efficiency; |
| • | maintain a reliable, secure, high-performance and scalable technology infrastructure; |
| • | predict our future revenues and appropriately budget for our expenses; |
| • | attract, retain and motivate talented employees; |
12
| • | anticipate trends that may emerge and affect our business; |
| • | anticipate and adapt to changing market conditions, including technological developments and changes in competitive landscape; and |
| • | navigate an evolving and complex regulatory environment. |
If we fail to adequately address any or all of these risks and challenges, our business may be materially and adversely affected.
We are an early stage company with a history of losses, and expect to incur significant expenses and continuing losses for the foreseeable future.
We have incurred a net loss since our inception. We believe that we will continue to incur operating and net losses each quarter until at least the time we begin significant deliveries of our vehicles. Even if we are able to successfully develop and sell or lease our vehicles, there can be no assurance that we will be commercially successful.
We expect the rate at which we will incur losses to be significantly higher in future periods as we, among other things, design, develop and manufacture our vehicles; build up inventories of parts and components for our vehicles; increase our sales and marketing activities, including opening new Fisker Experience Centers; develop our distribution infrastructure; and increases our general and administrative functions to support our growing operations. We may find that these efforts are more expensive than we currently anticipate or that these efforts may not result in revenues, which would further increase our losses.
Our EMaaS business model has yet to be tested and any failure to commercialize our strategic plans would have an adverse effect on our operating results and business, harm our reputation and could result in substantial liabilities that exceed our resources.
Investors should be aware of the difficulties normally encountered by a new enterprise, many of which are beyond our control, including substantial risks and expenses while establishing or entering new markets, setting up operations and undertaking marketing activities. The likelihood of our success must be considered in light of these risks, expenses, complications, delays, and the competitive environment in which we operate. There is, therefore, nothing at this time upon which to base an assumption that our EMaaS business model will prove successful, and we may not be able to generate significant revenue, raise additional capital or operate profitably. We will continue to encounter risks and difficulties frequently experienced by early commercial stage companies, including scaling up our infrastructure and headcount, and may encounter unforeseen expenses, difficulties or delays in connection with our growth. In addition, as a result of the capital-intensive nature of our business, it can be expected to continue to sustain substantial operating expenses without generating sufficient revenues to cover expenditures. Any investment in our company is therefore highly speculative and could result in the loss of your entire investment.
13
Our operating and financial results forecast relies in large part upon assumptions and analyses developed by us. If these assumptions or analyses prove to be incorrect, our actual operating results may be materially different from our forecasted results.
The projected financial and operating information appearing elsewhere in this registration statement reflect current estimates of future performance. Whether actual operating and financial results and business developments will be consistent with our expectations and assumptions as reflected in our forecast depends on a number of factors, many of which are outside our control, including, but not limited to:
| • | whether we can obtain sufficient capital to sustain and grow our business; |
| • | our ability to manage its growth; |
| • | whether we can manage relationships with key suppliers; |
| • | the ability to obtain necessary regulatory approvals; |
| • | demand for our products and services; |
| • | the timing and costs of new and existing marketing and promotional efforts; |
| • | competition, including from established and future competitors; |
| • | our ability to retain existing key management, to integrate recent hires and to attract, retain and motivate qualified personnel; |
| • | the overall strength and stability of domestic and international economies; |
| • | regulatory, legislative and political changes; and |
| • | consumer spending habits. |
Unfavorable changes in any of these or other factors, most of which are beyond our control, could materially and adversely affect our business, results of operations and financial results.
We may not be able to accurately estimate the supply and demand for our vehicles, which could result in a variety of inefficiencies in our business and hinder our ability to generate revenue. If we fail to accurately predict our manufacturing requirements, we could incur additional costs or experience delays.
It is difficult to predict our future revenues and appropriately budget for our expenses, and we may have limited insight into trends that may emerge and affect our business. We will be required to provide forecasts of our demand to our suppliers several months prior to the scheduled delivery of products to our prospective customers. Currently, there is no historical basis for making judgments on the demand for our vehicles or our ability to develop, manufacture, and deliver vehicles, or our profitability in the future. If we overestimate our requirements, our suppliers may have excess inventory, which indirectly would increase our costs. If we underestimate our requirements, our suppliers may have inadequate inventory, which could interrupt manufacturing of our products and result in delays in shipments and revenues. In addition, lead times for materials and components that our suppliers order may vary significantly and depend on factors such as the specific supplier, contract terms and demand for each component at a given time. If we fail to order sufficient quantities of product components in a timely manner, the delivery of vehicles to our customers could be delayed, which would harm our business, financial condition and operating results.
We could experience cost increases or disruptions in supply of raw materials or other components used in our vehicles. If we are unable to establish an arrangement for the sustainable supply of batteries for our vehicles, our business would be materially and adversely harmed.
We may be unable to adequately control the costs associated with our operations. We expect to incur significant costs related to procuring raw materials required to manufacture and assemble our vehicles. We expect to use various raw materials in our vehicles including, steel, recycled rubber, recycled polyester, carpeting from fishing nets and bottles recycled from ocean waste. The prices for these raw materials fluctuate depending on factors beyond our control. Our business also depends on the continued supply of battery cells for our vehicles. We are exposed to multiple risks relating to availability and pricing of quality
lithium-ion
battery cells.14
Furthermore, currency fluctuations, tariffs or shortages in petroleum and other economic or political conditions may result in significant increases in freight charges and raw material costs. Substantial increases in the prices for our raw materials or components would increase our operating costs, and could reduce our margins. In addition, a growth in popularity of electric vehicles without a significant expansion in battery cell production capacity could result in shortages, which would result in increased costs in raw materials to us or impact of prospects.
Our limited operating history makes evaluating our business and future prospects difficult and may increase the risk of your investment.
You must consider the risks and difficulties we face as an early stage company with a limited operating history. If we do not successfully address these risks, our business, prospects, operating results and financial condition will be materially and adversely harmed. We have a very limited operating history on which investors can base an evaluation of our business, operating results and prospects. It is difficult to predict our future revenues and appropriately budget for our expenses, and we have limited insight into trends that may emerge and affect our business. In the event that actual results differ from our estimates or we adjust our estimates in future periods, our operating results and financial position could be materially affected. The projected financial information appearing elsewhere in this registration statement was prepared by management and reflects current estimates of future performance.
If our vehicles fail to perform as expected, our ability to develop, market, and sell or lease our electric vehicles could be harmed.
Once production commences, our vehicles may contain defects in design and manufacture that may cause them not to perform as expected or that may require repair, recalls, and design changes. Our vehicles will use a substantial amount of software code to operate and software products are inherently complex and often contain defects and errors when first introduced. We have a limited frame of reference by which to evaluate the long-term performance of our systems and vehicles. There can be no assurance that we will be able to detect and fix any defects in the vehicles prior to their sale to consumers. If any of our vehicles fail to perform as expected, we may need to delay deliveries or initiate product recalls, which could adversely affect our brand in our target markets and could adversely affect our business, prospects, and results of operations.
Our services may not be generally accepted by our users. If we are unable to provide quality customer service, our business and reputation may be materially and adversely affected.
Our servicing may primarily be carried out through third parties certified by us. Although such servicing partners may have experience in servicing other vehicles, they will initially have limited experience in servicing Fisker vehicles. There can be no assurance that our service arrangements will adequately address the service requirements of our customers to their satisfaction, or that we and our partners will have sufficient resources to meet these service requirements in a timely manner as the volume of vehicles Fisker delivers increases.
In addition, if we are unable to roll out and establish a widespread service network that complies with applicable laws, user satisfaction could be adversely affected, which in turn could materially and adversely affect our reputation and thus our sales, results of operations, and prospects.
The automotive market is highly competitive, and we may not be successful in competing in this industry.
Both the automobile industry generally, and the electric vehicle segment in particular, are highly competitive, and we will be competing for sales with both ICE vehicles and other EVs. Many of our current and potential competitors have significantly greater financial, technical, manufacturing, marketing and other resources than we do and may be able to devote greater resources to the design, development, manufacturing, distribution,
15
promotion, sale and support of our products, including our electric vehicles. We expect competition for electric vehicles to intensify due to increased demand and a regulatory push for alternative fuel vehicles, continuing globalization, and consolidation in the worldwide automotive industry. Factors affecting competition include product quality and features, innovation and development time, pricing, reliability, safety, fuel economy, customer service, and financing terms. Increased competition may lead to lower vehicle unit sales and increased inventory, which may result in downward price pressure and adversely affect our business, financial condition, operating results, and prospects.
The automotive industry and its technology are rapidly evolving and may be subject to unforeseen changes. Developments in alternative technologies, including but not limited to hydrogen, may adversely affect the demand for our electric vehicles.
We may be unable to keep up with changes in electric vehicle technology or alternatives to electricity as a fuel source and, as a result, our competitiveness may suffer. Developments in alternative technologies, such as advanced diesel, ethanol, fuel cells, or compressed natural gas, or improvements in the fuel economy of the ICE, may materially and adversely affect our business and prospects in ways we do not currently anticipate. Any failure by us to successfully react to changes in existing technologies could materially harm our competitive position and growth prospects.
Reservations for our vehicles are cancellable.
Deposits paid to reserve the Fisker Ocean SUVs are cancellable by the customer until the customer enters into a lease or purchase agreement. Because all of our reservations are cancellable, it is possible that a significant number of customers who submitted reservations for the Fisker Ocean may not purchase vehicles.
The potentially long wait from the time a reservation is made until the time the vehicle is delivered, and any delays beyond expected wait times, could also impact user decisions on whether to ultimately make a purchase. Any cancellations could harm our financial condition, business, prospects, and operating results.
We may be subject to risks associated with autonomous driving technology.
Our vehicles will be designed with connectivity for future installation of an autonomous hardware suite and our plans to partner with a third-party software provider in the future to implement autonomous capabilities. However, we cannot guarantee that we will be able to identify a third party to provide the necessary hardware and software to enable autonomous capabilities in an acceptable timeframe, on terms satisfactory to us, or at all. Autonomous driving technologies are subject to risks and there have been accidents and fatalities associated with such technologies. The safety of such technologies depends in part on drive interactions, and drivers may not be accustomed to using or adapting to such technologies. To the extent accidents associated with our autonomous driving systems occur, we could be subject to liability, negative publicity, government scrutiny, and further regulation. Any of the foregoing could materially and adversely affect our results of operations, financial condition, and growth prospects.
We have identified material weaknesses in our internal control over financial reporting which, if not corrected, could affect the reliability of our consolidated financial statements and have other adverse consequences.
We have identified material weaknesses in internal control over financial reporting, which relate to: (a) our risk assessment process, including as it relates to fraud risks; (b) general segregation of duties, including the review and approval of journal entries; and (c) precision level to ensure accruals were recorded in the correct period.
A material weakness is a deficiency or combination of deficiencies in internal control over financial reporting such that there is a reasonable possibility that a material misstatement of our financial statements would not be prevented or detected on a timely basis. These deficiencies could result in additional material misstatements to our consolidated financial statements that could not be prevented or detected on a timely basis.
16
Our management has concluded that these material weaknesses in our internal control over financial reporting are due to the fact that, prior to the completion of the Business Combination, we were a private company with limited resources and did not have the necessary business processes and related internal control formally designed and implemented coupled with the appropriate resources with the appropriate level of experience and technical expertise to oversee our business processes and controls surrounding risk assessment, segregation of duties and accuracy of accruals.
Our management is in the process of developing a remediation plan. The material weaknesses will not be considered remediated until management designs and implements effective controls that operate for a sufficient period of time and management has concluded, through testing, that these controls are effective. Our management will monitor the effectiveness of our remediation plans and will make changes management determines to be appropriate.
If not remediated, these material weaknesses could result in further material misstatements to our annual or interim consolidated financial statements that might not be prevented or detected on a timely basis, or in delayed filing of required periodic reports. If we are unable to assert that its internal control over financial reporting is effective, or when required in the future, if our independent registered public accounting firm is unable to express an unqualified opinion as to the effectiveness of the internal control over financial reporting, investors may lose confidence in the accuracy and completeness of our financial reports, the market price of our Class A Common Stock could be adversely affected and we could become subject to litigation or investigations by the NYSE, the SEC, or other regulatory authorities, which could require additional financial and management resources.
Our future growth is dependent on the demand for, and upon consumers’ willingness to adopt, electric vehicles.
Our future growth is dependent on the demand for, and upon consumers’ willingness to adopt electric vehicles, and even if electric vehicles become more mainstream, consumers choosing us over other EV manufacturers. Demand for electric vehicles may be affected by factors directly impacting automobile prices or the cost of purchasing and operating automobiles such as sales and financing incentives, prices of raw materials and parts and components, cost of fuel and governmental regulations, including tariffs, import regulation and other taxes. Volatility in demand may lead to lower vehicle unit sales, which may result in downward price pressure and adversely affect our business, prospects, financial condition, and operating results.
In addition, the demand for our vehicles and services will highly depend upon the adoption by consumers of new energy vehicles in general and electric vehicles in particular. The market for new energy vehicles is still rapidly evolving, characterized by rapidly changing technologies, competitive pricing and competitive factors, evolving government regulation and industry standards, and changing consumer demands and behaviors.
Other factors that may influence the adoption of alternative fuel vehicles, and specifically electric vehicles, include:
| • | perceptions about electric vehicle quality, safety, design, performance and cost, especially if adverse events or accidents occur that are linked to the quality or safety of electric vehicles, whether or not such vehicles are produced by us or other manufacturers; |
| • | range anxiety; |
| • | the availability of new energy vehicles, including plug-in hybrid electric vehicles; |
| • | the availability of service and charging stations for electric vehicles; |
| • | the environmental consciousness of consumers, and their adoption of EVs; |
| • | perceptions about and the actual cost of alternative fuel; and |
17
| • | macroeconomic factors. |
Any of the factors described above may cause current or potential customers not to purchase electric vehicles in general, and Fisker electric vehicles in particular. If the market for electric vehicles does not develop as we expect or develop more slowly than we expect, our business, prospects, financial condition and operating results will be affected.
The unavailability, reduction or elimination of government and economic incentives could have a material adverse effect on our business, prospects, financial condition and operating results.
Any reduction, elimination, or discriminatory application of government subsidies and economic incentives because of policy changes, or the reduced need for such subsidies and incentives due to the perceived success of the electric vehicle or other reasons, may result in the diminished competitiveness of the alternative fuel and electric vehicle industry generally or our electric vehicles in particular. This could materially and adversely affect the growth of the alternative fuel automobile markets and our business, prospects, financial condition and operating results.
While certain tax credits and other incentives for alternative energy production, alternative fuel and electric vehicles have been available in the past, there is no guarantee these programs will be available in the future. If current tax incentives are not available in the future, our financial position could be harmed.
We may not be able to obtain or agree on acceptable terms and conditions for all or a significant portion of the government grants, loans and other incentives for which we may apply. As a result, our business and prospects may be adversely affected.
We may apply for federal and state grants, loans and tax incentives under government programs designed to stimulate the economy and support the production of alternative fuel and electric vehicles and related technologies. We anticipate that in the future there will be new opportunities for it to apply for grants, loans and other incentives from the United States, state and foreign governments. Our ability to obtain funds or incentives from government sources is subject to the availability of funds under applicable government programs and approval of our applications to participate in such programs. The application process for these funds and other incentives will likely be highly competitive. We cannot assure you that we will be successful in obtaining any of these additional grants, loans and other incentives. If we are not successful in obtaining any of these additional incentives and we are unable to find alternative sources of funding to meet our planned capital needs, our business and prospects could be materially adversely affected.
If we fail to manage our future growth effectively, we may not be able to market and sell or lease our vehicles successfully.
We intend to expand our operations significantly, which will require hiring, retaining and training new personnel, controlling expenses, establishing facilities and experience centers, and implementing administrative infrastructure, systems and processes. In addition, because our electric vehicles are based on a different technology platform than traditional ICE vehicles, individuals with sufficient training in electric vehicles may not be available to be hired, and we will need to expend significant time and expense training employees it hires. We also require sufficient talent in additional areas such as software development. Furthermore, as we are a relatively young company, our ability to train and integrate new employees into its operations may not meet the growing demands of our business which may affect our ability to grow. Any failure to effectively manage our growth could materially and adversely affect our business, prospects, operating results and financial condition.
Insufficient warranty reserves to cover future warranty claims could materially adversely affect our business, prospects, financial condition and operating results.
Once our cars are in production, we will need to maintain warranty reserves to cover warranty-related claims. If our warranty reserves are inadequate to cover future warranty claims on our vehicles, our business, prospects, financial condition and operating results could be materially and adversely affected. We may become subject to significant and unexpected warranty expenses. There can be no assurances that then-existing warranty reserves will be sufficient to cover all claims.
18
We may not succeed in establishing, maintaining and strengthening our brand, which would materially and adversely affect customer acceptance of its vehicles and components and its business, revenues and prospects.
Our business and prospects heavily depend on our ability to develop, maintain and strengthen the Fisker brand. If we are not able to establish, maintain and strengthen our brand, we may lose the opportunity to build a critical mass of customers. Our ability to develop, maintain and strengthen the Fisker brand will depend heavily on the success of our marketing efforts. The automobile industry is intensely competitive, and we may not be successful in building, maintaining and strengthening our brand. Many of our current and potential competitors, particularly automobile manufacturers headquartered in the United States, Japan, the European Union and China, have greater name recognition, broader customer relationships and substantially greater marketing resources than we do. If we do not develop and maintain a strong brand, our business, prospects, financial condition and operating results will be materially and adversely impacted.
Our distribution model is different from the predominant current distribution model for automobile manufacturers, which makes evaluating our business, operating results and future prospects difficult.
Our distribution model is different from the predominant current distribution model for automobile manufacturers, which makes evaluating our business, operating results and future prospects difficult. Our distribution model is not common in the automotive industry today. Our plans to conduct vehicle sales directly to users rather than through dealerships, primarily through our Flexee App and Fisker Experience Centers. This model of vehicle distribution is relatively new and, with limited exceptions, unproven, and subjects us to substantial risk. For example, we will not be able to utilize long established sales channels developed through a franchise system to increase sales volume. Moreover, we will be competing with companies with well established distribution channels. Our success will depend in large part on our ability to effectively develop our own sales channels and marketing strategies. If we are unable to achieve this, we could have a material adverse effect on our business, prospects, financial results and results of operations. There are substantial automotive franchise laws in place in many geographies in the world and we might be exposed to significant franchise dealer litigation risks.
We may face regulatory limitations on our ability to sell vehicles directly which could materially and adversely affect our ability to sell our electric vehicles.
Some states have laws that may be interpreted to impose limitations on thissales model. The application of these state laws to our operations may be difficult to predict. Laws in some states may limit our ‘ability to obtain dealer licenses from state motor vehicle regulators.
direct-to-consumer
In addition, decisions by regulators permitting us to sell vehicles may be challenged by dealer associations and others as to whether such decisions comply with applicable state motor vehicle industry laws. In some states, there have also been regulatory and legislative efforts by dealer associations to propose laws that, if enacted, would prevent us from obtaining dealer licenses in their states given our anticipated sales model. A few states have passed legislation that clarifies our ability to operate, but at the same time limits the number of dealer licenses we can obtain or dealerships that we can operate.
Internationally, there may be laws in jurisdictions that may restrict our sales or other business practices. Even for those jurisdictions we have analyzed, the laws in this area can be complex, difficult to interpret and may change over time. Continued regulatory limitations and other obstacles interfering with our ability to sell vehicles directly to consumers could have a negative and material impact on our business, prospects, financial condition and results of operations.
We will initially depend on revenue generated from a single model and in the foreseeable future will be significantly dependent on a limited number of models.
19
We will initially depend on revenue generated from a single vehicle model and in the foreseeable future will be significantly dependent on a limited number of models. Historically, automobile customers have come to expect a variety of vehicle models offered in a manufacturer’s fleet and new and improved vehicle models to be introduced frequently. Given that for the foreseeable future our business will depend on a single or limited number of models, to the extent a particular model is not well-received by the market, our sales volume, business, prospects, financial condition, and operating results could be materially and adversely affected.
Doing business internationally creates operational and financial risks for our business.
Our business plan includes operations in international markets, including initial manufacturing and supply activities in Europe, initial sales in North America and Europe, and eventual expansion into other international markets. Conducting and launching operations on an international scale requires close coordination of activities across multiple jurisdictions and time zones and consumes significant management resources. If we fail to coordinate and manage these activities effectively, our business, financial condition or results of operations could be adversely affected. International sales entail a variety of risks, including currency exchange fluctuations, challenges in staffing and managing foreign operations, tariffs and other trade barriers, unexpected changes in legislative or regulatory requirements of foreign countries into which we sell our products and services, difficulties in obtaining export licenses or in overcoming other trade barriers, laws and business practices favoring local companies, political and economic instability, difficulties protecting or procuring intellectual property rights, and restrictions resulting in delivery delays and significant taxes or other burdens of complying with a variety of foreign laws.
We are highly dependent on the services of Henrik Fisker, our Chief Executive Officer.
We are highly dependent on the services of Henrik Fisker, our
co-founder
and Chief Executive Officer, and, together with his wife, our Chief Financial Officer, our largest stockholder. Mr. Fisker is the source of many, if not most, of the ideas and execution driving Fisker. If Mr. Fisker were to discontinue his service to Fisker due to death, disability or any other reason, we would be significantly disadvantaged.Our business depends substantially on the continuing efforts of our executive officers, key employees and qualified personnel, and our operations may be severely disrupted if we lost their services.
Our success depends substantially on the continued efforts of our executive officers, key employees and qualified personnel, and our operations may be severely disrupted if we lost their services. As we build our brand and becomes more well known, the risk that competitors or other companies may poach our talent increases. The failure to attract, integrate, train, motivate and retain these personnel could seriously harm our business and prospects.
Our business may be adversely affected by labor and union activities.
Although none of our employees are currently represented by a labor union, it is common throughout the automobile industry generally for many employees at automobile companies to belong to a union, which can result in higher employee costs and increased risk of work stoppages. We may also directly and indirectly depend upon other companies with unionized work forces, such as parts suppliers and trucking and freight companies, and work stoppages or strikes organized by such unions could have a material adverse impact on our business, financial condition or operating results.
We face risks related to health epidemics, including the recent
COVID-19
pandemic, which could have a material adverse effect on our business and results of operations.We face various risks related to public health issues, including epidemics, pandemics, and other outbreaks, including the recent pandemic of respiratory illness caused by a novel coronavirus known as
COVID-19.
The impact ofCOVID-19,
including changes in consumer and business behavior, pandemic fears and market downturns, and restrictions on business and individual activities, has created significant volatility in the global economy and led to reduced economic activity. The spread ofCOVID-19
has also created a disruption in the manufacturing, delivery and overall supply chain of vehicle manufacturers and suppliers, and has led to a global decrease in vehicle sales in markets around the world.20
The pandemic has resulted in government authorities implementing numerous measures to try to contain the virus, such as travel bans and restrictions, quarantines,ororders, and business shutdowns. For example, employees at our headquarters located in Manhattan Beach, California, are currently subject to aorder from the state government. These measures may adversely impact our employees and operations and the operations of its customers, suppliers, vendors and business partners, and may negatively impact our sales and marketing activities. In addition, various aspects of our business cannot be conducted remotely. These measures by government authorities may remain in place for a significant period of time and they are likely to continue to adversely affect our manufacturing plans, sales and marketing activities, business and results of operations.
stay-at-home
shelter-in-place
stay-at-home
The spread of
COVID-19
has caused us to modify our business practices (including employee travel, recommending that allnon-essential
personnel work from home and cancellation or reduction of physical participation in sales activities, meetings, events and conferences), and we may take further actions as may be required by government authorities or that we determine is in the best interests of our employees, customers, suppliers, vendors and business partners. There is no certainty that such actions will be sufficient to mitigate the risks posed by the virus or otherwise be satisfactory to government authorities. If significant portions of our workforce are unable to work effectively, including due to illness, quarantines, social distancing, government actions or other restrictions in connection with theCOVID-19
pandemic, our operations will be impacted.The extent to which the
COVID-19
pandemic impacts our business, prospects and results of operations will depend on future developments, which are highly uncertain and cannot be predicted, including the duration and spread of the pandemic, its severity, the actions to contain the virus or treat its impact, and how quickly and to what extent normal economic and operating activities can resume. Even after theCOVID-19
pandemic has subsided, we may continue to experience an adverse impact to its business as a result of its global economic impact, including any recession that has occurred or may occur in the future.Specifically, difficult macroeconomic conditions, such as decreases in per capita income and level of disposable income, increased and prolonged unemployment, or a decline in consumer confidence as a result of the
COVID-19
pandemic could have a material adverse effect on the demand for our vehicles. Under difficult economic conditions, potential customers may seek to reduce spending by forgoing our vehicles for other traditional options or may choose to keep their existing vehicles, and cancel reservations.There are no comparable recent events that may provide guidance as to the effect of the spread of
COVID-19
and a pandemic, and, as a result, the ultimate impact of theCOVID-19
pandemic or a similar health epidemic is highly uncertain.Our business plans require a significant amount of capital. In addition, our future capital needs may require us to sell additional equity or debt securities that may dilute our stockholders or introduce covenants that may restrict our operations or our ability to pay dividends.
We expect our capital expenditures to continue to be significant in the foreseeable future as we expands our business, and that our level of capital expenditures will be significantly affected by user demand for our products and services. The fact that we have a limited operating history means we have limited historical data on the demand for our products and services. As a result, our future capital requirements may be uncertain and actual capital requirements may be different from those it currently anticipates. We may need to seek equity or debt financing to finance a portion of our capital expenditures. Such financing might not be available to us in a timely manner or on terms that are acceptable, or at all.
Our ability to obtain the necessary financing to carry out our business plan is subject to a number of factors, including general market conditions and investor acceptance of our EMaaS business model. These factors may make the timing, amount, terms and conditions of such financing unattractive or unavailable to us. If we are unable to
21
raise sufficient funds, we will have to significantly reduce our spending, delay or cancel our planned activities or substantially change our corporate structure. We might not be able to obtain any funding, and we might not have sufficient resources to conduct our business as projected, both of which could mean that we would be forced to curtail or discontinue our operations.
In addition, our future capital needs and other business reasons could require us to sell additional equity or debt securities or obtain a credit facility. The sale of additional equity or equity-linked securities could dilute our stockholders. The incurrence of indebtedness would result in increased debt service obligations and could result in operating and financing covenants that would restrict our operations or our ability to pay dividends to our stockholders.
If we cannot raise additional funds when we need or want them, our operations and prospects could be negatively affected.
Failure of information security and privacy concerns could subject us to penalties, damage our reputation and brand, and harm our business and results of operations.
We expect to face significant challenges with respect to information security and privacy, including the storage, transmission and sharing of confidential information. We will transmit and store confidential and private information of our customers, such as personal information, including names, accounts, user IDs and passwords, and payment or transaction related information.
We have adopted strict information security policies and deployed advanced measures to implement the policies, including, among others, advanced encryption technologies, and plans to continue to deploy additional measurers as we grow. However, advances in technology, an increased level of sophistication and diversity of our products and services, an increased level of expertise of hackers, new discoveries in the field of cryptography or others can still result in a compromise or breach of the measures that it uses. If we are unable to protect our systems, and hence the information stored in our systems, from unauthorized access, use, disclosure, disruption, modification or destruction, such problems or security breaches could cause a loss, give rise to our liabilities to the owners of confidential information or even subject it to fines and penalties. In addition, complying with various laws and regulations could cause us to incur substantial costs or require it to change our business practices, including our data practices, in a manner adverse to our business.
In addition, we will need to comply with increasingly complex and rigorous regulatory standards enacted to protect business and personal data in the United States, Europe and elsewhere. For example, the European Union adopted the General Data Protection Regulation (“GDPR”), which became effective on May 25, 2018 and the State of California adopted the California Consumer Privacy Act of 2018 (“CCPA”). Both the GDPR and the CCPA impose additional obligations on companies regarding the handling of personal data and provides certain individual privacy rights to persons whose data is stored. Compliance with existing, proposed and recently enacted laws (including implementation of the privacy and process enhancements called for under the GDPR) and regulations can be costly; any failure to comply with these regulatory standards could subject us to legal and reputational risks.
Compliance with any additional laws and regulations could be expensive, and may place restrictions on the conduct of our business and the manner in which we interact with our customers. Any failure to comply with applicable regulations could also result in regulatory enforcement actions against us, and misuse of or failure to secure personal information could also result in violation of data privacy laws and regulations, proceedings against us by governmental entities or others, and damage to our reputation and credibility, and could have a negative impact on revenues and profits.
Significant capital and other resources may be required to protect against information security breaches or to alleviate problems caused by such breaches or to comply with our privacy policies or privacy-related legal obligations. The resources required may increase over time as the methods used by hackers and others engaged in online criminal activities are increasingly sophisticated and constantly evolving. Any failure or perceived failure by us to prevent information security breaches or to comply with privacy policies or privacy-related legal obligations, or any compromise of security that results in the unauthorized release or transfer of personally identifiable
22
information or other customer data, could cause our customers to lose trust in us and could expose us to legal claims. Any perception by the public that online transactions or the privacy of user information are becoming increasingly unsafe or vulnerable to attacks could inhibit the growth of online retail and other online services generally, which may reduce the number of orders we receive.
We retain certain information about our users and may be subject to various privacy and consumer protection laws.
We intend to use our vehicles’ electronic systems to log information about each vehicle’s use, such as charge time, battery usage, mileage and driving behavior, in order to aid us in vehicle diagnostics, repair and maintenance, as well as to help us customize and optimize the driving and riding experience. Our users may object to the use of this data, which may harm our business. Possession and use of our users’ driving behavior and data in conducting our business may subject us to legislative and regulatory burdens in the United States and other jurisdictions that could require notification of any data breach, restrict our use of such information, and hinder our ability to acquire new customers or market to existing customers. If users allege that we have improperly released or disclosed their personal information, we could face legal claims and reputational damage. We may incur significant expenses to comply with privacy, consumer protection and security standards and protocols imposed by laws, regulations, industry standards or contractual obligations. If third parties improperly obtain and use the personal information of our users, we may be required to expend significant resources to resolve these problems.
Any unauthorized control or manipulation of our vehicles’ systems could result in loss of confidence in us and our vehicles and harm our business.
Our vehicles will contain complex information technology systems. For example, our vehicles will be outfitted with
built-in
data connectivity to accept and install periodic remote updates from us to improve or update the functionality of our vehicles. We have designed, implemented and tested security measures intended to prevent cybersecurity breaches or unauthorized access to our information technology networks, our vehicles and their systems, and intends to implement additional security measures as necessary. However, hackers may attempt in the future, to gain unauthorized access to modify, alter and use such networks, vehicles and systems to gain control of, or to change, our vehicles’ functionality, user interface and performance characteristics, or to gain access to data stored in or generated by the vehicle. Vulnerabilities could be identified in the future and our remediation efforts may not be successful. Any unauthorized access to or control of our vehicles or their systems or any loss of data could result in legal claims or proceedings. In addition, regardless of their veracity, reports of unauthorized access to our vehicles, their systems or data, as well as other factors that may result in the perception that our vehicles, their systems or data are capable of being “hacked,” could negatively affect our brand and harm our business, prospects, financial condition and operating results.Interruption or failure of our information technology and communications systems could impact our ability to effectively provide our services.
We plan to outfit our vehicles with
in-vehicle
services and functionality that utilize data connectivity to monitor performance and timely capture opportunities for cost-saving preventative maintenance. The availability and effectiveness of our services depend on the continued operation of information technology and communications systems, which we have yet to develop. Our systems will be vulnerable to damage or interruption from, among others, fire, terrorist attacks, natural disasters, power loss, telecommunications failures, computer viruses, computer denial of service attacks, or other attempts to harm our systems. Our data centers could also be subject tobreak-ins,
sabotage and intentional acts of vandalism causing potential disruptions. Some of our systems will not be fully redundant, and our disaster recovery planning cannot account for all eventualities. Any problems at our data centers could result in lengthy interruptions in our service. In addition, our vehicles are highly technical and complex and may contain errors or vulnerabilities, which could result in interruptions in our business or the failure of our systems.We face risks related to natural disasters, health epidemics and other outbreaks, which could significantly disrupt our operations.
23
Our facilities or operations could be adversely affected by events outside of our control, such as natural disasters, wars, health epidemics (as more fully described in the risk factor “” located elsewhere in these Risk Factors), and other calamities. Although we have servers that are hosted in an offsite location, our backup system does not capture data on a real-time basis and we may be unable to recover certain data in the event of a server failure. We cannot assure you that any backup systems will be adequate to protect us from the effects of fire, floods, typhoons, earthquakes, power loss, telecommunications failures,
We face risks related to health epidemics,
including
the recent COVID
-19
pandemic, which could have a material adverse effect on our business and results of operationsbreak-ins,
war, riots, terrorist attacks or similar events. Any of the foregoing events may give rise to interruptions, breakdowns, system failures, technology platform failures or internet failures, which could cause the loss or corruption of data or malfunctions of software or hardware as well as adversely affect our ability to provide services.We may need to defend us against patent or trademark infringement claims, which may be time-consuming and would cause us to incur substantial costs.
Companies, organizations, or individuals, including our competitors, may hold or obtain patents, trademarks or other proprietary rights that would prevent, limit or interfere with our ability to make, use, develop, sell, leasing or market our vehicles or components, which could make it more difficult for us to operate our business. From time to time, we may receive communications from holders of patents or trademarks regarding their proprietary rights. Companies holding patents or other intellectual property rights may bring suits alleging infringement of such rights or otherwise assert their rights and urge us to take licenses. Our applications and uses of trademarks relating to our design, software or artificial intelligence technologies could be found to infringe upon existing trademark ownership and rights. In addition, if we are determined to have infringed upon a third party’s intellectual property rights, we may be required to do one or more of the following:
| • | cease selling or leasing, incorporating certain components into, or using vehicles or offering goods or services that incorporate or use the challenged intellectual property; |
| • | pay substantial damages; |
| • | seek a license from the holder of the infringed intellectual property right, which license may not be available on reasonable terms, or at all; |
| • | redesign our vehicles or other goods or services; or |
| • | establish and maintain alternative branding for our products and services. |
In the event of a successful claim of infringement against us and our failure or inability to obtain a license to the infringed technology or other intellectual property right, our business, prospects, operating results and financial condition could be materially and adversely affected. In addition, any litigation or claims, whether or not valid, could result in substantial costs, negative publicity and diversion of resources and management attention.
We may not be able to prevent others from unauthorized use of our intellectual property, which could harm our business and competitive position.
We may not be able to prevent others from unauthorized use of our intellectual property, which could harm our business and competitive position. We rely on a combination of patents, trade secrets (including
know-how),
employee and third-party nondisclosure agreements, copyrights, trademarks, intellectual property licenses, and other contractual rights to establish and protect our rights in its technology. Despite our efforts to protect our proprietary rights, third parties may attempt to copy or otherwise obtain and use our intellectual property or seek court declarations that they do not infringe upon our intellectual property rights. Monitoring unauthorized use of our intellectual property is difficult and costly, and the steps we have taken or will take will prevent misappropriation. From time to time, we may have to resort to litigation to enforce our intellectual property rights, which could result in substantial costs and diversion of our resources.24
Patent, trademark, and trade secret laws vary significantly throughout the world. A number of foreign countries do not protect intellectual property rights to the same extent as do the laws of the United States. Therefore, our intellectual property rights may not be as strong or as easily enforced outside of the United States. Failure to adequately protect our intellectual property rights could result in our competitors offering similar products, potentially resulting in the loss of some of our competitive advantage and a decrease in our revenue which, would adversely affect our business, prospects, financial condition and operating results.
Our patent applications may not issue as patents, which may have a material adverse effect on our ability to prevent others from commercially exploiting products similar to ours.
We cannot be certain that we are the first inventor of the subject matter to which we have filed a particular patent application, or if we are the first party to file such a patent application. If another party has filed a patent application for the same subject matter as we have, we may not be entitled to the protection sought by the patent application. Further, the scope of protection of issued patent claims is often difficult to determine. As a result, we cannot be certain that the patent applications that we file will issue, or that our issued patents will afford protection against competitors with similar technology. In addition, our competitors may design around our issued patents, which may adversely affect our business, prospects, financial condition or operating results.
As our patents may expire and may not be extended, our patent applications may not be granted and our patent rights may be contested, circumvented, invalidated or limited in scope, our patent rights may not protect it effectively. In particular, we may not be able to prevent others from developing or exploiting competing technologies, which could have a material and adverse effect on our business operations, financial condition and results of operations.
We cannot assure you that we will be granted patents pursuant to our pending applications. Even if our patent applications succeed and we are issued patents in accordance with them, we are still uncertain whether these patents will be contested, circumvented or invalidated in the future. In addition, the rights granted under any issued patents may not provide us with meaningful protection or competitive advantages. The claims under any patents that issue from our patent applications may not be broad enough to prevent others from developing technologies that are similar or that achieve results similar to ours. The intellectual property rights of others could also bar us from licensing and exploiting any patents that issue from our pending applications. Numerous patents and pending patent applications owned by others exist in the fields in which we have developed and are developing our technology. These patents and patent applications might have priority over our patent applications and could subject our patent applications to invalidation. Finally, in addition to those who may claim priority, any of our existing or pending patents may also be challenged by others on the basis that they are otherwise invalid or unenforceable.
We may be subject to damages resulting from claims that we or our employees have wrongfully used or disclosed alleged trade secrets of our employees’ former employers.
Many of our employees were previously employed by other automotive companies or by suppliers to automotive companies. We may be subject to claims that we or these employees have inadvertently or otherwise used or disclosed trade secrets or other proprietary information of our former employers. Litigation may be necessary to defend against these claims. If we fail in defending such claims, in addition to paying monetary damages, we may lose valuable intellectual property rights or personnel. A loss of key personnel or our work product could hamper or prevent our ability to commercialize our products, which could severely harm our business. Even if we are successful in defending against these claims, litigation could result in substantial costs and demand on management resources.
Our vehicles are subject to motor vehicle standards and the failure to satisfy such mandated safety standards would have a material adverse effect on our business and operating results.
All vehicles sold must comply with international, federal, and state motor vehicle safety standards. In the United States, vehicles that meet or exceed all federally mandated safety standards are certified under the federal regulations. Rigorous testing and the use of approved materials and equipment are among the requirements for achieving federal certification. Failure by us to have the Fisker Ocean or any future model electric vehicle satisfy motor vehicle standards would have a material adverse effect on our business and operating results.
25
We are subject to substantial regulation and unfavorable changes to, or our failure to comply with, these regulations could substantially harm our business and operating results.
Our electric vehicles, and the sale of motor vehicles in general, are subject to substantial regulation under international, federal, state, and local laws. We expect to incur significant costs in complying with these regulations. Regulations related to the electric vehicle industry and alternative energy are currently evolving and we face risks associated with changes to these regulations.
To the extent the laws change, our vehicles may not comply with applicable international, federal, state or local laws, which would have an adverse effect on our business. Compliance with changing regulations could be burdensome, time consuming, and expensive. To the extent compliance with new regulations is cost prohibitive, our business, prospects, financial condition and operating results would be adversely affected.
Internationally, there may be laws in jurisdictions we have not yet entered or laws we are unaware of in jurisdictions we have entered that may restrict our sales or other business practices. Even for those jurisdictions we have analyzed, the laws in this area can be complex, difficult to interpret and may change over time. Continued regulatory limitations and other obstacles interfering with our ability to sell or lease vehicles directly to consumers could have a negative and material impact on our business, prospects, financial condition and results of operations.
We will face risks associated with potential international operations, including unfavorable regulatory, political, tax and labor conditions, which could harm our business.
We will face risks associated with any potential international operations, including possible unfavorable regulatory, political, tax and labor conditions, which could harm our business. We anticipate having international operations and subsidiaries that are subject to the legal, political, regulatory and social requirements and economic conditions in these jurisdictions. We have no experience to date selling or leasing and servicing our vehicles internationally and such expansion would require us to make significant expenditures, including the hiring of local employees and establishing facilities, in advance of generating any revenue. We will be subject to a number of risks associated with international business activities that may increase our costs, impact our ability to sell or lease our EVs and require significant management attention. These risks include:
| • | conforming our vehicles to various international regulatory requirements where our vehicles are sold which requirements may change over time; |
| • | difficulty in staffing and managing foreign operations; |
| • | difficulties attracting customers in new jurisdictions; |
| • | foreign government taxes, regulations and permit requirements, including foreign taxes that we may not be able to offset against taxes imposed upon it in the United States, and foreign tax and other laws limiting our ability to repatriate funds to the United States; |
| • | fluctuations in foreign currency exchange rates and interest rates, including risks related to any foreign currency swap or other hedging activities we undertake; |
| • | United States and foreign government trade restrictions, tariffs and price or exchange controls; |
| • | foreign labor laws, regulations and restrictions; |
| • | changes in diplomatic and trade relationships; |
26
| • | political instability, natural disasters, war or events of terrorism; and |
| • | the strength of international economies. |
If we fail to successfully address these risks, our business, prospects, operating results and financial condition could be materially harmed.
Our business could be adversely affected by trade tariffs or other trade barriers.
In recent years, both China and the United States have each imposed tariffs indicating the potential for further trade barriers. These tariffs may escalate a nascent trade war between China and the United States. Tariffs could potentially impact our raw material prices and impact any plans to sell vehicles in China. In addition, these developments could have a material adverse effect on global economic conditions and the stability of global financial markets. Any of these factors could have a material adverse effect on our business, financial condition and results of operations.
We may become subject to product liability claims, which could harm our financial condition and liquidity if we are not able to successfully defend or insure against such claims.
We may become subject to product liability claims, even those without merit, which could harm our business, prospects, operating results, and financial condition. The automobile industry experiences significant product liability claims and we face inherent risk of exposure to claims in the event our vehicles do not perform as expected or malfunction resulting in personal injury or death. Our risks in this area are particularly pronounced given it has limited field experience of our vehicles. A successful product liability claim against us could require us to pay a substantial monetary award. Moreover, a product liability claim could generate substantial negative publicity about our vehicles and business and inhibit or prevent commercialization of other future vehicle candidates, which would have material adverse effect on our brand, business, prospects and operating results. Any insurance coverage might not be sufficient to cover all potential product liability claims. Any lawsuit seeking significant monetary damages either in excess of our coverage, or outside of our coverage, may have a material adverse effect on our reputation, business and financial condition. We may not be able to secure additional product liability insurance coverage on commercially acceptable terms or at reasonable costs when needed, particularly if we face liability for our products and are forced to make a claim under our policy.
We are or will be subject to anti-corruption, anti-bribery, anti-money laundering, financial and economic sanctions and similar laws, and
non-compliance
with such laws can subject us to administrative, civil and criminal fines and penalties, collateral consequences, remedial measures and legal expenses, all of which could adversely affect our business, results of operations, financial condition and reputation.We are or will be subject to anti-corruption, anti-bribery, anti-money laundering, financial and economic sanctions and similar laws and regulations in various jurisdictions in which we conduct or in the future may conduct activities, including the U.S. Foreign Corrupt Practices Act (“FCPA”), the U.K. Bribery Act 2010, and other anti-corruption laws and regulations. The FCPA and the U.K. Bribery Act 2010 prohibit us and our officers, directors, employees and business partners acting on our behalf, including agents, from corruptly offering, promising, authorizing or providing anything of value to a “foreign official” for the purposes of influencing official decisions or obtaining or retaining business or otherwise obtaining favorable treatment. The FCPA also requires companies to make and keep books, records and accounts that accurately reflect transactions and dispositions of assets and to maintain a system of adequate internal accounting controls. The U.K. Bribery Act also prohibits
non-governmental
“commercial” bribery and soliciting or accepting bribes. A violation of these laws or regulations could adversely affect our business, results of operations, financial condition and reputation. Our policies and procedures designed to ensure compliance with these regulations may not be sufficient and our directors, officers, employees, representatives, consultants, agents, and business partners could engage in improper conduct for which we may be held responsible.27
Non-compliance
with anti-corruption, anti-bribery, anti-money laundering or financial and economic sanctions laws could subject us to whistleblower complaints, adverse media coverage, investigations, and severe administrative, civil and criminal sanctions, collateral consequences, remedial measures and legal expenses, all of which could materially and adversely affect our business, results of operations, financial condition and reputation. In addition, changes in economic sanctions laws in the future could adversely impact our business and investments in its shares.We may face legal challenges in one or more states attempting to sell or lease directly to customers which could materially adversely affect our costs.
Our business model includes the direct sale of vehicles to individual customers. Most, if not all, states require a license to sell or lease vehicles within the state. Many states prohibit manufacturers from directly selling or leasing vehicles to customers. In other states, manufacturers must operate a physical dealership within the state to deliver vehicles to customers. As a result, we may not be able to sell or lease directly to customers in each state in the United States.
We are currently not registered as a dealer in any state. In many states, it is unclear if, as a manufacturer, we will be able to obtain permission to sell or lease and deliver vehicles directly to customers. For customers residing in states in which we will not be allowed to sell, lease or deliver vehicles, we may have to arrange alternate methods of delivery of vehicles. This could include delivering vehicles to adjacent or nearby states in which we are allowed to directly sell or lease and ship vehicles, and arranging for the customer to transport the vehicles to their home states. These workarounds could add significant complexity, and as a result, costs, to our business.
We will need to improve our operational and financial systems to support our expected growth, increasingly complex business arrangements, and rules governing revenue and expense recognition and any inability to do so will adversely affect our billing and reporting.
To manage the expected growth of our operations and increasing complexity, we will need to improve our operational and financial systems, procedures, and controls and continue to increase systems automation to reduce reliance on manual operations. Any inability to do so will affect our billing and reporting. Our current and planned systems, procedures and controls may not be adequate to support our complex arrangements and the rules governing revenue and expense recognition for our future operations and expected growth. Delays or problems associated with any improvement or expansion of our operational and financial systems and controls could adversely affect our relationships with our customers, cause harm to our reputation and brand and could also result in errors in our financial and other reporting.
Failure to build our finance infrastructure and improve our accounting systems and controls could impair our ability to comply with the financial reporting and internal controls requirements for publicly traded companies.
As a public company, we will operate in an increasingly demanding regulatory environment, which requires us to comply with the Sarbanes-Oxley Act of 2002 (the “Sarbanes-Oxley Act”), the regulations of the NYSE, the rules and regulations of the SEC, expanded disclosure requirements, accelerated reporting requirements and more complex accounting rules. Company responsibilities required by the Sarbanes-Oxley Act include establishing corporate oversight and adequate internal control over financial reporting and disclosure controls and procedures. Effective internal controls are necessary for us to produce reliable financial reports and are important to help prevent financial fraud. We have never been required to test our internal controls within a specified period and, as a result, we may experience difficulty in meeting these reporting requirements in a timely manner.
We anticipate that the process of building our accounting and financial functions and infrastructure will require significant additional professional fees, internal costs and management efforts. We expect that we will need to implement a new internal system to combine and streamline the management of our financial, accounting, human
28
resources and other functions. However, such a system would likely require us to complete many processes and procedures for the effective use of the system or to run our business using the system, which may result in substantial costs. Any disruptions or difficulties in implementing or using such a system could adversely affect our controls and harm our business. Moreover, such disruption or difficulties could result in unanticipated costs and diversion of management’s attention. In addition, we may discover additional weaknesses in our system of internal financial and accounting controls and procedures that could result in a material misstatement of our financial statements. Our internal control over financial reporting will not prevent or detect all errors and all fraud. A control system, no matter how well designed and operated, can provide only reasonable, not absolute, assurance that the control system’s objectives will be met. Because of the inherent limitations in all control systems, no evaluation of controls can provide absolute assurance that misstatements due to error or fraud will not occur or that all control issues and instances of fraud will be detected.
If we are not able to comply with the requirements of Section 404 of the Sarbanes-Oxley Act in a timely manner, or if we are unable to maintain proper and effective internal controls, we may not be able to produce timely and accurate financial statements. If we cannot provide reliable financial reports or prevent fraud, our business and results of operations could be harmed, investors could lose confidence in our reported financial information and we could be subject to sanctions or investigations by the NYSE, the SEC or other regulatory authorities.
Our Certificate of Incorporation provides, subject to limited exceptions, that the Court of Chancery of the State of Delaware will be the sole and exclusive forum for certain stockholder litigation matters, which could limit our stockholders’ ability to obtain a chosen judicial forum for disputes with us or our directors, officers, employees or stockholders.
Our Certificate of Incorporation requires to the fullest extent permitted by law, that derivative actions brought in our name, actions against directors, officers and employees for breach of fiduciary duty and other similar actions may be brought in the Court of Chancery in the State of Delaware or, if that court lacks subject matter jurisdiction, another federal or state court situated in the State of Delaware. Any person or entity purchasing or otherwise acquiring any interest in shares of our capital stock shall be deemed to have notice of and consented to the forum provisions in our Certificate of Incorporation. In addition, our Certificate of Incorporation and Bylaws provide that the federal district courts of the United States shall be the exclusive forum for the resolution of any complaint asserting a cause of action under the Securities Act and the Exchange Act.
In March 2020, the Delaware Supreme Court issued a decision in, which found that an exclusive forum provision providing for claims under the Securities Act to be brought in federal court is facially valid under Delaware law. It is unclear whether this decision will be appealed, or what the final outcome of this case will be. We intend to enforce this provision, but we do not know whether courts in other jurisdictions will agree with this decision or enforce it.
Salzburg et al. v. Sciabacucchi
This choice of forum provision may limit a stockholder’s ability to bring a claim in a judicial forum of its choosing for disputes with us or any of our directors, officers, other employees or stockholders, which may discourage lawsuits with respect to such claims. Alternatively, if a court were to find the choice of forum provision contained in our Certificate of Incorporation to be inapplicable or unenforceable in an action, we may incur additional costs associated with resolving such action in other jurisdictions, which could harm its business, operating results and financial condition.
Charter documents and Delaware law could prevent a takeover that stockholders consider favorable and could also reduce the market price of our stock.
Our Certificate of Incorporation and Bylaws contain provisions that could delay or prevent a change in control of Fisker. These provisions could also make it more difficult for stockholders to elect directors and take other corporate actions. These provisions include:
| • | authorizing our Board of Directors to issue preferred stock with voting or other rights or preferences that could discourage a takeover attempt or delay changes in control; |
29
| • | Mr. Fisker and Dr. Gupta hold sufficient voting power to control voting for election of directors and amend our Certificate of Incorporation; |
| • | prohibiting cumulative voting in the election of directors; |
| • | providing that vacancies on our Board of Directors may be filled only by a majority of directors then in office, even though less than a quorum; |
| • | prohibiting the adoption, amendment or repeal of our Bylaws or the repeal of the provisions of our Certificate of Incorporation regarding the election and removal of directors without the required approval of at least two-thirds of the shares entitled to vote at an election of directors; |
| • | prohibiting stockholder action by written consent; |
| • | limiting the persons who may call special meetings of stockholders; and |
| • | requiring advance notification of stockholder nominations and proposals. |
These provisions may frustrate or prevent any attempts by our stockholders to replace or remove our current management by making it more difficult for stockholders to replace members of our Board of Directors, which is responsible for appointing the members of our management. In addition, the provisions of Section 203 of the “DGCL” govern Fisker. These provisions may prohibit large stockholders, in particular those owning 15% or more of our outstanding voting stock, from merging or combining with Fisker for a certain period of time without the consent of its Board of Directors.
These and other provisions in our Certificate of Incorporation and Bylaws and under Delaware law could discourage potential takeover attempts, reduce the price investors might be willing to pay in the future for shares of Class A Common Stock and result in the market price of Class A Common Stock being lower than it would be without these provisions. For more information, see the section of this registration statement captioned “.”
Description of Capital Stock—
Delaware Anti-Takeover Law and Certificate of Incorporation and Bylaw Provisions
Claims for indemnification by our directors and officers may reduce our available funds to satisfy successful third-party claims against us and may reduce the amount of money available to us.
Our Certificate of Incorporation and Bylaws provides that we will indemnify our directors and officers, in each case to the fullest extent permitted by Delaware law.
In addition, as permitted by Section 145 of the DGCL, our Bylaws and our indemnification agreements that we entered into with our directors and officers provide that:
| • | We will indemnify our directors and officers for serving Fisker in those capacities or for serving other business enterprises at our request, to the fullest extent permitted by Delaware law. Delaware law provides that a corporation may indemnify such person if such person acted in good faith and in a manner such person reasonably believed to be in or not opposed to the best interests of the registrant and, with respect to any criminal proceeding, had no reasonable cause to believe such person’s conduct was unlawful; |
| • | We may, in our discretion, indemnify employees and agents in those circumstances where indemnification is permitted by applicable law; |
| • | We will be required to advance expenses, as incurred, to our directors and officers in connection with defending a proceeding, except that such directors or officers shall undertake to repay such advances if it is ultimately determined that such person is not entitled to indemnification; |
30
| • | We will not be obligated pursuant to our Bylaws to indemnify a person with respect to proceedings initiated by that person against Fisker or our other indemnitees, except with respect to proceedings authorized by our Board of Directors or brought to enforce a right to indemnification; |
| • | the rights conferred in our Bylaws are not exclusive, and we are authorized to enter into indemnification agreements with our directors, officers, employees and agents and to obtain insurance to indemnify such persons; and |
| • | We may not retroactively amend our amended and restated bylaw provisions to reduce our indemnification obligations to directors, officers, employees and agents. |
Our management has limited experience in operating a public company.
Our executive officers have limited experience in the management of a publicly traded company. Our management team may not successfully or effectively manage our transition to a public company that will be subject to significant regulatory oversight and reporting obligations under federal securities laws. Their limited experience in dealing with the increasingly complex laws pertaining to public companies could be a significant disadvantage in that it is likely that an increasing amount of their time may be devoted to these activities which will result in less time being devoted to the management and growth of the combined company. We may not have adequate personnel with the appropriate level of knowledge, experience, and training in the accounting policies, practices or internal controls over financial reporting required of public companies in the United States. The development and implementation of the standards and controls necessary for the combined company to achieve the level of accounting standards required of a public company in the United States may require costs greater than expected. It is possible that we will be required to expand our employee base and hire additional employees to support our operations as a public company, which will increase our operating costs in future periods.
The dual class structure of our Common Stock has the effect of concentrating voting control with Henrik Fisker and Dr. Geeta Gupta, our
co-founders,
members of our Board of Directors and Chief Executive Officer and Chief Financial Officer, respectively. This will limit or preclude your ability to influence corporate matters, including the outcome of important transactions, including a change in control.Shares of our Class B Common Stock have 10 votes per share, while shares of our Class A Common Stock have one vote per share. Henrik Fisker and Dr. Geeta Gupta, Fisker’s.”
co-founders,
members of our Board of Directors and Chief Executive Officer and Chief Financial Officer, respectively, hold all of the issued and outstanding shares of our Class B Common Stock. Accordingly, Mr. Fisker and Dr. Gupta will hold approximately 90.8% of the voting power of Fisker’s capital stock on an outstanding basis and will be able to control matters submitted to its stockholders for approval, including the election of directors, amendments of its organizational documents and any merger, consolidation, sale of all or substantially all of our assets or other major corporate transactions. Mr. Fisker and Dr. Gupta may have interests that differ from yours and may vote in a way with which you disagree and which may be adverse to your interests. This concentrated control may have the effect of delaying, preventing or deterring a change in control of Fisker, could deprive its stockholders of an opportunity to receive a premium for their capital stock as part of a sale of Fisker, and might ultimately affect the market price of shares of our Class A Common Stock. For information about our dual class structure, see the section entitled “Description of Capital Stock
Our dual class structure may depress the trading price of our Class A Common Stock.
We cannot predict whether our dual class structure will result in a lower or more volatile market price of our Class A Common Stock or in adverse publicity or other adverse consequences. For example, certain index providers have announced restrictions on including companies with multiple-class share structures in certain of their indexes. S&P Dow Jones and FTSE Russell have announced changes to their eligibility criteria for inclusion of shares of public companies on certain indices, including the S&P 500, pursuant to which companies with multiple classes of shares of common stock are excluded. In addition, several stockholder advisory firms have announced their opposition to the use of multiple class structures. As a result, the dual class structure of our Common Stock
31
may cause stockholder advisory firms to publish negative commentary about our corporate governance practices or otherwise seek to cause Fisker to change our capital structure. Any such exclusion from indices or any actions or publications by stockholder advisory firms critical of our corporate governance practices or capital structure could adversely affect the value and trading market of our Class A Common Stock.
We are a controlled company within the meaning of the NYSE rules, and, as a result, qualify for exemptions from certain corporate governance requirements that provide protection to stockholders of other companies. To the extent we utilize any of these exemptions, you will not have the same protections afforded to stockholders of companies that are subject to such requirements. We do not currently intend to rely on the exemptions afforded to controlled companies at this time.
So long as more than 50% of the voting power for the election of directors of Fisker is held by an individual, a group or another company, we will qualify as a “controlled company” under NYSE rules. Effective as of the completion of the Business Combination, Henrik Fisker and Dr. Geeta Gupta control a majority of the voting power of Fisker’s outstanding capital stock. As a result, we are a “controlled company” under NYSE rules. As a controlled company, we are be exempt from certain NYSE corporate governance requirements, including those that would otherwise require our Board of Directors to have a majority of independent directors and require that we either establish compensation and nominating and corporate governance committees, each comprised entirely of independent directors, or otherwise ensure that the compensation of our executive officers and nominees for directors are determined or recommended to the Board of Directors by the independent members of the Board of Directors. While we do not currently intend to rely on any of these exemptions, we will be entitled to do so for as long as we are considered a “controlled company,” and to the extent we rely on one or more of these exemptions, holders of our capital stock will not have the same protections afforded to stockholders of companies that are subject to all of the NYSE corporate governance requirements.
Henrik Fisker and Dr. Geeta Gupta are married to each other. The separation or divorce of the couple in the future could adversely affect our business.
Henrik Fisker and Dr. Geeta Gupta, Fisker’s
co-founders,
members of the Board of Directors and Chief Executive Officer and Chief Financial Officer, respectively, are married to each other. They are two of our executive officers and are a vital part of our operations. If they were to become separated or divorced or could otherwise not amicably work with each other, one or both of them may decide to cease his or her employment with Fisker or it could negatively impact our working environment. Alternatively, their work performance may not be satisfactory if they become preoccupied with issues relating to their personal situation. In these cases, our business could be materially harmed.Our ability to utilize our net operating loss and tax credit carryforwards to offset future taxable income may be subject to certain limitations.
In general, under Section 382 of the Internal Revenue Code of 1986, as amended (the “Code”), a corporation that undergoes an “ownership change” is subject to limitations on its ability to use its
pre-change
net operating loss carryforwards, or NOLs, to offset future taxable income. The limitations apply if a corporation undergoes an “ownership change,” which is generally defined as a greater than 50 percentage point change (by value) in its equity ownership by certain stockholders over a three-year period. If we have experienced an ownership change at any time since our incorporation, we may already be subject to limitations on our ability to utilize our existing NOLs and other tax attributes to offset taxable income or tax liability. In addition, the Business Combination and future changes in our stock ownership, which may be outside of our control, may trigger an ownership change. Similar provisions of state tax law may also apply to limit our use of accumulated state tax attributes. As a result, even if we earn net taxable income in the future, our ability to use ourpre-change
NOL carryforwards and other tax attributes to offset such taxable income or tax liability may be subject to limitations, which could potentially result in increased future income tax liability to us.32
Changes to applicable U.S. tax laws and regulations may have a material adverse effect on our business, financial condition and results of operations.
New laws and policy relating to taxes may have an adverse effect on our business, financial condition and results of operations. Further, existing tax laws, statutes, rules, regulations or ordinances could be interpreted, changed, modified or applied adversely to us. For example, the U.S. government enacted the Tax Cuts and Jobs Act, or the Tax Act, and certain provisions of the Tax Act may adversely affect us. Changes under the Tax Act include, but are not limited to, a federal corporate income tax rate decrease to 21% for tax years beginning after December 31, 2017, a reduction to the maximum deduction allowed for net operating losses generated in tax years after December 31, 2017 and the elimination of carrybacks of net operating losses. Under the Coronavirus Aid, Relief, and Economic Security Act, or the CARES Act, which modified the Tax Act, U.S. federal net operating loss carryforwards generated in taxable periods beginning after December 31, 2017, may be carried forward indefinitely, but the deductibility of such net operating loss carryforwards in taxable years beginning after December 31, 2020, is limited to 80% of taxable income. The Tax Act is unclear in many respects and could be subject to potential amendments and technical corrections, and is subject to interpretations and implementing regulations by the Treasury and IRS, any of which could mitigate or increase certain adverse effects of the legislation. In addition, it is unclear how these U.S. federal income tax changes will affect state and local taxation. Generally, future changes in applicable U.S. tax laws and regulations, or their interpretation and application could have an adverse effect on our business, financial condition and results of operations.
Our failure to meet the continued listing requirements of the NYSE could result in a delisting of our Class A Common Stock.
If, after listing, we fail to satisfy the continued listing requirements of the NYSE such as the corporate governance requirements or the minimum closing bid price requirement, the NYSE may take steps to delist our Class A Common Stock. Such a delisting would likely have a negative effect on the price of our Class A Common Stock and would impair your ability to sell or purchase our Class A Common Stock when you wish to do so. In the event of a delisting, we can provide no assurance that any action taken by it to restore compliance with listing requirements would allow our Class A Common Stock to become listed again, stabilize the market price or improve the liquidity of our Class A Common Stock, prevent our Class A Common Stock from dropping below the NYSE minimum bid price requirement or prevent future
non-compliance
with NYSE’s listing requirements.If securities or industry analysts do not publish research or reports about our business or publish negative reports about our business, our share price and trading volume could decline.
The trading market for our Class A Common Stock will depend on the research and reports that securities or industry analysts publish about us or our business. Currently, we do not have any analyst coverage and may not obtain analyst coverage in the future. In the event we obtain analyst coverage, we will not have any control over such analysts. If one or more of the analysts who cover Fisker downgrade our shares or change their opinion of our shares, our share price would likely decline. If one or more of these analysts cease coverage of Fisker company or fail to regularly publish reports on Fisker, we could lose visibility in the financial markets, which could cause our share price or trading volume to decline.
33
USE OF PROCEEDS
All of the Class A Common Stock and Warrants offered by the Selling Securityholders pursuant to this prospectus will be sold by the Selling Securityholders for their respective accounts. We will not receive any of the proceeds from these sales.
We will receive up to an aggregate of approximately $261.5 million from the exercise of the Warrants, assuming the exercise in full of all of the Warrants for cash. We expect to use the net proceeds from the exercise of the Warrants for general corporate purposes. We will have broad discretion over the use of proceeds from the exercise of the Warrants. There is no assurance that the holders of the Warrants will elect to exercise any or all of such Warrants. To the extent that the Warrants are exercised on a “cashless basis,” the amount of cash we would receive from the exercise of the Warrants will decrease.
DETERMINATION OF OFFERING PRICE
The offering price of the shares of Class A Common Stock underlying the Private Warrants offered hereby is determined by reference to the exercise price of the Warrants of $11.50 per share. The Public Warrants are listed on the NYSE under the symbol “FSR WS.” Only the shares underlying the Magna Warrants are being registered for resale and the Magna Warrants may not be transferred other than in accordance with the provisions set forth therein.
We cannot currently determine the price or prices at which shares of our Class A Common Stock or Warrants may be sold by the Selling Securityholders under this prospectus.
MARKET INFORMATION FOR CLASS A COMMON STOCK AND DIVIDEND POLICY
Market Information
Our Class A Common Stock and Public Warrants are currently listed on the NYSE under the symbols “FSR” and “FSR WS,” respectively. Prior to the consummation of the Business Combination, our Class A Common Stock and our Public Warrants were listed on the NYSE under the symbols “SPAQ” and “SPAQ WS,” respectively. As of November 2, 2020 following the completion of the Business Combination, there were 161 holders of record of our Class A Common Stock and 2 holders of record of our Warrants. We currently do not intend to list the Private Warrants offered hereby on any stock exchange or stock market. Our Class B Common Stock is not registered and we do not currently intend to list the Class B Common Stock on any exchange or stock market.
Dividend Policy
We have not paid any cash dividends on our Class A Common Stock to date. We may retain future earnings, if any, for future operations, expansion and debt repayment and has no current plans to pay cash dividends for the foreseeable future. Any decision to declare and pay dividends in the future will be made at the discretion of the Board and will depend on, among other things, our results of operations, financial condition, cash requirements, contractual restrictions and other factors that the Board may deem relevant. In addition, our ability to pay dividends may be limited by covenants of any existing and future outstanding indebtedness we or our subsidiaries incur. We do not anticipate declaring any cash dividends to holders of the Class A Common Stock in the foreseeable future.
Securities Authorized for Issuance under Equity Compensation Plans
As of September 30, 2020, we did not have any securities authorized for issuance under equity compensation plans. In connection with the Business Combination, our stockholders approved the Fisker Inc. 2020 Equity Incentive Plan (the “2020 Plan”) and the Fisker Inc. 2020 Employee Stock Purchase Plan (the “2020 ESPP”).
We intend to file one or more registration statements on
Form S-8
under the Securities Act to register the shares of Class A Common Stock issued or issuable under the 2020 Plan, the 2020 ESPP and the assumed options to purchase outstanding shares of Legacy Fisker Class A common stock, whether or not exercisable and whether or not34
vested, immediately prior to the consummation of the Business Combination under the Legacy Fisker 2016 Stock Plan (the “Legacy Fisker Options”). Any such
Form S-8
registration statement will become effective automatically upon filing. We expect that the initial registration statement onForm S-8
will cover shares of Class A Common Stock underlying the 2020 Plan, the 2020 ESPP and the assumed Legacy Fisker Options. Once these shares are registered, they can be sold in the public market upon issuance, subject to applicable restrictions.35
SELECTED HISTORICAL CONSOLIDATED FINANCIAL AND OPERATING DATA OF FISKER
The selected historical condensed consolidated statements of operations data of Legacy Fisker for the nine months ended September 30, 2020 and 2019 and the condensed consolidated balance sheet data as of September 30, 2020 are derived from Legacy Fisker’s unaudited interim condensed consolidated financial statements included elsewhere in this prospectus. The selected historical consolidated statements of operations data of Legacy Fisker for the years ended December 31, 2019 and 2018 and the historical consolidated balance sheet data as of December 31, 2019 and 2018 are derived from Legacy Fisker’s audited consolidated financial statements included elsewhere in this prospectus. In Legacy Fisker management’s opinion, the unaudited interim condensed consolidated financial statements include all adjustments necessary to state fairly Legacy Fisker��s financial position as of September 30, 2020 and the results of operations for the nine months ended September 30, 2020 and 2019. Legacy Fisker’s historical results are not necessarily indicative of the results that may be expected in the future and Legacy Fisker’s results for the nine months ended September 30, 2020 are not necessarily indicative of the results that may be expected for the full year ending December 31, 2020 or any other period. You should read the following selected historical consolidated financial data together with “Management’s Discussion and Analysis of Financial Condition and Results of Operations of Legacy Fisker” and Legacy Fisker’s consolidated financial statements and related notes included elsewhere in this prospectus.
The financial information contained in this section relates to Legacy Fisker, prior to and without giving pro forma effect to the impact of the Business Combination and, as a result, the results reflected in this section may not be indicative of our results going forward. See the section entitled “” included elsewhere in this prospectus.
Unaudited Pro Forma Condensed Combined Financial Information
Statement of Operations Data | For The Nine months Ended September 30, 2020 | For The Nine months Ended September 30, 2019 | For The Year Ended December 31, 2019 | For The Year Ended December 31, 2018 | ||||||||||||
| (in actual dollars and shares) | ||||||||||||||||
Revenue | $ | — | $ | — | $ | — | $ | — | ||||||||
General and administrative | 8,055,515 | 2,882,451 | 3,625,833 | 1,475,613 | ||||||||||||
Research and development | 3,962,711 | 4,942,532 | 6,961,981 | 1,938,871 | ||||||||||||
Loss from operations | (12,018,226 | ) | (7,824,983 | ) | (10,587,814 | ) | (3,414,484 | ) | ||||||||
Other income (expense): | ||||||||||||||||
Other income (expense) | 15,000 | — | 575 | (21,000 | ) | |||||||||||
Interest income | 13,460 | 7,088 | 8,503 | 7,427 | ||||||||||||
Interest expense | (1,326,370 | ) | (19,728 | ) | (177,997 | ) | (1,590 | ) | ||||||||
Change in fair value of embedded derivative | (405,567 | ) | (8,904 | ) | (79,751 | ) | — | |||||||||
Change in fair value of convertible equity security | (29,003,494 | ) | — | — | — | |||||||||||
Foreign currency gain (loss) | 121,695 | (15,340 | ) | (42,266 | ) | (1,298 | ) | |||||||||
Net Loss | $ | (42,603,502 | ) | $ | (7,861,867 | ) | $ | (10,878,750 | ) | $ | (3,430,945 | ) | ||||
Deemed dividend attributable to preferred stock | — | — | — | (1,222,368 | ) | |||||||||||
Net loss attributable to common shareholders | $ | (42,603,502 | ) | $ | (7,861,867 | ) | $ | (10,878,750 | ) | $ | (4,653,313 | ) | ||||
Weighted average shares outstanding of Class A common stock | 94,754 | 51,837 | 57,139 | 20,040 | ||||||||||||
Weighted average shares outstanding of Class B common stock | 38,727,340 | 38,727,340 | 38,727,340 | 38,727,340 | ||||||||||||
Net loss per share attributable to Class A and Class B Common shareholders- Basic and Diluted | $ | (1.10 | ) | $ | (0.20 | ) | $ | (0.28 | ) | $ | (0.12 | ) | ||||
Balance Sheet Data | September 30, 2020 | December 31, 2019 | December 31, 2018 | |||||||||
Total assets | $ | 47,948,757 | $ | 2,076,427 | $ | 5,651,302 | ||||||
Total liabilities | 96,257,899 | 8,198,823 | 987,749 | |||||||||
Total temporary equity | 11,020,683 | 11,020,683 | 11,020,683 | |||||||||
Total stockholders’ deficit | (59,329,825 | ) | (17,143,079 | ) | (6,357,130 | ) | ||||||
36
SELECTED HISTORICAL FINANCIAL INFORMATION OF SPARTAN
The selected historical condensed statements of operations data of Spartan for the nine months ended September 30, 2020 and 2019 and the condensed balance sheet data as of September 30, 2020 are derived from Spartan’s unaudited interim condensed financial statements included elsewhere in this prospectus. The selected historical statements of operations data of Spartan for the years ended December 31, 2019 and 2018 and the historical balance sheet data as of December 31, 2019 and 2018 are derived from Spartan’s audited financial statements included elsewhere in this prospectus. In Spartan management’s opinion, the unaudited interim condensed financial statements include all adjustments necessary to state fairly Spartan’s financial position as of September 30, 2020 and the results of operations for the nine months ended September 30, 2020 and 2019.
Spartan’s historical results are not necessarily indicative of the results that may be expected in the future and Spartan’s results for the nine months ended September 30, 2020 are not necessarily indicative of the results that may be expected for the full year ending December 31, 2020 or any other period. The information below is only a summary and should be read in conjunction with the financial statements and the notes and schedules related thereto, which are included elsewhere in this prospectus. In connection with the Business Combination, Legacy Fisker was determined to be the accounting acquirer.
Statement of Operations Data | For the Nine months Ended September 30, 2020 | For the Nine months Ended September 30, 2019 | For the Year ended December 31, 2019 | For the Year ended December 31, 2018 | ||||||||||||
| (in actual dollars and shares) | ||||||||||||||||
Revenue | $ | — | $ | — | $ | — | $ | — | ||||||||
Expenses | ||||||||||||||||
Administrative fee—related party | 90,000 | 90,000 | 120,000 | 40,000 | ||||||||||||
General and administrative expenses | 4,248,250 | 1,021,755 | 1,132,661 | 811,091 | ||||||||||||
Other Income | ||||||||||||||||
Investment income from Trust Account | 4,554,058 | 9,927,002 | 12,654,638 | 4,375,763 | ||||||||||||
Interest income | 2,387 | 19,400 | 22,557 | 6,947 | ||||||||||||
Income tax provision | (924,823 | ) | (2,053,257 | ) | (2,615,474 | ) | (878,369 | ) | ||||||||
Net income (loss) | $ | (706,628 | ) | $ | 6,781,390 | $ | 8,809,060 | $ | 2,653,250 | |||||||
Weighted average shares outstanding of Class A common stock | 55,198,449 | 55,200,000 | 55,200,000 | 55,200,000 | ||||||||||||
Basic and diluted net income per share, Class A | $ | 0.06 | $ | 0.14 | $ | 0.18 | $ | 0.06 | ||||||||
Weighted average shares outstanding of Class B common stock | 13,800,000 | 13,800,000 | 13,800,000 | 13,800,000 | ||||||||||||
Basic and diluted net loss per share, Class B | $ | (0.31 | ) | $ | (0.07 | ) | $ | (0.07 | ) | $ | (0.05 | ) | ||||
Balance Sheet Data | September 30, 2020 | December 31, 2019 | December 31, 2018 | |||||||||
Total assets | $ | 569,245,438 | $ | 565,975,181 | $ | 557,475,687 | ||||||
Total liabilities | 23,689,808 | 19,636,001 | 19,945,567 | |||||||||
Value of Class A Common Stock that may be redeemed in connection with an initial business combination | 540,555,620 | 541,339,170 | 532,530,110 | |||||||||
Total stockholders’ equity | 5,000,010 | 5,000,010 | 5,000,010 | |||||||||
37
UNAUDITED PRO FORMA CONDENSED COMBINED FINANCIAL INFORMATION
Defined terms included below have the same meaning as terms defined and included elsewhere in this prospectus. Unless the context otherwise requires, the “Company” refers to Fisker Inc. and its subsidiaries after the Closing, and Spartan Energy Acquisition Corp. prior to the Closing.
Introduction
The Company is providing the following unaudited pro forma condensed combined financial information to aid you in your analysis of the financial aspects of Legacy Fisker becoming a wholly-owned subsidiary of Spartan Energy Acquisition Corp. (“Spartan”) as a result of Spartan’s wholly-owned subsidiary, Merger Sub, merging with and into Legacy Fisker, and Legacy Fisker surviving the merger (the “Merger Transaction”). Subsequent to the transaction, Spartan was renamed Fisker Inc. (the “Business Combination”). The following unaudited pro forma condensed combined financial information has been prepared in accordance with Article 11 of Regulation
S-X.
The unaudited pro forma condensed combined balance sheet as of September 30, 2020 combines the historical balance sheet of Spartan and the historical balance sheet of Legacy Fisker on a pro forma basis as if the Business Combination and related transactions, summarized below, had been consummated on September 30, 2020. The unaudited pro forma condensed combined statements of operations for the year ended December 31, 2019 and the nine months ended September 30, 2020 combine the historical statements of operations of Spartan and Legacy Fisker for such periods on a pro forma basis as if the Business Combination and related transactions, summarized below, had been consummated on January 1, 2019, the beginning of the earliest period presented:
| • | the merger of Merger Sub with and into Legacy Fisker, with Fisker surviving the merger as a wholly-owned subsidiary of Spartan; |
| • | the net proceeds of $482.5 million ($500.0 million gross proceeds less $17.5 million in fees) from the issuance and sale of 50,000,000 shares of Class A Common Stock at $10.00 per share in the PIPE Financing; |
| • | the issuance and conversion of all of Legacy Fisker convertible equity securities (the “Legacy Fisker Convertible Equity Securities”) and Legacy Fisker convertible notes into Class A Common Stock; and |
| • | the conversion of all outstanding Legacy Fisker shares and Legacy Fisker stock options into Class A Common Stock totaling 179.2 million shares. |
The pro forma condensed combined financial information may not be useful in predicting the future financial condition and results of operations of the post-combination company. The actual financial position and results of operations may differ significantly from the pro forma amounts reflected herein due to a variety of factors.
The historical financial information of Spartan was derived from the unaudited and audited financial statements of Spartan as of and for the nine months ended September 30, 2020, and for the year ended December 31, 2019, which are included elsewhere in this prospectus. The historical financial information of Fisker was derived from the unaudited and audited consolidated financial statements of Fisker as of and for the nine months ended September 30, 2020, which are included in this prospectus and for the year ended December 31, 2019, which are included elsewhere in this prospectus. This information should be read together with Spartan’s and Fisker’s unaudited and audited financial statements and related notes, and the section set forth in this prospectus entitled “” and other financial information which is included in this prospectus for the nine months ended September 30, 2020 and incorporated by reference for the year ended December 31, 2019 .
Management’s Discussion and Analysis of Financial Condition and Results of Operations of Fisker
The Business Combination was accounted for as a reverse recapitalization, in accordance with GAAP. Under this method of accounting, Spartan was treated as the “acquired” company for financial reporting purposes. Accordingly, the Business Combination was treated as the equivalent of Legacy Fisker issuing stock for the net assets of Spartan, accompanied by a recapitalization, whereby no goodwill or other intangible assets was recorded. Operations prior to the Business Combination are those of Legacy Fisker.
38
Legacy Fisker was determined to be the accounting acquirer based on evaluation of the following facts and circumstances:
| • | Fisker stockholders have the largest voting interest in the post-combination company; |
| • | The Class B Common Stock issued to two Fisker stockholders allows for incremental voting rights; |
| • | The Board of Directors of the post-combination company has seven members, and Legacy Fisker has the ability to nominate the majority of the members of the Board of Directors; |
| • | Fisker management holds executive management roles for the post-combination company and is responsible for the day-to-day |
| • | The post-combination company assumed the Fisker name; and |
| • | The intended strategy of the post-combination entity will continue Fisker’s current strategy of being a leader in the electric vehicle industry. |
Description of the Business Combination
The aggregate consideration for the Business Combination was $1.8 billion, paid in the form of shares of Common Stock.
The following summarizes the consideration:
(in thousands, except for share and per share amounts) | ||||
Shares transferred at Closing | 179,192,713 | |||
Value per share(1) | 10.00 | |||
Total Share Consideration | $ | 1,791,927 | ||
| (1) | Share Consideration is calculated using a $10.00 reference price. The closing share price on the date of the consummation of the Merger Transaction was $8.96. As the Merger Transaction was accounted for as a reverse recapitalization, the value per share is disclosed for informational purposes only in order to indicate the fair value of shares transferred. |
Holders of Legacy Fisker Class A Common Stock and Legacy Fisker Class B Common Stock received shares of Class A Common Stock and Class B Common Stock, respectively, in an amount determined by application of the Exchange Ratio except for the purchaser of the Legacy Fisker Convertible Equity Security. The purchaser of the Legacy Fisker Convertible Equity Security received a number of shares as defined in the Convertible Equity Security Purchase Agreement, dated July 7, 2020. The following summarizes the pro forma Common Stock shares at Closing:
New Fisker Shares | % | |||||||
Fisker Stockholders—Class A Common Stock | 39,594,965 | 12.6 | % | |||||
Convertible Equity Security shares | 5,882,352 | 1.9 | % | |||||
Convertible Note shares | 1,361,268 | 0.4 | % | |||||
Fisker total—Class A | 46,838,585 | 14.9 | % | |||||
Fisker Stockholders—Class B Common Stock | 132,354,128 | 42.0 | % | |||||
Total Fisker Merger Shares | 179,192,713 | 56.9 | % | |||||
Magna Warrant Shares (1) | 19,474,454 | 6.1 | % | |||||
Spartan public shares | 53,188,245 | 16.9 | % | |||||
Founder Shares | 13,358,824 | 4.2 | % | |||||
PIPE Financing | 50,000,000 | 15.9 | % | |||||
Pro Forma Common Stock at Closing | 315,214,236 | 100.0 | % | |||||
39
| (1) | The shares underlying the Magna Warrants do not represent legally issued and outstanding shares of the Class A Common Stock and are not exercisable immediately upon the Closing (and were issued following the Closing). The Magna Warrants vest upon achievement of certain production milestones as specified in the Cooperation Agreement entered into by Legacy Fisker and Magna, the holder of the Magna Warrants, dated October 15, 2020, and thus are not directly attributable to the Business Combination. As such, the shares underlying these warrants are excluded in the calculation of pro forma basic loss per share. |
The following unaudited pro forma condensed combined balance sheet as of September 30, 2020 and the unaudited pro forma condensed combined statements of operations for the nine months ended September 30, 2020 and the year ended December 31, 2019 are based on the historical financial statements of Spartan and Legacy Fisker. The unaudited pro forma adjustments are based on information currently available, and assumptions and estimates underlying the unaudited pro forma adjustments are described in the accompanying notes. Actual results may differ materially from the assumptions used to present the accompanying unaudited pro forma condensed combined financial information.
40
UNAUDITED PRO FORMA CONDENSED COMBINED BALANCE SHEET
AS OF SEPTEMBER 30, 2020
(in thousands)
As of September 30, 2020 | As of September 30, 2020 | |||||||||||||||||||||||
Fisker (Historical) | Spartan (Historical) | Reclassification Adjustments (Note 2) | Pro Forma Adjustments | Pro Forma Combined | ||||||||||||||||||||
ASSETS | ||||||||||||||||||||||||
Current assets: | ||||||||||||||||||||||||
Cash and cash equivalents | $ 44,976 | $ 165 | $ — | $ 569,041 | A | $1,018,649 | ||||||||||||||||||
500,000 | B | |||||||||||||||||||||||
(19,320) | C | |||||||||||||||||||||||
(55,499) | D | |||||||||||||||||||||||
(50) | E | |||||||||||||||||||||||
(20,664) | M | |||||||||||||||||||||||
Prepaid expenses | — | 39 | (39) | — | — | |||||||||||||||||||
Prepaid expenses and other current assets | 2,676 | — | 39 | (1,913) | D | 802 | ||||||||||||||||||
Total current assets | 47,652 | 204 | — | 971,595 | 1,019,451 | |||||||||||||||||||
Non-current assets: | ||||||||||||||||||||||||
Cash and investments held in Trust Account | — | 569,041 | — | (569,041) | A | — | ||||||||||||||||||
Property and equipment, net | 263 | — | — | — | 263 | |||||||||||||||||||
Right-of-use | 34 | — | — | — | 34 | |||||||||||||||||||
Total non-current assets | 297 | 569,041 | — | (569,041) | 297 | |||||||||||||||||||
TOTAL ASSETS | 47,949 | 569,245 | — | 402,554 | 1,019,748 | |||||||||||||||||||
LIABILITIES, TEMPORARY EQUITY AND STOCKHOLDERS’ EQUITY (DEFICIT) | ||||||||||||||||||||||||
Accounts payable | 676 | — | 2,722 | (2,672) | D | 676 | ||||||||||||||||||
(50) | E | |||||||||||||||||||||||
Accrued expenses | 2,678 | — | 262 | (1,242) | D | 1,422 | ||||||||||||||||||
(276) | F | |||||||||||||||||||||||
Accounts payable and accrued expenses | — | 2,722 | (2,722) | — | — | |||||||||||||||||||
Accrued income and franchise taxes | — | 262 | (262) | — | — | |||||||||||||||||||
Advances from related parties | — | 1,385 | (1,385) | D | — | |||||||||||||||||||
Convertible Security | 79,003 | — | — | (79,003) | L | — | ||||||||||||||||||
Bridge notes payable | 10,927 | — | — | (10,927) | F | — | ||||||||||||||||||
Lease liabilities | 36 | — | — | — | 36 | |||||||||||||||||||
Total current liabilities | 93,320 | 4,369 | — | (95,555) | 2,134 | |||||||||||||||||||
Non-current liabilities: | ||||||||||||||||||||||||
Customer deposits | 2,940 | — | — | — | 2,940 | |||||||||||||||||||
Deferred underwriting commissions | — | 19,320 | — | (19,320) | C | — | ||||||||||||||||||
Total non-current liabilities | 2,940 | 19,320 | — | (19,320) | 2,940 | |||||||||||||||||||
Total liabilities | 96,260 | 23,689 | — | (114,875) | 5,074 | |||||||||||||||||||
COMMITMENTS AND CONTINGENCIES | ||||||||||||||||||||||||
Temporary equity: | ||||||||||||||||||||||||
Series A Convertible Preferred stock | 4,634 | — | — | (4,634) | H | — | ||||||||||||||||||
Series B Convertible Preferred stock | 6,386 | — | — | (6,386) | H | — | ||||||||||||||||||
Common stock subject to possible redemption | — | 540,556 | — | (540,556) | G | — | ||||||||||||||||||
Stockholders’ equity (deficit): | ||||||||||||||||||||||||
Founders Convertible Preferred stock | — | — | — | — | — | |||||||||||||||||||
Class A Common stock | — | — | — | 5 | B | 16 | ||||||||||||||||||
— | F | |||||||||||||||||||||||
5 | G | |||||||||||||||||||||||
4 | H | |||||||||||||||||||||||
1 | I | |||||||||||||||||||||||
1 | L | |||||||||||||||||||||||
— | M | |||||||||||||||||||||||
Class B Common stock | — | 1 | — | (1) | I | 13 | ||||||||||||||||||
| 13 | J | |||||||||||||||||||||||
Additional paid-in capital | 1,173 | 4,146 | — | 499,995 | B | 1,107,849 | ||||||||||||||||||
| (19,413 | ) | D | ||||||||||||||||||||||
| 11,203 | F | |||||||||||||||||||||||
| 540,551 | G | |||||||||||||||||||||||
| 11,016 | H | |||||||||||||||||||||||
| (13 | ) | J | ||||||||||||||||||||||
| 853 | K | |||||||||||||||||||||||
| 79,002 | L | |||||||||||||||||||||||
| (20,664 | ) | M | ||||||||||||||||||||||
Retained earnings | — | 853 | (853 | ) | — | — | ||||||||||||||||||
Accumulated deficit | (60,504 | ) | — | 853 | (32,700 | ) | D | (93,204 | ) | |||||||||||||||
| (853 | ) | K | ||||||||||||||||||||||
Total stockholders’ equity (deficit) | (59,331 | ) | 5,000 | — | 1,069,005 | 1,014,674 | ||||||||||||||||||
TOTAL LIABILITIES, TEMPORARY EQUITY AND STOCKHOLDERS’ DEFICIT | 47,949 | 569,245 | — | 402,554 | 1,019,748 | |||||||||||||||||||
41
UNAUDITED PRO FORMA CONDENSED COMBINED STATEMENT OF OPERATIONS
FOR THE NINE MONTHS ENDED SEPTEMBER 30, 2020
(in thousands, except share and per share data)
For the Nine Months Ended September 30, 2020 | For the Nine Months Ended September 30, 2020 | |||||||||||||||||||
Fisker (Historical) | Spartan (Historical) | Pro Forma Adjustments | Pro Forma Combined | |||||||||||||||||
Revenue: | ||||||||||||||||||||
Revenue | $ | — | $ | — | $ | — | $ | — | ||||||||||||
Operating costs and expenses: | ||||||||||||||||||||
Administrative fee - related party | — | 90 | — | 90 | ||||||||||||||||
General and administrative | 8,056 | 4,248 | (4,067 | ) | AA | 8,237 | ||||||||||||||
Research and development | 3,963 | — | — | 3,963 | ||||||||||||||||
Total operating costs and expenses | 12,019 | 4,338 | (4,067 | ) | 12,290 | |||||||||||||||
Loss from operations | (12,019 | ) | (4,338 | ) | 4,067 | (12,290 | ) | |||||||||||||
Other income (expense): | ||||||||||||||||||||
Other income (expense) | 15 | — | 15 | |||||||||||||||||
Interest income | 13 | 2 | — | 15 | ||||||||||||||||
Interest expense | (1,326 | ) | — | 1,326 | BB | — | ||||||||||||||
Change in fair value of embedded derivative | (406 | ) | — | 406 | CC | — | ||||||||||||||
Change in fair value of Convertible Security | (29,003 | ) | — | 29,003 | DD | — | ||||||||||||||
Foreign currency gain | 122 | — | — | 122 | ||||||||||||||||
Other income - Interest income on Trust Account | — | 4,554 | (4,554 | ) | EE | — | ||||||||||||||
Total other income (expense) | (30,585 | ) | 4,556 | 26,181 | 152 | |||||||||||||||
Net income (loss) before income tax provision | (42,604 | ) | 218 | 30,248 | (12,138 | ) | ||||||||||||||
Income tax provision | — | 925 | (925 | ) | FF | — | ||||||||||||||
Net income (loss) | (42,604 | ) | (707 | ) | 31,173 | (12,138 | ) | |||||||||||||
Weighted average Common shares outstanding - Class A | 94,754 | 55,198,449 | 163,385,654 | |||||||||||||||||
Basic and diluted net income (loss) per share - Class A | $ | (1.10 | ) | $ | 0.06 | $ | (0.04 | ) | ||||||||||||
Weighted average Common shares outstanding - Class B | 38,727,340 | 13,800,000 | 132,354,128 | |||||||||||||||||
Basic and diluted net income (loss) per share - Class B | $ | (1.10 | ) | $ | (0.31 | ) | $ | (0.04 | ) | |||||||||||
42
UNAUDITED PRO FORMA CONDENSED COMBINED STATEMENT OF OPERATIONS
FOR YEAR ENDED DECEMBER 31, 2019
(in thousands, except share and per share data)
For the Year ended December 31, 2019 | For the Year ended December 31, 2019 | |||||||||||||||||||
Fisker (Historical) | Spartan (Historical) | Pro Forma Adjustments | Pro Forma Combined | |||||||||||||||||
Revenue: | ||||||||||||||||||||
Revenue | $ | — | $ | — | $ | — | $ | — | ||||||||||||
Operating costs and expenses: | ||||||||||||||||||||
Administrative fee - related party | — | 120 | — | 120 | ||||||||||||||||
General and administrative | 3,626 | 1,133 | — | 4,759 | ||||||||||||||||
Research and development | 6,962 | — | — | 6,962 | ||||||||||||||||
Total operating costs and expenses | 10,588 | 1,253 | — | 11,841 | ||||||||||||||||
Loss from operations | (10,588 | ) | (1,253 | ) | — | (11,841 | ) | |||||||||||||
Other income (expense): | ||||||||||||||||||||
Other income (expense) | 1 | — | — | 1 | ||||||||||||||||
Interest income | 9 | 23 | — | 32 | ||||||||||||||||
Interest expense | (178 | ) | — | 178 | BB | — | ||||||||||||||
Change in fair value of embedded derivative | (80 | ) | — | 80 | CC | — | ||||||||||||||
Foreign currency gain (loss) | (42 | ) | — | — | (42 | ) | ||||||||||||||
Other income - Interest income on Trust Account | — | 12,655 | (12,655 | ) | EE | — | ||||||||||||||
Total other income (expense) | (290 | ) | 12,678 | (12,397 | ) | (9 | ) | |||||||||||||
Net income (loss) before income tax provision | (10,878 | ) | 11,425 | (12,397 | ) | (11,850 | ) | |||||||||||||
Income tax provision | — | 2,615 | (2,615 | ) | FF | — | ||||||||||||||
Net income (loss) | (10,878 | ) | 8,810 | (9,782 | ) | (11,850 | ) | |||||||||||||
Weighted average Common shares outstanding - Class A | 57,139 | 55,200,000 | 163,385,654 | |||||||||||||||||
Basic and diluted net income (loss) per share - Class A | $ | (0.28 | ) | $ | 0.18 | $ | (0.04 | ) | ||||||||||||
Weighted average Common shares outstanding - Class B | 38,727,340 | 13,800,000 | 132,354,128 | |||||||||||||||||
Basic and diluted net income (loss) per share - Class B | $ | (0.28 | ) | $ | (0.07 | ) | $ | (0.04 | ) | |||||||||||
43
NOTES TO UNAUDITED PRO FORMA CONDENSED COMBINED FINANCIAL INFORMATION
1. Basis of Presentation
The Business Combination was accounted for as a reverse recapitalization in accordance with GAAP. Under this method of accounting, Spartan was treated as the “acquired” company for financial reporting purposes. Accordingly, the Business Combination was treated as the equivalent of Legacy Fisker issuing stock for the net assets of Spartan, accompanied by a recapitalization, whereby no goodwill or other intangible assets was recorded. Operations prior to the Business Combination are those of Legacy Fisker.
The unaudited pro forma condensed combined balance sheet as of September 30, 2020 assumes that the Business Combination occurred on September 30, 2020. The unaudited pro forma condensed combined statements of operations for the nine months ended September 30, 2020 and the year ended December 31, 2019 present pro forma effect to the Business Combination as if it had been completed on January 1, 2019.
The unaudited pro forma condensed combined balance sheet as of September 30, 2020 has been prepared using, and should be read in conjunction with, the following:
| • | Spartan’s unaudited condensed balance sheet as of September 30, 2020 and the related notes for the period ended September 30, 2020, incorporated by reference; and |
| • | Legacy Fisker’s unaudited condensed consolidated balance sheet as of September 30, 2020 and the related notes for the period ended September 30, 2020, contained elsewhere herein. |
The unaudited pro forma condensed combined statement of operations for the nine months ended September 30, 2020 has been prepared using, and should be read in conjunction with, the following:
| • | Spartan’s unaudited condensed statement of operations for the nine months ended September 30, 2020 and the related notes, incorporated by reference; and |
| • | Legacy Fisker’s unaudited condensed consolidated statement of operations for the Nine months ended September 30, 2020 and the related notes, contained elsewhere herein. |
The unaudited pro forma condensed combined statement of operations for the year ended December 31, 2019 has been prepared using, and should be read in conjunction with, the following:
| • | Spartan’s audited statement of operations for the year ended December 31, 2019 and the related notes, incorporated by reference; and |
| • | Fisker’s audited consolidated statement of operations for the year ended December 31, 2019 and the related notes, incorporated by reference. |
Management has made significant estimates and assumptions in its determination of the pro forma adjustments. As the unaudited pro forma condensed combined financial information has been prepared based on these preliminary estimates, the final amounts recorded may differ materially from the information presented.
The unaudited pro forma condensed combined financial information does not give effect to any anticipated synergies, operating efficiencies, tax savings, or cost savings that may be associated with the Business Combination.
The pro forma adjustments reflecting the consummation of the Business Combination are based on certain currently available information and certain assumptions and methodologies that the Company believes are reasonable under the circumstances. The unaudited condensed pro forma adjustments, which are described in the accompanying notes, may be revised as additional information becomes available and is evaluated.
Therefore, it is likely that the actual adjustments will differ from the pro forma adjustments and it is possible the difference may be material. The Company believes that its assumptions and methodologies provide a reasonable basis for presenting all of the significant effects of the Business Combination based on information available to management at this time and that the pro forma adjustments give appropriate effect to those assumptions and are properly applied in the unaudited pro forma condensed combined financial information.
44
The unaudited pro forma condensed combined financial information is not necessarily indicative of what the actual results of operations and financial position would have been had the Business Combination taken place on the dates indicated, nor are they indicative of the future consolidated results of operations or financial position of the post-combination company. They should be read in conjunction with the historical financial statements and notes thereto of Spartan and Legacy Fisker.
2. Accounting Policies
Upon consummation of the Business Combination, management will perform a comprehensive review of the two entities’ accounting policies. As a result of the review, management may identify differences between the accounting policies of the two entities which, when conformed, could have a material impact on the financial statements of the post-combination company. Based on its initial analysis, management had identified differences that would have an impact on the unaudited pro forma condensed combined financial information and recorded the necessary adjustments.
3. Adjustments to Unaudited Pro Forma Condensed Combined Financial Information
The unaudited pro forma condensed combined financial information has been prepared to illustrate the effect of the Business Combination and has been prepared for informational purposes only.
The historical financial statements have been adjusted in the unaudited pro forma condensed combined financial information to give pro forma effect to events that are (1) directly attributable to the Business Combination, (2) factually supportable, and (3) with respect to the statements of operations, expected to have a continuing impact on the results of the post-combination company. Legacy Fisker and Spartan have not had any historical relationship prior to the Business Combination. Accordingly, no pro forma adjustments were required to eliminate activities between the companies.
The pro forma combined provision for income taxes does not necessarily reflect the amounts that would have resulted had the post-combination company filed consolidated income tax returns during the periods presented.
The pro forma basic and diluted earnings per share amounts presented in the unaudited pro forma condensed combined statements of operations are based upon the number of the post-combination company’s shares outstanding, assuming the Business Combination occurred on January 1, 2019.
Adjustments to Unaudited Pro Forma Condensed Combined Balance Sheet
The adjustments included in the unaudited pro forma condensed combined balance sheet as of September 30, 2020 are as follows:
| (A) | Reflects the reclassification of $569.0 million of cash and cash equivalents held in the Trust Account at the balance sheet date that becomes available to fund expenses in connection with the Business Combination or future cash needs of the Company. |
| (B) | Represents the gross proceeds from the private placement of 50,000,000 shares of Class A Common Stock at $10.00 per share pursuant to the PIPE Financing. |
| (C) | Reflects the payment of $19.3 million of deferred underwriters’ fees. The fees were paid at the Closing out of the trust account. |
| (D) | Represents transaction costs totaling $56.2 million, consisting of approximately $19.4 million of equity issuance costs. Classification of transaction costs is as follows: |
45
| (in thousands) | Amount | |||
Costs related to issuance of equity | ||||
Amounts previously capitalized and paid | 671 | |||
Amounts previously capitalized and not paid | 1,242 | |||
Amounts incurred as part of the Business Combination (1) | 17,500 | |||
Subtotal | 19,413 | |||
Transaction expenses | ||||
Amounts previously incurred and paid | 10 | |||
Amounts previously incurred but not paid | 4,057 | |||
Amounts incurred as part of the Business Combination | 32,700 | |||
Subtotal | 36,767 | |||
Grand Total | 56,180 | |||
| (1) | Includes estimated fees of $17.5 million related to the issuance of the PIPE payable by the Company. |
| (E) | Reflects the settlement of Spartan’s historical liabilities that were settled prior to the consummation of the Business Combination and thus will not be part of the Company after the Closing. |
| (F) | Represents the conversion of the Fisker Convertible Notes upon a business combination, causing a conversion of the outstanding principal amount and any unpaid accrued interest into equity securities (Legacy Fisker did not utilize the election to convert directly into proceeds paid to the holders of Legacy Fisker’s Class A Common Stock in connection with the Business Combination). The Fisker Convertible Notes were issued from July 2019 to July 2020 and converted at the Closing. |
| (G) | Reflects the reclassification of approximately $540.6 million of Class A Common Stock subject to possible redemption to permanent equity. |
| (H) | Represents recapitalization of Legacy Fisker equity and issuance of 39.9 million of the post-combination company’s Class A Common Stock to Fisker equity holders as consideration for the reverse recapitalization. |
| (I) | Reflects the conversion of Spartan’s Class B Common Stock held by the initial stockholders to Class A Common Stock. Pursuant to the terms of the Company’s seconded amended and restated certificate of incorporation, all shares of Class B Common Stock outstanding prior to the Effective Time were converted into shares of Class A Common Stock at the Closing. All of the shares of Class B Common Stock converted into shares of Class A Common Stock are no longer outstanding and have ceased to exist, and each holder of such Class B Common Stock has ceased to have any rights with respect to such securities. |
| (J) | Reflects the issuance of 132.0 million shares of Class B Common Stock to Henrik Fisker and Dr. Geeta Gupta in exchange for their shares of Fisker Class B Common Stock. |
| (K) | Reflects the reclassification of Spartan’s historical retained earnings. |
| (L) | Reflects the conversion of the Fisker Convertible Security upon the Closing. Upon the Closing, the mandatory conversion feature upon a business combination was triggered, causing a conversion of the outstanding principal amount of the Fisker Convertible Security into equity securities at a specified price. The Fisker Convertible Security was outstanding from July 2020 through the Closing. |
| (M) | Reflects actual redemptions of 2,004,297 public shares at the Closing for aggregate redemption payments of approximately $20.6 million allocated to Class A Common Stock and additional paid-in capital using par value $0.0001 per share and at a redemption price of $10.31 per share. |
46
Adjustments to Unaudited Pro Forma Condensed Combined Statements of Operations
The pro forma adjustments included in the unaudited pro forma condensed combined statements of operations for the Nine months ended September 30, 2020 and year ended December 31, 2019 are as follows:
| (AA) | Elimination of non-recurring transaction expenses incurred in connect with the Business Combination. |
| (BB) | Elimination of interest expense from the Fisker Convertible Notes that converted upon the Closing. |
| (CC) | Elimination of the change in fair value of the embedded derivative liability in the Fisker Convertible Notes that converted upon the Closing. |
| (DD) | Elimination of the change in fair value of the Fisker Convertible Security that converted upon the Closing. |
| (EE) | Elimination of investment income on the Trust Account. |
| (FF) | Reflects elimination of income tax expense as a result of elimination of the trust account income (noted in footnote EE). |
4. Loss per Share
Represents the net loss per share calculated using the historical weighted average shares outstanding, and the issuance of additional shares in connection with the Business Combination, assuming the shares were outstanding since January 1, 2019. As the Business Combination and related equity transactions are being reflected as if they had occurred at the beginning of the periods presented, the calculation of weighted average shares outstanding for basic and diluted net income (loss) per share assumes that the shares issuable relating to the Business Combination have been outstanding for the entire periods presented. Holders of Fisker Class A Common Stock and Fisker Class B Common Stock received shares of Class A Common Stock and Class B Common Stock, respectively, in an amount determined by application of the Exchange Ratio except for the purchaser of the Legacy Fisker Convertible Equity Security. The purchaser of the Legacy Fisker Convertible Equity Security received a number of shares as defined in the Convertible Equity Security Purchase Agreement, dated July 7, 2020.
The unaudited pro forma condensed combined financial information has been prepared for the nine months ended September 30, 2020 and for the year ended December 31, 2019:
For the Nine Months Ended September 30, 2020 | For the Year ended December 31, 2019 | |||||||
Pro forma net loss | (12,138 | ) | (11,850 | ) | ||||
Weighted average shares outstanding of Class A Common Stock(1) | 163,385,654 | 163,385,654 | ||||||
Net loss per share (Basic and Diluted) attributable to Class A Common Stockholders (1)(2) | $ | (0.04 | ) | $ | (0.04 | ) | ||
Weighted average shares outstanding of Class B Common Stock | 132,354,128 | 132,354,128 | ||||||
Net loss per share (Basic and Diluted) attributable to Class B Common Stockholders (2) | $ | (0.04 | ) | $ | (0.04 | ) | ||
| (1) | Excludes approximately 19,474,454 shares of Class A Common Stock underlying the Magna Warrants issued on October 29, 2020 that are included as part of the capitalization table. The shares underlying the Magna Warrants will not represent legally issued and outstanding shares of Class A Common Stock and are not exercisable upon the Closing (and were issued following the Closing). The Magna Warrants vest upon achievement of certain production milestones as specified in the Cooperation Agreement entered into by Legacy Fisker and Magna, the holder of the Magna Warrants, dated October 15, 2020, and thus are not directly attributable to the Business Combination. As such, the shares underlying these warrants will be excluded in the calculation of pro forma basic loss per share. |
| (2) | For the purposes of calculating diluted earnings per share, it was assumed that all outstanding warrants sold in the IPO and the private placement are exchanged to Class A common stock. However, since this results in anti-dilution, the effect of such exchange was not included in calculation of diluted loss per share. |
47
COMPARATIVE SHARE INFORMATION
The following table sets forth summary historical comparative share information for Spartan and Legacy Fisker and unaudited pro forma condensed combined per share information after giving effect to the Business Combination.
The pro forma book value information reflects the business combination as if it had occurred on September 30, 2020. The weighted average shares outstanding and net earnings per share information reflect the business combination as if it had occurred on January 1, 2019.
This information is only a summary and should be read in conjunction with the historical financial statements of Spartan and Legacy Fisker and related notes included elsewhere herein. The unaudited pro forma combined per share information of Spartan and Legacy Fisker is derived from, and should be read in conjunction with, the unaudited pro forma condensed combined financial statements and related notes included elsewhere herein.
The unaudited pro forma combined earnings (loss) per share information below does not purport to represent the earnings (loss) per share which would have occurred had the companies been combined during the periods presented, nor earnings per share for any future date or period. The unaudited pro forma combined book value per share information below does not purport to represent what the value of Spartan and Legacy Fisker would have been had the companies been combined during the periods presented.
Fisker (Historical) | Spartan (Historical) | Combined Pro Forma | ||||||||||
As of and for the Nine Months ended September 30, 2020 | ||||||||||||
Book Value per share (1) | $ | (1.53 | ) | $ | 0.07 | $ | 3.43 | |||||
Weighted average shares outstanding of Class A common stock—basic and diluted | 94,754 | 55,198,449 | 163,385,654 | |||||||||
Weighted average shares outstanding of Class B common stock—basic and diluted | 38,727,340 | 13,800,000 | 132,354,128 | |||||||||
Net income (loss) per share of Class A common stock—basic and diluted | $ | (1.10 | ) | $ | 0.06 | $ | (0.04 | ) | ||||
Net loss per share of Class B common stock—basic and diluted | $ | (1.10 | ) | $ | (0.31 | ) | $ | (0.04 | ) | |||
As of and for the Year ended December 31, 2019 | ||||||||||||
Weighted average shares outstanding of Class A common stock—basic and diluted | 57,139 | 55,200,000 | 163,385,654 | |||||||||
Weighted average shares outstanding of Class B common stock—basic and diluted | 38,727,340 | 13,800,000 | 132,354,128 | |||||||||
Net income (loss) per share of Class A common stock—basic and diluted | $ | (0.28 | ) | $ | 0.18 | $ | (0.04 | ) | ||||
Net loss per share of Class B common stock—basic and diluted | $ | (0.28 | ) | $ | (0.07 | ) | $ | (0.04 | ) | |||
| (1) | Book value per share = (Total equity excluding preferred shares)/shares outstanding. The components of book value per share calculation are as follow (in thousands except per share data): |
Fisker (Historical) | Spartan (Historical) | Pro Forma Combined | ||||||||||
Total Equity (excluding preferred shares) | (59,331 | ) | 5,000 | 1,014,674 | ||||||||
Total Shares Outstanding —Class A and B | 38,822,094 | 68,998,449 | 295,739,782 | |||||||||
48
CAPITALIZATION
The following table sets forth the cash and capitalization of Spartan and Legacy Fisker on an unaudited, historical basis as of September 30, 2020.
Please refer to the historical financial statements of Spartan and Fisker and the related notes included elsewhere in this prospectus, as well as the section entitled “.”
Unaudited Pro Forma Condensed Combined Financial Information
September 30, 2020 | ||||||||||||
Historical | Pro Forma Combined | |||||||||||
(in thousands) | Spartan | Fisker | ||||||||||
Cash and cash equivalents | $ | 165 | $ | 44,976 | $ | 1,018,649 | ||||||
Investment held in Trust Account | $ | 569,041 | $ | — | $ | — | ||||||
Debt | ||||||||||||
Total Debt | $ | — | $ | 10,927 | $ | — | ||||||
Commitments: | ||||||||||||
Common Stock subject to possible redemption | 540,556 | — | — | |||||||||
Redeemable convertible preferred stock | — | 11,020 | — | |||||||||
Convertible equity security | — | 79,003 | — | |||||||||
Equity: | ||||||||||||
Preferred Stock | — | — | — | |||||||||
Class A Common Stock | — | — | 16 | |||||||||
Class B Common Stock | 1 | — | 13 | |||||||||
Additional paid-in capital | 4,146 | 1,173 | 1,107,849 | |||||||||
Retained earnings (accumulated deficit) | 853 | (60,504 | ) | (93,204 | ) | |||||||
Total stockholders’ equity (deficit) | 5,000 | (59,331 | ) | 1,014,674 | ||||||||
Total capitalization | $ | 545,556 | $ | 41,619 | $ | 1,014,674 | ||||||
49
MANAGEMENT’S DISCUSSION AND ANALYSIS OF FINANCIAL CONDITION AND RESULTS OF OPERATIONS OF FISKER
The following discussion and analysis provides information that Fisker’s management believes is relevant to an assessment and understanding of Fisker’s consolidated results of operations and financial condition. The discussion should be read together with “Selected Historical Consolidated Financial and Operating Data of Fisker” and the historical audited annual consolidated financial statements as of and for the years ended December 31, 2019 and 2018 and unaudited interim condensed consolidated financial statements as of September 30, 2020 and the nine-month periods ended September 30, 2020 and 2019, and the related respective notes thereto, included elsewhere in this prospectus. The discussion and analysis should also be read together with Fisker’s unaudited pro forma financial information for the year ended December 31, 2019 and the nine months ended September 30, 2020. See the section entitled “Unaudited Pro Forma Condensed Combined Financial Information.” This discussion may contain forward-looking statements based upon current expectations that involve risks and uncertainties. Fisker’s actual results may differ materially from those anticipated in these forward-looking statements as a result of various factors, including those set forth under “Risk Factors” elsewhere in this prospectus. Unless the context otherwise requires, references in this “Management’s Discussion and Analysis of Financial Condition and Results of Operations of Fisker” to “Fisker” and “the Company” refer to the business and operations of Legacy Fisker and its consolidated subsidiaries prior to the Business Combination and to Fisker and its consolidated subsidiaries, following the consummation of the Business Combination.
Overview
Fisker is building a technology-enabled, asset-light automotive business model that it believes will be among the first of its kind and aligned with the future state of the automotive industry. This involves a focus on vehicle development, customer experience, sales and service to change the personal mobility experience through technological innovation, ease of use and flexibility. The Company combines the legendary design and engineering expertise of Henrik Fisker — the visionary behind the iconic BMW Z8 sports car and the famed Aston Martin DB9 and V8 Vantage — to develop high quality electric vehicles with strong emotional appeal by engaging the consumer’s senses through the overall experience of Fisker vehicles. Central to Fisker’s business model is the Fisker Flexible Platform Agnostic
Design (“FF-PAD”),
a proprietary process that allows the development and design of a vehicle to be adapted to any given electric vehicle (“EV”) platform in the specific segment size. The process focuses on selecting industry leading vehicle specifications and adapting the design to crucial hard points on a third-party supplied EV platform and outsourced manufacturing to reduce development cost and time to market. Fisker believes it is well-positioned through its global premium EV brand, its renowned design capabilities and sustainability focus.The Fisker Ocean is targeting a large and rapidly expanding “premium with volume” segment (meaning a premium automaker producing more than 100,000 units of a single model such as the BMW 3 Series or Tesla Model 3) of the electric SUV market. Fisker expects to begin production of the Ocean as early as the fourth quarter of 2022 and, through November 1, 2020, the Company has received over 9,100 paid reservations for the Ocean, including a fleet order of 300 cars placed by Viggo HQ ApS, a Danish ride-hailing company that provides 100% of their services via zero-emission vehicles (“Viggo”). The Fisker Ocean, a five-passenger vehicle with potentiallydriving capabilities, will be differentiated in the marketplace by its innovative and timeless design and
a 250- to
over 300-mile range
and state-of-the-art autonomous
a re-imagined customer
experience delivered through an advanced software-based user interface. The Fisker Ocean is designed for a high degree of sustainability, using recycledrubber, eco-suede interior
trim made from recycled polyester, and carpeting from fishing nets and plastic bottles recycled from ocean waste, among many other sustainable features. The optional features for the Ocean, including California Mode (patent pending), a solar photovoltaic roof and augmentedreality “Head-up” display,
resulted in the Fisker Ocean prototype being the most awarded new automobile at CES 2020 by Time, Newsweek, Business Insider, CNET and others.50
Fisker believes its innovative business model,will revolutionize how consumers view personal transportation and car ownership. Over time, Fisker plans to combine a customer-focused experience with flexible leasing options, affordable monthly payments and no fixed lease terms. Through an innovative platform sharing partnership strategy, Fisker believes that it will be able to significantly reduce the capital intensity typically associated with developing and manufacturing vehicles, while maintaining flexibility and optionality in component sourcing and manufacturing due tostrategy with bothdealer networks. Fisker believes that this customer-focused approach will drive revenue, user satisfaction and higher margins than competitors.
including “E-Mobility-as-a-Service” (“EMaaS”),
Fisker’s FF-PAD proprietary
process. ThroughFisker’s FF-PAD proprietary
process, Fisker will partner with one or more industry-leading original equipment manufacturers (“OEMs”)and/or tier-one automotive
suppliers for platform sharing and access to procurement networks, while focusing on key differentiators in innovative design, software and user interface. Fisker envisions ago-to-market
web-
andapp-based
digital sales, loan financing approvals, leasing, and service management, with limited reliance on traditionalbrick-and-mortar
“sales-and-service”
The Business Combination
Fisker entered into a business combination agreement and plan of reorganization (the “Business Combination Agreement”) with Spartan Energy Acquisition Corp. (“Spartan”) on July 10, 2020. Pursuant to the Business Combination Agreement, and assuming a favorable vote of Spartan’s stockholders, Spartan Merger Sub Inc. (“Merger Sub”), a newly formed subsidiary of Spartan, will be merged with and into Fisker (the “Business Combination”). Upon consummation of the Business Combination, the separate corporate existence of Merger Sub shall cease, Fisker will survive and become a wholly-owned subsidiary of Spartan (“Fisker”).
The Business Combination is anticipated to be accounted for as a reverse recapitalization. Fisker will be deemed the accounting predecessor and the combined entity will be the successor SEC registrant, meaning that Fisker’s financial statements for previous periods will be disclosed in the registrant’s future periodic reports filed with the SEC. Under this method of accounting, Spartan will be treated as the acquired company for financial statement reporting purposes. The most significant change in the successor’s future reported financial position and results are expected to be an estimated net increase in cash (as compared to Fisker’s consolidated balance sheet at September 30, 2020) of $974 million, after stockholder redemptions, and including $500 million in gross proceeds from the private investment in public equity (“PIPE”) by Spartan. Total transaction costs are estimated at approximately $79 million. See “.” In addition, immediately prior to the effective time of the Business Combination, Fisker caused the outstanding principal and accrued but unpaid interest due on its outstanding convertible notes, which amounted to approximately $10.9 million, and convertible equity security totaling $79 million, adjusted for changes in fair value, as of September 30, 2020, to be automatically converted into a number of shares of Fisker’s Class A Common Stock, and such converted convertible notes are no longer outstanding and ceased to exist at the effective time of the Business Combination. See “.”
Unaudited Pro Forma Condensed Combined Financial Information
Management
’
s Discussion and Analysis of Financial Condition and Results of Operations of Fisker—Liquidity and Capital Resources—Debt
As a result of the Business Combination, Fisker is the successor to
an SEC-registered and
New York Stock Exchange-listed company, which requires Fisker to hire additional personnel and implement procedures and processes to address public company regulatory requirements and customary practices. Fisker expects to incur additional annual expenses as a public company for, among other things, directors’ and officers’ liability insurance, director fees, internal audit function, and additional internal and external accounting, legal, and administrative resources, including increased personnel costs, audit and other professional service fees. While we expect to incur significant general and administrative expenses, Fisker will closely monitor its expenditures and take actions designed to improve our processes and manage our cash effectively to facilitate scalability for the design and manufacturing teams.51
Key Trends, Opportunities and Uncertainties
Fisker is,” which is incorporated herein by reference.
a pre-revenue company
and believes that its future performance and success depends to a substantial extent on the ability to capitalize on the following opportunities, which in turn is subject to significant risks and challenges, including those discussed below and in the section of the prospectus titled “Risk Factors
Partnering with Industry-Leading OEMs
and/or Tier-One Automotive
SuppliersOn October 14, 2020, Fisker and Spartan entered into a Cooperation Agreement with Magna International Inc. (“Magna”) setting forth certain terms for the development of a full electric vehicle (the “Cooperation Agreement”). The Cooperation Agreement sets out the main terms and conditions of the upcoming operational phase agreements (the “Operational Phase Agreements”) that will extend from the Cooperation Agreement and other agreements with Magna (or its affiliates) that are expected to be entered into by and between Fisker and Magna (or its affiliates). The upcoming Operational Phase Agreements referenced in the Cooperation Agreement relate to various platform and manufacturing agreements.
Fisker is currently in negotiations with Magna and several other industry-leading OEMs
and tier-one automotive
suppliers for platform sharing, component sourcing and manufacturing. This allows Fisker to focus on vehicle design, strong brand affiliation and a differentiated customer experience. Fisker intends to leverage one or more EV platforms to accelerate its time to market, reduce vehicle development costs and gain access to an established global supply chain of batteries and other components.Fisker believes that its business model will reduce the considerable execution risk typically associated with new car companies. Through such platform sharing, component sourcing and manufacturing partnerships, Fisker believes it will be able to accelerate its time to market and reduce vehicle development costs. Fisker intends to meet timing, cost and quality expectations while optimally matching its cost structure with its projected production ramp by leveraging such partnerships and trained workforces. Remaining hardware agnostic allows for selection of partners, components, and manufacturing decisions to be based on both timeline and cost advantages and enables Fisker to focus on delivering truly innovative design features, a superior customer experience, and a leading user interface that leverages sophisticated software and other technology advancements.
Fisker continues to negotiate a potential relationship with several other industry-leading OEMs” for more information. Unanticipated events, delays in negotiations by third parties and any required changes in Fisker’s current business plans could materially and adversely affect its business, margins and cash flows.
and tier-one automotive
suppliers. Fisker intends to enter into agreements covering supply, engineering services (including tooling), and vehicle assembly, among other matters. Further, while Fisker has entered into the Collaboration Agreement with Magna, Fisker is strongly incentivized to promptly conclude negotiations with Magna and other OEM’s andtier-one
automotive suppliers to meet its commercialization timeline. If Fisker is unable to enter into definitive operational agreements with Magna or other OEM’s agreements or if Fisker is only able to do so on terms that are unfavorable to it, there is no assurance that commercialization will occur within the anticipated timeframe or at costs consistent with production plans. Extended negotiation of the specific project-related agreements, the sourcing of components or labor at higher than anticipated cost, or any delays in sourcing suppliers of sustainable parts may delay Fisker’s commercialization plans or require it to change the anticipated pricing of its vehicles. Such delays could be caused by a variety of factors, some of which may be out of Fisker’s control. For example, the outbreak ofthe COVID-19 pandemic
has severely restricted international travel, which may make it more difficult for Fisker to conclude agreements with partners outside the United States. See the section entitled “Risk Factors—
We face risks related to health epidemics, including the recent
COVID-19
pandemic, which could have a material adverse effect on our business and results of operations,
Market Trends and Competition
Fisker anticipates robust demand for the Fisker Ocean, based on its award-winning design, its unique sustainability features, the management team’s experience
and know-how and,
in particular, the growing acceptance of and demand for EVs as a substitute for gasoline-fueled vehicles. According to Bloomberg’s Electric Vehicle Outlook 2020, the global EV fleet is expected to increase at an estimated cumulative annual growth rate of approximately 26%, from52
less than 20 million vehicles in 2020 to more than 120 million by 2030, driven by worldwide governmental and private initiatives for growth. The EV market is highly competitive and Fisker believes the market will be broken down into three primary consumer segments: the white space segment, the value segment, and the conservative premium segment. See the section entitled “Business—Sales – Go to Market Strategy” for more information. Fisker expects to sell approximately 50% of its vehicles within the white space segment, appealing to customers who want to be part of the new EV movement and value sustainability and environmental, social, and governance (“ESG”) initiatives. Fisker believes that it will be well positioned to be the primary alternative to Tesla in this segment with the Ocean priced around the base price of the Model 3 and Model Y. While Fisker will compete with other EV startups, many of them are moving into the higher luxury priced segments due to the lack of volume pricing of components that Fisker expects to obtain through platform sharing partnerships with industry-leading OEMs and/or tier-one automotive suppliers. To expand market share and attract customers from competitors, Fisker must continue to innovate and convert successful research and development efforts into differentiated products, including new EV models.
Fisker is also working to quantify the sustainability advancements and claims that the Fisker brand would produce the most sustainable vehicles in the world, which it believes will be an increasingly important differentiator among a growing subset of consumers. In Fisker’s pursuit of these objectives, it will be in competition with substantially larger and better capitalized vehicle manufacturers. While Fisker believes that thecommercialization, provides the Company with an advantage relative to traditional and other established auto manufacturers, Fisker’s better capitalized competitors may seek to undercut the pricing or compete directly with Fisker’s designs by replicating their features. In addition, while Fisker believes that its strong management team forms the necessary backbone to execute on its strategy, the Company expects to compete for talent, as Fisker’s future growth will depend on hiring qualified and experienced personnel to operate all aspects of the business as it prepares to launch commercial operations.
low-capital-intensity
platform sharing partnership strategy, together withdirect-to-customer
Commercialization
Fisker currently anticipates commencing production of the Fisker Ocean in the fourth quarter of 2022, with initial customer deliveries in late 2022 at the earliest. Production commencement is dependent upon Fisker entering into definitive platform sharing agreements with one or more industry-leading OEMs
and/or tier-one automotive
suppliers. Failure to enter into these agreements timely could result in being unable to begin production in the timeframe anticipated. Through November 1, 2020, Fisker has received over 9,100 paid reservations, including a fleet order of 300 cars placed by Viggo, and over 40,000 indications of interest through the Flexee app (meaning the Flexee App has been downloaded and the potential purchaser has provided a contact phone number), reflecting the significant public interest in the Fisker Ocean.Fisker plans to initially market its vehicles throughmodel, leveraging its proprietary Flexee app, which will serve as
its direct-to-consumer sales
a one-stop-shop for
all components of its EMaaS business model. Over time, Fisker plans to develop Fisker Experience Centers in select cities in North America and Europe, which will enable prospective customers to experience Fisker vehicles through test drives and virtual and augmented reality. Fisker also intends to enter, in each launch market, into third-party service partnerships with credible vehicle service organizations with established service facilities, operations and technicians. These companies’ services will be integrated into and booked via the Flexee app in order to create ahassle-free, app-based service
experience for Fisker’s customers delivered at home, at work, or witha pick-up and
delivery service booked online. For North America, as an example, Fisker has entered intoa non-exclusive Memorandum
of Understanding with Manheim related to fleet management services. Fisker will continue to seek opportunities to build the service partnership model.Over time, Fisker aims to transform the EV sales model through the flexible lease model, under which customers will be able to utilize a vehicle onat an anticipated cost of $379 per month for the base model, with the ability to terminate the lease or upgrade their vehicle at any time. Development of a fleet of high value, sustainable EVs will allow Fisker to offer these flexible lease options to capture more customers. Fisker intends to requireof $3,000 under the flexible lease model, which the Company believes will reduce its cash flow risk and incentivize customers to keep their vehicles for a period of time. Assuming an eight-year expected vehicle life, Fisker anticipates that, over time, it will acquire a substantial fleet of used EVs available for sale or further flexible lease by Fisker, which it believes will enhance its ability to maintain its premium brand and pricing.
a month-to-month basis
a non-refundable up-front payment
53
Fisker believes itsmodel reflects today’s changing consumer preferences and is less capital intensive and expensive than the traditional automotive sales models. Fisker’s commercialization strategy is, however, relatively novel for the car industry, which has historically relied on extensive advertising and marketing, as well as relationships with physical car dealership networks. Should Fisker’s assumptions about the commercialization of its vehicles prove overly optimistic or if the Company is unable to develop, obtain or maintain themarketing or service technology upon which its prospective customer base would rely, Fisker may incur delays to its ability to commercialize the Fisker Ocean. This may also lead Fisker to make changes in its commercialization plans, which could result in unanticipated marketing delays or cost overruns, which could in turn adversely impact margins and cash flows or require Fisker to change its pricing. Further, to the extent that Fisker doesn’t generate the margins it expects upon commercialization of the Fisker Ocean, Fisker may be required to raise additional debt or equity capital, which may not be available or may only be available on terms that are onerous to Fisker and its stockholders.
digital, direct-to-consumer sales
direct-to-consumer
Regulatory Landscape
Fisker operates in an industry that is subject to and benefits from environmental regulations, which have generally become more stringent over time, particularly across developed markets. Regulations in Fisker’s target markets include economic incentives to purchasers of EVs, tax credits for EV manufacturers, and economic penalties that may apply to a car manufacturer based on its fleet-wide emissions ratings. See the section entitled “Business—Government Regulation and Credits” for more information. For example, a federal tax credit of $7,500 may be available to U.S. purchasers of Fisker vehicles, which would bring the effective estimated purchase price of the base Fisker Ocean model to approximately $30,000. Further, the registration and sale of Zero Emission Vehicles (“ZEVs”) in California will earn Fisker ZEV credits, which it may be able to sell to other OEMs
or tier-one automotive
suppliers seeking to access the state’s market. Several other U.S. states have adopted similar standards. In the European Union, where European car manufacturers are penalized for excessive fleet-wide emissions on the one hand and incentivized to produce low emission vehicles on the other, Fisker believes it will have the opportunity to monetize the ZEV technology through fleet emissions pooling arrangements with car manufacturers that may not otherwise meet their CO2 emissions targets. While Fisker expects environmental regulations to provide a tailwind to its growth, it is possible for certain regulations to result in margin pressures. For example, regulations that effectively impose EV production quotas on auto manufacturers may lead to an oversupply of EVs, which in turn could promote price decreases. As a pure play EV company, Fisker’s margins could be particularly and adversely impacted by such regulatory developments. Trade restrictions and tariffs, while historically minimal between the European Union and the United States where most of Fisker’s production and sales are expected, are subject to unknown and unpredictable change that could impact Fisker’s ability to meet projected sales or margins.Basis of Presentation
Fisker currently conducts its business through one operating segment. As
a pre-revenue company
with no commercial operations, Fisker’s activities to date have been limited and were conducted primarily in the United States and its historical results are reported under U.S. GAAP and in U.S. dollars. Upon commencement of commercial operations, Fisker expects to expand its global operations substantially, including in the USA and the European Union, and as a result Fisker expects its future results to be sensitive to foreign currency transaction and translation risks and other financial risks that are not reflected in its historical financial statements. As a result, Fisker expects that the financial results it reports for periods after it begins commercial operations will not be comparable to the financial results included in this prospectus.Components of Results of Operations
Fisker is an early stage company and its historical results may not be indicative of its future results for reasons that may be difficult to anticipate. Accordingly, the drivers of Fisker’s future financial results, as well as the components of such results, may not be comparable to Fisker’s historical or projected results of operations.
54
Revenues
Fisker has not begun commercial operations and currently does not generate any revenue. Once Fisker commences production and commercialization of its vehicles, it expects that the significant majority of its revenue will be initially derived from direct sales of Fisker Ocean SUVs and, subsequently, from flexible leases of its vehicles.
Cost of Goods Sold
To date, Fisker has not recorded cost of goods sold, as it has not recorded commercial revenue. Once Fisker commences the commercial production and sale of its vehicles, it expects cost of goods sold to include mainly vehicle components and parts, including batteries, direct labor costs, amortized tooling costs, and reserves for estimated warranty expenses.
General and Administrative Expense
General and administrative expenses consist mainly of personnel-related expenses for Fisker’s executive and other administrative functions and expenses for outside professional services, including legal, accounting and other advisory services.
Fisker is rapidly expanding its personnel headcount, in anticipation of ramping up for commercial operations and becoming a public company upon the consummation of the Business Combination. Accordingly, in addition to
the non-recurring transaction
costs discussed above, Fisker expects its general and administrative expenses to increase significantly in the near term and for the foreseeable future. Upon commencement of commercial operations, Fisker also expects general and administrative expenses to include facilities, marketing and advertising costs.Research and Development Expense
To date, Fisker’s research and development expenses have consisted primarily of external engineering services in connection with the design of the Fisker Ocean model and development of the first prototype. As Fisker ramps up for commercial operations, it anticipates that research and development expenses will increase for the foreseeable future as the Company expands its hiring of engineers and designers and continues to invest in new vehicle model design and development of technology.
Income Tax Expense / Benefit
Fisker’s income tax provision consists of an estimate for U.S. federal and state income taxes based on enacted rates, as adjusted for allowable credits, deductions, uncertain tax positions, changes in deferred tax assets and liabilities, and changes in the tax law. Fisker maintains a valuation allowance against the recognized amount of its U.S. and state net deferred tax assets because Fisker believes the recoverability of the tax assets is not more likely than not.
Results of Operations
Comparison of the Nine Months Ended September 30, 2020 to the Nine Months Ended September 30, 2019
The following table sets forth Fisker’s historical operating results for the periods indicated:
Nine Months Ended September 30, | ||||||||||||||||
2020 | 2019 | $ Change | % Change | |||||||||||||
(dollar amounts in thousands) | ||||||||||||||||
Operating costs and expenses: | ||||||||||||||||
General and administrative | $ | 8,056 | $ | 2,882 | $ | 5,174 | 179.5 | % | ||||||||
Research and development | 3,963 | 4,943 | (980 | ) | (19.8 | )% | ||||||||||
Total operating costs and expenses | 12,019 | 7,825 | 4,194 | 53.6 | % | |||||||||||
Loss from operations | (12,019 | ) | (7,825 | ) | (4,194 | ) | 53.6 | % | ||||||||
55
Nine Months Ended September 30, | ||||||||||||||||
2020 | 2019 | $ Change | % Change | |||||||||||||
(dollar amounts in thousands) | ||||||||||||||||
Other income (expense): | ||||||||||||||||
Other income | 15 | — | 15 | n.m. | ||||||||||||
Interest income | 13 | 7 | 6 | n.m. | ||||||||||||
Interest expense | (1,326 | ) | (20 | ) | (1,306 | ) | n.m. | |||||||||
Change in fair value of embedded derivatives | (406 | ) | (9 | ) | (397 | ) | n.m. | |||||||||
Change in fair value of convertible equity security | (29,003 | ) | — | (29,003 | ) | n.m. | ||||||||||
Foreign currency gain (loss) | 122 | (15 | ) | 137 | n.m. | |||||||||||
Total other income (expense) | (30,585 | ) | (37 | ) | (30,548 | ) | n.m. | |||||||||
Net loss | $ | (42,604 | ) | $ | (7,862 | ) | $ | (34,742 | ) | 441.9 | % | |||||
n.m. = not meaningful.
General and Administrative
General and administrative expenses increased by $5.2 million or 179.5% from $2.9 million in the first nine months of 2019 to $8.1 million in the first nine months of 2020, primarily due a $4.2 million increase in professional fees, mainly success fees related to the issuance of our convertible equity security in July 2020.
Research and Development
Research and development expenses decreased by $0.9 million or 19.8% from $4.9 million through the first nine months of 2019 to $4.0 million through the first nine months of 2020. The decrease primarily reflected lower outside engineering costs due to IDG’s development of the demonstrator vehicle, which reduced expense by $1.8 million through the first nine months of 2020. Fisker’s arrangement with IDG terminated in September 2020 and, as a result, Fisker does not anticipate future reductions in research and development expenses.
Other Income
Other income increased by a nominal amount in the first nine months of 2020 from nil in the first nine months of 2019.
Interest Income
Interest income increased a nominal amount from the first nine months of 2019 to the first nine months of 2020.
Interest Expense
Interest expense was $1.3 million through the first nine months of 2020 and nominal in the first nine months of 2019, reflecting the issuance of convertible bridge notes, starting in the second half of 2019 through the first nine months of 2020.
Change in Fair Value of Embedded Derivatives
The change in fair value of embedded derivatives amounted to $0.4 million in the first nine months of 2020 compared to a nominal amount in the same nine-month period of 2019, reflecting the change in value of the embedded derivative relating to Fisker’s convertible bridge notes.
Change in Fair Value of Convertible Equity Security
The change in fair value of the convertible equity security, which was issued in July 2020, amounted to $29.0 million in the first nine months of 2020, reflecting the change in value of Class A Common Stock to be issued to the holder of the convertible equity security in the event of the consummation of the Business Combination.
56
Foreign Currency Gain (Loss)
Fisker recorded a foreign currency gain of $0.1 million in the first nine months of 2020 as compared to a nominal loss in the first nine months of 2019.
Net Loss
Net loss was $42.6 million in the first nine months of 2020, an increase of $34.7 million or 441.9% from $7.9 million in the first nine months of 2019, for the reasons discussed above.
Comparison of the Fiscal Year Ended December 31, 2019 to the Fiscal Year Ended December 31, 2018
The following table sets forth Fisker’s historical operating results for the periods indicated:
Years Ended December 31, | ||||||||||||||||
2019 | 2018 | $ Change | % Change | |||||||||||||
(dollar amounts in thousands) | ||||||||||||||||
Operating costs and expenses: | ||||||||||||||||
General and administrative | $ | 3,626 | $ | 1,476 | $ | 2,150 | 145.7 | % | ||||||||
Research and development | 6,962 | 1,939 | 5,023 | 259.1 | % | |||||||||||
Total operating costs and expenses | 10,588 | 3,415 | 7,173 | 210.0 | % | |||||||||||
Loss from operations | (10,588 | ) | (3,415 | ) | (7,173 | ) | 210.0 | % | ||||||||
Other income (expense): | ||||||||||||||||
Other income (expense) | 1 | (21 | ) | 22 | n.m. | |||||||||||
Interest income | 9 | 7 | 2 | 28.6 | % | |||||||||||
Interest expense | (178 | ) | (2 | ) | (176 | ) | n.m. | |||||||||
Change in fair value of embedded derivatives | (80 | ) | — | (80 | ) | n.m. | ||||||||||
Foreign currency loss | (42 | ) | (1 | ) | (41 | ) | n.m. | |||||||||
Total other expense | (290 | ) | (17 | ) | (273 | ) | n.m. | |||||||||
Net loss | (10,878 | ) | (3,432 | ) | (7,446 | ) | 217.0 | % | ||||||||
Deemed dividend attributable to preferred stock | — | (1,222 | ) | 1,222 | 100.0 | % | ||||||||||
Net loss attributable to common stockholders | $ | (10,878 | ) | $ | (4,654 | ) | $ | (6,224 | ) | 133.7 | % | |||||
n.m. = not meaningful.
General and Administrative
General and administrative expenses increased by $2.1 million or 145.7% from $1.5 million in 2018 to $3.6 million in the 2019, reflecting an increase in legal expenses of approximately $1.7 million due to general professional legal services and litigation expense and
a one-time charge
of $0.8 million for the settlement of a legal matter in the 2019 period.Research and Development
Research and development expenses increased by approximately $5.0 million or 259.1% from $1.9 million in 2018 to $7.0 million in 2019, reflecting mainly
a ramp-up in
external engineering consulting in connection with the Fisker Ocean prototype design of approximately $4.4 million and an increase of internal research and development personal costs of approximately $0.6 million.Other Income (Expense)
Other income (expense) increased from a nominal expense position in 2018 to a nominal income position in 2019.
57
Interest Income
Interest income increased a nominal amount from fiscal year 2018 to fiscal year 2019.
Interest Expense
Interest expense increased from nearly nil in 2018 to $0.2 million in 2019, reflecting the issuance of convertible bridge notes, as discussed above.
Change in Fair Value of Embedded Derivatives
The change in fair value of embedded derivatives was $0.1 million in 2019 (compared to nil in 2018), reflecting the change in value of the embedded derivative relating to Fisker’s convertible bridge notes.
Foreign Currency Loss
Foreign currency loss increased a nominal amount from fiscal year 2018 to fiscal year 2019.
Net Loss
Net loss was $10.9 million in 2019, an increase of $7.5 million from $3.4 million in 2018, for the reasons discussed above.
In 2018, Fisker also recorded a deemed dividend attributable to preferred stock in the amount of $1.2 million, resulting in net loss attributable to common stockholders of $4.7 million in that year. Fisker did not have a comparable impact in 2019.
Liquidity and Capital Resources
As of the date of this prospectus, Fisker has yet to generate any revenue from its business operations. To date, Fisker has funded its capital expenditure and working capital requirements through equity and debt capital, as further discussed below. Fisker’s ability to successfully commence commercial operations and expand its business will depend on many factors, including its working capital needs, the availability of equity or debt financing and, over time, its ability to generate cash flows from operations.
As of September 30, 2020, Fisker’s cash and cash equivalents amounted to $45.0 million and its long-term debt amounted to $10.9 million. On a pro forma basis, upon stockholder approval and consummation of the Business Combination, Fisker’s cash and cash equivalents amount to approximately $1,018 million at September 30, 2020, after redemptions by Spartan stockholders.
Fisker expects its capital expenditures and working capital requirements to increase substantially in the near future, as it seeks to produce the Fisker Ocean EV model, develop its customer support and marketing infrastructure and expand its research and development efforts. Fisker believes that its cash on hand following the consummation of the Business Combination, including the net proceeds from Spartan’s cash in trust, and the PIPE will be sufficient to meet its working capital and capital expenditure requirements for a period of at least twelve months from the date of this prospectus and sufficient to fund its operations until it commences production of the Fisker Ocean, assuming Fisker is able to do so as currently contemplated. Fisker may, however, need additional cash resources due to changed business conditions or other developments, including unanticipated delays in negotiations with OEMs
and tier-one automotive
suppliers or other suppliers, supply chain challenges, disruptions dueto COVID-19, competitive
pressures, and regulatory developments, among other developments. To the extent that Fisker’s current resources are insufficient to satisfy its cash requirements, Fisker may need to seek additional equity or debt financing. If the financing is not available, or if the terms of financing are less desirable than Fisker expects, Fisker may be forced to decrease its level of investment in product development or scale back its operations, which could have an adverse impact on its business and financial prospects. See Note 1 to the audited consolidated financial statements included elsewhere in this prospectus.58
Going Concern
As of September 30, 2020, the Company evaluated whether there were any conditions and events, considered in the aggregate, that raise substantial doubt about its ability to continue as a going concern over the next twelve months. Since inception, the Company has incurred significant losses of approximately $60.5 million. The Company expects to continue to incur significant operating losses for the foreseeable future. As of September 30, 2020, the Company had approximately $45.0 million in cash and cash equivalents. The Company has historically funded its operations primarily through the sale of convertible debt and equity securities. However, given the anticipated cash received from the Business Combination and timing of expenditure assumptions, the Company currently expects that its cash will be sufficient to fund its operating expenses and capital expenditure requirements for at least the next 12 months.
Debt
Fisker had $10.0 million of principal in convertible bridge notes outstanding on September 30, 2020. The convertible bridge notes are due July 29, 2021, with simple interest rate of 5% per annum. In June 2020, Fisker amended the terms of its convertible bridge notes to provide that a transaction with a Special Purpose Acquisition Corporation (“SPAC”), which includes the Business Combination, prior to repayment or conversion in full of the notes, would result, immediately prior to such SPAC transaction, in the automatic conversion of the outstanding principal and any accrued but unpaid interest under the convertible bridge notes into shares of Legacy Fisker’s Class A Common Stock (or, at the election of the Company, directly into proceeds paid to the holders of Legacy Fisker’s Class A Common Stock in connection with such SPAC transaction) at a price per share that is 75% of the price per share of Legacy Fisker’s Class A Common Stock paid in such SPAC transaction. Immediately prior to the Close, the outstanding principal and any accrued but unpaid interest under the convertible bridge notes were converted into 1,361,268 shares of Class A Common Stock.
Cash Flows
The following table provides a summary of Fisker’s cash flow data for the periods indicated:
Nine Months Ended September 30, | Years Ended December 31, | |||||||||||||||
2020 | 2019 | 2019 | 2018 | |||||||||||||
(dollar amounts in thousands) | ||||||||||||||||
Net cash used in operating activities | $ | (7,941 | ) | $ | (4,911 | ) | $ | (7,260 | ) | $ | (3,417 | ) | ||||
Net cash used in investing activities | (224 | ) | (14 | ) | (14 | ) | (48 | ) | ||||||||
Net cash provided by financing activities | 51,283 | 1,089 | 3,586 | 7,614 | ||||||||||||
Cash Flows used in Operating Activities
Fisker’s cash flows used in operating activities to date have been primarily comprised of costs related to research and development, payroll and other general and administrative activities. As Fisker continues to ramp up hiring ahead of starting commercial operations, Fisker expects its cash used in operating activities to increase significantly before it starts to generate any material cash flows from its business.
Net cash used in operating activities was $7.9 million in the nine months ended September 30, 2020, an increase from $4.9 million net cash used in the nine months ended September 30, 2019.
Net cash used in operating activities was $7.3 million in 2019, up from $3.4 million in 2018.
Cash Flows used in Investing Activities
Fisker’s cash flows from investing activities, to date, have been comprised mainly of purchases of property and equipment and have not been material. Fisker expects these costs to increase substantially in the near future as it ramps up activity ahead of commencing commercial operations.
Fisker had $0.2 million of investing cash flow activity in the nine months ended September 30, 2020 compared to a nominal amount of cash used in the nine months ended September 30, 2019. Net cash used in investing activities were also nominal for the years ended 2019 and 2018.
59
Cash Flows from Financing Activities
Through September 30, 2020, Fisker has financed its operations primarily through the sale of equity securities, and, to a lesser extent, convertible notes.
Net cash from financing activities was $51.3 million in the first nine months of 2020, reflecting mainly the issuance of $46.5 million in convertible equity securities, net of payments of $3.5 million to advisors, and $1.1 million in the comparative period of 2019. Net cash from financing activities was $3.6 million in 2019, reflecting mainly proceeds from the issuance of convertible notes. Net cash from financing activities was $7.6 million in 2018, mainly reflecting net proceeds from the issuance of equity securities.
Contractual Obligations and Commitments
The following table summarizes Fisker’s contractual obligations and other commitments for cash expenditures as of September 30, 2020, and the years in which these obligations are due:
Payments Due by Period | ||||||||||||||||||||
Total | Less than 1 Year | 1-3 Years | 3-5 Years | More than 5 years | ||||||||||||||||
(Dollar amounts in thousands) | ||||||||||||||||||||
Contractual Obligations: | ||||||||||||||||||||
Convertible bridge notes (1) | $ | 10,015 | $ | 10,015 | $ | — | $ | — | $ | — | ||||||||||
Total | $ | 10,015 | $ | 10,015 | $ | — | $ | — | $ | — | ||||||||||
| (1) | Amounts do not include interest, which accrues at a simple interest rate of 5% per annum, payable upon demand following maturity or at the time of conversion, whichever is earlier. |
As of September 30, 2020, Fisker leased its headquarters space in the Los Angeles area under a single lease classified as an operating lease expiring on December 31, 2020. Subsequent to September 30, 2020, the Company executed two new leases for office space in the cities of Manhattan Beach and San Francisco, California over initial lease terms ranging from 42 months to 66 months.
Off-Balance Sheet
ArrangementsFisker is not a party to
any off-balance sheet
arrangements, as defined under SEC rules.Critical Accounting Policies and Estimates
Fisker’s financial statements have been prepared in accordance with generally accepted accounting principles in the United States (“GAAP”). In the preparation of these financial statements, Fisker is required to use judgment in making estimates and assumptions that affect the reported amounts of assets and liabilities and the disclosure of contingent assets and liabilities as of the date of the financial statements, as well as the reported expenses incurred during the reporting periods. Fisker considers an accounting judgment, estimate or assumption to be critical when (1) the estimate or assumption is complex in nature or requires a high degree of judgment and (2) the use of different judgments, estimates and assumptions could have a material impact on the consolidated financial statements.
Fisker’s significant accounting policies are described in Note 2 to its audited consolidated financial statements included elsewhere in this prospectus. Because Fisker is
a pre-revenue company
without commercial operations, management believes it does not currently have any critical accounting policies or estimates. Management believes that the accounting policies most likely to become critical in the near future are those described below.60
Stock-Based Compensation and Common Stock Valuation
Fisker recognizes the cost of share-based awards granted to employees and directors based on the estimated grant-date fair value of the awards. Cost is recognized on a straight-line basis over the service period, which is generally the vesting period of the award. Fisker reverses previously recognized costs for unvested options in the period that forfeitures occur. Fisker determines the fair value of stock options using the Black-Scholes option pricing model, which is impacted by the following assumptions:
| • | Expected Term |
| • | Expected Volatility |
| • | Expected Dividend Yield |
| • | Risk-Free Interest Rate Treasury zero-coupon issues with an equivalent remaining term equal to the expected life of the award. |
Common Stock Valuations
Prior to the Business Combination, the grant date fair value of Fisker common stock was determined by the Board of Directors with the assistance of management and a third-party valuation specialist. Given
its pre-revenue stage
of development, management utilized that an Option Pricing Model (“OPM”) as the most appropriate method for allocating enterprise value to determine the estimated fair value of the Common Stock. Application of the OPM involves the use of estimates, judgment, and assumptions that are highly complex and subjective, such as those regarding Fisker’s expected future revenue, expenses, and cash flows, discount rates, market multiples, the selection of comparable companies, and the probability of future events. Now that Fisker’s stock is publicly traded, the Board of Directors intends to determine the fair value of Fisker common stock based on the closing market price on or around the date of grant.Valuation of the Convertible Equity Security
Fisker measures convertible equity security at fair value based on significant inputs not observable in the market, which causes it to be classified as a Level 3 measurement within the fair value hierarchy. The valuation of the convertible equity security uses assumptions and estimates the Company believes would be made by a market participant in making the same valuation. The Company assesses these assumptions and estimates on
an on-going basis
as additional data impacting the assumptions and estimates are obtained. The fair value of the convertible equity security represents the fair value of the potential common stock to be issued to the holder of the convertible equity security in the event of the Business Combination. The significant unobservable input used in the fair value measurement of the Company’s convertible equity security is the probability of the Company’s closing of the Business Combination, which would trigger conversion of the convertible equity security. The Company assessed the probability of completing the Business Combination at 85% and the probability of not completing the Business Combination at 15%. Based on that assessment, the Company calculated the weighted fair value of the shares at approximately $79.0 million at September 30, 2020.Emerging Growth Company Status
Section 102(b)(1) of the Jumpstart Our Business Startups Act of 2012 (“JOBS Act”) exempts emerging growth companies from being required to comply with new or revised financial accounting standards until private companies are required to comply with the new or revised financial accounting standards. The JOBS Act provides that a company can choose not to take advantage of the extended transition period and comply with the requirements that apply
to non-emerging growth
companies, and any such election to not take advantage of the extended transition period is irrevocable.Spartan is an “emerging growth company” as defined in Section 2(a) of the Securities Act of 1933, as amended, and has elected to take advantage of the benefits of the extended transition period for new or revised financial accounting standards. Following the consummation of the Business Combination, Fisker expects to remain an emerging growth company at least through the end of the 2020 fiscal year and Fisker expects to continue to take advantage of the benefits of the extended transition period, although it may decide to early adopt such new or revised accounting
61
standards to the extent permitted by such standards. This may make it difficult or impossible to compare Fisker’s financial results with the financial results of another public company that is either not an emerging growth company or is an emerging growth company that has chosen not to take advantage of the extended transition period exemptions because of the potential differences in accounting standards used.
Recent Accounting Pronouncements
See Note 2 to the audited consolidated financial statements included elsewhere in this prospectus incorporated herein by reference for more information about recent accounting pronouncements, the timing of their adoption, and Fisker’s assessment, to the extent it has made one, of their potential impact on Fisker’s financial condition and its results of operations and cash flows.
Quantitative and Qualitative Disclosures About Market Risk
Fisker has not, to date, been exposed to material market risks given its early stage of operations. Upon commencing commercial operations, Fisker expects to be exposed to foreign currency translation and transaction risks and potentially other market risks, including those related to interest rates or valuation of financial instruments, among others.
Foreign Currency Risk
Fisker’s functional currency is the U.S. dollar, while certain of Fisker’s current and future subsidiaries are expected to have functional currencies in Euro and British pound sterling, reflecting their principal operating markets. Once Fisker commences commercial operations, it expects to be exposed to both currency transaction and translation risk. For example, Fisker expects its contracts with OEMs
and/or tier-one automotive
suppliers to be transacted in Euro or other foreign currencies. In addition, Fisker expects that certain of its subsidiaries will have functional currencies other than the U.S. dollar, meaning that such subsidiaries’ results of operations will be periodically translated into U.S. dollars in Fisker’s consolidated financial statements, which may result in revenue and earnings volatility from period to period in response to exchange rates fluctuations. To date, Fisker has not had material exposure to foreign currency fluctuations and has not hedged such exposure, although it may do so in the future.62
BUSINESS
Fisker Vision
A clean future for all.
Fisker Mission
Create the world’s most emotional and sustainable vehicles.
Overview
Fisker is building a technology-enabled, asset-light automotive business model that it believes will be among the first of its kind and aligned with the future state of the automotive industry. This involves a focus on vehicle development, customer experience, sales and service to change the personal mobility experience through technological innovation, ease of use and flexibility. Fisker combines the legendary design and engineering expertise of Henrik Fisker – the visionary behind the iconic BMW Z8 sports car and the famed Aston Martin DB9 and V8 Vantage, and – to develop high quality electric vehicles with strong emotional appeal by engaging the consumer’s senses through the overall experience of Fisker vehicles. Central to Fisker’s business model is the Fisker Flexible Platform Agnostic Design
(“FF-PAD”),
a proprietary process that allows the development and design of a vehicle to be adapted to any given EV platform in the specific segment size. The process focuses on selecting industry leading vehicle specifications and adapting the design to crucial hard points on a third-party supplied EV platform and outsourced manufacturing to reduce development cost and time to market.Fisker believes it is well positioned through its global premium EV brand, its renowned design capabilities and sustainability focus. Fisker’s first EV, the Fisker Ocean, is an award-winning, affordable,
all-electric
SUV with premium styling and features that Fisker expects to begin producing in the fourth quarter of 2022. Through November 1, 2020, Fisker has received over 9,100 paid reservations, including a fleet order of 300 cars placed by Viggo.Fisker believes over the next 10 years the automotive industry will experience a substantial evolution. In addition to continued electrification and support for environmental, social and governance (“ESG”) initiatives, Fisker believes there will be an acceleration of platform and supply chain sharing. This, Fisker believes, will considerably reduce direct investment costs in automobile hardware, such as steel-stamped platforms, crash structures, and other components that are not readily visible to customers, but that are essential to create an automobile. Fisker expects that software and visual exterior/interior design and user interface (“UI”) graphics will be the primary differentiators of EVs for customers. Finally, Fisker anticipates that customers will demand less restrictive leases and easier ways of accessing mobility, and Fisker’s offering of new mobility choices, along with great design and a hassle-free experience, will enable Fisker to gain a leading-market position.
The Fisker Ocean is targeting a large and rapidly expanding “premium with volume” segment (meaning a premium automaker producing more than 100,000 units of a single model such as the BMW 3 Series or Tesla Model 3) of the electric SUV market. The Fisker Ocean, a five-passenger vehicle with potentially aautonomous driving capabilities, will stand out due to Fisker’s innovative and timeless design and a
250-to
over300-mile
range andstate-of-the-art
re-imagined
customer experience delivered through an advanced software-based UI. Fisker has designed the Ocean for a high degree of sustainability, using recycled rubber,eco-suede
interior trim made from recycled polyester, and carpeting from fishing nets and bottles recycled from ocean waste, among many other sustainable features. The Fisker Ocean was recognized among the best new automobiles at CES 2020 by Time, Newsweek, Business Insider, CNET and others. Fisker expects to price the Fisker Ocean starting at $37,499 for customers who want to purchase the vehicle, or a flexible lease model (instead of a traditional fixed-term lease) starting at $379 per month, which Fisker believes will position the Fisker Ocean as a highly competitive and affordableall-electric
SUV, with premium styling and features.63
Fisker’s goal is to revolutionize how customers view personal transportation and car ownership. Fisker plans to employ an innovative(“EMaaS”) business model that combines a customer-focused experience with flexible leasing options with affordable monthly payments and no fixed term. Fisker envisions astrategy with bothdealer networks. Prospective customers would be able to “touch and feel” the vehicles at immersive Fisker Experience Centers, which Fisker anticipates will initially be located in key strategic locations across the United States and Europe. These centers will utilize dynamic augmented and virtual reality for customers to experience the vehicles, their technology, and sustainability features. Virtual factory tours, group test drives and
“E-Mobility-as-a-Service”
go-to-market
web-and
app-based
digital sales, loan financing approvals, leasing, and service management tools with limited reliance on traditionalbrick-and-mortar
“sales-and-service”
in-store
vehicle visualization, will be offered to prospective customers at Fisker Experience Centers, along with specification and offering for customers choosing not to use theweb-
orapp-based
sales. Fisker believes that this customer-focused approach will drive user engagement in Fisker’s products, brand and technology, and result in positive customer experiences. Such customer satisfaction, Fisker believes, should result in brand loyalty with potentially sustainable revenues.Through Fisker’s
FF-PAD
proprietary process, Fisker intends to significantly reduce the capital intensity and investments typically associated with a new car manufacturing business and accelerate its path to production in several ways, including:| • | Launching with a highly respected brand name in the automotive and EV categories co-founder, Chairman, President and Chief Executive Officer, is a pioneer in the EV industry, having launched the world’s first luxuryplug-in hybrid EV, and has a track record of successful designs as the former Chief Executive Officer and President of BMW Designworks USA and the former Design Director for Aston Martin. Fisker enters the market with an established brand name that is associated with automotive innovation and superior design. |
| • | Using an existing EV Platform. G-Class SUV and electric cars such as the JaguarI-PACE. The cooperation agreement sets out the main terms and conditions for certain operational agreements related to platform sharing, component sourcing and manufacturing for the Fisker Ocean. Fisker intends to leverage Magna’s platform to accelerate its time to market, reduce vehicle development costs, and gain access to an established global supply chain that includes a multi-source battery supply consortium. Fisker’s proprietaryFF-PAD process is hardware agnostic which will enable it to collaborate with several OEMs for the production of its future vehicles. |
| • | Using an existing manufacturing facility. |
| • | Developing a digitally-driven, hassle-free sales and service experience direct-to-customer app-based service experience for its customers. |
64
Market Opportunity
Sustainable vehicles are the future of transportation
In the last few years, Fisker has observed a significant transformation in the motor vehicle landscape. Electric cars, which were once only a fringe element in a market dominated by major global automakers, are quickly becoming mainstream. Along with Tesla, which has been public since 2010, the major automakers are all transitioning towards electric models. Joining them, Fisker and several other
start-ups
are developing EV offerings.In Fisker’s view, this trend is driven by several factors. A rising environmental consciousness is encouraging customers to weigh their emission footprint. As a
zero-emission
alternative to traditional internal combustion engine (“ICE”) options, an EV that can match or exceed an ICE in performance is a natural choice. Assisting with that choice, local and national governments are offering various forms of rebates and credits for the purchase of an EV and have otherwise begun to support the rise ofe-mobility
by accelerating the push for zero emission vehicles due to increased awareness of the impacts of global warming. As EV sales grow, parts volume grows in tandem, allowing automakers to purchase parts at a lower cost and further accelerating the switch to electric. Lastly, the continuing improvement in battery technology, continuingbuild-out
of electric charging infrastructure, and the growing comfort with EV range capabilities are easing “range anxiety” and facilitating adoption.
Source: Derived from data in Bloomberg Electric Vehicle Outlook 2020
But there is more to sustainability than just electrification. The Fisker Ocean will be built primarily from sustainable materials. By seeking to use excess existing manufacturing capacity, Fisker will not be contributing to the development of any additional industrial manufacturing construction. Fisker is committed to sustainability on all fronts, and it believes that commitment is in line with today’s market.
Sustainability is not the only major trend from which Fisker is intending to benefit. Fisker believes a more subtle transition is underway. For 100 years, the automobile industry has been hardware-based. Customers were fixated on the physical attributes and performance specifications of vehicles. Today, that is changing. While EV technology is such that the raw performance capabilities are largely on par with or better than ICE counterparts, customers are increasingly focused on software. The software interface and user experience are critical. That understanding inspired us to set out to be the first “digital” car company, leading the way to a more software-based future.
65
Few automotive manufacturers have established brand names in the EV space in order to fully benefit from the resulting changes to the automotive industry. The Fisker name is well recognized in the automotive world – the design credentials of our brand are undisputed, and the focus on building the most sustainable, fully electric vehicles aligns Fisker with changing consumer behavior and expectations for increased environmental consciousness.
The rise of the SUV
When designing its first offering, the Fisker team elected to develop an SUV. Fisker chose an SUV because it recognized another major trend in auto sales – the rise of the SUV.
For various reasons, today’s customers increasingly prefer SUVs to traditional sedans or crossovers. According to JATO, 2018 SUV sales globally, in the United States and European Union were 29.8 million, 7.8 million and 5.4 million vehicles, respectively, meaning that Fisker would require less than 1% market share in each market to achieve its near-term plan. With the Tesla Model Y, the Audi
E-Tron,
the Mercedes EQC and the XC40 Recharge on the market or expected in 2020, the EV SUV market continues to accelerate. According to Research Nester, the global SUV market is forecasted to be 53.2 million SUVs in 2027.
Source: Derived from data in DOC, OICA and GoodCarBadCar
Fisker Flexible Platform Adaptive Design
(FF-PAD)
Fisker has entered into a cooperation agreement with Magna which sets forth the main terms and conditions of a platform sharing partnership. Fisker intends that the final platform to be developed with Magna will form the basis of the Fisker Ocean and potentially additional Fisker models. Engaging in collaboration and partnership arrangements is intended to enable Fisker to share investments made by industry-leading OEMs and
tier-one
automotive suppliers, allowing Fisker to focus on creating value beyond basic engineering and customer expectations. Fisker believes this platform-sharing arrangement will reduce delivery risk by eliminating factors such as development of new and untested manufacturing processes and creation of new supply chains.The critical elements of the platform (also referred to as a “skateboard”) Fisker plans to adopt would include, for example, the sheet metal structure for the floor plan of the vehicle, the electrical powertrain, the suspension, steering and braking systems, airbags, seatbelts, and other architectural elements such as seat frames and HVAC. The implicit functionality provided by the platform/skateboard reduces the task of satisfying all of the requirements associated with
high-and
low-speed
crashworthiness, side impacts and roof crush, occupant injury, and pedestrian safety, among others, to one of system tuning. Similarly, durability, noise, vibration, and harshness performance become optimizing exercises where Fisker takes an already highly developed product and improves in those areas that are important to its customers.Fundamentally, the platforming sharing approach is intended to allow Fisker to mitigate risk in the research and development and delivery phases of the program so that Fisker can focus on creating additional value for its customers without distracting its resources on reinventing proven engineering.
66
By managing the degree of change in each functional and business area, Fisker intends to manage the overall program total risk, which greatly reduces cost and time to market while simultaneously ensuring high product quality. These advantages are intended to manifest themselves (i) to Fisker’s customers as reduced cost of ownership and high levels of ownership satisfaction, and (ii) to Fisker’s investors as reduced cost and time to market.
Alongside the
FF-PAD,
Fisker will focus its design and engineering process to improve the flow of information from customer demands, to design and engineering:| • | Sales and marketing: identify target customer and the customer’s demands for vehicles |
| • | Vehicle engineering: translate customer demand into a full technical specification of the vehicle, describing every attribute in quantifiable terms (SI units or Vehicle Evaluation Rating) |
| • | Design: deliver the visual aesthetic with a unique emotional attraction |
| • | Engineering: translate the technical and aesthetic specifications into engineered components and subsystems to deliver a fully optimized, compatible final product |
The fulcrum of this process is the Vehicle Architecture (“VA”) team. The VA team is placed at the center of the flow of information from these branches of the business and is tasked with balancing the conflicting requirements and arbitrating between business groups to achieve consensus.
Using the VA team in this way is intended to result in a highly efficient design and engineering process and reduce cost and time to market. One key aspect of this approach is to eliminate several over-lapping teams found in traditional automobile manufacturers and most new startups, including studio engineering, vehicle packaging and decision-making unit, and siloed computer-aided design authoring groups. By eliminating these separate teams and amalgamating them into one pivotal group, Fisker intends to reduce lines of communication and the potential for undiscovered errors.
Another key advantage of the VA approach is that it facilitates partnerships beyond that of simple platform sharing. By creating a group whose key role is to coordinate and organize, it then becomes a simple task to extend that role to include multiple, task oriented external partners in an effectively seamless fashion. By utilizing the VA role, Fisker is able to more seamlessly distribute other key elements of the business, as set forth in the graphic below which illustrates the total task to bring a vehicle to market.
This approach is intended to allow Fisker to efficiently leverage many of the industry leaders in service provision for the engineering, validation, supply chain and manufacturing tasks.
Fisker’s Manufacturing Approach
The existing automotive production industry has an estimated 20% overcapacity. Specifically, Fisker estimates that the industry has the capacity to produce approximately 100 million vehicles annually versus current production of around 80 million annually. Fisker decided to seek out a partnership with an existing manufacturer rather than constructing new production capacity and recently entered into a cooperation agreement with Magna which outlines the main terms of manufacturing agreements that are under negotiation between Fisker and Magna. This approach is intended to lower Fisker’s upfront costs, while also supporting Fisker’s ESG mission by reducing the carbon footprint of its operations. It has also commenced discussions with several other industry-leading OEMs and
tier-one
automotive suppliers for additional component sourcing and manufacturing for potential future vehicles or additional capacity needs. Fisker currently intends to manufacture its vehicles using Magna’s existing manufacturing facilities in Europe utilizing Magna’s existing labor force, with potential expansion to the United States in the near future.Recruiting and training a new vehicle manufacturing workforce can be an expensive and time consuming task. By leveraging existing manufacturing capacity, Fisker intends to bypass this startup cost and eliminate the need to recruit and train labor, with all the associated risk of poor initial build quality which can easily damage reputation. This approach is also intended to enable more efficient knowledge transfer—as we work alongside our partners,
67
Fisker personnel will absorb and learn vital skills which can then be deployed if and when Fisker chooses to create dedicated Fisker manufacturing facilities. Fisker also intends to reduce ramp up time through such partnerships, which would in turn allow Fisker to achieve production on a rapid timescale, while limiting risk to product quality.
An additional and significant advantage of working with established manufacturing partners is that such enterprises are already connected to the existing automotive supply chain. The maturity of supply chain relationships is critical, and is reflected in the connectivity of business systems and IT infrastructure. A typical vehicle consists of over 5,000 individual parts and assemblies, each of which is sourced from an extended supply chain consisting of thousands of suppliers. Compounding this further is the fact that there is complexity in the vehicle build specifications to suit customer choice. These parts must be delivered to the final point of assembly at a rate and in a sequence that matches planned vehicle production. Considering that a typical automotive facility will assemble these more than 5,000 parts into a complete vehicle at a rate of one vehicle every 120 seconds, the smooth running of that logistics effort becomes critical to the running of the operation. Such organizational efficiency is the result of decades of experience and cannot be easily replicated. These critical relationships extend beyond the simple supply of parts and into areas such as local government, where support and cooperation is vital to ensure that local infrastructure updates are considered at a strategic local government level. Such partnerships are also decades in the making, and are critical to the ongoing success of the enterprise.
Competitive Strengths
Fisker’s competitive strengths include the following:
| • | Legendary automotive Fisker brand co-founder, Chairman, President and Chief Executive Officer, is a pioneer in the EV industry and has built a global reputation for superior quality and distinctive automotive design over the last three decades. He is the former Chief Executive Officer and President of BMW Designworks USA and the former Member of the Board and Design Director for Aston Martin. He has spent his career designing luxury vehicles, including several award-winning cars and automobile industry icons such as the BMW Z8, Aston Martin’s most successful model (the last generation Vantage), and the Fisker Karma (the first luxury EV with a range extender). Unlike new entrants that launch with no brand identity or reputation for quality or execution, Fisker is entering the market with an established brand name in automotive innovation and superior design. |
| • | Award-winning all-electric SUVstate-of-the-art premium-yet-affordable, all-electric SUV that features a range of approximately 250 to over 300 miles (with 80% of its capacityre-charged in just 30 minutes), optional advanced autonomous driving capabilities, and optional photovoltaic solar roof. Fisker designed the Fisker Ocean to be the world’s most sustainable vehicle,eco-suede interior trim made from recycled polyester, and carpeting from fishing nets and bottles recycled from ocean waste. At a starting price below $40,000, Fisker believes the Fisker Ocean will be highly competitive in the large and rapidly growing premium with volume segment of the electric SUV market. |
| • | Digitally-driven, customer-first focus know-how, drivetrain technology, brand, design, and manufacturing capability were core competitive strengths, Fisker believes that, in the EV industry, key competitive differentiators will be brand, design, customer experience, charging network access, connectivity and software. Fisker’s strength in these areas range from an established premium EV brand, to a completely new customer experience, access to the largest charging network, and software and connectivity skills. Additionally, Fisker has been set up by Henrik Fisker since inception to be environmentally responsible, without the legacy issues of the established car companies. Fisker intends to revolutionize how customers view personal transportation and car ownership. Fisker plans to implement the first EMaaS business model in the car industry, combining a novel customer-focused experience with flexible leasing options, low monthly payments and no fixed |
68
term. Fisker is also designing anstrategy for vehicle configuration, sales and financing, leasing, and service management to replace the traditionaldealer network. Fisker plans to drive marketing through immersive Fisker Experience Centers in key strategic locations in the United States and Europe that will use dynamic augmented reality and virtual reality to convey thetechnology and sustainability features of its vehicles and its customer-centric business model. Family-friendly Fisker Experience Centers will offer prospective customers virtual factory tours, group test drives and the opportunity for
app-based,
direct-to-customer
brick-and-mortar
“sales-and-service”
new-and-improved
in-store
vehicle visualization, specification, and ordering. Fisker also intends to enter into a service partnership with third parties such as Pivet and Manheim to create a hassle-free service experience for Fisker’s customers. Service requests will be easily scheduled through Fisker’s Flexee App, with vehiclepick-up
and delivery by Fisker-branded personnel, through Manheim or other third-parties. Fisker believes that its customer-first approach will drive revenue and user satisfaction, while lowering upfront capital investment and enabling greater margins for Fisker over time.| • | Substantially “de-risked” path to commercializationtier-one automotive suppliers that will give Fisker access to additional platform sharing, component sourcing, and manufacturing. Fisker intends to leverage such arrangements to accelerate its time to market and reduce vehicle development costs. By utilizing these types of arrangements, Fisker will seek to benefit from previously established high-volume vehicle engineering, manufacturing, and safety experience andknow-how. Fisker also intends to gain access to an established supply chain that includes one or more established suppliers and a low cost, multi-source battery supply consortium. Fisker also intends to leverage one or more third-party manufacturing facilities and trained workforce, which positions Fisker well to meet timing, cost and quality expectations while optimally matching Fisker’s cost structure with its projected production ramp. Partnering on a platform, supply chain and manufacturing is intended to position Fisker to meet its projected production and delivery targets and enable Fisker to focus on what it believes will be the key differentiators for a new car company: delivering truly innovative design features, a superior customer experience, and a leading UI that leverages sophisticated software and other technology advancements. |
| • | Focus on the “critical few” for controlled operating expenses |
Growth Strategy
Fisker intends to leverage its competitive strengths and the following growth strategies to drive stakeholder value.
| • | Continue to develop the Fisker Ocean |
69
Fisker’s management team. As part of this plan, Fisker expects to begin building prototype,
pre-production
Fisker Oceans in 2021 through Magna’s manufacturing facilities. Additionally, Fisker and Magna have agreed to certain prototyping and engineering services relating to the Fisker Ocean.| • | Re-imagine the customer experience for personal transportation and car ownershipre-imagine the customer experience for personal transportation and car ownership. Fisker will continue to design EVs that will be differentiated in the marketplace by proprietary design innovation and a customer experience delivered through astate-of-the-art, |
| • | Develop additional high value, sustainable EV models tier-one automotive supplier, will enable Fisker to efficiently achieve its goal of providing the world with a fleet of high value, sustainable EVs. Fisker intends to utilize one or more platforms over time to develop a lifestyle pickup truck and a sport crossover to complement the Fisker Ocean. In addition, in the future, Fisker will also explore additional EV platform opportunities that will facilitate its mission to revolutionize the personal transportation industry. |
Fisker’s Vehicles

70

71

Fisker’s first vehicle will be the Fisker Ocean, an
all-electric
premium SUV that is expected to have a highly competitive starting price of $37,499 in the U.S. market before federal and state incentives are applied (Fisker will initiate sales with all of its currently allocated EV credits – $7,500 on the first 200,000 delivered vehicles). It will have at least three option packages, with prices anticipated to range from a base price of $37,499 to approximately $69,900 for several premium features. This allows customers with different preferences and means to find a vehicle and price that fits their needs. Fisker expects most of its sales initially to be vehicles with higher priced option packages, which is typical for a new, exciting vehicle entering the market.Fisker is planning to develop several unique option packages to broaden the market appeal of the Fisker Ocean, including an anticipated extreme
off-road
package, which Fisker refers to as Force E. Fisker plans to announce several option packages, each with their own characteristics by the end of 2020.Fisker believes the electric range of the Fisker Ocean will be potentially 250 to over 300 miles, depending on driving conditions and testing procedures (e.g., EPA cycle vs. WLTP cycle). Fisker believes its software engineers have the ability to optimize its proprietary battery management system and other technical aspects of the battery system to potentially offer potentially longer-range versions.
The Fisker Ocean has many selling points that will set Fisker apart from any of its competitors, including:
72
| • | California Mode open-air experience with the push of one button. California Mode enables all of the vehicle’s windows – side windows, sunroof and the rear hatch window – to open simultaneously. This feature allows for long items (like a surfboard) to be transported by placing them through the rear window without having to drive with an open hatch. This feature will not work as well on an ICE vehicle as exhaust fumes could enter the cabin. |
| • | Extra wide track best-in-class |
| • | Fixed hood |
| • | User Interface |
| • | Autonomy state-of-the-art tier-one automotive suppliers. |
| • | Solar roof state-of-the-art |
| • | Vegan interior |
| • | Recycled materials in the interior |
| • | Sustainability |
Fisker is planning to introduce three more vehicles by 2025 using an established-platform-sharing arrangement with one or more industry-leading OEMs. In addition to the Ocean, the four-vehicle lineup will include a super-sports sedan based on Fisker’s Emotion concept, a sport crossover, and a lifestyle pickup truck. Each of those vehicles have already been defined and the initial design concept has already been created. These vehicles are designed to stand out and provide a unique offering in each of their segments, attributes that Fisker believes will assist Fisker in achieving future growth.
73
New electronics architecture
The Fisker Ocean electronics architecture is based around a small number of key domain controllers, for advanced driver assistance functions, drivetrain and battery management, and infotainment. A traditional vehicle electronics architecture typically contains a high number of independent and self-contained modules, each a black box to the rest of the car. This new architecture, based on a few high-performance computers, opens new avenues for integration, sensor fusion, and an adaptive and evolving user experience. A connectivity module enables full communication with the Fisker cloud and the possibility for edge computing, while(“OTA”) software updates ensure the
over-the-air
in-car
experience can stay ahead of market expectations.Future generations of Fisker architecture will integrate automotive requirements into customized electronics chips and boards, with hardware accelerators for AI, machine-learning, and computer-vision. This further reduction in electronics component counts will lead to lower power consumption, increased computational power, and even greater scope for feature integration and optimization.
Digital car of the future: delivered over the air
The new electric, digital car is more technologically sophisticated than its predecessors. Many immediate benefits to the customer of this always-online car will be evident in the infotainment system. Entertainment and productivity apps, mobility services, and navigation aids can keep pace with the latest regional trends. The integrated and fully connected nature of the digital car opens new opportunities for innovation, and enables functions previously impossible, such as predictive maintenance and remote fault diagnosis.
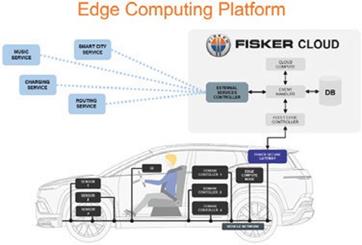
Through edge computing and
ultra-low
latency 5G connectivity, it also becomes possible for virtually infinite cloud computing resources to be used as a seamless extension of the computing power in the car. Continuous software updates, both for embedded systems in the car and functions hosted in the cloud, let the digital car grow and become smarter over its lifetime.E-powertrain
In future generations of Fisker cars, Fisker intends to utilize software to improve the powertrain performance, making the cars more efficient, allowing more instantaneous power output, or improving the charging experience. For example, powertrain parameters will be tailored to each driver in real time, based on driving habits, traffic density, road geometry, and environmental conditions. The optimal characteristics of the motors can be constantly measured and altered, and the level of the recuperation system can be adjusted in real time.
On-board
diagnostics, combined with predictive models and anomaly detection can guide the customer to schedule a service appointment before they can even perceive any symptoms, possibly averting a costly repair.74
UX/UI
Fisker EVs will always be “connected.” Fisker’s next-generation connectivity platform will enable the seamless integration of online services and functions, whether unique Fisker services or from third parties. Features that are visualized on the large center touchscreen or digital instrument cluster will meet strict driver-distraction guidelines and will be rendered in high resolution through Fisker’s custom UI framework. The leading-edge
head-up
display will project useful information onto the windshield so the driver’s eyes never need to leave the road. The Flexee App seamlessly connects to the car, ensuring the customer’s digital life and driving experience meet in the car.With data analysis, cloud computing, and OTA updates, the
in-car
experience can adapt over time to the driver, not the other way around as has traditionally been the case.Sales—Go To Market Strategy
Fisker believes over the next seven years, the U.S. and E.U. EV market will be broken down into three fundamental segments: the white space segment, the value segment and the conservative premium segment. All three segments will attract customers from traditional ICE vehicles, but the largest growth, by volume, will be the white space segment and the value segment.
EV Segment | Attributes of Segment | Fisker Plan within Segment | ||
| White space segment | Currently occupied by Tesla globally and by a few Chinese EV independent start-ups operating in China only. | Fisker believes it will be the primary alternative to Tesla in this segment with the Fisker Ocean priced around the base price of the Tesla Model 3 and Model Y. | ||
| Appeals to customers who want to be part of the new EV movement, who value sustainability and ESG. | Fisker believes other EV startups will move into the higher luxury priced segments due to the lack of volume pricing of components. | |||
| Can only be occupied by pure EV brands that only produce EVs with a clear commitment towards zero emission vehicles. | Fisker expects to sell approximately 50% of its vehicles into this segment. | |||
| Value segment | Focus on price and value proposition—customers will buy vehicles in this segment when the purchase price and cost of maintaining/running fits the budget and is better than an ICE vehicle. | Fisker believes it will penetrate the upper end of this segment by offering a compelling and differentiated price/ performance vehicle, compared to other traditional car makers struggling to compete due to lack of volume pricing. | ||
Yet to be dominated by any auto maker. | Fisker expects to sell approximately 10% of its vehicles into this segment. | |||
75
EV Segment | Attributes of Segment | Fisker Plan within Segment | ||
| Conservative premium segment | Emerging segment currently occupied by several traditional auto makers that are trying to keep their own customers from deflecting to new start up EV makers like Tesla. | Fisker believes its vehicles will be very attractive to customers sitting “on the fence” in this segment, ready to leave their ICE brand, but needing assurance of quality and reliability. This is a segment where Fisker believes it can attract new customers that will come from traditional ICE brands. | ||
| Vehicles in this segment, produced by the traditional premium automakers, are struggling with a clear EV identity as they try to bridge the traditional ICE attributes with new EV attributes. | Fisker believes it will sell approximately 40% of its vehicles into this segment, but it will grow rapidly, as Fisker will be able to offer a more emotional design, an exclusive EV brand, a larger battery and better equipment for the price due to Fisker’s volume pricing versus the lower volume traditional brands | |||
Marketing, Brand Awareness, Order Growth, and Sales/Lease
Fisker has developed a proprietarymobile application. After showing the Fisker Ocean at CES 2020, Fisker received over 40,000 indications of interest (meaning the Flexee App has been downloaded and the potential purchaser has provided a contact phone number), as of November 1, 2020. As of November 1, 2020, Fisker has received over 9,100 paid reservations, including a fleet order of 300 cars placed by Viggo, all without any paid marketing.
direct-to-customer
Fisker plans to grow paid reservations substantially by the end of 2020 by raising the brand profile and brand awareness. Fisker plans to hire several online market agencies to increase its marketing efforts. Fisker believes that a large and growing portion of the world’s population believe in the importance of sustainability, and as a company built with an
ESG-first
mindset, it has the ability to attract and build brand loyalty from this critical market segment. Fisker also plans to open Fisker Experience Centers across the U.S. and E.U. that will have a completely new brand experience focused on the environment and enjoyment of life. Fisker also plans to attend events and trade shows and to increase its social media presence. Additionally, Fisker plans to enter a new electric SUV sustainable racing series called Extreme E which will be televised globally.| • | Data and marketing studies show that a large number of consumers have a clear preference for pure EV brands, but currently only have the choice of Tesla. |
| • | According to AUTOCAR, customers prefer no hassle, easy digital buying – three-quarters of Teslas are sold online and, in the Netherlands and Germany, more than 50% of vehicle purchases are made without a test drive. |
Finally, Fisker believes many customers from any of the three above segments will welcome a new choice of an independent EV OEM. Fisker believes its collaborative use of Magna’s EV platform will be an advantage to Fisker over any independent competitor as it will give customers assurance of:
| • | Quality: Built by Magna in its European plant |
| • | Reliability: Engineered by Magna, a leading automotive manufacturer |
| • | Service and Maintenance: Confidence in product with standardized service and maintenance plans provided by credible third-party partners |
76
Fisker is confident that its competitive strengths, including its development strategy and the selling points of its vehicles, will enable Fisker to compete effectively in its target markets and achieve its vision and mission.
Service, Marketing and Insurance
Fisker’swill be the primary drivers of Fisker’s sales leads and have already helped Fisker achieve a high volume of reservations without traditional marketing efforts and with a relatively low marketing budget. Fisker plans to continue to expand its social media presence as a key part of its marketing effort. Additionally, Mr. Fisker intends to increase his personal engagement on social media in order to make potential customers feel they hear directly from the Fisker founder’s “voice.” In addition, Fisker plans to attend global events and open Fisker Experience Centers to give the opportunity for more potential buyers to experience its vehicles. Fisker is also planning a distinctive new customer rewards program and a unique customer retention engagement program.
co-founder
Henrik Fisker’s reputation, Fisker’s collaboration with Magna and Fisker’sroll-out
of the Fisker Ocean has generated significant media coverage of the company and its vehicles, and Fisker believes this brand awareness will expand dramatically upon the achievement of major company milestones. As such, Fisker believes media coverage andword-of-mouth
Fisker intends to use a combination of third-party insurance and self-insurance mechanisms, potentially including (if financially feasible and in compliance with regulatory requirements) a wholly-owned captive insurance subsidiary to provide for the insurance against certain risks, including auto liability and physical damage, general liability and products liability.
Direct Sales and Service
Fisker markets and will sell its vehicles directly to customers using Fisker’s proprietary digital platforms, including the Flexee App and website. This digital approach allows Fisker to collect customer data and improve the overall customer experience. Fisker’s digital customer interactive platforms are cost effective and increase the value proposition and competitiveness of Fisker’s vehicles.
Fisker believes it will be able to quickly build its company brand on a global scale and retain its customers through the direct interaction with its customers. In addition, Fisker plans to launch a unique “miles”-style retention program, which will include awards where Fisker’s reservation holders and future customers can generate points that can be converted into money or put towards the purchase or lease of a vehicle. This program is a unique rewards program that resembles successful programs used in other
non-automotive
industries.Fisker is also planning to offer both financing and insurance of its vehicles directly through its digital platforms. Fisker believes it can reduce the total cost of ownership (“TCO”) for its customers and potentially generate additional sources of revenue by providing both financing and insurance for its vehicles.
Fisker plans to keep introducing newprograms and services to further define the Fisker customer experience. As described elsewhere, Fisker also plans to keep Fisker’s lean sales, lease, and service model in order to be able to continue to offer great value to its customers regardless of the segment Fisker enters.
direct-to-customer
Fisker intends that its digital platform will eventually allow potential customers to view a selection of used Fisker vehicles for both purchase and Flexee lease. Fisker also anticipates that
non-Fisker
vehicletrade-ins
will be done digitally and handled in collaboration with Fisker’s service providers.77
Vehicle Maintenance
An important aspect to consumers is the maintenance of vehicles. Fisker believes customers ultimately do not enjoy taking their vehicle to service, waiting in line, filling out forms, waiting for a loaner vehicle, etc., only to be called back to pick up their vehicle and go through the same process. Fisker will offer a new approach to service that will result in less required infrastructure, higher efficiency, and significantly higher customer satisfaction. Through consumer requests on the Flexee App or information gathered through
on-board
diagnostics and connectivity, vehicle maintenance needs will be identified proactively. The vehicle will be picked up at a customer-specified location and brought to a nearby centralized service facility. This process will avoid the unpleasant experience that service stops at dealerships represent to consumers today.Fisker will have no “first mandatory service” as its vehicles will not need such a service. If a customer vehicle needs service, Fisker believes it will be for mainly two reasons: (1) a fault shows up in the
on-board
diagnostics/request to go to service or (2) the customer notices something needs to be “fixed” and service is needed. In those cases, either the vehicle’son-board
diagnostics will alert Fisker, or the customer will alert Fisker through its digital platforms. Fisker will then pick up the customer vehicle at an agreed time and place, service the vehicle and bring it back at an agreed time and place. Fisker believes it will eventually be able to conductpick-up
and delivery without the customer being physically present, using a digital key and a location map.Fisker believes a majority of service can be done in one day and will not need an exchange of a loaner vehicle, as Fisker anticipates most people will be at work during the service period. Should a loaner vehicle be needed, Fisker’s service representative will bring it and take it back when delivering the service vehicle back to the customer. This efficient service model will be performed in conjunction with select service partners, such as Pivet and Manheim, which are Fisker’s partners in the North American market. Fisker believes this service model delivers a better, faster, and more convenient customer experience. Fisker also believes this model drastically reduces cost, as Fisker does not need to construct and operate dealerships at which to perform service. Manheim has already streamlined its service model and because no customers will be required to visit the service centers, the service centers can be located in lower cost areas and be focused only on vehicle service and not customer reception.
Fisker plans to have several company-owned service centers for more technically challenging cases, which will be strategically placed across geographies.
Fisker believes its service model will take the customer experience and satisfaction to a new level and that Fisker’s service cost during the warranty period will be reduced. Fisker also believes this service will reduce cost for customers maintaining used Fisker vehicles.
Vehicle Financing
The most common method of buying a car is borrowing the money and then paying it off in installments. Over 85% of new car purchases and half of used car purchases are financed as opposed to being paid for in a lump sum with cash. Approximately 30% of new vehicles are leased.
Fisker intends to launch a
non-fixed
term financing contract for Fisker’s customers, which Fisker will call the “Flexee lease.” The Flexee lease is inclusive of car use and maintenance. Fisker is working on options to add insurance as well. Fisker believes it will be able to offer a comparatively low lease payment due to lower capitalized costs, lower depreciation, and very low maintenance and replacement parts cost compared to traditional automobile brands.The capitalized cost reduction occurs through elimination of the dealer margin usually financed in a lease, a customer down payment, and by including government EV incentives where and when available.
The lower and more even depreciation of the vehicle cost over its usable life results from the anticipated
eight-year
useful life of the vehicle and the relatively high expected residual value of the vehicle due to the expected high battery resale values. Additionally, carefully managed residual risk through reuse and refurbishment of the vehicles will minimize wear and tear and extend the vehicle life and value.78
There are two methods of financing a car: direct and indirect. A direct loan is one that the borrower arranges with a lender directly. Indirect financing is arranged by the car dealership where the car is purchased. Fisker intends to offer branded financing directly to consumers. Fisker anticipates that the loan process and funding will be arranged through financial services partners in different countries. Because of the high profitability of direct financing, Fisker will evaluate whether to establish its own captive finance company in the future.
Total Cost of Ownership
In general, EVs have significantly lower TCO than internal combustion engines vehicles. Fisker also believes that its EVs will have lower TCO than those of its EV competitors.
The TCO advantage over ICE vehicles resides in the fact that electricity is cheaper than gasoline or diesel, an EV has less components that can break as compared to an ICE vehicle, brake pads are less utilized in EV due to motor regenerative breaking, and an EV has fewer fluids and components exposed to friction, among other factors. Therefore, the Fisker Ocean is anticipated to have 30% to 50% lower TCO than a comparable vehicle with an internal combustion engine. The Fisker Ocean uses regenerative braking systems that use motor resistance through the electric motor, so brake pad utilization and cost is very minimal. EV powertrains are much simpler than their ICE vehicle counterparts. EVs don’t rely on a complicated multi-speed transmission. Instead, most use a fixed-ratio, direct-drive setup. EVs have significantly fewer parts. There is also no exhaust system, muffler, catalytic converter, fuel injector or fuel pump in an EV. Electric motors are not only reliable, long-lasting, and easy to maintain, but they also provide instant power on acceleration, they are quiet, highly efficient and, of course, they do not produce tailpipe emissions or odor.
There are a number of federal and state incentives available for EVs that further lower TCO. The TCO advantage of the Fisker Ocean versus comparable EVs is expected to result primarily from the parts pricing and vehicle servicing approach of Fisker. Through Fisker’s direct sales and Flexee lease models, Fisker
de-emphasizes
service part markups, resulting in lower maintenance and repair costs. Additionally, Fisker’s vehicle bodies will be made of steel, which is less costly to repair, and repair centers for this type of body work are more widely available.Additionally, given the lower repair costs for Fisker vehicles, Fisker’s aim is to reduce insurance premiums for its customers. A key element that makes up customer TCO is cost of repair in the event of physical damage to the vehicle as a result of an impact. In order to deliver lowest possible TCO, Fisker has developed a repair strategy, which is aligned with independent insurance providers. This is developed as an intrinsic part of the engineering of the vehicle. To ensure Fisker has the lowest TCO in the industry, Fisker has studied in detail the highest quality material and joining technologies for all parts of the vehicle that could be damaged in a collision, from a low speed bump in a parking lot, to a major, high-speed impact. By analyzing in detail how the Fisker Ocean absorbs impact energy, Fisker is able to precisely place the right material in the right place on the vehicle. Consequently, the Fisker Ocean body structure will be made of several grades of steel—from basic, highly formable mild steel for the skin, to ultra-high strength, hot stamped Boron steel for high load bearing areas. These materials are compatible with ‘low tech’ repair methods, meaning that there are a huge number of fully qualified repair facilities already in operation throughout all of Fisker’s main intended markets. This ensures that the cost of every type of “standard”
in-service
repair will be known in advance and insurance premiums can be optimized as a result.Further, Fisker’s predictive maintenance through the telematics connection of the vehicle to Fisker’s cloud ensures maintenance is completed long before a part can break, saving significant costs for parts replacement and inferred damages.
Fisker Added Value
Because Fisker’s vehicles will adopt much of the base engineering from a platform provided by an established OEM, Fisker intends to focus its design and engineering efforts exclusively on what differentiates a Fisker product from the competition, leaving the “reinvention of the wheel” to competitors with the time, the money, and the inclination to do so.
79
Key among the attributes defining Fisker-brand design and engineering is exterior and interior design language. The Fisker Ocean will establish the look and feel of Fisker products going forward—an evolution of the design language Henrik Fisker developed over his career and with which he has become synonymous. A key element of this design language is the broad shouldered, “muscular” stance of the vehicle. In creating an exterior design with these proportions, the Fisker team has taken some key decisions intended to move typical autobody engineering solutions to a position more relevant to EVs. For instance, customers are less interested in the hardware “under the hood” of EVs as compared to vehicles with internal combustion engines. Given that fact, Fisker will adopt a fixed hood and, in doing so, create a new design language for the front end of its vehicles. Not only will this give Fisker vehicles a distinctive, unique look, it also simplifies an otherwise complex manufacturing build tolerance issue. This approach provides greater control of the
front-end
package and removes certain hardware, ultimately facilitating Fisker’s desire to design a vehicle with class-leading frontal high-speed impact and pedestrian impact safety.The Fisker Ocean will also introduce Fisker’s proprietary California Mode feature. This feature allows for all door windows, the sixth light in the rear quarter, the glazed roof, and the tailgate glass to be fully opened with a single press of one control. Not only does this provide the ideal combination of convertible “openness” with fixed roof safety and security, but it also adds utility to the vehicle, allowing long cargo to be carried through the open tailgate glass.
Fisker-brand design and engineering also encompasses Fisker’s goal to build the world’s most sustainable vehicles. On the exterior of the vehicle Fisker plans to install one of the largest automotive solar roof installations currently available. This feature will be designed to have the capability to deliver annually the equivalent of up to 1000km of completely carbon free miles. The technology behind this system is state of the art photovoltaic (“PV”) cells. Fisker is working with two suppliers who are leaders in their respective fields. The first supplier owns the PV technology that will deliver the panels generating the energy. These panels can be manufactured in complex shapes allowing them to be incorporated directly into the glass panels of the sunroof. Fisker’s second supplier, who specializes in the manufacture of opening glass roof panels, will incorporate the PV panels into a uniquely designed opening roof delivering a system that Fisker believes will be a world first in terms of a vehicle mounted, opening solar roof.
The sustainability features extend to the interior of the vehicle, where Fisker will utilize several materials that are at the cutting edge of recycling and reuse. For example, through the reuse of tire manufacturing byproducts, Fisker will significantly reduce the amount of process waste that would otherwise go to landfill. Fisker is also working with suppliers who recover and repurpose ocean waste. These suppliers recover plastic materials that have accumulated in oceans, such as bottles and fishing nets, and reprocess them into automotive grade feedstock which can then be used to manufacture new interior trim fabrics and moldings. In doing so Fisker reduces its requirement to source ‘new’ hydrocarbon-based feedstock, while simultaneously providing an outlet for, and thus supporting, those suppliers who are investing in ocean clean up as an alternate source of raw material.
Fisker design language extends further into the interior of the vehicle with the deployment of Fisker’s unique UI. In addition to seamless integration of user devices, such as mobile phones and tablets, Fisker has developed a curved central screen display that is the largest in its class. This screen is the centerpiece of the Fisker UI and will integrate all main vehicle electrical functions and settings into a single, simple interface. The ergonomics of the central screen are further enhanced by combining user programmable “soft keys” on the touch screen surface, with five fixed switches that control the five most frequently used functions. In this way Fisker will deliver a futuristic EV “glass cockpit” without the annoyance of searching through several menus to find that critical function, which has been a criticism of similar systems. The combination of this unique central screen and the digital driver’s display will ensure a class-leading user experience.
Customers and Backlog
Fisker’s inaugural EV, the Fisker Ocean, is an award-winning,
premium-yet-affordable,
all-electric
SUV that Fisker expects to begin producing in late 2022. Fisker has received over 40,000 indications of interest as of November 1, 2020 through its Flexee App. Also, as of November 1, 2020, Fisker has received over 9,100 paid reservations, including a fleet order of 300 cars placed by Viggo.80
In October 2020, Viggo HQ and Fisker announced the signing of a vehicle fleet order whereby Fisker will deliver 300 Fisker Ocean vehicles in the fourth quarter of 2022 to Viggo as part of Viggo’s expansion into Scandinavia.
Research and Development
Fisker’s research and development activities primarily take place at Fisker’s headquarters in Manhattan Beach, California, and at Fisker’s partners’ facilities.
The majority of Fisker’s current activities are primarily focused on the research and development of Fisker’s EVs and software technology platforms. Fisker undertakes significant testing and validation of its products in order to ensure that Fisker will meet the demands of its customers. Fisker is working with its strategic partners to bring Fisker Ocean and other future EV models to commercialization.
Sustainability Actions
As demonstrated in Fisker’s vision and mission, Fisker is committed to sustainability, which includes Fisker’s dedication not only to the environment, but also Fisker’s communities and other stakeholders. Fisker intends to engage with its community through direct actions such as beach
clean-ups,
and is currently evaluating incentive and other programs to support sustainability throughout its corporate activities.Fisker’s Commitment to Building a Leading ESG, Digital Car Company
Fisker believes that its commitment to building a world class digital automotive company upon a broad foundation of environmental, sustainability and ethical governance policies will benefit all of its consumers and help drive better, more efficient and more profitable results.
Fisker commits to establishing ESG goals and initiatives that are consistent with its mission, and to monitor and report on progress against these ESG initiatives. As part of such process, Fisker has identified specific areas that will benefit its employees, customers and stockholders and other stakeholders. And Fisker’s diverse Board of Directors is a testament to this commitment.
Intellectual Property
Fisker’s success depends in part upon Fisker’s ability to protect its core technology and intellectual property. Fisker attempts to protect its intellectual property rights, both in the United States and abroad, through a combination of patent, trademark, copyright and trade secret laws, as well as nondisclosure and invention assignment agreements with Fisker’s consultants and employees, and Fisker seeks to control access to and distribution of its proprietary information through
non-disclosure
agreements with Fisker’s vendors and business partners. Unpatented research, development and engineering skills make an important contribution to Fisker’s business, but Fisker pursues patent protection when Fisker believes it is possible and consistent with Fisker’s overall strategy for safeguarding intellectual property.As of October 30, 2020, Fisker owned 12 issued U.S. patents and has 10 pending or allowed U.S. patent applications and 17 foreign patent applications. In addition, Fisker has 20 registered U.S. trademark applications, 156 registered foreign trademark applications and eight pending trademark applications. Fisker’s patents and patent applications are directed to, among other things, vehicle design, engineering and battery technology.
Government Regulation and Credits
Fisker operates in an industry that is subject to extensive environmental regulation, which has become more stringent over time. The laws and regulations to which Fisker is subject govern, among others, water use; air emissions; use of recycled materials; energy sources; the storage, handling, treatment, transportation and disposal of hazardous materials; the protection of the environment, natural resources and endangered species; and the remediation of environmental contamination. Compliance with such laws and regulations at an international, regional, national, provincial and local level is an important aspect of Fisker’s ability to continue its operations.
81
Environmental standards applicable to Fisker are established by the laws and regulations of the countries in which Fisker operates, standards adopted by regulatory agencies and the permits and licenses. Each of these sources is subject to periodic modifications and what Fisker anticipates will be increasingly stringent requirements. Violations of these laws, regulations or permits and licenses may result in substantial civil and criminal fines, penalties, and possibly orders to cease the violating operations or to conduct or pay for corrective works. In some instances, violations may also result in the suspension or revocation of permits and licenses.
Emissions
In the U.S., Europe and China, there are vehicle emissions performance standards that will provide an opportunity for Fisker to sell emissions credits.
United States
California has greenhouse gas emissions standards that closely follow the standards of the U.S. Environmental Protection Agency. The registration and sale of Zero Emission Vehicles (“ZEVs”) in California will earn Fisker ZEV credits that Fisker can sell to other OEMs. Other U.S. states have adopted similar standards including Colorado, Connecticut, Maine, Maryland, Massachusetts, New Jersey, New York, Oregon, Rhode Island and Vermont. Fisker intends to take advantage of these regimes by registering and selling ZEVs in these other U.S. states.
ZEV credits in California are calculated under the ZEV Regulation and are paid in relation to ZEVs sold and registered in California including Battery Electric Vehicles (“BEVs”) and Fuel Cell Electric Vehicles (“FCEVs”).
The ZEV program assigns ZEV credits to each vehicle manufacturer. Vehicle manufacturers are required to maintain ZEV credits equal to a set percentage of
non-electric
vehicles sold and registered in California.Each vehicle sold and registered in California earns a number of credits based on the drivetrain type and the
all-electric
range (“AER”) of the vehicle under the Urban Dynamometer Driving Schedule Test Cycle.Plug-in
hybrid vehicles (“PHEVs”) receive between 0.4 and 1.3 credits per vehicle sold and registered in California. Battery electric and fuel cell vehicles receive between 1 and 4 credits per vehicle sold in California, based on range.The credit requirement was 7% in 2019 which required about 3% of sales to be ZEVs. The credit requirement will rise to 22 percent in 2025, which will require about 8 percent of sales to be ZEVs.
If a vehicle manufacturer does not produce enough EVs to meet its quota, it can choose to buy credits from other manufacturers who do or pay a $5,000 fine for each credit it is short. This should provide an opportunity for Fisker.
European Union
Regulation (EU) No. 443/2009 setting emissions performance standards for new passenger cars in the EU (as amended) provides that if the average CO2 emissions of a manufacturer’s fleet exceed its limit value in any Calendar Year from Calendar Year 2019 onwards, the manufacturer will have to pay to the European Commission an excess emissions premium of €95 for each subsequent CO2 g/km of exceedance per vehicle registered in the EU.
In the EU, manufacturers of passenger cars may act jointly through a pooling arrangement to collectively meet their CO2 emissions targets.
82
The indicative average EU fleet-wide emissions target for new passenger cars for the calendar year 2019 was 130 CO2 g/km. From 1 January 2020 this target has been reduced to 95 CO2 g/km. From 1 January 2020 until 31 December 2024 this target will be complemented by additional measures corresponding to a reduction of 10 CO2 g/km. Between 2025 and 2029 the target will be 15% stricter compared to 2021. From 1 January 2030, the target will be equal to a 37.5% reduction of the target in 2021.
The European Commission adjusts the Specific Emissions Target each year for each manufacturer on the basis of the average mass of the relevant passenger cars using a limit value curve. This is laid down in Implementing Decisions.
Manufacturers of passenger cars are given additional incentives to put on the European market zero and
low-emission
passenger cars emitting less than 50 CO2 g/km through a “super-credits” system. These are taken into account for the calculation of a manufacturer’s specific average emissions. Such passenger cars are to be counted as 2 vehicles in 2020, 1.67 vehicles in 2021, 1.33 vehicles in 2022, and 1 vehicle from 2023 onwards (subject to a cap of 7.5 CO2 g /km over the 2020-2022 period for each manufacturer).Given that the specific average emissions of CO2 of Fisker’s electric passenger cars will be 0.000 CO2 g/km per vehicle registered in the EU, this will provide an opportunity for other manufacturers, which may not otherwise meet their specific CO2 emissions targets, to pay Fisker to consolidate their fleets with those of Fisker via a pooling arrangement for CO2 emissions compliance purposes.
China
The Chinese New Energy Vehicle (“NEV”) legislation is a modified version of the Californian ZEV Regulation. The NEV program assigns NEV credits to each passenger vehicle manufacturer. Passenger vehicle manufacturers are required to maintain NEV credits equal to a set percentage of
non-electric
vehicles sold registered in China.Each NEV sold and registered in China earns a number of credits taking into account factors such as energy efficiency and driving range. Higher performance vehicles receive more credits, capped at six credits per vehicle.
The NEV credit target is 12% in 2020. The NEV credit target is set to increase to 14% in 2021, 16% in 2022 and 18% in 2023.
The system also allows passenger vehicle manufacturers to use surplus NEV credits to offset corporate average fuel consumption (“CAFC”) credit deficits.
The policy creates a market for credits that will benefit manufacturers of electric passenger vehicles such as Fisker. Surplus NEV credits can be sold to other companies, and surplus CAFC credits can be banked and carried forward to help with CAFC compliance in future years or transferred to affiliated companies to help offset a CAFC credit deficit.
If a passenger vehicle manufacturer fails to meet CAFC or NEV credit targets after adopting all possible compliance pathways, China’s Ministry of Industry and Information Technology may deny type approval for new models that cannot meet their specific fuel consumption standards until those deficits are fully offset.
EPA Emissions and Certificate of Conformity
The U.S. Clean Air Act requires that Fisker obtain a Certificate of Conformity issued by the EPA and a California Executive Order issued by the California Air Resources Board (“CARB”), concerning emissions for its vehicles. A Certificate of Conformity is required for vehicles sold in states covered by the Clean Air Act’s standards and an Executive Order is required for vehicles sold in states that have sought and received a waiver from the EPA to utilize California standards. CARB sets the California standards for emissions control for certain regulated pollutants for new vehicles and engines sold in California. States that have adopted the California standards as approved by EPA also recognize the Executive Order for sales of vehicles. There are currently four states which have adopted the California standard for heavy-duty vehicles.
83
The Greenhouse Gas Rule was incorporated into the Clean Air Act on August 9, 2011. Since Fisker’s vehicles have
zero-emissions,
Fisker is required to seek an EPA Certificate of Conformity for the Greenhouse Gas Rule, and a CARB Executive Order for the CARB Greenhouse Gas Rule.Vehicle Safety and Testing
Fisker’s vehicles will be subject to, and will be required to comply with, numerous regulatory requirements established by the National Highway Traffic Safety Administration (“NHTSA”), including applicable U.S. federal motor vehicle safety standards (“FMVSS”). Fisker intends that the Fisker Ocean will fully comply with all applicable FMVSSs without the need for any exemptions, and expects future Fisker vehicles to either fully comply or comply with limited exemptions related to new technologies. Additionally, there are regulatory changes being considered for several FMVSSs, and while Fisker anticipates compliance, there is no assurance until final regulation changes are enacted.
As a manufacturer, Fisker must self-certify that its vehicles meet all applicable FMVSSs, as well as the NHTSA bumper standard, or otherwise are exempt, before the vehicles can be imported or sold in the U.S. Numerous FMVSSs will apply to Fisker’s vehicles, such as crash-worthiness requirements, crash avoidance requirements and EV requirements. Fisker will also be required to comply with other federal laws administered by NHTSA, including the CAFE standards, Theft Prevention Act requirements, consumer information labeling requirements, Early Warning Reporting requirements regarding warranty claims, field reports, death and injury reports and foreign recalls and owner’s manual requirements.
The Automobile Information and Disclosure Act requires manufacturers of motor vehicles to disclose certain information regarding the manufacturer’s suggested retail price, optional equipment and pricing. In addition, this law allows inclusion of city and highway fuel economy ratings, as determined by EPA, as well as crash test ratings as determined by NHTSA if such tests are conducted.
Fisker’s vehicles that may be sold outside of the U.S. are subject to similar foreign safety, environmental and other regulations. Many of those regulations are different from those applicable in the U.S. and may require redesign and/or retesting. The European Union has established new rules regarding additional compliance oversight that are scheduled to commence in 2020, and there is also regulatory uncertainty related to the United Kingdom’s withdrawal from the European Union. These changes could impact the rollout of new vehicle features in Europe.
In addition to the various territorial legal requirements Fisker is obligated to meet, the Fisker Ocean is engineered to deliver
5-star
performance in the two main voluntary vehicle safety performance assessment programs, U.S. New Car Assessment Program (“NCAP”) and Euro NCAP. Five-star is the maximum attainable score. These independent organizations have introduced a number of additional safety related tests aimed at improving the safety of passenger vehicles, both for occupants and pedestrians involved in collisions with vehicles. Some of these tests are derived from the legal tests, such as side impact, but have higher performance requirements. Others are unique to the program. Areas covered by these tests in 2020 include:| • | Mobile Progressive Deformable Barrier |
| • | Full Width Rigid Barrier |
| • | Mobile Side Impact Barrier |
| • | Side Pole |
| • | Far Side Impact |
| • | Whiplash |
| • | Vulnerable Road Users (Pedestrians and Cyclists) |
| • | Safety Assist |
| • | Rescue and Extrication |
84
The Fisker Ocean will also be equipped with certain advanced driving assistance features which may allow Fisker to garner further Euro NCAP awards for features which are not yet a formal part of the 5 Star rating. This will help promote the advanced societal benefits of the Fisker Ocean.
Strategic Collaborations
Magna
On October 14, 2020, Fisker and Spartan entered into a cooperation agreement with Magna setting forth certain terms for the development of a full electric vehicle (the “Cooperation Agreement”). The Cooperation Agreement sets out the main terms and conditions of the upcoming operational phase agreements (the “Operational Phase Agreements”) that will extend from the Cooperation Agreement and other agreements with Magna that are expected to be entered into by and between Fisker and Magna (or its affiliates). The upcoming Operational Phase Agreements referenced in the Cooperation Agreement relate to various platform and manufacturing agreements. The Cooperation Agreement provides that the Company would issue to Magna warrants to purchase Class A Common Stock in an amount equal to six percent (6%) of the capital stock of the Company on a fully diluted basis (which means for these purposes, after giving effect to the deemed conversion or exercise of all options, warrants and other convertible securities of the Company outstanding on the issuance date;, that the “public warrants” sold as part of the units issued by Spartan in its IPO which closed on August 14, 2018 shall not be deemed to be exercised for these purposes) after giving effect to the Merger and issuance of the warrants to purchase such shares to Magna, with an exercise price of $0.01 per share of (the “Magna Warrants”). On October 29, 2020, the Company issued to Magna 19,474,454 Magna Warrants. The Magna Warrants are subject to vesting as follows:
provided, however
Milestones | Percentage of Warrants that Vest Upon Achievement | |||
(i) Achievement of the “preliminary production specification” gateway as set forth in the Development Agreement; (ii) entering into the Platform Agreement; and (iii) entering into the Initial Manufacturing Agreement | 33.3 | % | ||
(i) Achievement of the “target agreement” gateway as set forth in the Development Agreement and (ii) entering into the Detailed Manufacturing Agreement, which will contain terms and conditions agreed to in the Initial Manufacturing | 33.3 | % | ||
Start of pre-serial production | 33.4 | % | ||
Additionally, the shares of Class A Common Stock underlying the Magna Warrants are entitled to registration rights under the A&R Registration Rights Agreement and Magna entered into a
Lock-Up
Agreement on the same terms as the other investors in Fisker.The Cooperation Agreement, and all rights and obligations of the parties thereunder, shall terminate upon any termination of the Business Combination Agreement. Fisker and Magna have not entered into a binding definitive agreement for manufacturing of Fisker’s vehicles and there is no guarantee that such a binding definitive agreement will be reached.
Employees
Fisker prides itself on the quality of its diverse team by seeking to hire only employees dedicated and aligned with Fisker’s strategic mission. Fisker works to leverage partnerships and modulate hiring based on Fisker’s product roadmap. As of October 30, 2020, Fisker employed 82 full-time employees and approximately 24 consultants based primarily in Fisker’s headquarters in Manhattan Beach, California. A majority of Fisker’s employees are engaged in research and development and related functions. To date, Fisker has not experienced any work stoppages and considers Fisker’s relationship with its employees to be in good standing. None of Fisker’s employees are either represented by a labor union or subject to a collective bargaining agreement.
85
Properties
In November 2020, Fisker moved its corporate headquarters from Torrance, California to Manhattan Beach, California, where Fisker occupies 72,649 square feet of space which it uses for an automobile design studio and general office purposes for its management, technology, product design, sales and marketing, finance, legal, human resources, general administrative and information technology teams. The lease term commenced on November 1, 2020 and will terminate on May 1, 2026. The Company has an option to extend the lease for an additional five years. The Company may be obligated to pay amounts in addition to the base rent in the form of an operating expense adjustment, contingent upon the Company’s operations reaching certain operating expenses thresholds.
The Company entered into a sublease agreement for 5,533 square feet of office and research and development space in San Francisco, California. The term of the sublease commenced on October 2, 2020 and will expire on March 31, 2024. The sublease does not expressly allow for renewal of the lease term.
The Company believes its existing facilities are adequate for its current requirements. The Company also believes it will be able to obtain additional or alternative space at other locations at commercially reasonable terms to support its continuing expansion.
Legal Proceedings
From time to time, Fisker may become involved in additional legal proceedings arising in the ordinary course of its business. Fisker is not currently a party to any legal proceedings the outcome of which, if determined adversely to Fisker, would individually or in the aggregate have a material adverse effect on its business, financial condition, and results of operations.
86
MANAGEMENT
Executive Officers and Directors
Our directors and executive officers and their ages as of October 30, 2020 are as follows:
Executive Officers
| Henrik Fisker | 57 | Chairman of the Board, President and Chief Executive Officer | ||
| Dr. Geeta Gupta | 46 | Chief Financial Officer and Director | ||
| Dr. Burkhard J. Huhnke | 53 | Chief Technology Officer |
Non-Employee
Directors| Wendy J. Greuel (1) | 59 | Director | ||
| Mark E. Hickson (1)(3) | 53 | Director | ||
| William R. McDermott (1) | 59 | Director | ||
| Roderick K. Randall (2) | 61 | Director | ||
| Nadine I. Watt (2) | 52 | Director |
| (1) | Member of the audit committee. |
| (2) | Member of the compensation committee. |
| (3) | Member of the nominating and corporate governance committee. |
Executive Officers
Henrik Fisker
co-founder,
Mr. Fisker, has served as Chairman of the Board and as our Chief Executive Officer since October 2020 and prior to this, served as Chief Executive Officer of Legacy Fisker since September 2016 and as President since October 2020, and he is married to Dr. Geeta Gupta, hisco-founder
and our Chief Financial Officer and a member of our Board. Although Mr. Fisker spends significant time with Fisker and is highly active in our management, he does not devote his full time and attention to Fisker. Since 2013, Mr. Fisker has served as Managing Member of HF Design LLC (“HF Design”). Mr. Fisker served as a Senior Advisor at McKinsey & Company where he worked from 2013 to 2016. In addition, from 2015 to 2017, he served as the Chief of Product and Design of VLF Automotive, LLC, which heco-founded.
From 2007 to 2011, Mr. Fisker served as Chief Executive Officer and Chief Design Officer of Fisker Automotive, Inc., which heco-founded,
and he served as Executive Chairman from 2012 to 2013. In 2013, Fisker Automotive, Inc. voluntarily filed for Chapter 11 bankruptcy with the United States Bankruptcy Court for the District of Delaware after Mr. Fisker had stepped down as its Executive Chairman. Prior to that, from 2000 to 2005, Mr. Fisker served as Creative Director at Ford Motor Company and Design Director at Aston Martin Lagonda Ltd, which was a subsidiary of Ford Motor Company at the time. He was also the Designer at Bayerische Flugzeugwerke AG (“BMW”) from 1999 to 2000. Mr. Fisker holds a Bachelor of Science in Automotive Design from the ArtCentre College of Design, California.We believe that Mr. Fisker is qualified to serve as a director because of his operational and historical expertise gained from serving as our Chief Executive Officer, and his extensive professional and educational experience in the automotive industry.
Dr.
Geeta Gupta
co-founder
and our Chief Executive Officer and Chairman of the Board. Prior to founding Fisker, Dr. Gupta served as an Entrepreneur and Investment Manager for the Fisker family from 2014 to 2020. Previously, Dr. Gupta served as an Investment Advisor at the Alfred Mann Foundation from 2013 to 2014. Dr. Gupta holds a Bachelor’s Degree in Zoology/Animal Biology from Maitrey College, New Delhi, India, a Master’s Degree in Biotechnology from the University of Kent, United Kingdom, a Doctor of Philosophy, Ph.D., in Biotechnology/Organic Chemistry from the University of Cambridge, United Kingdom, where she was an EPSRC Postdoctoral Research Newton Fellow.87
We believe that Dr. Gupta is qualified to serve as a director because of her historical expertise gained from serving as our Chief Financial Officer, and her financial and investing experience.
Dr.
Burkhard J. Huhnke
e-mobility
at Volkswagen of America, Inc. From 2011 to 2014, Dr. Huhnke served as the Senior General Manager of Electronics Development at Volkswagen AG. Dr. Huhnke holds an electrical engineering diploma and a doctorate in engineering from the Technical University of Braunschweig, Germany.Key Employee
Martin T. Welch
Non-Employee
DirectorsWendy J. Greuel
We believe that Ms. Greuel’s extensive executive and professional experience as a business consultant qualify her to serve as a director.
Mark E. Hickson
We believe that Mr. Hickson’s extensive executive and professional experience in the energy industry qualify him to serve as a director.
William R. McDermott
Co-Chief
Executive Officer, and from 2014 until October 2019, as sole Chief Executive Officer, of SAP SE (“SAP”), a multinational software company providing enterprise software. Mr. McDermott joined SAP in 2002 as Chief Executive Officer of SAP America, Inc., and served on the SAP Executive Board from 2008 until October 2019. Prior to joining SAP, Mr. McDermott served as Executive Vice President of Worldwide Sales and Operations at Siebel CRM Systems, Inc. from 2001 to 2002 and served as President of Gartner, Inc. from 2000 to 2001. Mr. McDermott also serves as a member of the board of directors of ServiceNow, Inc. Mr. McDermott holds a Bachelor’s Degree from Dowling College, New York, a Master of Business Administration from Northwestern University’s Kellogg School of Management and participated in the Executive Development Program of the Wharton School, University of Pennsylvania.88
We believe Mr. McDermott is qualified to serve as a director because of his extensive executive experience in the technology industry, including his leadership experience with a leading global business, as Chief Executive Officer, and his service on a number of public company boards which provides an important perspective on operations, finance and corporate governance.
Roderick K. Randall
We believe that Mr. Randall is qualified to serve as a director because of his extensive experience in the technology industry, his experience as a venture capitalist and his service on multiple boards of various technology companies.
Nadine I. Watt
We believe that Ms. Watt is qualified to serve as a director because of her extensive experience in management and her prior service on a number of public company boards, which provides an important perspective on operations and corporate governance matters.
Board Composition
Our business and affairs are organized under the direction of the Board. The Board consists of seven members. Henrik Fisker serves as Chairman of the Board. The primary responsibilities of the Board are to provide oversight, strategic guidance, counseling and direction to our management. The Board will meet on a regular basis and additionally as required.
In accordance with the terms of the Bylaws, the Board is divided into three classes, Class I, Class II and Class III, with members of each class serving staggered three-year terms. The Board is divided into the following classes:
| • | Class I, which consists of Wendy J. Greuel and Roderick K. Randall, whose terms will expire at our first annual meeting of stockholders to be held after consummation of the Business Combination; |
| • | Class II, which consists of Dr. Geeta Gupta, Nadine I. Watt and William R. McDermott, whose terms will expire at our second annual meeting of stockholders to be held after consummation of the Business Combination; and |
| • | Class III, which consists of Henrik Fisker and Mark E. Hickson, whose terms will expire at our third annual meeting of stockholders to be held after consummation of the Business Combination. |
89
At each annual meeting of stockholders to be held after the initial classification, the successors to directors whose terms then expire will be elected to serve from the time of election and qualification until the third annual meeting following their election and until their successors are duly elected and qualified. This classification of the Board may have the effect of delaying or preventing changes in our control or management. Our directors may be removed for cause by the affirmative vote of the holders of at least
two-thirds (2/3)
of our voting stock.Director Independence; Controlled Company Exemption
The Board determined that each of the directors on the Board other than Henrik Fisker and Dr. Geeta Gupta, qualify as independent directors, as defined under the listing rules of the NYSE, and the Board consists of a majority of “independent directors,” as defined under the rules of the SEC and NYSE listing rules relating to director independence requirements. In addition, we are subject to the rules of the SEC and the NYSE relating to the membership, qualifications, and operations of the audit committee, as discussed below.
Henrik Fisker and Dr. Geeta Gupta control a majority of the voting power of our outstanding capital stock. As a result, we are a “controlled company” under NYSE rules. As a controlled company, we are exempt from certain NYSE corporate governance requirements, including those that would otherwise require our Board of Directors to have a majority of independent directors and require that we either establish compensation and nominating and corporate governance committees, each comprised entirely of independent directors, or otherwise ensure that the compensation of our executive officers and nominees for directors are determined or recommended to the Board of Directors by the independent members of the Board of Directors. While we do not currently intend to rely on any of these exemptions, we will be entitled to do so for as long as we are considered a “controlled company,” and to the extent we relies on one or more of these exemptions, holders of our capital stock will not have the same protections afforded to stockholders of companies that are subject to all of the NYSE corporate governance requirements.
Board Leadership Structure
The Board believes that it should maintain the flexibility to select the Chairman of the Board and adjust its board leadership structure from time to time. Mr. Fisker is currently serving as both Fisker’s Chief Executive Officer and the Chairman of the Board. The Board determined that having its Chief Executive Officer also serve as the Chairman of the Board provides Fisker with optimally effective leadership and is in its best interests and those of its stockholders. Mr. Fisker founded and has led Fisker since its inception. The Board believes that Mr. Fisker’s strategic vision for the business, his
in-depth
knowledge of our operations, the EV industry, and his experience serving as the Chairman of the Board and Chief Executive Officer since Legacy Fisker’s inception make him well qualified to serve as both Chairman of the Board and Chief Executive Officer.Role of the Board in Risk Oversight
One of the key functions of the Board is informed oversight of our risk management process. The Board does not have a standing risk management committee, but rather administers this oversight function directly through the Board as a whole, as well as through various standing committees of the Board that address risks inherent in their respective areas of oversight. In particular, the Board is responsible for monitoring and assessing strategic risk exposure and our audit committee has the responsibility to consider and discuss our major financial risk exposures and the steps our management will take to monitor and control such exposures, including guidelines and policies to govern the process by which risk assessment and management is undertaken. The audit committee also monitors compliance with legal and regulatory requirements. Our compensation committee also assesses and monitors whether our compensation plans, policies and programs comply with applicable legal and regulatory requirements. Our nominating and corporate governance committee monitors the effectiveness of our governance guidelines.
90
Board Committees
In connection with the consummation of the Business Combination, the Board established an audit committee, a compensation committee and a nominating and corporate governance committee, each of which have the composition and responsibilities described below. Members will serve on these committees until their resignation or until otherwise determined by the Board. Each committee operates under a charter previously approved by the Board. Copies of each charter are posted on the Corporate Governance section of our website at www.fiskerinc.com. Our website and the information contained on, or that can be accessed through, our website is not deemed to be incorporated by reference in, and is not considered part of, this prospectus.
Audit Committee
Our audit committee consists of Wendy J. Greuel, Mark E. Hickson and William R. McDermott, with Wendy J. Greuel serving as audit committee chairperson. The Board has determined that Wendy J. Greuel, Mark E. Hickson and William R. McDermott each meet the requirements for independence and financial literacy under the current NYSE listing standards and SEC rules and regulations, including
Rule 10A-3.
In addition, the Board has determined that Ms. Greuel, Mr. Hickson and Mr. McDermott each qualifies as an “audit committee financial expert” within the meaning of Item 407(d) ofRegulation S-K
promulgated under the Securities Act. This designation does not impose any duties, obligations, or liabilities that are greater than are generally imposed on members of the audit committee and the Board. The audit committee is responsible for, among other things:| • | selecting a qualified firm to serve as the independent registered public accounting firm to audit our financial statements; |
| • | helping to ensure the independence and overseeing the performance of the independent registered public accounting firm; |
| • | reviewing and discussing the scope and results of the audit with the independent registered public accounting firm and reviewing, with management and that firm, our interim and year-end operating results; |
| • | reviewing our financial statements and critical accounting policies and estimates; |
| • | reviewing the adequacy and effectiveness of our internal controls; |
| • | developing procedures for employees to submit concerns anonymously about questionable accounting, internal accounting controls, or audit matters; |
| • | overseeing our policies on risk assessment and risk management; |
| • | overseeing compliance with our code of business conduct and ethics; |
| • | reviewing related party transactions; and |
| • | approving or, as permitted, pre-approving all audit and all permissiblenon-audit services (other than de minimisnon-audit services) to be performed by the independent registered public accounting firm. |
The audit committee operates under a written charter, which satisfies the applicable rules of the SEC and the listing standards of NYSE, and which is available on our website. All audit services to be provided to us and all permissible
non-audit
services, other thande minimis
non-audit
services, to be provided to us by our independent registered public accounting firm will be approved in advance by the audit committee.Compensation Committee
Our compensation committee consists of Nadine I. Watt and Roderick K. Randall. Ms. Watt is the chairperson of the compensation committee. The Board has determined that the composition of the compensation committee will meet the requirements for independence under the current NYSE listing standards and SEC rules and regulations. Each member of the committee is a
non-employee
director, as defined inRule 16b-3
promulgated under the Exchange Act. The compensation committee is responsible for, among other things:91
| • | reviewing, approving and determining, or making recommendations to the Board regarding, the compensation of our executive officers, including the Chief Executive Officer; |
| • | making recommendations regarding non-employee director compensation to our full Board of Directors; |
| • | administering our equity compensation plans and agreements with our executive officers; |
| • | reviewing, approving and administering incentive compensation and equity compensation plans; and |
| • | reviewing and approving our overall compensation philosophy. |
The compensation committee operates under a written charter, which satisfies the applicable rules of the SEC and the listing standards of NYSE, and which is available on our website.
Nominating and Corporate Governance Committee
Our nominating and corporate governance committee consists of Mark E. Hickson. Mr. Hickson is the chairperson of the nominating and corporate governance committee. The Board has determined that the composition of the nominating and corporate governance committee will meet the requirements for independence under the current NYSE listing standards and SEC rules and regulations. The nominating and corporate governance committee is responsible for, among other things:
| • | identifying, evaluating and selecting, or making recommendations to the Board regarding nominees for election to the Board of Directors and its committees; |
| • | considering and making recommendations to the Board regarding the composition of the Board of Directors and its committees; |
| • | developing and making recommendations to the Board regarding corporate governance guidelines and matters; |
| • | overseeing our corporate governance practices; |
| • | overseeing the evaluation and the performance of the Board and individual directors; and |
| • | contributing to succession planning. |
The nominating and corporate governance committee operates under a written charter, which satisfies the applicable rules of the SEC and the NYSE listing standards and is available on our website.
Compensation Committee Interlocks and Insider Participation
None of the members of the compensation committee is or has been at any time one of our officers or employees. None of our executive officers currently serves, or in the past fiscal year has served, as a member of the Board or compensation committee (or other Board of Directors committee performing equivalent functions or, in the absence of any such committee, the entire Board of Directors) of any entity that has one or more executive officers serving as a member of the Board or compensation committee.
92
Code of Ethics
The Board has adopted a Code of Business Conduct and Ethics that applies to all of our directors, officers and employees, including our principal executive officer, principal financial officer, principal accounting officer or controller, or persons performing similar functions. The Code of Business Conduct and Ethics is available on the Corporate Governance section of our website. In addition, we have posted on the Corporate Governance section of our website all disclosures that are required by law or the listing standards of the NYSE concerning any amendments to, or waivers from, any provision of the Code of Business Conduct and Ethics. The reference to our website address in this prospectus does not include or incorporate by reference the information on our website into this prospectus.
Limitation on Liability and Indemnification of Directors and Officers
The Certificate of Incorporation limits our directors’ liability to the fullest extent permitted under the “DGCL”. The DGCL provides that directors of a corporation will not be personally liable for monetary damages for breach of their fiduciary duties as directors, except for liability:
| • | for any transaction from which the director derives an improper personal benefit; |
| • | for any act or omission not in good faith or that involves intentional misconduct or a knowing violation of law; |
| • | for any unlawful payment of dividends or redemption of shares; or |
| • | for any breach of a director’s duty of loyalty to the corporation or its stockholders. |
If the DGCL is amended to authorize corporate action further eliminating or limiting the personal liability of directors, then the liability of our directors will be eliminated or limited to the fullest extent permitted by the DGCL, as so amended.
Delaware law and the Bylaws provide that we will, in certain situations, indemnify our directors and officers and may indemnify other employees and other agents, to the fullest extent permitted by law. Any indemnified person is also entitled, subject to certain limitations, to advancement, direct payment, or reimbursement of reasonable expenses (including attorneys’ fees and disbursements) in advance of the final disposition of the proceeding.
In addition, we entered into separate indemnification agreements with our directors and officers. These agreements, among other things, require us to indemnify our directors and officers for certain expenses, including attorneys’ fees, judgments, fines and settlement amounts incurred by a director or officer in any action or proceeding arising out of their services as one of our directors or officers or any other company or enterprise to which the person provides services at our request.
We maintain a directors’ and officers’ insurance policy pursuant to which our directors and officers are insured against liability for actions taken in their capacities as directors and officers. We believe these provisions in the Certificate of Incorporation, Bylaws and these indemnification agreements are necessary to attract and retain qualified persons as directors and officers.
Insofar as indemnification for liabilities arising under the Securities Act may be permitted to directors, officers, or control persons, in the opinion of the SEC, such indemnification is against public policy as expressed in the Securities Act and is therefore unenforceable.
Non-Employee
Director CompensationHistorically, we have neither had a formal compensation policy for ourexpenses incurred in connection with attending Board of Director and committee meetings and occasionally granted stock options to our
non-employee
directors, nor have we had a formal policy of reimbursing expenses incurred by ournon-employee
directors in connection with their board service. However, we have reimbursed ournon-employee
directors for reasonable travel andout-of-pocket
non-employee
directors. Directors who are also employees do not receive any compensation for their services as directors.93
The table below summarizes the compensation of each person serving as a” for a summary of the compensation provided to our named executive officers Mr. Fisker and Dr. Gupta.
non-employee
director in 2019. Neither Henrik Fisker, our Chief Executive Officer, nor Dr. Geeta Gupta, our Chief Financial Officer, received any additional compensation for service as directors in 2019. See the section titled “Executive Compensation
All Other Option Awards Compensation | ||||||||||||
Name | $ (1) | $ (2) | Total ($) | |||||||||
Roderick Randall | — | — | — | |||||||||
Morana Jovan (3) | — | 28,961 | 28,961 | |||||||||
| (1) | Mr. Randall held outstanding stock options covering 58,829 Legacy Fisker shares (pre-combination shares) as of December 31, 2019. No othernon-employee director held, directly or indirectly, as of December 31, 2019 outstanding stock options. |
| (2) | With respect to Ms. Jovan, the amount in this column represents the value of a stock option provided in consideration of services Globeways Holdings Limited performed as a consultant to Legacy Fisker. Ms. Jovan is the sole owner of Globeways Holdings Limited. The services Globeways Holdings Limited performed as a consultant to Legacy Fisker were distinct from Ms. Jovan’s services as a director of Legacy Fisker. The dollar amounts reported in this column represent the aggregate grant date fair value for financial statement reporting purposes of stock options granted in 2019 under the Legacy Fisker 2016 Stock Plan as calculated in accordance with FASB ASC Topic 718. This amount reflects our accounting expense for this stock option and does not represent the actual economic value that may be realized by the optionee. There can be no assurance that this amount will ever be realized. The valuation assumptions used in calculating the fair value of this stock option is set forth in Note 13 to the financial statements. As required by SEC rules, the amounts shown excludes the impact of estimated forfeitures related to service-based vesting conditions. |
| (3) | Ms. Jovan resigned from the Legacy Fisker board of directors effective March 21, 2019. |
The Board adopted an Outside Director Compensation Policy (the “Policy”), which was effective as of the consummation of the Business Combination, which Policy sets forth the terms upon which
non-employee
directors are compensated for their service on the Board. Under the terms of the Policy, eachnon-employee
director will receive an annual cash retainer of $50,000 and the lead independent director (if applicable) will receive an additional annual cash retainer of $25,000. The chairpersons of the audit committee, compensation committee and nominating and corporate governance committee will receive additional annual cash retainers of $25,000, $18,000 and $10,000, respectively. Other members of the audit committee, compensation committee and nominating and corporate governance committee will receive additional annual cash retainers of $10,000, $7,500 and $5,000, respectively.Under the terms of the Policy, (a) on the date of each annual meeting of the Company, each continuing
non-employee
director will also receive a grant of restricted stock units having a value of $200,000, vesting in equal quarterly installments over the12-month
period following the grant date, and (b) on the date anynon-employee
director is newly elected or appointed, such person will receive a grant of restricted stock units having a value of $200,000,pro-rated
based on the number full months that are expected to lapse between such appointment date and the next annual meeting of the Company and vesting in equal installments on each full quarterly anniversary from the Company’s last annual meeting that are expected to lapse between the director’s election or appointment and the next annual meeting, subject in each case to such director’s continued service as a member of the Board through each applicable vesting date. Restricted stock units granted under the Policy will automatically vest on a change in control of the Company during the director’s service period. Under the terms of the Policy,non-employee
directors may elect to convert all or a portion of their annual cash retainer for Board service (not including any annual retainer that a director may receive for serving as lead independent director (if applicable) and not including any annual retainers for committee service) into restricted stock units or to convert all or a portion of their restricted stock units into cash, as more fully set forth in the terms of the Policy.94
EXECUTIVE COMPENSATION
Our compensation committee has designed, and intends to modify as necessary, our compensation and benefits program to attract, retain, incentivize and reward deeply talented and qualified executives who share our philosophy and desire to work towards achieving these goals.
We believe our compensation program should promote the success of the company and align executive incentives with the long-term interests of our stockholders. Our current compensation programs reflect its startup origins in that they consist primarily of salary and stock option awards. As our needs evolve, we intend to continue to evaluate our philosophy and compensation programs as circumstances require.
This section provides an overview of our executive compensation programs, including a narrative description of the material factors necessary to understand the information disclosed in the summary compensation table below.
We have opted to comply with the executive compensation disclosure rules applicable to “emerging growth companies,” within the meaning of the Jumpstart Our Business Startups Act of 2012. These rules require reduced compensation disclosure for our principal executive officer and our two most highly compensated executive officers other than our principal executive officer (the named executive officers).
Prior to the formation of our compensation committee, our Board of Directors, with input from our Chief Executive Officer, has historically determined the compensation for our named executive officers. For the year ended December 31, 2019, our named executive officers were:
| • | Henrik Fisker, President and Chief Executive Officer; and |
| • | Dr. Geeta Gupta, Chief Financial Officer. |
Summary Compensation Table
The following table presents information regarding the total compensation awarded to, earned by, and paid to our named executive officers for services rendered to us in all capacities for 2019.
Name and Principal Position | Year | Salary ($) | All Other Compensation($) (1) | Total ($) | ||||||||||||
Henrik Fisker | 2019 | 42,197 | 8,985 | 51,182 | ||||||||||||
President, Chief Executive Officer and Chairman of the Board | ||||||||||||||||
Dr. Geeta Gupta | 2019 | 45,673 | 6,500 | 52,173 | ||||||||||||
Chief Financial Officer and Former President (2) | ||||||||||||||||
| (1) | Reflects policy premiums for term life insurance covering Mr. Fisker in the amount of $2,485, which we pay. We also provided the following auto allowances to certain of our named executive officers: Mr. Fisker ($6,500) and Dr. Gupta ($6,500). |
| (2) | Effective October 2, 2020, Mr. Fisker assumed the role of President. |
Narrative Disclosure to Summary Compensation Table
For 2019, the compensation program for our named executive officers consisted of base salary and certain perquisites.
95
Base Salary
We have historically paid each of Mr. Fisker and Dr. Gupta an annual base salary equal to the minimum base salary required to be paid under applicable law. Effective August 1, 2020, Dr. Gupta’s annual base salary was increased to $325,000.
Cash Bonus
We have not had any formal arrangements with our named executive officers providing for annual cash bonus awards.
The Executive Incentive Bonus Plan, or Bonus Plan, was adopted on October 4, 2020, effective as of the consummation of the Business Combination. The purpose of the Bonus Plan is to motivate and reward eligible officers and employees for their contributions toward the achievement of certain performance goals.
Administration.
Performance criteria.
non-sales
revenue; (ii) return on revenues; (iii) operating income; (iv) income or earnings including operating income; (v) income or earnings before or after taxes, interest, depreciation, and/or amortization; (vi) income or earnings from continuing operations; (vii) net income;(viii) pre-tax
income orafter-tax
income; (ix) net income excluding amortization of intangible assets, depreciation, and impairment of goodwill and intangible assets and/or excluding charges attributable to the adoption of new accounting pronouncements; (x) raising of financing or fundraising; (xi) project financing; (xii) revenue backlog; (xiii) gross margin; (xiv) operating margin or profit margin; (xv) capital expenditures, cost targets, reductions, and savings and expense management; (xvi) return on assets (gross or net), return on investment, return on capital, or return on stockholder equity; (xvii) cash flow, free cash flow, cash flow return on investment (discounted or otherwise), net cash provided by operations, or cash flow in excess of cost of capital; (xviii) performance warranty and/or guarantee claims; (xix) stock price or total stockholder return; (xx) earnings or book value per share (basic or diluted); (xxi) economic value created;(xxii) pre-tax
profit orafter-tax
profit; (xxiii) strategic business criteria, consisting of one or more objectives based on meeting specified market penetration or market share, completion of strategic agreements such as licenses, funded collaborations, joint ventures acquisitions, and the like, geographic business expansion, objective customer satisfaction or information technology goals, or intellectual property asset metrics; (xxiv) objective goals relating to divestitures, joint ventures, mergers, acquisitions, and similar transactions; (xxv) objective goals relating to staff management, results from staff attitude and/or opinion surveys, staff satisfaction scores, staff safety, staff accident and/or injury rates, compliance, headcount, performance management, or completion of critical staff training initiatives; (xxvi) objective goals relating to projects, including project completion, timing and/or achievement of milestones, project budget, or technical progress against work plans; (xxvii) key regulatory objectives or milestones; and (xxviii) enterprise resource planning.However, awards issued to participants may take into account other factors (including subjective factors). Performance goals may differ from participant to participant, performance period to performance period, and from award to award. Any criteria used may be measured, as applicable, (i) in absolute terms, (ii) in relative terms (including, but not limited to, any increase (or decrease) over the passage of time and/or any measurement against other companies or financial or business or stock index metrics particular to us), (iii) on a per share and/or share per capita basis, (iv) against our performance as a whole or against any of our affiliate(s), or a particular segment(s), our business unit(s) or a product(s) or individual project company, (v) on a
pre-tax
orafter-tax
basis, and/or (vi) using an actual foreign exchange rate or on a foreign exchange neutral basis.96
Service requirement.
Amendment or Termination.
Benefits and Perquisites
We provide benefits to our named executive officers on the same basis as provided to all of our employees, including health, dental and vision insurance; life insurance; accidental death and dismemberment insurance; and
short-and
long-term disability insurance; and atax-qualified
Section 401(k) plan for which we do not provide a match. In addition, Mr. Fisker and Dr. Gupta are each entitled to term life insurance with a face amount of $5,000,000 and a $1,000 per month car allowance (and, when available, the use of a Fisker automobile). We do not maintain any executive-specific benefit or perquisite programs.Severance Agreements
In September 2020, the compensation committee approved severance benefits for Mr. Fisker and Dr. Gupta after reviewing certain market data provided by the independent consulting firm, Compensia, and taking into account the historically low cash compensation paid to Mr. Fisker and Dr. Gupta. We entered into severance agreements with Mr. Fisker and Dr. Gupta setting forth these severance benefits.
Henrik Fisker
Pursuant to the severance agreement to be entered into with Mr. Fisker, if we terminate Mr. Fisker’s employment without cause or Mr. Fisker resigns for good reason, Mr. Fisker will be entitled to receive a cash payment equal to $9,682,000, plus the amount equal to 24 months of COBRA premium payments, in each case, less applicable withholding taxes and subject to, among other things, executing a general release of claims in favor of the company and complying with the terms of his confidentiality agreement.
Dr. Geeta Gupta
Pursuant to the severance agreement to be entered into with Dr. Gupta, if we terminate Dr. Gupta’s employment without cause or Dr. Gupta resigns for good reason, Dr. Gupta will be entitled to receive a cash payment equal to $4,597,500, plus the amount equal to 24 months of COBRA premium payments, in each case, less applicable withholding taxes and subject to, among other things, executing a general release of claims in favor of the company and complying with the terms of her confidentiality agreement.
Outstanding Equity Awards as of December 31, 2019
The following table sets forth information regarding unexercised stock options
(pre-combination)
held by each of our named executive officers as of December 31, 2019.97
Name | Grant Date | Number of Securities Underlying Unexercised Options (#) Exercisable (1) | Number of Securities Underlying Unexercised Options (#) Unexercisable | Option Exercise Price ($) (2) | Option Expiration Date | |||||||||||||||
Henrik Fisker | 12/19/2016 | 2,647,060 | (3) | — | 0.15 | 12/19/2016 | ||||||||||||||
President, Chief Executive Officer and Chairman of the Board | 04/26/2017 | 294,120 | (3) | — | 0.15 | 04/26/2017 | ||||||||||||||
Dr. Geeta Gupta | 04/26/2017 | 2,941,180 | (3) | — | 0.15 | 04/26/2017 | ||||||||||||||
Chief Financial Officer | ||||||||||||||||||||
| (1) | All stock options were granted pursuant to the Fisker Inc. 2016 Stock Plan. |
| (2) | This column represents the fair market value of a share of Class A Common Stock on the date of grant, as determined by the Legacy Fisker board of directors. |
| (3) | These option shares were fully vested and exercisable on the date of grant, except that in the case of Mr. Fisker’s grant of December 19, 2016, the then unvested option shares were amended on May 4, 2017, to be fully vested and exercisable. |
Executive Compensation
Our policies with respect to the compensation of our executive officers is administered by our compensation committee. The compensation policies we follow are intended to provide for compensation that is sufficient to attract, motivate and retain our executives and potentially other individuals and to establish an appropriate relationship between executive compensation and the creation of stockholder value.
Equity Compensation
It is anticipated that equity-based compensation will be an important foundation in executive compensation packages as we believe it is important to maintain a strong link between executive incentives and the creation of stockholder value. We believe that performance and equity-based compensation can be an important component of the total executive compensation package for maximizing stockholder value while, at the same time, attracting, motivating and retaining high-quality executives. Formal guidelines for the allocations of cash and equity-based compensation have not yet been determined, but it is expected that the Fisker Inc. 2020 Equity Incentive Plan will be an important element of the compensation arrangements for both executive officers and directors.
Equity Benefit Plans
Fisker Inc. 2020 Equity Incentive Plan
In October 2020, our Board adopted and our stockholders approved the Fisker Inc. 2020 Equity Incentive Plan (the “2020 Plan”). The 2020 Plan became effective immediately upon the consummation of the Business Combination.
Purpose
The 2020 Plan is intended to (i) attract and retain the best available personnel to ensure Fisker’s success and accomplish its goals, (ii) incentivize employees, directors and independent contractors of Fisker with long-term equity-based compensation to align their interests with stockholders’ and (iii) promote the success of Fisker’s business. The 2020 Plan is a continuation of the Legacy Fisker 2016 Stock Plan, which was assumed from Legacy Fisker and amended, restated and
re-named
into the form of the 2020 Plan effective as of the consummation of the Business Combination.98
Types of Stock Awards
The 2020 Plan permits the grant of incentive stock options, nonstatutory stock options, restricted stock, restricted stock units, stock appreciation rights (“SARs”), performance units, performance shares, other stock-based awards and other cash-based awards (all such types of awards, collectively, “stock awards”).
Share Reserve
Number of Shares
Subject to adjustments as set forth in the 2020 Plan, the maximum aggregate number of shares that may be issued
The number of shares available for issuance under the 2020 Plan will be automatically increased on the first day of each fiscal year beginning with the 2022 fiscal year, in an amount equal to the lesser of (i) 3% of the outstanding shares of our capital stock on the last day of the immediately preceding fiscal year and (ii) such number of shares determined by the Board.
Lapsed Awards
To the extent a stock award expires or is forfeited or becomes unexercisable for any reason without having been exercised in full, or is surrendered pursuant to an exchange program (as set forth in the 2020 Plan), the unissued shares that were subject thereto shall continue to be available under the 2020 Plan for issuance pursuant to future stock awards. In addition, any shares that Fisker retains upon exercise of a stock award in order to satisfy the exercise or purchase price for such stock award or any withholding taxes due with respect to such stock award shall be treated as not issued and shall continue to be available under the 2020 Plan for issuance pursuant to future stock awards. Shares issued under the 2020 Plan and later forfeited to us due to the failure to vest or repurchased by Fisker at the original purchase price paid to it for the shares (including without limitation upon forfeiture to or repurchase by Fisker in connection with a participant ceasing to be a service provider) shall again be available for future grant under the 2020 Plan. To the extent a stock award under the 2020 Plan is paid out in cash rather than shares, such cash payment will not result in reducing the number of shares available for issuance under the 2020 Plan.
Shares Available Following Certain Transactions
Stock awards granted in accordance with applicable stock exchange requirements that are in substitution or exchange for awards previously granted by a company or its affiliates acquires or combines with will not reduce (or add to) the shares authorized for issuance under the 2020 Plan or the limitations on grants to outside directors. Also, if a company or one of its affiliates acquires, or combines with, has shares available under a
pre-existing
plan approved by stockholders and not adopted in contemplation of such acquisition or combination, the shares available for grant pursuant to such plan (as adjusted to take into account the transaction as appropriate) may, subject to compliance with applicable stock exchange requirements, be used for stock awards under the 2020 Plan and shall not reduce (or add to) the shares authorized for issuance under the 2020 Plan; provided that such stock awards shall not be made beyond the latest date awards or grants could have been made under thepre-existing
plan and shall only be made to individuals who were not our or our affiliates’ employees or service providers prior to such acquisition or combination.99
Eligibility
Employees, directors and independent contractors of Fisker or its affiliates are all eligible to participate in the 2020 Plan. Incentive Stock Options may only be granted to employees. As of October 30, 2020, for equity plan purposes, Fisker had a total of approximately 82 employees, approximately 24 consultants and five
non-employee
directors who would be eligible to be granted stock awards from the 2020 Plan.Administration
The 2020 Plan is administered by the Board or a committee thereof, which committee will be constituted to satisfy applicable laws (the “Administrator”). To the extent desirable to qualify transactions under the 2020 Plan as exempt under Rule
16b-3
of the Exchange Act, the transactions contemplated under the 2020 Plan will be structured to satisfy the requirements for exemption under Rule16b-3.
Subject to the terms of the 2020 Plan, the Administrator has the authority, in its discretion, to (i) determine the fair market value of a share of Class A Common Stock in accordance with the 2020 Plan; (ii) select the service providers to whom stock awards may be granted under the 2020 Plan; (iii) determine the number of shares to be covered by each stock award granted under the 2020 Plan; (iv) approve forms of stock award agreements for use under the 2020 Plan; (v) determine the terms and conditions, not inconsistent with the terms of the 2020 Plan, of any stock award granted thereunder; (vi) institute and determine the terms and conditions of an exchange program under the terms of the 2020 Plan (subject to stockholder approval); (vii) construe and interpret the terms of the 2020 Plan and stock awards granted pursuant to the 2020 Plan; (viii) prescribe, amend and rescind rules and regulations relating to the 2020 Plan; (ix) modify or amend each stock award (subject to the terms of the 2020 Plan); (x) allow participants to satisfy tax withholding obligations in such manner as prescribed in the 2020 Plan; (xi) authorize any person to execute on Fisker’s behalf any instrument required to effect the grant of a stock award previously granted by the Administrator; (xii) allow a participant to defer the receipt of the payment of cash or the delivery of shares that would otherwise be due to such participant under a stock award; and (xiii) make all other determinations deemed necessary or advisable for administering the 2020 Plan.
To the extent permitted by applicable law, the Administrator, in its sole discretion and on such terms and conditions as it may provide, may delegate all or any part of its authority and powers under the 2020 Plan to one or more of Fisker’s directors or officers.
Stock Options
Each stock option will be designated in the stock award agreement as either an incentive stock option (which is entitled to favorable tax treatment) or a nonstatutory stock option. However, notwithstanding such designation, to the extent that the aggregate fair market value of the shares with respect to which incentive stock options are exercisable for the first time by the participant during any calendar year exceeds $100,000, such stock options will be treated as nonstatutory stock options. Incentive stock options may only be granted to Fisker or its subsidiaries’ employees.
The term of each stock option will be stated in the stock award agreement. In the case of an incentive stock option, the term will be 10 years from the date of grant or such shorter term as may be provided in the stock award agreement. Moreover, in the case of an incentive stock option granted to a participant who owns stock representing more than 10% of the total combined voting power of all classes of Fisker stock or the stock of any parent of Fisker and certain of its subsidiaries, the term of the incentive stock option will be five years from the date of grant or such shorter term as may be provided in the stock award agreement.
The per share exercise price for the shares to be issued pursuant to exercise of a stock option will be determined by the Administrator, subject to the following: in the case of an incentive stock option (i) granted to an employee who, at the time the incentive stock option is granted, owns stock representing more than 10% of the voting power of all classes of Fisker stock or the stock of any parent of Fisker and certain of its subsidiaries, the per share exercise price will be no less than 110% of the fair market value per share on the date of grant; and (ii) granted to any other employee, the per share exercise price will be no less than 100% of the fair market value per share on
100
the date of grant. In the case of a nonstatutory stock option, the per share exercise price will be no less than 100% of the fair market value per share on the date of grant. Notwithstanding the foregoing, stock options may be granted with a per share exercise price of less than 100% of the fair market value per share on the date of grant pursuant to a corporate reorganization, liquidation, or other transaction, described in Section 424(a) of the Code.
At the time a stock option is granted, the Administrator will fix the period within which the stock option may be exercised and will determine any conditions that must be satisfied before the stock option may be exercised. The Administrator will also determine the acceptable form of consideration for exercising a stock option, including the method of payment.
If a participant ceases to be a service provider other than for “Cause,” as defined in the 2020 Plan, the participant may exercise his or her stock option within such period of time as is specified in the stock award agreement to the extent that the stock option is vested on the date of termination (but in no event later than the expiration of the term of such stock option). In the absence of a specified time in the stock award agreement, or as may be provided in any other written agreement between Fisker or any affiliate and the participant, to the extent vested as of a participant’s termination, the stock option will remain exercisable for 12 months following a termination for death or disability, and three months following a termination for any other reason other than Cause. Any outstanding stock option (including any vested portion thereof) held by a participant shall immediately terminate in its entirety upon the participant being first notified of his or her termination for Cause.
Stock Appreciation Rights (SARs)
The Administrator will determine the terms and conditions of each SAR, except that the exercise price for each SAR cannot be less than 100% of the fair market value of the underlying shares of Class A Common Stock on the date of grant. Upon exercise of a SAR, a participant will receive payment from Fisker in an amount determined by multiplying the difference between the fair market value of a share on the date of exercise over the exercise price by the number of shares with respect to which the SAR is exercised. SARs may be paid in cash, shares of Class A Common Stock or a combination thereof, as determined by the Administrator. SARs are exercisable at the times and on the terms established by the Administrator.
Restricted Stock and RSUs
Restricted stock awards are grants of shares of Class A Common Stock that are subject to various restrictions, including restrictions on transferability and forfeiture provisions. Shares of restricted stock will vest and the restrictions on such shares will lapse in accordance with terms and conditions established by the Administrator. Each RSU is a bookkeeping entry representing an amount equal to the fair market value of one share of Class A Common Stock.
In determining whether restricted stock or RSUs should be granted, and/or the vesting schedule for such a stock award, the Administrator may impose whatever conditions on vesting as it determines to be appropriate. For example, the Administrator may determine to grant restricted stock or RSUs only if performance goals established by the Administrator are satisfied. Any performance goals may be applied on a Company-wide or an individual business unit basis, as determined by the Administrator. Please refer to the discussion below under “—Performance Goals” for more information.
During the period of restriction, participants holding restricted stock may exercise full voting rights and will be entitled to receive all dividends and other distributions paid, in each case with respect to such shares unless the Administrator determines otherwise. If any such dividends or distributions are paid in shares, the shares will be subject to the same restrictions, including without limitation restrictions on transferability and forfeitability, as the restricted stock with respect to which they were paid.
During the vesting period, participants holding RSUs will hold no voting rights by virtue of such RSUs. The Administrator may, in its sole discretion, award dividend equivalents in connection with the grant of RSUs that may be settled in cash, in shares of equivalent value, or in some combination thereof.
101
Performance Units and Performance Shares
Performance units and performance shares are stock awards that will result in a payment to a participant only if the performance goals that the Administrator establishes are satisfied. The Administrator will determine the applicable performance goals. Please refer to the discussion below under “—Performance Goals” for more information. After the applicable performance period has ended, the participant will be entitled to receive a payout of the number of performance units or shares earned during the performance period, depending upon the extent to which the applicable performance objectives have been achieved.
Other Cash-Based Awards and Other Stock-Based Awards
Other stock-based awards are rights or interests valued in whole or in part by reference to, or otherwise based on, or related to, shares of Class A Common Stock, including but not limited to unrestricted shares awarded as a bonus or upon the attainment of performance goals or otherwise as permitted under the 2020 Plan, and rights to acquire shares. Other cash-based awards are awards granted pursuant to the 2020 Plan that will be paid in cash on such terms as the Administrator establishes.
Performance Goals
The Administrator in its discretion may make performance goals applicable to a participant with respect to a stock award. In the Administrator’s discretion, one or more of the following performance goals may apply: (1) sales or
non-sales
revenue; (2) return on revenues; (3) operating income; (4) income or earnings including operating income; (5) income or earnings before or after taxes, interest, depreciation and/or amortization; (6) income or earnings from continuing operations; (7) net income;(8) pre-tax
income orafter-tax
income; (9) net income excluding amortization of intangible assets, depreciation and impairment of goodwill and intangible assets and/or excluding charges attributable to the adoption of new accounting pronouncements; (10) raising of financing or fundraising; (11) project financing; (12) revenue backlog; (13) gross margin; (14) operating margin or profit margin; (15) capital expenditures, cost targets, reductions and savings and expense management; (16) return on assets, return on investment, return on capital, or return on stockholder equity; (17) cash flow, free cash flow, cash flow return on investment, net cash provided by operations, or cash flow in excess of cost of capital; (18) performance warranty and/or guarantee claims; (19) stock price or total stockholder return; (20) earnings or book value per share; (21) economic value created;(22) pre-tax
profit orafter-tax
profit; (23) strategic business criteria; (24) objective goals relating to divestitures, joint ventures, mergers, acquisitions and similar transactions; (25) objective goals relating to staff management, results from staff attitude and/or opinion surveys, staff satisfaction scores, staff safety, staff accident and/or injury rates, compliance, headcount, performance management, completion of critical staff training initiatives; (26) objective goals relating to projects; and (27) enterprise resource planning, in each case measured as determined by the Administrator. Stock awards issued to participants may take into account other criteria (including subjective criteria).Outside Director Limitations
No
non-employee
director (“Outside Director”) may receive awards under the 2020 Plan with a total grant date fair value that, when combined with cash compensation received for service as an Outside Director, exceeds $750,000 in a calendar year, increased to $1,000,000 in the calendar year of his or her initial services as an Outside Director. Stock awards granted to an individual while he or she was serving in the capacity as an employee or while he or she was an independent contractor but not an Outside Director will not count for purposes of these limitations.Leaves of Absence / Transfer Between Locations
The Administrator has the discretion to determine at any time whether and to what extent the vesting of stock awards shall be suspended during any leave of absence. A participant will not cease to be an employee in the case of (i) any leave of absence approved by the participant’s employer or (ii) transfers between Fisker’s locations or between Fisker and any subsidiary. If an employee holds an incentive stock option and such leave exceeds 3 months then, for purposes of incentive stock option status only, such employee’s service as an employee shall be deemed terminated on the first day following such three month period and the incentive stock option shall thereafter automatically treated for tax purposes as a nonstatutory stock option in accordance with applicable laws, unless reemployment upon the expiration of such leave is guaranteed by contract or statute, or unless provided otherwise pursuant to a written Company policy.
102
Nontransferability of Stock Awards
Unless determined otherwise by the Administrator, a stock award may not be sold, pledged, assigned, hypothecated, transferred, or disposed of in any manner other than by will or by the laws of descent or distribution and may be exercised, during the lifetime of the participant, only by the participant. If the Administrator makes a stock award transferable, such stock award will contain such additional terms and conditions as the Administrator deems appropriate.
Recoupment Policy
All stock awards granted under the 2020 Plan will be subject to recoupment in accordance with any clawback policy that Fisker is required to adopt pursuant to the listing standards of any national securities exchange or association on which its securities are listed or as is otherwise required by the U.S. Dodd-Frank Wall Street Reform and Consumer Protection Act or other applicable law. In addition, the Board may impose such other clawback, recovery or recoupment provisions in a stock award agreement as the Board determines necessary or appropriate. No recovery of compensation under such a clawback policy will be an event giving rise to a right to resign for “good reason” or “constructive termination” (or similar term) under any agreement with Fisker.
Corporate Transaction
Except as set forth in a stock award agreement, in the event of (i) a transfer of all or substantially all of Fisker’s assets, (ii) a merger, consolidation or other capital reorganization or business combination transaction of Fisker with or into another corporation, entity or person, or (iii) the consummation of a transaction, or series of related transactions, in which any person becomes the beneficial owner directly or indirectly, of more than 50% of Fisker’s then outstanding capital stock, each outstanding stock award (vested or unvested) will be treated as the Administrator determines, which may include (a) Fisker’s continuation of such outstanding stock awards (if Fisker is the surviving corporation); (b) the assumption of such outstanding stock awards by the surviving corporation or its parent; (c) the substitution by the surviving corporation or its parent of new stock options or other equity awards for such stock awards; (d) the cancellation of such stock awards in exchange for a payment to the participants equal to the excess of (1) the fair market value of the shares subject to such stock awards as of the closing date of such corporate transaction over (2) the exercise price or purchase price paid or to be paid (if any) for the shares subject to the stock awards (which payment may be subject to the same conditions that apply to the consideration that will be paid to holders of shares in connection with the transaction, subject to applicable law); or (e) the opportunity for participants to exercise the stock options prior to the occurrence of the corporate transaction and the termination (for no consideration) upon the consummation of such corporate transaction of any stock options not exercised prior thereto.
Change in Control
A stock award may be subject to additional acceleration of vesting and exercisability upon or after a “Change in Control” (as defined in the 2020 Plan) as may be provided in the award agreement for such stock award or as may be provided in any other written agreement between Fisker or any affiliate and the participant, but in the absence of such provision, no such acceleration will occur.
Amendment, Termination and Duration of the 2020 Plan
The 2020 Plan will continue in effect for a term of 10 years measured from the date of approval by our Board of Directors, unless terminated earlier under the terms of the 2020 Plan. The Administrator may at any time amend, alter, suspend or terminate the 2020 Plan pursuant to the listing standards of any national securities exchange or association on which Fisker securities are listed or as otherwise required by applicable law.
103
Legacy Fisker 2016 Stock Plan and Stock Options Assumed in Connection with the Business Combination
Legacy Fisker’s board of directors adopted, and Legacy Fisker’s stockholders approved, the 2016 Stock Plan (the “2016 Plan”) on September 22, 2016, and the 2016 Plan was amended from time to time thereafter. No new awards will be granted under the 2016 Plan.
The 2016 Plan provided for the grant of incentive stock
options to Legacy Fisker employees (and employees of any parent or subsidiary of Legacy Fisker), and for the grant of
non-statutory
stock options and stock purchase rights to Legacy Fisker employees, directors and consultants (and employees and consultants of any parent, subsidiary or affiliate of Legacy Fisker). In connection with the Business Combination, we assumed the 2016 Plan and we amended, restated andre-named
the 2016 Plan into the form of the 2020 Plan. The terms of the 2016 Plan as described herein will continue to govern the terms and conditions of the outstanding awards previously granted thereunder.In connection with the Business Combination, each stock option granted under the 2016 Plan (each, a “Legacy Fisker Option”) that was outstanding immediately prior to the Effective Time, whether vested or unvested, was converted into an option (each, an “Exchanged Option”) to purchase a number of shares of Class A Common Stock equal to the product (rounded down to the nearest whole number) of (a) the number of shares of Legacy Fisker Common Stock subject to such Legacy Fisker Option immediately prior to the Effective Time and (b) the Exchange Ratio, at an exercise price per share (rounded up to the nearest whole cent) equal to (i) the exercise price per share of such Legacy Fisker Option immediately prior to the Effective Time divided by (ii) the Exchange Ratio. Except as specifically provided otherwise in the Business Combination Agreement, following the Effective Time, each Exchanged Option continues to be governed by the same terms and conditions (including vesting and exercisability terms and the applicable terms of the 2016 Plan) as were applicable to the corresponding Legacy Fisker Option immediately prior to the Effective Time.
As of the Closing, Exchanged Options covering 18,481,679 shares of Class A Common Stock were outstanding.
Our compensation committee administers the 2016 Plan, including without limitation the Exchanged Options.
In the event of certain corporate events or changes in our capitalization, to prevent diminution or enlargement of the benefits or potential benefits available under the 2016 Plan, the Fisker Board of Directors will make adjustments to one or more of the number, kind and class of securities that may be delivered under the 2016 Plan and/or the number, kind, class and price of securities covered by each outstanding Exchanged Option.
In the event of our dissolution or liquidation, each outstanding Exchanged Option will terminate immediately prior to the consummation of such action, unless otherwise determined by the Fisker Board of Directors.
The 2016 Plan provides that in the event of certain significant corporate transactions, including: (i) a transfer of all or substantially all of Fisker’s assets, (ii) a merger, consolidation or other capital, reorganization or business combination transaction of Fisker with or into another corporation, entity or person, or (iii) the consummation of a transaction, or series of related transactions, in which any person becomes the beneficial owner, directly or indirectly, of more than 50% of Fisker’s then outstanding capital stock, each outstanding Exchanged Option will be treated as our Board of Directors determines.
Fisker Inc. 2020 Employee Stock Purchase Plan
In October 2020, our Board of Directors adopted and our stockholders approved the Fisker Inc. 2020 Employee Stock Purchase Plan (the “ESPP”). The ESPP became effective immediately upon the consummation of the Business Combination.
104
Purpose
The ESPP provides a means by which eligible employees and/or eligible service providers of either Fisker or one of its affiliates may be given an opportunity to purchase shares Class A Common Stock. The ESPP permits Fisker to grant a series of purchase rights to eligible employees and/or eligible service providers. By means of the ESPP, Fisker will seek to retain and assist Fisker affiliates in retaining the services of such eligible employees and eligible service providers, to secure and retain the services of new eligible employees and eligible service providers and to provide incentives for such persons to exert maximum efforts for Fisker’s success and that of its affiliates. As of October 30, 2020, approximately 82 Fisker employees and approximately two other Fisker service providers are eligible to participate in the ESPP.
The ESPP includes two components: a “423 Component” and a “Non 423 Component.” The 423 Component is intended to qualify as an Employee Stock Purchase Plan pursuant to Section 423 of the Code. The provisions of the 423 Component will be construed in a manner that is consistent with the requirements of Section 423 of the Code, including without limitation to extend and limit ESPP participation in a uniform and
non-discriminating
basis. In addition, the ESPP authorizes grants of purchase rights under theNon-423
Component that do not meet the requirements of an Employee Stock Purchase Plan under Section 423 of the Code. Except as otherwise provided in the ESPP or determined by the Board, theNon-423
Component will operate and be administered in the same manner as the 423 Component. Eligible employees are able to receive the opportunity to participate in the 423 Component orNon-423
Component of the ESPP. Eligible service providers (who are not eligible employees) will only be able to receive the opportunity to participate in theNon-423
Component of the ESPP.Administration
Our Board of Directors administers the ESPP and has the final power to construe and interpret both the ESPP and the rights granted under it. Further, our Board of Directors has the power, subject to the provisions of the ESPP, to determine when and how rights to purchase Class A Common Stock will be granted, the provisions of each offering of such rights (which need not be identical), and whether any employee or other service provider will be eligible to participate in the ESPP.
Our Board of Directors has the power to delegate administration of the ESPP to a committee composed of not fewer than one member of the Board. As used herein with respect to the ESPP, the term “Board” refers to any committee our Board of Directors appoints, and to our Board of Directors. Whether or not our Board of Directors has delegated administration of the ESPP to a committee, our Board of Directors will have the final power to determine all questions of policy and expediency that may arise in the administration of the ESPP.
Stock Subject to the ESPP
Subject to adjustments as provided in the ESPP, the maximum number of shares of Class A Common Stock that may be issued under the ESPP will not exceed 3,213,034 shares of Class A Common Stock, plus the number of shares of Class A Common Stock that are automatically added on the first day of each fiscal year beginning with the 2022 fiscal year and ending on (and including) the first day of the 2032 fiscal year in an amount equal to
one-half
percent (0.5%) of the total number of shares of Class A Common Stock outstanding on the last day of the calendar month prior to the date of such automatic increase, unless the Board determines prior to the first day of any fiscal year that there will be no increase in the share reserve for such fiscal year or that the increase in the share reserve for such fiscal year will be a lesser number of shares of Class A Common Stock. If any purchase right granted under the ESPP terminates without having been exercised in full, the shares of Class A Common Stock not purchased under such purchase right will again become available for issuance under the ESPP.105
Offerings
The ESPP is implemented by offerings of rights to purchase shares of Class A Common Stock to all eligible employees and eligible service providers from time to time. Offerings may comprise one or more purchase periods. The maximum length for an offering under the ESPP is 27 months. The provisions of separate offerings need not be identical. When a participant elects to join an offering, he or she is granted a purchase right to acquire shares of Class A Common Stock on each purchase date within the offering, each corresponding to the end of a purchase period within such offering. On each purchase date, all payroll deductions collected from the participant during such purchase period are automatically applied to the purchase of Class A Common Stock, subject to certain limitations.
Eligibility
Purchase rights may be granted only to Fisker employees, employees of qualifying related corporations or, solely with respect to the
Non-423
Component, employees of a Fisker affiliate (other than a qualifying related corporation) or eligible service providers. The Board may provide that employees will not be eligible to be granted purchase rights under the ESPP if, on the offering date, the employee (i) has not completed at least two years of service since the employee’s last hire date (or such lesser period as the Board may determine), (ii) customarily works not more than 20 hours per week (or such lesser period as the Board may determine), (iii) customarily works not more than five months per calendar year (or such lesser period as the Board may determine), (iv) is an officer within the meaning of Section 16 of the Exchange Act, (v) is a highly compensated employee within the meaning of the Code, or (vi) has not satisfied such other criteria as the Board may determine consistent with Section 423 of the Code. Unless otherwise determined by the Board for any offering, an employee will not be eligible to be granted purchase rights unless, on the offering date, the employee customarily works more than 20 hours per week and more than five months per calendar year.No employee will be eligible for the grant of any purchase rights if, immediately thereafter, such employee owns stock possessing 5% or more of the total combined voting power or value of all classes of our stock or the stock of any related corporation. An eligible employee may be granted purchase rights only if such purchase rights, together with any other rights granted under all our and any related corporations’ Employee Stock Purchase Plans, do not permit such eligible employee’s rights to purchase stock to accrue in excess of $25,000 worth of stock in any calendar year.
Participation in the ESPP
On each offering date, each eligible employee or eligible service provider, pursuant to an offering made under the ESPP, will be granted a purchase right to purchase up to that number of shares of Class A Common Stock purchasable either with a percentage of such employee’s earnings or with a maximum dollar amount, as designated by the Board; provided however, that in the case of eligible employees, such percentage or maximum dollar amount will in either case not exceed 15% of such employee’s earnings during the period that begins on the offering date (or such later date as the Board determines for a particular offering) and ends on the date stated in the offering, which date will be no later than the end of the offering, unless otherwise provided for in an offering.
Purchase Price
The purchase price of shares of Class A Common Stock acquired pursuant to purchase rights will be not less than the lesser of (i) 85% of the fair market value of the shares of Class A Common Stock on the offering date; or (ii) 85% of the fair market value of the shares of Class A Common Stock on the applicable purchase date (i.e., the last day of the applicable purchase period).
Payment of Purchase Price; Payroll Deductions
The purchase price of the shares is accumulated by payroll deductions over the offering. To the extent permitted in the offering document, a participant may increase, reduce or terminate his or her payroll deductions. All payroll deductions made on behalf of a participant are credited to his or her account under the ESPP and deposited with Fisker general funds. To the extent permitted in the offering document, a participant may make additional payments into such account. If required under applicable laws or regulations or if specifically provided in the offering, in addition to or instead of making contributions by payroll deductions, a participant may make contributions through a payment by cash, check, or wire transfer prior to a purchase date, in a manner Fisker directs.
106
Purchase of Stock
The Board will establish one or more purchase dates during an offering on which purchase rights granted for that offering will be exercised and shares of Class A Common Stock will be purchased in accordance with such offering. In connection with each offering, the Board may specify a maximum number of shares of Class A Common Stock that may be purchased by any participant or all participants. If the aggregate purchase of shares of Class A Common Stock issuable on exercise of purchase rights granted under the offering would exceed any such maximum aggregate number, then, in the absence of any Board action otherwise, a pro rata (based on each participant’s accumulated contributions) allocation of the shares of Class A Common Stock available will be made in as nearly a uniform manner as will be practicable and equitable.
Withdrawal
During an offering, a participant may cease making contributions and withdraw from the offering by delivering a withdrawal form. Fisker may impose a deadline before a purchase date for withdrawing. On such withdrawal, such participant’s purchase right in that offering will immediately terminate and Fisker will distribute as soon as practicable to such participant all of his or her accumulated but unused contributions without interest and such participant’s purchase right in that offering will then terminate. A participant’s withdrawal from that offering will have no effect on his or her eligibility to participate in any other offerings under the ESPP, but such participant will be required to deliver a new enrollment form to participate in subsequent offerings.
Termination of Employment
Purchase rights granted pursuant to any offering under the ESPP will terminate immediately if the participant either (i) is no longer an eligible employee or eligible service provider for any reason or for no reason, or (ii) is otherwise no longer eligible to participate. Fisker will have the exclusive discretion to determine when a participant is no longer actively providing services and the date of the termination of employment or service for purposes of the ESPP. As soon as practicable, Fisker will distribute to such individual all of his or her accumulated but unused contributions without interest.
Restrictions on Transfer
During a participant’s lifetime, purchase rights will be exercisable only by such participant. Purchase rights are not transferable by a participant, except by will, by the laws of descent and distribution, or, if we so permit, by a beneficiary designation.
Exercise of Purchase Rights
On each purchase date, each participant’s accumulated contributions will be applied to the purchase of shares of Class A Common Stock, up to the maximum number of shares of Class A Common Stock permitted by the ESPP and the applicable offering, at the purchase price specified in the offering. Unless otherwise specified in the offering, no fractional shares will be issued and, if any amount of accumulated contributions remains in a participant’s account after the purchase of shares of Class A Common Stock on the final purchase date in an offering, such remaining amount will roll over to the next offering.
No purchase rights may be exercised to any extent unless and until the shares of Class A Common Stock to be issued on such exercise under the ESPP are covered by an effective registration statement pursuant to the Securities Act, and the ESPP is in material compliance with all applicable U.S. federal and state, foreign and other securities, exchange control, and other laws applicable to the ESPP. If, on the purchase date, as delayed to the maximum extent permissible, the shares of Class A Common Stock are not registered and the ESPP is not in material compliance with all applicable laws or regulations, no purchase rights will be exercised and all accumulated but unused contributions will be distributed as soon as practicable to the participants without interest.
107
Capitalization Adjustments
In the event of a capitalization adjustment, the Board will appropriately and proportionately adjust: (i) the classes and maximum number of securities subject to the ESPP, (ii) the classes and maximum number of securities by which the share reserve is to increase automatically each year pursuant to the ESPP, (iii) the classes and number of securities subject to, and the purchase price applicable to outstanding offerings and purchase rights, and (iv) the classes and number of securities that are the subject of the purchase limits under each ongoing offering.
Dissolution or Liquidation
In the event of Fisker’s dissolution or liquidation, the Board will shorten any offering then in progress by setting a new purchase date prior to the consummation of such proposed dissolution or liquidation. The Board will notify each participant in writing, prior to the new purchase date that the purchase date for the participant’s purchase rights has been changed to the new purchase date and that such purchase rights will be automatically exercised on the new purchase date, unless prior to such date the participant has withdrawn from the offering.
Effect of Certain Corporate Transactions
In the event of:
| • | a transfer of all or substantially all of Fisker’s assets; |
| • | a merger, consolidation or other capital reorganization or business combination transaction of our company with or into another corporation, entity or person; or |
| • | the consummation of a transaction, or series of related transactions, in which any person becomes the beneficial owner, directly or indirectly, of more than 50% of Fisker’s then outstanding capital stock; |
any surviving corporation or acquiring corporation (or the surviving or acquiring corporation’s parent company) may assume or continue outstanding purchase rights or may substitute similar rights for outstanding purchase rights, or, if any surviving or acquiring corporation (or its parent company) does not assume or continue such purchase rights or does not substitute similar rights for such purchase rights, then the participants’ accumulated contributions will be used to purchase shares of Class A Common Stock prior to the corporate transaction under the outstanding purchase rights, and the purchase rights will terminate immediately after such purchase. The Board will notify each participant in writing prior to the new purchase date that the purchase date for the participant’s purchase rights has been changed to the new purchase date and that such purchase rights will be automatically exercised on the new purchase date unless prior to such date the participant has withdrawn from the offering.
Amendment, Termination or Suspension of the ESPP
The Board may amend the ESPP at any time in any respect the Board deems necessary or advisable. However, except with respect to capitalization adjustments described above, stockholder approval will be required for any amendment of the ESPP for which stockholder approval is required by applicable laws, regulations or listing requirements, including any amendment that either (i) increases the number of shares of Class A Common Stock available for issuance under the ESPP, (ii) expands the class of individuals eligible to become participants and receive purchase rights, (iii) materially increases the benefits accruing to participants under the ESPP or reduces the price at which shares of Class A Common Stock may be purchased under the ESPP, (iv) extends the term of the ESPP, or (v) expands the types of awards available for issuance under the ESPP, but in each case only to the extent stockholder approval is required by applicable laws, regulations, or listing requirements.
The Board may suspend or terminate the ESPP at any time. No purchase rights may be granted under the ESPP while the ESPP is suspended or after it is terminated.
108
Any benefits, privileges, entitlements, and obligations under any outstanding purchase rights granted before an amendment, suspension, or termination of the ESPP will not be materially impaired by any such amendment, suspension, or termination except (i) with the consent of the person to whom such purchase rights were granted, (ii) as necessary to comply with any laws, listing requirements, or governmental regulations, or (iii) as necessary to obtain or maintain any special tax, listing, or regulatory treatment.
109
CERTAIN RELATIONSHIPS AND RELATED TRANSACTIONS
The following includes a summary of transactions since October 1, 2017, to which we or Legacy Fisker have been a participant in which the amount involved exceeded or will exceed $120,000, and in which any of our directors, executive officers or beneficial owners of more than 5% of our capital stock or any member of the immediate family of any of the foregoing persons had or will have a direct or indirect material interest, other than equity and other compensation, termination, change in control and other arrangements, which are described in the section entitled “.” Described below are certain other transactions with our directors, executive officers and stockholders.
Executive Compensation
Magna Warrants (Magna International Inc.)
On October 14, 2020, Fisker and Spartan entered into a Cooperation Agreement with Magna International Inc. (“Magna”) setting forth certain terms for the development of a full electric vehicle (the “Cooperation Agreement”). The Cooperation Agreement provides that we will issue to Magna (or to an affiliate of Magna designated by Magna) warrants to purchase Class A Common Stock in an amount equal to six percent (6%) of our capital stock on a fully diluted basis (which means for these purposes, after giving effect to the deemed conversion or exercise of all of our options, warrants and other convertible securities outstanding on the issuance date; provided, however, that the “public warrants” sold as part of the units issued by Spartan in its IPO which closed on August 14, 2018 shall not be deemed to be exercised for these purposes) after giving effect to the Merger and issuance of the Magna Warrants. The Magna Warrants are subject to vesting upon the achievement of certain milestones as set forth in the Cooperation Agreement. Additionally, the shares of Class A Common Stock underlying the Magna Warrants will be entitled to registration rights under the A&R Registration Rights Agreement and Magna will enter into a
lock-up
agreement on the same terms as the other investors in Fisker.Private Placement
On October 29, 2020, a number of purchasers (each, a “Subscriber”) purchased from the Company an aggregate of 50,000,000 shares of Class A Common Stock (the “PIPE Shares”) for a purchase price of $10.00 per share and an aggregate purchase price of $500 million (the “PIPE Financing”). The PIPE Financing was consummated concurrently with the Closing. The shares of Class A Common Stock issued in the PIPE Financing have not been registered under the Securities Act, in reliance on the exemption from registration provided by Section 4(a)(2) of the Securities Act and/or Regulation D promulgated thereunder. Pursuant to Subscription Agreements, the Company gave certain registration rights to the Subscribers with respect to the PIPE Shares. The sale of the PIPE Shares was consummated concurrently with the Closing.
Spartan Related Agreements
Founder Shares
In October 2017, we issued an aggregate of 14,375,000 Founder Shares to the Former Sponsor for an aggregate purchase price of $25,000 in cash, or approximately $0.002 per share. In July 2018, the Former Sponsor surrendered 2,875,000 shares of its Class B Common Stock for no consideration. In August 2018, we effected a stock dividend with respect to our Class B Common Stock of 2,300,000 shares thereof, resulting in the Former Sponsor holding an aggregate of 13,800,000 shares of Class B Common Stock. The number of Founder Shares issued was determined based on the expectation that such Founder Shares would represent 20% of the outstanding shares upon completion of our IPO. In August 2018, the Former Sponsor transferred 150,000 Founder Shares to two of our former three independent directors at their original purchase price. In July 2019, the Former Sponsor transferred 75,000 Founder Shares to John J. MacWilliams, a
non-independent
member of the Spartan Board, at their original purchase price. In April 2020, the Former Sponsor transferred 37,500 Founder Shares to our former third independent director at their original purchase price.110
Private Placement Warrants
The Former Sponsor purchased an aggregate of 9,360,000 private placement warrants for a purchase price of $1.50 per warrant in a private placement that occurred simultaneously with the closing of the IPO. As such, the Former Sponsor’s interest in this transaction is valued at approximately $14,040,000. Each private placement warrant entitles the holder to purchase one share of our Class A Common Stock at $11.50 per share. The private placement warrants (including the Class A Common Stock issuable upon exercise thereof) may not, subject to certain limited exceptions, be transferred, assigned or sold by the holder until 30 days after the Closing.
Administrative Services Agreement
On August 9, 2018, we entered into an administrative services agreement with the Former Sponsor, pursuant to which we paid the Former Sponsor a total of $10,000 per month for office space, utilities, secretarial support and administrative services. Upon the Closing, we ceased paying these monthly fees.
Other than these monthly fees, no compensation of any kind, including finder’s and consulting fees, was paid by us to the Former Sponsor, officers and directors, or any of their respective affiliates, for services rendered prior to or in connection with the consummation of the Business Combination. However, these individuals were reimbursed for anyexpenses incurred in connection with activities on our behalf such as identifying potential target businesses and performing due diligence on suitable business combinations. There was no cap or ceiling on the reimbursement ofexpenses incurred by such persons in connection with activities on our behalf.
out-of-pocket
out-of-pocket
Related Party Loans and Advances
Until the consummation of the IPO, our only source of liquidity was an initial sale of Founder Shares to the Former Sponsor. Additionally, an affiliate of the Former Sponsor advanced funds totaling $294,354 to pay administrative and offering costs. Upon the closing of the IPO, we repaid the affiliate of the Former Sponsor $294,354 in settlement of the outstanding loan and advances.
Registration Rights
The holders of the Founder Shares and private placement warrants (and any shares of Class A Common Stock issuable upon the exercise of the private placement warrants and upon conversion of the Founder Shares) will be entitled to registration rights pursuant to the IPO Registration Rights Agreement, requiring us to register such securities for resale (in the case of the Founder Shares, only after conversion to our Class A Common Stock). The holders of the majority of these securities are entitled to make up to three demands, excluding short form demands, that we register such securities. In addition, the holders have certain “piggy-back” registration rights with respect to registration statements filed subsequent to the Closing and rights to require us to register for resale such securities pursuant to Rule 415 under the Securities Act.
Legacy Fisker Related Agreements
Equity Financings
Series A Preferred Stock
Between October 1, 2017 and March 2018, Legacy Fisker sold an aggregate of 163,768 shares
(pre-business
combination) of its Series A Preferred Stock at a purchase price of $7.48 per share (prior to the stock split) representing 1,637,680 shares post stock split to accredited investors for an aggregate purchase price of approximately $2.1 million. Each share of Series A Preferred Stock was exchanged for such number of shares of Class A Common Stock at an exchange ratio of 2.7162 in connection with the consummation of the Business Combination, as provided in the Business Combination Agreement.111
The following table summarizes issuances of the Series A Preferred Stock to members of the Board and holders of more than 5% of the Company’s capital stock.
Name of Stockholder (1) | No. of Shares (Series A)* | Aggregate Purchase Price | ||||||
Roderick Randall (2) | 668,440 | $ | 499,993.12 | |||||
Series Fisker, a separate series of The Randall Group, LLC (2) | 568,170 | $ | 424,991.16 | |||||
Nadine I. Watt Jameson Family Trust (3) | 135,000 | $ | 100,980.00 | |||||
HF Holdco LLC (4) | 334,220 | $ | 249,996.56 | |||||
| * | All share numbers are pre-business combination. |
| (1) | Additional details regarding these stockholders and their equity holdings are described in the section entitled “ Beneficial Ownership of Securities |
| (2) | Mr. Roderick Randall, a member of the Board, is the Series Manager of Series Fisker, a separate series of The Randall Group, LLC. |
| (3) | Ms. Nadine Watt, a member of the Board, is the Trustee of Nadine I. Watt Jameson Family Trust. |
| (4) | Mr. Henrik Fisker and Dr. Geeta Gupta — directors and officers of the Company and holders of greater than 5% of the Company’s capital stock — are each a Member of HF Holdco LLC. |
Convertible Notes
From July 2019 through July 3, 2020, Legacy Fisker entered into a Convertible Note Purchase Agreement pursuant to which it issued $9,546,434.00 and €400,000 in aggregate principal amounts of convertible promissory notes, which are referred to as the Convertible Notes. The Convertible Notes accrued interest at a rate of 5% per year.
The following table summarizes the Convertible Notes purchased by members of the Company’s Board and holders of more than 5% of the Company’s capital stock.
Name of Stockholder (1) | Convertible Notes Principal Amount and Interest($) | Shares of Class A Common Stock | ||||||
Roderick Randall (2) | $ | 106,273,97 | 5,166 | |||||
The Randall Group Fisker Series C (2) | $ | 224,098,63 | 10,894 | |||||
Henrik Fisker* and Geeta Gupta* and affiliated entities (3) | $ | 255,239,73 | 12,408 | |||||
| * | Owners of more than 5% of the Company’s capital stock. |
| (1) | Additional details regarding these stockholders and their equity holdings are described in the section entitled “ Beneficial Ownership of Securities |
| (2) | Mr. Randall, a member of the Board, is the Managing Director of the Randall Group Fisker Series C. Pursuant to a letter agreement dated July 29 2019, entered into in connection with the Convertible Note Purchase Agreement, Mr. Randall was granted the right to receive a base model Fisker electric SUV. |
| (3) | Mr. Fisker and Dr. Gupta are each a Member of HF Holdco LLC. On May 29, 2020, the Company entered into the Convertible Note Purchase Agreement with HF Holdco LLC, whereby the Convertible Note was issued to HF Holdco LLC in the principal amount of $250,000, in satisfaction of advances made by Mr. Fisker and Dr. Gupta in connection with the formation of the Company. |
Roderick Randall, a member of the Board, provides certain services to the Company pursuant to a consulting agreement entered into with the Company dated May 1, 2017. In connection with the consulting agreement, Mr. Randall received an option grant to purchase 58,820 shares
(pre-business
combination) of Class A Common Stock. Mr. Randall also received an option grant to purchase 25,000 and 5,000 shares(pre-business
combination) of Class A Common Stock on June 22, 2020.112
Amended and Restated Investors’ Rights Agreement
In April 2018, the Company entered into an amended and restated investors’ rights agreement (the “Investors’ Rights Agreement”) with certain holders of the Company’s capital stock including certain directors, officers and 5% holders of the Company’s capital stock. The Investors’ Rights Agreement terminated in accordance with its terms at the Closing.
Other Transactions
Indemnification Agreements and Directors’ and Officers’ Liability Insurance
The Company entered into indemnification agreements with each of the Company’s directors and executive officers as of the Closing. The indemnification agreements and the Bylaws require the Company to indemnify its directors and officers to the fullest extent permitted by Delaware law, including indemnification of expenses such as attorneys’ fees, judgments, penalties, fines and settlement amounts incurred by the director or executive officer in any action or proceeding, including any action or proceeding by or in right of the Company, arising out of the person’s services as a director or executive officer. The Company has obtained an insurance policy that insures its directors and officers against certain liabilities, including liabilities arising under applicable securities laws. For more information regarding these indemnification agreements, see the section entitled “—”
Management
Limitation on Liability and Indemnification of Directors and Officers.
Executive Compensation
The Company has granted stock options and other equity awards to the Company’s executive officers and certain of its directors that provide for change in control benefits. For a description of these options and equity awards, see the sections entitled “””
Executive Compensation
— Equity Benefit Plans.
The Company has entered into certain severance agreements with some of the Company’s executive officers that provide for change in control benefits. For a description of the severance agreements, see the section entitled “”
Executive compensation—Severance Agreements.
Policies and Procedures for Related Party Transactions
The audit committee charter became effective upon the Closing. The audit committee charter states that the audit committee is responsible for reviewing and approving in advance any related party transaction. The Board adopted a written related person transaction policy setting forth the policies and procedures for the review and approval or ratification of related person transactions by the audit committee.
Pursuant to the policy, all of the Company’s directors, officers and employees will be required to report to the audit committee prior to entering into any transaction, arrangement or relationship, or any series of similar transactions, arrangements or relationships in which the Company is to be a participant, the amount involved exceeds $120,000 and a related person had or will have a direct or indirect material interest, including purchases of goods or services by or from the related person or entities in which the related person has a material interest, indebtedness, guarantees of indebtedness and employment by the Company of a related person.
The Company believes that the Company has executed all of the transactions described herein on terms no less favorable to the Company than the Company could have obtained from unaffiliated third parties. It is the Company’s intention to ensure that all future transactions between the Company and its officers, directors and principal stockholders and their affiliates, are approved by the audit committee, and are on terms no less favorable to the Company than those that the Company could obtain from unaffiliated third parties.
113
BENEFICIAL OWNERSHIP OF SECURITIES
The following table sets forth information regarding the beneficial ownership of our Common Stock as of November 2, 2020 and as adjusted to reflect the sale of the Class A Common Stock offered by us under this prospectus by:
| • | each of our directors and Named Officers; |
| • | all directors and executive officers as a group; and |
| • | each person who is known to us to own beneficially more than 5% of its Common Stock. |
Beneficial ownership is determined according to the rules of the Commission, which generally provide that a person has beneficial ownership of a security if he, she or it possesses sole or shared voting or investment power over that security, including options and warrants that are currently exercisable or exercisable within 60 days. In computing the number of shares of Common Stock beneficially owned by a person and the percentage ownership, the Company deemed outstanding shares of its Common Stock subject to options and warrants held by that person that are currently exercisable or exercisable within 60 days of the Closing Date. The Company did not deem these shares outstanding, however, for the purpose of computing the percentage ownership of any other person.
The percentage ownership of Common Stock is based on 277,258,103 shares of Common Stock outstanding, comprised of 144,903,975 shares of Class A Common Stock and 132,354,128 shares of Class B Common Stock outstanding as of the Closing Date.
Unless otherwise indicated and subject to applicable community property laws, the Company believes that all persons named in the table have sole voting and investment power with respect to all shares of Common Stock of the Company beneficially owned by them.
Unless otherwise indicated below, the address of each beneficial owner listed in the table below is c/o Fisker Inc., 1888 Rosecrans Avenue, Manhattan Beach, California 90266.
Name and Address of Beneficial Owners | Number of shares of Class A Common Stock | % | Number of shares of Class B Common Stock | % | % of Total Voting Power ** | |||||||||||||||
Five Percent Holders | ||||||||||||||||||||
Magna International Inc. (1) | 19,474,454 | 6.6 | — | — | — | |||||||||||||||
Spartan Energy Acquisition Sponsor LLC (2) | 22,306,324 | 7.8 | % | — | — | — | ||||||||||||||
All 5% Holders as a Group | 41,780,778 | 14.3 | % | — | — | — | ||||||||||||||
Current Directors and Named Executive Officers | ||||||||||||||||||||
Henrik Fisker (3) | 8,391,743 | 2.9 | 66,177,064 | 50.0 | 45.4 | |||||||||||||||
Dr. Geeta Gupta (4) | 8,432,486 | 3.0 | 66,177,064 | 50.0 | 45.4 | |||||||||||||||
Wendy J. Greuel (5) | 1,981 | * | — | — | — | |||||||||||||||
Mark E. Hickson (6) | 1,415 | * | — | — | — | |||||||||||||||
William R. McDermott (7) | 849 | * | — | — | — | |||||||||||||||
Roderick K. Randall (8) | 3,510,633 | 1.3 | — | — | — | |||||||||||||||
Nadine I. Watt (9) | 368,671 | * | — | — | — | |||||||||||||||
All Directors and Executive Officers as a Group (8 Individuals) | 20,721,359 | 7.3 | 132,354,128 | 100.0 | 90.8 | |||||||||||||||
| * | Less than one percent. |
| ** | Percentage of total voting power represents voting power with respect to all shares of Class A Common Stock and Class B Common Stock, as a single class. Each share of Class B Common Stock is entitled to ten votes per share and each share of Class A Common Stock is entitled to one vote per share. For more information about the voting rights of Common Stock, see the section entitled “ Description of Capital Stock. |
| (1) | Consists of warrants to purchase 19, 474,454 shares of Class A Common Stock. The business address for this securityholder is 337 Magna Drive, Aurora, Ontario, L4G 7K1, Canada. |
114
| (2) | Consists of 12,946,324 Founder Shares and 9,360,000 Private Warrants. Spartan Energy Acquisition Sponsor LLC (“Sponsor”) is the record holder of the shares and Private Warrants reported herein. Geoffrey Strong is the Chief Executive Officer of Sponsor. Mr. Strong may be deemed to have or share beneficial ownership of the common stock and Private Warrants held directly by Sponsor. In addition, AP Spartan Energy Holdings, L.P., a wholly owned indirect subsidiary of alternative investment vehicles of Apollo Natural Resources Partners II, L.P. (“ANRP II”), directly owns all of the limited liability company interests of Sponsor. Accordingly, ANRP II may be deemed to have or share beneficial ownership of the common stock and Private Warrants held directly by Sponsor. |
| (3) | Consists of (i) 66,177,064 shares of Class B Common Stock, (ii) 50% of the 941,518 shares (470,759 shares) of Class A Common Stock held by HF Holdco, LLC, and (iii) 7,920,984 shares of Class A Common Stock issuable upon the exercise of stock options exercisable within 60 days after the Closing Date. Mr. Fisker, a member of the Board of Directors serves as a Member of HF Holdco, LLC and as such, has shared voting and dispositive power with respect to the shares held by HF Holdco, LLC. and may be deemed to beneficially own the shares of Common Stock held by HF Holdco, LLC. |
| (4) | Consists of (i) 66,177,064 shares of Class B Common Stock, (ii) 50% of the 941,518 shares (470,759 shares) of Class A Common Stock held by HF Holdco, LLC, and (iii) 7,961,727 shares of Class A Common Stock issuable upon the exercise of stock options exercisable within 60 days after the Closing Date. Dr. Gupta, a member of the Board of Directors serves as a Member of HF Holdco, LLC and as such, has shared voting and dispositive power with respect to the shares held by HF Holdco, LLC. and may be deemed to beneficially own the shares of Common Stock held by HF Holdco, LLC. |
| (5) | Represents shares of Class A Common Stock issuable upon the exercise of stock options exercisable within 60 days after the Closing Date. |
| (6) | Represents shares of Class A Common Stock issuable upon the exercise of stock options exercisable within 60 days after the Closing Date. |
| (7) | Represents shares of Class A Common Stock issuable upon the exercise of options exercisable within 60 days after the Closing Date. |
| (8) | Consists of (i) 1,829,662 shares of Class A Common Stock, (ii) 108,105 shares of Class A Common Stock issuable upon the exercise of stock options exercisable within 60 days after the Closing Date, (iii) 1,543,275 shares of Class A Common Stock held by the Randall Group’s Series Fisker, and (iv) 29,591 shares of Class A Common Stock held by the Randall Group’s Fisker Series C. Mr. Roderick Randall, a member of the Board of Directors, is the Managing Director of the Randall Group’s Series Fisker and Fisker Series C (the “Randall Group”). As Managing Director of the Randall Group, Mr. Randall has voting and dispositive power with respect to the shares held by the Randall Group and he may be deemed to beneficially own the shares of common stock held by the Randall Group. |
| (9) | Consists of (i) 366,690 shares of Class A Common Stock held by the Nadine Watt Jameson Family Trust, of which Ms. Watt is the trustee, and (ii) 1,981 shares of Class A Common Stock issuable upon the exercise of stock options exercisable within 60 days after the Closing Date. Ms. Watt is the sole trustee of the Nadine Watt Jameson Family Trust and holds sole voting and dispositive power with respect to the shares held of record by Nadine Watt Jameson Family Trust. |
115
SELLING SECURITYHOLDERS
This prospectus relates to the possible resale by the Selling Securityholders of up to 133,785,596 shares of our Class A Common Stock and 9,360,000 Private Warrants. The PIPE Investors acquired shares of Class A Common Stock pursuant to the Subscription Agreements. The Former Sponsor acquired shares of Class A Common Stock and Private Warrants exercisable for shares of Class A Common Stock concurrently with our IPO (including shares converted from Founder Shares into Conversion Shares in connection with the Business Combination). Robert C. Reeves, John M. Stice, John J. MacWilliams and Jan C. Wilson, our former directors, each acquired Founder Shares in connection with the Company’s IPO, which shares converted into Conversion Shares at the closing of the Business Combination. Henrik Fisker and Dr. Geeta Gupta, including certain affiliated entities, acquired shares of Class A Common Stock and shares of Class A Common underlying shares of Class B Common Stock pursuant to the Business Combination. Magna acquired the Magna Warrants in connection with entering into the Cooperation Agreement.
A description of our relationships with certain of the Selling Securityholders and their affiliates is set forth in “.”
Certain Relationships and Related Transactions
When we refer to the “Selling Securityholders” in this prospectus, we mean the persons listed in the table below, and the pledgees, donees, or other transferees who later come to hold any of the Class A Common Stock or Private Warrants other than through a public sale, including through a distribution by such Selling Securityholders to their members.
The following table is prepared based on information provided to us by the Selling Securityholders. It sets forth the name and address of the Selling Securityholders, the aggregate number of shares of Class A Common Stock and Private Warrants that the Selling Securityholders may offer pursuant to this prospectus, and the beneficial ownership of the Selling Securityholders both before and after the offering. We have based percentage ownership prior to this offering on 276,895,304 shares of Common Stock and 9,360,000 Private Warrants outstanding, in each case as of October 30, 2020. In calculating percentages of shares of Class A Common Stock owned by a particular Selling Securityholder, we treated as outstanding the number of shares of our Class A Common Stock issuable upon exercise of that particular Selling Securityholder’s Private Warrants, if any, and did not assume the exercise of any other Selling Securityholder’s Private Warrants.
We cannot advise you as to whether the Selling Securityholders will in fact sell any or all of such Class A Common Stock or Private Warrants. In addition, the Selling Securityholders may sell, transfer or otherwise dispose of, at any time and from time to time, the Class A Common Stock and Private Warrants in transactions exempt from the registration requirements of the Securities Act after the date of this prospectus. For purposes of this table, we have assumed that the Selling Securityholders will have sold all of the securities covered by this prospectus upon the completion of the offering.
Unless otherwise indicated below, the address of each beneficial owner listed in the table below is 1888 Rosecrans Avenue, Manhattan Beach, CA, 90266.
116
Shares of Class A Common Stock
Name of Selling Securityholder | Shares of Class A Common Stock Beneficially Owned prior to Offering | Private Warrants Beneficially owned prior to Offering | Number of Shares of Class A Common Stock Being Offered | Number of Private Warrants Being Offered | Shares of Class A Common Stock Beneficially Owned After the Offered Shares of Class A Common Stock are Sold | Private Warrants Beneficially Owned After the Offered Warrants are Sold | ||||||||||||||||||||||||||
Shares | Percent | Number | Percent | |||||||||||||||||||||||||||||
PIPE Shares | ||||||||||||||||||||||||||||||||
Prentice Capital Long/Short Equity Master Fund II LP (1) | 1,000,000 | — | 1,000,000 | — | — | — | — | — | ||||||||||||||||||||||||
Highmark Limited, in respect of its Segregated Account Highmark Long/Short Equity 17 Limited (2) | 2,500,000 | — | 2,500,000 | — | — | — | — | — | ||||||||||||||||||||||||
Tech Opportunities II LLC (3) | 4,250,000 | — | 4,250,000 | — | — | — | — | — | ||||||||||||||||||||||||
Alyeska Master Fund, L.P. (4) | 4,513,600 | — | 4,513,600 | — | — | — | — | — | ||||||||||||||||||||||||
Alyeska Master Fund 3, L.P. (4) | 36,400 | — | 36,400 | — | — | — | — | — | ||||||||||||||||||||||||
Nineteen77 Global Merger Arbitrage Master Limited (5) | 1,150,000 | — | 1,150,000 | — | — | — | — | — | ||||||||||||||||||||||||
Nineteen77 Global Multi-Strategy Alpha Master Limited (5) | 1,000,000 | — | 1,000,000 | — | — | — | — | — | ||||||||||||||||||||||||
Nineteen77 Environmental Focus Fund (Cayman) Master Limited (5) | 75,000 | — | 75,000 | — | — | — | — | — | ||||||||||||||||||||||||
Select Alternative Strategies II ICAV, on behalf of Nineteen77 Environmental Focus Fund (EU) (5) | 75,000 | — | 75,000 | — | — | — | — | — | ||||||||||||||||||||||||
AllianceBernstein L.P. (6) | 3,300,000 | — | 3,300,000 | — | — | — | — | — | ||||||||||||||||||||||||
Moore Global Investments, LLC (7) | 4,250,000 | — | 4,250,000 | — | — | — | — | — | ||||||||||||||||||||||||
CVI Investments, Inc. (8) | 950,000 | — | 950,000 | — | — | — | — | — | ||||||||||||||||||||||||
Shotfut Menayot Chool – Phoenix Amitim (9) | 990,000 | — | 990,000 | — | — | — | — | — | ||||||||||||||||||||||||
The Phoenix Insurance Company Ltd. (9) | 110,000 | — | 110,000 | — | — | — | — | — | ||||||||||||||||||||||||
117
Name of Selling Securityholder | Shares of Class A Common Stock Beneficially Owned prior to Offering | Private Warrants Beneficially owned prior to Offering | Number of Shares of Class A Common Stock Being Offered | Number of Private Warrants Being Offered | Shares of Class A Common Stock Beneficially Owned After the Offered Shares of Class A Common Stock are Sold | Private Warrants Beneficially Owned After the Offered Warrants are Sold | ||||||||||||||||||||||||||
Shares | Percent | Number | Percent | |||||||||||||||||||||||||||||
BEMAP Master Fund Ltd. (10) | 272,700 | — | 272,700 | — | — | — | — | — | ||||||||||||||||||||||||
Monashee Solitario Fund LP (10) | 163,620 | — | 163,620 | — | — | — | — | — | ||||||||||||||||||||||||
Monashee Pure Alpha SPV I LP (10) | 122,700 | — | 122,700 | — | — | — | — | — | ||||||||||||||||||||||||
SFL SPV I LLC (10) | 40,980 | — | 40,980 | — | — | — | — | — | ||||||||||||||||||||||||
BNP Paribas Asset Management UK Limited, on behalf of BNP Paribas Funds Energy Transition (11) | 1,640,000 | — | 1,640,000 | — | — | — | — | — | ||||||||||||||||||||||||
ICS Opportunities, Ltd. (12) | 290,000 | — | 290,000 | — | — | — | — | — | ||||||||||||||||||||||||
Integrated Core Strategies (US) LLC (13) | 1,109,971 | — | 1,010,000 | — | 99,971 | * | — | — | ||||||||||||||||||||||||
Norges Bank (The Central Bank of Norway) (14) | 3,250,000 | — | 3,250,000 | — | — | — | — | — | ||||||||||||||||||||||||
Magnetar Constellation Master Fund, Ltd. (14) | 111,050 | — | 111,050 | — | — | — | — | — | ||||||||||||||||||||||||
Magnetar Structured Credit Fund, LP (14) | 43,870 | — | 43,870 | — | — | — | — | — | ||||||||||||||||||||||||
Magnetar Xing He Master Fund Ltd (14) | 40,810 | — | 40,810 | — | — | — | — | — | ||||||||||||||||||||||||
Magnetar SC Fund Ltd (14) | 30,730 | — | 30,730 | — | — | — | — | — | ||||||||||||||||||||||||
Magnetar Longhorn Fund LP (14) | 19,120 | — | 19,120 | — | — | — | — | — | ||||||||||||||||||||||||
Purpose Alternative Credit Fund – F LLC (14) | 15,770 | — | 15,770 | — | — | — | — | — | ||||||||||||||||||||||||
Purpose Alternative Credit Fund – T LLC (14) | 7,880 | — | 7,880 | — | — | — | — | — | ||||||||||||||||||||||||
Magnetar Capital Master Fund, Ltd (14) | 80,770 | — | 80,770 | — | — | — | — | — | ||||||||||||||||||||||||
Entities affiliated with Federated Global Investment Management Corp. (15) | 3,000,000 | — | 3,000,000 | — | — | — | — | — | ||||||||||||||||||||||||
Blue Rock Capital Fund, L.P. (16) | 218,034 | — | 200,411 | — | 17,623 | * | — | — | ||||||||||||||||||||||||
118
Name of Selling Securityholder | Shares of Class A Common Stock Beneficially Owned prior to Offering | Private Warrants Beneficially owned prior to Offering | Number of Shares of Class A Common Stock Being Offered | Number of Private Warrants Being Offered | Shares of Class A Common Stock Beneficially Owned After the Offered Shares of Class A Common Stock are Sold | Private Warrants Beneficially Owned After the Offered Warrants are Sold | ||||||||||||||||||||||||||
Shares | Percent | Number | Percent | |||||||||||||||||||||||||||||
Blue Rock Liquid Alpha Fund, L.P. (16) | 115,780 | — | 106,860 | — | 8,920 | * | — | — | ||||||||||||||||||||||||
DBC CAV Master, LP (17) | 314,893 | — | 290,865 | — | 24,028 | * | — | — | ||||||||||||||||||||||||
Deep Basin Long-Short Master Fund LP (18) | 2,174,018 | — | 2,001,864 | — | 172,154 | * | — | — | ||||||||||||||||||||||||
Healthcare of Ontario Pension Plan Trust Fund (19) | 1,100,000 | — | 1,100,000 | — | — | — | — | — | ||||||||||||||||||||||||
HBK Master Fund L.P. (20) | 400,000 | — | 400,000 | — | — | — | — | — | ||||||||||||||||||||||||
Suvretta Master Fund, Ltd. (21) | 994,000 | — | 994,000 | — | — | — | — | — | ||||||||||||||||||||||||
Suvretta Long Master Fund, Ltd. (21) | 6,000 | — | 6,000 | — | — | — | — | — | ||||||||||||||||||||||||
Millais Limited (22) | 400,000 | — | 400,000 | — | — | — | — | — | ||||||||||||||||||||||||
Park West Investors Master Fund, Limited (23) | 775,000 | — | 775,000 | — | — | — | — | — | ||||||||||||||||||||||||
Park West Partners International, Limited (23) | 75,000 | — | 75,000 | — | — | — | — | — | ||||||||||||||||||||||||
Hartree Partners, LP ( 24) | 900,000 | — | 900,000 | — | — | — | — | — | ||||||||||||||||||||||||
M.H. Davidson & Co. (25) | 34,440 | — | 34,440 | — | — | — | — | — | ||||||||||||||||||||||||
Davidson Kempner International, Ltd. (25) | 517,200 | — | 517,200 | — | — | — | — | — | ||||||||||||||||||||||||
Davidson Kempner Institutional Partners, L.P. (25) | 440,400 | — | 440,400 | — | — | — | — | — | ||||||||||||||||||||||||
Davidson Kempner Partners (25) | 207,960 | — | 207,960 | — | — | — | — | — | ||||||||||||||||||||||||
Citadel Multi-Strategy Equities Master Fund Ltd. (26) | 1,250,000 | — | 1,250,000 | — | — | — | — | — | ||||||||||||||||||||||||
Putnam Variable Trust – Putnam VT George Putnam Balanced Fund (27) | 24,857 | — | 24,857 | — | — | — | — | — | ||||||||||||||||||||||||
Putnam Variable Trust – Putnam VT Research Fund (27) | 8,946 | — | 8,946 | — | — | — | — | — | ||||||||||||||||||||||||
119
Name of Selling Securityholder | Shares of Class A Common Stock Beneficially Owned prior to Offering | Private Warrants Beneficially owned prior to Offering | Number of Shares of Class A Common Stock Being Offered | Number of Private Warrants Being Offered | Shares of Class A Common Stock Beneficially Owned After the Offered Shares of Class A Common Stock are Sold | Private Warrants Beneficially Owned After the Offered Warrants are Sold | ||||||||||||||||||||||||||
Shares | Percent | Number | Percent | |||||||||||||||||||||||||||||
George Putnam Balanced Fund (27) | 189,486 | — | 189,486 | — | — | — | — | — | ||||||||||||||||||||||||
Putnam Investment Funds – Putnam Research Fund (27) | 72,227 | — | 72,227 | — | — | — | — | — | ||||||||||||||||||||||||
Putnam Variable Trust – Putnam VT Sustainable Future Fund (27) | 17,988 | — | 17,988 | — | — | — | — | — | ||||||||||||||||||||||||
Putnam Investment Funds – Putnam Sustainable Future Fund (27) | 230,685 | — | 230,685 | — | — | — | — | — | ||||||||||||||||||||||||
Putnam Funds Trust – Putnam Global Technology Fund (27) | 385,515 | — | 385,515 | — | — | — | — | — | ||||||||||||||||||||||||
37 Capital Bluescale Fund, LP (27) | 320,296 | — | 320,296 | — | — | — | — | — | ||||||||||||||||||||||||
BlackRock, Inc. (28) | 3,660,000 | — | 3,660,000 | — | — | — | — | — | ||||||||||||||||||||||||
120
Name of Selling Securityholder | Shares of Class A Common Stock Beneficially Owned prior to Offering | Private Warrants Beneficially owned prior to Offering | Number of Shares of Class A Common Stock Being Offered | Number of Private Warrants Being Offered | Shares of Class A Common Stock Beneficially Owned After the Offered Shares of Class A Common Stock are Sold | Private Warrants Beneficially Owned After the Offered Warrants are Sold | ||||||||||||||||||||||||||
Shares | Percent | Number | Percent | |||||||||||||||||||||||||||||
Alberta Investment Management Corporation (29) | 550,000 | — | 550,000 | — | — | — | — | — | ||||||||||||||||||||||||
BMO Nesbitt Burns ITF MMCAP International Inc. SPC on behalf of MMCAP Master Segregated Portfolio (30) | 500,000 | — | 500,000 | — | — | — | — | — | ||||||||||||||||||||||||
Merger Consideration Shares | — | — | — | — | ||||||||||||||||||||||||||||
Amanda Galton | 18,145 | — | 18,145 | — | — | — | — | — | ||||||||||||||||||||||||
Amogha Natha | 34,893 | — | 34,893 | — | — | — | — | — | ||||||||||||||||||||||||
Anup Jacob | 6,710 | — | 6,710 | — | — | — | — | — | ||||||||||||||||||||||||
Beau Boeckmann 2012 Irrevocable Trust No. 1 (31) | 453,908 | — | 453,908 | — | — | — | — | — | ||||||||||||||||||||||||
BLI Fund LLC (32) | 3,645,317 | — | 3,645,317 | — | — | — | — | — | ||||||||||||||||||||||||
Blue Bridge Trust Company Inc., as trustee for Nobile Trust (33) | 21,999 | — | 21,999 | — | — | — | — | — | ||||||||||||||||||||||||
Bo Holmgreen | 34,472 | — | 34,472 | — | — | — | — | — | ||||||||||||||||||||||||
Boeckmann Family Revocable Trust (34) | 453,908 | — | 453,908 | — | — | — | — | — | ||||||||||||||||||||||||
Boxer RE, LP (35) | 1,089,367 | — | 1,089,367 | — | — | — | — | — | ||||||||||||||||||||||||
C4 Ventures I SCSP (36) | 40,304 | — | 40,304 | — | — | — | — | — | ||||||||||||||||||||||||
Caterpillar Venture Capital Inc. (37) | 1,363,646 | — | 1,363,646 | — | — | — | — | — | ||||||||||||||||||||||||
Core Group Properties, LLC (38) | 363,132 | — | 363,132 | — | — | — | — | — | ||||||||||||||||||||||||
Daniel Hennessy | 14,000 | — | 14,000 | — | — | — | — | — | ||||||||||||||||||||||||
David Heath | 19,747 | — | 19,747 | — | — | — | — | — | ||||||||||||||||||||||||
David Lincoln | 13,419 | — | 13,419 | — | — | — | — | — | ||||||||||||||||||||||||
Digital Motors Corporation (39) | 1,359 | — | 1,359 | — | — | — | — | — | ||||||||||||||||||||||||
Divinando Corporation (40) | 1,815,630 | — | 1,815,630 | — | — | — | — | — | ||||||||||||||||||||||||
Fidam Global Fund SPC Limited SP1 (41) | 22,032 | — | 22,032 | — | — | — | — | — | ||||||||||||||||||||||||
Fidam Global Fund SPC Limited SP10 (41) | 20,133 | — | 20,133 | — | — | — | — | — | ||||||||||||||||||||||||
121
Name of Selling Securityholder | Shares of Class A Common Stock Beneficially Owned prior to Offering | Private Warrants Beneficially owned prior to Offering | Number of Shares of Class A Common Stock Being Offered | Number of Private Warrants Being Offered | Shares of Class A Common Stock Beneficially Owned After the Offered Shares of Class A Common Stock are Sold | Private Warrants Beneficially Owned After the Offered Warrants are Sold | ||||||||||||||||||||||||||
Shares | Percent | Number | Percent | |||||||||||||||||||||||||||||
Fidam Global Fund SPC Limited SP2 (41) | 22,032 | — | 22,032 | — | — | — | — | — | ||||||||||||||||||||||||
Fidam Global Fund SPC Limited SP3 (41) | 22,032 | — | 22,032 | — | — | — | — | — | ||||||||||||||||||||||||
Fidam Global Fund SPC Limited SP9 (41) | 20,133 | — | 20,133 | — | — | — | — | — | ||||||||||||||||||||||||
Foundry Square Investors XVI, LLC (42) | 290,500 | — | 290,500 | — | — | — | — | — | ||||||||||||||||||||||||
Gavin Bristow | 46,597 | — | 46,597 | — | — | — | — | — | ||||||||||||||||||||||||
Globeways Holdings Limited (43) | 2,363,899 | — | 2,363,899 | — | — | — | — | — | ||||||||||||||||||||||||
Hakim Assets Management Ltd. (44) | 1,155,317 | — | 1,155,317 | — | — | — | — | — | ||||||||||||||||||||||||
HF Holdco LLC (45) | 941,518 | — | 941,518 | — | — | — | — | — | ||||||||||||||||||||||||
Inspire Investment Corporation (46) | 69,758 | — | 69,758 | — | — | — | — | — | ||||||||||||||||||||||||
Ivan Todorov | 181,553 | — | 181,553 | — | — | — | — | — | ||||||||||||||||||||||||
Jameel Jameel | 13,823 | — | 13,823 | — | — | — | — | — | ||||||||||||||||||||||||
Joe Cozzolino | 34,450 | — | 34,450 | — | — | — | — | — | ||||||||||||||||||||||||
John Paxton | 13,201 | — | 13,201 | — | — | — | — | — | ||||||||||||||||||||||||
Keith L. Black | 544,684 | — | 544,684 | — | — | — | — | — | ||||||||||||||||||||||||
Kelsey Re, L.P. (47) | 363,132 | — | 363,132 | — | — | — | — | — | ||||||||||||||||||||||||
Kenneth Martin | 90,777 | — | 90,777 | — | — | — | — | — | ||||||||||||||||||||||||
Kenneth W. Lang Revocable Trust (48) | 47,116 | — | 47,116 | — | — | — | — | — | ||||||||||||||||||||||||
Lawrence Renna | 1,886 | — | 1,886 | — | — | — | — | — | ||||||||||||||||||||||||
Matt Riley | 261,738 | — | 261,738 | — | — | — | — | — | ||||||||||||||||||||||||
Mitch Zuklie | 54,461 | — | 54,461 | — | — | — | — | — | ||||||||||||||||||||||||
Moore Strategic Ventures, LLC (49) | 5,882,352 | — | 5,882,352 | — | — | — | — | — | ||||||||||||||||||||||||
Nadine I. Watt Jameson Family Trust (50) | 366,690 | — | 366,690 | — | — | — | — | — | ||||||||||||||||||||||||
Nikolaj Coster-Waldau | 13,867 | — | 13,867 | — | — | — | — | — | ||||||||||||||||||||||||
Peninsula Point Productions (51) | 13,867 | — | 13,867 | — | — | — | — | — | ||||||||||||||||||||||||
Phillip Holding ApS (52) | 13,647 | — | 13,647 | — | — | — | — | — | ||||||||||||||||||||||||
122
Name of Selling Securityholder | Shares of Class A Common Stock Beneficially Owned prior to Offering | Private Warrants Beneficially owned prior to Offering | Number of Shares of Class A Common Stock Being Offered | Number of Private Warrants Being Offered | Shares of Class A Common Stock Beneficially Owned After the Offered Shares of Class A Common Stock are Sold | Private Warrants Beneficially Owned After the Offered Warrants are Sold | ||||||||||||||||||||||||||
Shares | Percent | Number | Percent | |||||||||||||||||||||||||||||
Rajesh Atluru & Melissa A. Buckley, Trustees of the 2004 Buckley Atluru Family Trust, U/T/D 9/14/2004 (53) | 13,419 | — | 13,419 | — | — | — | — | — | ||||||||||||||||||||||||
Roderick K. Randall (54) | 1,829,662 | — | 1,829,662 | — | — | — | — | — | ||||||||||||||||||||||||
Sean Barrett | 565 | — | 565 | — | — | — | — | — | ||||||||||||||||||||||||
Series Fisker, a separate series of The Randall Group, LLC (54) | 1,543,275 | — | 1,543,275 | — | — | — | — | — | ||||||||||||||||||||||||
Seunghee Oh | 2,828 | — | 2,828 | — | — | — | — | — | ||||||||||||||||||||||||
Soren Eilersten | 16,409 | — | 16,409 | — | — | — | — | — | ||||||||||||||||||||||||
Stage 1 Growth Fund, LLC Series 3 (55) | 268,603 | — | 268,603 | — | — | — | — | — | ||||||||||||||||||||||||
Stage 1 Growth Fund, LLC Series 3NP (55) | 419,738 | — | 419,738 | — | — | — | — | — | ||||||||||||||||||||||||
Stage 1 Growth Fund, LLC Series G (55) | 1,241,964 | — | 1,241,964 | — | — | — | — | — | ||||||||||||||||||||||||
The Randall Group Fisker Series C (54) | 29,591 | — | 29,591 | — | — | — | — | — | ||||||||||||||||||||||||
Thynk Capital II, LLC (56) | 590,072 | — | 590,072 | — | — | — | — | — | ||||||||||||||||||||||||
Timothy J. McSweeney 2006 Trust (57) | 60,569 | — | 60,569 | — | — | — | — | — | ||||||||||||||||||||||||
Todd W. McSweeney 2007 Trust (58) | 33,671 | — | 33,671 | — | — | — | — | — | ||||||||||||||||||||||||
William Davis Ballard | 45,389 | — | 45,389 | — | — | — | — | — | ||||||||||||||||||||||||
Conversion Shares | — | — | — | — | ||||||||||||||||||||||||||||
Spartan Energy Acquisition Sponsor LLC (59) | 22,306,324 | 9,360,000 | 22,306,324 | 9,360,000 | — | — | — | — | ||||||||||||||||||||||||
Robert C. Reeves | 150,000 | — | 150,000 | — | — | — | — | — | ||||||||||||||||||||||||
John M. Stice | 150,000 | — | 150,000 | — | — | — | — | — | ||||||||||||||||||||||||
John J. MacWilliams | 75,000 | — | 75,000 | — | — | — | — | — | ||||||||||||||||||||||||
Jan C. Wilson | 37,500 | — | 37,500 | — | — | — | — | — | ||||||||||||||||||||||||
Magna Warrants | — | — | — | — | — | — | ||||||||||||||||||||||||||
Magna International Inc. | 19,474,454 | — | 19,474,454 | — | — | — | — | — | ||||||||||||||||||||||||
Executive Shares | — | — | — | — | — | — | ||||||||||||||||||||||||||
Henrik Fisker (60) | 66,177,064 | — | 6,617,706 | — | 59,559,358 | 21.5 | % | — | — | |||||||||||||||||||||||
Dr. Geeta Gupta (60) | 66,177,064 | — | 6,617,706 | — | 59,559,358 | 21.5 | % | — | — | |||||||||||||||||||||||
TOTAL | 253,227,008 | 9,360,000 | 133,785,596 | 9,360,000 | 119,441,412 | 43.1 | % | — | — | |||||||||||||||||||||||
| * | Represents beneficial ownership of less than 1%. |
| (1) | Prentice Capital Long/Short Equity Fund II, LP (“Prentice Long/Short”) is the owner of the shares, and shares voting and dispositive power over the shares with Prentice Capital Management, LP (“Prentice Capital Management”), the investment manager of Prentice Long/Short, and Michael Zimmerman, the managing member of certain entities that, directly or indirectly, serve as the general partner or investment manager of Prentice Long/Short. The address of Prentice Long/Short, Prentice Capital Management, and Mr. Zimmerman is 100 West Putnam Avenue-Slagle House, Greenwich, Connecticut 06830. |
| (2) | Highmark Limited, in respect of its Segregated Account Highmark Long/Short Equity 17 (“Highmark”) is the owner of the shares, and shares voting and dispositive power over the shares with Prentice Capital Management, the investment manager of Highmark, and Michael Zimmerman, the managing member of certain entities that, directly or indirectly, serve as the general partner or investment manager of Highmark. The address of Highmark, Prentice Capital Management, and Mr. Zimmerman is 100 West Putnam Avenue-Slagle House, Greenwich, Connecticut 06830. |
| (3) | Hudson Bay Capital Management LP, the investment manager of Tech Opportunities II LLC, has voting and investment power over these securities. Sander Gerber is the managing member of Hudson Bay Capital GP LLC, which is the general partner of Hudson Bay Capital Management LP. Each of Tech Opportunities II LLC and Sander Gerber disclaims beneficial ownership over these securities. |
123
| (4) | Alyeska Investment Group, L.P., the investment manager of Alyeska Master Fund, L.P. and Alyeska Master Fund 3, L.P. (the “Alyeska Funds”), has voting and investment control of the shares held by the Alyeska Funds. Anand Parekh is the Chief Executive Officer of Alyeska Investment Group, L.P. and may be deemed to be the beneficial owner of such shares. Mr. Parekh, however, disclaims any beneficial ownership of the shares held by the Alyeska Funds. The address of these entities and Mr. Parekh is 77 W. Wacker, Suite 700, Chicago, Illinois 60601. |
| (5) | Nineteen77 Global Merger Arbitrage Master Limited, Nineteen77 Global Multi-Strategy Alpha Master Limited, Nineteen77 Environmental Focus Fund (Cayman) Master Limited, and Select Alternative Strategies II ICAV, on behalf of Nineteen77 Environmental Focus Fund (EU) (collectively, the “Nineteen77 Entities”). Kevin Russell, the Chief Investment Officer of UBS O’Connor LLC, is deemed to have power to vote or dispose of the shares held by these Selling Securityholders. The address of the Nineteen77 Entities and Mr. Russell is c/o UBS O’Connor LLC, One North Wacker Drive, 31st Floor, Chicago, Illinois 60606. |
| (6) | Includes (i) 68,750 shares of Class A Common Stock owned by Chicago District Council of Carpenters Pension Fund, (ii) 269,050 shares of Class A Common Stock owned by Principal Funds, Inc. - SmallCap Growth Fund I, (iii) 44,170 shares of Class A Common Stock owned by New Hampshire Retirement System, (iv) 148,360 shares of Class A Common Stock owned by Verizon Master Saving Trust, (v) 28,110 shares of Class A Common Stock owned by Bell Atlantic Master Trust, (vi) 20,900 shares of Class A Common Stock owned by CNA Employees’ Retirement Trust, (vii) 305,130 shares of Class A Common Stock owned by EQ Advisors Trust - AXA/AB Small Cap Growth Portfolio, (viii) 1,010 shares of Class A Common Stock owned by AXA Offshore Multimanager Funds Trust - AXA Offshore Aggressive Multimanager Fund, (ix) 40 shares of Class A Common Stock owned by AXA Offshore Multimanager Funds Trust - AXA Offshore Conservative Multimanager Fund, (x) 2,700 shares of Class A Common Stock owned by AXA Offshore Multimanager Funds Trust - AXA Offshore Moderate Multimanager Fund, (xi) 40,100 shares of Class A Common Stock owned by The District of Columbia Retirement Board, (xii) 1,390 shares of Class A Common Stock owned by Florida 529 Savings Plan, (xiii) 24,980 shares of Class A Common Stock owned by Investment Master Trust of Exelis Inc., (xiv) 2,020 shares of Class A Common Stock owned by Loews Corporation and Subsidiaries Master Retirement Trust, (xv) 1,023,850 shares of Class A Common Stock owned by AB Cap Fund, Inc. - AB Small Cap Growth Portfolio, (xvi) 29,970 shares of Class A Common Stock owned by AB Variable Products Series Fund, Inc. - AB Small Cap Growth Portfolio, (xvii) 13,300 shares of Class A Common Stock owned by AB Collective Investment Trust Series - AB US Small & Mid Cap Core Collective Trust, (xviii) 871,920 shares of Class A Common Stock owned by AB Discovery Growth Fund, Inc., (xix) 18,770 shares of Class A Common Stock owned by Sanford C. Bernstein Fund, Inc. - Overlay A Portfolio, (xx) 44,110 shares of Class A Common Stock owned by Sanford C. Bernstein Fund, inc. - Tax-Aware Overlay A Portfolio, (xxi) 72,770 shares of Class A Common Stock owned by Northrop Grumman Pension Master Trust, (xxii) 43,600 shares of Class A Common Stock owned by Schwab Institutional Trust Funds - Schwab Institutional Small Cap Trust Fund, (xxiii) 160,830 shares of Class A Common Stock owned by AB Collective Investment Trust Series - AB US Small & Mid Cap Growth Collective Trust, (xxiv) 7,430 shares of Class A Common Stock owned by AB Collective Investment Trust Series - AB US Small Cap Growth Collective Trust, (xxv) 24,980 shares of Class A Common Stock owned by Laborer’s Pension Plan, (xxvi) 21,000 shares of Class A Common Stock owned by Bakery and Confectionary Union and Industry International Pension Fund, (xxvii) 7,140 shares of Class A Common Stock owned by Milwaukee Drivers Pension Plan and (xxviii) 3,620 shares of Class A Common Stock owned by Scarlett Investment Partnership (collectively, the “AllianceBernstein Accounts”). AllianceBernstein L.P. is investment advisor to the AllianceBernstein Accounts. Neil Ruffell, in his position as Head of Portfolio Administration of AllianceBernstein L.P., may be deemed to have voting and investment power with respect to the common stock owned by the AllianceBernstein Accounts. The address for the foregoing persons is 1345 Avenue of the Americas, New York, NY 10105. |
| (7) | Moore Capital Management, LP (“MCM LP”), the investment manager of Moore Global Investments, LLC (“MGI LLC”), has voting and investment control over the shares held by MGI LLC. Louis M. Bacon controls the general partner of MCM LP and may be deemed the beneficial owner of the shares held by MGI LLC. Mr. Bacon also is the indirect majority owner of MGI LLC. MGI LLC and Mr. Bacon are affiliated with Moore Strategic Ventures, LLC (see footnote (49) below). The address of MGI LLC, MCM LP and Mr. Bacon is 11 Times Square, 38 th Floor, New York, New York 10036. |
| (8) | Heights Capital Management, Inc., the authorized agent of CVI Investments, Inc. (“CVI”), has discretionary authority to vote and dispose of the shares held by CVI and may be deemed to be the beneficial owner of these shares. Martin Kobinger, in his capacity as Investment Manager of Heights Capital Management, Inc., may also be deemed to have investment discretion and voting power over the shares held by CVI. Mr. Kobinger disclaims any such beneficial ownership of the shares. CVI is affiliated with one or more FINRA members. CVI purchased the shares being registered hereunder in the ordinary course of business and at the time of purchase, had no agreements or understandings, directly or indirectly, with any other person to distribute such shares. |
| (9) | The securities reported under the Phoenix Insurance Company Ltd. and Shotfut Menayot Chool – Phoenix Amitim are beneficially owned by The Phoenix Holdings Ltd. (the “Phoenix”) as subsidiaries of it. The subsidiaries manage their own funds and/or the funds of others, including for members of pension or provident funds. The Phoenix and each of the subsidiaries operates under independent management and makes its own independent voting and investment decisions. The address for the Phoenix and each of the subsidiaries is 53 Derech Hashalom Street, Givatyim, Israel. |
| (10) | Voting and investment power over the shares held by these entities resides with Monashee Investment Management LLC. Jeff Muller, in his capacity as Chief Compliance Officer of Monashee Investment Management LLC, may also be deemed to have |
124
| investment discretion and voting power over the shares held by each such entity. The address of the foregoing individuals and entities is c/o Monashee Investment Management LLC, 75 Park Plaza, 2nd Floor, Boston, MA 02116. |
| (11) | Consists of (i) 309,197 shares of common stock held by BNP PARIBAS FUNDS ENERGY TRANSITION. BNP PARIBAS ASSET MANAGEMENT UK Ltd (“BNPP AM UK”) is a registered investment manager and acts as investment manager to BNP PARIBAS FUNDS ENERGY TRANSITION on whose behalf these shares were purchased. BNPP AM UK is an affiliate of a broker-dealer. BNPP AM UK acquired the shares being registered hereunder in the ordinary course of business, and at the time of the acquisition of the shares described herein, BNPP AM UK did not have any arrangements or understandings with any person to distribute such securities. BNPP AM UK holds the voting and dispositive power with respect to the shares held by BNP PARIBAS FUNDS ENERGY TRANSITION. BNPP AM UK is a wholly owned subsidiary of BNP PARIBAS ASSET MANAGEMENT HOLDING SA, and its ultimate parent company is BNP PARIBAS SA. The registered address of BNPP AM UK is 5 Aldermanbury square, London, UK, EC2V 7BP. |
| (12) | ICS Opportunities II LLC (“ICS Opportunities II”), an affiliate of ICS Opportunities, Ltd. (“ICS Opportunities”) and Integrated Core Strategies (US) LLC (“Integrated Core Strategies”), beneficially owns 14,000 shares of our common stock. Millennium International Management LP (“Millennium International Management”) is the investment manager to ICS Opportunities and ICS Opportunities II LLC and may be deemed to have shared voting control and investment discretion over securities owned by ICS Opportunities and ICS Opportunities II. Millennium Management LLC (“Millennium Management”) is the general partner of the managing member of Integrated Core Strategies and may be deemed to have shared voting control and investment discretion over securities owned by Integrated Core Strategies. Millennium Management is also the general partner of the 100% owner of ICS Opportunities and ICS Opportunities II and may also be deemed to have shared voting control and investment discretion over securities owned by ICS Opportunities and ICS Opportunities II. Millennium Group Management LLC (“Millennium Group Management”) is the managing member of Millennium Management and may also be deemed to have shared voting control and investment discretion over securities owned by Integrated Core Strategies. Millennium Group Management is also the general partner of Millennium International Management and may also be deemed to have shared voting control and investment discretion over securities owned by ICS Opportunities and ICS Opportunities II. The managing member of Millennium Group Management is a trust of which Israel A. Englander currently serves as the sole voting trustee. Therefore, Mr. Englander may also be deemed to have shared voting control and investment discretion over securities owned by Integrated Core Strategies, ICS Opportunities and ICS Opportunities II. The foregoing should not be construed in and of itself as an admission by Millennium International Management, Millennium Management, Millennium Group Management or Mr. Englander as to beneficial ownership of the securities owned by Integrated Core Strategies, ICS Opportunities or ICS Opportunities II, as the case may be. The address of Integrated Core Strategies is c/o Millennium Management, 666 Fifth Avenue, 8th Floor, New York, New York 10103. The address of ICS Opportunities and ICS Opportunities II is c/o Millennium International Management, 666 Fifth Avenue, 8th Floor, New York, New York 10103. |
| (13) | The address of Norges Bank is Bankplassen 2, P.O. Box 1179, Sentrum, NO 0101, Oslo, Norway. |
| (14) | Voting and investment power over the shares held by these entities resides with their investment adviser, Magnetar Financial LLC. Magnetar Capital Partners LP serves as the sole member and parent holding company of Magnetar Financial LLC. Supernova Management LLC is the general partner of Magnetar Capital Partners LP. Mr. Alec Litowitz is the manager of Supernova Management LLC. The address of these entities and Mr. Litowitz is c/o Magnetar Financial LLC, 1603 Orrington Avenue, 13 th Floor, Evanston, Illinois 60201. |
| (15) | Consists of (i) 974,000 shares of common stock held by Federated Hermes Kaufmann Fund, a portfolio of Federated Hermes Equity Funds, (ii) 2,000,000 shares of common stock held by Federated Hermes Kaufmann Small Cap Fund, a portfolio of Federated Hermes Equity Funds and (iii) 26,000 shares of common stock held by Federated Hermes Kaufmann Fund II, a Federated Hermes Insurance Series (collectively, the “Federated Funds”). The address of the Federated Funds is 4000 Ericsson Drive, Warrendale, Pennsylvania 15086-7561. The Federated Funds are managed by Federated Equity Management Company of Pennsylvania and subadvised by Federated Global Investment Management Corp., which are wholly owned subsidiaries of FII Holdings, Inc., which is a wholly owned subsidiary of Federated Hermes, Inc. (the “Parent”). All of the Parent’s outstanding voting stock is held in the Voting Shares Irrevocable Trust, or the Trust, for which Thomas R. Donahue, Rhodora J. Donahue and J. Christopher Donahue, who are collectively referred to as Trustees, act as trustees. The Parent’s subsidiaries have the power to direct the vote and disposition of the securities held by the Funds. Each of the Parent, its subsidiaries, the Trust, and each of the Trustees expressly disclaim beneficial ownership of such securities. |
| (16) | Deep Basin Capital LP is a Portfolio Manager of Blue Rock Capital Fund, L.P. and Blue Rock Liquid Alpha Fund, L.P. (the “Blue Rock Funds”) pursuant to an Investment Sub-Advisory Agreement with each of the Blue Rock Funds and, as such, has voting power and dispositive power with respect to these shares, and may be deemed to beneficially own these shares. Blue Rock Advisors, LLC is the general partner and investment adviser of the Blue Rock Funds. Blue Rock Advisors, Inc., Robbie Burkhart and Mark Steen are members of Blue Rock Advisors, LLC, and Robert Fullerton and Mark Steen are shareholders of Blue Rock Advisors, Inc., and as such, may be deemed to beneficially own the shares held by the Blue Rock Funds. The address of these entities and individuals is 445 East Lake Street, Suite 120, Wayzata, Minnesota 55391. |
| (17) | CAV GP Ltd. is the general partner of DBC CAV Master, LP. Khalid Iton and Campbell Congdon are directors of CAV GP Ltd. and share voting and dispositive power over the shares held by DBC CAV Master, LP. The address of DBC CAV Master, LP is c/o HedgeMark Advisors, 240 Greenwich Street, 6 th Floor, New York, New York 10286. |
125
| (18) | Deep Basin Long-Short Fund GP LLC (the “General Partner”) is the general partner of Deep Basin Long-Short Master Fund LP (“Deep Basin LP”). Deep Basin Capital LP (the “Investment Manager”) acts as investment manager to, and exercises investment discretion with respect to the shares directly owned by, a number of accounts and investment vehicles, including Deep Basin LP. Matthew J. Smith ultimately controls the General Partner and the Investment Manager, but disclaims any beneficial ownership with respect to the shares held by Deep Basin LP except to the extent of his pecuniary interest therein. The address of Deep Basin LP is 484 Pacific Street, 2 nd Floor, Stamford, Connecticut 06902. |
| (19) | The address of Healthcare of Ontario Pension Plan Trust Fund is 1 York Street, Suite 1900, Toronto, Ontario, Canada M5J 0B6. |
| (20) | HBK Investments L.P. has shared voting and dispositive power over the shares held by HBK Master Fund L.P. pursuant to an Investment Management Agreement between HBK Investments L.P. and HBK Master Fund L.P. HBK Investments L.P. has delegated discretion to vote and dispose of these shares to HBK Services LLC. The following individuals may be deemed to have control over HBK Investments L.P. and HBK Services LLC: Jamiel A. Akhtar, Richard L. Booth, David C. Haley, Jon L. Mosle III and Matthew Luth. The address of each of these entities and individuals is c/o HBK Services LLC, 2300 North Field Street, Suite 2200, Dallas, Texas 75201. |
| (21) | Suvretta Capital Management, LLC has shared voting and dispositive power over the shares held by Suvretta Master Fund, Ltd. and Suvretta Long Master Fund, Ltd. and Aaron Cowen is a control person of Suvretta Capital Management, LLC and as such may be deemed to beneficially own these shares. The address of Suvretta Capital Management, LLC is 540 Madison Avenue, 7th Floor, New York, New York 10022. |
| (22) | BlueCrest Capital Management Limited, the investment manager of Millais Limited, has voting and investment control of the shares held by Millais Limited. Michael Platt is the Chief Executive Officer of BlueCrest Capital Management Limited and may be deemed to be the beneficial owner of such shares. The address of these entities and Mr. Platt is c/o Millais USA LLC, 767 5 th Ave., 9th Fl., New York, NY 10153. |
| (23) | Park West Asset Management LLC is the investment manager to Park West Investors Master Fund, Limited and Park West Partners International, Limited. Peter S. Park is the sole member and manager of Park West Asset Management LLC and has sole voting and dispositive power over these shares. The address of Park West Investors Master Fund, Limited is 900 Larkspur Landing Circle, Suite 165, Larkspur, California 94939. |
| (24) | Hartree Partners, LP (“Hartree”) is managed by Hartree Partners GP, LLC (“Hartree GP”) as the general partner of Hartree. The management committee of Hartree GP establishes the trading guidelines of Hartree and holds voting and dispositive power over the shares held by Hartree. Such management committee is comprised of the following six members: Steve Hendel, Steve Semlitz, Jonathan Merison, Robert O’Leary, Brook Hinchman and Jordan Mikes. The address of Hartree, Hartree GP and Messrs. Hendel, Semlitz and Merison is 1185 Avenue of the Americas, New York, New York 10036. The address of Messrs. O’Leary, Hinchman and Mikes is 333 South Grand Avenue, 28 th Floor, Los Angeles, California 90071. |
| (25) | Davidson Kempner Capital Management LP (“DKCM”) holds voting and dispositive power over the shares held by M.H. Davidson & Co., Davidson Kempner International, Ltd., Davidson Kempner Institutional Partners, L.P. and Davidson Kempner Partners (the “Davidson Kempner Entities”). Anthony A. Yoseloff, Eric P. Epstein, Avram Z. Friedman, Conor Bastable, Shulamit Leviant, Morgan P. Blackwell, Patrick W. Dennis, Gabriel T. Schwartz, Zachary Z. Altschuler, Joshua D. Morris and Suzanne K. Gibbons, through DKCM, are responsible for the voting and investment decisions relating to the shares held by the Davidson Kempner Entities. Each of the aforementioned entities and individuals disclaims beneficial ownership of shares held by any other entity or individual names in this footnote except to the extent of such entity or individual’s pecuniary interest therein, if any. The address of each of the entities and individuals is c/o Davidson Kempner Capital Management LP, 520 Madison Avenue, 30 th Floor, New York, New York 10022. |
| (26) | Consists of shares held by Citadel Multi-Strategy Equities Master Fund Ltd. Citadel Advisors LLC., (“CAL”), is a registered investment adviser and acts as investment adviser to certain partnerships and affiliated entities on whose behalf these shares were purchased. CAL is an affiliate of a broker-dealer. CAL acquired the shares being registered hereunder in the ordinary course of business, and at the time of the acquisition of the shares described herein, CAL did not have any arrangements or understandings with any person to distribute such securities. CAL holds the voting and dispositive power with respect to the shares held by Citadel Multi-Strategy Equities master Fund Ltd. Citadel Advisors Holdings LP (“CAH”) is the sole member of CAL. Citadel GP LLC is the general partner of CAH. Kenneth Griffin (“Griffin”) is the President and Chief Executive Officer of and sole member of Citadel GP LLC. Citadel GP LLC and Griffin may be deemed to be the beneficial owners of the stock through their control of CAL and/or certain other affiliated entities. The principal business address for CAL is c/o Citadel Enterprise Americas LLC, 131 South Dearborn Street, Chicago, Illinois 60603. |
| (27) | The account of 37 Capital Bluescale Fund, LP is managed by The Putnam Advisory Company, LLC, or PAC, including sole dispositive and voting power over the shares. Putnam Investment Management, LLC, or PIM, manages the accounts of George Putnam Balanced Fund, Putnam Investment Funds—Putnam Sustainable Future Fund, Putnam Investment Funds—Putnam Research Fund, Putnam Funds Trust—Putnam Global Technology Fund, Putnam Variable Trust—Putnam VT Sustainable Future Fund, Putnam Variable Trust—Putnam VT George Putnam Balanced Fund and Putnam Variable Trust—Putnam VT Research Fund, each of which is a mutual fund registered with the U.S. Securities and Exchange Commission under the Investment Company Act of 1940, as amended. PIM and PAC are owned through a series of holding companies by Great-West Lifeco Inc., a publicly traded company whose shares are listed on the Toronto Stock Exchange. The address for each of these entities is c/o Putnam Investments, 100 Federal Street, Mail Stop: M26A, Boston, MA 02110. |
126
| (28) | The registered holders of the referenced shares to be registered are the following funds and accounts under management by subsidiaries of BlackRock, Inc.: BlackRock Global Funds – Future of Transport Fund (160,000 shares); BlackRock Science and Technology Trust II (1,000,000 shares); BlackRock Global Funds – Next Generation Technology Fund (500,000 shares); BlackRock Strategic Income Opportunities Portfolio of BlackRock Funds V (624,512 shares); Master Total Return Portfolio of Master Bond LLC (375,488 shares); BlackRock Global Allocation Fund, Inc. (677,224 shares); BlackRock Global Allocation V.I. Fund of BlackRock Variable Series Funds, Inc. (236,707 shares); BlackRock Global Allocation Collective Fund (68,426 shares); BlackRock Global Allocation Fund (Australia) (12,172 shares); and BlackRock Global Allocation Portfolio of BlackRock Series Fund, Inc. (5,471 shares). BlackRock, Inc. is the ultimate parent holding company of such subsidiaries. On behalf of such subsidiaries, the applicable portfolio managers, as managing directors (or in other capacities) of such entities, and/or the applicable investment committee members of such funds and accounts, have voting and investment power over the shares held by the funds and accounts which are the registered holders of the referenced shares. Such portfolio managers and/or investment committee members expressly disclaim beneficial ownership of all shares held by such funds and accounts. The address of such funds and accounts, such subsidiaries and such portfolio managers and/or investment committee members is either: 55 East 52nd Street, New York, NY 10055; 1 University Square Drive, Princeton, NJ 08540; or 400 Howard Street, San Francisco, CA 94105. Shares shown include only the securities being registered for resale and may not incorporate all interests deemed to be beneficially held by the registered holders or BlackRock, Inc. |
| (29) | These shares are owned directly by Alberta Investment Management Corporation. Alberta Investment Management Corporation is established as an agent of the Crown in right of the Province of Alberta and manages funds on behalf of a diverse set of Alberta public sector clients for which it serves as investment manager. The address for Alberta Investment Management Corporation is 1600, 10250 -101 Street, Edmonton, AB T5J 3P4. |
| (30) | Matthew MacIsaac is Secretary of MM Asset Management Inc. and holds sole voting and dispositive power with respect to the shares held of record by MM Asset Management Inc. The address of MMCAP International Inc. SPC is c/o MM Asset Management Inc., 161 Bay Street, Suite 2240, Toronto ON M5J 2S1, Canada. |
| (31) | Herbert F. Boeckmann, III is the trustee and sole current beneficiary of the Beau Boeckmann 2012 Irrevocable Trust No. 1 (“Beau Boeckmann Trust”) and has sole voting and investment power over the shares held by the Beau Boeckmann Trust. The address of the Beau Boeckmann Trust is 15505 Roscoe Blvd., North Hills, California 91343. |
| (32) | Bruce Heavin and Lynda Weinman share voting and dispositive power over the shares held by the BLI Fund LLC. The address of BLI Fund LLC is 1187 Coast Village Road #427, Santa Barbara, California 93108. |
| (33) | The shares are held by Blue Bridge Trust Company Inc. (“Blue Bridge”) as trustee for Nobile Trust. Blue Bridge is a registered trust administrator under the laws of the province of Quebec and is headquartered at 1000, Sherbrooke Street West, Suite 1900, Montreal (QC) H3A3G4 Canada. The Nobile Trust is an irrevocable trust over which Blue Bridge Exercises sole voting and investment control. |
| (34) | Herbert F. Boeckmann, II and Floy Jane Boeckmann, as trustees of the Boeckmann Family Revocable Trust (“Boeckmann Family Trust”), share voting and investment power over the shares held by the Boeckmann Family Trust. Herbert F. Boeckmann, II and Floy Jane Boeckmann are also the current beneficiaries of the Boeckmann Family Trust. The address of the Boeckmann Family Trust is 15505 Roscoe Blvd., North Hills, California 91343. |
| (35) | Boxer GM, L.L.C. (“Boxer LLC”) is the general partner of Boxer RE, L.P. (“Boxer LP”). Andrew Segal is the manager of Boxer LLC and as such, has voting and dispositive power over the shares held by Boxer LP. The address of Boxer LP, Boxer LLC and Andrew Segal is 720 N Post Oak Road, Suite 500, Houston, Texas 77024. |
| (36) | C4 Ventures I SCSP (“C4 Ventures”) is managed by its general partner, C4 GP SA. The Board of Directors of C4 GP SA vote on investment and divestment decisions for C4 Ventures. The address of C4 Ventures is 47 rue de Gasperich, L-1617 Luxembourg. |
| (37) | Caterpillar Venture Capital Inc. (“Caterpillar Venture”) is owned by Caterpillar Inc. (“Caterpillar”) and Caterpillar is a publicly held company. The address for Caterpillar Venture is 510 Lake Cook Road, Suite 100, Deerfield, Illinois 60015. |
| (38) | Justin R. Segal is the Managing Member and 100% owner of Core Group Properties, LLC (“Core Group”) and as such, has sole voting and dispositive power over the shares held by Core Group. The address for Core Group is 720 North Post Oak Road #500, Houston, Texas 77024. |
| (39) | The board of directors controls Digital Motors Corporation (“Digital Motors”). There are four members of the board of directors of Digital Motors. Each board member has one vote, and the approval of a majority is required to approve an action. Under the so-called “rule of three,” if voting and dispositive decisions regarding an entity’s securities are made by three or more individuals, and voting or dispositive decisions require the approval of a majority of those individuals, then none of the individuals is deemed a beneficial owner of the entity’s securities. Based on the foregoing, no individual member of the board of directors controls Digital Motors or exercises voting or dispositive control over any of the securities held by Digital Motors, even those in which he or she holds a pecuniary interest. Accordingly, none of them will be deemed to have or share beneficial ownership of such shares. The address of Digital Motors is 500 Technology Drive, Suite 420, Irvine, California 92618. |
| (40) | Divinando Corporation, a corporation formed under the laws of the Island of Nevis, is wholly-owned by Erinville Investments, Ltd., a company formed under the laws of the Cayman Islands. Erinville Investments, Ltd. is wholly-owned by Oceamar Invest, Ltd., a company formed under the laws of the British Virgin Islands. Oceamar Invest, Ltd. is wholly-owned by the Lama Family Foundation, a private foundation formed under the laws of the Republic of Panama. The Lama Family Foundation’s beneficial owner is Mrs. Doralise Verdeja de Lama. The address of Divinando Corporation is c/o Rasco Klock Perez & Nieto P.L., 2555 Ponce de Leon Boulevard, Suite 600, Coral Gables, Florida 33134. |
127
| (41) | Fidam Global Fund SPC Limited SP1, Fidam Global Fund SPC Limited SP10, Fidam Global Fund SPC Limited SP2, Fidam Global Fund SPC Limited SP3 and Fidam Global Fund SPC Limited SP9 (the “Fidam Entities”) are managed by a board of directors. Bertrand Coste, Clive Harris and Bruno Gardien serve as directors and have shared voting and investment control over the shares held by the Fidam Entities. The address of the Fidam Entities is Craigmuir Chambers Road Town, Tortola VG1110 British Virgin Islands. |
| (42) | An investment committee manages Foundry Square Investors XVI, LLC (“Foundry LLC”). There are five members of the investment committee. Each member has one vote, and the approval of a majority is required to approve an action. Under the so-called “rule of three,” if voting and dispositive decisions regarding an entity’s securities are made by three or more individuals, and voting or dispositive decisions require the approval of a majority of those individuals, then none of the individuals is deemed a beneficial owner of the entity’s securities. Based on the foregoing, no individual member of the investment committee exercises voting or dispositive control over any of the securities held by the entity, even those in which he holds a pecuniary interest. Accordingly, none of them will be deemed to have or share beneficial ownership of such shares. Foundry LLC is an affiliate of Orrick, Herrington & Sutcliffe LLP, which serves as our outside legal counsel. The address of Foundry LLC is c/o Peter Lillevand, Orrick, Herrington & Sutcliffe LLP, 405 Howard Street, San Francisco California 94105. |
| (43) | Dr. Morana Jovan-Embiricos is the sole owner of Globeways Holdings Limited and may be deemed to beneficially own the shares of Class A Common Stock held by Globeways Holdings Limited. Dr. Jovan-Embiricos resigned from the Legacy Fisker board of directors effective March 21, 2019. The address of Globeways Holdings Limited is c/o LJ Fiduciary, 8 Rue Saint-Leger, CH-1205, Geneva, Switzerland. |
| (44) | Hakim Assets Management Ltd. (“Hakim Ltd.”) is fully owned and controlled by KeiShing Wong, the director of Hakim Ltd. Mr. Wong has sole voting and dispositive power over the shares held by Hakim Ltd. The address of Hakim Ltd. is Vistra Corporate Services Centre, Wickhams Cay II, Road Town, VG1110, British Virgin Islands. |
| (45) | Mr. Fisker and Dr. Gupta, each a member of our Board of Directors, serve as members of HF Holdco, LLC and as such, have shared voting and dispositive power with respect to the shares held by HF Holdco, LLC. and may be deemed to beneficially own the shares held by HF Holdco, LLC. |
| (46) | Ryosuke Takatsuki is the President and Chief Executive Officer of Inspire Investment Corporation (“Inspire”) and serves as the representative director of Inspire. As such, Mr. Takatsuki has voting and dispositive power over the shares held by Inspire. The address of Inspire is FROM-1 st Bldg. 3F, Minamiaoyama,Minato-ku, Tokyo107-0062, Japan. |
| (47) | Neil Financial Company, LLC is the general partner of Kelsey Re, L.P. F. James Neil, Jr. is the manager of Neil Financial Company, LLC and as such, has voting and dispositive power with respect to the shares held by Kelsey Re, L.P. and may be deemed to beneficially own the shares held by Kelsey Re, L.P. |
| (48) | Kenneth W. Lang is the trustee of the Kenneth W. Lang Revocable Trust and has sole voting and dispositive power over these shares. |
| (49) | Kendall Capital Markets, LLC (“KCM LLC”), the investment manager of Moore Strategic Ventures, LLC (“MSV LLC”), has voting and investment control over the shares held by MSV LLC. Louis M. Bacon controls KCM LLC and may be deemed the beneficial owner of the shares held by MSV LLC. MSV LLC and Mr. Bacon are affiliated with Moore Global Investments, LLC (see footnote (7) above). The address of KCM LLC, MSV LLC and Mr. Bacon is 11 Times Square, 38 th Floor, New York, New York 10036. |
| (50) | One of the members of our Board of Directors, Nadine I. Watt, is the trustee of the Nadine Watt Jameson Family Trust. Ms. Watt is the sole trustee of the Nadine Watt Jameson Family Trust and holds sole voting and dispositive power with respect to the shares held of record by Nadine Watt Jameson Family Trust. |
| (51) | Carter Oosterhouse is the sole owner and serves as President of Peninsula Point Productions (“Peninsula”), and as such, has sole voting and dispositive power over the shares held by Peninsula. The address of Peninsula is 22042 Carbon Mesa Road, Malibu, California 90265. |
| (52) | Phillip Holding ApS is wholly owned by Jackie Phillip, who holds sole voting and dispositive power over these shares. The address of Phillip Holding ApS is c/o Jackie Phillip Law Firm, Amaliegade No. 9, DK-1256, Copenhagen K. |
| (53) | The trustees of the Rajesh Atluru & Melissa A. Buckley, Trustees of the 2004 Buckley Atluru Family Trust, U/T/D 9/14/2004 (“2004 Buckley Atluru Trust”), Rajesh Atluru and Melissa A. Buckley, share voting and dispositive power over the shares held by the 2004 Buckley Atluru Trust. The address of the Buckley Atluru Trust is 2151 Green Street, San Francisco, California 94123. |
| (54) | Mr. Roderick Randall, a member of the Board of Directors, is the Managing Director of the Randall Group’s Series Fisker and Fisker Series C (the “Randall Group”). As Managing Director of the Randall Group, Mr. Randall has voting and dispositive power with respect to the shares held by the Randall Group and he may be deemed to beneficially own the shares of common stock held by the Randall Group. |
| (55) | David Baum is the General Partner of each of Stage 1 Growth Fund, LLC Series 3, Stage 1 Growth Fund, LLC Series 3NP and Stage 1 Growth Fund, LLC Series G (the “Stage 1 Entities”) and as such, has voting and dispositive power over the shares held by the Stage 1 Entities. The address of the Stage 1 Entities is 890 Winter Street, Suite 208, Waltham, Massachusetts 02451. |
| (56) | James Plante is the manager and sole member of Thynk Capital II, LLC and as such, has sole voting and dispositive power and beneficial ownership with respect to the shares held by Thynk Capital II, LLC. The address of Thynk Capital II, LLC and Mr. Plante is 2620 S. Maryland Parkway, #14-844, Las Vegas, Nevada 89109. |
128
| (57) | The trustees of the Timothy J. McSweeney 2006 Trust (“2006 McSweeney Trust”), Timothy J. McSweeney and Debie A. McSweeney, share voting and dispositive power over the shares held by the 2006 McSweeney Trust. The address of the 2006 McSweeney Trust is 9 Cliff Road, Weston, Massachusetts 02493. |
| (58) | The trustees of the Todd W. McSweeney 2007 Trust (“2007 McSweeney Trust”), Todd W. McSweeney and Jeannette Hsu, share voting and dispositive power over the shares held by the 2007 McSweeney Trust. The address of the 2007 McSweeney Trust is 51 Scotch Pine Road, Wellesley, Massachusetts 02481. |
| (59) | Spartan Energy Acquisition Sponsor LLC (“Sponsor”) is the record holder of the shares and Private Warrants reported herein. Geoffrey Strong is the Chief Executive Officer of Sponsor. Mr. Strong may be deemed to have or share beneficial ownership of the common stock and Private Warrants held directly by Sponsor. In addition, AP Spartan Energy Holdings, L.P., a wholly owned indirect subsidiary of alternative investment vehicles of Apollo Natural Resources Partners II, L.P. (“ANRP II”), directly owns all of the limited liability company interests of Sponsor. Accordingly, ANRP II may be deemed to have or share beneficial ownership of the common stock and Private Warrants held directly by Sponsor. |
| (60) | Mr. Fisker and Dr. Gupta are executive officers and members of the Board of Directors of our Company. |
129
PLAN OF DISTRIBUTION
We are registering the issuance by us of up to 9,360,000 shares of our Class A Common Stock issuable upon the exercise of the Private Warrants, 18,400,000 shares of our Class A Common Stock issuable upon the exercise of the Public Warrants and 19,474,454 shares of our Class A Common Stock issuable upon the exercise of the Magna Warrants. We are also registering the resale by the Selling Securityholders of up to 9,360,000 Private Warrants and 133,785,596 shares of our Class A Common Stock. Such shares include all shares of Class A Common Stock held by the Selling Securityholders or issuable to them upon conversion of 13,235,412 shares of Class B Common Stock, as well as up to 9,360,000 shares of Class A Common Stock issuable upon exercise of the Private Warrants, 19,474,454 issuable upon exercise of the Magna Warrants and 50,000,000 PIPE Shares.
The Selling Securityholders may offer and sell, from time to time, their respective shares of Class A Common Stock and Private Warrants covered by this prospectus. The Selling Securityholders will act independently of us in making decisions with respect to the timing, manner and size of each sale. Such sales may be made on one or more exchanges or inor otherwise, at prices and under terms then prevailing or at prices related to the then current market price or in negotiated transactions. The Selling Securityholders may sell their securities by one or more of, or a combination of, the following methods:
the over-the-counter market
| • | purchases by a broker-dealer as principal and resale by such broker-dealer for its own account pursuant to this prospectus; |
| • | ordinary brokerage transactions and transactions in which the broker solicits purchasers; |
| • | block trades in which the broker-dealer so engaged will attempt to sell the shares as agent but may position and resell a portion of the block as principal to facilitate the transaction; |
| • | an over-the-counter distribution |
| • | through trading plans entered into by a Selling Securityholder pursuant to Rule 10b5-1 under the Exchange Act that are in place at the time of an offering pursuant to this prospectus and any applicable prospectus supplement hereto that provide for periodic sales of their securities on the basis of parameters described in such trading plans; |
| • | short sales; |
| • | distribution to employees, members, limited partners or stockholders of the Selling Securityholders; |
| • | through the writing or settlement of options or other hedging transaction, whether through an options exchange or otherwise; |
| • | by pledge to secured debts and other obligations; |
| • | delayed delivery arrangements; |
| • | to or through underwriters or agents; |
| • | in “at the market” offerings, as defined in Rule 415 under the Securities Act, at negotiated prices, at prices prevailing at the time of sale or at prices related to such prevailing market prices, including sales made directly on a national securities exchange or sales made through a market maker other than on an exchange or other similar offerings through sales agents; |
| • | in privately negotiated transactions; |
| • | in options transactions; and |
| • | through a combination of any of the above methods of sale, as described below, or any other method permitted pursuant to applicable law. |
In addition, any securities that qualify for sale pursuant to Rule 144 may be sold under Rule 144 rather than pursuant to this prospectus.
To the extent required, this prospectus may be amended or supplemented from time to time to describe a specific plan of distribution. In connection with distributions of the securities or otherwise, the Selling Securityholders may enter into hedging transactions with broker-dealers or other financial institutions. In connection with such transactions, broker-dealers or other financial institutions may engage in short sales of the securities in the course of hedging the positions they assume with Selling Securityholders. The Selling Securityholders may also sell the securities short and redeliver the securities to close out such short positions. The Selling Securityholders may also enter into option or other transactions with broker-dealers or other financial institutions which require the delivery to such broker-dealer or other financial institution of securities offered by this prospectus, which securities such broker-dealer or other financial institution may resell pursuant to this prospectus (as supplemented or amended to reflect such transaction). The Selling Securityholders may also pledge securities to a broker-dealer or other financial institution, and, upon a default, such broker- dealer or other financial institution, may effect sales of the pledged securities pursuant to this prospectus (as supplemented or amended to reflect such transaction).
130
In effecting sales, broker-dealers or agents engaged by the Selling Securityholders may arrange for other broker-dealers to participate. Broker-dealers or agents may receive commissions, discounts or concessions from the Selling Securityholders in amounts to be negotiated immediately prior to the sale.
In offering the securities covered by this prospectus, the Selling Securityholders and any broker-dealers who execute sales for the Selling Securityholders may be deemed to be “underwriters” within the meaning of the Securities Act in connection with such sales. Any profits realized by the Selling Securityholders and the compensation of any broker-dealer may be deemed to be underwriting discounts and commissions.
Certain of our stockholders have entered
into lock-up agreements.
The Initial Stockholders, including permitted transferees of the Former Sponsor, subject to certain exceptions, may not transfer Founder Shares (and the resulting Conversion Shares) for 12 months after the completion of the Business Combination. The Legacy Fisker Stockholders may not transfer their Class A Common Stock acquired pursuant to the Merger Agreement, including the Merger Consideration, for 180 days after completion of the Business Combination.In order to comply with the securities laws of certain states, if applicable, the securities must be sold in such jurisdictions only through registered or licensed brokers or dealers. In addition, in certain states the securities may not be sold unless they have been registered or qualified for sale in the applicable state or an exemption from the registration or qualification requirement is available and is complied with.
We have advised the Selling Securityholders that the anti-manipulation rules of Regulation M under the Exchange Act may apply to sales of securities in the market and to the activities of the Selling Securityholders and their affiliates. In addition, we will make copies of this prospectus available to the Selling Securityholders for the purpose of satisfying the prospectus delivery requirements of the Securities Act. The Selling Securityholders may indemnify any broker-dealer that participates in transactions involving the sale of the securities against certain liabilities, including liabilities arising under the Securities Act.
At the time a particular offer of securities is made, if required, a prospectus supplement will be distributed that will set forth the number of securities being offered and the terms of the offering, including the name of any underwriter, dealer or agent, the purchase price paid by any underwriter, any discount, commission and other item constituting compensation, any discount, commission or concession allowed or reallowed or paid to any dealer, and the proposed selling price to the public.
A holder of Private Warrants or Public Warrants may exercise its Private Warrants or Public Warrants in accordance with the Warrant Agreement on or before the expiration date set forth therein by surrendering, at the office of the Warrant Agent, Continental Stock Transfer & Trust Company, the certificate evidencing such Private Warrants or Public Warrants, with the form of election to purchase set forth thereon, properly completed and duly executed, accompanied by full payment of the exercise price and any and all applicable taxes due in connection with the exercise of the Private Warrants or Public Warrants, subject to any applicable provisions relating to cashless exercises in accordance with the Warrant Agreement.
We have agreed to indemnify certain of the Selling Securityholders against certain liabilities, including certain liabilities under the Securities Act, the Exchange Act or other federal or state law.
We have agreed with certain Selling Securityholders pursuant to the A&R Registration Rights Agreement to use our best efforts to keep the registration statement of which this prospectus constitutes a part effective until such time as all securities covered by this prospectus have been sold, transferred, disposed of or exchanged in accordance with the registration statement.
We have agreed with certain Selling Securityholders pursuant to the Subscription Agreements to use commercially reasonable efforts to keep the registration statement of which this prospectus constitutes a part effective until the earlier of the following: (i) the Selling Securityholder ceases to hold any securities covered by this prospectus or (ii) the date all securities covered by this prospectus held by Selling Securityholder may be sold without restriction under Rule 144, including without limitation, any volume and manner of sale restrictions which may be applicable to affiliates under Rule 144 and without the requirement for the Company to be in compliance with the current public information required under Rule 144(c)(1) or Rule 144(i)(2), as applicable, and (iii) two years from the effective date of this prospectus.
131
Lock-up Agreements
The stockholders of Legacy Fisker have entered into agreements (the
“Lock-Up
Agreements”) pursuant to which they have agreed, subject to certain customary exceptions, not to (a) sell, offer to sell, contract or agree to sell, hypothecate, pledge, grant any option to purchase or otherwise dispose of or agree to dispose of, directly or indirectly, or establish or increase a put equivalent position or liquidate or decrease a call equivalent position within the meaning of Section 16 of the Exchange Act, and the rules and regulations of the SEC promulgated thereunder, anyLock-Up
Shares, (b) enter into any swap or other arrangement that transfers to another, in whole or in part, any of the economic consequences of ownership of any of suchLock-Up
Shares, whether any such transaction is to be settled by delivery of such securities, in cash or otherwise or (c) publicly announce any intention to effect any transaction specified in clause (a) or (b) for 180 days after the Closing Date. Thereafter, until the 18 month anniversary of the Closing Date, subject to certain customary exceptions, each of Henrik Fisker and Dr. Geeta Gupta will also agree not to Transfer more than the lesser of (a) such number ofLock-Up
Shares resulting in gross proceeds to him or her of $25,000,000 and (b) 10% of theLock-Up
Shares. Thereafter, until the two year anniversary of the Closing Date, subject to certain customary exceptions, each of Henrik Fisker and Dr. Geeta Gupta will also agree not to Transfer more than the number ofLock-Up
Shares that, together with any amounts Transferred pursuant to the immediately preceding sentence, would constitute 80% of theLock-Up
Shares.The Former Sponsor and our former board members agreed not to transfer, assign or sell any Founder Shares held by each of them until one year after the date of the Closing or earlier if, subsequent to the Business Combination, (i) the last reported sale price of the Class A Common Stock equals or exceeds $12.00 per share (as adjusted for stock splits, stock dividends, reorganizations, recapitalizations and the like) for any 20 trading days within any
30-trading
day period commencing at least 150 days after the consummation of a Business Combination or (ii) the Company consummates a subsequent liquidation, merger, stock exchange or other similar transaction which results in all of the Company’s stockholders having the right to exchange their shares of Common Stock for cash, securities or other property.132
CERTAIN UNITED STATES FEDERAL INCOME TAX CONSIDERATIONS
The following discussion is a summary of certain U.S. federal income tax considerations generally applicable to the ownership and disposition of our Class A Common Stock and Warrants, which we refer to collectively as our securities. This summary is based upon U.S. federal income tax law as of the date of this prospectus, which is subject to change or differing interpretations, possibly with retroactive effect. This summary does not discuss all aspects of U.S. federal income taxation that may be important to particular investors in light of their individual circumstances, including investors subject to special tax rules (e.g., financial institutions, insurance companies, broker-dealers, dealers or traders inS corporations, regulated investment companies, real estate investment trusts, passive foreign investment companies, controlled foreign corporations, U.S. Holders (as defined below) that will hold Class A Common Stock or Warrants as part of a straddle, hedge, conversion, or other integrated transaction for U.S. federal income tax purposes, expatriates or former long-term residents of the United States, or investors that have a functional currency other than the U.S. dollar), all of whom may be subject to tax rules that differ materially from those summarized below. This summary does not discuss other U.S. federal tax consequences (e.g., estate or gift tax), any state, local,”) and that acquire our Class A Common Stock and Warrants for cash pursuant to this prospectus. No ruling from the Internal Revenue Service, (the “”) has been or will be sought regarding any matter discussed herein. No assurance can be given that the IRS would not assert, or that a court would not sustain a position contrary to any of the tax aspects set forth below.
securities, tax-exempt organizations
(including private foundations), taxpayers that haveelected mark-to-market accounting,
or non-U.S. tax
considerations or the Medicare tax or alternative minimum tax. In addition, this summary is limited to investors that will hold our securities as “capital assets” (generally, property held for investment) under the Internal Revenue Code of 1986, as amended (the “Code
IRS
For purposes of this summary, a “” is a beneficial holder of securities who or that, for U.S. federal income tax purposes is:
U.S. Holder
| • | an individual who is a United States citizen or resident of the United States; |
| • | a corporation or other entity treated as a corporation for United States federal income tax purposes created in, or organized under the law of, the United States or any state or political subdivision thereof; |
| • | an estate the income of which is includible in gross income for United States federal income tax purposes regardless of its source; or |
| • | a trust (A) the administration of which is subject to the primary supervision of a United States court and which has one or more United States persons (within the meaning of the Code) who have the authority to control all substantial decisions of the trust or (B) that has in effect a valid election under applicable Treasury regulations to be treated as a United States person. |
A “” is a beneficial holder of securities who or that is neither a U.S. Holder nor a partnership for U.S. federal income tax purposes.
non-U.S.
Holder
If a partnership (including an entity or arrangement treated as a partnership for U.S. federal income tax purposes) holds our securities, the tax treatment of a partner, member or other beneficial owner in such partnership will generally depend upon the status of the partner, member or other beneficial owner, the activities of the partnership and certain determinations made at the partner, member or other beneficial owner level. If you are a partner, member or other beneficial owner of a partnership holding our securities, you are urged to consult your tax advisor regarding the tax consequences of the ownership and disposition of our securities.
THIS DISCUSSION OF U.S. FEDERAL INCOME TAX CONSIDERATIONS IS FOR GENERAL INFORMATION PURPOSES ONLY AND IS NOT TAX ADVICE. PROSPECTIVE HOLDERS SHOULD CONSULT THEIR TAX ADVISORS CONCERNING THE U.S. FEDERAL INCOME TAX CONSEQUENCES TO THEM OF OWNING AND DISPOSING OF OUR SECURITIES, AS WELL AS THE APPLICATION OF ANY, STATE, LOCAL
AND NON-U.S. INCOME,
ESTATE AND OTHER TAX CONSIDERATIONS.133
U.S. Holders
Taxation of Distributions
If we pay distributions or make constructive distributions (other than certain distributions of our stock or rights to acquire our stock) to U.S. Holders of shares of our Class A Common Stock, such distributions generally will constitute dividends for U.S. federal income tax purposes to the extent paid from our current or accumulated earnings and profits, as determined under U.S. federal income tax principles. Distributions in excess of our current and accumulated earnings and profits will constitute a return of capital that will be applied against and reduce (but not below zero) the U.S. Holder’s adjusted tax basis in our Class A Common Stock. Any remaining excess will be treated as gain realized on the sale or other disposition of the Class A Common Stock and will be treated as described under “” below.
U.S. Holders—Gain or Loss on Sale, Taxable Exchange or Other Taxable Disposition of Class
A Common Stock
Dividends we pay to a U.S. Holder that is a taxable corporation will generally qualify for the dividends received deduction if the requisite holding period is satisfied. With certain exceptions (including dividends treated as investment income for purposes of investment interest deduction limitations), and provided certain holding period requirements are met, dividends we pay to
a non-corporate U.S.
Holder will generally constitute “qualified dividends” that will be subject to tax at the maximum tax rate accorded to long-term capital gains. If the holding period requirements are not satisfied, a corporation may not be able to qualify for the dividends received deduction and would have taxable income equal to the entire dividend amount, and non-corporate holders may be subject to tax on such dividend at ordinary income tax rates instead of the preferential rates that apply to qualified dividend income.Gain or Loss on Sale, Taxable Exchange or Other Taxable Disposition of Class A Common Stock
A U.S. Holder generally will recognize gain or loss on the sale, taxable exchange or other taxable disposition of our Class A Common Stock. Any such gain or loss will be capital gain or loss, and will be long-term capital gain or loss if the U.S. Holder’s holding period for the Class A Common Stock so disposed of exceeds one year. The amount of gain or loss recognized will generally be equal to the difference between (1) the sum of the amount of cash and the fair market value of any property received in such disposition and (2) the U.S. Holder’s adjusted tax basis in its Class A Common Stock so disposed of. A U.S. Holder’s adjusted tax basis in its Class A Common Stock will generally equal the U.S. Holder’s acquisition cost for such Class A Common Stock (or, in the case of Class A Common Stock received upon exercise of a Warrant, the U.S. Holder’s initial basis for such Class A Common Stock, as discussed below), less any prior distributions treated as a return of capital. The deductibility of capital losses is subject to limitations. Long-term capital gains recognized by non-corporate U.S. Holders are generally eligible for reduced rates of tax. If the U.S. Holder’s holding period for the Class A Common Stock so disposed of is one year or less, any gain on a sale or other taxable disposition of the shares would be subject to short-term capital gain treatment and would be taxed at ordinary income tax rates. The deductibility of capital losses is subject to limitations.
Exercise of a Warrant
Except as discussed below with respect to the cashless exercise of a Warrant, a U.S. Holder generally will not recognize taxable gain or loss upon the exercise of a Warrant for cash. The U.S. Holder’s initial tax basis in the share of our Class A Common Stock received upon exercise of the Warrant will generally be an amount equal to the sum of the U.S. Holder’s acquisition cost of the Warrant and the exercise price of such Warrant. It is unclear whether a U.S. Holder’s holding period for the Class A Common Stock received upon exercise of the Warrant would commence on the date of exercise of the Warrant or the day following the date of exercise of the Warrant; however, in either case the holding period will not include the period during which the U.S. Holder held the Warrants.
The tax consequences of a cashless exercise of a Warrant are not clear under current tax law. A cashless exercise may be nontaxable, either because the exercise is not a realization event or because the exercise is treated as a recapitalization for U.S. federal income tax purposes. In either situation, a U.S. Holder’s initial tax basis in the Class A Common Stock received generally should equal the holder’s adjusted tax basis in the Warrant. If the cashless exercise were treated as not being a realization event, it is unclear whether a U.S. Holder’s holding period for the Class A Common Stock would commence on the date of exercise of the Warrant or the day following the date of exercise of the Warrant; in either case, the holding period would not include the period during which the U.S. Holder held the Warrant. If, instead, the cashless exercise were treated as a recapitalization, the holding period of the Class A Common Stock generally would include the holding period of the Warrant.
It is also possible that a cashless exercise of a Warrant could be treated in part as a taxable exchange in which gain or loss is recognized. In such event, a U.S. Holder could be deemed to have surrendered a portion of the Warrants being exercised having a value equal to the exercise price of such Warrants in satisfaction of such exercise price. Although not free from doubt, such U.S. Holder generally should recognize capital gain or loss in an amount equal to the difference between the fair market value of the Warrants deemed surrendered to satisfy the exercise price and the U.S. Holder’s adjusted tax basis in such Warrants. In this case, a U.S. Holder’s initial tax basis in the Class A Common Stock received would equal the sum of the exercise price and the U.S. holder’s adjusted tax basis in the Warrants exercised. It is unclear whether a U.S. Holder’s holding period for the Class A Common Stock would commence on the date of exercise of the Warrant or the day following the date of exercise of the Warrant; in either case, the holding period would not include the period during which the U.S. Holder held the Warrant. Due to the uncertainty and absence of authority on the U.S. federal income tax treatment of a cashless exercise, including when a U.S. Holder’s holding period would commence with respect to the Class A Common Stock received, U.S. Holders are urged to consult their tax advisors regarding the tax consequences of a cashless exercise.
134
Sale, Exchange, Redemption or Expiration of a Warrant
Upon a sale, exchange (other than by exercise), redemption (other than a redemption for Class A Common Stock), or expiration of a Warrant, a U.S. Holder will recognize taxable gain or loss in an amount equal to the difference between (1) the amount realized upon such disposition or expiration and (2) the U.S. Holder’s adjusted tax basis in the Warrant. A U.S. Holder’s adjusted tax basis in its Warrants will generally equal the U.S. Holder’s acquisition cost, increased by the amount of any constructive distributions included in income by such U.S. Holder (as described below under “U.S. Holders—Possible Constructive Distributions”). Such gain or loss generally will be treated as long-term capital gain or loss if the Warrant is held by the U.S. Holder for more than one year at the time of such disposition or expiration. If a Warrant is allowed to lapse unexercised, a U.S. Holder will generally recognize a capital loss equal to such holder’s adjusted tax basis in the Warrant. The deductibility of capital losses is subject to certain limitations.
A redemption of Warrants for Class A Common Stock described in this prospectus under “” should be treated as a “recapitalization” for U.S. federal income tax purposes. Accordingly, you should not recognize any gain or loss on the redemption of Warrants for shares of our Class A Common Stock. Your aggregate initial tax basis in the shares of Class A Common Stock received in the redemption should equal your aggregate adjusted tax basis in your Warrants redeemed and your holding period for the shares of Class A Common Stock received in redemption of your Warrants should include your holding period for your surrendered Warrants.
Description of Capital Stock—Warrants—Public Warrants
Possible Constructive Distributions
The terms of each Warrant provide for an adjustment to the number of shares of Class A Common Stock for which the Warrant may be exercised or to the exercise price of the Warrant in certain events, as discussed in the section of this prospectus captioned “.” An adjustment which has the effect of preventing dilution generally should not be a taxable event. Nevertheless, a U.S. Holder of Warrants would be treated as receiving a constructive distribution from us if, for example, the adjustment increases the holder’s proportionate interest in our assets or earnings and profits (e.g., through an increase in the number of shares of Class A Common Stock that would be obtained upon exercise) as a result of a distribution of cash to the holders of shares of our Class A Common Stock which is taxable to such holders as a distribution. Such constructive distribution would be subject to tax as described above under “” in the same manner as if such U.S. Holder received a cash distribution from us on Class A Common Stock equal to the fair market value of such increased interest.
Description of Capital Stock—Warrants—Public Warrants
U.S. Holders—Taxation of Distributions
Information Reporting and Backup Withholding.
In general, information reporting requirements may apply to dividends paid to a U.S. Holder and to the proceeds of the sale or other disposition of our shares of Class A Common Stock and Warrants, unless the U.S. Holder is an exempt recipient. Backup withholding may apply to such payments if the U.S. Holder fails to provide a taxpayer identification number, a certification of exempt status or has been notified by the IRS that it is subject to backup withholding (and such notification has not been withdrawn).
Backup withholding is not an additional tax. Any amounts withheld under the backup withholding rules will be allowed as a credit against a U.S. Holder’s U.S. federal income tax liability and may entitle such holder to a refund, provided the required information is timely furnished to the IRS.
Non-U.S. Holders
Taxation of Distributions
In general, any distributions (including constructive distributions) we make toapplicable). In the case of any constructive dividend (as described below under “”), it is possible that this tax would be withheld from any amount owed to” below. In addition, if we determine that we are likely to be classified as a “United States real property holding corporation” (see “” below), we will withhold 15% of any distribution that exceeds our current and accumulated earnings and profits.
a non-U.S. Holder
of shares of our Class A Common Stock, to the extent paid out of our current or accumulated earnings and profits (as determined under U.S. federal income tax principles), will constitute dividends for U.S. federal income tax purposes and, provided such dividends are not effectively connected with thenon-U.S. Holder’s
conduct of a trade or business within the United States, we will be required to withhold tax from the gross amount of the dividend at a rate of 30%, unlesssuch non-U.S. Holder
is eligible for a reduced rate of withholding tax under an applicable income tax treaty and provides proper certification of its eligibility for such reduced rate (usually on an IRSForm W-8BEN or W-8BEN-E, as
Non-U.S.
Holders—Possible Constructive Distributions
a non-U.S. Holder
by the applicable withholding agent, including cash distributions on other property or sale proceeds from Warrants or other property subsequently paid or credited to such holder. Any distribution not constituting a dividend will be treated first as reducing (but not below zero) thenon-U.S. Holder’s
adjusted tax basis in its shares of our Class A Common Stock and, to the extent such distribution exceeds thenon-U.S. Holder’s
adjusted tax basis, as gain realized from the sale or other disposition of the Class A Common Stock, which will be treated as described under “Non-U.S.
Holders—Gain on Sale, Taxable Exchange or Other Taxable Disposition of Class
A Common Stock and Warrants
Non-U.S.
Holders—Gain on Sale, Exchange or Other Taxable Disposition of Class
A Common Stock and Warrants
135
Dividends we pay to
a non-U.S. Holder
that are effectively connected withsuch non-U.S. Holder’s
conduct of a trade or business within the United States (or if a tax treaty applies are attributable to a U.S. permanent establishment or fixed base maintained by thenon-U.S. Holder)
will generally not be subject to U.S. withholding tax, providedsuch non-U.S. Holder
complies with certain certification and disclosure requirements (generally by providing an IRSForm W-8ECI). Instead,
such dividends generally will be subject to U.S. federal income tax, net of certain deductions, at the same graduated individual or corporate rates applicable to U.S. Holders. If thenon-U.S. Holder
is a corporation, dividends that are effectively connected income may also be subject to a “branch profits tax” at a rate of 30% (or such lower rate as may be specified by an applicable income tax treaty).Exercise of a Warrant
The U.S. federal income tax treatment of” above, although to the extent a cashless exercise results in a taxable exchange, the tax consequences to the.”
a non-U.S. Holder’s
exercise of a Warrant will generally correspond to the U.S. federal income tax treatment of the exercise of a Warrant by a U.S. Holder, as described under “U.S. Holders—Exercise of a Warrant
non-U.S. Holder
would be the same as those described below in “Non-U.S.
Holders—Gain on Sale, Exchange or Other Taxable Disposition of Class
A Common Stock and Warrants
Redemption of Warrants for Class A Common Stock
A redemption of Warrants for Class A Common Stock described in this prospectus under “” should be treated as a “recapitalization” for U.S. federal income tax purposes. Accordingly, you should not recognize any gain or loss on the redemption of Warrants for shares of our Class A Common Stock. Your aggregate initial tax basis in the shares of Class A Common Stock received in the redemption should equal your aggregate adjusted tax basis in your Warrants redeemed and your holding period for the shares of Class A Common Stock received in redemption of your Warrants should include your holding period for your surrendered Warrants.
Description of Capital Stock—Warrants—Public Warrants
Gain on Sale, Exchange or Other Taxable Disposition of Class A Common Stock and Warrants
A
non-U.S. Holder
generally will not be subject to U.S. federal income or withholding tax in respect of gain recognized on a sale, taxable exchange or other taxable disposition of our Class A Common Stock or Warrants or an expiration or redemption of our Warrants, unless:| • | the gain is effectively connected with the conduct of a trade or business by the non-U.S. Holder within the United States (and, if an applicable tax treaty so requires, is attributable to a U.S. permanent establishment or fixed base maintained by thenon-U.S. Holder); |
| • | the non-U.S. Holder is an individual who is present in the United States for 183 days or more in the taxable year of disposition and certain other conditions are met; or |
| • | we are or have been a “United States real property holding corporation” for U.S. federal income tax purposes at any time during the shorter of the five-year period ending on the date of disposition or the period that the non-U.S. Holder held our Class A Common Stock or Warrants and, in the case where shares of our Class A Common Stock are regularly traded on an established securities market, the non-U.S. Holder has owned, directly or constructively, more than 5% of our Class A common stock at any time within the shorter of the five-year period preceding the disposition or such Non-U.S. holder’s holding period for the shares of our Class A common stock. There can be no assurance that our Class A Common Stock will be treated as regularly traded on an established securities market for this purpose. |
Gain described in the first bullet point above will be subject to tax at generally applicable U.S. federal income tax rates as if the non-U.S. Holder were a U.S. resident. Any gains described in the first bullet point above of
a non-U.S. Holder
that is a foreign corporation may also be subject to an additional “branch profits tax” at a 30% rate (or lower applicable treaty rate). Gain described in the second bullet point above will generally be subject to a flat 30% U.S. federal incometax. Non-U.S. Holders
are urged to consult their tax advisors regarding possible eligibility for benefits under income tax treaties.If the third bullet point above applies to
a non-U.S. Holder
and applicable exceptions are not available, gain recognized by such holder on the sale, exchange or other disposition of our Class A Common Stock or Warrants will be subject to tax at generally applicable U.S. federal income tax rates. In addition, a buyer of our Class A Common Stock or Warrants from such holder may be required to withhold U.S. income tax at a rate of 15% of the amount realized upon such disposition. We will be classified as a United States real property holding corporation if the fair market value of our “United States real property interests” equals or exceeds 50% of the sum of the fair market value of our worldwide real property interests plus our other assets used or held for use in a trade or business, as determined for U.S. federal income tax purposes. We do not believe we currently are or will become a United States real property holding corporation, however there can be no assurance in thisregard. Non-U.S. Holders
are urged to consult their tax advisors regarding the application of these rules.136
Possible Constructive Distributions
The terms of each Warrant provide for an adjustment to the number of shares of Class A Common Stock for which the Warrant may be exercised or to the exercise price of the Warrant in certain events, as discussed in the section of this prospectus captioned “.” An adjustment which has the effect of preventing dilution generally should not be a taxable event. Nevertheless,” under that section in the same manner as if
Description of Capital Stock—Warrants—Public Warrants
a non-U.S. Holder
of Warrants would be treated as receiving a constructive distribution from us if, for example, the adjustment increases the holder’s proportionate interest in our assets or earnings and profits (e.g., through an increase in the number of shares of Class A Common Stock that would be obtained upon exercise) as a result of a distribution of cash to the holders of shares of our Class A Common Stock which is taxable to such holders as a distribution.A non-U.S. Holder
would be subject to U.S. federal income tax withholding as described above under “Non-U.S.
Holders—Taxation of Distributions
such non-U.S. Holder
received a cash distribution from us on Class A Common Stock equal to the fair market value of such increased interest.Foreign Account Tax Compliance Act
Provisions of the Code and Treasury Regulations and administrative guidance promulgated thereunder commonly referred as the “Foreign Account Tax Compliance Act” (“”) generally impose withholding at a rate of 30% in certain circumstances on dividends (including constructive dividends) in respect of our securities which are held by or through certain foreign financial institutions (including investment funds), unless any such institution (1) enters into, and complies with, an agreement with the IRS to report, on an annual basis, information with respect to interests in, and accounts maintained by, the institution that are owned by certain U.S. persons and bythat does not qualify under certain exceptions will generally be subject to withholding at a rate of 30%, unless such entity either (1) certifies to us or the applicable withholding agent that such entity does not have any “substantial United States owners” or (2) provides certain information regarding the entity’s “substantial United States owners,” which will in turn be provided to the U.S. Department of Treasury. Withholding under FATCA was scheduled to apply to payments of gross proceeds from the sale or other disposition of property that produces U.S.-source interest or dividends, however, the IRS released proposed regulations that, if finalized in their proposed form, would eliminate the obligation to withhold on such gross proceeds. Although these proposed Treasury Regulations are not final, taxpayers generally may rely on them until final Treasury Regulations are issued. Prospective investors should consult their tax advisors regarding the possible implications of FATCA on their investment in our securities.
FATCA
certain non-U.S. entities
that are wholly or partially owned by U.S. persons and to withhold on certain payments, or (2) if required under an intergovernmental agreement between the United States and an applicable foreign country, reports such information to its local tax authority, which will exchange such information with the U.S. authorities. An intergovernmental agreement between the United States and an applicable foreign country may modify these requirements. Accordingly, the entity through which our securities are held will affect the determination of whether such withholding is required. Similarly, dividends in respect of our securities held by an investor that isa non-financial non-U.S. entity
Information Reporting and Backup Withholding.
Information returns will be filed with the IRS in connection with payments of dividends and the proceeds from a sale or other disposition of our units, shares of Class A Common Stock and Warrants. A non-U.S. Holder may have to comply with certification procedures to establish that it is not a United States person in order to avoid information reporting and backup withholding requirements. The certification procedures required to claim a reduced rate of withholding under a treaty generally will satisfy the certification requirements necessary to avoid the backup withholding as well. Backup withholding is not an additional tax. The amount of any backup withholding from a payment to a non-U.S. Holder will be allowed as a credit against such holder’s U.S. federal income tax liability and may entitle such holder to a refund, provided that the required information is timely furnished to the IRS.
137
DESCRIPTION OF CAPITAL STOCK
The following summary of the material terms of our securities is not intended to be a complete summary of the rights and preferences of such securities, and is qualified by reference to the Certificate of Incorporation, the Bylaws and the warrant-related documents described herein, which are exhibits to the registration statement of which this prospectus is a part. We urge you to read each of the Certificate of Incorporation, the Bylaws and the warrant-related documents described herein in their entirety for a complete description of the rights and preferences of our securities.
Authorized Capital Stock
We are authorized to issue 915,000,000 shares of capital stock, consisting of three classes: 750,000,000 shares of Class A Common Stock, $0.00001 par value per share, 150,000,000 shares of Class B Common Stock, $0.00001 par value per share, and 15,000,000 shares of Preferred Stock, $0.00001 par value per share.
Common Stock
As of October 30, 2020, there were 144,903,975 shares of Class A Common Stock outstanding, held of record by 161 stockholders. As of October 30, 2020, there were 132,354,128 shares of Class B Common Stock outstanding, held of record by two stockholders. Options to purchase 18,481,679 shares of Class A Common Stock were also outstanding.
The holders of Class A Common Stock are entitled to one vote for each share held of record by such holder and each holder of Class B Common Stock has the right to ten votes per share of Class B Common Stock held of record by such holder on all matters submitted to a vote of the stockholders. The holders of shares of Class A Common Stock and Class B Common Stock shall at all times vote together as a single class on all matters (including the election of directors) submitted to a vote of our stockholders;, that, except as otherwise required by law, holders of shares of Class A Common Stock and Class B Common Stock shall not be entitled to vote on any amendment to the Certificate of Incorporation (including any certificate of designation relating to any series of preferred stock) that relates solely to the terms of one or more outstanding series of preferred stock if the holders of such affected series are entitled, either separately or together as a class with the holders of one or more other such series, to vote thereon pursuant to the Certificate of Incorporation (including any certificate of designation relating to any series of preferred stock). Subject to preferences that may be applicable to any outstanding preferred stock, holders of Common Stock are entitled to receive ratably such dividends as may be declared by the Board of Directors out of funds legally available for that purpose. See “.” In the event of liquidation, dissolution or winding up of Fisker, the holders of Common Stock are entitled to share ratably in all assets remaining after payment of liabilities, subject to the prior distribution rights of any outstanding preferred stock. The Common Stock has no preemptive or conversion rights or other subscription rights. The outstanding shares of Common Stock are, and the shares of Common Stock to be issued upon completion of this offering will be, fully paid andbasis at the option of the holders of the Class B Common Stock at any time upon written notice to Fisker. In addition, the Class B Common Stock will automatically convert into shares of Class A Common Stock immediately prior to the close of business on the earliest to occur of certain events specified in our Certificate of Incorporation.
provided, however
Market Information For Class
A Common Stock And Dividend Policy
non-assessable.
The Class B Common Stock will be convertible into shares of Class A Common Stock on aone-to-one
Preferred Stock
The Board of Directors has the authority, without further action by the stockholders, to issue up to 15,000,000 shares of preferred stock, $0.00001 par value, in one or more series. The Board also has the authority to designate the rights, preferences, privileges and restrictions of each such series, including dividend rights, dividend rates, conversion rights, voting rights, terms of redemption, redemption prices, liquidation preferences and the number of shares constituting any series.
The Certificate of Incorporation provides that shares of preferred stock may be issued from time to time in one or more series. The Board is authorized to fix the designation, vesting, powers (including voting powers), preferences and relative, participating, optional or other rights (and the qualifications, limitations or restrictions thereof) of the shares of each such series and to increase (but not above the total number of authorized shares of the class) or decrease (but not below the number of shares of such series then outstanding) the number of shares of any such series. The number of authorized shares of Preferred Stock may also be increased or decreased (but not below the number of shares thereof then outstanding) by the affirmative vote of the holders of a majority of the voting power of all the then-outstanding shares of our capital stock entitled to vote thereon, without a separate vote of the holders of the Preferred Stock or any series thereof, unless a vote of any such holders is required pursuant to the terms of any certificate of designation designating a series of Preferred Stock.
138
The Board will be able to, subject to limitations prescribed by Delaware law, without stockholder approval, issue preferred stock with voting and other rights that could adversely affect the voting power and other rights of the holders of the Common Stock and could have anti-takeover effects. The ability of the Board to issue preferred stock without stockholder approval, while providing flexibility in connection with possible acquisitions and other corporate purposes, could, among other things, have the effect of delaying, deferring or preventing a change of control of Fisker or the removal of our management and may adversely affect the market price of Class A Common Stock and the voting and other rights of the holders of Fisker. We do not have any outstanding preferred stock as of the date of this prospectus.
Warrants
As of October 30, 2020, there were Public Warrants outstanding to purchase an aggregate of 18,400,000 shares of Class A Common Stock, Private Warrants outstanding to purchase an aggregate of 9,360,000 shares of Class A Common Stock and Magna Warrants outstanding to purchase an aggregate of 19,474,454 shares of Class A Common Stock.
Public Warrants
Each whole warrant entitles the registered holder to purchase one whole share of our Class A Common Stock at a price of $11.50 per share, subject to adjustment as discussed below, 30 days after the Closing, provided that we have an effective registration statement under the Securities Act covering the shares of Class A Common Stock issuable upon exercise of the warrants and a current prospectus relating to them is available (or we permit holders to exercise their warrants on a cashless basis under the circumstances specified in the warrant agreement) and such shares are registered, qualified or exempt from registration under the securities, or blue sky, laws of the state of residence of the holder. Pursuant to the warrant agreement, a warrantholder may exercise its warrants only for a whole number of shares of Class A Common Stock. This means that only a whole warrant may be exercised at any given time by a warrantholder. The warrants will expire five years after the completion of the Business Combination, at 5:00 p.m., New York City time, or earlier upon redemption or liquidation.
We are not obligated to deliver any shares of Class A Common Stock pursuant to the exercise of a warrant and will have no obligation to settle such warrant exercise unless a registration statement under the Securities Act with respect to the shares of Class A Common Stock underlying the warrants is then effective and a prospectus relating thereto is current, subject to our satisfying our obligations described below with respect to registration. No warrant will be exercisable and we will not be obligated to issue shares of Class A Common Stock upon exercise of a warrant unless the Class A Common Stock issuable upon such warrant exercise has been registered, qualified or deemed to be exempt under the securities laws of the state of residence of the registered holder of the warrants. In the event that the conditions in the two immediately preceding sentences are not satisfied with respect to a warrant, the holder of such warrant will not be entitled to exercise such warrant and such warrant may have no value and expire worthless. In no event will we be required to net cash settle any warrant. In the event that a registration statement is not effective for the exercised warrants, the purchaser of a unit containing such warrant will have paid the full purchase price for the unit solely for the share of Class A Common Stock underlying such unit.
Once the warrants become exercisable, we may call the warrants for redemption:
| • | in whole and not in part; |
| • | at a price of $0.01 per warrant; |
| • | upon not less than 30 days’ prior written notice of redemption (the “30-day redemption period”) to each warrantholder; and |
| • | if, and only if, the reported last sale price of the Class A Common Stock equals or exceeds $18.00 per share (as adjusted for stock splits, stock dividends, reorganizations, recapitalizations and the like) for any 20 trading days within a 30-trading day period ending three business days before we send the notice of redemption to the warrantholders. |
If and when the warrants become redeemable by us, we may exercise our redemption right even if we are unable to register or qualify the underlying securities for sale under all applicable state securities laws.
139
We have established the last of the redemption criterion discussed above to prevent a redemption call unless there is at the time of the call a significant premium to the warrant exercise price. If the foregoing conditions are satisfied and we issue a notice of redemption of the warrants, each warrantholder will be entitled to exercise his, her or its warrant prior to the scheduled redemption date. However, the price of the Class A Common Stock may fall below the $18.00 redemption trigger price (as adjusted for stock splits, stock dividends, reorganizations, recapitalizations and the like) as well as the $11.50 (for whole shares) warrant exercise price after the redemption notice is issued.
If we call the warrants for redemption as described above, our management will have the option to require any holder that wishes to exercise his, her or its warrant to do so on a “cashless basis.” In determining whether to require all holders to exercise their warrants on a “cashless basis,” our management will consider, among other factors, our cash position, the number of warrants that are outstanding and the dilutive effect on our stockholders of issuing the maximum number of shares of Class A Common Stock issuable upon the exercise of our warrants. If our management takes advantage of this option, all holders of warrants would pay the exercise price by surrendering their warrants for that number of shares of Class A Common Stock equal to the quotient obtained by dividing (x) the product of the number of shares of Class A Common Stock underlying the warrants, multiplied by the difference between the exercise price of the warrants and the “fair market value” (defined below) by (y) the fair market value. The “fair market value” shall mean the average reported last sale price of the Class A Common Stock for the 10 trading days ending on the third trading day prior to the date on which the notice of redemption is sent to the holders of warrants. If our management takes advantage of this option, the notice of redemption will contain the information necessary to calculate the number of shares of Class A Common Stock to be received upon exercise of the warrants, including the “fair market value” in such case. Requiring a cashless exercise in this manner will reduce the number of shares to be issued and thereby lessen the dilutive effect of a warrant redemption. We believe this feature is an attractive option to us if we do not need the cash from the exercise of the warrants after our Business Combination. If we call our warrants for redemption and our management does not take advantage of this option, our Former Sponsor and its permitted transferees would still be entitled to exercise their private placement warrants for cash or on a cashless basis using the same formula described above that other warrantholders would have been required to use had all warrantholders been required to exercise their warrants on a cashless basis, as described in more detail below.
A holder of a warrant may notify us in writing in the event it elects to be subject to a requirement that such holder will not have the right to exercise such warrant, to the extent that after giving effect to such exercise, such person (together with such person’s affiliates), to the warrant agent’s actual knowledge, would beneficially own in excess of 9.8% (or such other amount as a holder may specify) of the shares of Class A Common Stock outstanding immediately after giving effect to such exercise.
If the number of outstanding shares of Class A Common Stock is increased by a stock dividend payable in shares of Class A Common Stock, or by a
split-up
of shares of Class A Common Stock or other similar event, then, on the effective date of such stock dividend,split-up
or similar event, the number of shares of Class A Common Stock issuable on exercise of each warrant will be increased in proportion to such increase in the outstanding shares of Class A Common Stock. A rights offering to holders of Class A Common Stock entitling holders to purchase shares of Class A Common Stock at a price less than the fair market value will be deemed a stock dividend of a number of shares of Class A Common Stock equal to the product of (i) the number of shares of Class A Common Stock actually sold in such rights offering (or issuable under any other equity securities sold in such rights offering that are convertible into or exercisable for Class A Common Stock) multiplied by (ii) one (1) minus the quotient of (x) the price per share of Class A Common Stock paid in such rights offering divided by (y) the fair market value. For these purposes (i) if the rights offering is for securities convertible into or exercisable for Class A Common Stock, in determining the price payable for Class A Common Stock, there will be taken into account any consideration received for such rights, as well as any additional amount payable upon exercise or conversion and (ii) fair market value means the volume weighted average price of Class A Common Stock as reported during the ten trading day period ending on the trading day prior to the first date on which the shares of Class A Common Stock trade on the applicable exchange or in the applicable market, regular way, without the right to receive such rights.In addition, if we, at any time while the warrants are outstanding and unexpired, pay a dividend or make a distribution in cash, securities or other assets to the holders of Class A Common Stock on account of such shares of Class A Common Stock (or other shares of our capital stock into which the warrants are convertible), other than (a) as described above, (b) certain ordinary cash dividends (initially defined as up to $0.10 per share in a 365 day period), (c) to satisfy the redemption rights of the holders of Class A Common Stock in connection with a proposed Business Combination, (d) to satisfy the redemption rights of the holders of Class A Common Stock in connection with a stockholder vote to approve an amendment to our Certificate of Incorporation that would affect the substance or timing of our obligation to redeem 100% of our Class A Common Stock if we have not consummated an Business Combination within the time period set forth in our Certificate of Incorporation, or (e) in connection with the redemption of our public shares upon our failure to complete our Business Combination, then the warrant exercise price will be decreased, effective immediately after the effective date of such event, by the amount of cash and/or the fair market value of any securities or other assets paid on each share of Class A Common Stock in respect of such event.
140
If the number of outstanding shares of our Class A Common Stock is decreased by a consolidation, combination, reverse stock split or reclassification of shares of Class A Common Stock or other similar event, then, on the effective date of such consolidation, combination, reverse stock split, reclassification or similar event, the number of shares of Class A Common Stock issuable on exercise of each warrant will be decreased in proportion to such decrease in outstanding shares of Class A Common Stock.
Whenever the number of shares of Class A Common Stock purchasable upon the exercise of the warrants is adjusted, as described above, the warrant exercise price will be adjusted by multiplying the warrant exercise price immediately prior to such adjustment by a fraction (x) the numerator of which will be the number of shares of Class A Common Stock purchasable upon the exercise of the warrants immediately prior to such adjustment, and (y) the denominator of which will be the number of shares of Class A Common Stock so purchasable immediately thereafter.
In case of any reclassification or reorganization of the outstanding shares of Class A Common Stock (other than those described above or that solely affects the par value of such shares of Class A Common Stock), or in the case of any merger or consolidation of us with or into another corporation (other than a consolidation or merger in which we are the continuing corporation and that does not result in any reclassification or reorganization of our outstanding shares of Class A Common Stock), or in the case of any sale or conveyance to another corporation or entity of the assets or other property of us as an entirety or substantially as an entirety in connection with which we are dissolved, the holders of the warrants will thereafter have the right to purchase and receive, upon the basis and upon the terms and conditions specified in the warrants and in lieu of the shares of our Class A Common Stock immediately theretofore purchasable and receivable upon the exercise of the rights represented thereby, the kind and amount of shares of stock or other securities or property (including cash) receivable upon such reclassification, reorganization, merger or consolidation, or upon a dissolution following any such sale or transfer, that the holder of the warrants would have received if such holder had exercised his, her or its warrants immediately prior to such event. If less than 70% of the consideration receivable by the holders of Class A Common Stock in such a transaction is payable in the form of common stock in the successor entity that is listed for trading on a national securities exchange or is quoted in an establishedmarket, or is to be so listed for trading or quoted immediately following such event, and if the registered holder of the warrant properly exercises the warrant within thirty days following public disclosure of such transaction, the warrant exercise price will be reduced as specified in the warrant agreement based on the Black-Scholes value (as defined in the warrant agreement) of the warrant. The purpose of such exercise price reduction is to provide additional value to holders of the warrants when an extraordinary transaction occurs during the exercise period of the warrants pursuant to which the holders of the warrants otherwise do not receive the full potential value of the warrants. The warrant exercise price will not be adjusted for other events.
over-the-counter
The warrants have been issued in registered form under a warrant agreement between Continental Stock Transfer & Trust Company, as warrant agent, and us. The warrant agreement provides that the terms of the warrants may be amended without the consent of any holder to cure any ambiguity or correct any defective provision, but requires the approval by the holders of at least 50% of the then outstanding public warrants to make any change that adversely affects the interests of the registered holders of public warrants.
The warrants may be exercised upon surrender of the warrant certificate on or prior to the expiration date at the offices of the warrant agent, with the exercise form on the reverse side of the warrant certificate completed and executed as indicated, accompanied by full payment of the exercise price (or on a cashless basis, if applicable), by certified or official bank check payable to us, for the number of warrants being exercised. The warrantholders do not have the rights or privileges of holders of Class A Common Stock or any voting rights until they exercise their warrants and receive shares of Class A Common Stock. After the issuance of shares of Class A Common Stock upon exercise of the warrants, each holder will be entitled to one vote for each share held of record on all matters to be voted on by stockholders.
No fractional shares will be issued upon exercise of the warrants. If, upon exercise of the warrants, a holder would be entitled to receive a fractional interest in a share, we will, upon exercise, round down to the nearest whole number of shares of Class A Common Stock to be issued to the warrantholder.
141
Private Warrants
The private placement warrants (including the shares of Class A Common Stock issuable upon exercise of the private placement warrants) are not transferable, assignable or salable until 30 days after the Closing (except, among other limited exceptions, to our officers and directors and other persons or entities affiliated with our Former Sponsor), and they will not be redeemable by us so long as they are held by our Former Sponsor or its permitted transferees. Our Former Sponsor, or its permitted transferees, has the option to exercise the private placement warrants on a cashless basis. Except as described below, the private placement warrants have terms and provisions that are identical to those of the warrants sold as part of the units in the IPO, including as to exercise price, exercisability and exercise period. If the private placement warrants are held by holders other than our Former Sponsor or its permitted transferees, the private placement warrants will be redeemable by us and exercisable by the holders on the same basis as the warrants included in the units sold in the IPO.
If holders of the private placement warrants elect to exercise them on a cashless basis, they would pay the exercise price by surrendering his, her or its warrants for that number of shares of Class A Common Stock equal to the quotient obtained by dividing (x) the product of the number of shares of Class A Common Stock underlying the warrants, multiplied by the difference between the exercise price of the warrants and the “fair market value” (defined below) by (y) the fair market value. The “fair market value” shall mean the average reported last sale price of the Class A Common Stock for the ten trading days ending on the third trading day prior to the date on which the notice of warrant exercise is sent to the warrant agent.
Magna Warrants
On October 29, 2020, the Company issued the Magna Warrants exercisable for up to 19,474,454 shares of the Company’s Class A Common Stock, subject to adjustment, in a private placement pursuant to the exemption from the registration requirements of the Securities Act provided by Section 4(a)(2) of the Securities Act. The Magna Warrants were issued in connection with a Cooperation Agreement entered into by the Company and Magna International Inc., the holder of the Magna Warrants (the “Holder”), dated October 15, 2020.
The Magna Warrants are subject to vesting as follows:
Milestones | Percentage of Warrants that Vest Upon Achievement | |||
(i) | 33.3 | % | ||
(i) | 33.3 | % | ||
Start of pre-serial production | 33.4 | % | ||
The exercise price for the Magna Warrants is $0.01 per share of Class A Common Stock. The Magna Warrants will vest in full upon a change of control of the Company. Once vested, the Magna Warrants may be exercised at the election of the Holder, in whole but not in part, by the tender to the Company of a notice of exercise. The Warrants will expire on October 29, 2030.
Lock-Up
RestrictionsCertain of our stockholders are subject to certain restrictions on transfer until the termination of applicable” for
lock-up
periods. See the section entitled “Certain Relationships and Related Transactions
lock-up
restrictions on our securities under theLock-Up
Agreements.Registration Rights
The holders of the Founder Shares, Private Warrants and Public Warrants that may be issued upon conversion of working capital loans (and any shares of Class A Common Stock issuable upon the exercise of the Private Warrants and Public Warrants that may be issued upon conversion of working capital loans and upon conversion of the Founder Shares) (collectively, the “Reg Rights Holders”) will be entitled to registration rights pursuant to the A&R Registration Rights Agreement, dated as of October 29, 2020,
142
requiring us to register such securities for resale (in the case of the Founder Shares, only after conversion to our Class A Common Stock). The holders of the majority of these securities are entitled to make up to three demands, excluding short form demands, that we register such securities. In addition, the holders have certain “piggy-back” registration rights with respect to registration statements filed subsequent to our completion of our Business Combination and rights to require us to register for resale such securities pursuant to Rule 415 under the Securities Act.
Pursuant to the A&R Registration Rights Agreement, we agreed that, within 30 calendar days after the Closing, we will file the Registration Statement with the SEC (at our sole cost and expense), and we will use our reasonable best efforts to have the Registration Statement become effective as soon as reasonably practicable after the filing thereof. Additionally, we agreed that, as soon as reasonably practicable after we are eligible to register the Reg Rights Holders’ securities on a registration statement on
Form S-3,
we will file the Registration Statement with the SEC (at our sole cost and expense) and we will use our reasonable best efforts to have the Registration Statement become effective as soon as reasonably practicable after the filing thereof. In certain circumstances, the Reg Rights Holders can demand up to three underwritten offerings and will be entitled to customary piggyback registration rights. The A&R Registration Rights Agreement does not provide for the payment of any cash penalties by us if we fail to satisfy any of our obligations under the A&R Registration Rights Agreement.Pursuant to the Subscription Agreements entered into as part of the PIPE Financing, the Company agreed that, within 30 calendar days after the consummation of the Business Combination, the Company will file with the SEC (at its sole cost and expense) a registration statement registering the resale of the PIPE Shares (the “PIPE Resale Registration Statement”), and that the Company will use our commercially reasonable efforts to have the PIPE Resale Registration Statement declared effective as soon as practicable after the filing thereof.
Delaware Anti-Takeover Law and Certificate of Incorporation and Bylaw Provisions
Under Section 203 of the DGCL, we will be prohibited from engaging in any Business Combination with any stockholder for a period of three years following the time that such stockholder (the “interested stockholder”) came to own at least 15% of our outstanding voting stock (the “acquisition”), except if:
| • | the Board approved the acquisition prior to its consummation; |
| • | the interested stockholder owned at least 85% of the outstanding voting stock upon consummation of the acquisition; or |
| • | the Business Combination is approved by the Board, and by a 2/3 majority vote of the other stockholders in a meeting. |
Generally, a “Business Combination” includes any merger, consolidation, asset or stock sale or certain other transactions resulting in a financial benefit to the interested stockholder. Subject to certain exceptions, an “interested stockholder” is a person who, together with that person’s affiliates and associates, owns, or within the previous three years owned, 15% or more of our voting stock.
Under certain circumstances, declining to opt out of Section 203 of the DGCL will make it more difficult for a person who would be an “interested stockholder” to effect various Business Combinations with the Company for a three-year period. This may encourage companies interested in acquiring the Company to negotiate in advance with the Board because the stockholder approval requirement would be avoided if the Board approves the acquisition which results in the stockholder becoming an interested stockholder. This may also have the effect of preventing changes in the Board and may make it more difficult to accomplish transactions which stockholders may otherwise deem to be in their best interests.
Written Consent by Stockholders
Under the Certificate of Incorporation, subject to the rights of any series of Preferred Stock then outstanding, any action required or permitted to be taken by our stockholders must be effected at a duly called annual or special meeting of our stockholders and may not be effected by any consent in writing by such stockholders.
143
Special Meeting of Stockholders
Under the Certificate of Incorporation, special meetings of our stockholders may be called only by the chairperson of the Board, our chief executive officer or the Board acting pursuant to a resolution adopted by a majority of the total number of authorized directors whether or not there exist any vacancies in previously authorized directorships, and may not be called by any other person or persons. Only such business shall be considered at a special meeting of stockholders as shall have been stated in the notice for such meeting.
Advance Notice Requirements for Stockholder Proposals and Director Nominations
Under the Certificate of Incorporation, advance notice of stockholder nominations for the election of directors and of business to be brought by stockholders before any meeting of our stockholders shall be given in the manner and to the extent provided in our Bylaws.
Transfer Agent and Registrar
The transfer agent for our Class A Common Stock and warrant agent for our warrants is Continental Stock Transfer & Trust Company. The transfer agent and warrant agent’s telephone number and address is (212)
509-4000
and 1 State Street, 30th
Floor, New York, NY. 10004.144
SECURITIES ACT RESTRICTIONS ON RESALE OF SECURITIES
Rule 144
Pursuant to Rule 144 of the Securities Act (“Rule 144”), a person who has beneficially owned restricted shares of our Class A Common Stock or Warrants for at least six months would be entitled to sell their securities, that (i) such person is not deemed to have been one of our “affiliates” at the time of, or at any time during the three months preceding, a sale, (ii) we are subject to the Exchange Act periodic reporting requirements for at least 90 days before the sale and (iii) we have filed all required reports under Section 13 or 15(d) of the Exchange Act during the 12 months (or such shorter period as we were required to file reports) preceding the sale. After
provided
a one-year holding
period, assuming we remain subject to the Exchange Act reporting requirements, such a person may sell their securities without regard to clause (iii) in the prior sentence.Persons who have beneficially owned restricted shares of our Class A Common Stock or Warrants for at least six months but who are our affiliates at the time of, or at any time during the three months preceding, a sale, would be subject to additional restrictions, by which such person would be entitled to sell within any three-month period only a number of securities that does not exceed the greater of:
| • | one percent (1%) of the total number of shares of Class A Common Stock then outstanding; or |
| • | the average weekly reported trading volume of the Class A Common Stock during the four calendar weeks preceding the filing of a notice on Form 144 with respect to the sale. |
Sales by our affiliates under Rule 144 are also limited by manner of sale provisions and notice requirements and to the availability of current public information about us.
Restrictions on the Use of Rule 144 by Shell Companies or Former Shell Companies
Rule 144 is not available for the resale of securities initially issued by shell companies (other than Business Combination related shell companies) or issuers that have been at any time previously a shell company, including us. However, Rule 144 also includes an important exception to this prohibition if the following conditions are met at the time of such resale:
| • | the issuer of the securities that was formerly a shell company has ceased to be a shell company; |
| • | the issuer of the securities is subject to the reporting requirements of Section 13 or 15(d) of the Exchange Act; |
| • | the issuer of the securities has filed all Exchange Act reports and material required to be filed, as applicable, during the preceding 12 months (or such shorter period that the issuer was required to file such reports and materials), other than Form 8-K reports; and |
| • | at least one year has elapsed from the time that the issuer filed current Form 10 type information with the SEC reflecting its status as an entity that is not a shell company. |
As of October 30, 2020, we had 277,258,103 shares of Common Stock outstanding, consisting of 144,903,975shares of Class A Common Stock and 132,354,128 shares of Class B Common Stock. Of these shares, 53,188,245 shares of Class A Common Stock sold in our IPO are freely tradable without restriction or further registration under the Securities Act, except for any shares purchased by one of our affiliates within the meaning of Rule 144. All of the 13,358,824 Conversion Shares owned by the Initial Stockholders and the permitted transferees of the Former Sponsor are restricted securities under Rule 144, in that they were issued in private transactions not involving a public offering. All of the 50,000,000 PIPE Shares we issued to the PIPE Investors pursuant to the Subscription Agreements are also restricted securities for purposes of Rule 144. All such restricted shares have been registered for resale under the Securities Act on the registration statement of which this prospectus is part.
As of the date of this registration statement, there are approximately 47,234,454 Warrants outstanding, consisting of 18,400,000 Public Warrants originally sold as part of the units issued in the Company’s IPO, 9,360,000 Private Warrants that were sold by the Company to the Former Sponsor in a private sale prior to the Company’s IPO and 19,474,454 Magna Warrants issued to Magna in connection with entering into the cooperation agreement. Each Warrant is exercisable for one share of our Class A Common
145
Stock, in accordance with the terms of the warrant agreement governing the Warrants. 18,400,000 of these warrants are Public Warrants and are freely tradable, except for any warrants purchased by one of our affiliates within the meaning of Rule 144 under the Securities Act. In addition, we have filed the registration statement of which this prospectus is part covering the 18,400,000 shares of our Class A Common Stock that may be issued upon exercise of the Public Warrants, the 9,360,000 Private Warrants, the 9,360,000 shares of our Class A Common Stock that may be issued upon exercise of the Private Warrants, and the 19,474,454 shares of our Class A Common Stock that may be issued upon exercise of the Magna Warrants, and we are obligated to maintain the effectiveness of such registration statement until the expiration of the Warrants.
While we were formed as a shell company, since the completion of the Business Combination we are no longer a shell company, and so, once the conditions set forth in the exceptions listed above are satisfied, Rule 144 will become available for the resale of the above noted restricted securities.
Form S-8 Registration
StatementWe intend to file one or more registration statements
on Form S-8 under
the Securities Act to register the shares of Class A Common Stock issued or issuable under our 2020 Plan. Anysuch Form S-8 registration
statement will become effective automatically upon filing. We expect that the initial registration statementon Form S-8 will
cover approximately 7.8 million shares of Class A Common Stock. Once these shares are registered, they can be sold in the public market upon issuance, subject to Rule 144 limitations applicable to affiliates and vesting restrictions.146
LEGAL MATTERS
The validity of the Class A Common Stock offered hereby will be passed upon for the Company by Orrick, Herrington & Sutcliffe LLP.
EXPERTS
The financial statements as of December 31, 2019 and 2018, and for each of the two years in the period ended December 31, 2019, of Fisker Group Inc. (formerly known as Fisker Inc.) included in this Prospectus have been audited by Deloitte & Touche LLP, an independent registered public accounting firm, as stated in their report appearing herein and elsewhere in the Registration Statement (which report expresses an unqualified opinion on the financial statements and includes an explanatory paragraph referring to the entity’s ability to continue as a going concern). Such financial statements have been so included in reliance upon the report of such firm given upon their authority as experts in accounting and auditing.
The financial statements as of and for the years ended December 31, 2019 and December 31, 2018 of Spartan Energy Acquisition Corp., appearing in this prospectus and registration statement have been audited by WithumSmith+Brown, PC, an independent registered public accounting firm (“WithumSmith”), as set forth in their report appearing elsewhere herein, and are included in reliance upon such report given on the authority of such firm as experts in accounting and auditing.
CHANGE IN AUDITOR
On October 29, 2020, the Audit Committee of the Board approved the engagement of Deloitte as the Company’s independent registered public accounting firm to audit the Company’s consolidated financial statements for the year ended December 31, 2020. Deloitte served as the independent registered public accounting firm of Legacy Fisker prior to the Business Combination. Accordingly, WithumSmith, the Company’s independent registered public accounting firm prior to the Business Combination, was informed that it would be replaced by Deloitte as the Company’s independent registered public accounting firm following the completion of WithumSmith’s review of the quarter ended September 30, 2020, which consists only of the accounts of the
pre-Business
Combination special purpose acquisition company. This decision was approved by the Board.The report of WithumSmith, independent registered public accounting firm, dated March 12, 2020, on the Company’s financial statements as of December 31, 2019, and for the period from October 13, 2017 (inception) through December 31, 2019, did not contain an adverse opinion or a disclaimer of opinion, and were not qualified or modified as to uncertainties, audit scope or accounting principles other than the Company’s ability to continue as a going concern due to the Company’s obligation to either complete a business combination by the close of business on August 14, 2020, or cease all operations except for the purpose of winding down and liquidating.
During the period of WithumSmith’s engagement by the Company, during the period from October 13, 2017 (inception) to December 31, 2019, and the subsequent period through October 28, 2020, there were no disagreements with WithumSmith on any matter of accounting principles or practices, financial statement disclosure, or auditing scope or procedure, which disagreements, if not resolved to the satisfaction of WithumSmith, would have caused it to make a reference to the subject matter of the disagreement in connection with its report covering such period. In addition, no “reportable events,” as defined in Item 304(a)(1)(v) of Regulation
S-K,
occurred within the period of WithumSmith’s engagement and the subsequent interim period preceding WithumSmith’s dismissal.During the period from October 13, 2017 (inception) through December 31, 2019, and the subsequent interim period preceding the engagement of Deloitte, neither the Company nor anyone on the Company’s behalf consulted with Deloitte regarding (i) the application of accounting principles to a specified transaction, either completed or proposed; or the type of audit opinion that might be rendered on the Company’s financial statements, and no written report or oral advice was provided to the Company by Deloitte that Deloitte concluded was an important factor considered by the Company in reaching a decision as to the accounting, auditing or financial reporting issue; or (ii) any matter that was either the subject of a disagreement, as that term is described in Item 304(a)(1)(iv) of Regulation
S-K,
or a reportable event, as that term is defined in Item 304(a)(1)(v) of RegulationS-K.
WHERE YOU CAN FIND MORE INFORMATION
We are required to file annual, quarterly and current reports, proxy statements and other information with the SEC as required by the Exchange Act. You can read our SEC filings, including this prospectus, over the Internet at the SEC’s website at.
www.sec.gov
Our website address is. Through our website, we make available, free of charge, the following documents as soon as reasonably practicable after they are electronically filed with, or furnished to, the SEC, including our Annual Reports on
www.fiskerinc.com
Form 10-K;
our proxy statements for our annual and special stockholder meetings; our Quarterly Reports onForm 10-Q;
our Current Reports onForm 8-K;
Forms 3, 4, and 5 and Schedules 13D with respect to our securities filed on behalf of our directors and our executive officers; and amendments to those documents. The information contained on, or that may be accessed through, our website is not a part of, and is not incorporated into, this prospectus.147
FISKER INC. AND SUBSIDIARIES
INDEX TO UNAUDITED CONDENSED CONSOLIDATED FINANCIAL STATEMENTS
Page | ||||
Fisker Unaudited Condensed Financial Statements | ||||
Unaudited Condensed Consolidated Financial Statements | ||||
| F-3 | ||||
| F-5 | ||||
| F-6 | ||||
| F-7 | ||||
| F-8 | ||||
Fisker Audited Financial Statements | ||||
| F-25 | ||||
Consolidated Financial Statements | ||||
| F-26 | ||||
| F-27 | ||||
| F-28 | ||||
| F-29 | ||||
| F-30 | ||||
Spartan Energy Acquisition Corp. Unaudited Condensed Financial Statements | ||||
| F-53 | ||||
| F-54 | ||||
| F-55 | ||||
| F-57 | ||||
| F-58 | ||||
Spartan Energy Acquisition Corp Audited Financial Statements | ||||
| F-76 | ||||
F-1
| F-77 | ||||
| F-78 | ||||
| F-79 | ||||
| F-80 | ||||
F-2
Fisker Inc. and Subsidiaries
Unaudited Condensed Consolidated Balance Sheets
As of September 30, 2020 | As of December 31, 2019 | |||||||
ASSETS | ||||||||
Current assets: | ||||||||
Cash and cash equivalents | $ | 44,976,281 | $ | 1,858,093 | ||||
Prepaid expenses and other current assets | 2,675,593 | 18,401 | ||||||
Total current assets | 47,651,874 | 1,876,494 | ||||||
Non-current assets: | ||||||||
Property and equipment, net | 262,784 | 65,261 | ||||||
Right-of-use | 34,099 | 134,672 | ||||||
Total non-current assets | 296,883 | 199,933 | ||||||
TOTAL ASSETS | $ | 47,948,757 | $ | 2,076,427 | ||||
LIABILITIES, TEMPORARY EQUITY AND STOCKHOLDERS’ DEFICIT | ||||||||
Current liabilities: | ||||||||
Accounts payable | $ | 674,210 | $ | 2,134,696 | ||||
Accrued expenses | 2,676,788 | 927,516 | ||||||
Founders demand note payable | — | 250,000 | ||||||
Convertible equity security | 79,003,494 | — | ||||||
Bridge notes payable, current | 10,927,368 | — | ||||||
Lease liabilities | 36,331 | 143,599 | ||||||
Total current liabilities | 93,318,191 | 3,455,811 | ||||||
Non-current liabilities: | ||||||||
Bridge notes payable, non-current | — | 3,797,200 | ||||||
Customer deposits | 2,939,708 | 945,812 | ||||||
Total non-current liabilities | 2,939,708 | 4,743,012 | ||||||
F-3
Total liabilities | 96,257,899 | 8,198,823 | ||||||
COMMITMENTS AND CONTINGENCIES (NOTE 18) | ||||||||
Temporary equity: | ||||||||
Series A Convertible Preferred stock, $0.00001 par value; 6,252,530 shares authorized, issued and outstanding as of September 30, 2020 and December 31, 2019 (liquidation value of $4,676,892 as of September 30, 2020 and December 31, 2019) | 4,634,416 | 4,634,416 | ||||||
Series B Convertible Preferred stock, $0.00001 par value; 2,126,750 shares authorized, 1,386,370 shares issued and outstanding as of September 30, 2020 and December 31, 2019 (liquidation value of $6,518,712 as of September 30, 2020 and December 31, 2019) | 6,386,267 | 6,386,267 | ||||||
Stockholders’ deficit: | ||||||||
Founders Convertible Preferred stock, $0.00001 par value; 10,000,000 shares authorized, issued and outstanding as of September 30, 2020 and December 31, 2019 | 100 | 100 | ||||||
Class A Common stock, $0.00001 par value; 150,000,000 shares authorized; 131,746 and 77,631 shares issued and outstanding as of September 30, 2020 and December 31, 2019, respectively | 1 | — | ||||||
Class B Common Stock, $0.00001 par value; 40,000,000 shares authorized; 38,727,340 shares issued and outstanding as of September 30, 2020 and December 31, 2019 | 387 | 387 | ||||||
Additional paid-in capital | 1,173,234 | 756,479 | ||||||
Accumulated deficit | (60,503,547 | ) | (17,900,045 | ) | ||||
Total stockholders’ deficit | (59,329,825 | ) | (17,143,079 | ) | ||||
TOTAL LIABILITIES, TEMPORARY EQUITY AND STOCKHOLDERS’ DEFICIT | $ | 47,948,757 | $ | 2,076,427 | ||||
The accompanying notes are an integral part of these unaudited condensed consolidated financial statements.
F-4
Fisker Inc. and Subsidiaries
Unaudited Condensed Consolidated Statements of Operations
Nine Months Ended September 30, | ||||||||
2020 | 2019 | |||||||
Operating costs and expenses: | ||||||||
General and administrative | $ | 8,055,515 | $ | 2,882,451 | ||||
Research and development | 3,962,711 | 4,942,532 | ||||||
Total operating costs and expenses | 12,018,226 | 7,824,983 | ||||||
Loss from operations | (12,018,226 | ) | (7,824,983 | ) | ||||
Other income (expense): | ||||||||
Other income | 15,000 | — | ||||||
Interest income | 13,460 | 7,088 | ||||||
Interest expense | (1,326,370 | ) | (19,728 | ) | ||||
Change in fair value of embedded derivative | (405,567 | ) | (8,904 | ) | ||||
Change in fair value of convertible equity security | (29,003,494 | ) | — | |||||
Foreign currency gain (loss) | 121,695 | (15,340 | ) | |||||
Total other expense | (30,585,276 | ) | (36,884 | ) | ||||
Net loss | $ | (42,603,502 | ) | $ | (7,861,867 | ) | ||
Net loss per common share | ||||||||
Net loss per share attributable to Class A and Class B Common stockholders- Basic and Diluted | $ | (1.10 | ) | $ | (0.20 | ) | ||
Weighted average shares outstanding | ||||||||
Weighted average Class A and Class B Common shares outstanding- Basic and Diluted | 38,822,094 | 38,779,177 | ||||||
The accompanying notes are an integral part of these unaudited condensed consolidated financial statements.
F-5
Fisker Inc. and Subsidiaries
Unaudited Condensed Consolidated Statements of Temporary Equity and Stockholders’ Deficit
Series A Convertible Preferred | Series B Convertible Preferred | Founders Convertible Preferred | Class A Common Stock | Class B Common Stock | Additional Paid-in | Accumulated | Total Stockholders’ | |||||||||||||||||||||||||||||||||||||||||||||
Shares | Amount | Shares | Amount | Shares | Amount | Shares | Amount | Shares | Amount | Capital | Deficit | Deficit | ||||||||||||||||||||||||||||||||||||||||
Balance at December 31, 2019 | 6,252,530 | $ | 4,634,416 | 1,386,370 | $ | 6,386,267 | 10,000,000 | $ | 100 | 77,631 | $ | — | 38,727,340 | $ | 387 | $ | 756,479 | $ | (17,900,045 | ) | $ | (17,143,079 | ) | |||||||||||||||||||||||||||||
Stock-based compensation | — | — | — | — | — | — | — | — | — | — | 334,011 | — | 334,011 | |||||||||||||||||||||||||||||||||||||||
Exercise of stock options | — | — | — | — | — | — | 54,115 | 1 | — | — | 82,744 | — | 82,745 | |||||||||||||||||||||||||||||||||||||||
Net loss | — | — | — | — | — | — | — | — | — | — | — | (42,603,502 | ) | (42,603,502 | ) | |||||||||||||||||||||||||||||||||||||
Balance at September 30, 2020 | 6,252,530 | $ | 4,634,416 | 1,386,370 | $ | 6,386,267 | 10,000,000 | $ | 100 | 131,746 | $ | 1 | 38,727,340 | $ | 387 | $ | 1,173,234 | $ | (60,503,547 | ) | $ | (59,329,825 | ) | |||||||||||||||||||||||||||||
Series A Convertible Preferred | Series B Convertible Preferred | Founders Convertible Preferred | Class A Common Stock | Class B Common Stock | Additional Paid-in | Accumulated | Total Stockholders’ | |||||||||||||||||||||||||||||||||||||||||||||
Shares | Amount | Shares | Amount | Shares | Amount | Shares | Amount | Shares | Amount | Capital | Deficit | Deficit | ||||||||||||||||||||||||||||||||||||||||
Balance at December 31, 2018 | 6,252,530 | $ | 4,634,416 | 1,386,370 | $ | 6,386,267 | 10,000,000 | $ | 100 | 34,272 | $ | — | 38,727,340 | $ | 387 | $ | 663,678 | $ | (7,021,295 | ) | $ | (6,357,130 | ) | |||||||||||||||||||||||||||||
Stock-based compensation | — | — | — | — | — | — | — | — | — | — | 43,615 | — | 43,615 | |||||||||||||||||||||||||||||||||||||||
Exercise of stock options | — | — | — | — | — | — | 32,374 | — | — | — | 5,850 | — | 5,850 | |||||||||||||||||||||||||||||||||||||||
Net loss | — | — | — | — | — | — | — | — | — | — | — | (7,861,867 | ) | (7,861,867 | ) | |||||||||||||||||||||||||||||||||||||
Balance at September 30, 2019 | 6,252,530 | $ | 4,634,416 | 1,386,370 | $ | 6,386,267 | 10,000,000 | $ | 100 | 66,646 | $ | — | 38,727,340 | $ | 387 | $ | 713,143 | $ | (14,883,162 | ) | $ | (14,169,532 | ) | |||||||||||||||||||||||||||||
The accompanying notes are an integral part of these unaudited condensed consolidated financial statements.
F-6
Fisker Inc. and Subsidiaries
Unaudited Condensed Consolidated Statements of Cash Flows
Nine Months Ended September 30, | ||||||||
2020 | 2019 | |||||||
Cash Flows from Operating Activities: | ||||||||
Net loss | $ | (42,603,502 | ) | $ | (7,861,867 | ) | ||
Reconciliation of net loss to net cash used in operating activities: | ||||||||
Stock-based compensation | 334,011 | 43,615 | ||||||
Depreciation and amortization | 26,169 | 18,435 | ||||||
Amortization of right-of-use | 100,573 | 97,266 | ||||||
Amortization of debt discount | 1,091,033 | 14,876 | ||||||
Change in fair value of embedded derivative | 405,567 | 8,904 | ||||||
Change in fair value of convertible equity security | 29,003,494 | — | ||||||
Reclassification of expensed payments to arrangers of convertible security | 3,500,000 | — | ||||||
Unrealized loss on foreign currency | 11,835 | — | ||||||
Changes in operating assets and liabilities: | ||||||||
Prepaid expenses and other current assets | (744,634 | ) | 19,281 | |||||
Accounts payable and accrued expenses | (952,660 | ) | 2,704,783 | |||||
Customer deposits | 1,993,896 | 144,643 | ||||||
Change in operating lease liability | (107,268 | ) | (100,766 | ) | ||||
Net cash used in operating activities | (7,941,486 | ) | (4,910,830 | ) | ||||
Cash Flows from Investing Activities: | ||||||||
Purchase of property and equipment | (223,692 | ) | (13,890 | ) | ||||
Net cash used in investing activities | (223,692 | ) | (13,890 | ) | ||||
Cash Flows from Financing Activities: | ||||||||
Proceeds from the issuance of bridge notes | 5,371,733 | 1,082,788 | ||||||
Proceeds from issuance of convertible equity security, net | 46,500,000 | — | ||||||
Payments of deferred offering costs | (671,112 | ) | — | |||||
Proceeds from the exercise of stock options | 82,745 | 5,850 | ||||||
Net cash provided by financing activities | 51,283,366 | 1,088,638 | ||||||
Net increase (decrease) in cash and cash equivalents | 43,118,188 | (3,836,082 | ) | |||||
Cash and cash equivalents, beginning of the period | 1,858,093 | 5,545,663 | ||||||
Cash and cash equivalents, end of the period | $ | 44,976,281 | $ | 1,709,581 | ||||
Non-cash financing activities | ||||||||
Issuance of bridge note for founders demand note | $ | 250,000 | $ | — | ||||
Deferred offering costs in prepaid assets and accounts payable and accrued expenses | $ | 1,241,445 | $ | — | ||||
The accompanying notes are an integral part of these unaudited condensed consolidated financial statements.
F-7
Fisker Inc. and Subsidiaries
Notes to Unaudited Condensed Consolidated Financial Statements
(Information as of September 30, 2020 and for the nine months ended September 30, 2020 and 2019 is unaudited. Information as of December 31, 2019 is derived from the audited financial statements)
1. Overview of the Company
Fisker Inc. (“Fisker” or the “Company”) was incorporated in the state of Delaware on September 21, 2016. The Company is currently designing and developing sustainable electric vehicles. The Company is currently accepting reservations for the Fisker Ocean.
In connection with its formation, the Company entered into stock purchase agreements with the Company’s founders, whereby the founders contributed certain IP (primarily trademarks) and interests in Platinum IPR LLC. Platinum IPR LLC is an entity solely owned by the Company’s founders, which held Fisker trademarks registered in a variety of jurisdictions around the world. The founders’ transfer of its interest in Platinum IPR LLC and the transfer of trademarks was accounted for as a transfer of assets between entities under common control. The carrying amount of the transferred assets is recorded based on the prior carrying value, which was de minimis.
In December 2018, the Company effectedsplit of its outstanding common and preferred stock, and a proportional adjustment to the existing conversion ratios for each series of preferred stock was made at the time of the effectiveness of the reverse stock split. Accordingly, all share and per share amounts for all periods presented in these condensed consolidated financial statements and notes thereto, have been adjusted retroactively, where applicable, to reflect this reverse stock split and adjustment of the preferred stock conversion ratio.
a 10-for-1 stock
On July 10, 2020, the Company entered into a Business Combination Agreement and Plan of Reorganization (as amended, the “Merger”) with Spartan Energy Acquisition Corp., a Delaware corporation (“Spartan”). On October 29, 2020, the Company and Spartan consummated the Merger and the Company is now a wholly-owned subsidiary of Spartan, subsequently renamed “Fisker Inc.” The Merger is further described in Note 19.
Going Concern, Liquidity and Capital Resources
The Company evaluated whether there are any conditions and events, considered in the aggregate, that raise substantial doubt about its ability to continue as a going concern over the next twelve months through November 2021. Since inception, the Company has incurred significant losses of approximately $60.5 million. As of September 30, 2020, the Company had approximately $45.0 million in cash and cash equivalents. The Company expects to continue to incur significant operating losses for the foreseeable future. The Company has historically funded its operations primarily through the sale of convertible debt and equity securities. However, based on anticipated spend and cash received from the Merger and timing of expenditure assumptions, the Company currently expects that its cash will be sufficient to fund its operating expenses and capital expenditure requirements for at least the next 12 months from issuance.
2. Summary of Significant Accounting Policies
Basis of Presentation
The Company’s condensed consolidated financial statements have been prepared in conformity with accounting principles generally accepted in the United States of America (“GAAP”) as determined by the Financial Accounting Standards Board (“FASB”) Accounting Standards Codification (“ASC”) and pursuant to the regulations of the U.S. Securities and Exchange Commission (“SEC”).
F-8
Use of Estimates
The preparation of the condensed consolidated financial statements in conformity with GAAP requires management to make estimates and assumptions that affect the reported amounts of assets and liabilities in the condensed consolidated financial statements and accompanying notes. The Company bases these estimates on historical experience and on various other assumptions that it believes are reasonable under the circumstances, the results of which form the basis for making judgments about the carrying amounts of assets and liabilities that are not readily apparent from other sources. Actual results may differ materially from these estimates.
Unaudited Interim Condensed Consolidated Financial Statements
The accompanying interim condensed consolidated balance sheet as of September 30, 2020, the interim condensed consolidated statements of temporary equity and stockholders’ deficit and the interim condensed consolidated statements of operations for the nine months ended September 30, 2020 and 2019, and the interim condensed consolidated statements of cash flows for the nine months ended September 30, 2020 and 2019, are unaudited. The unaudited interim condensed consolidated financial statements have been prepared on the same basis as the audited annual consolidated financial statements and, in management’s opinion, include all adjustments consisting of only normal recurring adjustments necessary for the fair statement of the Company’s financial position as of September 30, 2020 and its results of operations for the nine months ended September 30, 2020 and 2019 and cash flows for the nine months ended September 30, 2020 and 2019. The financial data and the other financial information disclosed in the notes to these condensed consolidated financial statements related to the nine-month periods are also unaudited. The results of operations for the nine months ended September 30, 2020 are not necessarily indicative of the results to be expected for the full fiscal year or any other period.
These unaudited interim condensed consolidated financial statements should be read in conjunction with the consolidated financial statements and the related notes included in the Company’s annual financial statements for the fiscal year ended December 31, 2019.
Recently Issued Accounting Pronouncements
In December 2019, the FASB issued, which is intended to simplify various aspects related to accounting for income taxes.
ASU No. 2019-12,
Income Taxes (Topic 740): Simplifying the Accounting for Income Taxes
ASU No. 2019-12 removes
certain exceptions to the general principles in ASC 740 and also clarifies and amends existing guidance to improve consistent application. This guidance is effective for fiscal years, and interim periods within those fiscal years, beginning after December 15, 2020, with early adoption permitted. The Company is currently evaluating the impact of this standard on its condensed consolidated financial statements.In June 2016, the FASB issued (Topic 326. This guidance introduces a new model for recognizing credit losses on financial instruments based on an estimate of current expected credit losses. This AU also provides updated guidance regarding the impairmentsecurities and includes additional disclosure requirements. The new guidance is effective
ASU No. 2016-13,
Financial Instruments—Credit Losses
): Measurement of Credit Losses on Financial Instruments
of available-for-sale debt
for non-public companies,
and public business entities that meet the definition of a Smaller Reporting Company as defined by the Securities and Exchange Commission, for interim and annual periods beginning after December 15, 2022. The Company is currently evaluating the impact of this standard on its condensed consolidated financial statements.3. Fair Value Measurements
The Company’s financial assets and liabilities subject to fair value measurements on a recurring basis and the level of inputs used for such measurements were as follows:
Fair Value Measured as of September 30, 2020 Using: | ||||||||||||||||
Level 1 | Level 2 | Level 3 | Total | |||||||||||||
Assets included in: | ||||||||||||||||
Money market funds included in cash and cash equivalents | $ | 32,513,006 | $ | — | $ | — | $ | 32,513,006 | ||||||||
F-9
Total fair value | $ | 32,513,006 | $ | — | $ | — | $ | 32,513,006 | ||||||||
Liabilities included in: | ||||||||||||||||
Embedded derivative in bridge notes | $ | — | $ | — | $ | 3,664,848 | $ | 3,664,848 | ||||||||
Convertible equity security | — | — | 79,003,494 | 79,003,494 | ||||||||||||
Total fair value | $ | — | $ | — | $ | 82,668,342 | $ | 82,668,342 | ||||||||
Fair Value Measured as of December 31, 2019 Using: | ||||||||||||||||
Level 1 | Level 2 | Level 3 | Total | |||||||||||||
Assets included in: | ||||||||||||||||
Money market funds included in cash and cash equivalents | $ | 1,731,455 | $ | — | $ | — | $ | 1,731,455 | ||||||||
Total fair value | $ | 1,731,455 | $ | — | $ | — | $ | 1,731,455 | ||||||||
Liabilities included in: | ||||||||||||||||
Embedded derivative in bridge notes | $ | — | $ | — | $ | 1,325,049 | $ | 1,325,049 | ||||||||
Total fair value | $ | — | $ | — | $ | 1,325,049 | $ | 1,325,049 | ||||||||
The fair value of the Company’s money market funds is determined using quoted market prices in active markets for identical assets.
The carrying amounts included in the Condensed Consolidated Balance Sheets under Current assets approximate fair value because of the short maturity of these instruments.
The carrying amount of bridge notes approximate fair value due to management’s opinion that current rates and terms that would be available to the Company with the same maturity and security structure would be essentially equivalent to that of the Company’s bridge notes. Certain features of the bridge notes were determined to be an embedded derivative requiring separate measurement from the loan host instrument.
The Company measures the embedded derivative liability and the convertible equity security at fair value based on significant inputs not observable in the market, which causes it to be classified as a Level 3 measurement within the fair value hierarchy. The valuation of the embedded derivative and the convertible equity security use assumptions and estimates the Company believes would be made by a market participant in making the same valuation. The Company assess these assumptions and estimates on
an on-going basis
as additional data impacting the assumptions and estimates are obtained. Changes in the fair value of the embedded derivative and convertible equity security related to updated assumptions and estimates are recognized within the Condensed Consolidated Statements of Operations.The embedded derivative liability and convertible equity security may change significantly as additional data is obtained, impacting the Company’s assumptions regarding probabilities of outcomes used to estimate the fair value of the liability. In evaluating this information, considerable judgment is required to interpret the data used to develop the assumptions and estimates. The estimates of fair value may not be indicative of the amounts that could be realized in a current market exchange. Accordingly, the use of different market assumptions and/or different valuation techniques may have a material effect on the estimated fair value amounts, and such changes could materially impact the Company’s results of operations in future periods.
Level 3 Disclosures
F-10
The following table provides quantitative information associated with the fair value measurement of the Company’s Level 3 inputs:
Fair Value as of September 30, 2020 | Valuation Technique | Unobservable Input Description | Input | |||||||
Embedded derivative in bridge notes | $ | 3,664,848 | Probability-adjusted discounted cash flow | Probabilities of Completion of Next Equity Financing | 100% | |||||
| Period in which outcomes are expected to be achieved | 0.1 years | |||||||||
| Discount rate | 11.5% - 16.7% | |||||||||
Convertible equity security | $ | 79,003,494 | Probability-adjusted market approach | Probabilities of Conversion into Series C Preferred Stock | 15% | |||||
Probabilities of Conversion upon Merger | 85% | |||||||||
The fair value of the embedded derivative liability represents the fair value of the Company’s liability for all potential payments if the holders of the bridge notes elected to convert into cash or shares of common stock. The significant unobservable inputs used in the fair value measurement of the Company’s embedded derivative liability are the probabilities of the Company’s closing of the sale of capital stock on or prior to the bridge notes’ maturity dates, resulting in gross proceeds in excess of at least $20.0 million (the “Completion of the Next Equity Financing”), which would trigger conversion of the embedded derivative liability, probabilities as to the periods in which the outcomes are expected to be achieved and a discount rate. Significant changes in any of the probabilities of the Completion of the Next Equity Financing or significant changes in the period in which outcomes are expected to be achieved would result in a significantly higher or lower fair value measurement, respectively.
The fair value of the convertible equity security represents the fair value of the potential common stock to be issued to the holder of the convertible equity security in the event of a SPAC transaction or conversion to shares of aSeries C preferred stock. The significant unobservable input used in the fair value measurement of the Company’s convertible equity security is the probability of the Company’s closing of a SPAC transaction, which would trigger conversion of the convertible equity security. Significant changes in any of the probabilities of the SPAC transaction would result in a significantly higher or lower fair value measurement, respectively.
to-be-issued
The following table presents changes in Level 3 liabilities measured at fair value for the nine months ended September 30, 2020 and 2019:
Embedded derivative in bridge notes | Convertible equity security | Total | ||||||||||
Balance, December 31, 2019 | $ | 1,325,049 | $ | — | $ | 1,325,049 | ||||||
Issuance of bridge notes | 1,934,232 | — | 1,934,232 | |||||||||
Issuance of Convertible equity security | — | 50,000,000 | 50,000,000 | |||||||||
Change in fair value | 405,567 | 29,003,494 | 29,409,061 | |||||||||
Balance, September 30, 2020 | $ | 3,664,848 | $ | 79,003,494 | $ | 82,668,342 | ||||||
F-11
Embedded derivative in bridge notes | ||||
Balance, December 31, 2018 | $ | — | ||
Issuance of bridge notes | 405,718 | |||
Change in fair value | 8,904 | |||
Balance, September 30, 2019 | $ | 414,622 | ||
For the nine months ended September 30, 2020 and 2019, the changes in the fair value of the embedded derivative liability resulted from an adjustment to the remaining period to the expected outcome and probabilities of completion. For the nine months ended September 30, 2020, the changes in the fair value of the convertible equity security resulted from changes in price of Spartan’s common stock and an adjustment to the probabilities of completion of a SPAC transaction. No other changes in valuation techniques or inputs occurred during the nine months ended September 30, 2020.
4
Prepaid expenses and other current assets
Prepaid expenses and other current assets consists of the following as of September 30, 2020 and as of December 31, 2019:
As of September 30, | As of December 31, | |||||||
2020 | 2019 | |||||||
Prepaid insurance | $ | 595,000 | $ | — | ||||
Deferred offering costs | 1,912,235 | — | ||||||
Other prepaid expenses and other current assets | 168,358 | 18,401 | ||||||
| $ | 2,675,593 | $ | 18,401 | |||||
5
Property and Equipment, net
Property and equipment, net, consists of the following as of September 30, 2020 and as of December 31, 2019:
As of September 30, | As of December 31, | |||||||
2020 | 2019 | |||||||
Leasehold improvements | $ | 59,485 | $ | 59,485 | ||||
Furniture and fixtures | 45,377 | 45,377 | ||||||
Computer equipment | 235,354 | 11,662 | ||||||
Total property and equipment | 340,216 | 116,524 | ||||||
Less: Accumulated depreciation and amortization | (77,432 | ) | (51,263 | ) | ||||
Property and equipment, net | $ | 262,784 | $ | 65,261 | ||||
Depreciation and amortization expense for the nine months ended September 30, 2020 and 2019 was $26,169 and $18,435, respectively.
F-12
6. Leases
The Company currently leases its headquarters space in the Los Angeles area under a single lease classified as an operating lease expiring on December 30, 2020. Fixed rent escalates each year, but the Company is not responsible for any portion of the landlord’s operating expenses. Under the lease, the Company has
one 18-month renewal
option with specified fixed rent, which has not been included in the calculation of lease liabilities and right of use assets; at the adoption date, exercise of the option was not reasonably certain. This lease does not have any contingent rent payments, does not impose any financial restrictions, and does not contain residual value guarantees.The Company does not act as a lessor or have any leases classified as financing leases.
At September 30, 2020 and December 31, 2019, the Company had operating lease liabilities of $36,331 and $143,599, respectively,of $34,099 and $134,672, respectively, in the Condensed Consolidated Balance Sheets.
and right-of-use assets
The tables below present information regarding the Company’s lease assets and liabilities:
As of September 30, | As of December 31, | |||||||
2020 | 2019 | |||||||
Assets: | ||||||||
Operating lease right-of-use | $ | 34,099 | $ | 134,672 | ||||
Liabilities: | ||||||||
Current | ||||||||
Operating | $ | 36,331 | $ | 143,599 | ||||
The components of lease related expense are as follows:
Nine months ended September 30, | ||||||||
2020 | 2019 | |||||||
Lease costs: | ||||||||
Operating lease expense | $ | 102,880 | $ | 102,880 | ||||
Short-term lease expense | 9,750 | 9,450 | ||||||
Variable rent concession | (1,340 | ) | — | |||||
Total lease costs | $ | 111,290 | $ | 112,330 | ||||
The components of supplemental cash flow information related to leases are as follows:
Nine months ended September 30, | ||||||||
2020 | 2019 | |||||||
Cash flow information: | ||||||||
Cash paid for amounts included in the measurement of lease liabilities: | ||||||||
Operating cash flows from operating leases | $ | 109,575 | | $ | 106,380 | | ||
Non-cash activity: | ||||||||
ROU asset obtained in exchange for lease obligations | $ | — | $ | 264,900 | ||||
Other Information | ||||||||
Weighted average remaining lease term (in years) | 0.25 | 1.25 | ||||||
Weighted average discount rate | 3.20 | % | 3.20 | % | ||||
F-13
Future minimum payments during the next five years and thereafter are as follows:
Operating | ||||
Leases | ||||
Three Months Ended December 31, 2020 | $ | 36,525 | ||
Year Ended December 31, 2021 | — | |||
Year Ended December 31, 2022 | — | |||
Year Ended December 31, 2023 | — | |||
Year Ended December 31, 2024 | — | |||
Thereafter | — | |||
Total | 36,525 | |||
Less present value discount | (194 | ) | ||
Operating lease liabilities | $ | 36,331 | ||
The Company’s lease agreement does not provide an implicit rate, so the Company used an estimated incremental borrowing rate, which was derived from third-party information available at the time the Company adopted ASC 842, in determining the present value of lease payments. The rate used is for a secured borrowing of a similar term as the lease.
7. Accrued Expenses
A summary of the components of accrued expenses is as follows:
As of September 30, | As of December 31, | |||||||
2020 | 2019 | |||||||
Accrued payroll | 178,954 | 84,726 | ||||||
Accrued professional fees | 2,218,781 | 39,396 | ||||||
Accrued research and development | — | 9,853 | ||||||
Accrued interest | 276,217 | 42,305 | ||||||
Accrued other | 2,836 | 1,236 | ||||||
Accrued legal settlement | — | 750,000 | ||||||
Total accrued liabilities | $ | 2,676,788 | $ | 927,516 | ||||
8. Customer Deposits
Customer deposits consists of the following as of September 30, 2020 and as of December 31, 2019:
As of September 30, | As of December 31, | |||||||
2020 | 2019 | |||||||
Customer reservation deposits | $ | 2,185,725 | $ | 466,500 | ||||
Customer SUV option | 753,983 | 479,312 | ||||||
Total customer deposits | $ | 2,939,708 | $ | 945,812 | ||||
F-14
9. Founders Demand Note
In connection with the Company formation in September 2016, HF Holdco LLC, an entity controlled by Henrik Fisker, the Company’s Chief Executive Officer and founder, and Dr. Geeta Gupta, the Company’s Chief Financial Officer and founder, advanced the Company $250,000 in the form of a demand note.
In May 2020, in satisfaction of the advances made by HF Holdco LLC, the Company issued a bridge note payable to HF Holdco LLC with the principal sum of $250,000. The bridge note bears substantially the same terms as the bridge notes payable as described in Note 10.
As of December 31, 2019, the entire amount of the founder demand note is outstanding.
10. Bridge Notes Payable
From July 2019 to September 2020, the Company entered into note agreements with investors. As of September 30, 2020 and December 31, 2019, the aggregate principal amount of the bridge notes is approximately $10.0 million and $4.1 million, respectively, which are due July 29, 2021, with simple interest rate of 5% per annum. All notes mature in less than twelve months from September 30, 2020. The outstanding principal and any accrued but unpaid interest under the bridge notes shall be automatically converted into equity securities issued by the Company at the initial closing of the Company’s next sale of capital stock occurring on or prior to the notes’ maturity date resulting in gross proceeds in excess of at least $20.0 million, (the “Next Equity Financing”), at an exchange price equal to 75% of the per share price received from investors in the Next Equity Financing.
In June 2020, the Company entered into an amendment to the note agreements with holders of the Company’s outstanding bridge notes to provide for amendments to the definition of the Next Equity Financing such that in the event of a Special Purpose Acquisition Corporation (“SPAC”) Transaction, as defined, prior to repayment or conversion in full of the note, immediately prior to such SPAC Transaction, the outstanding principal and any accrued but unpaid interest under the bridge notes shall automatically convert into shares of Class A Common Stock of the Company (or, at the election of the Company, directly into proceeds paid to the holders of Class A Common Stock in connection with such SPAC Transaction) at a price per share that is 75% of the price per share of Class A Common Stock paid in such SPAC Transaction.
In the event the Next Equity Financing has not been consummated on or before the maturity date, at the option of the Company, the outstanding principal and any accrued but unpaid interest under the bridge notes shall convert into shares of the Company’s Series B Convertible Preferred Stock at the Series B Convertible Preferred Stock original issue price of $4.702.
In the event of a change in control, as defined in the note agreements, prior to repayment or conversion, the outstanding principal and any accrued but unpaid interest under the bridge notes shall, at the option of the majority holders, settle in cash equal to 1.5 times the outstanding principal and unpaid interest or settle with common stock of the Company at a price per share that is 75% of the price per share of common stock paid at the change of control.
Certain holders of the bridge notes were issued option agreements providing the holder with
a non-binding right
to receive a base model Fisker Ocean SUV within the first 12 months of production, subject to the terms and conditions. The proceeds received from these holders were allocated to the bridge notes and option agreements on a relative fair value basis, resulting in an initial discount to the bridge notes.The automatic exchange feature is the predominant settlement feature and the change of control feature within the bridge notes are embedded contingent put options that, collectively, are required to be bifurcated from the debt host and measured at fair value with changes in fair value recognized in earnings (see Note 3). After bifurcation of the embedded derivative, the initial carrying value of the bridge notes are accreted to their stated principal value over the contractual term of the bridge notes, using the effective interest method. The Company recognized approximately $1.2 million of accretion of debt discount from the issuance dates of the bridge notes through September 30, 2020, classified as interest expense in the Condensed Consolidated Statement of Operations.
F-15
The estimated fair value of the embedded derivative at issuance was $3,179,530. The Company recognized $405,567 of other expense due to the change in fair value of the embedded derivative for the nine months ended September 30, 2020.
The following table summarizes the aggregate values recorded for the bridge notes as of September 30, 2020 and December 31, 2019:
As of September 30, | ||||||||
At Issuance | 2020 | |||||||
Principal | $ | 9,990,882 | $ | 10,015,385 | ||||
Embedded derivative | 3,179,530 | 3,664,848 | ||||||
Unamortized discounts and fees | (3,970,061 | ) | (2,752,865 | ) | ||||
Net carrying amount | $ | 9,200,351 | $ | 10,927,368 | ||||
As of December 31, | ||||||||
At Issuance | 2019 | |||||||
Principal | $ | 4,094,448 | $ | 4,099,080 | ||||
Embedded derivative | 1,245,298 | 1,325,049 | ||||||
Unamortized discounts and fees | (1,761,159 | ) | (1,626,929 | ) | ||||
Net carrying amount | $ | 3,578,587 | $ | 3,797,200 | ||||
Certain of the Company’s bridge notes include a covenant as to the use of proceeds from the issuance. Proceeds of $1.0 million are to be used for the development of certain battery technology. As of September 30, 2020, the Company is in compliance with such covenant.
11. Temporary Equity
Series A and Series B Convertible Preferred Stock
As of September 30, 2020, the Company is authorized to issue 8,379,280 shares of Preferred stock with a par value of $0.00001, of which, 6,252,530 shares are designated Series A Convertible Preferred Stock and 2,126,750 are designated as Series B Convertible Preferred Stock. The original issue price and the liquidation value, as of September 30, 2020, of each class of Convertible Preferred Stock is as follows:
Shares Issued and Outstanding | Original Issue Price | Original Issue value | Aggregate Liquidation Preference | |||||||||||||
Series A | 6,252,530 | $ | 0.748 | $ | 4,676,892 | $ | 4,676,892 | |||||||||
Series B | 1,386,370 | $ | 4.702 | $ | 6,518,712 | $ | 6,518,712 | |||||||||
Dividends
Series A holders
receive non-cumulative dividends
at a rate per annum equal to $0.045 per share, if and when declared by the Company’s Board of Directors. Series A holders receive dividends prior to and in preference to any dividends on Series B Convertible Preferred Stock, Founders Convertible Preferred and Common Stockholders. After payment of any Series A dividends, any additional dividends are distributed to Founders Convertible Preferred and CommonStockholders pro-rata based
on the number of shares of Common Stock held (assuming conversion of all such Founders Convertible Preferred into Common Stock). No dividends have been declared or paid as of September 30, 2020.F-16
Liquidation
Holders of Series A Convertible Preferred Stock and Series B Convertible Preferred Stock are entitled to receive a liquidation preference prior to any distribution to holders of Founders Convertible Preferred and Common Stock.
Upon the occurrence of a liquidation transaction, Convertible Preferred Stock Series A and Convertible Preferred Stock Series B will be redeemed by the Company at the greater of (i) $0.748 per share (Series A) or $4.702 (Series B) (adjusted for stock splits, stock dividends, reclassifications etc.) and (ii) such amount per share as would have been payable had all shares of Convertible Preferred Series A or Convertible Preferred Series B been converted into Class A Common Stock immediately prior to the liquidation transaction (a “Deemed Conversion”).
Remaining assets are distributed among the holders of Founders Convertible Preferred and Common Stock pro rata based on the number of shares of Common Stock held by each (assuming conversion of Founders Convertible Preferred into Common Stock).
Conversion
Series A Convertible Preferred Stock and Series B Convertible Preferred Stock are convertible at any time, at the option of the holder, into Class A Common Stock as is determined by dividing the then-original issue price, as adjusted, for such share of preferred stock by the conversion price, as adjusted, in effect on the date the certificate is surrendered for conversion (“Conversion Price”).
The Conversion Prices of Series A and Series B Convertible Preferred Stock as of September 30, 2020 and December 31, 2019 are as follows:
Conversion Price | ||||
Series A | $ | 0.748 | ||
Series B | $ | 4.702 | ||
Additionally, all outstanding shares of the Series A Convertible Preferred Stock and Series B Convertible Preferred Stock shall automatically be converted into shares of underlying Class A Common Stock upon either (a) the Company’s sale of its Common Stock in a firm commitment underwritten public offering pursuant to a registration statement under the Securities Act, which results in aggregate cash proceeds to the Company of not less than $50,000,000, net of underwriting discounts and commissions (a “Qualified IPO”); or (b) the date, or upon the occurrence of an event, specified by vote or written consent of the holders of a majority of the then outstanding shares of Convertible Preferred Stock, voting together as a single class on
an as-converted basis.
Voting Rights
Holders of Series A Convertible Preferred Stock and Series B Convertible Preferred Stock are entitled to the same voting rights as the Common Stockholders and to notice of stockholders’ meeting. The holders of Common Stock, Founders Convertible Preferred, Series A Convertible Preferred Stock and Series B Convertible Preferred Stock shall vote together as a single class (on
an as-converted basis)
on all matters. Each holder of Series A Convertible Preferred Stock and Series B Convertible Preferred Stock is entitled to the number of votes equal to the number of shares of Class A Common Stock into which such shares of Preferred Stock could be converted.Each of the Series A and Series B Convertible Preferred Stock is conditionally puttable by the holders upon a “deemed liquidation event,” which includes a merger, consolidation, reorganization or recapitalization in which a subsidiary of the Company is a constituent party and the Company issues shares of its capital stock pursuant to such transaction, or a sale of substantially all of the Company’s assets. A “deemed liquidation event” is not solely within
F-17
the control of the Company given holders of the Series A Convertible Preferred Stock have representation on the Company’s board of directors. As such, the Series A and Series B Convertible Preferred Stock is classified as temporary equity. Any discount to liquidation preference of the Series A and Series B Convertible Preferred Stock is not being accreted as a deemed dividend, as at September 30, 2020, it is not currently probable that the Series A and Series B Convertible Preferred Stock will become redeemable. Subsequent adjustments to increase the carrying values to the ultimate redemption values will be made only when it becomes probable that such a liquidation event will occur.
12. Convertible equity security
On July 7, 2020, the Company issued an investor a convertible security (the “Security”) in the amount of $50.0 million. The Security is classified as a SAFE agreement (Simple Agreement for Future Equity). The Security is automatically convertible into shares of capital stock of the combined entity upon the closing of a transaction with a special purpose acquisition company at a conversion price equal to 85% of the price per share upon consummation of such transaction (a “SPAC Transaction”). In the event the SPAC Transaction contemplated at the time of entering into the transaction terminates or does not occur by December 31, 2020, the Security is automatically convertible into a newly created Series C Convertible preferred stock at price per share equal to $1.4 billion divided by the number of shares of capital stock of the Company (on
an as-converted basis)
then issued and outstanding, assuming exercise and/or conversion of all outstanding options, warrants and other convertible securities. The Security had no interest rate or maturity date and the SAFE investor had no voting right prior to conversion. The Security was recorded as a liability of $50 million and $79 million at issuance and as of September 30, 2020, respectively.13. Stockholders’ Deficit
Common Stock
As of September 30, 2020 and December 31, 2019, the Company is authorized to issue 150,000,000 shares of Class A Common Stock and 40,000,000 shares of Class B Common Stock. Both classes of common stock qualify and share equally in dividends, if declared by the Company’s Board of Directors. In the event of liquidation, dissolution, distribution of assets
or winding-up of
the Company, the holders of both classes of common stock have equal rights to receive all the assets of the Company, after rights of the holders of the preferred stock, if any, have been satisfied.Class A Common Stock
Holders of Class A Common Stock are entitled to one vote per share on matters to be voted upon by stockholders. Holders of Class A Common Stock have no preemptive rights to subscribe for or to purchase any additional shares of Class A Common Stock or other obligations convertible into shares of Class A Common Stock which the Company may issue in the future.
All of the outstanding shares of Class A Common Stock are fully paid
and non-assessable. Holders
of Class A Common Stock are not liable for further calls or assessments.Class B Common Stock
Holders of Class B Common Stock are entitled to ten votes per share on matters to be voted upon by stockholders.
Holders of the Class B Common Stock may, at any time, convert their Class B Common Stock into one share of Class A Common Stock.
F-18
Founders Convertible Preferred Stock
As of September 30, 2020 and December 31, 2019, the Company is authorized to issue 10,000,000 shares of Founders Convertible Preferred Stock with a par value of $0.00001, of which 10,000,000 shares are issued and outstanding.
Holders of Founders Convertible Preferred Stock are entitled to ten votes for each share of Class A Common Stock into which such Founders Convertible Preferred Stock could be then directly converted.
Founders Convertible Preferred Stock are convertible at any time, at the option of the holder, into Class A Common Stock as is determined by dividing $0.10, as adjusted, for such share of preferred stock by the conversion price, as adjusted, in effect on the date the certificate is surrendered for conversion.
Additionally, all outstanding shares of the Founders Convertible Preferred Stock shall automatically be converted (i) upon any transfer, as defined, into Class A Common Stock (ii) upon any exempt transfer, as defined, into Class B Common Stock (iii) into Class A Common Stock upon the earlier of (a) the Company’s sale of its Common Stock in a public offering pursuant to a registration statement under the Securities Act which results in aggregate cash proceeds to the Company of not less than $50,000,000, net of underwriting discounts and commissions (a “Qualified IPO”); or (b) the date, or upon the occurrence of an event, specified by vote or written consent of the holders of a majority of the then outstanding shares of Founders Convertible Preferred Stock, voting together as a single class on
an as-converted basis.
14. Loss Per Share
Founders Convertible Preferred Stock are participating securities as the Founders Convertible Preferred Stock participates in undistributed earnings on
an as-if converted
basis. The Company computes earnings (loss) per share of Class A Common Stock and Class B Common Stock usingthe two-class method
required for participating securities. Basic and diluted earnings per share was the same for each period presented as the inclusion of all potential Class A Common Stock and Class B Common Stock outstanding would have been anti-dilutive. The Company excluded the convertible equity security from the calculation of earnings per share as it is considered a contingently issuable share. For more information regarding the convertible equity security and the conversion terms, refer to Note 12. Basic and diluted earnings per share are the same for each class of common stock because they are entitled to the same liquidation and dividend rights. The following table sets forth the computation of basic and diluted loss per Class A Common Stock and Class B Common Stock:Nine months ended September 30, | ||||||||
2020 | 2019 | |||||||
Numerator: | ||||||||
Net loss attributable to common stockholders | $ | (42,603,502 | ) | $ | (7,861,867 | ) | ||
Denominator: | ||||||||
Weighted average Class A common shares outstanding | 94,754 | 51,837 | ||||||
Weighted average Class B common shares outstanding | 38,727,340 | 38,727,340 | ||||||
Weighted average Class A and Class B common shares outstanding- Basic | 38,822,094 | 38,779,177 | ||||||
Dilutive effect of potential common shares | — | — | ||||||
Weighted average Class A and Class B common shares outstanding- Diluted | 38,822,094 | 38,779,177 | ||||||
Net loss per share attributable to Class A and Class B Common stockholders- Basic | $ | (1.10 | ) | $ | (0.20 | ) | ||
Net loss per shares attributable to Class A and Class B Common stockholders- Diluted | $ | (1.10 | ) | $ | (0.20 | ) | ||
F-19
The following table presents the potential common shares outstanding that were excluded from the computation of diluted net loss per share of common stock as of the periods presented because including them would have been antidilutive:
Nine months ended September 30, | ||||||||
2020 | 2019 | |||||||
Series A Preferred Stock | 6,252,530 | 6,252,530 | ||||||
Series B Preferred Stock | 1,386,370 | 1,386,370 | ||||||
Founder Preferred Stock | 10,000,000 | 10,000,000 | ||||||
Bridge notes | 2,189,725 | 288,110 | ||||||
Stock Options | 6,965,679 | 6,410,615 | ||||||
Convertible equity security | 2,269,397 | — | ||||||
Total | 29,063,701 | 24,337,625 | ||||||
15. Stock Based Compensation
The Company maintains the 2016 Stock Plan (the “Plan”). The Plan is a stock-based compensation plan which provides for the grants of options and restricted stock to employees and consultants of the Company. Options granted under the Plan may be either incentive options (“ISO”) or nonqualified stock options (“NSO”). The maximum aggregate number of shares of the Company’s Class A Common Stock that may be issued under the Plan is 8,823,530 shares (subject to adjustments upon changes in capitalization, merger or certain other transactions).
Options under the Plan may be granted at prices as determined by the Board of Directors, provided, however, that (i) the exercise price of an ISO and NSO shall not be less than 100% of the estimated fair value of the shares on the date of grant, and (ii) the exercise price of an ISO granted to a 10% stockholder shall not be less than 110% of the estimated fair value of the shares on the date of grant. The fair value of the shares is determined by the Board of Directors on the date of grants. Stock options generally have a contractual life of 10 years.
In 2016 and 2017, the Company’s founders were granted an aggregate of 5,882,360 options which are fully vested. Options granted to other employees and consultants become vested and are exercisable over a range of up to six years from the date of grant.
The following table summarizes option activity under the Plan:
Shares available for Grant | Options | Weighted average exercise price | Weighted average contractual term (in years) | |||||||||||||
Balance as of December 31, 2019 | 2,335,588 | 6,410,311 | $ | 0.24 | 7.2 | |||||||||||
Granted | (726,450 | ) | 726,450 | 9.89 | ||||||||||||
Exercised | — | (54,115 | ) | 1.53 | ||||||||||||
Forfeited | 116,967 | (116,967 | ) | 6.37 | ||||||||||||
Balance as of September 30, 2020 | 1,726,105 | 6,965,679 | $ | 1.14 | 6.8 | |||||||||||
F-20
Additional information regarding stock options exercisable as of September 30, 2020 is summarized below:
Options Exercisable at September 30, 2020 | ||||||||||||
Range of Exercise Price | Number | Weighted average exercise price | Weighted average contractual term (in years) | |||||||||
$0.152 - $17.50 | 6,073,077 | $ | 0.198 | 6.4 | ||||||||
The aggregate intrinsic value represents the total pretax intrinsic value (i.e., the difference between the fair value of the Company’s common stock price and the exercise price, multiplied by the numberthat would have been received by the option holders had all option holders exercised their options. The aggregate intrinsic value of options outstanding as of September 30, 2020 was $114.0 million. The intrinsic value of options exercisable was $105.1 million as of September 30, 2020. The total intrinsic value of options exercised was $0.9 million for the nine months ended September 30, 2020.
of in-the-money options)
The weighted-average grant date fair value per share for the stock option grants during the nine months ended September 30, 2020 was $7.31. As of September 30, 2020, the total unrecognized compensation related to unvested stock option awards granted was $4.8 million, which the Company expects to recognize over a weighted-average period of approximately 1.9 years.
The fair value of each stock option grant under the Plan was estimated on the date of grant using the Black-Scholes option pricing model, with the following weighted-average assumptions:
Nine months ended September 30, | ||||||||
2020 | 2019 | |||||||
Expected term (in years) | 6.1 | 6.4 | ||||||
Volatility | 89.7 | % | 83.1 | % | ||||
Dividend yield | 0 | % | 0.0 | % | ||||
Risk-free interest rate | 0.5 | % | 2.1 | % | ||||
Common stock price | $ | 9.89 | $ | 2.88 | ||||
The Black-Scholes option pricing model requires various highly subjective assumptions that represent management’s best estimates of the fair value of the Company’s common stock, volatility, risk-free interest rates, expected term, and dividend yield. Given the absence of an active market for the Company’s common stock, the Company determines its common stock value generally using the market approach valuation methods. The valuation results are reviewed and approved by the Company’s board of directors.
The expected term represents the weighted-average period that options granted are expected to be outstanding giving consideration to vesting schedules. Since the Company does not have an extended history of actual exercises, the Company has estimated the expected term using a simplified method which calculates the expected term as the average ofthe contractual life of the awards. The Company has never declared or paid cash dividends and does not plan to pay cash dividends in the foreseeable future; therefore, the Company used an expected dividend yield of zero. The risk-free interest rate is based on U.S. Treasury rates in effect during the expected term of the grant. The expected volatility is based on historical volatility of publicly-traded peer companies.
the time-to-vesting and
F-21
Stock-based compensation expense for the nine months ended September 30, 2020 and 2019 is as follows:
Nine months ended September 30, | ||||||||
2020 | 2019 | |||||||
General and administrative expense | $ | 177,661 | $ | 22,548 | ||||
Research and development | 156,350 | 21,067 | ||||||
Total | $ | 334,011 | $ | 43,615 | ||||
16. Income Taxes
On March 27, 2020, the U.S. President signed into law the CARES Act, an economic stimulus package in response to
the COVID-19 global
pandemic. The CARES Act contains several corporate income tax provisions, including making remaining alternative minimum tax credits immediately refundable; providinga 5-year carryback
of net operating loss carryforwards (“NOLs”) generated in tax years 2018, 2019, and 2020, and removing the 80% taxable income limitation on utilization of those NOLs if carried back to prior tax years or utilized in tax years beginning before 2021; and temporarily liberalizing the interest deductibility rules under Section 163(j) of the Tax Cuts and Jobs Act, by raising the adjusted taxable income limitation from 30% to 50% for tax years 2019 and 2020 and giving taxpayers the election of using 2019 adjusted taxable income for purposes of computing 2020 interest deductibility. The Company is still evaluating the impact but does not currently expect the provisions of the CARES Act to have a material effect on the realizability of deferred income tax assets or tax expense. There is no material impact for the nine months ended September 30, 2020. As additional guidance is released, the Company will evaluate whether there would need to be a change in the period when such guidance is issued.As of September 30, 2020, there were no material changes to either the nature or the amounts of the uncertain tax positions previously determined for the year ended December 31, 2019.
17. Related Party Transactions
In July 2019 and in June 2020, the Company entered into bridge note payables with Roderick K. Randall, a member of the Company’s Board of Directors, for the principal sum of $100,000 and $220,000, respectively. As of September 30, 2020, the bridge notes with an aggregate principal balance of $320,000 are outstanding and the accrued interest balance of the notes is $8,885. As of December 31, 2019, the principal balance of $100,000 is outstanding and the accrued interest balance of the notes is $2,068.
As described in Note 9, in connection with the Company formation in September 2016, HF Holdco LLC, an entity controlled by Mr. Fisker and Dr. Gupta advanced the Company $250,000 in the form of a demand note. In May 2020, in satisfaction of the advances made by HF Holdco LLC, the Company issued a bridge note payable to HF Holdco LLC with the principal sum of $250,000.
In February 2020, the Company temporarily suspended the disbursement of cash compensation to Mr. Fisker and Dr. Gupta. In March 2020, the Company also temporarily furloughed employees and reduced the cash compensation disbursed to such employees. During the nine months ended September 30, 2020, the Company repaid accrued compensation of $33,280 to Mr. Fisker and Dr. Gupta and $88,866 for furloughed employee compensation.
F-22
18. Commitments and Contingencies
The Company is not a party to any material legal proceedings and is not aware of any pending or threatened claims. From time to time however, the Company may be subject to various legal proceedings and claims that arise in the ordinary course of its business activities.
Beginning in early March 2020,
the COVID-19 pandemic
and the measures imposed to contain this pandemic have disrupted and are expected to continue to impact the Company’s business. The magnitude of the impact ofthe COVID-19 pandemic
on the Company’s productivity, results of operations and financial position, and its disruption to the Company’s business and vehicle development and timelines, will depend, in part, on the length and severity of these restrictions and on the Company’s ability to conduct business in the ordinary course.19. Subsequent Events
The Company has completed an evaluation of all subsequent events through November 4, 2020, which is the date the condensed consolidated financial statements were available to be issued, to ensure that these condensed consolidated financial statements include appropriate disclosure of events both recognized in the condensed consolidated financial statements and events which occurred but were not recognized in the condensed consolidated financial statements. Except as described below, the Company has concluded that no subsequent event has occurred that requires disclosure.
In October 2020, the Company entered into a
forty-two
month sublease agreement with annual escalating rental payments for its first dedicated engineering and technology center, to be located in the Mission District of San Francisco, California. This facility will be the development center for the Company’s software and vehicle electronics. Also, the Company entered into a lease agreement for its new headquarters in the city of Manhattan Beach, California with more than 73,000 square feet of space. The lease includes an option to extend the lease term an additional 60 months at the end of the initial 66 month rental period. Rental payments escalate each annual period. The Company will measure and recognize the right of use assets and lease liabilities during the fourth quarter of 2020.On October 14, 2020, Fisker and Spartan entered into a Cooperation Agreement with Magna International Inc. (“Magna”) setting forth certain terms for the development of a full electric vehicle (the “Cooperation Agreement”). The Cooperation Agreement sets out the main terms and conditions of the upcoming operational phase agreements (the “Operational Phase Agreements”) that will extend from the Cooperation Agreement and other agreements with Magna (or its affiliates) that are expected to be entered into by and between Fisker and Magna (or its affiliates). The upcoming Operational Phase Agreements referenced in the Cooperation Agreement relate to various platform and manufacturing agreements. The Cooperation Agreement provides that New Fisker (as defined below) will issue to Magna (or to an affiliate of Magna designated by Magna) warrants to purchase Class A Common Stock in an amount equal to six percent (6%) of the capital stock of New Fisker on a fully diluted basis (which means for these purposes, after giving effect to the deemed conversion or exercise of all options, warrants and other convertible securities of New Fisker outstanding on the issuance date; provided, however, that the “public warrants” sold as part of the units issued by Spartan in its IPO which closed on August 14, 2018 shall not be deemed to be exercised for these purposes) after giving effect to the Merger and issuance of the warrants to purchase such shares to Magna, with an exercise price of $0.01 per share of (the “Magna Warrants”). The Magna Warrants are subject to vesting upon the achievement of certain milestones as set forth in the Cooperation Agreement. Additionally, the shares of Class A Common Stock underlying the Magna Warrants will be entitled to registration rights under the A&R Registration Rights Agreement being entered into in connection with the consummation of the Business Combination and Magna will enter into a
lock-up
agreement on the same terms as the other investors in Fisker.On October 28, 2020, the stockholders of Spartan, a Delaware corporation approved the Merger, by and among Spartan, Fisker, Merger Sub and certain other parties thereto, pursuant to which Merger Sub merged with and into Fisker, with Fisker surviving the merger (the “Fisker Merger”) and the stockholders of Fisker received shares of Class A common stock and two stockholders of Fisker also received shares of Class B Common Stock of New Fisker. Fisker is now a wholly-owned subsidiary of Spartan, which was renamed “Fisker, Inc.” and is referred to herein as “New Fisker.” The Fisker Merger resulted in the Company receiving $977.6 million in gross proceeds on October 29, 2020.
Under the term of the Fisker Merger, 46,838,585 shares of Class A Common Stock will be issued to the Historical Rollover Stockholders in the Business Combination in exchange for all outstanding shares of Fisker Class A Common Stock, or reserved for issuance in respect of New Fisker options issued in exchange for outstanding
pre-merger
Fisker Options, assuming that certain provisions of the Merger do not result in an upward adjustment (including for Closing Cash (as defined in the Business Combination Agreement) of Fisker) to the number of such shares at Closing (including 941,518 shares of Class A Common Stock issued to HF Holdco and 15,882,711 shares of Class A Common Stock underlying options to purchase Class A Common Stock held by Henrik Fisker and Dr.F-23
Geeta Gupta). In addition, in connection with the Closing, New Fisker will implement a dual class stock structure comprised of Class A Common Stock, which will carry one vote per share, and Class B Common Stock, which will carry 10 votes per share. At the Closing, 132,354,128 shares of Class B Common Stock will be issued to Henrik Fisker and Dr. Geeta Gupta in the Merger in exchange for all outstanding shares of Fisker Class B Common Stock and Fisker Founders Stock.
Upon the Closing, the conversion feature upon a business combination was triggered for the Bridge Notes and the convertible equity security as described in Note 10 and Note 12, respectively, causing a conversion of the $10.0 million outstanding principal amount of these Bridge Notes and $50.0 million outstanding principal of the convertible equity security and any unpaid accrued interest in equity securities at a specified price. The noteholders and convertible equity security holder received 1,361, 268 and 5,882,352 shares of Class A Common Stock in New Fisker, respectively, as result of the conversion.
New Fisker has adopted a dual class stock structure comparable to the one in effect at Fisker as of immediately prior to the Closing, comprised of Class A Common Stock, which carries one vote per share, and Class B Common Stock, which carries 10 votes per share. All stockholders of New Fisker only hold shares of New Fisker Class A Common Stock, except for Mr. Fisker and Dr. Gupta, who hold shares of New Fisker Class A Common Stock and shares of New Fisker Class B Common Stock.
The Merger is expected to be accounted for as a reverse recapitalization, in accordance with GAAP. Under this method of accounting, Spartan is expected to be treated as the “acquired” company for financial reporting purposes. Accordingly, the Fisker Merger is expected to be treated as the equivalent of Fisker issuing stock for the net assets of Spartan, accompanied by a recapitalization. The net assets of Spartan will be stated at historical cost, with no goodwill or other intangible assets recorded. Operations prior to the Business Combination will be those of Fisker.
F-24
Report of Independent Registered Public Accounting Firm
To the stockholders and the Board of Directors of Fisker Inc.:
Opinion on the Financial Statements
We have audited the accompanying consolidated balance sheets of Fisker Inc. and subsidiaries (the “Company”) as of December 31, 2019 and 2018, the related consolidated statements of operations, temporary equity and stockholders’ deficit, and cash flows, for each of the two years in the period ended December 31, 2019, and the related notes (collectively referred to as the “financial statements”). In our opinion, the financial statements present fairly, in all material respects, the financial position of the Company as of December 31, 2019 and 2018, and the results of its operations and its cash flows for each of the two years in the period ended December 31, 2019 in conformity with accounting principles generally accepted in the United States of America.
Going Concern
The accompanying financial statements have been prepared assuming that the Company will continue as a going concern. As discussed in Note 1 to the financial statements, the Company has suffered recurring losses from operations. The Company has stated that substantial doubt exists about its ability to continue as a going concern. Management’s evaluation of the events and conditions and management’s plans regarding these matters are also described in Note 1. The financial statements do not include any adjustments that might result from the outcome of this uncertainty.
Basis for Opinion
These financial statements are the responsibility of the Company’s management. Our responsibility is to express an opinion on the Company’s financial statements based on our audits. We are a public accounting firm registered with the Public Company Accounting Oversight Board (United States) (PCAOB) and are required to be independent with respect to the Company in accordance with the U.S. federal securities laws and the applicable rules and regulations of the Securities and Exchange Commission and the PCAOB.
We conducted our audits in accordance with the standards of the PCAOB and in accordance with auditing standards generally accepted in the United States of America. Those standards require that we plan and perform the audit to obtain reasonable assurance about whether the financial statements are free of material misstatement, whether due to error or fraud. The Company is not required to have, nor were we engaged to perform, an audit of its internal control over financial reporting. As part of our audits, we are required to obtain an understanding of internal control over financial reporting but not for the purpose of expressing an opinion on the effectiveness of the Company’s internal control over financial reporting. Accordingly, we express no such opinion.
Our audits included performing procedures to assess the risks of material misstatement of the financial statements, whether due to error or fraud, and performing procedures that respond to those risks. Such procedures included examining, on a test basis, evidence regarding the amounts and disclosures in the financial statements. Our audits also included evaluating the accounting principles used and significant estimates made by management, as well as evaluating the overall presentation of the financial statements. We believe that our audits provide a reasonable basis for our opinion.
/s/ Deloitte & Touche LLP
Los Angeles, California
August 7, 2020
We have served as the Company’s auditor since 2020.
F-25
Fisker Inc. and Subsidiaries
Consolidated Balance Sheets
As of December 31, | ||||||||
2019 | 2018 | |||||||
ASSETS | ||||||||
Current assets: | ||||||||
Cash and cash equivalents | $ | 1,858,093 | $ | 5,545,663 | ||||
Prepaid expenses and other current assets | 18,401 | 29,549 | ||||||
Total current assets | 1,876,494 | 5,575,212 | ||||||
Non-current assets: | ||||||||
Property and equipment, net | 65,261 | 76,090 | ||||||
Right-of-use | 134,672 | — | ||||||
Total non-current assets | 199,933 | 76,090 | ||||||
TOTAL ASSETS | $ | 2,076,427 | $ | 5,651,302 | ||||
LIABILITIES, TEMPORARY EQUITY AND STOCKHOLDERS’ DEFICIT | ||||||||
Current liabilities: | ||||||||
Accounts payable | $ | 2,134,696 | $ | 172,014 | ||||
Accrued expenses | 927,516 | 198,808 | ||||||
Founders demand note payable | 250,000 | 250,000 | ||||||
Lease liabilities | 143,599 | — | ||||||
Total current liabilities | 3,455,811 | 620,822 | ||||||
Non-current liabilities: | ||||||||
Customer deposits | 945,812 | 358,000 | ||||||
Bridge notes payable | 3,797,200 | — | ||||||
Other long-term liabilities | — | 8,927 | ||||||
Total non-current liabilities | 4,743,012 | 366,927 | ||||||
Total liabilities | 8,198,823 | 987,749 | ||||||
COMMITMENTS AND CONTINGENCIES (Note 16) | ||||||||
Temporary equity: | ||||||||
Series A Convertible Preferred stock, $0.00001 par value; 6,252,530 shares authorized, issued and outstanding as of December 31, 2019 and 2018 (liquidation value of $4,676,892 as of December 31, 2019 and 2018) | 4,634,416 | 4,634,416 | ||||||
Series B Convertible Preferred stock, $0.00001 par value; 2,126,750 shares authorized, 1,386,370 shares issued and outstanding as of December 31, 2019 and 2018 (liquidation value of $6,518,712 as of December 31, 2019 and 2018) | 6,386,267 | 6,386,267 | ||||||
Stockholders’ deficit: | ||||||||
Founders Convertible Preferred stock, $0.00001 par value; 10,000,000 shares authorized, issued and outstanding as of December 31, 2019 and 2018 | 100 | 100 | ||||||
Class A Common stock, $0.00001 par value; 150,000,000 shares authorized; 77,631 and 34,272 shares issued and outstanding as of December 31, 2019 and 2018, respectively | — | — | ||||||
Class B Common stock, $0.00001 par value; 40,000,000 shares authorized; 38,727,340 shares issued and outstanding as of December 31, 2019 and 2018 | 387 | 387 | ||||||
Additional paid-in capital | 756,479 | 663,678 | ||||||
Accumulated deficit | (17,900,045 | ) | (7,021,295 | ) | ||||
Total stockholders’ deficit | (17,143,079 | ) | (6,357,130 | ) | ||||
TOTAL LIABILITIES, TEMPORARY EQUITY AND STOCKHOLDERS’ DEFICIT | $ | 2,076,427 | $ | 5,651,302 | ||||
The accompanying notes are an integral part of these consolidated financial statements.
F-26
Fisker Inc. and Subsidiaries
Consolidated Statements of Operations
Year Ended December 31, | ||||||||
2019 | 2018 | |||||||
Operating costs and expenses: | ||||||||
General and administrative | $ | 3,625,833 | $ | 1,475,613 | ||||
Research and development | 6,961,981 | 1,938,871 | ||||||
Total operating costs and expenses | 10,587,814 | 3,414,484 | ||||||
Loss from operations | (10,587,814 | ) | (3,414,484 | ) | ||||
Other income (expense): | ||||||||
Other income (expense) | 575 | (21,000 | ) | |||||
Interest income | 8,503 | 7,427 | ||||||
Interest expense | (177,997 | ) | (1,590 | ) | ||||
Change in fair value of embedded derivative | (79,751 | ) | — | |||||
Foreign currency gain (loss) | (42,266 | ) | (1,298 | ) | ||||
Total other income (expense) | (290,936 | ) | (16,461 | ) | ||||
Net loss | $ | (10,878,750 | ) | $ | (3,430,945 | ) | ||
Deemed dividend attributable to preferred stock | — | $ | (1,222,368 | ) | ||||
Net loss attributable to common shareholders | $ | (10,878,750 | ) | $ | (4,653,313 | ) | ||
Net loss per common share | ||||||||
Net loss per share attributable to Class A and Class B Common shareholders- Basic and Diluted | $ | (0.28 | ) | $ | (0.12 | ) | ||
Weighted average shares outstanding | ||||||||
Weighted average Class A and Class B Common shares outstanding- Basic and Diluted | 38,784,479 | 38,747,380 | ||||||
The accompanying notes are an integral part of these consolidated financial statements.
F-27
Fisker Inc. and Subsidiaries
Consolidated Statements of Temporary Equity and Stockholders’ Deficit
Series A Convertible Preferred | Series B Convertible Preferred | Founders Convertible Preferred | Class A Common Stock | Class B Common Stock | Additional Paid-in Capital | Accumulated Deficit | Total Stockholders’ Deficit | |||||||||||||||||||||||||||||||||||||||||||||
Shares | Amount | Shares | Amount | Shares | Amount | Shares | Amount | Shares | Amount | |||||||||||||||||||||||||||||||||||||||||||
Balance at January 1, 2018 | 4,614,850 | $ | 3,412,048 | — | $ | — | 10,000,000 | $ | 100 | — | $ | — | 38,727,340 | $ | 387 | $ | 598,104 | $ | (3,590,350 | ) | $ | (2,991,759 | ) | |||||||||||||||||||||||||||||
Stock-based compensation | — | — | — | — | — | — | — | — | — | — | 60,141 | — | 60,141 | |||||||||||||||||||||||||||||||||||||||
Exercise of stock options | — | — | — | — | — | — | 34,272 | — | — | — | 5,433 | — | 5,433 | |||||||||||||||||||||||||||||||||||||||
Issuance of Series A Convertible Preferred stock, net of issuance costs | 1,637,680 | 1,222,368 | — | — | — | — | — | — | — | — | — | — | — | |||||||||||||||||||||||||||||||||||||||
Allocation of Series A Convertible Preferred stock to beneficial conversion feature | — | (1,222,368 | ) | — | — | — | — | — | — | — | — | 1,222,368 | — | 1,222,368 | ||||||||||||||||||||||||||||||||||||||
Deemed dividend on Series A Convertible Preferred stock | — | 1,222,368 | — | — | — | — | — | — | — | — | (1,222,368 | ) | — | (1,222,368 | ) | |||||||||||||||||||||||||||||||||||||
Issuance of Series B Convertible Preferred stock, net of issuance costs | — | — | 1,386,370 | 6,386,267 | — | — | — | — | — | — | — | — | — | |||||||||||||||||||||||||||||||||||||||
Net loss | — | — | — | — | — | — | — | — | — | — | — | (3,430,945 | ) | (3,430,945 | ) | |||||||||||||||||||||||||||||||||||||
Balance at December 31, 2018 | 6,252,530 | $ | 4,634,416 | 1,386,370 | 6,386,267 | 10,000,000 | $ | 100 | 34,272 | $ | — | 38,727,340 | $ | 387 | $ | 663,678 | $ | (7,021,295 | ) | $ | (6,357,130 | ) | ||||||||||||||||||||||||||||||
Stock-based compensation | — | — | — | — | — | — | — | — | — | — | 85,197 | — | 85,197 | |||||||||||||||||||||||||||||||||||||||
Exercise of stock options | — | — | — | — | — | — | 43,359 | — | — | — | 7,604 | — | 7,604 | |||||||||||||||||||||||||||||||||||||||
Net loss | — | — | — | — | — | — | — | — | — | — | — | (10,878,750 | ) | (10,878,750 | ) | |||||||||||||||||||||||||||||||||||||
Balance at December 31, 2019 | 6,252,530 | $ | 4,634,416 | 1,386,370 | $ | 6,386,267 | 10,000,000 | $ | 100 | 77,631 | $ | — | 38,727,340 | $ | 387 | $ | 756,479 | $ | (17,900,045 | ) | $ | (17,143,079 | ) | |||||||||||||||||||||||||||||
The accompanying notes are an integral part of these consolidated financial statements.
F-28
Fisker Inc. and Subsidiaries
Consolidated Statements of Cash Flows
Year Ended December 31, | ||||||||
2019 | 2018 | |||||||
Cash Flows from Operating Activities: | ||||||||
Net loss | $ | (10,878,750 | ) | $ | (3,430,945 | ) | ||
Reconciliation of net loss to net cash used in operating activities: | ||||||||
Stock-based compensation | 85,197 | 60,141 | ||||||
Depreciation and amortization | 24,719 | 16,732 | ||||||
Deferred rent | — | 13,594 | ||||||
Amortization of right-of-use | 130,228 | — | ||||||
Amortization of debt discount | 136,866 | — | ||||||
Change in fair value of embedded derivative | 79,751 | |||||||
Unrealized loss on foreign currency | 11,599 | — | ||||||
Changes in operating assets and liabilities: | ||||||||
Prepaid expenses and other current assets | 11,147 | (4,922 | ) | |||||
Accounts payable and accrued expenses | 2,686,501 | (228,027 | ) | |||||
Customer deposits | 587,812 | 156,000 | ||||||
Change in operating lease liability | (134,895 | ) | — | |||||
Net cash used in operating activities | (7,259,825 | ) | (3,417,427 | ) | ||||
Cash Flows from Investing Activities: | ||||||||
Purchase of property and equipment | (13,890 | ) | (48,247 | ) | ||||
Net cash used in investing activities | (13,890 | ) | (48,247 | ) | ||||
Cash Flows from Financing Activities: | ||||||||
Proceeds from the issuance of bridge notes | 3,578,541 | — | ||||||
Proceeds from the issuance of Series A Convertible Preferred shares, net of issuance costs | — | 1,222,368 | ||||||
Proceeds from the issuance of Series B Convertible Preferred shares, net of issuance costs | — | 6,386,267 | ||||||
Proceeds from the exercise of stock options | 7,604 | 5,433 | ||||||
Net cash provided by financing activities | 3,586,145 | 7,614,068 | ||||||
Net increase (decrease) in cash and cash equivalents | (3,687,570 | ) | 4,148,394 | |||||
Cash and cash equivalents, beginning of the period | 5,545,663 | 1,397,269 | ||||||
Cash and cash equivalents, end of the period | $ | 1,858,093 | $ | 5,545,663 | ||||
Supplemental disclosure of cash flow information | ||||||||
Cash paid for interest | $ | — | $ | — | ||||
Cash paid for income taxes | $ | — | $ | — | ||||
The accompanying notes are an integral part of these consolidated financial statements.
F-29
Fisker Inc. and Subsidiaries
Notes to Consolidated Financial Statements
1. Overview of the Company
Fisker Inc. (“Fisker” or the “Company”) was incorporated in the state of Delaware on September 21, 2016. The Company is currently designing and developing sustainable electric vehicles. The Company is currently accepting reservations for the Fisker Ocean.
In connection with its formation, the Company entered into stock purchase agreements with the Company’s founders, whereby the founders contributed certain IP (primarily trademarks) and interests in Platinum IPR LLC. Platinum IPR LLC is an entity solely owned by the Company’s founders, which held Fisker trademarks registered in a variety of jurisdictions around the world. The founders’ transfer of its interest in Platinum IPR LLC and the transfer of trademarks was accounted for as a transfer of assets between entities under common control. The carrying amount of the transferred assets is recorded based on the prior carrying value, which was de minimis.
In December 2018, the Company effected astock split of its outstanding common and preferred stock, and a proportional adjustment to the existing conversion ratios for each series of preferred stock was made at the time of the effectiveness of the reverse stock split. Accordingly, all share and per share amounts for all periods presented in these consolidated financial statements and notes thereto, have been adjusted retroactively, where applicable, to reflect this reverse stock split and adjustment of the preferred stock conversion ratio.
10-for-1
Going Concern, Liquidity and Capital Resources
The Company evaluated whether there are any conditions and events, considered in the aggregate, that raise substantial doubt about its ability to continue as a going concern over the next twelve months through August 2021. Since inception, the Company has incurred significant losses of approximately $17.9 million. As of December 31, 2019, the Company had approximately $1.9 million in cash and cash equivalents. The Company expects to continue to incur significant operating losses for the foreseeable future. The Company has historically funded its operations primarily through the sale of convertible debt and equity securities.
In order to proceed with the Company’s business plan, the Company will need to raise substantial additional funds through one or more of the following: issuance of additional debt, equity or both. Until such time, if ever, the Company can generate revenue sufficient to achieve profitability, the Company expects to finance its operations through equity or debt financings, which may not be available to the Company on the timing needed or on terms that the Company deems to be favorable. To the extent that the Company raises additional capital through the sale of equity or convertible debt securities, the ownership interest of its stockholders will be diluted, and the terms of these securities may include liquidation or other preferences that adversely affect the rights of common stockholders. Debt financing and preferred equity financing, if available, may involve agreements that include covenants limiting or restricting the Company’s ability to take specific actions, such as incurring additional debt, making acquisitions or capital expenditures or declaring dividends. If the Company is unable to obtain sufficient financial resources, its business, financial condition and results of operations will be materially and adversely affected. The Company may be required to delay, limit, reduce or terminate its product development activities or future commercialization efforts. There can be no assurance that the Company will be able to obtain the needed financing on acceptable terms or at all.
As a result, the Company has concluded that there is substantial doubt about its ability to continue as a going concern within one year after the date that the consolidated financial statements are issued.
The accompanying consolidated financial statements have been prepared assuming the Company will continue to operate as a going concern, which contemplates the realization of assets and settlement of liabilities in the normal
F-30
course of business, and do not include any adjustments to reflect the possible future effects on the recoverability and classification of assets or the amounts and classifications of liabilities that may result from uncertainty related to its ability to continue as a going concern.
2. Summary of Significant Accounting Policies
Basis of Presentation
The Company’s consolidated financial statements have been prepared in conformity with accounting principles generally accepted in the United States of America (“GAAP”) as determined by the Financial Accounting Standards Board (“FASB”) Accounting Standards Codification (“ASC”) and pursuant to the regulations of the U.S. Securities and Exchange Commission (“SEC”).
Use of Estimates
The preparation of the consolidated financial statements in conformity with GAAP required management to make estimates and assumptions that affect the reported amounts of assets and liabilities in the consolidated financial statements and accompanying notes. The Company bases these estimates on historical experience and on various other assumptions that it believes are reasonable under the circumstances, the results of which form the basis for making judgments about the carrying amounts of assets and liabilities that are not readily apparent from other sources. Actual results may differ materially from these estimates.
Principles of Consolidation
The consolidated financial statements include the accounts of Fisker Inc. and its wholly owned subsidiaries. All inter-company transactions and balances have been eliminated in consolidation.
Cash and Cash Equivalents
The Company considers all highly liquid investments purchased with original maturities of three months or less at acquisition to be cash equivalents. Cash and cash equivalents include cash held in banks and money market mutual funds.
Concentrations of Credit Risk and
Off-balance
Sheet RiskCash and cash equivalents are financial instruments that are potentially subject to concentrations of credit risk. The Company’s cash and cash equivalents are deposited in accounts at large financial institutions, and amounts may exceed federally insured limits. The Company believes it is not exposed to significant credit risk due to the financial strength of the depository institutions in which the cash and cash equivalents are held. The Company has no financial instruments with
off-balance
sheet risk of loss.Fair Value Measurements
The Company follows the accounting guidance in ASC 820 for its fair value measurements of financial assets and liabilities measured at fair value on a recurring basis. Fair value is defined as an exit price, representing the amount that would be received to sell an asset or paid to transfer a liability in an orderly transaction between market participants at the measurement date. As such, fair value is a market-based measurement that should be determined based on assumptions that market participants would use in pricing an asset or a liability.
The accounting guidance requires fair value measurements be classified and disclosed in one of the following three categories:
Level 1: Quoted prices in active markets for identical assets or liabilities.
F-31
Level 2: Observable inputs other than Level 1 prices, for similar assets or liabilities that are directly or indirectly observable in the marketplace.
Level 3: Unobservable inputs which are supported by little or no market activity and that are financial instruments whose values are determined using pricing models, discounted cash flow methodologies, or similar techniques, as well as instruments for which the determination of fair value requires significant judgment or estimation.
The fair value hierarchy also requires an entity to maximize the use of observable inputs and minimize the use of unobservable inputs when measuring fair value. Assets and liabilities measured at fair value are classified in their entirety based on the lowest level of input that is significant to the fair value measurement.
Property and Equipment
Property and equipment are stated at cost less accumulated depreciation and amortization. Depreciation and amortization is computed using the straight-line method over the estimated useful lives of the related assets as follows:
Useful Life (in years) | ||||
Leasehold improvements | 5 | |||
Furniture and fixtures | 5 | |||
Computer equipment | 3 | |||
Leasehold improvements are amortized on a straight-line basis over the shorter of their estimated useful lives or the term of the related lease. Upon retirement or sale, the cost and related accumulated depreciation are removed from the balance sheet and the resulting gain or loss is reflected in operations. Maintenance and repair expenditures are expensed as incurred, while major improvements that increase functionality of the asset are capitalized and depreciated ratably to expense over the identified useful life.
Long-lived assets primarily consist of property, plant and equipment, net and are reviewed for impairment whenever events or changes in circumstances indicate that the carrying amount of an asset may not be recoverable. If circumstances require a long-lived asset to be tested for possible impairment, the Company first compares undiscounted cash flows expected to be generated by that asset group to its carrying amount. The Company assesses impairment for asset groups, which represent a combination of assets that produce distinguishable cash flows. If the carrying amount of the asset group is not recoverable on an undiscounted cash flow basis, an impairment is recognized to the extent that the carrying amount exceeds its fair value. Fair value is determined through various valuation techniques, including discounted cash flow models, quoted market values, and third-party independent appraisals, as considered necessary. The Company has not recorded any impairment charges during the periods presented.
Leases
Effective January 1, 2019, the Company accounts for its leases under ASC 842,. Under this guidance, lessees classify arrangements meeting the definition of a lease as operating or financing leases, and leases are recorded on the consolidated balance sheet as both aasset and lease liability, calculated by discounting fixed lease payments over the lease term at the rate implicit in the lease or the Company’s incremental borrowing rate. Lease liabilities are increased by interest and reduced by payments each period, and the right of use asset is amortized over the lease term. For operating leases, interest on the lease liability and the amortization of theasset result in straight-line rent expense over the lease term. For finance leases, interest on the lease liability and the amortization of theasset results in front-loaded expense over the lease term. Variable lease expenses are recorded when incurred.
Leases
right-of-use
right-of-use
right-of-use
F-32
In calculating theasset and lease liability, the Company elects to combine lease and
right-of-use
non-lease
components for all classes of assets. The Company excludes short-term leases having initial terms of 12 months or less from the new guidance as an accounting policy election, and instead recognizes rent expense on a straight-line basis over the lease term.The Company continues to account for leases in the prior period financial statements under ASC 840.
Derivative Financial Instruments
The Company does not use derivative instruments to hedge exposures to interest rate, market, or foreign currency risks. The Company evaluates all of its financial instruments, including notes payable, to determine if such instruments are derivatives or contain features that qualify as embedded derivatives. Embedded derivatives must be separately measured from the host contract if all the requirements for bifurcation are met. The assessment of the conditions surrounding the bifurcation of embedded derivatives depends on the nature of the host contract. Bifurcated embedded derivatives are recognized at fair value, with changes in fair value recognized in the statement of operations each period. Bifurcated embedded derivatives are classified with the related host contract in the Company’s balance sheet.
From July 2019 to December 2019, the Company entered into note agreements that were determined to have embedded derivative instruments in the form of a contingent put option. The notes are recognized at the value of proceeds received after allocating issuance proceeds to the separable instruments issued with the notes and to the bifurcated contingent put option. The notes are subsequently measured at amortized cost using the effective interest method to accrete interest over their term to bring the notes’ initial carrying value to their principal balance at maturity. The bifurcated put option is initially measured at fair value which is included in the Bridge notes payable balance on the Consolidated Balance Sheets and subsequently measured at fair value with changes in fair value recognized as a component of Other income (expense) in the Consolidated Statements of Operations (see Note 9).
Segments
Operating segments are defined as components of an entity for which separate financial information is available and that is regularly reviewed by the Chief Operating Decision Maker (“CODM”) in deciding how to allocate resources to an individual segment and in assessing performance. The Company’s CODM is its Chief Executive Officer. The Company has determined that it operates in one operating segment and one reportable segment, as the CODM reviews financial information presented on a consolidated basis for purposes of making operating decisions, allocating resources, and evaluating financial performance.
Revenue Recognition
The Company recognizes revenue from contracts with customers in accordance with ASC 606,(“ASC 606”). The core principle of ASC 606 is that a company should recognize revenue to depict the transfer of promised goods or services to customers in an amount that reflects the consideration to which the company expects to be entitled in exchange for those goods or services. A good or service is transferred to a customer when, or as the customer obtains control of that good or service. The following five steps are applied to achieve that core principle:
Revenue from Contracts with Customers
| • | Step 1: Identify the contract with the customer |
| • | Step 2: Identify the performance obligation(s) in the contract |
| • | Step 3: Determine the transaction price |
| • | Step 4: Allocate the transaction price to the performance obligation(s) in the contract |
| • | Step 5: Recognize revenue when or as the company satisfies a performance obligation |
F-33
The Company’s customers may reserve a Fisker vehicle by making a deposit, which is refundable, and in certain instances, subject to a 10% administration and process fee in the event of cancellation. The Company has yet to deliver and recognize revenue related to the delivery of a vehicle.
Certain holders of the Company’s bridge notes were issued option agreements providing the holder with a
non-binding
right to receive a base model Fisker Ocean SUV within the first 12 months of production, subject to the terms and conditions. The proceeds received from these holders were allocated to the bridge notes and option agreements on a relative fair value basis, resulting in an initial discount to the bridge notes.See Note 7 for the balance of the Company’s customer reservation deposits.
Foreign Currency Remeasurement and Transactions
The functional currency of the Company’s U.K. subsidiary is the U.S. Dollar. For this subsidiary, monetary assets and liabilities denominated in non U.S. currencies are
re-measured
to U.S. Dollars using current exchange rates in effect at the balance sheet date.Non-monetary
assets and liabilities denominated innon-U.S.
currencies are maintained at historical U.S. Dollar exchange rates. Expenses arere-measured
at average U.S. Dollar monthly rates.Foreign currency transaction gains and losses are a result of the effect of exchange rate changes on transactions denominated in currencies other than the functional currency. Transaction gains and losses have not been significant for any periods presented.
Stock-based Compensation
The Company expenses stock-based compensation over the requisite service period based on the estimated grant-date fair value of the awards. The Company accounts for forfeitures as they occur.
Prior to the adoption of ASU
2018-07
on January 1, 2018, the Company remeasured the fair value ofnon-employee
awards at each reporting period prior to vesting and finally at the vesting date of the award. Changes in the estimated fair value of thesenon-employee
awards were recognized as compensation expense in the period of change. Subsequent to the adoption of ASU2018-07,
the Company recognizesnon-employee
compensation costs over the requisite service period based on a measurement of fair value for each stock award.From inception through December 31, 2019, the Company has primarily granted service based awards. Stock-based awards with graded-vesting schedules are recognized on a straight-line basis over the requisite service period. The Company estimates the fair value of stock option grants using the Black-Scholes option pricing model, and the assumptions used in calculating the fair value of stock-based awards represent management’s best estimates and involve inherent uncertainties and the application of management’s judgment. All stock-based compensation costs are recorded in general and administrative or research and development costs in the statements of operations based upon the underlying individual’s role at the Company.
Research and Development Costs
Research and development costs are expensed as incurred. Research and development expenses consist primarily of payroll, benefits and stock-based compensation of those employees engaged in research, design and development activities, costs related to design tools, protype development work, supplies and services, depreciation and other occupancy costs.
Advertising Expense
All advertising costs are expensed as incurred. For the years ended December 31, 2019 and 2018, advertising expense was $82,641 and $144,905, respectively.
F-34
Income Taxes
Income taxes are recorded in accordance with ASC 740, (“ASC 740”), which provides for deferred taxes using an asset and liability approach. The Company recognizes deferred tax assets and liabilities for the expected future tax consequences of events that have been included in the consolidated financial statements or tax returns. Deferred tax assets and liabilities are determined based on the difference between the consolidated financial statement and tax bases of assets and liabilities using enacted tax rates in effect for the year in which the differences are expected to reverse. Valuation allowances are provided, if based upon the weight of available evidence, it is more likely than not that some or all of the deferred tax assets will not be realized.
Income Taxes
The Company accounts for uncertain tax positions in accordance with the provisions of ASC 740. When uncertain tax positions exist, the Company recognizes the tax benefit of tax positions to the extent that the benefit would more likely than not be realized assuming examination by the taxing authority. The determination as to whether the tax benefit will more likely than not be realized is based upon the technical merits of the tax position as well as consideration of the available facts and circumstances. The Company recognizes any interest and penalties accrued related to unrecognized tax benefits as income tax expense.
Net Loss per Share of Common Stock
Basic net loss per share of common stock is calculated using the
two-class
method under which earnings are allocated to both common shares and participating securities. Undistributed net losses are allocated entirely to common shareholders since the participating security has no contractual obligation to share in the losses. Basic net loss per share is calculated by dividing the net loss attributable to common shares by the weighted-average number of shares of common stock outstanding for the period. The diluted net loss per share of common stock is computed by dividing the net loss using the weighted-average number of common shares and, if dilutive, potential common shares outstanding during the period. Potential common shares consist of stock options to purchase common stock (using the treasury stock method) and the conversion of convertible preferred stock and convertible notes payable (using theif-converted
method).Recently adopted accounting pronouncements
In May 2014, the FASB issued ASU, which was codified with its subsequent amendments as ASC 606. This guidance applies to any entity that either enters into contracts with customers to transfer goods or services or enters into contracts for the transfer of nonfinancial assets unless those contracts are within the scope of other standards. The core principle of this guidance is that an entity should recognize revenue to depict the transfer of promised goods or services to customers in an amount that reflects the consideration to which the entity expects to be entitled in exchange for those goods or services. This guidance supersedes existing revenue recognition guidance, including most industry-specific guidance, as well as certain related guidance on accounting for contract costs. The Company adopted ASC 606 on January 1, 2018 using the modified retrospective method. The adoption of this guidance did not have a material impact on the Company’s consolidated financial statements.
2014-09,
Revenue from Contracts with Customers
In June 2018, the FASB issued ASU, which simplifies the accounting for share-based payments granted to nonemployees for goods and services. Under the ASU, most of the guidance on such payments to nonemployees would be aligned with the requirements for share-based payments granted to employees. The changes take effect for public business entities for fiscal years starting after December 15, 2018, including interim periods within that fiscal year. For all other entities, the amendments are effective for fiscal years beginning after December 15, 2019, and interim periods within fiscal years beginning after December 15, 2020. Early adoption is permitted, but no earlier than an entity’s adoption date of ASC 606. The Company adopted ASU
2018-07,
Improvements to Nonemployee Share-Based Payment Accounting
2018-07
as of January 1, 2018. The adoption of this update did not have a material impact on the Company’s consolidated financial statements.In February 2016, the FASB issued ASU, which was codified with its subsequent amendments as ASC 842. ASC 842 requires a lessee to recognize a lease asset representing its right to use the underlying asset
2016-02,
Leases
F-35
for the lease term, and a lease liability for the payments to be made to lessor, on its balance sheet for all operating leases greater than 12 months. The Company adopted ASC 842 as of January 1, 2019, using the modified retrospective transition approach by recording aasset and lease liability for operating leases of $264,900 and $278,984, respectively, at that date; the Company did not have any finance lease assets and liabilities upon adoption or any arrangements where it acts as a lessor. Adoption of ASC 842 did not have an effect on the Company’s accumulated deficit. The Company availed itself of the practical expedients provided under ASC 842 regarding identification of leases, lease classification, indirect costs, and the combination of lease and
right-of-use
non-lease
components for all classes of assets. The Company continues to account for leases in the prior period financial statements under ASC 840.Recently issued accounting pronouncements
In December 2019, the FASB issued ASU, which is intended to simplify various aspects related to accounting for income taxes. ASU
No. 2019-12,
Income Taxes (Topic 740): Simplifying the Accounting for Income Taxes
No. 2019-12
removes certain exceptions to the general principles in ASC 740 and also clarifies and amends existing guidance to improve consistent application. This guidance is effective for fiscal years, and interim periods within those fiscal years, beginning after December 15, 2020, with early adoption permitted. The Company is currently evaluating the impact of this standard on its consolidated financial statements.3. Fair value measurements
The Company’s financial assets and liabilities subject to fair value measurements on a recurring basis and the level of inputs used for such measurements were as follows:
Fair Value Measured as of December 31, 2019 Using: | ||||||||||||||||
Level 1 | Level 2 | Level 3 | Total | |||||||||||||
Assets included in: | ||||||||||||||||
Money market funds included in cash and cash equivalents | $ | 1,731,455 | $ | — | $ | — | $ | 1,731,455 | ||||||||
Total fair value | $ | 1,731,455 | $ | — | $ | — | $ | 1,731,455 | ||||||||
Liabilities included in: | ||||||||||||||||
Embedded derivative in bridge notes | $ | — | $ | — | $ | 1,325,049 | $ | 1,325,049 | ||||||||
Total fair value | $ | — | $ | — | $ | 1,325,049 | $ | 1,325,049 | ||||||||
Fair Value Measured as of December 31, 2018 Using: | ||||||||||||||||
Level 1 | Level 2 | Level 3 | Total | |||||||||||||
Assets included in: | ||||||||||||||||
Money market funds included in cash and cash equivalents | $ | 5,055,517 | $ | — | $ | — | $ | 5,055,517 | ||||||||
Total fair value | $ | 5,055,517 | $ | — | $ | — | $ | 5,055,517 | ||||||||
The fair value of the Company’s money market funds is determined using quoted market prices in active markets for identical assets.
The carrying amounts included in the Consolidated Balance Sheets under Current assets approximate fair value because of the short maturity of these instruments.
The carrying amount of bridge notes approximate fair value due to management’s opinion that current rates and terms that would be available to the Company with the same maturity and security structure would be essentially
F-36
equivalent to that of the Company’s bridge notes. Certain features of the bridge notes were determined to be an embedded derivative requiring separate measurement from the loan host instrument.
The Company measures the embedded derivative liability at fair value based on significant inputs not observable in the market, which causes it to be classified as a Level 3 measurement within the fair value hierarchy. The valuation of the embedded derivative uses assumptions and estimates the Company believes would be made by a market participant in making the same valuation. The Company assess these assumptions and estimates on an
on-going
basis as additional data impacting the assumptions and estimates are obtained. Changes in the fair value of the embedded derivative related to updated assumptions and estimates are recognized within the Consolidated Statements of Operations.The embedded derivative liability may change significantly as additional data is obtained, impacting the Company’s assumptions regarding probabilities of outcomes used to estimate the fair value of the liability. In evaluating this information, considerable judgment is required to interpret the data used to develop the assumptions and estimates. The estimates of fair value may not be indicative of the amounts that could be realized in a current market exchange. Accordingly, the use of different market assumptions and/or different valuation techniques may have a material effect on the estimated fair value amounts, and such changes could materially impact the Company’s results of operations in future periods.
Level 3 Disclosures
The following table provides quantitative information associated with the fair value measurement of the Company’s Level 3 inputs:
Fair Value as of December 31, 2019 | Valuation Technique | Unobservable Input Description | Input | |||||
Embedded derivative in bridge notes | $1,325,049 | Probability-adjusted discounted cash flow | Probabilities of Completion of Next Equity Financing | 99% | ||||
Period in which outcomes are expected to be achieved | 0.5 years | |||||||
Discount rate | 11.5%-13.1% |
The fair value of the embedded derivative liability represents the fair value of the Company’s liability for all potential payments if the holders of the bridge notes elected to convert into cash or shares of common stock. The significant unobservable inputs used in the fair value measurement of the Company’s embedded derivative liability are the probabilities of the Company’s closing of the sale of capital stock on or prior to the bridge notes’ maturity dates, resulting in gross proceeds in excess of at least $20.0 million, (the “Completion of the Next Equity Financing”), which would trigger conversion of the embedded derivative liability, probabilities as to the periods in which the outcomes are expected to be achieved and a discount rate. Significant changes in any of the probabilities of the Completion of the Next Equity Financing would result in a significantly higher or lower fair value measurement, respectively. Significant changes in the probabilities as to the periods in which outcomes will be achieved would result in a significantly lower or higher fair value measurement, respectively.
F-37
The following table presents changes in Level 3 liabilities measured at fair value for the year ended December 31, 2019:
Embedded derivative in bridge notes | Total | |||||||
Balance, December 31, 2018 | $ | — | $ | — | ||||
Issuance of bridge notes | 1,245,298 | 1,245,298 | ||||||
Change in fair value | 79,751 | 79,751 | ||||||
Balance, December 31, 2019 | $ | 1,325,049 | $ | 1,325,049 | ||||
For the year ended December 31, 2019, the changes in the fair value of the embedded derivative liability resulted from an adjustment to the remaining period to the expected outcome. No other changes in valuation techniques or inputs occurred during the year ended December 31, 2019.
4
Property and Equipment, net
Property and equipment, net, consists of the following as of December 31, 2019 and 2018:
As of December 31, | ||||||||
2019 | 2018 | |||||||
Leasehold improvements | $ | 59,485 | $ | 48,355 | ||||
Furniture and fixtures | 45,377 | 45,376 | ||||||
Computer equipment | 11,662 | 8,903 | ||||||
Total property and equipment | 116,524 | 102,634 | ||||||
| Less: Accumulated depreciation and amortization | (51,263 | ) | (26,544 | ) | ||||
Property and equipment, net | $ | 65,261 | $ | 76,090 | ||||
Depreciation and amortization for the years ended December 31, 2019 and 2018 was $24,719 and $16,732, respectively.
5. Leases
The Company currently leases its headquarters space in the Los Angeles area under a single lease classified as an operating lease expiring on December 31, 2020. Fixed rent escalates each year, but the Company is not responsible for any portion of the landlord’s operating expenses. Under the lease, the Company has one
18-month
renewal option with specified fixed rent, which has not been included in the calculation of lease liabilities and right of use assets; at the adoption date, exercise of the option was not reasonably certain. This lease does not have any contingent rent payments, does not impose any financial restrictions, and does not contain residual value guarantees.The Company does not act as a lessor or have any leases classified as financing leases.
At December 31, 2019, the Company had operating lease liabilities of $143,599 andassets of $134,672, in the Consolidated Balance Sheet.
right-of-use
F-38
The tables below present information regarding the Company’s lease assets and liabilities:
As of December 31, | ||||
2019 | ||||
Assets: | ||||
Operating lease right-of-use | $ | 134,672 | ||
Liabilities: | ||||
Current | ||||
Operating | $ | 143,599 | ||
The components of lease related expense are as follows:
Year Ended December 31, | ||||
2019 | ||||
Lease costs: | ||||
Operating lease expense | $ | 137,173 | ||
Short-term lease expense | 11,550 | |||
Total lease costs | $ | 148,723 | ||
The components of supplemental cash flow information related to leases are as follows:
Year Ended December 31, | ||||
2019 | ||||
Cash flow information: | ||||
Cash paid for amounts included in the measurement of lease liabilities: | ||||
Operating cash flows from operating leases | $ | 141,840 | ||
Non-cash activity: | ||||
ROU asset obtained in exchange for lease obligations | $ | 264,900 | ||
Other Information | ||||
Weighted average remaining lease term (in years) | 1.00 | |||
Weighted average discount rate | 3.20 | % | ||
As of December 31, 2019, future minimum payments during the next five years and thereafter are as follows:
Operating | ||||
Leases | ||||
Year Ended December 31, 2020 | $ | 146,100 | ||
Year Ended December 31, 2021 | — | |||
Year Ended December 31, 2022 | — | |||
Year Ended December 31, 2023 | — | |||
Year Ended December 31, 2024 | — | |||
Thereafter | — | |||
Total | 146,100 | |||
Less present value discount | (2,501 | ) | ||
Operating lease liabilities | $ | 143,599 | ||
The Company’s lease agreement does not provide an implicit rate, so the Company used an estimated incremental borrowing rate, which was derived from third-party information available at the time the Company adopted ASC 842, in determining the present value of lease payments. The rate used is for a secured borrowing of a similar term as the lease.
F-39
Rent expense for the year ended December 31, 2018 was $151,170.
Future minimum lease payments on
non-cancellable
operating leases as of December 31, 2018 are as follows:Payments | ||||
Year Ended December 31, 2019 | $ | 141,840 | ||
Year Ended December 31, 2020 | 146,100 | |||
Year Ended December 31, 2021 | — | |||
Year Ended December 31, 2022 | — | |||
Year Ended December 31, 2023 | — | |||
Thereafter | — | |||
$287,940 | ||||
6. Accrued Expenses
A summary of the components of accrued expenses is as follows:
As of December 31, | ||||||||
2019 | 2018 | |||||||
Accrued payroll | 84,726 | 81,672 | ||||||
Accrued professional fees | 39,396 | 44,215 | ||||||
Accrued research and development | 9,853 | — | ||||||
Accrued other | 1,236 | 66,822 | ||||||
Accrued interest | 42,305 | 1,432 | ||||||
Accrued legal settlement | 750,000 | — | ||||||
Deferred rent | — | 4,667 | ||||||
Total accrued expenses | $ | 927,516 | $ | 198,808 | ||||
7. Customer Deposits
Customer deposits consists of the following as of December 31, 2019 and 2018:
As of December 31, | ||||||||
2019 | 2018 | |||||||
Customer reservation deposits | $ | 466,500 | $ | 358,000 | ||||
Customer SUV option | 479,312 | — | ||||||
Total customer deposits | $ | 945,812 | $ | 358,000 | ||||
8. Founders Demand Note
In connection with the Company formation in September 2016, HF Holdco LLC, an entity controlled by the Company’s Chief Executive Officer, and founder, and the Company’s Chief Financial Officer, and founder, advanced the Company $250,000 in the form of a demand note. As of December 31, 2019 and 2018, the entire amount of the founder demand note is outstanding. The demand note bears an annual interest rate of 0.25% and is repayable on demand.
9. Bridge Notes Payable
From July 2019 to February 2020, the Company entered into note agreements with investors. As of December 31, 2019, the aggregate principal amount of the bridge notes is approximately $4.1 million, which are
F-40
due July 29, 2021, with simple interest rate of 5% per annum. No notes mature in less than twelve months from December 31, 2019. The outstanding principal and any accrued but unpaid interest under the bridge notes shall be automatically converted into equity securities issued by the Company at the initial closing of the Company’s next sale of capital stock occurring on or prior to the notes’ maturity date resulting in gross proceeds in excess of at least $20.0 million, (the “Next Equity Financing”), at an exchange price equal to 75% of the per share price received from investors in the Next Equity Financing.
In the event the Next Equity Financing has not been consummated on or before the maturity date, at the option of the Company, the outstanding principal and any accrued but unpaid interest under the bridge notes shall convert into shares of the Company’s Series B Convertible Preferred Stock at the Series B Convertible Preferred Stock original issue price of $4.702.
In the event of a change in control, as defined in the note agreements, prior to repayment or conversion, the outstanding principal and any accrued but unpaid interest under the bridge notes shall, at the option of the majority holders, settle in cash equal to 1.5 times the outstanding principal and unpaid interest or settle with common stock of the Company at a price per share that is 75% of the price per share of common stock paid at the change of control.
Certain holders of the bridge notes were issued option agreements providing the holder with a
non-binding
right to receive a base model Fisker Ocean SUV within the first 12 months of production, subject to the terms and conditions. The proceeds received from these holders were allocated to the bridge notes and option agreements on a relative fair value basis, resulting in an initial discount to the bridge notes.The automatic exchange feature is the predominant settlement feature and the change of control feature within the bridge notes are embedded contingent put options that, collectively, are required to be bifurcated from the debt host and measured at fair value with changes in fair value recognized in earnings (see Note 2). After bifurcation of the embedded derivative, the initial carrying value of the bridge notes are accreted to their stated principal value over the contractual term of the bridge notes, using the effective interest method. The Company recognized approximately $0.1 million of accretion of debt discount from the issuance dates of the bridge notes through December 31, 2019, classified as Interest expense in the Consolidated Statement of Operations.
The estimated fair value of the embedded derivative at issuance was $1,245,298. The Company recognized $79,751 of other expense due to the change in fair value of the embedded derivative.
The following table summarizes the aggregate values recorded for the bridge notes as of and December 31, 2019:
At Issuance | As of December 31, 2019 | |||||||
Principle | $ | 4,094,448 | $ | 4,099,080 | ||||
Embedded derivative | 1,245,298 | 1,325,049 | ||||||
Unamortized discounts and fees | (1,761,159 | ) | (1,626,929 | ) | ||||
Net carrying amount | $ | 3,578,587 | $ | 3,797,200 | ||||
Certain of the Company’s bridge notes include a covenant as to the use of proceeds from the issuance. Proceeds of $1.0 million are to be used for the development of certain battery technology. As of December 31, 2019, the Company is in compliance with such covenant.
The Company had no bridge notes payable outstanding as of December 31, 2018.
F-41
10
Temporary Equity
Series A and Series B Convertible Preferred Stock
As of December 31, 2019, the Company is authorized to issue 8,379,280 shares of Preferred stock with a par value of $0.00001, of which, 6,252,530 shares are designated Series A Convertible Preferred Stock and 2,126,750 are designated as Series B Convertible Preferred Stock (collectively, the “Convertible Preferred Stock”). The original issue price and the liquidation value, as of December 31, 2019, of each class of Convertible Preferred Stock is as follows:
Shares Issued and Outstanding | Original Issue Price | Original Issue value | Aggregate Liquidation Preference | |||||||||||||
Series A | 6,252,530 | $ | 0.748 | $ | 4,676,892 | $ | 4,676,892 | |||||||||
Series B | 1,386,370 | $ | 4.702 | $ | 6,518,712 | $ | 6,518,712 | |||||||||
Dividends
Series A holders receive
non-cumulative
dividends at a rate per annum equal to $0.045 per share, if and when declared by the Company’s Board of Directors. Series A holders receive dividends prior to and in preference to any dividends on Series B Convertible Preferred Stock, Founders Convertible Preferred and Common Stockholders. After payment of any Series A dividends, any additional dividends are distributed to Founders Convertible Preferred and Common Stockholderspro-rata
based on the number of shares of Common Stock held (assuming conversion of all such Founders Convertible Preferred into Common Stock). No dividends have been declared or paid as of December 31, 2019.Liquidation
Holders of Series A Convertible Preferred Stock and Series B Convertible Preferred Stock are entitled to receive a liquidation preference prior to any distribution to holders of Founders Convertible Preferred and Common Stock. Upon the occurrence of a liquidation transaction, Convertible Preferred Stock Series A and Convertible Preferred Stock Series B will be redeemed by the Company at the greater of (i) $0.748 per share (Series A) or $4.702 (Series B) (adjusted for stock splits, stock dividends, reclassifications etc.) and (ii) such amount per share as would have been payable had all shares of Convertible Preferred Series A or Convertible Preferred Series B been converted into Class A Common Stock immediately prior to the liquidation transaction (a “Deemed Conversion”).
Remaining assets are distributed among the holders of Founders Convertible Preferred and Common Stock pro rata based on the number of shares of Common Stock held by each (assuming conversion of Founders Convertible Preferred into Common Stock).
Conversion
Series A Convertible Preferred Stock and Series B Convertible Preferred Stock is convertible at any time, at the option of the holder, into Class A Common Stock as is determined by dividing the then-original issue price, as adjusted, for such share of preferred stock by the conversion price, as adjusted, in effect on the date the certificate is surrendered for conversion (“Conversion Price”).
The Conversion Prices of Series A and Series B Convertible Preferred Stock as of December 31, 2019 is as follows:
Conversion Price | ||||
Series A | $ | 0.748 | ||
Series B | $ | 4.702 | ||
F-42
Additionally, all outstanding shares of the Series A Convertible Preferred Stock and Series B Convertible Preferred Stock shall automatically be converted into shares of underlying Class A Common Stock upon either (a) the Company’s sale of its Common Stock in a public offering pursuant to a registration statement under the Securities Act of 1933 which results in aggregate cash proceeds to the Company of not less than $50,000,000, net of underwriting discounts and commissions (a “Qualified IPO”); or (b) the date, or upon the occurrence of an event, specified by vote or written consent of the holders of a majority of the then outstanding shares of Convertible Preferred Stock, voting together as a single class on an
as-converted
basis.Voting Rights
Holders of Series A Convertible Preferred Stock and Series B Convertible Preferred Stock are entitled to the same voting rights as the Common Stockholders and to notice of stockholders’ meeting. The holders of Common Stock, Founders Convertible Preferred, Series A Convertible Preferred Stock and Series B Convertible Preferred Stock shall vote together as a single class (on an
as-converted
basis) on all matters. Each holder of Series A Convertible Preferred Stock and Series B Convertible Preferred Stock is entitled to the number of votes equal to the number of shares of Class A Common Stock into which such shares of Convertible Preferred Stock could be converted.Significant stock transactions
In March 2018, the Company issued 1,637,680 shares of Series A Convertible Preferred Stock at $0.748 per share, for net proceeds of approximately $1.2 million. From April through November 2018, the Company issued an aggregate of 1,386,370 shares of Series B Convertible Preferred stock at $4.702 per share, for net proceeds of approximately $6.4 million.
Each of the Series A and Series B Convertible Preferred Stock is conditionally puttable by the holders upon a “deemed liquidation event,” which includes a merger, consolidation, reorganization or recapitalization in which a subsidiary of the Company is a constituent party and the Company issues shares of its capital stock pursuant to such transaction, or a sale of substantially all of the Company’s assets. A “deemed liquidation event” is not solely within the control of the Company given holders of the Series A Convertible Preferred Stock have representation on the Company’s board of directors. As such, the Series A and Series B Convertible Preferred Stock is classified as temporary equity. Any discount to liquidation preference of the Series A and Series B Convertible Preferred Stock is not being accreted as a deemed dividend, as it is not currently probable that the Series A and Series B Convertible Preferred Stock will become redeemable. Subsequent adjustments to increase the carrying values to the ultimate redemption values will be made only when it becomes probable that such a liquidation event will occur.
11. Stockholders’ Deficit
Common Stock
As of December 31, 2019, the Company is authorized to issue 150,000,000 shares of Class A Common Stock and 40,000,000 shares of Class B Common Stock. Both classes of common stock qualify and share equally in dividends, if declared by the Company’s Board of Directors. In the event of liquidation, dissolution, distribution of assets or
winding-up
of the Company, the holders of both classes of common stock have equal rights to receive all the assets of the Company, after rights of the holders of the preferred stock, if any, have been satisfied.Class A Common Stock
Holders of Class A Common Stock are entitled to one vote per share on matters to be voted upon by stockholders. Holders of Class A Common Stock have no preemptive rights to subscribe for or to purchase any additional shares of Class A Common Stock or other obligations convertible into shares of Class A Common Stock which the Company may issue in the future.
F-43
All of the outstanding shares of Class A Common Stock are fully paid and
non-assessable.
Holders of Class A Common Stock are not liable for further calls or assessments.Class B Common Stock
Holders of Class B Common Stock are entitled to ten votes per share on matters to be voted upon by stockholders. Holders of the Class B Common Stock may, at any time, convert their Class B Common Stock into one share of Class A Common Stock.
Founders Convertible Preferred Stock
As of December 31, 2019, the Company is authorized to issue 10,000,000 shares of Founders Convertible Preferred Stock with a par value of $0.00001, of which 10,000,000 shares are issued and outstanding.
Holders of Founders Convertible Preferred Stock are entitled to ten votes for each share of Class A Common Stock into which such Founders Convertible Preferred Stock could be then directly converted.
Founders Convertible Preferred Stock are convertible at any time, at the option of the holder, into Class A Common Stock as is determined by dividing $0.10, as adjusted, for such share of preferred stock by the conversion price, as adjusted, in effect on the date the certificate is surrendered for conversion.
Additionally, all outstanding shares of the Founders Convertible Preferred Stock shall automatically be converted (i) upon any transfer, as defined, into Class A Common Stock (ii) upon any exempt transfer, as defined, into Class B Common Stock (iii) into Class A Common Stock upon the earlier of (a) the Company’s sale of its Common Stock in a public offering pursuant to a registration statement under the Securities Act of 1933 which results in aggregate cash proceeds to the Company of not less than $50,000,000, net of underwriting discounts and commissions (a “Qualified IPO”); or (b) the date, or upon the occurrence of an event, specified by vote or written consent of the holders of a majority of the then outstanding shares of Founders Convertible Preferred Stock, voting together as a single class on an
as-converted
basis.F-44
12. Earnings (Loss) Per Share
Founders Convertible Preferred Stock are participating securities as the Founders Convertible Preferred Stock participates in undistributed earnings on anbasis. The Company computes earnings (loss) per share of Class A Common Stock and Class B Common Stock using the
as-if-converted
two-class
method required for participating securities. Basic and diluted earnings per share was the same for each period presented as the inclusion of all potential Class A Common Stock and Class B Common Stock outstanding would have been anti-dilutive. Basic and diluted earnings per share are the same for each class of common stock because they are entitled to the same liquidation and dividend rights. The following table sets forth the computation of basic and diluted loss per Class A Common Stock and Class B Common Stock:Year Ended December 31, | ||||||||
2019 | 2018 | |||||||
Numerator: | ||||||||
Net loss | $ | (10,878,750 | ) | $ | (3,430,945 | ) | ||
Deemed dividend attributable to preferred stock | — | (1,222,368 | ) | |||||
Net loss attributable to common shareholders | $ | (10,878,750 | ) | $ | (4,653,313 | ) | ||
Denominator: | ||||||||
Weighted average Class A common shares outstanding | 57,139 | 20,040 | ||||||
Weighted average Class B common shares outstanding | 38,727,340 | 38,727,340 | ||||||
Weighted average Class A and Class B common shares outstanding- Basic | 38,784,479 | 38,747,380 | ||||||
Dilutive effect of potential common shares | — | — | ||||||
Weighted average Class A and Class B common shares outstanding- Diluted | 38,784,479 | 38,747,380 | ||||||
Net loss per share attributable to Class A and Class B Common shareholders- Basic | $ | (0.28 | ) | $ | (0.12 | ) | ||
Net loss per shares attributable to Class A and Class B Common shareholders- Diluted | $ | (0.28 | ) | $ | (0.12 | ) | ||
The following table presents the potential common shares outstanding that were excluded from the computation of diluted net loss per share of common stock as of the periods presented because including them would have been antidilutive:
Year Ended December 31, | ||||||||
2019 | 2018 | |||||||
Series A Convertible Preferred Stock | 6,252,530 | 6,252,530 | ||||||
Series B Convertible Preferred Stock | 1,386,370 | 1,386,370 | ||||||
Founders Convertible Preferred Stock | 10,000,000 | 10,000,000 | ||||||
Bridge notes | 880,334 | — | ||||||
Stock Options | 6,410,311 | 6,611,058 | ||||||
Total | 24,929,545 | 24,249,958 | ||||||
F-45
13. Stock Based Compensation
The Company maintains the 2016 Stock Plan (the “Plan”). The Plan is a stock-based compensation plan which provides for the grants of options and restricted stock to employees and consultants of the Company. Options granted under the Plan may be either incentive options (“ISO”) or nonqualified stock options (“NSO”). The maximum aggregate number of shares of the Company’s Class A Common Stock that may be issued under the Plan is 8,823,530 shares (subject to adjustments upon changes in capitalization, merger or certain other transactions).
Options under the Plan may be granted at prices as determined by the Board of Directors, provided, however, that (i) the exercise price of an ISO and NSO shall not be less than 100% of the estimated fair value of the shares on the date of grant, and (ii) the exercise price of an ISO granted to a 10% shareholder shall not be less than 110% of the estimated fair value of the shares on the date of grant. The fair value of the shares is determined by the Board of Directors on the date of grants. Stock options generally have a contractual life of 10 years.
In 2016 and 2017, the Company’s founders were granted an aggregate of 5,882,360 options which are fully vested. Options granted to other employees and consultants become vested and are exercisable over a range of up to six years from the date of grant.
The following table summarizes option activity under the Plan:
Shares Available For Grant | Options | Weighted Average Exercise Price | Weighted Average Contractual Term (in Years) | |||||||||||||
Balance as of January 1, 2018 | 2,063,530 | 6,760,000 | $ | 0.15 | 9.2 | |||||||||||
Granted | (363,875 | ) | 363,875 | 1.70 | ||||||||||||
Exercised | — | (34,272 | ) | 0.15 | ||||||||||||
Forfeited | 478,545 | (478,545 | ) | 0.24 | ||||||||||||
Balance as of December 31, 2018 | 2,178,200 | 6,611,058 | 0.23 | 8.2 | ||||||||||||
Granted | (66,597 | ) | 66,597 | 3.05 | ||||||||||||
Exercised | — | (43,359 | ) | 0.18 | ||||||||||||
Forfeited | 223,985 | (223,985 | ) | 0.73 | ||||||||||||
Balance as of December 31, 2019 | 2,335,588 | 6,410,311 | 0.24 | 7.2 | ||||||||||||
Additional information regarding stock options exercisable as of December 31, 2019 is summarized below:
Options Exercisable at December 31, 2019 | ||||||||||||||
Range of Exercise Price | Number | Weighted Average Exercise Price | Weighted Average Contractual Term (in Years) | |||||||||||
| $ | 0.152—$3.69 | 6,036,764 | $ | 0.177 | 7.18 | |||||||||
The aggregate intrinsic value represents the total pretax intrinsic value (i.e., the difference between the fair value of the Company’s common stock price and the exercise price, multiplied by the number ofoptions) that would have been received by the option holders had all option holders exercised their options. The aggregate intrinsic value of options outstanding as of December 31, 2019 was $22.1 million. The intrinsic value of options exercisable was $21.2 million as of December 31, 2019. The total intrinsic value of options exercised was $152,392 and $62,512 for the years ended December 31, 2019 and 2018, respectively.
in-the-money
The weighted-average grant date fair value per share for the stock option grants during the years ended December 31, 2019 and 2018 was $2.18 and $1.47, respectively. As of December 31, 2019, the total
F-46
unrecognized compensation related to unvested stock option awards granted was $329,885, which the Company expects to recognize over a weighted-average period of approximately 1.9 years.
The fair value of each stock option grant under the Plan was estimated on the date of grant using the Black-Scholes option pricing model, with the following weighted-average assumptions:
Year Ended December 31, | ||||||||
2019 | 2018 | |||||||
Expected term (in years) | 6.3 | 6.3 | ||||||
Volatility | 83.7 | % | 84.0 | % | ||||
Dividend yield | 0.0 | % | 0.0 | % | ||||
Risk-free interest rate | 2.0 | % | 2.8 | % | ||||
Common stock price | $ | 3.05 | $ | 1.94 | ||||
The Black-Scholes option pricing model requires various highly subjective assumptions that represent management’s best estimates of the fair value of the Company’s common stock, volatility, risk-free interest rates, expected term, and dividend yield. Given the absence of an active market for the Company’s common stock, the Company determines its common stock value generally using the market approach valuation methods. The valuation results are reviewed and approved by the Company’s board of directors.
The expected term represents the weighted-average period that options granted are expected to be outstanding giving consideration to vesting schedules. Since the Company does not have an extended history of actual exercises, the Company has estimated the expected term using a simplified method which calculates the expected term as the average of theand the contractual life of the awards. The Company has never declared or paid cash dividends and does not plan to pay cash dividends in the foreseeable future; therefore, the Company used an expected dividend yield of zero. The risk-free interest rate is based on U.S. Treasury rates in effect during the expected term of the grant. The expected volatility is based on historical volatility of publicly-traded peer companies.
time-to-vesting
Stock-based compensation expense for the years ended December 31, 2019 and 2018 is as follows:
Year Ended December 31, | ||||||||
2019 | 2018 | |||||||
General and administrative expense | $ | 29,799 | $ | 28,858 | ||||
Research and development | 55,398 | 31,283 | ||||||
Total | 85,197 | 60,141 | ||||||
F-47
14. Income Taxes
The Company has limited foreign operations and
pre-tax
loss from its foreign operations has no material impact on Income tax. Income tax expense attributable to loss from continuing operations consists of:Current | Deferred | Total | ||||||||||
Year ended December 31, 2019 | ||||||||||||
U.S. operations | $ | — | $ | (2,310,819 | ) | $ | (2,310,819 | ) | ||||
State and local | — | (807,732 | ) | (807,732 | ) | |||||||
Valuation allowance | — | 3,118,551 | 3,118,511 | |||||||||
$ — | $ — | $ — | ||||||||||
Year ended December 31, 2018 | ||||||||||||
U.S. operations | $ | — | $ | (811,547 | ) | $ | (811,547 | ) | ||||
State and local | — | (313,854 | ) | (313,854 | ) | |||||||
Valuation allowance | — | 1,125,401 | 1,125,401 | |||||||||
$ — | $ — | $ — | ||||||||||
Deferred Tax Assets and Liabilities
Deferred income taxes reflect the net tax effects of (a) temporary differences between the carrying amounts of assets and liabilities for financial reporting purposes and the amounts used for income tax purposes, and (b) operating losses and tax credit carryforwards.
The Company records income tax expense for the anticipated tax consequences of the reported results of operations using the asset and liability method. Under this method, the Company recognizes deferred tax assets and liabilities for the expected future tax consequences of temporary differences between the financial reporting and tax basis of assets and liabilities, as well as for operating loss and tax credit carryforwards. Deferred tax assets and liabilities are measured using the tax rates that are expected to apply to taxable income for the years in which those tax assets and liabilities are expected to be realized or settled. The Company records valuation allowances to reduce its deferred tax assets to the net amount that it believes is more likely than not to be realized. Its assessment considers the recognition of deferred tax assets on a jurisdictional basis. The Company has placed a full valuation allowance against U.S. federal and state deferred tax assets since the recovery of the assets is uncertain.
F-48
The tax effects of significant items comprising the Company’s deferred taxes are as follows:
As of December 31, | ||||||||
2019 | 2018 | |||||||
Deferred tax assets: | ||||||||
Net operating loss carryforwards | $ | 5,540,098 | $ | 2,801,576 | ||||
Tax credits | 672,463 | 500,165 | ||||||
Stock options | 161,717 | 151,781 | ||||||
Legal reserve | 209,877 | — | ||||||
Lease liability | 40,184 | — | ||||||
Trademarks | 19,980 | 19,980 | ||||||
Other | 4,091 | 4,091 | ||||||
Total gross deferred income tax assets | 6,648,410 | 3,477,593 | ||||||
Deferred tax liabilities: | ||||||||
ROU asset | (41,490 | ) | — | |||||
Research and development expense | (26,456 | ) | (26,456 | ) | ||||
Depreciation | (18,335 | ) | (9,337 | ) | ||||
Amortization | (6,363 | ) | (4,620 | ) | ||||
Other | (5,194 | ) | (5,159 | ) | ||||
Total gross deferred income tax liabilities | (97,838 | ) | (45,572 | ) | ||||
Net deferred income tax assets | 6,550,572 | 3,432,021 | ||||||
Valuation allowance | (6,550,572 | ) | (3,432,021 | ) | ||||
Deferred tax asset, net of allowance | $ | — | $ | — | ||||
ASC 740 requires that the tax benefit of net operating losses (“NOLs”), temporary differences and credit carryforwards be recorded as an asset to the extent that management assesses that realization is “more likely than not.” Realization of the future tax benefits is dependent on the Company’s ability to generate sufficient taxable income within the carryforward period. Management believes that recognition of the deferred tax assets arising from the above-mentioned future tax benefits from operating loss carryforwards is currently not likely to be realized and, accordingly, has provided a valuation allowance against its deferred tax assets.
The changes in the valuation allowance related to current year operating activity was an increase in the amount of $3,118,551 during the year ended December 31, 2019.
Year Ended December 31, | ||||||||
2019 | 2018 | |||||||
Beginning of the year | $ | 3,432,021 | $ | 2,306,620 | ||||
Increase – income tax benefit | 3,118,551 | 1,125,401 | ||||||
End of the year | $ | 6,550,572 | $ | 3,432,021 | ||||
The effective tax rate of the Company’s (provision) benefit for income taxes differs from the federal statutory rate as follows:
Year Ended December 31, | ||||||||
2019 | 2018 | |||||||
Expected federal income tax benefit | 21.0 | % | 21.0 | % | ||||
State taxes net of federal benefit | 6.7 | 6.8 | ||||||
Tax credits | 1.7 | 5.4 | ||||||
Valuation allowance | (28.7 | ) | (32.8 | ) | ||||
Other | (0.7 | ) | (0.4 | ) | ||||
Income taxes provision (benefit) | — | % | — | % | ||||
F-49
Net Operating Losses
Federal and state laws impose substantial restrictions on the utilization of NOLs and tax credit carryforwards in the event of an ownership change for tax purposes, as defined in Section 382 of the Internal Revenue Code. Depending on the significance of past and future ownership changes, the Company’s ability to realize the potential future benefit of tax losses and tax credits that existed at the time of the ownership change may be significantly reduced.
As of December 31, 2019, the Company has approximately $16.0 million and $5.6 million of federal and state NOLs respectively. Federal NOLs generated prior to 2017 begin expiring in the calendar year 2036. Under the new Tax Cuts and Jobs Act, all NOLs incurred after December 31, 2017 are carried forward indefinitely for federal tax purposes. The Coronavirus Aid, Relief, and Economic Security Act (“CARES Act”) signed in to law on March 27, 2020, provided that NOLs generated in a taxable year beginning in 2018, 2019, or 2020, may now be carried back five years and forward indefinitely. In addition, the 80% taxable income limitation is temporarily removed, allowing NOLs to fully offset net taxable income. California has not conformed to the indefinite carryforward period for NOLs. The NOLs begin expiring in the calendar year 2036 for state purposes.
In the ordinary course of its business, the Company incurs costs that, for tax purposes, are determined to be qualified research and development (“R&D”) expenditures within the meaning of IRC §41 and are, therefore, eligible for the Increasing Research Activities credit under IRC §41. The R&D tax credit carryforward as of December 31, 2019 is $469,825 and $302,639 for Federal and State, respectively. The R&D tax credit carryforwards begin expiring in the calendar year 2036 for federal purposes. The Company has adjusted the deferred tax assets related to Federal R&D credit carryover to account for any expiring tax credits.
Uncertain Tax Positions
The Company recognizes tax benefits from uncertain tax positions only if it believes that it is more likely than not that the tax position will be sustained on examination by the taxing authorities based on the technical merits of the position. As the Company expands, it will face increased complexity in determining the appropriate tax jurisdictions for revenue and expense items. The Company’s policy is to adjust these reserves when facts and circumstances change, such as the closing of a tax audit or refinement of an estimate. To the extent that the final tax outcome of these matters is different than the amounts recorded, such differences will affect the income tax expense in the period in which such determination is made and could have a material impact on its financial condition and operating results. The income tax expense includes the effects of any accruals that the Company believes are appropriate, as well as the related net interest and penalties.
As of December 31, 2019, the Company has total uncertain tax positions of $100,000 of which $100,000 is related to R&D tax credits, which is recorded as a reduction of the deferred tax asset. No interest or penalties have been recorded related to the uncertain tax positions. A reconciliation of the beginning and ending balances of unrecognized tax benefits is as follows:
Year Ended December 31, | ||||||||
2019 | 2018 | |||||||
Beginning of the year | $ | — | $ | — | ||||
Increase—current year positions | 100,000 | — | ||||||
End of the year | $ | 100,000 | $ | — | ||||
It is not expected that there will be a significant change in uncertain tax positions in the next 12 months. The Company is subject to U.S. federal and state income tax and one foreign jurisdiction. In the normal course of business, the Company is subject to examination by tax authorities. There are no tax examinations in progress as of December 31, 2019. The Company’s federal and state tax years for 2016 and forward are subject to examination by taxing authorities.
F-50
15. Related Party Transactions
In March 2018, the Company entered into a Series A Convertible Preferred Stock Purchase Agreement with HF Holdco LLC for the purchase of 334,220 shares of Series A Convertible Preferred Stock for aggregate gross proceeds of $249,997. Henrik Fisker, the Company’s Chief Executive Officer and founder and Geeta Gupta, the Company’s Chief Financial Officer and founder, are the sole members of HF Holdco LLC.
In March 2018, the Company entered into a Series A Convertible Preferred Stock Purchase Agreement with Series Fisker, a separate series of The Randall Group, LLC, for the purchase of 568,170 shares of Series A Convertible Preferred Stock for aggregate proceeds of $424,991. Roderick K. Randall, a member of the Company’s Board of Directors, is the managing member of The Randall Group, LLC.
In July 2019, the Company entered into a Convertible Promissory Note Agreement with Mr. Randall for the principal sum of $100,000. As of December 31, 2019 the bridge note is outstanding and the accrued interest balance of this note is $2,069.
As described in Note 8, in connection with the Company formation in September 2016, HF Holdco LLC, an entity controlled by Mr. Fisker and Dr. Gupta advanced the Company $250,000 in the form of a demand note. As of December 31, 2019, the note is outstanding and the accrued interest balance of this note is $2,057.
16. Commitments and Contingencies
The Company is not a party to any material legal proceedings and is not aware of any pending or threatened claims. From time to time however, the Company may be subject to various legal proceedings and claims that arise in the ordinary course of its business activities.
17. Subsequent Events
The Company has completed an evaluation of all subsequent events through August 7, 2020 to ensure that these consolidated financial statements include appropriate disclosure of events both recognized in the consolidated financial statements and events which occurred but were not recognized in the consolidated financial statements. Except as described below, the Company has concluded that no subsequent event has occurred that requires disclosure.
In February 2020, the Company temporarily suspended the disbursement of cash compensation to Mr. Fisker and Dr. Gupta. In March 2020, the Company also temporarily furloughed employees and reduced the cash compensation disbursed to such employees.
Beginning in early March 2020, the
COVID-19
pandemic and the measures imposed to contain this pandemic have disrupted and are expected to continue to impact the Company’s business. The magnitude of the impact of theCOVID-19
pandemic on the Company’s productivity, results of operations and financial position, and its disruption to the Company’s business and vehicle development and timelines, will depend, in part, on the length and severity of these restrictions and on the Company’s ability to conduct business in the ordinary course.In May 2020, in satisfaction of the advances made by HF Holdco LLC, an entity controlled by the Company’s founders, the Company issued a convertible promissory note to HF Holdco LLC with the principal sum of $250,000. The convertible promissory note bears substantially the same terms as the bridge notes payable as described in Note 9.
In June 2020, the Company entered into a Convertible Promissory Note Agreement with Mr. Randall for the principal sum of $220,000.
From January through July 2020, the Company entered into note agreements with investors with an aggregate principal amount of approximately $5.9 million. The notes are due July 29, 2021, with simple interest rate of 5%
F-51
per annum. The terms of the note agreements contain substantially the same terms as the bridge notes described in Note 9.
In June 2020, the Company entered into an Amendment to Convertible Notes with holders of the Company’s outstanding bridge notes to provide for amendments to the definition of the Next Equity Financing such that in the event of a Special Purpose Acquisition Corporation (“SPAC”) Transaction, as defined, prior to repayment or conversion in full of the note, immediately prior to such SPAC Transaction, the outstanding principal and any accrued but unpaid interest under the bridge notes shall automatically convert into shares of Class A Common Stock of the Company (or, at the election of the Company, directly into proceeds paid to the holders of Class A Common Stock in connection with such SPAC Transaction) at a price per share that is 75% of the price per share of Class A Common Stock paid in such SPAC Transaction.
On July 1, 2020, the Company entered into an agreement with Italdesign Giugiaro S.p.A. (“IDG”) pursuant to which IDG has agreed to provide engineering services relating to the development of the Fisker Ocean. The anticipated costs associated with the agreement are approximately $13.4 million of which a first installment of approximately $4.6 million was paid by the Company upon execution.
On July 7, 2020, the Company issued an investor a convertible equity security (the “Security”) in the amount of $50.0 million. The Security is automatically convertible into shares of capital stock of the combined entity upon the closing of a transaction with a special purpose acquisition company at a conversion price equal to 85% of the price per share upon consummation of such transaction (a “SPAC Transaction”). In the event the SPAC Transaction contemplated at the time of entering into the transaction terminates or does not occur by December 31, 2020, the Security is automatically convertible into a newly created Series C Convertible Preferred stock at price per share equal to $1.4 billion divided by the number of shares of capital stock of the Company (on an
as-converted
basis) then issued and outstanding, assuming exercise and/or conversion of all outstanding options, warrants and other convertible securities.In July 2020, the Company entered into a legal settlement agreement related to claims brought in April 2019 alleging trade secret misappropriation by former employees. Pursuant to the settlement agreement, while the Company did not admit to any wrongdoing, it agreed to a settlement payment of $750,000 in cash. The legal settlement is accrued in the Consolidated Balance Sheet as of December 31, 2019; see Note 6.
On July 10, 2020, Spartan Energy Acquisition Corp. (“Spartan”) (NYSE:SPAQ), a special purpose acquisition company sponsored by a legal entity which is associated with Apollo Global Management, Inc. (NYSE:APO) (together with its consolidated subsidiaries, “Apollo”), announced they have entered into a definitive agreement for a business combination that would result in the Company merging into a newly created subsidiary of Spartan. If such business combination is ultimately completed, the Company would effectively comprise all of Spartan’s material operations.
F-52
SPARTAN ENERGY ACQUISITION CORP.
CONDENSED BALANCE SHEETS
September 30, 2020 | December 31, 2019 | |||||||
(unaudited) | ||||||||
ASSETS | ||||||||
Current assets: | ||||||||
Cash and cash equivalent | $ | 164,923 | $ | 548,761 | ||||
Prepaid expenses | 39,340 | 273,831 | ||||||
Total current assets | 204,263 | 822,592 | ||||||
Investment held in Trust Account | 569,041,175 | 565,152,589 | ||||||
Total assets | $ | 569,245,438 | $ | 565,975,181 | ||||
LIABILITIES AND STOCKHOLDERS’ EQUITY | ||||||||
Current liabilities: | ||||||||
Accounts payable and accrued expenses | $ | 2,722,389 | $ | 116,001 | ||||
Accrued income and franchise taxes | 262,301 | 200,000 | ||||||
Advances from related parties | 1,385,118 | 0 | ||||||
Total current liabilities | 4,369,808 | 316,001 | ||||||
Deferred underwriting commissions | 19,320,000 | 19,320,000 | ||||||
Total liabilities | 23,689,808 | 19,636,001 | ||||||
Commitments and contingencies | ||||||||
Class A common stock subject to possible redemption; 54,055,562 and 54,133,917 shares at September 30, 2020 and December 31, 2019, respectively (at approximately $10.00 per share) | 540,555,620 | 541,339,170 | ||||||
Stockholders’ equity: | ||||||||
Preferred stock, $0.0001 par value per share; 1,000,000 shares authorized; NaN issued and outstanding | 0 | 0 | ||||||
Class A common stock, $0.0001 par value per share, 200,000,000 shares authorized, 1,136,980 and 1,066,083 shares issued and outstanding (excluding 54,055,562 and 54,113,917 shares subject to possible redemption) at September 30, 2020 and December 31, 2019, respectively | 114 | 107 | ||||||
Class B common stock, $0.0001 par value per share, 20,000,000 shares authorized, 13,800,000 shares issued and outstanding as of September 30, 2020 and December 31, 2019 | 1,380 | 1,380 | ||||||
Additional paid-in capital | 4,145,926 | — | ||||||
Retained earnings | 852,590 | 4,998,523 | ||||||
Total stockholders’ equity | 5,000,010 | 5,000,010 | ||||||
Total liabilities and stockholders’ equity | $ | 569,245,438 | $ | 565,975,181 | ||||
See accompanying notes to unaudited condensed financial statements.
F-53
SPARTAN ENERGY ACQUISITION CORP.
CONDENSED STATEMENTS OF OPERATIONS
(unaudited)
For the Three Months Ended September 30, | For the Nine Months Ended September 30, | |||||||||||||||
2020 | 2019 | 2020 | 2019 | |||||||||||||
REVENUE | $ | 0 | $ | 0 | $ | 0 | $ | 0 | ||||||||
EXPENSES | ||||||||||||||||
Administrative fee – related party | 30,000 | 30,000 | 90,000 | 90,000 | ||||||||||||
General and administrative expenses | 3,290,249 | 425,846 | 4,248,250 | 1,021,755 | ||||||||||||
TOTAL EXPENSES | 3,320,249 | 455,846 | 4,338,250 | 1,111,755 | ||||||||||||
OTHER INCOME | ||||||||||||||||
Investment income from Trust Account | 74,232 | 3,146,769 | 4,554,058 | 9,927,002 | ||||||||||||
Interest income | 11 | 5,142 | 2,387 | 19,400 | ||||||||||||
TOTAL OTHER INCOME | 74,243 | 3,151,911 | 4,556,445 | 9,946,402 | ||||||||||||
INCOME (LOSS) BEFORE INCOME TAX PROVISION | (3,246,006 | ) | 2,696,065 | 218,195 | 8,834,647 | |||||||||||
Income tax provision | 5,002 | 650,235 | 924,823 | 2,053,257 | ||||||||||||
Net Income (Loss) | $ | (3,251,008 | ) | $ | 2,045,830 | $ | (706,628 | ) | $ | 6,781,390 | ||||||
Weighted average shares outstanding of Class A common stock | 55,195,379 | 55,200,000 | 55,198,449 | 55,200,000 | ||||||||||||
Basic and diluted net income (loss) per share, Class A | $ | 0.00 | $ | 0.04 | $ | 0.06 | $ | 0.14 | ||||||||
Weighted average shares outstanding of Class B common stock | 13,800,000 | 13,800,000 | 13,800,000 | 13,800,000 | ||||||||||||
Basic and diluted net loss per share, Class B | $ | (0.24 | ) | $ | (0.03 | ) | $ | (0.31 | ) | $ | (0.07 | ) | ||||
See accompanying notes to unaudited condensed financial statements.
F-54
SPARTAN ENERGY ACQUISITION CORP.
CONDENSED STATEMENTS OF CHANGES IN STOCKHOLDERS’ EQUITY
(unaudited)
For the nine months ended September 30, 2020
Class A Common Stock | Class B Common Stock | Additional Paid-in | Retained | Stockholders’ | ||||||||||||||||||||||||
Shares | Amount | Shares | Amount | Capital | Earnings | Equity | ||||||||||||||||||||||
Balance as of December 31, 2019 | 1,066,083 | $ | 107 | 13,800,000 | $ | 1,380 | $ | 0 | $ | 4,998,523 | $ | 5,000,010 | ||||||||||||||||
Change in Class A common stock subject to possible redemption | 70,897 | 7 | 0 | 0 | 4,145,926 | (3,439,305 | ) | 706,628 | ||||||||||||||||||||
Net loss | — | 0 | — | 0 | 0 | (706,628 | ) | (706,628 | ) | |||||||||||||||||||
Balance as of September 30, 2020 | 1,136,980 | $ | 114 | 13,800,000 | $ | 1,380 | $ | 4,145,926 | $ | 852,590 | $ | 5,000,010 | ||||||||||||||||
For the three months ended September 30, 2020
Class A Common Stock | Class B Common Stock | Additional Paid-in | Retained | Stockholders’ | ||||||||||||||||||||||||
Shares | Amount | Shares | Amount | Capital | Earnings | Equity | ||||||||||||||||||||||
Balance as of June 30, 2020 | 811,645 | $ | 81 | 13,800,000 | $ | 1,380 | $ | 894,951 | $ | 4,103,598 | $ | 5,000,010 | ||||||||||||||||
Change in Class A common stock subject to possible redemption | 325,335 | 33 | 0 | 0 | 3,250,975 | 0 | 3,251,008 | |||||||||||||||||||||
Net loss | — | 0 | — | 0 | 0 | (3,251,008 | ) | (3,251,008 | ) | |||||||||||||||||||
Balance as of September 30, 2020 | 1,136,980 | $ | 114 | 13,800,000 | $ | 1,380 | $ | 4,145,926 | $ | 852,590 | $ | 5,000,010 | ||||||||||||||||
See accompanying notes to unaudited condensed financial statements.
F-55
SPARTAN ENERGY ACQUISITION CORP.
CONDENSED STATEMENTS OF CHANGES IN STOCKHOLDERS’ EQUITY
(unaudited)
For the nine months ended September 30, 2019
Class A Common Stock | Class B Common Stock | Additional Paid-in | Retained | Stockholders’ | ||||||||||||||||||||||||
Shares | Amount | Shares | Amount | Capital | Earnings | Equity | ||||||||||||||||||||||
Balance as of December 31, 2018 | 1,946,989 | $ | 195 | 13,800,000 | $ | 1,380 | $ | 2,349,053 | $ | 2,649,382 | $ | 5,000,010 | ||||||||||||||||
Change in Class A common stock subject to possible redemption | (678,139 | ) | (68 | ) | 0 | 0 | (2,349,053 | ) | (4,432,269 | ) | (6,781,390 | ) | ||||||||||||||||
Net income | — | 0 | — | 0 | 0 | 6,781,390 | 6,781,390 | |||||||||||||||||||||
Balance as of September 30, 2019 | 1,268,850 | $ | 127 | 13,800,000 | $ | 1,380 | $ | 0 | $ | 4,998,503 | $ | 5,000,010 | ||||||||||||||||
For the three months ended September 30, 2019
Class A Common Stock | Class B Common Stock | Additional Paid-in | Retained | Stockholders’ | ||||||||||||||||||||||||
Shares | Amount | Shares | Amount | Capital | Earnings | Equity | ||||||||||||||||||||||
Balance as of June 30, 2019 | 1,473,433 | $ | 148 | 13,800,000 | $ | 1,380 | $ | 0 | $ | 4,998,482 | $ | 5,000,010 | ||||||||||||||||
Change in Class A common stock subject to possible redemption | (204,583 | ) | (21 | ) | 0 | 0 | 0 | (2,045,809 | ) | (2,045,830 | ) | |||||||||||||||||
Net income | — | 0 | — | 0 | 0 | 2,045,830 | 2,045,830 | |||||||||||||||||||||
Balance as of September 30, 2019 | 1,268,850 | $ | 127 | 13,800,000 | $ | 1,380 | $ | 0 | $ | 4,998,503 | $ | 5,000,010 | ||||||||||||||||
See accompanying notes to unaudited condensed financial statements.
F-56
SPARTAN ENERGY ACQUISITION CORP.
CONDENSED STATEMENTS OF CASH FLOWS
(unaudited)
For the Nine Months Ended September 30, | ||||||||
2020 | 2019 | |||||||
Cash Flows From Operating Activities: | ||||||||
Net (loss) income | $ | (706,632 | ) | $ | 6,781,390 | |||
Adjustments to reconcile net (loss) income to net cash used in operating activities: | ||||||||
Investment income earned on investment held in Trust Account | (4,554,058 | ) | (9,927,002 | ) | ||||
Changes in operating assets and liabilities: | ||||||||
Prepaid expenses | 234,491 | (44,951 | ) | |||||
Accounts payable and accrued expenses | 2,606,392 | 73,437 | ||||||
Related party advances | 1,385,118 | (55,432 | ) | |||||
Accrued income and franchise taxes | 62,301 | (248,780 | ) | |||||
Net Cash Used In Operating Activities | (972,388 | ) | (3,421,338 | ) | ||||
Cash Flows From Investing Activities: | ||||||||
Investment income released from Trust Account to pay taxes | 588,550 | 2,597,812 | ||||||
Net Cash Provided By Investing Activities | 588,550 | 2,597,812 | ||||||
Net change in cash and cash equivalent | (383,838 | ) | (823,526 | ) | ||||
Cash and cash equivalent at beginning of period | 548,761 | 1,531,595 | ||||||
Cash and cash equivalent at end of period | $ | 164,923 | $ | 708,069 | ||||
Supplemental disclosures of cash flow information: | ||||||||
Cash paid for income taxes | $ | 548,500 | $ | 2,397,762 | ||||
Supplemental disclosure of non-cash financing activities: | ||||||||
Change in value of Class A common stock subject to possible redemption | $ | 783,550 | $ | 6,781,390 | ||||
Redemption of Class A common stock | $ | 76,922 | $ | — | ||||
See accompanying notes to unaudited condensed financial statements.
F-57
SPARTAN ENERGY ACQUISITION CORP.
NOTES TO CONDENSED FINANCIAL STATEMENTS
NOTE 1. DESCRIPTION OF ORGANIZATION AND BUSINESS OPERATIONS
Organization and General
Spartan Energy Acquisition Corp. (the “”) was incorporated in Delaware on October 13, 2017. The Company was formed for the purpose of effecting a merger, capital stock exchange, asset acquisition, stock purchase, reorganization or similar business combination with one or more businesses (the “”). The Company is an “emerging growth company” as defined in Section 2(a) of the Securities Act of 1933, as amended (the “’), as modified by the Jumpstart Our Business Startups Act of 2012 (the “”).
Company
Initial Business Combination
Securities Act
JOBS Act
As of September 30, 2020, the Company had not commenced any operations. All activity for the period from October 13, 2017 (inception) through September 30, 2020 relates to the Company’s formation and the initial public offering (the “”) described below, the identification and evaluation of prospective acquisition targets for an Initial Business Combination and ongoing administrative and compliance matters. The Company will not generate any operating revenues until after completion of its Initial Business Combination, at the earliest. The Company generates
Public Offering
non-operating
income in the form of income earned on investments from the net proceeds derived from the Public Offering. The Company has selected December 31st as its fiscal year end.Sponsor and Public Offering
The Company’s sponsor is Spartan Energy Acquisition Sponsor LLC, a Delaware limited liability company (the “”). As described in Note 3, on August 14, 2018, the Company consummated the Public Offering of 55,200,000 of its units (the “”), including 7,200,000 Units that were issued pursuant to the underwriters’ full exercise of their over-allotment option, generating gross proceeds of $552,000,000. As described in Note 4, on August 14, 2018, simultaneously with the closing of the Public Offering, the Sponsor purchased an aggregate of 9,360,000 warrants (the “”) at a purchase price of $1.50 per warrant, or approximately $14,040,000 in the aggregate (the “”).
Sponsor
Units
Private Placement Warrants
Private Placement
The Company intends to finance its Initial Business Combination with proceeds from the Public Offering, the Private Placement, the private placement of forward purchase units (described in Note 4), the Company’s capital stock, debt or a combination of the foregoing.
The registration statement for the Company’s Public Offering (as described in Note 3) was declared effective by the U.S. Securities and Exchange Commission (the “”) on August 9, 2018.
SEC
Trust Account
Upon the closing of the Public Offering and the Private Placement, $552,000,000 was placed in a trust account (the “”). The proceeds held in the Trust Account will be invested only in U.S. government securities with a maturity of one hundred eighty (180) days or less or in money market funds that meet certain conditions under Rule
Trust Account
2a-7
under the Investment Company Act of 1940, as amended, which invest only in direct U.S. government treasury obligations, as determined by the Company. Funds will remain in the Trust Account until the earlier of (i) the consummation of the Initial Business Combination or (ii) the distribution of the Trust Account proceeds as described below. The remaining proceeds outside the Trust Account may be used to pay for business, legal and accounting due diligence on prospective acquisitions and continuing general and administrative expenses.The Company’s amended and restated certificate of incorporation provides that, except for the withdrawal of interest to pay franchise and income taxes, none of the funds held in the Trust Account (including the interest earned on the funds held in the Trust Account) will be released from the Trust Account until the earlier of: (i) the completion of the Initial Business Combination; (ii) the redemption of any shares of Class A common stock included in the Units sold
F-58
in the Public Offering (the “”) that have been properly tendered in connection with a stockholder vote seeking to amend any provisions of the Company’s amended and restated certificate of incorporation relating to stockholders’ rights or”) to extend the date by which the Company must complete an Initial Business Combination for an additional six months, from August 14, 2020 to February 14, 2021. In connection with the Charter Amendment, the holders of 7,458 shares of Class A Common Stock properly exercised their right to redeem their shares for cash at a redemption price of approximately $10.31 per share, for an aggregate redemption amount of approximately $76,922. The proceeds deposited in the Trust Account could become subject to the claims of the Company’s creditors, if any, which could have priority over the claims of the Company’s public stockholders.
Public Shares
pre-Initial
Business Combination activity; or (iii) the redemption of 100% of the Public Shares if the Company is unable to complete an Initial Business Combination within 24 months from the closing of the Public Offering (or August 14, 2020). On August 4, 2020, the Company amended and restated its certificate of incorporation (“Charter Amendment
F-59
SPARTAN ENERGY ACQUISITION CORP.
NOTES TO CONDENSED FINANCIAL STATEMENTS—CONTINUED
Initial Business Combination
The Company’s management has broad discretion with respect to the specific application of the net proceeds of the Public Offering, although substantially all of the net proceeds of the Public Offering are intended to be generally applied toward consummating an Initial Business Combination. The Initial Business Combination must occur with one or more target businesses that together have a fair market value of at least 80% of the assets held in the Trust Account (excluding the deferred underwriting discounts and commissions and taxes payable on the interest earned on the Trust Account) at the time of the agreement to enter into the Initial Business Combination. Furthermore, there is no assurance that the Company will be able to successfully effect an Initial Business Combination.
The Company, after signing a definitive agreement for an Initial Business Combination, will either (i) seek stockholder approval of the Initial Business Combination at a meeting called for such purpose in connection with which stockholders may seek to redeem their Public Shares, regardless of whether they vote for or against the Initial Business Combination, for cash equal to their pro rata share of the aggregate amount on deposit in the Trust Account as of two business days prior to the consummation of the Initial Business Combination, including interest not previously released to the Company to pay its franchise and income taxes, or (ii) provide stockholders with the opportunity to sell their Public Shares to the Company by means of a tender offer (and thereby avoid the need for a stockholder vote) for an amount in cash equal to their pro rata share of the aggregate amount on deposit in the Trust Account as of two business days prior to the consummation of the Initial Business Combination, including interest not previously released to the Company to pay its franchise and income taxes. The decision as to whether the Company will seek stockholder approval of the Initial Business Combination or will allow stockholders to sell their Public Shares in a tender offer will be made by the Company, solely in its discretion, and will be based on a variety of factors such as the timing of the transaction and whether the terms of the transaction would otherwise require the Company to seek stockholder approval, unless a vote is required by law or under New York Stock Exchange rules. If the Company seeks stockholder approval, it will complete its Initial Business Combination only if a majority of the outstanding shares of common stock voted are voted in favor of the Initial Business Combination. However, in no event will the Company redeem its Public Shares in an amount that would cause its net tangible assets to be less than $5,000,001. In such case, the Company would not proceed with the redemption of its Public Shares and the related Initial Business Combination, and instead may search for an alternate Initial Business Combination.
If the Company holds a stockholder vote or there is a tender offer for shares in connection with an Initial Business Combination, a stockholder will have the right to redeem his, her or its Public Shares for an amount in cash equal to his, her or its pro rata share of the aggregate amount on deposit in the Trust Account as of two business days prior to the consummation of the Initial Business Combination, including interest not previously released to the Company to pay its franchise and income taxes. As a result, such Public Shares are recorded at redemption amount and classified as temporary equity upon the completion of the Public Offering, in accordance with the Financial Accounting Standards Board (“”) Accounting Standards Codification (“”) 480, “.”
FASB
ASC
Distinguishing Liabilities from Equity
Pursuant to the Company’s amended and restated certificate of incorporation, if the Company is unable to complete an Initial Business Combination within 24 months from the closing of the Public Offering, or August 24, 2020 (which was extended for an additional six months, from August 14, 2020 to February 14, 2021, as described above), the Company will (i) cease all operations except for the purpose of winding up, (ii) as promptly as reasonably possible but no more than ten business days thereafter subject to lawfully available funds therefor, redeem the Public Shares, at a
per-share
price, payable in cash, equal to the aggregate amount then on deposit in the Trust Account, including interest earned on the funds held in the Trust Account and not previously released to the Company to pay the Company’s franchise and income taxes (less up to $100,000 of such net interest to pay dissolution expenses), divided by the number of then outstanding Public Shares, which redemption will completely extinguish public stockholders’ rights as stockholders (including the right to receive further liquidating distributions, if any), subject to applicable law, and (iii) as promptly as reasonably possible following such redemption, subject to the approval of the Company’s remaining stockholders and the Company’s board of directors, dissolve and liquidate, subject in each case to theF-60
SPARTAN ENERGY ACQUISITION CORP.
NOTES TO CONDENSED FINANCIAL STATEMENTS—CONTINUED
Company’s obligations under Delaware law to provide for claims of creditors and the requirements of other applicable law. The Sponsor and the Company’s officers and directors have entered into a letter agreement with the Company, pursuant to which they have agreed to waive their rights to liquidating distributions from the Trust Account with respect to any Founder Shares (as defined below) held by them if the Company fails to complete the Initial Business Combination within 24 months of the closing of the Public Offering (which was extended to February 14, 2021, as described below). However, if the Sponsor or any of the Company’s directors, officers or affiliates acquires shares of Class A common stock in or after the Public Offering, they will be entitled to liquidating distributions from the Trust Account with respect to such shares if the Company fails to complete the Initial Business Combination within the prescribed time period.
F-61
SPARTAN ENERGY ACQUISITION CORP.
NOTES TO CONDENSED FINANCIAL STATEMENTS—CONTINUED
In the event of a liquidation, dissolution or winding up of the Company after an Initial Business Combination, the Company’s stockholders are entitled to share ratably in all assets remaining available for distribution to them after payment of liabilities and after provision is made for each class of stock, if any, having preference over the common stock. The Company’s stockholders have no preemptive or other subscription rights. There are no sinking fund provisions applicable to the common stock, except that the Company will provide its stockholders with the opportunity to redeem their Public Shares for cash equal to their pro rata share of the aggregate amount then on deposit in the Trust Account, upon the completion of the Initial Business Combination, subject to the limitations described herein.
Going Concern and Liquidity Considerations
As of September 30, 2020, the Company had $164,923 in its operating bank account, approximately $17.0 million of cumulative investment income available in the Trust Account to pay for franchise and income taxes (less up to $100,000 of investment income to pay dissolution expenses), and working deficit of approximately $4.2 million.
Through September 30, 2020, the Company’s liquidity needs have been satisfied through receipt of a $25,000 capital contribution from the Sponsor in exchange for the issuance of the Founder Shares (Note 4) to the Sponsor, an aggregate of approximately $3.2 million in advances due to related party, which is discussed in Note 4, and the net proceeds from investment income released from Trust Account since inception of approximately $4.5 million for taxes. The Company repaid the loans of $1.6 million from the Sponsor in full in February 2018. The Company may not have sufficient liquidity to meets its future obligations and anticipates that it may need to obtain additional loans from the Sponsor or obtain funding from other sources in order to satisfy our working capital requirements through August 14, 2020, our mandatory liquidation date (which was extended to February 14, 2021, as described below), if the Company does not consummate a business combination.
Management continues to evaluate the impact of the
COVID-19
pandemic and has concluded that while it is reasonably possible that it could have a negative effect on the Company’s financial position, results of operations and pending business combination, the specific impact is not readily determinable as of the date of these financial statements. The financial statements do not include any adjustments that might result from the outcome of this uncertainty.In connection with the Company’s assessment of going concern considerations in accordance with FASB’s Accounting Standards Update the Company determined that the liquidity, mandatory liquidation and subsequent dissolution provisions discussed above raise substantial doubt about the Company’s ability to continue as a going concern. No adjustments have been made to the carrying amounts of assets or liabilities should the Company be required to liquidate after February 14, 2021.
2014-15,
“Disclosure of Uncertainties about an Entity’s Ability to Continue as a Going Concern,”
NOTE 2. SUMMARY OF SIGNIFICANT ACCOUNTING POLICIES
Basis of Presentation
The accompanying unaudited condensed interim financial statements of the Company are presented in U.S. dollars in conformity with accounting principles generally accepted in the United States of America (“”) and pursuant to the accounting and disclosure rules and regulations of the SEC, and reflect all adjustments, consisting only of normal recurring adjustments, which are, in the opinion of management, necessary for a fair presentation of the financial position as of September 30, 2020 and the results of operations and cash flows for the periods presented. Certain information and disclosures normally included in financial statements prepared in accordance with GAAP have been
GAAP
omitted
pursuant to such rules and regulations. Interim results are not necessarily indicative of results for a full year.F-62
SPARTAN ENERGY ACQUISITION CORP.
NOTES TO CONDENSED FINANCIAL STATEMENTS—CONTINUED
The accompanying unaudited condensed interim financial statements should be read in conjunction with the audited financial statements and notes thereto included in the Form
10-K
filed by the Company with the SEC on March 12, 2020.Emerging Growth Company
Section 102(b)(1) of the JOBS Act exempts emerging growth companies from being required to comply with new or revised financial accounting standards until private companies (that is, those that have not had a Securities Act registration statement declared effective or do not have a class of securities registered under the Securities Exchange Act of 1934, as amended) are required to comply with the new or revised financial accounting standards. The JOBS Act provides that a company can elect to opt out of the extended transition period and comply with the requirements that apply to
non-emerging
growth companies, but any such election to opt out is irrevocable. The Company has elected not to opt out of such extended transition period, which means that when a standard is issued or revised and it has different application dates for public or private companies, the Company, as an emerging growth company, can adopt the new or revised standard at the time private companies adopt the new or revised standard. This may make comparison of the Company’s financial statements with another public company which is neither an emerging growth company nor an emerging growth company which has opted out of using the extended transition period difficult or impossible because of the potential differences in accounting standards used.Net Income Per Share of Common Stock
The Company complies with accounting and disclosure requirements of FASB ASC Topic 260, “ Net income per share is computed by dividing net income applicable to common stockholders by the weighted average number of shares of common stock outstanding for the period. The Company has not considered the effect of the warrants sold in the Public Offering and Private Placement Warrants to purchase an aggregate of 27,760,000 shares of Class A common stock in the calculation of diluted earnings per share, since their inclusion would be anti-dilutive under the treasury stock method. As a result, diluted earnings per share is the same as basic earnings per share for the period.
Earnings Per Share.”
The Company’s statements of operations include a presentation of income per share for Class A common stock subject to redemption in a manner similar to the
two-class
method of income per share. Net income (loss) per share, basic and diluted for Class A common stock is calculated by dividing the investment income earned on the Trust Account of $74,232 and $3,146,769, respectively, net of applicable taxes of $55,413 and $700,646, respectively, by the weighted average number of 55,195,379 and 55,200,000 shares of Class A common stock outstanding since the initial issuance for the three months ended September 30, 2020 and 2019, respectively. Net income per share, basic and diluted for Class A common stock is calculated by dividing the investment income earned on the Trust Account of $4,554,058 and $9,927,002, respectively, net of applicable taxes of $1,074,960 and $2,202,846, respectively, by the weighted average number of55,198,449
and55,200,000
shares of Class A common stock outstanding since the initial issuance for the nine months ended September 30, 2020 and 2019, respectively. Net loss per share, basic and diluted for Class B common stock is calculated by dividing the net income (loss), less income attributable to Class A common stock, by the weighted average number of shares of Class B common stock outstanding for the period.Cash and Cash Equivalents
The Company considers all short-term investments with an original maturity of three months or less when purchased to be cash equivalents.
F-63
SPARTAN ENERGY ACQUISITION CORP.
NOTES TO CONDENSED FINANCIAL STATEMENTS—CONTINUED
Concentration of Credit Risk
Financial instruments that potentially subject the Company to concentration of credit risk consist of cash accounts in a financial institution which, at times, may exceed the Federal depository insurance coverage of $250,000. As of September 30, 2020, the Company has not experienced losses on these accounts and management believes the Company is not exposed to significant risks on such accounts.
F-64
SPARTAN ENERGY ACQUISITION CORP.
NOTES TO CONDENSED FINANCIAL STATEMENTS—CONTINUED
Financial Instruments
The fair value of the Company’s assets and liabilities, which qualify as financial instruments under FASB ASC 820, “,” approximates the carrying amounts represented in the balance sheets.
Fair Value Measurements and Disclosures
Fair Value Measurements
Fair value is defined as the price that would be received for sale of an asset or paid for transfer of a liability, in an orderly transaction between market participants at the measurement date. GAAP establishes a three-tier fair value hierarchy, which prioritizes the inputs used in measuring fair value. The hierarchy gives the highest priority to unadjusted quoted prices in active markets for identical assets or liabilities (Level 1 measurements) and the lowest priority to unobservable inputs (Level 3 measurements). These tiers include:
| • | Level 1, defined as observable inputs such as quoted prices (unadjusted) for identical instruments in active markets; |
| • | Level 2, defined as inputs other than quoted prices in active markets that are either directly or indirectly observable such as quoted prices for similar instruments in active markets or quoted prices for identical or similar instruments in markets that are not active; and |
| • | Level 3, defined as unobservable inputs in which little or no market data exists, therefore requiring an entity to develop its own assumptions, such as valuations derived from valuation techniques in which one or more significant inputs or significant value are unobservable. |
In some circumstances, the inputs used to measure fair value might be categorized within different levels of the fair value hierarchy. In those instances, the fair value measurement is categorized in its entirety in the fair value hierarchy based on the lowest level input that is significant to the fair value measurement.
Use of Estimates
The preparation of the financial statements in conformity with GAAP requires the Company’s management to make estimates and assumptions that affect the reported amounts of assets and liabilities and disclosure of contingent assets and liabilities at the date of the financial statements and the reported amounts of expenses during the reporting periods. Actual results could differ from those estimates.
Class A Common Stock Subject to Possible Redemption
The Company accounts for its Class A common stock subject to possible redemption in accordance with the guidance in ASC Topic 480 Shares of Class A common stock subject to mandatory redemption (if any) are classified as liability instruments and are measured at fair value. Shares of conditionally redeemable Class A common stock (including Class A common stock that feature redemption rights that are either within the control of the holder or subject to redemption upon the occurrence of uncertain events not solely within the Company’s control) are classified as temporary equity. At all other times, shares of Class A common stock are classified as stockholders’ equity. The Company’s Class A common stock features certain redemption rights that are considered to be outside of the Company’s control and subject to the occurrence of uncertain future events.
“Distinguishing Liabilities from Equity.”
As discussed in Note 1, all of the 55,192,542 Public Shares contain a redemption feature which allows for the redemption of Class A common stock under the Company’s liquidation or tender offer/stockholder approval provisions. In accordance with FASB ASC 480, redemption provisions not solely within the control of the Company require the security to be classified outside of permanent equity. Ordinary liquidation events, which involve the redemption and liquidation of all of the entity’s equity instruments, are excluded from the provisions of FASB ASC 480. Although the Company has not specified a maximum redemption threshold, its amended and restated certificate of incorporation provides that in no event will the Company redeem its Public Shares in an amount that would cause its net tangible assets to be less than $5,000,001.
F-6
5
SPARTAN ENERGY ACQUISITION CORP.
NOTES TO CONDENSED FINANCIAL STATEMENTS—CONTINUED
The Company recognizes changes in redemption value immediately as they occur and will adjust the carrying value of the security at the end of each reporting period. Increases or decreases in the carrying amount of redeemable shares of Class A common stock shall be affected by charges against additional
paid-in
capital.At September 30, 2020, 54,055,562 of the 55,192,542 outstanding shares of Class A common stock were classified outside of permanent equity. At December 31, 2019, 54,133,917 of the 55,200,000 outstanding shares of Class A common stock were classified outside of permanent equity.
Income Taxes
The Company follows the asset and liability method of accounting for income taxes under FASB ASC 740,Deferred tax assets and liabilities are recognized for the estimated future tax consequences attributable to differences between the financial statement carrying amounts of existing assets and liabilities and their respective tax bases. Deferred income tax assets and liabilities are measured using enacted tax rates expected to apply to taxable income in the years in which those temporary differences are expected to be recovered or settled. The effect on deferred tax assets and liabilities of a change in tax rates is recognized in income in the period that included the enactment date. Valuation allowances are established, when necessary, to reduce deferred tax assets to the amount expected to be realized. Management has determined that a full valuation allowance on the deferred tax asset (related to
“Income Taxes.”
start-up
costs) is appropriate at this time after consideration of all available positive and negative evidence related to the realization of the deferred tax asset.FASB ASC 740 prescribes a recognition threshold and a measurement attribute for the financial statement recognition and measurement of tax positions taken or expected to be taken in a tax return. For those benefits to be recognized, a tax position must be more likely than not to be sustained upon examination by taxing authorities. There were no unrecognized tax benefits as of September 30, 2020 or December 31, 2019. The Company recognizes accrued interest and penalties related to unrecognized tax benefits as income tax expense. No amounts were accrued for the
payment
of interest and penalties at September 30, 2020 or December 31, 2019. The Company is currently not aware of any issues under review that could result in significant payments, accruals or material deviation from its position. The Company is subject to income tax examinations by major taxing authorities since inception.Subsequent Events
Management has evaluated subsequent events to determine if events or transactions occurring through the date the financial statements were available for issuance, require potential adjustment to or disclosure in the financial statements and has concluded that all such events that would require recognition or disclosure have been recognized or disclosed.
Recent Accounting Pronouncements
The Company’s management does not believe that any recently issued, but not yet effective, accounting pronouncements, if currently adopted, would have a material effect on the Company’s financial statements.
NOTE 3. PUBLIC OFFERING
The Company sold 55,200,000 Units in the Public Offering, including 7,200,000 Units that were issued pursuant to the underwriters’ full exercise of their over-allotment option, at a price of $10.00 per Unit. Simultaneously with the closing of the Public Offering, the Sponsor purchased an aggregate of 9,360,000 Private Placement Warrants at a purchase price of $1.50 per warrant, or approximately $14,040,000 in the aggregate.
F-66
SPARTAN ENERGY ACQUISITION CORP.
NOTES TO CONDENSED FINANCIAL STATEMENTS—CONTINUED
Each Unit consists of one share of the Company’s Class A common stock, $0.0001 par value per share, and” and, collectively, the “”). Each whole Warrant entitles the holder to purchase one share of Class A common stock at a price of $11.50 per share. No fractional shares will be issued upon separation of the Units and only whole Warrants will trade. Each Warrant will become exercisable on the later of 30 days after the completion of an Initial Business Combination or 12 months from the closing of the Public Offering and will expire five years after the completion of an Initial Business Combination or earlier upon redemption or liquidation. Once the Warrants become exercisable, the Company may redeem the outstanding Warrants in whole and not in part at a price of $0.01 per Warrant upon a minimum of 30 days’ prior written notice of redemption, if and only if the last sale price of the Company’s Class A common stock has been at least $18.00 per share on each of 20 trading days within the 30
one-third
of one warrant (each, a “Warrant
Warrants
trading-day
period ending on the third business day prior to the date on which the Company sent the notice of redemption to the Warrant holders.F-67
SPARTAN ENERGY ACQUISITION CORP.
NOTES TO CONDENSED FINANCIAL STATEMENTS—CONTINUED
As noted above, the underwriters exercised the
45-day
option to purchase up to 7,200,000 additional Units to cover any over-allotments at the Public Offering price less the underwriting discounts and commissions. The Units that were issued in connection with the over-allotment option were identical to the other Units issued in the Public Offering.The Company paid an underwriting discount of 2.0% of the gross offering proceeds, or $11.04 million in the aggregate, to the underwriters at the closing of the Public Offering, with an additional fee (the “”) of 3.5% of the gross offering proceeds, or $19.32 million in the aggregate, payable upon the Company’s completion of an Initial Business Combination. The Deferred Discount will become payable to the underwriters from the amounts held in the Trust Account solely in the event the Company completes an Initial Business Combination.
Deferred Discount
NOTE 4. RELATED PARTY TRANSACTIONS
Founder Shares
In October 2017, the Sponsor purchased 14,375,000 shares of the Company’s Class B common stock (the “”) for $25,000, or approximately $0.002 per share. In July 2018, the Sponsor surrendered 2,875,000 shares of its Class B common stock for no consideration. In August 2018, the Company effected a stock dividend with respect to the Class B common stock of 2,300,000 shares thereof, resulting in the Sponsor holding an aggregate of 13,800,000 shares of Class B common stock. As used herein, unless the context otherwise requires, “Founder Shares” shall be deemed to include the shares of Class A common stock issuable upon conversion thereof. The Founder Shares are identical to the Class A common stock included in the Units sold in the Public Offering except that the Founder Shares are shares of Class B common stock which automatically convert into shares of Class A common stock at the time of the Initial Business Combination and are subject to certain transfer restrictions, as described in more detail below. In August 2018, prior to the Public Offering, the Sponsor transferred 150,000 Founder Shares to each of the Company’s two independent directors at their original purchase price. In July 2019, the Company’s Sponsor transferred 75,000 Founder Shares to a newly appointed independent director at their original purchase price. In April 2020, the Sponsor transferred 37,500 Founder Shares to the Company’s third independent director at their original purchase price. The Founder Shares were issued in connection with our organization pursuant to the exemption from registration contained in Section 4(a)(2) of the Securities Act of 1933, as amended (the “Securities Act”).
Founder Shares
The holders of the Founders Shares have agreed, subject to limited exceptions, not to transfer, assign or sell any of their Founder Shares until the earlier to occur of: (A) one year after the completion of an Initial Business Combination or (B) subsequent to an Initial Business Combination, (x) if the last reported sale price of the Company’s Class A common stock equals or exceeds $12.00 per share (as adjusted for stock splits, stock dividends, reorganizations, recapitalizations and the like) for any 20 trading days within any
30-trading
day period commencing at least 150 days after the consummation of an Initial Business Combination, or (y) the date on which the Company completes a liquidation, merger, stock exchange or other similar transaction that results in all of the Company’s stockholders having the right to exchange their shares of common stock for cash, securities or other property.Private Placement
Concurrently with the closing of the Public Offering, the Sponsor purchased an aggregate of 9,360,000 Private Placement Warrants at a price of $1.50 per warrant ($14,040,000 in the aggregate) in the Private Placement. Each Private Placement Warrant is exercisable for one share of the Company’s Class A common stock at a price of $11.50 per share. A portion of the purchase price of the Private Placement Warrants was added to the proceeds from the Public Offering held in the Trust Account. If the Initial Business Combination is not completed within 24 months from the closing of the Public Offering (unless extended, as described above), the proceeds from the sale of the Private Placement Warrants held in the Trust Account will be used to fund the redemption of the Public Shares (subject to the requirements of applicable law) and the Private Placement Warrants will expire worthless. The Private Placement Warrants will be
non-redeemable
and exercisable on a cashless basis so long as they are held by the Sponsor or its permitted transferees.F-68
SPARTAN ENERGY ACQUISITION CORP.
NOTES TO CONDENSED FINANCIAL STATEMENTS—CONTINUED
The Sponsor and the Company’s officers and directors agreed, subject to limited exceptions, not to transfer, assign or sell any of their Private Placement Warrants until 30 days after the completion of the Initial Business Combination.
Registration Rights
The holders of the Founder Shares, Private Placement Warrants and equity securities that may be issued upon conversion of working capital loans, if any (and any Class A common shares issuable upon the conversion of any Founder Shares and the exercise of the Private Placement Warrants and equity securities that may be issued upon conversion of working capital loans) are entitled to registration rights pursuant to a registration rights agreement signed on August 9, 2018, which will be amended and restated in connection with closing of the Proposed Transactions (as defined below). The holders of these securities are entitled to make up to three demands, excluding short form demands, that the Company register such securities. In addition, the holders have certain “piggy-back” registration rights. The Company will bear the expenses incurred in connection with the filing of any such registration statements.
Related Party Advances
The Sponsor or affiliates of the Sponsor paid certain administrative expenses and offering costs on behalf of the Company. These advances are due on demand and are
non-interest
bearing. Since inception through September 30, 2020, the related party advanced an aggregate of approximately $3.2 million to the Company. During the nine months ended September 30, 2020 and 2019, the related party paid $1,643,368 and $447,097, respectively, of other expenses on behalf of the Company and the Company had repaid the related party $258,250 and $502,529, respectively, for advances. As of September 30, 2020 and December 31, 2019, there were $1,385,118 and $0 due to the related parties, respectively.During the nine months ended September 30, 2020, the Company paid certain expenses totaling $11,801 on behalf of the Sponsor. As of September 30, 2020, the amount due to the Company from the Sponsor was $0.
Prior to the closing of the Public Offering, an affiliate of the Sponsor advanced the Company $294,354 to be used for a portion of the expenses of the Public Offering. Upon the closing of the Public Offering, the Company repaid the affiliate of the Sponsor $294,354 in settlement of the outstanding advances.
Administrative Service Fee
The Company, commencing on August 10, 2018, has agreed to pay the Sponsor a total of $10,000 per month for office space, utilities, secretarial support and administrative services. Upon completion of the Initial Business Combination or the Company’s liquidation, the Company will cease paying these monthly fees. The Company paid the Sponsor $30,000 and $30,000 for such services for the three months ended September 30, 2020 and 2019, respectively. The Company paid the Sponsor $90,000 and $90,000 for such services for the nine months ended September 30, 2020 and 2019, respectively.
Forward Purchase Agreement
On August 9, 2018, the Company entered into a forward purchase agreement (the “”) pursuant to which an affiliate of the Sponsor agreed to purchase an aggregate of up to 30,000,000 shares of the Company’s Class A common stock (the “”), plus an aggregate of up to 10,000,000 warrants (the “” and, together with the Forward Purchase Shares, the “”), for an aggregate purchase price of up to $300,000,000 or $10.00 per unit. Each Forward Purchase Warrant will have the same terms as each of the Private Placement Warrants.
Forward Purchase
Agreement
Forward Purchase Shares
Forward Purchase Warrants
Forward Purchase Units
F-6
9
SPARTAN ENERGY ACQUISITION CORP.
NOTES TO CONDENSED FINANCIAL STATEMENTS—CONTINUED
The obligations under the Forward Purchase Agreement do not depend on whether any public stockholders elect to redeem their shares in connection with the Initial Business Combination and provide the Company with a minimum funding level for the Initial Business Combination. Additionally, the obligations of the affiliate of the Sponsor to purchase the Forward Purchase Units are subject to termination prior to the closing of the sale of the Forward Purchase Units by mutual written consent of the Company and such affiliate, or automatically: (i) if the Initial Business Combination is not consummated within 24 months from the closing of the Public Offering, unless extended up to a maximum of sixty (60) days in accordance with the amended and restated certificate of incorporation; or (ii) if the affiliate of the Sponsor or the Company become subject to any voluntary or involuntary petition under the United States federal bankruptcy laws or any state insolvency law, in each case which is not withdrawn within sixty (60) days after being filed, or a receiver, fiscal agent or similar officer is appointed by a court for business or property of the affiliate of the Sponsor or the Company in each case which is not removed, withdrawn or terminated within sixty (60) days after such appointment. In addition, the obligations of the affiliate of the Sponsor to purchase the Forward Purchase Units are subject to fulfillment of customary closing conditions, including that the Initial Business Combination must be consummated substantially concurrently with the purchase of the Forward Purchase Units. The Company did not require the Sponsor to Purchase the Forward Purchase Units in connection with the Proposed Transactions.
F-70
SPARTAN ENERGY ACQUISITION CORP.
NOTES TO CONDENSED FINANCIAL STATEMENTS—CONTINUED
NOTE 5. DEFERRED UNDERWRITING COMMISSIONS
The Company is committed to pay the Deferred Discount of 3.5% of the gross proceeds of the Public Offering, or $19,320,000, to the underwriters of the Public Offering upon the Company’s completion of an Initial Business Combination. The underwriters are not entitled to receive any of the interest earned on Trust Account funds that would be used to pay the Deferred Discount, and no Deferred Discount is payable to the underwriters if an Initial Business Combination is not completed within 24 months after the Public Offering (unless extended, as described above).
NOTE 6. ENTRY INTO A MATERIAL DEFINITIVE AGREEMENT
On July 10, 2020, the Company entered into a business combination agreement and plan of reorganization (the “Business Combination Agreement”) with Spartan Merger Sub Inc., a Delaware corporation and the Company’s wholly owned subsidiary of (“Merger Sub”), and Fisker Inc., a Delaware corporation (“Fisker”), pursuant to which Merger Sub will be merged with and into Fisker (the “Merger,” together with the other transactions related thereto, the “Proposed Transactions”), with Fisker surviving the Merger as the Company’s wholly owned subsidiary. The parties expect the Proposed Transactions to be completed in the fourth quarter of 2020, subject to, among other things, the approval of the Proposed Transactions by the Company’s stockholders, satisfaction of the conditions stated in the Business Combination Agreement and other customary closing conditions.
In connection with the execution of the Business Combination Agreement, on July 10, 2020, the Sponsor entered into a Sponsor Agreement with the Company pursuant to which the Sponsor will, immediately prior to, and conditioned upon, the effective time of the Merger, automatically and irrevocably surrender and forfeit to the Company, for no consideration and as a contribution to our capital, 441,176 shares of the Company’s Class B common stock, par value $0.0001 per share (the “Sponsor Shares”), whereupon the Sponsor Shares will be canceled.
In connection with the execution of the Business Combination Agreement, on July 10, 2020, the Company entered into separate subscription agreements (collectively, the “Subscription Agreements”) with a number of investors (collectively, the “Subscribers”), pursuant to which the Subscribers agreed to purchase, and the Company agreed to sell to the Subscribers, an aggregate of 50,000,000 shares of the Company’s Class A common stock, par value $0.0001 per share (the “PIPE Shares”), for a purchase price of $10.00 per share and an aggregate purchase price of $500,000,000, in a private placement (the “PIPE”).
The closing of the sale of the PIPE Shares pursuant to the Subscription Agreements is contingent upon, among other customary closing conditions, the concurrent consummation of the Proposed Transactions. The purpose of the PIPE is to raise additional capital for use by the combined company following the closing of the Merger.
Pursuant to the Subscription Agreements, the Company agreed that, within 30 calendar days after the consummation of the Proposed Transactions, the Company will file with the SEC (at its sole cost and expense) a registration statement registering the resale of the PIPE Shares (the “PIPE Resale Registration Statement”), and that the Company will use our commercially reasonable efforts to have the PIPE Resale Registration Statement declared effective as soon as practicable after the filing thereof.
On October 5, 2020, the Company filed a definitive proxy statement with the SEC in regards to the above business combination agreement as well as additional proposals for stockholders to vote on at a special meeting on October 28, 2020.
F-
71
SPARTAN ENERGY ACQUISITION CORP.
NOTES TO CONDENSED FINANCIAL STATEMENTS—CONTINUED
NOTE 7. STOCKHOLDERS’ EQUITY
Common Stock
The authorized common stock of the Company includes 200,000,000 shares of Class A common stock and 20,000,000 shares of Class B common stock. If the Company enters into an Initial Business Combination, it may (depending on the terms of such an Initial Business Combination) be required to increase the number of shares of Class A common stock which the Company is authorized to issue at the same time as the Company’s stockholders vote on the Initial Business Combination to the extent the Company seeks stockholder approval in connection with the Initial Business Combination. Holders of the Company’s common stock are entitled to one vote for each share of common stock. At September 30, 2020, there were 55,192,542 shares of Class A common stock issued and outstanding (of which 54,055,562 were classified outside of permanent equity) and 13,800,000 shares of Class B common stock issued and outstanding. At December 31, 2019, there were 55,200,000 shares of Class A common stock issued and outstanding (of which 54,133,917 were classified outside of permanent equity) and 13,800,000 shares of Class B common stock issued and outstanding. All shares and the associated amounts have been retroactively restated to reflect: (i) the forfeiture of 2,875,000 shares of Class B common stock in July 2018; and (ii) the stock dividend of 2,300,000 shares of Class B common stock in August 2018.
In connection with the Charter Amendment on August 4, 2020, the holders of 7,458 shares of Class A Common Stock properly exercised their right to redeem their shares for cash at a redemption price of approximately $10.31 per share, for an aggregate redemption amount of approximately $76,922.
F-72
SPARTAN ENERGY ACQUISITION CORP.
NOTES TO CONDENSED FINANCIAL STATEMENTS—CONTINUED
Preferred Stock
The Company is authorized to issue 1,000,000 shares of preferred stock with such designations, voting and other rights and preferences as may be determined from time to time by the Company’s board of directors. At September 30, 2020 and December 31, 2019, there were no shares of preferred stock issued or outstanding.
Warrants
The Warrants will become exercisable on the later of (a) 30 days after the completion of an Initial Business Combination or (b) 12 months from the closing of the Public Offering; provided in each case that the Company has an effective registration statement under the Securities Act covering the Class A common stock issuable upon exercise of the Warrants and a current prospectus relating to them is available (or the Company permits holders to exercise their Public Warrants on a cashless basis and such cashless exercise is exempt from registration under the Securities Act). The Company has agreed that as soon as practicable, but in no event later than 15 business days, after the closing of its Initial Business Combination, the Company will use its best efforts to file with the SEC a registration statement for the registration, under the Securities Act, of the Class A common stock issuable upon exercise of the Warrants. The Company will use its best efforts to cause the same to become effective and to maintain the effectiveness of such registration statement, and a current prospectus relating thereto, until the expiration of the Warrants in accordance with the provisions of the warrant agreement. If the Class A common stock is at the time of any exercise of a Warrant not listed on a national securities exchange such that it satisfies the definition of a “covered security” under Section 18(b)(1) of the Securities Act, the Company may, at its option, require holders of Warrants who exercise their Warrants to do so on a “cashless basis” in accordance with Section 3(a)(9) of the Securities Act or another exemption. The Warrants will expire five years after the completion of an Initial Business Combination or earlier upon redemption or liquidation.
The Private Placement Warrants are identical to the Warrants, except that the Private Placement Warrants and the Class A common stock issuable upon exercise of the Private Placement Warrants will not be transferable, assignable or salable until 30 days after the completion of an Initial Business Combination, subject to certain limited exceptions. Additionally, the Private Placement Warrants will
be non-redeemable so
long as they are held by the Sponsor or any of its permitted transferees. If the Private Placement Warrants are held by someone other than the Sponsor or its permitted transferees, the Private Placement Warrants will be redeemable by the Company and exercisable by such holders on the same basis as the Warrants.The Company may call the Warrants for redemption (except with respect to the Private Placement Warrants):
| • | in whole and not in part; |
| • | at a price of $0.01 per warrant; |
| • | upon a minimum of 30 days prior written notice of redemption; and |
| • | if, and only if, the last reported sales price of the Class A common stock has been at least $18.00 per share on each of 20 trading days within the 30 trading-day period ending on the third business day prior to the date on which the Company sends the notice of redemption to the Warrant holders. |
If the Company calls the Warrants for redemption, management will have the option to require all holders that wish to exercise the Warrants to do so on a cashless basis. In no event will the Company be required to net cash settle the Warrant exercise. If the Company is unable to complete an Initial Business Combination within 24 months from the closing of the Public Offering (unless extended, as described above) and the Company liquidates the funds held in the Trust Account, holders of Warrants will not receive any of such funds with respect to their Warrants, nor will they receive any distribution from the Company’s assets held outside of the Trust Account with respect to such Warrants. Accordingly, the Warrants may expire worthless.
F-
73
SPARTAN ENERGY ACQUISITION CORP.
NOTES TO CONDENSED FINANCIAL STATEMENTS—CONTINUED
NOTE 8. FAIR VALUE MEASUREMENTS
The following table presents information about the Company’s assets that are measured on a recurring basis as of September 30, 2020 and December 31, 2019 and indicates the fair value hierarchy of the valuation techniques that the Company utilized to determine such fair value.
Description | Fair Value | Quoted Prices in Active Markets (Level 1) | Significant Other Observable Inputs (Level 2) | Significant Other Unobservable Inputs (Level 3) | ||||||||||||
Investment held in Trust Account | ||||||||||||||||
September 30, 2020 | $ | 569,041,175 | $ | 569,041,175 | $ | — | $ | — | ||||||||
December 31, 2019 | $ | 565,152,589 | $ | 565,152,589 | $ | — | $ | — | ||||||||
At September 30, 2020 and December 31, 2019, the investments held in the Trust Account were held in U.S. Treasury Money Market Funds.
F-74
SPARTAN ENERGY ACQUISITION CORP.
NOTES TO CONDENSED FINANCIAL STATEMENTS—CONTINUED
NOTE 9. SUBSEQUENT EVENTS
On October 5, 2020, the Company filed a definitive proxy statement with the SEC in regards to the above business combination agreement as well as additional proposals for stockholders to vote on at a special meeting on October 28, 2020.
F-
75
Report of Independent Registered Public Accounting Firm
To the Stockholders and the Board of Directors of
Spartan Energy Acquisition Corp.
Opinion on the Financial Statements
We have audited the accompanying balance sheets of Spartan Energy Acquisition Corp. (the “Company”), as of December 31, 2019 and 2018, the related statements of operations, changes in stockholders’ equity and cash flows for each of the two years in the period ended December 31, 2019, and the related notes (collectively referred to as the “financial statements”). In our opinion, the financial statements present fairly, in all material respects, the financial position of the Company as of December 31, 2019 and 2018, and the results of its operations and its cash flows for each of the two years in the period ended December 31, 2019, in conformity with accounting principles generally accepted in the United States of America.
Going Concern
The accompanying financial statements have been prepared assuming that the Company will continue as a going concern. As discussed in Note 1 to the consolidated financial statements, if the Company is unable to complete a an Initial Business Combination by the close of business on August 14, 2020, then the Company will cease all operations except for the purpose of liquidating. This date for mandatory liquidation and subsequent dissolution raises substantial doubt about the Company’s ability to continue as a going concern. The financial statements do not include any adjustments that might result from the outcome of this uncertainty.
Basis for Opinion
These financial statements are the responsibility of the Company’s management. Our responsibility is to express an opinion on the Company’s financial statements based on our audits. We are a public accounting firm registered with the Public Company Accounting Oversight Board (United States) (“PCAOB”) and are required to be independent with respect to the Company in accordance with the U.S. federal securities laws and the applicable rules and regulations of the Securities and Exchange Commission and the PCAOB.
We conducted our audits in accordance with the standards of the PCAOB. Those standards require that we plan and perform the audits to obtain reasonable assurance about whether the financial statements are free of material misstatement, whether due to error or fraud. The Company is not required to have, nor were we engaged to perform, an audit of its internal control over financial reporting. As part of our audits we are required to obtain an understanding of internal control over financial reporting but not for the purpose of expressing an opinion on the effectiveness of the entity’s internal control over financial reporting. Accordingly, we express no such opinion.
Our audits included performing procedures to assess the risks of material misstatement of the financial statements, whether due to error or fraud, and performing procedures that respond to those risks. Such procedures included examining, on a test basis, evidence regarding the amounts and disclosures in the financial statements. Our audits also included evaluating the accounting principles used and significant estimates made by management, as well as evaluating the overall presentation of the financial statements. We believe that our audits provide a reasonable basis for our opinion.
/s/ WithumSmith+Brown, PC
We have served as the Company’s auditor since 2017.
New York, New York
March 12, 2020
F-76
SPARTAN ENERGY ACQUISITION CORP.
BALANCE SHEETS
December 31, 2019 | December 31, 2018 | |||||||
ASSETS | ||||||||
Current assets: | ||||||||
Cash and cash equivalent | $ | 548,761 | $ | 1,531,595 | ||||
Prepaid expenses | 273,831 | 248,329 | ||||||
Total current assets | 822,592 | 1,779,924 | ||||||
Investment held in Trust Account | 565,152,589 | 555,695,763 | ||||||
Total assets | $ | 565,975,181 | $ | 557,475,687 | ||||
LIABILITIES AND STOCKHOLDERS’ EQUITY | ||||||||
Current liabilities: | ||||||||
Accounts payable and accrued expenses | $ | 116,001 | $ | 22,249 | ||||
Advances from related party | 0 | 204,949 | ||||||
Accrued income and franchise taxes | 200,000 | 398,369 | ||||||
Total current liabilities | 316,001 | 625,567 | ||||||
Deferred underwriting commissions | 19,320,000 | 19,320,000 | ||||||
Total liabilities | 19,636,001 | 19,945,567 | ||||||
Commitments and contingencies | ||||||||
Class A common stock subject to possible redemption; 54,133,917 and 53,253,011 shares at December 31, 2019 and 2018, respectively (at approximately $10.00 per share) | 541,339,170 | 532,530,110 | ||||||
Stockholders’ equity: | ||||||||
Preferred stock, $0.0001 par value per share; 1,000,000 shares authorized; NaN issued and outstanding | 0 | 0 | ||||||
Class A common stock, $0.0001 par value per share, 200,000,000 shares authorized, 1,066,083 and 1,946,989 shares issued and outstanding (excluding 54,133,917 and 53,253,011 shares subject to possible redemption) at December 31, 2019 and 2018, respectively | 107 | 195 | ||||||
Class B common stock, $0.0001 par value per share, 20,000,000 shares authorized, 13,800,000 shares issued and outstanding as of December 31, 2019 and 2018 | 1,380 | 1,380 | ||||||
Additional paid-in capital | 0 | 2,349,053 | ||||||
Retained earnings | 4,998,523 | 2,649,382 | ||||||
Total stockholders’ equity | 5,000,010 | 5,000,010 | ||||||
Total liabilities and stockholders’ equity | $ | 565,975,181 | $ | 557,475,687 | ||||
See accompanying notes to financial statements.
F-
77
SPARTAN ENERGY ACQUISITION CORP.
STATEMENTS OF OPERATIONS
For the Year Ended December 31, | ||||||||
2019 | 2018 | |||||||
REVENUE | $ | — | $ | — | ||||
EXPENSES | ||||||||
Administrative fee—related party | 120,000 | 40,000 | ||||||
General and administrative expenses | 1,132,661 | 811,091 | ||||||
TOTAL EXPENSES | 1,252,661 | 851,091 | ||||||
OTHER INCOME | ||||||||
Interest income | 22,557 | 6,947 | ||||||
Investment income from Trust Account | 12,654,638 | 4,375,763 | ||||||
TOTAL OTHER INCOME | 12,677,195 | 4,382,710 | ||||||
INCOME BEFORE INCOME TAX PROVISION | 11,424,534 | 3,531,619 | ||||||
Income tax provision | 2,615,474 | 878,369 | ||||||
Net Income | $ | 8,809,060 | $ | 2,653,250 | ||||
Weighted average shares outstanding of Class A common stock | 55,200,000 | 55,200,000 | ||||||
Basic and diluted net income per share, Class A | $ | 0.18 | $ | 0.06 | ||||
Weighted average shares outstanding of Class B common stock | 13,800,000 | 13,800,000 | ||||||
Basic and diluted net loss per share, Class B | $ | (0.07 | ) | $ | (0.05 | ) | ||
See accompanying notes to financial statements.
F-78
SPARTAN ENERGY ACQUISITION CORP.
STATEMENTS OF CHANGES IN STOCKHOLDERS’ EQUITY
Class A Common Stock | Class B Common Stock (1) | Additional Paid-in Capital | Retained Earnings (Accumulated Deficit) | Total Stockholders’ Equity | ||||||||||||||||||||||||
Shares | Amount | Shares | Amount | |||||||||||||||||||||||||
Balances as of December 31, 2017 | — | — | 13,800,000 | $ | 1,380 | $ | 23,620 | $ | (3,868 | ) | $ | 21,132 | ||||||||||||||||
Sale of Units in Public Offering | 55,200,000 | 5,520 | — | — | 551,994,480 | — | 552,000,000 | |||||||||||||||||||||
Underwriters’ discount and offering costs | — | — | — | — | (31,184,262 | ) | — | (31,184,262 | ) | |||||||||||||||||||
Sale of Private Placement Warrants to Sponsor | — | — | — | — | 14,040,000 | — | 14,040,000 | |||||||||||||||||||||
Class A common stock subject to possible redemption | (53,253,011 | ) | (5,325 | ) | — | — | (532,524,785 | ) | — | (532,530,110 | ) | |||||||||||||||||
Net income | — | — | — | — | — | 2,653,250 | 2,653,250 | |||||||||||||||||||||
Balance as of December 31, 2018 | 1,946,989 | $ | 195 | 13,800,000 | $ | 1,380 | $ | 2,349,053 | $ | 2,649,382 | $ | 5,000,010 | ||||||||||||||||
Change in Class A common stock subject to possible redemption | (880,906 | ) | (88 | ) | — | — | (2,349,053 | ) | (6,459,919 | ) | (8,809,060 | ) | ||||||||||||||||
Net income | — | — | — | — | — | 8,809,060 | 8,809,060 | |||||||||||||||||||||
Balance as of December, 2019 | 1,066,083 | $ | 107 | 13,800,000 | $ | 1,380 | $ | — | $ | 4,998,523 | $ | 5,000,010 | ||||||||||||||||
| (1) | Share and associated amounts have been retroactively restated to reflect: (i) the forfeiture of 2,875,000 shares of Class B common stock in July 2018; and (ii) the stock dividend of 2,300,000 shares of Class B common stock in August 2018 (see Note 4). |
See accompanying notes to financial statements.
F-
79
SPARTAN ENERGY ACQUISITION CORP.
STATEMENTS OF CASH FLOWS
For the Year Ended December 31, | ||||||||
2019 | 2018 | |||||||
Cash Flows From Operating Activities: | ||||||||
Net income | $ | 8,809,060 | $ | 2,653,250 | ||||
Adjustments to reconcile net income to net cash used in operating activities: | ||||||||
Investment income earned on investment held in Trust Account | (12,654,638 | ) | (4,375,763 | ) | ||||
Changes in operating assets and liabilities: | ||||||||
Prepaid expenses | (25,502 | ) | (248,329 | ) | ||||
Accounts payable and accrued expenses | 93,752 | 18,381 | ||||||
Advances from related party | (204,949 | ) | 204,949 | |||||
Accrued income and franchise taxes | (198,369 | ) | 398,369 | |||||
Net Cash Used In Operating Activities | (4,180,646 | ) | (1,349,143 | ) | ||||
Cash Flows From Investing Activities: | ||||||||
Cash deposited into Trust Account | — | (552,000,000 | ) | |||||
Investment income released from Trust Account to pay taxes | 3,197,812 | 680,000 | ||||||
Net Cash Provided By (Used In) Investing Activities | 3,197,812 | (551,320,000 | ) | |||||
Cash Flows From Financing Activities: | ||||||||
Proceeds from sale of Units in Public Offering | — | 552,000,000 | ||||||
Proceeds from sale of Private Placement Warrants | — | 14,040,000 | ||||||
Payment of underwriter compensation | — | (11,040,000 | ) | |||||
Payment of offering costs | — | (824,262 | ) | |||||
Net Cash Provided By Financing Activities | — | 554,175,738 | ||||||
Net change in cash and cash equivalent | (982,834 | ) | 1,506,595 | |||||
Cash and cash equivalent at beginning of year | 1,531,595 | 25,000 | ||||||
Cash and cash equivalent at end of year | $ | 548,761 | $ | 1,531,595 | ||||
Supplemental disclosures of cash flow information: | ||||||||
Cash paid for income taxes | $ | 2,997,762 | $ | — | ||||
Supplemental disclosure of non-cash financing activities: | ||||||||
Deferred underwriters’ commissions charged to additional paid-in capital in connection with the Public Offering | $ | — | $ | 19,320,000 | ||||
Change in value of Class A common stock subject to possible redemption | $ | 8,809,060 | $ | 532,530,110 | ||||
See accompanying notes to financial statements.
F-80
SPARTAN ENERGY ACQUISITION CORP.
NOTES TO FINANCIAL STATEMENTS
NOTE 1. DESCRIPTION OF ORGANIZATION AND BUSINESS OPERATIONS
Organization and General
Spartan Energy Acquisition Corp. (the “”) was incorporated in Delaware on October 13, 2017. The Company was formed for the purpose of effecting a merger, capital stock exchange, asset acquisition, stock purchase, reorganization or similar business combination with one or more businesses (the “”). The Company is an “emerging growth company” as defined in Section 2(a) of the Securities Act of 1933, as amended (the “’), as modified by the Jumpstart Our Business Startups Act of 2012 (the “”).
Company
Initial Business Combination
Securities Act
JOBS Act
At December 31, 2019, the Company had not commenced any operations. All activity for the period from October 13, 2017 (inception) through December 31, 2019 relates to the Company’s formation and the initial public offering (the “”) described below, the identification and evaluation of prospective acquisition targets for an Initial Business Combination and ongoing administrative and compliance matters. The Company will not generate any operating revenues until after completion of its Initial Business Combination, at the earliest. The Company generates
Public Offering
non-operating
income in the form of income earned on investments from the net proceeds derived from the Public Offering. The Company has selected December 31st
as its fiscal year end.Sponsor and Public Offering
The Company’s sponsor is Spartan Energy Acquisition Sponsor LLC, a Delaware limited liability company (the “”). As described in Note 3, on August 14, 2018, the Company consummated the Public Offering of”), including”) at a purchase price of $”).
Sponsor
55,200,000
of its units (the “Units
7,200,000
Units that were issued pursuant to the underwriters’ full exercise of their over-allotment option, generating gross proceeds of $552,000,000
. As described in Note 4, on August 14, 2018, simultaneously with the closing of the Public Offering, the Sponsor purchased an aggregate of9,360,000
warrants (the “Private Placement Warrants
1.50
per warrant, or approximately $14,040,000
in the aggregate (the “Private Placement
The Company intends to finance its Initial Business Combination with proceeds from the Public Offering, the Private Placement, the private placement of forward purchase units (described in Note 4), the Company’s capital stock, debt or a combination of the foregoing.
The registration statement for the Company’s Public Offering (as described in Note 3) was declared effective by the U.S. Securities and Exchange Commission (the “”) on August 9, 2018.
SEC
Trust Account
Upon the closing of the Public Offering and the Private Placement, $”). The proceeds held in the Trust Account will be invested only in U.S. government securities with a maturity of one hundred eighty (180) days or less or in money market funds that meet certain conditions under Rule
552,000,000
was placed in a trust account (the “Trust Account
2a-7
under the Investment Company Act of 1940, as amended, which invest only in direct U.S. government treasury obligations, as determined by the Company. Funds will remain in the Trust Account until the earlier of (i) the consummation of the Initial Business Combination or (ii) the distribution of the Trust Account proceeds as described below. The remaining proceeds outside the Trust Account may be used to pay for business, legal and accounting due diligence on prospective acquisitions and continuing general and administrative expenses.The Company’s amended and restated certificate of incorporation provides that, except for the withdrawal of interest to pay franchise and income taxes, none of the funds held in the Trust Account (including the interest
F-
81
earned on the funds held in the Trust Account) will be released from the Trust Account until the earlier of: (i) the completion of the Initial Business Combination; (ii) the redemption of any shares of Class A common stock included in the Units sold in the Public Offering (the “”) that have been properly tendered in connection with a stockholder vote seeking to amend any provisions of the Company’s amended and restated certificate of incorporation relating to stockholders’ rights or
Public Shares
pre-Initial
Business Combination activity; or (iii) the redemption of 100% of the Public Shares if the Company is unable to complete an Initial Business Combination within 24 months from the closing of the Public Offering. The proceeds deposited in the Trust Account could become subject to the claims of the Company’s creditors, if any, which could have priority over the claims of the Company’s public stockholders.Initial Business Combination
The Company’s management has broad discretion with respect to the specific application of the net proceeds of the Public Offering, although substantially all of the net proceeds of the Public Offering are intended to be generally applied toward consummating an Initial Business Combination. The Initial Business Combination must occur with one or more target businesses that together have a fair market value of at least 80% of the assets held in the Trust Account (excluding the deferred underwriting discounts and commissions and taxes payable on the interest earned on the Trust Account) at the time of the agreement to enter into the Initial Business Combination. Furthermore, there is no assurance that the Company will be able to successfully effect an Initial Business Combination.
The Company, after signing a definitive agreement for an Initial Business Combination, will either (i) seek stockholder approval of the Initial Business Combination at a meeting called for such purpose in connection with which stockholders may seek to redeem their Public Shares, regardless of whether they vote for or against the Initial Business Combination, for cash equal to their pro rata share of the aggregate amount on deposit in the Trust Account as of two business days prior to the consummation of the Initial Business Combination, including interest not previously released to the Company to pay its franchise and income taxes, or (ii) provide stockholders with the opportunity to sell their Public Shares to the Company by means of a tender offer (and thereby avoid the need for a stockholder vote) for an amount in cash equal to their pro rata share of the aggregate amount on deposit in the Trust Account as of two business days prior to the consummation of the Initial Business Combination, including interest not previously released to the Company to pay its franchise and income taxes. The decision as to whether the Company will seek stockholder approval of the Initial Business Combination or will allow stockholders to sell their Public Shares in a tender offer will be made by the Company, solely in its discretion, and will be based on a variety of factors such as the timing of the transaction and whether the terms of the transaction would otherwise require the Company to seek stockholder approval, unless a vote is required by law or under New York Stock Exchange rules. If the Company seeks stockholder approval, it will complete its Initial Business Combination only if a majority of the outstanding shares of common stock voted are voted in favor of the Initial Business Combination. However, in no event will the Company redeem its Public Shares in an amount that would cause its net tangible assets to be less than $5,000,001. In such case, the Company would not proceed with the redemption of its Public Shares and the related Initial Business Combination, and instead may search for an alternate Initial Business Combination.
If the Company holds a stockholder vote or there is a tender offer for shares in connection with an Initial Business Combination, a stockholder will have the right to redeem his, her or its Public Shares for an amount in cash equal to his, her or its pro rata share of the aggregate amount on deposit in the Trust Account as of two business days prior to the consummation of the Initial Business Combination, including interest not previously released to the Company to pay its franchise and income taxes. As a result, such Public Shares are recorded at redemption amount and classified as temporary equity upon the completion of the Public Offering, in accordance with the Financial Accounting Standards Board (“”) Accounting Standards Codification (“”) 480, “.”
FASB
ASC
Distinguishing Liabilities from Equity
Pursuant to the Company’s amended and restated certificate of incorporation, if the Company is unable to complete an Initial Business Combination within 24 months from the closing of the Public Offering (until
F-82
August 14, 2020), the Company will (i) cease all operations except for the purpose of winding up, (ii) as promptly as reasonably possible but no more than ten business days thereafter subject to lawfully available funds therefor, redeem the Public Shares, at a
per-share
price, payable in cash, equal to the aggregate amount then on deposit in the Trust Account, including interest earned on the funds held in the Trust Account and not previously released to the Company to pay the Company’s franchise and income taxes (less up to $100,000 of such net interest to pay dissolution expenses), divided by the number of then outstanding Public Shares, which redemption will completely extinguish public stockholders’ rights as stockholders (including the right to receive further liquidating distributions, if any), subject to applicable law, and (iii) as promptly as reasonably possible following such redemption, subject to the approval of the Company’s remaining stockholders and the Company’s board of directors, dissolve and liquidate, subject in each case to the Company’s obligations under Delaware law to provide for claims of creditors and the requirements of other applicable law. The Sponsor and the Company’s officers and directors have entered into a letter agreement with the Company, pursuant to which they have agreed to waive their rights to liquidating distributions from the Trust Account with respect to any Founder Shares (as defined below) held by them if the Company fails to complete the Initial Business Combination within 24 months of the closing of the Public Offering. However, if the Sponsor or any of the Company’s directors, officers or affiliates acquires shares of Class A common stock in or after the Public Offering, they will be entitled to liquidating distributions from the Trust Account with respect to such shares if the Company fails to complete the Initial Business Combination within the prescribed time period.In the event of a liquidation, dissolution or winding up of the Company after an Initial Business Combination, the Company’s stockholders are entitled to share ratably in all assets remaining available for distribution to them after payment of liabilities and after provision is made for each class of stock, if any, having preference over the common stock. The Company’s stockholders have no preemptive or other subscription rights. There are no sinking fund provisions applicable to the common stock, except that the Company will provide its stockholders with the opportunity to redeem their Public Shares for cash equal to their pro rata share of the aggregate amount then on deposit in the Trust Account, upon the completion of the Initial Business Combination, subject to the limitations described herein.
Going Concern Considerations
In connection with the Company’s assessment of going concern considerations in accordance with FASB’s Accounting Standards Update the Company determined that the mandatory liquidation and subsequent dissolution provisions discussed above raise substantial doubt about the Company’s ability to continue as a going concern. No adjustments have been made to the carrying amounts of assets or liabilities should the Company be required to liquidate after August 14, 2020.
2014-15, “
Disclosure of Uncertainties about an Entity’s Ability to Continue as a Going Concern,”
As of December 31, 2019, the Company had approximately $549,000 in its operating bank account, approximately $12.7 million of investment income available in the Trust Account to pay for franchise and income taxes (less up to $100,000 of investment income to pay dissolution expenses), and working capital surplus of approximately $378,000.
Through December 31, 2019, the Company’s liquidity needs have been satisfied through receipt of a $25,000 capital contribution from the Sponsor in exchange for the issuance of the Founder Shares (Note 5) to the Sponsor, an aggregate of approximately $1.5 million in advances due to related party, which is discussed in Note 4, and the net proceeds from investment income released from Trust Account since inception of approximately $3.9 million for taxes. The Company repaid the loans from the Sponsor in full in February 2018. The Company anticipated that it may need to obtain additional loans from the Sponsor or obtain funding from other sources in order to satisfy our working capital requirements through August 14, 2020, our mandatory liquidation date.
F-
8
3NOTE 2. SUMMARY OF SIGNIFICANT ACCOUNTING POLICIES
Basis of Presentation
The accompanying financial statements of the Company are presented in U.S. dollars in conformity with accounting principles generally accepted in the United States of America (“”) and pursuant to the accounting and disclosure rules and regulations of the SEC.
GAAP
Emerging Growth Company
Section 102(b)(1) of the JOBS Act exempts emerging growth companies from being required to comply with new or revised financial accounting standards until private companies (that is, those that have not had a Securities Act registration statement declared effective or do not have a class of securities registered under the Securities Exchange Act of 1934, as amended) are required to comply with the new or revised financial accounting standards. The JOBS Act provides that a company can elect to opt out of the extended transition period and comply with the requirements that apply to
non-emerging
growth companies, but any such election to opt out is irrevocable. The Company has elected not to opt out of such extended transition period, which means that when a standard is issued or revised and it has different application dates for public or private companies, the Company, as an emerging growth company, can adopt the new or revised standard at the time private companies adopt the new or revised standard. This may make comparison of the Company’s financial statements with another public company which is neither an emerging growth company nor an emerging growth company which has opted out of using the extended transition period difficult or impossible because of the potential differences in accounting standards used.Net Income Per Share of Common Stock
The Company complies with accounting and disclosure requirements of FASB ASC Topic 260, “ Net income per share is computed by dividing net income applicable to common stockholders by the weighted average number of shares of common stock outstanding for the period. The Company has not considered the effect of the warrants sold in the Public Offering and Private Placement Warrants to purchase an aggregate of 27,760,000 shares of Class A common stock in the calculation of diluted earnings per share, since their inclusion would be anti-dilutive under the treasury stock method. As a result, diluted earnings per share is the same as basic earnings per share for the period.
Earnings Per Share.”
The Company’s statements of operations include a presentation of income per share for Class A common stock subject to redemption in a manner similar to the
two-class
method of income per share. Net income per share, basic and diluted for Class A common stock is calculated by dividing the investment income earned on the Trust Account of $12,654,638 and $4,375,763, respectively, net of applicable taxes of $2,815,474 and $1,078,369, respectively, by the weighted average number of 55,200,000 shares of Class A common stock outstanding since the initial issuance for years ended December 31, 2019 and 2018, respectively. Net loss per share, basic and diluted for Class B common stock is calculated by dividing the net income, less income attributable to Class A common stock, by the weighted average number of shares of Class B common stock outstanding for the period.Cash and Cash Equivalents
The Company considers all short-term investments with an original maturity of three months or less when purchased to be cash equivalents.
Concentration of Credit Risk
Financial instruments that potentially subject the Company to concentration of credit risk consist of cash accounts in a financial institution which, at times, may exceed the Federal depository insurance coverage of $250,000. As of December 31, 2019, the Company has not experienced losses on these accounts and management believes the Company is not exposed to significant risks on such accounts.
F-84
Financial Instruments
The fair value of the Company’s assets and liabilities, which qualify as financial instruments under FASB ASC 820, “,” approximates the carrying amounts represented in the balance sheet.
Fair Value Measurements and Disclosures
Fair Value Measurements
Fair value is defined as the price that would be received for sale of an asset or paid for transfer of a liability, in an orderly transaction between market participants at the measurement date. GAAP establishes a three-tier fair value hierarchy, which prioritizes the inputs used in measuring fair value. The hierarchy gives the highest priority to unadjusted quoted prices in active markets for identical assets or liabilities (Level 1 measurements) and the lowest priority to unobservable inputs (Level 3 measurements). These tiers include:
| • | Level 1, defined as observable inputs such as quoted prices (unadjusted) for identical instruments in active markets; |
| • | Level 2, defined as inputs other than quoted prices in active markets that are either directly or indirectly observable such as quoted prices for similar instruments in active markets or quoted prices for identical or similar instruments in markets that are not active; and |
| • | Level 3, defined as unobservable inputs in which little or no market data exists, therefore requiring an entity to develop its own assumptions, such as valuations derived from valuation techniques in which one or more significant inputs or significant value are unobservable. |
In some circumstances, the inputs used to measure fair value might be categorized within different levels of the fair value hierarchy. In those instances, the fair value measurement is categorized in its entirety in the fair value hierarchy based on the lowest level input that is significant to the fair value measurement.
Use of Estimates
The preparation of the financial statements in conformity with GAAP requires the Company’s management to make estimates and assumptions that affect the reported amounts of assets and liabilities and disclosure of contingent assets and liabilities at the date of the financial statements and the reported amounts of expenses during the reporting period. Actual results could differ from those estimates.
Class A Common Stock Subject to Possible Redemption
The Company accounts for its Class A common stock subject to possible redemption in accordance with the guidance in ASC Topic 480 “ Shares of Class A common stock subject to mandatory redemption (if any) are classified as liability instruments and are measured at fair value. Shares of conditionally redeemable Class A common stock (including Class A common stock that feature redemption rights that are either within the control of the holder or subject to redemption upon the occurrence of uncertain events not solely within the Company’s control) are classified as temporary equity. At all other times, shares of Class A common stock are classified as stockholders’ equity. The Company’s Class A common stock features certain redemption rights that are considered to be outside of the Company’s control and subject to the occurrence of uncertain future events.
Distinguishing Liabilities from Equity.”
As discussed in Note 1, all of the 55,200,000 Public Shares contain a redemption feature which allows for the redemption of Class A common stock under the Company’s liquidation or tender offer/stockholder approval provisions. In accordance with FASB ASC 480, redemption provisions not solely within the control of the Company require the security to be classified outside of permanent equity. Ordinary liquidation events, which involve the redemption and liquidation of all of the entity’s equity instruments, are excluded from the provisions of FASB ASC 480. Although the Company has not specified a maximum redemption threshold, its amended and restated certificate of incorporation provides that in no event will the Company redeem its Public Shares in an amount that would cause its net tangible assets to be less than $5,000,001.
F-
85
The Company recognizes changes in redemption value immediately as they occur and will adjust the carrying value of the security at the end of each reporting period. Increases or decreases in the carrying amount of redeemable shares of Class A common stock shall be affected by charges against additional
paid-in
capital.At December 31, 2019 and 2018, 54,133,917 and 53,253,011, respectively, of the 55,200,000 outstanding shares of Class A common stock were classified outside of permanent equity.
Income Taxes
The Company follows the asset and liability method of accounting for income taxes under FASB ASC 740, “ Deferred tax assets and liabilities are recognized for the estimated future tax consequences attributable to differences between the financial statement carrying amounts of existing assets and liabilities and their respective tax bases. Deferred income tax assets and liabilities are measured using enacted tax rates expected to apply to taxable income in the years in which those temporary differences are expected to be recovered or settled. The effect on deferred tax assets and liabilities of a change in tax rates is recognized in income in the period that included the enactment date. Valuation allowances are established, when necessary, to reduce deferred tax assets to the amount expected to be realized. Management has determined that a full valuation allowance on the deferred tax asset (related to
Income Taxes.”
start-up
costs) is appropriate at this time after consideration of all available positive and negative evidence related to the realization of the deferred tax asset.FASB ASC 740 prescribes a recognition threshold and a measurement attribute for the financial statement recognition and measurement of tax positions taken or expected to be taken in a tax return. For those benefits to be recognized, a tax position must be more likely than not to be sustained upon examination by taxing authorities. There were no unrecognized tax benefits as of December 31, 2019 or 2018. The Company recognizes accrued interest and penalties related to unrecognized tax benefits as income tax expense. No amounts were accrued for the payment of interest and penalties at December 31, 2019 or 2018. The Company is currently not aware of any issues under review that could result in significant payments, accruals or material deviation from its position. The Company is subject to income tax examinations by major taxing authorities since inception.
Subsequent Events
Management has evaluated subsequent events to determine if events or transactions occurring through the date the financial statements were available for issuance, require potential adjustment to or disclosure in the financial statements and has concluded that all such events that would require recognition or disclosure have been recognized or disclosed.
Recent Accounting Pronouncements
The Company’s management does not believe that any recently issued, but not yet effective, accounting pronouncements, if currently adopted, would have a material effect on the Company’s financial statements.
NOTE 3. PUBLIC OFFERING
The Company sold 55,200,000 Units in the Public Offering, including 7,200,000 Units that were issued pursuant to the underwriters’ full exercise of their over-allotment option, at a price of $10.00 per Unit. Simultaneously with the closing of the Public Offering, the Sponsor purchased an aggregate of 9,360,000 Private Placement Warrants at a purchase price of $1.50 per warrant, or approximately $14,040,000 in the aggregate.
Each Unit consists of one share of the Company’s Class A common stock, $0.0001 par value per share, and” and, collectively, the “”). Each whole Warrant entitles the holder to purchase one share of Class A common stock at a price of $11.50 per share. No fractional shares will be issued upon separation of the Units and only whole Warrants will trade. Each Warrant will become
one-third
of one warrant (each, a “Warrant
Warrants
F-86
exercisable on the later of 30 days after the completion of an Initial Business Combination or 12 months from the closing of the Public Offering and will expire five years after the completion of an Initial Business Combination or earlier upon redemption or liquidation. Once the Warrants become exercisable, the Company may redeem the outstanding Warrants in whole and not in part at a price of $0.01 per Warrant upon a minimum of 30 days’ prior written notice of redemption, if and only if the last sale price of the Company’s Class A common stock has been at least $18.00 per share on each of 20 trading days within the 30
trading-day
period ending on the third business day prior to the date on which the Company sent the notice of redemption to the Warrant holders.As noted above, the underwriters exercised the
45-day
option to purchase up to 7,200,000 additional Units to cover any over-allotments at the Public Offering price less the underwriting discounts and commissions. The Units that were issued in connection with the over-allotment option were identical to the other Units issued in the Public Offering.The Company paid an underwriting discount of 2.0% of the gross offering proceeds, or $11.04 million in the aggregate, to the underwriters at the closing of the Public Offering, with an additional fee (the “”) of 3.5% of the gross offering proceeds, or $19.32 million in the aggregate, payable upon the Company’s completion of an Initial Business Combination. The Deferred Discount will become payable to the underwriters from the amounts held in the Trust Account solely in the event the Company completes an Initial Business Combination.
Deferred Discount
NOTE 4. RELATED PARTY TRANSACTIONS
Founder Shares
In October 2017, the Sponsor purchased 14,375,000 shares of the Company’s Class B common stock (the “”) for $25,000, or approximately $0.002 per share. In July 2018, the Sponsor surrendered 2,875,000 shares of its Class B common stock for no consideration. In August 2018, the Company effected a stock dividend with respect to the Class B common stock of 2,300,000 shares thereof, resulting in the Sponsor holding an aggregate of 13,800,000 shares of Class B common stock. As used herein, unless the context otherwise requires, “Founder Shares” shall be deemed to include the shares of Class A common stock issuable upon conversion thereof. The Founder Shares are identical to the Class A common stock included in the Units sold in the Public Offering except that the Founder Shares are shares of Class B common stock which automatically convert into shares of Class A common stock at the time of the Initial Business Combination and are subject to certain transfer restrictions, as described in more detail below. In August 2018, prior to the Public Offering, the Sponsor transferred 150,000 Founder Shares to each of the Company’s two independent directors at their original purchase price. In July 2019, the Company’s Sponsor transferred 75,000 Founder Shares to a newly appointed independent director at their original purchase price.
Founder Shares
The holders of the Founders Shares have agreed, subject to limited exceptions, not to transfer, assign or sell any of their Founder Shares until the earlier to occur of: (A) one year after the completion of an Initial Business Combination or (B) subsequent to an Initial Business Combination, (x) if the last reported sale price of the Company’s Class A common stock equals or exceeds $12.00 per share (as adjusted for stock splits, stock dividends, reorganizations, recapitalizations and the like) for any 20 trading days within any
30-trading
day period commencing at least 150 days after the consummation of an Initial Business Combination, or (y) the date on which the Company completes a liquidation, merger, stock exchange or other similar transaction that results in all of the Company’s stockholders having the right to exchange their shares of common stock for cash, securities or other property.Private Placement
Concurrently with the closing of the Public Offering, the Sponsor purchased an aggregate of 9,360,000 Private Placement Warrants at a price of $1.50 per warrant ($14,040,000 in the aggregate) in the Private Placement. Each
F-
87
Private Placement Warrant is exercisable for one share of the Company’s Class A common stock at a price of $11.50 per share. A portion of the purchase price of the Private Placement Warrants was added to the proceeds from the Public Offering held in the Trust Account. If the Initial Business Combination is not completed within 24 months from the closing of the Public Offering, the proceeds from the sale of the Private Placement Warrants held in the Trust Account will be used to fund the redemption of the Public Shares (subject to the requirements of applicable law) and the Private Placement Warrants will expire worthless. The Private Placement Warrants will be
non-redeemable
and exercisable on a cashless basis so long as they are held by the Sponsor or its permitted transferees.The Sponsor and the Company’s officers and directors agreed, subject to limited exceptions, not to transfer, assign or sell any of their Private Placement Warrants until 30 days after the completion of the Initial Business Combination.
Registration Rights
The holders of the Founder Shares, Private Placement Warrants and equity securities that may be issued upon conversion of working capital loans, if any (and any Class A common shares issuable upon the conversion of any Founder Shares and the exercise of the Private Placement Warrants and equity securities that may be issued upon conversion of working capital loans) will be entitled to registration rights pursuant to a registration rights agreement signed on August 9, 2018. The holders of these securities are entitled to make up to three demands, excluding short form demands, that the Company register such securities. In addition, the holders have certain “piggy-back” registration rights with respect to registration statements filed subsequent to the consummation of an Initial Business Combination. However, the registration rights agreement provides that the Company will not permit any registration statement filed under the Securities Act to become effective until termination of the applicable
lock-up
period. The Company will bear the expenses incurred in connection with the filing of any such registration statements.Advances from Related Parties
Affiliates of the Sponsor paid certain administrative expenses and offering costs on behalf of the Company. These advances are due on demand and are
non-interest
bearing. During the year ended December 31, 2019 and 2018, the related party paid $605,442 and $788,786, respectively, of other expenses on behalf of the Company and the Company had repaid the related party $810,391 and $603,329, respectively, for advances. As of December 31, 2019 and 2018, there was $0 and $204,949, respectively, due to the related parties.Prior to the closing of the Public Offering, an affiliate of the Sponsor advanced the Company $294,354 to be used for a portion of the expenses of the Public Offering. Upon the closing of the Public Offering, the Company repaid the affiliate of the Sponsor $294,354 in settlement of the outstanding advances.
Administrative Service Fee
The Company, commencing on August 10, 2018, has agreed to pay the Sponsor a total of $10,000 per month for office space, utilities, secretarial support and administrative services. Upon completion of the Initial Business Combination or the Company’s liquidation, the Company will cease paying these monthly fees. The Company paid the Sponsor $120,000 and $40,000 for such services for the years ended December 31, 2019 and 2018, respectively.
Forward Purchase Agreement
On August 9, 2018, the Company entered into a forward purchase agreement (the “”) pursuant to which an affiliate of the Sponsor agreed to purchase an aggregate of up to 30,000,000 shares of the Company’s Class A common stock (the “”), plus an
Forward Purchase
Agreement
Forward Purchase Shares
F-88
aggregate of up to 10,000,000 warrants (the “” and, together with the Forward Purchase Shares, the “”), for an aggregate purchase price of up to $300,000,000 or $10.00 per unit. Each Forward Purchase Warrant will have the same terms as each of the Private Placement Warrants.
Forward Purchase Warrants
Forward Purchase Units
The obligations under the Forward Purchase Agreement do not depend on whether any public stockholders elect to redeem their shares in connection with the Initial Business Combination and provide the Company with a minimum funding level for the Initial Business Combination. Additionally, the obligations of the affiliate of the Sponsor to purchase the Forward Purchase Units are subject to termination prior to the closing of the sale of the Forward Purchase Units by mutual written consent of the Company and such affiliate, or automatically: (i) if the Initial Business Combination is not consummated within 24 months from the closing of the Public Offering, unless extended up to a maximum of sixty (60) days in accordance with the amended and restated certificate of incorporation; or (ii) if the affiliate of the Sponsor or the Company become subject to any voluntary or involuntary petition under the United States federal bankruptcy laws or any state insolvency law, in each case which is not withdrawn within sixty (60) days after being filed, or a receiver, fiscal agent or similar officer is appointed by a court for business or property of the affiliate of the Sponsor or the Company in each case which is not removed, withdrawn or terminated within sixty (60) days after such appointment. In addition, the obligations of the affiliate of the Sponsor to purchase the Forward Purchase Units are subject to fulfillment of customary closing conditions, including that the Initial Business Combination must be consummated substantially concurrently with the purchase of the Forward Purchase Units.
NOTE 5. DEFERRED UNDERWRITING COMMISSIONS
The Company is committed to pay the Deferred Discount of 3.5% of the gross proceeds of the Public Offering, or $19,320,000, to the underwriters of the Public Offering upon the Company’s completion of an Initial Business Combination. The underwriters are not entitled to receive any of the interest earned on Trust Account funds that would be used to pay the Deferred Discount, and no Deferred Discount is payable to the underwriters if an Initial Business Combination is not completed within 24 months after the Public Offering.
NOTE 6. STOCKHOLDERS’ EQUITY
Common Stock
The authorized common stock of the Company includes 200,000,000 shares of Class A common stock and 20,000,000 shares of Class B common stock. If the Company enters into an Initial Business Combination, it may (depending on the terms of such an Initial Business Combination) be required to increase the number of shares of Class A common stock which the Company is authorized to issue at the same time as the Company’s stockholders vote on the Initial Business Combination to the extent the Company seeks stockholder approval in connection with the Initial Business Combination. Holders of the Company’s common stock are entitled to one vote for each share of common stock. At December 31, 2019, there were 55,200,000 shares of Class A common stock issued and outstanding (of which 54,133,917 were classified outside of permanent equity) and 13,800,000 shares of Class B common stock issued and outstanding. At December 31, 2018, there were 55,200,000 shares of Class A common stock issued and outstanding (of which 53,253,011 were classified outside of permanent equity) and 13,800,000 shares of Class B common stock issued and outstanding. All shares and the associated amounts have been retroactively restated to reflect: (i) the forfeiture of 2,875,000 shares of Class B common stock in July 2018; and (ii) the stock dividend of 2,300,000 shares of Class B common stock in August 2018.
Preferred Stock
The Company is authorized to issue 1,000,000 shares of preferred stock with such designations, voting and other rights and preferences as may be determined from time to time by the Company’s board of directors. At December 31, 2019 and 2018, there were no shares of preferred stock issued or outstanding.
F-89
Warrants
The Warrants will become exercisable on the later of (a) 30 days after the completion of an Initial Business Combination or (b) 12 months from the closing of the Public Offering; provided in each case that the Company has an effective registration statement under the Securities Act covering the Class A common stock issuable upon exercise of the Warrants and a current prospectus relating to them is available (or the Company permits holders to exercise their Public Warrants on a cashless basis and such cashless exercise is exempt from registration under the Securities Act). The Company has agreed that as soon as practicable, but in no event later than 15 business days, after the closing of its Initial Business Combination, the Company will use its best efforts to file with the SEC a registration statement for the registration, under the Securities Act, of the Class A common stock issuable upon exercise of the Warrants. The Company will use its best efforts to cause the same to become effective and to maintain the effectiveness of such registration statement, and a current prospectus relating thereto, until the expiration of the Warrants in accordance with the provisions of the warrant agreement. If the Class A common stock is at the time of any exercise of a Warrant not listed on a national securities exchange such that it satisfies the definition of a “covered security” under Section 18(b)(1) of the Securities Act, the Company may, at its option, require holders of Warrants who exercise their Warrants to do so on a “cashless basis” in accordance with Section 3(a)(9) of the Securities Act or another exemption. The Warrants will expire five years after the completion of an Initial Business Combination or earlier upon redemption or liquidation.
The Private Placement Warrants are identical to the Warrants, except that the Private Placement Warrants and the Class A common stock issuable upon exercise of the Private Placement Warrants will not be transferable, assignable or salable until 30 days after the completion of an Initial Business Combination, subject to certain limited exceptions. Additionally, the Private Placement Warrants will
be non-redeemable so
long as they are held by the Sponsor or any of its permitted transferees. If the Private Placement Warrants are held by someone other than the Sponsor or its permitted transferees, the Private Placement Warrants will be redeemable by the Company and exercisable by such holders on the same basis as the Warrants.The Company may call the Warrants for redemption (except with respect to the Private Placement Warrants):
| • | in whole and not in part; |
| • | at a price of $0.01 per warrant; |
| • | upon a minimum of 30 days prior written notice of redemption; and |
| • | if, and only if, the last reported sales price of the Class A common stock has been at least $18.00 per share on each of 20 trading days within the 30 trading-day period ending on the third business day prior to the date on which the Company sends the notice of redemption to the Warrant holders. |
If the Company calls the Warrants for redemption, management will have the option to require all holders that wish to exercise the Warrants to do so on a cashless basis. In no event will the Company be required to net cash settle the Warrant exercise. If the Company is unable to complete an Initial Business Combination within 24 months from the closing of the Public Offering and the Company liquidates the funds held in the Trust Account, holders of Warrants will not receive any of such funds with respect to their Warrants, nor will they receive any distribution from the Company’s assets held outside of the Trust Account with respect to such Warrants. Accordingly, the Warrants may expire worthless.
F-90
NOTE 7. FAIR VALUE MEASUREMENTS
The following table presents information about the Company’s assets that are measured on a recurring basis as of December 31, 2019 and 2018 and indicates the fair value hierarchy of the valuation techniques that the Company utilized to determine such fair value.
Description | Fair Value | Quoted Prices in Active Markets (Level 1) | Significant Other Observable Inputs (Level 2) | Significant Other Unobservable Inputs (Level 3) | ||||||||||||
Investment held in Trust Account | ||||||||||||||||
December 31, 2019 | $ | 565,152,589 | $ | 565,152,589 | $ | — | $ | — | ||||||||
December 31, 2018 | $ | 555,695,763 | $ | 555,695,763 | $ | — | $ | — | ||||||||
At December 31, 2019 and 2018, the investments held in the Trust Account were held in marketable equity securities.
NOTE 8. INCOME TAXES
The Company’s deferred tax assets are as follows at December 31, 2019 and 2018:
December 31, 2019 | December 31, 2018 | |||||||
Deferred tax asset | ||||||||
Startup expenses/Organizational costs | $ | 357,788 | 136,729 | |||||
Valuation Allowance | (357,788 | ) | (136,729 | ) | ||||
Deferred tax asset, net of allowance | $ | — | — | |||||
The income tax provision (benefit) consists of the following at December 31, 2019 and 2018:
Year Ended December 31, 2019 | Year Ended December 31, 2018 | |||||||
Federal | ||||||||
Current | $ | 2,615,474 | $ | 878,369 | ||||
Deferred | (221,059 | ) | (136,729 | ) | ||||
State and Local | ||||||||
Current | — | — | ||||||
Deferred | — | — | ||||||
Change in valuation allowance | 221,059 | 136,729 | ||||||
Income tax provision (benefit) | $ | 2,615,474 | $ | 878,369 | ||||
In assessing the realization of the deferred tax assets, management considers whether it is more likely than not that some portion of all of the deferred tax assets will not be realized. The ultimate realization of deferred tax assets is dependent upon the generation of future taxable income during the periods in which temporary differences representing net future deductible amounts become deductible. Management considers the scheduled reversal of deferred tax liabilities, projected future taxable income and tax planning strategies in making this assessment. After consideration of all of the information available, management believes that significant uncertainty exists with respect to future realization of the deferred tax assets and has therefore established a full valuation allowance. For the year ended December 31, 2019 and 2018, the change in the valuation allowance was $221,059 and $136,729, respectively.
F-91
A reconciliation of the statutory tax rate to the Company’s effective tax rates as of December 31, 2019 and 2018 is as follows:
Year Ended December 31, 2019 | Year Ended December 31, 2018 | |||||||
Statutory federal income tax rate | 21.0 | % | 21.0 | % | ||||
State taxes, net of federal tax benefit | 0.0 | % | 0.0 | % | ||||
Other | 0.0 | % | 0.0 | % | ||||
Change in valuation allowance | 1.9 | % | 3.9 | % | ||||
Income tax provision (benefit) | 22.9 | % | 24.9 | % | ||||
NOTE 9. SUBSEQUENT EVENTS
The Company evaluated subsequent events and transactions that occurred after the balance sheet date up to the date that the financial statements were available to be issued.
F-92
PART II
INFORMATION NOT REQUIRED IN PROSPECTUS
Item 13. Other Expenses of Issuance and Distribution
The following is an estimate of the expenses (all of which are to be paid by the registrant) that we may incur in connection with the securities being registered hereby.
Amount to be Paid | ||||
SEC registration fee | $ | 176,577.68 | ||
Printing and engraving expenses | * | |||
Legal fees and expenses | * | |||
Accounting fees and expenses | * | |||
Miscellaneous fees and expenses | * | |||
Total | * | |||
* These fees are calculated based on the securities offered and the number of issuances and accordingly cannot be defined at this time.
Item 14. Indemnification of Directors and Officers
Section 145 of the Delaware General Corporation Law (the “DGCL”) provides that a corporation may indemnify directors and officers as well as other employees and individuals against expenses (including attorneys’ fees), judgments, fines and amounts paid in settlement actually and reasonably incurred by such person in connection with any threatened, pending or completed actions, suits or proceedings in which such person is made a party by reason of such person being or having been a director, officer, employee or agent of the Company. The DGCL provides that Section 145 is not exclusive of other rights to which those seeking indemnification may be entitled under any bylaws, agreement, vote of stockholders or disinterested directors or otherwise. The Company’s Certificate of Incorporation and Bylaws provide for indemnification by the Company of its directors and officers to the fullest extent permitted by the DGCL.
Section 102(b)(7) of the DGCL permits a corporation to provide in its certificate of incorporation that a director of the corporation shall not be personally liable to the corporation or its stockholders for monetary damages for breach of fiduciary duty as a director, except for liability (1) for any breach of the director’s duty of loyalty to the corporation or its stockholders, (2) for acts or omissions not in good faith or which involve intentional misconduct or a knowing violation of law, (3) for unlawful payments of dividends or unlawful stock repurchases, redemptions or other distributions or (4) for any transaction from which the director derived an improper personal benefit. The Company’s Certificate of Incorporation provides for such limitation of liability to the fullest extent permitted by the DGCL.
The Company maintains standard policies of insurance under which coverage is provided (1) to its directors and officers against loss arising from claims made by reason of breach of duty or other wrongful act, while acting in their capacity as directors and officers of the Company, and (2) to the Company with respect to payments which may be made by the Company to such officers and directors pursuant to any indemnification provision contained in the Company’s Second Amended and Restated Certificate of Incorporation and Amended and Restated Bylaws or otherwise as a matter of law.
II-1
Item 15. Recent Sales of Unregistered Securities
Subscription Agreements
In connection with the execution of the Business Combination Agreement, the Company entered into subscription agreements, each dated July 10, 2020 (the “Subscription Agreements”), with certain investors pursuant to which the investors agreed to purchase 50,000,000 shares of Class A Common Stock in a private placement for an aggregate purchase price of $500 million (the “PIPE Financing”). The PIPE Financing was consummated concurrently with the Closing. The shares of Class A Common Stock issued in the PIPE Financing have not been registered under the Securities Act, in reliance on the exemption from registration provided by Section 4(a)(2) of the Securities Act and/or Regulation D promulgated thereunder.
Magna Warrants
On October 29, 2020, the Company issued the Magna Warrants exercisable for up to 19,474,454 shares of the Company’s Class A Common Stock, subject to adjustment, in a private placement pursuant to the exemption from the registration requirements of the Securities Act provided by Section 4(a)(2) of the Securities Act. The Magna Warrants were issued pursuant to the Cooperation Agreement entered into by the Company and Magna, the holder of the Magna Warrants (the “Holder”), dated October 15, 2020. The Company has relied on the exemption from registration under the Securities Act based in part on representations made by the Holder in the agreement pursuant to which the Warrants were issued that it is an “accredited investor” as defined in Rule 501 under the Securities Act and that the Magna Warrants are being acquired for investment purposes and not with a view to or for sale in connection with any distribution thereof in violation of any federal or state securities laws.
The Magna Warrants are subject to vesting as follows:
Milestones | Percentage of Warrants that Vest Upon Achievement | |||
(i)Achievement of the “preliminary production specification” gateway as set forth in the Development Agreement; (ii) entering into the Platform Agreement; and (iii) entering into the Initial Manufacturing Agreement | 33.3 | % | ||
(i) Achievement of the “target agreement” gateway as set forth in the Development Agreement and (ii) entering into the Detailed Manufacturing Agreement, which will contain terms and conditions agreed to in the Initial Manufacturing | 33.3 | % | ||
Start of pre-serial production | 33.4 | % | ||
The exercise price for the Magna Warrants is $0.01 per share of Class A Common Stock. The Magna Warrants will vest in full upon a change of control of the Company. Once vested, the Magna Warrants may be exercised at the election of the Holder, in whole but not in part, by the tender to the Company of a notice of exercise. The Warrants will expire on October 29, 2030.
Class B Common Stock
Pursuant to our prior amended and restated certificate of incorporation, each share of Spartan’s Class B Common Stock, par value $0.0001 per share (the “Class B Common Stock”), converted into one share of Spartan’s Class A Common Stock, par value $0.0001 per share (the “Class A Common Stock”), at the Closing. After the Closing and following the effectiveness of our Certificate of Incorporation, (i) each share of Class A Common Stock was automatically reclassified, redesignated and changed into one validly issued, fully paid and
non-assessable
share of newly authorized Class A Common Stock, without any further action by us or any stockholder and (ii) each share of Class B Common Stock was automatically reclassified, redesignated and changed into one validly issued, fully paid andnon-assessable
share of newly authorized Class B Common Stock, without any further action by us or any stockholder. The issuance of Class A Common Stock upon automatic conversion of Class B Common Stock at the Closing has not been registered under the Securities Act in reliance on the exemption from registration provided by Section 3(a)(9) of the Securities Act.II-2
Private Placement Warrants.
Simultaneously with the consummation of the IPO, the Former Sponsor purchased from us an aggregate of 9,360,000 private placement warrants (for a purchase price of approximately $14,040,000). Each private placement warrant entitles the holder thereof to purchase one share of our Class A Common Stock at an exercise price of $11.50 per share. The sale of the private placement warrants was made pursuant to an exemption from registration contained in Section 4(a)(2) of the Securities Act.
Business Combination Agreement
At the Effective Time, each share of Legacy Fisker Common Stock was converted into and exchanged for 2.7162 shares of our Class A Common Stock. The securities issued in connection with the Business Combination Agreement was made pursuant to an exemption from registration contained in Section 4(a)(2) of the Securities Act.
II-3
Item 16. Exhibits
II-4
| * | The schedules to this Exhibit have been omitted in accordance with Regulation S-K Item 601(b)(2). The Company agrees to furnish supplementally a copy of any omitted schedule to the Securities and Exchange Commission upon its request. |
| † | Indicates a management contract or compensatory plan, contract or arrangement. |
II-5
Item 17. Undertakings
| (a) | The undersigned registrant hereby undertakes: |
| (1) | To file, during any period in which offers or sales are being made, a post-effective amendment to this registration statement: |
| (i) | to include any prospectus required by Section 10(a)(3) of the Securities Act; |
| (ii) | to reflect in the prospectus any facts or events arising after the effective date of the registration statement (or the most recent post-effective amendment thereof) which, individually or in the aggregate, represent a fundamental change in the information set forth in the registration statement. Notwithstanding the foregoing, any increase or decrease in volume of securities offered (if the total dollar value of securities offered would not exceed that which was registered) and any deviation from the low or high end of the estimated maximum offering range may be reflected in the form of prospectus filed with the SEC pursuant to Rule 424(b) if, in the aggregate, the changes in volume and price represent no more than 20 percent change in the maximum aggregate offering price set forth in the “Calculation of Registration Fee” table in the effective registration statement; and |
| (iii) | to include any material information with respect to the plan of distribution not previously disclosed in the registration statement or any material change to such information in the registration statement; |
provided, however
| (2) | That, for the purpose of determining any liability under the Securities Act, each such post-effective amendment shall be deemed to be a new registration statement relating to the securities offered therein, and the offering of such securities at that time shall be deemed to be the initial bona fide offering thereof. |
| (3) | To remove from registration by means of a post-effective amendment any of the securities being registered which remain unsold at the termination of the offering. |
| (4) | That, for the purpose of determining liability under the Securities Act to any purchaser: |
| (i) | Each prospectus filed by the registrant pursuant to Rule 424(b)(3) shall be deemed to be part of the registration statement as of the date the filed prospectus was deemed part of and included in the registration statement; and |
| (ii) | Each prospectus required to be filed pursuant to Rule 424(b)(2), (b)(5) or (b)(7) as part of a registration statement in reliance on Rule 430B relating to an offering made pursuant to Rule 415(a)(1)(i), (vii) or (x) for the purpose of providing the information required by Section 10(a) of the Securities Act shall be deemed to be part of and included in the registration statement as of the earlier of the date such form of prospectus is first used |
II-6
| after effectiveness or the date of the first contract of sale of securities in the offering described in the prospectus. As provided in Rule 430B, for liability purposes of the issuer and any person that is at that date an underwriter, such date shall be deemed to be a new effective date of the registration statement relating to the securities in the registration statement to which that prospectus relates, and the offering of such securities at that time shall be deemed to be the initial bona fide Provided however |
| (5) | That, for the purpose of determining liability of the registrant under the Securities Act to any purchaser in the initial distribution of the securities, the undersigned registrant undertakes that in a primary offering of securities of the undersigned registrant pursuant to this registration statement, regardless of the underwriting method used to sell the securities to the purchaser, if the securities are offered or sold to such purchaser by means of any of the following communications, the undersigned registrant will be a seller to the purchaser and will be considered to offer or sell such securities to such purchaser: |
| (i) | Any preliminary prospectus or prospectus of the undersigned registrant relating to the offering required to be filed pursuant to Rule 424; |
| (ii) | Any free writing prospectus relating to the offering prepared by or on behalf of the undersigned registrant or used or referred to by the undersigned registrant; |
| (iii) | The portion of any other free writing prospectus relating to the offering containing material information about the undersigned registrant or its securities provided by or on behalf of the undersigned registrant; and |
| (iv) | Any other communication that is an offer in the offering made by the undersigned registrant to the purchaser. |
| (b) | Insofar as indemnification for liabilities arising under the Securities Act may be permitted to directors, officers and controlling persons of the Company pursuant to the foregoing provisions, or otherwise, the Company has been advised that in the opinion of the SEC such indemnification is against public policy as expressed in the Securities Act and is, therefore, unenforceable. In the event that a claim for indemnification against such liabilities (other than the payment by the Company of expenses incurred or paid by a director, officer or controlling person of the Company in the successful defense of any action, suit or proceeding) is asserted by such director, officer or controlling person in connection with the securities being registered, the Company will, unless in the opinion of its counsel the matter has been settled by controlling precedent, submit to a court of appropriate jurisdiction the question whether such indemnification by it is against public policy as expressed in the Securities Act and will be governed by the final adjudication of such issue. |
II-7
SIGNATURES
Pursuant to the requirements of the Securities Act of 1933, the registrant has duly caused this registration statement to be signed on its behalf by the undersigned, thereunto duly authorized, in the city of Manhattan Beach, State of California on November 9, 2020.
FISKER INC. | ||
By: | /s/ Henrik Fisker | |
Henrik Fisker | ||
President and Chief Executive Officer | ||
POWER OF ATTORNEY
KNOW ALL PERSONS BY THESE PRESENTS, that each person whose signature appears below hereby constitutes and appoints, jointly and severally, Henrik Fisker and Dr. Geeta Gupta, and each of them, as his or herwith full power of substitution, for him or her in any and all capacities, to sign any and all amendments to this Registration Statement (including
attorney-in-fact,
post-effective
amendments), and any and all Registration Statements filed pursuant to Rule 462 under the Securities Act of 1933, as amended, in connection with or related to the offering contemplated by this Registration Statement and its amendments, if any, and to file the same, with exhibits thereto and other documents in connection therewith, with the SEC, hereby ratifying and confirming our signatures as they may be signed by our said attorney to any and all amendments to said Registration Statement.Pursuant to the requirements of the Securities Act of 1933, this Registration Statement has been signed by the following persons in the capacities and on the dates indicated.
Signature | Title | Date | ||||
/s/ Henrik Fisker Henrik Fisker | Chairman, President and Chief Executive Officer | November 9, 2020 | ||||
/s/ Geeta Gupta Dr. Geeta Gupta | Chief Financial Officer | November 9, 2020 | ||||
/s/ Wendy J. Greuel Wendy J. Greuel | Director | November 9, 2020 | ||||
/s/ Mark E. Hickson Mark E. Hickson | Director | November 9, 2020 | ||||
/s/ William R. McDermott William R. McDermott | Director | November 9, 2020 | ||||
/s/ Roderick K. Randall Roderick K. Randall | Director | November 9, 2020 | ||||
/s/ Nadine I. Watt Nadine I. Watt | Director | November 9, 2020 | ||||
II-8