| FREE WRITING PROSPECTUS | ||
| FILED PURSUANT TO RULE 433 | ||
| REGISTRATION FILE NO.: 333-206847-08 | ||
 |  |  |
BANK 2017-BNK9
Free Writing Prospectus
Structural and Collateral Term Sheet
$1,053,725,818
(Approximate Total Mortgage Pool Balance)
$875,909,000
(Approximate Offered Certificates)
Banc of America Merrill Lynch Commercial Mortgage Inc.
as Depositor
Bank of America, National Association
Morgan Stanley Mortgage Capital Holdings LLC
Wells Fargo Bank, National Association
as Sponsors and Mortgage Loan Sellers
Commercial Mortgage Pass-Through Certificates
Series 2017-BNK9
November 28, 2017
| BofA MERRILL LYNCH | WELLS FARGO SECURITIES | MORGAN STANLEY |
| Co-Lead Manager and | Co-Lead Manager and | Co-Lead Manager and |
| Joint Bookrunner | Joint Bookrunner | Joint Bookrunner |
| Drexel Hamilton | ||
| Co-Manager |
STATEMENT REGARDING THIS FREE WRITING PROSPECTUS
The depositor has filed a registration statement (including a prospectus) with the SEC (File No. 333-206847) for the offering to which this communication relates. Before you invest, you should read the prospectus in that registration statement and other documents the depositor has filed with the SEC for more complete information about the depositor, the issuing entity and this offering. You may get these documents for free by visiting EDGAR on the SEC web site atwww.sec.gov. Alternatively, the depositor or any underwriter or any dealer participating in the offering will arrange to send you the prospectus if you request it by calling toll free 1-800-294-1322 or by email todg.Prospectus_Requests@baml.com.
This is not a research report and was not prepared by any Underwriter’s research department. It was prepared by the Underwriters’ sales, trading, banking or other non-research personnel. Please see additional important information and qualifications at the end of this Term Sheet. |
Neither this Term Sheet nor anything contained herein shall form the basis for any contract or commitment whatsoever.The information contained herein is preliminary as of the date hereof.This Term Sheet is subject to change, completion or amendment from time to time.The information contained herein will be superseded by similar information delivered to you as part of the Preliminary Prospectus.The information contained herein supersedes any such information previously delivered.The information contained herein should be reviewed only in conjunction with the entire Preliminary Prospectus.All of the information contained herein is subject to the same limitations and qualifications contained in the Preliminary Prospectus.The information contained herein does not contain all relevant information relating to the underlying mortgage loans or mortgaged properties.Such information is described in the Preliminary Prospectus.The information contained herein will be more fully described in the Preliminary Prospectus.The information contained herein should not be viewed as projections, forecasts, predictions or opinions with respect to value.Prior to making any investment decision, prospective investors are strongly urged to read the Preliminary Prospectus in its entirety.Neither the Securities and Exchange Commission nor any state securities commission has approved or disapproved of these securities or determined if this Term Sheet is truthful or complete.Any representation to the contrary is a criminal offense.
IMPORTANT NOTICE RELATING TO AUTOMATICALLY GENERATED EMAIL DISCLAIMERS
Any legends, disclaimers or other notices that may appear at the bottom of, or attached to, the email communication to which this Term Sheet may have been attached are not applicable to this Term Sheet and should be disregarded. Such legends, disclaimers or other notices have been automatically generated as a result of this Term Sheet having been sent via Bloomberg or another email system.
IMPORTANT NOTICE REGARDING THE CONDITIONS FOR THIS OFFERING OF ASSET-BACKED SECURITIES
THE ASSET-BACKED SECURITIES REFERRED TO IN THIS TERM SHEET ARE BEING OFFERED WHEN, AS AND IF ISSUED. IN PARTICULAR, YOU ARE ADVISED THAT THE ASSET-BACKED SECURITIES, AND THE ASSET POOL BACKING THEM, ARE SUBJECT TO MODIFICATION OR REVISION (INCLUDING, AMONG OTHER THINGS, THE POSSIBILITY THAT ONE OR MORE CLASSES OF SECURITIES MAY BE SPLIT, COMBINED OR ELIMINATED), AT ANY TIME PRIOR TO ISSUANCE OR AVAILABILITY OF A FINAL PROSPECTUS. AS A RESULT, YOU MAY COMMIT TO PURCHASE SECURITIES THAT HAVE CHARACTERISTICS THAT MAY CHANGE, AND YOU ARE ADVISED THAT ALL OR A PORTION OF THE SECURITIES MAY NOT BE ISSUED THAT HAVE THE CHARACTERISTICS DESCRIBED IN THIS TERM SHEET. OUR OBLIGATION TO SELL SECURITIES TO YOU IS CONDITIONED ON THE SECURITIES AND THE UNDERLYING TRANSACTION HAVING THE CHARACTERISTICS DESCRIBED IN THIS TERM SHEET. IF WE DETERMINE THAT THE FOREGOING CONDITION IS NOT SATISFIED IN ANY MATERIAL RESPECT, WE WILL NOTIFY YOU, AND NEITHER THE ISSUING ENTITY NOR ANY UNDERWRITER WILL HAVE ANY OBLIGATION TO YOU TO DELIVER ALL OR ANY PORTION OF THE SECURITIES WHICH YOU HAVE COMMITTED TO PURCHASE, AND THERE WILL BE NO LIABILITY BETWEEN US AS A CONSEQUENCE OF THE NON-DELIVERY.
This is not a research report and was not prepared by any Underwriter’s research departments. Please see additional important information and qualifications at the end of this Term Sheet. |
| T-2 |
| BANK 2017-BNK9 | Structural Overview |
Offered Certificates
| Class | Expected Ratings (Fitch/KBRA/Moody’s)(1) | Approximate Initial Certificate Balance or Notional Amount(2) | Approximate Initial Credit Support(3) | Pass-Through Rate Description | Expected Weighted Average Life (Years)(4) | Expected Principal Window (Months)(4) | Certificate Principal UW NOI Debt Yield(5) | Certificate Principal to Value Ratio(6) |
| Class A-1 | AAAsf/AAA(sf)/Aaa(sf) | $26,278,000 | 30.000% | (7) | 2.78 | 1– 59 | 16.4% | 41.7% |
| Class A-2 | AAAsf/AAA(sf)/Aaa(sf) | $27,104,000 | 30.000% | (7) | 4.95 | 59 – 60 | 16.4% | 41.7% |
| Class A-SB | AAAsf/AAA(sf)/Aaa(sf) | $39,690,000 | 30.000% | (7) | 7.44 | 60 – 116 | 16.4% | 41.7% |
| Class A-3 | AAAsf/AAA(sf)/Aaa(sf) | [$300,000,000] | 30.000% | (7) | [9.81] | 116 – 119 | 16.4% | 41.7% |
| Class A-4 | AAAsf/AAA(sf)/Aaa(sf) | [$307,655,000] | 30.000% | (7) | [9.92] | 119 – 120 | 16.4% | 41.7% |
| Class X-A | AAAsf/AAA(sf)/Aaa(sf) | $700,727,000(8) | N/A | Variable(9) | N/A | N/A | N/A | N/A |
| Class X-B | A-sf/AAA(sf)/NR | $175,182,000(8) | N/A | Variable(9) | N/A | N/A | N/A | N/A |
| Class A-S | AAAsf/AAA(sf)/Aa2(sf) | $41,293,000 | 25.875% | (7) | 9.99 | 120 – 120 | 15.5% | 44.2% |
| Class B | AA-sf/AA(sf)/NR | $82,586,000 | 17.625% | (7) | 9.99 | 120 – 120 | 14.0% | 49.1% |
| Class C | A-sf/A-(sf)/NR | $51,303,000 | 12.500% | (7) | 9.99 | 120 – 120 | 13.1% | 52.1% |
Privately Offered Certificates(10)
| Class | Expected Ratings (Fitch/KBRA/Moody’s)(1) | Approximate Initial Certificate Balance or Notional Amount(2) | Approximate Initial Credit Support(3) | Pass-Through Rate Description | Expected Weighted Average Life (Years)(4) | Expected Principal Window (Months)(4) | Certificate Principal UW NOI Debt Yield(5) | Certificate Principal to Value Ratio(6) |
| Class X-D | BBB-sf/BBB-(sf)/NR | $47,549,000(8) | N/A | Variable(9) | N/A | N/A | N/A | N/A |
| Class X-E | BB+sf/BB-(sf)/NR | $21,273,000(8) | N/A | Variable(9) | N/A | N/A | N/A | N/A |
| Class X-F | B+sf/B-(sf)/NR | $15,015,000(8) | N/A | Variable(9) | N/A | N/A | N/A | N/A |
| Class X-G | NR/NR/NR | $41,293,526(8) | N/A | Variable(9) | N/A | N/A | N/A | N/A |
| Class D | BBB-sf/BBB-(sf)/NR | $47,549,000 | 7.750% | (7) | 10.00 | 120 – 123 | 12.5% | 55.0% |
| Class E | BB+sf/BB-(sf)/NR | $21,273,000 | 5.625% | (7) | 10.24 | 123 – 123 | 12.2% | 56.2% |
| Class F | B+sf/B-(sf)/NR | $15,015,000 | 4.125% | (7) | 10.24 | 123 – 123 | 12.0% | 57.1% |
| Class G | NR/NR/NR | $41,293,526 | 0.000% | (7) | 11.25 | 123 – 179 | 11.5% | 59.6% |
Non-Offered Eligible Vertical Interest(10)
| Class | Expected Ratings (Fitch/KBRA/Moody’s)(1) | Approximate Initial Certificate Balance or Notional Amount(2) | Approximate Initial Credit Support(3) | Pass- Through Rate Description | Expected Weighted Average Life (Years)(4) | Expected Principal Window (Months)(4) | Certificate Principal UW NOI Debt Yield | Certificate Principal to Value Ratio |
| RR Interest | NR/NR/NR | $52,686,290.90 | N/A | (11) | 9.55 | 1– 179 | N/A | N/A |
| (1) | Ratings shown are those of Fitch Ratings, Inc. (“Fitch”), Kroll Bond Rating Agency, Inc. (“KBRA”) and Moody’s Investors Service, Inc. (“Moody’s”). Certain nationally recognized statistical rating organizations that were not hired by the depositor may use information they receive pursuant to Rule 17g-5 under the Securities Exchange Act of 1934, as amended, or otherwise to rate the certificates. There can be no assurance as to what ratings a non-hired nationally recognized statistical rating organization would assign. See “Risk Factors—Other Risks Relating to the Certificates—Nationally Recognized Statistical Rating Organizations May Assign Different Ratings to the Certificates; Ratings of the Certificates Reflect Only the Views of the Applicable Rating Agencies as of the Dates Such Ratings Were Issued; Ratings May Affect ERISA Eligibility; Ratings May Be Downgraded” and “Ratings” in the Preliminary Prospectus to be dated on or about the date hereof (the “Preliminary Prospectus”). Capitalized terms used but not defined herein have the meanings assigned to such terms in the Preliminary Prospectus. Fitch, KBRA and Moody’s have informed us that the “sf” designation in their ratings represents an identifier for structured finance product ratings. |
| (2) | Approximate, subject to a permitted variance of plus or minus 5%. In addition, the notional amounts of the Class X-A, Class X-B, Class X-D, Class X-E, Class X-F and Class X-G certificates may vary depending upon the final pricing of the classes of principal balance certificates whose certificate balances comprise such notional amounts, and, if as a result of such pricing the pass-through rate of any class of the Class X-A, Class X-B, Class X-D, Class X-E, Class X-F or Class X-G certificates, as applicable, would be equal to zero at all times, such class of certificates will not be issued on the closing date of this securitization. |
| (3) | The approximate initial credit support percentages set forth for the certificates are approximate and, for the Class A-1, Class A-2, Class A-SB, Class A-3 and Class A-4 certificates, are represented in the aggregate. The RR Interest provides credit support only to the limited extent that it is allocated a portion of any losses incurred on the underlying mortgage loans, which such losses are allocated between it, on the one hand, and to the Offered Certificates and the Non-Offered Certificates, on the other hand,pro ratain accordance with their respective Percentage Allocation Entitlements (as defined below). See “Credit Risk Retention” in the Preliminary Prospectus. |
| (4) | The Expected Weighted Average Life and Expected Principal Window during which distributions of principal would be received as set forth in the foregoing table with respect to each class of certificates having a certificate balance are based on the assumptions set forth under “Yield and Maturity Considerations— |
This is not a research report and was not prepared by any Underwriter’s research departments. Please see additional important information and qualifications at the end of this Term Sheet. |
| T-3 |
| BANK 2017-BNK9 | Structural Overview |
| Weighted Average Life” in the Preliminary Prospectus and on the assumptions that there are no prepayments, modifications or losses in respect of the mortgage loans and that there are no extensions or forbearances of maturity dates or anticipated repayment dates of the mortgage loans. |
| (5) | Certificate Principal UW NOI Debt Yield for any class of principal balance certificates (other than the RR Interest) is calculated as the product of (a) the weighted average UW NOI Debt Yield for the mortgage pool, multiplied by (b) a fraction, the numerator of which is the total initial certificate balance of all the principal balance certificates (other than the RR Interest), and the denominator of which is the total initial certificate balance of the subject class of principal balance certificates and all other classes of principal balance certificates (other than the RR Interest), if any, that are senior to such class (without regard to the RR Interest). The Certificate Principal UW NOI Debt Yields of the Class A-1, Class A-2, Class A-SB, Class A-3 and Class A-4 certificates are calculated in the aggregate for those classes as if they were a single class. |
| (6) | Certificate Principal to Value Ratio for any class of principal balance certificates (other than the RR Interest) is calculated as the product of (a) the weighted average Cut-off Date LTV Ratio of the mortgage pool, multiplied by (b) a fraction, the numerator of which is the total initial certificate balance of the subject class of principal balance certificates and all other classes of principal balance certificates (other than the RR Interest), if any, that are senior to such class, and the denominator of which is the total initial certificate balance of all the principal balance certificates (other than the RR Interest). The Certificate Principal to Value Ratios of the Class A-1, Class A-2, Class A-SB, Class A-3 and Class A-4 certificates are calculated in the aggregate for those classes as if they were a single class. |
| (7) | The pass-through rate for each class of the Class A-1, Class A-2, Class A-SB, Class A-3, Class A-4, Class A-S, Class B, Class C, Class D, Class E, Class F and Class G certificates (which, together with the RR Interest, are referred to as the “principal balance certificates”) will be one of the following: (i) a fixed rateper annum, (ii) a variable rateper annum equal to the weighted average of the net mortgage interest rates on the mortgage loans for the related distribution date, (iii) a variable rateper annum equal to the lesser of (a) a fixed rate and (b) the weighted average of the net mortgage interest rates on the mortgage loans for the related distribution date or (iv) a variable rateper annum equal to the weighted average of the net mortgage interest rates on the mortgage loans for the related distribution date minus a specified percentage. For purposes of the calculation of the weighted average of the net mortgage interest rates on the mortgage loans for each distribution date, the net mortgage interest rates will be adjusted as necessary to a 30/360 basis. |
| (8) | The Class X-A, Class X-B, Class X-D, Class X-E, Class X-F and Class X-G certificates (collectively referred to as the “Class X certificates”) are notional amount certificates and will not be entitled to distributions of principal. The notional amount of the Class X-A certificates will be equal to the aggregate certificate balance of the Class A-1, Class A-2, Class A-SB, Class A-3 and Class A-4 certificates. The notional amount of the Class X-B certificates will be equal to the aggregate certificate balance of the Class A-S, Class B and Class C certificates. The notional amount of each class of the Class X-D, Class X-E, Class X-F and Class X-G certificates will be equal to the certificate balance of the class of principal balance certificates that with the addition of “X-”, has the same alphabetical designation as the subject class of Class X certificates. |
| (9) | The pass-through rate for the Class X-A certificates for any distribution date will be aper annum rate equal to the excess, if any, of (a) the weighted average of the net mortgage interest rates on the mortgage loans for the related distribution date, over (b) the weighted average of the pass-through rates on the Class A-1, Class A-2, Class A-SB, Class A-3 and Class A-4 certificates for the related distribution date, weighted on the basis of their respective certificate balances outstanding immediately prior to that distribution date. The pass-through rate for the Class X-B certificates for any distribution date will be aper annum rate equal to the excess, if any, of (a) the weighted average of the net mortgage interest rates on the mortgage loans for the related distribution date, over (b) the weighted average of the pass-through rates on the Class A-S, Class B and Class C certificates for the related distribution date, weighted on the basis of their respective certificate balances outstanding immediately prior to that distribution date. The pass-through rate for each class of the Class X-D, Class X-E, Class X-F and Class X-G certificates for any distribution date will be aper annum rate equal to the excess, if any, of (a) the weighted average of the net mortgage interest rates on the mortgage loans for the related distribution date, over (b) the pass-through rate for the related distribution date of the class of principal balance certificates that, with the addition of “X-”, has the same alphabetical designation as the subject class of Class X certificates. For purposes of the calculation of the weighted average of the net mortgage interest rates on the mortgage loans for each distribution date, the net mortgage interest rates will be adjusted as necessary to a 30/360 basis. |
| (10) | Not offered pursuant to the Preliminary Prospectus or this Term Sheet and referred to herein as the “Non-Offered Certificates”. Information provided in this Term Sheet regarding the characteristics of these certificates is provided only to enhance your understanding of the offered certificates. The Non-Offered Certificates also include the Class R certificates, which do not have a certificate balance, notional amount, credit support, pass-through rate, rating, assumed final distribution date or rated final distribution date, and which are not shown in the chart. The Class R certificates represent the beneficial ownership of the residual interest in each of the real estate mortgage investment conduits, as further described in the Preliminary Prospectus. |
| (11) | Although it does not have a specified pass-through rate (other than for tax reporting purposes), the effective pass-through rate for the RR Interest will be a variable rateper annumequal to the weighted average of the net mortgage interest rates on the mortgage loans for the related distribution date (in each case adjusted, if necessary, to accrue on the basis of a 360-day year consisting of twelve 30-day months). |
This is not a research report and was not prepared by any Underwriter’s research departments. Please see additional important information and qualifications at the end of this Term Sheet. |
| T-4 |
| BANK 2017-BNK9 | Structural Overview |
Issue Characteristics
| Offered Certificates: | $875,909,000 (approximate) monthly pay, multi-class, commercial mortgage pass-through certificates, consisting of eight principal balance classes (Class A-1, Class A-2, Class A-SB, Class A-3, Class A-4, Class A-S, Class B and Class C) and two interest-only classes (Class X-A and Class X-B) | |
| Co-Lead Managers and Joint Bookrunners: | Merrill Lynch, Pierce, Fenner & Smith Incorporated, Morgan Stanley & Co. LLC and Wells Fargo Securities, LLC | |
| Co-Manager: | Drexel Hamilton, LLC | |
| Mortgage Loan Sellers: | Bank of America, National Association, Morgan Stanley Mortgage Capital Holdings LLC and Wells Fargo Bank, National Association | |
| Rating Agencies: | Moody’s Investors Service, Inc., Fitch Ratings, Inc. and Kroll Bond Rating Agency, Inc. | |
| Master Servicer: | Wells Fargo Bank, National Association | |
| Special Servicer: | Rialto Capital Advisors, LLC | |
| Certificate Administrator/ Certificate Registrar/Custodian: | Wells Fargo Bank, National Association | |
| Trustee: | Wilmington Trust, National Association | |
| Operating Advisor: | Park Bridge Lender Services LLC | |
| Asset Representations Reviewer: | Park Bridge Lender Services LLC | |
| Initial Directing Certificateholder: | RREF III Debt AIV, LP, or another affiliate of Rialto Capital Advisors, LLC | |
| Risk Retention Consultation Party: | Bank of America, National Association | |
| U.S. Credit Risk Retention: | For a discussion on the manner in which the U.S. credit risk retention requirements will be addressed by Bank of America, National Association, as the retaining sponsor, see “Credit Risk Retention” in the Preliminary Prospectus. | |
| EU Risk Retention: | For a discussion of the manner in which each of Bank of America, National Association, Morgan Stanley Bank, N.A. and Wells Fargo Bank, National Association will covenant and represent to each other, the issuing entity and the trustee to retain a material net economic interest in the securitization for the purpose of the EU risk retention requirements and due diligence requirements, see “EU Securitization Risk Retention Requirements” in the Preliminary Prospectus. | |
| Cut-off Date: | The mortgage loans will be considered part of the trust fund as of their respective cut-off dates. The cut-off date with respect to each mortgage loan is the respective due date for the monthly debt service payment that is due in December 2017 (or, in the case of any mortgage loan that has its first due date after December 2017, the date that would have been its due date in December 2017 under the terms of that mortgage loan if a monthly debt service payment were scheduled to be due in that month). | |
| Expected Pricing Date: | Week of December 4, 2017 | |
| Expected Closing Date: | Week of December 18, 2017 | |
| Determination Dates: | The 11th day of each month or, if the 11th day is not a business day, then the business day immediately following such 11th day | |
| Distribution Dates: | The 4th business day following each determination date. The first distribution date will be in January 2018. | |
| Rated Final Distribution Date: | The distribution date in November 2054 | |
| Interest Accrual Period: | Preceding calendar month | |
| Payment Structure: | Sequential pay | |
| Tax Treatment: | REMIC | |
| Optional Termination: | 1.00% clean-up call (solely for the purposes of this calculation, if such right is being exercised after January 2028 and the Hackensack Commons mortgage loan, Dover Town Center mortgage loan or the Woodside Village mortgage loan is still an asset of the trust, then such mortgage loan(s) will be excluded from the then-aggregate stated principal balance of the pool of mortgage loans and from the initial pool balance) | |
| Minimum Denominations: | $10,000 for each class of Offered Certificates (other than Class X-A and Class X-B certificates); $1,000,000 for the Class X-A and Class X-B certificates | |
| Settlement Terms: | DTC, Euroclear and Clearstream | |
| Legal/Regulatory Status: | Each class of Offered Certificates is expected to be eligible for exemptive relief under ERISA. No class of Offered Certificates is SMMEA eligible. | |
| Analytics: | The certificate administrator is expected to make available all distribution date statements, CREFC® reports and supplemental notices received by it to certain modeling financial services as described in the Preliminary Prospectus. | |
| Bloomberg Ticker: | BANK 2017-BNK9<MTGE><GO> | |
| Risk Factors: | THE CERTIFICATES INVOLVE CERTAIN RISKS AND MAY NOT BE SUITABLE FOR ALL INVESTORS. SEE THE “RISK FACTORS” SECTION OF THE PRELIMINARY PROSPECTUS. |
This is not a research report and was not prepared by any Underwriter’s research departments. Please see additional important information and qualifications at the end of this Term Sheet. |
| T-5 |
| BANK 2017-BNK9 | Structural Overview |
Structural Overview
| Allocation Between the RR Interest and the Non-Retained Certificates: | The aggregate amount available for distributions to the holders of the Certificates (including the RR Interest) on each distribution date (net of specified expenses of the issuing entity, including fees payable to, and costs and expenses reimbursable to, the master servicer, any primary servicers, the special servicer, the certificate administrator, the trustee, the operating advisor, the asset representations reviewer and CREFC®) will be allocated between amounts available for distribution to the holders of the RR Interest, on the one hand, and to all other Certificates, referred to herein (excluding the Class R certificates) as the “Non-Retained Certificates”, on the other hand. The portion of such amount allocable to (a) the RR Interest will at all times be the product of such amount multiplied by 5% and (b) the Non-Retained Certificates will at all times be the product of such amount multiplied by the difference between 100% and the percentage set forth in clause (a) (each, the respective “Percentage Allocation Entitlement”). | |
| Accrual: | Each class of Offered Certificates will accrue interest on a 30/360 basis. | |
| Amount and Order of Distributions: | On each distribution date, the Non-Retained Certificates’ Percentage Allocation Entitlement of funds available for distribution from the mortgage loans, net of (i) any yield maintenance charges and prepayment premiums and (ii) any excess interest, will be distributed in the following amounts and order of priority:
First, to the Class A-1, Class A-2, Class A-SB, Class A-3, Class A-4, Class X-A, Class X-B, Class X-D, Class X-E, Class X-F and Class X-G certificates, in respect of interest, up to an amount equal to, andpro rata in accordance with, the interest entitlements for those classes;
Second, to the Class A-1, Class A-2, Class A-SB, Class A-3, and Class A-4 certificates as follows, to the extent of applicable available funds allocated to principal: either (i)(a)first, to principal on the Class A-SB certificates, until the certificate balance of the Class A-SB certificates is reduced to the planned principal balance for the related distribution date set forth in Annex E to the Preliminary Prospectus, and (b)second, to principal on each class of the Class A-1, Class A-2, Class A-3, Class A-4 and Class A-SB certificates, in that order, in each case until the certificate balance of such class of certificates has been reduced to zero, or (ii) if the certificate balance of each class of principal balance certificates other than the Class A-1, Class A-2, Class A-SB, Class A-3 and Class A-4 certificates and the RR Interest has been reduced to zero as a result of the allocation of losses on the mortgage loans to those certificates, to principal on the Class A-1, Class A-2, Class A-SB, Class A-3 and Class A-4 certificates,pro rata, without regard to the distribution priorities described above or the planned principal balance of the Class A-SB certificates;
Third, to the Class A-1, Class A-2, Class A-SB, Class A-3 and Class A-4 certificates, first, up to an amount equal to, andpro rata based on, any previously unreimbursed losses on the mortgage loans allocable to principal that were previously borne by each such class and then in the amount of interest thereon;
Fourth, to each class of the Class A-S, Class B and Class C certificates, in that order, in each case as follows: (a) to interest on such class of certificates up to an amount equal to its interest entitlement; (b) to the extent of applicable available funds allocable to principal remaining after distributions in respect of principal to each class with a higher priority (as set forth in this clause or prior enumerated clauses set forth above), to principal on such class of certificates until its certificate balance has been reduced to zero; and (c) to reimburse such class of certificates, first, up to an amount any previously unreimbursed losses on the mortgage loans that were previously allocated to those certificates, then up to the amount of interest thereon;
Fifth, to the Non-Offered Certificates (other than the Class X-D, Class X-E, Class X-F, Class X-G and Class R certificates) in the amounts and order of priority described in “Description of the Certificates—Distributions” in the Preliminary Prospectus; and
Sixth, to the Class R certificates, any remaining amounts. | |
| Interest and Principal Entitlements: | The interest entitlement of each class of Offered Certificates on each distribution date generally will be the interest accrued during the related interest accrual period on the related certificate balance or notional amount at the related pass-through rate, net of any prepayment interest shortfalls allocated to that class for such distribution date as described below. If prepayment interest shortfalls arise from voluntary prepayments on serviced mortgage loans during any collection period, the applicable master servicer is required to make a limited compensating interest payment to offset those shortfalls. See “Description of the Certificates—Prepayment Interest Shortfalls” in the Preliminary Prospectus. The remaining amount of prepayment interest shortfalls will be allocated between the RR Interest, on one hand, and the Non-Retained Certificates, on the other hand, in accordance with their respective Percentage Allocation Entitlements. The prepayment interest shortfalls allocated to the Non-Retained Certificates (other than the Class R Certificates) will be allocated among such classes of certificates entitled to interest, on apro rata basis, based on their respective amounts of accrued interest for the related distribution date, to reduce the interest entitlement on each such class of certificates. If a class receives less than the entirety of its interest entitlement on any distribution date, then the shortfall (excluding any shortfall due to prepayment interest shortfalls), together with interest thereon, will be added to its interest entitlement for the next succeeding distribution date.
The aggregate principal distribution amount for each distribution date generally will be the aggregate amount of principal received or advanced in respect of the mortgage loans, net of any non-recoverable advances and interest thereon and any workout-delayed reimbursement amounts that are reimbursed to the applicable master servicer or the trustee during the related collection period. Non-recoverable advances and interest thereon are reimbursable from principal collections before reimbursement from other amounts. Workout-delayed reimbursement amounts will be reimbursable from principal collections. The Non-Retained Certificates and the RR Interest will be entitled to their respective Percentage Allocation Entitlements of the aggregate principal distribution amount. |
This is not a research report and was not prepared by any Underwriter’s research departments. Please see additional important information and qualifications at the end of this Term Sheet. |
| T-6 |
| BANK 2017-BNK9 | Structural Overview |
| Special Servicer Compensation: | The principal compensation to be paid to a special servicer in respect of its special servicing activities will be the special servicing fee, the workout fee and the liquidation fee.
The special servicing fee for each distribution date is calculated based on the outstanding principal balance of each serviced mortgage loan that is a specially serviced mortgage loan (and any related serviced companion loan) or as to which the related mortgaged property has become an REO property at the special servicing fee rate, which will be a rate equal to (i) the greater of 0.25% and theper annum rate that would result in a special servicing fee of $3,500 for the related month or (ii) for any mortgage loan with respect to which the Risk Retention Consultation Party is entitled to consult with the special servicer, for so long as the related mortgage loan is a specially serviced loan, and during the continuance of a consultation termination event, $5,000. The special servicing fee will be payable monthly,first, from liquidation proceeds, insurance and condemnation proceeds, and other collections in respect of the related specially serviced mortgage loan or REO property and,then, from general collections on all the serviced mortgage loans and any REO properties.
Each special servicer will also be entitled to (i) liquidation fees generally equal to 1.0% (or, if such rate would result in an aggregate liquidation fee less than $25,000, then the liquidation fee rate will be equal to the lesser of (i) 3.0% and (ii) such lower rate as would result in an aggregate liquidation fee equal to $25,000) of liquidation proceeds and certain other collections in respect of a specially serviced mortgage loan (and any related serviced companion loan) or related REO property and of amounts received in respect of mortgage loan repurchases by the related mortgage loan sellers and (ii) workout fees generally equal to 1.0% of interest (other than default interest) and principal payments made in respect of a rehabilitated mortgage loan (and any related serviced companion loan), subject to a floor of $25,000 with respect to any mortgage loan, whole loan or related REO property, and in the case of each of clause (i) and (ii), subject to certain adjustments and exceptions as described in the Preliminary Prospectus under “Pooling and Servicing Agreement—Servicing and Other Compensation and Payment of Expenses—Special Servicing Compensation”.
With respect to any non-serviced mortgage loan, the related special servicer under the related other pooling and servicing agreement pursuant to which such mortgage loan is being serviced will be entitled to similar compensation as that described above with respect to such non-serviced mortgage loan under such other pooling and servicing agreement as further described in the Preliminary Prospectus, although any related fees may accrue at a different rate and there may be a higher (or no) cap on liquidation and workout fees. | |
| Prepayment Premiums/Yield Maintenance Charges: | If any yield maintenance charge or prepayment premium is collected during any collection period with respect to any mortgage loan, then on the immediately succeeding distribution date, the certificate administrator will pay: (i)(a) to the holders of each class of the Class A-1, Class A-2, Class A-SB, Class A-3, Class A-4, Class A-S, Class B, Class C and Class D certificates, the product of (x) the Non-Retained Certificates’ Percentage Allocation Entitlement of such yield maintenance charge or prepayment premium, (y) the related Base Interest Fraction for such class and the applicable principal prepayment, and (z) a fraction, the numerator of which is equal to the amount of principal distributed to such class for that distribution date, and the denominator of which is the total amount of principal distributed to all principal balance certificates (other than the RR Interest) for that distribution date, (b) to the holders of the Class X-A certificates, the excess, if any, of (x) the product of (1) the Non-Retained Certificates’ Percentage Allocation Entitlement of such yield maintenance charge or prepayment premium and (2) a fraction, the numerator of which is equal to the amount of principal distributed to the Class A-1, Class A-2, Class A-SB, Class A-3 and Class A-4 certificates for that distribution date, and the denominator of which is the total amount of principal distributed to all principal balance certificates (other than the RR Interest) for that distribution date, over (y) the amount of such yield maintenance charge or prepayment premium distributed to the Class A-1, Class A-2, Class A-SB, Class A-3 and Class A-4 certificates as described above, and (c) to the holders of the Class X-B certificates, any remaining portion of the Non-Retained Certificates’ Percentage Allocation Entitlement of such yield maintenance charge or prepayment premium not distributed as described above, and (ii) to the RR Interest, its Percentage Allocation Entitlement of such yield maintenance charge or prepayment premium.
No prepayment premiums or yield maintenance charges will be distributed to the holders of the Class X-D, Class X-E, Class X-F, Class X-G, Class E, Class F, Class G or Class R Certificates.
“Base Interest Fraction” means, with respect to any principal prepayment of any mortgage loan that provides for the payment of a yield maintenance charge or prepayment premium, and with respect to any class of principal balance certificates (other than the RR Interest), a fraction (A) the numerator of which is the greater of (x) zero and (y) the difference between (i) the pass-through rate on that class, and (ii) the applicable discount rate and (B) the denominator of which is the difference between (i) the mortgage interest rate on the related mortgage loan and (ii) the applicable discount rate; provided, that: under no circumstances will the Base Interest Fraction be greater than one; if the discount rate referred to above is greater than or equal to both the mortgage interest rate on the related mortgage loan and the pass-through rate on that class, then the Base Interest Fraction will equal zero; and if the discount rate referred to above is greater than or equal to the mortgage interest rate on the related mortgage loan and is less than the pass-through rate on that class, then the Base Interest Fraction will be equal to 1.0.
Consistent with the foregoing, the Base Interest Fraction is equal to:
(Pass-Through Rate – Discount Rate) (Mortgage Rate – Discount Rate) |
This is not a research report and was not prepared by any Underwriter’s research departments. Please see additional important information and qualifications at the end of this Term Sheet. |
| T-7 |
| BANK 2017-BNK9 | Structural Overview |
| Realized Losses: | On each distribution date, immediately following the distributions to be made to the certificateholders on that date, the certificate administrator is required to calculate the amount, if any, by which (i) the aggregate stated principal balance of the mortgage loans, including any successor REO loans, expected to be outstanding immediately following that distribution date is less than (ii) the then aggregate certificate balance of the principal balance certificates after giving effect to distributions of principal on that distribution date. The Non-Retained Certificates’ Percentage Allocation Entitlement of such amount will be applied to the Class G, Class F, Class E, Class D, Class C, Class B and Class A-S certificates, in that order, in each case until the related certificate balance has been reduced to zero, and then to the Class A-1, Class A-2, Class A-SB, Class A-3 and Class A-4 certificates,pro rata based upon their respective certificate balances, until their respective certificate balances have been reduced to zero. The RR Interest’s Percentage Allocation Entitlement of such amount will be applied to the RR Interest until the related RR Interest balance has been reduced to zero. | |
| Serviced Whole Loans: | Each of the following mortgaged properties or portfolio of mortgaged properties secures a mortgage loan and one or morepari passu promissory notes (each, a “servicedpari passu companion loan”) that will be serviced pursuant to the related intercreditor agreement and the pooling and servicing agreement for this transaction: Laguna Cliff’s Marriott and Warwick Mall. With respect to each such mortgaged property or portfolio of mortgaged properties, the related mortgage loan, together with the related servicedpari passu companion loan(s), is referred to herein (for so long as it is serviced under the pooling and servicing agreement for this transaction) as a “servicedpari passuwhole loan.” Each servicedpari passu companion loan is not part of the mortgage pool and may be contributed to one or more future securitization transactions (if not already securitized) or may be otherwise transferred at any time, subject to compliance with the related intercreditor agreement. See the table below entitled “Mortgage Loans with Pari Passu Companion Loans,” as well as “Description of the Mortgage Pool—The Whole Loans” in the Preliminary Prospectus, for additional information regarding each such whole loan. | |
| Non-Serviced Whole Loans: | Each of the following mortgaged properties or portfolio of mortgaged properties secures a mortgage loan (each, a “non-serviced mortgage loan”), one or morepari passu promissory notes and, in some cases, one or more generally subordinate promissory notes (each such promissory note, a “non-serviced companion loan”) that will be serviced pursuant to the related intercreditor agreement and the pooling and servicing agreement or trust and servicing agreement (referred to herein as a related “pooling and servicing agreement”) for another securitization transaction: Griffin Portfolio, Colorado Center, Park Square, U.S. Industrial Portfolio III and Bass Pro & Cabela’s Portfolio. With respect to each such mortgaged property or portfolio of mortgaged properties, the related mortgage loan, together with the related non-serviced companion loan(s), is referred to herein (for so long as it is serviced under the pooling and servicing agreement for another securitization transaction) as a “non-serviced whole loan.” Each non-serviced companion loan is not part of the mortgage pool and may be contributed to one or more future securitization transactions (if not already securitized) or may be otherwise transferred at any time, subject to compliance with the related intercreditor agreement. Servicing of each non-serviced whole loan will generally be directed by the holder of the related control note (or, if such control note is included in a securitization, the directing certificateholder thereunder (or other party designated thereunder to exercise the rights of such control note)), and such holder will have the right to replace the special servicer with respect to the related whole loan with or without cause. See the tables below entitled “Mortgage Loans with Pari Passu Companion Loans” and“Mortgage Loans with Subordinate Debt,” as well as “Description of the Mortgage Pool—The Whole Loans” in the Preliminary Prospectus, for additional information regarding each such whole loan. | |
| Directing Certificateholder/ Controlling Class: | The “Directing Certificateholder” with respect to each mortgage loan will be the Controlling Class Certificateholder (or its representative) selected by more than 50% (by certificate balance) of the Controlling Class Certificateholders;provided, that (1) absent that selection, (2) until a Directing Certificateholder is so selected or (3) upon receipt of a notice from a majority of the Controlling Class Certificateholders (by certificate balance) that a Directing Certificateholder is no longer designated, the Controlling Class Certificateholder that owns the largest aggregate certificate balance of the Controlling Class (or its representative) will be the Directing Certificateholder;provided, that (a) in the case of clause (3), if no one holder owns the largest aggregate certificate balance of the Controlling Class, then there will be no Directing Certificateholder until appointed in accordance with the terms of the pooling and servicing agreement, and (b) the certificate administrator and the other parties to the pooling and servicing agreement will be entitled to assume that the identity of the Directing Certificateholder has not changed until such parties receive written notice of a replacement of the Directing Certificateholder from a party holding the requisite interest in the Controlling Class (as confirmed by the certificate registrar), or the resignation of the then current Directing Certificateholder.
The “Controlling Class” will be, as of any time of determination, the most subordinate class of Control Eligible Certificates then outstanding that has an aggregate certificate balance (as notionally reduced by any Cumulative Appraisal Reduction Amounts (as defined below) allocable to such class) at least equal to 25% of the initial certificate balance of that class; provided, that if at any time the certificate balances of the certificates other than the Control Eligible Certificates and the RR Interest have been reduced to zero as a result of principal payments on the mortgage loans, then the Controlling Class will be the most subordinate class of Control Eligible Certificates that has a certificate balance greater than zero without regard to any Cumulative Appraisal Reduction Amounts. The Controlling Class as of the closing date will be the Class G certificates.
The “Control Eligible Certificates” will be either of the Class F or Class G certificates. | |
| Control Rights: | Prior to a Control Termination Event, the Directing Certificateholder will have certain consent and consultation rights under the pooling and servicing agreement with respect to certain major decisions and other matters. A “Control Termination Event” will occur when (i) the Class F certificates have a certificate balance (taking into |
This is not a research report and was not prepared by any Underwriter’s research departments. Please see additional important information and qualifications at the end of this Term Sheet. |
| T-8 |
| BANK 2017-BNK9 | Structural Overview |
account the application of the allocable portion of any Cumulative Appraisal Reduction Amounts to notionally reduce the certificate balance thereof) of less than 25% of the initial certificate balance of that class; or (ii) a holder of the Class F certificates is the majority controlling class certificateholder and has irrevocably waived its right, in writing, to exercise any of the rights of the controlling class certificateholder and such rights have not been reinstated to a successor controlling class certificateholder; provided, however, that a Control Termination Event will not be deemed continuing in the event that the certificate balances of the principal balance certificates other than the Control Eligible Certificates and the RR Interest have been reduced to zero as a result of principal payments on the mortgage loans.
After the occurrence of a Control Termination Event but prior to the occurrence of a Consultation Termination Event, the Directing Certificateholder will not have any consent rights, but the Directing Certificateholder will have certain non-binding consultation rights under the pooling and servicing agreement with respect to certain major decisions and other matters. A “Consultation Termination Event” will occur when (i) no class of Control Eligible Certificates has a certificate balance (without regard to the application of the allocable portion of any Cumulative Appraisal Reduction Amounts) at least equal to 25% of the initial certificate balance of that class; or (ii) a holder of a majority of the Class F certificates is the majority controlling class certificateholder and has irrevocably waived its right, in writing, to exercise any of the rights of the controlling class certificateholder and such rights have not been reinstated to a successor controlling class certificateholder (provided that no Consultation Termination Event resulting solely from the operation of clause (ii) will be deemed to have existed or be in continuance with respect to a successor holder of the Class F certificates that has not irrevocably waived its right to exercise any of the rights of the controlling class certificateholder); provided, however, that a “Consultation Termination Event” will not be deemed continuing in the event that the certificate balances of the principal balance certificates other than the Control Eligible Certificates and the RR Interest have been reduced to zero as a result of principal payments on the mortgage loans.
After the occurrence of a Consultation Termination Event, the Directing Certificateholder will not have any consent or consultation rights, except with respect to any rights expressly set forth in the pooling and servicing agreement, and the operating advisor will retain certain non-binding consultation rights under the pooling and servicing agreement with respect to certain major decisions and other matters.
Notwithstanding the proviso to the definitions of “Control Termination Event” and “Consultation Termination Event”, a Control Termination Event will be deemed to have occurred and be continuing and a Consultation Termination Event will be deemed to have occurred with respect to such Excluded Loan with respect to the Directing Certificateholder or the holder of the majority of the Controlling Class, and neither the Directing Certificateholder nor any Controlling Class Certificateholder will have any consent or consultation rights with respect to the servicing of such Excluded Loan.
An “Excluded Loan” means (a) with respect to the Directing Certificateholder or the holder of the majority of the Controlling Class, a mortgage loan or whole loan with respect to which, as of any date of determination, the Directing Certificateholder or the holder of the majority of the Controlling Class is a Borrower Party or (b) with respect to the Risk Retention Consultation Party or the holder of the majority of the RR Interest, a mortgage loan or whole loan with respect to which, as of any date of determination, the Risk Retention Consultation Party or the holder of the majority of the RR Interest is a Borrower Party. It is expected that there will be no Excluded Loans with respect to this securitization on the Closing Date.
“Borrower Party” means a borrower, a mortgagor, a manager of a mortgaged property, the holder of a mezzanine loan that has been accelerated or as to which foreclosure or enforcement proceedings have been commenced against the equity collateral pledged to secure the related mezzanine loan, or any Borrower Party Affiliate.
“Borrower Party Affiliate” means, with respect to a borrower, a mortgagor, a manager of a mortgaged property or the holder of a mezzanine loan that has been accelerated or as to which foreclosure or enforcement proceedings have been commenced against the equity collateral pledged to secure the related mezzanine loan, (a) any other person controlling or controlled by or under common control with such borrower, mortgagor, manager or mezzanine lender, as applicable, or (b) any other person owning, directly or indirectly, 25% or more of the beneficial interests in such borrower, mortgagor, manager or mezzanine lender, as applicable. For the purposes of this definition, “control” when used with respect to any specified person means the power to direct the management and policies of such person, directly or indirectly, whether through the ownership of voting securities, by contract or otherwise and the terms “controlling” and “controlled” have meanings correlative to the foregoing.
Notwithstanding any of the foregoing to the contrary, if any mortgage loan is part of a whole loan, the Directing Certificateholder’s consent and/or consultation rights with respect thereto may be limited as described in the Preliminary Prospectus. In particular, with respect to each non-serviced whole loan, the Directing Certificateholder will only have certain consultation rights with respect to certain major decisions and other matters related to such whole loan, in each case only prior to a Control Termination Event or Consultation Termination Event, as applicable. In addition, with respect to any serviced A/B whole loan, for so long as the holder of the related subordinate companion loan is the controlling note holder, the holder of such subordinate companion loan (rather than the Directing Certificateholder) will be entitled to exercise such consent and consultation rights with respect to such whole loan. |
This is not a research report and was not prepared by any Underwriter’s research departments. Please see additional important information and qualifications at the end of this Term Sheet. |
| T-9 |
| BANK 2017-BNK9 | Structural Overview |
| Appraisal Reduction Amounts and Collateral Deficiency Amounts: | An “Appraisal Reduction Amount” generally will be created in the amount, if any, by which the principal balance of a required appraisal loan (which is a mortgage loan with respect to which certain defaults, modifications or insolvency events have occurred as further described in the Preliminary Prospectus) plus other amounts overdue or advanced in connection with such mortgage loan exceeds 90% of the appraised value of the related mortgaged property plus certain escrows and reserves (including letters of credit) held with respect to the mortgage loan.
A mortgage loan will cease to be subject to an Appraisal Reduction Amount when it has been brought current for at least three consecutive months, no additional event of default is foreseeable in the reasonable judgment of the applicable special servicer and no other circumstances exist that would cause such mortgage loan or any related companion loan to be a specially serviced mortgage loan; however, a “Collateral Deficiency Amount” may exist with respect to any mortgage loan that is modified into an AB loan structure (an “AB Modified Loan”) and remains a corrected mortgage loan and, if so, will generally equal the excess of (i) the stated principal balance of such AB Modified Loan (taking into account the related junior note(s) and anypari passu notes included therein), over (ii) the sum of (in the case of a whole loan, solely to the extent allocable to the subject mortgage loan) (x) the most recent appraised value for the related mortgaged property or mortgaged properties, plus (y) solely to the extent not reflected or taken into account in such appraised value (or in the calculation of any related Appraisal Reduction Amount) and to the extent on deposit with, or otherwise under the control of, the lender as of the date of such determination, any capital or additional collateral contributed by the related borrower at the time the mortgage loan became (and as part of the modification related thereto) such AB Modified Loan for the benefit of the related mortgaged property or mortgaged properties (provided that in the case of an non-serviced mortgage loan, the amounts set forth in this clause (y) will be taken into account solely to the extent relevant information is received by the applicable special servicer), plus (z) any other escrows or reserves (in addition to any amounts set forth in the immediately preceding clause (y) and solely to the extent not reflected or taken into account in the calculation of any related Appraisal Reduction Amount) held by the lender in respect of such AB Modified Loan as of the date of such determination, which such excess, for the avoidance of doubt, will be determined separately from and exclude any related Appraisal Reduction Amounts.
As used herein, a “Cumulative Appraisal Reduction Amount” will be the sum of any Appraisal Reduction Amounts and any Collateral Deficiency Amounts.
Any Appraisal Reduction Amount in respect of any non-serviced mortgage loan generally will be calculated in accordance with the other servicing agreement pursuant to which such mortgage loan is being serviced, which calculations are expected to be generally similar to those provided for in the pooling and servicing agreement for this transaction.
If any mortgage loan is part of a whole loan, any Appraisal Reduction Amount or Collateral Deficiency Amount will (or effectively will) be calculated in respect of such whole loan taken as a whole and allocated, to the extent provided in the related intercreditor agreement and the related pooling and servicing agreement,first, to any related subordinate companion loan, andsecond, to the related mortgage loan and anypari passu companion loan on apro rata basis by unpaid principal balance.
Appraisal Reduction Amounts will proportionately reduce the interest portion of debt service advances required to be made in respect of the related mortgage loan. Appraisal Reduction Amounts and Collateral Deficiency Amounts (in each case, to the extent of the Non-Retained Certificates’ Percentage Allocation Entitlement thereof) will be taken into account in determining the identity of the controlling class entitled to appoint the Directing Certificateholder, the existence of a Control Termination Event and the allocation and/or exercise of voting rights for certain purposes (see“—Directing Certificateholder/Controlling Class” above). | |
| Appraised-Out Class: | An “Appraised-Out Class” is any class of Control Eligible Certificates, the certificate balance of which (taking into account the application of the Non-Retained Certificates’ Percentage Allocation Entitlement of any Appraisal Reduction Amounts or Collateral Deficiency Amounts to notionally reduce the certificate balance of such class) has been reduced to less than 25% of its initial certificate balance. Any Appraised-Out Class for which the Requesting Holders (as defined below) are challenging the special servicer’s Appraisal Reduction Amount or Collateral Deficiency Amount determination may not exercise any direction, control, consent and/or similar rights of the Controlling Class until such time, if any, as such class is reinstated as the Controlling Class, and the rights of the Controlling Class will be exercised by the next most senior class of Control Eligible Certificates, if any, during such period. | |
| Appraisal Remedy: | The holders of the majority (by certificate balance) of an Appraised-Out Class (such holders, the “Requesting Holders”) will have the right, at their sole expense, to require the special servicer to order a second appraisal of any mortgage loan (or serviced whole loan) for which an appraisal reduction event has occurred or as to which there exists a Collateral Deficiency Amount. With respect to any serviced mortgage loan, the special servicer will use its reasonable best efforts to ensure that such appraisal is delivered within 30 days from receipt of the Requesting Holders’ written request and will be required to ensure that such appraisal is prepared on an “as-is” basis by an MAI appraiser. Upon receipt of such supplemental appraisal, the special servicer will be required to determine, in accordance with the Servicing Standard, whether, based on its assessment of such supplemental appraisal, any recalculation of the applicable Appraisal Reduction Amount or Collateral Deficiency Amount is warranted and, if so warranted, will recalculate such Appraisal Reduction Amount or Collateral Deficiency Amount, as applicable, based upon such supplemental appraisal and receipt of information that is in the possession of the master servicer requested by the special servicer from the master servicer. If required by any such recalculation, the applicable Appraised-Out Class will be reinstated as the Controlling Class and each Appraised-Out Class will, if applicable, have its related certificate balance notionally restored to the extent required by such recalculation of the Appraisal Reduction Amount or Collateral Deficiency Amount, if applicable. |
This is not a research report and was not prepared by any Underwriter’s research departments. Please see additional important information and qualifications at the end of this Term Sheet. |
| T-10 |
| BANK 2017-BNK9 | Structural Overview |
| Sale of Defaulted Loans: | Under certain circumstances the special servicer may be required to use reasonable efforts to solicit offers for a defaulted serviced mortgage loan (and any related companion loan (to the extent provided under the related intercreditor agreement) and/or related REO properties).
The Directing Certificateholder will not have a right of first refusal to purchase a defaulted loan.
If the special servicer does not receive an offer at least equal to the outstanding principal balance plus all accrued and unpaid interest and outstanding costs and expenses and certain other amounts specified in the pooling and servicing agreement (the “Par Purchase Price”), the special servicer may purchase the defaulted loan or REO property at the Par Purchase Price or may accept the first cash offer received from any person that is determined to be a fair price for such defaulted loan or REO property. If multiple offers are received during the period designated by the special servicer for receipt of offers, the special servicer is generally required to select the highest offer. The special servicer will be required to determine whether any cash offer constitutes a fair price for any defaulted loan or REO property if the highest offeror is a person other than a party to the pooling and servicing agreement for this transaction (the “PSA”), the Directing Certificateholder, the Risk Retention Consultation Party, any sponsor, any Borrower Party, any independent contractor engaged by the special servicer or any known affiliate of any of the preceding entities. With respect to a whole loan if it is a defaulted loan, the depositor, the master servicer, the special servicer (or any independent contractor engaged by the special servicer), or the trustee for the securitization of a Companion Loan, and each related companion loan holder or its representative, any holder of a related mezzanine loan, or any known affiliate of any of the preceding entities (each, an “Interested Person”). If an offer is made by an Interested Person, the trustee will be required to determine (based upon the most recent appraisal conducted in accordance with the terms of the PSA) whether the offer constitutes a fair price for the defaulted loan or REO property unless (i) the offer is equal to or greater than the applicable Par Purchase Price and (ii) the offer is the highest offer received. Absent an offer at least equal to the Par Purchase Price, no offer from an Interested Person will constitute a fair price unless (x) it is the highest offer received and (y) at least two other offers are received from independent third parties. Neither the trustee nor any of its affiliates may make an offer for or purchase any specially serviced loan or REO property.
Notwithstanding any of the foregoing to the contrary, the special servicer is not required to accept the highest offer and may accept a lower offer for a defaulted loan or REO property if the special servicer determines, in accordance with the Servicing Standard (and subject to the requirements of any related intercreditor agreement), that a rejection of such offer would be in the best interests of the certificateholders and any related companion loan holders as a collective whole as if they constituted a single lender, so long as such lower offer was not made by the special servicer or any of its affiliates.
If title to any mortgaged property is acquired by the trust fund, the special servicer will generally be required to sell such mortgaged property prior to the close of the third calendar year beginning after the year of acquisition.
The foregoing applies to mortgage loans serviced under the PSA. With respect to any non-serviced whole loan, if the special servicer under the applicable pooling and servicing agreement determines to sell the related controlling companion loan if it becomes a defaulted loan, then the applicable special servicer will be required to sell the related whole loan, including the related mortgage loan included in the BANK 2017-BNK9 securitization trust and the relatedpari passucompanion loan(s) and, under certain circumstances, any subordinate companion loan(s), as a single loan. In connection with any such sale, the special servicer under the applicable pooling and servicing agreement will be required to follow procedures substantially similar to those set forth above. | |
| Risk Retention Consultation Party: | A risk retention consultation party may be appointed by the holder or holders of more than 50% of the RR Interest, by certificate balance. The majority RR Interest holder will have a continuing right to appoint, remove or replace the risk retention consultation party in its sole discretion. This right may be exercised at any time and from time to time. Except with respect to an Excluded Loan as to such party, the risk retention consultation party will be entitled to consult with the special servicer, upon request of the risk retention consultation party, with respect to certain material servicing actions proposed by the special servicer; provided, that prior to the occurrence and continuance of a Consultation Termination Event, such mortgage loan must also be a specially serviced mortgage loan. | |
| Appointment and Replacement of Special Servicer: | The Directing Certificateholder will appoint the initial special servicer as of the closing date. Prior to the occurrence and continuance of a Control Termination Event, the special servicer may generally be replaced by the Directing Certificateholder with or without cause at any time.
After the occurrence and during the continuance of a Control Termination Event and upon (a) the written direction of holders of principal balance certificates evidencing not less than 25% of the voting rights of all classes of certificates (other than the RR Interest) entitled to principal (taking into account the application of Appraisal Reduction Amounts to notionally reduce the certificate balances of classes to which such Appraisal Reduction Amounts are allocable) requesting a vote to replace the special servicer with a replacement special servicer, (b) payment by such requesting holders to the certificate administrator of all reasonable fees and expenses to be incurred by the certificate administrator in connection with administering such vote and (c) delivery by such holders of a rating agency confirmation from each applicable rating agency, the certificate administrator will be required to promptly post such notice on its internet website and by mail and conduct the solicitation of votes of all certificates in such regard, which requisite affirmative votes must be received within 180 days of the posting of such notice. Upon the written direction of holders of at least 66 2/3% of a Certificateholder Quorum, the trustee will be required to immediately replace the special servicer with a qualified replacement special servicer designated by such holders of certificates. |
This is not a research report and was not prepared by any Underwriter’s research departments. Please see additional important information and qualifications at the end of this Term Sheet. |
| T-11 |
| BANK 2017-BNK9 | Structural Overview |
After the occurrence and during the continuance of a Consultation Termination Event, if the operating advisor determines that the special servicer is not performing its duties as required under the pooling and servicing agreement or is otherwise not acting in accordance with the Servicing Standard, the operating advisor may also recommend the replacement of the special servicer. The operating advisor’s recommendation to replace the special servicer must be confirmed by an affirmative vote of holders of principal balance certificates evidencing at least a majority of the aggregate voting rights (taking into account the application of any Appraisal Reduction Amounts to notionally reduce the respective certificate balances) of all principal balance certificates on an aggregate basis.
A “Certificateholder Quorum” means, in connection with any solicitation of votes in connection with the replacement of the special servicer or the asset representations reviewer, the holders of certificates evidencing at least 50% of the aggregate voting rights (taking into account the application of realized losses and, other than with respect to the termination of the asset representations reviewer, any Appraisal Reduction Amounts to notionally reduce the certificate balance of the certificates) of all classes of certificates entitled to principal (other than the RR Interest) on an aggregate basis.
With respect to each serviced whole loan, any holder of a relatedpari passu companion loan, following a servicer termination event with respect to the special servicer that affects such holder, will be entitled to direct the trustee (and the trustee will be required) to terminate the special servicer solely with respect to such serviced whole loan. A replacement special servicer will be selected by the trustee or, prior to a Control Termination Event, by the Directing Certificateholder;provided, that any successor special servicer appointed to replace the special servicer with respect to such whole loan generally cannot be the entity (or its affiliate) that was terminated at the direction of the holder of the relatedpari passucompanion loan.
With respect to any non-serviced whole loan, the BANK 2017-BNK9 trust, as holder of the related mortgage loan, has the right to terminate the special servicer under the related pooling and servicing agreement if a servicer termination event occurs with respect to such special servicer that affects the trust in its capacity as such holder. Such rights may be exercised by the Directing Certificateholder. The successor special servicer will be selected pursuant to the applicable pooling and servicing agreement by the related directing holder prior to a control termination event under such pooling and servicing agreement. | ||
| Servicing Standard: | The master servicer and the special servicer are obligated to service and administer the mortgage loans (and, if applicable, the serviced companion loans) in accordance with the definition of the “Servicing Standard” described in the Preliminary Prospectus and the terms of the pooling and servicing agreement, provided that each non-serviced mortgage loan, if any, will be serviced by another master servicer or special servicer under the pooling and servicing agreement with respect to the securitization of a related companion loan, which entities will be obligated to service and administer such non-serviced mortgage loan pursuant to a similar standard set forth in the related pooling and servicing agreement. | |
| Excluded Special Servicer: | If the special servicer is a Borrower Party with respect to any mortgage loan (an “Excluded Special Servicer Loan”), the special servicer will be required to resign as special servicer of that Excluded Special Servicer Loan. Prior to the occurrence of a Control Termination Event, the Directing Certificateholder will be required to appoint (and may remove and replace with or without cause) a separate special servicer that is not a Borrower Party (an “Excluded Special Servicer”) with respect to any Excluded Special Servicer Loan, unless such Excluded Special Servicer Loan is also an Excluded Loan with respect to the Directing Certificateholder or the holder of the majority of the Controlling Class. After the occurrence and during the continuance of a Control Termination Event or if at any time the applicable Excluded Special Servicer Loan is also an Excluded Loan with respect to the Directing Certificateholder or the holder of the majority of the Controlling Class, the resigning special servicer will be required to select the related Excluded Special Servicer. Any Excluded Special Servicer will be required to perform all of the obligations of the special servicer and will be entitled to all special servicing compensation with respect to such Excluded Special Servicer Loan earned while the related mortgage loan is an Excluded Special Servicer Loan. | |
| Liquidated Loan Waterfall: | On liquidation of any mortgage loan, all net liquidation proceeds related to the mortgage loan (but not any related companion loan) will be applied so that amounts allocated as a recovery of accrued and unpaid interest will not, in the first instance, include any delinquent interest that was not advanced as a result of Appraisal Reduction Amounts or accrued on the portion of the stated principal balance thereof equal to any related Collateral Deficiency Amount in effect from time to time and as to which no advance was made. After the adjusted interest amount is so allocated, any remaining liquidation proceeds will be allocated to pay principal on the mortgage loan until the unpaid principal amount of the mortgage loan has been reduced to zero. Any remaining liquidation proceeds will then be allocated to pay delinquent interest that was not advanced as a result of Appraisal Reduction Amounts or that accrued on the portion of the stated principal balance thereof equal to any related Collateral Deficiency Amount in effect from time to time and as to which no advance was made. | |
| Operating Advisor: | The operating advisor will be required to perform certain review duties if a Control Termination Event has occurred and is continuing, which will generally include a limited annual review of, and the preparation of a report regarding, certain actions of the special servicer with respect to the resolution and/or liquidation of specially serviced loans. The review and report generally will be based on any asset status reports and additional information delivered to the operating advisor by the special servicer. In addition, if a Control Termination Event has occurred and is continuing, the special servicer must consult with the operating advisor (in addition to the Directing Certificateholder if no Consultation Termination Event has occurred and is continuing) in connection with major decisions with respect to mortgage loans. Furthermore, under certain circumstances, but only if a Consultation Termination Event has occurred and is continuing, the operating advisor may recommend the replacement of the special servicer as described above under “—Appointment and |
This is not a research report and was not prepared by any Underwriter’s research departments. Please see additional important information and qualifications at the end of this Term Sheet. |
| T-12 |
| BANK 2017-BNK9 | Structural Overview |
Replacement of Special Servicer”; however, the operating advisor will not have any rights or obligations with respect to a non-serviced whole loan.
If a Consultation Termination Event has occurred and is continuing, the operating advisor may be removed and replaced without cause upon the affirmative direction of certificates owners holding not less than 75% of the voting rights of all certificates (taking into account the application of Appraisal Reduction Amounts), following a proposal from certificate owners holding not less than 25% of the voting rights of all certificates (taking into account the application of Appraisal Reduction Amounts). The certificateholders who initiate a vote on a termination and replacement of the operating advisor without cause must cause the payment of the fees and expenses incurred in the replacement. In addition, in the event there are no classes of certificates outstanding other than the Control Eligible Certificates, the RR Interest and the Class R certificates, then all of the rights and obligations of the operating advisor under the PSA will terminate without payment of any penalty or termination fee (other than any rights or obligations that accrued prior to the date of such termination (including accrued and unpaid compensation) and other than indemnification rights arising out of events occurring prior to such termination). See “Pooling and Servicing Agreement—The Operating Advisor—Termination of the Operating Advisor Without Cause” in the Preliminary Prospectus. | ||
| Asset Representations Reviewer: | The asset representations reviewer will be required to review certain delinquent mortgage loans after a specified delinquency threshold has been met and the required percentage of certificateholders vote to direct a review as described below. The asset representations reviewer will be entitled to the Asset Representations Reviewer Fee with respect to such review. See “Pooling and Servicing Agreement—The Asset Representations Reviewer” in the Preliminary Prospectus.
The certificate administrator will be required to notify certificateholders if the specified delinquency threshold has been met as described in the Preliminary Prospectus under “—The Asset Representations Reviewer”.
If certificateholders evidencing not less than 5.0% of the voting rights request a vote to commence an asset review, and if subsequently (i) a majority of those certificateholders who cast votes and (ii) a majority of an Asset Review Quorum authorizes an asset review within 150 days of the request for a vote, the asset representations reviewer will be required to conduct an asset review of delinquent loans.
The asset representations reviewer may be terminated and replaced without cause. Upon (i) the written direction of certificateholders evidencing not less than 25% of the voting rights (without regard to the application of any Appraisal Reduction Amounts) requesting a vote to terminate and replace the asset representations reviewer with a proposed successor asset representations reviewer that is an eligible asset representations reviewer, and (ii) payment by such holders to the certificate administrator of the reasonable fees and expenses to be incurred by the certificate administrator in connection with administering such vote, the certificate administrator will be required to promptly provide notice to all certificateholders and the asset representations reviewer of such request by posting such notice on its internet website, and by mailing such notice to all certificateholders and the asset representations reviewer. Upon the written direction of certificateholders evidencing at least 75% of a Certificateholder Quorum (without regard to the application of any Appraisal Reduction Amounts), the trustee will be required to terminate all of the rights and obligations of the asset representations reviewer under the pooling and servicing agreement (other than any rights or obligations that accrued prior to the date of such termination and other than indemnification rights arising out of events occurring prior to such termination) by written notice to the asset representations reviewer, and the proposed successor asset representations reviewer will be appointed. See “Pooling and Servicing Agreement—The Asset Representations Reviewer” in the Preliminary Prospectus.
An “Asset Review Quorum” means, in connection with any solicitation of votes to authorize an Asset Review as described above, the holders of certificates evidencing at least 5.0% of the aggregate voting rights represented by all certificates that have voting rights. | |
| Dispute Resolution Provisions: | The mortgage loan sellers will be subject to the dispute resolution provisions set forth in the PSA to the extent those provisions are triggered with respect to any mortgage loan sold to the depositor by a mortgage loan seller, and such mortgage loan seller will be obligated under the related mortgage loan purchase agreement to comply with all applicable provisions and to take part in any mediation or arbitration proceedings that may result. Generally, in the event that a Repurchase Request is not “Resolved” within 180 days after the related mortgage loan seller receives such Repurchase Request, then the enforcing servicer will be required to send a notice to the first certificateholder (or beneficial owner) to deliver a certificateholder repurchase request with respect to the mortgage loan (the “Initial Requesting Certificateholder”) (if any) and to the certificate administrator (which will be required to make such notice available to certificateholders via the certificate administrator’s website) indicating the enforcing servicer’s intended course of action with respect to the Repurchase Request. If (a) the enforcing servicer’s intended course of action with respect to the Repurchase Request does not involve pursuing further action to exercise rights against the related mortgage loan seller with respect to the Repurchase Request and the Initial Requesting Certificateholder, if any, or any other certificateholder or certificate owner wishes to exercise its right to refer the matter to mediation (including nonbinding arbitration) or arbitration, or (b) the enforcing servicer’s intended course of action is to pursue further action to exercise rights against the related mortgage loan seller with respect to the Repurchase Request but the Initial Requesting Certificateholder, if any, or any other certificateholder or certificate owner does not agree with the dispute resolution method selected by the enforcing servicer, then the Initial Requesting Certificateholder, if any, or such other certificateholder or certificate owner may deliver a written notice to the enforcing servicer indicating its intent to exercise its right to refer the matter to either mediation or arbitration.
“Resolved” means, with respect to a Repurchase Request, (i) that the related material defect or breach has been cured, (ii) the related mortgage loan has been repurchased in accordance with the related mortgage loan |
This is not a research report and was not prepared by any Underwriter’s research departments. Please see additional important information and qualifications at the end of this Term Sheet. |
| T-13 |
| BANK 2017-BNK9 | Structural Overview |
| purchase agreement, (iii) a mortgage loan has been substituted for the related mortgage loan in accordance with the related mortgage loan purchase agreement, (iv) the applicable mortgage loan seller has made a loss of value payment, (v) a contractually binding agreement has been entered into between the enforcing servicer, on behalf of the issuing entity, and the related mortgage loan seller that settles the related mortgage loan seller’s obligations under the related mortgage loan purchase agreement, or (vi) the related mortgage loan is no longer property of the issuing entity as a result of a sale or other disposition in accordance with the pooling and servicing agreement. See “Pooling and Servicing Agreement—Dispute Resolution Provisions” in the Preliminary Prospectus. | ||
| Investor Communications: | The certificate administrator is required to include on any Form 10-D any request received from a certificateholder to communicate with other certificateholders related to certificateholders exercising their rights under the terms of the PSA. Any certificateholder wishing to communicate with other certificateholders regarding the exercise of its rights under the terms of the PSA will be able to deliver a written request signed by an authorized representative of the requesting investor to the certificate administrator. | |
| Deal Website: | The certificate administrator will be required to maintain a deal website which will include, among other items: (a) summaries of asset status reports prepared by a special servicer, (b) inspection reports, (c) appraisals, (d) various “special notices” described in the Preliminary Prospectus, (e) the “Investor Q&A Forum” and (f) a voluntary “Investor Registry”. Investors may access the deal website following execution of a certification and confidentiality agreement. |
This is not a research report and was not prepared by any Underwriter’s research departments. Please see additional important information and qualifications at the end of this Term Sheet. |
| T-14 |
| BANK 2017-BNK9 | Collateral Statistics |
| Mortgage Loan Sellers | No. of Mortgage Loans | No. of Mortgaged Properties | Aggregate Cut-off Date Balance | % of Pool(1) |
| Bank of America, National Association | 17 | 26 | $383,543,420 | 36.4% |
| Morgan Stanley Mortgage Capital Holdings LLC | 18 | 38 | $332,567,983 | 31.6% |
| Wells Fargo Bank, National Association | 9 | 24 | $277,614,415 | 26.3% |
| Morgan Stanley Mortgage Capital Holdings LLC / Wells Fargo Bank, National Association | 1 | 1 | $60,000,000 | 5.7% |
| Total: | 45 | 89 | $1,053,725,818 | 100.0% |
Pool Statistics(1)
| Aggregate Cut-off Date Balance: | $1,053,725,818 |
| Number of Mortgage Loans: | 45 |
| Average Cut-off Date Balance per Mortgage Loan: | $23,416,129 |
| Number of Mortgaged Properties: | 89 |
| Average Cut-off Date Balance per Mortgaged Property: | $11,839,616 |
| Weighted Average Mortgage Rate: | 4.2396% |
| % of Pool Secured by 5 Largest Mortgage Loans: | 41.1% |
| % of Pool Secured by 10 Largest Mortgage Loans: | 63.6% |
| Weighted Average Original Term to Maturity (months): | 119 |
| Weighted Average Remaining Term to Maturity (months): | 118 |
| Weighted Average Seasoning (months): | 1 |
| % of Pool Secured by Single Tenant Mortgaged Properties: | 17.8% |
| % of Pool Secured by Refinance Loans: | 49.5% |
| % of Pool Secured by Acquisition Loans: | 33.5% |
| % of Pool Secured by Recapitalization Loans: | 16.9% |
Additional Debt
| % of Pool withPari Passu Mortgage Debt: | 37.5% |
| % of Pool with Subordinate Mortgage Debt: | 5.7% |
Credit Statistics(2)
| Weighted Average UW NOI DSCR: | 2.38x |
| Weighted Average UW NOI Debt Yield: | 11.5% |
| Weighted Average UW NCF DSCR: | 2.18x |
| Weighted Average UW NCF Debt Yield: | 10.5% |
| Weighted Average Cut-off Date LTV Ratio(3): | 59.6% |
| Weighted Average Maturity Date LTV Ratio(3): | 55.2% |
Footnotes are set forth on the following page.
This is not a research report and was not prepared by any Underwriter’s research departments. Please see additional important information and qualifications at the end of this Term Sheet. |
| T-15 |
| BANK 2017-BNK9 | Collateral Statistics |
Amortization
| Weighted Average Original Amortization Term (months): | 350 |
| Weighted Average Remaining Amortization Term (months): | 350 |
| % of Pool Interest Only through Maturity: | 57.2% |
| % of Pool Interest Only followed by Amortizing Balloon: | 22.8% |
| % of Pool Amortizing Balloon: | 20.0% |
| Lockboxes | |
| % of Pool with Hard Lockboxes: | 55.0% |
| % of Pool with Springing Lockboxes: | 27.5% |
| % of Pool with Soft Lockboxes: | 16.1% |
| % of Pool with no Lockboxes: | 1.4% |
| Reserves | |
| % of Pool Requiring Tax Reserves: | 47.5% |
| % of Pool Requiring Insurance Reserves: | 14.0% |
| % of Pool Requiring Replacement Reserves: | 65.2% |
| % of Pool Requiring TI/LC Reserves(4): | 60.4% |
| Call Protection | |
| % of Pool with lockout period, followed by defeasance until open period: | 58.3% |
| % of Pool with lockout period, followed by the greater of a prepayment premium and yield maintenance until open period: | 28.9% |
| % of Pool with lockout period, followed by defeasance or the greater of a prepayment premium and yield maintenance until open period: | 10.6% |
| % of Pool with lockout period, followed by the greater of a prepayment premium and yield maintenance, followed by defeasance or the greater of a prepayment premium and yield maintenance until open period: | 2.2% |
| (1) | Unless otherwise indicated, all references to “% of Pool” in this Term Sheet reflect a percentage of the aggregate principal balance of the mortgage pool as of the Cut-off Date, after application of all payments of principal due during or prior to December 2017. |
| (2) | With respect to any mortgage loan that is part of a whole loan, unless otherwise indicated, all LTV, DSCR and Debt Yield calculations in this Term Sheet include any relatedpari passu companion loans and exclude any subordinate companion loans, as applicable. Additionally, LTV, DSCR and Debt Yield figures in this Term Sheet are calculated for mortgage loans without regard to any additional indebtedness that may be incurred at a future date. |
| (3) | The LTV ratios set forth in this Term Sheet are generally based on the “as-is” values of the related mortgaged properties; provided that the “as-is” value for a portfolio of mortgaged properties may include a premium relating to the valuation of the mortgaged properties as a whole rather than as the sum of individually valued mortgaged properties; provided, further, that such LTV ratios may be based on “as-stabilized”, “as complete” or other contingent values in certain cases in which reserves have been established at origination for the applicable condition or circumstance that is expected to result in stabilization. See the definition of “Appraised Value” under“Description of the Mortgage Pool—Certain Calculations and Definitions”in the Preliminary Prospectus. |
| (4) | Excludes hospitality, multifamily, manufactured housing, other (leased fee) and self storage properties. |
This is not a research report and was not prepared by any Underwriter’s research departments. Please see additional important information and qualifications at the end of this Term Sheet. |
| T-16 |
| BANK 2017-BNK9 | Characteristics of the Mortgage Loans |
| Top 10 Mortgage Loans or Groups of Cross-Collateralized Mortgage Loans(1) | |||||||||||||
| Loan No. | Mortgage Loan Seller | Property Name | City | State | Property Type | Cut-off Date Balance | % of Pool | SF/Units/Rooms | Cut-off Date Balance per SF/Unit/ Room | UW NCF DSCR | UW NOI Debt Yield | Cut-off Date LTV | Maturity Date LTV |
| 1 | WFB | Duane Morris Plaza | Philadelphia | PA | Office | $105,300,000 | 9.99% | 617,476 | $170.53 | 2.40x | 10.1% | 68.4% | 68.4% |
| 2 | BANA | Griffin Portfolio | Various | Various | Various | $96,250,000 | 9.1% | 3,708,698 | $101.11 | 2.49x | 10.2% | 61.5% | 61.5% |
| 3 | WFB | Laguna Cliffs Marriott | Dana Point | CA | Hospitality | $85,000,000 | 8.1% | 378 | $291,005.29 | 2.31x | 12.3% | 49.1% | 49.1% |
| 4 | MSMCH | Marriott at Legacy Town Center | Plano | TX | Hospitality | $79,800,000 | 7.6% | 404 | $197,524.75 | 2.13x | 14.5% | 65.0% | 55.2% |
| 5 | MSMCH | Hackensack Commons | Hackensack | NJ | Retail | $66,400,000 | 6.3% | 274,643 | $241.77 | 1.82x | 8.6% | 64.6% | 64.6% |
| 6 | MSMCH/WFB | Colorado Center | Santa Monica | CA | Office | $60,000,000 | 5.7% | 1,176,161 | $253.37 | 4.83x | 18.6% | 24.6% | 24.6% |
| 7 | BANA | Park Square | Boston | MA | Office | $60,000,000 | 5.7% | 503,312 | $317.89 | 1.89x | 8.3% | 56.9% | 56.9% |
| 8 | BANA | BWI Airport Marriott | Linthicum Heights | MD | Hospitality | $47,700,000 | 4.5% | 315 | $151,428.57 | 1.61x | 12.2% | 69.9% | 57.3% |
| 9 | MSMCH | U.S. Industrial Portfolio III | Various | Various | Various | $40,000,000 | 3.8% | 2,886,593 | $41.76 | 1.48x | 9.4% | 72.5% | 66.1% |
| 10 | BANA | Spectrum Town Center | Gilbert | AZ | Retail | $30,000,000 | 2.8% | 170,388 | $176.07 | 1.46x | 9.4% | 62.9% | 57.5% |
| Total/Wtd. Avg. | $670,450,000 | 63.6% | 2.33x | 11.4% | 59.3% | 56.7% | |||||||
| (1) | With respect to any mortgage loan that is part of a whole loan, unless otherwise indicated, all LTV, DSCR, Debt Yield and Balance per SF/Unit/Room calculations in this Term Sheet include any relatedpari passu companion loans and exclude any subordinate companion loans, as applicable. Additionally, LTV, DSCR, Debt Yield and Balance per SF/Unit/Room figures in this Term Sheet are calculated for mortgage loans without regard to any additional indebtedness that may be incurred at a future date. With respect to any leased fee loans, the SF/Units/Rooms and Balance per SF/Unit/Room figures in this Term Sheet are based on the size of the non-collateral improvements. |
This is not a research report and was not prepared by any Underwriter’s research departments. Please see additional important information and qualifications at the end of this Term Sheet. |
| T-17 |
| BANK 2017-BNK9 | Characteristics of the Mortgage Loans |
| Mortgage Loans with Pari Passu Companion Loans | ||||||||||||
| Loan No. | Mortgage Seller | Property Name | Mortgage Loan Cut-off Date Balance | Aggregate Pari Passu Companion Loan Cut-off Date Balance | Combined Cut-off Date Balance | Lead Servicing Agreement | Master Servicer | Special Servicer | Control Rights | Combined UW NCF DSCR(1) | Combined UW NOI Debt Yield(1) | Combined Cut-off Date LTV(1) |
| 2 | BANA | Griffin Portfolio | $96,250,000 | $278,750,000 | $375,000,000 | BANK 2017-BNK8 | Wells Fargo | Midland | BANK 2017-BNK8 | 2.49x | 10.2% | 61.5% |
| 3 | WFB | Laguna Cliffs Marriott | $85,000,000 | $25,000,000 | $110,000,000 | BANK 2017-BNK9 | Wells Fargo | Rialto | BANK 2017-BNK9 | 2.31x | 12.3% | 49.1% |
| 6 | MSMCH/WFB | Colorado Center | $60,000,000 | $238,000,000 | $298,000,000 | BXP TRUST 2017-CC | Wells Fargo | Aegon | BXP TRUST 2017-CC | 4.83x | 18.6% | 24.6% |
| 7 | BANA | Park Square | $60,000,000 | $100,000,000 | $160,000,000 | BANK 2017-BNK8 | Wells Fargo | Midland | BANK 2017-BNK8 | 1.89x | 8.3% | 56.9% |
| 9 | MSMCH | U.S. Industrial Portfolio III | $40,000,000 | $80,537,149 | $120,537,149 | BANK 2017-BNK8 | Wells Fargo | Midland | BANK 2017-BNK8 | 1.48x | 9.4% | 72.5% |
| 11 | BANA | Warwick Mall | $30,000,000 | $45,000,000 | $75,000,000 | BANK 2017-BNK9 | Wells Fargo | Rialto | BANK 2017-BNK9 | 2.01x | 13.3% | 47.5% |
| 13 | WFB | Bass Pro & Cabela’s Portfolio | $23,500,000 | $171,400,000 | $194,900,000 | GSMS 2017-GS8 | Wells Fargo | Midland | GSMS 2017-GS8 | 2.72x | 12.8% | 50.4% |
| (1) | DSCR, Debt Yield and LTV calculations include any relatedpari passu companion loans and exclude any subordinate companion loans, as applicable. |
This is not a research report and was not prepared by any Underwriter’s research departments. Please see additional important information and qualifications at the end of this Term Sheet. |
| T-18 |
| BANK 2017-BNK9 | Characteristics of the Mortgage Loans |
| Mortgage Loans with Subordinate Debt | |||||||||||
| Loan No. | Mortgage Loan Seller | Property Name | Mortgage Loan Cut-off Date Balance | Cut-off Date Balance per SF | Subordinate Debt Cut-off Date Balance | UW NCF DSCR | UW NOI Debt Yield | Cut-off Date LTV | Total Debt UW NCF DSCR(1) | Total Debt UW NOI Debt Yield(1) | Total Debt Cut-off Date LTV(1) |
| 6 | MSMCH/WFB | Colorado Center | $60,000,000 | $253.37 | $252,000,000 | 4.83x | 18.6% | 24.6% | 2.62x | 10.1% | 45.4% |
| (1) | Total Debt UW NCF DSCR, Total Debt UW NOI Debt Yield and Total Debt Cut-off Date LTV figures shown above are calculated based on any relatedpari passu notes and any related subordinate note(s). |
This is not a research report and was not prepared by any Underwriter’s research departments. Please see additional important information and qualifications at the end of this Term Sheet. |
| T-19 |
| BANK 2017-BNK9 | Characteristics of the Mortgage Loans |
| Prior Securitization History(1) | ||||||||||||||
| Loan No. | Mortgage Loan Seller | Property Name | City | State | Property Type | Cut-off Date Balance | % of Pool | SF/Units/ Rooms | Cut-off Date Balance per SF/Unit/ Room(2) | UW NCF DSCR(2) | UW NOI Debt Yield(2) | Cut-off Date LTV(2) | Maturity Date LTV(2) | Prior Securitization |
| 2.08 | BANA | Ace Hardware HQ(2) | Oak Brook | IL | Office | $5,839,167 | 0.6% | 206,030 | $101.11 | 2.49x | 10.2% | 61.5% | 61.5% | JPMCC 2012-C6 |
| 4 | MSMCH | Marriott at Legacy Town Center | Plano | TX | Hospitality | $79,800,000 | 7.6% | 404 | $197,524.75 | 2.13x | 14.5% | 65.0% | 55.2% | MSC 2017-PRME |
| 5 | MSMCH | Hackensack Commons | Hackensack | NJ | Retail | $66,400,000 | 6.3% | 274,643 | $241.77 | 1.82x | 8.6% | 64.6% | 64.6% | VNO 2010-VNO |
| 7 | BANA | Park Square | Boston | MA | Office | $60,000,000 | 5.7% | 503,312 | $317.89 | 1.89x | 8.3% | 56.9% | 56.9% | LBUBS 2006-C6 |
| 8 | BANA | BWI Airport Marriott | Linthicum Heights | MD | Hospitality | $47,700,000 | 4.5% | 315 | $151,428.57 | 1.61x | 12.2% | 69.9% | 57.3% | MSBAM 2013-C13 |
| 9 | MSMCH | U.S. Industrial Portfolio III | Various | Various | Various | $40,000,000 | 3.8% | 2,886,593 | $41.76 | 1.48x | 9.4% | 72.5% | 66.1% | WFRBS 2013-C16 |
| 10 | BANA | Spectrum Town Center | Gilbert | AZ | Retail | $30,000,000 | 2.8% | 170,388 | $176.07 | 1.46x | 9.4% | 62.9% | 57.5% | MSBAM 2013-C12 |
| 16 | WFB | 3151 Regatta Boulevard | Richmond | CA | Industrial | $17,950,148 | 1.7% | 435,835 | $41.19 | 2.62x | 16.5% | 44.2% | 35.3% | JPMCC 2002-C2, COMM 2012-CR4 |
| 20 | WFB | The Knox | Torrance | CA | Office | $14,000,000 | 1.3% | 108,050 | $129.57 | 2.29x | 11.3% | 64.8% | 64.8% | WBCMT 2006-WL7A |
| 24 | MSMCH | Best Buy Distribution Center | Staunton | VA | Industrial | $11,600,000 | 1.1% | 709,000 | $16.36 | 1.25x | 14.1% | 56.6% | 37.0% | CSFB 1998-C1 |
| 33 | WFB | Briggs Chaney Shopping Center | Silver Spring | MD | Retail | $6,691,570 | 0.6% | 42,055 | $159.11 | 1.55x | 10.3% | 61.7% | 50.5% | BSCMS 2007-PW18 |
| 34 | BANA | Old Barn Self Storage | Grass Valley | CA | Self Storage | $6,250,000 | 0.6% | 71,341 | $87.61 | 2.61x | 11.3% | 61.9% | 61.9% | MLCFC 2006-4 |
| 35 | MSMCH | Woodside Village | Coppell | TX | Retail | $6,000,000 | 0.6% | 27,383 | $219.11 | 1.30x | 9.2% | 69.8% | 55.4% | LBUBS 2004-C6 |
| 37 | MSMCH | Westwood Shopping Center | Shreveport | LA | Retail | $4,741,807 | 0.5% | 112,507 | $42.15 | 1.87x | 14.2% | 55.0% | 41.1% | BACM 2008-1 |
| 38 | BANA | Brentwood Self Storage | Brentwood | TN | Self Storage | $4,400,000 | 0.4% | 44,505 | $98.87 | 1.92x | 9.2% | 61.4% | 61.4% | MLMT 2007-C1 |
| 39 | WFB | Fort Pierce Industrial | St. George | UT | Industrial | $4,300,000 | 0.4% | 47,606 | $90.32 | 1.61x | 10.6% | 66.2% | 56.9% | WBCMT 2007-C34 |
| 41 | BANA | Eagle Village Shopping Center | Stockbridge | GA | Retail | $2,700,000 | 0.3% | 21,589 | $125.06 | 1.40x | 9.6% | 71.1% | 59.7% | JPMCC 2007-LD11 |
| 42 | MSMCH | Walgreens Colorado Springs | Colorado Springs | CO | Retail | $2,493,617 | 0.2% | 14,490 | $172.09 | 1.63x | 13.0% | 43.4% | 27.1% | JPMCC 2003-CB7 |
| Total | $410,866,309 | 39.0% | ||||||||||||
| (1) | Includes mortgage loans for which all or a portion of the previously existing debt was most recently securitized in conduit securitizations, based on information provided by the related borrower or obtained through searches of a third-party database. The information has not otherwise been confirmed by the mortgage loan sellers. With respect to any mortgage loan that is part of a whole loan, unless otherwise indicated, all LTV, DSCR, Debt Yield and Cut-off Date Balance per SF/Unit/Room calculations include any relatedpari passucompanion loans and exclude any related subordinate companion loans, as applicable. |
| (2) | For properties that are part of a portfolio, the Cut-off Date Balance per SF/Unit/Room, UW NCF DSCR, UW NOI Debt Yield, Cut-off Date LTV and Maturity Date LTV calculations reflect the values of the portfolio as a whole. |
This is not a research report and was not prepared by any Underwriter’s research departments. Please see additional important information and qualifications at the end of this Term Sheet. |
| T-20 |
| BANK 2017-BNK9 | Characteristics of the Mortgage Loans |
Mortgage Loans with Scheduled Balloon Payments and Related Classes(1)
| Class A-2 (27,104,000) | ||||||||||||||||
| Loan No. | Mortgage Loan Seller | Property Name | State | Property Type | Cut-off Date Balance | % of Pool | Maturity Date Balance | % of Class A-2 Certificate Principal Balance | SF/ Units | Cut-off Date Balance per SF/Unit | UW NCF DSCR | UW NOI Debt Yield | Cut-off Date LTV | Maturity Date LTV | Rem. IO Period (mos.) | Rem. Term to Maturity (mos.) |
| 20 | WFB | The Knox | CA | Office | $14,000,000 | 1.3% | $14,000,000 | 51.7% | 108,050 | $129.57 | 2.29x | 11.3% | 64.8% | 64.8% | 59 | 59 |
| 24 | MSMCH | Best Buy Distribution Center | VA | Industrial | $11,600,000 | 1.1% | $7,590,733 | 28.0% | 709,000 | $16.36 | 1.25x | 14.1% | 56.6% | 37.0% | 0 | 60 |
| 34 | BANA | Old Barn Self Storage | CA | Self Storage | $6,250,000 | 0.6% | $6,250,000 | 23.1% | 71,341 | $87.61 | 2.61x | 11.3% | 61.9% | 61.9% | 60 | 60 |
| Total/Wtd. Avg. | $31,850,000 | 3.0% | $27,840,733 | 102.7% | 1.97x | 12.3% | 61.2% | 54.1% | 38 | 60 | ||||||
| (1) | The table above reflects the mortgage loans whose balloon payments will be applied to pay down the Class A-2 certificates, assuming (i) that none of the mortgage loans experience prepayments, defaults or losses; (ii) there are no extensions of maturity dates; and (iii) each mortgage loan is paid in full on its stated maturity date. The table above is otherwise based on the Structuring Assumptions set forth under “Yield and Maturity Considerations—Weighted Average Life” in the Preliminary Prospectus. |
This is not a research report and was not prepared by any Underwriter’s research departments. Please see additional important information and qualifications at the end of this Term Sheet. |
| T-21 |
| BANK 2017-BNK9 | Characteristics of the Mortgage Loans |

| Property Type Distribution(1) | ||||||||
| Property Type | Number of Mortgaged Properties | Aggregate Cut-off Date Balance | % of Pool | Wtd. Avg. Mortgage Rate | Wtd. Avg. UW NCF DSCR | Wtd. Avg. UW NOI Debt Yield | Wtd. Avg. Cut-off Date LTV | Wtd. Avg. Maturity Date LTV |
| Office | 16 | $338,052,686 | 32.1% | 3.8686% | 2.73x | 11.5% | 57.1% | 56.3% |
| CBD | 3 | $225,300,000 | 21.4% | 3.8495% | 2.91x | 11.9% | 53.7% | 53.7% |
| Suburban | 13 | $112,752,686 | 10.7% | 3.9067% | 2.36x | 10.9% | 64.1% | 61.4% |
| Retail | 36 | $301,433,910 | 28.6% | 4.5140% | 1.81x | 10.5% | 60.8% | 55.3% |
| Anchored | 9 | $169,680,307 | 16.1% | 4.4751% | 1.74x | 10.3% | 63.5% | 56.8% |
| Unanchored | 6 | $54,014,267 | 5.1% | 4.5615% | 1.67x | 8.9% | 62.6% | 59.1% |
| Regional Mall | 1 | $30,000,000 | 2.8% | 4.4450% | 2.01x | 13.3% | 47.5% | 43.5% |
| Single Tenant | 16 | $23,500,000 | 2.2% | 4.3790% | 2.72x | 12.8% | 50.4% | 50.4% |
| Free-Standing | 2 | $14,693,617 | 1.4% | 4.6049% | 1.65x | 10.7% | 60.8% | 53.7% |
| Shadow Anchored | 2 | $9,545,719 | 0.9% | 5.3446% | 1.33x | 9.2% | 71.2% | 57.3% |
| Hospitality | 5 | $232,470,920 | 22.1% | 4.4307% | 2.10x | 13.3% | 59.9% | 53.0% |
| Full Service | 3 | $212,500,000 | 20.2% | 4.3989% | 2.09x | 13.1% | 59.7% | 53.2% |
| Limited Service | 2 | $19,970,920 | 1.9% | 4.7685% | 2.20x | 15.4% | 61.2% | 50.1% |
| Industrial | 23 | $90,041,212 | 8.5% | 4.0972% | 1.91x | 11.7% | 62.1% | 54.7% |
| Warehouse | 22 | $72,091,064 | 6.8% | 4.1189% | 1.73x | 10.5% | 66.5% | 59.6% |
| Cold Storage | 1 | $17,950,148 | 1.7% | 4.0100% | 2.62x | 16.5% | 44.2% | 35.3% |
| Multifamily | 2 | $42,000,000 | 4.0% | 4.4059% | 1.74x | 9.0% | 66.0% | 62.7% |
| Mid Rise | 1 | $28,500,000 | 2.7% | 4.3850% | 1.78x | 8.0% | 63.9% | 63.9% |
| Garden | 1 | $13,500,000 | 1.3% | 4.4500% | 1.64x | 11.0% | 70.3% | 60.1% |
| Other | 1 | $19,000,000 | 1.8% | 4.3300% | 1.88x | 8.2% | 59.4% | 59.4% |
| Leased Fee | 1 | $19,000,000 | 1.8% | 4.3300% | 1.88x | 8.2% | 59.4% | 59.4% |
| Mixed Use | 2 | $11,904,590 | 1.1% | 4.1167% | 1.99x | 13.5% | 47.5% | 35.4% |
| Retail/Office | 2 | $11,904,590 | 1.1% | 4.1167% | 1.99x | 13.5% | 47.5% | 35.4% |
| Self Storage | 2 | $10,650,000 | 1.0% | 4.4062% | 2.32x | 10.4% | 61.7% | 61.7% |
| Self Storage | 2 | $10,650,000 | 1.0% | 4.4062% | 2.32x | 10.4% | 61.7% | 61.7% |
| Manufactured Housing | 2 | $8,172,500 | 0.8% | 4.5042% | 1.47x | 9.2% | 66.7% | 54.1% |
| Manufactured Housing | 2 | $8,172,500 | 0.8% | 4.5042% | 1.47x | 9.2% | 66.7% | 54.1% |
| Total/Wtd. Avg. | 89 | $1,053,725,818 | 100.0% | 4.2396% | 2.18x | 11.5% | 59.6% | 55.2% |
| (1) | All numerical information concerning the mortgage loans is approximate and, in the case of mortgage loans secured by multiple properties, is based on allocated loan amounts with respect to such properties. All weighted average information regarding the mortgage loans reflects the weighting of the mortgage loans based on their outstanding principal balances as of the Cut-off Date or, in the case of mortgage loans secured by multiple properties, allocated loan amounts. The sum of numbers and percentages in columns may not match the “Total” due to rounding. With respect to any mortgage loan that is part of a whole loan, unless otherwise indicated, all LTV, DSCR and Debt Yield calculations include any relatedpari passu companion loans and exclude any related subordinate companion loans, as applicable. For mortgaged properties securing residential cooperative mortgage loans, the UW NCF DSCR and UW NOI Debt Yield for each such mortgaged property is calculated using underwritten net operating income or underwritten net cash flow, as applicable, for the related residential cooperative property which is the projected net operating income or net cash flow, as applicable, reflected in the most recent appraisal obtained by or otherwise in the possession of the related mortgage loan seller as of the Cut-off Date. LTV calculations are based upon the appraised value of the residential cooperative property determined as if such residential cooperative property is operated as a residential cooperative, inclusive of the amount of the underlying debt encumbering such residential cooperative property. The UW NCF DSCR, UW NOI Debt Yield and LTV calculations do not take into account any subordinate debt (whether or not secured by the related mortgaged property), that currently exists or is allowed under the terms of any mortgage loan. |
This is not a research report and was not prepared by any Underwriter’s research departments. Please see additional important information and qualifications at the end of this Term Sheet. |
| T-22 |
| BANK 2017-BNK9 | Characteristics of the Mortgage Loans |
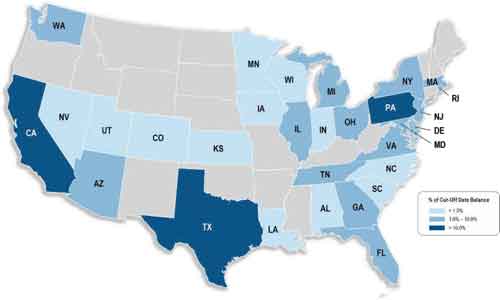
| Geographic Distribution(1) | ||||||||
| State or Other Jurisdiction | Number of Mortgaged Properties | Aggregate Cut-off Date Balance | % of Pool | Wtd. Avg. Mortgage Rate | Wtd. Avg. UW NCF DSCR | Wtd. Avg. UW NOI Debt Yield | Wtd. Avg. Cut-off Date LTV | Wtd. Avg. Maturity Date LTV |
| California | 10 | $244,653,298 | 23.2% | 4.0477% | 2.97x | 14.0% | 45.2% | 43.7% |
| California – Southern(2) | 6 | $189,433,150 | 18.0% | 4.0742% | 3.04x | 13.9% | 43.5% | 42.8% |
| California – Northern(2) | 4 | $55,220,148 | 5.2% | 3.9566% | 2.73x | 14.5% | 51.0% | 46.6% |
| Texas | 11 | $121,139,049 | 11.5% | 4.2187% | 2.15x | 13.1% | 63.9% | 56.1% |
| Pennsylvania | 4 | $111,255,997 | 10.6% | 3.8709% | 2.35x | 10.1% | 68.4% | 68.0% |
| Massachusetts | 2 | $72,200,000 | 6.9% | 4.2244% | 1.85x | 8.6% | 58.2% | 57.3% |
| New Jersey | 1 | $66,400,000 | 6.3% | 4.3550% | 1.82x | 8.6% | 64.6% | 64.6% |
| Maryland | 3 | $64,378,490 | 6.1% | 4.7688% | 1.69x | 12.4% | 68.5% | 56.1% |
| Arizona | 2 | $40,010,000 | 3.8% | 4.2326% | 1.72x | 9.6% | 62.5% | 58.5% |
| Ohio | 9 | $34,831,228 | 3.3% | 4.1710% | 1.88x | 10.4% | 67.8% | 61.9% |
| New York | 2 | $33,750,000 | 3.2% | 4.3956% | 1.74x | 8.0% | 62.3% | 62.3% |
| Michigan | 4 | $33,112,165 | 3.1% | 4.4499% | 1.84x | 12.2% | 69.0% | 56.9% |
| Washington | 2 | $32,120,283 | 3.0% | 4.3157% | 1.86x | 8.2% | 63.6% | 63.6% |
| Georgia | 3 | $30,608,323 | 2.9% | 4.0706% | 2.06x | 9.9% | 65.3% | 59.9% |
| Rhode Island | 1 | $30,000,000 | 2.8% | 4.4450% | 2.01x | 13.3% | 47.5% | 43.5% |
| Illinois | 4 | $18,864,870 | 1.8% | 4.5188% | 1.96x | 11.3% | 64.1% | 56.8% |
| Virginia | 3 | $18,702,664 | 1.8% | 4.2637% | 1.34x | 12.3% | 62.6% | 48.1% |
| Tennessee | 2 | $17,428,500 | 1.7% | 4.6488% | 1.54x | 9.8% | 68.1% | 61.8% |
| Delaware | 1 | $16,500,000 | 1.6% | 4.7900% | 1.32x | 9.8% | 66.3% | 44.8% |
| Florida | 7 | $12,174,482 | 1.2% | 4.3019% | 1.74x | 10.1% | 67.5% | 61.2% |
| Nevada | 1 | $9,984,000 | 0.9% | 5.0000% | 2.25x | 16.3% | 55.8% | 46.0% |
| Kansas | 2 | $8,046,034 | 0.8% | 4.6158% | 1.57x | 10.4% | 70.0% | 58.5% |
| North Carolina | 1 | $6,923,583 | 0.7% | 3.7700% | 2.49x | 10.2% | 61.5% | 61.5% |
| Utah | 2 | $6,156,850 | 0.6% | 4.6032% | 1.94x | 11.3% | 61.4% | 54.9% |
| Louisiana | 1 | $4,741,807 | 0.5% | 4.8200% | 1.87x | 14.2% | 55.0% | 41.1% |
| Colorado | 2 | $4,615,731 | 0.4% | 4.4876% | 2.13x | 12.9% | 46.6% | 37.8% |
| Minnesota | 3 | $4,171,883 | 0.4% | 4.3790% | 2.72x | 12.8% | 50.4% | 50.4% |
| Wisconsin | 1 | $3,376,266 | 0.3% | 4.1800% | 1.48x | 9.4% | 72.5% | 66.1% |
| Indiana | 2 | $2,667,883 | 0.3% | 4.2969% | 2.21x | 11.4% | 59.5% | 56.9% |
| Iowa | 1 | $2,500,938 | 0.2% | 4.1800% | 1.48x | 9.4% | 72.5% | 66.1% |
| South Carolina | 1 | $1,410,723 | 0.1% | 4.3790% | 2.72x | 12.8% | 50.4% | 50.4% |
| Alabama | 1 | $1,000,770 | 0.1% | 4.3790% | 2.72x | 12.8% | 50.4% | 50.4% |
| Total/Wtd Avg. | 89 | $1,053,725,818 | 100.0% | 4.2396% | 2.18x | 11.5% | 59.6% | 55.2% |
| (1) | All numerical information concerning the mortgage loans is approximate and, in the case of mortgage loans secured by multiple properties, is based on allocated loan amounts with respect to such properties. All weighted average information regarding the mortgage loans reflects the weighting of the mortgage loans based on their outstanding principal balances as of the Cut-off Date or, in the case of mortgage loans secured by multiple properties, allocated loan amounts. The sum of numbers and percentages in columns may not match the “Total” due to rounding. With respect to any mortgage loan that is part of a whole loan, unless otherwise indicated, all LTV, DSCR and Debt Yield calculations include any relatedpari passu companion loans and exclude any related subordinate companion loans, as applicable. For mortgaged properties securing residential cooperative mortgage loans, the UW NCF DSCR and UW NOI Debt Yield for each such mortgaged property is calculated using underwritten net operating income or underwritten net cash flow, as applicable, for the related residential cooperative property which is the projected net operating income or net cash flow, as applicable, reflected in the most recent appraisal obtained by or otherwise in the possession of the related mortgage loan seller as of the Cut-off Date. LTV calculations are based upon the appraised value of the residential cooperative property determined as if such residential cooperative property is operated as a residential cooperative, inclusive of the amount of the underlying debt encumbering such residential cooperative property. The UW NCF DSCR, UW NOI Debt Yield and LTV calculations do not take into account any subordinate debt (whether or not secured by the related mortgaged property), that currently exists or is allowed under the terms of any mortgage loan. |
| (2) | “California – Northern” includes zip codes above 93600, and “California – Southern” includes zip codes at or below 93600. |
This is not a research report and was not prepared by any Underwriter’s research departments. Please see additional important information and qualifications at the end of this Term Sheet. |
| T-23 |
| BANK 2017-BNK9 | Collateral Statistics |
Collateral Statistics(1)
Cut-off Date Balance ($)
| No. of Mortgage Loans | Aggregate Cut-off Date Balance ($) | % of Pool | ||
| 1,872,697 - 5,000,000 | 9 | 28,490,930 | 2.7 | |
| 5,000,001 - 10,000,000 | 9 | 70,332,490 | 6.7 | |
| 10,000,001 - 15,000,000 | 8 | 96,558,500 | 9.2 | |
| 15,000,001 - 25,000,000 | 7 | 129,393,898 | 12.3 | |
| 25,000,001 - 50,000,000 | 5 | 176,200,000 | 16.7 | |
| 50,000,001 – 105,300,000 | 7 | 552,750,000 | 52.5 | |
| Total: | 45 | $1,053,725,818 | 100.0% | |
Min: $1,872,697 | Max: $105,300,000 | Avg: $23,416,129 | ||
State or Other Jurisdiction(2)
| No. of Mortgaged Properties | Aggregate Cut-off Date Balance ($) | % of Pool | |
| California | 10 | 244,653,298 | 23.2 |
| California – Southern(3) | 6 | 189,433,150 | 18.0 |
| California – Northern(3) | 4 | 55,220,148 | 5.2 |
| Texas | 11 | 121,139,049 | 11.5 |
| Pennsylvania | 4 | 111,255,997 | 10.6 |
| Massachusetts | 2 | 72,200,000 | 6.9 |
| New Jersey | 1 | 66,400,000 | 6.3 |
| Maryland | 3 | 64,378,490 | 6.1 |
| Arizona | 2 | 40,010,000 | 3.8 |
| Ohio | 9 | 34,831,228 | 3.3 |
| New York | 2 | 33,750,000 | 3.2 |
| Michigan | 4 | 33,112,165 | 3.1 |
| Washington | 2 | 32,120,283 | 3.0 |
| Georgia | 3 | 30,608,323 | 2.9 |
| Rhode Island | 1 | 30,000,000 | 2.8 |
| Illinois | 4 | 18,864,870 | 1.8 |
| Virginia | 3 | 18,702,664 | 1.8 |
| Tennessee | 2 | 17,428,500 | 1.7 |
| Delaware | 1 | 16,500,000 | 1.6 |
| Florida | 7 | 12,174,482 | 1.2 |
| Nevada | 1 | 9,984,000 | 0.9 |
| Kansas | 2 | 8,046,034 | 0.8 |
| North Carolina | 1 | 6,923,583 | 0.7 |
| Utah | 2 | 6,156,850 | 0.6 |
| Louisiana | 1 | 4,741,807 | 0.5 |
| Colorado | 2 | 4,615,731 | 0.4 |
| Minnesota | 3 | 4,171,883 | 0.4 |
| Wisconsin | 1 | 3,376,266 | 0.3 |
| Indiana | 2 | 2,667,883 | 0.3 |
| Iowa | 1 | 2,500,938 | 0.2 |
| South Carolina | 1 | 1,410,723 | 0.1 |
| Alabama | 1 | 1,000,770 | 0.1 |
| Total: | 89 | $1,053,725,818 | 100.0% |
Property Type(2)
| No. of Mortgaged Properties | Aggregate Cut-off Date Balance ($) | % of Pool | |
| Office | 16 | $338,052,686 | 32.1 |
| CBD | 3 | $225,300,000 | 21.4 |
| Suburban | 13 | $112,752,686 | 10.7 |
| Retail | 36 | $301,433,910 | 28.6 |
| Anchored | 9 | $169,680,307 | 16.1 |
| Unanchored | 6 | $54,014,267 | 5.1 |
| Regional Mall | 1 | $30,000,000 | 2.8 |
| Single Tenant | 16 | $23,500,000 | 2.2 |
| Free-Standing | 2 | $14,693,617 | 1.4 |
| Shadow Anchored | 2 | $9,545,719 | 0.9 |
| Hospitality | 5 | $232,470,920 | 22.1 |
| Full Service | 3 | $212,500,000 | 20.2 |
| Limited Service | 2 | $19,970,920 | 1.9 |
| Industrial | 23 | $90,041,212 | 8.5 |
| Warehouse | 22 | $72,091,064 | 6.8 |
| Cold Storage | 1 | $17,950,148 | 1.7 |
| Multifamily | 2 | $42,000,000 | 4.0 |
| Mid Rise | 1 | $28,500,000 | 2.7 |
| Garden | 1 | $13,500,000 | 1.3 |
| Other | 1 | $19,000,000 | 1.8 |
| Leased Fee | 1 | $19,000,000 | 1.8 |
| Mixed Use | 2 | $11,904,590 | 1.1 |
| Retail/Office | 2 | $11,904,590 | 1.1 |
| Self Storage | 2 | $10,650,000 | 1.0 |
| Self Storage | 2 | $10,650,000 | 1.0 |
| Manufactured Housing | 2 | $8,172,500 | 0.8 |
| Manufactured Housing | 2 | $8,172,500 | 0.8 |
| Total: | 89 | $1,053,725,818 | 100.0% |
Mortgage Rate (%)
| No. of Mortgage Loans | Aggregate Cut-off Date Balance ($) | % of Pool | ||
| 3.5625 - 4.0000 | 4 | 271,250,000 | 25.7 | |
| 4.0001 - 4.4999 | 20 | 588,963,898 | 55.9 | |
| 4.5000 - 4.9999 | 19 | 177,527,920 | 16.8 | |
| 5.0000 - 5.5600 | 2 | 15,984,000 | 1.5 | |
| Total: | 45 | $1,053,725,818 | 100.0% | |
| Min: 3.5625% | Max: 5.5600% | Wtd Avg:4.2396% | ||
Original Term to Maturity (mos.)
| No. of Mortgage Loans | Aggregate Cut-off Date Balance ($) | % of Pool | ||
| 60 | 3 | 31,850,000 | 3.0 | |
| 120 | 39 | 932,975,818 | 88.5 | |
| 123 | 1 | 66,400,000 | 6.3 | |
| 144 | 1 | 16,500,000 | 1.6 | |
| 180 | 1 | 6,000,000 | 0.6 | |
| Total: | 45 | $1,053,725,818 | 100.0% | |
| Min: 60 mos. | Max: 180 mos. | Wtd Avg: 119 mos. | ||
Remaining Term to Maturity (mos.)
| No. of Mortgage Loans | Aggregate Cut-off Date Balance ($) | % of Pool | ||
| 59 - 60 | 3 | 31,850,000 | 3.0 | |
| 61 - 120 | 39 | 932,975,818 | 88.5 | |
| 121 - 144 | 2 | 82,900,000 | 7.9 | |
| 145 - 179 | 1 | 6,000,000 | 0.6 | |
| Total: | 45 | $1,053,725,818 | 100.0% | |
| Min: 59 mos. | Max: 179 mos. | Wtd Avg: 118 mos. | ||
Original Amortization Term (mos.)
| No. of Mortgage Loans | Aggregate Cut-off Date Balance ($) | % of Pool | ||
| Interest Only | 14 | 602,350,000 | 57.2 | |
| 144 | 1 | $11,600,000 | 1.1 | |
| 240 | 1 | $2,493,617 | 0.2 | |
| 300 | 3 | $30,941,807 | 2.9 | |
| 360 | 26 | $406,340,394 | 38.6 | |
| Total: | 45 | $1,053,725,818 | 100.0% | |
| Min: 144 mos. | Max: 360 mos. | Wtd Avg: 350 mos. | ||
Remaining Amortization Term (mos.)
| No. of Mortgage Loans | Aggregate Cut-off Date Balance ($) | % of Pool | ||
| Interest Only | 14 | 602,350,000 | 57.2 | |
| 144 - 240 | 2 | 14,093,617 | 1.3 | |
| 241 - 300 | 3 | 30,941,807 | 2.9 | |
| 301 - 360 | 26 | 406,340,394 | 38.6 | |
| Total: | 45 | $1,053,725,818 | 100.0% | |
| Min: 144 mos. | Max: 360 mos. | Wtd Avg: 350 mos. | ||
Mortgage Loan Sellers
| No. of Mortgage Loans | Aggregate Cut-off Date Balance ($) | % of Pool | |
| BANA | 17 | 383,543,420 | 36.4 |
| MSMCH | 18 | 332,567,983 | 31.6 |
| WFB | 9 | 277,614,415 | 26.3 |
| MSMCH/WFB | 1 | 60,000,000 | 5.7 |
| Total: | 45 | $1,053,725,818 | 100.0% |
Amortization Type
| No. of Mortgage Loans | Aggregate Cut-off Date Balance ($) | % of Pool | |
| Interest Only | 14 | 602,350,000 | 57.2 |
| Partial Interest Only | 11 | 240,528,500 | 22.8 |
| Amortizing Balloon | 20 | 210,847,318 | 20.0 |
| Total: | 45 | $1,053,725,818 | 100.0% |
Cut-off Date LTV Ratio (%)
| No. of Mortgage Loans | Aggregate Cut-off Date Balance ($) | % of Pool | ||
| 24.6 - 40.0 | 3 | 72,872,697 | 6.9 | |
| 40.1 - 60.0 | 11 | 273,969,572 | 26.0 | |
| 60.1 - 65.0 | 15 | 397,536,160 | 37.7 | |
| 65.1 - 70.0 | 7 | 198,786,920 | 18.9 | |
| 70.1 - 73.7 | 9 | 110,560,469 | 10.5 | |
| Total: | 45 | $1,053,725,818 | 100.0% | |
| Min: 24.6% | Max: 73.7% | Wtd Avg: 59.6% | ||
Maturity Date LTV Ratio (%)
| No. of Mortgage Loans | Aggregate Cut-off Date Balance ($) | % of Pool | ||
| 24.6 - 35.0 | 5 | 85,066,314 | 8.1 | |
| 35.1 - 45.0 | 5 | 80,791,955 | 7.7 | |
| 45.1 - 55.0 | 8 | 154,457,080 | 14.7 | |
| 55.1 - 60.0 | 14 | 308,486,250 | 29.3 | |
| 60.1 - 68.4 | 13 | 424,924,219 | 40.3 | |
| Total: | 45 | $1,053,725,818 | 100.0% | |
| Min: 24.6% | Max: 68.4% | Wtd Avg: 55.2% | ||
UW DSCR (x)
| No. of Mortgage Loans | Aggregate Cut-off Date Balance ($) | % of Pool | ||
| 1.25 - 1.40 | 6 | 47,125,719 | 4.5 | |
| 1.41 - 1.50 | 7 | 110,281,000 | 10.5 | |
| 1.51 - 1.60 | 2 | 8,896,160 | 0.8 | |
| 1.61 - 1.70 | 6 | 96,193,617 | 9.1 | |
| 1.71 - 1.80 | 3 | 57,400,000 | 5.4 | |
| 1.81 - 1.90 | 4 | 150,141,807 | 14.2 | |
| 1.91 - 2.50 | 12 | 464,987,366 | 44.1 | |
| 2.51 - 3.00 | 3 | 47,700,148 | 4.5 | |
| 3.01 - 4.83 | 2 | 71,000,000 | 6.7 | |
| Total: | 45 | $1,053,725,818 | 100.0% | |
| Min: 1.25x | Max: 4.83x | Wtd Avg: 2.18x | ||
UW NOI Debt Yield (%)
| No. of Mortgage Loans | Aggregate Cut-off Date Balance ($) | % of Pool | ||
| 8.0 - 8.5 | 5 | 141,250,000 | 13.4 | |
| 8.6 - 9.0 | 1 | 66,400,000 | 6.3 | |
| 9.1 - 9.5 | 7 | 92,118,219 | 8.7 | |
| 9.6 - 10.0 | 6 | 58,088,500 | 5.5 | |
| 10.1 - 11.0 | 7 | 240,446,160 | 22.8 | |
| 11.1 - 12.0 | 2 | 20,250,000 | 1.9 | |
| 12.1 - 15.0 | 13 | 336,238,791 | 31.9 | |
| 15.1 - 20.7 | 4 | 98,934,148 | 9.4 | |
| Total: | 45 | $1,053,725,818 | 100.0% | |
| Min: 8.0% | Max: 20.7% | Wtd Avg: 11.5% | ||
| (1) | All numerical information concerning the mortgage loans is approximate. All weighted average information regarding the mortgage loans reflects the weighting of the mortgage loans based on their outstanding principal balances as of the Cut-off Date. The sum of numbers and percentages in columns may not match the “Total” due to rounding. With respect to any mortgage loan that is part of a whole loan, unless otherwise indicated, all LTV, DSCR and Debt Yield calculations include any relatedpari passu companion loans and exclude any related subordinate companion loans, as applicable. For mortgaged properties securing residential cooperative mortgage loans, the UW DSCR and UW NOI Debt Yield for each such mortgaged property is calculated using underwritten net operating income or underwritten net cash flow, as applicable, for the related residential cooperative property which is the projected net operating income or net cash flow, as applicable, reflected in the most recent appraisal obtained by or otherwise in the possession of the related mortgage loan seller as of the Cut-off Date. LTV Ratio calculations are based upon the appraised value of the residential cooperative property determined as if such residential cooperative property is operated as a residential cooperative, inclusive of the amount of the underlying debt encumbering such residential cooperative property In the case of the residential cooperative property. The UW DSCR, UW NOI Debt Yield and LTV Ratio calculations do not take into account any subordinate debt (whether or not secured by the related mortgaged property), that currently exists or is allowed under the terms of any mortgage loan. |
| (2) | In the case of mortgage loans secured by multiple properties, cut-off date balance information is based on allocated loan amounts with respect to such properties. |
| (3) | “California – Northern” includes zip codes above 93600, and “California – Southern” includes zip codes at or below 93600. |
This is not a research report and was not prepared by any Underwriter’s research departments. Please see additional important information and qualifications at the end of this Term Sheet. |
| T-24 |
(THIS PAGE INTENTIONALLY LEFT BLANK)
| T-25 |
| BANK 2017-BNK9 | Duane Morris Plaza |
Mortgage Loan No. 1 – Duane Morris Plaza
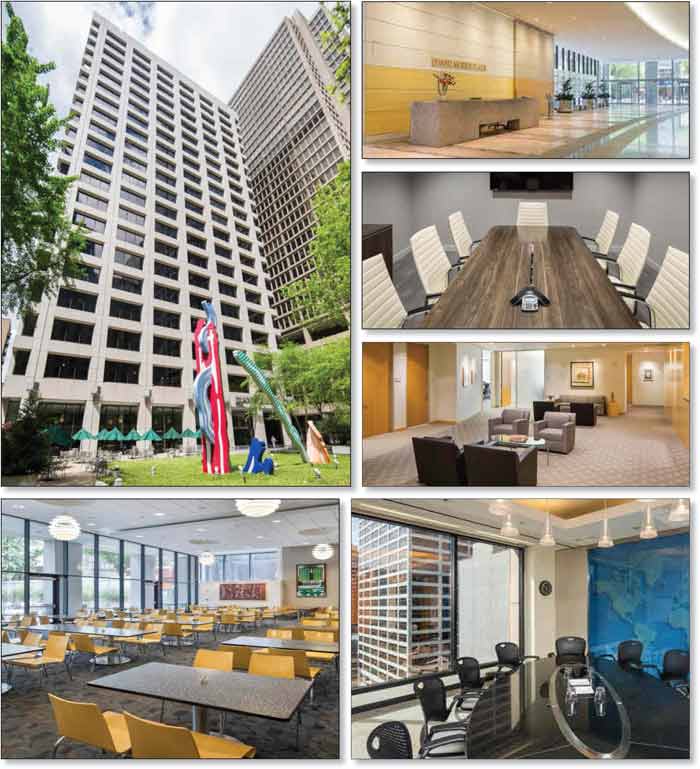
This is not a research report and was not prepared by any Underwriter’s research departments. Please see additional important information and qualifications at the end of this Term Sheet. |
| T-26 |
| BANK 2017-BNK9 | Duane Morris Plaza |
Mortgage Loan No. 1 – Duane Morris Plaza

This is not a research report and was not prepared by any Underwriter’s research departments. Please see additional important information and qualifications at the end of this Term Sheet. |
| T-27 |
| BANK 2017-BNK9 | Duane Morris Plaza |
Mortgage Loan No. 1 – Duane Morris Plaza

This is not a research report and was not prepared by any Underwriter’s research departments. Please see additional important information and qualifications at the end of this Term Sheet. |
| T-28 |
| BANK 2017-BNK9 | Duane Morris Plaza |
| Mortgage Loan No. 1 – Duane Morris Plaza |
| Mortgage Loan Information | Property Information | |||||
| Mortgage Loan Seller: | WFB | Single Asset/Portfolio: | Single Asset | |||
| Original Balance: | $105,300,000 | Location: | Philadelphia, PA 19103 | |||
| Cut-off Date Balance: | $105,300,000 | General Property Type: | Office | |||
| % of Initial Pool Balance: | 9.99% | Detailed Property Type: | CBD | |||
| Loan Purpose: | Acquisition | Title Vesting: | Fee | |||
| Sponsor: | Oaktree Pinnacle Investment Fund, L.P. | Year Built/Renovated: | 1975/2002 | |||
| Mortgage Rate: | 3.8440% | Size: | 617,476 SF | |||
| Note Date: | 11/7/2017 | Cut-off Date Balance per SF: | $171 | |||
| First Payment Date: | 12/11/2017 | Maturity Date Balance per SF: | $171 | |||
| Final Maturity Date: | 11/11/2027 | Property Manager: | NAI Geis Realty Group, Inc. | |||
| Original Term: | 120 months | |||||
| Original Amortization Term: | 0 months | |||||
| IO Period: | 120 months | |||||
| Seasoning: | 1 month | |||||
| Prepayment Provisions: | LO (25); DEF/YM1 (88); O (7) | |||||
| Lockbox/Cash Mgmt Status: | Hard/Springing | Underwriting and Financial Information | ||||
| Additional Debt Type: | N/A | UW NOI: | $10,624,718 | |||
| Additional Debt Balance: | N/A | UW NOI Debt Yield: | 10.1% | |||
| Future Debt Permitted (Type)(1): | Yes (Mezzanine) | UW NOI Debt Yield at Maturity: | 10.1% | |||
| Reserves(2) | UW NCF DSCR: | 2.40x | ||||
| Type | Initial | Monthly | Cap | Most Recent NOI: | $9,296,133 (10/31/2017 TTM) | |
| RE Tax: | $0 | Springing | N/A | 2nd Most Recent NOI: | $9,980,202 (12/31/2016) | |
| Insurance: | $0 | Springing | N/A | 3rd Most Recent NOI(3): | $9,181,861 (3/31/2016 TTM) | |
| Elevator/Generator Reserve: | $1,090,293 | $0 | N/A | Most Recent Occupancy: | 94.8% (11/1/2017) | |
| Replacement Reserve: | $0 | Springing | N/A | 2nd Most Recent Occupancy: | 91.5% (12/31/2016) | |
| Leasing Reserves: | $0 | Springing | N/A | 3rd Most Recent Occupancy: | 95.6% (12/31/2015) | |
| Rent Concession Reserves: | $2,532,274 | $0 | N/A | Appraised Value (as of)(4): | $154,000,000 (10/6/2017) | |
| Existing TI/LC Reserves: | $4,511,095 | $0 | N/A | Cut-off Date LTV Ratio(5): | 68.4% | |
| Duane Morris Existing TI/LC and Rent Concession Reserve: | $6,650,884 | $0 | N/A | Maturity Date LTV Ratio(5): | 68.4% | |
| Sources and Uses | ||||||
| Sources | Proceeds | % of Total | Uses | Proceeds | % of Total | |
| Loan Amount: | $105,300,000 | 67.2% | Purchase Price: | $145,800,000 | 93.1% | |
| Borrower Sponsor Equity: | $51,338,490 | 32.8% | Seller Credit(6): | ($8,366,151) | (5.3%) | |
| Upfront Reserve: | $14,784,546 | 9.4% | ||||
| Closing Costs: | $4,420,095 | 2.8% | ||||
| Total Sources: | $156,638,490 | 100.0% | Total Uses: | $156,638,490 | 100.0% | |
| (1) | See “Mezzanine Loan and Preferred Equity” below. |
| (2) | See “Escrows and Reserves” below for further discussion of reserve requirements. |
| (3) | Cash flow statements for January through March 2015 are not available due to the seller’s acquisition of the Duane Morris Plaza Property in early 2015. |
| (4) | The Appraised Value shown is based on the appraiser’s Hypothetical Value Upon Completion, which assumes certain outstanding capital improvements and tenant improvements have been completed and certain rent abatement periods have ended. All of the related capital improvements, tenant improvements and rent abatements were reserved for upon the origination of the Duane Morris Plaza Mortgage Loan (as defined below) (see“Escrows and Reserves”below). |
| (5) | The Cut-off Date LTV Ratio and Maturity Date LTV Ratio shown are based on the appraiser’s Hypothetical Value Upon Completion. Based on the as-is appraised value of $146,000,000 (as of October 6, 2017), the Cut-off Date LTV Ratio and Maturity Date LTV Ratio are approximately 72.1%. |
| (6) | The seller credit represents certain outstanding tenant improvement obligations, leasing commissions and rent abatements owed to existing tenants. The seller credit is comprised of $1,063,762 for base rent, $747,675 for security deposits, $1,306,395 for outstanding capital projects, $3,456,785 for outstanding TI/LCs, $1,699,976 for rent abatements, and $91,557 in other prorations associated with loan closing. |
The Mortgage Loan. The largest mortgage loan (the “Duane Morris Plaza Mortgage Loan”) is evidenced by a promissory note in the original principal amount of $105,300,000 and is secured by a first priority fee mortgage encumbering a 617,476 SF Class A office tower located in Philadelphia, Pennsylvania (the “Duane Morris Plaza Property”). The proceeds of the Duane Morris Plaza Mortgage Loan, along with approximately $51.3 million of equity from the borrower sponsor, were used to facilitate the acquisition of the Duane Morris Plaza Property.
This is not a research report and was not prepared by any Underwriter’s research departments. Please see additional important information and qualifications at the end of this Term Sheet. |
| T-29 |
| BANK 2017-BNK9 | Duane Morris Plaza |
The Borrower and the Sponsor. The borrower is 30 South 17 Property Owner, LLC (the “Duane Morris Plaza Borrower”), a single-purpose Delaware limited liability company structured to be bankruptcy-remote, with two independent directors. The sponsor and the nonrecourse carve-out guarantor of the Duane Morris Plaza Mortgage Loan is Oaktree Pinnacle Investment Fund, L.P. In lieu of including the guarantor as an indemnitor on the environmental indemnity agreement, the lender obtained an environmental insurance policy with a $1.0 million limit per claim with a 13-year term and $25,000 deductible.
Oaktree Pinnacle Investment Fund, L.P. is the operating partnership of Oaktree Capital Management (“Oaktree”), a leading global alternative investment management firm. Oaktree’s clients include 75 of the 100 largest U.S. pension plans, over 400 corporations around the world, over 350 endowments and foundations globally, 16 sovereign wealth funds and 38 of the 50 primary state retirement plans in the United States. Oaktree comprises over 900 employees in 18 cities across four continents. As of September 30, 2017, Oaktree had approximately $100 billion in assets under management.
The Property. The Duane Morris Plaza Property consists of the fee interest in a 20-story, Class A office building totaling 617,476 SF, located in the central business district of Philadelphia, Pennsylvania, more commonly known as Center City Philadelphia. The Duane Morris Plaza Property was built in 1975 and renovated in 2002 and has since 2002 served as the headquarters for Duane Morris LLP (“Duane Morris”). Aside from Duane Morris, no tenant accounts for more than 7.4% of NRA or 9.3% of underwritten rent.
The Duane Morris Plaza Property is located one block south of Market Street and has frontage along both 17th and 18thstreets. The Duane Morris Plaza Property features an open plaza area in front of the main lobby entrance on 17th Street and features flexible floor plates that can accommodate full floor users or multi-tenant configurations. Duane Morris operates a private cafeteria within the building, which can be accessed from the lobby or an exterior entrance from 17th Street. The 18th Street frontage of the Duane Morris Plaza Property is leased to two restaurants that are expected to open in early 2018: the Tria Wine Bar and Green Eggs Café. The Duane Morris Plaza Property contains an 88-space subterranean parking garage, resulting in a parking ratio of 0.1 spaces per 1,000 SF of NRA. As of November 1, 2017, the Duane Morris Plaza Property was 94.8% leased to 27 tenants.
Major Tenants.
Duane Morris (257,021 SF, 41.6% NRA, 36.8% of underwritten rent). Duane Morris, ranked number 71 of the top 100 law firms in the United States according to a third-party law publication, occupies eight floors totaling 257,021 SF at the Duane Morris Plaza Property. Over the past 19 years, Duane Morris has tripled in size to more than 750 attorneys across 29 offices in the United States, United Kingdom and Asia; and the firm has experienced an approximate 7.8% increase in gross revenue from $421.5 million in 2013 to $454.5 million in 2016. Revenue per lawyer and profits per equity partner also saw growth during this period of 2.2% and 7.4%, respectively. Duane Morris has consistently been nationally ranked in multiple segments, including appellate, banking and finance, bankruptcy, construction, corporate healthcare, immigration, insurance, IP litigation and patent litigation.
The following table presents certain information relating to the major tenants at the Duane Morris Plaza Property:
| Tenant Summary(1) | |||||||
| Tenant Name | Credit Rating (Fitch/Moody’s/S&P)(2) | Tenant SF | Approximate % of SF | Annual UW Rent(3) | % of Total Annual UW Rent | Annual UW Rent PSF(3)(4) | Lease Expiration |
| Major Tenant | |||||||
| Duane Morris | NR/NR/NR | 257,021 | 41.6% | $5,322,523(5)(6) | 36.8% | $20.71(5)(6) | 3/31/2026(7)(8) |
| Convene | NR/NR/NR | 45,774 | 7.4% | $1,352,139(9) | 9.3% | $29.54(9) | 6/30/2029 |
| Volpe & Koenig, PC | NR/NR/NR | 31,609 | 5.1% | $932,466(10) | 6.4% | $29.50(10) | 2/7/2031 |
| JLT RE (North America) Inc. | BBB/Baa3/BBB | 31,609 | 5.1% | $908,759 | 6.3% | $28.75 | 4/30/2028(11) |
| Cohen, Seglias, Pallas, Green | NR/NR/NR | 31,609 | 5.1% | $853,443 | 5.9% | $27.00 | 10/31/2020 |
| Wells Fargo Advisors | A+/A2/A | 24,002 | 3.9% | $612,051(12) | 4.2% | $25.50(12) | 3/31/2025 |
| Subtotal/Wtd. Avg. | 421,624 | 68.3% | $9,981,380 | 68.9% | $23.67 | ||
| Other Tenants | 163,597 | 26.5% | $4,499,166 | 31.1% | $27.50 | ||
| Vacant Space | 32,255 | 5.2% | $0 | 0.0% | $0.00 | ||
| Total/Wtd. Avg. | 617,476 | 100.0% | $14,480,546 | 100.0% | $24.74 | ||
| (1) | Information is based on the underwritten rent roll as of November 2017. |
| (2) | Certain ratings are those of the parent company whether or not the parent guarantees the lease. |
| (3) | Annual UW Rent is based on the rent roll as of November 2017. Contractual rent steps amounting to $752,706 were underwritten through October 31, 2018, including rent averaging for Duane Morris. |
| (4) | Wtd. Avg. Annual UW Rent PSF excludes vacant space. |
| (5) | The Annual UW Rent and Annual UW Rent PSF for Duane Morris is based on the tenant’s average rental rate over the remaining term of its lease. Duane Morris’ current contractual rental rate is $18.50 PSF. Duane Morris is on a triple net lease, while other tenant leases at the Duane Morris Plaza Property are modified gross. |
| (6) | Duane Morris has a one-month free rent period in January 2018. An upfront rent concession reserve was deposited by the Duane Morris Plaza Borrower (see“Escrows and Reserves”below). |
| (7) | Duane Morris has the right to contract its space by one full floor (either the 3rd, 6th, 9th or 12th floor) on September 1, 2022 upon 12 months’ written notice and payment of a termination fee equal to $854,192 (approximately $27.88 PSF). Duane Morris currently occupies eight full floors at the Duane Morris Plaza Property. |
| (8) | Duane Morris has two, five-year renewal options and one, three-year option at fair market value. |
| (9) | Convene will pay abated rent of $8.60 PSF through April 2018, $17.80 PSF from May 2018 through June 2018, and $21.44 PSF from July 2020 through October 2020. An upfront rent concession reserve was deposited by the Duane Morris Plaza Borrower (see “Escrows and Reserves” below). |
| (10) | Volpe & Koenig, PC will receive full monthly rent abatement for nine total months occurring from 2018 to 2021. An upfront rent concession reserve was deposited by the Duane Morris Plaza Borrower (see “Escrows and Reserves” below). |
| (11) | JLT RE (North America) Inc. has the right to terminate its lease on September 30, 2022 upon 12 months’ written notice and payment of a termination fee equal to $1,854,946 (approximately $58.68 PSF). |
| (12) | Wells Fargo Advisors has a free rent period through March 2018. An upfront rent concession reserve was deposited by the Duane Morris Plaza Borrower (see“Escrows and Reserves”below). |
This is not a research report and was not prepared by any Underwriter’s research departments. Please see additional important information and qualifications at the end of this Term Sheet. |
| T-30 |
| BANK 2017-BNK9 | Duane Morris Plaza |
The following table presents certain information relating to the lease rollover schedule at the Duane Morris Plaza Property:
| Lease Rollover Schedule(1) | ||||||||
| Year | # of Leases Rolling | SF Rolling | Annual UW Rent PSF Rolling(2) | Approx. % of Total SF Rolling | Approx. Cumulative % of SF Rolling | Total UW Rent Rolling | Approx. % of Total Rent Rolling | Approx. Cumulative % of Total Rent Rolling |
| 2017 | 0 | 0 | $0.00 | 0.0% | 0.0% | $0 | 0.0% | 0.0% |
| 2018 | 0 | 0 | $0.00 | 0.0% | 0.0% | $0 | 0.0% | 0.0% |
| 2019 | 3 | 20,769 | $28.92 | 3.4% | 3.4% | $600,687 | 4.1% | 4.1% |
| 2020 | 4 | 45,099 | $26.81 | 7.3% | 10.7% | $1,209,256 | 8.4% | 12.5% |
| 2021 | 1 | 12,307 | $27.00 | 2.0% | 12.7% | $332,289 | 2.3% | 14.8% |
| 2022 | 4 | 27,466 | $27.24 | 4.4% | 17.1% | $748,116 | 5.2% | 20.0% |
| 2023 | 5 | 45,413 | $26.58 | 7.4% | 24.5% | $1,206,908 | 8.3% | 28.3% |
| 2024 | 3 | 33,306 | $27.06 | 5.4% | 29.9% | $901,180 | 6.2% | 34.5% |
| 2025 | 2 | 24,002 | $25.50 | 3.9% | 33.7% | $612,051 | 4.2% | 38.7% |
| 2026 | 3 | 257,021 | $20.71 | 41.6% | 75.4% | $5,322,523 | 36.8% | 75.5% |
| 2027 & Beyond | 9 | 119,838 | $29.60 | 19.4% | 94.8% | $3,547,537 | 24.5% | 100.0% |
| Vacant | 0 | 32,255 | $0.00 | 5.2% | 100.0% | $0 | 0.0% | 100.0% |
| Total/Wtd. Avg. | 34 | 617,476 | $24.74 | 100.0% | $14,480,546 | 100.0% | ||
| (1) | Information is based on the underwritten rent roll as of November 2017. |
| (2) | Wtd. Avg. Annual UW Rent PSF Rolling excludes vacant space. |
The Market. The Duane Morris Plaza Property is located in the central business district of Philadelphia, Pennsylvania, more commonly known as Center City Philadelphia. The Philadelphia metropolitan statistical area is home to over 6.0 million people, making it the sixth-largest metropolitan area in the United States. The City of Philadelphia has experienced significant population growth since 2006, as its population has increased by an average of 0.5% annually. The Duane Morris Plaza Property is situated two blocks west of City Hall, and one block south of Market Street, between 17th and 18th streets. The Duane Morris Plaza Property is located less than one mile from the Pennsylvania Convention Center and Philadelphia’s 30thStreet Station. The Pennsylvania Convention Center contains more than 679,000 SF of exhibit hall space with seven halls and 82 meeting rooms, including the largest ballroom in the Northeast. Philadelphia’s 30th Street Station is one of the country’s last remaining grand terminals and experiences more than 4 million passengers annually, making it Amtrak’s third busiest hub in the nation.
According to a third party market research report, the Duane Morris Plaza Property is located within the Market Street West office submarket. As of the third quarter of 2017, the Market Street West office submarket contained approximately 39.0 million SF of inventory with an average vacancy rate of 8.2% and year-to-date net absorption of 525,121 SF. For the same period, Philadelphia’s overall office market contained approximately 424.2 million SF of office space with an average vacancy rate of 8.3% and year-to-date net absorption of 467,848 SF. The Market Street West submarket Class A office space reported third quarter average asking rents of $34.42 PSF, compared to the central business district average of $31.30 PSF and the greater Philadelphia average of $28.01 PSF. The appraiser concluded to a market rent for the office space at the Duane Morris Plaza Property of $30.50 PSF, modified gross.
The following table presents certain information relating to comparable office leases to the Duane Morris Plaza Property:
| Comparable Leases Summary | ||||||||
| Property Name/Location | Year Built | Size SF | Total Occupancy | Tenant Name | Lease Date/Term | Lease Area (SF) | Annual In Place Rent PSF | Lease Type |
Duane Morris Plaza Property Philadelphia, PA | 1975 | 617,476 | 94.8% | Duane Morris | Sep. 2016 / 9.5 Yrs | 257,021 | $18.50(1) | NNN |
Beneficial Bank Place Philadelphia, PA | 1972 | 988,206 | 88.3% | Market Research Partners | June 2018 / 11.0 Yrs | 23,673 | $32.00 | MG |
Four Penn Center Philadelphia, PA | 1964 | 524,462 | 79.3% | Bank of America | March 2017 / 10.0 Yrs | 34,124 | $27.00 | MG |
Two Logan Square Philadelphia, PA | 1988 | 708,844 | 97.1% | Comcast | Oct. 2016 / 5.0 Yrs | 44,398 | $31.00 | MG |
Two Liberty Place Philadelphia, PA | 1990 | 940,654 | 90.4% | Eckert Seamans | Oct. 2016 / 16.0 Yrs | 52,931 | $31.50 | MG |
Two Liberty Place Philadelphia, PA | 1990 | 940,654 | 90.4% | Cigna | Sept. 2015 / 12.0 Yrs | 322,086 | $31.00 | MG |
| Philadelphia Stock Exchange Building Philadelphia, PA | 1981 | 456,922 | 84.2% | Independence Blue Cross | June 2015 / 18.0 Yrs | 227,974 | $28.00 | MG |
Source:Appraisal, underwritten rent roll and third party market research report.
| (1) | Represents Duane Morris’ current in-place rent. The tenant’s underwritten rent of $20.71 PSF represents the average over its remaining lease term. The underwritten reimbursements for Duane Morris equate to approximately $11.92 PSF. |
This is not a research report and was not prepared by any Underwriter’s research departments. Please see additional important information and qualifications at the end of this Term Sheet. |
| T-31 |
| BANK 2017-BNK9 | Duane Morris Plaza |
Operating History and Underwritten Net Cash Flow.The following table presents certain information relating to the historical operating performance and the Underwritten Net Cash Flow at the Duane Morris Plaza Property:
| Cash Flow Analysis | |||||||||||||
| 2014 | 3/31/2016 TTM(1) | 2016 | 10/31/2017 TTM | UW | UW PSF | ||||||||
| Base Rent | $12,376,061 | $11,952,708 | $13,016,875 | $12,631,960 | $15,322,965 | $24.82 | |||||||
| Total Recoveries | $3,140,265 | $3,456,385 | $3,178,523 | $2,816,114 | $3,659,675 | $5.93 | |||||||
| Other Income | $299,970 | $306,700 | $351,651 | $351,656 | $351,656 | $0.57 | |||||||
| Less Vacancy & Credit Loss | $0 | $0 | $0 | $0 | ($1,539,071) | ($2.49) | |||||||
| Effective Gross Income | $15,816,296 | $15,715,792 | $16,547,049 | $15,799,730 | $17,795,225 | $28.82 | |||||||
| Total Operating Expenses | $7,025,390 | $6,533,931 | $6,566,847 | $6,503,597 | $7,170,507 | $11.61 | |||||||
| Net Operating Income | $8,790,906 | $9,181,861 | $9,980,202 | $9,296,133 | $10,624,718(2) | $17.21 | |||||||
| Replacement Reserves | $0 | $0 | $0 | $0 | $123,495 | $0.20 | |||||||
| Tenant Improvements | $0 | $0 | $0 | $0 | $453,444 | $0.73 | |||||||
| Leasing Commissions | $0 | $0 | $0 | $0 | $185,930 | $0.30 | |||||||
| Net Cash Flow | $8,790,906 | $9,181,861 | $9,980,202 | $9,296,133 | $9,861,849 | $15.97 | |||||||
| Occupancy % | 92.2% | 95.6%(3) | 91.5% | 94.8%(4) | 90.0%(4) | ||||||||
| NOI DSCR | 2.14x | 2.24x | 2.43x | 2.27x | 2.59x | ||||||||
| NCF DSCR | 2.14x | 2.24x | 2.43x | 2.27x | 2.40x | ||||||||
| NOI Debt Yield | 8.3% | 8.7% | 9.5% | 8.8% | 10.1% | ||||||||
| NCF Debt Yield | 8.3% | 8.7% | 9.5% | 8.8% | 9.4% | ||||||||
| (1) | Cash flow statements for January through March 2015 are not available due to the seller’s acquisition of the Duane Morris Plaza Property in early 2015. |
| (2) | UW Net Operating Income is higher than the most recent Net Operating Income due primarily to a four-month free rent period for Duane Morris from November 2016 through February 2017. |
| (3) | The physical occupancy was 95.6% as of 12/31/2015. |
| (4) | The underwritten economic vacancy is 10.0%. The Duane Morris Plaza Property was 94.8% leased as of November 1, 2017. |
Escrows and Reserves. At loan origination, the Duane Morris Plaza Borrower deposited $1,090,293 for amounts payable under contracts for elevator and generator maintenance that are required to satisfy obligations under the Duane Morris lease.
At loan origination, the Duane Morris Plaza Borrower deposited $2,532,274 for rent concessions related to seven tenants (for leases other than the Duane Morris lease) and $4,511,095 for existing TI/LC obligations (for leases other than the Duane Morris lease). The Duane Morris Plaza Borrower also deposited $6,650,884 for existing TI/LC obligations ($6,254,643; “Duane Morris TI/LC Obligations”) and rent concessions ($396,241) related to the Duane Morris lease. Beginning on September 1, 2019, approximately $3.9 million of the Duane Morris TI/LC Obligations will be made available for expenses incurred after May 27, 2016; beginning September 1, 2020, any unused portion of such allowance may be used by the tenant towards monthly rent.
The Duane Morris Plaza Mortgage Loan documents do not require ongoing monthly escrows for taxes, insurance premiums, replacement reserves or TI/LC as long as (i) no Cash Trap Event Period (see “Lockbox and Cash Management” below) has occurred and is continuing; (ii) with respect to taxes, the Duane Morris Plaza Borrower provides the lender with evidence that the Duane Morris Plaza Property taxes have been paid; and (iii) with respect to insurance premiums, the Duane Morris Plaza Borrower provides the lender with evidence that the Duane Morris Plaza Property is insured via an acceptable blanket policy and such policy is in full force and effect.
The Duane Morris Plaza Mortgage Loan documents require monthly escrows of excess cash for potential re-leasing costs related to the Duane Morris space upon the occurrence and continuance of a Duane Morris Sweep Period (as defined below).
A “Duane Morris Sweep Period” will commence upon the occurrence of any of the following;provided, however, that a Duane Morris Sweep Period will not commence if the net cash flow debt yield excluding any income from the Duane Morris lease is equal to or greater than the net cash flow debt yield at origination including income from the Duane Morris lease (9.4%):
| (i) | The date that is 15 months prior to the Duane Morris lease expiration date; |
| (ii) | 50% or more of the Duane Morris space is subleased to one or more sublease tenants; |
| (iii) | the occurrence of a monetary or material non-monetary default under the Duane Morris lease; or |
| (iv) | any filing by or against Duane Morris under any creditors rights law resulting in the rejection of the Duane Morris lease. |
A Duane Morris Sweep Period will end upon the occurrence of the following:
| ● | With regard to clause (i) above, upon the occurrence of a Duane Morris Re-Leasing Event (as defined below); |
| ● | With regard to clause (ii) above, upon the occurrence of (a) a Duane Morris Re-Leasing Event or (b) a Duane Morris Sweep Cap Event (as defined below); |
| ● | With regard to clause (iii) above, upon the occurrence of (a) a Duane Morris Re-Leasing Event, (b) a Duane Morris Sweep Cap Event, or (c) the date that is six months following the date of the cure of such event of default; and |
| ● | With regard to clause (iv) above, upon the occurrence of (a) a Duane Morris Re-Leasing Event, (b) a Duane Morris Sweep Cap Event, or (c) any applicable proceeding having been terminated and/or the Duane Morris lease having been affirmed and assumed. |
A “Duane Morris Re-Leasing Event” will occur upon (i) all or a portion of the Duane Morris space being leased to one or more qualified lessees with terms sufficient to generate a net cash flow debt yield equal to or greater than the net cash flow debt yield at origination, such tenants having commenced paying
This is not a research report and was not prepared by any Underwriter’s research departments. Please see additional important information and qualifications at the end of this Term Sheet. |
| T-32 |
| BANK 2017-BNK9 | Duane Morris Plaza |
full unabated rent (or any rent concessions are deposited into a reserve subaccount), and all landlord obligations having been completed and paid (or any outstanding landlord obligations are deposited into a reserve subaccount); or (ii) Duane Morris exercises its renewal option.
A “Duane Morris Sweep Cap Event” will occur upon the amount in the Duane Morris lease reserve being equal to $8,995,735, provided that if Duane Morris enters into an extension or renewal of its lease for less than the entire space under the existing lease, such amount will be proportionately reduced.
Lockbox and Cash Management. A hard lockbox is in place with respect to the Duane Morris Plaza Mortgage Loan, with springing cash management upon the occurrence of a Cash Trap Event Period (as defined below). During a Cash Trap Event Period, all excess cash flow is required to be held in the excess cash flow sub-account as additional security for the Duane Morris Plaza Mortgage Loan (and during a Duane Morris Sweep Period, held for potential leasing costs for the Duane Morris space).
A “Cash Trap Event Period” will commence upon the earlier of the following:
| (i) | the occurrence and continuance of an event of default; |
| (ii) | the net cash flow debt yield being less than 6.50% at the end of any calendar quarter (unless the Duane Morris Borrower deposits with the lender cash or letter of credit in an amount that which, if applied to the outstanding balance of the loan, would cure the debt yield test); or |
| (iii) | the occurrence of a Duane Morris Sweep Period (see “Escrows and Reserves” above). |
A Cash Trap Event Period will end:
| ● | with regard to clause (i), upon the cure of such event of default; |
| ● | with regard to clause (ii), upon (a) the debt yield being at least 6.50% for two consecutive calendar quarters; or (b) the debt yield being at least 6.75% for one calendar quarter; and |
| ● | with regard to clause (iii), upon the cure of such Duane Morris Sweep Period (as outlined in“Escrows and Reserves” above). |
Mezzanine Loan and Preferred Equity. Any time after November 7, 2018, the direct owner of the Duane Morris Plaza Borrower is permitted to obtain a mezzanine loan issued by a Qualified Mezzanine Lender (as defined below) secured by the direct ownership interests in the Duane Morris Plaza Borrower upon satisfaction of certain terms and conditions including, among others, (i) no monetary or material non-monetary event of default has occurred and is continuing, (ii) the combined loan-to-value ratio is less than or equal to 68.4%, (iii) the combined debt yield is equal to or greater than 9.1%, (iv) the mortgage and mezzanine lenders enter into an intercreditor agreement acceptable to the lender, (v) delivery of rating agency confirmation and (vi) such mezzanine loan has a maturity date no earlier than that of the Duane Morris Plaza Mortgage Loan.
A “Qualified Mezzanine Lender” is an institution that, among other requirements outlined in the loan documents, (i) has total real estate assets (in name or management) in excess of $300,000,000 or capital/statutory surplus of shareholder’s equity in excess of $100,000,000; and (ii) is regularly engaged in the business of making or owning commercial real estate loans or operating commercial mortgage properties.
Release of Property. Not permitted.
Terrorism Insurance.The Duane Morris Plaza Mortgage Loan documents require that the “all risk” insurance policy required to be maintained by the Duane Morris Plaza Borrower provide coverage for terrorism in an amount equal to the full replacement cost of the Duane Morris Plaza Property (provided that the Duane Morris Plaza Borrower is not required to pay terrorism insurance premiums in excess of two times the premium for all risk and business interruption coverage if the Terrorism Risk Insurance Program Reauthorization Act is no longer in effect). The loan documents also require business interruption insurance covering no less than the 24-month period following the occurrence of a casualty event, together with a six-month extended period of indemnity. See “Risk Factors—Risks Relating to the Mortgage Loans—Terrorism Insurance May Not Be Available for All Mortgaged Properties” in the Preliminary Prospectus.
This is not a research report and was not prepared by any Underwriter’s research departments. Please see additional important information and qualifications at the end of this Term Sheet. |
| T-33 |
| BANK 2017-BNK9 | Griffin Portfolio |
Mortgage Loan No. 2 – Griffin Portfolio
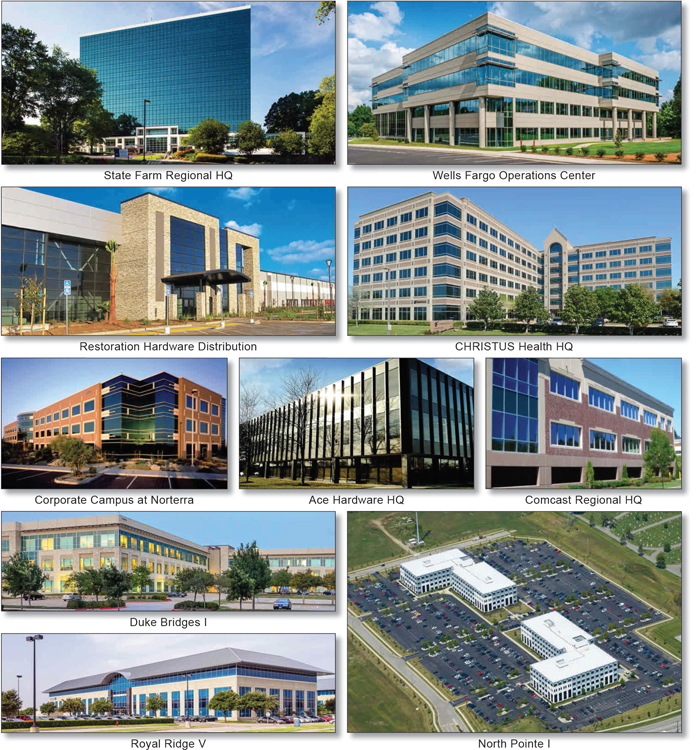
This is not a research report and was not prepared by any Underwriter’s research departments. Please see additional important information and qualifications at the end of this Term Sheet. |
| T-34 |
| BANK 2017-BNK9 | Griffin Portfolio |
Mortgage Loan No. 2 – Griffin Portfolio
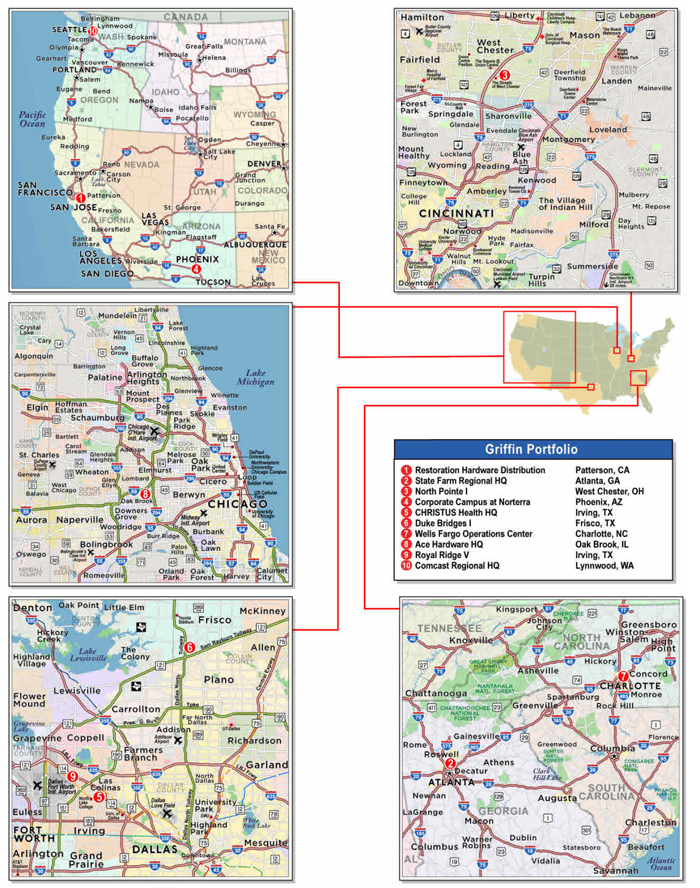
This is not a research report and was not prepared by any Underwriter’s research departments. Please see additional important information and qualifications at the end of this Term Sheet. |
| T-35 |
| BANK 2017-BNK9 | Griffin Portfolio |
| Mortgage Loan No. 2 – Griffin Portfolio |
| Mortgage Loan Information | Property Information | |||||
| Mortgage Loan Seller: | BANA | Single Asset/Portfolio: | Portfolio | |||
| Original Balance(1): | $96,250,000 | Location: | Various | |||
| Cut-off Date Balance(1): | $96,250,000 | General Property Type: | Various | |||
| % of Initial Pool Balance: | 9.1% | Detailed Property Type: | Various | |||
| Loan Purpose: | Recapitalization | Title Vesting: | Fee | |||
| Sponsor: | Griffin Capital Company, LLC | Year Built/Renovated: | Various/Various | |||
| Mortgage Rate: | 3.7700% | Size: | 3,708,698 SF | |||
| Note Date: | 9/29/2017 | Cut-off Date Balance per SF(1): | $101 | |||
| First Payment Date: | 11/1/2017 | Maturity Date Balance per SF(1): | $101 | |||
| Maturity Date: | 10/1/2027 | Property Manager: | Griffin Capital Essential Asset Property Management, LLC | |||
| Original Term to Maturity: | 120 months | (borrower-related) | ||||
| Original Amortization Term: | 0 months | |||||
| IO Period: | 120 months | Underwriting and Financial Information | ||||
| Seasoning: | 2 months | UW NOI: | $38,310,729 | |||
| Prepayment Provisions: | LO (24); YM1 (90); O (6) | UW NOI Debt Yield(1): | 10.2% | |||
| Lockbox/Cash Mgmt Status: | Hard/Springing | UW NOI Debt Yield at Maturity(1): | 10.2% | |||
| Additional Debt Type(1)(2): | Pari Passu | UW NCF DSCR(1): | 2.49x | |||
| Additional Debt Balance(1)(2): | $278,750,000 | Most Recent NOI: | $36,689,111 (6/30/2017 TTM) | |||
| Future Debt Permitted (Type): | No (N/A) | 2nd Most Recent NOI: | $36,419,432 (12/31/2016) | |||
| Reserves(3) | 3rd Most Recent NOI(4): | $26,778,722 (12/31/2015) | ||||
| Type | Initial | Monthly | Cap | Most Recent Occupancy: | 98.4% (Various) | |
| RE Tax: | $930,000 | $466,667 | N/A | 2nd Most Recent Occupancy: | 98.4% (12/31/2016) | |
| Insurance: | $0 | Springing | N/A | 3rd Most Recent Occupancy: | 98.4% (12/31/2015) | |
| Recurring Replacements: | $0 | Springing | (3) | Appraised Value (as of)(5): | $610,000,000 (9/21/2017) | |
| TI/LC | $0 | Springing | (3) | Cut-off Date LTV Ratio(1)(5): | 61.5% | |
| Other Reserves: | $5,657,511 | $0 | N/A | Maturity Date LTV Ratio(1)(5): | 61.5% | |
| Sources and Uses | ||||||
| Sources | Proceeds | % of Total | Uses | Proceeds | % of Total | |
| Loan Amount(1): | $375,000,000 | 100.0% | Return of Equity(6): | $363,553,632 | 96.9% | |
| Reserves: | $6,587,511 | 1.8% | ||||
| Closing Costs: | $4,858,857 | 1.3% | ||||
| Total Sources: | $375,000,000 | 100.0% | Total Uses: | $375,000,000 | 100.0% | |
| (1) | The Griffin Portfolio Mortgage Loan (as defined below) is part of the Griffin Portfolio Whole Loan (as defined below), which is comprised of tenpari passu promissory notes with an aggregate original principal balance of $375,000,000. The Cut-off Date Balance per SF, Maturity Date Balance per SF, UW NOI Debt Yield, UW NOI Debt Yield at Maturity, UW NCF DSCR, Cut-off Date LTV Ratio and Maturity Date LTV Ratio numbers presented above are based on the aggregate principal balance of the promissory notes comprising the Griffin Portfolio Whole Loan. |
| (2) | See “The Mortgage Loan” and “Additional Secured Indebtedness (not including trade debts)” below for further discussion of additional debt. |
| (3) | See “Escrows and Reserves” below for further discussion of reserve requirements. |
| (4) | 3rd Most Recent NOI includes only partial year cash flow for the Restoration Hardware Distribution property which, has a single tenant lease that commenced in August 2015, and does not include any cash flow for the Royal Ridge V property, which has a single tenant lease that commenced in December 2015. |
| (5) | The appraiser provided a bulk portfolio value for the Griffin Portfolio Properties (as defined below) of $610,000,000, which includes a portfolio premium of $17,940,000 over the aggregate “as is” appraised values for the individual Griffin Portfolio Properties. The aggregate “as is” appraised values for the individual Griffin Portfolio Properties is $592,060,000, which results in a Cut-off Date LTV Ratio and a Maturity Date LTV Ratio of 63.3%. |
| (6) | Proceeds from the Griffin Portfolio Whole Loan were used to return equity to the Griffin Portfolio Whole Loan sponsor to pay down a portion of the sponsor’s credit facility. The Griffin Portfolio Whole Loan sponsor maintains a current cost basis in the Griffin Portfolio Properties of approximately $522.5 million. |
The Mortgage Loan. The second largest mortgage loan (the “Griffin Portfolio Mortgage Loan”) is part of a whole loan (the “Griffin Portfolio Whole Loan”) evidenced by tenpari passu promissory notes in the aggregate original principal amount of $375,000,000, all of which are secured by the fee interests in a portfolio of nine office properties and one distribution facility located in eight different states and totaling 3,708,698 SF (the “Griffin Portfolio Properties”). The non-controlling Promissory Note A-1-2 in the original aggregate principal amount of $96,250,000 represents the Griffin Portfolio Mortgage Loan and will be included in the BANK 2017-BNK9 securitization trust. A summary of the remaining promissory notes (the “Griffin Portfolio ServicedPari Passu Companion Loans”) is shown in the table below. The Griffin Portfolio Whole Loan will be serviced pursuant to the pooling and servicing agreement for the BANK 2017-BNK8 securitization trust. See “Description of the Mortgage Pool—The Whole Loans—The Non-Serviced Pari Passu Whole Loans” and“Pooling and Servicing Agreement—Servicing of the Non-Serviced Mortgage Loans” in the Preliminary Prospectus.
This is not a research report and was not prepared by any Underwriter’s research departments. Please see additional important information and qualifications at the end of this Term Sheet. |
| T-36 |
| BANK 2017-BNK9 | Griffin Portfolio |
| Griffin Portfolio Whole Loan Summary | ||||
Notes | Original Balance | Note Holder(1) | Controlling Interest | |
| A-1-1 | $100,000,000 | BANK 2017-BNK8 | Yes | |
| A-1-2 | $96,250,000 | BANK 2017-BNK9 | No | |
| A-1-3 | $10,000,000 | BANK 2017-BNK8 | No | |
| A-2-1 | $35,000,000 | Deutsche Bank AG, New York Branch | No | |
| A-2-2 | $30,000,000 | UBS AG | No | |
| A-2-3 | $25,000,000 | UBS 2017-C5 | No | |
| A-2-4 | $20,000,000 | Deutsche Bank AG, New York Branch | No | |
| A-2-5 | $15,000,000 | UBS 2017-C5 | No | |
| A-2-6 | $6,250,000 | UBS AG | No | |
| A-3 | $37,500,000 | KeyBank National Association | No | |
| Griffin Portfolio Whole Loan | $375,000,000 | |||
| (1) | Certain of the Griffin Portfolio ServicedPari Passu Companion Loans were sold to UBS AG and KeyBank National Association following the origination of the Griffin Portfolio Whole Loan by Bank of America, N. A. UBS AG subsequently sold the A-2-1 and A-2-4 notes to Deutsche Bank AG, New York Branch. |
Proceeds from the Griffin Portfolio Whole Loan were used to return equity to the Griffin Portfolio Whole Loan sponsor to pay down a portion of the sponsor’s credit facility, fund upfront reserves, and pay closing costs.
The Borrowers and the Sponsor. The borrowers are nine Delaware limited liability companies and one Delaware limited partnership, each structured to be bankruptcy-remote with at least two independent directors (individually and collectively, the “Griffin Portfolio Borrowers”). Equity ownership in the Griffin Portfolio Borrowers is held by Griffin Capital Essential Asset REIT Inc., a Maryland corporation. Griffin Capital Essential Asset REIT Inc. is the nonrecourse carve-out guarantor for the Griffin Portfolio Whole Loan and is a real estate investment trust that invests in single-tenant, office and industrial properties net leased on a long term basis to primarily credit rated corporate tenants. As of June 30, 2017, Griffin Capital Essential Asset REIT Inc. had a real estate portfolio consisting of 74 properties in 20 states.
Griffin Capital Essential Asset REIT Inc.’s sponsor is Griffin Capital Company, LLC, formerly known as Griffin Capital Corporation. Griffin Capital Company, LLC is the sponsor for the Griffin Portfolio Whole Loan and is an alternative investment asset manager with approximately $9.5 billion in assets under management as of June 30, 2017.
The Properties. The Griffin Portfolio Properties are comprised of nine office buildings and one distribution center that are located across eight different states. The Griffin Portfolio Properties total 3,708,698 SF. The Griffin Portfolio Properties are currently 98.4% leased to sixteen tenants from a range of industries that include insurance, wireless telecommunication services, banking and retail. Each of the major tenants uses the properties as its corporate or regional headquarters or occupies built-to-suit space. The largest individual properties based on net rentable area are the Restoration Hardware Distribution property (40.5% of SF, 16.0% of UW NOI), the State Farm Regional HQ property (15.8% of SF, 20.0% of UW NOI) and the North Pointe I property (11.0% of SF, 11.1% of UW NOI), with no other individual property representing more than 6.8% of SF or 9.9% of UW NOI.
This is not a research report and was not prepared by any Underwriter’s research departments. Please see additional important information and qualifications at the end of this Term Sheet. |
| T-37 |
| BANK 2017-BNK9 | Griffin Portfolio |
The following table presents detailed information with respect to each of the Griffin Portfolio Properties.
| Griffin Portfolio Properties Summary | ||||||||
| Property Name, Location | Major Tenant | Year Built/ Renovated | SF | Occupancy | Allocated Loan Amount (“ALA”) | % of ALA | Appraised Value | % of Appraised Value(2) |
Restoration Hardware Distribution 825 Rogers Road | Restoration Hardware | 2015 / N/A | 1,501,387 | 100.0% | $78,000,000 | 20.8% | $120,000,000 | 20.3% |
State Farm Regional HQ 64 & 66 Perimeter Center East | State Farm | 1971 & 1985 / 2012 | 584,785 | 89.6% | $69,461,000 | 18.5% | $122,000,000 | 20.6% |
North Pointe I 6440 & 6380 Aviation Way | General Electric Co. | 2010 / N/A | 409,798 | 100.0% | $39,650,000 | 10.6% | $61,000,000 | 10.3% |
Corporate Campus at Norterra 25500 & 25600 N. Norterra Parkway | Cigna Health Care | 2000 / N/A | 232,648 | 100.0% | $39,000,000 | 10.4% | $60,000,000 | 10.1% |
CHRISTUS Health HQ 919 Hidden Ridge Road | CHRISTUS Health | 1997 / 2012 | 253,340 | 100.0% | $36,198,500 | 9.7% | $55,690,000 | 9.4% |
Duke Bridges I 7668 Warren Parkway | T-Mobile West | 2005 / N/A | 158,135 | 100.0% | $27,475,500 | 7.3% | $42,270,000 | 7.1% |
Wells Fargo Operations Center 8740 Research Drive | Wells Fargo Bank | 1984 / 2014 | 155,579 | 100.0% | $26,975,000 | 7.2% | $41,500,000 | 7.0% |
Ace Hardware HQ 2200 - 2222 Kensington Court | Ace Hardware Corporation | 1974 / 2012 | 206,030 | 100.0% | $22,750,000 | 6.1% | $35,000,000 | 5.9% |
Royal Ridge V 3929 W. John Carpenter Freeway | NEC | 2004 / N/A | 119,611 | 100.0% | $21,385,000 | 5.7% | $32,900,000 | 5.6% |
Comcast Regional HQ 15815 25th Avenue | Comcast | 2007 / N/A | 87,385 | 100.0% | $14,105,000 | 3.8% | $21,700,000 | 3.7% |
| Total/Wtd. Avg. | 3,708,698 | 98.4% | $375,000,000 | 100.0% | $610,000,000(1) | 100.0% | ||
| (1) | The aggregate of the “as is” appraised values for the individual Griffin Portfolio Properties is $592,060,000. The appraiser provided a bulk portfolio value for the Griffin Portfolio Properties of $610,000,000, which includes a portfolio premium of $17,940,000. |
| (2) | Calculated as a percentage of the aggregate of the “as is” appraised values for the individual Griffin Portfolio Properties. |
Major Properties.
Restoration Hardware Distribution (1,501,387 SF, 40.5% of NRA, 20.8% Allocated Loan Amount). The Restoration Hardware Distribution property is located in Patterson, California, approximately 35 miles southwest of Stockton, California and approximately 14 miles southwest of Modesto, California. The Restoration Hardware Distribution property is a built to suit regional distribution center that is 100.0% leased to Restoration Hardware, Inc. (NYSE: RH). Including the Restoration Hardware Distribution property, Restoration Hardware, Inc. has four furniture and one small parcel distribution centers strategically located in five markets throughout the United States. The Restoration Hardware lease extends through August 31, 2030, contains three, five-year renewal options and requires annual rental increases of 2.0% each August. The Restoration Hardware Distribution property was built in 2015 with 36-foot clear heights throughout the facility and 199 dock-high loading entrances. All entrances are gated and the Restoration Hardware Distribution property includes 372 auto parking spaces and 528 truck parking spaces. Access is provided by Interstate 5 at the Sperry Avenue interchange due south of the Restoration Hardware Distribution property. The immediate area is designed for industrial development, with Amazon.com, CVS Caremark, Grainger and Kohl’s Department Store having distribution centers in close proximity.
State Farm Regional HQ (584,785 SF, 15.8% of SF, 18.5% Allocated Loan Amount). The State Farm Regional HQ property is comprised of 64 Perimeter Center and 66 Perimeter Center, two Class A office buildings connected by an enclosed pedestrian bridge, located in Atlanta, Georgia. 64 Perimeter Center consists of a 15-story, 384,575 SF building built in 1985 and includes a café on the 2nd floor, an entire 15th floor breakroom with market café and 1,146 parking spaces in a 6-story garage. 66 Perimeter Center consists of an 8-story, 200,201 SF building built in 1971 and includes a fitness center on the ground floor and 766 surface parking spaces. Both the 64 Perimeter Center and 66 Perimeter Center buildings were substantially updated in 2012 with an approximately $9 million renovation. The State Farm Regional HQ property is currently 89.6% occupied by State Farm Insurance (86.0% of SF) for use as its regional headquarters, and by BCD Travel USA and Ventyx, Inc. The State Farm Insurance lease extends through December 2023, contains three remaining five-year renewal options and requires annual rental increases of 2.5% each December. Approximately $21.5 million of tenant improvements was invested by State Farm Insurance to their space. State Farm Insurance has another corporate location approximately one mile from the State Farm Regional HQ property known as the Dunwoody campus, to which it is currently adding 670,000 SF of additional office space. The State Farm Regional HQ property is located adjacent to Interstate 285, accessible via the Ashford Dunwoody Road interchange and approximately 2.0 miles from the Georgia 400 expressway.
The State Farm Regional HQ property is subject to a revenue bond lease structure with the Dunwoody Development Authority, whereby for purposes of being able to offer a tax abatement, the Dunwoody Development Authority has sold revenue bonds to the Griffin Portfolio Borrowers in exchange for the fee interest in the State Farm Regional HQ property and leases the property back to the Griffin Portfolio Borrowers at an amount equal to the payments called for by the revenue bonds. The lease and the revenue bonds are co-terminous. The Dunwoody Development Authority has joined the fee interest to the collateral for the Griffin Portfolio Whole Loan. Full (unabated) tax expenses were underwritten by the lender.
North Pointe I (409,798 SF, 11.0% of SF, 10.6% Allocated Loan Amount). The North Pointe I property is comprised of two Class A, LEED-Gold, office buildings located in West Chester, Ohio, approximately 19 miles north of Cincinnati. Each building is 4-stories with a 2-story atrium entrance. The North Pointe I property was completed in 2010 and includes 1,720 surface parking spaces. The North Pointe I property is 100.0% leased through March 31,
This is not a research report and was not prepared by any Underwriter’s research departments. Please see additional important information and qualifications at the end of this Term Sheet. |
| T-38 |
| BANK 2017-BNK9 | Griffin Portfolio |
2020 to General Electric Company (NYSE: GE) (“GE”) and was built to suit for GE for use as the GE Aviation’s Product Engineering Center and Worldwide Call Center for jet engine-related problems, housing approximately 1,700 employees and operating 24 hours per day and 365 days per year. GE Aviation’s headquarters and main production facility is located in Evendale, Ohio, approximately 5 miles south of the North Pointe I property. GE Aviation has been headquartered in the Cincinnati area since 1949 and is one of the largest employers in the state of Ohio. The GE lease contains four, five-year renewal options and requires annual rental increases of 2.0% each April. Prior to taking occupancy, GE had reportedly invested approximately $15 million to the North Pointe I property in tenant improvements, furnishings, back-up power and technology infrastructure.
The following table presents certain information relating to the leases at the Griffin Portfolio Properties:
| Tenant Summary(1) | ||||||||||||||||
| Tenant Name | Credit Rating (Fitch/ Moody’s/ S&P)(2) | Tenant SF | Approx. % of Total SF | Annual UW Rent | % of Total Annual UW Rent | Annual UW Rent PSF(3) | Lease Expiration | Renewal Options | ||||||||
| Restoration Hardware | NR/NR/NR | 1,501,387 | 40.5% | $6,781,152 | 16.1% | $4.52 | 8/31/2030 | 3 x 5 Yrs | ||||||||
| State Farm | NR/Aa1/AA | 503,201 | 13.6% | $6,801,718 | 16.1% | $13.52 | 12/31/2023 | 3 x 5 Yrs | ||||||||
| General Electric Co. | AA-/A1/AA- | 409,798 | 11.0% | $5,151,942 | 12.2% | $12.57 | 3/31/2020 | 4 x 5 Yrs | ||||||||
| CHRISTUS Health | NR/NR/NR | 247,721 | 6.7% | $5,363,160 | 12.7% | $21.65 | 11/30/2024 | 2 x 5 Yrs | ||||||||
| Cigna Health Care | BBB+/Baa1/A | 232,648 | 6.3% | $3,941,057 | 9.3% | $16.94 | 7/31/2023 | 2 x 5 Yrs | ||||||||
| Ace Hardware Corporation(4) | NR/NR/NR | 206,030 | 5.6% | $2,917,385 | 6.9% | $14.16 | 11/30/2024 | 3 x 5 Yrs | ||||||||
| T-Mobile West(5) | BBB+/Baa1/BBB+ | 158,135 | 4.3% | $3,044,099 | 7.2% | $19.25 | 4/30/2027 | 1 x 10 Yrs | ||||||||
| Wells Fargo Bank(6) | AA-/Aa1/AA | 155,579 | 4.2% | $2,761,527 | 6.6% | $17.75 | 1/31/2025 | 3 x 5 Yrs | ||||||||
| NEC(7) | NR/Baa2/BBB- | 119,611 | 3.2% | $2,990,275 | 7.1% | $25.00 | 3/31/2026 | 1 x 7 Yrs | ||||||||
| Comcast(8) | A-/A3/A- | 87,385 | 2.4% | $1,620,118 | 3.8% | $18.54 | 7/31/2027 | 1 x 10 Yrs | ||||||||
| Subtotal/Wtd. Avg. | 3,621,495 | 97.6% | $41,372,433 | 98.1% | $11.42 | |||||||||||
| Other Tenants | 15,889 | 0.4% | $786,371 | 1.9% | $49.49 | |||||||||||
| Management Offices/Fitness Center | 10,281 | 0.3% | $0 | 0.0% | $0.00 | |||||||||||
| Total Occupied Space | 3,647,665 | 98.4% | $42,158,803 | 100.0% | $11.59(9) | |||||||||||
| Vacant Space | 61,033 | 1.6% | $0 | 0.0% | $0.00 | |||||||||||
| Total/Wtd. Avg. | 3,708,698 | 100.0% | $42,158,803 | 100.0% | $11.59 | |||||||||||
| (1) | Information is based on the underwritten rent roll. |
| (2) | Certain ratings are those of the parent company whether or not the parent guarantees the lease. |
| (3) | Wtd. Avg. Annual UW Rent PSF excludes vacant space and management offices/fitness center space for which no rent is collected. All leases are NNN except for CHRISTUS Health and NEC whose leases are full service gross plus electric. |
| (4) | Ace Hardware Corporation has a one-time right of first refusal to purchase the Ace Hardware HQ property if offered for sale. |
| (5) | T-Mobile West is entitled to a rent abatement in connection with its recent renewal and expansion equal to $401,177, which amount has been fully reserved by the lender. |
| (6) | Wells Fargo Bank has a termination option effective January 31, 2023 with 9 months’ notice and payment of a termination fee equal to $1,491,390. |
| (7) | NEC has a termination option effective March 31, 2024 with 12 months’ notice and payment of a termination fee equal to transaction costs and three months’ of base rent, estimated as $2,695,119. |
| (8) | Comcast is entitled to a rent abatement in connection with its recent renewal equal to $262,155, which amount has been fully reserved by the lender. Comcast has a termination option effective November 30, 2024 with 15 months’ notice and payment of a termination fee equal to four months’ rent plus tenant improvement and leasing commissions costs. Comcast’s termination option will be null and void upon any extension or renewal of its initial lease term. |
| (9) | Total Occupied Space Annual UW Rent PSF excludes management offices/fitness center space for which no rent is collected. |
This is not a research report and was not prepared by any Underwriter’s research departments. Please see additional important information and qualifications at the end of this Term Sheet. |
| T-39 |
| BANK 2017-BNK9 | Griffin Portfolio |
The following table presents certain information relating to the lease rollover schedule at the Griffin Portfolio Properties:
| Lease Rollover Schedule(1)(2) | ||||||||
| Year | # of Leases Rolling | SF Rolling | Approx. % of Total SF Rolling | Approx. Cumulative % of SF Rolling | UW Base Rent PSF Rolling(3) | Total UW Base Rent Rolling | Approx. % of Total Rent Rolling | Approx. Cumulative % of Total Rent Rolling |
| 2017 | 0 | 0 | 0.0% | 0.0% | $0.00 | $0 | 0.0% | 0.0% |
| 2018 | 3 | 3,233 | 0.1% | 0.1% | $16.65 | $53,820 | 0.1% | 0.1% |
| 2019 | 0 | 0 | 0.0% | 0.1% | $0.00 | $0 | 0.0% | 0.1% |
| 2020 | 1 | 409,798 | 11.0% | 11.1% | $12.57 | $5,151,942 | 12.2% | 12.3% |
| 2021 | 0 | 0 | 0.0% | 11.1% | $0.00 | $0 | 0.0% | 12.3% |
| 2022 | 0 | 0 | 0.0% | 11.1% | $0.00 | $0 | 0.0% | 12.3% |
| 2023 | 4 | 748,505 | 20.2% | 31.3% | $15.27 | $11,432,041 | 27.1% | 39.5% |
| 2024 | 2 | 453,751 | 12.2% | 43.6% | $18.25 | $8,280,544 | 19.6% | 59.1% |
| 2025 | 1 | 155,579 | 4.2% | 47.7% | $17.75 | $2,761,527 | 6.6% | 65.7% |
| 2026 | 2 | 119,611 | 3.2% | 51.0% | $25.36 | $3,033,560 | 7.2% | 72.9% |
| 2027 | 2 | 245,520 | 6.6% | 57.6% | $19.00 | $4,664,217 | 11.1% | 83.9% |
| 2028 & Beyond(4) | 1 | 1,511,668 | 40.8% | 98.4% | $4.48 | $6,781,152 | 16.1% | 100.0% |
| Vacant | 0 | 61,033 | 1.6% | 100.0% | $0.00 | $0 | 0.0% | 100.0% |
| Total/Wtd. Avg. | 16 | 3,708,698 | 100.0% | $11.59 | $42,158,803 | 100.0% | ||
| (1) | Information is based on the underwritten rent roll. Certain tenants may have multiple leases which are consolidated as presented. |
| (2) | Certain tenants may have lease termination options that are exercisable prior to the originally stated expiration date of the subject lease and that are not considered in the lease rollover schedule. |
| (3) | Total/Wtd. Avg. UW Base Rent PSF Rolling excludes vacant space and management office/fitness space for which no rent is collected. |
| (4) | SF Rolling includes 10,281 SF of management office/fitness center space for which no rent is collected. UW Base Rent PSF Rolling excludes 10,281 SF of management office/fitness space for which no rent is collected. |
The Markets. The Griffin Portfolio Properties are geographically diverse. The largest property, the Restoration Hardware Distribution property, is located in Patterson, California (40.5% of SF), the second largest property, the State Farm Regional HQ property, is located in Atlanta, Georgia (15.8% of SF), three properties are located in Texas (14.3% of SF) and the remainder of the properties are located across five other states.
The following table presents certain information relating to the population demographics of the markets in which the Griffin Portfolio Properties operate:
| Griffin Portfolio Properties Demographic Summary | |||||||
| Property Name | City, State | 1-mile Population | 3-mile Population | 5-mile Population | 1-mile Median Household Income | 3-mile Median Household Income | 5-mile Median Household Income |
| Restoration Hardware Distribution | Patterson, CA | 42 | 20,441 | 24,102 | $47,865 | $61,858 | $60,310 |
| State Farm Regional HQ | Atlanta, GA | 12,649 | 97,983 | 250,574 | $77,288 | $79,064 | $70,985 |
| North Pointe I | West Chester, OH | 2,971 | 49,063 | 132,374 | $97,422 | $77,727 | $79,948 |
| Corporate Campus at Norterra | Phoenix, AZ | 3,559 | 42,905 | 134,668 | $80,150 | $73,070 | $65,689 |
| CHRISTUS Health HQ | Irving, TX | 8,613 | 95,066 | 224,668 | $68,773 | $59,976 | $53,483 |
| Duke Bridges I | Frisco, TX | 5,920 | 86,699 | 266,265 | $69,869 | $98,529 | $105,029 |
| Wells Fargo Operations Center | Charlotte, NC | 4,175 | 80,660 | 186,610 | $51,460 | $51,225 | $52,919 |
| Ace Hardware HQ | Oak Brook, IL | 2,674 | 73,723 | 294,911 | $104,663 | $88,632 | $83,002 |
| Royal Ridge V | Irving, TX | 1,960 | 38,018 | 163,442 | $42,630 | $76,656 | $67,010 |
| Comcast Regional HQ | Lynnwood, WA | 20,196 | 136,312 | 323,365 | $65,877 | $68,260 | $73,081 |
Source: Appraisals.
This is not a research report and was not prepared by any Underwriter’s research departments. Please see additional important information and qualifications at the end of this Term Sheet. |
| T-40 |
| BANK 2017-BNK9 | Griffin Portfolio |
Operating History and Underwritten Net Cash Flow.The following table presents certain information relating to the historical operating performance and Underwritten Net Cash Flow at the Griffin Portfolio Properties:
| Cash Flow Analysis | |||||||||||
| 2015(1) | 2016 | 6/30/2017 TTM | UW | UW PSF | |||||||
| Base Rent(2) | $28,945,010 | $40,014,721 | $41,038,947 | $45,573,634 | $12.29 | ||||||
| Reimbursements(3) | $8,286,631 | $12,164,850 | $11,783,658 | $13,125,514 | $3.54 | ||||||
| Other Income(4) | $461,007 | $288,903 | $256,280 | $261,221 | $0.07 | ||||||
| Vacancy | $0 | $0 | $0 | ($4,053,927) | ($1.09) | ||||||
| Effective Gross Income | $37,692,649 | $52,468,474 | $53,078,885 | $54,906,442 | $14.80 | ||||||
| Total Operating Expenses(5) | $10,913,927 | $16,049,042 | $16,389,774 | $16,595,713 | $4.47 | ||||||
| Net Operating Income | $26,778,722 | $36,419,432 | $36,689,111 | $38,310,729 | $10.33 | ||||||
| TI/LC | $0 | $0 | $0 | $2,066,126 | $0.56 | ||||||
| Capital Expenditures | $0 | $0 | $0 | $591,601 | $0.16 | ||||||
| Net Cash Flow | $26,778,722 | $36,419,432 | $36,689,111 | $35,653,002 | $9.61 | ||||||
| Occupancy % | 98.4% | 98.4% | 98.4% | 93.1% | |||||||
| NOI DSCR(6) | 1.87x | 2.54x | 2.56x | 2.67x | |||||||
| NCF DSCR(6) | 1.87x | 2.54x | 2.56x | 2.49x | |||||||
| NOI Debt Yield(6) | 7.1% | 9.7% | 9.8% | 10.2% | |||||||
| NCF Debt Yield(6) | 7.1% | 9.7% | 9.8% | 9.5% | |||||||
| (1) | 2014 cash flows are not available for the entire Griffin Portfolio Properties and 2015 includes partial year cash flow for the Restoration Hardware Distribution property, which has a single tenant lease that commenced in August 2015, and does not include any cash flow for the Royal Ridge V property, which has a single tenant lease that commenced in December 2015. |
| (2) | UW Base Rent is based on the underwritten rent roll with rent steps taken through October 2018 of $827,523 and straightlined rent for all investment grade rated tenants equal to $1,589,396. |
| (3) | All leases are triple net except for the NEC and CHRISTUS Health leases which are full service gross plus electric. |
| (4) | Other Income includes license agreements, administrative fees and other miscellaneous income. |
| (5) | The State Farm Regional HQ property is currently subject to a revenue bond lease structure whereby the State Farm Regional HQ property benefits from a property tax abatement. The UW Total Operating Expenses include estimated full (unabated) taxes. |
| (6) | Debt service coverage ratios and debt yields are based on the Griffin Portfolio Whole Loan. |
Escrows and Reserves. The Griffin Portfolio Borrowers deposited at loan origination $930,000 to a tax reserve and are required to deposit monthly 1/12th of the estimated annual property taxes (initially $466,667) and 1/12th of the estimated annual insurance premiums (unless the Griffin Portfolio Properties are covered by an acceptable blanket policy). Additionally, the Griffin Portfolio Borrowers deposited at loan origination $1,273,019 for tenant improvements at the Comcast Regional HQ property and Royal Ridge V property, $730,512 in free rent relating to the Comcast Regional HQ property, Duke Bridges I property and Corporate Campus at Norterra property, and $3,653,980 for remaining tenant improvements at the Duke Bridges I property.
Upon the occurrence of a Debt Yield Sweep Period (as defined below), the Griffin Portfolio Borrowers are required to deposit to a replacement reserve (i) 1/12th of $0.10per annum PSF of industrial space and 1/12th of $0.20per annum PSF of office space, capped at two years’ worth of such deposits,provided that at any time the reserve balance falls below the cap or an event of default exists, the Griffin Portfolio Borrowers are required to resume monthly deposits to the replacement reserve until the cap is reached or exceeded or until the event of default ceases to exist, as applicable.
Additionally, beginning on October 1, 2022, the Griffin Portfolio Borrowers are required to deposit into the replacement reserve (i) 1/12thof $0.10per annum PSF of industrial space and 1/12th of $0.20per annum PSF of office space, capped at one years’ worth of such deposits,provided that at any time the reserve balance falls below the cap or an event of default exists, the Griffin Portfolio Borrowers are required to resume monthly deposits to the replacement reserve until the cap is reached or exceeded or until the event of default ceases to exist, as applicable.
Upon the occurrence of a Debt Yield Sweep Period (as defined below), the Griffin Portfolio Borrowers are required to deposit to a tenant improvement and leasing commissions reserve (i) 1/12th of $0.50per annum PSF of industrial space and 1/12thof $1.00per annum PSF of office space, capped at two years’ worth of such deposits,provided that at any time the reserve balance falls below the cap or an event of default exists, the Griffin Portfolio Borrowers are required to resume monthly deposits to the tenant improvement and leasing commissions reserve until the cap is reached or exceeded or until the event of default ceases to exist, as applicable.
Additionally, beginning on October 1, 2022, the Griffin Portfolio Borrowers are required to deposit into the tenant improvement and leasing commissions reserve (i) 1/12th of $0.50per annum PSF of industrial space and 1/12th of $1.00per annum PSF of office space, capped at one years’ worth of such deposits,provided that at any time the reserve balance falls below the cap or an event of default exists, the Griffin Portfolio Borrowers are required to resume monthly deposits to the tenant improvement and leasing commissions reserve until the cap is reached or exceeded or until the event of default ceases to exist.
A “Debt Yield Sweep Period” will commence upon the debt yield being less than 7.5% in a calendar quarter, and end upon the debt yield being equal to or greater than 7.5% in a calendar quarter.
Lockbox and Cash Management. A hard lockbox is in place with respect to the Griffin Portfolio Whole Loan, with springing cash management upon the occurrence of a Cash Sweep Period (as defined below). During the continuance of a Cash Sweep Period, all funds in the lockbox account are required to be swept each business day to a lender-controlled cash management account and disbursed in accordance with the Griffin Portfolio Whole Loan documents. All excess cash flow will be required to be held as additional security for the Griffin Portfolio Whole Loan until discontinuance of the Cash Sweep Period. If a Cash Sweep Period is cured by either a State Farm Cash Trap Cap Cure (as defined below) or a Restoration Hardware Cash Trap Cap Cure (as defined below), the excess cash is required to be held by the lender and not disbursed to the Griffin Portfolio Borrowers until the State Farm Cure Conditions (as defined below) or the Restoration Hardware Cure Conditions (as defined below) are satisfied.
This is not a research report and was not prepared by any Underwriter’s research departments. Please see additional important information and qualifications at the end of this Term Sheet. |
| T-41 |
| BANK 2017-BNK9 | Griffin Portfolio |
A “Cash Sweep Period” means any of (a) a Debt Yield Sweep Period, (b) a Restoration Hardware Sweep Period (as defined below), (c) a State Farm Sweep Period (as defined below), (d) a T-Mobile Sweep Period (as defined below) or (e) any period of time during which an event of default is continuing. A Cash Sweep Period will continue if any of the Cash Sweep Period triggers remain.
A “Restoration Hardware Sweep Period” will commence on the first to occur of (i) Restoration Hardware being in monetary default under its lease beyond notice and cure periods, (ii) Restoration Hardware terminating its lease, vacating or going dark in 50% or more of its space, or giving notice that it intends to terminate, vacate or go dark in 50% or more of its space, (iii) any termination or cancellation of the Restoration Hardware lease (including rejection in any insolvency proceeding) and/or the Restoration Hardware lease failing to otherwise be in full force and effect, (iv) any bankruptcy or similar insolvency of Restoration Hardware or its assets and (v) Restoration Hardware failing to extend or renew its lease on or prior the deadline provided under the applicable lease or if no such date exits, the date 12 months prior to lease expiration.A Restoration Hardware Sweep Period will end on the first to occur of (1) the lender’s receipt of the satisfaction of the Restoration Hardware Cure Conditions (as defined below) or (2) in the event the Restoration Hardware Sweep Period exists solely pursuant to clauses (ii) or (v) above, at least 85% of the Restoration Hardware space being re-leased to an acceptable replacement tenant who is in physical occupancy of the space, open to the public and paying full rent. Notwithstanding the foregoing, a Restoration Hardware Sweep Period will be deemed to have been cured at such time as $6.00 PSF for the Restoration Hardware space is on deposit in the excess cash reserve (a “Restoration Hardware Cash Trap Cap Cure”).
“Restoration Hardware Cure Conditions” means as applicable (i) Restoration Hardware has cured all defaults under its lease, (ii) Restoration Hardware has revoked all termination or cancellation notices and has re-affirmed its lease, (iii) if triggered by (v) above, Restoration Hardware has renewed or extended its lease, (iv) Restoration Hardware and its assets are no longer insolvent or subject to any bankruptcy proceedings and Restoration Hardware has affirmed its lease pursuant to final, non-appealable order of a court and (v) Restoration Hardware is paying full, unabated rent (or if rent is abated, the Griffin Portfolio Borrowers have deposited such amount into a reserve with the lender).
A “State Farm Sweep Period” means the earliest to occur of (i) State Farm being in monetary default under either of its leases beyond notice and cure periods, (ii) State Farm terminating either of its leases, vacating or going dark in 50% or more of its space, or giving notice that it intends to terminate either of its leases or vacate or go dark in 50% or more of its space, (iii) any termination or cancellation of either State Farm lease (including rejection in any insolvency proceeding) and/or either State Farm lease failing to otherwise be in full force and effect, (iv) any bankruptcy or similar insolvency of State Farm or its assets and (v) State Farm failing to extend or renew either lease on or prior to the deadlines pursuant to its leases. A State Farm Sweep Period will expire upon the lender’s receipt of (1) the satisfaction of the State Farm Cure Conditions (as defined below) or (2) in the event the State Farm Sweep Period exists solely pursuant to clauses (ii) or (v) described above, at least 85% of the State Farm space being re-leased to an acceptable replacement tenant, who is in physical occupancy of the space, open to the public for business and paying full rent. Notwithstanding the foregoing, a State Farm Sweep Period will be deemed to have been cured at such time as $35.00 PSF for the State Farm space is on deposit in the excess cash reserve (a “State Farm Cash Trap Cap Cure”).
“State Farm Cure Conditions” means as applicable (i) State Farm has cured all defaults under each lease, (ii) State Farm has revoked all termination or cancellation notices and has re-affirmed each lease, (iii) if triggered by (v) above, State Farm has renewed or extended its lease(s), (iv) State Farm and its assets are no longer insolvent or subject to any bankruptcy proceedings and has affirmed the lease(s) pursuant to a final, non-appealable order of a court and (v) State Farm is paying full, unabated rent under each lease (or if rent is abated, the Griffin Portfolio Borrowers have deposited such amount into a reserve with the lender).
A “T-Mobile Sweep Period” will occur upon T-Mobile exercising its right pursuant to its lease to require the Griffin Portfolio Borrowers to construct the T-Mobile parking structure and will end when sufficient funds have been deposited with the lender to complete the construction of the T-Mobile parking structure.
Additional Secured Indebtedness (not including trade debts). The Griffin Portfolio Properties also secure the Griffin PortfolioPari Passu Companion Loans, which have an aggregate Cut-off Date principal balance of $278,750,000. The Griffin PortfolioPari Passu Companion Loans accrue interest at the same rate as the Griffin Portfolio Mortgage Loan. The Griffin Portfolio Mortgage Loan is entitled to payments of interest on a pro rata and pari passu basis with the Griffin PortfolioPari Passu Companion Loans. The holders of the Griffin Portfolio Mortgage Loan and the Griffin PortfolioPari Passu Companion Loans have entered into a co-lender agreement which sets forth the allocation of collections on the Griffin Portfolio Whole Loan. See “Description of the Mortgage Pool—The Whole Loans” in the Preliminary Prospectus.
Mezzanine Loan and Preferred Equity. Not permitted.
Release of Property. After October 31, 2019, the Griffin Portfolio Borrowers may obtain the release of one or more individual properties in connection with an arms-length saleprovided that among other conditions (i) no event of default is continuing, (ii) the lender receives payment of a release price equal to 110% of the allocated loan amount for the release property plus payment of any applicable yield maintenance premium, (iii) the debt yield after the individual property release is not less than the greater of (a) 8.9% and (b) the debt yield immediately prior to such release, and (iv) the loan to value ratio after the individual property release is equal to or less than 125% provided the outstanding principal balance of the Griffin Portfolio Whole Loan may be paid down in order to meet the required loan to value ratio.
Notwithstanding the foregoing, if a tenant has vacated, cancelled its lease, given notice to terminate or terminated its lease, or an event of default has occurred with respect to an individual property such that a material adverse effect should result, such individual property may be released without the requirement of an arms-length saleprovided that, among other conditions, (i) the lender receives payment of a release price equal to 120% of the allocated loan amount for the applicable individual property and (ii) the aggregate allocated loan amounts for all released properties during the term of the Griffin Portfolio Whole Loan must not exceed $84,375,000.
Substitution of Property.Following the earlier of (a) the closing date of the securitization that includes the last note to be securitized and (b) September 29, 2019, the Griffin Portfolio Borrowers may substitute one or more individual properties with a replacement property that is a similar Class A office or industrial property provided no event of default is continuing andprovided furtherthat among other conditions, (i) the replaced property has less than two years remaining on the term of the lease encumbering the property or the substitution of the property is curing a Cash Sweep Period, (ii) the aggregated allocated loan amounts for all replaced properties during the term of the Griffin Portfolio Whole Loan must not exceed $84,375,000, (iii) the replacement property has net operating income equal to or greater than the net operating income of the replaced property immediately prior to the substitution, (iv) the replacement property is owned in fee, (v) the replacement property has an average remaining lease term of no less than five years and is leased to a tenant with credit (or whose guarantor has credit) that is better than or equal to the tenant leasing the replaced property, (vi) the replacement property is located in a top ten metropolitan statistical area or a metropolitan statistical area equal to or greater than that in which the replaced property is located,
This is not a research report and was not prepared by any Underwriter’s research departments. Please see additional important information and qualifications at the end of this Term Sheet. |
| T-42 |
| BANK 2017-BNK9 | Griffin Portfolio |
(vii) the lender has received rating agency confirmation, (viii) any tenant at a remaining property will not have the right to lease space at the replacement property and (ix) satisfaction of customary REMIC requirements.
Terrorism Insurance.The Griffin Portfolio Borrowers are required to obtain and maintain property insurance that covers perils of terrorism and acts of terrorism in an amount equal to the full replacement cost of the Griffin Portfolio Properties and business interruption insurance for 24 months with a 12 month extended period of indemnity,provided if the Terrorism Risk Insurance Program Reauthorization Act of 2007 or subsequent statute is not in effect, the Griffin Portfolio Borrowers will not be required to pay annual premiums in excess of two times the premium for a separate policy insuring only the Griffin Portfolio Properties on a stand-alone basis. See “Risk Factors—Risks Relating to the Mortgage Loans—Terrorism Insurance May Not Be Available for All Mortgaged Properties” in the Preliminary Prospectus.
This is not a research report and was not prepared by any Underwriter’s research departments. Please see additional important information and qualifications at the end of this Term Sheet. |
| T-43 |
| BANK 2017-BNK9 | Laguna Cliffs Marriott |
Mortgage Loan No. 3 – Laguna Cliffs Marriott
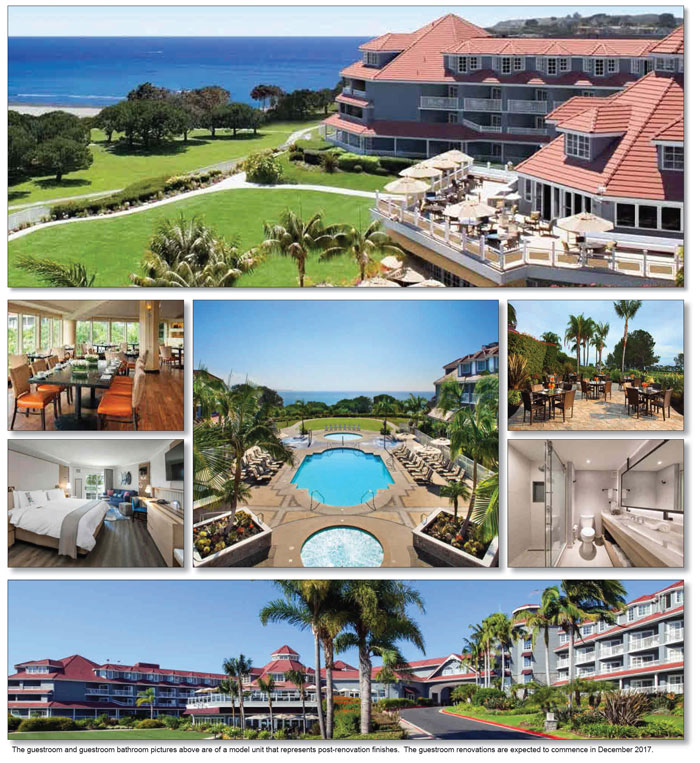
This is not a research report and was not prepared by any Underwriter’s research departments. Please see additional important information and qualifications at the end of this Term Sheet. |
| T-44 |
| BANK 2017-BNK9 | Laguna Cliffs Marriott |
Mortgage Loan No. 3 – Laguna Cliffs Marriott
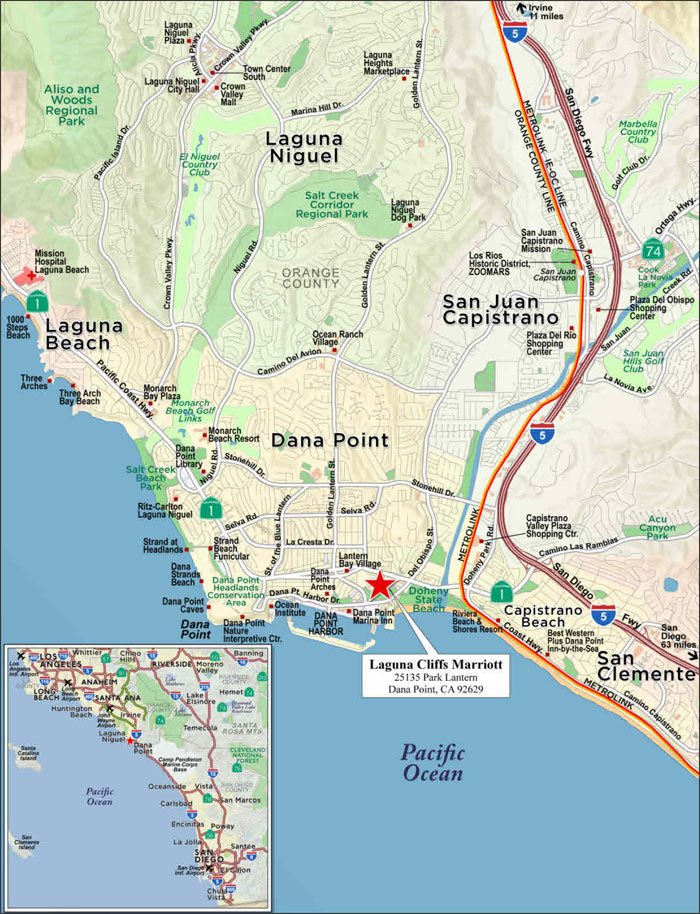
This is not a research report and was not prepared by any Underwriter’s research departments. Please see additional important information and qualifications at the end of this Term Sheet. |
| T-45 |
| BANK 2017-BNK9 | Laguna Cliffs Marriott |
| Mortgage Loan No. 3 – Laguna Cliffs Marriott |
| Mortgage Loan Information | Property Information | |||||
| Mortgage Loan Seller: | WFB | Single Asset/Portfolio: | Single Asset | |||
| Original Balance(1): | $85,000,000 | Location: | Dana Point, CA 92629 | |||
| Cut-off Date Balance(1): | $85,000,000 | General Property Type: | Hospitality | |||
| % of Initial Pool Balance: | 8.1% | Detailed Property Type: | Full Service | |||
| Loan Purpose: | Refinance | Title Vesting: | Fee | |||
| Sponsor: | The Regents of The University of California | Year Built/Renovated: | 1987/2008, 2010 | |||
| Mortgage Rate: | 4.3400% | Size: | 378 Rooms | |||
| Note Date: | 11/17/2017 | Cut-off Date Balance per Room(1): | $291,005 | |||
| First Payment Date: | 1/11/2018 | Maturity Date Balance per Room(1): | $291,005 | |||
| Final Maturity Date: | 12/11/2027 | Property Manager: | Interstate Management Company LLC | |||
| Original Term to Maturity: | 120 months | |||||
| Original Amortization Term: | 0 months | Underwriting and Financial Information | ||||
| IO Period: | 120 months | UW NOI: | $13,569,611 | |||
| Seasoning: | 0 months | UW NOI Debt Yield(1): | 12.3% | |||
| Prepayment Provisions(2): | LO (24); YM1 (91); O (5) | UW NOI Debt Yield at Maturity(1): | 12.3% | |||
| Lockbox/Cash Mgmt Status: | Hard/Springing | UW NCF DSCR(1): | 2.31x | |||
| Additional Debt Type(3): | Pari Passu | Most Recent NOI: | $13,061,454 (9/30/2017 TTM) | |||
| Additional Debt Balance(3): | $25,000,000 | 2nd Most Recent NOI: | $12,562,478 (12/31/2016) | |||
| Future Debt Permitted (Type)(3): | Yes (Mezzanine) | 3rd Most Recent NOI: | $12,074,091 (12/31/2015) | |||
| Reserves(4) | Most Recent Occupancy: | 76.2% (9/30/2017) | ||||
| Type | Initial | Monthly | Cap | 2nd Most Recent Occupancy: | 74.4% (12/31/2016) | |
| RE Tax: | $0 | Springing | N/A | 3rd Most Recent Occupancy: | 74.4% (12/31/2015) | |
| Insurance: | $0 | Springing | N/A | Appraised Value (as of)(5): | $224,000,000 (10/25/2017) | |
| FF&E Reserve: | $0 | (4) | N/A | Cut-off Date LTV Ratio(1)(5): | 49.1% | |
| PIP Reserve: | $13,520,759 | $0 | N/A | Maturity Date LTV Ratio(1)(5): | 49.1% | |
| Sources and Uses | ||||||
| Sources | Proceeds | % of Total | Uses | Proceeds | % of Total | |
| Loan Amount: | $110,000,000 | 100% | Loan Payoff: | $89,615,334 | 81.5% | |
| PIP Reserve(6): | $13,520,759 | 12.3% | ||||
| Return of Equity: | $4,872,812 | 4.4% | ||||
| Closing Costs: | $1,991,094 | 1.8% | ||||
| Total Sources: | $110,000,000 | 100% | Total Uses: | $110,000,000 | 100.0% | |
| (1) | The Laguna Cliffs Marriott Mortgage Loan is part of the Laguna Cliffs Marriott Whole Loan, which is comprised of twopari passu notes with an aggregate original principal balance of $110,000,000. The Cut-off Date Balance per Room, Maturity Date Balance per Room, UW NOI Debt Yield, UW NOI Debt Yield at Maturity, UW NCF DSCR, Cut-off Date LTV Ratio and Maturity Date LTV Ratio numbers presented are based on the Laguna Cliffs Marriott Whole Loan. |
| (2) | Yield Maintenance is not required for any prepayment made in order to cure a debt service coverage ratio based cash management trigger (See “Lockbox and Cash Management”below). |
| (3) | See “The Mortgage Loan”, and “Additional Secured Indebtedness (not including trade debts)” and “Mezzanine Loan and Preferred Equity” for a discussion of the additional debt. |
| (4) | See “Escrows and Reserves” below for further discussion of reserve requirements. |
| (5) | The LTV shown is based on the appraiser’s Hypothetical Value Upon Completion, which assumes certain outstanding PIP work has been completed. The related PIP work was reserved for upon the origination of the Laguna Cliffs Property Whole Loan (see “Escrows and Reserves” below). Based on the as-is appraised value of $197,700,000 (as of October 25, 2017), the Cut-off Date LTV Ratio is approximately 55.6%. |
| (6) | The total estimated cost of the PIP is approximately $18.5 million; however, the borrower has already incurred approximately $5.1 million in costs. |
The Mortgage Loan. The third largest mortgage loan (the “Laguna Cliffs Marriott Mortgage Loan”) is part of a whole loan (the “Laguna Cliffs Marriott Whole Loan”) evidenced by twopari passupromissory notes in the aggregate original principal amount of $110,000,000 which are secured by a first priority fee mortgage encumbering a full service hospitality property located in Dana Point, California (the “Laguna Cliffs Marriott Property”). Promissory Note A-1 in the original principal amount of $85,000,000 represents the Laguna Cliffs Marriott Mortgage Loan and will be included in the BANK 2017-BNK9 securitization trust. Promissory Note A-2 in the original principal amount of $25,000,000 (the “Laguna Cliffs Marriott ServicedPari Passu Companion Loan”), is expected to be contributed to a future securitization. The Laguna Cliffs Marriott Mortgage Loan will be serviced pursuant to the pooling and servicing agreement for the BANK 2017-BNK9 securitization trust. See “Description of the Mortgage Pool—The Whole Loans— The Serviced Pari Passu Whole Loans”and“Pooling and Servicing Agreement” in the Preliminary Prospectus. The proceeds of the Laguna Cliffs Marriott Whole Loan were primarily used to refinance existing debt on the Laguna Cliffs Marriott Property, pay closing costs and fund capital improvements.
The Borrower and the Sponsor. The borrower is Regency Laguna L.P. (the “Laguna Cliffs Marriott Borrower”), a single-purpose Delaware limited partnership structured to be bankruptcy-remote, with two independent directors. The sponsor and the nonrecourse carve-out guarantor of the Laguna Cliffs Marriott Whole Loan is The Regents of the University of California.
This is not a research report and was not prepared by any Underwriter’s research departments. Please see additional important information and qualifications at the end of this Term Sheet. |
| T-46 |
| BANK 2017-BNK9 | Laguna Cliffs Marriott |
The Regents of the University of California is the governing board of the University of California system. As of June 2016, The Regents of the University of California had an estimated net worth of approximately $9.5 billion, estimated liquid assets of $266.6 million, total assets of $65.2 billion and total liabilities of $55.7 billion. As of June 2016, the University of California and the University of California Retirement System invested approximately $937.4 million and $3.0 billion in real estate comingled funds, respectively.
The Property. The Laguna Cliffs Marriott Property, known as the Marriott Laguna Cliffs Resort & Spa Dana Point, consists of a 378-room full-service resort hotel located atop a cliff overlooking the Pacific Ocean and Dana Point Harbor in Dana Point, California. The Laguna Cliffs Marriott Property comprises one expansive four-story building connected by a series of walkways that features Victorian-style architecture with red gabled roofs. The Laguna Cliffs Marriott Property is situated adjacent to Lantern Bay Park, Doheny Beach and Dana Point Harbor and offers ocean views from the majority of guestrooms. The Laguna Cliffs Marriott Property is one of only two Marriott hotels located directly along the coast in Orange County.
The Laguna Cliffs Marriott Property contains 198 king guestrooms, 164 double guestrooms, 11 one-bedroom suites, 4 studio suites and 1 king suite. Since 2004, the property has undergone various upgrades and renovations, including the construction of the 14,000 SF spa and 30 additional guestrooms in 2004, and an approximately $21.0 million ($55,555/key) renovation in 2008. This 2008 renovation included upgrades to the guestrooms, meeting space and swimming pool facilities. An additional $18.5 million property improvement plan (“PIP”) ($48,942/key) is expected to include a complete renovation of guestrooms, guestroom bathrooms and corridors, as well as the refurbishment of the meeting space and restaurants. Minor work has begun on the Laguna Cliffs Marriott Property with room renovations expected to begin in December 2017 with completion planned for May 2018.
The Laguna Cliffs Marriott Property offers two full-service restaurants, two outdoor swimming pools with whirlpools and a splash playground, fitness center, on-site rental station for bicycles, boogie boards and surfboards, full-service spa, tennis court, children’s center, and a car-rental service. The spa at the Laguna Cliffs Marriott Property features men’s & women’s saunas and steam rooms, indoor whirlpool, relaxation area and a hair salon. The Laguna Cliffs Marriott Property contains approximately 18,654 SF of indoor meeting space plus 18,500 SF of outdoor meeting space. The Laguna Cliffs Marriott Property includes a 462-space valet garage (1.2 spaces per key). According to the appraisal, the Laguna Cliffs Marriott Property generates approximately 60% of its room revenue from transient demand and 40% from meeting and group demand. The hotel franchise agreement with Marriott International, Inc. expires on April 17, 2020.
More specific information about the Laguna Cliffs Marriott Property and the related competitive set is set forth in the following table:
| Historical Occupancy, ADR, RevPAR | |||||||||
Competitive Set(1) | The Laguna Cliffs Marriott Property | Penetration Factor | |||||||
| Year | Occupancy | ADR | RevPAR | Occupancy | ADR | RevPAR | Occupancy | ADR | RevPAR |
| 9/30/2015 TTM | 79.5% | $210.65 | $167.49 | 74.8% | $213.36 | $159.62 | 94.1% | 101.3% | 95.3% |
| 9/30/2016 TTM | 78.8% | $216.83 | $170.83 | 72.5% | $211.54 | $153.34 | 92.0% | 97.6% | 89.8% |
| 9/30/2017 TTM | 79.8% | $221.19 | $176.48 | 76.2% | $223.02 | $169.91 | 95.5% | 100.8% | 96.3% |
Source:Industry Report.
| (1) | The competitive set includes Marriott Newport Beach Hotel and Spa, Hyatt Regency Newport Beach, Rancho Bernardo Inn, Hilton La Jolla Torrey Pines, Hilton Huntington Beach Waterfront Resort, Balboa Bay Resort, and Hyatt Regency Huntington Beach and Spa. |
The Market. The Laguna Cliffs Marriott Property is located in Dana Point, California, just west of the Pacific Coast Highway. The Laguna Cliffs Marriott Property is located approximately 65 miles north of San Diego, 59 miles south of Los Angeles, and 25 miles south of Orange County and the John Wayne Airport. According to the appraisal, Dana Point is one of Southern California’s iconic coastal destinations and is bordered by the cities of Laguna Niguel and Laguna Beach to the north, San Juan Capistrano to the east, and San Clemente to the south.
Dana Point, California is well known for its beaches and modern 2500-slip yacht harbor, located 0.4 miles southwest of the Laguna Cliffs Marriott Property. Since 1972, the Dana Point Harbor has hosted the annual Festival of Whales that attracts approximately 100,000 visitors over two weekends each December. The Dana Point Harbor is expected to undergo a $200 million redevelopment via a private-public partnership. The project is expected to include more than 116,000 SF of commercial retail space, including restaurant and outdoor dining, retail and market hall/food court, marine related retail, office space and a surfing museum. Construction on street improvements began in July 2017, and the remainder of the project is expected to commence in January 2018 with construction scheduled for December 2018 to December 2025.
Dana Point offers year-round outdoor recreation opportunities, such as Doheny State Beach, one of California’s most popular beach facilities with over two million visitors per year, located approximately 0.4 miles southeast of the Laguna Cliffs Marriott Property. Doheny State Beach comprises 62 acres of open space and offers camping, picnicking, swimming, surfing, bicycling, whale watching, and tide pool exploration. Other beaches in Dana Point include Salt Creek Beach, Monarch Beach, Dana Strands Beach, Baby Beach, Poche Beach and Capistrano County Beach, all of which are within 3.2 miles of the Laguna Cliffs Marriott Property. According to a third party market report, the estimated 2017 population within a three- and five-mile radius of the Laguna Cliffs Marriott Property was 66,580 and 151,000, respectively. The average household income within the same radii was $136,567 and $140,958, respectively.
This is not a research report and was not prepared by any Underwriter’s research departments. Please see additional important information and qualifications at the end of this Term Sheet. |
| T-47 |
| BANK 2017-BNK9 | Laguna Cliffs Marriott |
Primary competitive properties to the Laguna Cliffs Marriott Property are shown in the table below:
| Competitive Property Summary | ||||||
| Property Name | No. of Rooms | Transient Demand | Meeting & Group Demand | 2016 Occupancy | 2016 ADR | 2016 RevPAR |
| Laguna Cliffs Marriott Property | 378 | 60% | 40% | 74.6% | $213.13 | $158.96 |
| Marriott Newport Beach Hotel and Spa | 532 | 60% | 40% | 75-80% | $200-210 | $150-160 |
| Hilton Waterfront Beach Resort | 285 | 60% | 40% | 70-75% | $240-250 | $180-190 |
| Hyatt Regency Huntington Beach Resort | 517 | 50% | 50% | 80-85% | $260-270 | $210-220 |
| Hyatt Regency Newport Beach | 407 | 60% | 40% | 80-85% | $170-180 | $140-150 |
| Total/Wtd. Avg. | 2,119 | 57% | 43% | 79.1% | $217.75 | $172.26 |
Source:Appraisal.
Operating History and Underwritten Net Cash Flow. The following table presents certain information relating to the historical operating performance and the Underwritten Net Cash Flow at the Laguna Cliffs Marriott Property:
| Cash Flow Analysis | ||||||
| 2014 | 2015 | 2016 | 9/30/2017 TTM | UW | UW per Room | |
| Occupancy | 76.8% | 74.4% | 74.4% | 76.2% | 76.2% | |
| ADR | $197.05 | $215.08 | $213.13 | $223.02 | $227.00 | |
| RevPAR | $151.34 | $160.00 | $158.53 | $169.91 | $172.95 | |
| Rooms Revenue | $20,880,415 | $22,074,831 | $21,931,962 | $23,442,914 | $23,861,275 | $63,125 |
| Food & Beverage | $16,516,136 | $17,439,933 | $17,253,690 | $18,232,507 | $18,232,507 | $48,234 |
| Other Income(1) | $4,771,179 | $5,072,434 | $5,444,253 | $5,810,756 | $5,810,756 | $15,372 |
| Total Revenue | $42,167,730 | $44,587,198 | $44,629,905 | $47,486,177 | $47,904,538 | $126,732 |
| Total Expenses | $30,484,280 | $32,513,107 | $32,067,427 | $34,424,723 | $34,334,926 | $90,833 |
| Net Operating Income | $11,683,450 | $12,074,091 | $12,562,478 | $13,061,454 | $13,569,611 | $35,898 |
| FF&E | $0 | $0 | $0 | $0 | $2,395,227 | $6,337 |
| Net Cash Flow | $11,683,450 | $12,074,091 | $12,562,478 | $13,061,454 | $11,174,385 | $29,562 |
| NOI DSCR(2) | 2.41x | 2.49x | 2.60x | 2.70x | 2.80x | |
| NCF DSCR(2) | 2.41x | 2.49x | 2.60x | 2.70x | 2.31x | |
| NOI Debt Yield(2) | 10.6% | 11.0% | 11.4% | 11.9% | 12.3% | |
| NCF Debt Yield(2) | 10.6% | 11.0% | 11.4% | 11.9% | 10.2% | |
| (1) | Other Income consists of parking, spa and health club income, resort fees, and miscellaneous income. |
| (2) | Calculated based on the Laguna Cliffs Marriott Whole Loan. |
Escrows and Reserves. At origination, the Laguna Cliffs Marriott Borrower deposited $13,520,759 ($35,769/room) for a PIP. The total estimated cost of the PIP is approximately $18.5 million; however, the borrower has already incurred approximately $5.1 million in costs.
The Laguna Cliffs Marriott Whole Loan documents do not require ongoing monthly escrows for taxes or insurance premiums as long as (i) no Cash Trap Event Period (see “Lockbox and Cash Management” below) has occurred and is continuing; (ii) with respect to taxes, the Laguna Cliffs Marriott Borrower provides the lender with evidence that the Laguna Cliffs Marriott Property taxes have been paid; and (iii) with respect to insurance premiums, the Laguna Cliffs Marriott Borrower provides the lender with evidence that the Laguna Cliffs Marriott Property is insured via an acceptable blanket policy and such policy is in full force and effect.
The Laguna Cliffs Marriott Borrower is required to make monthly deposits into the FF&E reserve of $197,783 for the first month and thereafter an amount equal to 1/12 of 5% of the operating income of the preceding calendar year.
This is not a research report and was not prepared by any Underwriter’s research departments. Please see additional important information and qualifications at the end of this Term Sheet. |
| T-48 |
| BANK 2017-BNK9 | Laguna Cliffs Marriott |
Lockbox and Cash Management. A hard lockbox is in place with respect to the Laguna Cliffs Marriott Whole Loan, with springing cash management upon the occurrence of a Cash Trap Event Period (as defined below). During a Cash Trap Event Period, all excess cash flow is required to be held in the excess cash flow sub account as additional security for the Laguna Cliffs Marriott Whole Loan.
A “Cash Trap Event Period” will commence upon the earlier of:
| (i) | the occurrence of an event of default; or |
| (ii) | the debt service coverage ratio (including any applicable mezzanine debt (see “Mezzanine Loan and Preferred Equity” below), and based on a hypothetical 30-year amortization period) being less than 1.20x at the end of any calendar quarter; provided, however, that the Laguna Cliffs Marriott Borrower may make a voluntary prepayment without yield maintenance or prepayment premium in an amount sufficient to reduce the outstanding principal balance of the Laguna Cliffs Marriott Loan to prevent such debt service coverage ratio trigger. |
A Cash Trap Event Period will end:
with regard to clause (i), upon the cure of such event of default; or
with regard to clause (ii), upon the debt service coverage ratio being at least 1.20x for two consecutive calendar quarters.
Additional Secured Indebtedness (not including trade debts).The Laguna Cliffs Marriott Property also secures the Laguna Cliffs Marriott ServicedPari Passu Companion Loan, which has an aggregate Cut-off Date principal balance of $25,000,000. The Laguna Cliffs Marriott ServicedPari Passu Companion Loan accrues interest at the same rate as the Laguna Cliffs Marriott Mortgage Loan. The Laguna Cliffs Marriott Mortgage Loan is entitled to payments of principal and interest on apro rata andpari passubasis with the Laguna Cliffs Marriott ServicedPari Passu Companion Loan. The holders of the Laguna Cliffs Marriott Mortgage Loan and the Laguna Cliffs Marriott ServicedPari Passu Companion Loan have entered into a co-lender agreement which sets forth the allocation of collections on the Laguna Cliffs Marriott Whole Loan. See “Description of the Mortgage Pool—The Whole Loans— The Serviced Pari Passu Whole Loans” in the Preliminary Prospectus.
Mezzanine Loan and Preferred Equity.In connection with a sale of the Laguna Cliffs Marriott Property and assumption of the Laguna Cliffs Marriott Whole Loan by the purchaser, certain direct and indirect owners of the Laguna Cliffs Marriott Borrowers are permitted to obtain a mezzanine loan secured by the direct or indirect ownership interests in the Laguna Cliffs Marriott Borrowers upon satisfaction of certain terms and conditions including, among others, (i) no event of default has occurred and is continuing, (ii) the combined loan-to-value ratio does not exceed the loan-to-value at the origination of the Laguna Cliffs Marriott Whole Loan, (iii) the combined debt service coverage ratio is not less than the debt service coverage ratio at the origination of the Laguna Cliffs Marriott Whole Loan, (iv) the combined debt yield is not less than the debt yield at the origination of the Laguna Cliffs Marriott Whole Loan, (v) the mezzanine loan must be a fixed rate loan and must be coterminous with Laguna Cliffs Marriott Whole Loan or freely prepayable without any premium or penalty from and after the maturity date of the Laguna Cliffs Marriott Mortgage Loan, (vi) the mortgage and mezzanine lenders enter into an intercreditor agreement and (vii) delivery of rating agency confirmation.
Release of Property. Not permitted.
Right of First Refusal.Marriott International, Inc. has a right of first refusal (“ROFR”) to acquire the Laguna Cliffs Marriott Property if there is a transfer of the hotel or the controlling direct or indirect interest in the Laguna Cliffs Marriott Borrower to a Competitor (as defined in the loan documents). The ROFR is not extinguished by a foreclosure or deed-in-lieu thereof, and if the transfer to a Competitor is by foreclosure, or if the franchisee or its affiliates become a Competitor, the franchisor has the right to purchase the Laguna Cliffs Marriott Property upon notice to the franchisee.
Terrorism Insurance.The Laguna Cliffs Marriott Whole Loan documents require that the “all risk” insurance policy required to be maintained by the Laguna Cliffs Marriott Borrower provide coverage for terrorism in an amount equal to the full replacement cost of the Laguna Cliffs Marriott Property (provided that the Laguna Cliffs Marriott Borrower is not required to pay terrorism insurance premiums in excess of two times the premium for all risk and business interruption coverage if the Terrorism Risk Insurance Program Reauthorization Act is no longer in effect). The loan documents also require business interruption insurance covering no less than the 24-month period following the occurrence of a casualty event, together with a six-month extended period of indemnity. See “Risk Factors—Risks Relating to the Mortgage Loans—Terrorism Insurance May Not Be Available for All Mortgaged Properties” in the Preliminary Prospectus.
This is not a research report and was not prepared by any Underwriter’s research departments. Please see additional important information and qualifications at the end of this Term Sheet. |
| T-49 |
| BANK 2017-BNK9 | Marriott at Legacy Town Center |
Mortgage Loan No. 4 – Marriott at Legacy Town Center

This is not a research report and was not prepared by any Underwriter’s research departments. Please see additional important information and qualifications at the end of this Term Sheet. |
| T-50 |
| BANK 2017-BNK9 | Marriott at Legacy Town Center |
Mortgage Loan No. 4 – Marriott at Legacy Town Center

This is not a research report and was not prepared by any Underwriter’s research departments. Please see additional important information and qualifications at the end of this Term Sheet. |
| T-51 |
| BANK 2017-BNK9 | Marriott at Legacy Town Center |
| Mortgage Loan No. 4 – Marriott at Legacy Town Center |
| Mortgage Loan Information | Property Information | ||||||
| Mortgage Loan Seller: | MSMCH | Single Asset/Portfolio: | Single Asset | ||||
| Original Balance: | $79,800,000 | Location: | Plano, TX 75024 | ||||
| Cut-off Date Balance: | $79,800,000 | General Property Type: | Hospitality | ||||
| % of Initial Pool Balance: | 7.6% | Detailed Property Type: | Full Service | ||||
| Loan Purpose: | Acquisition | Title Vesting: | Fee | ||||
| Sponsor: | Roch Capital Inc. | Year Built/Renovated: | 2001/2014 | ||||
| Mortgage Rate: | 4.2100% | Size: | 404 Rooms | ||||
| Note Date: | 11/1/2017 | Cut-off Date Balance per Room: | $197,525 | ||||
| First Payment Date: | 12/1/2017 | Maturity Date Balance per Room: | $167,733 | ||||
| Maturity Date: | 11/1/2027 | Property Manager: | Marriott Hotel Services, Inc. | ||||
| Original Term to Maturity: | 120 months | ||||||
| Original Amortization Term: | 360 months | Underwriting and Financial Information | |||||
| IO Period: | 24 months | UW NOI: | $11,572,877 | ||||
| Seasoning: | 1 month | UW NOI Debt Yield: | 14.5% | ||||
| Prepayment Provisions: | LO (25); DEF (90); O (5) | UW NOI Debt Yield at Maturity: | 17.1% | ||||
| Lockbox/Cash Mgmt Status: | Soft/Springing | UW NCF DSCR: | 2.93x (IO) 2.13x (P&I) | ||||
| Additional Debt Type: | N/A | Most Recent NOI: | $11,328,500 (8/31/2017 TTM) | ||||
| Additional Debt Balance: | N/A | 2nd Most Recent NOI: | $10,986,670 (12/31/2016) | ||||
| Future Debt Permitted (Type)(1): | Yes (Mezzanine) | 3rd Most Recent NOI: | $11,230,788 (12/31/2015) | ||||
| Reserves(2) | Most Recent Occupancy: | 72.0% (8/31/2017) | |||||
| Type | Initial | Monthly | Cap | 2nd Most Recent Occupancy: | 70.6% (12/31/2016) | ||
| RE Tax: | $0 | Springing | N/A | 3rd Most Recent Occupancy: | 71.0% (12/31/2015) | ||
| Insurance: | $0 | Springing | N/A | Appraised Value (as of): | $122,800,000 (10/4/2017) | ||
| Recurring Replacements: | $0 | $132,190 | N/A | Cut-off Date LTV Ratio: | 65.0% | ||
| Capital Expenditures: | $17,711,531 | $0 | N/A | Maturity Date LTV Ratio: | 55.2% | ||
| Sources and Uses | ||||||
| Sources | Proceeds | % of Total | Uses | Proceeds | % of Total | |
| Loan Amount: | $79,800,000 | 64.8% | Purchase Price: | $104,000,000 | 84.4% | |
| Borrower Equity: | $43,355,616 | 35.2% | Reserves: | $17,711,531 | 14.4% | |
| Closing Costs: | $1,444,085 | 1.2% | ||||
| Total Sources: | $123,155,616 | 100.0% | Total Uses: | $123,155,616 | 100.0% | |
| (1) | See “Mezzanine Loan and Preferred Equity” below for further discussion of future permitted debt. |
| (2) | See“Escrows and Reserves” below for further discussion of reserve requirements. |
The Mortgage Loan. The fourth largest mortgage loan (the “Marriott at Legacy Town Center Mortgage Loan”) is evidenced by a promissory note in the original principal amount of $79,800,000, and secured by a first priority fee mortgage encumbering the full service, 404-room Marriott at Legacy Town Center hotel located in Plano, Texas (the “Marriott at Legacy Town Center Property”). The proceeds of the Marriott at Legacy Town Center Mortgage Loan, together with approximately $43.4 million of borrower equity, were used to acquire the Marriott at Legacy Town Center Property, fund reserves and pay closing costs. The previous mortgage loan secured by the Marriott at Legacy Town Center Property was included in the MSC 2017-PRIME securitization trust.
The Borrower and the Sponsor. The borrower is Pios Grande Xgen Plano MRT LLC (the “Marriott at Legacy Town Center Borrower”), a single-purpose Delaware limited liability company, with two independent directors. Pios Grande Holdings LLC and Pios Grande Holdings II LLC are the nonrecourse carveout guarantors. The borrower sponsor is Roch Capital Inc. (“Roch”).
Pios Grande Holdings LLC and Pios Grande Holdings II LLC are each wholly owned by four trusts for the benefit of Rocco Abessinio’s four children. The Marriott at Legacy Town Center Borrower is wholly owned by eight trusts for the benefit of Rocco Abessinio’s four children. Rocco Abessinio is the founder and CEO of Roch, a capital management firm that invests in diversified real estate opportunities including hospitality, office, retail, flex/industrial, multifamily, manufactured home and recreational vehicle communities, student housing, mixed-use, single tenant net lease properties and corporate sale-leasebacks.
This is not a research report and was not prepared by any Underwriter’s research departments. Please see additional important information and qualifications at the end of this Term Sheet. |
| T-52 |
| BANK 2017-BNK9 | Marriott at Legacy Town Center |
The Property. The Marriott at Legacy Town Center Property is a six-story, full service hotel located in Plano, Texas. The Marriott at Legacy Town Center Property contains 404 rooms, including 217 king bedrooms, 132 double/double rooms and 55 suites. Amenities include two restaurants, an outdoor swimming pool with a whirlpool, a fitness center, a business center, a gift shop and a local shuttle. The Marriott at Legacy Town Center Property also features 11 meeting/banquet rooms, including a ballroom which can be divided into four separate rooms, totaling 23,341 SF of meeting and event space. The Marriott at Legacy Town Center Property also includes 14,821 SF of white box retail space, which is currently unoccupied. There are 544 parking spaces located in a four-story parking garage (1.35 spaces per room) on the Marriott at Legacy Town Center Property. In order to obtain the number of parking spaces required for zoning purposes (609 spaces), the Marriott at Legacy Town Center Borrower has entered into a Reciprocal Parking Easement and Maintenance Agreement with an adjoining property owner, pursuant to which each property owner has the right to use up to 200 spaces in the other property owner’s parking garage. The agreement expires in June 2031.
The Marriott at Legacy Town Center Property is part of Legacy, a master planned development, as to which a declaration of covenants, conditions and restrictions establishes a Legacy Association for the purpose of enforcing design and building restrictions, and ongoing maintenance requirements of each property owner for its own parcels and which has the power to levy annual and special assessments.
The borrower’s business plan includes approximately $17.7 million ($43,840/room) of renovations over the next two years, which amount was reserved for at origination of the Marriott at Legacy Town Center Mortgage Loan. The majority of the planned renovations will be to the lobby and guestrooms. The Marriott at Legacy Town Center Property was opened in 2001 and, according to the previous owner, has undergone approximately $11.9 million in renovations since 2011, which include the replacement of mattresses and a cooling tower, along with meeting space and guestroom upgrades.
The Marriott at Legacy Town Center Property operates under a management agreement with Marriott Hotel Services, Inc. that expires on December 31, 2023 with two, ten-year renewal options;provided that Marriott Hotel Services, Inc. may elect, in writing delivered to the Marriott at Legacy Town Center Borrower no later than one calendar year prior to the date the renewal term would otherwise have commenced, not to renew the term, in which case the management agreement will not be renewed.
According to the appraisal, in 2016 the Marriott at Legacy Town Center Property generated approximately 55% of its room nights from commercial demand, 30% from meeting and group demand and 15% from leisure demand.
More specific information about the Marriott at Legacy Town Center Property and the related competitive set is set forth in the following table:
| Historical Occupancy, ADR, RevPAR(1)(2) | ||||||||||||
Competitive Set | Marriott at Legacy Town Center Property | Penetration Factor | ||||||||||
| Year | Occupancy | ADR | RevPAR | Occupancy | ADR | RevPAR | Occupancy | ADR | RevPAR | |||
| 8/31/2015 TTM | 65.0% | $149.39 | $97.14 | 70.4% | $188.58 | $132.79 | 108.3% | 126.2% | 136.7% | |||
| 8/31/2016 TTM | 66.3% | $155.70 | $103.25 | 69.9% | $195.26 | $136.52 | 105.4% | 125.4% | 132.2% | |||
| 8/31/2017 TTM | 64.2% | $160.16 | $102.76 | 72.0% | $185.46 | $133.57 | 112.3% | 115.8% | 130.0% | |||
Source: Industry Report
| (1) | The competitive set includesHilton Dallas Plano Granite Park,Westin Stonebriar,Embassy Suites Dallas Frisco, HyattPlace Dallas Plano and NYLO Hotel Plano. Such competitive set is different from the competitive set used in the Property Competitive Summary table below. |
| (2) | The variances between the underwriting, the appraisal and the industry report data with respect to Occupancy, ADR and RevPAR at the Marriott at Legacy Town Center Property are attributable to variances in reporting methodologies and/or timing differences. |
The Market. The Marriott at Legacy Town Center Property is a part of Legacy, a dining, shopping and entertainment center in Plano, Texas. Legacy is a master-planned development that spans over 2,600 acres with over 500,000 SF of retail and entertainment space and nearly 16 million SF of office campuses, which are home to companies including Hewlett Packard, J.C. Penney, Frito-Lay, FedEx and Ericsson. Legacy is home to over 2,400 units of multifamily housing and nearly 60,000 people work in Legacy every day.
The Marriott at Legacy Town Center Property is located adjacent to a $2 billion mixed-use development (“Legacy West”) that is currently under construction. According to the appraisal, Legacy West is expected to feature 280,000 SF of retail space, 240,000 SF of office space, and 627 apartments upon its anticipated completion in 2018. JPMorgan Chase has announced that it will be consolidating its North Texas operations, moving approximately 6,000 jobs to Legacy West between 2017 and 2019. According to the appraisal, Toyota and Liberty Mutual are expected to move approximately 4,000 and 5,000 jobs, respectively, to Legacy West by early 2018. However, there can be no assurance that any of these job moves will occur.
Plano is located between downtown Dallas and the growing commercial and residential suburb of Frisco, Texas. According to the appraisal, the estimated 2017 population within a one-, three- and five-mile radius of the Marriott at Legacy Town Center Property is 10,255, 56,347 and 122,793, respectively. The cumulative population growth within a one-, three- and five-mile radius of the Marriott at Legacy Town Center Property between 2010 and 2017 was 13.2%, 10.5% and 8.9%, respectively. The estimated 2017 average household income within a one-, three- and five-mile radius of the Marriott at Legacy Town Center Property is $56,154, $54,654 and $55,457, respectively.
This is not a research report and was not prepared by any Underwriter’s research departments. Please see additional important information and qualifications at the end of this Term Sheet. |
| T-53 |
| BANK 2017-BNK9 | Marriott at Legacy Town Center |
The following table presents certain information relating to the primary competitive properties to the Marriott at Legacy Town Center Property:
| Property Competitive Summary(1)(2) | ||||||||||
| Property Name | No. of Rooms | Year Built | Meeting Space (SF) | Commercial | Meeting & Group | Leisure | Estimated 2016 Occupancy(3) | Estimated 2016 ADR(3) | Estimated 2016 RevPAR(3) | |
| Marriott at Legacy Town Center | 404 | 2001 | 23,341 | 55% | 30% | 15% | 70.8% | $190.70 | $134.94 | |
| Hilton Dallas Plano Granite Park | 299 | 2014 | 18,488 | 60% | 30% | 10% | 60.0% - 65.0% | $170 - $180 | $110 - $115 | |
| Westin Stonebriar | 301 | 2000 | 16,571 | 55% | 30% | 15% | 60.0% - 65.0% | $180 - $190 | $110 - $115 | |
| Embassy Suites Dallas Frisco | 330 | 2005 | 90,000 | 55% | 30% | 15% | 70.0% - 75.0% | $150 - $160 | $110 - $115 | |
Source:Appraisal.
| (1) | Variances between the underwriting, the appraisal and the Historical Occupancy, ADR, RevPAR table with respect to Occupancy, ADR and RevPAR at the Marriott at Legacy Town Center Property are attributable to variances in reporting methodologies and/or timing differences. |
| (2) | Secondary competitors, as identified by the appraiser, include Courtyard by Marriott at Legacy Park, Sheraton Stonebriar, NYLO Hotel Plano, Aloft Plano, Hilton Garden Inn Frisco, Aloft Frisco and Hyatt Place Plano. The competitive sets identified in the table above and in this footnote are different from the competitive sets used in the Historical Occupancy, ADR, RevPAR table above. |
| (3) | Estimated 2016 Occupancy, Estimated 2016 ADR and Estimated 2016 RevPAR are based on the appraisal’s estimated 2016 year-end figures. |
According to the appraisal, two hotels, a 304-room Renaissance Hotel and a 300-room Omni Hotel, both of which directly compete with the Marriott at Legacy Town Center Property, recently opened within three miles of the Marriott at Legacy Town Center Property. An additional four hotels are under development in the market where the Marriott at Legacy Town Center Property is located, at least one of which, a 295-room Hyatt Regency to be located two miles from the Marriott at Legacy Town Center Property and expected to open in 2019, is expected to directly compete with the Marriott at Legacy Town Center Property.
Operating History and Underwritten Net Cash Flow. The following table presents certain information relating to the historical operating performance and the Underwritten Net Cash Flow at the Marriott at Legacy Town Center Property.
| Cash Flow Analysis | ||||||||||||
| 2014 | 2015 | 2016 | 8/31/2017 TTM | UW | UW per Room | |||||||
| Occupancy(1) | 69.2% | 71.0% | 70.6% | 72.0% | 72.0% | |||||||
| ADR(1) | $178.78 | $193.45 | $190.70 | $185.46 | $185.46 | |||||||
| RevPAR(1) | $123.71 | $137.41 | $134.58 | $133.57 | $133.57 | |||||||
| Rooms Revenue | $18,222,044 | $20,262,566 | $19,898,911 | $19,696,553 | $19,309,190 | $47,795 | ||||||
| Food & Beverage | $10,208,167 | $10,922,258 | $10,986,941 | $11,613,419 | $11,385,023 | $28,181 | ||||||
| Other Income | 1,042,337 | 730,265 | 1,114,966 | 1,052,082 | $1,031,391 | 2,553 | ||||||
| Total Revenue | $29,472,548 | $31,915,089 | $32,000,818 | $32,362,054 | $31,725,604 | $78,529 | ||||||
| Total Expenses | 19,592,696 | 20,684,301 | 21,014,148 | 21,033,554 | $20,152,727(2) | 49,883 | ||||||
| Net Operating Income | $9,879,852 | $11,230,788 | $10,986,670 | $11,328,500 | $11,572,877 | $28,646 | ||||||
| FF&E | 1,443,931 | 1,601,653 | 1,600,041 | 1,618,103 | $1,586,280 | 3,926 | ||||||
| Net Cash Flow | $8,435,921 | $9,629,135 | $9,386,629 | $9,710,397 | $9,986,597 | $24,719 | ||||||
| NOI DSCR (IO) | 2.90x | 3.30x | 3.23x | 3.33x | 3.40x | |||||||
| NOI DSCR (P&I) | 2.11x | 2.40x | 2.34x | 2.42x | 2.47x | |||||||
| NCF DSCR(IO) | 2.48x | 2.83x | 2.76x | 2.85x | 2.93x | |||||||
| NCF DSCR (P&I) | 1.80x | 2.05x | 2.00x | 2.07x | 2.13x | |||||||
| NOI Debt Yield | 12.4% | 14.1% | 13.8% | 14.2% | 14.5% | |||||||
| NCF Debt Yield | 10.6% | 12.1% | 11.8% | 12.2% | 12.5% | |||||||
| (1) | Occupancy, ADR and RevPAR figures are based on the underwriting and have been taken from financial statements provided by the Marriott at Legacy Town Center Borrower. Variances between the underwriting, the appraisal and the Historical Occupancy, ADR, RevPAR table with respect to Occupancy, ADR and RevPAR at the Marriott at Legacy Town Center Property are attributable to variances in reporting methodologies and/or timing differences. |
| (2) | The majority of the decrease in UW Total Expenses from 8/31/2017 TTM is due to a decrease in the incentive management fee owed to the property manager as a result of the Marriott at Legacy Town Center Borrower’s commencement of a $17.7 million renovation. Approximately $1.1 million of the Marriott at Legacy Town Center Borrower’s planned capital expenditures for 2018 is being subtracted from net cash flow to reduce the underwritten incentive management fee. The Hotel Manager is owed an incentive management fee equal to 35.0% of available cash flow (the “Incentive Management Fee”), which is defined as the excess, if any, of operating profit (net cash flow less replacement reserves) over the Marriott at Legacy Town Center Borrower’s priority distribution (calculated as 11.0% of the Marriott at Legacy Town Center Borrower’s cost basis, which basis is currently approximately $6.4 million (the “Owner’s Priority Distribution”)). Only major capital expenditures (non-routine, major repairs, alterations, improvements, renewals, replacements, and additions to the Marriott at Legacy Town Center Property) are added to the Marriott at Legacy Town Center Borrower’s cost basis. None of the $1.1 million of capex is added to the Marriott at Legacy Town Center Borrower’s cost basis. |
Escrows and Reserves. The Marriott at Legacy Town Center Loan documents provide for upfront reserves in the amount of $17,689,300 in connection with specified capital expenditures for the Marriott at Legacy Town Center Property, primarily including guestroom renovations and lobby renovations. The Marriott at Legacy Town Center Loan documents also provide for upfront reserves in the amount of $22,231 for capital expenditures for the retail area of the Marriott at Legacy Town Center Property.
The Marriott at Legacy Town Center Borrower is required to make monthly deposits of: (i) 1/12 of the annual estimated real estate taxes into a tax escrow and (ii) 1/12 of the annual estimated insurance premiums into an insurance escrow (unless the Marriott at Legacy Town Center Borrower maintains an
This is not a research report and was not prepared by any Underwriter’s research departments. Please see additional important information and qualifications at the end of this Term Sheet. |
| T-54 |
| BANK 2017-BNK9 | Marriott at Legacy Town Center |
acceptable blanket policy);provided that so long as no event of default exists under the Marriott at Legacy Town Center Mortgage Loan, the Marriott at Legacy Town Center Borrower is entitled to a credit (on a dollar for dollar basis) against the foregoing monthly deposit requirements for any deposits that are required to be made and actually are made into an escrow for the same purpose maintained by the Hotel Manager (as defined below) pursuant to the Hotel Management Agreement (as defined below). The Marriott at Legacy Town Center Borrower is required to make monthly deposits into an escrow for furniture, fixtures and equipment (“FF&E”) equal to the amount required by the Hotel Manager on account of FF&E under the Hotel Management Agreement;provided that the FF&E monthly deposit may not be less than 1/12th of 5.00% of gross operating income for the Marriott at Legacy Town Center Property for the preceding calendar year andprovided further that so long as no event of default exists under the Marriott at Legacy Town Center Mortgage Loan, the Marriott at Legacy Town Center Borrower is entitled to a credit (on a dollar for dollar basis) against the foregoing monthly deposit requirement for any deposits that are required to be made and actually are made into an FF&E escrow maintained by the Hotel Manager pursuant to the Hotel Management Agreement. The required FF&E monthly deposit will be $132,190 for the remainder of 2017. If any property improvement plan (“PIP”) is imposed by the Hotel Manager pursuant to the Hotel Management Agreement, the Marriott at Legacy Town Center Borrower is required to deposit with the lender 110% of the cost of such PIP.
“Hotel Manager” means Marriott Hotel Services, Inc., or any other qualified hotel manager pursuant to a replacement Hotel Management Agreement.
“Hotel Management Agreement” means the management agreement between the Marriott at Legacy Town Center Borrower and the Hotel Manager, or any replacement hotel management agreement entered into subsequent to the loan origination date.
Lockbox and Cash Management. A soft lockbox is in place with respect to the Marriott at Legacy Town Center Mortgage Loan. All hotel revenue with respect to the Marriott at Legacy Town Center Property is collected by the Hotel Manager and deposited in an account to which the Hotel Manager has access (the “Hotel Operating Account”). The Hotel Manager is required to pay operating expenses (other than debt service) from the Hotel Operating Account pursuant to the Hotel Management Agreement, and may deduct from gross revenues in the Hotel Operating Account, its base management fee and expenses, and funds for FF&E Reserves, tax and insurance reserves, working capital reserves and other reserves required to be maintained under the Hotel Management Agreement. The Marriott at Legacy Town Center Borrower has collaterally assigned its interest in the Hotel Operating Account and such reserves to the lender, and the Hotel Manager has acknowledged such assignment; however, such assignment may not interfere with Hotel Manager’s right to use such funds as provided in the Hotel Management Agreement. Gross revenues remaining in the Hotel Operating Account after deduction of the foregoing fees, expenses and reserves, for each accounting period (typically a four to five week period), are required under the Hotel Management Agreement to be applied in the following priority by the Hotel Manager: (i) to pay the Marriott at Legacy Town Center Borrower a prorated portion of the Owner’s Priority Distribution, (ii) the Hotel Manager may deduct its Incentive Management Fee and (iii) to pay any remainder to the Marriott at Legacy Town Center Borrower (such remainder amount, together with the Owner’s Priority Distribution, the “Owner Distributions”). The Marriott at Legacy Town Center Borrower has directed the Hotel Manager to deposit into a lender-controlled lockbox account the Owner Distributions so payable to the Marriott at Legacy Town Center Borrower.
The Marriott at Legacy Town Center Mortgage Loan has springing cash management. Provided no Cash Sweep Event Period (as defined below) exists, Owner Distributions in the lockbox account are required to be swept daily to an account designated by the Marriott at Legacy Town Center Borrower. Upon the first occurrence of a Cash Sweep Event Period, the lender has the right to establish, and the Marriott at Legacy Town Center Borrower is required to cooperate to establish, a lender-controlled cash management account. During the continuance of a Cash Sweep Event Period, all Owner Distributions on deposit in the lockbox account are required to be swept each business day to such cash management account and applied on each monthly payment date to pay debt service on the Marriott at Legacy Town Center Loan; to fund the required reserves deposits as described under “Escrows and Reserves”; to deposit, if a Management FF&E Expiration Event (as defined below) is continuing, remaining Owner Distributions in the lockbox account into the FF&E reserve until the amount on deposit therein equals $30,000 per key (as determined by the lender); to pay, if the Cash Sweep Event Period relates solely to a DSCR Event (as defined below), operating expenses set forth in the approved annual budget and extraordinary expenses approved (if in excess of $10,000) by the lender, in each case to the extent not paid or reserved for under the Hotel Management Agreement; and to deposit the remainder to an account to be held by the lender as additional security for the Marriott at Legacy Town Center Mortgage Loan during the continuance of such Cash Sweep Event Period.
A “Cash Sweep Event Period” is a period commencing upon a Trigger Event (as defined below) and terminating upon a Cash Sweep Termination Event (as defined below).
A “Trigger Event” means (i) an event of default; (ii) the amortizing debt service coverage ratio dropping below 1.25x for six consecutive calendar months based upon the trailing 12 months (a “DSCR Event”); (iii) the termination of the Hotel Management Agreement without the lender’s prior consent or if the Hotel Management Agreement has not been renewed or extended one year prior to its expiration (a “Management Termination Event”); (iv) any time that Hotel Manager provides written notice to the Marriott at Legacy Town Center Borrower and/or the lender that there is an uncured default under the Hotel Management Agreement and the default is not cured within 30 days of the Marriott at Legacy Town Center Borrower’s receipt of such notice (a “Management Default Event”); and (v) the date one year prior to the renewal date of the Hotel Management Agreement if the Hotel Management Agreement has not been renewed and/or extended and the funds in the FF&E reserve are less than $30,000 per key (a “Management FF&E Expiration Event”).
A “Cash Sweep Termination Event” means (i) no event of default has occurred and is continuing; (ii) if the Trigger Event was a DSCR Event, the amortizing debt service coverage ratio has been not less than 1.25x for the immediately preceding six consecutive calendar months based on the trailing twelve months; (iii) if the Trigger Event was a Management Termination Event or Management FF&E Expiration Event, the Marriott at Legacy Town Center Borrower has either renewed or extended the Hotel Management Agreement, or has entered into a replacement management agreement with a reputable and experienced nationally-recognized brand manager possessing experience in flagging and operating hotel properties similar in size, scope, use and value to the Marriott at Legacy Town Center Property, which replacement manager and management agreement have been reasonably approved by the lender (with the new manager having provided the lender with a subordination, non-disturbance and attornment agreement or comfort letter acceptable to the lender in its reasonable discretion) and has been operating under such agreement for 60 days without a default by either party thereto; or (iv) if the Trigger Event was a Management Default Event, the default has been remedied to the reasonable satisfaction of the lender and Hotel Manager and there has been no default by the Marriott at Legacy Town Center Borrower under the Hotel Management Agreement for 60 days.
Additional Secured Indebtedness (not including trade debts). Not permitted.
Mezzanine Loan and Preferred Equity. After a sale of the Marriott at Legacy Town Center Property and assumption of The Marriott at Legacy Town Center Mortgage Loan, the owners of the Marriott at Legacy Town Center Property Borrower may incur mezzanine debt secured by ownership interests in the Marriott at Legacy Town Center Borrower, provided among other conditions, (i) the mezzanine loan has been approved by the rating agencies rating the BANK 2017-BNK9 securitization, (ii) the mezzanine lender enters into an intercreditor agreement with the lender in form and substance acceptable to
This is not a research report and was not prepared by any Underwriter’s research departments. Please see additional important information and qualifications at the end of this Term Sheet. |
| T-55 |
| BANK 2017-BNK9 | Marriott at Legacy Town Center |
the lender and the rating agencies in their sole discretion, (iii) the mezzanine lender is an institutional lender acceptable to the lender, (iv) the mezzanine financing is in an amount that, when added to the outstanding principal balance of the Marriott at Legacy Town Center Mortgage Loan, will result in (1) a combined loan to value ratio of no more than 75.0%, (2) a combined debt service coverage ratio of no less than 2.00x; and (3) a combined debt yield of not less than 11.8%; and (iv) the mezzanine loan is not secured by the Marriott at Legacy Town Center Property or its rents.
Release of Property. Not permitted.
Terrorism Insurance. If “acts of terrorism” are excluded from the Marriott at Legacy Town Center Borrower’s all risk insurance policy, the Marriott at Legacy Town Center Mortgage Loan documents require the Marriott at Legacy Town Center Borrower to obtain an endorsement to such policy or a separate policy which provides coverage for terrorism in an amount reasonably determined by the lender (but in no event more than the full replacement cost of the Marriott at Legacy Town Center Property and 12 months of business interruption insurance);provided that if the Terrorism Risk Insurance Act of 2002, as extended and modified by the Terrorism Risk Insurance Program Reauthorization Act of 2015 or subsequent statute, extension or reauthorization thereof (“TRIPRA”) is in effect and continues to cover both foreign and domestic acts of terrorism, the lender is required to accept terrorism insurance with coverage against “covered acts” (as defined by TRIPRA or such other program).
This is not a research report and was not prepared by any Underwriter’s research departments. Please see additional important information and qualifications at the end of this Term Sheet. |
| T-56 |
(THIS PAGE INTENTIONALLY LEFT BLANK)
| T-57 |
| BANK 2017-BNK9 | Hackensack Commons |
Mortgage Loan No. 5 – Hackensack Commons

This is not a research report and was not prepared by any Underwriter’s research departments. Please see additional important information and qualifications at the end of this Term Sheet. |
| T-58 |
| BANK 2017-BNK9 | Hackensack Commons |
Mortgage Loan No. 5 – Hackensack Commons
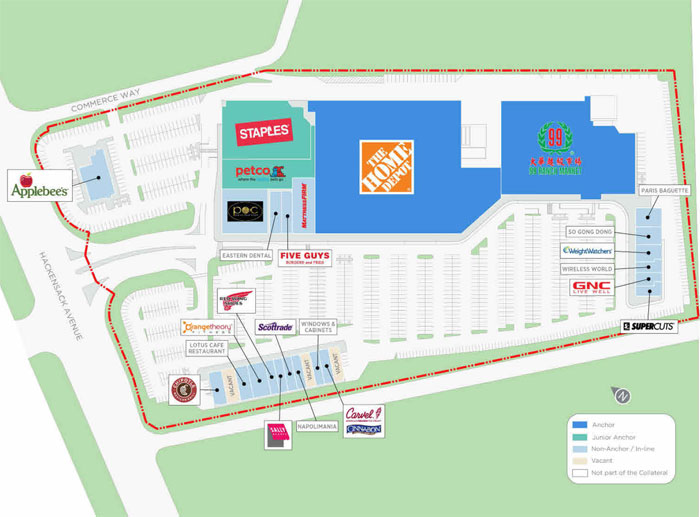
This is not a research report and was not prepared by any Underwriter’s research departments. Please see additional important information and qualifications at the end of this Term Sheet. |
| T-59 |
| BANK 2017-BNK9 | Hackensack Commons |
Mortgage Loan No. 5 – Hackensack Commons
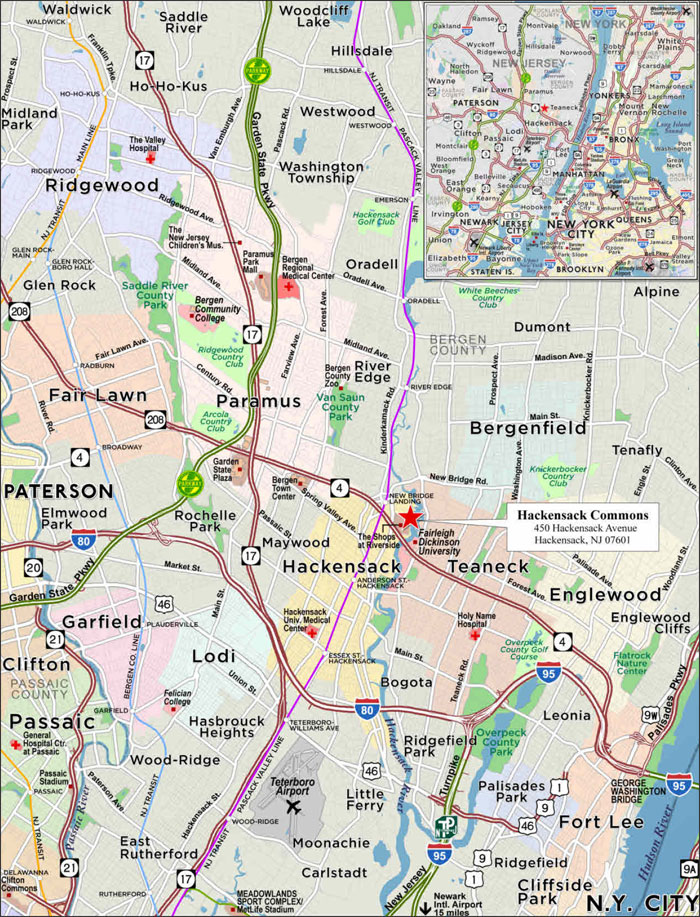
This is not a research report and was not prepared by any Underwriter’s research departments. Please see additional important information and qualifications at the end of this Term Sheet. |
| T-60 |
| BANK 2017-BNK9 | Hackensack Commons |
| Mortgage Loan No. 5 – Hackensack Commons |
| Mortgage Loan Information | Property Information | ||||||
| Mortgage Loan Seller: | MSMCH | Single Asset/Portfolio: | Single Asset | ||||
| Original Balance: | $66,400,000 | Location: | Hackensack, NJ 07601 | ||||
| Cut-off Date Balance: | $66,400,000 | General Property Type: | Retail | ||||
| % of Initial Pool Balance: | 6.3% | Detailed Property Type: | Anchored | ||||
| Loan Purpose: | Refinance | Title Vesting: | Fee | ||||
| Sponsor: | Urban Edge Properties | Year Built/Renovated: | 1963 / 1995 | ||||
| Mortgage Rate: | 4.3550% | Size: | 274,643 SF | ||||
| Note Date: | 11/15/2017 | Cut-off Date Balance Per SF: | $242 | ||||
| First Payment Date: | 1/1/2018 | Maturity Date Balance Per SF: | $242 | ||||
| Maturity Date: | 3/1/2028 | Property Manager: | UE Property Management LLC | ||||
| Original Term to Maturity | 123 months | ||||||
| Original Amortization Term: | 0 months | Underwriting and Financial Information | |||||
| IO Period: | 123 months | UW NOI: | $5,726,801 | ||||
| Seasoning: | 0 months | UW NOI Debt Yield: | 8.6% | ||||
| Prepayment Provisions: | LO (24); DEF (94); O (5) | UW NOI Debt Yield at Maturity: | 8.6% | ||||
| Lockbox/Cash Mgmt Status: | Springing/Springing | UW NCF DSCR: | 1.82x | ||||
| Additional Debt Type: | N/A | Most Recent NOI: | $4,858,643 (9/30/2017 TTM) | ||||
| Additional Debt Balance: | N/A | 2nd Most Recent NOI: | $4,168,249 (12/31/2016) | ||||
| Future Debt Permitted (Type): | No (N/A) | 3rd Most Recent NOI: | $3,990,813 (12/31/2015) | ||||
| Reserves(1) | Most Recent Occupancy(2): | 97.9% (10/26/2017) | |||||
| Type | Initial | Monthly | Cap | 2nd Most Recent Occupancy: | 72.8% (12/31/2016) | ||
| RE Tax: | $0 | Springing | N/A | 3rd Most Recent Occupancy: | 72.8% (12/31/2015) | ||
| Insurance: | $0 | Springing | N/A | Appraised Value (as of): | $102,800,000 (10/10/2017) | ||
| Recurring Replacements: | $0 | $3,433 | N/A | Cut-off Date LTV Ratio: | 64.6% | ||
| TI/LC: | $2,313,931 | $13,732 | $400,000 | Maturity Date LTV Ratio: | 64.6% | ||
| So Gong Dong Free Rent: | $42,613 | $0 | N/A | ||||
| Sources and Uses | |||||||
| Sources | Proceeds | % of Total | Uses | Proceeds | % of Total | ||
| Loan Amount: | $66,400,000 | 100.0% | Loan Payoff: | $38,840,963 | 58.5% | ||
| Reserves: | $2,356,544 | 3.5% | |||||
| Closing Costs: | $930,194 | 1.4% | |||||
| Return of Equity: | $24,272,299 | 36.6% | |||||
| Total Sources: | $66,400,000 | 100.0% | Total Uses: | $66,400,000 | 100.0% | ||
| (1) | See “Escrows and Reserves” below for further discussion of reserve requirements. |
| (2) | Most Recent Occupancy includes three new tenants (23.3% of NRA) that have executed leases and taken possession of their space but are not yet in occupancy. |
The Mortgage Loan.The fifth largest mortgage loan (the “Hackensack Commons Mortgage Loan”) is evidenced by a promissory note in the original principal amount of $66,400,000 and secured by a first priority fee mortgage encumbering an anchored retail property in Hackensack, New Jersey (the “Hackensack Commons Property”). Proceeds of the Hackensack Commons Mortgage Loan were primarily used to refinance the previous loan secured by the Hackensack Commons Property, fund upfront reserves, pay closing costs and return equity to the Hackensack Commons Borrower (as defined below). The Hackensack Commons Property was previously collateral for a loan securitized in the VNO 2010-VNO transaction.
The Borrower and the Sponsor. The borrower is Hackensack UE LLC (the “Hackensack Commons Borrower”), a single-purpose New Jersey limited liability company, with two independent directors in its organizational structure. The Hackensack Commons Borrower is 100.0% owned by Urban Edge Properties LP, which is in turn 89.9% owned by Urban Edge Properties. Urban Edge Properties is the borrower sponsor and Urban Edge Properties LP is the non-recourse carveout guarantor.
Urban Edge Properties is a real estate investment trust that acquires, develops, owns, manages and improves shopping centers in and on the edge of urban communities. Its portfolio comprises 16.7 million SF in 90 properties and it manages over 5 million SF for others. Urban Edge’s core assets are concentrated in the Washington, D.C. to Boston corridor.
The Property.The Hackensack Commons Property is a 274,643 SF anchored retail community center located in Hackensack, New Jersey, approximately ten miles west of the George Washington Bridge and upper Manhattan, New York City. Built in 1963 and renovated in 1995, the Hackensack Commons Property sits on 21.4 acres and contains a total of 1,163 parking spaces (4.23 spaces per 1,000 SF of NRA).
As of October 26, 2017, the Hackensack Commons Property was 97.9% leased by a mix of 24 national and regional tenants, including Home Depot, 99 Ranch Market, Applebee’s, Chipotle, Five Guys, GNC, Mattress Firm, Petco and Staples. Home Depot has served as an anchor tenant at the Hackensack Commons Property since 2002 and accounts for 40.4% of NRA and 39.8% of underwritten rent. Eleven of the 24 tenants at the Hackensack Commons
This is not a research report and was not prepared by any Underwriter’s research departments. Please see additional important information and qualifications at the end of this Term Sheet. |
| T-61 |
| BANK 2017-BNK9 | Hackensack Commons |
Property, representing 57.9% of NRA, have operated there for ten years or longer and ten of the tenants have renewed at least once. Six tenants (99 Ranch Market, Orangetheory Fitness, Eastern Dental, Paris Baguette, So Gong Dong, and Chipotle) leased space totaling 72,212 SF (26.3% of NRA and 20.8% of underwritten rent) in 2017. Three of such tenants, 99 Ranch Market, Paris Baguette, and So Gong Dong, representing in the aggregate 23.3% of NRA and 16.3% of underwritten rent, are not yet in occupancy and two of such tenants, Paris Baguette, and So Gong Dong, representing in the aggregate 1.8% of NRA and 2.6% of underwritten rent are not yet paying rent.
Major Tenants.
Home Depot (111,027 SF, 40.4% of NRA, 39.8% ofunderwritten rent). Home Depot U.S.A., Inc. (“Home Depot”), a tenant at the Hackensack Commons Property since 2002, is a home improvement chain with over 400,000 employees at more than 2,200 stores within the United States, Canada and Mexico. Home Depot has a lease expiration of January 31, 2023 and has two, five-year renewal options. Home Depot reported sales at the Hackensack Commons Property for fiscal year ending January 2015, 2016, and 2017 of approximately $55.2 million ($497 PSF), approximately $56.7 million ($511 PSF), and approximately $59.1 million ($532 PSF), respectively. According to the annual report for Home Depot’s parent company, The Home Depot Inc.’s national average store sales were approximately $391 PSF for the fiscal year ending January 2017.
99 Ranch Market(59,170 SF, 21.5% of NRA, 13.7% of underwritten rent). 99 Ranch Market is scheduled to open at the Hackensack Property in December 2017. Established in 1984, 99 Ranch Market now has over 42 store locations in California, Nevada, Texas and Washington. The 99 Ranch Market at the Hackensack Commons Property will be its first location on the east coast of the United States. 99 Ranch Market has a lease expiration of December 31, 2027 and has three, five-year renewal options. 99 Ranch Market has taken possession of its space and is paying rent, but is not yet in occupancy. 99 Ranch Market has a $1,479,250 tenant improvement allowance, which was reserved for at loan origination.
Staples(27,017 SF, 9.8% of NRA, 10.7% of underwritten rent).Staples, a tenant at the Hackensack Commons Property since 2005, is an office supply chain with more than 1,900 stores within the United States, Canada, the United Kingdom, Australia, Brazil, and a presence in multiple European countries. Staples has extended its lease two times, has a lease expiration of March 31, 2020 and has one, three-year renewal option.
The following table presents a summary regarding the major tenants at the Hackensack Commons Property:
| Tenant Summary(1) | ||||||||||
| Tenant Name | Credit Rating (Fitch/Moody’s/S&P)(2) | Tenant SF | Approx. % of SF | Annual UW Rent | Annual UW Rent PSF(3) | % of Annual UW Rent | 2016 Sales | Occ. Cost %(4) | Lease Expiration | |
| $ | PSF | |||||||||
| Major Tenants | ||||||||||
| Home Depot | A/A2/A | 111,027 | 40.4% | $2,498,108 | $22.50 | 39.8% | $59,094,578 | $532 | 4.2% | 1/31/2023 |
| 99 Ranch Market | NR/NR/NR | 59,170 | 21.5% | $857,965 | $14.50 | 13.7% | NAV | NAV | NAV | 12/31/2027 |
| Staples | NR/B3/B+ | 27,017 | 9.8% | $670,022 | $24.80 | 10.7% | $6,730,536 | $249 | 10.0% | 3/31/2020 |
| Petco Supplies & Fish | NR/NR/B | 13,808 | 5.0% | $359,008 | $26.00 | 5.7% | NAV | NAV | NAV | 1/31/2024 |
| Port of Call American Fusion | NR/NR/NR | 10,556 | 3.8% | $316,680 | $30.00 | 5.0% | $3,094,061 | $293 | 10.2% | 1/31/2024 |
| Subtotal/Wtd. Avg. | 221,578 | 80.7% | $4,701,783 | $21.22 | 74.9% | $68,919,175(5) | $464(5) | 5.1%(5) | ||
| Other Tenants | 47,206 | 17.2% | $1,578,431 | $33.44 | 25.1% | $8,570,303(5) | $362(5) | 9.5%(5) | ||
| Vacant Space | 5,859 | 2.1% | $0 | $0.00 | 0.0% | |||||
| Total/Wtd. Avg. | 274,643 | 100.0% | $6,280,214 | $23.37 | 100.0% | $77,489,478(5) | $450(5) | 5.6%(5) | ||
| (1) | Information is based on the underwritten rent roll as of October 26, 2017. |
| (2) | Certain ratings are those of the parent company whether or not the parent guarantees the lease. |
| (3) | Wtd. Avg. Annual UW Rent PSF excludes vacant space. |
| (4) | Occ. Cost % is based on the underwritten rent as of the October 26, 2017 rent roll divided by the most recently reported sales. |
| (5) | Subtotal/Wtd. Avg., Other Tenants and Total/Wtd. Avg. 2016 Sales $, 2016 Sales PSF and Occ. Cost % are based on tenants that report sales. Fourteen tenants, representing 172,307 SF (62.7% of NRA) and $4,302,445 of Annual UW Rent (68.5% of Annual UW Rent), report sales. |
This is not a research report and was not prepared by any Underwriter’s research departments. Please see additional important information and qualifications at the end of this Term Sheet. |
| T-62 |
| BANK 2017-BNK9 | Hackensack Commons |
The following table presents certain information relating to the lease rollover at the Hackensack Commons Property:
| Lease Rollover Schedule(1)(2) | ||||||||
| Year | # of Leases Rolling | SF Rolling | Approx. % of Total SF Rolling | Approx. Cumulative % of SF Rolling | Total UW Rent Rolling | Annual UW Rent PSF Rolling | Approx. % of Total Rent Rolling | Approx. Cumulative % of Total Rent Rolling |
| 2017 | 0 | 0 | 0.0% | 0.0% | $0 | $0.00 | 0.0% | 0.0% |
| 2018 | 2 | 3,380 | 1.2% | 1.2% | $103,717 | $30.69 | 1.7% | 1.7% |
| 2019 | 4 | 7,105 | 2.6% | 3.8% | $279,691 | $39.37 | 4.5% | 6.1% |
| 2020 | 2 | 29,231 | 10.6% | 14.5% | $739,409 | $25.30 | 11.8% | 17.9% |
| 2021 | 1 | 1,555 | 0.6% | 15.0% | $49,760 | $32.00 | 0.8% | 18.7% |
| 2022 | 3 | 9,768 | 3.6% | 18.6% | $286,939 | $29.38 | 4.6% | 23.2% |
| 2023 | 1 | 111,027 | 40.4% | 59.0% | $2,498,108 | $22.50 | 39.8% | 63.0% |
| 2024 | 2 | 24,364 | 8.9% | 67.9% | $675,688 | $27.73 | 10.8% | 73.8% |
| 2025 | 1 | 6,200 | 2.3% | 70.1% | $181,500 | $29.27 | 2.9% | 76.7% |
| 2026 | 1 | 1,646 | 0.6% | 70.7% | $77,839 | $47.29 | 1.2% | 77.9% |
| 2027 | 6 | 72,059 | 26.2% | 97.0% | $1,307,481 | $18.14 | 20.8% | 98.7% |
| 2028 & Beyond | 1 | 2,449 | 0.9% | 97.9% | $80,082 | $32.70 | 1.3% | 100.0% |
| Vacant | 0 | 5,859 | 2.1% | 100.0% | $0 | $0.00 | 0.0% | 100.0% |
| Total/Wtd. Avg. | 24 | 274,643 | 100.0% | $6,280,214 | $23.37(3) | 100.0% | ||
| (1) | Information is based on the underwritten rent roll as of October 26, 2017. |
| (2) | Certain tenants may have lease termination options that are exercisable prior to the stated expiration date of the subject lease or leases which are not considered in the lease rollover schedule. |
| (3) | Total/Wtd. Avg. Annual UW Rent PSF Rolling excludes vacant space. |
The Market. The Hackensack Commons Property is located in the North Bergen retail submarket of the Northern New Jersey retail market. According to the appraisal, as of the second quarter of 2017, the vacancy rate in the Northern New Jersey retail market was approximately 8.6% with average asking rents of $29.42 PSF. As of the second quarter of 2017, the vacancy rate in the North Bergen retail submarket was approximately 5.8% with average asking rents of $33.24 PSF. According to the appraisal, both the Northern New Jersey retail market and the North Bergen retail submarket have seen steady increases in asking rents PSF since 2011. The North Bergen retail submarket is made up of 2,300,000 SF, 64,000 SF of which has been built since 2008.
The Hackensack Commons Property is situated at the intersection of Hackensack Avenue and Commerce Way, with 612 feet of frontage on Hackensack Avenue and 509 feet of frontage on Commerce Way. The Hackensack Commons Property is accessible from major highways via Route 17 in a north/south direction and Route 4 in an east/west direction. Within a short distance are Interstate 80, the New Jersey Turnpike and the Garden State Parkway. According to an industry report, the traffic count at the Hackensack Commons Property’s location on Hackensack Avenue averages approximately 20,000 vehicles per day, while State Route 4, within a half mile south of the Hackensack Commons Property, has a traffic count of approximately 124,600 vehicles per day.
According to the appraisal, the 2017 estimated population within a one-, three- and five-mile radius is 18,469, 206,629 and 483,035, respectively. The 2017 estimated average household income within a one-, three- and five-mile radius is $130,261, $107,707 and $110,226, respectively.
This is not a research report and was not prepared by any Underwriter’s research departments. Please see additional important information and qualifications at the end of this Term Sheet. |
| T-63 |
| BANK 2017-BNK9 | Hackensack Commons |
The following table presents recent leasing data at comparable retail properties with respect to the Hackensack Commons Property:
| Comparable Lease Summary | ||||||
Property Name City. State | Tenant | Lease Area (SF) | Lease Date | Base Rent PSF | Lease Term (Yrs.) | Reimbursements |
West Falls Plaza Woodland Park, NJ | andThat! | 64,793 | Sep 2017 | $20.00 | 9.3
| NNN |
471 Prospect Ave West Orange, NJ | LA Fitness | 48,200 | Apr 2016 | $28.00 | 15.0 | NNN |
132-194 Passaic Avenue Kearny, NJ | BJ’s Wholesale Club | 87,788 | Aug 2015 | $17.00 | 20.0 | NNN |
Paramus Towne Square Paramus, NJ | Golf Galaxy | 46,458 | Apr 2014 | $31.00 | 15.0 | NNN |
Roxbury Mall Succasunna, NJ | Petco | 17,000 | Jan 2017 | $26.94 | 12.0 | NNN |
South Paramus Plaza Paramus, NJ | Ashley Furniture | 18,340 | Oct 2016 | $20.00 | 15.0 | NNN |
Gold Acres Shopping Center South Plainfield, NJ | ShopRite | 80,000 | 2016 | $18.00 | 20.0 | NNN |
115 Belmont Avenue Belleville, NJ | KeyFoods | 51,946 | 2016 | $21.50 | 20.0 | NNN |
Livingston Town Center Livingston, NJ | Fan Bistro | 5,020 | Jun 2016 | $25.00 | 10.0 | NNN |
40 Meadowlands Parkway Secaucus, NJ | Secaucus Foodmart | 3,000 | Jun 2017 | $41.00 | 10.0 | NNN |
| The Shops at 17 North Paramus, NJ | Farrow & Ball | 2,018 | Dec 2016 | $46.00 | 10.0 | NNN |
Source: Appraisal.
The following table presents certain information regarding competitive properties with respect to the Hackensack Commons Property:
| Competitive Property Summary | ||||||
| Property Address - Name | City | State | Year Built | Size (SF) | Total Occupancy | |
| 700-790 Broadway - Westwood Plaza | Westwood | NJ | 1981 | 173,854 | 98.9% | |
| 585 From Rd - Sears | Paramus | NJ | 2000 | 193,446 | 100.0% | |
| 502 Garden State Plz - JCPenney | Paramus | NJ | 1958 | 182,909 | 100.0% | |
| 400 Hackensack Ave - Bloomingdale’s | Hackensack | NJ | 1959 | 293,346 | 100.0% | |
| 149-175 Main St - Saddle River Crossing | Lodi | NJ | 2007 | 230,000 | 100.0% | |
| 150 Route 17 - Lowe’s | East Rutherford | NJ | 1996 | 197,000 | 100.0% | |
| 545 State Route 17 South | Paramus | NJ | 1974 | 157,100 | 89.7% | |
| 165 W State Route 4 | Paramus | NJ | 1975 | 261,300 | 100.0% | |
| 698 US Highway 46 - Wal-Mart | Teterboro | NJ | 2015 | 159,311 | 100.0% | |
| 698 US Highway 46 - Costco | Teterboro | NJ | 2015 | 156,166 | 100.0% | |
| 233 N Franklin Tpke - Interstate Shopping Center | Ramsey | NJ | 1961 | 309,000 | 98.7% | |
| 34 E Ridgewood Ave - The Fashion Center | Paramus | NJ | 1968 | 306,762 | 100.0% | |
| 461-537 River Rd | Edgewater | NJ | 1996 | 269,233 | 100.0% | |
| 189 W Route 46 - Saddlebrook Square Center | Saddle Brook | NJ | 1974 | 221,892 | 97.8% | |
Source:Appraisal.
This is not a research report and was not prepared by any Underwriter’s research departments. Please see additional important information and qualifications at the end of this Term Sheet. |
| T-64 |
| BANK 2017-BNK9 | Hackensack Commons |
Operating History and Underwritten Net Cash Flow. The following table presents certain information relating to the historical operating performance and the Underwritten Net Cash Flow at the Hackensack Commons Property:
| Cash Flow Analysis | ||||||
| 2014 | 2015 | 2016 | 9/30/2017 TTM | UW | UW PSF | |
| Base Rent | $4,860,111 | $4,814,243 | $4,755,847 | $5,035,084 | $6,485,279(1) | $23.61 |
| Total Recoveries | $2,155,546 | $2,303,667 | $2,372,550 | $3,029,090 | $3,601,515 | $13.11 |
| Less Vacancy | $0 | $0 | $0 | $0 | ($504,340) | ($1.84) |
| Effective Gross Income | $7,015,657 | $7,117,910 | $7,128,397 | $8,064,174 | $9,582,454 | $34.89 |
| Total Expenses | $3,177,892 | $3,127,097 | $2,960,148 | $3,205,531 | $3,855,654 | $14.04 |
| Net Operating Income(2) | $3,837,765 | $3,990,813 | $4,168,249 | $4,858,643 | $5,726,801 | $20.85 |
| Capital Expenditures | $0 | $0 | $0 | $0 | $41,196 | $0.15 |
| TI/LC | $0 | $0 | $0 | $0 | $339,404 | $1.24 |
| Net Cash Flow | $3,837,765 | $3,990,813 | $4,168,249 | $4,858,643 | $5,346,200 | $19.47 |
| Occupancy % | NAV | 72.8% | 72.8% | 97.9%(3) | 95.0% | |
| NOI DSCR | 1.31x | 1.36x | 1.42x | 1.66x | 1.95x | |
| NCF DSCR | 1.31x | 1.36x | 1.42x | 1.66x | 1.82x | |
| NOI Debt Yield | 5.8% | 6.0% | 6.3% | 7.3% | 8.6% | |
| NCF Debt Yield | 5.8% | 6.0% | 6.3% | 7.3% | 8.1% | |
| (1) | Underwritten Base Rent is based on the rent roll dated October 26, 2017 and includes rent steps through November 30, 2018 totaling $73,031. |
| (2) | The increase in UW Net Operating Income from 9/30/2017 TTM Net Operating Income can be attributed to recent lease signings. Six tenants (99 Ranch Market, Orangetheory Fitness, Eastern Dental, Paris Baguette, So Gong Dong, and Chipotle) leased space totaling 72,212 SF (26.3% of NRA and 20.8% of underwritten base rent) in 2017. The majority of the increase in 9/30/2017 TTM Net Operating Income from 2016 Net Operating Income can be attributed a new tenant, 99 Ranch Market, which commenced paying rent in June 2017. |
| (3) | 9/30/2017 TTM Occupancy % reflects occupancy as of October 26, 2017 and includes three new tenants (99 Ranch Market, Paris Baguette and So Gong Dong), representing 23.3% of NRA, that have executed leases and taken possession of their space but are not yet in occupancy. |
Escrows and Reserves. At origination, the Hackensack Commons Borrower deposited $2,313,931 with lender for tenant improvements and leasing commissions (“TI/LC”) reserves, and $42,613 in connection with the tenant So Gong Dong (to be released to the Hackensack Commons Borrower upon receipt of an estoppel certificate from the tenant stating that its free rent period has expired, there are no reimbursements due to it from the Hackensack Commons Borrower outstanding and it is in occupancy, open for business and paying full rent).
The Hackensack Commons Borrower is required to make monthly deposits of $13,732 for TI/LC reserves and $3,433 for replacement reserves. The Hackensack Commons Borrower will not be required to deposit the TI/LC monthly deposit if the amount then on deposit in the TI/LC reserve exceeds $400,000 (excluding the TI/LC reserve deposit made at origination). The Hackensack Commons Borrower is required to deposit monthly into escrow 1/12 of the annual estimated real estate tax payments and 1/12 of the annual estimated insurance premiums unless (i) no Cash Sweep Event Period (as defined below) is continuing and (ii) the lender is provided with written reasonably satisfactory evidence that such taxes or insurance premiums have been timely paid. In addition, the Hackensack Commons Borrower’s obligation to make monthly deposits into the insurance escrow will be suspended so long as an acceptable blanket insurance policy is in place.
In lieu of depositing amounts into any reserve, the Hackensack Commons Borrower is permitted to deposit a letter of credit or a guaranty from the non-recourse carve-out guarantor, Urban Edge Properties LP;provided that such guarantor has a senior unsecured credit rating of at least Baa3 from Moody’s Investors Service, Inc. and BBB from Standard & Poor’s Ratings Services, and maintains a net worth equal to at least $100,000,000 (including amounts available under undrawn lines of credit);provided, further, that if such guaranty or all letters of credit in the aggregate exceed 10% of the outstanding principal balance of the Hackensack Commons Mortgage Loan, the Hackensack Commons Borrower’s right to provide any such guaranty is conditioned upon delivery of a non-consolidation opinion reasonably satisfactory to the lender addressing such guaranty.
Lockbox and Cash Management. The Hackensack Commons Mortgage Loan has a springing hard lockbox and springing cash management. Upon the first occurrence of a Cash Sweep Event Period, the Hackensack Commons Borrower is required to establish a lender-controlled lockbox account and direct all tenants to pay rents directly into such lockbox account and the lender has the right to establish, and the Hackensack Commons Borrower is required to cooperate with a cash management bank to establish, a lender-controlled cash management account. Following the establishment of such accounts, if no Cash Sweep Event Period exists, all funds in the lockbox account are required to be disbursed to the Hackensack Commons Borrower’s operating account. If a Cash Sweep Event Period exists, funds in the lockbox account are required to be swept daily to the cash management account, and, provided no event of default is continuing, applied on each monthly payment date to pay debt service on the Hackensack Commons Mortgage Loan, to fund required reserve deposits as described above under “Escrows and Reserves,” to pay operating expenses set forth in the annual budget (which is required to be approved by the lender during a Cash Sweep Event Period) and extraordinary expenses approved by the lender, to deposit, if a Major Tenant Event (as defined below) exists, all remaining cash flow into the TI/LC reserve subaccount until an amount equal to $15 PSF of the space leased to the applicable Major Tenant has been deposited, and thereafter, to the extent (i) a Cash Sweep Event Period exists other than due to a Major Tenant Event, to deposit any remaining cash flow to an account to be held by the lender as additional security for the Hackensack Commons Mortgage Loan during the continuance of such Cash Sweep Event Period or (ii) a Cash Sweep Event Period exists solely due to a Major Tenant Event, to disburse any remaining cash flow to the Hackensack Commons Borrower.
A “Cash Sweep Event Period” will commence upon the occurrence of (a) an event of default, (b) the debt service coverage ratio (assuming a 30-year amortization schedule) is less than 1.20x for six consecutive calendar months (a “DSCR Event”), and/or (c) a Major Tenant Event.
A “Major Tenant Event” means (i) a Major Tenant has filed for bankruptcy or become the subject of a bankruptcy filing, (ii) a Major Tenant Lease Expiration Event, or (iii) a Major Tenant has vacated or “gone dark”.
This is not a research report and was not prepared by any Underwriter’s research departments. Please see additional important information and qualifications at the end of this Term Sheet. |
| T-65 |
| BANK 2017-BNK9 | Hackensack Commons |
A “Major Tenant Lease Expiration Event” means the date (i) 12 months prior to the expiration of a Major Tenant’s lease, unless such Major Tenant has renewed or extended its lease pursuant to its terms or on terms acceptable to the lender; (ii) any Major Tenant gives notice to vacate or not to renew its lease; (iii) any Major Tenant exercises any termination option under its lease; or (iv) any Major Tenant cancels or terminates its lease.
A “Major Tenant” means Home Depot or 99 Ranch Market and any replacement tenant occupying more than 40,000 SF pursuant to a replacement lease.
A Cash Sweep Event Period will terminate if (1) no event of default exists; (2) in the case of a DSCR Event, (a) the debt service coverage ratio (assuming a 30-year amortization schedule) is equal to or greater than 1.20x for the immediately preceding six consecutive calendar months or (b) the Hackensack Commons Borrower either (i) after the lockout period expiration date but prior to the open period effectuates a partial defeasance in the minimum amount sufficient to obtain a debt service coverage ratio (assuming a 30-year amortization schedule) of at least 1.20x (the “DSCR Cure Amount”), (ii) during the open period, partially prepays the loan in the DSCR Cure Amount, or (iii) deposits cash or a letter of credit with the lender in the DSCR Cure Amount, (3) in the case of a Major Tenant Lease Expiration Event, either (a) the Major Tenant renews or extends its lease and the lender receives a reasonably acceptable estoppel or letter from the Major Tenant stating that the Major Tenant is in occupancy of the entirety of its space, open for business and paying full contractual rent or (b) the entirety of the Major Tenant’s space has been re-let to one or more replacement tenant(s) reasonably acceptable to the lender pursuant to one or more replacement lease(s) and the lender receives a reasonably acceptable estoppel or letter from each replacement tenant(s) stating that such replacement tenant(s) is/are in occupancy for its/their space, open for business and paying full contractual rent (a “Major Tenant Replacement Cure”), (4) in the event a Major Tenant has filed for bankruptcy or become the subject of a bankruptcy filing, either (a) the Major Tenant’s lease has been affirmed in bankruptcy and the lender receives a reasonably acceptable estoppel or letter stating that the Major Tenant is in occupancy of the entirety of its space, open for business and paying full contractual rent, or (b) there is a Major Tenant Replacement Cure, (5) in the case of a Major Tenant that has vacated or “gone dark”, either (a) the Major Tenant is in occupancy of the entirety of its space and lender receives a reasonably acceptable estoppel or letter stating that the Major Tenant is in occupancy of its space, open for business and paying full contractual rent or (b) there is a Major Tenant Replacement Cure, or (6) in the case of a Major Tenant Event, the amount of excess cash flow deposited into the TI/LC reserve (as a result of the Major Tenant Event) equals $15 PSF of the space leased to the applicable Major Tenant.
If the Hackensack Commons Borrower delivers cash or a letter of credit in the DSCR Cure Amount to cure a DSCR Event, such cash or letter of credit is required to be released to the Hackensack Commons Borrower at any time that the debt service coverage ratio (assuming a 30-year amortization schedule) is equal to or greater than 1.20x for the immediately preceding six consecutive calendar months.
Additional Secured Indebtedness (not including trade debts). Not permitted.
Mezzanine Loan and Preferred Equity. Not permitted.
Release of Property. Not permitted.
Terrorism Insurance. The Hackensack Commons Borrower is required to obtain property insurance covering perils of terrorism and acts of terrorism in an amount equal to 100% of replacement cost, together with eighteen months of business income insurance, to the extent such policies are commercially available. Notwithstanding the foregoing, for so long as the Terrorism Risk Insurance Act of 2002 (as extended and modified by the Terrorism Risk Insurance Program Reauthorization Act of 2015) is in effect (or any extension thereof or other federal government program with substantially similar protection), the lender is required to accept terrorism insurance which covers “covered acts” (as defined by such statute or other program), as full compliance as it relates to the risks required to be covered pursuant to the preceding sentence, so long as such statute or other program covers both domestic and foreign acts of terrorism.
This is not a research report and was not prepared by any Underwriter’s research departments. Please see additional important information and qualifications at the end of this Term Sheet. |
| T-66 |
(THIS PAGE INTENTIONALLY LEFT BLANK)
| T-67 |
| BANK 2017-BNK9 | Colorado Center |
Mortgage Loan No. 6 – Colorado Center
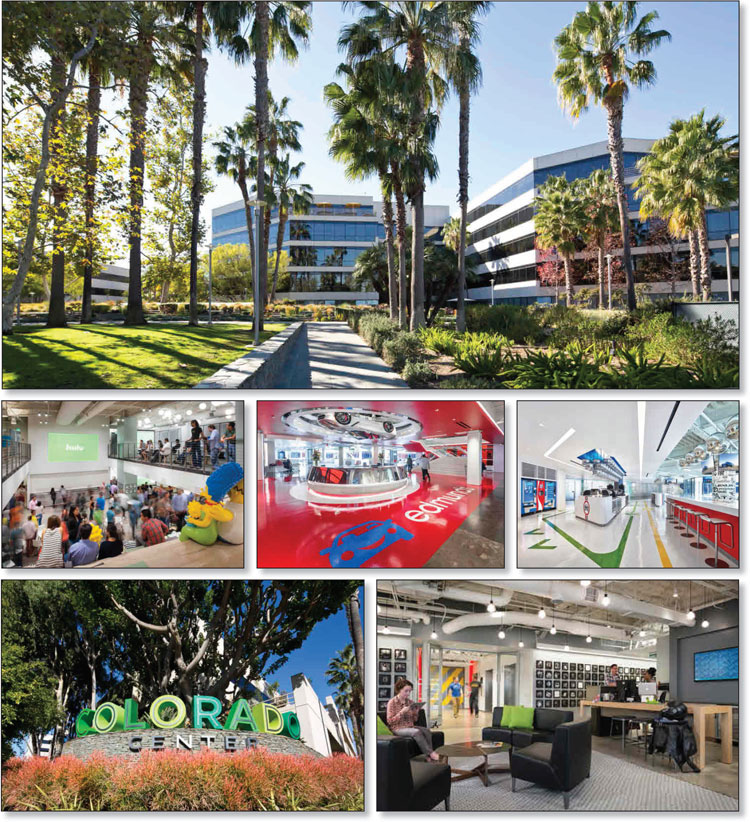
This is not a research report and was not prepared by any Underwriter’s research departments. Please see additional important information and qualifications at the end of this Term Sheet. |
| T-68 |
| BANK 2017-BNK9 | Colorado Center |
Mortgage Loan No. 6 – Colorado Center
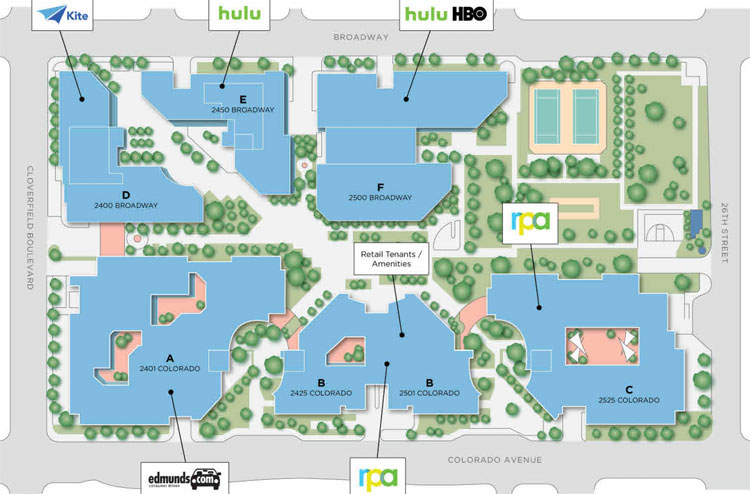
This is not a research report and was not prepared by any Underwriter’s research departments. Please see additional important information and qualifications at the end of this Term Sheet. |
| T-69 |
| BANK 2017-BNK9 | Colorado Center |
Mortgage Loan No. 6 – Colorado Center
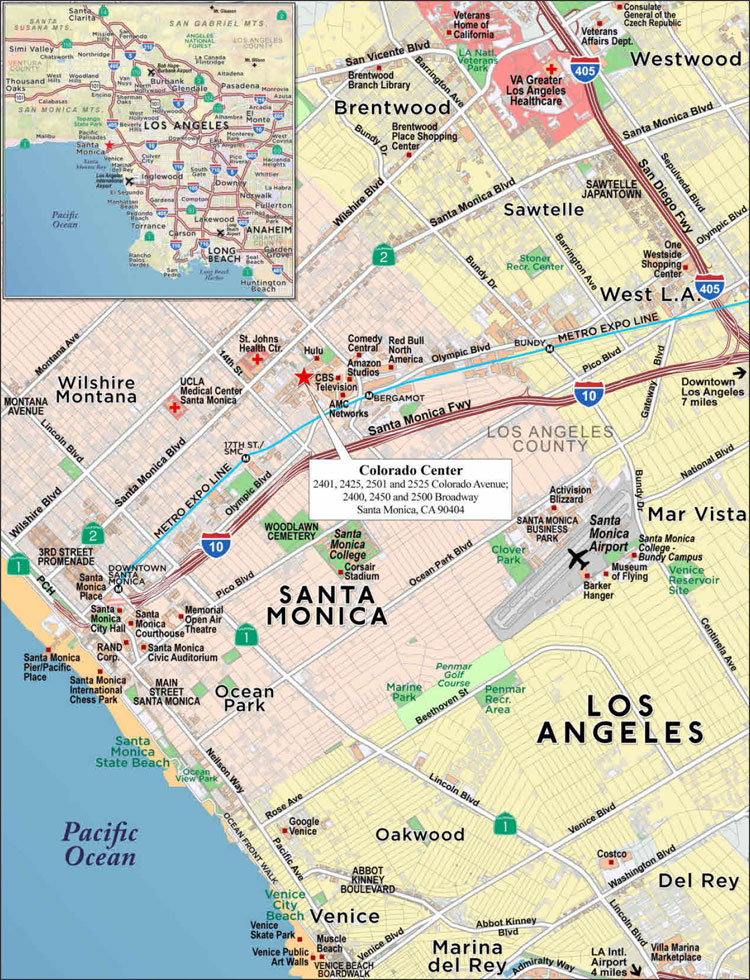
This is not a research report and was not prepared by any Underwriter’s research departments. Please see additional important information and qualifications at the end of this Term Sheet. |
| T-70 |
| BANK 2017-BNK9 | Colorado Center |
| Mortgage Loan No. 6 – Colorado Center |
| Mortgage Loan Information | Property Information | ||||||
| Mortgage Loan Seller: | MSMCH/WFB | Single Asset/Portfolio: | Single Asset | ||||
| Original Balance(1): | $60,000,000 | Location: | Santa Monica, CA 90404 | ||||
| Cut-off Date Balance(1): | $60,000,000 | General Property Type: | Office | ||||
| % of Initial Pool Balance: | 5.7% | Detailed Property Type: | CBD | ||||
| Loan Purpose: | Recapitalization | Title Vesting: | Fee | ||||
| Sponsors: | Boston Properties Limited Partnership; Teachers Insurance and Annuity Association of America | Year Built/Renovated: | 1984-1991/2013-2016 | ||||
| Size: | 1,176,161 SF | ||||||
| Mortgage Rate: | 3.5625% | Cut-off Date Balance per SF(1): | $253 | ||||
| Note Date: | 7/28/2017 | Maturity Date Balance per SF(1): | $253 | ||||
| First Payment Date: | 9/9/2017 | Property Manager: | Boston Properties Limited Partnership (borrower-related) | ||||
| Maturity Date: | 8/9/2027 | ||||||
| Original Term to Maturity: | 120 months | ||||||
| Original Amortization Term: | 0 months | Underwriting and Financial Information | |||||
| IO Period: | 120 months | UW NOI(5): | $55,360,535 | ||||
| Seasoning: | 4 months | ||||||
| Prepayment Provisions(2): | LO (28); DEF (85); O (7) | UW NOI Debt Yield(1): | 18.6% | ||||
| Lockbox/Cash Mgmt Status: | Hard/Springing | UW NOI Debt Yield at Maturity(1): | 18.6% | ||||
| Additional Debt Type(1)(3): | Pari Passu/B-Note | UW NCF DSCR(1): | 4.83x | ||||
| Additional Debt Balance(1)(3): | $238,000,000/$252,000,000 | Most Recent NOI(5): | $23,563,721 (12/31/2016) | ||||
| Future Debt Permitted (Type): | No (N/A) | 2nd Most Recent NOI: | $30,115,359 (12/31/2015) | ||||
| Reserves(4) | 3rd Most Recent NOI: | $44,524,957 (12/31/2014) | |||||
| Type | Initial | Monthly | Cap | Most Recent Occupancy(6): | 91.5% (7/1/2017) | ||
| RE Tax: | $0 | Springing | N/A | 2nd Most Recent Occupancy | 68.0% (12/31/2016) | ||
| Insurance: | $0 | Springing | N/A | 3rd Most Recent Occupancy: | 54.7% (12/31/2015) | ||
| Recurring Replacements: | $0 | $0 | N/A | Appraised Value (as of)(7): | $1,212,500,000 (7/10/2017) | ||
| TI/LC: | $25,193,502 | $0 | N/A | Cut-off Date LTV Ratio(1)(7): | 24.6% | ||
| Other: | $20,761,186 | $0 | N/A | Maturity Date LTV Ratio(1)(7): | 24.6% | ||
| Sources and Uses | ||||||
| Sources | Proceeds | % of Total | Uses | Proceeds | % of Total | |
| Loan Amount: | $550,000,000 | 100.0% | Return of Equity: | $502,636,939 | 91.4% | |
| Reserves: | $45,954,688 | 8.4% | ||||
| Closing Costs: | $1,408,373 | 0.3% | ||||
| Total Sources: | $550,000,000 | 100.0% | Total Uses: | $550,000,000 | 100.0% | |
| (1) | The Colorado Center Mortgage Loan (as defined below) is part of the Colorado Center Whole Loan (as defined below), which is comprised of tenpari passusenior promissory notes with an aggregate principal balance of $298,000,000 and three junior promissory notes that arepari passu with each other with an aggregate principal balance of $252,000,000. The Cut-off Date Balance per SF, Maturity Date Balance per SF, UW NOI Debt Yield, UW NOI Debt Yield at Maturity, UW NCF DSCR, Cut-off Date LTV Ratio and Maturity Date LTV Ratio numbers presented above are based on the aggregate principal balance of the promissory notes comprising the Colorado Center Senior Loans (as defined below), without regard to the Colorado Center Subordinate Companion Loans (as defined below). The Cut-off Date Balance per SF, Maturity Date Balance per SF, UW NOI Debt Yield, UW NOI Debt Yield at Maturity, UW NCF DSCR, Cut-off Date LTV Ratio and Maturity Date LTV Ratio numbers based on the entire $550,000,000 Colorado Center Whole Loan are $468, $468, 10.1%, 10.1%, 2.62x, 45.4% and 45.4%, respectively. |
| (2) | Defeasance of the Colorado Center Whole Loan is permitted at any time after the earlier of (i) July 28, 2020, or (ii) two years from the closing date of the securitization that includes the lastpari passu senior promissory note of the Colorado Center Whole Loan to be securitized. The assumed lockout period of 28 payments is based on the closing date of this transaction in December 2017. |
| (3) | See “The Mortgage Loan,”and“Additional Secured Indebtedness (not including trade debts)” below for further discussion of additional debt. |
| (4) | See “Escrows and Reserves” below for further discussion of reserve requirements. |
| (5) | The increase in UW NOI from the Most Recent NOI reflects the leased occupancy increase from 68.0% to 91.5%. See the “Cash Flow Analysis” table below. |
| (6) | The Colorado Center Property is 91.5% leased and 68.7% physically occupied. Occupancy includes (i) a new 159,310 SF lease to Kite Pharma, Inc. that provides for free rent expiring April 1, 2018 and a partial rent abatement expiring July 1, 2019, which was reserved at loan origination, (ii) two expansion space leases for existing tenant HULU (collectively 45,462 SF) that provide for gap rent through May 31, 2018 and for which gap rent was reserved at loan origination and (iii) an expansion space lease for existing tenant Edmunds.com (62,556 SF) that provides for free rent and abated rent through December 31, 2018, which was reserved at loan origination. |
| (7) | Appraised Value (as of), Cut-off Date LTV Ratio and Maturity Date LTV Ratio with respect to the Colorado Center Senior Loans are based on the “As-Is Assuming Reserves” value of $1,212,500,000 as of July 10, 2017, which assumes upfront reserves of $25,193,502 for existing tenant improvements and leasing commissions costs. Such reserve was escrowed for at loan origination. The Cut-off Date LTV Ratio and Maturity Date LTV Ratio of the Colorado Center Senior Loans (excluding the Colorado Center Subordinate Companion Loans) based on the $1,187,500,000 “As-Is” appraised value are 25.1% and 25.1%, respectively. |
This is not a research report and was not prepared by any Underwriter’s research departments. Please see additional important information and qualifications at the end of this Term Sheet. |
| T-71 |
| BANK 2017-BNK9 | Colorado Center |
The Mortgage Loan. The sixth largest mortgage loan (the “Colorado Center Mortgage Loan”) is part of a whole loan (the “Colorado Center Whole Loan”) in the aggregate original principal amount of $550,000,000. The Colorado Center Whole Loan is secured by a first priority fee mortgage encumbering an office property in Santa Monica, California (the “Colorado Center Property”). The Colorado Center Whole Loan was co-originated by Deutsche Bank AG, New York Branch (“DBNY”), Wells Fargo Bank, National Association (“WFB”) and Morgan Stanley Bank, N.A. The Colorado Center Whole Loan is comprised of (i) a senior loan, comprised of ten senior notes, that arepari passu with each other, with an outstanding principal balance of $298,000,000 (collectively, the “Colorado Center Senior Loans”) and (ii) a subordinate companion loan, comprised of three subordinate notes that arepari passu with each other and subordinate to the Colorado Center Senior Loans, with an outstanding principal balance of $252,000,000 (collectively, the “Colorado Center Subordinate Companion Loans”), each as described below. Promissory Note A-1-C2, which is being contributed by Morgan Stanley Mortgage Capital Holdings LLC (“MSMCH”), in the original principal amount of $40,000,000 and Promissory Note A-3-C2, which is being contributed by WFB, in the original principal amount of $20,000,000, represent the Colorado Center Mortgage Loan and will be included in the BANK 2017-BNK9 securitization trust. Of the remaining Colorado Center Senior Loans (collectively, the “Colorado Center Non-ServicedPari Passu Companion Loans”), the Colorado Center Non-ServicedPari Passu Companion Loans evidenced by Promissory Notes A-1-S, A-2-S and A-3-S, in the aggregate original principal amount of $98,000,000 and all of the Colorado Center Subordinate Companion Loans were contributed to the BXP 2017-CC securitization trust. The Colorado Center Whole Loan will be serviced pursuant to the trust and servicing agreement for the BXP 2017-CC securitization trust. See “Description of the Mortgage Pool—The Whole Loans—The Non-Serviced AB Whole Loan” and “Pooling and Servicing Agreement—Servicing of the Non-Serviced Mortgage Loans” in the Preliminary Prospectus.
| Colorado Center Whole Loan Summary | ||||
| Notes(1) | Original Balance | Cut-off Date Balance | Note Holder | Controlling Interest |
| Colorado Center Senior Loans | ||||
| A-1-C2 & A-3-C2 | $60,000,000 | $60,000,000 | BANK 2017-BNK9 | No |
| A-1-S, A-2-S, A-3-S | $98,000,000 | $98,000,000 | BXP 2017-CC | Yes(2) |
| A-1-C1 & A-3-C1 | $80,000,000 | $80,000,000 | BANK 2017-BNK8 | No |
| A-2-C1 & A-2-C2-1 | $40,000,000 | $40,000,000 | COMM 2017-COR2 | No |
| A-2-C2-2(3) | $20,000,000 | $20,000,000 | DBNY | No |
| Colorado Center Subordinate Companion Loans | ||||
| B-1-S , B-2-S, B-3-S | $252,000,000 | $252,000,000 | BXP 2017-CC | No |
| Colorado Center Whole Loan | $550,000,000 | $550,000,000 | ||
| (1) | The B-Notes are subordinate to the A-Notes. |
| (2) | Note A-1-S is the controlling note. |
| (3) | Promissory Note A-2-C2-2 is expected to be contributed to a future securitization transaction or may be otherwise transferred at any time. |
The Borrower and the Sponsors. The borrower is CA-Colorado Center, L.L.C. (the “Colorado Center Borrower”), a Delaware limited liability company and single purpose entity with two independent directors. The sponsors of the Colorado Center Borrower are Boston Properties Limited Partnership (“BPLP”) and Teachers Insurance and Annuity Association of America, for the benefit of its separate Real Estate Account (“Teachers”). There is no non-recourse carve-out guarantor for the Colorado Center Whole Loan and no environmental indemnitor other than the Colorado Center Borrower.
BPLP is the operating partnership through which Boston Properties, Inc. (“Boston Properties”) conducts its business and owns all of its interests in properties. Boston Properties is a self-administered and self-managed publicly traded real estate investment trust. BPLP is one of the largest owners, managers and developers of Class A office properties in the United States, with significant presence in five markets: Boston, Los Angeles, New York, San Francisco and Washington, D.C. As of May 31, 2017, BPLP owned or had interests in 175 commercial real estate properties, aggregating approximately 48.2 million net rentable SF.
Teachers is one of the largest real estate owners in the world, with reported net assets of $24.8 billion as of June 30, 2017. Teachers was established in 1995 and as of December 31, 2016 owned a total of 129 real estate investments, including 38 office investments. Teachers has no account-level debt, and its proportionate share of mortgage loans payable outstanding on its portfolio was $4.4 billion, representing a loan-to-value ratio of approximately 15.0%.
The Property. The Colorado Center Property is a six-building Class A urban office campus with a three-level underground parking garage containing 3,105 parking spaces (providing a parking ratio of 2.6 spaces per 1,000 SF). The Colorado Center Property is comprised of approximately 1,176,161 SF, including approximately 45,490 SF of retail and amenity space. Amenities at the Colorado Center Property include a health club, food court, swimming pool, and a public park with two tennis courts and a basketball court.
The Colorado Center Property was built between 1984 and 1991. Boston Properties purchased a 50% interest in the Colorado Center Property in July 2016 for an implied purchase price of $1,026,000,000 ($872 PSF). The Colorado Center Property features a full service gym, yoga studio, racquetball and squash courts, an indoor lap pool, tennis and basketball courts, a 3.5- acre park, Wi-Fi and a three story subterranean garage. The Colorado Center Borrower sponsors are also currently planning to further spend approximately $19.1 million in repositioning the Colorado Center Property, which is expected to include a wholesale redevelopment of the retail floor of Building B, replacement of the existing in-line retail tenants with a food hall, renovation of the existing fitness center and redesign of the exterior landscape. However, such renovations are permitted but not required and have not been reserved for under the Colorado Center Whole Loan.
This is not a research report and was not prepared by any Underwriter’s research departments. Please see additional important information and qualifications at the end of this Term Sheet. |
| T-72 |
| BANK 2017-BNK9 | Colorado Center |
The Colorado Center Property has experienced leasing momentum in the last 12 months. Since acquisition in 2016, the Colorado Center Borrower sponsors have signed leases at the Colorado Center Property, improving the leased occupancy from 68.0% to 91.5% as of July 1, 2017. Approximately 135,000 SF of the newly leased space is attributed to expansion leases with tenants HULU and Edmunds.com. In addition, in 2017, Kite Pharma, Inc. signed a new 159,310 SF lease through 2032.
The Colorado Center Property is 91.5% leased as of July 1, 2017 by a diverse roster of tenants, including companies in the technology, entertainment, pharmaceutical, media and advertising industries. The Colorado Center Property serves as the headquarters for HULU (22.3% of NRA, 26.7% of underwritten base rent), Edmunds.com (16.8% of NRA, 20.8% of underwritten base rent), Kite Pharma, Inc. (13.5% of NRA, 17.0% of underwritten base rent), and Rubin Postaer & Associates (15.9% of NRA, 15.1% of underwritten base rent) and is the west coast office for HBO (10.9% of NRA, 12.4% of underwritten base rent).
Major Tenants.
HULU (261,823 SF, 22.3% of NRA, 26.7% of underwritten base rent). HULU, which is headquartered at the Colorado Center Property, is a streaming video service that offers instant access to live and on-demand channels, original series and films, and a library of TV and movies to 32 million subscribers in the U.S. HULU was launched in 2008 and is owned by NBC Universal, The Walt Disney Company, 21st Century Fox and Time Warner Inc. HULU took occupancy at the Colorado Center Property in 2012 with 55,948 SF and has expanded its space multiple times, including 105,037 SF of expansions since March 2016. HULU has two five-year extension options remaining at market rent. HULU is currently in occupancy of 237,155 SF (which includes a 20,794 SF expansion that commenced November 16, 2017) and has executed an expansion for 24,668 SF of space commencing June 1, 2018. HULU has a total of $1,873,813 of gap rent through May 31, 2018, which was reserved at loan origination.
Edmunds.com (197,812 SF, 16.8% of NRA, 20.8% of underwritten base rent). Edmunds.com, which is headquartered at the Colorado Center Property, operates an online platform that provides users access to highly-targeted automotive information, including auto dealer inventory, vehicle reviews, shopping tips, photos, videos, detailed pricing and data. Edmunds.com took occupancy at the Colorado Center Property in 2015 with 135,256 SF and recently executed an expansion lease for an additional 62,556 SF commencing August 1, 2018. Edmunds.com has a total of $5,983,082 of free rent and abated rent through December 31, 2018, which was reserved at loan origination. Edmunds.com has two, five-year extension options at market rent remaining.
Kite Pharma, Inc. (159,310 SF, 13.5% of NRA, 17.0% of underwritten base rent). Kite Pharma, Inc. (NASDAQ: KITE), which is headquartered at the Colorado Center Property, is a publicly-traded biopharmaceutical company engaged in the development and commercialization of cancer immunotherapy products. Kite Pharma, Inc.’s lease at the Colorado Center Property commenced in August 2017 for an initial 15-year lease term through July 2032 and has three five-year extension options at market rent remaining. Kite Pharma, Inc. has taken possession of its space but is not yet in occupancy. Kite Pharma, Inc. has 12 months of free rent commencing on August 1, 2017, and a partial rent abatement for an additional 12 months commencing August 1, 2018, totaling $12,790,705, which was reserved at loan origination.
Rubin Postaer & Associates (“RPA”) (186,894 SF, 15.9% of NRA, 15.1% of underwritten base rent). RPA, which is headquartered at the Colorado Center Property, is an advertising agency founded in 1986. RPA’s services include direct and event marketing, digital marketing, social media marketing, branded entertainment, account management and analytics. RPA serves national accounts including Honda, Farmers Insurance, Southwest Airlines, FX, Apartments.com, Intuit and the Los Angeles Clippers. RPA has two, five-year extension options at market rent remaining and has the option to terminate its lease as of December 31, 2020 with 12 months’ notice by December 31, 2019 and payment of a termination fee equal to six months of base rent.
HBO (128,273 SF, 10.9% of NRA, 12.4% of underwritten base rent). HBO is an American cable and satellite television network that is owned by Time Warner Inc. HBO has provided the Colorado Center Borrower notice of its intent to vacate the Colorado Center Property upon its lease expiration date (June 30, 2019); however, the tenant reportedly requested an approximately nine month extension. The Colorado Center Borrower is currently negotiating a holdover agreement with HBO to formally extend its lease by nine months to March 31, 2020.
This is not a research report and was not prepared by any Underwriter’s research departments. Please see additional important information and qualifications at the end of this Term Sheet. |
| T-73 |
| BANK 2017-BNK9 | Colorado Center |
The following table presents certain information relating to the major tenants at the Colorado Center Property:
| Tenant Summary(1) | |||||||
| Tenant Name | Credit Rating (Fitch/Moody’s/S&P)(2) | Tenant SF | Approximate % of SF | Annual UW Rent(3) | Annual UW Rent PSF(3)(4) | % of Total Annual UW Rent | Lease Expiration |
| Major Tenants | |||||||
| HULU(5) | AA/Aa3/NR | 261,823 | 22.3% | $16,985,607 | $64.87 | 26.7% | 11/15/2021 |
| Edmunds.com(6)(7) | A+/A3/A- | 197,812 | 16.8% | $13,226,003 | $66.86 | 20.8% | 1/31/2028 |
| Kite Pharma, Inc.(8) | BBB+/NR/BBB | 159,310 | 13.5% | $10,829,894 | $67.98 | 17.0% | 7/31/2032 |
| RPA(9) | A-/Baa1/A | 186,894 | 15.9% | $9,569,281 | $51.20 | 15.1% | 12/31/2025 |
| HBO(10) | AAA/Aaa/AAA | 128,273 | 10.9% | $7,857,346 | $61.25 | 12.4% | 6/30/2019 |
| Subtotal/Wtd. Avg. | 934,112 | 79.4% | $58,468,131 | $62.59 | 92.0% | ||
| Other Tenants | 141,825 | 12.1% | $5,091,675 | $35.90 | 8.0% | ||
| Vacant Space | 100,224 | 8.5% | $0 | $0.00 | 0.0% | ||
| Total/Wtd. Avg. | 1,176,161 | 100.0% | $63,559,806 | $59.07 | 100.0% | ||
| (1) | Information is based on the underwritten rent roll as of July 1, 2017. |
| (2) | Certain ratings are those of the parent company whether or not the parent guarantees the lease. |
| (3) | Annual UW Rent and Annual UW Rent PSF include $2,100,026 ($1.95 PSF) of rent steps through August 1, 2018. |
| (4) | Wtd. Avg. Annual UW Rent PSF excludes vacant space. |
| (5) | HULU is currently in occupancy of 237,155 SF (which includes a 20,794 SF expansion that commenced November 16, 2017) and has executed an expansion for an additional 24,668 SF of space commencing June 1, 2018. HULU has a total of $1,873,813 of gap rent through May 31, 2018, which was reserved at loan origination. HULU has two, five-year extension options remaining at market rent. |
| (6) | Edmunds.com is currently in occupancy of 135,256 SF and has executed an expansion for an additional 62,556 SF commencing August 1, 2018. Edmunds.com has a total of $5,983,082 of free rent and abated rent through December 31, 2018, which was reserved at loan origination. Edmunds.com has two, five-year extension options remaining. |
| (7) | Edmunds.com currently leases 195,594 SF of space pursuant to a lease expiring on January 31, 2028 and 2,218 SF of space pursuant to a lease expiring on November 30, 2027. |
| (8) | Kite Pharma, Inc. has taken possession of its space but is not yet in occupancy. Kite Pharma, Inc. has 12 months of free rent commencing on August 1, 2017, and a partial rent abatement for an additional 12 months commencing August 1, 2018, totaling $12,790,705, which was reserved at loan origination. Kite Pharma, Inc. has three, five-year extension options remaining. |
| (9) | RPA has two, five-year extension options remaining and has the right to terminate its lease as of December 31, 2020 with no less than 12 months’ notice by December 31, 2019 and payment of a termination fee equal to six months of base rent at the time of the lease termination. |
| (10) | HBO has provided the Colorado Center Borrower notice of its intent to vacate the Colorado Center Property upon its lease expiration date (June 30, 2019), however, it has reportedly requested an approximately nine month extension and the Colorado Center Borrower is currently negotiating a holdover agreement with HBO to formally extend its lease to March 31, 2020. |
The following table presents certain information relating to the lease rollover schedule at the Colorado Center Property:
| Lease Rollover Schedule(1)(2) | ||||||||
| Year | # of Leases Rolling | SF Rolling | % of Total SF Rolling | Cumulative % of Total SF Rolling | Total UW Base Rent Rolling(3) | UW Rent PSF Rolling(3)(4) | % of UW Base Rent Rolling | Cumulative % of UW Base Rent Rolling |
| MTM | 3 | 1,623 | 0.1% | 0.1% | $42,553 | $26.22 | 0.1% | 0.1% |
| 2017 | 2 | 3,523 | 0.3% | 0.4% | $20,654 | $5.86 | 0.0% | 0.1% |
| 2018 | 2 | 1,495 | 0.1% | 0.6% | $66,398 | $44.41 | 0.1% | 0.2% |
| 2019 | 5 | 130,323 | 11.1% | 11.6% | $7,868,146 | $60.37 | 12.4% | 12.6% |
| 2020 | 1 | 7,576 | 0.6% | 12.3% | $0 | $0.00 | 0.0% | 12.6% |
| 2021 | 10 | 294,711 | 25.1% | 37.3% | $18,635,269 | $63.23 | 29.3% | 41.9% |
| 2022 | 4 | 39,421 | 3.4% | 40.7% | $2,142,511 | $54.35 | 3.4% | 45.3% |
| 2023 | 0 | 0 | 0.0% | 40.7% | $0 | $0.00 | 0.0% | 45.3% |
| 2024 | 0 | 0 | 0.0% | 40.7% | $0 | $0.00 | 0.0% | 45.3% |
| 2025 | 6 | 186,894 | 15.9% | 56.6% | $9,569,281 | $51.20 | 15.1% | 60.3% |
| 2026 | 0 | 0 | 0.0% | 56.6% | $0 | $0.00 | 0.0% | 60.3% |
| 2027 | 3 | 2,218 | 0.2% | 56.8% | $0 | $0.00 | 0.0% | 60.3% |
| 2028 & Beyond | 15 | 408,153 | 34.7% | 91.5% | $25,214,994 | $61.78 | 39.7% | 100.0% |
| Vacant | 0 | 100,224 | 8.5% | 100.0% | $0 | $0.00 | 0.0% | 100.0% |
| Total/Wtd. Avg. | 51 | 1,176,161 | 100.0% | $63,559,806 | $59.07 | 100.0% | ||
| (1) | Information is based on the underwritten rent roll as of July 1, 2017. |
| (2) | Certain tenants may have lease termination options that are exercisable prior to the stated expiration date of the subject lease or leases which are not considered in the lease rollover schedule. |
| (3) | Total UW Base Rent Rolling and UW Rent PSF Rolling include $2,100,026 ($1.95 PSF) of rent steps through August 1, 2018. |
| (4) | Wtd. Avg. UW Rent PSF Rolling excludes vacant space. |
This is not a research report and was not prepared by any Underwriter’s research departments. Please see additional important information and qualifications at the end of this Term Sheet. |
| T-74 |
| BANK 2017-BNK9 | Colorado Center |
The Market. The Colorado Center Property is located on a 15.0-acre site in Santa Monica’s Media and Entertainment District, one block north of the 26th Street/Bergamot Los Angeles County Metro Rail light rail station that connects downtown Santa Monica to Downtown Los Angeles. According to the appraisal, Santa Monica is a supply-constrained office submarket, with only 310,000 SF (4.1% of total submarket inventory as of the end of 2016) of new office supply delivered in the Santa Monica submarket since 2000. The immediate area around the Colorado Center Property features a number of other office projects, including the Water Garden office park located to the south across Colorado Avenue, the 2600 Colorado Avenue office complex located at the southeast corner of Colorado Avenue and 26th Street, and Arboretum Gateway, a mixed-use office and retail development located to the southwest corner of Cloverfield Boulevard and Colorado Avenue.
The Colorado Center Property is situated in the West Los Angeles office market of Los Angeles County, within the Santa Monica office submarket. As of the first quarter of 2017, the 12 office submarkets that comprise the West Los Angeles office market contain approximately 54.3 million SF of office space, and the Santa Monica submarket contained approximately 9.7 million SF of office space, of which approximately 7.3 million SF is characterized as Class A office space.
According to the appraisal, as of the first quarter of 2017, the Santa Monica submarket had a direct vacancy rate of 8.0% and overall vacancy rate (including subleasing) of 9.0%, lower than the West Los Angeles market direct vacancy and overall vacancy of 11.1% and 12.0%, respectively. From the first quarter of 2016 to the first quarter of 2017, Class A office vacancy in the Santa Monica submarket declined from 14.5% to 9.3%.
The appraiser identified 16 comparable recent office leases at six properties ranging in tenant size from 1,003 SF to 189,058 SF. The comparable leases are all located in buildings similar in class and quality to the Colorado Center Property, and in the general competitive market. The comparable leases have terms ranging from six months to 12 years and exhibit a range of rents from $51.00 PSF full service gross to $70.80 PSF full service gross, with an average of $61.72 PSF. Free rent concessions ranged from zero to 10 months. Tenant improvement allowances for new leases ranged from $0.00 to $75.00 PSF full service gross.
The following table presents certain information relating to comparable leases for the Colorado Center Property:
| Comparable Lease Summary | ||||||
| Property Name | Tenant Name | Expense Basis | Lease Area (SF) | Lease Date | Lease Term (Yrs) | Rental Rate (PSF per Year) |
| Water Garden Phase I | Miramax | FSG | 3,521 | 17-Sep | 0.5 | $66.00 |
| Water Garden Phase I | Oracle | FSG | 110,000 | 17-Sep | 6.0 | $63.00 |
| Water Garden Phase I | Angeles Equity Partners | FSG | 4,941 | 17-Aug | 6.2 | $69.00 |
| Water Garden Phase I | GroupM | FSG | 13,343 | 16-Apr | 2.0 | $66.00 |
| Water Garden Phase II | GroupM | FSG | 13,343 | 15-Jul | 0.8 | $63.00 |
| 2700 Colorado | Invesco | FSG | 24,906 | 17-Sep | 6.0 | $70.80 |
| 2700 Colorado | Lions Gate | FSG | 189,058 | 15-Sep | 8.0 | $57.00 |
| Lantana Center | The Littlefield Company | FSG | 1,003 | 17-Jan | 2.0 | $65.40 |
| Lantana Center | Slingshot Global Media | FSG | 3,045 | 16-Sep | 2.2 | $60.00 |
| Lantana Center | Dick Clark Productions | FSG | 11,650 | 16-Apr | 5.0 | $64.80 |
| Lantana Center | Dick Clark Productions | FSG | 11,800 | 16-Apr | 5.0 | $64.80 |
| Pen Factory | Awesomeness TV | NNN | 96,000 | 17-May | 12.0 | $55.80 |
| Santa Monica Business Park | Interactive Data Corporation | FSG | 22,877 | 17-Dec | 5.0 | $60.60 |
| Santa Monica Business Park | Pandora | FSG | 25,347 | 16-May | 8.0 | $51.00 |
| Santa Monica Business Park | S&F Hospice OPCO I, LLC | FSG | 2,346 | 16-May | 10.0 | $58.08 |
| Santa Monica Business Park | Beachhead Studios | FSG | 13,346 | 16-Jan | 3.2 | $52.20 |
Source:Appraisal.
The following table presents certain information relating to the appraiser’s concluded rental rates for the Colorado Center Property:
| Market Rent Conclusion | |||
| Office | Retail | Storage | |
| Market Rent | $69.00 | $48.00 | $0.00 |
| Concessions | 7 mos. | None | None |
| Reimbursements | FSG | NNN | Gross |
| Annual Escalation | 3.5% | 3.5% | 3.5% |
| Tenant Improvements (New) | $35.00 | $35.00 | $0.00 |
| Tenant Improvements (Renewal) | $15.00 | $15.00 | $0.00 |
| Average Lease Term | 7 Years | 5 Years | 5 Years |
| Leasing Commissions (New) | 6.0% | 6.0% | 6.0% |
| Leasing Commissions (Renewal) | 3.0% | 3.0% | 3.0% |
Source:Appraisal.
This is not a research report and was not prepared by any Underwriter’s research departments. Please see additional important information and qualifications at the end of this Term Sheet. |
| T-75 |
| BANK 2017-BNK9 | Colorado Center |
Operating History and Underwritten Net Cash Flow.The following table presents certain information relating to the historical operating performance and the Underwritten Net Cash Flow at the Colorado Center Property:
| Cash Flow Analysis | |||||||
| 2013 | 2014 | 2015 | 2016 | UW | UW PSF | ||
| Base Rent(1) | $50,972,936 | $53,273,430 | $42,763,089 | $33,880,500 | $61,459,780 | $52.25 | |
| Contractual Rent Steps(2) | $0 | $0 | $0 | $0 | $2,100,026 | $1.79 | |
| Free Rent | ($5,410,705) | ($1,460,868) | ($2,635,146) | $0 | $0 | $0.00 | |
| Gross Potential Rent | $45,562,231 | $51,812,562 | $40,127,943 | $33,880,500 | $63,559,806 | $54.04 | |
| Total Recoveries | $2,550,592 | $3,510,275 | $2,613,165 | $1,256,614 | $1,114,063 | $0.95 | |
| Other Income(3) | $7,201,033 | $9,274,869 | $6,290,373 | $5,831,714 | $8,457,149 | $7.19 | |
| Less Vacancy & Credit Loss | $0 | $0 | $0 | $0 | $0 | $0.00 | |
| Effective Gross Income | $55,313,856 | $64,597,706 | $49,031,481 | $40,968,828 | $73,131,018 | $62.18 | |
| Total Expenses | $19,048,534 | $20,072,749 | $18,916,122 | $17,405,107 | $17,770,483 | $15.11 | |
| Net Operating Income | $36,265,322 | $44,524,957 | $30,115,359 | $23,563,721(4) | $55,360,535(4) | $47.07 | |
| Capital Expenditures | $0 | $0 | $0 | $0 | $235,232 | $0.20 | |
| TI/LC | $0 | $0 | $0 | $0 | $3,160,222 | $2.69 | |
| Net Cash Flow | $36,265,322 | $44,524,957 | $30,115,359 | $23,563,721 | $51,965,081 | $44.18 | |
| Occupancy % | 93.9% | 92.6% | 54.7% | 68.0% | 91.5% | ||
| NOI DSCR(5) | 3.37x | 4.14x | 2.80x | 2.19x | 5.14x | ||
| NCF DSCR(5) | 3.37x | 4.14x | 2.80x | 2.19x | 4.83x | ||
| NOI Debt Yield(5) | 12.2% | 14.9% | 10.1% | 7.9% | 18.6% | ||
| NCF Debt Yield(5) | 12.2% | 14.9% | 10.1% | 7.9% | 17.4% | ||
| (1) | UW Base Rent reflects contractual rents as of July 1, 2017. |
| (2) | UW Contractual Rent Steps include rent steps through August 2018. |
| (3) | Other Income is primarily made up of parking revenue and is based on the Colorado Center Borrower’s budget figures. |
| (4) | During 2015, occupancy at the Colorado Center Property declined from 85.0% to 49.9%, when Riot Games, Inc. (which moved to a single tenant headquarters campus in West Los Angeles) and Yahoo! (which left the Colorado Center Property as part of a larger company downsizing) both vacated the Colorado Center Property. The increase in UW NOI from 2016 is due to an occupancy increase from 68.0% to 91.5% as well as the inclusion of Contractual Rent Steps. Edmunds.com commenced paying rent for 133,038 SF of its space ($8,426,627 of base rent) on December 1, 2016. Since 2016, new leases of approximately 300,000 SF ($20.1 million of base rent) have been signed at the Colorado Center Property. |
| (5) | The debt service coverage ratios and debt yields are based on the Colorado Center Senior Loans, and exclude the Colorado Center Subordinate Companion Loans. |
Escrows and Reserves. The Colorado Center Whole Loan documents provide for upfront reserves of $25,193,502 for existing tenant improvements and leasing commissions costs and $20,761,186 for existing gap rent and free rent obligations.
During the continuance of a Cash Management Sweep Period (as defined below), the Colorado Center Whole Loan documents provide for ongoing monthly reserve deposits on each monthly payment date of 1/12 of the estimated annual taxes and, provided an acceptable blanket policy is no longer in place, 1/12 of the estimated annual insurance premiums. Notwithstanding the foregoing, in lieu of making any required monthly reserve payment, or in lieu of reserves previously deposited, the Colorado Center Borrower has the right to deliver to the lender a guaranty from BPLP (a “BPLP Guaranty”) in an aggregate amount equal to such amount the Colorado Center Borrower would otherwise be required to have reserved with the lender (other than with respect to the upfront reserves, which in no event may be replaced by a BPLP Guaranty);provided, however, delivery of the BPLP Guaranty will be permitted only so long as BPLP’s senior unsecured credit rating is “BBB” or higher by S&P and “Baa3” or higher by Moody’s (the “BPLP Guarantor Required Rating”). The aggregate amount guaranteed under any such BPLP Guaranty will be reduced as the Colorado Center Borrower expends funds for the purposes which such funds would have otherwise been deposited in the reserve account. The Colorado Center Borrower may also deliver a letter of credit in lieu of any reserve payments or in lieu of reserves previously deposited. The aggregate amount of any BPLP Guaranty (and the face amount of any letter of credit obtained by BPLP and delivered on behalf of the Colorado Center Borrower) may not at any time exceed 10.0% of the outstanding principal balance of the Colorado Center Whole Loan unless, in connection with the delivery of such new BPLP Guaranty or letter of credit, the Colorado Center Borrower delivers a non-consolidation opinion satisfactory to the lender, and if required by the lender, the rating agencies.
In the event BPLP no longer satisfies the BPLP Guarantor Required Rating, within 10 business days of such downgrade, withdrawal or qualification, the Colorado Center Borrower is required to (i) deposit with the lender cash in the amount of the guaranteed obligations under each BPLP Guaranty then outstanding, and/or (ii) provide the lender with a letter of credit with a face amount equal to the guaranteed obligations under each BPLP Guaranty then outstanding.
Lockbox and Cash Management. The Colorado Center Whole Loan is structured with a hard lockbox and springing cash management. The Colorado Center Borrower and property manager were required at origination to deliver letters to all tenants at the Colorado Center Property directing them to deposit all rents and other payments into a lockbox account. In addition, any rents received by the Colorado Center Borrower or property manager are required to be deposited into the lockbox account within five business days of receipt. Unless a Cash Management Sweep Period is continuing, all funds in the lockbox account are required to be swept within one business day into the Colorado Center Borrower’s operating account. Upon the first occurrence of a Cash Management Sweep Period, the Colorado Center Borrower is required to establish a lender controlled cash management account. During the continuance of a Cash Management Sweep Period, all funds in the lockbox account are required to be swept each business day into such lender-controlled cash management account and disbursed on each payment date to pay debt service on the Colorado Center Whole Loan, to pay escrows and reserves as described above under “Escrows and Reserves,” to pay operating expenses and capital expenditures (in each case as set forth in the annual budget, which is required to be approved by the lender solely during the continuance of a Cash Management Sweep Period), and to disburse any remainder into an account (the “Cash Sweep Account”) to be held as additional security for the Colorado Center Whole Loan during the continuance of such Cash Management Sweep Period;provided, however, if no event of default is continuing, such funds are required to be disbursed to the Colorado Center
This is not a research report and was not prepared by any Underwriter’s research departments. Please see additional important information and qualifications at the end of this Term Sheet. |
| T-76 |
| BANK 2017-BNK9 | Colorado Center |
Borrower within 10 days after the lender’s receipt of a written request from the Colorado Center Borrower (at its election) (a) to pay shortfalls on debt service on the Colorado Center Whole Loan, (b) to disburse monthly operating expenses (including payments to any affiliate of the Colorado Center Borrower if set forth in the approved annual budget or otherwise approved by the lender) as set forth in the approved annual budget, (c) to pay capital expenditures (other than payments to any affiliate of the Colorado Center Borrower unless set forth in the approved annual budget or otherwise approved by the lender) subject to the satisfaction of certain capital expenditure release conditions and (d) to pay tenant improvement costs, tenant improvement allowances or leasing expenses as set forth in the approved annual budget or incurred on commercially reasonable terms in connection with leases which do not require the lender’s approval, subject to satisfaction of certain tenant improvement release conditions or leasing commission/allowance release conditions.
A “Cash Management Sweep Period” will commence upon the occurrence of (a) an event of default under the Colorado Center Whole Loan documents or (b) the interest only debt service coverage ratio being less than 1.20x as of the last day of any calendar quarter and will terminate upon (x) in the case of clause (a), the cure of such event of default, and (y) in the case of clause (b), (A) the interest only debt service coverage ratio of the Colorado Center Whole Loan being 1.20x or greater for one calendar quarter and no event of default is continuing or (B) the Colorado Center Borrower’s delivery of (x) cash, which cash will be held by lender in an additional reserve fund, (y) a letter of credit satisfying the requirements in the Colorado Center Whole Loan documents or (z) so long as BPLP satisfies the BPLP Guarantor Required Rating, a BPLP Guaranty, in each case in an amount that would be required to be prepaid in order for the debt service coverage ratio to equal at least 1.20x.
Additional Secured Indebtedness (not including trade debts). In addition to the Colorado Center Mortgage Loan, the Colorado Center Property also secures the Colorado Center Non-ServicedPari Passu Companion Loans, which have an aggregate Cut-off Date principal balance of $238,000,000 and the Colorado Center Subordinate Companion Loans, which have a Cut-off Date principal balance of $252,000,000. The Colorado Center Subordinate Companion Loans are coterminous with the Colorado Center Mortgage Loan and accrue interest at the same rate as the Colorado Center Mortgage Loan. The Colorado Center Mortgage Loan along with the Colorado Center Non-ServicedPari Passu Companion Loans are eachpari passu in right of payment and the Colorado Center Senior Loans are senior in right of payment to the Colorado Center Subordinate Companion Loans. The holders of the Colorado Center Mortgage Loan, the Colorado Center Non-ServicedPari Passu Companion Loans and the Colorado Center Subordinate Companion Loans have entered into a co-lender agreement that sets forth the allocation of collections on the Colorado Center Whole Loan. See “Description of the Mortgage Pool—The Whole Loans—The Non-Serviced AB Whole Loan” in the Preliminary Prospectus.
Mezzanine Loan and Preferred Equity. Not permitted.
Release of Property. Not permitted.
Terrorism Insurance. So long as the Terrorism Risk Insurance Program Reauthorization Act of 2015 or any replacement, reauthorization or extension thereof (“TRIPRA”) is in effect, the Colorado Center Borrower is required to maintain property insurance that includes terrorism coverage in an amount equal to the full replacement cost of the Colorado Center Property (plus 18 months of business interruption coverage), provided that so long as TRIPRA is in effect and continues to cover both foreign and domestic acts, the lender is required to accept terrorism insurance with coverage against “covered acts” within the meaning of TRIPRA. If TRIPRA is not in effect, then provided that terrorism insurance is commercially available, the Colorado Center Borrower is required to carry terrorism insurance throughout the term of the Colorado Center Whole Loan as described in the preceding sentence, but in that event the Colorado Center Borrower is not required to spend more than two times the amount of the then-current insurance premium that is payable in respect of the property and business interruption insurance required under the related loan documents (without giving effect to the cost of the terrorism, earthquake or flood components of such insurance). See “Risk Factors—Risks Relating to the Mortgage Loans—Terrorism Insurance May Not Be Available for All Mortgaged Properties” in the Preliminary Prospectus.
This is not a research report and was not prepared by any Underwriter’s research departments. Please see additional important information and qualifications at the end of this Term Sheet. |
| T-77 |
| BANK 2017-BNK9 | Park Square |
Mortgage Loan No. 7 – Park Square
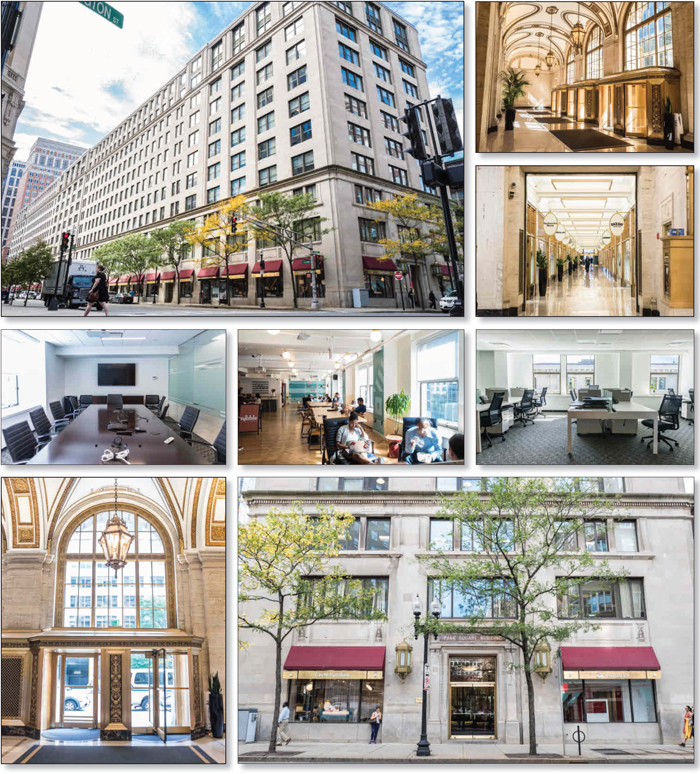
This is not a research report and was not prepared by any Underwriter’s research departments. Please see additional important information and qualifications at the end of this Term Sheet. |
| T-78 |
| BANK 2017-BNK9 | Park Square |
Mortgage Loan No. 7 – Park Square
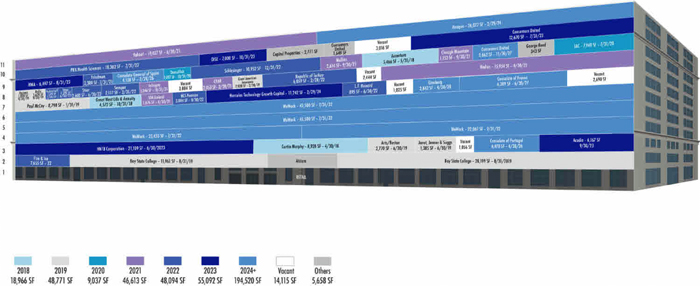
This is not a research report and was not prepared by any Underwriter’s research departments. Please see additional important information and qualifications at the end of this Term Sheet. |
| T-79 |
| BANK 2017-BNK9 | Park Square |
Mortgage Loan No. 7 – Park Square

This is not a research report and was not prepared by any Underwriter’s research departments. Please see additional important information and qualifications at the end of this Term Sheet. |
| T-80 |
| BANK 2017-BNK9 | Park Square |
| Mortgage Loan No. 7 – Park Square |
| Mortgage Loan Information | Property Information | ||||||
| Mortgage Loan Seller: | BANA | Single Asset/Portfolio: | Single Asset | ||||
| Original Balance(1): | $60,000,000 | Location: | Boston, MA 02116 | ||||
| Cut-off Date Balance(1): | $60,000,000 | General Property Type: | Office | ||||
| % of Initial Pool Balance: | 5.7% | Detailed Property Type: | CBD | ||||
| Loan Purpose: | Refinance | Title Vesting: | Fee | ||||
| Sponsor: | Capital Properties | Year Built/Renovated: | 1910/2017 | ||||
| Mortgage Rate: | 4.1460% | Size: | 503,312 SF | ||||
| Note Date: | 10/13/2017 | Cut-off Date Balance per SF(1): | $318 | ||||
| First Payment Date: | 12/1/2017 | Maturity Date Balance per SF(1): | $318 | ||||
| Maturity Date: | 11/1/2027 | Property Manager: | Capital Properties Management, Inc. (borrower-related) | ||||
| Original Term to Maturity: | 120 months | ||||||
| Original Amortization Term: | 0 months | ||||||
| IO Period: | 120 months | Underwriting and Financial Information | |||||
| Seasoning: | 1 month | UW NOI: | $13,294,394 | ||||
| Prepayment Provisions: | LO (25); YM1 (91); O (4) | UW NOI Debt Yield(1): | 8.3% | ||||
| Lockbox/Cash Mgmt Status: | Hard/Springing | UW NOI Debt Yield at Maturity(1): | 8.3% | ||||
| Additional Debt Type(1)(2): | Pari Passu | UW NCF DSCR(1): | 1.89x | ||||
| Additional Debt Balance(1)(2): | $100,000,000 | Most Recent NOI: | $12,011,745 (7/31/2017 TTM) | ||||
| Future Debt Permitted (Type): | No (N/A) | 2nd Most Recent NOI: | $10,747,441 (12/31/2016) | ||||
| Reserves(3) | 3rd Most Recent NOI: | $6,974,885 (12/31/2015) | |||||
| Type | Initial | Monthly | Cap | Most Recent Occupancy: | 95.9% (9/1/2017) | ||
| RE Tax: | $550,336 | $275,168 | N/A | 2nd Most Recent Occupancy: | 84.2% (12/31/2016) | ||
| Insurance: | $0 | Springing | N/A | 3rd Most Recent Occupancy: | 68.9% (12/31/2015) | ||
| Recurring Replacements: | $0 | $8,249 | N/A | Appraised Value (as of): | $281,000,000 (8/9/2017) | ||
| TI/LC: | $3,128,280 | $41,943 | $1,325,000 | Cut-off Date LTV Ratio(1): | 56.9% | ||
| Other: | $1,950,781 | $0 | N/A | Maturity Date LTV Ratio(1): | 56.9% | ||
| Sources and Uses | ||||||
| Sources | Proceeds | % of Total | Uses | Proceeds | % of Total | |
| Loan Amount: | $160,000,000 | 100.0% | Loan Payoff: | $131,856,926 | 82.4% | |
| Return of Equity: | $19,791,002 | 12.4% | ||||
| Reserves: | $5,629,397 | 3.5% | ||||
| Closing Costs: | $2,722,675 | 1.7% | ||||
| Total Sources: | $160,000,000 | 100.0% | Total Uses: | $160,000,000 | 100.0% | |
| (1) | The Park Square Mortgage Loan (as defined below) is part of the Park Square Whole Loan (as defined below), which is comprised of twopari passu promissory notes with an aggregate original principal balance of $160,000,000. The Cut-off Date Balance per SF, Maturity Date Balance per SF, UW NOI Debt Yield, UW NOI Debt Yield at Maturity, UW NCF DSCR, Cut-off Date LTV Ratio and Maturity Date LTV Ratio numbers presented above are based on the aggregate principal balance of the promissory notes comprising the Park Square Whole Loan. |
| (2) | See “The Mortgage Loan” and “Additional Secured Indebtedness (not including trade debts)” below for further discussion of additional debt. |
| (3) | See “Escrows and Reserves” below for further discussion of reserve requirements. |
The Mortgage Loan. The seventh largest mortgage loan (the “Park Square Mortgage Loan”) is part of a whole loan (the “Park Square Whole Loan”) evidenced by twopari passu promissory notes in the aggregate original principal amount of $160,000,000, which are secured by a first priority fee mortgage encumbering a 503,312 SF office property known as Park Square located in Boston, Massachusetts (the “Park Square Property”). The non-controlling Promissory Note A-2 in the original principal amount of $60,000,000 represents the Park Square Mortgage Loan and will be included in the BANK 2017-BNK9 securitization trust. The controlling Promissory Note A-1 in the original principal amount of $100,000,000 (the “Park SquarePari-PassuCompanion Loan”) was contributed to the BANK 2017-BNK8 securitization trust. The Park Square Whole Loan will be serviced pursuant to the pooling and servicing agreement for the BANK 2017-BNK8 securitization trust. See “Description of the Mortgage Pool—The Whole Loans—The Non-Serviced Pari Passu Whole Loans”and“Pooling and Servicing Agreement—Servicing of the Non-Serviced Mortgage Loans”in the Preliminary Prospectus.
The proceeds of the Park Square Whole Loan were used to pay off previous financing secured by the Park Square Property, return equity to the Park Square sponsor, fund reserves and pay closing costs.
The Borrower and the Sponsor. The borrower is OMV Park Square LLC (the “Park Square Borrower”), a single-purpose Delaware limited liability company with at least two independent directors. The sponsor is Capital Properties, a privately owned real estate investment, development and management firm founded in 1977 in Boston, Massachusetts. Since its inception, Capital Properties has developed, acquired and managed more than 17,000 apartment units and 8.0 million SF of office space. Capital Properties’ current portfolio includes 3.5 million SF of Class A office space including six properties in the Boston area: the Park Square Property, Haddon Hall, 360 Newbury Street, S.S. Pierce, Athenaeum Center and Lincoln Plaza. The nonrecourse carve-out guarantors are Richard D. Cohen, founder and President of Capital Properties, and Gary Darman.
This is not a research report and was not prepared by any Underwriter’s research departments. Please see additional important information and qualifications at the end of this Term Sheet. |
| T-81 |
| BANK 2017-BNK9 | Park Square |
The Property. The Park Square Property consists of an 11-story, multi-tenant office building totaling 503,312 SF that includes 26,590 SF of street-level retail. The Park Square Property is located on the north side of St. James Avenue with 663 linear feet of street frontage between Arlington and Berkeley Streets in downtown Boston, Massachusetts. The Park Square Property was built in 1910, renovated in 2010, and between 2014 and 2017 the Park Square sponsor made tenant improvements and capital expenditures at the Park Square Property at a reported cost of approximately $28.2 million. The ground floor of the Park Square Property includes a two-story limestone and marble lobby with arched windows and gold-leaf detail, and is divided by a common hallway that runs the length of the building creating an arcade for restaurant and retail tenants. The office floor plates are 45,500 SF each and can accommodate full and half floor tenants meeting in the central elevator core.
The Park Square Property is located one block from the Boston Public Gardens, within four blocks from Copley Place, Trinity Church and the Boston Public Library, and within less than half a mile of Chinatown, the Boston Common, Emerson College and Tufts Medical Center. The Arlington subway station is adjacent to the Park Square Property and according to the appraisal, this station, which connects to the Park Square Property’s retail atrium, creates traffic counts of approximately 15,000 people daily.
As of September 1, 2017, the Park Square Property was 95.9% occupied. Historical occupancy since 2009 has averaged 86.9%.
| Historical Occupancy | ||||||||
| 2009 | 2010 | 2011 | 2012 | 2013 | 2014 | 2015 | 2016 | 9/1/2017 TTM |
| 93.6% | 92.0% | 93.7% | 93.4% | 85.0% | 75.8% | 68.9% | 84.2% | 95.9% |
The five largest tenants are WeWork (27.2% of NRA), Bay State College (6.5% of NRA), Anaqua, Inc. (5.2% of NRA), HNTB Corporation (4.3% of NRA) and Yahoo Holdings, Inc. (3.9% of NRA), which together represent 47.1% of the net rentable area and 48.3% of underwritten rent. No other tenant comprises more than 3.9% of NRA or 4.3% of underwritten rent.
Major Tenants.
WeWork (136,920 SF, 27.2% of NRA, 27.7% of underwritten rent).WeWork leases three floors under a lease that expires in July 2032 with two five-year renewal options. WeWork is entitled to abated rent on its original space (113,067 SF) for the months of November and December 2017 and November 2018, and abated rent on the expansion space that it took possession of in March 2017 (23,433 SF) until December 2, 2017, which abated rent has been fully reserved by the lender. The WeWork lease is guaranteed by WeWork Companies Inc. WeWork’s space was renovated prior to it taking occupancy, with a $15.6 million tenant improvement allowance provided by the Park Square sponsor. WeWork provides a shared workspace, community and services for a membership base of 120,000 individuals and businesses in 49 cities across 15 countries. WeWork’s corporate members include General Motors, IBM, Spotify and Salesforce. WeWork’s corporate clients at the Park Square Property include Amazon and Liberty Mutual.
Bay State College (32,864 SF, 6.5% of NRA, 5.5% of underwritten rent).Bay State College has been a tenant since 2000 and leases 32,864 SF under a lease that expires in August 2019 with two, five-year renewal options. Bay State College opened in 1947 and is a small, private, career-focused, for-profit college that has been accredited by the New England Association of Schools and Colleges since 1989. Bay State College primarily awards 2-year associate’s degrees, has three locations and approximately 1,100 full time and part time students. The Bay State College library, Bay State College computer labs, and the Bay State College bookstore are all located at the Park Square Property.
Anaqua, Inc. (26,077 SF, 5.2% of NRA, 6.1% of underwritten rent).Anaqua, Inc. has been a tenant since 2015 and leases 26,077 SF under a lease that expires in October 2026 with one, five-year renewal option. The lease requires annual rent increases through the lease term each May. In connection with its expansion space (21,051 SF) that it took possession of in April 2016, Anaqua, Inc. is entitled to abated rent for the month of May 2018, which abated rent has been fully reserved by the lender. Anaqua, Inc. is a web-based unified software platform for automating the full intellectual property lifecycle of patents, trademarks, designs, trade secrets and contracts. Anaqua, Inc. is a privately-held company, headquartered at the Park Square Property, with offices in Cologne-Germany, London-UK and Pau-France and additional offices in the United States, Asia and Europe.
HNTB Corporation (21,749 SF, 4.3% of NRA, 4.9% of underwritten rent). HNTBCorporation has been a tenant since 2008 under a recently renewed lease for 21,109 SF that expires in June 2023 plus 640 SF of storage space that expires in March 2018. In connection with the renewal, HNTB Corporation is entitled to abated rent for the months of April, May and June 2018, which abated rent has been fully reserved by the lender. HNTB Corporation is an architecture, civil engineering, consulting and construction management firm that was founded in 1914.
Yahoo Holdings, Inc. (19,437 SF, 3.9% of NRA, 4.1% of underwritten rent). Yahoo Holdings, Inc. has been a tenant since 2013 under a lease that expires in June 2021, with one, five-year renewal option. Yahoo Holdings, Inc., is a web based service provider owned by Verizon Communications through Oath Inc. Yahoo Holdings, Inc. is known for its Web portal, search engine Yahoo! Search and related services, advertising, online mapping, video sharing, fantasy sports, and its social media website.
This is not a research report and was not prepared by any Underwriter’s research departments. Please see additional important information and qualifications at the end of this Term Sheet. |
| T-82 |
| BANK 2017-BNK9 | Park Square |
The following table presents certain information relating to the major tenants at the Park Square Property:
| Tenant Summary(1) | |||||||
| Tenant Name | Credit Rating (Fitch/Moody’s/S&P)(2) | Tenant SF | Approximate % of SF | Annual UW Rent | % of Total Annual UW Rent | Annual UW Rent PSF(3) | Lease Expiration |
| Major Tenants | |||||||
| WeWork(4) | N/A / NA / NA | 136,920 | 27.2% | $5,458,240 | 27.7% | $39.86 | 7/31/2032 |
| Bay State College | N/A / NA / NA | 32,864 | 6.5% | $1,080,922 | 5.5% | $32.89 | 8/31/2019 |
| Anaqua, Inc.(5) | N/A / NA / NA | 26,077 | 5.2% | $1,199,542 | 6.1% | $46.00 | 10/31/2026 |
| HNTB Corporation(6) | N/A / NA / NA | 21,749 | 4.3% | $960,460 | 4.9% | $44.16 | 6/30/2023 |
| Yahoo Holdings, Inc. | A-/Baa1/BBB+ | 19,437 | 3.9% | $816,354 | 4.1% | $42.00 | 6/30/2021 |
| Subtotal/Wtd. Avg. | 237,047 | 47.1% | $9,515,517 | 48.3% | $40.14 | ||
| Other Tenants | 245,506 | 48.8% | $10,194,641 | 51.7% | $41.53 | ||
| Vacant Space | 20,759 | 4.1% | $0 | 0.0% | $0.00 | ||
| Total/Wtd. Avg. | 503,312 | 100.0% | $19,710,158 | 100.0% | $40.85 | ||
| (1) | Information is based on the underwritten rent roll. |
| (2) | Certain ratings are those of the parent company whether or not the parent guarantees the lease. |
| (3) | Total Wtd. Avg. Annual UW Rent PSF excludes vacant space. |
| (4) | WeWork is entitled to abated rent on 113,067 SF of its space for the months of December 2017 and November 2018, and abated rent on 23,433 SF of its space until December 2, 2017, which amounts have been fully reserved by the lender. |
| (5) | Anaqua, Inc. is entitled to abated rent on 21,015 SF of its space for the month of May 2018, which amounts have been fully reserved by the lender. |
| (6) | HNTB Corporation is entitled to abated rent for the months of April, May and June 2018, which amounts have been fully reserved by the lender. |
The following table presents certain information relating to the lease rollover schedule at the Park Square Property:
| Lease Rollover Schedule(1)(2) | ||||||||
| Year | # of Leases Rolling | SF Rolling | Approx. % of Total SF Rolling | Approx. Cumulative % of SF Rolling | UW Rent PSF Rolling(3) | Total UW Rent Rolling | Approx. % of Total UW Rent Rolling | Approx. Cumulative % of Total UW Rent Rolling |
| MTM/2017 | 14 | 8,494 | 1.7% | 1.7% | $25.42 | $215,896 | 1.1% | 1.1% |
| 2018 | 12 | 27,086 | 5.4% | 7.1% | $40.88 | $1,107,353 | 5.6% | 6.7% |
| 2019 | 17 | 59,452 | 11.8% | 18.9% | $38.50 | $2,288,793 | 11.6% | 18.3% |
| 2020 | 3 | 9,103 | 1.8% | 20.7% | $40.11 | $365,139 | 1.9% | 20.2% |
| 2021 | 17 | 51,322 | 10.2% | 30.9% | $42.07 | $2,158,941 | 11.0% | 31.1% |
| 2022 | 15 | 59,466 | 11.8% | 42.7% | $43.25 | $2,571,702 | 13.0% | 44.2% |
| 2023 | 7 | 55,171 | 11.0% | 53.7% | $43.18 | $2,382,351 | 12.1% | 56.3% |
| 2024 | 7 | 20,054 | 4.0% | 57.6% | $39.33 | $788,635 | 4.0% | 60.3% |
| 2025 | 0 | 0 | 0.0% | 57.6% | $0.00 | $0 | 0.0% | 60.3% |
| 2026 | 4 | 34,685 | 6.9% | 64.5% | $44.62 | $1,547,668 | 7.9% | 68.1% |
| 2027 | 4 | 9,251 | 1.8% | 66.4% | $46.66 | $431,629 | 2.2% | 70.3% |
| 2028 & Beyond | 20 | 148,469 | 29.5% | 95.9% | $39.42 | $5,852,052 | 29.7% | 100.0% |
| Vacant | 0 | 20,759 | 4.1% | 100.0% | $0.00 | $0 | 0.0% | 100.0% |
| Total/Wtd. Avg. | 120 | 503,312 | 100.0% | $40.85 | $19,710,158 | 100.0% | ||
| (1) | Information is based on the underwritten rent roll. Certain tenants may have co-terminous leases which are consolidated as presented. |
| (2) | Certain tenants may have lease termination options that are exercisable prior to the originally stated expiration date of the subject lease and that are not considered in the lease rollover schedule. |
| (3) | Total/Wtd. Avg. UW Base Rent PSF Rolling excludes vacant space. |
The Market. The Park Square Property is located at 31 St. James Avenue in the Back Bay area of Boston, Massachusetts, surrounded by several prominent buildings including the John Hancock Tower and the Prudential Center. The Back Bay/Fenway area is served by commuter and rapid transit subway lines with stops at Back Bay, Arlington and Copley. Additionally, the area is served by Interstates 90 and 93 and by Logan International Airport. Major employers include Fidelity Investments, State Street, John Hancock, Liberty Mutual, MFA, Manulife, Wellington Management, Bank of America, and Putnam Investments, all located within two miles of the Park Square Property. Nearby residential neighborhoods such as Back Bay, Beacon Hill, and the South End, are located within approximately one mile from the Park Square Property and provide a source of technical personnel, middle management personnel and executives. In addition to its employment base, the area is accessible to the Cambridge and Route 128 submarkets, all within 20 minutes driving time.
According to a third party research report, the Back Bay area is approximately one mile west of Boston’s Financial District but commands higher rental rates and has a lower vacancy than the neighboring area. The Park Square Property is located in the Back Bay submarket within the Boston office market which as of the second quarter of 2017 had an inventory of 50 buildings (14,044,000 SF) with a vacancy rate of 8.2% and average asking rents of $55.01 PSF, as compared to the broader Boston market with a vacancy rate of 12.1% and asking rents of $38.53 PSF.
This is not a research report and was not prepared by any Underwriter’s research departments. Please see additional important information and qualifications at the end of this Term Sheet. |
| T-83 |
| BANK 2017-BNK9 | Park Square |
According to the appraisal, the estimated 2017 population within a one-, three- and five-mile radius of the Park Square Property was 88,860, 513,595 and 970,953, respectively and the estimated 2017 median household income within the same radii was $74,860, $63,957 and $64,460, respectively.
According to the appraisal, there are no new office buildings under construction in the submarket.
The following table presents recent leasing data at comparable office buildings with respect to the Park Square Property:
| Comparable Lease Summary | |||||||
| Property Name/Address | Year Built/ Renovated | Total NRA (SF) | Tenant Name | Lease Area (SF) | Lease Date / Term | Initial Rent PSF | TI PSF/ Free Rent |
| Office Building 116 Huntington Ave. | 1990 / N/A | 285,978 | Brigham & Women’s Hospital Saylent Technologies Inc. | 26,284 5,794 | Apr-18 / 64 mos May-17 / 86 mos | $53.00 $54.00 | $20.00 / 4 mos $95.00 / 2 mos |
| 75 Arlington Street 75 Arlington St. | 1900 / 1980 | 244,000 | The Boston Foundation | 25,500 | Jul-17 / 159 mos | $48.50 | $63.33 / 2 mos |
| One Exeter Plaza 699 Boylston St. | 1983 / 2000 | 211,000 | Bainco International Investors | 6,035 | Mar-17 / 88 mos | $59.00 | $45.00 / 4 mos |
| 185 Dartmouth Street 441 Stuart St. | 1937 / 2014 | 164,509 | The Presidents and Trustees of Williams College | 6,219 | Feb-17 / 124 mos | $49.00 | $80.00 / 4 mos |
| 75 Park Plaza 300 Boylston St. | 1984 / N/A | 165,000 | Paratek Pharmaceuticals | 4,153 | Nov-16 / 56 mos | $53.00 | $60.00 / 4 mos |
| The Newbry 501 Boylston St. | 1941 / 2009 | 607,685 | Trunk Club | 17,587 | Nov-16 / 150 mos | $48.00 | $65.00 / 6 mos |
Source:Appraisal.
Operating History and Underwritten Net Cash Flow.The following table presents certain information relating to the historical operating performance and the Underwritten Net Cash Flow at the Park Square Property:
| Cash Flow Analysis | ||||||
| 2014 | 2015 | 2016 | 7/31/2017 TTM | UW | UW PSF | |
| Gross Potential Rent(1) | $18,065,640 | $18,758,126 | $19,307,939 | $19,683,868 | $20,663,580 | $41.06 |
| Total Recoveries | $1,600,591 | $1,568,261 | $1,690,421 | $1,704,697 | $1,511,655 | $3.00 |
| Total Other Income(2) | $220,675 | $195,599 | $221,295 | $252,486 | $203,438 | $0.40 |
| Less Vacancy | ($5,085,327) | ($6,157,800) | ($3,236,643) | ($2,116,447) | ($1,108,762) | (5.2%) |
| Effective Gross Income | $14,801,579 | $14,364,186 | $17,983,012 | $19,524,604 | $21,269,911 | $42.26 |
| Total Operating Expenses | $7,537,195 | $7,389,301 | $7,235,571 | $7,512,859 | $7,975,517 | $15.85 |
| Net Operating Income | $7,264,384 | $6,974,885 | $10,747,441 | $12,011,745 | $13,294,394 | $26.41 |
| Capital Expenditures | $0 | $0 | $0 | $0 | $98,987 | $0.20 |
| TI/LC | $0 | $0 | $0 | $0 | $503,312 | $1.00 |
| Net Cash Flow | $7,264,384 | $6,974,885 | $10,747,441 | $12,011,745 | $12,692,096 | $25.22 |
| Occupancy % | 75.8% | 68.9% | 84.2% | 90.2%(3) | 95.0% | |
| NOI DSCR(4) | 1.08x | 1.04x | 1.60x | 1.79x | 1.98x | |
| NCF DSCR(4) | 1.08x | 1.04x | 1.60x | 1.79x | 1.89x | |
| NOI Debt Yield(4) | 4.5% | 4.4% | 6.7% | 7.5% | 8.3% | |
| NCF Debt Yield(4) | 4.5% | 4.4% | 6.7% | 7.5% | 7.9% | |
| (1) | UW Gross Potential Rent includes contractual rent steps through October 2018 totaling $409,366. |
| (2) | UW Total Other Income includes antenna income, HVAC income, tenant service fees, late fees, damage/cleaning fees and other miscellaneous income. |
| (3) | Occupancy as of August 8, 2017. |
| (4) | Debt service coverage ratios and debt yields are based on the Park Square Whole Loan. |
Escrows and Reserves. The Park Square Borrower deposited at loan origination $550,336 for real estate taxes and is required to deposit monthly 1/12th of the annual estimated real estate taxes due (initially $275,168) and 1/12th of the annual estimated insurance premiums due (unless the Park Square Property is covered by an acceptable blanket insurance policy). The Park Square Borrower is also required to deposit monthly $8,249 to a replacement reserve.
The Park Square Borrower deposited at loan origination $3,128,280 to a leasing reserve in connection with tenant improvements and leasing commissions relating to eight tenants and is required to deposit monthly $41,943 to the general leasing reserve, which leasing reserve is capped at $1,325,000. The Park Square Borrower deposited at loan origination $1,950,781 for abated rent relating to eleven tenants.
This is not a research report and was not prepared by any Underwriter’s research departments. Please see additional important information and qualifications at the end of this Term Sheet. |
| T-84 |
| BANK 2017-BNK9 | Park Square |
Lockbox and Cash Management.The Park Square Whole Loan has a hard lockbox in place with springing cash management whereby the Park Square Borrower is required to direct all tenants at the Park Square Property to deposit all rents directly to a lockbox account and upon a Cash Sweep Period (as defined below) all funds in the lockbox account are required to be swept each business day to a lender-controlled cash management account and disbursed in accordance with the Park Square Whole Loan documents, with all excess cash from the Park Square Property required to be held by lender as additional security for the Park Square Whole Loan. Provided no event of default has occurred, upon the cure of the Cash Sweep Period, the excess cash will be disbursed to the Park Square Borrower.
A “Cash Sweep Period” means (a) a DSCR Sweep Period (as defined below), (b) a Major Tenant Sweep Period (as defined below), or (c) any period during which an event of default is continuing.
A “DSCR Sweep Period” will commence when the debt service coverage ratio is less than 1.25x and will end when the debt service coverage ratio equals or exceeds 1.30x for two consecutive calendar quarters.
A “Major Tenant Sweep Period” will commence upon the first to occur of (i) the WeWork tenant or guarantor being in default in the payment of rent beyond applicable notice and cure periods, (ii) the WeWork tenant or guarantor giving notice of termination or vacating any portion in excess of 20% of its space, (iii) any termination or cancellation of the WeWork lease (including rejection in any insolvency proceeding) and/or the WeWork lease failing to otherwise be in full force and effect, (iv) any bankruptcy or similar insolvency of the WeWork tenant or guarantor and (v) the WeWork tenant or guarantor failing to extend or renew its lease 12 months prior to expiration. A Major Tenant Sweep Period will expire upon the first to occur of (1) satisfaction of the Major Tenant Cure Conditions (as defined below) or (2) the entire WeWork space being leased to an acceptable replacement tenant for an acceptable lease term, with the replacement tenant being in physical occupancy of the space, open for business and paying full rent.
“Major Tenant Cure Conditions” means each of the following, as applicable (i) the WeWork tenant or guarantor has cured all defaults under its lease, (ii) the WeWork tenant or guarantor has revoked or rescinded all termination or cancellation notices with respect to its lease and has reaffirmed the lease as being in full force and effect, (iii) in the event the Major Tenant Sweep Period is due to the WeWork tenant’s or guarantor’s failure to extend or renew its lease, the WeWork lease being renewed or extended, (iv) with respect to any applicable bankruptcy or insolvency proceedings involving the WeWork tenant or guarantor, the WeWork tenant or guarantor no longer being insolvent or subject to any bankruptcy or insolvency proceedings and affirming the WeWork Lease pursuant to a final, non-appealable order of a court and (v) the WeWork tenant or guarantor paying full, unabated rent under the WeWork Lease.
Additional Secured Indebtedness (not including trade debts).The Park Square Property also secures the Park SquarePari Passu Companion Loan, which has a Cut-off Date principal balance of $100,000,000. The Park SquarePari Passu Companion Loan accrues interest at the same rate as the Park Square Mortgage Loan. The Park Square Mortgage Loan is entitled to payments of interest on a pro rata and pari passu basis with the Park SquarePari Passu Companion Loan. The holders of the Park Square Mortgage Loan and the Park SquarePari Passu Companion Loan have entered into a co-lender agreement which sets forth the allocation of collections on the Park Square Whole Loan. See “Description of the Mortgage Pool—The Whole Loans” in the Preliminary Prospectus.
Mezzanine Loan and Preferred Equity.Not permitted.
Release of Property.Not permitted.
Terrorism Insurance.The Park Square Whole Loan documents require that the property insurance policy required to be maintained by the Park Square Borrower provide coverage for perils of terrorism and acts of terrorism in an amount equal to the full replacement cost of the Park Square Property, and 24 months of business interruption insurance with 12 months of extended indemnity, provided that if the Terrorism Risk Insurance Program Reauthorization Act of 2002 or subsequent statute (“TRIPRA”) is not in effect the Park Square Borrower will not be required to pay annual premiums in excess of two times the premium for a separate policy insuring the Park Square Property on a stand-alone basis. See “Risk Factors—Risks Relating to the Mortgage Loans—Terrorism Insurance May Not Be Available for All Mortgaged Properties” in the Preliminary Prospectus.
This is not a research report and was not prepared by any Underwriter’s research departments. Please see additional important information and qualifications at the end of this Term Sheet. |
| T-85 |
| BANK 2017-BNK9 | BWI Airport Marriott |
Mortgage Loan No. 8 – BWI Airport Marriott

This is not a research report and was not prepared by any Underwriter’s research departments. Please see additional important information and qualifications at the end of this Term Sheet. |
| T-86 |
| BANK 2017-BNK9 | BWI Airport Marriott |
Mortgage Loan No. 8 – BWI Airport Marriott
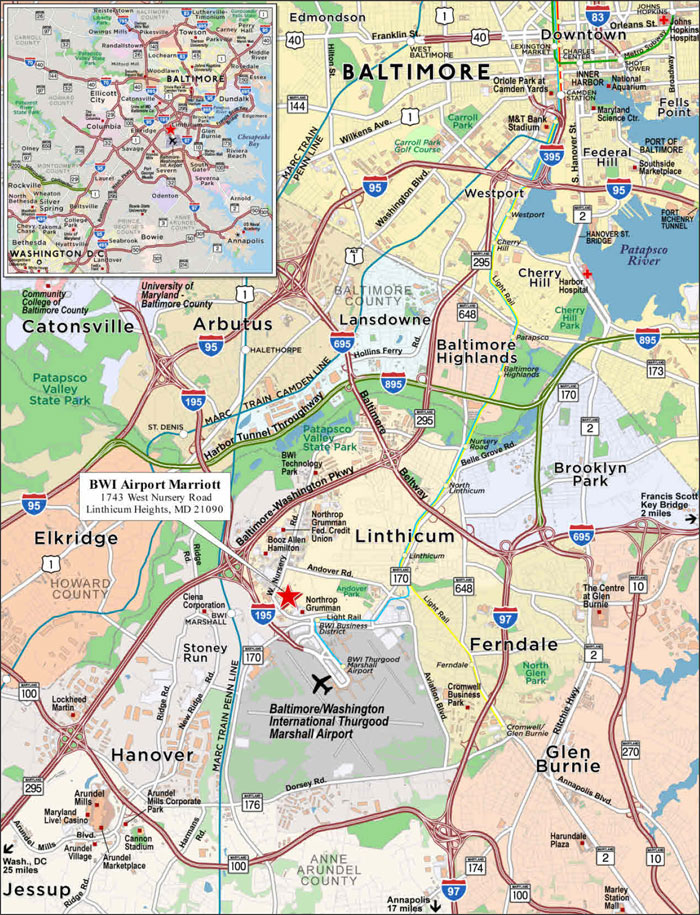
This is not a research report and was not prepared by any Underwriter’s research departments. Please see additional important information and qualifications at the end of this Term Sheet. |
| T-87 |
| BANK 2017-BNK9 | BWI Airport Marriott |
| Mortgage Loan No. 8 – BWI Airport Marriott |
| Mortgage Loan Information | Property Information | ||||||
| Mortgage Loan Seller: | BANA | Single Asset/Portfolio: | Single Asset | ||||
| Original Balance: | $47,700,000 | Location: | Linthicum Heights, MD 21090 | ||||
| Cut-off Date Balance: | $47,700,000 | General Property Type: | Hospitality | ||||
| % of Initial Pool Balance: | 4.5% | Detailed Property Type: | Full Service | ||||
| Loan Purpose: | Refinance | Title Vesting: | Fee | ||||
| Sponsor: | Graham Snell | Year Built/Renovated: | 1988/2017 | ||||
| Mortgage Rate: | 4.8200% | Size: | 315 Rooms | ||||
| Note Date: | 11/14/2017 | Cut-off Date Balance per Room: | $151,429 | ||||
| First Payment Date: | 1/1/2018 | Maturity Date Balance per Room: | $124,047 | ||||
| Maturity Date: | 12/1/2027 | Property Manager: | Marriott Hotel Services, Inc. | ||||
| Original Term to Maturity: | 120 months | ||||||
| Original Amortization Term: | 360 months | Underwriting and Financial Information | |||||
| IO Period: | 0 months | UW NOI: | $5,835,051 | ||||
| Seasoning: | 0 months | UW NOI Debt Yield: | 12.2% | ||||
| Prepayment Provisions: | LO (24); YM1 (92); O (4) | UW NOI Debt Yield at Maturity: | 14.9% | ||||
| Lockbox/Cash Mgmt Status: | Soft/In Place | UW NCF DSCR: | 1.61x | ||||
| Additional Debt Type: | N/A | Most Recent NOI: | $5,723,511 (9/30/2017 TTM) | ||||
| Additional Debt Balance: | N/A | 2nd Most Recent NOI: | $5,358,067 (12/31/2016) | ||||
| Future Debt Permitted (Type): | No (N/A) | 3rd Most Recent NOI: | $5,587,935 (12/31/2015) | ||||
| Reserves(1) | Most Recent Occupancy: | 75.1% (9/30/2017) | |||||
| Type | Initial | Monthly | Cap | 2nd Most Recent Occupancy: | 74.9% (12/31/2016) | ||
| RE Tax: | $0 | (1) | N/A | 3rd Most Recent Occupancy: | 75.5% (12/31/2015) | ||
| Insurance: | $0 | (1) | N/A | Appraised Value (as of): | $68,200,000 (8/1/2017) | ||
| FF&E Reserve: | $0 | (1) | N/A | Cut-off Date LTV Ratio(2): | 69.9% | ||
| Other: | $1,700,000 | $0 | N/A | Maturity Date LTV Ratio(2): | 57.3% | ||
| Sources and Uses | ||||||
| Sources | Proceeds | % of Total | Uses | Proceeds | % of Total | |
| Loan Amount: | $47,700,000 | 100.0% | Loan Payoff: | $35,997,933 | 75.5% | |
| Return of Equity(3): | $9,025,696 | 18.9% | ||||
| Reserves: | $1,700,000 | 3.6% | ||||
| Closing Costs: | $976,371 | 2.0% | ||||
| Total Sources: | $47,700,000 | 100.0% | Total Uses: | $47,700,000 | 100.0% | |
| (1) | See“Escrows and Reserves” below for further detail on the reserve requirements. Reserves for real estate taxes, insurance premiums and FF&E are required to be collected by the lender at any time such reserves are not otherwise collected and paid by the BWI Airport Marriott Manager. |
| (2) | The appraiser provided an “as stabilized” value of $77,600,000 as of August 1, 2020, which would result in a Cut-off Date LTV Ratio of 61.5% and a Maturity Date LTV Ratio of 50.4%. |
| (3) | The BWI Airport Marriott sponsor maintains an un-depreciated cost basis in the BWI Airport Marriott Property of $69,327,058. |
The Mortgage Loan. The eighth largest mortgage loan (the “BWI Airport Marriott Mortgage Loan”) is evidenced by a promissory note in the original principal amount of $47,700,000 that is secured by a first priority fee mortgage encumbering a full service hotel located in Linthicum Heights, Maryland, known as the BWI Airport Marriott (the “BWI Airport Marriott Property”). The proceeds of the BWI Airport Marriott Mortgage Loan were used to pay off existing debt, fund reserves, pay closing costs and return equity to the BWI Airport Marriott sponsor. The BWI Airport Marriott Property was previously collateral for a loan securitized in the MSBAM 2013-C13 transaction.
The Borrower and the Sponsor. The borrower is Hibernia BWI Hotel, LP (the “BWI Airport Marriott Borrower”), a Delaware limited partnership with at least one independent director. The BWI Airport Marriott Borrower is indirectly owned by Hibernia Worldwide Hotels BV, a Netherlands based asset management company.
The nonrecourse carve-out guarantor is Graham Snell, who is a managing director of Hibernia Hotel Fund, a hotel joint venture between Capital Hospitality Group and Halifax Bank of Scotland, created to own hotels in Europe, Asia and the United States.
The Property. The BWI Airport Marriott Property is a 10-story, 315-room full service hotel featuring an indoor swimming pool, a 24-hour fitness room, a business center and 476 surface parking spaces. The BWI Airport Marriott Property offers its guests complimentary high-speed internet access, a complimentary hotel shuttle to and from the Baltimore Washington Thurgood Marshall Airport (“BWI Airport”) and the Baltimore Light Rail, room service, a 152-seat restaurant serving three meals daily, a 150-seat sports bar/lounge and 15,622 SF of meeting space across 19 rooms. The BWI Airport Marriott Property was built in 1988, and from 2007-2016, underwent $10,997,000 ($35,589 per room) of capital improvements, including a $3,397,000 rooms renovation in 2012 and 2013. In 2017, guestroom suites were converted to increase the available rooms at the BWI Airport Marriott Property from 309 rooms to 315 rooms. The current guestroom mix includes 161 king rooms and 154 double/double rooms.
This is not a research report and was not prepared by any Underwriter’s research departments. Please see additional important information and qualifications at the end of this Term Sheet. |
| T-88 |
| BANK 2017-BNK9 | BWI Airport Marriott |
According to the appraisal, the demand at the BWI Airport Marriott Property is estimated at 60% commercial and leisure, 30% meeting and group and 10% contract. The top corporate accounts for 2016 were Northrop Grumman (4,948 room nights), IBM (3,079 room nights), General Dynamics Global (2,366 room nights), Lockheed Martin (1,537 room nights) and University of Maryland (1,242 room nights).
The BWI Airport Marriott Property is managed by Marriott Hotel Services, Inc. (the “BWI Airport Marriott Manager” or the “BWI Airport Marriott Franchisor”) under a management agreement (the “Management Agreement” or the “Franchise Agreement”) dated August 29, 2003, which was amended in November 2017 to extend the initial term to December 31, 2033. The Management Agreement contains two ten-year automatic renewals unless the BWI Airport Marriott Manager elects to not renew and provides 12 months’ notice of non-renewal.
The Marriott affiliation provides the BWI Airport Marriott Property with access to a reservation system that is very well known to business travelers and access to Marriott’s corporate accounts in the immediate area including Deloitte, Northrup Grumman, IBM and Lockheed Martin.
More specific information about the BWI Airport Marriott Property and the related competitive set is set forth in the following table:
| Historical Occupancy, ADR, RevPAR | |||||||||
Competitive Set(1) | BWI Airport Marriott Property | Penetration Factor | |||||||
| Year | Occupancy | ADR | RevPAR | Occupancy | ADR | RevPAR | Occupancy | ADR | RevPAR |
| 2008 | 70.4% | $121.34 | $85.42 | 74.9% | $141.37 | $105.83 | 106.3% | 116.5% | 123.9% |
| 2009 | 68.9% | $112.29 | $77.33 | 71.9% | $121.33 | $87.29 | 104.5% | 108.0% | 112.9% |
| 2010 | 76.2% | $105.44 | $80.35 | 75.9% | $120.61 | $91.56 | 99.6% | 114.4% | 113.9% |
| 2011 | 68.5% | $113.72 | $77.87 | 78.3% | $121.94 | $95.51 | 114.4% | 107.2% | 122.7% |
| 2012 | 72.1% | $113.64 | $81.91 | 77.6% | $123.55 | $95.82 | 107.6% | 108.7% | 117.0% |
| 2013 | 73.5% | $110.33 | $81.12 | 75.2% | $126.21 | $94.91 | 102.3% | 114.4% | 117.0% |
| 2014 | 73.0% | $113.28 | $82.74 | 77.1% | $130.75 | $100.87 | 105.6% | 115.5% | 121.9% |
| 2015 | 71.5% | $116.74 | $83.50 | 75.5% | $137.15 | $103.54 | 105.5% | 117.5% | 124.0% |
| 2016 | 71.9% | $116.51 | $83.73 | 74.9% | $135.81 | $101.74 | 104.2% | 116.6% | 121.5% |
| 9/30/2017 TTM | 74.9% | $117.79 | $88.28 | 75.0% | $134.90 | $101.16 | 100.1% | 114.5% | 114.6% |
Source:Industry Report and Underwritten Operating Statements.
| (1) | As of 9/30/2017 TTM, the competitive set includes Embassy Suites Baltimore @BWI Airport, Hyatt Place Baltimore Washington Airport, Holiday Inn Baltimore BWI Airport Area, Westin Baltimore Washington Airport, Hilton Baltimore BWI Airport and Sheraton Hotel Baltimore Washington Airport. |
The Market. The BWI Airport Marriott Property is located along West Nursery Road in Linthicum, Anne Arundel County, Maryland, approximately 1.5 miles northwest of BWI Airport and just north of Interstate 195, which connects to Interstates 95 and 295, leading to downtown Baltimore in approximately 8.8 miles.
The local area is anchored by Harborplace in downtown Baltimore, east of the BWI Airport Marriott Property, with other nearby attractions including Maryland Science Center, National Aquarium in Baltimore, Baltimore Zoo, Orioles Park at Camden Yards, M&T Bank Stadium and the University of Maryland – Baltimore. Additionally, hotel demand generators include the Fort Meade Military Base, which is home to the National Security Agency and the U.S. Cyber Command, the Naval Academy located in Annapolis which is home to 4,400 undergraduate students.
Large nearby corporations include Booz Allen Hamilton (0.5 miles from the BWI Airport Marriott Property) which employs 1,100 employees in Anne Arundel County, Ciena Corporation (0.7 miles from the BWI Airport Marriott Property), which is headquartered in Linthicum, Northrop Grumman Electronic System (0.8 miles from the BWI Airport Marriott Property) which is the largest private sector employer in Anne Arundel County, and Lockheed Martin (7.5 miles from the BWI Airport Marriott Property). Other corporations with a presence the area include CSC, Boeing, Harris Corporation, IBM Toyota, Oracle, and Deloitte.
According to the appraisal, BWI Airport and the Port of Baltimore are significant economic drivers for the Baltimore region. BWI Airport had total passenger travel of over 25.1 million in 2016, is the east coast hub for Southwest Airlines and recently launched a $60 million expansion of its international terminal, which is expected to be completed in 2017 and will add six new gates. The Port of Baltimore is one of only two ports on the East Coast prepared to accommodate the cargo ships from the expanded Panama Canal, which connects Asian markets to the East Coast markets of the United States.
According to the appraisal, the 2016 estimated population within a one-, three- and five-mile radius of the BWI Airport Marriott Property was 997, 37,225 and 190,813, respectively. The 2016 average household income within the same radii was $114,317, $100,521 and $88,289, respectively. From 2000-2016, within a five-mile radius of the BWI Airport Marriott Property, population and average household income grew 0.9% and 2.9%, respectively.
This is not a research report and was not prepared by any Underwriter’s research departments. Please see additional important information and qualifications at the end of this Term Sheet. |
| T-89 |
| BANK 2017-BNK9 | BWI Airport Marriott |
The following table presents certain information relating to the primary competitive properties to the BWI Airport Marriott Property:
| Competitive Property Summary | ||||||||
| Property Name | Year Opened | Rooms | Transient | Meeting/ Group | Contract | 2016 Occupancy Penetration | 2016 ADR Penetration | 2016 RevPAR Penetration |
| BWI Airport Marriott Property | 1988 | 309 | 60% | 30% | 10% | 102.4% | 111.0% | 113.6% |
| Embassy Suites Baltimore @ BWI Airport | 1987 | 251 | 70% | 20% | 5% | 92.9% | 99.5% | 92.5% |
| Hyatt Place Baltimore Washington Airport | 1996 | 127 | 70% | 10% | 20% | 103.9% | 96.3% | 100.0% |
| Holiday Inn Baltimore BWI Airport Area | 1997 | 137 | 70% | 10% | 20% | 105.2% | 87.3% | 91.9% |
| Westin Baltimore Washington Airport | 2007 | 260 | 60% | 20% | 20% | 95.7% | 97.1% | 92.9% |
| Hilton Baltimore Washington Airport | 2006 | 280 | 75% | 15% | 10% | 106.6% | 109.3% | 116.5% |
| Sheraton Hotel Baltimore Washington Airport | 2007 | 203 | 60% | 15% | 25% | 95.7% | 84.0% | 80.4% |
Source:Appraisal.
The appraiser did not note any properties either proposed or under construction that would directly compete with the BWI Airport Marriott Property.
Operating History and Underwritten Net Cash Flow. The following table presents certain information relating to the historical operating performance and the Underwritten Net Cash Flow at the BWI Airport Marriott Property:
| Cash Flow Analysis | |||||||
| 2013 | 2014 | 2015 | 2016 | 9/30/2017 TTM | UW | UW per Room | |
| Occupancy | 75.1% | 77.1% | 75.5% | 74.9% | 75.1% | 75.1% | |
| ADR | $122.00 | $130.77 | $137.15 | $135.81 | $134.90 | $134.90 | |
| RevPAR | $91.62 | $100.82 | $103.55 | $101.72 | $101.31 | $101.31 | |
| Rooms Revenue | $10,725,000 | $11,376,000 | $11,677,493 | $11,505,776 | $11,427,112 | $11,648,998 | $36,981 |
| Food & Beverage | $7,104,000 | $7,841,000 | $7,927,442 | $7,763,311 | $7,555,432 | $7,555,432 | $23,985 |
| Other Income(1) | $679,000 | $810,000 | $800,062 | $728,730 | $738,199 | $738,199 | $2,343 |
| Total Revenue | $18,508,000 | $20,027,000 | $20,404,997 | $19,997,817 | $19,720,743 | $19,942,629 | $63,310 |
| Total Expenses | $13,948,000 | $14,663,000 | $14,817,062 | $14,639,750 | $13,997,232 | $14,107,578 | $44,786 |
| Net Operating Income | $4,560,000 | $5,364,000 | $5,587,935 | $5,358,067 | $5,723,511 | $5,835,051 | $18,524 |
| FF&E | $925,000 | $1,001,000 | $1,020,239 | $999,891 | $986,037 | $997,131 | $3,165 |
| Net Cash Flow | $3,635,000 | $4,363,000 | $4,567,696 | $4,358,176 | $4,737,474 | $4,837,920 | $15,358 |
| NOI DSCR | 1.51x | 1.78x | 1.86x | 1.78x | 1.90x | 1.94x | |
| NCF DSCR | 1.21x | 1.45x | 1.52x | 1.45x | 1.57x | 1.61x | |
| NOI Debt Yield | 9.6% | 11.2% | 11.7% | 11.2% | 12.0% | 12.2% | |
| NCF Debt Yield | 7.6% | 9.1% | 9.6% | 9.1% | 9.9% | 10.1% | |
| (1) | Other Income includes vending machines, telecommunications, rentals, and other miscellaneous sources. |
Escrows and Reserves.At any time that amounts for taxes and insurance premiums are not held and paid by the BWI Airport Marriott Manager pursuant to the Management Agreement, the BWI Airport Marriott Borrower is required to deposit monthly (i) real estate taxes in an amount equal to 1/12th of estimated annual taxes due and (ii) insurance reserves in an amount equal to 1/12th of estimated annual premiums due (unless waived because the BWI Airport Marriott Property is covered by a blanket insurance policy).
The BWI Airport Marriott Borrower deposited at loan origination $1,700,000 to be applied towards capital improvements at the BWI Airport Marriott Property. Additionally, a monthly amount equal to 1/12th of 4% of the greater of annual gross revenues and the amount required by the Franchisor for FF&E is required to be held by the BWI Airport Marriott Manager pursuant to the Management Agreement, or if not held by the BWI Airport Marriott Manager, such monthly amount is required to be deposited in reserve with the lender.
Lockbox and Cash Management.A soft lockbox is in place with respect to the BWI Airport Marriott Mortgage Loan. All hotel revenue with respect to the BWI Airport Marriott Property is deposited in an account to which the BWI Airport Marriott Manager has access (the “Hotel Operating Account”). The BWI Airport Marriott Manager is required to pay operating expenses (other than debt service) from the Hotel Operating Account pursuant to the Management Agreement, and may deduct from the Hotel Operating Account its base management fee and expenses and funds for FF&E reserves and amounts for real estate taxes and insurance premiums. The BWI Airport Marriott Manager is required to make all payments of operating profit due to the BWI Airport Marriott Borrower directly into the lockbox, and the BWI Airport Marriott Manager is required to instruct those who maintain accounts receivable with respect to the hotel to make payments of amounts due on such accounts receivable directly to the lockbox.
The BWI Airport Marriott Mortgage Loan features in-place cash management, whereby funds in the lockbox account are required to be transferred daily to the lender-controlled cash management account to fund any required reserves (unless held and paid by the BWI Airport Marriott Manager pursuant to the Management Agreement) and to pay debt service, with any remaining funds released to the BWI Airport Marriott Borrower so long as no Cash Sweep Period (as defined below) exists. During a Cash Sweep Period, funds in the cash management account (after collections for reserves and debt service) are required to be disbursed to pay operating expenses, capital expenditures and extraordinary expenses with all excess cash held by the lender as additional security for the BWI Airport Marriott Mortgage Loan until discontinuation of the Cash Sweep Period.
This is not a research report and was not prepared by any Underwriter’s research departments. Please see additional important information and qualifications at the end of this Term Sheet. |
| T-90 |
| BANK 2017-BNK9 | BWI Airport Marriott |
A “Cash Sweep Period” will commence upon the earliest of (i) the occurrence of an event of default, (ii) the debt service coverage ratio being less than 1.20x for two consecutive calendar quarters, (iii) a Franchise Agreement Trigger Event (as defined below), or (iv) a Franchise Renewal Trigger Event (as defined below);provided,however, that the BWI Airport Marriott Borrower has the right to avoid the commencement of a cash sweep period triggered under clause (ii) by partially prepaying the BWI Airport Marriott Mortgage Loan in an amount necessary to satisfy the debt service coverage ratio test (together with payment of a yield maintenance charge).
A Cash Sweep Period will end upon (i) if triggered by an event of default, the cure of the event of default, (ii) if triggered by the debt service coverage ratio test, the debt service coverage ratio being equal to or greater than 1.30x on a trailing twelve month basis for two consecutive calendar quarters, (iii) if triggered by the Franchise Agreement Trigger Event, the occurrence of the applicable Franchise Agreement Cure Event (as defined below), and (iv) if triggered by a Franchise Renewal Trigger Event, the occurrence of a Franchise Renewal Event (as defined below). Notwithstanding the foregoing, a Cash Sweep Period will not expire in the event that a Cash Sweep Period then exists for any other reason.
A “Franchise Agreement Trigger Event” will occur upon (i) the BWI Airport Marriott Borrower being in default under the Franchise Agreement beyond any notice and cure periods, (ii) the BWI Airport Marriott Borrower or the BWI Airport Marriott Franchisor giving notice that it is terminating the Franchise Agreement, (iii) any termination, cancellation or expiration of the Franchise Agreement (including rejection in any bankruptcy or similar insolvency proceeding) and/or the Franchise Agreement otherwise failing to be in full force and effect, or (iv) any bankruptcy or insolvency of the BWI Airport Marriott Franchisor.
A “Franchise Renewal Trigger Event” will occur upon a Franchise Renewal Event (as defined below) failing to occur on or before the date which is 12 months prior to the expiration of the then applicable term of the Franchise Agreement.
A “Franchise Agreement Cure Event” will occur upon (i) the date which is 60 days after the cure of all defaults (if any) by the BWI Airport Marriott Borrower, (ii) the Franchise Agreement being reaffirmed by the BWI Airport Marriott Borrower and the BWI Airport Marriott Franchisor as being in full force and effect, and (iii) if triggered by the bankruptcy or insolvency of the BWI Airport Marriott Franchisor, the BWI Airport Marriott Franchisor no longer being insolvent or subject to any bankruptcy proceedings and the Franchise Agreement being affirmed pursuant to a final, non-appealable order of a court.
A “Franchise Renewal Event” will occur upon (i) the Franchise Agreement being extended or replaced by a qualified franchise agreement for a term expiring no earlier than 3 years after the maturity date of the BWI Airport Marriott Mortgage Loan, (ii) the Franchise Agreement or the qualified franchise agreement being in full force and effect with no defaults thereunder, and (iii) the BWI Airport Marriott Borrower having deposited to the FF&E reserve either in cash or as a letter of credit an amount equal to the excess of $10,000 per room over the operating profit estimated by the BWI Airport Marriott Franchisor under its business plan during the final fiscal year under the Management Agreement.
Additional Secured Indebtedness (not including trade debts).Not permitted.
Mezzanine Loan and Preferred Equity.Not permitted.
Release of Property.Not permitted.
Terrorism Insurance. The BWI Airport Marriott Mortgage Loan documents require that the property insurance policy required to be maintained by the BWI Airport Marriott Borrower provides coverage for perils of terrorism and acts of terrorism in an amount equal to the full replacement cost of the BWI Airport Marriott Property, and 18 months of business interruption insurance with 6 months of extended indemnity;providedthat, for so long as the Terrorism Risk Insurance Act of 2002, as extended and modified by the Terrorism Risk Insurance Program Reauthorization Act of 2015 (as the same may be further modified, amended, or extended, “TRIPRA”) or subsequent statute, extension, or reauthorization is in effect and covers both foreign and domestic acts of terror, the provisions of TRIPRA will determine the acts of terrorism for which coverage will be required. See “Risk Factors—Risks Relating to the Mortgage Loans—Terrorism Insurance May Not Be Available for All Mortgaged Property” in the Preliminary Prospectus.
This is not a research report and was not prepared by any Underwriter’s research departments. Please see additional important information and qualifications at the end of this Term Sheet. |
| T-91 |
| BANK 2017-BNK9 | U.S. Industrial Portfolio III |
Mortgage Loan No. 9 – U.S. Industrial Portfolio III
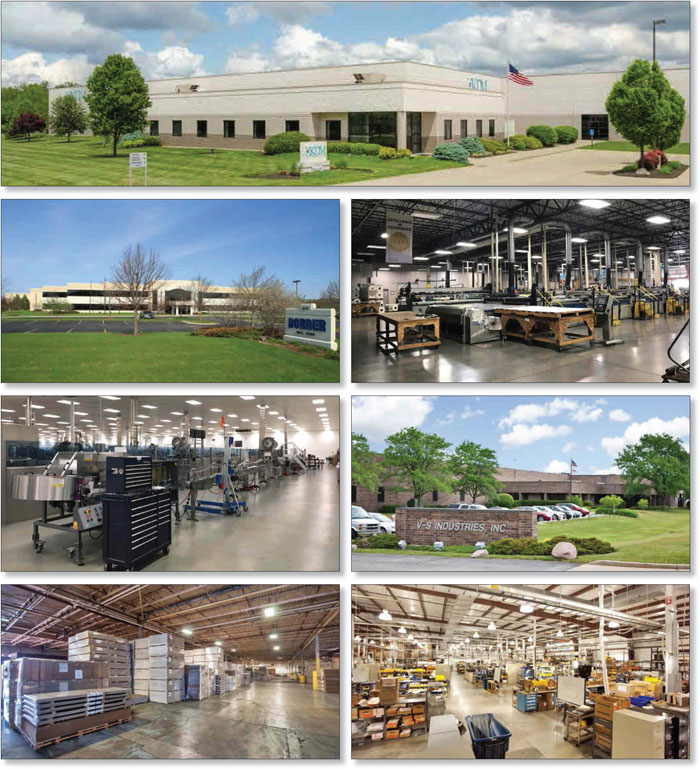
This is not a research report and was not prepared by any Underwriter’s research departments. Please see additional important information and qualifications at the end of this Term Sheet. |
| T-92 |
| BANK 2017-BNK9 | U.S. Industrial Portfolio III |
Mortgage Loan No. 9 – U.S. Industrial Portfolio III

This is not a research report and was not prepared by any Underwriter’s research departments. Please see additional important information and qualifications at the end of this Term Sheet. |
| T-93 |
| BANK 2017-BNK9 | U.S. Industrial Portfolio III |
| Mortgage Loan No. 9 – U.S. Industrial Portfolio III |
| Mortgage Loan Information | Property Information | ||||||
| Mortgage Loan Seller: | MSMCH | Single Asset/Portfolio: | Portfolio | ||||
| Original Balance(1): | $40,000,000 | Location: | Various | ||||
| Cut-off Date Balance(1): | $40,000,000 | General Property Type(5): | Various | ||||
| % of Initial Pool Balance: | 3.8% | Detailed Property Type: | Various | ||||
| Loan Purpose: | Acquisition | Title Vesting: | Fee | ||||
| Sponsor: | Brennan Investment Group Acquisitions LLC | Year Built/Renovated: | Various/Various | ||||
| Size: | 2,886,593 SF | ||||||
| Mortgage Rate: | 4.1800% | Cut-off Date Balance per SF(1): | $42 | ||||
| Note Date: | 10/12/2017 | Maturity Date Balance per SF(1): | $38 | ||||
| First Payment Date: | 12/5/2017 | Property Manager: | Brennan Management, LLC (borrower-related) | ||||
| Maturity Date: | 11/5/2027 | ||||||
| Original Term: | 120 months | ||||||
| Original Amortization Term: | 360 months | ||||||
| IO Period: | 60 months | Underwriting and Financial Information | |||||
| Seasoning: | 1 month | UW NOI: | $11,310,590 | ||||
| Prepayment Provisions(2): | LO (25); DEF (88); O (7) | UW NOI Debt Yield(1): | 9.4% | ||||
| Lockbox/Cash Mgmt Status: | Hard/Springing | UW NOI Debt Yield at Maturity(1): | 10.3% | ||||
| Additional Debt Type(1)(3): | Pari Passu | UW NCF DSCR(1): | 2.04x (IO) 1.48x (P&I) | ||||
| Additional Debt Balance(1)(3): | $80,537,149 | Most Recent NOI: | $12,203,308 (6/30/2017 TTM) | ||||
| Future Debt Permitted (Type): | No (N/A) | 2nd Most Recent NOI: | $12,055,263 (12/31/2016) | ||||
| Reserves(4) | 3rd Most Recent NOI: | $11,626,063 (12/31/2015) | |||||
| Type | Initial | Monthly | Cap | Most Recent Occupancy(6): | 100.0% (11/1/2017) | ||
| RE Tax: | $0 | Springing | N/A | 2nd Most Recent Occupancy: | 100.0% (12/31/2016) | ||
| Insurance: | $0 | Springing | N/A | 3rd Most Recent Occupancy: | 100.0% (12/31/2015) | ||
| Recurring Replacements: | $0 | $6,250 | N/A | Appraised Value (as of)(7): | $166,300,000 (6/16/2017) | ||
| TI/LC: | $120,000 | Springing | N/A(4) | Cut-off Date LTV Ratio(1)(7): | 72.5% | ||
| Other: | $453,411 | $0 | N/A | Maturity Date LTV Ratio(1)(7): | 66.1% | ||
| Sources and Uses | ||||||
| Sources | Proceeds | % of Total | Uses | Proceeds | % of Total | |
| Loan Amount: | $120,537,149 | 71.2% | Purchase Price: | $164,603,823 | 97.2% | |
| Borrower Sponsor Equity: | $48,798,629 | 28.8% | Closing Costs: | $4,158,544 | 2.5% | |
| Reserves: | $573,411 | 0.3% | ||||
| Total Sources: | $169,335,778 | 100.0% | Total Uses: | $169,335,778 | 100.0% | |
| (1) | The U.S. Industrial Portfolio III Mortgage Loan is part of the U.S. Industrial Portfolio III Whole Loan (as defined below), which is comprised of threepari passu promissory notes with an aggregate principal balance of $120,537,149. The Cut-off Date Balance per SF, Maturity Date Balance per SF, UW NOI Debt Yield, UW NOI Debt Yield at Maturity, UW NCF DSCR, Cut-off Date LTV Ratio and Maturity Date LTV Ratio numbers presented above are based on the aggregate principal balance of the promissory notes comprising the U.S. Industrial Portfolio III Whole Loan. |
| (2) | Defeasance is permitted at any time after the earlier to occur of (i) the end of the two-year period commencing on the closing date of the securitization of the last U.S. Industrial Portfolio III Whole Loan promissory note to be securitized and (ii) October 12, 2020. The assumed lockout period of 25 payments is based on the closing date of this transaction in December 2017. After the defeasance lockout period, the U.S. Industrial Portfolio III Borrowers are permitted to obtain the release of any individual property with the defeasance of a release price ranging from 100.0% to 110.0% (depending on the number of properties that have been released) of the allocated loan amount with respect to such individual property See “Release of Property” below. |
| (3) | See “The Mortgage Loan” and “Additional Secured Indebtedness (not including trade debts)” for a discussion of additional debt. |
| (4) | See “Escrows and Reserves” below for further discussion of reserve requirements. |
| (5) | The U.S. Industrial Portfolio III Properties (as defined below) are made up of 19 industrial properties and two office properties. See the “U.S. Industrial Portfolio III Properties Summary” table below. |
| (6) | Most Recent Occupancy includes PNC Acquisition Company, Inc. (75,902 SF, 2.6% of NRA), which leases 100.0% of the space at the 900 Chaddick Drive property but is currently dark. |
| (7) | The “As Portfolio” Appraised Value of $166,300,000 reflects a 4.0% premium attributed to the aggregate “As-is” value of the U.S. Industrial Portfolio III Properties as a whole. The sum of the “As-is” values for each of the U.S. Industrial Portfolio III Properties on an individual basis is $159,940,000, which represents a Cut-off Date LTV Ratio and Maturity Date LTV Ratio of 75.4% and 68.7%, respectively. |
The Mortgage Loan. The ninth largest mortgage loan (the “U.S. Industrial Portfolio III Mortgage Loan”) is part of a whole loan (the “U.S. Industrial Portfolio III Whole Loan”) evidenced by three promissory notes with an aggregate original principal balance of $120,537,149. The U.S. Industrial Portfolio III Whole Loan is secured by the fee simple interests in a portfolio of 21 single-tenant industrial and office properties located across 10 states, totaling 2,886,593 SF (the “U.S. Industrial Portfolio III Properties”). The U.S. Industrial Portfolio III Whole Loan was co-originated by Morgan Stanley Bank, N.A. and Barclays Bank PLC. Promissory Note A-1-2, with an original principal balance of $40,000,000, represents the U.S. Industrial Portfolio III Mortgage Loan and will be included in the BANK 2017-BNK9 securitization trust. Promissory Notes A-1-1 and A-2, with an aggregate original principal balance of $80,537,149, collectively represent thepari passu companion loans (the “U.S. Industrial Portfolio III Non-ServicedPari Passu Companion Loans”).
This is not a research report and was not prepared by any Underwriter’s research departments. Please see additional important information and qualifications at the end of this Term Sheet. |
| T-94 |
| BANK 2017-BNK9 | U.S. Industrial Portfolio III |
The following table presents a summary of the promissory notes comprising the U.S. Industrial Portfolio III Whole Loan. The U.S. Industrial Portfolio III Whole Loan will be serviced pursuant to the pooling and servicing agreement for the BANK 2017-BNK8 securitization trust. See “Description of the Mortgage Pool—The Whole Loans—The Non-Serviced Pari Passu Whole Loans” and “Pooling and Servicing Agreement—Servicing of the Non-Serviced Mortgage Loans” in the Preliminary Prospectus.
| U.S. Industrial Portfolio III Whole Loan Summary | ||||
| Notes | Original Balance | Cut-off Date Balance | Note Holder | Controlling Interest |
| A-1-1 | $50,000,000 | $50,000,000 | BANK 2017-BNK8 | Yes |
| A-1-2 | $40,000,000 | $40,000,000 | BANK 2017-BNK9 | No |
| A-2 | $30,537,149 | $30,537,149 | WFCM 2017-C41(1) | No |
| U.S. Industrial Portfolio III Whole Loan | $120,537,149 | $120,537,149 | ||
| (1) | The WFCM 2017-C41 securitization transaction is expected to close on November 30, 2017. |
The proceeds of the U.S. Industrial Portfolio III Whole Loan, together with approximately $48.8 million of borrower equity, were used to acquire the U.S. Industrial Portfolio III Properties, fund reserves and pay closing costs. The previous mortgage loan secured by the U.S. Industrial Portfolio III Properties was included in the WFRBS 2013-C16 securitization trust.
The Borrowers and the Sponsor. The borrowers consist of 21 single-purpose Delaware limited liability companies, each structured to be bankruptcy-remote with at least two independent directors (the “U.S. Industrial Portfolio III Borrowers”). The non-recourse carveout guarantors under the U.S. Industrial Portfolio III Whole Loan are, collectively, jointly and severally, Michael Brennan, Robert Vanecko, Scott McKibben, Sam Mandarino, Allen Crosswell, Troy MacMane and Greenwood Holding Company, LLC. The U.S. Industrial Portfolio III Borrowers are indirectly owned 10% by USIP III Manager LLC (of which Michael Brennan and William Vanecko are non-member managers) and 90% by Northstar Summit Holding III, LLC. Northstar Summit Holding III, LLC is indirectly owned by Deep Springs, L.P., a Cayman Island limited partnership owned by non-U.S. investors, of which the general partner is Morningstar Summit Holdings Company Limited and the manager is CDH Real Estate Investment Management Company Limited, which is controlled by Li Guo, William Shang Wi Hsu and Xiaoming Song. The non-recourse carveout guarantors collectively own 1.6% of the equity in the U.S. Industrial Portfolio III Borrowers.
The sponsor of the U.S. Industrial Portfolio III Whole Loan is Brennan Investment Group Acquisitions LLC, an affiliate of Brennan Investment Group. Each of the non-recourse carveout guarantors under the U.S. Industrial Portfolio III Whole Loan is a principal of Brennan Investment Group (“Brennan”). Brennan is a real estate investment firm specializing in investments in industrial properties. Brennan Management LLC (an affiliate of Brennan) manages industrial assets. Affiliates of Brennan own a portfolio of industrial properties totaling approximately 33.0 million SF. Michael Brennan, the co-founder and chairman of Brennan, was the co-founder of First Industrial Realty Trust in 1994 and served as President, CEO and a member of the Board of Directors until 2008.
The Properties. The U.S. Industrial Portfolio III Properties are comprised of 21 single tenant industrial and office properties totaling approximately 2.9 million SF. The U.S. Industrial Portfolio III Properties are located across 10 states, with the largest concentration of properties in Ohio (28.1% of NRA), Virginia (24.1% of NRA) and Florida (13.0% of NRA). The U.S. Industrial Portfolio III Properties were built between 1952 and 2015, range in size from approximately 32,688 SF to 378,270 SF and are all leased on a triple-net basis. As of October 1, 2017 the weighted average remaining lease term for the U.S. Industrial Portfolio III Properties was approximately 11.8 years. The U.S. Industrial Portfolio III Properties consist of 19 industrial properties (approximately 96.6% of NRA) and two suburban office properties. The U.S. Industrial Portfolio III Properties serve as a headquarters location for nine tenants. The U.S. Industrial Portfolio III Properties are 100.0% leased to 18 tenants as of November 1, 2017.
This is not a research report and was not prepared by any Underwriter’s research departments. Please see additional important information and qualifications at the end of this Term Sheet. |
| T-95 |
| BANK 2017-BNK9 | U.S. Industrial Portfolio III |
The following table presents detailed information with respect to each of the U.S. Industrial Portfolio III Properties:
| U.S. Industrial Portfolio III Properties Summary(1) | |||||||||
| Property Name | Location | Property Type | SF | Year Built / Renovated | Allocated Loan Amount | % of Allocated Loan Amount | Appraised Value | UW NOI(2) | |
| 2121 Gardner Street | Elliston, VA | Industrial | 378,270 | 2000 / NAP | $16,504,712 | 13.7% | $21,900,000 | $1,674,703 | |
| 975 Cottonwood Avenue | Hartland, WI | Industrial | 175,042 | 2000, 2015 / NAP | $10,174,137 | 8.4% | $13,500,000 | $1,018,666 | |
| 4925 Bulls Bay Highway | Jacksonville, FL | Industrial | 198,408 | 2006 / NAP | $9,910,363 | 8.2% | $13,150,000 | $986,726 | |
| 1500 Southeast 37th Street | Grimes, IA | Industrial | 248,257 | 1961 / 2017 | $7,536,398 | 6.3% | $10,000,000 | $716,745 | |
| 1501 Industrial Boulevard | Harleysville, PA | Industrial | 112,253 | 1973 / 2013 | $7,385,670 | 6.1% | $9,800,000 | $658,271 | |
| 10450 Medallion Drive | Cincinnati, OH | Industrial | 151,506 | 1998 / NAP | $7,385,670 | 6.1% | $9,800,000 | $783,609 | |
| 1001 DDC Way | Fairfield, OH | Office | 66,444 | 1981 / 2004 | $6,413,475 | 5.3% | $8,510,000 | $686,609 | |
| 1152 Armorlite Drive | San Marcos, CA | Industrial | 44,313 | 1986 / NAP | $5,222,724 | 4.3% | $6,930,000 | $335,570 | |
| 3800 West Broward Boulevard | Plantation, FL | Office | 32,688 | 1956 / 2010 | $5,124,751 | 4.3% | $6,800,000 | $548,720 | |
| 2900 & 2950 Hill Avenue | Toledo, OH | Industrial | 237,698 | 1955 / NAP | $5,087,069 | 4.2% | $6,750,000 | $541,032 | |
| 1700 Highland Road | Twinsburg, OH | Industrial | 115,169 | 1986, 1996 / NAP | $4,917,500 | 4.1% | $6,525,000 | $506,714 | |
| 1972 Salem Industrial Drive | Salem, VA | Industrial | 317,144 | 1972 / NAP | $4,898,659 | 4.1% | $6,500,000 | $536,163 | |
| 1800 University Parkway | Sarasota, FL | Industrial | 105,752 | 1965 / NAP | $4,823,295 | 4.0% | $6,400,000 | $479,598 | |
| 621 Hunt Valley Circle | New Kensington, PA | Industrial | 61,796 | 2002 / 2009 | $3,918,927 | 3.3% | $5,200,000 | $491,244 | |
| 5000 Askins Lane | Houston, TX | Industrial | 100,040 | 1978 / NAP | $3,655,153 | 3.0% | $4,850,000 | $339,211 | |
| 900 Chaddick Drive(3) | Wheeling, IL | Industrial | 75,902 | 1982 / NAP | $3,542,107 | 2.9% | $4,700,000 | ($314,806) | |
| 6600 Chapek Parkway | Cuyahoga Heights, OH | Industrial | 157,950 | 1952-2006 / NAP | $3,391,379 | 2.8% | $4,500,000 | $327,365 | |
| 53208 Columbia Drive | Elkhart, IN | Industrial | 117,938 | 2005 / NAP | $3,316,015 | 2.8% | $4,400,000 | $416,748 | |
| 7750 Hub Parkway | Valley View, OH | Industrial | 83,404 | 1971, 1980 / NAP | $3,184,128 | 2.6% | $4,225,000 | $327,365 | |
| 21699 Torrence Avenue & 2701 Kalvelage Drive | Sauk Village, IL | Industrial | 67,995 | 1977, 2000 / NAP | $2,110,191 | 1.8% | $2,800,000 | $230,778 | |
| 3221 Cherry Palm Drive | Tampa, FL | Industrial | 38,624 | 1988 / NAP | $2,034,827 | 1.7% | $2,700,000 | $266,049 | |
| Total(4) | 2,886,593 | $120,537,149 | 100.0% | $159,940,000 | $11,310,590 | ||||
| (1) | Information is based on the underwritten rent roll as of September 1, 2017. |
| (2) | A vacancy adjustment to 5.0% has been underwritten at the portfolio level. |
| (3) | The 900 Chaddick Drive property is currently 100.0% leased to PNC Acquisition Company, Inc. through January 2019. PNC Acquisition Company, Inc. is currently dark at the 900 Chaddick Drive property. In the event PNC Acquisition Company, Inc. does not renew at expiration in January 2019, PNC Acquisition Company, Inc. will be required to pay a non-renewal fee of $380,000. No rent was underwritten for the 900 Chaddick Drive property. |
| (4) | The Total Appraised Value of $159,940,000 represents the sum of the individual Appraised Values of the U.S. Industrial Portfolio III Properties, as compared to the “As-Portfolio” Appraised Value of $166,300,000. |
Major Properties (by allocated loan amount)
2121 Gardner Street. The largest property by allocated loan amount is 2121 Gardner Street, a 378,270 SF manufacturing facility situated on approximately 58.9 acres and located in Elliston, Virginia. 2121 Gardner Street was constructed in 2000 and consists of an approximately 81.4% industrial component and an approximately 18.6% office component. The industrial component of the property features 22 to 40 foot clear heights, two drive-in grade level doors and 33 dock-high doors.
2121 Gardner Street is currently 100.0% leased to Rowe Fine Furniture on a triple-net basis through July 2028 with four, five-year renewal options. 2121 Gardner Street is the corporate headquarters for Rowe Fine Furniture. Founded 70 years ago, Rowe Fine Furniture manufactures upholstered furniture which is sold through major and independent home furnishings retailers across the United States and abroad. 2121 Gardner Street accounts for approximately 13.1% and 14.1% of the net rentable area and underwritten base rent, respectively, of the U.S. Industrial Portfolio III Properties.
975 Cottonwood Avenue. The second largest property by allocated loan amount is 975 Cottonwood Avenue, a 175,042 SF warehouse and distribution facility situated on approximately 18.2 acres in Hartland, Wisconsin. 975 Cottonwood Avenue was originally constructed in 2000 with an addition constructed in 2015 and consists of an approximately 79.2% industrial component and an approximately 20.8% office component. The industrial component of the property features 25 to 26 foot clear heights, three drive-in grade level doors and six dock-high doors.
975 Cottonwood Avenue is currently 100.0% leased to Dorner Manufacturing Corp. on a triple-net basis through October 2035. 975 Cottonwood Avenue is the corporate headquarters for Dorner Manufacturing Corp. Founded in 1966, Dorner Manufacturing Corp. is a privately-held company engaged in the design, applications, manufacturing, and integration of conveyor systems. 975 Cottonwood Avenue accounts for approximately 6.1% and 8.6% of the net rentable area and underwritten base rent, respectively, of the U.S. Industrial Portfolio III Properties.
4925 Bulls Bay Highway. The third largest property by allocated loan amount is 4925 Bulls Bay Highway, a 198,408 SF warehouse and distribution facility situated on approximately 13.3 acres in Jacksonville, Florida. 4925 Bulls Bay Highway was constructed in 2006 and consists of an approximately 92.0% industrial component and an approximately 8.0% office component. The industrial component of the property features approximately 24-foot clear heights, 24 drive-in grade level doors and two dock-high doors.
4925 Bulls Bay Highway is currently 100.0% leased to Southeastern Aluminum Products on a triple-net basis through February 2027. 4925 Bulls Bay Highway is the headquarters for Southeastern Aluminum Products. Founded in 1952, Southeastern Aluminum Products manufactures and distributes
This is not a research report and was not prepared by any Underwriter’s research departments. Please see additional important information and qualifications at the end of this Term Sheet. |
| T-96 |
| BANK 2017-BNK9 | U.S. Industrial Portfolio III |
bathroom shower doors and enclosures. 4925 Bulls Bay Highway accounts for approximately 6.9% and 8.3% of the net rentable area and underwritten base rent, respectively, of the U.S. Industrial Portfolio III Properties.
1500 Southeast 37th Street. The fourth largest property by allocated loan amount is 1500 Southeast 37th Street, a 248,257 SF warehouse and distribution facility situated on approximately 26.4 acres in Grimes, Iowa. 1500 Southeast 37th Street was constructed in 1961, renovated in 2017 and consists of an approximately 86.7% industrial component and an approximately 13.3% office component. The industrial component of the property features approximately 16-30 foot clear heights, 14 grade-level doors and 14 dock-high doors.
1500 Southeast 37th Street is currently 100.0% leased to Ryko Solutions, Inc. on a triple-net basis through August 2032. 1500 Southeast 37th Street is the headquarters for Ryko Solutions, Inc. Founded in 1973, Ryko Solutions, Inc. manufactures rollover vehicle wash systems and their product lines include friction and touchless rollovers, drive-throughs, conveyors, vacuums, dryers, self-service systems and a variety of accessories. 1500 Southeast 37th Street accounts for approximately 8.6% and 6.0% of the net rentable area and underwritten base rent, respectively, of the U.S. Industrial Portfolio III Properties.
The following table presents detailed information with respect to the tenancy of the U.S. Industrial Portfolio III Properties:
| U.S. Industrial Portfolio III Tenant Summary(1) | ||||||||||
| Tenant Name | Property Name | Credit Rating(2) (Fitch/Moody’s/S&P) | Tenant SF | % of Total SF | Annual UW Rent | Annual UW Rent PSF(3) | % of Total Annual UW Rent | Lease Expiration Date | ||
| Rowe Fine Furniture(4) | Various(5) | NR/NR/NR | 695,414 | 24.1% | $2,266,842 | $3.26 | 18.6% | 7/31/2028 | ||
| Ryko Solutions, Inc. | 1500 Southeast 37th Street | NR/NR/NR | 248,257 | 8.6% | $736,590 | $2.97 | 6.0% | 8/31/2032 | ||
| Northern Stamping Co. | Various(6) | NR/NR/NR | 241,354 | 8.4% | $674,610 | $2.80 | 5.5% | 11/30/2031 | ||
| Decorative Panels International | 2900 & 2950 Hill Avenue | NR/NR/NR | 237,698 | 8.2% | $557,956 | $2.35 | 4.6% | 11/30/2030 | ||
| Southeastern Aluminum Products | 4925 Bulls Bay Highway | NR/NR/NR | 198,408 | 6.9% | $1,011,027 | $5.10 | 8.3% | 2/28/2027 | ||
| Dorner Manufacturing Corp. | 975 Cottonwood Avenue | NR/NR/NR | 175,042 | 6.1% | $1,043,145 | $5.96 | 8.6% | 10/31/2035 | ||
| Sigma Corporation | Various(7) | NR/NR/NR | 168,035 | 5.8% | $586,055 | $3.49 | 4.8% | 7/31/2031 | ||
| KDM Signs, Inc. | 10450 Medallion Drive | NR/NR/NR | 151,506 | 5.2% | $805,985 | $5.32 | 6.6% | 7/31/2025 | ||
| LTI Flexible Products, Inc. | 53208 Columbia Drive | NR/B3/NR | 117,938 | 4.1% | $427,559 | $3.63 | 3.5% | 10/31/2026 | ||
| TAC Materials. Inc. | 1700 Highland Road | NR/NR/NR | 115,169 | 4.0% | $519,926 | $4.51 | 4.3% | 8/31/2028 | ||
| Accupac, Inc. | 1501 Industrial Boulevard | NR/NR/NR | 112,253 | 3.9% | $675,321 | $6.02 | 5.5% | 3/31/2032 | ||
| Halifax Sarasota LLC | 1800 University Parkway | NR/NR/NR | 105,752 | 3.7% | $492,211 | $4.65 | 4.0% | 1/31/2032 | ||
| DDC Center Holding Corp. | 1001 DDC Way | NR/NR/NR | 66,444 | 2.3% | $702,893 | $10.58 | 5.8% | 7/31/2025 | ||
| Bacharach, Inc. | 621 Hunt Valley Circle | NR/NR/NR | 61,796 | 2.1% | $503,152 | $8.14 | 4.1% | 12/31/2024 | ||
| The San Diego Union - Tribune(8) | 1152 Armorlite Drive | NR/B1/B | 44,313 | 1.5% | $344,312 | $7.77 | 2.8% | 12/31/2027 | ||
| Amphenol Custom Cable, Inc.(9) | 3221 Cherry Palm Drive | NR/Baa1/BBB+ | 38,624 | 1.3% | $272,844 | $7.06 | 2.2% | 7/31/2028 | ||
| The Chrysalis Center, Inc.(10) | 3800 West Broward Boulevard | NR/NR/NR | 32,688 | 1.1% | $561,350 | $17.17 | 4.6% | 12/31/2027 | ||
| Subtotal / Wtd. Avg. | 2,810,691 | 97.4% | $12,181,778 | $4.33 | 100.0% | |||||
| Vacant(11) | 75,902 | 2.6% | $0 | $0.00 | 0.0% | |||||
| Total / Wtd. Avg. | 2,886,593 | 100.0% | $12,181,778 | $4.33 | 100.0% | |||||
| (1) | Information is based on the underwritten rent roll as of September 1, 2017. |
| (2) | Certain ratings are those of the parent company whether or not the parent company guarantees the lease. |
| (3) | Total/Wtd. Avg. Annual UW Rent PSF excludes vacant space. |
| (4) | Rowe Fine Furniture subleases 126,275 SF of its space at the 1972 Salem Industrial Drive property to Turman Lumber Company at $1.60 PSF. Annual UW Rent reflects the average of the lower sublease rent (with respect to the square footage subleased to Turman) and the contractual rent (with respect to the remaining square footage covered by the Rowe Fine Furniture leases). |
| (5) | Rowe Fine Furniture is the sole tenant at two of the U.S. Industrial Portfolio III Properties: 1972 Salem Industrial Drive (317,144 SF, 11.0% of Total SF and 4.5% of Total Annual UW Rent) and 2121 Gardner Street (378,270 SF, 13.7% of Total SF and 14.1% of Total Annual UW Rent). The Rowe Fine Furniture lease expires July 31, 2028 at both properties. |
| (6) | Northern Stamping Co. is the sole tenant at two of the U.S. Industrial Portfolio III Properties: 6600 Chapek Parkway (157,950 SF, 5.5% of Total SF and 2.8% of Total Annual UW Rent) and 7750 Hub Parkway (83,404 SF, 2.9% of Total SF and 2.8% of Total Annual UW Rent). The Northern Stamping Co. lease expires December 31, 2027 at both properties. |
| (7) | Sigma Corporation is the sole tenant at two of the U.S. Industrial Portfolio III Properties: 5000 Askins Lane (100,040 SF, 3.5% of Total SF and 2.9% of Total Annual UW Rent) and 21699 Torrence Avenue & 2701 Kalvelage Drive (67,995 SF, 2.4% of Total SF and 1.9% of Total Annual UW Rent). The Sigma Corporation lease expires July 31, 2031 at both properties. |
| (8) | The San Diego Union – Tribune subleases its entire space to ACI-California, LLC at $7.77 PSF. Annual UW Rent reflects the sublease rent, which is lower than the prime lease rent. |
| (9) | Amphenol Custom Cable, Inc. has the right to terminate its lease without penalty on (i) November 1, 2018, and (ii) November 1, 2024 with 180 days’ notice. |
| (10) | The Chrysalis Center, Inc. subleases 10,303 SF of its space to Bank of America at $23.49 PSF. Annual UW Rent reflects The Chrysalis Center, Inc.’s contractual rent at $17.17. |
| (11) | Vacant Tenant SF is made up of the entire 900 Chaddick Drive property, which is currently 100.0% leased to PNC Acquisition Company, Inc. through January 2019. PNC Acquisition Company, Inc. is currently dark at the 900 Chaddick Drive property. In the event PNC Acquisition Company, Inc. does not renew at expiration in January 2019, PNC Acquisition Company, Inc. will be required to pay a non-renewal fee of $380,000. No rent was underwritten for the 900 Chaddick Drive property. |
This is not a research report and was not prepared by any Underwriter’s research departments. Please see additional important information and qualifications at the end of this Term Sheet. |
| T-97 |
| BANK 2017-BNK9 | U.S. Industrial Portfolio III |
The following table presents certain information with respect to the lease rollover at the U.S. Industrial Portfolio III Properties:
| Lease Rollover Schedule(1)(2) | ||||||||
| Year | # of Leases Rolling | SF Rolling | % of Total SF Rolling | Cumulative % of SF Rolling | Annual UW Rent PSF Rolling(3) | Annual UW Rent Rolling | % of Annual UW Rent Rolling | Cumulative % of Annual UW Rent Rolling |
| 2017 | 0 | 0 | 0.0% | 0.0% | $0.00 | $0 | 0.0% | 0.0% |
| 2018 | 0 | 0 | 0.0% | 0.0% | $0.00 | $0 | 0.0% | 0.0% |
| 2019 | 0 | 0 | 0.0% | 0.0% | $0.00 | $0 | 0.0% | 0.0% |
| 2020 | 0 | 0 | 0.0% | 0.0% | $0.00 | $0 | 0.0% | 0.0% |
| 2021 | 0 | 0 | 0.0% | 0.0% | $0.00 | $0 | 0.0% | 0.0% |
| 2022 | 0 | 0 | 0.0% | 0.0% | $0.00 | $0 | 0.0% | 0.0% |
| 2023 | 0 | 0 | 0.0% | 0.0% | $0.00 | $0 | 0.0% | 0.0% |
| 2024 | 1 | 61,796 | 2.1% | 2.1% | $8.14 | $503,152 | 4.1% | 4.1% |
| 2025 | 2 | 217,950 | 7.6% | 9.7% | $6.92 | $1,508,878 | 12.4% | 16.5% |
| 2026 | 1 | 117,938 | 4.1% | 13.8% | $3.63 | $427,559 | 3.5% | 20.0% |
| 2027 | 3 | 275,409 | 9.5% | 23.3% | $6.96 | $1,916,689 | 15.7% | 35.8% |
| 2028 & Beyond | 13 | 2,137,598 | 74.1% | 97.4% | $3.66 | $7,825,500 | 64.2% | 100.0% |
| Vacant(4) | 0 | 75,902 | 2.6% | 100.0% | $0.00 | $0 | 0.0% | 100.0% |
| Total / Wtd. Avg. | 20 | 2,886,593 | 100.0% | $4.33 | $12,181,778 | 100.0% | ||
| (1) | Information is based on the underwritten rent roll as of September 1, 2017. |
| (2) | Certain tenants may have lease termination options that may become exercisable prior to the originally stated expiration date of the tenant lease that are not considered in the lease rollover schedule. |
| (3) | Total Wtd. Avg. Annual UW Rent PSF Rolling excludes vacant space. |
| (4) | Vacant is made up of the entire 900 Chaddick Drive property, which is currently 100.0% leased to PNC Acquisition Company, Inc. through January 2019. PNC Acquisition Company, Inc. is currently dark at the 900 Chaddick Drive property. In the event PNC Acquisition Company, Inc. does not renew at expiration in January 2019, PNC Acquisition Company, Inc. will be required to pay a non-renewal fee of $380,000. No rent was underwritten for the 900 Chaddick Drive property. |
The Markets. The U.S. Industrial Portfolio III Properties are geographically diverse, located in 21 different cities across 10 states. The U.S. Industrial Portfolio III Properties are located in Ohio (28.1% of NRA), Virginia (24.1% of NRA), Florida (13.0% of NRA), Iowa (8.6% of NRA), Wisconsin (6.1% of NRA), Pennsylvania (6.0% of NRA) and Illinois (5.0% of NRA) with 9.1% of NRA located across an additional three other states.
Underwritten Net Cash Flow.The following table presents certain information relating to the Underwritten Net Cash Flow at the U.S. Industrial Portfolio III Properties:
| Cash Flow Analysis | ||||||
| 2014 | 2015 | 2016 | 6/30/2017 TTM | UW | UW PSF | |
| Gross Potential Rent(1)(2) | $11,275,200 | $11,626,356 | $12,032,044 | $12,183,306 | $12,559,202 | $4.35 |
| Total Recoveries | $2,264,342 | $2,355,463 | $2,290,350 | $2,265,200 | $3,675,807 | $1.27 |
| Other Income | $216,870 | $768 | $3,219 | $0 | $0 | $0.00 |
| Less Vacancy & Credit Loss | $0 | $0 | $0 | $0 | ($942,766) | ($0.33) |
| Effective Gross Income | $13,756,412 | $13,982,587 | $14,325,613 | $14,448,506 | $15,292,243 | $5.30 |
| Total Operating Expenses | $2,264,342 | $2,356,524 | $2,270,350 | $2,245,198 | $3,981,653 | $1.38 |
| Net Operating Income | $11,492,070 | $11,626,063 | $12,055,263 | $12,203,308 | $11,310,590 | $3.92 |
| Capital Expenditures | $0 | $0 | $0 | $0 | $298,573 | $0.10 |
| TI/LC | $0 | $0 | $0 | $0 | $596,602 | $0.21 |
| Net Cash Flow | $11,492,070 | $11,626,063 | $12,055,263 | $12,203,308 | $10,415,416 | $3.61 |
| Occupancy % | 100.0% | 100.0% | 100.0% | 100.0% | 95.0% | |
| NOI DSCR (IO)(3) | 2.25x | 2.28x | 2.36x | 2.39x | 2.21x | |
| NOI DSCR(3) | 1.63x | 1.65x | 1.71x | 1.73x | 1.60x | |
| NCF DSCR (IO)(3) | 2.25x | 2.28x | 2.36x | 2.39x | 2.04x | |
| NCF DSCR(3) | 1.63x | 1.65x | 1.71x | 1.73x | 1.48x | |
| NOI Debt Yield(3) | 9.5% | 9.6% | 10.0% | 10.1% | 9.4% | |
| NCF Debt Yield(3) | 9.5% | 9.6% | 10.0% | 10.1% | 8.6% | |
| (1) | UW Gross Potential Rent reflects contractual rents as of September 1, 2017 and includes rent steps of $280,181 through September 1, 2018. |
| (2) | With respect to three of the U.S. Industrial Portfolio III Properties, all or a portion of the space is subleased. Gross Potential Rent reflects the average of the lower sublease rent and the contractual rent of the respective square footage, or in the case of The Chrysalis Center, Inc. property, the prime lease rent, which is lower than the sublease rent. |
| (3) | The debt service coverage ratios and debt yields are based on the U.S. Industrial Portfolio III Whole Loan. |
This is not a research report and was not prepared by any Underwriter’s research departments. Please see additional important information and qualifications at the end of this Term Sheet. |
| T-98 |
| BANK 2017-BNK9 | U.S. Industrial Portfolio III |
Escrows and Reserves.At the origination of the U.S. Industrial Portfolio III Whole Loan, the U.S. Industrial Portfolio III Borrowers agreed to complete approximately $729,003 in required repairs, for which no reserve deposit was required at origination. The U.S. Industrial Portfolio III Borrowers have until June 30, 2018 to complete the repair work, after which time they are required under the loan documents to deposit the aggregate amount for unfinished required repairs set forth on the required repairs schedule;provided that if a required repair is a tenant’s obligation under its lease and such required repair is not completed by June 30, 2018, the U.S. Industrial Portfolio III Borrowers will have additional time as reasonably necessary to complete the required repairs, which additional time may not exceed an additional six months. In addition, the U.S. Industrial Portfolio III Whole Loan documents require the deposit of an upfront reserve of $453,411 for security deposits held by the U.S. Industrial Portfolio III Borrowers and $120,000 for the re-tenanting of the PNC Acquisition Inc. space at the 900 Chaddick Drive property. The U.S. Industrial Portfolio III Borrowers are also required to deposit the $380,000 non-renewal fee, if paid by PNC Acquisition, Inc.
The U.S. Industrial Portfolio III Borrowers are required to deposit monthly reserves of (i) 1/12 of the estimated annual real estate taxes, (ii) 1/12 of the estimated annual insurance premiums (except to the extent the U.S. Industrial Portfolio III Properties are insured under blanket policies);provided, however, that such deposits are not required to be made to the extent that the applicable tenant is required to pay such taxes and insurance premiums, such taxes and insurance premiums are paid prior to delinquency and certain other conditions are satisfied. The U.S. Industrial Portfolio III Borrowers are required to deposit monthly reserves of $6,250 for capital expenditures. The U.S. Industrial Portfolio III Borrowers are required to deposit monthly, commencing on each payment date following the Rent Sweep Start Date (as set forth in the table below) for each Expiring Tenant (as set forth in the table below), an amount equal to such Expiring Tenant’s Monthly Sweep Amount (as set forth in the table below) for the related property until the applicable Max TI/LC Reserve Cap (as set forth in the table below) has been deposited with the lender.
| Expiring Tenant | Bacharach, Inc. | DDC Center | KDM Signs | LTI Flexible Products | Southeastern Aluminum | The Chrysalis Center, Inc. | Rowe Fine Furniture(1) | Rowe Fine Furniture(2) |
| Lease Roll Date | 12/31/2024 | 7/31/2025 | 7/31/2025 | 10/31/2026 | 2/28/2027 | 12/31/2027 | 7/31/2028 | 7/31/2028 |
| Rent Sweep Start Date | 7/1/2024 | 2/1/2025 | 2/1/2025 | 5/1/2026 | 9/1/2026 | 7/1/2026 | 4/1/2026 | 4/1/2026 |
| Monthly Sweep Amount | $30,898 | $143,962 | $75,753 | $58,969 | $99,204 | $81,720 | $157,613 | $105,715 |
| Max TI/LC Reserve Cap | $185,388 | $863,772 | $454,518 | $353,814 | $595,224 | $490,320 | $945,675 | $634,288 |
| (1) | Represents Rowe Fine Furniture at the 2121 Gardner Street property. |
| (2) | Represents Rowe Fine Furniture at the 1972 Salem Industrial Drive property. |
In addition, on each payment date during a Major Tenant Rollover Reserve Event (as defined below), the related borrower is required to deposit the related tenant’s Monthly Sweep Amount until the Max TI/LC Reserve Cap has been deposited.
“Major Tenant Rollover Reserve Event” means with respect to Rowe Fine Furniture or any replacement tenant therefor:
| (i) | A period that commences on the earlier of (a) the date such tenant gives notice to vacate or exercise any termination option and (b) the date six months prior to the maturity date of the U.S. Industrial Portfolio III Whole Loan, and ends when either (x) such tenant’s lease has been renewed on terms and conditions acceptable to the lender, and the lender receives a tenant estoppel stating that such tenant is in occupancy in the entirety of its space and paying full contractual rent or (y) the entirety of such tenant’s space has been relet to one or more replacement tenants reasonably acceptable to the lender under a lease reasonably acceptable to the lender and the lender receives a tenant estoppel stating that such tenant is in occupancy in the entirety of its space and paying full contractual rent (a “Replacement Tenant Cure”) or (z) the Max TI/LC Reserve Cap has been deposited; |
| (ii) | A period that commences on the date such tenant has vacated or gone dark in its space or terminated or given notice of intent to terminate its lease and ends when either (x) such tenant is in occupancy of the entirety of its space and the lender receives a tenant estoppel stating that such tenant is in occupancy in the entirety of its space and paying full contractual rent, or (y) a Replacement Tenant Cure has occurred or (z) the Max TI/LC Reserve Cap has been deposited; |
| (iii) | A period that commences on the date the tenant has made or been the subject of a bankruptcy filing and ends when either (x) such tenant’s lease has been affirmed in bankruptcy and the lender receives a tenant estoppel stating that such tenant is in occupancy in the entirety of its space and paying full contractual rent, or (y) a Replacement Tenant Cure has occurred or (z) the Max TI/LC Reserve Cap has been deposited. |
Lockbox and Cash Management. A hard lockbox is in place with respect to the U.S. Industrial Portfolio III Whole Loan, with springing cash management upon the occurrence of a Cash Management Period. If no Cash Management Period is continuing, all funds in the lockbox account are required to be swept daily to the U.S. Industrial Portfolio III Borrowers’ operating account. Upon the first occurrence of a Cash Management Period, the lender has the right to establish, and the U.S. Industrial Portfolio III Borrowers are required to cooperate with the cash management bank to establish, a lender-controlled cash management account, and during the continuance of a Cash Management Period, all funds are required to be swept each business day to such cash management account and disbursed to make payments into the reserve funds as described above under “Escrows and Reserves,” to pay monthly debt service on the U.S. Industrial Portfolio III Whole Loan, to pay monthly operating expenses as set forth in the annual budget (which is required to be approved only during the continuance of a Cash Management Period) and additional operating expenses approved by the lender, and to deposit all excess cash flow in an excess cash flow account to be held as additional security for the U.S. Industrial Portfolio III Whole Loan during such Cash Management Period.
A “Cash Management Period” commences upon the occurrence of either (a) an event of default under the U.S. Industrial Portfolio III Whole Loan or (b) the amortizing debt service coverage ratio (after deducting the amount of any Low DSCR Collateral (as defined below) from the principal balance of the U.S. Industrial Portfolio III Whole Loan) is below 1.15x for six consecutive months, based on the trailing six months’ operating statement and rent roll and ends upon (i), with respect to clause (a), the cure of such event of default, as accepted by the lender in its sole discretion, or (ii) with respect to clause (b), either (x) the amortizing debt service coverage ratio (calculated in the manner set forth in clause (b)) is at least 1.15x for six consecutive calendar months or (y) Low DSCR Collateral has been delivered to the lender.
“Low DSCR Collateral” means cash or a letter of credit meeting the requirements of the U.S. Industrial Portfolio III Whole Loan documents, in an amount by which the principal balance of the U.S. Industrial Portfolio III Whole Loan would need to be reduced such that, after recomputing the related monthly
This is not a research report and was not prepared by any Underwriter’s research departments. Please see additional important information and qualifications at the end of this Term Sheet. |
| T-99 |
| BANK 2017-BNK9 | U.S. Industrial Portfolio III |
payment under a 360-month amortization schedule, the amortizing debt service coverage ratio would be at least 1.15x. Low DSCR Collateral may be released if the amortizing debt service coverage ratio for six consecutive months, without giving effect to the Low DSCR Collateral, is at least 1.15x.
Additional Secured Indebtedness (not including trade debts). The U.S. Industrial Portfolio III Properties also secure the U.S. Industrial Portfolio III Non-ServicedPari Passu Companion Loans, with an aggregate cut-off date principal balance of $80,537,149. The promissory notes evidencing the U.S. Industrial Portfolio III Non-ServicedPari Passu Companion Loans accrue interest at the same rate as the U.S. Industrial Portfolio III Mortgage Loan. The U.S. Industrial Portfolio III Mortgage Loan is entitled to payments of principal and interest on a pro rata andpari passu basis with the U.S. Industrial Portfolio III Non-ServicedPari Passu Companion Loans. The holders of the U.S. Industrial Portfolio III Mortgage Loan and the U.S. Industrial Portfolio III Non-ServicedPari Passu Companion Loans have entered into a co-lender agreement that sets forth the allocation of collections on the U.S. Industrial Portfolio III Whole Loan. See “Description of the Mortgage Pool—The Whole Loans—The Non-Serviced Pari Passu Whole Loans” in the Preliminary Prospectus.
Mezzanine Loan and Preferred Equity. Not permitted.
Release of Property. After the defeasance lockout prepayment date and prior to the open prepayment date, the U.S. Industrial Portfolio III Borrowers are permitted to obtain the release of any individual property upon defeasance of the related Release Amount (as defined below), provided that the following conditions, among others, are satisfied: (i) after giving effect to the release, the debt service coverage ratio of the remaining properties is at least equal to the greater of: (x) 1.40x and (y) the lesser of (1) 1.75x or (2) the amortizing debt service coverage ratio immediately prior to the related release, (ii) after giving effect to the release, the debt yield of the remaining properties is at least equal to the greater of: (x) 8.4% and (y) the lesser of (1) 10.1% or (2) the debt yield immediately prior to the related release, (iii) after giving effect to the release, no remaining single tenant’s gross rent exceeds 30.0% of the total remaining properties’ gross rent, and (iv) compliance with REMIC requirements.
“Release Amount” means (i) with respect to the release of properties representing up to 15% of the lesser of the total net rentable area and the total gross revenue, not to exceed five properties, 100% of the allocated loan amount for each such property, plus the amount, if any, necessary to satisfy the debt service coverage ratio and debt yield tests above; (ii) with respect to the release of properties representing the next 5% of the lesser of the total net rentable area and the total gross revenue, 105% of the allocated loan amount for each such property, plus the amount, if any, necessary to satisfy the debt service coverage ratio and debt yield tests above; and (iii) thereafter, with respect to the remaining properties, 110% of the allocated loan amount, plus the amount, if any, necessary to satisfy the debt service coverage ratio and debt yield tests above.
In addition, the U.S. Industrial Portfolio III Borrowers may obtain the release of an unimproved release parcel at the 10450 Medallion Drive property, without defeasance or prepayment provided that certain conditions are satisfied, including among others, that the release does not adversely affect the use or operation of, or access to, the remaining portion of the property, or violate any leases or legal requirements, compliance with zoning and separate tax lot requirements, and compliance with REMIC requirements. Pursuant to its lease, the tenant at the 10450 Medallion Drive Property, KDM Signs, Inc., has the right to cause the subdivision of such property into such release parcel and the remaining property, and to purchase such release parcel for a purchase price of $1.00.
Terrorism Insurance. The U.S. Industrial Portfolio III Borrowers are required to obtain and maintain property insurance in an amount equal to the full replacement cost of the U.S. Industrial Portfolio III Properties and rental loss and/or business interruption insurance for a period of at least 12 months that covers loss or damage by terrorist acts;provided that such coverage is available. See “Risk Factors—Risks Relating to the Mortgage Loans—Terrorism Insurance May Not Be Available for All Mortgaged Properties” in the Preliminary Prospectus.
This is not a research report and was not prepared by any Underwriter’s research departments. Please see additional important information and qualifications at the end of this Term Sheet. |
| T-100 |
(THIS PAGE INTENTIONALLY LEFT BLANK)
| T-101 |
| BANK 2017-BNK9 | Spectrum Town Center |
Mortgage Loan No. 10 – Spectrum Town Center
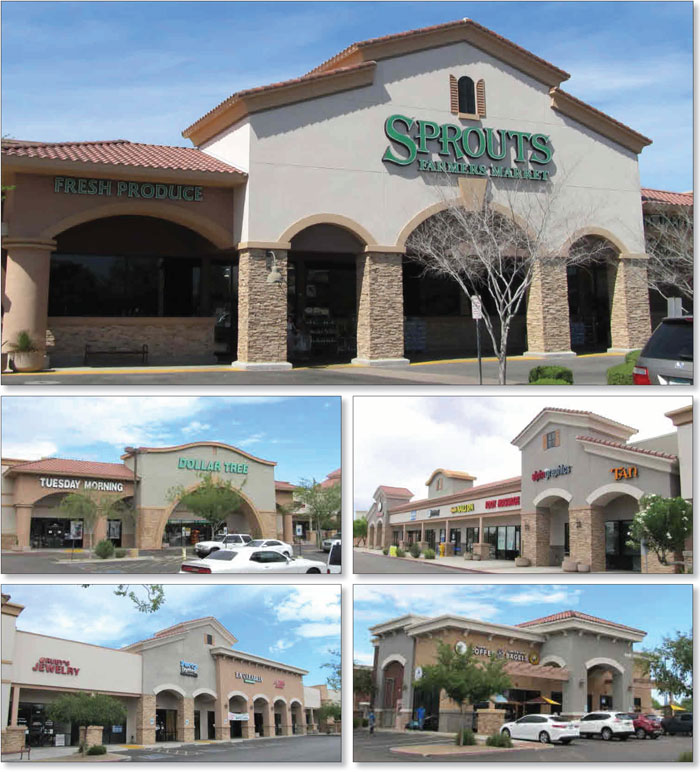
This is not a research report and was not prepared by any Underwriter’s research departments. Please see additional important information and qualifications at the end of this Term Sheet. |
| T-102 |
| BANK 2017-BNK9 | Spectrum Town Center |
Mortgage Loan No. 10 – Spectrum Town Center
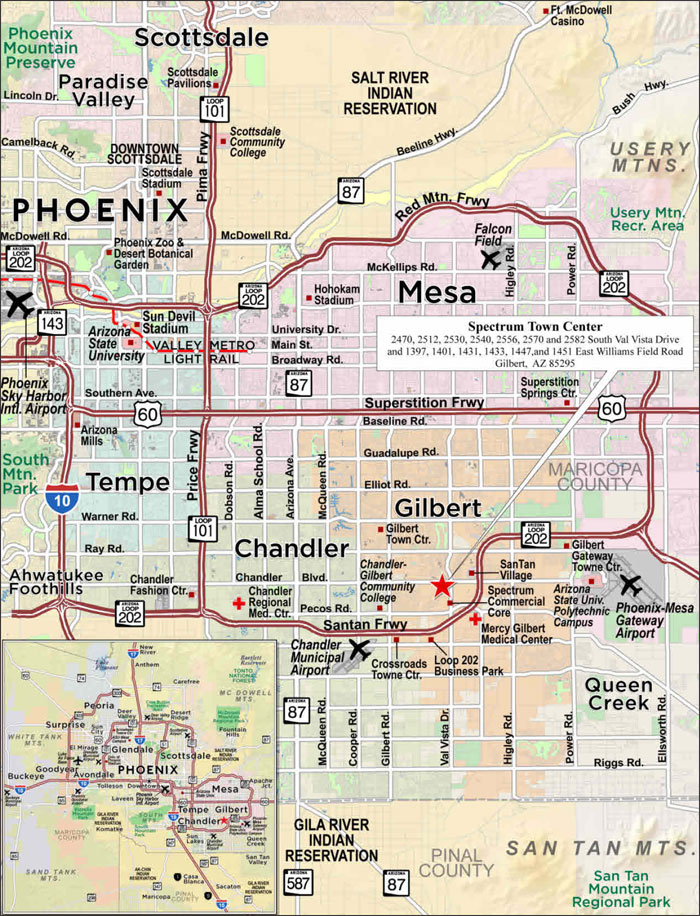
This is not a research report and was not prepared by any Underwriter’s research departments. Please see additional important information and qualifications at the end of this Term Sheet. |
| T-103 |
| BANK 2017-BNK9 | Spectrum Town Center |
| Mortgage Loan No. 10 – Spectrum Town Center |
| Mortgage Loan Information | Property Information | ||||||
| Mortgage Loan Seller: | BANA | Single Asset/Portfolio: | Single Asset | ||||
| Original Balance: | $30,000,000 | Location: | Gilbert, AZ 85295 | ||||
| Cut-off Date Balance: | $30,000,000 | General Property Type: | Retail | ||||
| % of Initial Pool Balance: | 2.8% | Detailed Property Type: | Anchored | ||||
| Loan Purpose: | Refinance | Title Vesting: | Fee | ||||
| Sponsor: | Sean Leoni | Year Built/Renovated: | 2006/N/A | ||||
| Mortgage Rate: | 4.3870% | Size: | 170,388 SF | ||||
| Note Date: | 10/4/2017 | Cut-off Date Balance per SF: | $176 | ||||
| First Payment Date: | 12/1/2017 | Maturity Date Balance per SF: | $161 | ||||
| Maturity Date: | 11/1/2027 | Property Manager: | Capital Asset Management LLC
| ||||
| Original Term to Maturity: | 120 months | ||||||
| Original Amortization Term: | 360 months | ||||||
| IO Period: | 60 months | Underwriting and Financial Information | |||||
| Seasoning: | 1 month | UW NOI: | $2,820,269 | ||||
| Prepayment Provisions: | LO (25); DEF (91); O (4) | UW NOI Debt Yield: | 9.4% | ||||
| Lockbox/Cash Mgmt Status: | Springing/Springing | UW NOI Debt Yield at Maturity: | 10.3% | ||||
| Additional Debt Type: | N/A | UW NCF DSCR: | 1.96x (IO) 1.46x (P&I) | ||||
| Additional Debt Balance: | N/A | Most Recent NOI: | $2,451,398 (8/31/2017 TTM) | ||||
| Future Debt Permitted (Type): | No (N/A) | 2nd Most Recent NOI: | $2,340,314 (12/31/2016) | ||||
| Reserves(1) | 3rd Most Recent NOI: | $2,366,381 (12/31/2015) | |||||
| Type | Initial | Monthly | Cap | Most Recent Occupancy: | 95.4% (9/11/2017) | ||
| RE Tax: | $26,819 | $26,819 | N/A | 2nd Most Recent Occupancy: | 90.8% (12/31/2016) | ||
| Insurance: | $11,489 | $3,830 | N/A | 3rd Most Recent Occupancy: | 89.6% (12/31/2015) | ||
| Recurring Replacements: | $0 | $2,840 | N/A | Appraised Value (as of): | $47,730,000 (9/1/2017) | ||
| TI/LC: | $300,711 | $15,000 | $540,000 | Cut-off Date LTV Ratio: | 62.9% | ||
| Rent Concession: | $52,369 | $0 | N/A | Maturity Date LTV Ratio: | 57.5% | ||
| Sources and Uses | ||||||
| Sources | Proceeds | % of Total | Uses | Proceeds | % of Total | |
| Loan Amount: | $30,000,000 | 100.0% | Loan Payoff: | $22,260,530 | 74.2% | |
| Return of Equity(2): | $6,429,231 | 21.4% | ||||
| Closing Costs: | $918,851 | 3.1% | ||||
| Reserves: | $391,387 | 1.3% | ||||
| Total Sources: | $30,000,000 | 100.0% | Total Uses: | $30,000,000 | 100.0% | |
| (1) | See “Escrows and Reserves” below for further discussion of reserve requirements. |
| (2) | The Spectrum Town Center sponsor maintains a current cost basis in the Spectrum Town Center Property (as defined below) of approximately $30.2 million. |
The Mortgage Loan. The tenth largest mortgage loan (the “Spectrum Town Center Mortgage Loan”) is evidenced by a promissory note in the original principal amount of $30,000,000 and is secured by a first priority fee mortgage encumbering a multi-tenant anchored retail property in Gilbert, Arizona (the “Spectrum Town Center Property”). The proceeds from the Spectrum Town Center Mortgage Loan were primarily used to refinance the previous loan secured by the Spectrum Town Center Property, return equity to the Spectrum Town Center sponsor, pay closing costs and fund upfront reserves. The previous loan secured by the Spectrum Town Center Property was included in the MSBAM 2013-C12 transaction.
The Borrower and the Sponsor.The borrower is Gilbert Center Holdings, LLC (the “Spectrum Town Center Borrower”), a single-purpose Delaware limited liability company with one independent director. Gilbert Center Holdings, LLC, is 51% owned by the Leoni Family Trust and 49% owned by Tari Holdings, LLC (DE). Sean Leoni is the loan sponsor and the nonrecourse carve-out guarantor (the “Spectrum Town Center Sponsor”). Sean Leoni is an experienced real estate professional and currently has interests in 19 commercial real estate investment properties valued at a total of $158.7 million.
The Property.The Spectrum Town Center Property is a 170,388 SF anchored retail property located in Gilbert, Arizona, approximately 31 miles southeast of downtown Phoenix. The Spectrum Town Center Property was built in 2006 on a 21.5-acre site and contains 864 surface parking spaces (approximately 5.1 spaces per 1,000 SF). The Spectrum Town Center Property is comprised of ten buildings with frontage on Williams Field Road and Val Vista Drive. According to the appraisal, the average daily traffic count passing the Spectrum Town Center Property is 48,884 vehicles. As of September 11, 2017, the Spectrum Town Center Property was 95.4% occupied by a granular rent roll of 36 tenants. Historical occupancy at the Spectrum Town Center Property was 90.0%, 89.6% and 90.8% as of the end of the calendar years 2014, 2015 and 2016, respectively. The anchor tenants are Sprouts Farmers Market, Fitness Works, Dollar Tree, Salon Boutique and Tuesday Morning, with no other tenant accounting for more than 3.4% of NRA or 4.3% of underwritten rent. In addition to the anchor tenants, the Spectrum Town Center Property’s tenant roster includes national tenants such as Einstein’s Bagels, Pita Jungle, Subway, Pet Club and Pure Barre. The Spectrum Town Center Property is shadow anchored by an 88,408 SF Kohl’s and a CVS.
This is not a research report and was not prepared by any Underwriter’s research departments. Please see additional important information and qualifications at the end of this Term Sheet. |
| T-104 |
| BANK 2017-BNK9 | Spectrum Town Center |
Major Tenants
Sprouts Farmers Market (30,497 SF, 17.9% of NRA, 17.4% of underwritten rent). Sprouts Farmers Markets’ (“Sprouts”) lease commenced in December 2006 and extends through March 2022, with four, five-year renewal options. Sprouts (NASDAQ: SFM) is a chain of specialty grocery stores headquartered in Arizona with more than 280 stores across the United States. Sprouts reportedly invested $400,000 into store improvements at the Spectrum Town Center Property in 2016, primarily to add a new deli concept and made-to-order food counter.
Fitness Works (30,099 SF, 17.7% of NRA, 7.3% of underwritten rent). Fitness Works’ lease commenced in February 2013 and extends through February 2023, with three, five-year extension options. Fitness Works is a privately-held company, founded in 1992, that operates six gyms in Arizona, including two in Gilbert.
Dollar Tree (14,845 SF, 8.7% of NRA, 6.6% of underwritten rent). Dollar Tree’s lease commenced in July 2007 and the tenant has exercised its extension option in January 2017 extending its lease through July 2022, with two, five-year extension options. Dollar Tree (NASDAQ: DLTR) is a Fortune 500 company, founded in Norfolk, Virginia in 1986, that offers a mix of housewares, toys, seasonal items, beauty aids and books, with most items priced at $1.00 or less.
Salon Boutique (10,702 SF, 6.3% of NRA, 6.6% of underwritten rent). Salon Boutique’s lease commenced in November 2007 and extends through November 2027. Salon Boutique is a privately-held company, founded in 1999, which offers manicures, pedicures, skincare and massage therapy. Salon Boutique operates across 18 locations in Texas and Arizona.
Tuesday Morning (10,617 SF, 6.2% of NRA, 4.4% of underwritten rent). Tuesday Morning’s lease commenced in December 2007 and the tenant has exercised its renewal option in August 2017, extending its lease through July 2022, with one remaining five-year extension option. Tuesday Morning, founded in 1975 in Dallas, TX, is a discount, off-priced retailer specializing in domestic and international designer and name-brand closeout merchandise. As of year-end 2016, Tuesday morning reported sales PSF of $103.86 at the Spectrum Town Center Property.
The following table presents a summary regarding the major tenants at the Spectrum Town Center Property:
| Major Tenant Summary(1) | ||||||||||
| Tenant Name | Credit Rating (Fitch/Moody’s/S&P)(2) | Tenant SF | Approx. % of SF | Annual UW Rent(3) | % of Total Annual UW Rent | Annual UW Rent PSF(3) | 2016 Sales | Occ. Cost % | Lease Expiration | |
| $ | PSF | |||||||||
| Major Tenants | ||||||||||
| Sprouts Farmers Market | NR/NR/NR | 30,497 | 17.9% | $505,031 | 17.4% | $16.56 | NAV | NAV | NAV | 3/31/2022 |
| Fitness Works | NR/NR/NR | 30,099 | 17.7% | $211,596 | 7.3% | $7.03 | NAV | NAV | NAV | 2/28/2023 |
| Dollar Tree | NR/Ba1/BB+ | 14,845 | 8.7% | $192,985 | 6.6% | $13.00 | NAV | NAV | NAV | 7/31/2022 |
| Salon Boutique | NR/NR/NR | 10,702 | 6.3% | $192,636 | 6.6% | $18.00 | NAV | NAV | NAV | 11/30/2027 |
| Tuesday Morning | NR/Ba3/NR | 10,617 | 6.2% | $128,466 | 4.4% | $12.10 | $1,102,688 | $104 | 15.3% | 7/31/2022 |
| Subtotal/Wtd. Avg. | 96,760 | 56.8% | $1,230,713 | 42.3% | $12.72 | NAV | NAV | NAV | ||
| Other Tenants | 65,741 | 38.6% | $1,677,154 | 57.7% | $25.51 | |||||
| Vacant Space | 7,887 | 4.6% | $0 | 0.0% | $0.00 | |||||
| Total/Wtd. Avg. | 170,388 | 100.0% | $2,907,868 | 100.0% | $17.89 | |||||
| (1) | Information is based on the underwritten rent roll. |
| (2) | Certain ratings are those of the parent company whether or not the parent guarantees the lease. |
| (3) | Annual UW Rent is based on in-place contract rents with rent bumps to November 1, 2018. |
This is not a research report and was not prepared by any Underwriter’s research departments. Please see additional important information and qualifications at the end of this Term Sheet. |
| T-105 |
| BANK 2017-BNK9 | Spectrum Town Center |
The following table presents certain information relating to the lease rollover schedule at the Spectrum Town Center Property:
| Lease Rollover Schedule(1)(2) | |||||||||
| Year | # of Leases Rolling | SF Rolling | Approx. % of Total SF Rolling | Approx. Cumulative % of SF Rolling | UW Rent PSF Rolling(3) | Total UW Rent Rolling | Approx. % of Total Rent Rolling | Approx. Cumulative % of Total Rent Rolling | |
| 2017 | 1 | 2,024 | 1.2% | 1.2% | $30.90 | $62,542 | 2.2% | 2.2% | |
| 2018 | 2 | 4,821 | 2.8% | 4.0% | $32.26 | $155,537 | 5.3% | 7.5% | |
| 2019 | 6 | 16,179 | 9.5% | 13.5% | $23.44 | $379,175 | 13.0% | 20.5% | |
| 2020 | 8 | 13,517 | 7.9% | 21.4% | $26.66 | $360,430 | 12.4% | 32.9% | |
| 2021 | 2 | 2,202 | 1.3% | 22.7% | $24.82 | $54,660 | 1.9% | 34.8% | |
| 2022 | 10 | 66,683 | 39.1% | 61.9% | $15.96 | $1,063,961 | 36.6% | 71.4% | |
| 2023 | 2 | 31,266 | 18.3% | 80.2% | $7.64 | $238,834 | 8.2% | 79.6% | |
| 2024 | 1 | 5,558 | 3.3% | 83.5% | $23.69 | $131,669 | 4.5% | 84.1% | |
| 2025 | 2 | 6,409 | 3.8% | 87.2% | $31.29 | $200,506 | 6.9% | 91.0% | |
| 2026 | 0 | 0 | 0.0% | 87.2% | $0.00 | $0 | 0.0% | 91.0% | |
| 2027 | 2 | 13,842 | 8.1% | 95.4% | $18.82 | $260,554 | 9.0% | 100.0% | |
| 2028 & Beyond | 0 | 0 | 0.0% | 95.4% | $0.00 | $0 | 0.0% | 100.0% | |
| Vacant | 0 | 7,887 | 4.6% | 100.0% | $0.00 | $0 | 0.0% | 100.0% | |
| Total/Wtd. Avg.(3) | 36 | 170,388 | 100.0% | $17.89 | $2,907,868 | 100.0% | |||
| (1) | Information is based on the underwritten rent roll. |
| (2) | Certain tenants may have lease termination options that are exercisable prior to the originally stated expiration date of the related lease and are not considered in the rollover schedule. |
| (3) | Wtd. Avg. UW Rent PSF Rolling excludes vacant space. |
The Market. The Spectrum Town Center Property is located in Gilbert, Arizona, within the Phoenix-Mesa-Scottsdale metropolitan statistical area. According to the appraisal, the Phoenix-Mesa-Scottsdale metropolitan statistical area had a 2016 total population of 4,672,308 and experienced an annual growth rate of 1.8% since 2010, compared to 0.8% and 1.4% for the United States and the State of Arizona, respectively. Unemployment in the Phoenix-Mesa-Scottsdale metropolitan statistical area was 4.6% at the end of 2016, which is lower than the 4.9% and 5.3% unemployment rates of the United States and the state of Arizona, respectively, during the same time span. The major employers in the area include Banner Health (8,184 employees), Apollo Group Inc. (6,701 employees), Honeywell (6,247 employees), American Express (5,880 employees) and St. Joseph’s Hospital (4,109 employees). The Spectrum Town Center Property is located in close proximity to freeways that provide access to the greater metropolitan statistical area, including the San Tan Freeway (1.0 mile west), Superstation Springs Freeway or Highway 60 (5.5 miles south), and Interstate-10 (13.0 miles east). Additionally, the Spectrum Town Center Property is located approximately 3.5 miles northeast of the Chandler Municipal Airport. According to the appraisal, the Phoenix-Mesa-Scottsdale metropolitan statistical area has an average of 330 sunny days per year and has over 200 golf courses, making it a top resort and outdoor recreation destination. The lure of the Sonora Desert, Tonto National Forest, local American Indian communities and wilderness surrounding the region continues to draw visitors to the region. Phoenix is also home to all four major sports leagues in the United States: basketball (Suns), football (Cardinals), baseball (Diamondbacks) and hockey (Coyotes).
According to the appraisal, the estimated 2016 population within a one-, three- and five-mile radius was 12,629, 101,222 and 278,146, respectively. The estimated 2016 median household income within a one-, three- and five-mile radius was $80,734, $89,438 and $82,180, respectively, with the distribution of household income at the level of $100,000 or more within a one-, three- and five-mile radius being 35.1%, 42.6% and 38.5%, respectively.
According to the appraisal, the Spectrum Town Center Property is located within the Gilbert retail submarket. As of the second quarter of 2017, the submarket reported total supply of approximately 14.9 million SF, with a 6.4% vacancy rate and average asking rents of $17.20 PSF. The vacancy rate of 6.4% is slightly lower than the vacancy rate during the same period last year (7.0%) and is significantly lower than the average vacancy rate over the past nine years (9.7%). According to the appraisal, as of the second quarter 2017, inventory grew by 0.8%, with an absorption rate of 0.8%. During the same period last year, net absorption was 5.0%, and over the past nine years, absorption has been stable at 1.8%.
This is not a research report and was not prepared by any Underwriter’s research departments. Please see additional important information and qualifications at the end of this Term Sheet. |
| T-106 |
| BANK 2017-BNK9 | Spectrum Town Center |
The following table reflects the comparable retail properties with respect to the Spectrum Town Center Property:
| Comparable Properties | |||||
| Property / Address | Year Built | Size (SF) | Occupancy | Distance from Subject | Asking Rent |
Spectrum Town Center 2470, 2512, 2530, 2540, 2556, 2570 and 2582 South Val Vista Drive, and 1397, 1401, 1431, 1433, 1447 and 1451 East Williams Field Road | 2006 | 170,388 | 95.4%(1) | N/A | $16.55(2) |
| Gilbert Fiesta (Fry’s Foods) | 2002 | 106,822 | 97.8% | 1.9 mi | $22.00 |
| 87 E Williams Field Rd | |||||
| Val Vista Square (Winco Foods) | 2013 | 102,984 | 100.0% | 1.5 mi | N/A |
| 1967 E Pecos Rd | |||||
| Fry’s Plaza | 1998 | 89,795 | 100.0% | 2.5 mi | N/A |
| 714 S Val Vista Dr | |||||
| Albertsons Center | 2002 | 102,814 | 94.3% | 3.0 mi | N/A |
| 861 E Warner Rd | |||||
Source:Appraisal.
| (1) | Based on the underwritten rent roll as of September 11, 2017. |
| (2) | Based on underwritten rents, with rent bumps to November 1, 2018. |
Operating History and Underwritten Net Cash Flow. The following table presents certain information relating to the historical operating performance and Underwritten Net Cash Flow at the Spectrum Town Center Property:
| Cash Flow Analysis | ||||||
| 2014 | 2015 | 2016 | 8/31/2017 TTM | UW | UW PSF | |
| Base Rent(1) | $2,290,993 | $2,474,012 | $2,472,267 | $2,583,069 | $3,069,551 | $18.02 |
| Reimbursements | $720,074 | $680,686 | $640,004 | $656,099 | $653,378 | $3.83 |
| Other Income(2) | $0 | $14,706 | $14,706 | $17,652 | $15,802 | $0.09 |
| Less Vacancy & Credit Loss | $0 | $0 | $0 | $0 | ($190,051) | ($1.12) |
| Effective Gross Income | $3,011,067 | $3,169,404 | $3,126,977 | $3,256,820 | $3,548,680 | $20.83 |
| Total Operating Expenses | $899,268 | $803,023 | $786,663 | $805,422 | $728,411 | $4.28 |
| Net Operating Income | $2,111,799 | $2,366,381 | $2,340,314 | $2,451,398 | $2,820,269 | $16.55 |
| Capital Expenditures | $0 | $0 | $0 | $0 | $34,078 | $0.20 |
| TI/LC | $0 | $0 | $0 | $0 | $166,206 | $0.98 |
| Net Cash Flow | $2,111,799 | $2,366,381 | $2,340,314 | $2,451,398 | $2,619,985 | $15.38 |
| Occupancy % | 90.0% | 89.6% | 90.8% | 95.4% | 94.9% | |
| NOI DSCR (IO) | 1.58x | 1.77x | 1.75x | 1.84x | 2.11x | |
| NOI DSCR (P&I) | 1.17x | 1.31x | 1.30x | 1.36x | 1.57x | |
| NCF DSCR (IO) | 1.58x | 1.77x | 1.75x | 1.84x | 1.96x | |
| NCF DSCR (P&I) | 1.17x | 1.31x | 1.30x | 1.36x | 1.46x | |
| NOI Debt Yield | 7.0% | 7.9% | 7.8% | 8.2% | 9.4% | |
| NCF Debt Yield | 7.0% | 7.9% | 7.8% | 8.2% | 8.7% | |
| (1) | Base Rent has been underwritten to in-place contract rents, with rent bumps to November 1, 2018. |
| (2) | Other Income was underwritten to the 2017 budgeted other income that includes “other monthly charges”. The remaining items of other income (miscellaneous income, late fees, NSF fees, sales tax and termination and settlement fees) have been excluded. |
This is not a research report and was not prepared by any Underwriter’s research departments. Please see additional important information and qualifications at the end of this Term Sheet. |
| T-107 |
| BANK 2017-BNK9 | Spectrum Town Center |
Escrows and Reserves. The Spectrum Town Center Borrower deposited at loan origination $26,819 into a tax reserve and is required to deposit monthly 1/12th of the estimated annual property taxes (initially $26,819 per month). The Spectrum Town Center Borrower deposited at loan origination $11,489 into an insurance reserve and is required to deposit monthly 1/12th of the estimated annual insurance premiums (initially $3,830 per month). The Spectrum Town Center Borrower is required to deposit monthly $2,840 for replacement reserves.
The Spectrum Town Center Borrower deposited at loan origination $300,711 and is required to deposit monthly $15,000 to a general tenant improvement and leasing commission reserve, subject to a cap of $540,000. Additionally, the Spectrum Town Center Borrower deposited at loan origination $52,369 into a rent concession reserve for landlord’s outstanding free rent for Dance Element ($6,925), Hide Tide Seafood Bar and/or Pescado Borracho ($35,020) and Page Q Enterprises ($10,424).
Lockbox and Cash Management. During a Cash Sweep Period (as defined below), all tenants at the Spectrum Town Center Property are required to deposit all rents directly into a lockbox account and all funds in the lockbox account are required to be swept daily to a lender-controlled cash management account and disbursed in accordance with the Spectrum Town Center Mortgage Loan documents. During a Cash Sweep Period, all excess cash from the Spectrum Town Center Property is required to be held by the lender as additional security for the Spectrum Town Center Mortgage Loan until the Cash Sweep Period has ended.
A “Cash Sweep Period” will occur during (i) the occurrence and continuance of an event of default, (ii) a DSCR Trigger Event (as defined below) or (iii) a Sprouts Trigger Event (as defined below).
A “DSCR Trigger Event” will commence when the debt service coverage ratio is less than 1.20x at the end of any calendar quarter for the trailing six-month period and will end when the debt service coverage ratio is equal to or greater than 1.20x at the end of two consecutive calendar quarters for the trailing six-month period.
A “Sprouts Trigger Event” will occur during (i) a Sprouts Bankruptcy Event (as defined below), (ii) a Sprouts Default Event (as defined below), (iii) a Sprouts Operations Event (as defined below), or (iv) a Sprouts Renewal Event (as defined below).
A “Sprouts Bankruptcy Event” will occur upon the date on which Sprouts, or the guarantor under the Sprouts lease, avails itself of any creditors rights laws, otherwise becomes the subject of any bankruptcy proceedings, or has its assets made subject to the jurisdiction of any bankruptcy court. A Sprouts Bankruptcy Event will end upon Sprouts having assumed the Sprouts lease without alteration of any material terms, the assets of Sprouts or the guarantor under the Sprouts lease, no longer being subject to bankruptcy, and the obligations of Sprouts, or the obligations of the guarantor of the Sprouts lease remaining unaltered from the date on which Sprouts or the guarantor under the Sprouts lease became subject to bankruptcy.
A “Sprouts Default Event” will commence upon the date on which Sprouts defaults in payment of rent under the Sprouts lease beyond any notice or cure period and will end upon the cure of such default.
A “Sprouts Operations Event” will commence upon the date on which Sprouts goes dark, vacates, or otherwise ceases to operate and will end upon the earlier to occur of (i) Sprouts leased space being re-leased to one or more replacement tenants, or (ii) Sprouts resuming operations and rental payments in accordance with the Sprouts lease.
A “Sprouts Renewal Event” will commence upon the earlier to occur of (i) Sprouts giving notice of non-renewal or failing to exercise any of its renewal or extension options on the date that it is required to do so, or if no such date is specified, the date that is 6 months prior to the expiration of its lease. A Sprouts Renewal Event will end upon Sprouts renewing or extending its lease or the date on which Sprouts’ leased space has been leased to one or more replacement tenants.
Additional Secured Indebtedness (not including trade debts).Not permitted.
Mezzanine Loan and Preferred Equity. Not permitted.
Release of Property. Not permitted.
Terrorism Insurance. The Spectrum Town Center Borrower is required to maintain property insurance in an amount equal to the full replacement cost of the Spectrum Town Center Property and 12 months of business interruption insurance, with six months of extended indemnity, which policies are required to cover acts of terrorism.
This is not a research report and was not prepared by any Underwriter’s research departments. Please see additional important information and qualifications at the end of this Term Sheet. |
| T-108 |
(THIS PAGE INTENTIONALLY LEFT BLANK)
| T-109 |
| BANK 2017-BNK9 | Warwick Mall |
| Mortgage Loan No. 11 – Warwick Mall |
| Mortgage Loan Information | Property Information | ||||||
| Mortgage Loan Seller: | BANA | Single Asset/Portfolio: | Single Asset | ||||
| Original Balance(1): | $30,000,000 | Location: | Warwick, RI 02886 | ||||
| Cut-off Date Balance(1): | $30,000,000 | General Property Type: | Retail | ||||
| % of Initial Pool Balance: | 2.8% | Detailed Property Type: | Regional Mall | ||||
| Loan Purpose: | Refinance | Title Vesting: | Fee | ||||
| Sponsors: | Bliss Properties; Lane Family Trust; Mark T. Brennan | Year Built/Renovated: | 1970/1991, 2010 | ||||
| Mortgage Rate: | 4.4450% | Size: | 588,716 SF | ||||
| Note Date: | 9/14/2017 | Cut-off Date Balance per SF(1): | $127 | ||||
| First Payment Date: | 11/1/2017 | Maturity Date Balance per SF(1): | $117 | ||||
| Maturity Date: | 10/1/2027 | Property Manager: | Mark T. Brennan & Co., Inc.; Bliss Properties, Inc.; Norman P. Posner (borrower-related); Mark G. Sklarz | ||||
| Original Term to Maturity: | 120 months | ||||||
| Original Amortization Term: | 360 months | ||||||
| IO Period: | 60 months | ||||||
| Seasoning: | 2 months | Underwriting and Financial Information | |||||
| Prepayment Provisions(2): | LO (26); DEF (89); O (5) | UW NOI: | $9,999,062 | ||||
| Lockbox/Cash Mgmt Status(3): | Hard/Springing | UW NOI Debt Yield(1): | 13.3% | ||||
| Additional Debt Type(1): | Pari Passu | UW NOI Debt Yield at Maturity(1): | 14.6% | ||||
| Additional Debt Balance(1): | $45,000,000 | UW NCF DSCR(1): | 2.70x (IO) 2.01x(P&I) | ||||
| Future Debt Permitted (Type)(4): | Yes (Mezzanine) | Most Recent NOI: | $10,187,042 (8/31/2017 TTM) | ||||
| Reserves | 2nd Most Recent NOI: | $10,308,956 (12/31/2016) | |||||
| Type | Initial | Monthly | Cap | 3rd Most Recent NOI: | $9,340,283 (12/31/2015) | ||
| RE Tax: | $120,833 | $120,833 | N/A | Most Recent Occupancy: | 95.7% (11/17/2017) | ||
| Insurance: | $241,667 | $48,333 | N/A | 2nd Most Recent Occupancy: | 95.7% (12/31/2016) | ||
| Recurring Replacements: | $0 | $12,265 | N/A | 3rd Most Recent Occupancy: | 99.6% (12/31/2015) | ||
| TI/LC: | $830,000 | $61,196 | N/A | Appraised Value (as of): | $158,000,000 (7/28/2017) | ||
| Condominium CAM(5): | $0 | $6,377 | N/A | Cut-off Date LTV Ratio(1): | 47.5% | ||
| Guarantor Reserve(6): | $5,000,000 | $0 | N/A | Maturity Date LTV Ratio(1): | 43.5% | ||
| Sources and Uses | ||||||
| Sources | Proceeds | % of Total | Uses | Proceeds | % of Total | |
| Loan Amount: | $75,000,000 | 100.0% | Loan Payoff: | $60,799,410 | 81.1% | |
| Return of Equity(7): | $5,694,535 | 7.6% | ||||
| Guarantor Reserve(6): | $5,000,000 | 6.7% | ||||
| Closing Costs: | $2,313,555 | 3.1% | ||||
| Upfront Reserves: | $1,192,500 | 1.6% | ||||
| Total Sources: | $75,000,000 | 100.0% | Total Uses: | $75,000,000 | 100.0% | |
| (1) | The Warwick Mall Mortgage Loan (as defined below) is part of the Warwick Mall Whole Loan (as defined below), which is comprised of threepari passupromissory notes with an aggregate original principal balance of $75,000,000. The Cut-off Date Balance per SF, Maturity Date Balance per SF, UW NOI Debt Yield, UW NOI Debt Yield at Maturity, UW NCF DSCR, Cut-off Date LTV Ratio and Maturity Date LTV Ratio numbers presented above are based on the aggregate principal balance of the promissory notes comprising the Warwick Mall Whole Loan. |
| (2) | Defeasance of the Warwick Mall Whole Loan is permitted any time after the earlier of (i) September 14, 2020, or (ii) two years from the closing date of the securitization that includes the lastpari passunote of the Warwick Mall Whole Loan to be securitized. The assumed lockout period of 26 payments is based on the closing date of this transaction in December 2017. |
| (3) | The Warwick Mall Whole Loan Documents require springing cash management upon the debt service coverage ratio being less than 1.25x (calculated on an amortizing basis) for the trailing four quarters, continuing until the debt service coverage ratio is greater than or equal to 1.30x (calculated on an amortizing basis) for the trailing four quarters for two consecutive quarters. |
| (4) | Following the date which is 12 months after the loan origination date and until the date that is 12 months prior to the maturity date, the owners of the direct or indirect equity interests in the Warwick Mall Borrower are permitted, subject to the lender’s approval, to incur mezzanine debt, upon satisfaction of certain conditions, including: (i) the mezzanine lender enters into an intercreditor agreement acceptable to the lender, (ii) the lender receives rating agency confirmation and (iii) the mezzanine financing is in an amount that, when added to the outstanding principal balance of the Warwick Mall Whole Loan, will result in (1) a combined loan-to-value ratio of no more than 47.5%, (2) a combined debt service coverage ratio of no less than 2.00x and (3) a combined debt yield of no less than 12.17%. |
| (5) | The Showcase Cinema portion of the Warwick Mall Property is subject to a condominium regime. The Warwick Mall Borrower is required to deposit monthly $6,377 into a condominium common area charges reserve which represents the estimated amount due under the condominium documents for common area charges. |
| (6) | The Warwick Mall Guarantor is required to maintain (i) a minimum net worth of not less than $17.5 million and (ii) liquidity of no less than $5.0 million. To satisfy such liquidity covenant, the Warwick Mall Guarantor deposited at loan origination, and is required to maintain throughout the loan term, a $5.0 million guarantor reserve in a lender-controlled account, in which the lender has been granted a security interest. |
| (7) | The Warwick Mall Sponsors maintain an un-depreciated cost basis in the Warwick Mall Property of approximately $83.0 million. |
This is not a research report and was not prepared by any Underwriter’s research departments. Please see additional important information and qualifications at the end of this Term Sheet. |
| T-110 |
| BANK 2017-BNK9 | Warwick Mall |
The Mortgage Loan. The eleventh largest mortgage loan (the “Warwick Mall Mortgage Loan”) is part of a whole loan (the “Warwick Mall Whole Loan”) that is evidenced by threepari passupromissory notes in the aggregate original principal amount of $75,000,000. The Warwick Mall Whole Loan is secured by a first priority fee mortgage encumbering the borrower’s interest in a 588,716 SF portion of a 977,781 SF regional mall located in Warwick, Rhode Island (the “Warwick Mall Property”). The Warwick Mall Mortgage Loan is evidenced by the controlling Promissory Note A-1, in the original principal amount of $30,000,000. Non-controlling Promissory Notes A-2 and A-3 in the original principal amounts of $25,000,000 and $20,000,000, respectively, are currently being held by Bank of America, N.A. and are expected to be contributed to one or more future securitization trusts. The Warwick Mall Whole Loan will be serviced pursuant to the pooling and servicing agreement for the BANK 2017-BNK9 securitization. The proceeds of the Warwick Mall Whole Loan were used to pay off existing debt, return equity to the Warwick Mall Sponsors (as defined below), pay closing costs and fund reserves. See “Description of the Mortgage Pool—The Whole Loans—The Serviced Pari Passu Whole Loans” in the Preliminary Prospectus.
Warwick Mall Whole Loan Summary
| ||||
| Notes | Original Balance | Cut-off Date Balance | Note Holder | Controlling Interest |
| A-1 | $30,000,000 | $30,000,000 | BANK 2017-BNK9 | Yes |
| A-2 | $25,000,000 | $25,000,000 | Bank of America, N.A. | No |
| A-3 | $20,000,000 | $20,000,000 | Bank of America, N.A. | No |
| Total | $75,000,000 | $75,000,000 | ||
The Borrower and the Sponsors.The borrower is Warwick Mall Owner LLC, a single-purpose Delaware limited liability company with two independent directors (the “Warwick Mall Borrower”). Warwick Mall Owner LLC is indirectly majority owned by The Lane Trust #2 (33.33%), LEB Warwick Trust (16.67%) and the Estate of John T. Brennan (13.67%). Sponsorship consists of Bliss Properties (37.34%), the Lane Family Trust (33.3%) and Mark T. Brennan (29.3%), (together, the “Warwick Mall Sponsors”). The Warwick Mall Property was originally developed by the Warwick Mall Sponsors in 1970 and has remained under their ownership and management since development.
The non-recourse carve out guarantor for the Warwick Mall Whole Loan is Warwick Mall OP L.L.C. (the “Warwick Mall Guarantor”). Pursuant to the Warwick Mall Whole Loan documents, the Warwick Mall Guarantor is required to maintain a minimum net worth of not less than $17.5 million and liquidity of no less than $5.0 million. To satisfy the liquidity covenant, the Warwick Mall Guarantor has deposited a $5.0 million guarantor reserve in a lender controlled account.
The Property.The Warwick Mall Property is a portion of a one-level enclosed regional mall located in Warwick, Rhode Island. In addition to the anchor and inline space, the Warwick Mall Property features a food court, two freestanding restaurant buildings, two freestanding retailers, a 4,720 SF strip center, and a freestanding 12-screen Showcase Cinema. The Warwick Mall Property was built in 1970 and renovated in 2010. The property temporarily closed from March 30, 2010 to August 20, 2010 as a result of property-wide flood damage resulting from the historic flooding of the Pawtucket River on March 30, 2010. Approximately $20.5 million was spent on the renovation, including approximately $10.3 million from insurance proceeds and $10.2 million from the Warwick Mall Sponsors. Multiple tenants at the property also contributed capital to the renovation of their individual spaces, including the non-collateral anchor Macy’s, which reportedly spent $34 million, the non-collateral anchor Target, which reportedly spent $15 million, and the collateral anchor JC Penney, which reportedly spent $12 million. The post-flood renovation transformed the Warwick Mall Property into like-new condition featuring best-in-class amenities. Additionally, in 2012, the Warwick Mall Sponsors expanded the Warwick Mall Property by constructing the 37,472 SF anchor Nordstrom space.
The greater Warwick Mall totals 977,781 SF, with the Warwick Mall Mortgage Loan collateral encompassing 588,716 SF of the mall and outparcels that as of November 17, 2017was 95.7% leased by a granular rent roll of 82 tenants. Collateral anchor tenants include JC Penney, Jordan’s Furniture, Showcase Cinema, Nordstrom Rack and Old Navy; additional tenants include H&M, Kay Jewelers, Victoria’s Secret, LensCrafters, Buffalo Wild Wings, Longhorn Steakhouse and Things Remembered. Non-collateral anchor tenants are Macy’s and Target, both of which are corporate-owned.
The following table presents the historical occupancy, in-line sales and resulting occupancy cost at the Warwick Mall Property:
| Historical Occupancy and In-line Sales | ||||||
| 2012 | 2013 | 2014 | 2015 | 2016 | 9/30/2017 TTM | |
| Collateral Occupancy | 97.6% | 97.6% | 98.8% | 99.6% | 99.0% | 96.6% |
| In-Line Occupancy | 92.2% | 92.7% | 96.4% | 98.8% | 97.1% | 89.5% |
| In-Line Sales PSF | $447 | $460 | $463 | $497 | $502 | $494 |
| In-Line Occupancy Cost | 14.2% | 14.5% | 13.5% | 12.4% | 13.4% | 13.7% |
A portion of the Warwick Mall Property, which includes the Showcase Cinema parcel, is subject to a retail condominium regime with two other units: the space occupied by the non-collateral shadow anchor Target, which is corporate owned, and the two floors above the non-collateral Target, which are owned by the Warwick Mall Guarantor. All three condominium units currently have equal 1/3 interests and decision making requires 80% approval of the unit owners. See“Description of the Mortgage Pool—Mortgage Pool Characteristics—Condominium Interests”in the Preliminary Prospectus.
This is not a research report and was not prepared by any Underwriter’s research departments. Please see additional important information and qualifications at the end of this Term Sheet. |
| T-111 |
| BANK 2017-BNK9 | Warwick Mall |
Major Tenants
JC Penney (137,952 SF, 23.4% of NRA, 0.9% of underwritten rent). JC Penney has been a tenant at the Warwick Mall Property since April 1980. JC Penney leases its parcel from the Warwick Mall Borrower pursuant to a ground lease through March 31, 2020 with two, 10-year renewal options plus one, five-year renewal option. JC Penney (NYS: JCP) is one of the largest department stores in the United States operating 1,013 stores in 49 states and Puerto Rico. JC Penney features a Sephora store-within-store concept, portrait studio, optical services, and full-service beauty salon at the Warwick Mall Property and generated sales of $141 PSF at as of the trailing 12-month period ending in September 2017. Historical sales PSF were approximately $130, $134 and $144 for 2014, 2015 and 2016, respectively.
Jordan’s Furniture (113,743 SF, 19.3% of NRA, 7.6% of underwritten rent). Jordan’s Furniture has been a tenant at the Warwick Mall Property since December 2011. Jordan Furniture’s lease extends through December 2021, with five, five-year renewal options. Jordan’s Furniture is wholly-owned by Berkshire Hathaway. In addition to offering name brand furniture and mattresses, each Jordan’s Furniture store contains family entertainment including IMAX theaters, restaurants, ice cream parlors and holiday specific entertainment. The Jordan’s Furniture Store at the Warwick Mall Property features a laser light and water show. Jordan’s Furniture generated sales of $246 PSF at the Warwick Mall Property as of the trailing 12-month period ending in September 2017. Historical sales PSF were approximately $201, $224 and $244 for 2014, 2015 and 2016, respectively.
Showcase Cinema (57,160 SF, 9.7% of NRA, 8.0% of underwritten rent). Showcase Cinema has been a tenant at the Warwick Mall Property since May 2001. Showcase Cinema’s lease expires in April 2021 with five, five year renewal options. Showcase Cinema is owned by National Amusements, Inc., a privately-owned movie theater chain controlled by media mogul Sumner Redstone. With over 1,500 screens in 12 U.S. states, Argentina, Brazil, Chile, England, Russia, Scotland and Wales, the company operates under the Showcase Cinema, Multiplex Cinemas, KinoStar and Cinema de Lux banners. Showcase Cinema has 12 screens at the Warwick Mall Property and generated sales of $429,843 per screen as of the trailing 12-month period ending in September 2017. Historical sales per screen were approximately $388,802, $473,012 and $467,491 for 2014, 2015 and 2016, respectively.
Showcase Cinema has an option pursuant to its lease to request a change of use, and if it certifies an operating loss during any two of the previous three years and the landlord denies the request for a change of use, Showcase Cinema has a termination right.
Nordstrom Rack (37,472 SF, 6.4% of NRA, 8.6% of underwritten rent). Nordstrom Rack has been a tenant at the Warwick Mall Property since its building was constructed by the Warwick Mall Sponsors in November 2012. Nordstrom Rack also reportedly contributed $6.0 million to the buildout of its space. Nordstrom Rack’s lease extends through November 2022 with four, five-year renewal options. Nordstrom Rack is the off-price retail division of the upscale retailer Nordstrom, Inc., which operates 349 stores across 40 states and 3 provinces in Canada.
Old Navy (22,579 SF, 3.8% of NRA, 4.5% of underwritten rent). Old Navy has been a tenant at the Warwick Mall Property since November 2010. Old Navy’s lease extends through January 2021 with one, five-year renewal option. Old Navy is a subsidiary of The Gap, Inc., which is an American worldwide clothing and accessories retailer founded in 1969. The Gap, Inc. has over 3,200 stores in the United States, Canada, the United Kingdom, France, Ireland and Japan. Old Navy generated sales of $464 PSF at the Warwick Mall Property as of the trailing 12-month period ending in September 2017. Historical sales PSF were approximately $440, $448 and $460 for 2014, 2015 and 2016, respectively.
This is not a research report and was not prepared by any Underwriter’s research departments. Please see additional important information and qualifications at the end of this Term Sheet. |
| T-112 |
| BANK 2017-BNK9 | Warwick Mall |
The following table presents a summary regarding major tenants at the Warwick Mall Property:
| Tenant Summary(1) | ||||||||||
| Tenant Name | Credit Rating (Fitch/Moody’s/ S&P)(2) | Tenant SF | Approx. % of SF | Annual UW Base Rent(3) | % of Total Annual UW Rent | Annual UW Base Rent PSF(3)(4) | 9/30/2017 TTM Sales | Occ. Cost % | Lease Expiration | |
| $ | PSF | |||||||||
| Major Tenants | ||||||||||
| JC Penney (ground lease)(5) | B+/B1/B+ | 137,952 | 23.4% | $110,000 | 0.9% | $0.80 | $19,452,572 | $141 | 1.0% | 3/31/2020 |
| Jordan’s Furniture | A+/Aa2/AA | 113,743 | 19.3% | $948,617 | 7.6% | $8.34 | $27,943,202 | $246 | 3.4% | 12/31/2021 |
| Showcase Cinema(6) | NR/NR/B+ | 57,160 | 9.7% | $1,000,000 | 8.0% | $17.49 | $5,158,121 | $429,843 | 25.7% | 4/30/2021 |
| Nordstrom Rack | BBB+/Baa1/BBB+ | 37,472 | 6.4% | $1,071,699 | 8.6% | $28.60 | NAV | NAV | NAV | 11/30/2022 |
| Old Navy | BB+/Baa2/BB+ | 22,579 | 3.8% | $564,475 | 4.5% | $25.00 | $10,485,454 | $464 | 6.5% | 1/31/2021 |
| Subtotal/Wtd. Avg. | 368,906 | 62.7% | $3,694,791 | 29.6% | $10.02 | |||||
| Other Tenants | 194,468 | 33.0% | $8,777,007 | 70.4% | $45.13 | |||||
| Occupied Total | 563,374 | 95.7% | $12,471,798 | 100.0% | $22.14 | |||||
| Vacant Space | 25,342 | 4.3% | $0 | 0.0% | $0.00 | |||||
| Total/Wtd. Avg. | 588,716 | 100.0% | $12,471,798 | 100.0% | $22.14 | |||||
| Non-Collateral Tenants | ||||||||||
| Macy’s | BBB/Baa3/BBB- | 180,000 | NAV | NAV | NAV | NAV | ||||
| Target | A-/A2/A | 140,000 | NAV | NAV | NAV | NAV | ||||
| Off Broadway Shoes | NR/NR/NR | 22,500 | NAV | NAV | NAV | NAV | ||||
| (1) | Information is based on the underwritten rent roll. |
| (2) | Certain ratings are those of the parent company whether or not the parent guarantees the lease. |
| (3) | Annual UW Base Rent and Annual UW Base Rent PSF has been underwritten based on the November 17, 2017 rent roll. |
| (4) | Wtd. Avg. Annual UW Base Rent PSF excludes vacant space. |
| (5) | JC Penney leases its parcel from the Warwick Mall Borrower pursuant to a ground lease which commenced on April 1, 1980 and expires on March 31, 2020. JC Penney has 3 unexpired extension options remaining (two, 10-year extension options and one, 5-year extension option). |
| (6) | Showcase Cinema Sales PSF is shown as sales per screen (12 screens). Showcase Cinema has an option pursuant to its lease to request a change of use, and if it certifies an operating loss during any two of the previous three years and the landlord denies the request for a change of use, Showcase Cinema has a termination right. |
The following table presents certain information relating to the lease rollover schedule at the Warwick Mall Property:
| Lease Rollover Schedule(1)(2) | ||||||||
| Year | # of Leases Rolling | SF Rolling | UW Base Rent PSF Rolling(3) | Approx. % of Total SF Rolling | Approx. Cumulative % of SF Rolling | Total UW Base Rent Rolling | Approx. % of Total Rent Rolling | Approx. Cumulative % of Total Rent Rolling |
| 2017 & MTM | 15 | 10,439 | $47.96 | 1.8% | 1.8% | $500,652 | 4.0% | 4.0% |
| 2018 | 7 | 6,289 | $86.87 | 1.1% | 2.8% | $546,300 | 4.4% | 8.4% |
| 2019 | 12 | 28,866 | $46.59 | 4.9% | 7.7% | $1,344,789 | 10.8% | 19.2% |
| 2020 | 12 | 156,254 | $8.51 | 26.5% | 34.3% | $1,329,919 | 10.7% | 29.8% |
| 2021 | 10 | 204,606 | $15.39 | 34.8% | 69.0% | $3,148,719 | 25.2% | 55.1% |
| 2022 | 7 | 53,029 | $33.03 | 9.0% | 78.0% | $1,751,777 | 14.0% | 69.1% |
| 2023 | 7 | 49,974 | $33.09 | 8.5% | 86.5% | $1,653,438 | 13.3% | 82.4% |
| 2024 | 3 | 10,973 | $30.44 | 1.9% | 88.4% | $333,998 | 2.7% | 85.1% |
| 2025 | 3 | 14,068 | $57.52 | 2.4% | 90.8% | $809,132 | 6.5% | 91.6% |
| 2026 | 2 | 10,101 | $20.95 | 1.7% | 92.5% | $211,619 | 1.7% | 93.3% |
| 2027 | 2 | 5,718 | $66.19 | 1.0% | 93.5% | $378,457 | 3.0% | 96.3% |
| 2028 & Beyond | 2 | 13,057 | $35.46 | 2.2% | 95.7% | $463,000 | 3.7% | 100.0% |
| Vacant | 0 | 25,342 | $0.00 | 4.3% | 100.0% | $0 | 0.0% | 100.0% |
| Total/Wtd. Avg. | 82 | 588,716 | $22.14 | 100.0% | $12,471,798 | 100.0% | ||
| (1) | Information is based on the underwritten rent roll. |
| (2) | Certain tenants may have lease termination options that are exercisable prior to the originally stated expiration date of the related lease and are not considered in the rollover schedule. |
| (3) | Wtd. Avg. UW Base Rent PSF Rolling excludes vacant space. |
This is not a research report and was not prepared by any Underwriter’s research departments. Please see additional important information and qualifications at the end of this Term Sheet. |
| T-113 |
| BANK 2017-BNK9 | Warwick Mall |
The Market. The Warwick Mall Property is located in Warwick, Rhode Island along Bald Hill Road, with immediate access to Route 2 and Route 5, which routes are the focus of retail activity in the trade area and provide access to Interstate-95 and Interstate-295 leading to Providence, Rhode Island (approximately 11.2 miles from the Warwick Mall Property) and Boston, Massachusetts (approximately 50.0 miles from the Warwick Mall Property). According to the appraisal, the immediate neighborhood is defined as the Route 2 Corridor, stretching from the Interstate-95 interchange (approximately 3.5 miles south of the Warwick Mall Property) to the Route 37 interchange (approximately 3.0 miles north of the Warwick Mall Property.) The Route 2 Corridor is a densely developed regional retail destination, which south of the Warwick Mall Property has been developed over the last five to ten years, while the northern section of the corridor is characterized by more mature neighborhoods with smaller strip retail development.
According to the appraisal, the 2016 average population within a 5-, 7- and 10-mile radius was 186,650, 335,389 and 557,141, respectively. The 2016 average household income within a 5-, 7- and 10-mile radius was $76,629, $129,575 and $217,480, respectively, with retail sales per household within the same radii of $45,009, $43,789, and $44,142, respectively. Both Warwick, Rhode Island and nearby Providence, Rhode Island have historically served as hubs for the education and health services industry sectors, led by Brown University and other local universities and healthcare systems. More recently, the region has seen growth the in manufacturing and defense industries, including activity from General Dynamics Electric Boat’s $17.6 billion contract with the United States Navy in 2014 and its $100 billion Columbia nuclear missile contract, and Raytheon’s $58.1 million contract for mine neutralization systems in 2017. The Providence area is home to the headquarters of four Fortune 500 companies: CVS Health, Textron, United Natural Foods and Citizens Financial Group. Additional major employers in the area include Lifespan (12,050 employees), Care New England (8,500 employees) and Naval Station Newport (5,063 employees). The Providence metropolitan statistical area had a March 2017 unemployment rate of 3.8%.
The Warwick Mall Property is located in the Central/West Bay retail submarket of the greater Providence market. According to a third party research report, as of the year-end 2016, the Central/West Bay retail submarket contained approximately 2.8 million SF of retail mall space across 4 properties with a vacancy rate of 1.3%, as compared to the broader Providence market, which contained approximately 4.5 million SF of retail mall space across 6 properties with a vacancy rate of 5.4%.
The following table reflects the competitive retail properties with respect to the Warwick Mall Property:
| Competitive Retail Property Summary | ||||||
| Property Name/Location | Distance | Property Type | Year Built/ Renovated | Total NRA (SF) | Total Occupancy | Anchors |
Warwick Mall Warwick, RI | N/A | Super-Regional Center | 1970/ 1991; 2010 | 977,352(1) | 96%(2) | JC Penney, Macy’s (non-collateral), Target (non-collateral), Jordan’s Furniture, Showcase Cinema, Nordstrom Rack, Old Navy |
Garden City Center Cranston, RI | 4.0 mi (North) | Lifestyle Center | 1949/1990 | 473,967 | 94% | The Container Store, LA Fitness, LL Bean, Party City, Whole Foods |
Rhode Island Mall Warwick, RI | 0.3 mi (South) | Regional Center | 1967/2001 | 579,499 | N/A | Burlington Coat Factory, Kohl’s, Sears, Walmart |
Providence Place Providence, RI | 8.0 mi (North) | Super-Regional Center | 1999/N/A | 1,259,756 | 99% | Bed, Bath & Beyond, Macy’s, Nordstrom Rack |
Source: Appraisal
| (1) | Total collateral NRA is 588,716 SF. |
| (2) | Collateral occupancy is 95.7% as of November 17, 2017. |
This is not a research report and was not prepared by any Underwriter’s research departments. Please see additional important information and qualifications at the end of this Term Sheet. |
| T-114 |
| BANK 2017-BNK9 | Warwick Mall |
Operating History and Underwritten Net Cash Flow. The following table presents certain information relating to the historical operating performance and Underwritten Net Cash Flow at the Warwick Mall Property:
| Cash Flow Analysis | ||||||
| 2014 | 2015 | 2016 | 8/31/2017 TTM | UW | UW PSF | |
| Base Rent | $10,761,968 | $11,196,544 | $12,432,167 | $12,450,106 | $13,465,902(1) | $22.87 |
| Total Recoveries | $3,618,732 | $3,749,940 | $4,136,183 | $4,002,878 | $4,213,924 | $7.16 |
| Percentage Rent | $927,005 | $960,865 | $301,863 | $278,988 | $242,517 | $0.41 |
| Other Income | $658,120 | $540,642 | $583,452 | $660,178 | $540,247 | $0.92 |
| Less Vacancy & Credit Loss | ($6,645) | ($174,983) | ($121,404) | ($8,932) | ($1,505,990)(2) | ($2.56) |
| Effective Gross Income | $15,959,180 | $16,273,009 | $17,332,261 | $17,383,218 | $16,956,599 | $28.80 |
| Total Operating Expenses | $6,841,554 | $6,932,726 | $7,023,306 | $7,196,176 | $6,957,538 | $11.82 |
| Net Operating Income | $9,117,626 | $9,340,283 | $10,308,956 | $10,187,042 | $9,999,062 | $16.98 |
| Capital Expenditures | $0 | $0 | $0 | $0 | $147,179 | $0.25 |
| TI/LC | $0 | $0 | $0 | $0 | $733,745 | $1.25 |
| Net Cash Flow | $9,117,626 | $9,340,283 | $10,308,956 | $10,187,042 | $9,118,138 | $15.49 |
| Occupancy % | 98.8% | 99.6% | 95.7% | 95.7%(2) | 91.6%(2) | |
| NOI DSCR (IO)(3) | 2.70x | 2.76x | 3.05x | 3.01x | 2.96x | |
| NOI DSCR (P&I)(3) | 2.01x | 2.06x | 2.28x | 2.25x | 2.21x | |
| NCF DSCR (IO)(3) | 2.70x | 2.76x | 3.05x | 3.01x | 2.70x | |
| NCF DSCR (P&I)(3) | 2.01x | 2.06x | 2.28x | 2.25x | 2.01x | |
| NOI Debt Yield(3) | 12.2% | 12.5% | 13.7% | 13.6% | 13.3% | |
| NCF Debt Yield(3) | 12.2% | 12.5% | 13.7% | 13.6% | 12.2% | |
| (1) | Base Rent has been underwritten based on the November 17, 2017 rent roll and includes contractual rent steps through February 2019 totaling $260,217. |
| (2) | The underwritten economic occupancy is 91.6%. The Warwick Mall Property was 95.7% physically occupied as of November 17, 2017. |
| (3) | The debt service coverage ratios and debt yields are based on the Warwick Mall Whole Loan. |
Property Release. Following the defeasance lockout period, the Warwick Mall Borrower has the right to release a 1.75-acre parcel from the Warwick Mall Whole Loan collateral in connection with the transfer of such parcel to a person wholly owned by the guarantor for the development of one or more hotels, a bowling alley, one or more multifamily residential buildings, or such other project that is consistent with the operation of a first class retail shopping center and that is compatible with the Warwick Mall Property and reasonably acceptable to the lender, subject to the satisfaction of certain conditions, including, (i) partial defeasance of the Warwick Mall Whole Loan in an amount equal to $1,181,250 (125% of the appraised value of the release parcel), (ii) the loan-to-value ratio of the remaining collateral being no greater than 47.5%, and (iii) the debt yield following the release being at least 12.17%, and (iv) under no circumstances may any dividends, distributions, profits, proceeds or any other property of any nature received from the use, ownership, sale or financing of the release parcel be distributed to a shareholder, partner or member of the guarantor.
This is not a research report and was not prepared by any Underwriter’s research departments. Please see additional important information and qualifications at the end of this Term Sheet. |
| T-115 |
| BANK 2017-BNK9 | Linq Apartments |
| Mortgage Loan No. 12 – Linq Apartments |
| Mortgage Loan Information | Property Information | ||||||
| Mortgage Loan Seller: | BANA | Single Asset/Portfolio: | Single Asset | ||||
| Original Balance: | $28,500,000 | Location: | Kenmore, WA 98028 | ||||
| Cut-off Date Balance: | $28,500,000 | General Property Type(1): | Multifamily | ||||
| % of Initial Pool Balance: | 2.7% | Detailed Property Type(1): | Mid-Rise | ||||
| Loan Purpose: | Refinance | Title Vesting: | Fee | ||||
| Sponsor: | MainStreet Property Group | Year Built/Renovated: | 2016/N/A | ||||
| Mortgage Rate: | 4.3850% | Size(1): | 94 Units | ||||
| Note Date: | 11/15/2017 | Cut-off Date Balance per Unit: | $303,191 | ||||
| First Payment Date: | 1/1/2018 | Maturity Date Balance per Unit: | $303,191 | ||||
| Maturity Date: | 12/1/2027 | Property Manager: | Insite Property Solutions, LLC (borrower-related) | ||||
| Original Term to Maturity: | 120 months | Underwriting and Financial Information | |||||
| Original Amortization Term: | 0 months | ||||||
| IO Period: | 120 months | UW NOI: | $2,273,242 | ||||
| Seasoning: | 0 months | UW NOI Debt Yield: | 8.0% | ||||
| Prepayment Provisions: | LO (24); DEF (91); O (5) | UW NOI Debt Yield at Maturity: | 8.0% | ||||
| Lockbox/Cash Mgmt Status: | Soft/Springing | UW NCF DSCR: | 1.78x | ||||
| Additional Debt Type: | N/A | Most Recent NOI(2): | N/A | ||||
| Additional Debt Balance: | N/A | 2ndMost Recent NOI(2): | N/A | ||||
| Future Debt Permitted (Type): | No (N/A) | 3rdMost Recent NOI(2): | N/A | ||||
| Reserves | Most Recent Occupancy: | 92.6% (11/7/2017) | |||||
| Type | Initial | Monthly | Cap | 2ndMost Recent Occupancy(2): | N/A | ||
| RE Tax: | $23,356 | $11,678 | N/A | 3rdMost Recent Occupancy(2): | N/A | ||
| Insurance: | $0 | Springing | N/A | Appraised Value (as of): | $44,610,000 (9/28/2017) | ||
| Recurring Replacements: | $0 | $1,175 | N/A | Cut-off Date LTV Ratio: | 63.9% | ||
| Other Reserve(3): | $861,181 | $0 | N/A | Maturity Date LTV Ratio: | 63.9% | ||
| Sources and Uses | ||||||
| Sources | Proceeds | % of Total | Uses | Proceeds | % of Total | |
| Loan Amount: | $28,500,000 | 100.0% | Loan Payoff: | $20,399,421 | 71.6% | |
| Return of Equity(4): | $6,888,332 | 24.2% | ||||
| Reserves: | $884,537 | 3.1% | ||||
| Closing Costs: | $327,711 | 1.1% | ||||
| Total Sources: | $28,500,000 | 100.0% | Total Uses: | $28,500,000 | 100.0% | |
| (1) | The Linq Apartments Property (as defined below) also has one ground floor retail tenant, Evergreen Health, which leases 19,301 SF through April 30, 2032. |
| (2) | There are no historical cash flow figures available for the Linq Apartments Property as the property was built in 2016 and began leasing in February 2017. |
| (3) | Other Reserve represents outstanding tenant improvement and leasing commissions related to the Evergreen Health retail space. |
| (4) | The Linq Apartments Sponsor (as defined below) developed the property in 2016 at a total cost basis of approximately $30.2 million. |
The Mortgage Loan. The twelfth largest mortgage loan (the “Linq Apartments Mortgage Loan”) is evidenced by a promissory note in the original principal amount of $28,500,000 secured by a first priority fee mortgage encumbering a 94-unit, mid-rise apartment complex with 19,301 SF of ground floor retail space, located in Kenmore, Washington (the “Linq Apartments Property”). The proceeds of the Linq Apartments Mortgage Loan were used to refinance existing debt secured by the Linq Apartments Property, fund reserves, pay closing costs and return equity to the Linq Apartments Borrower (as defined below).
The Borrower and Sponsor. The borrower is LINQ Lofts LLC, a single purpose Delaware limited liability company with one independent director (the “Linq Apartments Borrower”). The Linq Apartments Borrower is indirectly majority owned by Eric Campbell (26.42%), Scheumann Investments LLC (19.94%) and Grousemont Associates (12.96%). The sponsor of the Linq Apartments Mortgage Loan is MainStreet Property Group (the “Linq Apartments Sponsor”). The nonrecourse carve-out guarantor is Eric Campbell, Chief Executive Officer of MainStreet Property Group.
MainStreet Property Group is a privately-held real estate development company with a primary focus on residential, retail and mixed-use properties. Other companies affiliated with MainStreet Property Group include GenCap Construction Corp. and Insite Property Solutions, LLC. GenCap Construction Corp. is a general commercial contractor and management firm that specializes in the construction of large scale, multi-family units, retail and tenant improvements. Insite Property Solutions, LLC is a property management company that partners with investors, developers and owners in order to operate residential communities and commercial centers. Mainstreet Property Group has focused its primary investments on Seattle’s Eastside, with other projects in neighboring cities. The Linq Apartments Sponsor currently has an interest in 19 projects containing more than 1,700 residential units.
This is not a research report and was not prepared by any Underwriter’s research departments. Please see additional important information and qualifications at the end of this Term Sheet. |
| T-116 |
| BANK 2017-BNK9 | Linq Apartments |
The Property.The Linq Apartments Property is a 5-story, 94-unit mid-rise apartment complex with 19,301 SF of retail space and one level of underground parking located at 18151 68th Avenue NE in Kenmore, Washington. The Linq Apartments Property was developed in 2016 and began leasing units to the public in February 2017. As of November 7, 2017, the residential units at the Linq Apartments Property were 92.6% occupied and the ground floor retail space was 100% leased to Evergreen Health through April 2032. Evergreen Health is a public hospital district and community-based health care organization established in 1972.
The Linq Apartments Property offers a unit mix of apartments ranging from urban flats to three-bedroom units including lofts featuring barn doors, quartz countertops, hard wood flooring, full-size stackable washers and dryers, stainless steel appliances and 100% LED lighting. The Linq Apartments Property incorporates sustainable features to achieve LEED Gold status. The Linq Apartments Sponsor rechanneled 68th Avenue NE, which added on-street parking, bike lanes and pedestrian sidewalks. Additional amenities at the Linq Apartments Property include a communal event space, a fully-equipped gym, a “shared workspace” setup with dinner-style seating and an arts-and-crafts room.
The table below shows the apartment unit mix at the Linq Apartments Property:
| Linq Apartments Unit Mix | |||||||||
| Unit Type | Units | Occupied Units | % Occupied | Average SF per Unit | Total SF | Average Rent per Unit | Market Rent per Unit | Average Rent PSF | Market Rent PSF |
| Urban One Flat | 16 | 15 | 93.8% | 624 | 9,980 | $1,630 | $1,635 | $2.61 | $2.62 |
| 1x1 Tech | 46 | 43 | 93.5% | 787 | 36,210 | $1,787 | $1,800 | $2.27 | $2.29 |
| 2x2 | 9 | 9 | 100.0% | 1,175 | 10,575 | $2,516 | $2,521 | $2.14 | $2.15 |
| 2x2 Loft | 10 | 7 | 70.0% | 1,035 | 10,350 | $2,415 | $2,369 | $2.33 | $2.29 |
| 2x2 Den | 7 | 7 | 100.0% | 1,101 | 7,705 | $2,233 | $2,246 | $2.03 | $2.04 |
| 3x2 | 4 | 4 | 100.0% | 1,305 | 5,220 | $2,823 | $2,834 | $2.16 | $2.17 |
| 3x3 Loft | 2 | 2 | 100.0% | 1,423 | 2,845 | $2,795 | $2,995 | $1.96 | $2.11 |
| Total/Wtd. Avg. | 94 | 87 | 92.6% | 882 | 82,885 | $1,993 | $2,004 | $2.26 | $2.27 |
Source: Underwritten rent roll dated November 7, 2017.
The Market.The Linq Apartments Property is located at 18151 68th Avenue NE in Kenmore, Washington, directly north of the intersection with Highway 522 (Bothell Way NE), and approximately 14 miles northeast of Seattle. The Linq Apartments Property is situated between Interstate 5 and Interstate 405, with access to Interstate 405 less than 3 miles away. The Linq Apartments Property is located on the northernmost shore of Lake Washington which is home to a large industrial port as well as Kenmore Air Harbor, one of the largest seaplane facilities in the world.
According to the appraisal, the Linq Apartments Property is located within in the Seattle-Tacoma-Bellevue, Washington metropolitan statistical area (the “MSA”), which had a 2016 total population of 3,796,727 and experienced an annual population growth rate of 1.7% between 2010 and 2016, which was greater than the United States and the State of Washington at 0.8% and 1.3%, respectively, during the same time period. The MSA had an unemployment rate of 4.5% in 2016, which was lower than both the United States and the State of Washington at 4.9% and 5.4%, respectively, during the same time period. The MSA is home to eight fortune 500 Companies: Microsoft, Weyerhaeuser, Nordstrom, Costco Wholesale, Amazon.com, Paccar, Starbucks and Expeditors International of Washington. The top employers in the area are Boeing (81,939 employees), Joint Base Lewis McChord (56,000 employees), Microsoft (43,301 employees), Navy Region NW (43,000 employees), the University of Washington (30,200 employees) and Amazon.com (24,700 employees). The 2016 population within a 1-, 3- and 5-mile radius was 12,443, 103,530 and 327,927, respectively. The 2016 estimated median household income within a 1-, 3- and 5-mile radius was $82,423, $84,474 and $76,005, respectively.
The Linq Apartments Property is located in the Eastside King County multifamily market within the Puget Sound region and the Kenmore/Bothell multifamily submarket. According to the appraisal, the Kenmore/Bothell multifamily submarket totals 2,876 units representing approximately 6% of the inventory of the Eastside King County broader market. The Eastside King County market added an annualized average of 2,638 and 2,048 new units in spring 2017 and fall 2017, respectively, with annual absorption rates of 6.0% and 4.6%, respectively. Between 2017 and 2019, the Kenmore/Bothell submarket is expected to add 842 new units to the area’s total multifamily inventory. As of September 2017, the Kenmore/Bothell submarket had a vacancy rate of 5.4%. The appraiser noted no new projects either under construction or proposed in Kenmore.
This is not a research report and was not prepared by any Underwriter’s research departments. Please see additional important information and qualifications at the end of this Term Sheet. |
| T-117 |
| BANK 2017-BNK9 | Linq Apartments |
Comparable rental properties to the Linq Apartments Property are shown in the table below:
| Comparable Rental Properties | ||||||||
| Property | City/State | Distance | Year Built | # Units | Occupancy | Average SF per Unit | Average Rent per Unit | Average Rent PSF |
| The Linq Apartments | Kenmore, WA | N/A | 2016 | 94 | 92.6%(1) | 882 | $1,993 | $2.26 |
| Spencer 68 Apartments(2) | Kenmore, WA | 0.1 mi | 2015 | 222 | 88% | 916 | $1,842 | $2.01 |
| Six Oaks | Bothell, WA | 1.9 mi | 2014 | 202 | 98% | 801 | $1,827 | $2.28 |
| The Village at Beardslee PH I | Bothell, WA | 2.8 mi | 2014 | 146 | 96% | 832 | $1,828 | $2.20 |
| The Village at Beardslee PH II | Bothell, WA | 2.7 mi | 2015 | 158 | 96% | 832 | $1,765 | $2.12 |
| Malmo Apartments | Shoreline, WA | 4.6 mi | 2015 | 129 | 97% | 749 | $1,696 | $2.26 |
| Array | Seattle, WA | 2.8 mi | 2013 | 319 | 98% | 757 | $1,878 | $2.48 |
| Total/Wtd. Avg.(3) | 1,176 | 95% | 813 | $1,821 | $2.25 | |||
Source: Appraisal.
| (1) | The Linq Apartments Property was 92.6% occupied as of November 7, 2017. |
| (2) | Spencer 68 Apartments is also owned by the Linq Apartments Sponsor. The two properties offer similar unit sizes, but do not directly compete with each other. Spencer 68 Apartments is an 8-building town-home style, drive-up residential community that features more traditional residential amenities such as private garages, open outdoor spaces and BBQ areas. |
| (3) | Total/Wtd. Avg. statistics exclude the Linq Apartments Property. |
Underwritten Net Cash Flow.The following table presents certain information relating to the Underwritten Net Cash Flow at the Linq Apartments Property:
| Cash Flow Analysis(1) | |||||
| UW | UW per Unit | ||||
| Base Rent | $2,244,840 | $23,881 | |||
| Commercial Income | $891,872 | $9,488 | |||
| Other Income(2) | $271,248 | $2,886 | |||
| Less Vacancy & Credit Loss | ($191,396) | ($2,036) | |||
| Effective Gross Income | $3,216,564 | $34,219 | |||
| Total Operating Expenses | $943,322 | $10,035 | |||
| Net Operating Income | $2,273,242 | $24,183 | |||
| Capital Expenditures | $18,800 | $200 | |||
| Net Cash Flow | $2,254,442 | $23,983 | |||
| Occupancy % | 94.2%(3) | ||||
| NOI DSCR | 1.79x | ||||
| NCF DSCR | 1.78x | ||||
| NOI Debt Yield | 8.0% | ||||
| NCF Debt Yield | 7.9% | ||||
| (1) | There are no historical cash flow figures available for the Linq Apartments Property as the property was built in 2016 and leasing began in February 2017. |
| (2) | Other Income includes utility reimbursements and parking income. |
| (3) | The Linq Apartments Property was underwritten to an occupancy of 94.2%. Occupancy as of November 7, 2017 was 92.6%. |
This is not a research report and was not prepared by any Underwriter’s research departments. Please see additional important information and qualifications at the end of this Term Sheet. |
| T-118 |
(THIS PAGE INTENTIONALLY LEFT BLANK)
| T-119 |
| BANK 2017-BNK9 | Bass Pro & Cabela’s Portfolio |
| Mortgage Loan No. 13 – Bass Pro & Cabela’s Portfolio |
| Mortgage Loan Information | Property Information | |||||||
| Mortgage Loan Seller: | WFB | Single Asset/Portfolio: | Portfolio | |||||
| Original Balance(1): | $23,500,000 | Location: | Various | |||||
| Cut-off Date Balance(1): | $23,500,000 | General Property Type: | Retail | |||||
| % of Initial Pool Balance: | 2.2% | Detailed Property Type: | Single Tenant | |||||
| Loan Purpose: | Acquisition | Title Vesting: | Fee | |||||
| Sponsor: | Starwood Property Trust, Inc. | Year Built/Renovated: | Various | |||||
| Mortgage Rate: | 4.3790% | Size: | 1,896,527 SF | |||||
| Note Date: | 9/25/2017 | Cut-off Date Balance per SF(1): | $103 | |||||
| First Payment Date: | 11/6/2017 | Maturity Date Balance per SF(1): | $103 | |||||
| Maturity Date: | 10/6/2027 | Property Manager: | Self-Managed | |||||
| Original Term to Maturity: | 120 months | |||||||
| Original Amortization Term: | 0 months | Underwriting and Financial Information | ||||||
| IO Period: | 120 months | UW NOI: | $24,937,758 | |||||
| Seasoning: | 2 months | UW NOI Debt Yield(1): | 12.8% | |||||
| Prepayment Provisions(2): | LO(24);YM1(2);DEF/YM1(87);O(7) | UW NOI Debt Yield at Maturity(1): | 12.8% | |||||
| Lockbox/Cash Mgmt Status: | Hard/Springing | UW NCF DSCR(1): | 2.72x | |||||
| Additional Debt Type(3): | Pari Passu | Most Recent NOI(6): | N/A | |||||
| Additional Debt Balance: | $171,400,000 | 2nd Most Recent NOI(6): | N/A | |||||
| Future Debt Permitted (Type)(4): | Yes (Mezzanine) | 3rd Most Recent NOI(6): | N/A | |||||
| Reserves | Most Recent Occupancy: | 100.0% (12/1/2017) | ||||||
| Type | Initial | Monthly | Cap | 2nd Most Recent Occupancy(6): | N/A | |||
| RE Tax: | $0 | Springing(5) | N/A | 3rd Most Recent Occupancy(6): | N/A | |||
| Insurance: | $0 | Springing(5) | N/A | Appraised Value (as of): | $386,700,000 (7/1/2017) | |||
| Recurring Replacements: | $0 | Springing(5) | N/A | Cut-off Date LTV Ratio(1): | 50.4% | |||
| TI/LC: | $0 | Springing(5) | N/A | Maturity Date LTV Ratio(1): | 50.4% | |||
| Sources and Uses | ||||||
| Sources | Proceeds | % of Total | Uses | Proceeds | % of Total | |
| Whole Loan Amount: | $194,900,000 | 56.8% | Purchase Price: | $341,609,572 | 99.5% | |
| Borrower Equity | $148,423,879 | 43.2% | Closing Costs: | $1,714,307 | 0.5% | |
| Total Sources: | $343,323,879 | 100.0% | Total Uses: | $343,323,879 | 100.0% | |
| (1) | The Bass Pro & Cabela’s Portfolio Mortgage Loan is part of the Bass Pro & Cabela’s Portfolio Whole Loan (as defined below.) The Cut-off Date Balance per SF, Maturity Date Balance per SF, UW NCF DSCR, UW NOI Debt Yield, UW NOI Debt Yield at Maturity, Cut-off Date LTV Ratio and Maturity Date LTV Ratio numbers presented are based on the Bass Pro & Cabela’s Portfolio Whole Loan. |
| (2) | Prior to the open prepayment date of April 6, 2027, the Bass Pro & Cabela’s Portfolio Whole Loan can be prepaid, in whole or in part, (a) by defeasance after the earlier to occur of (i) September 25, 2020 and (ii) the first monthly payment date following the end of the two-year period commencing on the closing date of the securitization of the last Bass Pro & Cabela’s Portfolio Whole Loan promissory note (collectively, the “Defeasance Lockout Period”) or (b) after October 6, 2019 (the “Yield Maintenance Lockout Period”) with payment of the greater of 1% of the amount prepaid or a yield maintenance premium, provided that no yield maintenance premium will be payable with respect to the first $25,000,000 (the “Permitted Free Prepayment Amount”) of principal repaid regardless of when paid, so long as no event of default has occurred and is continuing under the Bass Pro & Cabela’s Portfolio Whole Loan (except in the case where such prepayment is effected in order to cure or prevent a default or an event of default or is the payment of a release price to cure an event of default, and such default or event of default is not the result of the willful misconduct or bad faith actions of any Bass Pro & Cabela’s Portfolio borrower). Any prepayment made of the Permitted Free Prepayment Amount will be allocated among Promissory Note A-1, Note A-2 and all of the A-3 notes in the aggregate on a pro rata andpari passubasis; provided that any such prepayments (including in connection with the release of any of the Bass Pro & Cabela’s Portfolio Properties (as defined below)) allocated to the A-3 notes in the aggregate will not be allocated among such notes on a pro rata andpari passu basis, but instead, will be allocated among such notes as described under “The Mortgage Loan” below. Partial release is permitted. See “Release of Property” below for further discussion of release requirements. |
| (3) | See “The Mortgage Loan” below for further discussion of additional debt. |
| (4) | Any time after March 25, 2018, direct or indirect equity owners of the Bass Pro & Cabela’s Portfolio Borrower (as defined below) are permitted to obtain a mezzanine loan in an amount not to exceed $24,362,500, provided that certain conditions are satisfied, including but not limited to the following: (a) immediately after giving effect to such mezzanine loan, (i) the combined loan-to-value ratio is not greater than 50.4%, (ii) the combined debt service coverage ratio is not less than 3.08x, and (iii) the combined debt yield is not less than 13.67%, (b) the mortgage lenders and the lender under the mezzanine loan have entered into an intercreditor agreement reasonably acceptable to the mortgage lenders, (c) such mezzanine loan is coterminous with the Bass Pro & Cabela’s Portfolio Whole Loan or freely prepayable without any premium or penalty from and after the maturity date of the Bass Pro & Cabela’s Portfolio Whole Loan, (d) if the mezzanine loan bears a floating interest rate, the mezzanine borrower must maintain an interest rate cap agreement from a reasonably acceptable counterparty in a notional amount not less than the outstanding principal balance of the mezzanine loan and with a strike price that would result in a debt service coverage ratio of at least 3.08x, and (e) the receipt of a rating agency confirmation. |
| (5) | Ongoing monthly reserves for taxes, insurance, recurring replacements and TI/LCs are not required unless a Trigger Period (as defined below) has occurred and is continuing. A “Trigger Period” will occur upon (i) the delivery to the lenders of annual or quarterly financial reports showing that the debt yield, determined as of the last day of any fiscal quarter is less than 10.5%, (ii) a Bass Pro Event (as defined below), or (iii) if annual or quarterly financial reports are not delivered to the lenders when required, then ten business days following the borrower’s receipt of written notice of the same, at the lenders’ option. A “Bass Pro Event” means (i) the Master Tenant (as defined below) ceases operations or vacates, as determined in accordance with the Bass Pro & Cabela’s Portfolio Master Lease, with respect to more than 15% of the Bass Pro & Cabela’s Portfolio Properties (by number of locations), (ii) the guarantor of the Bass Pro & Cabela’s Portfolio Master Lease or the Master Tenant files for bankruptcy, (iii) the Master Tenant defaults under the Bass Pro & Cabela’s Portfolio Master Lease beyond any notice and cure period set forth in the Master Lease, or (iv) the total net leverage ratio for the tenant exceeds 5.75x and will end upon the cure of such event as determined in accordance with the loan documents. |
| (6) | There is no historical data as the Bass Pro & Cabela’s Portfolio Properties were owner occupied prior to executing a master lease on September 25, 2017. |
This is not a research report and was not prepared by any Underwriter’s research departments. Please see additional important information and qualifications at the end of this Term Sheet. |
| T-120 |
| BANK 2017-BNK9 | Bass Pro & Cabela’s Portfolio |
The Mortgage Loan. The thirteenth largest mortgage loan (the “Bass Pro & Cabela’s Portfolio Mortgage Loan”) is part of a whole loan (the “Bass Pro & Cabela’s Portfolio Whole Loan”) evidenced by twelvepari passupromissory notes, secured by the fee interest in a portfolio of retail properties located in 10 states (the “Bass Pro & Cabela’s Portfolio Properties”). The Bass Pro & Cabela’s Portfolio Whole Loan was co-originated on September 25, 2017 by Goldman Sachs Mortgage Company (“GS”), Wells Fargo Bank, National Association (“WFB”) and UBS AG, by and through its branch office at 1285 Avenue of the Americas, New York, New York (“UBS”) (collectively, the “Cabela’s Co-Originators”). The Bass Pro & Cabela’s Portfolio Whole Loan has an outstanding principal balance as of the Cut-off Date of $194,900,000 and each note has an interest rate of 4.3790% per annum. The Bass Pro & Cabela’s Portfolio Whole Loan had an initial term of 120 months, has a remaining term of 118 months as of the Cut-off Date and requires payments of interest only through its term. The Bass Pro & Cabela’s Portfolio Whole Loan matures on October 6, 2027.
Promissory Note A-2(B)(2), with an original principal balance of $23,500,000, represents the Bass Pro & Cabela’s Portfolio Mortgage Loan and will be included in the BANK 2017-BNK9 securitization trust. Promissory Notes A-1(A-CP), A-1(A-NCP), A-1(B-CP), A-2(A), A-2(B)(1), A-3(A-CP), A-3(B-CP), A-3(C-CP), A-3(D-NCP), A-3(E-NCP) and A-3(F-NCP), with an aggregate original principal balance of $171,400,000, collectively represent thepari passu companion loans (collectively, the “Bass Pro & Cabela’s PortfolioPari Passu Companion Loans”) and are currently held by GSMC, WFB and UBS AG or a securitization trust, as further described in the Bass Pro & Cabela’s Portfolio Whole Loan Summary table below. The lenders provide no assurances that any of the non-securitized notes will not be split further. The Bass Pro & Cabela’s Portfolio Whole Loan is expected to be serviced pursuant to the pooling and servicing agreement for the GSMS 2017-GS8 securitization transaction. See “Description of the Mortgage Pool—The Whole Loans—The Non-Serviced Whole Loans” and“Pooling and Servicing Agreement—Servicing of the Non-Serviced Mortgage Loans” in the Preliminary Prospectus.
Promissory Notes A-2(A), A-2(B)(1) and A-2(B)(2) are collectively referred to herein as the “A-2 Notes”. Any prepayment made of the Permitted Free Prepayment Amount will be allocated among Promissory Notes A-1, A-2 and the A-3 Notes in the aggregate, on a pro rata andpari passu basis. However, any such prepayments of the Permitted Free Prepayment Amount (including any prepayments made in connection with the release of any of the Bass Pro & Cabela’s Portfolio Properties) that are allocated to the A-2 Notes in the aggregate will not be allocated among the individual A-2 Notes on a pro rata andpari passu basis, but instead will generally be allocated first to Promissory Note A-2(A), until the principal balance of such note has been reduced to zero, and then to Promissory Notes A-2(B)(1) and A-2(B)(2), on pro rata andpari passu basis, until the principal balance of such notes has been reduced to zero. The maximum Permitted Free Prepayment Amount that may be allocated to the A-2 Notes in the aggregate is $7,500,000. The aggregate of the principal balances of Note A-2(A) (the “Non-Call Protected A-2 Note”) is also $7,500,000. As a result, it is expected that any Permitted Free Prepayment Amounts allocated to the A-2 Notes in the aggregate will generally be allocated to the Non-Call Protected A-2 Note and will not be allocated to the Mortgage Loan (Note A-2(B)(2)), unless the aggregate principal balance of the Non-Call Protected A-2 Note was previously reduced to an amount that is less than the amount of any Permitted Free Prepayment Amount. See“Description of the Mortgage Pool—The Whole Loans—The Non-Serviced Whole Loans—Application of Principal and Defeasance—Bass Pro & Cabela’s Portfolio Whole Loan”in the Preliminary Prospectus.
The proceeds of the Bass Pro & Cabela’s Portfolio Whole Loan, together with $148,423,879 of borrower equity, were used to acquire the Bass Pro & Cabela’s Portfolio Properties and pay closing costs.
| Bass Pro & Cabela’s Whole Loan Summary | ||||
| Notes | Original Balance | Cut-off Date Balance | Note Holder | Controlling Piece |
| Note A-1(A-CP) | $37,500,000 | $37,500,000 | GSMS 2017-GS8(1) | Yes |
| Note A-1(A-NCP) | $10,000,000 | $10,000,000 | GSMS 2017-GS8(1) | No |
| Note A-1(B-CP) | $30,460,000 | $30,460,000 | GSMC | No |
| Note A-2(A) | $7,500,000 | $7,500,000 | WFB | No |
| Note A-2(B)(1) | $27,470,000 | $27,470,000 | WFB | No |
| Note A-2(B)(2) | $23,500,000 | $23,500,000 | BANK 2017-BNK9 | No |
| Note A-3(A-CP) | $20,000,000 | $20,000,000 | UBS 2017-C5 | No |
| Note A-3(B-CP) | $24,750,000 | $24,750,000 | UBS | No |
| Note A-3(C-CP) | $6,220,000 | $6,220,000 | UBS | No |
| Note A-3(D-NCP) | $2,500,000 | $2,500,000 | UBS | No |
| Note A-3(E-NCP) | $2,500,000 | $2,500,000 | UBS | No |
| Note A-3(F-NCP) | $2,500,000 | $2,500,000 | UBS | No |
| Bass Pro & Cabela’s Whole Loan | $194,900,000 | $194,900,000 | ||
| (1) | The GSMS 2017-GS8 securitization transaction is expected to close on November 30, 2017. |
The Borrowers and the Sponsor.
The borrowers are SPT Prairie I CB Drive, LLC, SPT Prairie 200 BP Drive, LLC, SPT Prairie 210 Demers Avenue, LLC, SPT 1000 CB Drive, LLC, SPT Prairie 2250 Gatlin Blvd., LLC, SPT Prairie 2427 N. Greenwich Road, LLC, SPT Prairie 2502 W. CB Drive, LLC, SPT Prairie 2700 Market Place Drive, LLC, SPT Prairie 3900 CB Drive, LLC, SPT Prairie 5500 Cornerstone North Blvd., LLC, SPT Prairie 7090 CB Drive NW, LLC, SPT Prairie 7700 CB Drive, LLC, SPT Prairie 10670 CB Drive, LLC, SPT Prairie 10501 Palm River Road, LLC, SPT Prairie 17907 IH-10 West, LLC and SPT Prairie 20200 Rodgers Drive, LLC (collectively, the “Bass Pro & Cabela’s Portfolio Borrower”), each a single-purpose Delaware limited liability company structured to be bankruptcy remote with two independent directors.
The borrower sponsor and nonrecourse carve-out guarantor of the Bass Pro & Cabela’s Portfolio Whole Loan is Starwood Property Trust, Inc. (“SPT”), an affiliate of Starwood Capital Group. The aggregate recourse to the borrower sponsor related to bankruptcy or insolvency actions or the breach of SPE Covenants resulting in substantive consolidation may not exceed an amount equal to 20% of the principal balance of the Bass Pro & Cabela’s Portfolio Whole Loan outstanding at the time of the occurrence of such event, plus reasonable third-party costs incurred by the lender in connection with the enforcement of its rights. SPT’s core business focuses on originating, acquiring, financing and managing commercial mortgage loans and other commercial real estate debt investments. As of the second quarter of 2017, the company had a current equity market capitalization of approximately $5.8 billion and an enterprise value of $12.4 billion. Since its inception, Starwood Property Trust, Inc. has deployed over $29.0 billion in capital across various commercial
This is not a research report and was not prepared by any Underwriter’s research departments. Please see additional important information and qualifications at the end of this Term Sheet. |
| T-121 |
| BANK 2017-BNK9 | Bass Pro & Cabela’s Portfolio |
real estate debt investments, commercial and residential mortgage-backed securities, and other commercial and residential real estate-related debt investments. The company currently owns a diversified portfolio of retail, residential, office and medical office properties across the U.S. and Europe.
The Properties.
The Bass Pro & Cabela’s Portfolio is comprised of 16 single tenant retail properties leased to Cabela’s (12 properties) and Bass Pro Shops (4 properties) retail stores totaling 1,896,527 SF of space across 10 states. The Bass Pro & Cabela’s Portfolio Properties were constructed between 1997 and 2016 and range in size from 43,263 SF to 188,745 SF, with an average size of 118,533 SF. No asset accounts for more than 10.8% of the total rental income and no single state comprises more than 25.2% of the total rental income.
The Bass Pro & Cabela’s Portfolio Properties are 100.0% leased to Cabela’s Wholesale, Inc. (“Cabela’s” or the “Master Tenant”) under a triple net unitary master lease executed at the origination of the Bass Pro & Cabela’s Portfolio Whole Loan (the “Bass Pro & Cabela’s Portfolio Master Lease”). The Bass Pro & Cabela’s Portfolio Master Lease has a 25-year term expiring on April 30, 2042 with an initial annual base rent of $14.05 per SF with increases every five years equal to the lesser of (i) 12.5% or (ii) the aggregate percent increase of the consumer price index over the prior five-year period. The Bass Pro & Cabela’s Portfolio Master Lease has six five-year renewal options with annual base rent resets at the commencement of each renewal period at the greater of (i) fair market rent or (ii) 110% of the annual base rent from the immediately preceding year, and no termination options. Obligations of the Master Tenant under the Bass Pro & Cabela’s Portfolio Master Lease are guaranteed by Bass Pro Group, LLC, an affiliate of the Master Tenant.
The following tables present certain information relating to the Bass Pro & Cabela’s Portfolio Properties:
| Portfolio Summary | ||||||||
| Property Name | Location | Year Built | Property NRSF(1) | Allocated Cut-Off Date Balance(2) | % Allocated Cut-off Date Balance | Appraised Value | Allocated Cut-off Date LTV Ratio | Allocated Base Rent |
| Cabela’s Rogers | Rogers, MN | 2005 | 186,379 | $20,700,000 | 10.6% | $41,100,000 | 50.4% | $2,878,000 |
| Cabela’s Lone Tree | Lone Tree, CO | 2013 | 108,077 | $17,600,000 | 9.0% | $34,950,000 | 50.4% | $2,445,000 |
| Bass Pro San Antonio | San Antonio, TX | 2006 | 184,656 | $17,200,000 | 8.8% | $34,200,000 | 50.3% | $2,308,100 |
| Cabela’s Allen(3) | Allen, TX | 2010 | 107,329 | $16,900,000 | 8.7% | $33,600,000 | 50.3% | $2,100,000 |
| Cabela’s Lehi | Lehi, UT | 2006 | 169,713 | $15,400,000 | 7.9% | $30,600,000 | 50.3% | $1,990,000 |
| Bass Pro Tampa | Tampa, FL | 2015 | 132,734 | $14,500,000 | 7.4% | $28,800,000 | 50.3% | $2,302,850 |
| Cabela’s Hammond | Hammond, IN | 2007 | 188,745 | $13,000,000 | 6.7% | $25,700,000 | 50.6% | $1,800,000 |
| Bass Pro Round Rock | Round Rock, TX | 2014 | 120,763 | $12,600,000 | 6.5% | $25,000,000 | 50.4% | $1,500,000 |
| Cabela’s Fort Mill | Fort Mill, SC | 2014 | 104,476 | $11,700,000 | 6.0% | $23,250,000 | 50.3% | $1,627,100 |
| Cabela’s Wichita | Wichita, KS | 2011 | 80,699 | $10,500,000 | 5.4% | $20,800,000 | 50.5% | $1,404,550 |
| Cabela’s Owatonna | Owatonna, MN | 1997 | 161,987 | $9,600,000 | 4.9% | $19,000,000 | 50.5% | $1,520,000 |
| Cabela’s Centerville | Centerville, OH | 2016 | 71,872 | $8,900,000 | 4.6% | $17,600,000 | 50.6% | $1,143,600 |
| Cabela’s Huntsville | Huntsville, AL | 2016 | 82,443 | $8,300,000 | 4.3% | $16,400,000 | 50.6% | $1,025,000 |
| Bass Pro Port St. Lucie | Port St. Lucie, FL | 2013 | 86,637 | $7,700,000 | 4.0% | $15,350,000 | 50.2% | $1,150,000 |
| Cabela’s Waco | Waco, TX | 2013 | 43,263 | $6,000,000 | 3.1% | $11,850,000 | 50.6% | $798,200 |
| Cabela’s East Grand Forks | East Grand Forks, MN | 1999 | 66,754 | $4,300,000 | 2.2% | $8,500,000 | 50.6% | $660,000 |
| Total/Weighted Average | 1,896,527 | $194,900,000 | 100% | $386,700,000 | 50.4% | $26,652,400 | ||
| (1) | Information obtained from the underwritten rent roll. |
| (2) | Based on the Bass Pro & Cabela’s Portfolio Whole Loan amount. |
| (3) | The City of Allen, Texas has a right of first refusal (“ROFR”) to purchase the Cabela’s Allen property if an offer is received that the borrower is otherwise willing to accept, and a right of first offer (“ROFO”) if the borrower decides to market the property for sale. The ROFR and ROFO and recurring rights and terminate 15 years after completion of construction or upon repayment of grants from the City of Allen (a certificate of occupancy was issued in April 2011). Further, applicable restrictions permit the use of the property as a Cabela’s only, and City approval would be required for any successor use. |
This is not a research report and was not prepared by any Underwriter’s research departments. Please see additional important information and qualifications at the end of this Term Sheet. |
| T-122 |
| BANK 2017-BNK9 | Bass Pro & Cabela’s Portfolio |
| Historical Sales Performance | |||||||||
| Property Name | Property SF(1) | Sales ($) | Sales PSF | ||||||
| 2014 | 2015 | 2016 | TTM(2) | 2014 | 2015 | 2016 | TTM(2) | ||
| Cabela’s Rogers | 186,379 | $66,143,890 | $66,114,325 | $65,612,864 | $64,397,009 | $ 355 | $ 355 | $ 352 | $ 346 |
| Cabela’s Lone Tree | 108,077 | $50,540,139 | $53,173,638 | $53,507,506 | $52,580,155 | $ 468 | $ 492 | $ 495 | $ 487 |
| Bass Pro San Antonio | 184,656 | $46,850,725 | $45,147,437 | $42,252,151 | $41,944,692 | $ 254 | $ 244 | $ 229 | $ 227 |
| Cabela’s Allen | 107,329 | $51,003,648 | $54,760,193 | $55,165,344 | $53,101,409 | $ 475 | $ 510 | $ 514 | $ 495 |
| Cabela’s Lehi | 169,713 | $49,050,049 | $53,127,414 | $45,616,127 | $42,784,972 | $ 289 | $ 313 | $ 269 | $ 252 |
| Bass Pro Tampa | 132,734 | N/A | N/A | $49,556,186 | $47,290,425 | N/A | N/A | $ 373 | $ 356 |
| Cabela’s Hammond | 188,745 | $40,171,544 | $41,750,631 | $40,674,889 | $38,911,591 | $ 213 | $ 221 | $ 216 | $ 206 |
| Bass Pro Round Rock | 120,763 | N/A | N/A | $29,280,166 | $30,223,077 | N/A | N/A | $ 242 | $ 250 |
| Cabela’s Fort Mill | 104,476 | N/A | $26,514,959 | $28,348,550 | $26,548,534 | N/A | $ 254 | $ 271 | $ 254 |
| Cabela’s Wichita | 80,699 | $32,134,636 | $31,487,608 | $28,598,702 | $27,079,480 | $ 398 | $ 390 | $ 354 | $ 336 |
| Cabela’s Owatonna | 161,987 | $36,740,413 | $36,280,363 | $35,215,690 | $33,160,088 | $ 227 | $ 224 | $ 217 | $ 205 |
| Cabela’s Centerville | 71,872 | N/A | N/A | $13,038,242 | $15,092,953 | N/A | N/A | $ 181 | $ 210 |
| Cabela’s Huntsville | 82,443 | N/A | N/A | $22,460,788 | $22,016,732 | N/A | N/A | $ 272 | $ 267 |
| Bass Pro Port St. Lucie | 86,637 | $24,021,522 | $23,758,647 | $23,690,873 | $22,866,252 | $ 277 | $ 274 | $ 273 | $ 264 |
| Cabela’s Waco | 43,263 | $14,778,172 | $17,044,063 | $17,119,752 | $16,532,260 | $ 342 | $ 394 | $ 396 | $ 382 |
| Cabela’s East Grand Forks | 66,754 | $16,543,482 | $16,342,556 | $15,356,164 | $14,618,059 | $ 248 | $ 245 | $ 230 | $ 219 |
| Total/Weighted Average | 1,896,527 | $427,978,220 | $ 465,501,833 | $ 565,493,993 | $ 549,147,687 | $ 309 | $ 313 | $ 298 | $ 290 |
| (1) | Information is based on the underwritten rent roll. |
| (2) | TTM Sales ($) and TTM Sales PSF are from July 2016 to June 2017. |
Cabela’s (1,896,527 SF, 100.0% of NRA, 100.0% of underwritten base rent). Bass Pro Shops acquired Cabela’s for a purchase price of approximately $5.0 billion to become North America’s premier outdoor and conservation company. The merger received regulatory approval on July 5, 2017 and closed on September 25, 2017. Following the merger, the combined company is known as the Bass Pro Group, LLC. Bass Pro Shops was founded in 1972 in Springfield, Missouri. Bass Pro Shops is a privately held national retailer of hunting, fishing, camping and related outdoor gear and apparel. Bass Pro Shops operates 82 Bass Pro stores across 32 U.S. states and four Canadian provinces. Bass Pro Shops also operates Big Cedar Lodge, a resort welcoming more than one million guests to Missouri’s Ozark Mountains per year. Cabela’s (NYSE: CAB) was founded in 1961, went public in 2004, and is currently based in Sidney, Nebraska. Cabela’s is a direct marketer and specialty retailer of hunting, fishing, boating, camping, shooting, and related outdoor recreation merchandise. As of year-end 2016, the company operated 85 retail stores, including 74 stores in the U.S. and 11 stores in Canada. Cabela’s stores range in size from 40,000 SF to 246,000 SF. Most locations typically include wildlife displays in natural habitats, dioramas, a restaurant or deli, and aquarium stocked with local fish.
The following table presents a summary regarding the sole tenant at the Bass Pro & Cabela’s Portfolio Properties:
| Tenant Summary | |||||||
| Tenant Name | Credit Rating (Fitch/Moody’s/S&P)(1) | Tenant SF | Approximate % of SF | Annual UW Rent(1) | % of Total Annual UW Rent | Annual UW Rent PSF(2) | Lease Expiration |
| Major Tenants | |||||||
| Cabela’s Wholesale, Inc.(3) | NR/Ba3/B+ | 1,896,527 | 100.0% | $26,652,400 | 100.0% | $14.05 | 4/30/2042(4) |
| Vacant Space | 0 | 0.0% | $0 | 0.0% | $0.00 | ||
| Total/Wtd. Avg. | 1,896,527 | 100.0% | $26,652,400 | 100.0% | $14.05 | ||
| (1) | Ratings provided are for the parent company of the entity listed in the “Tenant Name” field whether or not the parent company guarantees the lease. |
| (2) | Annual UW Rent and Annual UW Rent PSF is based on the minimum master lease rent. |
| (3) | The Bass Pro & Cabela’s Portfolio Properties are leased to the Master Tenant under a 25-year NNN master lease and operated under the Cabela’s and Bass Pro Shop brands. |
| (4) | The Bass Pro & Cabela’s Portfolio Properties have six five-year renewal options with no termination options. |
This is not a research report and was not prepared by any Underwriter’s research departments. Please see additional important information and qualifications at the end of this Term Sheet. |
| T-123 |
| BANK 2017-BNK9 | Bass Pro & Cabela’s Portfolio |
The Markets. The Bass Pro & Cabela’s Portfolio Properties are located across 16 markets in 10 states, with the top three markets, Chicago (10.0% of NRA), Twin Cities (9.8% of NRA) and San Antonio (9.7% of NRA) representing 29.5% of NRA with no other market representing more than 8.9% of NRA.
The following table presents certain market information relating to the Bass Pro & Cabela’s Portfolio Properties:
| Market Information(1) | ||||||
| Property Name | Location | Market(2) | Estimated 2017 Population(3) | Estimated 2017 Average Household Income(3) | Rental Rate PSF | |
| Actual(4) | Market(2) | |||||
| Cabela’s Rogers | Rogers, MN | Twin Cities | 32,950 | $121,804 | $15.44 | $14.25 |
| Cabela’s Lone Tree | Lone Tree, CO | Denver | 156,660 | $141,711 | $22.62 | $21.00 |
| Bass Pro San Antonio | San Antonio, TX | San Antonio | 135,780 | $109,077 | $12.50 | $12.00 |
| Cabela’s Allen | Allen, TX | Dallas | 239,733 | $132,938 | $19.57 | $20.00 |
| Cabela’s Lehi | Lehi, UT | Salt Lake City | 113,925 | $107,930 | $11.73 | $11.75 |
| Bass Pro Tampa | Tampa, FL | Tampa-St. Petersburg | 199,723 | $65,282 | $17.35 | $17.00 |
| Cabela’s Hammond | Hammond, IN | Chicago | 228,213 | $65,540 | $9.54 | $9.70 |
| Bass Pro Round Rock | Round Rock, TX | Austin | 132,637 | $97,299 | $12.42 | $12.50 |
| Cabela’s Fort Mill | Fort Mill, SC | Charlotte | 148,219 | $80,904 | $15.57 | $15.00 |
| Cabela’s Wichita | Wichita, KS | Wichita | 115,269 | $88,536 | $17.40 | $13.00 |
| Cabela’s Owatonna | Owatonna, MN | Owatonna | 26,126 | $72,739 | $9.38 | $8.50 |
| Cabela’s Centerville | Centerville, OH | Dayton | 128,676 | $85,520 | $15.91 | $12.00 |
| Cabela’s Huntsville | Huntsville, AL | Huntsville | 102,803 | $69,794 | $12.43 | $14.00 |
| Bass Pro Port St. Lucie | Port St. Lucie, FL | Port St Lucie/Fort Pierce | 109,748 | $70,134 | $13.27 | $12.50 |
| Cabela’s Waco | Waco, TX | Waco | 129,894 | $58,388 | $18.45 | $17.00 |
| Cabela’s East Grand Forks | East Grand Forks, MN | Grand Forks | 67,005 | $67,934 | $9.89 | $10.00 |
| Total/Weighted Average | $14.05 | $13.38 | ||||
| (1) | Information is based on third party market research reports. |
| (2) | Information is based on the appraisals. |
| (3) | Information is based on a five-mile radius. |
| (4) | Information is based on the Bass Pro & Cabela’s Portfolio Master Lease. |
Operating History and Underwritten Net Cash Flow. The following table presents certain information relating to the Underwritten Net Cash Flow at the Bass Pro & Cabela’s Portfolio Properties:
| Cash Flow Analysis(1)(2) | |||||
| UW | UW PSF | ||||
| Base Rent | $26,652,400(3) | $14.05 | |||
| Total Recoveries | $7,640,446 | $4.03 | |||
| Less Vacancy & Credit Loss | $ (1,714,642) | ($0.90) | |||
| Effective Gross Income | $32,578,204 | $17.18 | |||
| Total Operating Expenses | $7,640,446 | $4.03 | |||
| Net Operating Income | $24,937,758 | $13.15 | |||
| TI/LC | $474,132 | $0.25 | |||
| Replacement Reserve | $948,264 | $0.50 | |||
| Net Cash Flow | $23,515,362 | $12.40 | |||
| Occupancy %(4) | 95.0% | ||||
| NOI DSCR(5) | 2.88x | ||||
| NCF DSCR(5) | 2.72x | ||||
| NOI Debt Yield(5) | 12.8% | ||||
| NCF Debt Yield(5) | 12.1% | ||||
| (1) | Certain items such as straight line rent, interest expense, interest income, lease cancellation income, depreciation, amortization, debt service payments and any other non-recurring or non-operating items were not considered for the cash flow analysis. |
| (2) | There is no historical financial information as the Bass Pro & Cabela’s Portfolio Properties were owner-occupied prior to executing the Master Lease on September 25, 2017. |
| (3) | UW Gross Potential Rent is based on the Master Lease. |
| (4) | The underwritten economic occupancy is 95.0%. The Bass Pro & Cabela’s Portfolio Properties were 100.0% physically occupied as of December 1, 2017. |
| (5) | Debt service coverage ratios and debt yields are based on the Bass Pro & Cabela’s Portfolio Whole Loan. |
This is not a research report and was not prepared by any Underwriter’s research departments. Please see additional important information and qualifications at the end of this Term Sheet. |
| T-124 |
| BANK 2017-BNK9 | Bass Pro & Cabela’s Portfolio |
Release of Property.Any time after the expiration of the Yield Maintenance Lockout Period or the Defeasance Lockout Period, the Bass Pro & Cabela’s Portfolio Borrower may obtain the release of any of the Bass Pro & Cabela’s Portfolio Properties, provided that among other things, (a) no event of default has occurred and is continuing (unless the release would cure or prevent a non-monetary default related solely to the released property and such default is the result of willful misconduct or bad actions of the borrower), (b)(i) to the extent the Yield Maintenance Lockout Period has expired, prepayment of the Bass Pro & Cabela’s Portfolio Whole Loan in an amount equal to the applicable Release Amount (as defined below) and the applicable yield maintenance premium (subject to no yield maintenance premium on the first $25 million of prepaid principal) or (ii) to the extent the Defeasance Lockout Period has expired, defeasance of the Bass Pro & Cabela’s Portfolio Whole Loan in an amount equal to the applicable Release Amount, (c) the debt yield with respect to the remaining Bass Pro & Cabela’s Portfolio Properties is no less than the greater of (i) 13.67% and (ii) the debt yield for the 12-month period ending on the last day of the most recently ended fiscal quarter (provided that the Bass Pro & Cabela’s Portfolio Borrower may partially prepay the Bass Pro & Cabela’s Portfolio Whole Loan or deliver a letter of credit in an amount when subtracted from the outstanding principal balance of the loan would result in a debt yield satisfying such tests), (d) the delivery of a legal opinion covering compliance in all respects with all laws, rules and regulations governing REMICs, and (e) the release of the applicable Bass Pro & Cabela’s Portfolio Properties from the Bass Pro & Cabela’s Portfolio Master Lease.
The “Release Amount” is an amount equal to the greater of (a) 80% of the net sales proceeds for such property and (b) the Release Percentage of the Allocated Cut-off Date Balance (identified in the “Portfolio Summary” chart above).
The “Release Percentage” means (i) for up to 10% of the original principal balance of the Bass Pro & Cabela’s Portfolio Whole Loan prior to such release, 110% of the applicable Allocated Cut-off Date Balance, (ii) exceeding 10%, but not exceeding 15% of the original principal balance of the Bass Pro & Cabela’s Portfolio Whole Loan prior to such release, 115% of the applicable Allocated Cut-off Date Balance, (iii) exceeding 15%, but not exceeding 20% of the original principal balance of the Bass Pro & Cabela’s Portfolio Whole Loan prior to such release, 120% of the applicable Allocated Cut-off Date Balance, or (iv) exceeding 20% of the original principal balance of the Bass Pro & Cabela’s Portfolio Whole Loan prior to such release, 125% of the applicable Allocated Cut-off Date Balance.
Substitution.Any time from and after the six-month anniversary of the closing date of the securitization of the last Bass Pro & Cabela’s Portfolio Whole Loan promissory note (but prior to April 6, 2027), the Bass Pro & Cabela’s Portfolio Borrower may obtain the release of any of the Bass Pro & Cabela’s Portfolio Properties by providing one or more substitute properties (individually or collectively, the “Substitute Property”), provided that, among other things, (a) the Bass Pro & Cabela’s Portfolio Borrower delivers to the lenders a Phase I environmental report, a structural engineering report, a seismic report (if necessary) and an appraisal demonstrating the as-is appraised value of the Substitute Property(ies) is greater than or equal to the replaced property at the time of substitution, (b) the rent under the Master Lease is not reduced as a result of such substitution, (c) after the substitution, the aggregate allocated loan amount of all Substituted Properties does not exceed 10% of the original balance of the Bass Pro & Cabela’s Portfolio Whole Loan, or if greater than 10%, at the lenders’ determination to the extent the Master Tenant requests additional substitutions in accordance with the Master Lease (however the 10% threshold is not permitted to include any property substitution effectuated for the sole purpose of curing an event of default or Trigger Period), (d) the debt yield with respect to the remaining Bass Pro & Cabela’s Portfolio Properties including the Substitute Property, is no less than the greater of (i) 13.67% and (ii) the debt yield for the 12-month period ending on the last day of the most recently ended fiscal quarter and (e) if all or any portion of the Bass Pro & Cabela’s Portfolio Whole Loan has been securitized (i) the delivery of a legal opinion covering compliance in all respects with all laws, rules and regulations governing REMICs and (ii) the receipt of a rating agency confirmation.
This is not a research report and was not prepared by any Underwriter’s research departments. Please see additional important information and qualifications at the end of this Term Sheet. |
| T-125 |
| BANK 2017-BNK9 | Lowes Ground Lease – Oxnard, CA |
| Mortgage Loan No. 14 – Lowes Ground Lease - Oxnard, CA |
| Mortgage Loan Information | Property Information | ||||||
| Mortgage Loan Seller: | WFB | Single Asset/Portfolio: | Single Asset | ||||
| Original Balance: | $19,000,000 | Location: | Oxnard, CA 93036 | ||||
| Cut-off Date Balance: | $19,000,000 | General Property Type: | Other | ||||
| % of Initial Pool Balance: | 1.8% | Detailed Property Type: | Leased Fee | ||||
| Loan Purpose: | Refinance | Title Vesting: | Fee | ||||
| Sponsors: | Gary C. Simons; Sean A. Baker | Year Built/Renovated: | 2011/N/A | ||||
| Mortgage Rate: | 4.3300% | Size: | 171,069 SF(1) | ||||
| Note Date: | 11/14/2017 | Cut-off Date Balance per SF: | $111 | ||||
| First Payment Date: | 1/11/2018 | Maturity Date Balance per SF: | $111 | ||||
| Maturity Date: | 12/11/2027 | Property Manager: | Self-Managed | ||||
| Original Term to Maturity: | 120 months | ||||||
| Original Amortization Term: | 0 months | Underwriting and Financial Information | |||||
| IO Period: | 120 months | UW NOI: | $1,566,844 | ||||
| Seasoning: | 0 months | UW NOI Debt Yield: | 8.2% | ||||
| Prepayment Provisions: | LO (24); DEF (92); O (4) | UW NOI Debt Yield at Maturity: | 8.2% | ||||
| Lockbox/Cash Mgmt Status: | Hard/In Place | UW NCF DSCR: | 1.88x | ||||
| Additional Debt Type: | N/A | Most Recent NOI: | $1,567,156 (9/30/2017 TTM) | ||||
| Additional Debt Balance: | N/A | 2nd Most Recent NOI: | $1,566,486 (12/31/2016) | ||||
| Future Debt Permitted (Type): | No (N/A) | 3rd Most Recent NOI: | $1,559,211 (12/31/2015) | ||||
| Most Recent Occupancy: | 100.0% (12/1/2017) | ||||||
| 2nd Most Recent Occupancy: | 100.0% (12/31/2016) | ||||||
| Reserves | 3rd Most Recent Occupancy: | 100.0% (12/31/2015) | |||||
| Type | Initial | Monthly | Cap | Appraised Value (as of): | $32,000,000 (5/24/2017) | ||
| RE Tax: | $0 | Springing | N/A | Cut-off Date LTV Ratio: | 59.4% | ||
| Insurance: | $0 | Springing | N/A | Maturity Date LTV Ratio: | 59.4% | ||
| Sources and Uses | ||||||
| Sources | Proceeds | % of Total | Uses | Proceeds | % of Total | |
| Loan Amount: | $19,000,000 | 99.2% | Loan Payoff: | $18,954,860 | 98.9% | |
| Borrower Equity: | $161,227 | 0.8% | Closing Costs: | $206,367 | 1.1% | |
| Total Sources: | $19,161,227 | 100.0% | Total Uses: | $19,161,227 | 100.0% | |
| (1) | Size shown represents the improvements. The leased fee parcel comprises 460,864 SF. |
The Mortgage Loan. The fourteenth largest mortgage loan (the “Lowes Ground Lease - Oxnard, CA Mortgage Loan”) is evidenced by a promissory note in the original principal amount of $19,000,000, and is secured by a first priority fee mortgage encumbering a 10.6-acre leased fee site that is improved with a 171,069 SF home improvement center located in Oxnard, California (the “Lowes Ground Lease - Oxnard, CA Property”). The proceeds of the Lowes Ground Lease - Oxnard, CA Mortgage Loan together with cash equity from the Lowes Ground Lease - Oxnard, CA Borrower (as defined below), were used to refinance a previous loan of approximately $18,954,860, and pay closing costs.
The Borrower and the Sponsors. The borrower is Upside Oxnard Parcel 1, LP (the “Lowes Ground Lease - Oxnard, CA Borrower”), a special-purpose California limited partnership structured to be bankruptcy-remote. The sponsors are Gary C. Simons and Sean A. Baker (the “Lowes Ground Lease - Oxnard, CA Sponsors”). The non-recourse carveout guarantors are Gary C. Simons, Sean A. Baker, Gary C. Simons as Trustee of the Gary C. Simons Living Trust, and Sean A. Baker and Dianna K. Baker as Co-Trustees of the Amended and Restated Baker Family Trust.
Mr. Simons and Mr. Baker are the principals of Upside Investments, Inc., a California-based company that owns apartment complexes and shopping centers valued in excess of $275,000,000 across the western United States. Mr. Simons and Mr. Baker each have over 40 years of experience in commercial real estate acquisitions, development and management throughout the western United States.
The Property. The Lowes Ground Lease - Oxnard, CA Mortgage Loan is secured by the leased fee interest in a 10.6-acre parcel that is ground leased to Lowes HIW Inc. (“Lowes HIW”), which operates a 171,069 SF Lowe’s home improvement center on the parcel, located in Oxnard, California. The Lowes Ground Lease - Oxnard, CA Property is a part of the larger Carriage Square Shopping Center, which is also owned by the Lowes Ground Lease - Oxnard, CA Sponsors and has tenants including O’Reilly Auto Parts, IHOP, KFC, and 7-Eleven (which are not part of the collateral). The Lowes Ground Lease - Oxnard, CA Property contains 543 parking spaces, resulting in a parking ratio of 3.17 spaces per 1,000 SF of rentable area.
The Lowes Ground Lease - Oxnard, CA Property is 100% occupied by Lowes HIW through November 2031 with six, five-year extension options. The lease provides for a flat rent of $1,600,000 through its term. Lowes HIW is a wholly-owned subsidiary of Lowe’s Companies, Inc. (NYSE:LOW; rated ’A3’ and ’A-’ by Moody’s and S&P, respectively).
This is not a research report and was not prepared by any Underwriter’s research departments. Please see additional important information and qualifications at the end of this Term Sheet. |
| T-126 |
| BANK 2017-BNK9 | Lowes Ground Lease – Oxnard, CA |
Incorporated in 1946, Lowe’s Companies, Inc. (“Lowe’s”) is the world’s second largest home improvement company. Lowe’s operates throughout the home improvement retail operations segment, serving homeowners, renters and professional customers. As of August 4, 2017, Lowe’s operated 2,141 home improvement and hardware stores, representing approximately 214 million SF of retailing sales floor spaces.
The following table presents certain information relating to the sole tenant at the Lowes Ground Lease - Oxnard, CA Property:
| Tenant Summary | ||||||||||
| Tenant Name | Credit Rating (Fitch/Moody’s/S&P)(1) | Tenant SF | Approximate % of SF | Annual UW Rent | % of Total Annual UW Rent | Annual UW Rent PSF | 2016 Sales | Lease Expiration | ||
| $ | PSF | Occ. Cost % | ||||||||
| Tenant | ||||||||||
| Lowes HIW Inc.(2) | NR/A3/A- | 171,069 | 100.0% | $1,600,000 | 100.0% | $9.35 | N/A | N/A | N/A | 11/22/2031 |
| Subtotal/Wtd. Avg. | 171,069 | 100.0% | $1,600,000 | 100.0% | $9.35 | N/A | N/A | N/A | ||
| Vacant Space | 0 | 0.0% | $0 | 0.0% | $0.00 | |||||
| Total/Wtd. Avg. | 171,069 | 100.0% | $1,600,000 | 100.0% | $9.35 | |||||
| (1) | Certain ratings are those of the parent company whether or not the parent guarantees the lease. |
| (2) | Lowe’s HIW Inc. has a right of first offer (“ROFO”) to purchase the Lowes Ground Lease – Oxnard, CA Property if the borrower decides to market the property for sale. The ROFO is not extinguished by foreclosure; however, the ROFO does not apply to foreclosure or deed-in-lieu thereof. |
The following table presents certain information relating to the lease rollover schedule at the Lowes Ground Lease - Oxnard, CA Property:
| Lease Rollover Schedule(1) | ||||||||
| Year | # of Leases Rolling | SF Rolling | UW Rent PSF Rolling(3) | Approx. % of Total SF Rolling | Approx. Cumulative % of SF Rolling | Total UW Rent Rolling | Approx. % of Total Rent Rolling | Approx. Cumulative % of Total Rent Rolling |
| 2017 | 0 | 0 | $0.00 | 0.0% | 0.0% | $0 | 0.0% | 0.0% |
| 2018 | 0 | 0 | $0.00 | 0.0% | 0.0% | $0 | 0.0% | 0.0% |
| 2019 | 0 | 0 | $0.00 | 0.0% | 0.0% | $0 | 0.0% | 0.0% |
| 2020 | 0 | 0 | $0.00 | 0.0% | 0.0% | $0 | 0.0% | 0.0% |
| 2021 | 0 | 0 | $0.00 | 0.0% | 0.0% | $0 | 0.0% | 0.0% |
| 2022 | 0 | 0 | $0.00 | 0.0% | 0.0% | $0 | 0.0% | 0.0% |
| 2023 | 0 | 0 | $0.00 | 0.0% | 0.0% | $0 | 0.0% | 0.0% |
| 2024 | 0 | 0 | $0.00 | 0.0% | 0.0% | $0 | 0.0% | 0.0% |
| 2025 | 0 | 0 | $0.00 | 0.0% | 0.0% | $0 | 0.0% | 0.0% |
| 2026 | 0 | 0 | $0.00 | 0.0% | 0.0% | $0 | 0.0% | 0.0% |
| 2027 | 0 | 0 | $0.00 | 0.0% | 0.0% | $0 | 0.0% | 0.0% |
| 2028 and Beyond | 1 | 171,069 | $9.35 | 100.0% | 100.0% | $1,600,000 | 100.0% | 100.0% |
| Vacant | 0 | 0 | $0.00 | 0.0% | 100.0% | $0 | 0.0% | 100.0% |
| Total/Wtd. Avg. | 1 | 171,069 | $9.35 | 100.0% | $1,600,000 | 100.0% | ||
| (1) | Information is based on the underwritten rent roll. |
The Market. The Lowes Ground Lease - Oxnard, CA Property is located in the northern quadrant of the City of Oxnard at the intersection of Gonzales Road and Oxnard Boulevard, which is part of the Pacific Coast Highway. The Lowes Ground Lease - Oxnard, CA Property is located approximately 0.8 miles south of U.S. Highway 101 and 7.7 miles from the Port of Hueneme, the only deep water commercial port between Los Angeles and San Francisco. According to a third party market research report, the estimated 2017 average household income within a three- and five-mile radius of the Lowes Ground Lease - Oxnard, CA Property is $84,619 and $84,643, respectively. The estimated 2017 population within the same three- and five-mile radii was 144,612 and 303,172, respectively.
According to the appraisal, the Lowes Ground Lease - Oxnard, CA Property is located within the Oxnard/Port Hueneme submarket of the Los Angeles retail market. According a third party market research report, as of the third quarter of 2017, the Oxnard/Port Hueneme submarket contained a total inventory of approximately 7.9 million SF with a 4.7% vacancy rate. The appraiser concluded to a market rent for the Lowes Ground Lease - Oxnard, CA Property of $9.35 PSF, triple net.
This is not a research report and was not prepared by any Underwriter’s research departments. Please see additional important information and qualifications at the end of this Term Sheet. |
| T-127 |
| BANK 2017-BNK9 | Lowes Ground Lease – Oxnard, CA |
The following table reflects competitive ground leases with respect to the Lowes Ground Lease - Oxnard, CA Property as identified in the appraisal:
| Competitive Lease Summary | |||||
| Property Name/Location | Size (SF)(1) | Lease Date | Lease Term (Yrs.) | Annual Ground Rent | Rent PSF(1) |
Golden Coral Restaurant 9516 Lakewood Blvd, Downey, CA | 12,000 | Jun-14 | 20.0 | $235,000 | $19.58 |
ALDI 1545 N. Hacienda Blvd, La Puente, CA | 18,577 | Feb-16 | 20.0 | $321,036 | $17.28 |
CVS 1303 Sepulveda Blvd, Los Angeles, CA | 14,576 | Nov-13 | 25.0 | $250,000 | $17.15 |
Home Depot Gateway Towne Center Greenleaf Boulevard and Alameda Street, Compton, CA | 113,047 | 2006 | 25.0 | $750,000 | $6.63 |
Home Depot Moorpark Miller Parkway and Patriot Drive, Moorpark, CA | 139,646 | 2007 | 20.0 | $1,550,000 | $11.10 |
Source:Appraisal
| (1) | The Size and Rent PSF shown are based on the improvements. |
Operating History and Underwritten Net Cash Flow.The following table presents certain information relating to the historical operating performance and the Underwritten Net Cash Flow at the Lowes Ground Lease - Oxnard, CA Property:
| Cash Flow Analysis | |||||||||||
| 2015 | 2016 | 9/30/2017 TTM | UW | UW PSF | |||||||
| Base Rent | $1,600,000 | $1,600,000 | $1,599,999 | $1,600,000 | $9.35 | ||||||
| Total Recoveries | $0 | $0 | $0 | $0 | $0.00 | ||||||
| Other Income | $0 | $0 | $0 | $0 | $0.00 | ||||||
| Less Vacancy | $0 | $0 | $0 | $0 | $0.00 | ||||||
| Effective Gross Income | $1,600,000 | $1,600,000 | $1,599,999 | $1,600,000 | $9.35 | ||||||
| Total Operating Expenses | $40,789 | $33,514 | $32,843 | $33,156 | $0.19 | ||||||
| Net Operating Income | $1,559,211 | $1,566,486 | $1,567,156 | $1,566,844 | $9.16 | ||||||
| Capital Expenditures | $0 | $0 | $0 | $0 | $0.00 | ||||||
| Net Cash Flow | $1,559,211 | $1,566,486 | $1,567,156 | $1,566,844 | $9.16 | ||||||
| Occupancy % | 100.0% | 100.0% | 100.0% | 100.0% | |||||||
| NOI DSCR | 1.87x | 1.88x | 1.88x | 1.88x | |||||||
| NCF DSCR | 1.87x | 1.88x | 1.88x | 1.88x | |||||||
| NOI Debt Yield | 8.2% | 8.2% | 8.2% | 8.2% | |||||||
| NCF Debt Yield | 8.2% | 8.2% | 8.2% | 8.2% | |||||||
| (1) | The UW economic vacancy is 0.0%. The Lowes Ground Lease - Oxnard, CA Property was 100.0% occupied as of December 1, 2017. |
This is not a research report and was not prepared by any Underwriter’s research departments. Please see additional important information and qualifications at the end of this Term Sheet. |
| T-128 |
(THIS PAGE INTENTIONALLY LEFT BLANK)
| T-129 |
| BANK 2017-BNK9 | Crystal Glen Office Centre |
| Mortgage Loan No. 15 – Crystal Glen Office Centre |
| Mortgage Loan Information | Property Information | ||||||
| Mortgage Loan Seller: | MSMCH | Single Asset/Portfolio: | Single Asset | ||||
| Original Balance: | $18,693,750 | Location: | Novi, MI 48375 | ||||
| Cut-off Date Balance: | $18,693,750 | General Property Type: | Office | ||||
| % of Initial Pool Balance: | 1.8% | Detailed Property Type: | Suburban | ||||
| Loan Purpose: | Acquisition | Title Vesting: | Fee | ||||
| Sponsor: | Raymond Massa | Year Built/Renovated: | 1989/2015 | ||||
| Mortgage Rate: | 4.0800% | Size: | 241,547 SF | ||||
| Note Date: | 11/7/2017 | Cut-off Date Balance per SF: | $77 | ||||
| First Payment Date: | 1/1/2018 | Maturity Date Balance per SF: | $62 | ||||
| Maturity Date: | 12/1/2027 | Property Manager: | CBRE, Inc. | ||||
| Original Term to Maturity: | 120 months | ||||||
| Original Amortization Term: | 360 months | ||||||
| IO Period: | 0 months | Underwriting and Financial Information | |||||
| Seasoning: | 0 months | UW NOI(3): | $2,541,154 | ||||
| Prepayment Provisions: | LO (24); DEF (91); O (5) | UW NOI Debt Yield: | 13.6% | ||||
| Lockbox/Cash Mgmt Status: | Springing / Springing | UW NOI Debt Yield at Maturity: | 17.0% | ||||
| Additional Debt Type: | N/A | UW NCF DSCR: | 2.09x | ||||
| Additional Debt Balance: | N/A | Most Recent NOI: | $2,641,134 (8/30/2017 TTM) | ||||
| Future Debt Permitted (Type): | No (N/A) | 2nd Most Recent NOI: | $2,428,647 (12/31/2016) | ||||
| Reserves | 3rd Most Recent NOI: | $1,902,437 (12/31/2015) | |||||
| Type | Initial | Monthly | Cap | Most Recent Occupancy(4): | 85.7% (10/31/2017) | ||
| RE Tax: | $75,390 | $18,847 | N/A | 2nd Most Recent Occupancy: | 86.2% (12/31/2016) | ||
| Insurance: | $0 | Springing(1) | N/A | 3rd Most Recent Occupancy: | 86.9% (12/31/2015) | ||
| Recurring Replacements: | $0 | $4,026 | N/A | Appraised Value (as of): | $25,900,000 (10/4/2017) | ||
| TI/LC: | $750,000 | $20,129 | $1,250,000(2) | Cut-off Date LTV Ratio: | 72.2% | ||
| Other(3): | $269,915 | $0 | N/A | Maturity Date LTV Ratio: | 57.6% | ||
| Sources and Uses | ||||||
| Sources | Proceeds | % of Total | Uses | Proceeds | % of Total | |
| Loan Amount: | $18,693,750 | 69.6% | Purchase Price: | $24,925,000 | 92.8% | |
| Borrower Equity: | $8,151,447 | 30.4% | Reserves: | $1,095,305 | 4.1% | |
| Closing Costs: | $824,892 | 3.1% | ||||
| Total Sources: | $26,845,197 | 100.0% | Total Uses: | $26,845,197 | 100.0% | |
| (1) | Monthly deposits for insurance are springing upon the Crystal Glen Office Centre Borrower (as defined below) failing to maintain an approved blanket policy or an event of default under the loan documents. |
| (2) | If, after reaching the cap, funds in the TI/LC reserve fall below $750,000, monthly deposits are required to resume until the cap is again reached. |
| (3) | Other reserves represent outstanding tenant improvements and leasing commissions ($235,800) and an outstanding free rent reserve ($34,115). |
| (4) | Most Recent Occupancy includes three tenants (2.0% of NRA) that are paying rent but currently dark. Rent from such tenants was not underwritten. |
The Mortgage Loan. The fifteenth largest mortgage loan (the “Crystal Glen Office Centre Mortgage Loan”) is evidenced by a promissory note in the original principal amount of $18,693,750 and secured by a first priority fee mortgage encumbering an office property located in Novi, Michigan (the “Crystal Glen Office Centre Property”). The proceeds of the Crystal Glen Office Centre Mortgage Loan, together with $8,151,447 of borrower equity, were used to acquire the Crystal Glen Office Centre Property, fund reserves, and pay closing costs.
The Borrower and the Sponsor.The borrower is Crystal Glen Michigan Realty LP (the “Crystal Glen Office Centre Borrower”), a single-purpose Delaware limited partnership, which does not have an independent director. The Crystal Glen Office Centre Borrower is 0.5% owned by its general partner, Crystal Glen Michigan Realty Management LLC, and 99.5% owned by Crystal Glen Michigan LP. Crystal Glen Michigan Realty Management LLC and Crystal Glen Michigan LP are controlled by Group RMC Management Inc. (“Group RMC”).
Group RMC is a real estate management company headquartered in New York City targeting investments in office assets throughout the United States. Group RMC is currently invested in 18 office properties and one warehouse property totaling approximately 6,495,699 SF across more than 80 buildings throughout the United States and Canada.
The sponsor and nonrecourse carve-out guarantor is Raymond Massa. Raymond Massa controls Group RMC and has a 9.74% beneficial interest in the borrower.
The Property.The Crystal Glen Office Centre Property is a 241,547 SF, 6-story, Class A office building located on an approximately 11.65-acre parcel in Novi, Michigan. The Crystal Glen Office Centre Property lobby features a 6-story central glass atrium, granite flooring, a multi-tiered fountain and a sculptured glass elevator. The Crystal Glen Office Centre Property was built in 1989 and renovated between 2012 and 2016 at an approximate cost to the
This is not a research report and was not prepared by any Underwriter’s research departments. Please see additional important information and qualifications at the end of this Term Sheet. |
| T-130 |
| BANK 2017-BNK9 | Crystal Glen Office Centre |
seller of $1.4 million. Amenities at the Crystal Glen Office Centre Property include a conference room located on the lower level, a café, a hair salon, mobile dry cleaning and shoe shine services, access to bike paths and four electric car charging stations. There are 853 parking spaces (approximately 3.5 spaces per 1,000 SF) at the Crystal Glen Office Centre Property.
The Crystal Glen Office Center Property consists of one unit in an 11-unit condominium in which the borrower holds a 25.22% interest in the common elements. Under the condominium documents, each unit has the right to elect one member of the board of directors. Accordingly, the borrower does not control the condominium. There is no active association or board of directors with respect to the condominium. Each unit owner is required to maintain its own unit.
As of October 31, 2017, the Crystal Glen Office Centre Property was 85.7% leased to 54 tenants.
Major Tenants.
The Mathworks (23,447 SF, 9.7% of NRA, 11.5% of underwritten rent). The Mathworks is a developer of mathematical computing software for engineers and scientists that employs over 3,500 people in 17 countries. The Mathworks originally took occupancy of 8,061 SF at the Crystal Glen Office Centre Property in 2001. The Mathworks has extended its lease three times (expanding its footprint each time), has a lease expiration of August 31, 2020 and has one, five-year renewal option.
Regus Corporation (20,070 SF, 8.3% of NRA, 9.8% of underwritten rent). RGN Novi I, LLC, a subsidiary of Regus Corporation, has been a tenant at the Crystal Glen Office Centre Property since 1994. . Regus Corporation is a provider of flexible workspace solutions with more than 3,000 locations across 120 countries. Regus signed a new lease in 2015 that expires May 31, 2020, with one, five-year renewal option.
The following table presents certain information relating to the major tenants at the Crystal Glen Office Centre Property:
| Tenant Summary(1) | |||||||
| Tenant Name | Credit Rating (Fitch/Moody’s/S&P) | Tenant SF | Approximate % of SF | Annual UW Rent | % of Total Annual UW Rent | Annual UW Rent PSF(2) | Lease Expiration |
| Tenant | |||||||
| The Mathworks | NR/NR/NR | 23,447 | 9.7% | $495,860 | 11.5% | $21.15 | 8/31/2020 |
| Regus Corporation | NR/NR/NR | 20,070 | 8.3% | $421,470 | 9.8% | $21.00 | 5/31/2020 |
| Strategic Legal | NR/NR/NR | 10,964 | 4.5% | $241,208 | 5.6% | $22.00 | 7/31/2019 |
| Canon Solutions America | NR/NR/NR | 10,717 | 4.4% | $220,536 | 5.1% | $20.58 | 9/30/2018 |
| Nagase Plastics | NR/NR/NR | 9,122 | 3.8% | $194,755 | 4.5% | $21.35 | 7/31/2020 |
| Subtotal/Wtd. Avg. | 74,320 | 30.8% | $1,573,829 | 36.5% | $21.18 | ||
| Other Tenants | 128,019 | 53.0% | $2,735,769 | 63.5% | $21.37 | ||
| Vacant Space(3) | 39,208 | 16.2% | $0 | 0.0% | $0.00 | ||
| Total/Wtd. Avg. | 241,547 | 100.0% | $4,309,598 | 100.0% | $21.30 | ||
| (1) | Information is based on the underwritten rent roll as of 10/31/2017. |
| (2) | Total/Wtd. Avg. Annual UW Rent PSF excludes vacant space. |
| (3) | Vacant Space includes three tenants (2.0% of NRA) that are paying rent but currently dark. Rent from such tenants was not underwritten. |
This is not a research report and was not prepared by any Underwriter’s research departments. Please see additional important information and qualifications at the end of this Term Sheet. |
| T-131 |
| BANK 2017-BNK9 | Crystal Glen Office Centre |
The following table presents certain information relating to the lease rollover schedule at the Crystal Glen Office Centre Property:
| Lease Rollover Schedule(1) | ||||||||
| Year | # of Leases Rolling | SF Rolling | Approx. % of Total SF Rolling | Approx. Cumulative % of SF Rolling | Total UW Rent Rolling | UW Rent PSF Rolling(2) | Approx. % of Total Rent Rolling | Approx. Cumulative % of Total Rent Rolling |
| MTM(3) | 0 | 0 | 0.0% | 0.0% | $48,346 | $0.00 | 1.1% | 1.1% |
| 2017 | 1 | 1,021 | 0.4% | 0.4% | $20,931 | $20.50 | 0.5% | 1.6% |
| 2018 | 10 | 30,432 | 12.6% | 13.0% | $631,227 | $20.74 | 14.6% | 16.3% |
| 2019 | 11 | 37,331 | 15.5% | 28.5% | $811,833 | $21.75 | 18.8% | 35.1% |
| 2020 | 14 | 85,411 | 35.4% | 63.8% | $1,811,466 | $21.21 | 42.0% | 77.1% |
| 2021(4) | 8 | 22,853 | 9.5% | 73.3% | $526,805 | $23.05 | 12.2% | 89.3% |
| 2022 | 7 | 16,762 | 6.9% | 80.2% | $314,788 | $18.78 | 7.3% | 96.7% |
| 2023 | 1 | 6,409 | 2.7% | 82.9% | $144,203 | $22.50 | 3.3% | 100.0% |
| 2024 | 0 | 0 | 0.0% | 82.9% | $0 | $0.00 | 0.0% | 100.0% |
| 2025 | 0 | 0 | 0.0% | 82.9% | $0 | $0.00 | 0.0% | 100.0% |
| 2026 | 0 | 0 | 0.0% | 82.9% | $0 | $0.00 | 0.0% | 100.0% |
| 2027 | 0 | 0 | 0.0% | 82.9% | $0 | $0.00 | 0.0% | 100.0% |
| 2028 & Beyond | 2 | 2,120 | 0.9% | 83.8% | $0 | $0.00 | 0.0% | 100.0% |
| Vacant Space(5) | 0 | 39,208 | 16.2% | 100.0% | $0 | $0.00 | 0.0% | 100.0% |
| Total/Wtd. Avg. | 54 | 241,547 | 100.0% | $4,309,598 | $21.30 | 100.0% | ||
| (1) | Information is based on the underwritten rent roll as of 10/31/2017. |
| (2) | Total/Wtd. Avg. UW Rent PSF Rolling excludes vacant space. |
| (3) | MTM space is made up of an antenna and FedEx leases at the property, which have zero square footage associated with them. |
| (4) | 2021 includes $20,400 of UW Rent associated with an antenna lease, with zero square footage associated with it. |
| (5) | Vacant Space includes three tenants (2.0% of NRA) that are paying rent but currently dark. Rent from such tenants was not underwritten. |
The Market. The Crystal Glen Office Centre Property is located in the I-275 Corridor office submarket of the Greater Detroit office market. According to the appraisal, as of the third quarter of 2017, the vacancy rate in the Greater Detroit office market was approximately 10.1%, with average asking rents of $19.04 PSF. As of the second quarter of 2017, the vacancy rate in the I-275 Corridor office submarket was approximately 6.7%, with average asking rents of $19.66 PSF. According to the appraisal, both the Greater Detroit office market and the I-275 Corridor office submarket have seen steady decreases in vacancy and increases in asking rents PSF since 2012. Since 2012, the I-275 Corridor office submarket has seen a 2.5% increase in square footage from new construction, 10.2% positive net absorption, a 6.7% decrease in vacancy and a 2.7% increase in asking rent. The appraisal also concluded that directly competitive buildings had an average vacancy rate of 13.6%.
According to the appraisal, the 2016 estimated population within a one-, three- and five-mile radius of the Crystal Glen Office Centre Property was 7,537, 74,285 and 174,925, respectively. The 2016 estimated average household income within the same one-, three- and five-mile radius was $122,166, $102,981 and $111,555, respectively.
The following table presents information relating to comparable office property sales for the Crystal Glen Office Centre Property:
| Comparable Property Sales | ||||||
| Property Name/Location | Sale Date | Year Built | Total NRA (SF) | Total Occupancy | Sale Price | Sale Price PSF |
Crystal Glen Office Centre (subject) Novi, MI | Nov-2017 | 1989 | 241,157 | 85.7% | $24,925,000 | 103.36 |
Laurel Office Park II Livonia MI | Dec-2015 | 1986 | 130,122 | 88.7% | $12,600,000 | 96.83 |
Wilshire Plaza Troy, MI | Jul-2017 | 1986 | 349,643 | 89.1% | $33,500,000 | 95.81 |
Victor Corporate Center Livonia, MI | Sep-2014 | 1999 | 373,593 | 100.0% | $51,000,000 | 136.51 |
Park Center Plaza Independence, OH | Jan-2017 | 1998 | 418,180 | 92.8% | $50,100,000 | 119.80 |
| Metropolitan Plaza Highland Hills, OH | Jun-2017 | 2000 | 163,105 | 99.8% | $24,169,000 | 148.18 |
Arboretum Office Park Farmington Hills, MI | May-2017 | 1986 | 195,027 | 87.8% | $26,500,000 | 135.88 |
Source:Appraisal.
This is not a research report and was not prepared by any Underwriter’s research departments. Please see additional important information and qualifications at the end of this Term Sheet. |
| T-132 |
| BANK 2017-BNK9 | Crystal Glen Office Centre |
The following table reflects comparable office leases with respect to the Crystal Glen Office Centre Property:
| Comparable Office Lease Summary | |||||||||
| Property/Location | Year Built | SF | Distance (miles) | Tenant Name | Lease Date | Lease Term (Yrs.) | Rent PSF | Lease Type | |
| Size (SF) | |||||||||
Town Center Southfield, MI | 1979 | 409,431 | 10.1 | Sullivan Cotter and Associates | 9,694 | 7/2017 | 5.8 | $22.43 | MG |
Southfield T-12 Building Southfield, MI | 1973 | 152,858 | 8.7 | ENT Consultants | 5,510 | 11/2016 | 3.0 | $20.17 | MG |
Laurel Park Office Center Livonia, MI | 1987 | 125,000 | 2.2 | IMS/Chinatool, LLS | 1,580 | 8/2016 | 3.0 | $20.00 | MG |
Lake Pointe Office Center Novi, MI | 1987 | 92,934 | 3.2 | Caliber Home Loans, Inc | 3,542 | 6/2016 | 5.0 | $21.00 | MG |
Northville Mixed Use Northville, MI | 2002 | 8,466 | 2.3 | Freedom Fitness LLC | 1,990 | 6/2016 | 10.0 | $24.62 | Gross |
Source:Appraisal.
Operating History and Underwritten Net Cash Flow. The following table presents certain information relating to the operating history and Underwritten Net Cash Flow at the Crystal Glen Office Centre Property:
| Cash Flow Analysis(1) | ||||||
| 2014 | 2015 | 2016 | 8/31/2017 TTM | UW | UW PSF | |
| Gross Potential Rent | $3,516,767 | $3,468,493 | $4,032,530 | $4,206,376 | $5,134,650 | $21.26 |
| Total Recoveries | $318,433 | $300,843 | $328,454 | $347,590 | $337,310 | $1.40 |
| Other Income | $18,989 | $24,700 | $25,352 | $9,154 | $9,154 | $0.04 |
| Less Vacancy & Credit Loss | $0 | $0 | $0 | $0 | ($831,798) | ($3.44) |
| Effective Gross Income | $3,854,189 | $3,794,037 | $4,386,336 | $4,563,120 | $4,649,316 | $19.25 |
| Total Expenses | $1,920,334 | $1,891,600 | $1,957,689 | $1,921,986 | $2,108,161 | $8.73 |
| Net Operating Income | $1,933,854 | $1,902,437 | $2,428,647 | $2,641,134 | $2,541,154 | $10.52 |
| Capital Expenditures | $0 | $0 | $0 | $0 | $48,309 | $0.20 |
| TI/LC | $0 | $0 | $0 | $0 | $236,596 | $0.98 |
| Net Cash Flow | $1,933,854 | $1,902,437 | $2,428,647 | $2,641,134 | $2,256,249 | $9.34 |
| Occupancy % | 84.0% | 86.9% | 86.2% | 85.7%(2) | 83.9% | |
| NOI DSCR | 1.79x | 1.76x | 2.25x | 2.44x | 2.35x | |
| NCF DSCR | 1.79x | 1.76x | 2.25x | 2.44x | 2.09x | |
| NOI Debt Yield | 10.3% | 10.2% | 13.0% | 14.1% | 13.6% | |
| NCF Debt Yield | 10.3% | 10.2% | 13.0% | 14.1% | 12.1% | |
| (1) | UW Base Rent is based on the underwritten rent roll dated October 31, 2017 and includes rent steps through November 1, 2018 totaling $73,132. |
| (2) | 8/31/2017 TTM Occupancy % is as of October 31, 2017 and includes three tenants (2.0% of NRA) that are paying rent but currently dark. Rent from such tenants was not underwritten. |
This is not a research report and was not prepared by any Underwriter’s research departments. Please see additional important information and qualifications at the end of this Term Sheet. |
| T-133 |
| BANK 2017-BNK9 |
This material was prepared by sales, trading, banking or other non-research personnel of one of the following (or an affiliate thereof): Merrill Lynch, Pierce, Fenner & Smith Incorporated (together with its affiliates, “BofA Merrill Lynch”), Morgan Stanley & Co. LLC, Morgan Stanley & Co. International Limited, Morgan Stanley Japan Limited and/or Morgan Stanley Dean Witter Asia Limited (together with their affiliates, hereinafter “Morgan Stanley”), Wells Fargo Securities, LLC (together with its affiliates, “Wells Fargo”) or Drexel Hamilton, LLC (together with its affiliates, “Drexel”, and collectively with BofA Merrill Lynch, Morgan Stanley and Wells Fargo, the “Underwriters”). This material was not produced by an Underwriter’s research analyst, although it may refer to an Underwriter’s research analyst or research report. Unless otherwise indicated, these views (if any) are the author’s and may differ from those of the fixed income or equity research departments of the Underwriters or others in those firms.
This material may have been prepared by or in conjunction with the respective trading desks of the Underwriters that may deal as principal in or own or act as market maker or liquidity provider for the securities/instruments (or related derivatives) mentioned herein. The trading desk may have accumulated a position in the subject securities/instruments based on the information contained herein. Trading desk materials are not independent of the proprietary interests of the Underwriters, which may conflict with your interests. Each of the Underwriters may also perform or seek to perform investment banking services for the issuers of the securities and instruments mentioned herein.
The information contained in this material is subject to change, completion or amendment from time to time, and the information in this material supersedes information in any other communication relating to the securities referred to in this material. This material is not a solicitation to participate in any trading strategy, and is not an offer to sell any security or instrument or a solicitation of an offer to buy or sell any security or instrument in any jurisdiction where an offer, solicitation or sale is not permitted. Unless otherwise set forth in this material, any securities referred to in this material may not have been registered under the U.S. Securities Act of 1933, as amended, and, if not, may not be offered or sold absent an exemption therefrom. Recipients are required to comply with any legal or contractual restrictions on their purchase, holding, sale, exercise of rights or performance of obligations under any securities/instruments transaction.
The securities/instruments discussed in this material may not be suitable for all investors. This material has been prepared and issued by the Underwriters for intended distribution to market professionals and institutional investor clients. Other recipients should seek independent investment advice prior to making any investment decision based on this material. This material does not provide individually tailored investment advice or offer tax, regulatory, accounting or legal advice. Prior to entering into any proposed transaction, recipients should determine, in consultation with their own investment, legal, tax, regulatory and accounting advisors, the economic risks and merits, as well as the legal, tax, regulatory and accounting characteristics and consequences, of the transaction. You should consider this material as only a single factor in making an investment decision. The value of and income from investments may vary because of changes in interest rates, foreign exchange rates, default rates, prepayment rates, securities/instruments prices, market indexes, operational or financial conditions of companies or other factors. There may be time limitations on the exercise of options or other rights in securities/instruments transactions. Past performance is not necessarily a guide to future performance. Estimates of future performance are based on assumptions that may not be realized. Actual events may differ from those assumed and changes to any assumptions may have a material impact on any projections or estimates. Other events not taken into account may occur and may significantly affect the projections or estimates. Certain assumptions may have been made for modeling purposes only to simplify the presentation and/or calculation of any projections or estimates, and the Underwriters do not represent that any such assumptions will reflect actual future events. Accordingly, there can be no assurance that estimated returns or projections will be realized or that actual returns or performance results will not materially differ from those estimated herein. Some of the information contained in this document may be aggregated data of transactions in securities or other financial instruments executed by an Underwriter that has been compiled so as not to identify the underlying transactions of any particular customer.
Notwithstanding anything herein to the contrary, the Underwriters and each recipient hereof (and their employees, representatives, and other agents) may disclose to any and all persons, without limitation of any kind from the commencement of discussions, the U.S. federal and state income tax treatment and tax structure of the transaction and all materials of any kind (including opinions or other tax analyses) that are provided to it relating to the tax treatment and tax structure (as such terms are defined in Treasury Regulation 1.6011-4). For this purpose, “tax structure” is limited to facts relevant to the U.S. federal and state income tax treatment of the transaction and does not include information relating to the identity of the parties, their affiliates, agents or advisors. This authorization of tax disclosure is retroactively effective to the commencement of discussions with prospective investors regarding the transactions contemplated herein.
THE DISTRIBUTION OF THIS MATERIAL (A) IF MADE BY A PERSON WHO IS NOT AN AUTHORIZED PERSON UNDER THE FINANCIAL SERVICES AND MARKETS ACT 2000 (“FSMA”), IS BEING MADE ONLY TO, OR DIRECTED ONLY AT, PERSONS WHO (I) ARE OUTSIDE THE UNITED KINGDOM, OR (II) HAVE PROFESSIONAL EXPERIENCE IN MATTERS RELATING TO INVESTMENTS AND QUALIFY AS INVESTMENT PROFESSIONALS IN ACCORDANCE WITH ARTICLE 19(5) OF THE FINANCIAL SERVICES AND MARKETS ACT 2000 (FINANCIAL PROMOTION) ORDER 2005 (THE “FINANCIAL PROMOTION ORDER”), OR (III) ARE PERSONS FALLING WITHIN ARTICLE 49(2)(A) THROUGH (D) (HIGH NET WORTH COMPANIES, UNINCORPORATED ASSOCIATIONS, ETC.) OF THE FINANCIAL PROMOTION ORDER; AND (B) IF MADE BY A PERSON WHO IS AN AUTHORIZED PERSON UNDER THE FSMA, IS BEING MADE ONLY TO, OR DIRECTED ONLY AT, PERSONS WHO (I) ARE OUTSIDE THE UNITED KINGDOM, OR (II) HAVE PROFESSIONAL EXPERIENCE IN MATTERS RELATING TO INVESTMENTS AND QUALIFY AS INVESTMENT PROFESSIONALS IN ACCORDANCE WITH ARTICLE 14(5) OF THE FINANCIAL SERVICES AND MARKETS ACT 2000 (PROMOTION OF COLLECTIVE INVESTMENT SCHEMES) (EXEMPTIONS) ORDER 2001 (THE “PROMOTION OF COLLECTIVE INVESTMENT SCHEMES EXEMPTIONS ORDER”), OR (III) ARE PERSONS FALLING WITHIN ARTICLE 22(2)(A) THROUGH (D) (“HIGH NET WORTH COMPANIES, UNINCORPORATED ASSOCIATIONS, ETC.”) OF THE PROMOTION OF COLLECTIVE INVESTMENT SCHEMES EXEMPTIONS ORDER, OR (IV) ARE PERSONS TO WHOM THE ISSUING ENTITY MAY LAWFULLY BE PROMOTED IN ACCORDANCE WITH CHAPTER 4.12 OF THE UK FINANCIAL CONDUCT AUTHORITY’S CONDUCT OF BUSINESS SOURCEBOOK.
THE OFFERED CERTIFICATES HAVE NOT BEEN AND WILL NOT BE REGISTERED UNDER THE FINANCIAL INSTRUMENTS EXCHANGE ACT OF JAPAN (LAW NO. 25 OF 1948, AS AMENDED (THE “FIEL”)), AND EACH OF MERRILL LYNCH, PIERCE, FENNER & SMITH INCORPORATED, MORGAN STANLEY & CO. LLC, WELLS FARGO SECURITIES, LLC AND DREXEL HAMILTON, LLC HAS AGREED THAT IT WILL NOT OFFER OR SELL ANY OFFERED CERTIFICATES, DIRECTLY OR INDIRECTLY, IN JAPAN OR TO, OR FOR THE BENEFIT OF, ANY JAPANESE PERSON, OR TO OTHERS FOR REOFFERING OR RESALE, DIRECTLY OR INDIRECTLY, IN JAPAN OR TO ANY JAPANESE PERSON, EXCEPT PURSUANT TO AN EXEMPTION FROM THE REGISTRATION REQUIREMENTS OF, AND OTHERWISE IN COMPLIANCE WITH, THE FIEL AND ANY OTHER APPLICABLE LAWS AND REGULATIONS. FOR THE PURPOSES OF THIS PARAGRAPH, “JAPANESE PERSON” SHALL MEAN ANY PERSON RESIDENT IN JAPAN, INCLUDING ANY CORPORATION OR OTHER ENTITY ORGANIZED UNDER THE LAWS AND REGULATIONS OF JAPAN.