0000004904aep:AppalachianPowerCompanyMemberaep:RegulatoryLiabilityPaysAReturnMemberaep:RegulatoryLiabilityPendingFinalDeterminationIncludingNettingMember2023-12-310000004904us-gaap:FairValueInputsLevel1Memberus-gaap:PensionPlansDefinedBenefitMemberus-gaap:ForeignGovernmentDebtSecuritiesMember2023-12-310000004904aep:IndianaMichiganPowerCompanyMemberaep:SpentNuclearFuelandDecommissioningTrustsMemberaep:DomesticMember2023-01-012023-12-310000004904aep:AEPTexasInc.Memberus-gaap:VariableInterestEntityPrimaryBeneficiaryMemberaep:RestorationFundingMember2023-12-31
UNITED STATES
SECURITIES AND EXCHANGE COMMISSION
WASHINGTON, D.C. 20549
FORM 10-K
(Mark One)
☒ ANNUAL REPORT PURSUANT TO SECTION 13 OR 15(d) OF THE SECURITIES EXCHANGE ACT OF 1934
For the fiscal year ended December 31, 2024
or
☐ TRANSITION REPORT PURSUANT TO SECTION 13 OR 15(d) OF THE SECURITIES EXCHANGE ACT OF 1934
For the transition period from __________ to_________
| | | | | | | | | | | | | | | | | | | | | | | | | | | | | | | | |
| Commission | | Registrants; | | | | I.R.S. Employer |
| File Number | | Address and Telephone Number | | States of Incorporation | | Identification Nos. |
| | | | | | | | | | | |
| 1-3525 | | AMERICAN ELECTRIC POWER CO INC. | | New York | | 13-4922640 |
| 333-221643 | | AEP TEXAS INC. | | Delaware | | 51-0007707 |
| 333-217143 | | AEP TRANSMISSION COMPANY, LLC | | Delaware | | 46-1125168 |
| 1-3457 | | APPALACHIAN POWER COMPANY | | Virginia | | 54-0124790 |
| 1-3570 | | INDIANA MICHIGAN POWER COMPANY | | Indiana | | 35-0410455 |
| 1-6543 | | OHIO POWER COMPANY | | Ohio | | 31-4271000 |
| 0-343 | | PUBLIC SERVICE COMPANY OF OKLAHOMA | | Oklahoma | | 73-0410895 |
| 1-3146 | | SOUTHWESTERN ELECTRIC POWER COMPANY | | Delaware | | 72-0323455 |
| | | 1 Riverside Plaza, | Columbus, | Ohio | 43215-2373 | | | | |
| | | Telephone | (614) | 716-1000 | | | | | | |
Securities registered pursuant to Section 12(b) of the Act:
| | | | | | | | | | | | | | | | | | | | |
| Registrant | | Title of each class | | Trading Symbol | | Name of Each Exchange on Which Registered |
| American Electric Power Company Inc. | | Common Stock, $6.50 par value | | AEP | | The NASDAQ Stock Market LLC |
| | | | | | |
Securities registered pursuant to Section 12(g) of the Act: None
| | | | | | | | | | | | | | |
| Indicate by check mark if the AEP Texas Inc., AEP Transmission Company, LLC and Public Service Company of Oklahoma, are well-known seasoned issuers, as defined in Rule 405 of the Securities Act. | Yes | x | No | ¨ |
| | | | |
| Indicate by check mark if American Electric Power Company, Inc., Appalachian Power Company, Indiana Michigan Power Company, Ohio Power Company and Southwestern Electric Power Company are well-known seasoned issuers, as defined in Rule 405 of the Securities Act. | Yes | ¨ | No | x |
| | | | |
| Indicate by check mark if the registrants are not required to file reports pursuant to Section 13 or Section 15(d) of the Exchange Act. | Yes | ¨ | No | x |
| | | | |
| Indicate by check mark whether the registrants (1) have filed all reports required to be filed by Section 13 or 15(d) of the Securities Exchange Act of 1934 during the preceding 12 months (or for such shorter period that the registrants were required to file such reports), and (2) have been subject to such filing requirements for the past 90 days. | Yes | x | No | ¨ |
| | | | |
| Indicate by check mark whether the registrants have submitted electronically every Interactive Data File required to be submitted pursuant to Rule 405 of Regulation S-T (232.405 of this chapter) during the preceding 12 months (or for such shorter period that the registrant was required to submit such files). | Yes | x | No | ¨ |
| | | | | | | | | | | | | | | | | | | | | | | |
| Indicate by check mark whether American Electric Power Company, Inc. is a large accelerated filer, an accelerated filer, a non-accelerated filer, a smaller reporting company, or an emerging growth company. See the definitions of “large accelerated filer,” “accelerated filer,” “smaller reporting company,” and “emerging growth company” in Rule 12b-2 of the Exchange Act. |
| | |
| Large Accelerated filer | x | Accelerated filer | ☐ | Non-accelerated filer | ☐ | | |
| | | | | | | | |
| Smaller reporting company | ☐ | Emerging growth company | ☐ | | | | |
| | | | | | | | | | | | | | | | | | | | | | | |
| Indicate by check mark whether AEP Texas Inc., AEP Transmission Company, LLC, Appalachian Power Company, Indiana Michigan Power Company, Ohio Power Company, Public Service Company of Oklahoma and Southwestern Electric Power Company are large accelerated filers, accelerated filers, non-accelerated filers, smaller reporting companies, or emerging growth companies. See the definitions of “large accelerated filer,” “accelerated filer,” “smaller reporting company,” and “emerging growth company” in Rule 12b-2 of the Exchange Act. |
| | | |
| Large Accelerated filer | ☐ | Accelerated filer | ☐ | Non-accelerated filer | x | | |
| | | | | | | | |
| Smaller reporting company | ☐ | Emerging growth company | ☐ | | | | |
| | | | | | | | | | | | | | | | | |
| If an emerging growth company, indicate by check mark if the registrants have elected not to use the extended transition period for complying with any new or revised financial accounting standards provided pursuant to Section 13(a) of the Exchange Act. |
| | ☐ | | | |
| | | | | | | | | | | | | | | | | |
| Indicate by check mark whether the registrant has filed a report on and attestation to its management’s assessment of the effectiveness of its internal control over financial reporting under Section 404(b) of the Sarbanes-Oxley Act (15 U.S.C. 7262(b)) by the registered public accounting firm that prepared or issued its audit report. |
| | x | | | |
| If securities are registered pursuant to Section 12(b) of the Act, indicate by check mark whether the financial statements of the registrant included in the filing reflect the correction of an error to previously issued financial statements. |
|
| | ¨ | | | |
| Indicate by check mark whether any of those error corrections are restatements that required a recovery analysis of incentive-based compensation received by any of the registrant’s executive officers during the relevant recovery period pursuant to §240.10D-1(b). |
| | ¨ | | | |
| | | | | | | | | | | | | | | | | | | | |
| Indicate by check mark whether the registrants are shell companies (as defined in Rule 12b-2 of the Exchange Act). | | Yes | ☐ | | No | x |
AEP Texas Inc., AEP Transmission Company, LLC, Appalachian Power Company, Indiana Michigan Power Company, Ohio Power Company, Public Service Company of Oklahoma and Southwestern Electric Power Company meet the conditions set forth in General Instruction I(1)(a) and (b) of Form 10-K and are therefore filing this Form 10-K with the reduced disclosure format specified in General Instruction I(2) to such Form 10-K.
| | | | | | | | | | | | | | |
| | | Aggregate Market Value of Voting and Non-Voting Common Equity Held by Nonaffiliates of the Registrants as of June 30, 2024 the Last Trading Date of the Registrants' Most Recently Completed Second Fiscal Quarter | | Number of Shares of Common Stock Outstanding of the Registrants as of December 31, 2024 |
| American Electric Power Company, Inc. | | 46,757,322,914 | | 532,907,715 | |
| | | | | ($6.50 par value) |
| AEP Texas Inc. | | None | | 100 | |
| | | | ($0.01 par value) |
| AEP Transmission Company, LLC (a) | | None | | NA |
| | | | |
| Appalachian Power Company | | None | | 13,499,500 | |
| | | | | (no par value) |
| Indiana Michigan Power Company | | None | | 1,400,000 | |
| | | | | (no par value) |
| Ohio Power Company | | None | | 27,952,473 | |
| | | | | (no par value) |
| Public Service Company of Oklahoma | | None | | 9,013,000 | |
| | | | | ($15 par value) |
| Southwestern Electric Power Company | | None | | 3,680 | |
| | | | | ($18 par value) |
(a)100% interest is held by AEP Transmission Holdco.
NA Not applicable.
Note on Market Value of Common Equity Held by Nonaffiliates
American Electric Power Company, Inc. owns all of the common stock of AEP Texas Inc., Appalachian Power Company, Indiana Michigan Power Company, Ohio Power Company, Public Service Company of Oklahoma and Southwestern Electric Power Company and, indirectly, all of the LLC membership interest in AEP Transmission Company, LLC (see Item 12 herein).
Documents Incorporated By Reference
| | | | | | | | |
| Description | | Part of Form 10-K into which Document is Incorporated |
| | | |
| Portions of Proxy Statement of American Electric Power Company, Inc. for 2025 Annual Meeting of Shareholders. | | Part III |
This combined Form 10-K is separately filed by American Electric Power Company, Inc., AEP Texas Inc., AEP Transmission Company, LLC, Appalachian Power Company, Indiana Michigan Power Company, Ohio Power Company, Public Service Company of Oklahoma and Southwestern Electric Power Company. Information contained herein relating to any individual registrant is filed by such registrant on its own behalf. Except for American Electric Power Company, Inc., each registrant makes no representation as to information relating to the other registrants.
You can access financial and other information at AEP’s website, including AEP’s Principles of Business Conduct, certain committee charters and Principles of Corporate Governance. The address is www.AEP.com. Investors can obtain copies of our SEC filings from this site free of charge, as well as from the SEC website at www.sec.gov.
TABLE OF CONTENTS
| | | | | | | | |
Item
Number | | Page
Number |
| | Glossary of Terms | |
| | Forward-Looking Information | |
| | |
| PART I |
| 1 | Business | |
| | General | |
| | Business Segments | |
| | Vertically Integrated Utilities | |
| | Transmission and Distribution Utilities | |
| | AEP Transmission Holdco | |
| | Generation & Marketing | |
| | Executive Officers of AEP | |
| 1A | Risk Factors | |
| 1B | Unresolved Staff Comments | |
| 1C | Cybersecurity | |
| 2 | Properties | |
| | Generation Facilities | |
| | | |
| | Title to Property | |
| | | |
| | Construction Program | |
| | Potential Uninsured Losses | |
| 3 | Legal Proceedings | |
| 4 | Mine Safety Disclosure | |
| | |
| PART II |
| 5 | Market for Registrants’ Common Equity, Related Stockholder Matters and Issuer Purchases of Equity Securities | |
| 6 | Reserved | |
| 7 | Management’s Discussion and Analysis of Financial Condition and Results of Operations | |
| 7A | Quantitative and Qualitative Disclosures about Market Risk | |
| 8 | Financial Statements and Supplementary Data | |
| 9 | Changes in and Disagreements with Accountants on Accounting and Financial Disclosure | |
| 9A | Controls and Procedures | |
| 9B | Other Information | |
| 9C | Disclosure Regarding Foreign Jurisdictions that Prevent Inspections | |
| | |
| PART III | |
| 10 | Directors, Executive Officers and Corporate Governance | |
| 11 | Executive Compensation | |
| 12 | Security Ownership of Certain Beneficial Owners and Management and Related Stockholder Matters | |
| 13 | | |
| 14 | Principal Accounting Fees and Services | |
| | |
| PART IV |
| 15 | Exhibits and Financial Statement Schedules | |
| | Financial Statements | |
| 16 | Form 10-K Summary | |
| | Signatures | |
| | Index of Financial Statement Schedules | |
| | Exhibit Index | |
GLOSSARY OF TERMS
When the following terms and abbreviations appear in the text of this report, they have the meanings indicated below.
| | | | | | | | |
| Term | | Meaning |
| | | |
| AEGCo | | AEP Generating Company, an AEP electric utility subsidiary. |
| AEP | | American Electric Power Company, Inc., an investor-owned electric public utility holding company which includes American Electric Power Company, Inc. (Parent) and majority-owned consolidated subsidiaries and consolidated affiliates. |
| AEP Credit | | AEP Credit, Inc., a consolidated VIE of AEP which securitizes accounts receivable and accrued utility revenues for affiliated electric utility companies. |
| AEP Development Services, LLC | | AEP Development Services, LLC, a consolidated VIE of AEP formed for the purpose of developing, constructing, and installing energy projects for the regulated operating companies of AEP. |
| AEP East Companies | | APCo, I&M, KGPCo, KPCo, OPCo and WPCo. |
| AEP Energy | | AEP Energy, Inc., a wholly-owned retail electric supplier for customers in Ohio, Illinois and other deregulated electricity markets throughout the United States. |
| AEP Energy Supply, LLC | | A nonregulated holding company for AEP’s competitive generation, wholesale and retail businesses, and a wholly-owned subsidiary of AEP. |
| AEP OnSite Partners | | A division of AEP Energy Supply, LLC that builds, owns, operates and maintains customer solutions utilizing existing and emerging distributed technologies. |
| AEP Renewables | | A division of AEP Energy Supply, LLC that develops and/or acquires large scale renewable projects that are backed with long-term contracts with creditworthy counter parties. |
| AEP System | | American Electric Power System, an electric system, owned and operated by AEP subsidiaries. |
| AEP Texas | | AEP Texas Inc., an AEP electric utility subsidiary. AEP Texas engages in the transmission and distribution of electric power to retail customers in west, central and southern Texas. |
| AEP Transmission Holdco | | AEP Transmission Holding Company, LLC, a wholly-owned subsidiary of AEP. |
| AEP Wind Holdings, LLC | | Acquired in April 2019 as Sempra Renewables LLC, develops, owns and operates, or holds interests in, wind generation facilities in the United States. |
| AEPEP | | AEP Energy Partners, Inc., a subsidiary of AEP dedicated to wholesale marketing and trading, hedging activities, asset management and commercial and industrial sales in deregulated markets. |
| | |
| AEPSC | | American Electric Power Service Corporation, an AEP service subsidiary providing management and professional services to AEP and its subsidiaries. |
| AEPTCo | | AEP Transmission Company, LLC, a wholly-owned subsidiary of AEP Transmission Holdco, is an intermediate holding company that owns the State Transcos. |
| AEPTCo Parent | | AEP Transmission Company, LLC, the holding company of the State Transcos within the AEPTCo consolidation. |
| AEPTHCo | | AEP Transmission Holding Company, LLC, a subsidiary of AEP, an intermediate holding company that owns transmission operations joint ventures and AEPTCo. |
| AFUDC | | Allowance for Equity Funds Used During Construction. |
| AGR | | AEP Generation Resources Inc., a competitive AEP subsidiary in the Generation & Marketing segment. |
| ALJ | | Administrative Law Judge. |
| | |
| | |
| AOCI | | Accumulated Other Comprehensive Income. |
| APCo | | Appalachian Power Company, an AEP electric utility subsidiary. APCo engages in the generation, transmission and distribution of electric power to retail customers in the southwestern portion of Virginia and southern West Virginia. |
| Appalachian Consumer Rate Relief Funding | | Appalachian Consumer Rate Relief Funding LLC, a wholly-owned subsidiary of APCo and a consolidated VIE formed for the purpose of issuing and servicing securitization bonds related to the under-recovered ENEC deferral balance. |
| APTCo | | AEP Appalachian Transmission Company, Inc., a wholly-owned AEPTCo transmission subsidiary. |
| APSC | | Arkansas Public Service Commission. |
| | |
| | | | | | | | |
| Term | | Meaning |
| | | |
| ARO | | Asset Retirement Obligations. |
| ASU | | Accounting Standards Update. |
| ATM | | At-the-Market. |
| BHE | | Berkshire Hathaway Energy. |
| CAA | | Clean Air Act. |
| CAMT | | Corporate Alternative Minimum Tax. |
| | |
| | |
| CCR | | Coal Combustion Residual. |
| CEO | | Chief Executive Officer. |
| CLECO | | Central Louisiana Electric Company, a nonaffiliated utility company. |
CO2 | | Carbon dioxide and other greenhouse gases. |
| | |
| | |
| CODM | | Chief Operating Decision Maker. |
| Cook Plant | | Donald C. Cook Nuclear Plant, a two-unit, 2,296 MW nuclear plant owned by I&M. |
| | |
| CRES Provider | | Competitive Retail Electric Service providers under Ohio law that target retail customers by offering alternative generation service. |
| CSAPR | | Cross-State Air Pollution Rule. |
| CSPCo | | Columbus Southern Power Company, a former AEP electric utility subsidiary that was merged into OPCo effective December 31, 2011. |
| | |
| CWIP | | Construction Work in Progress. |
| DCC Fuel | | DCC Fuel XIV, DCC Fuel XV, DCC Fuel XVI, DCC Fuel XVII, DCC Fuel XVIII, DCC Fuel XIX and DCC Fuel XX consolidated VIEs formed for the purpose of acquiring, owning and leasing nuclear fuel to I&M. |
| | |
| DHLC | | Dolet Hills Lignite Company, LLC, a wholly-owned lignite mining subsidiary of SWEPCo. |
| DIR | | Distribution Investment Rider. |
| Diversion | | Diversion, acquired in December 2024, consists of 201 MWs of wind generation in Texas. |
| DOE | | U. S. Department of Energy. |
| EIS | | Energy Insurance Services, Inc., a nonaffiliated captive insurance company and consolidated VIE of AEP. |
| ELG | | Effluent Limitation Guidelines. |
| ENEC | | Expanded Net Energy Cost. |
| Equity Units | | AEP’s Equity Units issued in August 2020 and March 2019. |
| ERCOT | | Electric Reliability Council of Texas regional transmission organization. |
| ESP | | Electric Security Plans, a PUCO requirement for electric utilities to adjust their rates by filing with the PUCO. |
| ETT | | Electric Transmission Texas, LLC, an equity interest joint venture between AEP Transmission Holdco and Berkshire Hathaway Energy Company formed to own and operate electric transmission facilities in ERCOT. |
| Excess ADIT | | Excess accumulated deferred income taxes. |
| FAC | | Fuel Adjustment Clause. |
| FASB | | Financial Accounting Standards Board. |
| Federal EPA | | United States Environmental Protection Agency. |
| FERC | | Federal Energy Regulatory Commission. |
| FGD | | Flue Gas Desulfurization or scrubbers. |
| FIP | | Federal Implementation Plan. |
| FTR | | Financial Transmission Right, a financial instrument that entitles the holder to receive compensation for certain congestion-related transmission charges that arise when the power grid is congested resulting in differences in locational prices. |
| GAAP | | Generally Accepted Accounting Principles in the United States of America. |
| GHG | | Greenhouse gas. |
| G&M | | Generation & Marketing. |
| | | | | | | | |
| Term | | Meaning |
| | | |
| I&M | | Indiana Michigan Power Company, an AEP electric utility subsidiary. I&M engages in the generation, transmission and distribution of electric power to retail customers in northern and eastern Indiana and southwestern Michigan. |
| IMTCo | | AEP Indiana Michigan Transmission Company, Inc., a wholly-owned AEPTCo transmission subsidiary. |
| IRA | | On August 16, 2022 President Biden signed into law legislation commonly referred to as the “Inflation Reduction Act” (IRA). |
| IRC | | Internal Revenue Code. |
| IRP | | Integrated Resource Plan. |
| IRS | | Internal Revenue Service. |
| ITC | | Investment Tax Credit. |
| IURC | | Indiana Utility Regulatory Commission. |
| KGPCo | | Kingsport Power Company, an AEP electric utility subsidiary. KGPCo provides electric service to retail customers in Kingsport, Tennessee and eight neighboring communities in northeastern Tennessee. |
| KPCo | | Kentucky Power Company, an AEP electric utility subsidiary. KPCo engages in the generation, transmission and distribution of electric power to retail customers in eastern Kentucky. |
| KPSC | | Kentucky Public Service Commission. |
| KTCo | | AEP Kentucky Transmission Company, Inc., a wholly-owned AEPTCo transmission subsidiary. |
| kV | | Kilovolt. |
| KWh | | Kilowatt-hour. |
| Liberty | | Liberty Utilities Co., a subsidiary of Algonquin Power & Utilities Corporation. |
| LPSC | | Louisiana Public Service Commission. |
| MATS | | Mercury and Air Toxic Standards. |
| Maverick | | Maverick, part of the North Central Wind Energy Facilities, consists of 287 MWs of wind generation in Oklahoma. |
| MISO | | Midcontinent Independent System Operator. |
| Mitchell Plant | | A two unit, 1,560 MW coal-fired power plant located in Moundsville, West Virginia. The plant is jointly owned by KPCo and WPCo. |
| MMBtu | | Million British Thermal Units. |
| MPSC | | Michigan Public Service Commission. |
| MTM | | Mark-to-Market. |
| MW | | Megawatt. |
| MWh | | Megawatt-hour. |
| NAAQS | | National Ambient Air Quality Standards. |
| NCWF | | North Central Wind Energy Facilities, a joint PSO and SWEPCo project, which includes three Oklahoma wind facilities totaling approximately 1,484 MWs of wind generation. |
| NERC | | North American Electric Reliability Corporation. |
| Net Zero | | Represents net-zero Scope 1 and Scope 2 GHG emissions by 2045. |
| NMRD | | New Mexico Renewable Development, LLC. |
| Nonutility Money Pool | | Centralized funding mechanism AEP uses to meet the short-term cash requirements of certain nonutility subsidiaries. |
| | |
| NOL | | Net operating losses. |
| NOLC | | Net operating loss carryforward. |
NOx | | Nitrogen Oxide. |
| | |
| NRC | | Nuclear Regulatory Commission. |
| | |
| OATT | | Open Access Transmission Tariff. |
| OCC | | Corporation Commission of the State of Oklahoma. |
| | |
| | |
| OHTCo | | AEP Ohio Transmission Company, Inc., a wholly-owned AEPTCo transmission subsidiary. |
| | |
| | | | | | | | |
| Term | | Meaning |
| | | |
| OKTCo | | AEP Oklahoma Transmission Company, Inc., a wholly-owned AEPTCo transmission subsidiary. |
| OPCo | | Ohio Power Company, an AEP electric utility subsidiary. OPCo engages in the transmission and distribution of electric power to retail customers in Ohio. |
| OPEB | | Other Postretirement Benefits. |
| Operating Agreement | | Agreement, dated January 1, 1997, as amended, by and among PSO and SWEPCo governing generating capacity allocation, energy pricing, and revenues and costs of third-party sales. AEPSC acts as the agent. |
| OTC | | Over-the-counter. |
| OVEC | | Ohio Valley Electric Corporation, which is 43.47% owned by AEP. |
| Parent | | American Electric Power Company, Inc., the equity owner of AEP subsidiaries within the AEP consolidation. |
| | |
| PCA | | Power Coordination Agreement among APCo, I&M, KPCo and WPCo. |
| PFD | | Proposal for Decision. |
| PJM | | Pennsylvania – New Jersey – Maryland regional transmission organization. |
| PLR | | Private Letter Ruling. |
| PM | | Particulate Matter. |
| PPA | | Power Purchase Agreement. |
| | |
| PSA | | Purchase and Sale Agreement. |
| PSO | | Public Service Company of Oklahoma, an AEP electric utility subsidiary. PSO engages in the generation, transmission and distribution of electric power to retail customers in eastern and southwestern Oklahoma. |
| PTC | | Production Tax Credit. |
| PUCO | | Public Utilities Commission of Ohio. |
| PUCT | | Public Utility Commission of Texas. |
| | |
| | |
| Registrant Subsidiaries | | AEP subsidiaries which are SEC registrants: AEP Texas, AEPTCo, APCo, I&M, OPCo, PSO and SWEPCo. |
| Registrants | | SEC registrants: AEP, AEP Texas, AEPTCo, APCo, I&M, OPCo, PSO and SWEPCo. |
| REP | | Texas Retail Electric Provider. |
| Restoration Funding | | AEP Texas Restoration Funding LLC, a wholly-owned subsidiary of AEP Texas and a consolidated VIE formed for the purpose of issuing and servicing securitization bonds related to storm restoration in Texas primarily caused by Hurricane Harvey. |
| Risk Management Contracts | | Trading and non-trading derivatives, including those derivatives designated as cash flow and fair value hedges. |
| Rockport Plant | | A generation plant, jointly-owned by AEGCo and I&M, consisting of two 1,310 MW coal-fired generating units near Rockport, Indiana. |
| ROE | | Return on Equity. |
| RPM | | Reliability Pricing Model. |
| RTO | | Regional Transmission Organization, responsible for moving electricity over large interstate areas. |
| Sabine | | Sabine Mining Company, a lignite mining company that is a consolidated VIE for AEP and SWEPCo. |
| | |
| SEC | | U.S. Securities and Exchange Commission. |
| Sempra Renewables LLC | | Sempra Renewables LLC, acquired in April 2019 (subsequently renamed as AEP Wind Holdings LLC), consists of 724 MWs of wind generation and battery assets in the United States. |
| | |
| SIP | | State Implementation Plan. |
| SNF | | Spent Nuclear Fuel. |
SO2 | | Sulfur dioxide. |
| SPP | | Southwest Power Pool regional transmission organization. |
| SSO | | Standard service offer. |
| | | | | | | | |
| Term | | Meaning |
| | | |
| State Transcos | | AEPTCo’s seven wholly-owned, FERC regulated, transmission only electric utilities, which are geographically aligned with AEP's existing utility operating companies. |
| Storm Recovery Funding | | SWEPCo Storm Recovery Funding LLC, a wholly-owned subsidiary of SWEPCo and consolidated VIE formed for the purpose of issuing and servicing securitization bonds related to storm restoration in Louisiana. |
| Sundance | | Sundance, acquired in April 2021 as part of the North Central Wind Energy Facilities, consists of 199 MWs of wind generation in Oklahoma. |
| SWEPCo | | Southwestern Electric Power Company, an AEP electric utility subsidiary. SWEPCo engages in the generation, transmission and distribution of electric power to retail customers in northeastern and panhandle of Texas, northwestern Louisiana and western Arkansas. |
| SWTCo | | AEP Southwestern Transmission Company, Inc., a wholly-owned AEPTCo transmission subsidiary. |
| TA | | Transmission Agreement, effective November 2010, among APCo, I&M, KGPCo, KPCo, OPCo and WPCo with AEPSC as agent. |
| Tax Reform | | On December 22, 2017, President Trump signed into law legislation referred to as the “Tax Cuts and Jobs Act” (the TCJA). The TCJA includes significant changes to the Internal Revenue Code of 1986, including a reduction in the corporate federal income tax rate from 35% to 21% effective January 1, 2018. |
| TCA | | Transmission Coordination Agreement dated January 1, 1997, by and among, PSO, SWEPCo and AEPSC, in connection with the operation of the transmission assets of the two public utility subsidiaries. |
| T&D | | Transmission and Distribution Utilities. |
| Transition Funding | | AEP Texas Central Transition Funding III LLC, a wholly-owned subsidiary of AEP Texas and consolidated VIE formed for the purpose of issuing and servicing securitization bonds related to restructuring legislation in Texas. |
| Transource Energy | | Transource Energy, LLC, a consolidated VIE formed for the purpose of investing in utilities which develop, acquire, construct, own and operate transmission facilities in accordance with FERC-approved rates. |
| Traverse | | Traverse, part of the North Central Wind Energy Facilities, consists of 998 MWs of wind generation in Oklahoma. |
| | |
| Turk Plant | | John W. Turk, Jr. Plant, a 650 MW coal-fired plant in Arkansas that is 73% owned by SWEPCo. |
| UMWA | | United Mine Workers of America. |
| UPA | | Unit Power Agreement. |
| Utility Money Pool | | Centralized funding mechanism AEP uses to meet the short-term cash requirements of certain utility subsidiaries. |
| VIE | | Variable Interest Entity. |
| Virginia SCC | | Virginia State Corporation Commission. |
| VIU | | Vertically Integrated Utilities. |
| WPCo | | Wheeling Power Company, an AEP electric utility subsidiary. WPCo provides electric service to retail customers in northern West Virginia. |
| WVPSC | | Public Service Commission of West Virginia. |
| WVTCo | | AEP West Virginia Transmission Company, Inc., a wholly-owned AEPTCo transmission subsidiary. |
.
FORWARD-LOOKING INFORMATION
This report made by the Registrants contains forward-looking statements within the meaning of Section 21E of the Securities Exchange Act of 1934. Many forward-looking statements appear in “Item 7 – Management’s Discussion and Analysis of Financial Condition and Results of Operations,” but there are others throughout this document which may be identified by words such as “expect,” “anticipate,” “intend,” “plan,” “believe,” “will,” “should,” “could,” “would,” “project,” “continue” and similar expressions, and include statements reflecting future results or guidance and statements of outlook. These matters are subject to risks and uncertainties that could cause actual results to differ materially from those projected. Forward-looking statements in this document are presented as of the date of this document. Except to the extent required by applicable law, management undertakes no obligation to update or revise any forward-looking statement. Among the factors that could cause actual results to differ materially from those in the forward-looking statements are:
| | | | | |
| • | Changes in economic conditions, electric market demand and demographic patterns in AEP service territories. |
| • | The economic impact of increased global conflicts and trade tensions, and the adoption or expansion of economic sanctions, tariffs or trade restrictions. |
| • | Inflationary or deflationary interest rate trends. |
| • | New legislation adopted in the states in which we operate that alters the regulatory framework or that prevents the timely recovery of costs and investments. |
| • | Volatility and disruptions in financial markets precipitated by any cause, including fiscal and monetary policy, turmoil related to federal budget or debt ceiling matters or instability in the banking industry; particularly developments affecting the availability or cost of capital to finance new capital projects and refinance existing debt. |
| • | The availability and cost of funds to finance working capital and capital needs, particularly (a) if expected sources of capital such as proceeds from the sale of assets, subsidiaries and tax credits and anticipated securitizations do not materialize or do not materialize at the level anticipated, and (b) during periods when the time lag between incurring costs and recovery is long and the costs are material. |
| • | Shifting demand for electricity. |
| • | The impact of extreme weather conditions, natural disasters and catastrophic events such as storms, drought conditions and wildfires that pose significant risks including potential litigation and the inability to recover significant damages and restoration costs incurred. |
| • | Limitations or restrictions on the amounts and types of insurance available to cover losses that might arise in connection with natural disasters or operations. |
| • | The cost of fuel and its transportation, the creditworthiness and performance of parties who supply and transport fuel and the cost of storing and disposing of used fuel, including coal ash and SNF. |
| • | The availability of fuel and necessary generation capacity and the performance of generation plants. |
| • | The ability to recover fuel and other energy costs through regulated or competitive electric rates. |
| • | The ability to build or acquire generation (including from renewable sources), transmission lines and facilities (including the ability to obtain any necessary regulatory approvals and permits) to meet the demand for electricity at acceptable prices and terms, including favorable tax treatment, cost caps imposed by regulators and other operational commitments to regulatory commissions and customers for generation projects, and to recover all related costs. |
| • | The disruption of AEP’s business operations due to impacts on economic or market conditions, costs of compliance with potential government regulations, electricity usage, supply chain issues, customers, service providers, vendors and suppliers caused by pandemics, natural disasters or other events. |
| • | New legislation, litigation or government regulation, including changes to tax laws and regulations, oversight of nuclear generation, energy commodity trading and new or modified requirements related to emissions of sulfur, nitrogen, mercury, carbon, soot or PM and other substances that could impact the continued operation, cost recovery and/or profitability of generation plants and related assets. |
| • | The impact of federal tax legislation, including potential changes to existing tax incentives, on results of operations, financial condition, cash flows or credit ratings. |
| • | The risks before, during and after generation of electricity associated with the fuels used or the by-products and wastes of such fuels, including coal ash and SNF. |
| • | Timing and resolution of pending and future rate cases, negotiations and other regulatory decisions, including rate or other recovery of new investments in generation, distribution and transmission service and environmental compliance. |
| • | Resolution of litigation or regulatory proceedings or investigations. |
| • | The ability to efficiently manage and recover operation, maintenance and development project costs. |
| • | Prices and demand for power generated and sold at wholesale. |
| • | Changes in technology, particularly with respect to energy storage and new, developing, alternative or distributed sources of generation. |
| | | | | |
| • | The ability to recover through rates any remaining unrecovered investment in generation units that may be retired before the end of their previously projected useful lives. |
| • | Volatility and changes in markets for coal and other energy-related commodities, particularly changes in the price of natural gas. |
| • | The impact of changing expectations and demands of customers, regulators, investors and stakeholders, including development, adoption, and use of artificial intelligence by us, our customers and our third party vendors and evolving expectations related to environmental, social and governance concerns. |
| • | Changes in utility regulation and the allocation of costs within RTOs including ERCOT, PJM and SPP. |
| • | Changes in the creditworthiness of the counterparties with contractual arrangements, including participants in the energy trading market. |
| • | Actions of rating agencies, including changes in the ratings of debt. |
| • | The impact of volatility in the capital markets on the value of the investments held by the pension, OPEB, captive insurance entity and nuclear decommissioning trust and the impact of such volatility on future funding requirements. |
| • | Accounting standards periodically issued by accounting standard-setting bodies. |
| • | Other risks and unforeseen events, including wars and military conflicts, the effects of terrorism (including increased security costs), embargoes, cybersecurity threats, labor strikes impacting material supply chains, global information technology disruptions and other catastrophic events. |
| • | The ability to attract and retain the requisite work force and key personnel. |
The forward-looking statements of the Registrants speak only as of the date of this report or as of the date they are made. The Registrants expressly disclaim any obligation to update any forward-looking information, except as required by law. For a more detailed discussion of these factors, see “Risk Factors” in Part I of this report.
The Registrants may use AEP’s website as a distribution channel for material company information. Financial and other important information regarding the Registrants is routinely posted on and accessible through AEP’s website at www.aep.com/investors/. In addition, you may automatically receive email alerts and other information about the Registrants when you enroll your email address by visiting the “Email Alerts” section at www.aep.com/investors/.
Company Website and Availability of SEC Filings
Our principal corporate website address is www.aep.com. Information on our website is not incorporated by reference herein and is not part of this Form 10-K. We make available free of charge through our website our Annual Report on Form 10-K, quarterly reports on Form 10-Q, current reports on Form 8-K and amendments to those reports filed or furnished pursuant to Section 13(a) or 15(d) of the Exchange Act as soon as reasonably practicable after such documents are electronically filed with, or furnished to, the SEC. The SEC maintains a website at www.sec.gov that contains reports, proxy and information statements and other information regarding AEP.
PART I
ITEM 1. BUSINESS
GENERAL
Overview and Description of Major Subsidiaries
AEP was incorporated under the laws of the State of New York in 1906 and reorganized in 1925. It is a public utility holding company that owns, directly or indirectly, all of the outstanding common stock of its public utility subsidiaries and varying percentages of other subsidiaries.
The service areas of AEP’s public utility subsidiaries cover portions of the states of Arkansas, Indiana, Kentucky, Louisiana, Michigan, Ohio, Oklahoma, Tennessee, Texas, Virginia and West Virginia. Transmission networks are interconnected with extensive distribution facilities in the territories served. The public utility subsidiaries of AEP have traditionally provided electric service, consisting of generation, transmission and distribution, on an integrated basis to their retail customers. Restructuring laws in Michigan, Ohio and the ERCOT area of Texas have caused AEP public utility subsidiaries in those states to unbundle previously integrated regulated rates for their retail customers.
The member companies of AEP have contractual, financial and other business relationships with the other member companies, such as participation in AEP savings and retirement plans and tax returns, sales of electricity and transportation and handling of fuel. The member companies of AEP also obtain certain accounting, administrative, information systems, engineering, financial, legal, maintenance and other services at cost from a common provider, AEPSC.
As of December 31, 2024, the subsidiaries of AEP had a total of 16,330 employees. Because it is a holding company rather than an operating company, AEP has no employees.
Summary information related to AEP subsidiary operating companies as of December 31, 2024 is shown in the table below:
| | | | | | | | | | | | | | | | | | | | | | | | | | | | | | | | | | | | | | | | | | | | | | | | | | | | | | | | | | | | | | |
| | AEP Texas | | AEPTCo | | APCo | | I&M | | KGPCo (a) | | KPCo | | OPCo (b) | | PSO | | SWEPCo | | WPCo |
| | | | | | | | | | | | | | | | | | | | |
| State of Incorporation | | Delaware, 1925 | | Delaware, 2006 | | Virginia, 1926 | | Indiana, 1907 | | Virginia, 1917 | | Kentucky, 1919 | | Ohio,
1907 | | Oklahoma, 1913 | | Delaware, 1912 | | West Virginia, 1883 |
| AEP Reportable Segment | | Transmission and Distribution Utilities | | AEP Transmission Holdco | | Vertically Integrated Utilities | | Vertically Integrated Utilities | | Vertically Integrated Utilities | | Vertically Integrated Utilities | | Transmission and Distribution Utilities | | Vertically Integrated Utilities | | Vertically Integrated Utilities | | Vertically Integrated Utilities |
| RTO Affiliation | | ERCOT | | (c) | | PJM | | PJM | | PJM | | PJM | | PJM | | SPP | | SPP | | PJM |
| Approximate Number of Retail Customers | | 1,122,000 | | (c) | | 969,000 | | 617,000 | | 50,000 | | 163,000 | | 1,539,000 | | 584,000 | | 555,000 | | 41,000 |
| | | | | | | | | | | | | | | | | | | | |
| Number of Employees | | 1,598 | | (c) | | 1,613 | | 2,069 | | 47 | | 279 | | 1,594 | | 1,044 | | 1,314 | | 229 |
| | | | | | | | | | | | | | | | | | | | |
(a)KGPCo does not own any generating facilities and purchases electric power from APCo for distribution to its customers.
(b)OPCo purchases energy and capacity at auction to serve generation service customers who have not switched to a competitive generation supplier.
(c)AEPTCo is a holding company for the State Transcos. Five State Transcos are members of PJM and two State Transcos are members of SPP. Neither AEPTCo nor its subsidiaries have any employees. Instead, AEPSC and certain AEP utility subsidiaries provide services to these entities.
Service Company Subsidiary
AEPSC is a service company subsidiary that provides accounting, administrative, information systems, engineering, financial, legal, maintenance and other services at cost to AEP subsidiaries. The executive officers of AEP and certain of the executive officers of its public utility subsidiaries are employees of AEPSC. As of December 31, 2024, AEPSC had 6,237 employees.
Principal Industries Served
The following table illustrates the principal industries and wholesale electric markets served by AEP’s public utility subsidiaries.
| | | | | | | | | | | | | | | | | | | | | | | | | | | | | | | | | | | | | | | | | | | | | | | | | | | | | | | | |
| | AEP Texas | | APCo | | I&M | | KGPCo | | KPCo | | OPCo | | PSO | | SWEPCo | | WPCo |
| Principal Industries Served: | | | | | | | | | | | | | | | | | | |
| Petroleum and Coal Products Manufacturing | | X | | | | | | | | X | | X | | X | | X | | |
| Chemical Manufacturing | | X | | X | | X | | X | | X | | X | | | | X | | X |
| Oil and Gas Extraction | | X | | | | | | | | X | | | | X | | X | | |
| Pipeline Transportation | | X | | X | | | | | | X | | X | | X | | | | X |
| Primary Metal Manufacturing | | X | | X | | X | | | | | | X | | | | | | X |
| Data Processing (a) | | X | | | | X | | | | | | X | | | | | | |
| Coal-Mining | | | | X | | | | | | X | | | | | | | | X |
| Paper Manufacturing | | | | X | | | | X | | | | | | X | | X | | |
| Transportation Equipment | | | | | | X | | | | | | | | | | | | X |
| Plastics and Rubber Products | | | | | | X | | X | | | | X | | X | | | | |
| Fabricated Metals Product Manufacturing | | | | | | X | | | | | | | | | | | | |
| Food Manufacturing | | | | | | | | | | | | | | | | X | | |
| | | | | | | | | | | | | | | | | | |
| Supply and Market Electric Power at Wholesale to: | | | | | | | | | | | | | | | | | | |
| Other Electric Utility Companies | | | | X | | X | | | | X | | | | X | | X | | X |
| Rural Electric Cooperatives | | | | X | | X | | | | | | | | | | X | | |
| Municipalities | | | | X | | X | | | | X | | | | X | | X | | |
| Other Market Participants | | | | X | | X | | | | X | | | | X | | X | | X |
(a)Primarily includes data centers and cryptocurrency operations.
Public Utility Subsidiaries by Jurisdiction
The following table illustrates certain regulatory information with respect to the jurisdictions in which the public utility subsidiaries of AEP operate:
| | | | | | | | | | | | | | | | | |
| Principal Jurisdiction | | AEP Utility Subsidiaries Operating in that Jurisdiction | | Authorized Return on Equity (a) |
| Arkansas | | SWEPCo | | 9.50 | % | |
| | | | | |
| FERC | | AEPTCo - PJM | | 10.35 | % | (b) |
| | AEPTCo - SPP | | 10.50 | % | |
| | | | | |
| Indiana | | I&M | | 9.85 | % | |
| | | | | |
| Kentucky | | KPCo | | 9.75 | % | |
| | | | | |
| Louisiana | | SWEPCo | | 9.50 | % | |
| | | | | |
| Michigan | | I&M | | 9.86 | % | |
| | | | | |
| Ohio | | OPCo | | 9.70 | % | |
| | | | | |
| Oklahoma | | PSO | | 9.50 | % | |
| | | | | |
| Tennessee | | KGPCo | | 9.50 | % | |
| | | | | |
| Texas | | AEP Texas | | 9.76 | % | |
| | SWEPCo | | 9.25 | % | (c) |
| | | | | |
| Virginia | | APCo | | 9.75 | % | |
| | | | | |
| West Virginia | | APCo | | 9.75 | % | |
| | | WPCo | | 9.75 | % | |
(a)Identifies the predominant current authorized ROE, and may not include other, less significant, permitted recovery. Actual ROE varies from authorized ROE.
(b)In December 2022, the FERC issued an order removing the 50 basis point RTO incentive from OHTCo transmission formula rates effective February 2022, reducing OHTCo’s authorized ROE to 9.85%.
(c)In February 2022, as part of the 2020 Texas Base Rate Case, SWEPCo filed a motion for rehearing with the PUCT alleging several errors in the final order, which included a challenge of the approved ROE. In April 2022, the PUCT denied the motion for rehearing. In May 2022, SWEPCo filed a petition for review with the Texas District Court seeking a judicial review of the several errors challenged in the PUCT’s final order. See “2020 Texas Base Rate Case” section of Note 4 for additional information.
CLASSES OF SERVICE
AEP and subsidiaries recognize revenues from customers for retail and wholesale electricity sales and electricity transmission and distribution delivery services. AEP’s subsidiaries within the Vertically Integrated Utilities, Transmission and Distribution Utilities, AEP Transmission Holdco and Generation & Marketing segments derive revenue from the following sources: Retail Revenues, Wholesale and Competitive Retail Revenues, Other Revenues from Contracts with Customers and Alternative Revenues. For further information relating to the sources of revenue for the Registrants, see Note 20 - Revenues from Contracts with Customers for additional information.
FINANCING
General
AEP subsidiaries generally use short-term debt to finance working capital needs. Short-term debt may also be used to finance acquisitions, construction and redemption or repurchase of outstanding securities until such needs can be financed with long-term funding. In recent history, short-term funding needs have been provided for by cash from operations, AEP’s commercial paper program and term loan issuances. Funds are made available to subsidiaries under the AEP corporate borrowing program. Certain public utility subsidiaries of AEP also sell accounts receivable to provide liquidity. Sources of long-term funding include issuance of long-term debt, long-term asset securitizations, leasing agreements, hybrid securities or common stock. See “Financial Condition” section of Management’s Discussion and Analysis of Financial Condition and Results of Operations for additional information.
AEP’s revolving credit agreements (which backstop the commercial paper program) include covenants and events of default typical for these types of facilities, including a maximum debt-to-total capitalization test. In addition, the acceleration of AEP’s payment obligations, or the obligations of certain of its major subsidiaries, prior to maturity under any other agreement or instrument relating to debt outstanding in excess of $100 million, would cause an event of default under the credit agreements. As of December 31, 2024, AEP was in compliance with its debt covenants. With the exception of a voluntary bankruptcy or insolvency, any event of default has either or both a cure period or notice requirement before termination of the applicable agreement. A voluntary bankruptcy or insolvency of AEP or one of its significant subsidiaries would be considered an immediate termination event. See “Financial Condition” section of Management’s Discussion and Analysis of Financial Condition and Results of Operations for additional information.
AEP’s subsidiaries have also utilized, and expect to continue to utilize, additional financing arrangements, such as securitization financings and leasing arrangements.
ENVIRONMENTAL AND OTHER MATTERS
General
AEP subsidiaries are currently subject to regulation by federal, state and local authorities with regard to air and water-quality control, solid and hazardous waste disposal and other environmental matters, and are subject to zoning and other regulation by local authorities. The current and proposed environmental laws and regulations discussed below will have an impact on AEP’s operations. Management continues to monitor developments in these regulations and evaluate the economic feasibility and refine cost estimates for compliance. AEP is unable to predict changes in regulations, regulatory guidance, legal interpretations, policy positions and implementation actions that may result from the change in Presidential administrations. For additional information on the laws and regulations discussed below, see “Environmental Issues” section of Management’s Discussion and Analysis of Financial Condition and Results of Operations.
Clean Air Act Requirements (CAA)
The CAA establishes a comprehensive program to protect and improve the nation’s air quality and control sources of air emissions. The states implement and administer many of these programs and could impose additional or more stringent requirements. The primary regulatory programs that continue to drive investments in AEP’s existing generating units include: (a) periodic revisions to NAAQS and the development of SIPs to achieve more stringent standards, (b) implementation of the regional haze program by the states and the Federal EPA, (c) regulation of hazardous air pollutant emissions under MATS, (d) implementation and review of CSAPR and (e) the Federal EPA’s regulation of GHG emissions from fossil generation under Section 111 of the CAA.
Clean Water Act Requirements
The Federal EPA’s ELG rule for generating facilities establishes limits for FGD wastewater, fly ash and bottom ash transport water and flue gas mercury control wastewater, which are to be implemented through each facility’s wastewater discharge permit. In April 2024, the Federal EPA finalized further revisions to the ELG rule that establish a zero liquid discharge standard for FGD wastewater, bottom ash transport water, and managed combustion residual leachate, as well as more stringent discharge limits for unmanaged combustion residual leachate. The revised rule provides a new compliance alternative that would eliminate the need to install zero liquid discharge systems for facilities that comply with the 2020 rule’s control technology requirements and commit by December 31, 2025 to retire by 2034. Management is evaluating the compliance alternatives in the rule, taking into consideration the requirements of the other new rules and their combined impacts to operations. Several appeals have been filed with various federal courts challenging the 2024 ELG rule. SWEPCo has also challenged the rule, by filing a joint appeal with a utility trade association in which AEP participates. The various appeals have been consolidated before the United States Court of Appeals for the Eighth Circuit. SWEPCo and the utility trade association filed a motion to stay the rule during the litigation. In October 2024, the court denied the motion. Management cannot predict the outcome of the litigation.
Coal Ash Regulation
The Federal EPA’s CCR Rule regulates the disposal and beneficial re-use of CCR, including fly ash and bottom ash created from coal-fired generating units and FGD gypsum generated at some coal-fired plants. As originally promulgated, the rule applied to active and inactive CCR landfills and surface impoundments at facilities of active electric utility or independent power producers.
In April 2024, the Federal EPA finalized revisions to the CCR Rule to expand the scope of the rule to include inactive impoundments at inactive facilities (“legacy CCR surface impoundments”) as well as to establish requirements for currently exempt solid waste management units that involve the direct placement of CCR on the land (“CCR management units”). The Federal EPA is requiring that owners and operators of legacy surface impoundments comply with all of the existing CCR Rule requirements applicable to inactive CCR surface impoundments at active facilities, except for the location restrictions and liner design criteria. The rule establishes compliance deadlines for legacy surface impoundments to meet regulatory requirements, including a requirement to initiate closure within five years after the effective date of the final rule. The rule requires evaluations to be completed at both active facilities and inactive facilities with one or more legacy surface impoundments. Closure may be accomplished by applying an impermeable cover system over the CCR material (“closure in place”) or the CCR material may be excavated and placed in a compliant landfill (“closure by removal”). Groundwater monitoring and other analysis over the next three years will provide additional information on the planned closure method. AEP evaluated the applicability of the rule to current and former plant sites and recorded incremental ARO of $674 million in the second quarter of 2024 based on initial cost estimates primarily reflecting compliance with the rule through closure in place and future groundwater monitoring requirements pursuant to the revised CCR Rule.
As further groundwater monitoring and other analysis is performed, management expects to refine the assumptions and underlying cost estimates used in recording the ARO. These refinements may include, but are not limited to, changes in the expected method of closure, changes in estimated quantities of CCR at each site, the identification of new CCR management units, among other items. These future changes could have a material impact on the ARO and materially reduce future net income and cash flows and further impact financial condition.
Climate Change, CO2 Regulation and Energy Policy
In April 2024, the Administrator of the Federal EPA signed new GHG standards and guidelines for new and existing fossil-fuel fired sources. The rule relies on carbon capture and sequestration and natural gas co-firing as means to reduce CO2 emissions from coal fired plants and carbon capture and sequestration or limited utilization to reduce CO2 emissions from new gas turbines. The rule also offers early retirement of coal plants in lieu of carbon capture and storage as an alternative means of compliance. A number of parties filed petitions for review of the rule in the U.S. Court of Appeals for the D.C. Circuit. AEP is in the early stages of evaluating and identifying the best strategy for complying with this rule while ensuring the adequacy of resources to meet customer needs. The Federal EPA’s new GHG rule is directed at the fossil-fuel fired electric utility industry and could force AEP to close additional coal-fired generation facilities earlier than their estimated useful life. If AEP is unable to recover the costs of its investments, it would reduce future net income and cash flows and impact financial condition.
Other Environmental Issues and Matters
The Comprehensive Environmental Response, Compensation and Liability Act of 1980 imposes costs for environmental remediation upon owners and previous owners of sites, as well as transporters and generators of hazardous material disposed of at such sites. See “The Comprehensive Environmental Response Compensation and Liability Act (Superfund) and State Remediation” section of Note 6 for additional information.
Electric Industry Transformation
The electric utility industry is in the midst of an historic transformation, driven by large load growth in the commercial customer class from data processing loads, changing customer needs, evolving public policies, stakeholder demands, demographics, competitive offerings, technologies and commodity prices.
AEP is committed to providing reliable affordable power to its customers. To achieve this, AEP and its subsidiaries routinely meet with state regulators and key stakeholders to understand their needs for both dispatchable and renewable generation resources. This process evaluates, amongst other things, future supply and demand fundamentals, the economic aspects of investments, grid reliability and resilience, regulations and evolving RTO requirements, the advancement of generation technologies, and market impacts and constraints. As part of the regulatory process, AEP routinely submits IRPs in various regulatory jurisdictions to address future generation needs. The objective of the IRPs is to recommend future generation and capacity resources that provide the most cost-efficient and reliable power to customers.
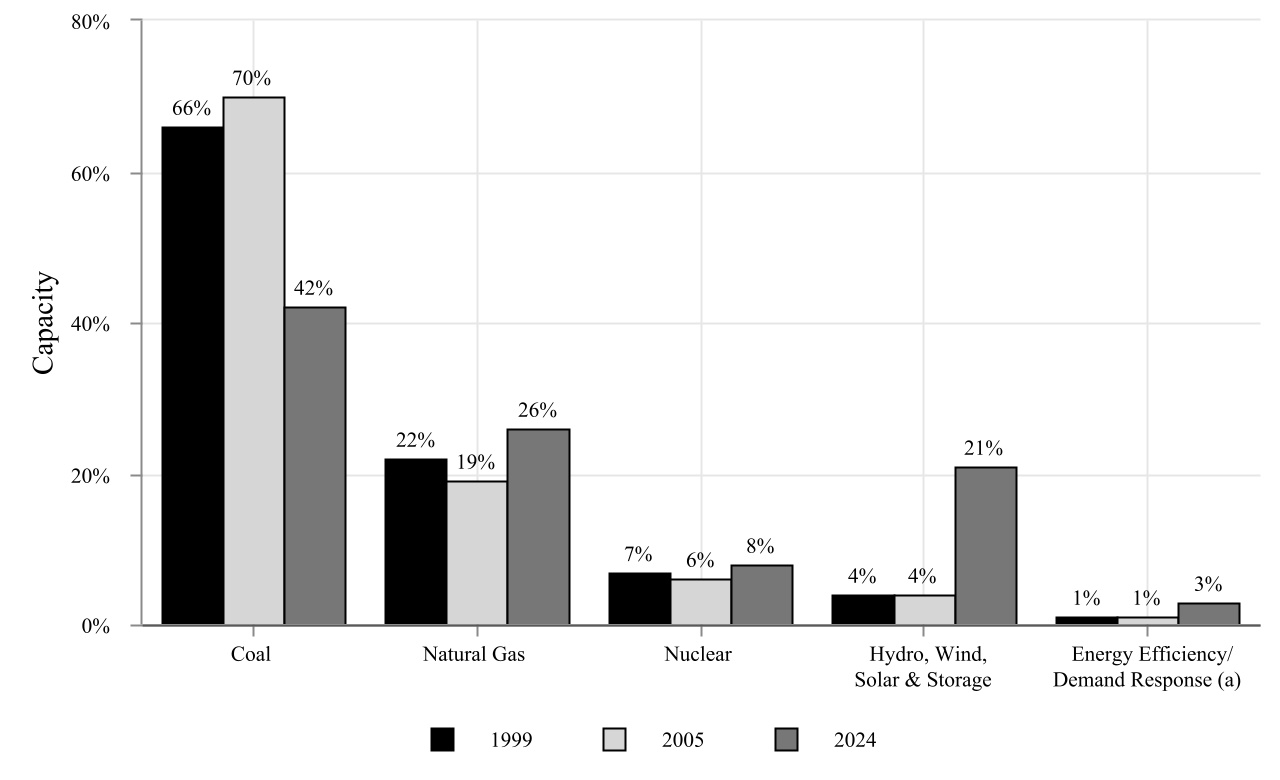
As of December 31, 2024, AEP’s generating capacity included owned and PPA capacity of approximately 23,200 MWs and 5,300 MWs, respectively. The graph below summarizes AEP’s generating capacity by resource type for the years 1999, 2005 and 2024:
(a) Energy Efficiency/Demand Response represents avoided capacity rather than physical assets.
Corporate Governance
In response to environmental issues and in connection with its assessment of AEP’s strategic plan, the Board of Directors continually reviews the risks posed by new environmental rules and requirements that could alter the retirement date of coal-fired generation assets. The Board of Directors is informed of new environmental regulations and proposed environmental regulations or legislation that would significantly affect AEP. In addition, the Board holds extended meetings twice a year to provide extra time for a more robust review of the Company’s strategy, including discussions about carbon and carbon risk. The Board’s Committee on Directors and Corporate Governance oversees AEP’s annual Corporate Sustainability Report, which includes information about AEP’s environmental, social, governance and financial performance.
HUMAN CAPITAL MANAGEMENT
Attracting, developing and retaining high-performing employees with the skills and experience needed to serve our customers efficiently and effectively is crucial to AEP’s growth and competitiveness and is central to our long-term strategy. AEP invests in employees and continues to build a high performance and inclusive culture that inspires leadership, encourages innovative thinking and welcomes everyone.
The following table shows AEP’s number of employees by subsidiary as of December 31, 2024:
| | | | | | | | |
| Subsidiary | | Number of Employees |
| AEPSC | | 6,237 | |
| AEP Texas | | 1,598 | |
| APCo | | 1,613 | |
| I&M | | 2,069 | |
| KGPCo | | 47 | |
| KPCo | | 279 | |
| OPCo | | 1,594 | |
| PSO | | 1,044 | |
| SWEPCo | | 1,314 | |
| WPCo | | 229 | |
| Other (a) | | 306 | |
| Total AEP | | 16,330 | |
(a) Primarily relates to AEP Energy employees.
Of AEP’s 16,330 employees, less than 1% are Traditionalists (born before 1946), approximately 12% are Baby Boomers (born 1946-1964), approximately 37% are Generation X (born 1965-1980), approximately 42% are Millennials (born 1981-1996) and less than 9% are Generation Z (born after 1996). As of December 31, 2024, women comprised approximately 20% of AEP’s total workforce, approximately 21% of AEP’s total workforce was represented by racially or ethnically diverse employees and approximately 25% of AEP’s total workforce was represented by labor unions.
Safety
Safety is integral to our culture and is one of AEP’s core values. AEP is dedicated to ensuring the safety of our employees, contractors, customers and the communities we serve. AEP has policies, procedures, programs, training and initiatives in place to help ensure a safety conscious work environment. We are committed to fundamentally embed layers of protection in the work we do. This includes focusing our efforts to prevent serious injuries and fatalities, strengthening pre-job briefing effectiveness, learning from safety incidents, providing appropriate training and education and improving proactive safety initiatives and data analysis to identify and address potential performance gaps.
| | | | | | | | | | | | | | |
| Safety Metric | | 2024 | | 2023 |
| DART | | 0.556 | | 0.384 |
| TRIR | | 0.913 | | 0.690 |
AEP’s employee Days Away, Restricted and Transferred (DART) rate and Total Recordable Incident Rate (TRIR) increased in 2024. A DART event is an event that results in one or more lost days, one or more restricted days, or results in an employee transferring to a different job within the company. The DART rate is a mathematical calculation (number of DART events multiplied by 200,000 and divided by total YTD hours worked) that describes the number of injuries per 100 full-time employees annually. A recordable event is a work-related event that results in death, days away from work, restricted work or transfer to another job, medical treatment beyond first aid, loss of consciousness or a significant injury or illness diagnosed by a physician or other licensed health care professional. TRIR is a mathematical calculation (number of recordable events multiplied by 200,000 and divided by total year to date hours worked) that describes the number of incidents per 100 full-time employees annually. In response to these challenges, AEP is recommitting to fundamental principles of excellence by integrating human performance fundamentals into our operational practices to ensure a safer work environment for all.
Culture and Inclusion
At AEP, we believe in doing the right thing every time for our customers and each other and that culture serves as the foundation for our success. We recognize that an engaged, collaborative and inclusive workforce helps us better serve our employees, customers, suppliers and other key stakeholders. AEP views a culture as a core business value that is centered on performance, accountability and developing our employees. As a strategic priority, our commitment to culture and inclusion is guided by three principles:
•Ensuring leaders are held accountable for fostering an inclusive environment and culture.
•Promoting an inclusive culture where all employees can thrive.
•Supporting the communities we serve so they will prosper.
AEP’s culture and inclusion progress is measured through our annual Employee Voice Survey. The Employee Voice Survey is an opportunity for employees to provide feedback about their experience at AEP. It also serves as a means for the company to understand how we can foster a workplace focused on performance, accountability, efficiency, and customer orientation. 2024 marks our eleventh consecutive year of formally surveying employees about their experience at AEP.
Training and Professional Development
Attracting, developing, and retaining high-performing employees with the skills and experience needed to serve our customers efficiently and effectively is crucial to AEP’s growth and long-term strategy. At AEP, we are preparing our workforce for the future by providing opportunities to learn new skills and engaging higher education institutions to better prepare the next generation of workers. AEP offers co-op and internship programs in partnership with high schools, technical/vocational schools and colleges across our 11-state service territory. AEP also provides a broad range of training and assistance that supports lifelong learning and development. This includes operational skills training, professional training, leadership development, educational assistance, ongoing performance coaching, and other forms of training that offer developmental pathways for employees.
Compensation and Benefits
AEP is committed to the well-being of our employees, and we offer programs to foster employee financial security, physical and emotional health, and social connectedness. We provide market-competitive compensation and benefits, including medical and dental coverage, life insurance, and well-being programs that support our employees and their families. Nearly all AEP employees participate in an annual incentive program that rewards individual performance and achievement of business goals, fostering a high-performance culture. AEP also offers paid time off in the form of vacation, holidays, sick time, and parental leave.
BUSINESS SEGMENTS
AEP’s Reportable Segments
AEP’s primary business is the generation, transmission and distribution of electricity. Within its Vertically Integrated Utilities segment, AEP centrally dispatches generation assets and manages its overall utility operations on an integrated basis because of the substantial impact of cost-based rates and regulatory oversight applicable to each public utility subsidiary. Intersegment sales and transfers are generally based on underlying contractual arrangements and agreements. AEP’s reportable segments are as follows:
•Vertically Integrated Utilities
•Transmission and Distribution Utilities
•AEP Transmission Holdco
•Generation & Marketing
The remainder of AEP’s activities is presented as Corporate and Other, which is not considered a reportable segment. See Note 9 - Business Segments for additional information on AEP’s segments.
Seasonality
The consumption and delivery of electric power is generally seasonal which impacts the results of operations of AEP’s reportable segments. In many parts of the country, demand for power peaks during the hot summer months, with market prices also peaking at that time. In other areas, power demand peaks during the winter. The pattern of this fluctuation may change due to the nature and location of AEP’s facilities and the terms of power sale contracts into which AEP enters. In addition, AEP has historically sold and delivered less power, and consequently earned less income, when weather conditions are milder. Unusually mild weather in the future could diminish AEP’s results of operations. Conversely, unusually extreme weather conditions could increase AEP’s results of operations.
VERTICALLY INTEGRATED UTILITIES
GENERAL
AEP’s vertically integrated utility operations are engaged in the generation, transmission and distribution of electricity for sale to retail and wholesale customers through assets owned and operated by AEGCo, APCo, I&M, KGPCo, KPCo, PSO, SWEPCo and WPCo. AEPSC, as agent for AEP’s public utility subsidiaries, performs marketing, generation dispatch, fuel procurement and power-related risk management and trading activities on behalf of each of these subsidiaries.
ELECTRIC GENERATION
Facilities
As of December 31, 2024, AEP’s vertically integrated public utility subsidiaries owned approximately 23,200 MWs of generation. See Item 2 – Properties for more information regarding the generation capacity of vertically integrated public utility subsidiaries.
Fuel Supply
The following table shows the owned and leased generation sources by type (including wind purchase agreements), on an actual net generation (MWhs) basis, used by the Vertically Integrated Utilities:
| | | | | | | | | | | | | | | | | |
| | 2024 | | 2023 | | 2022 |
| Coal and Lignite | 40% | | 37% | | 43% |
| Nuclear | 22% | | 22% | | 21% |
| Natural Gas | 22% | | 22% | | 19% |
| Renewables | 16% | | 19% | | 17% |
An increase/decrease in one or more generation types relative to previous years reflects changes in resource mix and price changes in one or more fuel commodity sources relative to the pricing of other fuel commodity sources. AEP’s overall 2024 fossil fuel costs for the Vertically Integrated Utilities increased 3.2% on a dollar per MMBtu basis from 2023.
Coal and Lignite
AEP’s Vertically Integrated Utilities procure coal under a combination of purchasing arrangements, including long-term contracts, and spot agreements with various producers and marketers. Coal consumption increased 12.7% in 2024 from 2023.
Management projects that the Vertically Integrated Utilities will be able to secure and transport coal of adequate quality and quantities to operate their coal fired units. As of December 31, 2024, through subsidiaries, AEP owns, leases or controls 2,934 railcars, 296 barges, 4 towboats and a coal handling terminal with approximately 18 million tons of annual capacity to move and store coal for use in AEP generating facilities. AEP will procure additional railcar and barge/towboat capacity as needed based on demand.
Although coal prices remained stable for all of 2024 the market price for coal is greater than historical prices (excluding 2021 and 2022), due to the higher cost incurred by the suppliers to mine coal over the last few years. Coal prices may see a fluctuation in the next few years as utilities begin to reenter the market as high inventories decline and as forecasted demand for electricity increases. AEP’s strategy for purchasing coal includes maintaining a target inventory level by layering in supplies over time to help with reducing price volatility. The price paid for coal delivered in 2024 decreased approximately 3.5% from 2023 mainly due to the completion of higher priced coal supply agreements that were agreed to in 2021 and 2022 when coal market pricing was stronger. The decrease in the delivered cost of coal should continue into 2025 as some higher priced agreements ended in 2024. With AEP’s strategy of layering tons into the coal portfolio the prices over the next few years will continue to fluctuate with the coal market.
The following table shows the amount of coal and lignite delivered to the Vertically Integrated Utilities’ plants during the past three years and the average delivered price of coal and lignite purchased by the Vertically Integrated Utilities:
| | | | | | | | | | | | | | | | | |
| | 2024 | | 2023 | | 2022 |
| Total coal and lignite delivered to the plants (in millions of tons) | 16.5 | | 20.9 | | 20.4 | |
| Average cost per ton of coal and lignite delivered | $ | 62.05 | | | $ | 64.31 | | | $ | 56.16 | |
The coal supplies at the Vertically Integrated Utilities plants vary from time to time depending on various factors, including, but not limited to, consumption rates driven by the demand for electric power, unit outages, transportation limitations or delays, space limitations, labor issues, supplier outages and issues and weather conditions, all of which may impact production, consumption or deliveries. As of December 31, 2024 and 2023, the Vertically Integrated Utilities’ coal inventory was approximately 71 days and 82 days of full load burn, respectively. Inventory levels remained high in 2024 due to mild weather conditions and continued low natural gas prices. Management expects inventory levels to remain elevated in 2025 due to many of these same factors. While inventory targets vary by plant and are changed as necessary, the current coal inventory target for the Vertically Integrated Utilities is approximately 35 days of full load burn.
Natural Gas
The Vertically Integrated Utilities consumed approximately 155 billion cubic feet of natural gas during 2024 for generating power. This represents an increase of 6.7% from 2023. Several of AEP’s natural gas-fired units are connected to at least two pipelines, which allows greater access to competitive supplies and improves delivery reliability. From a natural gas supply perspective, the Vertically Integrated Utilities secure forward month, fixed price baseload supply, prompt month baseload supply, and pursue daily spot market purchases or sales (to balance daily positions). From a natural gas transportation perspective, the Vertically Integrated Utilities utilize firm and interruptible transportation capacity. Furthermore, SWEPCo and PSO utilize firm natural gas storage, which supports price stability and provides additional surety of natural gas supply. AEP’s natural gas supply, transportation and storage transactions are competitively bid and are based on applicable market prices.
The following table shows the amount of natural gas delivered to the Vertically Integrated Utilities’ plants during the past three years and the average delivered price of natural gas purchased by the Vertically Integrated Utilities:
| | | | | | | | | | | | | | | | | |
| | 2024 | | 2023 | | 2022 |
| Total natural gas delivered to the plants (in billions cubic feet) | 155.0 | | | 146.0 | | | 126.0 | |
| Average delivered price per MMBtu of purchased natural gas | $ | 3.05 | | | $ | 2.69 | | | $ | 6.94 | |
Nuclear
I&M has made commitments to meet the current nuclear fuel requirements of the Cook Plant. I&M has made and will make purchases of uranium in various forms in the spot, short-term, mid-term and long-term markets.
For purposes of the storage of high-level radioactive waste in the form of SNF, I&M completed modifications to its SNF storage pool in the early 1990’s. I&M entered into an agreement to provide for onsite dry cask storage of SNF to permit normal operations to continue. I&M is scheduled to conduct further dry cask loading and storage projects on an ongoing periodic basis. The year of expiration of each NRC Operating License is 2034 for Unit 1 and 2037 for Unit 2. Management has started the application process for license extensions for both units that would extend Unit 1 and Unit 2 to 2054 and 2057, respectively.
Nuclear Waste and Decommissioning
As the owner of the Cook Plant, I&M has a significant future financial commitment to dispose of SNF and decommission and decontaminate the plant safely. The cost to decommission a nuclear plant is affected by NRC regulations and the SNF disposal program. The most recent decommissioning cost study was completed in 2024. According to that study, stated in 2024 undiscounted dollars, the estimated cost of decommissioning and disposal of low-level radioactive waste was $2.4 billion, with additional ongoing costs of $7 million per year for post decommissioning storage of SNF and an eventual cost of $45 million for the subsequent decommissioning of the SNF storage facility. As of December 31, 2024 and 2023, the total decommissioning trust fund balance for the Cook Plant was approximately $4 billion and $3.5 billion, respectively. The balance of funds available to eventually decommission Cook Plant will differ based on contributions and investment returns. The ultimate cost of retiring the Cook Plant may be materially different from estimates and funding targets as a result of the:
•Escalation of various cost elements (including, but not limited to, general inflation and the cost of energy).
•Further development of regulatory requirements governing decommissioning.
•Technology available at the time of decommissioning differing significantly from that assumed in studies.
•Availability of nuclear waste disposal facilities.
•Availability of a United States Department of Energy facility for permanent storage of SNF.
Accordingly, management is unable to provide assurance that the ultimate cost of decommissioning the Cook Plant will not be significantly different than current projections. AEP will seek recovery from customers through regulated rates if actual decommissioning costs exceed projections. See the “Nuclear Contingencies” section of Note 6 - Commitments, Guarantees and Contingencies for additional information with respect to nuclear waste and decommissioning.
Low-Level Radioactive Waste
The Low-Level Waste Policy Act of 1980 mandates that the responsibility for the disposal of low-level radioactive waste rests with the individual states. Low-level radioactive waste consists largely of ordinary refuse and other items that have come in contact with radioactive materials. Michigan does not currently have a disposal site for such waste available. I&M cannot predict when such a site may be available. However, the states of Utah and Texas have licensed low-level radioactive waste disposal sites which currently accept low-level radioactive waste from Michigan waste generators. There is currently no set date limiting I&M’s access to either of these facilities. The Cook Plant has a facility onsite designed specifically for the storage of low-level radioactive waste. In the event that low-level radioactive waste disposal facility access becomes unavailable, it can be stored onsite at this facility.
Counterparty Risk Management
The Vertically Integrated Utilities segment also sells power and enters into related energy transactions with wholesale customers and other market participants. As a result, counterparties and exchanges may require cash or cash related instruments to be deposited on transactions as margin against open positions. As of December 31, 2024, counterparties posted approximately $16 million in cash, cash equivalents or letters of credit with AEPSC for the benefit of AEP’s public utility subsidiaries (while, as of that date, AEP’s public utility subsidiaries posted approximately $201 million with counterparties and exchanges). Since open trading contracts are valued based on market prices of various commodities, exposures change daily. See the “Quantitative and Qualitative Disclosures About Market Risk” section of Management’s Discussion and Analysis of Financial Condition and Results of Operations for additional information.
Certain Power Agreements
I&M
A UPA between AEGCo and I&M (the I&M Power Agreement) provides for the sale by AEGCo to I&M of all the energy and capacity available to AEGCo at the Rockport Plant unless it is sold to another utility. I&M is obligated, whether or not power is available from AEGCo, to pay as a demand charge for the right to receive such power (and as an energy charge for any associated energy taken by I&M) net of amounts received by AEGCo from any other sources, sufficient to enable AEGCo to pay all of its operating and other expenses, including a rate of return on the common equity of AEGCo as approved by the FERC. The UPA will continue in effect until the debt obligations of AEGCo secured by the Rockport Plant have been satisfied and discharged (currently expected to be December 2028).
In April 2021, AEGCo and I&M executed an agreement to purchase 100% of the interests in Rockport Plant, Unit 2 effective at the end of the lease term on December 7, 2022. Prior to the termination of the lease, I&M assigned 30% of the power to KPCo. Beginning December 8, 2022, AEGCo billed 100% of its share of the Rockport Plant to I&M and ceased billing to KPCo. KPCo reached an agreement with I&M, from the end of the lease through May 2023, to buy capacity from Rockport Plant, Unit 2 through the PCA at a rate equal to PJM’s RPM clearing price. See the “Unit Power Agreements” section of Note 17 - Related Party Transactions for additional information.
OVEC
AEP and several nonaffiliated utility companies jointly own OVEC. The aggregate equity participation of AEP in OVEC is 43.47%. Parent owns 39.17% and OPCo owns 4.3%. Under the Inter-Company Power Agreement (ICPA), which defines the rights of the owners and sets the power participation ratio of each, the sponsoring companies are entitled to receive and are obligated to pay for all OVEC capacity (approximately 2,400 MWs) in proportion to their respective power participation ratios. The aggregate power participation ratio of APCo, I&M and OPCo is 43.47%. The ICPA terminates in June 2040. The proceeds from charges by OVEC to sponsoring companies under the ICPA based on their power participation ratios are designed to be sufficient for OVEC to meet its operating expenses and fixed costs. OVEC’s Board of Directors, as elected by AEP and nonaffiliated owners, has authorized environmental investments related to their ownership interests, with resulting expenses (including for related debt and interest thereon) included in charges under the ICPA. OVEC financed capital expenditures in excess of $1 billion in connection with flue gas desulfurization projects and the associated scrubber waste disposal landfills at its two generation plants through debt issuances, including tax-advantaged debt issuances. Both OVEC generation plants are operating with the environmental controls in-service. See Note 18 - Variable Interest Entities and Equity Method Investments for additional information.
ELECTRIC DELIVERY
General
Other than AEGCo, AEP’s vertically integrated public utility subsidiaries own and operate transmission and distribution lines and other facilities to deliver electric power. See Item 2 – Properties for more information regarding the transmission and distribution lines. Most of the transmission and distribution services are sold to retail customers of AEP’s vertically integrated public utility subsidiaries in their service territories. These sales are made at rates approved by the state utility commissions of the states in which they operate, and in some instances, approved by the FERC. The FERC regulates and approves the rates for both wholesale transmission transactions and wholesale generation contracts. The use and the recovery of costs associated with the transmission assets of the AEP vertically integrated public utility subsidiaries are subject to the rules, principles, protocols and agreements in place with PJM and SPP, and as approved by the FERC. See Item 1. Business – Vertically Integrated Utilities – Regulation – FERC. As discussed below, some transmission services also are separately sold to nonaffiliated companies.
Other than AEGCo, AEP’s vertically integrated public utility subsidiaries hold franchises or other rights to provide electric service in various municipalities and regions in their service areas. In some cases, these franchises provide the utility with the exclusive right to provide electric service within a specific territory. These franchises have varying provisions and expiration dates. In general, the operating companies consider their franchises to be adequate for the conduct of their business.
Transmission Agreement
APCo, I&M, KGPCo, KPCo and WPCo own and operate transmission facilities that are used to provide transmission service under the PJM OATT and are parties to the TA. OPCo, which is a subsidiary in AEP’s Transmission and Distribution Utilities segment that provides transmission service under the PJM OATT, is also a party to the TA. The TA defines how the parties to the agreement share the revenues associated with their transmission facilities and the costs of transmission service provided by PJM. The TA has been approved by the FERC.
Transmission Coordination Agreement and Open Access Transmission Tariff
PSO, SWEPCo and AEPSC are parties to the TCA. Under the TCA, a coordinating committee is charged with the responsibility of: (a) overseeing the coordinated planning of the transmission facilities of the parties to the agreement, including the performance of transmission planning studies, (b) the interaction of such subsidiaries with independent system operators and other regional bodies interested in transmission planning and (c) compliance with the terms of the AEP and SPP OATTs filed with the FERC and the rules of the FERC relating to such tariffs. Pursuant to the TCA, PSO, SWEPCo and AEPSC each have responsibility for monitoring and reporting situations or problems that materially affect the reliability of PSO’s and SWEPCo’s transmission systems. The TCA also provides for the allocation among the parties of revenues collected for transmission and ancillary services as determined by the FERC-approved OATT for the SPP.
Regional Transmission Organizations
AEGCo, APCo, I&M, KGPCo, KPCo and WPCo are members of PJM, and PSO and SWEPCo are members of SPP (both FERC-approved RTOs). RTOs operate, plan and control utility transmission assets in a manner designed to provide open access to such assets in a way that prevents discrimination between participants owning transmission assets and those that do not.
REGULATION
General
AEP’s vertically integrated public utility subsidiaries’ retail rates and certain other matters are subject to traditional cost-based regulation by the state utility commissions. AEP’s vertically integrated public utility subsidiaries are also subject to regulation by the FERC under the Federal Power Act with respect to wholesale power and transmission service transactions. I&M is subject to regulation by the NRC under the Atomic Energy Act of 1954, as amended, with respect to the operation of the Cook Plant. AEP and its vertically integrated public utility subsidiaries are also subject to the regulatory provisions of, much of the Energy Policy Act of 2005, which is administered by the FERC.
Rates
Historically, state utility commissions have established electric service rates on a cost-of-service basis, which is designed to allow a utility an opportunity to recover its cost of providing service and to earn a reasonable return on its investment used in providing that service. A utility’s cost of service generally reflects its operating expenses, including operation and maintenance expense, depreciation expense and taxes. State utility commissions periodically adjust rates pursuant to a review of: (a) a utility’s adjusted revenues and expenses during a defined test period and (b) such utility’s level of investment. Absent a legal limitation, such as a law limiting the frequency of rate changes or capping rates for a period of time, a state utility commission can review and change rates on its own initiative. Some states may initiate reviews at the request of a utility, customer, governmental or other representative of a group of customers. Such parties may, however, agree with one another not to request reviews of or changes to rates for a specified period of time.
Public utilities have traditionally financed capital investments until the new asset is placed in-service. Provided the asset was found to be a prudent investment, it was then added to rate base and entitled to a return through rate recovery. Given long lead times in construction, the high costs of plant and equipment and volatile capital markets, management actively pursues strategies to accelerate rate recognition of investments and cash flow. AEP representatives continue to engage state commissioners and legislators on alternative rate-making options to reduce regulatory lag and enhance certainty in the process. These options include pre-approvals, a return on construction work in progress, rider/trackers, formula rates and the inclusion of future test-year projections into rates.
The rates of AEP’s vertically integrated public utility subsidiaries are generally based on the cost of providing traditional bundled electric service (i.e., generation, transmission and distribution service). Historically, the state regulatory frameworks in the service area of the AEP vertically integrated public utility subsidiaries reflected specified fuel costs as part of bundled (or, more recently, unbundled) rates or incorporated fuel adjustment clauses in a utility’s rates and tariffs. Fuel adjustment clauses permit periodic adjustments to fuel cost recovery from customers and therefore provide protection against exposure to fuel cost changes.
The following state-by-state analysis summarizes the regulatory environment of certain major jurisdictions in which AEP’s vertically integrated public utility subsidiaries operate. Several public utility subsidiaries operate in more than one jurisdiction. See Note 4 - Rate Matters for more information regarding pending rate matters.
Arkansas
SWEPCo provides retail electric service in Arkansas at bundled rates approved by the APSC, with rates set on a historical cost-of-service basis and formula rates. Arkansas provides for timely fuel and purchased power cost recovery through respective annual fuel and purchased power recovery mechanisms.
Indiana
I&M provides retail electric service in Indiana at fully bundled rates approved by the IURC, with rates set on a forecasted cost-of-service basis. Indiana generally allows for timely recovery of fuel expenses through a fuel recovery surcharge mechanism. I&M is subject to a semi-annual Indiana jurisdictional earnings test.
Kentucky
KPCo provides retail electric service in Kentucky at bundled rates approved by the KPSC, with rates currently set on a historical cost-of-service basis. Kentucky generally allows for timely recovery of fuel expenses through a fuel recovery surcharge mechanism.
Louisiana
SWEPCo provides retail electric service in Louisiana at bundled rates approved by the LPSC with rates set on a historical cost-of-service basis and formula rates. Louisiana provides for timely fuel and purchased power cost recovery through respective fuel and purchased power recovery mechanisms updated monthly.
Michigan
I&M provides retail electric service in Michigan at both unbundled standard service and open access distribution service rates approved by the MPSC, with rates set on a forecasted cost-of-service basis. Open access distribution service is limited to 10% of I&M’s retail load. Michigan generally allows for timely recovery of fuel expenses, transmission expenses and purchased power expenses through a single surcharge mechanism.
Oklahoma
PSO provides retail electric service in Oklahoma at bundled rates approved by the OCC. PSO’s rates are set on a historical cost-of-service basis. Fuel and purchased energy costs are recovered through a fuel adjustment clause.
Tennessee
KGPCo currently provides retail electric service in Tennessee at bundled rates approved by the TPUC. Tennessee generally allows for timely recovery of fuel expenses and purchased power expenses through a surcharge mechanism.
Texas
SWEPCo provides retail electric service in Texas at bundled rates approved by the PUCT with rates set on a historical cost-of-service basis. Texas generally provides for timely fuel and purchased power cost recovery through respective fuel and purchased power recovery mechanisms.
Virginia
APCo currently provides retail electric service in Virginia at unbundled generation and distribution rates approved by the Virginia SCC. Virginia generally allows for timely recovery of fuel expenses through a fuel cost recovery surcharge mechanism. In addition to base rates and fuel cost recovery, APCo is permitted to recover transmission expenses provided at OATT rates based on rates established by the FERC. APCo is subject to a biennial Virginia retail generation and distribution earnings test.
West Virginia
APCo and WPCo provide retail electric service at bundled rates approved by the WVPSC with rates set on a combined APCo and WPCo cost-of-service basis. West Virginia generally allows for timely recovery of fuel expenses, purchased power expenses and transmission expenses through a single surcharge mechanism.
FERC
The FERC regulates rates for interstate power sales at wholesale, transmission of electric power, accounting and other matters, including construction and operation of hydroelectric projects. The FERC regulations require AEP’s vertically integrated public utility subsidiaries to provide open access transmission service at FERC-approved rates, and AEP has approved cost-based formula transmission rates on file at the FERC. The FERC also regulates unbundled transmission service to retail customers. In addition, the FERC regulates the sale of power for resale in interstate commerce by: (a) approving contracts for wholesale sales to municipal and cooperative utilities at cost-based rates and (b) granting authority to public utilities to sell power at wholesale at market-based rates upon a showing that the seller lacks the ability to improperly influence market prices. AEP’s vertically integrated public utility subsidiaries have market-based rate authority from the FERC, under which much of their wholesale marketing activity takes place. The FERC requires each public utility that owns or controls interstate transmission facilities, directly or through an RTO, to file an open access network and point-to-point transmission tariff that offers services comparable to the utility’s own uses of its transmission system. The FERC also requires all transmitting utilities, directly or through an RTO, to establish an Open Access Same-time Information System, which electronically posts transmission information such as available capacity and prices, and requires utilities to comply with Standards of Conduct that prohibit utilities’ transmission employees from providing non-public transmission information to the utility’s marketing employees. Additionally, the vertically integrated public utility subsidiaries are subject to mandatory reliability standards promulgated by the NERC, with the approval of the FERC, which standards protect the nation’s bulk power system against potential disruptions from cyber and physical security breaches.
The FERC oversees RTOs, entities created to operate, plan and control utility transmission assets. AEGCo, APCo, I&M, KGPCo, KPCo and WPCo are members of PJM. PSO and SWEPCo are members of SPP.
The FERC has jurisdiction over certain issuances of securities of most of AEP’s public utility subsidiaries, the acquisition of securities of utilities, the acquisition or sale of certain utility assets and mergers with another electric utility or holding company. In addition, both the FERC and state regulators are permitted to review the books and records of any company within a holding company system.
COMPETITION
AEP’s vertically integrated public utility subsidiaries primarily generate, transmit and distribute electricity to retail customers of AEP’s vertically integrated public utility subsidiaries in their service territories. These sales are made at rates approved by the state utility commissions of the states in which they operate, and in some instances, approved by the FERC, and are not subject to competition from other vertically integrated public utilities. Other than AEGCo, AEP’s vertically integrated public utility subsidiaries hold franchises or other rights that effectively grant the exclusive ability to provide electric service in various municipalities and regions in their service areas.
AEP’s vertically integrated public utility subsidiaries compete with self-generation and with distributors of other energy sources, such as natural gas, fuel oil, renewables and coal, within their service areas. The primary factors in such competition are price, reliability of service and the capability of customers to utilize alternative sources of energy other than electric power. With respect to competing generators and self-generation, the public utility subsidiaries of AEP believe that they currently maintain a competitive position.
TRANSMISSION AND DISTRIBUTION UTILITIES
GENERAL
This segment consists of the transmission and distribution of electricity for sale to retail and wholesale customers through assets owned and operated by AEP Texas and OPCo.
AEP’s transmission and distribution utility subsidiaries own and operate transmission and distribution lines and other facilities to deliver electric power. See Item 2 – Properties, for more information regarding the transmission and distribution lines. Transmission and distribution services are sold to retail customers of AEP’s transmission and distribution utility subsidiaries in their service territories. These sales are made at rates approved by the PUCT for AEP Texas and by the PUCO and the FERC for OPCo. The FERC regulates and approves the rates for wholesale transmission transactions. As discussed below, some transmission services also are separately sold to nonaffiliated companies.
AEP’s transmission and distribution utility subsidiaries hold franchises or other rights to provide electric service in various municipalities and regions in their service areas. In some cases, these franchises provide the utility with the exclusive right to provide electric service. These franchises have varying provisions and expiration dates. In general, the operating companies consider their franchises to be adequate for the conduct of their business.
The use and the recovery of costs associated with the transmission assets of the AEP transmission and distribution utility subsidiaries are subject to the rules, protocols and agreements in place with PJM and ERCOT, and as approved by the FERC. In addition to providing transmission services in connection with power sales in their service areas, AEP’s transmission and distribution utility subsidiaries also provide transmission services for nonaffiliated companies through RTOs.
Transmission Agreement
OPCo owns and operates transmission facilities that are used to provide transmission service under the PJM OATT; OPCo is a party to the TA with other utility subsidiary affiliates. The TA defines how the parties to the agreement share the revenues associated with their transmission facilities and the costs of transmission service provided by PJM. The TA has been approved by the FERC.
Regional Transmission Organizations
OPCo is a member of PJM, a FERC-approved RTO. RTOs operate, plan and control utility transmission assets to provide open access to such assets in a way that prevents discrimination between participants owning transmission assets and those that do not. AEP Texas is a member of ERCOT.
REGULATION
OPCo provides distribution and transmission services to retail customers within its service territory at cost-based rates approved by the PUCO or by the FERC. AEP Texas sets its rates through a combination of base rate cases and interim Transmission Cost of Services (TCOS) and Distribution Cost Recovery Factor (DCRF) filings. AEP Texas may file interim TCOS and DCRF filings semi-annually to update its rates to reflect changes in its net invested capital. Transmission and distribution rates are established on a cost-of-service basis, which is designed to allow a utility an opportunity to recover its cost of providing service and to earn a reasonable return on its investment used in providing that service. The cost-of-service generally reflects operating expenses, including operation and maintenance expense, depreciation expense and taxes. Utility commissions periodically adjust rates pursuant to a review of: (a) a utility’s adjusted revenues and expenses during a defined test period and (b) such utility’s level of investment.
FERC
The FERC regulates rates for transmission of electric power, accounting and other matters. The FERC regulations require AEP to provide open access transmission service at FERC-approved rates, and it has approved cost-based formula transmission rates on file at the FERC. The FERC also regulates unbundled transmission service to retail customers. The FERC requires each public utility that owns or controls interstate transmission facilities to, directly or through an RTO, file an open access network and point-to-point transmission tariff that offers services comparable to the utility’s own uses of its transmission system. The FERC also requires all transmitting utilities, directly or through an RTO, to establish an Open Access Same-time Information System, which electronically posts transmission information such as available capacity and prices, and requires utilities to comply with Standards of Conduct that prohibit utilities’ transmission employees from providing non-public transmission information to the utility’s marketing employees. In addition, both the FERC and state regulators are permitted to review the
books and records of any company within a holding company system. Additionally, the transmission and distribution utility subsidiaries are subject to mandatory reliability standards as set forth by the NERC, with the approval of the FERC, which standards protect the nation’s bulk power system against potential disruptions from cyber and physical security breaches.
AEP TRANSMISSION HOLDCO
GENERAL
AEPTHCo is a holding company for (a) AEPTCo, which is the direct holding company for the State Transcos and (b) AEP’s Transmission Joint Ventures.
AEPTCo
AEPTCo wholly owns the State Transcos which are independent of, but respectively overlay, the following AEP electric utility operating companies: APCo, I&M, KPCo, OPCo, PSO, SWEPCo and WPCo. The State Transcos develop, own, operate and maintain their respective transmission assets. Individual State Transcos (a) have obtained the approvals necessary to operate in Indiana, Kentucky, Michigan, Ohio, Oklahoma and West Virginia, subject to any applicable siting requirements, (b) are authorized to submit projects for commission approval in Virginia and (c) have been granted consent to enter into a joint license agreement that will support investment in Tennessee. Assets of the State Transcos interconnect to transmission facilities owned by the aforementioned operating companies and nonaffiliated transmission owners within the footprints of PJM, MISO and SPP. APTCo, IMTCo, KTCo, OHTCo and WVTCo are located within PJM. IMTCo also owns portions of the Greentown station assets located in MISO. OKTCo and SWTCo are located within SPP. SWTCo does not currently own or operate transmission assets.
The State Transcos own, operate, maintain and invest in transmission infrastructure in order to maintain and enhance system integrity and grid reliability, grid security, safety, reduce transmission constraints and facilitate interconnections of new generating resources and new wholesale customers, as well as enhance competitive wholesale electricity markets. A key part of AEP’s business is replacing and upgrading transmission facilities, assets and components of the existing AEP System as needed to maintain reliability. As of December 31, 2024, the State Transcos had $15.4 billion of transmission and other assets in-service, excluding CWIP, with plans to construct approximately $4.7 billion of additional transmission assets through 2027.
In January 2025, AEP announced a partnership between nonaffiliated entities to acquire a 19.9% noncontrolling interest in OHTCo and IMTCo for $2.82 billion. The transaction is subject to FERC approval and clearance from the Committee on Foreign Investment in the United States. See “Noncontrolling Interest in OHTCo and IMTCo” section of Note 21 for additional information.
AEPTHCO JOINT VENTURE INITIATIVES
AEP has established joint ventures with nonaffiliated electric utility companies for the purpose of developing, building and owning transmission assets that seek to improve reliability and market efficiency and provide transmission access to remote generation sources in North America (Transmission Joint Ventures). The Transmission Joint Ventures currently include:
| | | | | | | | | | | | | | | | | | | | | | | | | | | | | | | | | | | | | | |
| Joint Venture Name | | Location | | Projected or Actual Completion Date | | Owners
(Ownership %) | | Total Estimated/Actual Project Costs at Completion | | | Approved Return on Equity | |
| | | | | | | | | (in millions) | | | | |
| ETT | | Texas | | (a) | | BHE (50%) | | $ | 5,000.0 | | (a) | | 9.6 | % | |
| | | (ERCOT) | | | | AEP (50%) | | | | | | |
| | | | | | | | | | | | |
| Prairie Wind | | Kansas | | 2014 | | Evergy, Inc. (50%) | | 158.0 | | | | 12.8 | % | |
| | | | | | BHE (25%) | | | | | | |
| | | | | | AEP (25%) | | | | | | |
| | | | | | | | | | | | |
| Pioneer | | Indiana | | 2018 | | John Lainge (50%) | | 191.0 | | | | 10.48 | % | (b) |
| | | | | | | AEP (50%) | | | | | | |
| | | | | | | | | | | | |
| Transource | | Missouri | | 2016 | | Evergy, Inc. (13.5%) (d) | | 310.1 | | | | 11.1 | % | (c) |
| Missouri | | | | | | AEP (86.5%) (d) | | | | | | |
| | | | | | | | | | | | |
| Transource | | West | | 2019 | | Evergy, Inc. (13.5%) (d) | | 84.3 | | | | 10.5 | % | |
| West Virginia | | Virginia | | | | AEP (86.5%) (d) | | | | | | |
| | | | | | | | | | | | |
| Transource | | Maryland | | (e) | | Evergy, Inc. (13.5%) (d) | | 27.6 | | (e) | | 10.4 | % | |
| Maryland | | | | | | AEP (86.5%) (d) | | | | | | |
| | | | | | | | | | | | |
| Transource | | Pennsylvania | | (e) | | Evergy, Inc. (13.5%) (d) | | 243.6 | | (e) | | 10.4 | % | |
| Pennsylvania | | | | | | AEP (86.5%) (d) | | | | | | |
| | | | | | | | | | | | |
| Transource | | Oklahoma | | 2025 | | Evergy, Inc. (13.5%) (d) | | 131.2 | (f) | | 10.3 | % | |
| Oklahoma | | | | | | AEP (86.5%) (d) | | | | | | |
| | | | | | | | | | | | |
| Transource | | Pennsylvania | | 2027 | | Evergy, Inc. (13.5%) (d) | | 148.1 | | (g) | | 10.4 | % | |
| Pennsylvania | | | | | | AEP (86.5%) (d) | | | | | | |
(a)ETT is undertaking multiple projects and the completion dates will vary for those projects. ETT’s investment in completed and active projects in ERCOT is expected to be $5.0 billion by 2030. Future projects will be evaluated on a case-by-case basis.
(b)In May 2020, Pioneer received FERC approval authorizing an ROE of 10.02% (10.52% inclusive of the RTO incentive adder of 0.5%). In October 2024, the FERC issued an order reducing the base ROE for MISO Transmission Owners to 9.98% (10.48% inclusive of the RTO incentive adder of 0.5%).
(c)The ROE represents the weighted-average approved ROE based on the costs of two projects developed by Transource Missouri; the $64 million Iatan-Nashua project (10.3%) and the $246 million Sibley-Nebraska City project (11.3%).
(d)AEP owns 86.5% of Transource Missouri, Transource West Virginia, Transource Maryland, Transource Pennsylvania and Transource Oklahoma through its ownership interest in Transource Energy, LLC (Transource). Transource is a joint venture between AEPTHCo and Evergy, Inc. formed to pursue competitive transmission projects. AEPTHCo and Evergy, Inc. own 86.5% and 13.5% of Transource, respectively.
(e)See “Independence Energy Connection Project” section of Note 4 for additional information.
(f)In 2016, Transource Kansas received approval from the FERC authorizing an ROE of 9.8% (10.3% inclusive of the RTO incentive adder of 0.5%) for future competitive transmission projects in SPP. In October 2020, Transource was awarded the Sooner-Wekiwa project by SPP and the project was assigned to Transource Kansas. In November 2020, Transource Kansas was renamed Transource Oklahoma. The project is expected to go in-service in November 2025.
(g)In October 2022, Transource Energy’s North Delta A proposal was awarded by the New Jersey Board of Public Utilities. In December 2023, the North Delta project was expanded with additional scope and approved by the PJM Board of Managers. The project was renamed Bramah Station and is expected to go in-service in 2027. The project was originally expected to go in-service in 2029.
Transource Energy, and its subsidiaries Transource Missouri, Transource West Virginia, Transource Maryland, Transource Pennsylvania and Transource Oklahoma are consolidated joint ventures by AEP. All other joint ventures in the table above are not consolidated by AEP. AEP’s joint ventures do not have employees. Business services for the joint ventures are provided by AEPSC and other AEP subsidiaries and the joint venture partners. In 2024, approximately 502 AEPSC employees and 302 operating company employees provided service to one or more joint ventures.
REGULATION
The State Transcos and the Transmission Joint Ventures located outside of ERCOT establish transmission rates annually through forward-looking formula rate filings with the FERC pursuant to FERC-approved implementation protocols. The protocols include a transparent, formal review process to ensure the updated transmission rates are prudently-incurred and reasonably calculated.
The State Transcos’ and the Transmission Joint Ventures’ (where applicable) rates are included in the respective OATT for PJM and SPP. An OATT is the FERC rate schedule that provides the terms and conditions for transmission and related services on a transmission provider’s transmission system. The FERC requires transmission providers such as PJM and SPP to offer transmission service to all eligible customers (for example, load-serving entities, power marketers, generators and customers) on a non-discriminatory basis.
The FERC-approved formula rates establish the annual transmission revenue requirement (ATRR) and transmission service rates for transmission owners in annual rate base filings with the FERC. The formula rates establish rates for a one-year period based on the current projects in-service and proposed projects for a defined timeframe. The formula rates also include a true-up calculation for the previous year’s billings, allowing for over/under-recovery of the transmission owner’s ATRR. PJM and SPP pay the transmission owners their ATRR for use of their facilities and bill transmission customers taking service under the PJM and SPP OATTs, based on the terms and conditions in the respective OATT for the service taken. Additionally, the State Transcos are subject to mandatory reliability standards promulgated by the NERC, with the approval of the FERC, which standards protect the nation’s bulk power system against potential disruptions from cyber and physical security breaches. Management monitors pending matters before the FERC, including inquiries and challenges related to ROEs and transmission formula rates, that have the potential to reduce AEP’s future transmission formula rates and/or the transmission ROE methodology.
In the annual formula rate filings described above, the State Transcos in aggregate filed formula rate base totals of $11.4 billion, $10.7 billion and $9.9 billion for 2024, 2023 and 2022, respectively. The total filed transmission revenue requirements, including prior year over/under-recovery of revenue and associated carrying charges were $1.9 billion, $1.8 billion and $1.7 billion for 2024, 2023 and 2022, respectively.
The rates of ETT, which is located in ERCOT, are determined by the PUCT. ETT sets its rates through a combination of base rate cases and interim Transmission Cost of Services (TCOS) filings. ETT may file interim TCOS filings semi-annually to update its rates to reflect changes in its net invested capital.
GENERATION & MARKETING
GENERAL
The AEP Generation & Marketing segment consists of a retail supply business, a wholesale energy trading and marketing business and the rights to Cardinal Plant Unit 1’s power and capacity through 2028. AEP Generation & Marketing previously included AEP OnSite Partners prior to its sale in September 2024 and AEP Renewables prior to its sale in August 2023.
The retail energy supply business provides electricity and/or natural gas to residential, commercial and industrial customers in Illinois, Pennsylvania, Delaware, Maryland, New Jersey, Ohio and Washington, D.C. AEP Energy had approximately 987,000 customer accounts as of December 31, 2024.
The wholesale trading and marketing business transacts within RTOs to provide supply to customers, manage pricing risk or otherwise provide service to fulfill contractual obligations. Additionally in certain instances this business procures physical electricity from identified sources, including renewable generation, when providing service to customers. When adapting to meet the demands of customers’ changing needs or in response to changing circumstances of electricity markets and generation sources, this business executes transactions and modifies contracts as applicable to maximize value and mitigate pricing and delivery risk when fulfilling contractual obligations to its customers.
This segment also includes rights to Cardinal Plant Unit 1’s power and capacity through 2028 through a PPA with a nonaffiliated electric cooperative.
COMPETITION
The AEP Generation & Marketing segment subsidiaries face competition for the sale of available power, capacity and ancillary services. The principal factors of impact are electricity and fuel prices, new market entrants, construction or retirement of generating assets by others and technological advances in power generation. Other factors impacting competitiveness include environmental regulation, transmission congestion or transportation constraints at or near generation facilities, inoperability or inefficiencies, outages and deactivations and retirements at generation facilities. Technology advancements, increased demand for clean energy, changing consumer behaviors, low-priced and abundant natural gas, and regulatory and public policy reforms are among the catalysts for transformation within the industry that impact competition for AEP’s Generation & Marketing segment.
AEP Generation & Marketing’s retail energy supply business operates in jurisdictions that each establish laws and regulations governing its competitive market, and public utility commission communications and utility default service pricing can affect customer participation in retail competition. Severe load and market volatility, sustained low market volatility and maturing competitive environments can adversely affect this business.
Counterparty Risk Management
Counterparties and exchanges may require cash or cash related instruments to be deposited on these transactions as margin against open positions. As of December 31, 2024, counterparties posted approximately $156 million in cash, cash equivalents or letters of credit with AEP for the benefit of AEP’s Generation & Marketing segment subsidiaries (while, as of that date, AEP’s Generation & Marketing segment subsidiaries posted approximately $153 million with counterparties and exchanges). Since open trading contracts are valued based on market prices of various commodities, exposures change daily. See the “Quantitative and Qualitative Disclosures About Market Risk” section of Management’s Discussion and Analysis of Financial Condition and Results of Operations for additional information.
INFORMATION ABOUT OUR EXECUTIVE OFFICERS
The following persons are executive officers of AEP. Their ages are given as of February 13, 2025. The officers are appointed annually for a one-year term by the board of directors of AEP.
William J. Fehrman
President, Chief Executive Officer and Director
Age 64
President, Chief Executive Officer and Director since August 2024. President and Chief Executive Office of Centuri Holdings, Inc. from January 2024 to July 2024. President, Chief Executive Officer and Director of Berkshire Hathaway Energy Company from 2018 to 2023.
David M. Feinberg
Executive Vice President, General Counsel and Secretary
Age 55
Executive Vice President since January 2013. General Counsel and Secretary since January 2012.
Kelly J. Ferneau
Executive Vice President and Chief Nuclear Officer
Age 56
Executive Vice President and Chief Nuclear Officer since November 2024. I&M Site Vice President-Donald C. Cook Plant from July 2022 to October 2024. I&M Plant Manager from 2018 to June 2022.
Q. Shane Lies
Executive Vice President - Projects and Services
Age 54
Executive Vice President - Projects and Services since November 2024. Executive Vice President and Chief Nuclear Officer from September 2024 to November 2024. Senior Vice President and Chief Nuclear Officer from July 2022 to September 2024. I&M Site Vice President-Donald C. Cook Plant from January 2016 to July 2022.
Trevor I. Mihalik
Executive Vice President and Chief Financial Officer
Age 58
Executive Vice President and Chief Financial Officer since January 2025. Executive Vice President and Group President of Sempra from January 2024 to January 2025. Executive Vice President and Chief Financial Officer of Sempra from 2018 to 2023. Senior Vice President-Controller and Chief Accounting Officer of Sempra from 2012 to 2018.
Therace M. Risch
Executive Vice President and Chief Information & Technology Officer
Age 51
Executive Vice President since July 2021. Chief Information & Technology Officer since April 2020. Senior Vice President from April 2020 to July 2021. Executive Vice President, Chief Information Officer of JCPenney from December 2015 to April 2020.
Antonio P. Smyth
Executive Vice President - Grid Solutions
Age 48
Executive Vice President - Grid Solutions since December 2024. Executive Vice President - Grid Solutions & Government Affairs from April 2023 to December 2024. Senior Vice President - Grid Solutions from January 2021 to April 2023. Senior Vice President - Transmission Ventures, Strategy & Policy from October 2018 to December 2020.
Phillip R. Ulrich
Executive Vice President and Chief Human Resources Officer
Age 54
Executive Vice President since January 2023. Chief Human Resources Officer since August 2021. Senior Vice President from August 2021 to December 2022. Chief Human Resources Officer of Flex, LTD from May 2019 to July 2021.
ITEM 1A. RISK FACTORS
GENERAL RISKS OF REGULATED OPERATIONS
AEP may not be able to recover the costs of substantial planned investment in capital improvements and additions. (Applies to all Registrants)
AEP’s business plan calls for extensive investment in capital improvements and additions, including the construction or acquisition of additional transmission and generation facilities, modernizing existing infrastructure, installation of environmental upgrades and retrofits as well as other initiatives. AEP’s public utility subsidiaries currently provide service at rates approved by one or more regulatory commissions. If these regulatory commissions do not approve adjustments to the rates charged, affected AEP subsidiaries would not be able to recover the costs associated with their investments. This would cause financial results to be diminished.
Regulated electric revenues and earnings are dependent on federal and state regulation that may limit AEP’s ability to recover costs and other amounts. (Applies to all Registrants)
The rates customers pay to AEP regulated utility businesses are subject to approval by the FERC and the respective state utility commissions of Arkansas, Indiana, Kentucky, Louisiana, Michigan, Ohio, Oklahoma, Tennessee, Texas, Virginia and West Virginia. In certain instances, AEP’s applicable regulated utility businesses may agree to negotiated settlements related to various rate matters that are subject to regulatory approval. AEP cannot predict the ultimate outcomes of any settlements or the actions by the FERC or the respective state commissions in establishing rates.
If regulated utility earnings exceed the returns established by the relevant commissions, retail electric rates may be subject to review and possible reduction by the commissions, which may decrease future earnings. Additionally, if regulatory bodies do not allow recovery of costs incurred in providing service on a timely basis, it could reduce future net income and cash flows and negatively impact financial condition. Similarly, if recovery or other rate relief authorized in the past is overturned or reversed on appeal, future earnings could be negatively impacted. Any legislation, regulatory action or litigation outcome that triggers a reversal of a regulatory asset or deferred cost generally results in an impairment to the balance sheet and a charge to the income statement of the company involved. New legislation could be adopted in any of the states in which we operate that could alter the regulatory framework and prevent us from getting timely recovery of our costs and investments.
In addition, regulators have initiated and may initiate additional proceedings to investigate the prudence of costs in the AEP regulated utility businesses and in base rates and examine, among other things, the reasonableness or prudence of operation and maintenance practices, level of expenditures (including storm costs and costs associated with capital projects), allowed rates of return and rate base, proposed resource acquisitions and previously incurred capital expenditures that the regulated utility businesses seek to place in rates. The regulators may disallow costs subject to their jurisdiction found not to have been prudently incurred or found not to have been incurred in compliance with applicable tariffs, creating some risk to the ultimate recovery of those costs. Regulatory proceedings relating to rates and other matters typically involve multiple parties seeking to limit or reduce rates. Traditional base rate proceedings, as opposed to formula rate plans, generally have long timelines, are primarily based on historical costs and may or may not be limited in scope or duration by statute. The length of these base rate proceedings can cause the regulated utility businesses to experience regulatory lag in recovering costs through rates, such that they may not fully recover all costs during the rate effective period and may, therefore, earn less than their allowed returns. Decisions are typically subject to appeal, further exacerbating the regulatory lag and leading to additional uncertainty associated with rate case proceedings.
The AEP regulated utility businesses have large customer and stakeholder bases and, as a result, could be the subject of public criticism or adverse publicity focused on issues including the operation and maintenance of their assets and infrastructure, their preparedness for major storms or other extreme weather events and/or the time it takes to restore service after such events, or the quality of their service or the reasonableness of the cost of their service. Criticism or adverse publicity of this nature could render legislatures and other governing bodies, public service commissions and other regulatory authorities, and government officials less likely to view the applicable operating company in a favorable light and could potentially negatively affect legislative or regulatory processes or outcomes, as well as lead to increased regulatory oversight or more stringent legislative or regulatory requirements or other legislation or regulatory actions that adversely affect the regulated utility businesses.
The regulated utility businesses, and the energy industry as a whole, have experienced a period of rising costs and investments and an upward trend in spending, especially with respect to infrastructure investments, which is likely to continue in the foreseeable future and could result in more frequent rate cases and requests for, and the continuation of, cost recovery mechanisms, all of which could face resistance from customers and other stakeholders especially in a rising cost environment, whether due to inflation, tariffs, high fuel prices or otherwise, and/or in periods of economic decline or hardship. Significant
increases in costs could increase financing needs and otherwise adversely affect AEP’s business, financial position, results of operation or cash flows. See Note 4 – Rate Matters for additional information.
AEP’s transmission investment strategy and execution are dependent on federal and state regulatory policy. (Applies to all Registrants)
A significant portion of AEP’s earnings is derived from transmission investments and activities. FERC policy currently favors the expansion and updating of the transmission infrastructure within its jurisdiction. If the FERC were to adopt a different policy, if states were to limit or restrict such policies, or if transmission needs do not continue or develop as projected, AEP’s strategy of investing in transmission could be impacted. Management believes AEP’s experience with transmission facilities construction and operation gives AEP an advantage over other competitors in securing authorization to install, construct and operate new transmission lines and facilities. However, there can be no assurance that PJM, SPP, ERCOT or other RTOs will authorize new transmission projects or will award such projects to AEP.
Certain elements of AEP’s transmission formula rates have been challenged, which could result in lowered rates and/or refunds of amounts previously collected and thus have an adverse effect on AEP’s business, financial condition, results of operations and cash flows. (Applies to all Registrants other than AEP Texas)
AEP provides transmission service under rates regulated by the FERC. The FERC has approved the cost-based formula rate templates used by AEP to calculate its respective annual revenue requirements, but it has not expressly approved the amount of actual capital and operating expenditures to be used in the formula rates. All aspects of AEP’s rates accepted or approved by the FERC, including the formula rate templates, the rates of return on the actual equity portion of its respective capital structures and the approved targeted capital structures, are subject to challenge by interested parties at the FERC, or by the FERC on its own initiative. In addition, interested parties may challenge the annual implementation and calculation by AEP of its projected rates and formula rate true-up pursuant to its approved formula rate templates under AEP’s formula rate implementation protocols. If a challenger can establish that any of these aspects are unjust, unreasonable, unduly discriminatory or preferential, then the FERC can make appropriate prospective adjustments to them and/or disallow any of AEP’s inclusion of those aspects in the rate setting formula.
Inquiries related to rates of return, as well as challenges to the formula rates of other utilities, are ongoing in other proceedings at the FERC. The results of these proceedings could potentially negatively impact AEP in any future challenges to AEP’s formula rates. If the FERC orders revenue reductions, including refunds, in any future cases related to its formula rates, it could reduce future net income and cash flows and impact financial condition.
End-use consumers and entities supplying electricity to end-use consumers may also attempt to influence government and/or regulators to change the rate setting methodologies that apply to AEP, particularly if rates for delivered electricity increase substantially.
AEP faces risks related to project siting, financing, construction, permitting, governmental approvals and the negotiation of project development agreements that may impede their development and operating activities. (Applies to all Registrants)
AEP owns, develops, constructs, manages and operates electric generation, transmission and distribution facilities. A key component of AEP's growth is its ability to construct and operate these facilities. As part of these operations AEP must periodically apply for licenses and permits from various local, state, federal and other regulatory authorities and abide by their respective conditions. Should AEP be unsuccessful in obtaining necessary licenses or permits on acceptable terms or resolving third-party challenges to such licenses or permits, should there be a delay in obtaining or renewing necessary licenses or permits or should regulatory authorities initiate any associated investigations or enforcement actions or impose related penalties or disallowances, it could reduce future net income and cash flows and impact financial condition. Any failure to negotiate successful project development agreements for new facilities with third-parties could have similar results.
Changes in technology and regulatory policies may lower the value of electric utility facilities and franchises. (Applies to all Registrants)
AEP primarily generates electricity at large central facilities and delivers that electricity to customers over its transmission and distribution facilities to customers usually situated within an exclusive franchise. This method results in economies of scale and generally lower costs than newer technologies such as fuel cells and microturbines, and distributed generation using either new or existing technology. Other technologies, such as light emitting diodes (LEDs), increase the efficiency of electricity and, as a result, lower the demand for it. Changes in regulatory policies and advances in batteries or energy storage, wind turbines, small
modular reactors and photovoltaic solar cells are reducing costs of new technology to levels that are making them competitive with some central station electricity production and delivery. These developments can challenge AEP’s competitive ability to maintain relatively low cost, efficient and reliable operations, to establish fair regulatory mechanisms and to provide cost-effective programs and services to customers. Further, in the event that alternative generation resources are mandated, subsidized or encouraged through legislation or regulation or otherwise are economically competitive and added to the available generation supply, such resources could displace a higher marginal cost generating units, which could reduce the price at which market participants sell their electricity.
AEP may not recover costs incurred to begin construction on projects that are canceled. (Applies to all Registrants)
AEP’s business plan for the construction of new projects, including providing service to new large load customers, involves a number of risks, including incomplete or inaccurate forecasting, planning and procurement, construction delays, non-performance by equipment and other third-party suppliers and increases in equipment and labor costs. To limit the risks of these construction projects, AEP’s subsidiaries enter into interconnection and service agreements, equipment purchase orders and construction contracts and incur engineering and design service costs in advance of receiving necessary regulatory approvals, cost recovery and/or siting or environmental permits. If any of these projects are canceled for any reason, including shifts in large customer needs, preferences or financial stability, failure to receive necessary regulatory approvals, cost recovery and/or siting or environmental permits, significant unrecoverable costs or cancellation penalties under the equipment purchase orders and construction contracts could occur. In addition, if any construction work or investments have been recorded as an asset, an impairment may need to be recorded in the event the project is canceled.
AEP is exposed to nuclear generation risk. (Applies to AEP and I&M)
I&M owns the Cook Plant, which consists of two nuclear generating units for a rated capacity of 2,296 MWs, or about a tenth of the regulated generating capacity in the AEP System as of December 31, 2024. AEP and I&M are, therefore, subject to the risks of nuclear generation, which include the following:
•The potential harmful effects on the environment and human health due to an adverse incident/event resulting from the operation of nuclear facilities and the storage, handling and disposal of radioactive materials such as SNF.
•Limitations on the amounts and types of insurance commercially available to cover losses that might arise in connection with nuclear operations.
•Uncertainties with respect to contingencies and assessment amounts triggered by a loss event (federal law requires owners of nuclear units to purchase the maximum available amount of nuclear liability insurance unless the NRC specifies a lesser amount and potentially contribute to the coverage for losses of others).
•Uncertainties with respect to the technological and financial aspects of decommissioning nuclear plants at the end of their licensed lives.
There can be no assurance that I&M’s preparations or risk mitigation measures will be adequate if these risks are triggered.
The NRC has broad authority under federal law to impose licensing and safety-related requirements for the operation of nuclear generation facilities. In the event of non-compliance, the NRC has the authority to impose fines or shut down a unit, or both, depending upon its assessment of the severity of the situation, until compliance is achieved. Revised safety requirements promulgated by the NRC could necessitate substantial capital expenditures at nuclear plants. In addition, although management has no reason to anticipate a serious nuclear incident at the Cook Plant, if an incident did occur, it could harm results of operations or financial condition. A major incident at a nuclear facility anywhere in the world could cause the NRC to limit or prohibit the operation or licensing of any domestic nuclear unit. Moreover, a major incident at any nuclear facility in the U.S. could require AEP or I&M to make material contributory payments.
Costs associated with the operation (including fuel), maintenance and retirement of nuclear plants continue to be more significant and less predictable than costs associated with other sources of generation, in large part due to changing regulatory requirements and safety standards, availability of nuclear waste disposal facilities and experience gained in the operation of nuclear facilities. Costs also may include replacement power, any unamortized investment at the end of the useful life of the Cook Plant (whether scheduled or premature), the carrying costs of that investment and retirement costs. The ability to obtain adequate and timely recovery of costs associated with the Cook Plant is not assured.
AEP subsidiaries are exposed to risks through participation in the market and transmission structures in various regional power markets that are beyond their control. (Applies to all Registrants)
Results are likely to be affected by differences in the market and transmission structures in various regional power markets. The rules governing the various RTOs, including SPP and PJM, may also change from time to time which could affect costs or revenues. Existing, new or changed rules of these RTOs could result in significant additional fees and increased costs to participate in those structures, including the cost of transmission facilities built by others due to changes in transmission rate design. In addition, these RTOs may assess costs resulting from improved transmission reliability, reduced transmission congestion and firm transmission rights. As members of these RTOs, AEP’s subsidiaries are subject to certain additional risks, including the allocation among existing members, of losses caused by unreimbursed defaults of other participants in these markets and resolution of complaint cases that may seek refunds of revenues previously earned by members of these markets.
AEP could be subject to higher costs and/or penalties related to mandatory reliability standards. (Applies to all Registrants)
Owners and operators of the bulk power transmission system are subject to mandatory reliability standards promulgated by the NERC and enforced by the FERC. The standards are based on the functions that need to be performed to ensure the bulk power system operates reliably and are guided by reliability and market interface principles. Compliance with new reliability standards may subject AEP to higher operating costs and/or increased capital expenditures. While management expects to recover costs and expenditures from customers through regulated rates, there can be no assurance that the applicable commissions will approve full recovery in a timely manner. If AEP were found not to be in compliance with the mandatory reliability standards, AEP could be subject to sanctions, including substantial monetary penalties, which likely would not be recoverable from customers through regulated rates.
A substantial portion of the receivables of AEP Texas is concentrated in a small number of REPs, and any delay or default in payment could adversely affect its cash flows, financial condition and results of operations. (Applies to AEP and AEP Texas)
AEP Texas collects receivables from the distribution of electricity from REPs that supply the electricity it distributes to its customers. As of December 31, 2024, AEP Texas did business with approximately 135 REPs. Adverse economic conditions, structural problems in the market served by ERCOT or financial difficulties of one or more REPs could impair the ability of these REPs to pay for these services or could cause them to delay such payments. AEP Texas depends on these REPs to remit payments on a timely basis. Applicable regulatory provisions require that customers be shifted to another REP or a provider of last resort if a REP cannot make timely payments. Applicable PUCT regulations significantly limit the extent to which AEP Texas can apply normal commercial terms or otherwise seek credit protection from firms desiring to provide retail electric service in its service territory, and AEP Texas thus remains at risk for payments related to services provided prior to the shift to another REP or the provider of last resort. In 2024, AEP Texas’ two largest REPs accounted for 40% of its operating revenue. Any delay or default in payment by REPs could adversely affect cash flows, financial condition and results of operations. If a REP were unable to meet its obligations, it could consider, among various options, restructuring under the bankruptcy laws, in which event such REP might seek to avoid honoring its obligations, and claims might be made by creditors involving payments AEP Texas had received from such REP.
RISKS RELATED TO MARKET, ECONOMIC OR FINANCIAL VOLATILITY AND OTHER RISKS
AEP’s financial performance may be adversely affected if AEP is unable to successfully operate facilities or perform certain corporate functions. (Applies to all Registrants)
Performance is highly dependent on the successful operation of generation, transmission and/or distribution facilities. Operating these facilities involves many risks, including:
•Operator error and breakdown or failure of equipment or processes.
•Operating limitations that may be imposed by environmental or other regulatory requirements.
•Labor disputes.
•Compliance with mandatory reliability standards, including mandatory cybersecurity standards.
•Information technology failure, including failure of artificial intelligence technology, that impairs AEP’s information technology infrastructure or disrupts normal business operations.
•Information technology failure that affects AEP’s ability to access customer information or causes loss of confidential or proprietary data that materially and adversely affects AEP’s reputation or exposes AEP to legal claims.
•Supply chain disruptions and inflation.
•Fuel or water supply interruptions caused by transportation constraints, adverse weather such as drought, non-performance by suppliers and other factors.
•Catastrophic events such as fires, earthquakes, explosions, hurricanes, tornadoes, ice storms, terrorism (including cyber-terrorism), floods or other similar occurrences.
•Fuel costs and related requirements triggered by financial stress in the coal industry.
Physical attacks or hostile cyber intrusions could severely impair operations, lead to the disclosure of confidential information and damage AEP’s reputation. (Applies to all Registrants)
AEP and its regulated utility businesses face physical security and cybersecurity risks as the owner-operators of generation, transmission and/or distribution facilities and as participants in commodities trading. AEP and its regulated utility businesses own assets deemed as critical infrastructure, the operation of which is dependent on information technology systems. Further, the computer systems that run these facilities are not completely isolated from external networks. Parties that wish to disrupt the U.S. bulk power system or AEP operations could view these computer systems, software or networks as targets for cyber-attack. The Federal government has notified the owners and operators of critical infrastructure, such as AEP, that the conflict between Russia and Ukraine has increased the likelihood of a cyber-attack on such systems. In addition, the electric utility business requires the collection of sensitive customer data, as well as confidential employee and shareholder information, which is subject to electronic theft or loss.
A security breach of AEP or its regulated utility businesses’ physical assets or information systems, interconnected entities in RTOs, or regulators could impact the operation of the generation fleet and/or reliability of the transmission and distribution system. AEP and its regulated utility businesses could be subject to financial harm associated with ransomware theft or inappropriate release of certain types of information, including sensitive customer, vendor, employee, trading or other confidential data. A successful cyber-attack on the systems that control generation, transmission, distribution or other assets could severely disrupt business operations, preventing service to customers or collection of revenues. The breach of certain business systems could affect the ability to correctly record, process and report financial information. A major cyber incident could result in significant expenses to investigate and repair security breaches or system damage and could lead to litigation, fines, other remedial action, heightened regulatory scrutiny and damage to AEP’s reputation. In addition, the misappropriation, corruption or loss of personally identifiable information and other confidential data could lead to significant breach notification expenses and mitigation expenses such as credit monitoring.
AEP and its third-party vendors have been subject, and will likely continue to be subject, to attempts to gain unauthorized access to their technology systems and confidential data or to attempts to disrupt utility and related business operations. While there have been immaterial incidents of phishing, unauthorized access to technology systems, financial fraud and disruption of remote access across the AEP subsidiaries, there has been no material impact on business or operations from these attacks to date. Similarly, some of AEP’s third-party vendors have experienced cybersecurity incidents, though such incidents have not, to AEP’s knowledge, resulted in a material impact to AEP to date. However, AEP cannot guarantee that security efforts will detect or prevent future breaches, operational incidents, or other breakdowns of technology systems and network infrastructure and cannot provide any assurance that such incidents will not have a material adverse effect in the future. While AEP maintains insurance relating to cybersecurity events, such insurance is subject to a number of exclusions and may be insufficient to offset any losses, costs or damages experienced. Also, the market for cybersecurity insurance is relatively new and coverage available for cybersecurity events is evolving as the industry matures.
AEP is subject to standards enacted by the North American Electric Reliability Corporation and enforced by FERC regarding protection of critical infrastructure assets required for operating North America's bulk electric system. While AEP believes it is in compliance with such standards and regulations, AEP has been, and may in the future be, found to be in violation of such standards and regulations. To date, such violations have not resulted in material financial penalties; however, management can give no assurance that compliance efforts will not result in material penalties in the future. In addition, compliance with or changes in the applicable standards and regulations may subject AEP to higher operating costs and/or increased capital expenditures as well as substantial fines for non-compliance.
The failure of AEP or third-party vendor information technology systems, or the failure to enhance existing information technology systems and implement new technology, could adversely affect AEP. (Applies to all Registrants)
AEP’s operations are dependent upon the proper functioning of its internal systems, including the information technology systems that support our underlying business processes. Any significant failure or malfunction of such information technology systems may result in disruptions of our operations. In the ordinary course of business, we rely on information technology systems, including the internet and third-party hosted services, to support a variety of business processes and activities and to store sensitive data, including (i) intellectual property, (ii) proprietary business information, (iii) personally identifiable information of our customers, employees, retirees and shareholders and (iv) data with respect to invoicing and the collection of
payments, accounting, procurement and supply chain activities. Our information technology systems are dependent upon global communications and cloud service providers, as well as their respective vendors, many of whom have at some point experienced significant system failures and outages in the past and may experience such failures and outages in the future. These providers’ systems are susceptible to cybersecurity and data breaches, outages from fire, floods, power loss, telecommunications failures, break-ins and similar events. Failure to prevent or mitigate data loss from system failures or outages could materially affect AEP’s results of operations, financial position and cash flows.
The amount of taxes imposed on AEP could change. (Applies to all Registrants)
AEP is subject to income taxation at the federal level and by certain states and municipalities. In determining AEP’s income tax liability for these jurisdictions, management monitors changes to the applicable tax laws and related regulations, including tax incentives and credits designed to support the sale of energy from utility scale renewable energy facilities. While management believes AEP complies with current prevailing laws, one or more taxing jurisdictions could seek to impose incremental or new taxes on the company. At the Federal level, management is monitoring the potential for changes in current tax policy, including tax rates, tax credits and incentives. Any adverse developments in tax laws, incentives, credits or regulations, including legislative changes, judicial holdings or administrative interpretations, could have a material and adverse effect on financial condition and results of operations.
If AEP is unable to access capital markets or insurance markets on reasonable terms, it could reduce future net income and cash flows and negatively impact financial condition. (Applies to all Registrants)
AEP relies on access to capital markets as a significant source of liquidity for capital requirements not satisfied by operating cash flows or proceeds from the strategic sale of assets and investments, including subsidiaries or portions thereof, such as the announced transaction involving a noncontrolling interest in IMTCo and OHTCo. AEP also relies on access to insurance markets to assist in managing its risk and liability profile. Volatility, increased interest rates and reduced liquidity in the financial markets could affect AEP’s ability to raise capital on reasonable terms to fund capital needs, including construction costs and refinancing maturing indebtedness. In addition, AEP has exposure to international banks, including those in Europe, Canada and Asia. Disruptions in these markets could reduce or restrict the AEP’s ability to secure sufficient liquidity or secure liquidity at reasonable terms. As of December 31, 2024, approximately 8%, 25% and 16% of the Registrants’ available credit facilities were with European, Canadian, and Asian banks, respectively.
Certain sources of insurance and debt and equity capital have expressed increasing unwillingness to procure insurance for or to invest in companies, such as AEP, that rely on fossil fuels. The public holds diverse and often conflicting views on the use of fossil fuels. AEP has multiple stakeholders, including our shareholders, customers, associates, federal and state regulatory authorities, and the communities in which AEP operates, and these stakeholders will often have differing priorities and expectations regarding issues related to the use of fossil fuels. Any adverse publicity in connection with AEP’s use of fossil fuels could curtail availability from certain sources of capital. If sources of capital for AEP are reduced and/or expected sale proceeds do not become available, capital costs could increase materially. Restricted access to capital or insurance markets and/or increased borrowing costs or insurance premiums could reduce future net income and cash flows and negatively impact financial condition. If AEP is not able to access debt or equity at competitive rates or at all, the ability to finance its operations and implement its strategy and business plan as scheduled could be adversely affected. An inability to access debt and equity may limit AEP’s ability to pursue improvements or acquisitions that it may otherwise rely on for future growth.
Our financial position may be adversely impacted if announced dispositions do not occur as planned. (Applies to AEP)
Any planned sale of assets and investments, including the announced transaction involving a noncontrolling interest in IMTCo and OHTCo, may not occur for any number of reasons beyond our control, including regulatory approval. If the transaction is unable to be completed, it could reduce future expected cash flows and impact financial condition.
Shareholder activism could cause AEP to incur significant expense, hinder execution of AEP’s business strategy and impact AEP’s stock price. (Applies to all Registrants)
Shareholder activism, which can take many forms and arise in a variety of situations, could result in substantial costs and divert management’s and AEP’s board’s attention and resources from AEP’s business. Additionally, such shareholder activism could give rise to perceived uncertainties as to AEP’s future, adversely affect AEP’s relationships with its employees, customers or service providers and make it more difficult to attract and retain qualified personnel. Also, AEP may be required to incur significant fees and other expenses related to activist shareholder matters, including for third-party advisors. AEP’s stock price could be subject to significant fluctuation or otherwise be adversely affected by the events, risks and uncertainties of any shareholder activism.
Downgrades in AEP’s credit ratings could negatively affect its ability to access capital. (Applies to all Registrants)
The credit ratings agencies periodically review AEP’s capital structure and the quality and stability of earnings and cash flows. Any negative ratings actions could constrain the capital available to AEP and could limit access to funding for operations. AEP’s business is capital intensive, and AEP is dependent upon the ability to access capital at rates and on terms management determines to be attractive. If AEP’s ability to access capital becomes significantly constrained, AEP’s interest costs will likely increase and that could reduce future net income and cash flows and negatively impact financial condition.
AEP and AEPTCo have no income or cash flow apart from dividends paid or other payments due from their subsidiaries. (Applies to AEP and AEPTCo)
AEP and AEPTCo are holding companies and have no operations of their own. Their ability to meet their financial obligations associated with their indebtedness and to pay dividends is primarily dependent on the earnings and cash flows of their operating subsidiaries, primarily their regulated utilities, and the ability of their subsidiaries to pay dividends to them or repay loans from them. Their subsidiaries are separate and distinct legal entities that have no obligation (apart from loans from AEP or AEPTCo) to provide them with funds for their payment obligations, whether by dividends, distributions or other payments. Payments to AEP or AEPTCo by their subsidiaries are also contingent upon their earnings and business considerations. AEP and AEPTCo indebtedness and dividends are structurally subordinated to all subsidiary indebtedness.
AEP’s operating results may fluctuate on a seasonal or quarterly basis and with general economic and weather conditions. (Applies to all Registrants)
Electric power consumption is generally seasonal. In many parts of the country, demand for power peaks during the hot summer months, with market prices also peaking at that time. In other areas, power demand peaks during the winter. As a result, overall operating results in the future may fluctuate substantially on a seasonal basis. In addition, AEP has historically sold less power, and consequently earned less income, when weather conditions are milder. Unusually mild weather in the future could reduce future net income and cash flows and negatively impact financial condition. In addition, unusually extreme weather conditions could impact AEP’s results of operations in a manner that would not likely be sustainable.
Further, deteriorating economic conditions triggered by any cause, including tariffs, generally result in reduced consumption by customers, particularly industrial customers who may curtail operations or cease production entirely, while an expanding economic environment generally results in increased revenues. The current administration has implemented tariffs on certain imported goods and may impose additional tariffs. As a result, prevailing economic conditions may reduce future net income and cash flows and negatively impact financial condition.
Volatility in the securities markets, interest rates, and other factors could substantially increase defined benefit pension and other postretirement plan costs and the costs of nuclear decommissioning. (Applies to all Registrants and to AEP and I&M with respect to the costs of nuclear decommissioning)
The costs of providing pension and other postretirement benefit plans are dependent on a number of factors, such as the rates of return on plan assets, discount rates, the level of interest rates used to measure the required minimum funding levels of the plan, changes in actuarial assumptions, future government regulation, changes in life expectancy and the frequency and amount of AEP’s required or voluntary contributions made to the plans. Changes in actuarial assumptions and differences between the assumptions and actual values, as well as a significant decline in the value of investments that fund the pension and other postretirement plans, if not offset or mitigated by a decline in plan liabilities, could increase pension and other postretirement expense, and AEP could be required from time to time to fund the pension plan with significant amounts of cash. Such cash funding obligations could have a material impact on liquidity by reducing cash flows and could negatively affect results of operations.
Additionally, I&M holds a significant amount of assets in its nuclear decommissioning trusts to satisfy obligations to decommission its nuclear plant. The rate of return on assets held in those trusts can significantly impact both the costs of decommissioning and the funding requirements for the trusts.
Supply chain disruptions, tariffs and inflation could negatively impact our operations and corporate strategy. (Applies to all Registrants)
AEP’s operations and business plans depend on the global supply chain to procure the equipment, materials and other resources necessary to build and provide services in a safe and reliable manner. The delivery of components, materials, equipment and
other resources that are critical to AEP’s business operations and corporate strategy has been restricted by domestic and global supply chain upheaval. This has resulted in the shortage of critical items. International tensions from any source, including the ramifications of regional conflict or increased tariffs, could further exacerbate the global supply chain upheaval. These disruptions and shortages could adversely impact business operations and corporate strategy. The current administration has implemented tariffs on certain imported goods and may impose additional tariffs. The constraints in the supply chain could restrict the availability and delay the construction, maintenance or repair of items that are needed to support normal operations or are required to execute on AEP’s corporate strategy for continued capital investment in utility equipment and impact AEP’s strategy to transition its generation fleet. These disruptions and constraints could reduce future net income and cash flows and possibly harm AEP’s financial condition.
The United States economy has been in an elevated inflationary environment and supply chain disruptions have contributed to higher prices of components, materials, equipment and other needed commodities. A prolonged continuation or a further increase in the severity of supply chain and inflationary disruptions, including increased tariffs, could result in additional increases in the cost of certain goods, services and cost of capital and further extend lead times. AEP typically recovers increases in capital expenses from customers through rates in regulated jurisdictions. Failure to recover increased capital costs could reduce future net income and cash flows and possibly harm AEP’s financial condition. Increases in inflation raises our costs for labor, materials and services, and failure to secure these on reasonable terms may adversely impact our financial condition.
AEP’s results of operations and cash flows may be negatively affected by a lack of growth or slower growth in the number of customers, a decline in customer demand or a recession. (Applies to all Registrants)
Growth in customer accounts and growth of customer usage each directly influence demand for electricity and the need for additional power generation and delivery facilities. Customer growth and customer usage are affected by a number of factors outside the control of AEP, such as mandated energy efficiency measures, demand-side management goals, distributed generation resources and economic and demographic conditions, such as population changes, job and income growth, housing starts, new business formation and the overall level of economic activity, including changes due to public health considerations.
Certain regulatory and legislative bodies have introduced or are considering requirements and/or incentives to further reduce energy consumption. Additionally, technological advances or other improvements in or applications of technology could lead to declines in per capita energy consumption. Some or all of these factors, could impact the demand for electricity.
Failure to attract and retain an appropriately qualified workforce could harm results of operations. (Applies to all Registrants)
Certain events, such as an aging workforce without appropriate replacements, mismatch of skillset or complement to future needs, or unavailability of contract resources may lead to operating challenges and increased costs. The challenges include potential higher rates of existing employee departures, lack of resources, loss of knowledge and a lengthy time period associated with skill development. In this case, costs, including costs for contractors to replace employees, productivity costs and safety costs, may rise. Failure to hire and adequately train replacement employees, including the transfer of significant internal historical knowledge and expertise to the new employees, or the future availability and cost of contract labor may adversely affect the ability to manage and operate the business. If AEP is unable to successfully attract and retain an appropriately qualified workforce, operations may be negatively impacted and future net income and cash flows may be reduced.
Changes in the price of purchased power and commodities, the cost of procuring fuel, emission allowances for criteria pollutants and the costs of transport may increase AEP’s cost of purchasing and producing power, impacting financial performance. (Applies to all Registrants except AEP Texas, AEPTCo and OPCo)
AEP is exposed to changes in the price and availability of purchased power and fuel (including the cost to procure coal and gas) and the price and availability to transport fuel. AEP has existing contracts of varying durations for the supply of fuel, but as these contracts end or if they are not honored, AEP may not be able to purchase fuel on terms as favorable as the current contracts. AEP typically recovers increases in fuel expenses and purchased power from customers in regulated jurisdictions. Failure to recover these costs could reduce future net income and cash flows and possibly harm AEP’s financial condition. The inability to procure fuel at costs that are economical could cause AEP to retire generating capacity prior to the end of its useful life, and while AEP typically recovers expenditures for undepreciated plant balances, there can be no assurance in the future that AEP will recover such costs. Similarly, AEP is exposed to changes in the price and availability of emission allowances. AEP uses emission allowances based on the amount of fuel used and reductions achieved through emission controls and other measures. Based on current environmental programs remaining in effect, AEP has sufficient emission
allowances available through either EPA original issuance or market purchases to cover projected needs for the next two years and beyond. Additional costs may be incurred either to acquire additional allowances or to achieve further reductions in emissions. If AEP needs to obtain allowances, those purchases may not be on as favorable terms as those under the current environmental programs. AEP’s risks relative to the price and availability to transport coal include the volatility of the price of diesel which is the primary fuel used in transporting coal by barge.
Prices for coal, natural gas and emission allowances have shown material swings in the past. Changes in the cost of purchased power, fuel or emission allowances and changes in the relationship between such costs and the market prices of power could reduce future net income and cash flows and negatively impact financial condition. In addition, actual power prices and fuel costs will differ from those assumed in financial projections used to value trading and marketing transactions, and those differences may be material. As a result, as those transactions are marked-to-market, they may impact future results of operations and cash flows and impact financial condition.
AEP is subject to physical and financial risks associated with climate change. (Applies to all Registrants)
Climate change creates physical and financial risk. Physical risks from climate change may include an increase in sea level and changes in weather conditions, such as changes in precipitation and extreme weather events, such as fires. Customers’ energy needs vary with weather conditions, primarily temperature and humidity. For residential customers, heating and cooling represent their largest energy use. To the extent weather conditions are affected by climate change, customers’ energy use could increase or decrease depending on the duration and magnitude of the changes.
Increased energy use due to weather changes may require AEP to invest in additional generating assets, transmission and other infrastructure to serve increased load. Decreased energy use due to weather changes may affect financial condition through decreased revenues. Extreme weather conditions in general require more system backup, adding to costs, and can contribute to increased system stress, including service interruptions. Weather conditions outside of the AEP service territory could also have an impact on revenues. AEP buys and sells electricity depending upon system needs and market opportunities. Extreme weather conditions creating high energy demand on AEP’s own and/or other systems may raise electricity prices as AEP buys short-term energy to serve AEP’s own system, which would increase the cost of energy AEP provides to customers.
Severe weather and weather-related events impact AEP’s service territories, primarily when thunderstorms, tornadoes, hurricanes, fires, floods and snow or ice storms occur. To the extent the frequency and intensity of extreme weather events and storms increase, AEP’s cost of providing service will increase, including the costs and the availability of procuring insurance related to such impacts, and these costs may not be recoverable. Changes in wind patterns or in precipitation resulting in droughts, water shortages or floods could adversely affect operations, principally wind generation facilities for changes in wind patterns and the fossil fuel generating units for changes in precipitation. A change in wind patterns or a negative impact to water supplies due to long-term drought conditions or severe flooding could adversely impact AEP’s ability to provide electricity to customers, as well as increase the price they pay for energy. AEP may not recover all costs related to mitigating these physical and financial risks.
To the extent climate change impacts a region’s economic health, it may also impact revenues. AEP’s financial performance is tied to the health of the regional economies AEP serves. The price of energy, as a factor in a region’s cost of living as well as an important input into the cost of goods and services, has an impact on the economic health of the communities within AEP’s service territories. Climate change may impact the economy, which could impact our sales and revenues. The cost of additional regulatory requirements, such as regulation of carbon dioxide emissions, could impact the availability of goods and prices charged by AEP’s suppliers which would normally be borne by consumers through higher prices for energy and purchased goods. To the extent financial markets view climate change and carbon dioxide emissions as a financial risk, this could negatively affect AEP’s ability to access capital markets or cause AEP to receive less than ideal terms and conditions in capital markets.
The occurrence of one or more wildfires could cause tremendous loss, impact the market value and credit ratings of our securities and have a material adverse effect on our financial condition. (Applies to all Registrants)
More frequent and severe drought conditions, extreme swings in amount and timing of precipitation, changes in vegetation, unseasonably warm temperatures, very low humidity, stronger winds and other factors have increased the duration of the wildfire season and the potential impact of an event. AEP’s infrastructure could pose risks to safety and system reliability and wildfire mitigation initiatives may not be successful or effective in preventing or reducing wildfire-related events. Wildfires can occur even when effective mitigation procedures are followed. Despite AEP’s early-stage wildfire mitigation initiatives, a wildfire could be ignited, spread and cause damages, which could subject AEP to significant liability. Other potential risks associated with wildfires include the inability to secure sufficient insurance coverage, increased costs for insurance and mitigation efforts, regulatory recovery risk, litigation risk, and the potential for a credit downgrade and subsequent additional costs to access capital markets.
The generation, transmission and distribution of electricity are dangerous and involve inherent risks of damage to private property and injury to AEP’s workforce and the general public. (Applies to all Registrants)
Electricity poses hazards for AEP’s workforce and the general public in the event that either comes in contact with electrical current or equipment, including through energized downed power lines or through equipment malfunctions. In addition, the risks associated with the operation of transmission and distribution assets and power generation and storage facilities include public and workforce safety issues and the risk of utility assets causing or contributing to wildfires. Deaths, injuries and property damage caused by such events can subject AEP to liability that, despite the existence of insurance coverage, can be significant. In addition, AEP may be held responsible for the actions of its contractors. No assurance can be given that future losses will not exceed the limits of AEP’s or its contractors’ insurance coverage.
Management cannot predict the outcome of the legal proceedings relating to AEP’s business activities. (Applies to all Registrants)
AEP is involved in legal proceedings, claims and litigation arising out of its business operations, the most significant of which are summarized in Note 6 - Commitments, Guarantees and Contingencies. Adverse outcomes in these proceedings could require significant expenditures that could reduce future net income and cash flows and negatively impact financial condition.
Disruptions at power generation facilities owned by third-parties could interrupt the sales of transmission and distribution services. (Applies to AEP and AEP Texas)
AEP Texas transmits and distributes electric power that the REPs obtain from power generation facilities owned by third-parties. If power generation is disrupted or if power generation capacity is inadequate, sales of transmission and distribution services may be diminished or interrupted, and results of operations, financial condition and cash flows could be adversely affected.
Management is unable to predict the course, results or impact, if any, of current or future litigation or investigations relating to the severe winter weather in Texas in February 2021. (Applies to AEP and AEP Texas)
As a result of the February 2021 severe winter weather in Texas which caused a shortage of electric generation, ERCOT instructed AEP Texas and other Texas electric utilities to initiate power outages to avoid a sustained large-scale outage and prevent long-term damage to the electric system. At its peak, approximately 468,000 (44%) AEP Texas customers were without power. In February 2021, AEP Texas received a Civil Investigative Demand from the Office of the Attorney General of Texas requesting, among other data, information about its communications to and from ERCOT, PUCT, retail electric providers, utilities, or power generation companies, concerning power outages related to the February 2021 winter storm. The company responded to the Civil Investigative Demand in March 2021.
AEP Parent and AEP Texas are named in approximately 100 lawsuits alleging multiple claims of wrongful death, personal injury, property damage and other injuries and damages. Certain wind farms formerly owned by AEP have also been named as defendants in up to approximately 125 lawsuits, along with other Texas energy companies and transmission and distribution utilities. Most of the lawsuits contain hundreds of plaintiffs and one of the suits is a purported class action on behalf of all customers in ERCOT. The complaints seek monetary damages among other forms of relief.
The litigation has been consolidated into a multi-district litigation (MDL) proceeding in Texas state court. The judge overseeing the MDL issued an initial case management order and stayed discovery. Two appeals regarding motions to dismiss the plaintiffs’ claims filed in representative cases by AEP Texas and other similarly situated defendants are currently pending; resolution of either of these appeals in favor of AEP Texas would result in dismissal of the plaintiffs’ claims against AEP Texas in those cases. A separate appeal regarding a motion to dismiss filed on behalf of the three formerly AEP-owned wind farms and other similarly situated defendants is also pending; resolution of this appeal in favor of the three wind farms would result in dismissal of the plaintiffs’ claims against the wind farms in those cases. Management is unable to predict the course or outcome of these or any future litigation or investigations or their impact, if any, on future results of operations, financial condition and cash flows.
Hazards associated with high-voltage electricity transmission may result in suspension of AEP’s operations or the imposition of civil or criminal penalties. (Applies to all Registrants)
AEP operations are subject to the usual hazards associated with high-voltage electricity transmission, including explosions, fires, inclement weather, natural disasters, mechanical failure, unscheduled downtime, equipment interruptions, remediation, chemical spills, discharges or releases of toxic or hazardous substances or gases and other environmental risks. The hazards can cause personal injury and loss of life, severe damage to or destruction of property and equipment and environmental
damage, and may result in suspension of operations and the imposition of civil or criminal penalties. AEP maintains property and casualty insurance, but AEP is not fully insured against all potential hazards incident to AEP’s business, such as damage to poles, towers and lines or losses caused by outages.
AEPTCo depends on AEP affiliates for a substantial portion of its revenues. (Applies to AEPTCo)
AEPTCo’s principal transmission service customers are AEP affiliates. Management expects that these affiliates will continue to be AEPTCo’s principal transmission service customers for the foreseeable future. For the year ended December 31, 2024, AEP affiliates were responsible for approximately 80% of the consolidated transmission revenues of AEPTCo.
Most of the real property rights on which the assets of AEPTCo are situated result from affiliate license agreements and are dependent on the terms of the underlying easements and other rights of its affiliates. (Applies to AEPTCo)
AEPTCo does not hold title to the majority of real property on which its electric transmission assets are located. Instead, under the provisions of certain affiliate contracts, it is permitted to occupy and maintain its facilities upon real property held by the respective AEP subsidiary utility affiliate that overlay its operations. The ability of AEPTCo to continue to occupy such real property is dependent upon the terms of such affiliate contracts and upon the underlying real property rights of these utility affiliates, which may be encumbered by easements, mineral rights and other similar encumbrances that may affect the use of such real property. AEP can give no assurance that (a) the relevant AEP subsidiary utility affiliates will continue to be affiliates of AEPTCo, (b) suitable replacement arrangements can be obtained in the event that the relevant AEP subsidiary utility affiliates are not its affiliates and (c) the underlying easements and other rights are sufficient to permit AEPTCo to operate its assets in a manner free from interruption.
Compliance with legislative and regulatory requirements may lead to increased costs and result in penalties. (Applies to all Registrants)
Business activities of electric utilities and related companies are heavily regulated, primarily through national and state laws and regulations of general applicability, including laws and regulations related to working conditions, health and safety, equal employment opportunity, employee benefit and other labor and employment matters, laws and regulations related to competition and antitrust matters. Many agencies employ mandatory civil penalty structures for regulatory violations. Registrants are subject to the jurisdiction of many federal and state agencies, including the FERC, NERC, Commodities Futures Trading Commission, Federal EPA, NRC, Occupational Safety and Health Administration, the SEC and the United States Department of Justice which may impose significant civil and criminal penalties to enforce compliance requirements relative to AEP’s business, which could have a material adverse effect on financial operating results including earnings, cash flow and liquidity.
The impact of new laws, regulations and policies and the related interpretations, as well as changes in enforcement practices or regulatory scrutiny generally cannot be predicted, and changes in applicable laws, regulations and policies and the related interpretations and enforcement practices may require extensive system and operational changes, be difficult to implement, increase AEP’s operating costs, require significant capital expenditures, or adversely impact the cost or attractiveness of the products or services AEP offers, or result in adverse publicity and harm AEP’s reputation.
RISKS RELATED TO OWNING AND OPERATING GENERATION ASSETS AND SELLING POWER
Costs of compliance with existing and evolving environmental laws are significant. (Applies to all Registrants except AEPTCo)
Operations are subject to extensive federal, state and local environmental statutes, rules and regulations relating to air quality, water quality, waste management, natural resources and health and safety. A majority of the electricity generated by AEP subsidiaries is produced by the combustion of fossil fuels. Emissions of nitrogen and sulfur oxides, mercury and particulates and the discharge and disposal of solid waste (including coal-combustion residuals or CCR) resulting from fossil fueled generation plants are subject to increased regulations, controls and mitigation expenses. Compliance with these legal requirements (including any new and more stringent application of existing CCR regulations) requires AEP to commit significant capital toward environmental monitoring, installation of pollution control equipment, emission fees, disposal, remediation and permits at AEP facilities and could cause AEP to retire generating capacity prior to the end of its estimated useful life. Costs of compliance with environmental statutes and regulations could reduce future net income and negatively impact financial condition, especially if emission limits, CCR waste discharge and/or discharge disposal obligations are tightened, more extensive operating and/or permitting requirements are imposed or additional substances or facilities become regulated. Although AEP typically recovers expenditures for pollution control technologies, replacement generation, undepreciated plant balances and associated operating costs from customers, there can be no assurance in the future that AEP will recover the remaining costs associated with such plants. Failure to recover these costs could reduce future net income and cash flows and possibly harm financial condition.
Regulation of greenhouse gas emissions could materially increase costs to AEP and its customers or cause some electric generating units to be uneconomical to operate or maintain. (Applies to all Registrants except AEP Texas, AEPTCo and OPCo)
Federal or state laws or regulations may be adopted that would impose new or additional limits on the emissions of greenhouse gases, including, but not limited to, carbon dioxide and methane, from electric generation units using fossil fuels like coal. The potential effects of greenhouse gas emission limits on AEP's electric generation units are subject to significant uncertainties based on, among other things, the timing of the implementation of any new requirements, the required levels of emission reductions, the nature of any market-based or tax-based mechanisms adopted to facilitate reductions, the relative availability of greenhouse gas emission reduction offsets, the development of cost-effective, commercial-scale carbon capture and storage technology and supporting regulations and liability mitigation measures, and the range of available compliance alternatives.
AEP is committed to providing reliable affordable power to its customers. To achieve this, AEP and its subsidiaries routinely meet with state regulators and key stakeholders to understand their needs for both dispatchable and renewable generation resources. This process evaluates, amongst other things, future supply and demand fundamentals, the economic aspects of investments, grid reliability and resilience, regulations and evolving RTO requirements, the advancement of generation technologies, and market impacts and constraints. As part of the regulatory process, AEP routinely submits IRPs in various regulatory jurisdictions to address future generation needs. The objective of the IRPs is to recommend future generation and capacity resources that provide the most cost-efficient and reliable power to customers. AEP remains committed to making generation and capacity resource decisions that provide the most cost-efficient and reliable power to customers, irrespective of any specific carbon-reduction goal. Based on the assumptions used in the most recent analysis, AEP expects that its Scope 1 GHG emissions will be reduced by 80% by 2030 (from a 2005 baseline).
AEP’s GHG reduction efforts are predicated on the combined preferences of the eleven states that we operate in. AEP has made significant progress in reducing GHG emissions from its power generation fleet and while we aspire to be at net-zero Scope 1 and 2 emissions by 2045, our performance will ultimately be driven by the needs and desires of the states we serve. AEP is engaging with regulators and policymakers and our decisions around generation resources are reflected in the preferences of these states. AEP has embraced the advancement of low-carbon generation solutions where supported, which may include early-stage projects to bring small modular nuclear reactors to Virginia and Indiana as an example. Further advancement of affordable new generation technologies and a market for offsets, as well as continued alignment with our states, would be required to achieve net-zero emissions.
AEP’s results of operations could be materially adversely affected to the extent that new federal or state laws or regulations impose any new greenhouse gas emission limits. Any future limits on greenhouse gas emissions could create substantial additional costs in the form of taxes or emissions allowances, require significant capital investment in carbon capture and storage technology, fuel switching, or the replacement of high-emitting generation facilities with lower-emitting generation facilities and/or could cause AEP to retire generating capacity prior to the end of its estimated useful life. Although AEP typically recovers environmental expenditures, there can be no assurance in the future that AEP can recover such costs which could reduce future net income and cash flows and possibly harm financial condition. Further, real or alleged violations of environmental regulations, including those related to climate change, or an inability to meet AEP’s voluntary climate aspirations, could adversely impact AEP’s reputation, reduce future net income and cash flows and harm financial condition.
AEP may be unable to procure or construct generation capacity when needed or to recover the costs of such generation capacity. (Applies to all Registrants except AEP Texas, AEPTCo and OPCo)
AEP’s capacity obligations are subject to a number of factors including load growth, requirements that can be imposed by the states, RTOs and other jurisdictions in which it operates or participates as a member and the retirement of existing generating facilities. AEP must obtain new and replacement generation to comply with prevailing capacity needs and reserve obligations. AEP’s ability to acquire, retrofit and/or construct power generation facilities in a timely manner and within budget is contingent upon many variables and subject to substantial risks. These variables include, but are not limited to, project management expertise, escalating costs for capital, materials, labor, and environmental compliance, reliance on suppliers for timely and satisfactory performance, continued pandemic-related delays and cost increases, and supply chains and material constraints, including those that may result from major storm events. Delays in obtaining permits, challenges in securing suitable land for the siting, shortages in materials and qualified labor, levels of public support or opposition, suppliers and contractors not performing as expected or required under their contracts and/or experiencing financial problems that inhibit their ability to fulfill their obligations under contracts, changes in the scope and timing of projects, poor quality initial cost estimates from contractors, the inability to raise capital on favorable terms, changes in commodity prices affecting revenue, fuel costs, or materials costs, downward changes in the economy, changes in law or regulation, including environmental compliance requirements, further direct and indirect trade and tariff issues, supply chain delays or disruptions, and other events beyond AEP’s control may occur that may materially affect the schedule, cost, and performance of needed acquisitions or construction
projects. If these projects or other capital improvements are significantly delayed or become subject to cost overruns or cancellation, AEP could incur additional costs and termination payments or face increased risk of potential write-off of the investment in the project. In addition, AEP could be exposed to higher costs, penalties and market volatility, which could affect cash flow and cost recovery, should one or more applicable regulator decline to approve the acquisition or construction of the project or new generation needed to meet the reliability needs of customers at the lowest reasonable cost.
Courts adjudicating nuisance and other similar claims in the future may order AEP to pay damages or to limit or reduce emissions. (Applies to all Registrants except AEP Texas and AEPTCo)
In the past, there have been several cases seeking damages based on allegations of federal and state common law nuisance in which AEP, among others, were defendants. In general, the actions allege that emissions from the defendants’ power plants constitute a public nuisance. The plaintiffs in these actions generally seek recovery of damages and other relief. If future actions are resolved against AEP, substantial modifications or retirement of AEP’s existing coal-fired power plants could be required, and AEP might be required to purchase power from third-parties to fulfill AEP’s commitments to supply power to AEP customers. This could have a material impact on revenues. In addition, AEP could be required to invest significantly in additional emission control equipment, accelerate the timing of capital expenditures, pay damages or penalties and/or halt operations. Unless recovered, those costs could reduce future net income and cash flows and harm financial condition. Moreover, results of operations and financial position could be reduced due to the timing of recovery of these investments and the expense of ongoing litigation.
Commodity trading and marketing activities are subject to inherent risks which can be reduced and controlled but not eliminated. (Applies to all Registrants except AEP Texas, AEPTCo and OPCo)
AEP routinely has open trading positions in the market, within guidelines set by AEP, resulting from the management of AEP’s trading portfolio. To the extent open trading positions exist, fluctuating commodity prices can improve or diminish financial results and financial position. AEP’s power trading activities also expose AEP to risks of commodity price movements. To the extent that AEP’s power trading does not hedge the price risk associated with the generation it owns, or controls, AEP would be exposed to the risk of rising and falling spot market prices. In connection with these trading activities, AEP routinely enters into financial contracts, including futures and options, OTC options, financially-settled swaps and other derivative contracts. These activities expose AEP to risks from price movements. If the values of the financial contracts change in a manner AEP does not anticipate, it could harm financial position or reduce the financial contribution of trading operations.
Parties with whom AEP has contracts may fail to perform their obligations, which could harm AEP’s results of operations. (Applies to all Registrants)
AEP sells power from its generation facilities into the spot market and other competitive power markets on a contractual basis. AEP also enters into contracts to purchase and sell electricity, natural gas, emission allowances, renewable energy credits and coal as part of its power marketing and energy trading operations. AEP is exposed to the risk that counterparties that owe AEP money or the delivery of a commodity, including power, could breach their obligations. Should the counterparties to these arrangements fail to perform, AEP may be forced to enter into alternative hedging arrangements or honor underlying commitments at then-current market prices that may exceed AEP’s contractual prices, which would cause financial results to be diminished and AEP might incur losses. Although estimates take into account the expected probability of default by a counterparty, actual exposure to a default by a counterparty may be greater than the estimates predict.
AEP relies on electric transmission facilities that AEP does not own or control. If these facilities do not provide AEP with adequate transmission capacity, AEP may not be able to deliver wholesale electric power to the purchasers of AEP’s power. (Applies to all Registrants)
AEP depends on transmission facilities owned and operated by other nonaffiliated power companies to deliver the power AEP sells at wholesale. This dependence exposes AEP to a variety of risks. If transmission is disrupted, or transmission capacity is inadequate, AEP may not be able to sell and deliver AEP wholesale power. If a region’s power transmission infrastructure is inadequate, AEP’s recovery of wholesale costs and profits may be limited. If restrictive transmission price regulation is imposed, the transmission companies may not have sufficient incentive to invest in expansion of transmission infrastructure.
The FERC has issued electric transmission initiatives that require electric transmission services to be offered unbundled from commodity sales. Although these initiatives are designed to encourage wholesale market transactions, access to transmission systems may not be available if transmission capacity is insufficient because of physical constraints or because it is contractually unavailable. Management also cannot predict whether transmission facilities will be expanded in specific markets to accommodate competitive access to those markets.
OVEC may require additional liquidity and other capital support. (Applies to AEP, APCo, I&M and OPCo)
AEP and several nonaffiliated utility companies own OVEC. The Inter-Company Power Agreement (ICPA) defines the rights and obligations and sets the power participation ratio of the parties to it. Under the ICPA, parties are entitled to receive and are obligated to pay for all OVEC capacity (approximately 2,400 MWs) in proportion to their respective power participation ratios. The aggregate power participation ratio of APCo, I&M and OPCo is 43.47%. If a party fails to make payments owed by it under the ICPA, OVEC may not have sufficient funds to honor its payment obligations, including its ongoing operating expenses as well as its indebtedness. As of December 31, 2024, OVEC has outstanding indebtedness of approximately $997 million, of which APCo, I&M and OPCo are collectively responsible for $433 million through the ICPA. Although they are not an obligor or guarantor, APCo, I&M and OPCo are responsible for their respective ratio of OVEC’s outstanding debt through the ICPA and if OVEC’s indebtedness is accelerated for any reason, there is risk that APCo, I&M and/or OPCo may be required to pay some or all of such accelerated indebtedness in amounts equal to their aggregate power participation ratio of 43.47%.
New climate disclosure rules proposed by the U.S. Securities and Exchange Commission may increase our costs of compliance and adversely impact our business. (Applies to all Registrants)
On March 24, 2024, the SEC adopted new rules relating to the disclosure of a range of climate-related risks. The rules have been challenged in court and are currently stayed. At this time AEP cannot predict the costs of implementation or any potential adverse impacts resulting from the rule as adopted. To the extent these rules or any replacement rules are adopted, AEP could incur increased costs relating to the assessment and disclosure of climate-related risks. AEP may also face increased litigation risks related to disclosures made pursuant to any rules that are implemented. In addition, enhanced climate disclosure requirements could accelerate the trend of certain stakeholders and lenders restricting or seeking more stringent conditions with respect to their investments in certain carbon-intensive sectors.
ITEM 1B. UNRESOLVED STAFF COMMENTS
None.
ITEM 1C. CYBERSECURITY
The electric utility industry is an identified critical infrastructure function with mandatory cybersecurity requirements under the authority of FERC. The NERC, which FERC certified as the nation’s Electric Reliability Organization, developed mandatory critical infrastructure protection cybersecurity reliability standards. AEP’s service territory covers multiple NERC regions and is audited at least annually by one or more of the regions. AEP has participated in the NERC grid security and emergency response exercises, GridEx, for the past ten years and continues to participate in the bi-yearly exercises. These NERC-led efforts test and further develop the coordination, threat sharing and interaction between utilities and various government agencies relative to potential cyber and physical threats against the nation’s electric grid. AEP also conducts internal exercises to test and further refine AEP’s cyber response plans. These internal scenarios are chosen based on real world events and often include coordination with and communication to AEP’s Chief Executive Officer and executive team.
The operations of AEP’s electric utility subsidiaries are subject to extensive and rigorous mandatory cyber and physical security requirements that are developed and enforced by NERC to protect grid security and reliability. Cook Plant is also subject to NRC regulation for cybersecurity. AEP’s enterprise-wide security program includes cyber and physical security and incorporates many of the guidelines set forth in the National Institute of Standards and Technology Cybersecurity Framework. AEP'’s Chief Security Officer (CSO) has accountability for cyber aspects of third-party risk and data loss prevention and is also its NERC Critical Infrastructure Protection Senior Manager, who is responsible for ensuring alignment of compliance with the enterprise-wide security program. AEP’s CSO possesses extensive experience across cybersecurity, risk and data controls and infrastructure engineering. AEP’s CSO was the Chief Security Officer at Bread Financial Holdings, Inc., a publicly registered financial services company, and an executive director of cyber security at JPMorgan Chase & Co. prior to joining AEP.
Critical cyber assets, such as data centers, power plants, transmission operations centers and business networks are protected using multiple layers of cybersecurity controls and authentication. Cyber hackers and other malicious actors have caused material disruption by successfully breaching a number of very secure facilities of entities across the spectrum of industries, including federal agencies and financial institutions. As understanding of these events develop, AEP has adopted a defense in depth approach to cybersecurity and continually assesses its cybersecurity tools and processes to determine where to strengthen its defenses. These strategies include monitoring, alerting and emergency response, forensic analysis, disaster recovery, threat sharing and criminal activity reporting. This approach has allowed AEP to deal with cyber and related threats, intrusions and attempted breaches in real-time and to limit their impact to levels that would be expected in the ordinary course of business in the absence of such malicious activity. AEP is not aware of any occurrence from cybersecurity threats, including as a result of
any previous cybersecurity incidents, that has materially affected or is reasonably likely to materially affect AEP’s business strategy, results of operations, cash flows or financial condition.
AEP has undertaken a variety of actions to monitor and address cyber-related risks. Cybersecurity and the effectiveness of AEP’s cybersecurity processes are reviewed annually with the Board of Directors and at several meetings throughout the year with the Technology Committee of the Board, the principal committee that exercises oversight with respect to these matters. AEP’s Chief Executive Officer and executive team participate in interactive threat briefings from AEP’s CSO and/or Chief Information & Technology Officer on a regular basis. AEP’s strategy and procedure for managing cyber-related risks is integrated within its enterprise risk management processes. These procedures are designed to ensure that any material information regarding potentially relevant cyber incidents is elevated in a timely manner both to the appropriate leadership and, where applicable, to our external financial reporting and disclosure team. AEP’s enterprise-wide security program continually adjusts staff and resources in response to the evolving threat landscape. The costs for such investments are material and have remained generally consistent over time, a pattern that is expected to continue. In addition, AEP maintains cyber liability insurance to cover certain damages caused by cyber incidents.
AEP’s CSO leads the cybersecurity and physical security teams which are responsible for the design, implementation and execution of AEP’s security risk management strategy, which includes cybersecurity. AEP’s cybersecurity team operates a 24/7 Cybersecurity Intelligence and Response Center responsible for monitoring the AEP System for cyber risks and threats. The cybersecurity team constantly scans the AEP System for cyber risks and threats. In addition, under the direction of the CSO, the cybersecurity team actively monitors best practices, performs penetration testing, leads response exercises and internal awareness campaigns and provides training and communication across the organization. AEP’s security awareness training is mandatory for all employees and includes regular phish email testing to train employees to identify malicious emails that could put AEP at risk.
AEP also continually reviews its business continuity plan to develop an effective recovery strategy that seeks to decrease response times, limit financial impacts and maintain customer confidence during any business interruption. AEP administers a third-party risk governance program that identifies potential risks introduced through third-party relationships, such as vendors, software and hardware manufacturers or professional service providers. As warranted, AEP obtains certain contractual security guarantees and assurances with these third-party relationships to help ensure the security and safety of its information. The cyber security team works closely with a broad range of departments, including legal, regulatory, corporate communications, internal audit services, information technology and operational technology functions critical to the power grid.
The cybersecurity team collaborates with partners from both industry and government, and routinely participates in industry-wide programs that exchange knowledge of threats with utility peers, industry and federal agencies. AEP is an active member of a number of industry-specific threat and information sharing communities including the Department of Homeland Security’s Joint Cyber Defense Collaborative, the Electricity Information Sharing and Analysis Center and the National Defense Information Sharing and Analysis Center. AEP participates in classified briefings to maintain an awareness of current cybersecurity threats and vulnerabilities. AEP continues to work with nonaffiliated entities to do penetration testing and to design and implement appropriate remediation strategies. There can be no assurance, however, that these efforts will be effective to prevent material interruption of services or other damages to AEP's business or operations in connection with any cyber-related incident. See “Risk Factors - Risks Related to Market, Economic or Financial Volatility and Other Risks - Physical attacks or hostile cyber intrusions could severely impair operations, lead to the disclosure of confidential information and damage AEP’s reputation”.
ITEM 2. PROPERTIES
GENERATION FACILITIES
The tables below summarize the net maximum capacity of AEP's owned generation plants as of December 31, 2024. AEP subsidiaries serve customer electricity needs from these facilities and from purchased power in the PJM and SPP markets based on demand and other economic conditions. AEP's regulated subsidiaries have approved recovery mechanisms in retail jurisdictions that recover the cost of prudently incurred fuel, purchased power and other expenses.
Vertically Integrated Utilities Segment
| | | | | | | | | | | | | | | | | | | | | | | | | | | | | | | | |
| AEGCo | | | | | | | | | | |
| Plant Name | | Units | | State | | Fuel Type | | Net Maximum
Capacity (MWs) | | Year Plant
or First Unit Commissioned |
| Rockport (a) | | 2 | | IN | | Steam - Coal | | 1,310 | | | 1984 |
(a)AEGCo owns a 50% interest in the Rockport Plant units. I&M owns the remaining 50%. Figures presented reflect only the portion owned by AEGCo.
| | | | | | | | | | | | | | | | | | | | | | | | | | | | | | | | |
| APCo | | | | | | | | | | |
| Plant Name | | Units | | State | | Fuel Type | | Net Maximum
Capacity (MWs) | | Year Plant
or First Unit Commissioned |
| | | | | | | | | | |
| | | | | | | | | | |
| | | | | | | | | | |
| | | | | | | | | | |
| | | | | | | | | | |
| | | | | | | | | | |
| | | | | | | | | | |
| | | | | | | | | | |
| Ceredo | | 6 | | WV | | Natural Gas | | 516 | | | 2001 |
| Dresden | | 3 | | OH | | Natural Gas | | 665 | | | 2012 |
| Smith Mountain | | 5 | | VA | | Pumped Storage | | 585 | | | 1965 |
| Amos | | 3 | | WV | | Steam - Coal | | 2,950 | | | 1971 |
| Mountaineer | | 1 | | WV | | Steam - Coal | | 1,320 | | | 1980 |
| Clinch River | | 2 | | VA | | Steam - Natural Gas | | 465 | | | 1958 |
| Hydro (Various Plants) | | Various | | VA | | Hydro | | 158 | | | 1906-1964 |
| Hydro (Various Plants) | | Various | | WV | | Hydro | | 53 | | | 1935-1938 |
| Amherst | | NA | | VA | | Solar | | 5 | | | 2023 |
| Total MWs | | | | | | | | 6,717 | | | |
| | | | | | | | | | | | | | | | | | | | | | | | | | | | | | | | |
| I&M | | | | | | | | | | |
| Plant Name | | Units | | State | | Fuel Type | | Net Maximum
Capacity (MWs) | | Year Plant
or First Unit Commissioned |
| | | | | | | | | | |
| | | | | | | | | | |
| | | | | | | | | | |
| | | | | | | | | | |
| | | | | | | | | | |
| | | | | | | | | | |
| | | | | | | | | | |
| | | | | | | | | | |
| | | | | | | | | | |
| | | | | | | | | | |
| | | | | | | | | | |
| Rockport (a) | | 2 | | IN | | Steam - Coal | | 1,310 | | | 1984 |
| Cook | | 2 | | MI | | Steam - Nuclear | | 2,296 | | | 1975 |
| Hydro (Various Plants) | | Various | | IN | | Hydro | | 7 | | | 1904-1913 |
| Hydro (Various Plants) | | Various | | MI | | Hydro | | 13 | | | 1908-1923 |
| Solar (Various Plants) | | NA | | IN | | Solar | | 31 | | | 2016-2021 |
| Solar (Various Plants) | | NA | | MI | | Solar | | 5 | | | 2016 |
| Total MWs | | | | | | | | 3,662 | | | |
(a)I&M owns a 50% interest in the Rockport Plant units. AEGCo owns the remaining 50%. Figures presented reflect only the portion owned by I&M.
NA Not applicable.
| | | | | | | | | | | | | | | | | | | | | | | | | | | | | | | | |
| KPCo | | | | | | | | | | |
| Plant Name | | Units | | State | | Fuel Type | | Net Maximum
Capacity (MWs) | | Year Plant
or First Unit Commissioned |
| Mitchell (a) | | 2 | | WV | | Steam - Coal | | 780 | | | 1971 |
| Big Sandy | | 1 | | KY | | Steam - Natural Gas | | 295 | | | 1963 |
| Total MWs | | | | | | | | 1,075 | | | |
(a)KPCo owns a 50% interest in the Mitchell Plant units. WPCo owns the remaining 50%. Figures presented reflect only the portion owned by KPCo.
| | | | | | | | | | | | | | | | | | | | | | | | | | | | | | | | |
| PSO | | | | | | | | | | |
| Plant Name | | Units | | State | | Fuel Type | | Net Maximum
Capacity (MWs) | | Year Plant
or First Unit Commissioned |
| Comanche | | 3 | | OK | | Natural Gas | | 238 | | | 1973 |
| Northeastern, Unit 1 | | 1 | | OK | | Natural Gas | | 470 | | | 1961 |
| Riverside, Units 3 and 4 | | 2 | | OK | | Natural Gas | | 160 | | | 2008 |
| Southwestern, Units 4 and 5 | | 2 | | OK | | Natural Gas | | 166 | | | 2008 |
| Weleetka | | 2 | | OK | | Natural Gas | | 75 | | | 1975 |
| Northeastern, Unit 3 | | 1 | | OK | | Steam - Coal | | 472 | | | 1979 |
| Northeastern, Unit 2 | | 1 | | OK | | Steam - Natural Gas | | 435 | | | 1961 |
| Riverside, Units 1 and 2 | | 2 | | OK | | Steam - Natural Gas | | 879 | | | 1974 |
| Southwestern, Units 1, 2 and 3 | | 3 | | OK | | Steam - Natural Gas | | 446 | | | 1952 |
| Tulsa | | 2 | | OK | | Steam - Natural Gas | | 318 | | | 1956 |
| | | | | | | | | | |
| | | | | | | | | | |
| | | | | | | | | | |
| North Central Wind Energy Facilities (a) | | NA | | OK | | Wind | | 675 | | | 2021-2022 |
| Rock Falls | | NA | | OK | | Wind | | 155 | | | 2017 |
| Total MWs | | | | | | | | 4,489 | | | |
(a)PSO owns a 45.5% interest and SWEPCo owns the remaining 54.5% interest in Sundance, Maverick and Traverse. Figures presented reflect only the portion owned by PSO.
NA Not applicable.
| | | | | | | | | | | | | | | | | | | | | | | | | | | | | | | | |
| SWEPCo | | | | | | | | | | |
| Plant Name | | Units | | State | | Fuel Type | | Net Maximum
Capacity (MWs) | | Year Plant
or First Unit Commissioned |
| Mattison | | 4 | | AR | | Natural Gas | | 314 | | | 2007 |
| Stall | | 3 | | LA | | Natural Gas | | 534 | | | 2010 |
| Flint Creek (a) | | 1 | | AR | | Steam - Coal | | 259 | | | 1978 |
| Turk (a) | | 1 | | AR | | Steam - Coal | | 477 | | | 2012 |
| Welsh (b) | | 2 | | TX | | Steam - Coal | | 1,056 | | | 1977 |
| Arsenal Hill | | 1 | | LA | | Steam - Natural Gas | | 111 | | | 1960 |
| Knox Lee | | 1 | | TX | | Steam - Natural Gas | | 344 | | | 1950 |
| Lieberman | | 3 | | LA | | Steam - Natural Gas | | 219 | | | 1947 |
| Wilkes | | 3 | | TX | | Steam - Natural Gas | | 889 | | | 1964 |
| | | | | | | | | | |
| | | | | | | | | | |
| | | | | | | | | | |
| North Central Wind Energy Facilities (c) | | NA | | OK | | Wind | | 809 | | | 2021-2022 |
| Diversion Wind Farm | | NA | | TX | | Wind | | 201 | | | 2024 |
| Total MWs | | | | | | | | 5,213 | | | |
(a)Jointly-owned with nonaffiliated entities. Figures presented reflect only the portion owned by SWEPCo. The Arkansas jurisdictional portion of SWEPCo’s interest in Turk Plant is not in rate base.
(b)In November 2020, management announced it will cease using coal at the Welsh Plant in 2028. In December 2024, SWEPCo filed an application for a Certificate of Convenience and Necessity (CCN) with the APSC, LPSC and PUCT to convert Welsh Plant, Units 1 and 3 to natural gas in 2028 and 2027, respectively.
(c)SWEPCo owns a 54.5% interest and PSO owns the remaining 45.5% interest in Sundance, Maverick and Traverse. Figures presented reflect only the portion owned by SWEPCo.
NA Not applicable.
| | | | | | | | | | | | | | | | | | | | | | | | | | | | | | | | |
| WPCo | | | | | | | | | | |
| Plant Name | | Units | | State | | Fuel Type | | Net Maximum
Capacity (MWs) | | Year Plant
or First Unit Commissioned |
| Mitchell (a) | | 2 | | WV | | Steam - Coal | | 780 | | | 1971 |
(a)WPCo owns 50% in the Mitchell Plant units. KPCo owns the remaining 50%. Figures presented reflect only the portion owned by WPCo.
TRANSMISSION AND DISTRIBUTION FACILITIES
The AEP System has significant investments in transmission and distribution lines across its Vertically Integrated Utilities, Transmission and Distribution Utilities and AEP Transmission Holdco Segments.
TITLE TO PROPERTY
The AEP System’s generating facilities are generally located on lands owned in fee simple. The greater portion of the transmission and distribution lines of the AEP System has been constructed over lands of private owners pursuant to easements or along public highways and streets pursuant to appropriate statutory authority. The rights of AEP’s public utility subsidiaries in the realty on which their facilities are located are considered adequate for use in the conduct of their business. Minor defects and irregularities customarily found in title to properties of like size and character may exist, but such defects and irregularities do not materially impair the use of the properties. AEP’s public utility subsidiaries generally have the right of eminent domain which permits them, if necessary, to acquire, perfect or secure titles to or easements on privately held lands used or to be used in their utility operations.
SYSTEM TRANSMISSION LINES AND FACILITY SITING
Laws in the states of Arkansas, Indiana, Kentucky, Louisiana, Michigan, Ohio, Tennessee, Texas, Virginia and West Virginia require prior approval of sites of generating facilities and/or routes of high-voltage transmission lines. AEP has experienced delays and additional costs in constructing facilities as a result of proceedings conducted pursuant to such statutes and in proceedings in which AEP’s operating companies have sought to acquire rights-of-way through condemnation. These proceedings may result in additional delays and costs in future years.
CONSTRUCTION PROGRAM
With input from its state utility commissions, AEP subsidiaries continuously assess the adequacy of their transmission, distribution, generation and other facilities to plan and provide for the reliable supply of electric power and energy to its customers. In this assessment process, assumptions are continually being reviewed as new information becomes available and assessments and plans are modified, as appropriate. AEP forecasts approximately $11.5 billion of construction expenditures for 2025. Estimated construction expenditures are subject to periodic review and modification and may vary based on the ongoing effects of regulatory constraints, environmental regulations, business opportunities, market volatility, economic trends, supply chain issues, weather, legal reviews, inflation and the ability to access capital. See the “Budgeted Capital Expenditures” section of Management’s Discussion and Analysis of Financial Condition and Results of Operations for additional information.
POTENTIAL UNINSURED LOSSES
Some potential losses or liabilities may not be insurable or the amount of insurance carried may not be sufficient to meet potential losses and liabilities, including liabilities relating to damage to AEP’s generation plants and costs of replacement power. Unless allowed to be recovered through rates, future losses or liabilities which are not completely insured could reduce net income and impact the financial conditions of AEP and subsidiaries. For risks related to owning a nuclear generating unit, see the “Nuclear Contingencies” section of Note 6 - Commitments, Guarantees and Contingencies for additional information.
ITEM 3. LEGAL PROCEEDINGS
For a discussion of material legal proceedings, see Note 6 - Commitments, Guarantees and Contingencies for additional information.
ITEM 4. MINE SAFETY DISCLOSURE
Not applicable.
PART II
ITEM 5. MARKET FOR REGISTRANTS’ COMMON EQUITY, RELATED STOCKHOLDER MATTERS AND ISSUER PURCHASES OF EQUITY SECURITIES
AEP
In addition to the AEP Common Stock Information section below, the remaining information required by this item is incorporated herein by reference to (i) the material under the “Dividend Policy and Restrictions” section of Management’s Discussion and Analysis of Financial Condition and Results of Operations and (ii) Note 16 Stock-Based Compensation.
During the quarter ended December 31, 2024, neither AEP nor its publicly-traded subsidiaries purchased or issued equity securities that are registered by AEP or its publicly-traded subsidiaries pursuant to Section 12 of the Exchange Act other than in amounts that were not material as described in Note 16 referenced above.
AEP Texas, APCo, I&M, OPCo, PSO and SWEPCo
The common stock of these companies is held solely by AEP. For more information see the “Dividend Restrictions” section of Note 15 - Financing Activities.
AEPTCo
AEP owns the entire interest in AEPTCo through its wholly-owned subsidiary AEP Transmission Holdco.
AEP COMMON STOCK INFORMATION
AEP common stock is principally traded using the trading symbol “AEP” on the NASDAQ Stock Market. As of December 31, 2024, AEP had 44,820 registered shareholders. The performance graph below compares the cumulative total return among AEP, the S&P 500 Index and the S&P 500 Utilities (Sector) Index over a five year period. The performance graph assumes an initial investment of $100 on December 31, 2019 and that all dividends were reinvested.
Source: S&P Dow Jones Indices LLC. Data as of December 31, 2024. Past performance is no guarantee of future results. Chart provided for illustrative purposes.
ITEM 6. RESERVED
ITEM 7. MANAGEMENT’S DISCUSSION AND ANALYSIS OF FINANCIAL CONDITION AND RESULTS OF OPERATIONS
AEP
The information required by this item is incorporated herein by reference to the material under Management’s Discussion and Analysis of Financial Condition and Results of Operations. Year-to-year comparisons between 2023 and 2022 have been omitted from this Form 10-K but may be found in "Management's Discussion and Analysis of Financial Condition" in Part II, Item 7 of our Form 10-K for the fiscal year ended December 31, 2023, which specific discussion is incorporated herein by reference.
AEP Texas, AEPTCo, APCo, I&M, OPCo, PSO and SWEPCo
Omitted pursuant to Instruction I(2)(a). Management’s narrative analysis of the results of operations and other information required by Instruction I(2)(a) is incorporated herein by reference to the material under Management’s Discussion and Analysis of Financial Condition and Results of Operations.
ITEM 7A. QUANTITATIVE AND QUALITATIVE DISCLOSURES ABOUT MARKET RISK
AEP, AEP Texas, AEPTCo, APCo, I&M, OPCo, PSO and SWEPCo
The information required by this item is incorporated herein by reference to the material under the “Quantitative and Qualitative Disclosures About Market Risk” section of Management’s Discussion and Analysis of Financial Condition and Results of Operations.
ITEM 8. FINANCIAL STATEMENTS AND SUPPLEMENTARY DATA
2024 Annual Reports
American Electric Power Company, Inc. and Subsidiary Companies
AEP Texas Inc. and Subsidiaries
AEP Transmission Company, LLC and Subsidiaries
Appalachian Power Company and Subsidiaries
Indiana Michigan Power Company and Subsidiaries
Ohio Power Company and Subsidiaries
Public Service Company of Oklahoma
Southwestern Electric Power Company Consolidated
Audited Financial Statements and
Management’s Discussion and Analysis of Financial Condition and Results of Operations
AMERICAN ELECTRIC POWER COMPANY, INC. AND SUBSIDIARY COMPANIES
INDEX OF ANNUAL REPORTS
| | | | | | | | | | | | | | |
| | Page
Number |
| | |
| | | |
| | | |
| | | |
| Management’s Report on Internal Control Over Financial Reporting | | |
| | | |
| | | |
| AEP Texas Inc. and Subsidiaries: | | |
| Management’s Narrative Discussion and Analysis of Results of Operations | | |
| Report of Independent Registered Public Accounting Firm (PCAOB ID 238) | | |
| Management’s Report on Internal Control Over Financial Reporting | | |
| Consolidated Financial Statements | | |
| | | |
| AEP Transmission Company, LLC and Subsidiaries: | | |
| Management’s Narrative Discussion and Analysis of Results of Operations | | |
| Report of Independent Registered Public Accounting Firm (PCAOB ID 238) | | |
| Management’s Report on Internal Control Over Financial Reporting | | |
| Consolidated Financial Statements | | |
| | | |
| | |
| | | |
| | | |
| Management’s Report on Internal Control Over Financial Reporting | | |
| | | |
| | | |
| | |
| | | |
| | | |
| Management’s Report on Internal Control Over Financial Reporting | | |
| | | |
| | | |
| | |
| | | |
| | | |
| Management’s Report on Internal Control Over Financial Reporting | | |
| | | |
| | | |
| | |
| | | |
| | | |
| Management’s Report on Internal Control Over Financial Reporting | | |
| | | |
| | | |
| | |
| | | |
| | | |
| Management’s Report on Internal Control Over Financial Reporting | | |
| | | |
| | | |
| | |
AMERICAN ELECTRIC POWER COMPANY, INC. AND SUBSIDIARY COMPANIES MANAGEMENT’S DISCUSSION AND ANALYSIS OF FINANCIAL CONDITION AND
RESULTS OF OPERATIONS
EXECUTIVE OVERVIEW
Company Overview
AEP is one of the largest investor-owned electric public utility holding companies in the United States. AEP’s electric utility operating companies provide generation, transmission and distribution services to more than five million retail customers in Arkansas, Indiana, Kentucky, Louisiana, Michigan, Ohio, Oklahoma, Tennessee, Texas, Virginia and West Virginia.
AEP’s subsidiaries operate an extensive portfolio of assets including:
•Approximately 225,000 circuit miles of distribution lines that deliver electricity to 5.6 million customers.
•Approximately 40,000 circuit miles of transmission lines, including approximately 2,100 circuit miles of 765 kV lines, the backbone of the electric interconnection grid in the eastern United States.
•Approximately 23,000 MWs of regulated owned generating capacity as of December 31, 2024, one of the largest complements of generation in the United States.
AEP is committed to executing its strategy to provide customers with reliable, affordable power. AEP’s vision is focused on six core principles:
•Delivering industry leading customer service.
•Providing a safe and secure workplace for our engaged, trained and developed employees.
•Environmental respect through creative sustainable energy solutions.
•Regulatory and legislative integrity that achieves balanced regulatory outcomes and provides trusted industry leadership.
•Operational excellence.
•Strong financial discipline that drives value for customers and investors.
AEP is at the forefront of the energy industry’s transformation. AEP’s core strategy is focused on three pillars: 1) reinvestment in core assets, 2) investment in growth opportunities and 3) acquisition of new assets. Highlights of AEP’s strategy include:
•The announcement of a five-year, $54 billion capital investment plan that continues to build the energy grid of the future.
•Adding more than 20,000 MWs of diverse generation resources through 2034 to support resource adequacy, resiliency, affordability and the increasing customer demand for power driven by data processors and economic development.
•Building a culture of accountability and operational excellence to effectively support regulated operations and enhance customer service.
•Maintaining a strong balance sheet and achieving our financial targets.
AEP CONSOLIDATED RESULTS OF OPERATIONS
2024 Compared to 2023
Earnings Attributable to AEP Common Shareholders increased from $2.2 billion in 2023 to $3.0 billion in 2024 primarily due to:
•A favorable impact from the receipt of PLRs in 2024 related to the treatment of NOLCs in retail rate making. See “NOLCs in Retail Jurisdictions - IRS PLRs” section below for additional information.
•Favorable rate proceedings in AEP’s various jurisdictions.
•Investment in transmission assets, which resulted in higher revenues and income.
•An increase in sales volumes driven by favorable weather.
•Unfavorable regulatory decisions in Texas, West Virginia and at FERC in 2023.
•A loss on the sale of the competitive contracted renewables portfolio in 2023.
These increases were partially offset by:
•A revenue refund provision related to SWEPCo’s 2012 Texas Base Rate Case and the Turk Plant.
•An increase in operating expenses due to the Federal EPA’s revised CCR rule finalized in May 2024.
•An increase in severance expenses and pension settlement expenses resulting from the voluntary severance program announced in April 2024.
See “Results of Operations” section for additional information by operating segment.
RECENT DEVELOPMENTS AND TRANSACTIONS
Noncontrolling Interest in OHTCo and IMTCo (Applies to AEP and AEPTCo)
In January 2025, AEP announced a partnership between nonaffiliated entities to acquire a 19.9% indirect noncontrolling interest in OHTCo and IMTCo for $2.82 billion. Net proceeds will be used to help finance AEP’s $54 billion capital plan for 2025-2029, announced in November 2024, driven by transmission and distribution infrastructure upgrades and new generation to support anticipated load growth. The transaction is subject to FERC approval and clearance from the Committee on Foreign Investment in the United States. AEP expects to close on the transaction in the second half of 2025. If the transaction does not close, it could reduce expected future cash flows and impact financial condition.
Acquisition of the Diversion Wind Farm
In December 2024, SWEPCo acquired 100% of the equity interests in Diversion Wind Energy, LLC, the owner of Diversion wind farm. The Diversion wind farm is a newly constructed 201 MW wind facility located in Baylor County, Texas and was placed in service in December 2024. Output from Diversion serves FERC wholesale load and retail customers in Arkansas and Louisiana. SWEPCo’s Louisiana jurisdictional share of the Diversion revenue requirement, net of PTC benefit, is recoverable through an authorized rider until the amounts are reflected in base rates. Recovery of the Arkansas portion of the Diversion revenue requirement is expected to begin in 2026 through base rates. See the “Diversion Wind Farm” section of Note 7 for additional information.
Disposition of AEP Onsite Partners
In May 2024, AEP signed an agreement to sell AEP OnSite Partners to a nonaffiliated third-party. AEP OnSite Partners targets opportunities in distributed solar, combined heat and power, energy storage, waste heat recovery, energy efficiency, peaking generation and other energy solutions. In September 2024, AEP completed the sale to a nonaffiliated third-party and received cash proceeds of approximately $318 million, net of taxes and transaction costs. The proceeds were used to pay down short-term debt. See the “Disposition of AEP OnSite Partners” section of Note 7 for additional information.
Fuel Cell Agreement
In November 2024, AEP executed a purchase agreement to acquire 100 MWs of solid oxide fuel cells with an option to acquire up to one gigawatt in total by the end of 2025. AEP, through its utility subsidiaries, is offering data centers and other large customers this custom solution to support their growing energy needs while grid infrastructure enhancements are completed to accommodate demand. Through the date of this filing OPCo has signed multiple contracts for electricity service from fuel cells with customers and is filing those contracts with the PUCO for approval. See “AEP Development Services (Applies to OPCo)” section of Note 18 for additional information.
CCR Rule Revisions
In April 2024, the Federal EPA finalized revisions to the CCR Rule to expand the scope of the rule to include inactive impoundments at inactive facilities as well as to establish requirements for currently exempt solid waste management units that involve the direct placement of CCR on the land. In the second quarter of 2024, AEP evaluated the applicability of the rule to current and former plant sites and recorded a $674 million increase in ARO. See “CCR Rule” section in Environmental Issues below for additional information.
NOLCs in Retail Jurisdictions - IRS PLRs
The Registrants have made rate filings with state commissions to transition to stand-alone treatment of NOLCs in retail rate making. The Registrants completed the transition in Tennessee, West Virginia and Virginia prior to 2024 and in Michigan in July 2024. In the most recent KPCo, I&M (Indiana jurisdiction), PSO and SWEPCo base rate cases, the companies filed to transition to stand-alone rate making which was contingent upon a supportive PLR from the IRS.
In April 2024, supportive PLRs for certain retail jurisdictions were received from the IRS, effective March 2024. The PLRs concluded NOLCs on a stand-alone rate making basis should be included in rate base and should also be included in the computation of Excess ADIT regulatory liabilities to be refunded to customers. Based on this conclusion, I&M, PSO and SWEPCo recognized regulatory assets related to revenue requirement amounts to be collected from customers, reduced Excess ADIT regulatory liabilities and recorded favorable impacts to net income in the first quarter of 2024 as shown in the table below:
| | | | | | | | | | | | | | | | | | | | |
| Company | | Increase in Pretax Income from the Recognition of Regulatory Assets | | Reduction in Income Tax Expense (a) | | Increase in Net Income |
| | (in millions) |
| I&M | | $ | 20.2 | | | $ | 49.5 | | | $ | 69.7 | |
| PSO | | 12.1 | | | 44.7 | | | 56.8 | |
| SWEPCo | | 35.4 | | | 101.1 | | | 136.5 | |
| AEP Total | | $ | 67.7 | | | $ | 195.3 | | | $ | 263.0 | |
(a)Primarily relates to a $224 million remeasurement of Excess ADIT Regulatory Liabilities partially offset by $29 million of tax expense on favorable pretax income from the recognition of regulatory assets.
Beginning in the second quarter of 2024 and continuing until the NOLC revenue requirement is in rates, AEP is recognizing additional regulatory assets related to revenue requirement amounts to be collected from customers. Through December 31, 2024, AEP has recognized NOLC regulatory assets of $93 million.
In the second quarter of 2024, requests seeking to establish a recovery mechanism for these regulatory assets were filed in Indiana, Oklahoma and Texas. Certain intervenors in each jurisdiction have challenged the recovery or have proposed ratemaking treatment that would offset the recovery of the regulatory assets. In the fourth quarter of 2024, hearings on the merits were held in Indiana and Oklahoma. In January 2025, a second hearing on the merits in Oklahoma was held. A hearing is scheduled for the first quarter of 2025 in Texas.
Voluntary Severance Program
In April 2024, management announced a voluntary severance program designed to achieve a reduction in the size of AEP’s workforce. Approximately 7,400 of AEP’s 16,800 employees were eligible to participate in the program. Approximately 1,000 employees chose to take the voluntary severance package and substantially all terminated employment in July 2024. The severance program provides two weeks of base pay for every year of service with a minimum of four weeks and a maximum of 52 weeks of base pay. Certain positions impacted by the voluntary severance program have been and will continue to be refilled to maintain safe, effective and efficient operations. Net savings from the program will help offset increasing operating expenses and high interest costs in order to keep electricity costs affordable for customers. AEP recorded a $122 million pretax expense in the second quarter of 2024 related to this voluntary severance program. The Registrants paid $118 million of the severance benefits in the second half of 2024. In addition, AEP also recognized a settlement charge of $90 million in 2024 due to the remeasurement of pension obligations driven by the voluntary severance program. AEP will seek recovery for the portion of the expense related to regulated operations. See Note 14 - Voluntary Severance Program for additional information.
Customer Demand
AEP uses sales volumes by customer class as a way to measure drivers of customer demand. In 2024, AEP experienced an increase in customer demand for power driven by the growth in new data processing loads and economic development in the commercial customer class. AEP currently forecasts continued growth in customer demand in 2025. The percentage change and forecasted percentage change in sales volumes by customer class are shown in the table below.
(a)Percentage change for the year ended December 31, 2024 as compared to the year ended December 31, 2023.
(b)Forecasted percentage change for the year ending December 31, 2025 compared to the year ended December 31, 2024.
(c)The commercial sales growth is primarily due to new data processor loads and economic development.
Large Load and Data Center Tariffs
In July 2024, I&M submitted an application to the IURC to modify its Industrial Power Tariff to incorporate terms and conditions of service that would apply to large load customers with a load, individually or in the aggregate, greater than 150 MW. Among other things, the proposal aimed to extend the duration of electric service agreements (ESAs), implement higher minimum demand charges compared to current tariff provisions and address changes in contract capacity commitments and termination of service.
In November 2024, I&M, the Indiana Office of Utility Consumer Counselor and all intervening parties submitted a unanimous joint settlement agreement resolving all issues. The settlement agreement included terms that lowered the threshold for individual customer loads to 70 MW, reduced the minimum contract term to 12 years plus the load ramp period not to exceed 5 years, revised how a customer’s minimum bill would be calculated and revised terms and conditions associated with contract capacity commitments and termination of service. A hearing was held and the parties submitted a joint proposed order in December 2024. I&M anticipates an IURC decision in 2025.
In May 2024, OPCo submitted an application to the PUCO to establish new tariffs for data centers and mobile data centers that enter new retail service contracts after the tariff's effective date. Among other things, the proposal aimed to extend the duration of ESAs and implement higher minimum demand charges compared to current tariffs. In October 2024, intervening parties representing data centers and certain other parties presented a stipulation endorsing the application with certain adjustments, including broadening the tariff's applicability to all large loads (not limited to data centers) that meet specified criteria, as well as reducing the proposed minimum demand charges.
Subsequently, in October 2024, OPCo, along with the PUCO Staff, the Ohio Consumers Counsel, and additional parties, filed a separate stipulation suggesting the approval of the application with modifications. This stipulation recommended retaining the application’s proposal to apply the tariff only to data center customers and it proposed setting minimum demand charges that were higher than those proposed in the October 2024 stipulation but lower than those in the original application. Hearings were held in December 2024 and January 2025. OPCo anticipates a PUCO decision in 2025.
New Generation to Support Reliability
The growth of AEP’s regulated generation portfolio reflects the company’s commitment to meet increasing customer demand for power while balancing cost and reliability.
Significant Approved Renewable Generation Filings
AEP has received regulatory approvals from various state regulatory commissions to acquire approximately 2,303 MWs of owned renewable generation facilities, totaling approximately $5.5 billion. The estimated cost of these facilities are included in the Budgeted Capital Expenditures disclosure included in the Financial Condition section below. In addition, AEP has received regulatory approvals for 637 MWs of renewable PPAs. The following table summarizes regulatory approvals received for active renewable projects as of December 31, 2024:
| | | | | | | | | | | | | | | | | | | | | | | | | | |
| Company | | Generation Type | | Expected Commercial Operation | | Owned/PPA | | Generating Capacity |
| | | | | | | | (in MWs) |
| APCo | | Solar | | 2025-2027 | | PPA | | 184 | |
| APCo (a) | | Wind | | 2025-2026 | | Owned | | 344 | |
| I&M | | Solar | | 2026-2027 | | PPA | | 280 | |
| I&M | | Solar | | 2027 | | Owned | | 469 | |
| I&M | | Wind | | 2026 | | PPA | | 100 | |
| PSO (b) | | Solar | | 2025-2026 | | Owned | | 339 | |
| PSO (b) | | Wind | | 2025-2026 | | Owned | | 553 | |
| SWEPCo | | Solar | | 2025 | | PPA | | 73 | |
| SWEPCo | | Wind | | 2025 | | Owned | | 598 | |
| Total Approved Renewable Projects | | | | 2,940 | |
(a)APCo issued notice to proceed for the construction of all 344 MWs of wind capacity.
(b)PSO has issued notices to proceed for the construction of three wind facilities and one solar facility for a combined total capacity of 742 MWs. These facilities are part of the approved projects contemplated within PSO’s 893 MWs of total new renewable generation.
Natural Gas Generation
In June 2024, PSO entered into a PSA to acquire a 795 MW combined-cycle power generation facility located in Oklahoma. The acquisition is subject to OCC pre-approval including the approval of a rider to allow asset recovery prior to the inclusion in base rates in a future rate case. In January 2025, intervenors and the OCC staff filed testimony. While the OCC staff testified that PSO established the need for the acquisition and the Oklahoma Attorney General agreed PSO considered reasonable alternatives, other recommendations included requesting additional analysis on the requirement to consider reasonable alternatives and recommending future cost caps and performance guarantees. PSO filed rebuttal testimony in January 2025 and a hearing with the OCC is scheduled to occur in March 2025. Subject to obtaining the required approvals from FERC and the OCC, PSO expects to close on the transaction by June 2025.
In December 2024, SWEPCo filed an application for a Certificate of Convenience and Necessity (CCN) with the APSC, LPSC and PUCT for the construction of the Hallsville Natural Gas Plant (450 MWs) and the fuel conversion of Welsh Plant, Units 1 and 3 to natural gas. In the application for the CCN, SWEPCo seeks to site the Hallsville Natural Gas Plant at the location of the now-retired Pirkey Power Plant. If approved, the projects will help SWEPCo address increasing SPP capacity requirements. SWEPCo estimates the combined capital cost of these projects is approximately $723 million and the projects would be placed in service between November 2027 and May 2028.
Significant Generation Requests for Proposal (RFP)
The table below includes active RFPs issued for both owned and purchased power generation. Projects selected will be subject to regulatory approval.
| | | | | | | | | | | | | | | | | | | | | | |
| Company | | Issuance Date | | Projected
In-Service Dates | | | | Generating Capacity |
| | | | | | | | (in MWs) |
| | | | | | | | |
| PSO (a) | | November 2023 | | 2027/2028 | | | | 1,500 | |
| | | | | | | | |
| APCo (b) | | May 2024 | | 2028 | | | | 1,100 | |
| I&M (c) | | September 2024 | | 2029 | | | | 4,000 | |
| Total Significant RFPs | | | | | | | | 6,600 | |
(a)RFP is seeking 1,500 MW of SPP accredited capacity and associated energy through an all-source solicitation.
(b)RFP is seeking wind, solar, stand-alone battery energy storage systems and Renewable Energy Certificates.
(c)RFP seeks up to 4,000 MW (cumulatively) from intermittent (wind, solar), non-intermittent (dispatchable), and emerging technology resources.
Capacity Purchase Agreements
In addition to the generation projects discussed above, AEP enters into Capacity Purchase Agreements (CPA) to satisfy operating companies capacity reserve margins to serve customers. The following table includes CPA amounts under contract as of December 31, 2024, by year, for the five year period 2025-2029:
| | | | | | | | | | | | | | | | | | | | | | | | | | | | | | | | | | | | | | | | | | | | | |
| | | | I&M | | | | KPCo | | PSO | | SWEPCo | | |
| | | | | Natural Gas | | | | Natural Gas | | Natural Gas | | Wind | | Natural Gas | | Wind | | |
| Delivery Start Year | | | | (in MWs) |
| 2025 | | | | | 440 | | | | | 85 | | | 1,150 | | | 29 | | | 500 | | | 157 | | | |
| 2026 | | | | | 1,081 | | (a) | | | — | | | 980 | | | 86 | | | 350 | | | 100 | | | |
| 2027 | | | | | 210 | | | | | — | | | 260 | | | 86 | | | 300 | | | 100 | | | |
| 2028 | | | | | 1,050 | | | | | — | | | 260 | | | — | | | 300 | | | — | | | |
| 2029 | | | | | 1,050 | | | | | — | | | 260 | | | — | | | 300 | | | — | | | |
| | | | | | | | | | | | | | | | | | | |
(a)In January 2025, I&M terminated a 481 MW and a 600 MW capacity purchase agreement.
Regulatory Matters - Utility Rates and Rate Proceedings
The Registrants are involved in rate cases and other proceedings with their regulatory commissions in order to establish fair and appropriate electric service rates to recover their costs and earn a fair return on their investments. Depending on the outcomes, these rate cases and proceedings can have a material impact on results of operations, cash flows and possibly financial condition. AEP is currently involved in the following key proceedings.
The following tables show the Registrants’ completed and pending base rate case proceedings in 2024. See Note 4 - Rate Matters for additional information.
Completed Base Rate Case Proceedings
| | | | | | | | | | | | | | | | | | | | | | | | | | | | | |
| | | | Annual | | | | |
| | | | Base Revenue | | Approved | | New Rates |
| Company | | Jurisdiction | | Increase | | ROE | | Effective |
| | | | (in millions) | | | | |
| I&M | | Indiana | | $ | 42.6 | | (a) | | 9.85% | | May 2024 |
| I&M | | Michigan | | 17.3 | | | | 9.86% | | July 2024 |
| AEP Texas | | Texas | | 70.0 | | | | 9.76% | | October 2024 |
| APCo | | Virginia | | 9.8 | | | | 9.75% | | January 2025 |
| PSO | | Oklahoma | | 119.5 | | | | 9.5% | | October 2024 |
(a)A two-step increase in Indiana rates with a $28 million annual increase effective May 2024 with the remaining $15 million annual increase effective in January 2025 subject to I&M’s level of electric plant in service as of December 31, 2024 in comparison to I&M’s 2024 forecasted test year.
Pending Base Rate Case Proceedings
| | | | | | | | | | | | | | | | | | | | | | | | | | | | | | |
| | | | | | Annual | | | |
| | | | Filing | | Base Revenue | | Requested | |
| Company | | Jurisdiction | | Date | | Increase Request | | ROE | |
| | | | | | (in millions) | | | |
| APCo | | West Virginia | | November 2024 | | $ | 250.5 | | | | 10.8% | |
Other Significant Regulatory Matters
Ohio ESP Filings
In January 2023, OPCo filed an application with the PUCO to approve an ESP that included proposed rate adjustments, proposed new riders and the continuation and modification of certain existing riders, including the DIR, effective June 2024 through May 2030. The proposal includes a return on common equity of 10.65% on capital costs for certain riders. In June 2023, intervenors filed testimony opposing OPCo’s plan for various new riders and modifications to existing riders, including the DIR. In September 2023, OPCo and certain intervenors filed a settlement agreement with the PUCO addressing the ESP application. The settlement included a four year term from June 2024 through May 2028, an ROE of 9.7% and continuation of a number of riders including the DIR subject to revenue caps. In April 2024, the PUCO issued an order approving the settlement agreement. In May 2024, intervenors filed an application for rehearing with the PUCO on the approved settlement agreement and the PUCO denied the intervenors’ application for rehearing in June 2024.
2012 Texas Base Rate Case
In 2012, SWEPCo filed a request with the PUCT to increase annual base rates primarily due to the completion of the Turk Plant. In 2013, the PUCT issued an order affirming the prudence of the Turk Plant but determined that the Turk Plant’s Texas jurisdictional capital cost cap established in a previous Certificate of Convenience and Necessity case also limited SWEPCo’s recovery of AFUDC in addition to limits on its recovery of cash construction costs. Upon rehearing in 2014, the PUCT reversed its initial ruling and determined that AFUDC was excluded from the Turk Plant’s Texas jurisdictional capital cost cap. In 2017, the Texas District Court upheld the PUCT’s 2014 order and intervenors filed appeals with the Texas Third Court of Appeals. In August 2021, the Texas Third Court of Appeals reversed the Texas District Court judgment affirming the PUCT’s order on AFUDC, concluding that the language of the PUCT’s original 2008 order intended to include AFUDC in the Texas jurisdictional capital cost cap, and remanded the case to the PUCT for future proceedings. In November 2021, SWEPCo and
the PUCT submitted Petitions for Review with the Texas Supreme Court. In October 2022, the Texas Supreme Court denied the Petitions for Review submitted by SWEPCo and the PUCT. In December 2022, SWEPCo and the PUCT filed requests for rehearing with the Texas Supreme Court. In June 2023, the Texas Supreme Court denied SWEPCo’s request for rehearing and the case was remanded to the PUCT for future proceedings. In October 2023, SWEPCo filed testimony with the PUCT in the remanded proceeding recommending no refund or disallowance.
In December 2023, the PUCT approved a preliminary order stating the PUCT will not address SWEPCo’s request that would allow the PUCT to find cause to allow SWEPCo to exceed the Texas jurisdictional capital cost cap in the current remand proceeding. As a result of the PUCT’s approval of the preliminary order, SWEPCo recorded a pretax, non-cash probable disallowance of $86 million in the fourth quarter of 2023.
The PUCT’s December 2023 approval of the preliminary order determined that it will address, in the ongoing PUCT remand proceeding, any potential revenue refunds to customers that may be required by future PUCT orders. On March 1, 2024, SWEPCo filed supplemental direct testimony with the PUCT in response to the December 2023 preliminary order. On March 8, 2024, intervenors and the PUCT staff filed a motion with the PUCT to strike portions of SWEPCo’s October 2023 direct testimony and March 2024 supplemental direct testimony. On March 19, 2024, the ALJ granted portions of the motion, which included removal of testimony supporting SWEPCo’s position that refunds were not appropriate. On March 28, 2024, SWEPCo filed an appeal of the ALJ decision with the PUCT. In April 2024, intervenors and PUCT staff submitted testimony recommending customer refunds through December 2023 ranging from $149 million to $197 million, including carrying charges, with refund periods ranging from 18 months to 48 months. In May 2024, the PUCT denied SWEPCo’s appeal of the ALJ’s March 2024 decision. In the second quarter of 2024, based on the PUCT’s decision, SWEPCo recorded a one-time, probable revenue refund provision of $160 million, including interest, associated with revenue collected from February 2013 through December 2023. In June 2024, SWEPCo and parties to the remand proceeding reached an agreement in principle that would resolve all issues in the case. In October 2024, SWEPCo filed the settlement agreement with the PUCT. Under the settlement agreement, SWEPCo would refund, over a two-year period, $148 million, including interest, associated with revenue collected from February 2013 through December 2023 and remove AFUDC in excess of the Texas jurisdictional capital cost cap from rate base. In January 2025, the settlement agreement was approved by the PUCT.
FERC 2021 PJM and SPP Transmission Formula Rate Challenge
The Registrants transitioned to stand-alone treatment of NOLCs in its PJM and SPP transmission formula rates beginning with the 2022 projected transmission revenue requirements and 2021 true-up to actual transmission revenue requirements, and provided notice of this change in informational filings made with the FERC. Stand-alone treatment of the NOLCs for transmission formula rates increased the annual revenue requirements for years 2024, 2023, 2022 and 2021 by $52 million, $61 million, $69 million and $78 million, respectively.
In January 2024, the FERC issued two orders granting formal challenges by certain unaffiliated customers related to stand-alone treatment of NOLCs in the 2021 Transmission Formula Rates of the AEP transmission owning subsidiaries within PJM and SPP. The FERC directed the AEP transmission owning subsidiaries within PJM and SPP to provide refunds with interest on all amounts collected for the 2021 rate year, and for such refunds to be reflected in the annual update for the next rate year. Accordingly, in the third quarter of 2024, the AEP transmission owning subsidiaries within SPP provided a portion of the 2021 rate year refunds, with the remainder of the refunds expected to be provided in 2025. The AEP transmission owning subsidiaries within PJM are expected to provide their respective refunds for the 2021 rate year in 2025. In February 2024, AEPSC on behalf of the AEP transmission owning subsidiaries within PJM and SPP filed requests for rehearing. In March 2024, the FERC denied AEPSC’s requests for rehearing of the January 2024 orders by operation of law and stated it may address the requests for rehearing in future orders. In March 2024, AEPSC submitted refund compliance reports to the FERC, which preserve the non-finality of the FERC’s January 2024 orders pending further proceedings on rehearing and appeal. In April 2024, AEPSC made filings with the FERC which request that the FERC: (a) reopen the record so that the FERC may take the IRS PLRs received in April 2024 regarding the treatment of stand-alone NOLCs in ratemaking into evidence and consider them in substantive orders on rehearing and (b) stay its January 2024 orders and related compliance filings and refunds to provide time for consideration of the April 2024 IRS PLRs. In May 2024, AEPSC filed a petition for review with the United States Court of Appeals for the District of Columbia Circuit seeking review of the FERC’s January 2024 and March 2024 decisions. In July 2024, the FERC issued orders approving AEPSC’s request to reopen the record for the limited purpose of accepting into the record the IRS PLRs and establish additional briefing procedures. In August 2024, AEPSC filed briefs with the FERC requesting the commission modify or overturn their initial orders.
As a result of the January 2024 FERC orders, the Registrants’ balance sheets reflect a liability for the probable refund of all NOLC revenues included in transmission formula rates for years 2024, 2023, 2022 and 2021, with interest. The Registrants have not yet been directed to make cash refunds related to the 2024, 2023 or 2022 rate years. The probable refunds to affiliated and nonaffiliated customers are reflected as Deferred Credits and Other Noncurrent Liabilities on the balance sheets, with the exception of amounts expected to be refunded within one year which are reflected in Other Current Liabilities. Refunds
probable to be received by affiliated companies, resulting in a reduction to affiliated transmission expense, were deferred as an increase to Regulatory Liabilities or a reduction to Regulatory Assets on the balance sheets where management expects that refunds would be returned to retail customers through authorized retail jurisdiction rider mechanisms.
Kentucky Securitization Case
In January 2024, the KPSC issued a financing order approving KPCo’s request to securitize certain regulatory assets balances as of the time securitization bonds are issued and concluding that costs requested for recovery through securitization were prudently incurred. The KPSC’s financing order includes certain additional requirements related to securitization bond structuring, marketing, placement and issuance that were not reflected in KPCo’s proposal. In accordance with Kentucky statutory requirements and the financing order, the issuance of the securitized bonds is subject to final review by the KPSC after bond pricing. KPCo expects to proceed with the securitized bond issuance process and to complete the securitization process in the first half of 2025, subject to market conditions. As of December 31, 2024, regulatory asset balances expected to be recovered through securitization total $491 million and include: (a) $303 million of plant retirement costs, (b) $79 million of deferred storm costs related to 2020, 2021, 2022 and 2023 major storms, (c) $50 million of deferred purchased power expenses, (d) $57 million of under-recovered purchased power rider costs and (e) $2 million of deferred issuance-related expenses, including KPSC advisor expenses. If any of these costs are not recoverable, it could reduce future net income and cash flows and impact financial condition.
Investigation of the Service, Rates and Facilities of KPCo
In June 2023, the KPSC issued an order directing KPCo to show cause why it should not be subject to Kentucky statutory remedies, including fines and penalties, for failure to provide adequate service in its service territory. The KPSC’s show cause order did not make any determination regarding the adequacy of KPCo’s service. In July 2023, KPCo filed a response to the show cause order demonstrating that it has provided adequate service. In December 2023 and February 2024, KPCo and certain intervenors filed testimony with the KPSC. A hearing with the KPSC was previously scheduled to occur in June 2024. The hearing was postponed and has not yet been rescheduled. If any fines or penalties are levied against KPCo relating to the show cause order, it could reduce net income and cash flows and impact financial condition.
KPCo Fuel Adjustment Clause (FAC) Review
In December 2023, KPCo received intervenor testimony in its FAC review for the two-year period ending October 31, 2022, recommending a disallowance ranging from $44 million to $60 million of its total $432 million purchased power cost recoveries as a result of proposed modifications to the ratemaking methodology that limits purchased power costs recoverable through the FAC. In November 2024, KPCo and intervening parties entered into a settlement agreement whereby KPCo agreed to provide customer rate credits, which will reduce FAC costs otherwise recoverable in 2025 and 2026, for a combined $17 million over the periods January 2025 through April 2025 and January 2026 through April 2026 based on actual customer usage. In December 2024, the KPSC issued an order approving the settlement agreement without modification.
Ohio House Bill 6 (HB 6)
In July 2019, HB 6, which offered incentives for power-generating facilities with zero or reduced carbon emissions, was signed into law by the Ohio Governor. HB 6 terminated energy efficiency programs as of December 31, 2020, including OPCo’s shared savings revenues of $26 million annually and phased out renewable mandates after 2026. HB 6 also provided for continued recovery of existing renewable energy contracts on a bypassable basis through 2032 and included a provision for continued recovery of OVEC costs through 2030 which is allocated to all electric distribution utility customers in Ohio on a non-bypassable basis. OPCo’s Inter-Company Power Agreement for OVEC terminates in June 2040. In July 2020, an investigation led by the U.S. Attorney’s Office resulted in a federal grand jury indictment of the Speaker of the Ohio House of Representatives, Larry Householder, four other individuals, and Generation Now, an entity registered as a 501(c)(4) social welfare organization, in connection with an alleged racketeering conspiracy involving the adoption of HB 6. Certain defendants in that case had previously plead guilty and, in March 2023, a federal jury convicted Larry Householder and another individual of participating in the racketeering conspiracy. In February 2024, an Ohio grand jury indictment charged certain former FirstEnergy executives and the former PUCO Chairman and related entities with various crimes, including bribery. In January 2025, a federal grand jury indictment charged certain former FirstEnergy executives with a racketeering conspiracy based on similar allegations. In 2021, four AEP shareholders filed derivative actions purporting to assert claims on behalf of AEP against certain AEP officers and directors. In April 2024, AEP reached an agreement with the four shareholders to fully and finally resolve the derivative actions, and the settlement of those actions was approved in October 2024. See “Litigation Related to Ohio House Bill 6” section of Litigation below for additional information.
In March 2021, the Governor of Ohio signed legislation that, among other things, repealed the payments to the nonaffiliated owner of Ohio’s nuclear power plants that were previously authorized under HB 6. The new legislation, House Bill 128, went into effect in May 2021 and leaves unchanged other provisions of HB 6 regarding energy efficiency programs, recovery of renewable energy costs and recovery of OVEC costs. To the extent that the law changes or OPCo: (a) is unable to recover the costs of renewable energy contracts on a bypassable basis by the end of 2032 or (b) is unable to recover costs of OVEC after 2030, it could reduce future net income and cash flows and impact financial condition.
LITIGATION
In the ordinary course of business, AEP is involved in employment, commercial, environmental and regulatory litigation. Since it is difficult to predict the outcome of these proceedings, management cannot predict the eventual resolution, timing or amount of any loss, fine or penalty. Management assesses the probability of loss for each contingency and accrues a liability for cases that have a probable likelihood of loss if the loss can be estimated. Adverse results in these proceedings have the potential to reduce future net income and cash flows and impact financial condition. See Note 4 – Rate Matters and Note 6 – Commitments, Guarantees and Contingencies for additional information.
Litigation Related to Ohio House Bill 6 (HB 6)
In 2019, Ohio adopted and implemented HB 6 which benefits OPCo by authorizing rate recovery for certain costs including renewable energy contracts and OVEC’s coal-fired generating units. OPCo engaged in lobbying efforts and provided testimony during the legislative process in connection with HB 6. In July 2020, an investigation led by the U.S. Attorney’s Office resulted in a federal grand jury indictment of an Ohio legislator and associates in connection with an alleged racketeering conspiracy involving the adoption of HB 6. After AEP learned of the criminal allegations against the Ohio legislator and others relating to HB 6, AEP, with assistance from outside advisors, conducted a review of the circumstances surrounding the passage of the bill. Management does not believe that AEP was involved in any wrongful conduct in connection with the passage of HB 6.
In August 2020, an AEP shareholder filed a putative class action lawsuit in the U.S. District Court for the Southern District of Ohio against AEP and certain of its officers for alleged violations of securities laws. In December 2021, the district court issued an opinion and order dismissing the securities litigation complaint with prejudice, determining that the complaint failed to plead any actionable misrepresentations or omissions. The plaintiffs did not appeal the ruling.
In January 2021, an AEP shareholder filed a derivative action in the U.S. District Court for the Southern District of Ohio purporting to assert claims on behalf of AEP against certain AEP officers and directors. In February 2021, a second AEP shareholder filed a similar derivative action in the Court of Common Pleas of Franklin County, Ohio. In April 2021, a third AEP shareholder filed a similar derivative action in the U.S. District Court for the Southern District of Ohio and a fourth AEP shareholder filed a similar derivative action in the Supreme Court for the State of New York, Nassau County. These derivative complaints allege the officers and directors made misrepresentations and omissions similar to those alleged in the putative securities class action lawsuit filed against AEP. The derivative complaints (collectively, the “Derivative Actions”) together assert claims for: (a) breach of fiduciary duty, (b) waste of corporate assets, (c) unjust enrichment, (d) breach of duty for insider trading and (e) contribution for violations of sections 10(b) and 21D of the Securities Exchange Act of 1934; and seek monetary damages and changes to AEP’s corporate governance and internal policies among other forms of relief. The court entered a scheduling order in the New York state court derivative action staying the case other than with respect to briefing the motion to dismiss. AEP filed substantive and forum-based motions to dismiss in April 2022. In June 2022, the Ohio state court entered an order continuing the stays of that case until the final resolution of the consolidated derivative actions pending in Ohio federal district court. In September 2022, the New York state court granted the forum-based motion to dismiss with prejudice and the plaintiff subsequently filed a notice of appeal with the New York appellate court. In January 2023, the New York plaintiff filed a motion to intervene in the pending Ohio federal court action and withdrew his appeal in New York. The two derivative actions pending in federal district court in Ohio have been consolidated and the plaintiffs in the consolidated action filed an amended complaint. AEP filed a motion to dismiss the amended complaint and subsequently filed a brief in opposition to the New York plaintiffs’ motion to intervene in the consolidated action in Ohio. In March 2023, the federal district court issued an order granting the motion to dismiss with prejudice and denying the New York plaintiffs’ motion to intervene. In April 2023, one of the plaintiffs filed a notice of appeal to the U.S. Court of Appeals for the Sixth Circuit of the Ohio federal district court order dismissing the consolidated action and denying the intervention.
In March 2021, AEP received a litigation demand letter from counsel representing a purported AEP shareholder. The litigation demand letter was directed to the Board of Directors of AEP (AEP Board) and contained factual allegations involving HB 6 that were generally consistent with those in the derivative litigation filed in state and federal court. The shareholder that sent the letter has since withdrawn the litigation demand, which is now terminated and of no further effect. In April 2023, AEP received a litigation demand letter from counsel representing the purported AEP shareholder who had filed the dismissed derivative action in New York state court and unsuccessfully tried to intervene in the consolidated derivative actions in Ohio federal court the (Litigation Demand). The Litigation Demand is directed to the AEP Board and contains factual allegations involving HB 6 that are generally consistent with those in the Derivative Actions. The Litigation Demand requested, among other things, that the AEP Board undertake an independent investigation into alleged legal violations by certain current and former directors and officers, and that AEP commence a civil action asserting claims similar to the claims asserted in the Derivative Actions. The AEP Board considered the Litigation Demand and formed a committee of the Board (the Demand Review Committee) to investigate, review, monitor and analyze the Litigation Demand and make a recommendation to the AEP Board regarding a reasonable and appropriate response to the same.
In April 2024, AEP reached an agreement with the four shareholders to fully and finally resolve the Derivative Actions and the Litigation Demand, and all claims asserted or that could have been asserted by any AEP shareholder based on the facts alleged, in the manner and upon the terms and conditions set forth in the settlement documents (the Settlement). In July 2024, the U.S. District Court preliminarily approved the Settlement. The Settlement includes a payment of $450 thousand for attorneys’ fees and the implementation of certain governance changes outlined in the Settlement, many of which previously had been put in place. The Settlement does not include any admission of liability. In October 2024, the District Court issued an Order and Judgment approving the Settlement and granted an Order of Dismissal with Prejudice. Under the Settlement, all Derivative Actions have been dismissed, the Litigation Demand has been withdrawn, and those matters and claims have been resolved pursuant to the terms of the Settlement.
In May 2021, AEP received a subpoena from the SEC’s Division of Enforcement seeking various documents, including documents relating to the passage of HB 6 and documents relating to AEP’s policies and financial processes and controls. In August 2022, AEP received a second subpoena from the SEC seeking various additional documents relating to its ongoing investigation. In January 2025, AEP and the SEC reached a settlement concluding and resolving the SEC’s investigation concerning AEP’s relationship with and statements about Empowering Ohio’s Economy, a 501(c)(4) organization and AEP’s related internal accounting and disclosure controls. Under the terms of the administrative order, in which AEP neither admits nor denies the SEC’s findings, AEP agreed to pay a civil penalty of $19 million and to cease and desist from committing or causing any violations and any future violations of the specified provisions of the federal securities laws. AEP recorded an accrual for the full amount of the penalty in the third quarter of 2024. The $19 million penalty is included in Other Operation expenses on AEP’s statements of income and in Other Current Liabilities on AEP’s balance sheet.
Claims for Indemnification Made by Owners of the Gavin Power Station
In November 2022, the Federal EPA issued a final decision denying Gavin Power LLC’s requested extension to allow a CCR surface impoundment at the Gavin Power Station to continue to receive CCR and non-CCR waste streams after April 11, 2021 until May 4, 2023 (the Gavin Denial). As part of the Gavin Denial, the Federal EPA made several assertions related to the CCR Rule (see “CCR Rule” section below for additional information), including an assertion that the closure of the 300 acre unlined fly ash reservoir (FAR) is noncompliant with the CCR Rule in multiple respects. The Gavin Power Station was formerly owned and operated by AEP and was sold to Gavin Power LLC and Lightstone Generation LLC in 2017. Pursuant to the PSA, AEP maintained responsibility to complete closure of the FAR in accordance with the closure plan approved by the Ohio EPA which was completed in July 2021. The PSA contains indemnification provisions, pursuant to which the owners of the Gavin Power Station have notified AEP they believe they are entitled to indemnification for any damages that may result from these claims, including any future enforcement or litigation resulting from any determinations of noncompliance by the Federal EPA with various aspects of the CCR Rule consistent with the Gavin Denial. The owners of the Gavin Power Station have also sought indemnification for landowner claims for property damage allegedly caused by modifications to the FAR. Management does not believe that the owners of the Gavin Power Station have any valid claim for indemnity or otherwise against AEP under the PSA. In January 2024, Gavin Power LLC also filed a complaint with the United States District Court for the Southern District of Ohio, alleging various violations of the Administrative Procedure Act and asserting that the Federal EPA, through its prior inaction, has waived and is estopped from raising certain objections raised in the Gavin Denial. Management is unable to determine a range of potential losses that is reasonably possible of occurring.
Litigation Regarding Justice Thermal Coal Contract
In December 2023, APCo filed a suit in the Franklin County Ohio Court of Common Pleas seeking a declaratory judgment confirming APCo’s right to terminate a long-term coal contract with Justice Thermal LLC (Justice Thermal) based on Justice Thermal’s failure to perform under the contract. APCo terminated that contract in January 2024, and in April 2024, APCo filed an amended complaint seeking a declaration that the termination was proper and also seeking damages for Justice Thermal’s breach of contract. Justice Thermal filed an answer and counterclaim in April 2024, contesting the validity of the contract termination and asserting counterclaims. The parties entered into a Settlement Agreement and Release pursuant to which the litigation was dismissed with prejudice in September 2024 and each party released the other from all claims relating to the contract or the litigation, and as a result this matter has been resolved.
ENVIRONMENTAL ISSUES
AEP has a substantial capital investment program and incurs additional operational costs to comply with environmental control requirements. Additional investments and operational changes will be made in response to existing and potential future requirements to reduce emissions from fossil generation and in response to rules governing the beneficial use and disposal of coal combustion by-products, clean water and renewal permits for certain water discharges. AEP is unable to predict changes in regulations, regulatory guidance, legal interpretations, policy positions and implementation actions that may result from the change in Presidential administrations.
AEP is engaged in litigation about environmental issues, was notified of potential responsibility for the clean-up of contaminated sites and incurred costs for disposal of SNF and future decommissioning of the nuclear units. Management is engaged in the development of possible future requirements including the items discussed below.
AEP will seek recovery of expenditures for pollution control technologies and associated costs from customers through rates in regulated jurisdictions. Environmental rules could result in accelerated depreciation, impairment of assets or regulatory disallowances. If AEP cannot recover the costs of environmental compliance, it would reduce future net income and cash flows and impact financial condition.
Impact of Environmental Compliance on the Generating Fleet
The rules and environmental control requirements discussed below will have a material impact on AEP’s operations. As of December 31, 2024, AEP owned generating capacity of approximately 23,200 MWs, of which approximately 10,700 MWs were coal-fired. In April 2024, the Federal EPA announced four major new rules directed at fossil-fuel electric generation facilities. Management continues to evaluate the impacts of these rules on the plans for the future of AEP’s generating fleet, in particular, the economic feasibility of making the requisite environmental investments in AEP’s fossil generation fleet. AEP continues to refine the cost estimates of complying with these rules to identify the best alternative for ensuring compliance with all of the rules while meeting AEP’s obligations to provide reliable and affordable electricity.
The costs of complying with new rules may also change based on: (a) potential state rules that impose additional more stringent standards, (b) additional rulemaking activities in response to court decisions, (c) actual performance of the pollution control technologies installed, (d) changes in costs for new pollution controls, (e) new generating technology developments, (f) total MWs of capacity retired and replaced, including the type and amount of such replacement capacity and (g) other factors.
Clean Air Act Requirements
The CAA establishes a comprehensive program to protect and improve the nation’s air quality and control sources of air emissions. The states implement and administer many of these programs and could impose additional or more stringent requirements. The primary regulatory programs that continue to drive investments in AEP’s existing generating units include: (a) periodic revisions to NAAQS and the development of SIPs to achieve more stringent standards, (b) implementation of the regional haze program by the states and the Federal EPA, (c) regulation of hazardous air pollutant emissions under MATS, (d) implementation and review of CSAPR and (e) the Federal EPA’s regulation of GHG emissions from fossil generation under Section 111 of the CAA. Notable developments in significant CAA regulatory requirements affecting AEP’s operations are discussed in the following sections.
National Ambient Air Quality Standards
The Federal EPA periodically reviews and revises the NAAQS for criteria pollutants under the CAA. Revisions tend to increase the stringency of the standards, which in turn may require AEP to make investments in pollution control equipment at existing generating units, or, since most units are already well controlled, to make changes in how units are dispatched and operated. In February 2024, the Federal EPA finalized a new more stringent annual primary PM2.5 standard.
Areas with air quality that does not meet the new standard will be designated by the Federal EPA as “nonattainment,” which will trigger an obligation for states to revise their SIPs to include additional requirements, resulting in further emission reductions to ensure that the new standard will be met. Areas around some of AEP’s generating facilities may be deemed nonattainment, which may require those facilities to install additional pollution controls or to implement operational constraints. The nonattainment designations by the Federal EPA and the subsequent SIP revisions by the affected states will take some time to complete; therefore, management cannot reasonably estimate the impact on AEP’s operations, cash flows, net income or financial condition.
Regional Haze
The Federal EPA issued a Clean Air Visibility Rule (CAVR) in 2005, which could require power plants and other facilities to install best available retrofit technology to address regional haze in federal parks and other protected areas. CAVR is
implemented by the states, through SIPs, or by the Federal EPA, through FIPs. In 2017, the Federal EPA revised the rules governing submission of SIPs to implement the visibility programs. Petitions for review of the final rule revisions were filed in the U.S. Court of Appeals for the District of Columbia Circuit. In early 2018, the Federal EPA announced plans to revisit aspects of the final rule raised by petitioners in petitions for administrative reconsideration, and the court granted the Federal EPA’s motion to hold the litigation in abeyance.
The Federal EPA disapproved portions of the Texas regional haze SIP and finalized a FIP that allows participation in the CSAPR ozone season program to satisfy the NOX regional haze obligations for electric generating units in Texas. Additionally, the Federal EPA finalized an intrastate SO2 emissions trading program based on CSAPR allowance allocations. Environmental groups filed challenges to these various rulemakings in district courts in the Fifth Circuit and the District of Columbia Circuit. Management cannot predict the outcome of that litigation, although management supports the intrastate trading program as a compliance alternative to source-specific controls and intervened in the Fifth Circuit litigation in support of the Federal EPA. In July 2024, the U.S. District Court for the District of Columbia Circuit entered a consent decree setting deadlines for the Federal EPA to rule on Regional Haze SIPs for 32 states, including Texas. In September 2024, the Federal EPA signed a proposed rule to partially approve and partially disapprove the Texas SIP revision. The proposed rule was published in the Federal Register in October 2024, initiating a public comment period ending November 14, 2024. The deadline for the Federal EPA to take final action on the Texas SIP is May 30, 2025.
Cross-State Air Pollution Rule
CSAPR is a regional trading program that the Federal EPA began implementing in 2015 to address interstate transport of emissions that contribute significantly to nonattainment and interfere with maintenance of the 1997 ozone NAAQS and the 1997 and 2006 PM2.5 NAAQS in downwind states. CSAPR relies on SO2 and NOX allowances and individual state budgets to compel further emission reductions from electric utility generating units. Interstate trading of allowances is allowed on a restricted basis. The Federal EPA has revised, or updated, the CSAPR trading programs several times since they were established.
In January 2021, the Federal EPA finalized a revised CSAPR, which substantially reduced the ozone season NOX budgets for several states, including states where AEP operates, beginning in ozone season 2021. AEP has been able to meet the requirements of the revised rule over the first few years of implementation, and is evaluating its compliance options for later years, when the budgets are further reduced.
In February 2023, the Federal EPA Administrator finalized the disapproval of interstate transport SIPs submitted by 19 states, including Texas, addressing the 2015 Ozone NAAQS. The Federal EPA disapproved interstate transport SIPs submitted by additional states soon thereafter. Disapproval of the SIPs provided the Federal EPA with authority to impose a FIP for those states, replacing the SIPs that were disapproved. In August 2023, a FIP (the Good Neighbor Plan) went into effect that further revised the ozone season NOX budgets under the existing CSAPR program in states to which the FIP applies. As a result of several separate legal challenges brought by states and industry parties in various federal courts, implementation of the FIP has been stayed in all of the states in which AEP operates. In October 2024, the Federal EPA issued a final rule to administratively stay the effectiveness of the Good Neighbor Plan’s requirements for all sources covered by that rule as promulgated where an administrative stay was not already in place. The administrative stay of the Good Neighbor Plan’s effectiveness for power plants and other industrial facilities in each of the 23 states will remain in place until the Supreme Court lifts its order staying enforcement of the Good Neighbor Plan, other courts lift any judicial orders staying the SIP disapproval action as to the state, and the Federal EPA takes subsequent rulemaking action consistent with any judicial rulings on the merits. Additionally, in February 2025, the Federal EPA filed a motion with the court seeking to hold the legal challenges related to the Good Neighbor Plan in abeyance for 60 days, to allow the new administration time to review the rule. Management will continue to monitor the outcome of this litigation and the development of SIPs for any potential impact to operations.
Climate Change, CO2 Regulation and Energy Policy
In April 2024, the Administrator of the Federal EPA signed new GHG standards and guidelines for new and existing fossil-fuel fired sources. The rule relies on carbon capture and sequestration and natural gas co-firing as means to reduce CO2 emissions from coal fired plants and carbon capture and sequestration or limited utilization to reduce CO2 emissions from new gas turbines. The rule also offers early retirement of coal plants in lieu of carbon capture and storage as an alternative means of compliance.
AEP is in the early stages of evaluating and identifying the best strategy for complying with this and other new rules, discussed below, while ensuring the adequacy of resources to meet customer needs. The rule has been challenged by 27 states, numerous companies, trade associations and others. AEP has joined with several other utilities to challenge the rule and has asked the court to stay the rule during the litigation, and the appeals have been consolidated. In July 2024, the U.S. Court of Appeals for the District of Columbia Circuit denied those motions to stay and several parties, including AEP and other utilities, filed
applications with the United States Supreme Court seeking an emergency stay. The Supreme Court denied those applications in October 2024 and the challenges to the rule before the D.C. Circuit Court of Appeals were placed on an expedited schedule, with oral arguments held in December 2024. On February 5, 2025, Federal EPA filed an unopposed motion asking the court to withhold issuing an opinion and to hold the case in abeyance for 60 days to allow the new Agency leadership to review the underlying rule. Management cannot predict the outcome of that litigation. Excessive costs to comply with environmental regulations have led to the announcement of early plant closures across the country. The Federal EPA’s new GHG rules, and suite of other new rules issued simultaneously which are discussed below, are directed at the fossil-fuel fired electric utility industry and could force AEP to close additional coal-fired generation facilities earlier than their estimated useful life. If AEP is unable to recover the costs of its investments, it would reduce future net income and cash flows and impact financial condition.
AEP is committed to providing reliable affordable power to its customers. To achieve this, AEP and its subsidiaries routinely meet with state regulators and key stakeholders to understand their needs for both dispatchable and renewable generation resources. This process evaluates, amongst other things, future supply and demand fundamentals, the economic aspects of investments, grid reliability and resilience, regulations and evolving RTO requirements, the advancement of generation technologies, and market impacts and constraints. As part of the regulatory process, AEP routinely submits IRPs in various regulatory jurisdictions to address future generation needs. The objective of the IRPs is to recommend future generation and capacity resources that provide the most cost-efficient and reliable power to customers. AEP remains committed to making generation and capacity resource decisions that provide the most cost-efficient and reliable power to customers, irrespective of any specific carbon-reduction goal. Based on the assumptions used in the most recent analysis, AEP expects that its Scope 1 GHG emissions will be reduced by 80% by 2030 (from a 2005 baseline).
AEP’s GHG reduction efforts are predicated on the combined preferences of the eleven states that we operate in. AEP has made significant progress in reducing GHG emissions from its power generation fleet and while we aspire to be at net-zero Scope 1 and 2 emissions by 2045, our performance will ultimately be driven by the needs and desires of the states we serve. AEP is engaging with regulators and policymakers and our decisions around generation resources are reflected in the preferences of these states. AEP has embraced the advancement of low-carbon generation solutions where supported, which may include early-stage projects to bring small modular nuclear reactors to Virginia and Indiana as an example. Further advancement of affordable new generation technologies and a market for offsets, as well as continued alignment with our states, would be required to achieve net-zero emissions.
MATS Rule
In April 2024, the Federal EPA issued a revised MATS rule for power plants. The rule includes a more stringent standard for emissions of filterable PM for coal-fired electric generating units, as well as a new mercury standard for lignite-fired electric generating units. The rule also requires the installation and operation of continuous emissions monitors for PM. Several states and other parties have challenged the rule in the United States Court of Appeals for the District of Columbia Circuit, but management cannot predict the outcome of the litigation. Management is evaluating the impacts of the rule, but does not anticipate any significant challenges complying with the rule.
CCR Rule
The Federal EPA’s CCR Rule regulates the disposal and beneficial re-use of CCR, including fly ash and bottom ash created from coal-fired generating units and FGD gypsum generated at some coal-fired plants. As originally promulgated, the rule applied to active and inactive CCR landfills and surface impoundments at facilities of active electric utility or independent power producers.
In 2020, the Federal EPA revised the original CCR Rule to include a requirement that unlined CCR storage ponds cease operations and initiate closure by April 11, 2021. The revised rule provided two options by which facilities could continue to operate unlined CCR storage ponds.
The first option provided an extension of the date by which unlined ponds had to cease receipt of CCR, and required a satisfactory demonstration of the need for additional time to develop alternative ash disposal capacity.
The second option allowed a generating facility to seek an extension of time to continue operating existing unlined CCR impoundments without developing alternative CCR disposal, provided the facility commits to cease combustion of coal by a date certain. Under this option, a generating facility had until October 17, 2023 to cease coal-fired operations and to close CCR storage ponds 40 acres or less in size, or through October 17, 2028 for facilities with CCR storage ponds greater than 40 acres in size. Pursuant to this option, AEP has applied for an extension of time to keep using unlined CCR impoundments at the Welsh Plant and has committed to cease coal combustion at that plant by October 17, 2028. To date, the Federal EPA has not taken any action on the pending extension request for the Welsh Plant.
In April 2024, the Federal EPA finalized revisions to the CCR Rule to expand the scope of the rule to include inactive impoundments at inactive facilities (“legacy CCR surface impoundments”) as well as to establish requirements for currently exempt solid waste management units that involve the direct placement of CCR on the land (“CCR management units”). The Federal EPA is requiring that owners and operators of legacy surface impoundments comply with all of the existing CCR Rule requirements applicable to inactive CCR surface impoundments at active facilities, except for the location restrictions and liner design criteria. The rule establishes compliance deadlines for legacy surface impoundments to meet regulatory requirements, including a requirement to initiate closure within five years after the effective date of the final rule. The rule requires evaluations to be completed at both active facilities and inactive facilities with one or more legacy surface impoundments. Closure may be accomplished by applying an impermeable cover system over the CCR material (“closure in place”) or the CCR material may be excavated and placed in a compliant landfill (“closure by removal”). Groundwater monitoring and other analysis over the next three years will provide additional information on the planned closure method. AEP evaluated the applicability of the rule to current and former plant sites and recorded incremental ARO in the second quarter of 2024, as shown in the table below, based on initial cost estimates primarily reflecting compliance with the rule through closure in place and future groundwater monitoring requirements pursuant to the revised CCR Rule.
| | | | | | | | | | | | | | | | | | | | | | | | | | |
| Registrant | | Increase in ARO | | Increase in Generation Property (a) | | Increase in Regulatory Assets (b) | | Charged to Operating Expenses (c) |
| | (in millions) | | |
| APCo | | $ | 312.2 | | | $ | 75.6 | | | $ | 236.6 | | | $ | — | |
| I&M | | 85.7 | | | — | | | 72.3 | | | 13.4 | |
| OPCo | | 52.9 | | | — | | | — | | | 52.9 | |
| PSO | | 33.7 | | | 33.7 | | | — | | | — | |
| SWEPCo | | 23.8 | | | 23.8 | | | — | | | — | |
| Non-Registrants | | 166.1 | | | 43.8 | | | 46.1 | | | 76.2 | |
| Total | | $ | 674.4 | | | $ | 176.9 | | | $ | 355.0 | | | $ | 142.5 | |
(a)ARO is related to a legacy CCR surface impoundment or CCR management unit at an operating generation facility.
(b)ARO is related to a legacy CCR surface impoundment or CCR management unit at a retired generation facility and recognition of a regulatory asset in accordance with the accounting guidance for “Regulated Operations” is supported.
(c)ARO is related to a legacy CCR surface impoundment or CCR management unit and recognition of a regulatory asset in accordance with the accounting guidance for “Regulated Operations” is not yet supported.
As further groundwater monitoring and other analysis is performed, management expects to refine the assumptions and underlying cost estimates used in recording the ARO. These refinements may include, but are not limited to, changes in the expected method of closure, changes in estimated quantities of CCR at each site, the identification of new CCR management units, among other items. These future changes could have a material impact on the ARO and materially reduce future net income and cash flows and further impact financial condition.
AEP will seek cost recovery through regulated rates, including proposal of new regulatory mechanisms for cost recovery where existing mechanisms are not applicable. The rule could have an additional, material adverse impact on net income, cash flows and financial condition if AEP cannot ultimately recover these additional costs of compliance. Several parties, including AEP and one of its trade associations, have filed petitions for review of the rule with the U.S. Court of Appeals for the D.C. Circuit. One of the parties also filed a motion to stay the rule pending the outcome of the litigation. In November 2024, the court denied the stay motion. Management cannot predict the outcome of the litigation.
Clean Water Act Regulations
The Federal EPA’s ELG rule for generating facilities establishes limits for FGD wastewater, fly ash and bottom ash transport water and flue gas mercury control wastewater, which are to be implemented through each facility’s wastewater discharge permit. A revision to the ELG rule, published in October 2020, established additional options for reusing and discharging small volumes of bottom ash transport water, provided an exception for retiring units and extended the compliance deadline to a date as soon as possible beginning one year after the rule was published but no later than December 2025. Management has assessed technology additions and retrofits to comply with the rule and the impacts of the Federal EPA’s actions on facilities’ wastewater discharge permitting for FGD wastewater and bottom ash transport water. For affected facilities required to install additional technologies to meet the ELG rule limits, permit modifications were filed in January 2021 that reflect the outcome of that assessment. AEP continues to work with state agencies to finalize permit terms and conditions. Other facilities opted to
file Notices of Planned Participation (NOPP), pursuant to which the facilities are not required to install additional controls to meet ELG limits provided they make commitments to cease coal combustion by a date certain.
In April 2024, the Federal EPA finalized further revisions to the ELG rule that establish a zero liquid discharge standard for FGD wastewater, bottom ash transport water, and managed combustion residual leachate, as well as more stringent discharge limits for unmanaged combustion residual leachate. The revised rule provides a new compliance alternative that would eliminate the need to install zero liquid discharge systems for facilities that comply with the 2020 rule’s control technology requirements and commit by December 31, 2025 to retire by 2034. Management is evaluating the compliance alternatives in the rule, taking into consideration the requirements of the other new rules and their combined impacts to operations. Several appeals have been filed with various federal courts challenging the 2024 ELG rule. SWEPCo has also challenged the rule, by filing a joint appeal with a utility trade association in which AEP participates. The various appeals have been consolidated before the United States Court of Appeals for the Eighth Circuit. SWEPCo and the utility trade association filed a motion to stay the rule during the litigation. In October 2024, the court denied the motion. Management cannot predict the outcome of the litigation.
The definition of “waters of the United States” has been subject to rule-making and litigation which has led to inconsistent scope among the states. Management will continue to monitor developments in rule-making and litigation for any potential impact to operations.
Impact of Environmental Regulation on Coal-Fired Generation
Compliance with extensive environmental regulations requires significant capital investment in environmental monitoring, installation of pollution control equipment, emission fees, disposal, remediation and permits. Management continuously evaluates cost estimates of complying with these regulations which may result in a decision to retire coal-fired generating facilities earlier than their currently estimated useful lives.
The table below summarizes the net book value, as of December 31, 2024, of generating facilities retired or planned for early retirement in advance of the retirement date currently authorized for ratemaking purposes:
| | | | | | | | | | | | | | | | | | | | | | | | | | | | | | | | | | | | | | | | | | | | | | | | | | | | | |
| Company | | Plant | | | | | | Net
Investment (a) | | Accelerated Depreciation Regulatory Asset | | | | | Actual/Projected
Retirement
Date | | Current Authorized
Recovery
Period | | Annual Depreciation (b) | | |
| | | | | | | | (in millions) | | | | | | | (in millions) | | |
| PSO | | Northeastern Plant, Unit 3 | | | | | | $ | 101.7 | | | $ | 189.0 | | | | | | | 2026 | | | (c) | | $ | 16.2 | | | |
| | | | | | | | | | | | | | | | | | | | | | | |
| SWEPCo | | Pirkey Plant | | | | | | — | | | 121.3 | | (d) | | | | | 2023 | | | (e) | | — | | | |
| SWEPCo | | Welsh Plant, Units 1 and 3 | | | | | | 324.3 | | | 168.6 | | | | | | | 2028 | (f) | | (g) | | 43.6 | | | |
| | | | | | | | | | | | | | | | | | | | | | | |
| | | | | | | | | | | | | | | | | | | | | | | |
(a)Net book value including CWIP excluding cost of removal and materials and supplies.
(b)These amounts represent the amount of annual depreciation that has been collected from customers over the prior 12-month period.
(c)Northeastern Plant, Unit 3 is currently being recovered through 2040.
(d)Represents Arkansas and Texas jurisdictional share.
(e)As part of the 2021 Arkansas Base Rate Case, the APSC granted SWEPCo regulatory asset treatment. SWEPCo will request recovery including a weighted average cost of capital carrying charge through a future proceeding. The Texas share of the Pirkey Plant will be addressed in SWEPCo’s next base rate case. See the “Regulated Generating Units” section of Note 5 for additional information.
(f)In November 2020, management announced it will cease using coal at the Welsh Plant in 2028. In December 2024, SWEPCo filed an application for a Certificate of Convenience and Necessity (CCN) with the APSC, LPSC and PUCT to convert Welsh Plant, Units 1 and 3 to natural gas in 2028 and 2027, respectively.
(g)Welsh Plant, Unit 1 is being recovered through 2027 in the Louisiana jurisdiction and through 2037 in the Arkansas and Texas jurisdictions. Welsh Plant, Unit 3 is being recovered through 2032 in the Louisiana jurisdiction and through 2042 in the Arkansas and Texas jurisdictions.
Management is seeking or will seek regulatory recovery, as necessary, for any net book value remaining when the plants are retired. To the extent the net book value of these generation assets is not deemed recoverable, it could materially reduce future net income, cash flows and impact financial condition.
RESULTS OF OPERATIONS
AEP’s Reportable Segments
AEP’s primary business is the generation, transmission and distribution of electricity. Within its Vertically Integrated Utilities segment, AEP centrally dispatches generation assets and manages its overall utility operations on an integrated basis because of the substantial impact of cost-based rates and regulatory oversight applicable to each public utility subsidiary. Intersegment sales and transfers are generally based on underlying contractual arrangements and agreements. AEP’s reportable segments are as follows:
•Vertically Integrated Utilities
•Transmission and Distribution Utilities
•AEP Transmission Holdco
•Generation & Marketing
The remainder of AEP’s activities are presented as Corporate and Other, which is not considered a reportable segment.
The following discussion of AEP’s results of operations by operating segment provides a comparison of earnings (loss) attributable to AEP common shareholders for the year ended December 31, 2024 as compared to the year ended December 31, 2023. For AEP’s Vertically Integrated Utilities and Transmission and Distribution Utilities segments and Registrant Subsidiaries within these segments, the results include revenues from rate rider mechanisms designed to recover fuel, purchased power and other recoverable expenses such that the revenues and expenses associated with these items generally offset and do not affect Earnings Attributable to AEP Common Shareholders. For additional information regarding the financial results for the years ended December 31, 2024 and 2023, see the discussions of Results of Operations by Registrant Subsidiary.
A detailed discussion of AEP’s 2023 results of operations by operating segment can be found in Management’s Discussion and Analysis of Financial Condition and Results of Operation section included in the 2023 Annual Report on Form 10-K filed with the SEC on February 26, 2024.
The following table presents Earnings Attributable to AEP Common Shareholders by segment:
| | | | | | | | | | | | | | | | | | | | |
| | Years Ended December 31, |
| | 2024 | | 2023 | | 2022 |
| | (in millions) |
| Vertically Integrated Utilities | | $ | 1,453.2 | | | $ | 1,090.4 | | | $ | 1,292.0 | |
| Transmission and Distribution Utilities | | 725.7 | | | 698.7 | | | 595.7 | |
| AEP Transmission Holdco | | 790.2 | | | 702.9 | | | 673.5 | |
| Generation & Marketing | | 289.2 | | | (26.3) | | | 283.6 | |
| Corporate and Other | | (291.2) | | | (257.6) | | | (537.6) | |
| Earnings Attributable to AEP Common Shareholders | | $ | 2,967.1 | | | $ | 2,208.1 | | | $ | 2,307.2 | |
See Note 9 - Business Segments for additional information on Earnings (Loss) Attributable to AEP Common Shareholders by segment.
Non-GAAP Financial Measures
AEP reports its financial results in accordance with GAAP by using earnings (loss) attributable to AEP common shareholders as stated above. AEP supplements the reporting of financial information determined in accordance with GAAP with certain non-GAAP financial measures including operating earnings. Operating earnings, which could differ from GAAP earnings, exclude certain gains and losses and other specified items, including mark-to-market adjustments from commodity hedging activities and other items as set forth in the reconciliation below. Management believes these are not indicative of AEP's ongoing performance.
This information is intended to enhance an investor’s overall understanding of period over period financial results and provide an indication of AEP’s baseline operating performance by excluding items that are considered by management to be not directly related to the ongoing operations of the business. In addition, this information is among the primary indicators management uses as a basis for evaluating performance, allocating resources, setting incentive compensation targets and planning and forecasting of future periods. These non-GAAP financial measures are not a presentation defined under GAAP and may not be comparable to other companies’ presentations.
Reconciliation of Reported GAAP Earnings to Operating Earnings
The following table presents a reconciliation of operating earnings to the most directly comparable GAAP measure.
| | | | | | | | | | | | | | | | | | | | | | | | | | | | | | | | | | | | | | | | | | | | | | | | | | |
| | Year Ended December 31, 2024 |
| | AEP | | AEP Texas | | AEPTCo | | APCo | | I&M | | OPCo | | PSO | | SWEPCo |
| | (in millions) |
| Reported GAAP Earnings | | $ | 2,967.1 | | | $ | 420.1 | | | $ | 688.4 | | | $ | 421.7 | | | $ | 391.4 | | | $ | 305.6 | | | $ | 249.3 | | | $ | 321.2 | |
| Adjustments to Reported GAAP Earnings (a): | | | | | | | | | | | | | | | | |
| Mark-to-Market Impact of Commodity Hedging Activities (b) | | (84.8) | | | — | | | — | | | — | | | 18.9 | | | — | | | — | | | — | |
| Remeasurement of Excess ADIT Regulatory Liability (c) | | (44.6) | | | — | | | — | | | — | | | (12.3) | | | — | | | — | | | (32.3) | |
| Impact of NOLC on Retail Rate Making (d) | | (259.6) | | | — | | | — | | | — | | | (69.1) | | | — | | | (56.5) | | | (134.0) | |
| Disallowance - Dolet Hills Power Station (e) | | 11.1 | | | — | | | — | | | — | | | — | | | — | | | — | | | 11.1 | |
| Provision for Refund - Turk Plant (f) | | 116.5 | | | — | | | — | | | — | | | — | | | — | | | — | | | 116.5 | |
| Sale of AEP OnSite Partners (g) | | 10.4 | | | — | | | — | | | — | | | — | | | — | | | — | | | — | |
| Severance and Pension Settlement Charges (h) | | 121.4 | | | 15.6 | | | 8.4 | | | 20.3 | | | 17.0 | | | 19.5 | | | 7.7 | | | 22.6 | |
| Federal EPA Coal Combustion Residuals Rule (i) | | 110.7 | | | — | | | — | | | — | | | 10.6 | | | 41.3 | | | — | | | — | |
| SEC Matter Loss Contingency (j) | | 19.0 | | | — | | | — | | | — | | | — | | | — | | | — | | | — | |
| State Tax Law Changes (k) | | 10.7 | | | — | | | — | | | — | | | — | | | — | | | — | | | 10.7 | |
| Total Specified Items | | 10.8 | | | 15.6 | | | 8.4 | | | 20.3 | | | (34.9) | | | 60.8 | | | (48.8) | | | (5.4) | |
| | | | | | | | | | | | | | | | |
| Operating Earnings | | $ | 2,977.9 | | | $ | 435.7 | | | $ | 696.8 | | | $ | 442.0 | | | $ | 356.5 | | | $ | 366.4 | | | $ | 200.5 | | | $ | 315.8 | |
(a) Excluding tax related adjustments, all items presented in the table are tax adjusted at the statutory rate unless otherwise noted.
(b) Represents the impact of mark-to-market economic hedging activities.
(c) Represents the impact of the remeasurement of excess ADIT in Arkansas and Michigan.
(d) Represents the impact of receiving IRS PLRs related to NOLCs in retail rate making on I&M, PSO and SWEPCo. Amount includes a reduction in excess ADIT and activity related to prior periods.
(e) Represents the impact of a disallowance recorded at SWEPCo on the remaining net book value of the Dolet Hills Power Station as a result of an LPSC approved settlement agreement in April 2024.
(f) Represents a provision for revenue refund associated with the Turk Plant as a result of a PUCT approved settlement agreement in January 2025.
(g) Represents the loss on the sale of AEP OnSite Partners.
(h) Represents employee severance charges and pension settlement expenses.
(i) Represents the impact of the Federal EPA’s revised CCR Rule.
(j) Represents an estimated loss contingency related to a previously disclosed SEC investigation which is non-deductible for tax purposes based on the IRC rules for fines and penalties.
(k) Represents the impact of the remeasurement of accumulated deferred income taxes as a result of enacted state tax legislation in Arkansas and Louisiana.
| | | | | | | | | | | | | | | | | | | | | | | | | | | | | | | | | | | | | | | | | | | | | | | | | | |
| | Year Ended December 31, 2023 |
| | AEP | | AEP Texas | | AEPTCo | | APCo | | I&M | | OPCo | | PSO | | SWEPCo |
| | (in millions) |
| Reported GAAP Earnings | | $ | 2,208.1 | | | $ | 370.4 | | | $ | 614.2 | | | $ | 294.4 | | | $ | 335.9 | | | $ | 328.2 | | | $ | 208.8 | | | $ | 220.3 | |
| Adjustments to Reported GAAP Earnings (a): | | | | | | | | | | | | | | | | |
| Mark-to-Market Impact of Commodity Hedging Activities (b) | | 228.3 | | | — | | | — | | | — | | | (19.4) | | | — | | | — | | | — | |
| Remeasurement of Excess ADIT Regulatory Liability (c) | | (46.0) | | | — | | | — | | | (46.0) | | | — | | | — | | | — | | | — | |
| ENEC Fuel Disallowance (d) | | 181.0 | | | — | | | — | | | 100.4 | | | — | | | — | | | — | | | — | |
| Turk Impairment (e) | | 79.7 | | | — | | | — | | | — | | | — | | | — | | | — | | | 79.7 | |
| Sale of Unregulated Renewables (f) | | 73.4 | | | — | | | — | | | — | | | — | | | — | | | — | | | — | |
| Kentucky Operations (g) | | (33.7) | | | — | | | — | | | — | | | — | | | — | | | — | | | — | |
| Change in Texas Legislation (h) | | (24.4) | | | (20.2) | | | — | | | — | | | — | | | — | | | — | | | (4.3) | |
| FERC NOLC Disallowance (i) | | 23.7 | | | — | | | 36.1 | | | (3.8) | | | (1.9) | | | (9.0) | | | (3.2) | | | 1.5 | |
| Severance Charges (j) | | 19.4 | | | 2.6 | | | 1.1 | | | 3.9 | | | 2.8 | | | 4.7 | | | 1.5 | | | 1.9 | |
| Impairment of Investment in NMRD (k) | | 15.0 | | | — | | | — | | | — | | | — | | | — | | | — | | | — | |
| Total Specified Items | | 516.4 | | | (17.6) | | | 37.2 | | | 54.5 | | | (18.5) | | | (4.3) | | | (1.7) | | | 78.8 | |
| | | | | | | | | | | | | | | | |
| Operating Earnings | | $ | 2,724.5 | | | $ | 352.8 | | | $ | 651.4 | | | $ | 348.9 | | | $ | 317.4 | | | $ | 323.9 | | | $ | 207.1 | | | $ | 299.1 | |
(a)Excluding tax related adjustments, all items presented in the table are tax adjusted at the statutory rate unless otherwise noted.
(b)Represents the impact of mark-to-market economic hedging activities.
(c)Represents the impact of the remeasurement of accumulated deferred income taxes - net operating loss carryforward in Virginia and West Virginia.
(d)Represents the impact of the disallowance of the recovery of certain deferred fuel costs in West Virginia.
(e)Represents the impact of the disallowance of certain capitalized costs associated with the Turk Plant.
(f)Represents the loss on the sale of the Competitive Contracted Renewable Portfolio and other related third-party transaction costs.
(g)Represents an adjustment to the loss on the expected sale of the Kentucky Operations which was terminated in April 2023 and other related third-party transaction costs.
(h)Represents the impact of recent legislation in Texas regarding recovery of certain employee incentives.
(i)Represents the impact of the FERC decision denying stand-alone treatment of NOLCs for transmission formula rates.
(j)Represents the impact of AEP's workforce reduction in 2023.
(k)Represents the impairment of AEP's investment in the NMRD joint venture.
| | | | | | | | | | | | | | | | | | | | | | | | | | | | | | | | | | | | | | | | | | | | | | | | | | |
| | Year Ended December 31, 2022 |
| | AEP | | AEP Texas | | AEPTCo | | APCo | | I&M | | OPCo | | PSO | | SWEPCo |
| | (in millions) |
| Reported GAAP Earnings | | $ | 2,307.2 | | | $ | 307.9 | | | $ | 594.2 | | | $ | 394.2 | | | $ | 324.7 | | | $ | 287.8 | | | $ | 167.6 | | | $ | 290.1 | |
| Adjustments to Reported GAAP Earnings (a): | | | | | | | | | | | | | | | | |
| Mark-to-Market Impact of Commodity Hedging Activities (b) | | (77.0) | | | — | | | — | | | — | | | (8.5) | | | — | | | — | | | — | |
| Sale of Unregulated Renewables (c) | | 4.5 | | | — | | | — | | | — | | | — | | | — | | | — | | | — | |
| Kentucky Operations (d) | | 306.8 | | | — | | | — | | | — | | | — | | | — | | | — | | | — | |
| Impairments and Disposition of Investment in Flat Ridge 2 (e) | | 136.4 | | | — | | | — | | | — | | | — | | | — | | | — | | | — | |
| Gain on Sale of Mineral Rights (f) | | (91.9) | | | — | | | — | | | — | | | — | | | — | | | — | | | — | |
| Virginia Triennial Review (g) | | 24.4 | | | — | | | — | | | 24.4 | | | — | | | — | | | — | | | — | |
| Mark-to-Market Impact of Certain Investments (h) | | (3.2) | | | — | | | — | | | — | | | — | | | — | | | — | | | — | |
| Accumulated Deferred Income Tax Adjustments (i) | | (2.0) | | | — | | | — | | | — | | | — | | | — | | | — | | | — | |
| Total Specified Items | | 298.0 | | | — | | | — | | | 24.4 | | | (8.5) | | | — | | | — | | | — | |
| | | | | | | | | | | | | | | | |
| Operating Earnings | | $ | 2,605.2 | | | $ | 307.9 | | | $ | 594.2 | | | $ | 418.6 | | | $ | 316.2 | | | $ | 287.8 | | | $ | 167.6 | | | $ | 290.1 | |
(a)Excluding tax related adjustments, all items presented in the table are tax adjusted at the statutory rate unless otherwise noted.
(b)Represents the impact of mark-to-market economic hedging activities.
(c)Represents third-party transaction costs due to the unregulated renewable sales process.
(d)Includes a $363.3 million loss on the expected sale of the Kentucky operations and other related third-party transaction costs.
(e)Represents the impact of the impairment and disposition of AEP's investment in the Flat Ridge 2 wind farm joint venture.
(f)Represents the gain on the sale of certain mineral rights.
(g)Represents the impact of the Virginia Supreme Court opinion on AEP's appeal of Appalachian Power’s 2017-2019 Triennial Review.
(h)Represents the impact of mark-to-market on certain investments.
(i)Represents the impact of out-of-period adjustments related to accumulated deferred income taxes.
VERTICALLY INTEGRATED UTILITIES
| | | | | | | | | | | | | | | | | | | | |
| Summary of KWh Energy Sales for Vertically Integrated Utilities |
| | | | | | |
| | Years Ended December 31, |
| | 2024 | | 2023 | | 2022 |
| | (in millions of KWhs) |
| Retail: | | | | | | |
| Residential | | 31,025 | | | 30,290 | | | 32,835 | |
| Commercial | | 24,647 | | | 23,481 | | | 23,770 | |
| Industrial | | 34,013 | | | 34,148 | | | 34,532 | |
| Miscellaneous | | 2,271 | | | 2,229 | | | 2,316 | |
| Total Retail | | 91,956 | | | 90,148 | | | 93,453 | |
| | | | | | |
| Wholesale (a) | | 14,523 | | | 13,401 | | | 16,099 | |
| | | | | | |
| Total KWhs | | 106,479 | | | 103,549 | | | 109,552 | |
(a)Includes Off-system Sales, municipalities and cooperatives, unit power and other wholesale customers.
Heating degree days and cooling degree days are metrics commonly used in the utility industry as a measure of the impact of weather on revenues. In general, degree day changes in the eastern region have a larger effect on revenues than changes in the western region due to the relative size of the two regions and the number of customers within each region.
| | | | | | | | | | | | | | | | | | | | |
| Summary of Heating and Cooling Degree Days for Vertically Integrated Utilities |
| | | | | | |
| | Years Ended December 31, |
| | 2024 | | 2023 | | 2022 |
| | (in degree days) |
| Eastern Region | | | | | | |
| Actual – Heating (a) | | 2,092 | | | 1,992 | | | 2,709 | |
| Normal – Heating (b) | | 2,704 | | | 2,719 | | | 2,717 | |
| | | | | | |
| Actual – Cooling (c) | | 1,366 | | | 1,003 | | | 1,187 | |
| Normal – Cooling (b) | | 1,114 | | | 1,119 | | | 1,106 | |
| | | | | | |
| Western Region | | | | | | |
| Actual – Heating (a) | | 1,052 | | | 1,068 | | | 1,523 | |
| Normal – Heating (b) | | 1,450 | | | 1,464 | | | 1,455 | |
| | | | | | |
| Actual – Cooling (c) | | 2,738 | | | 2,590 | | | 2,695 | |
| Normal – Cooling (b) | | 2,289 | | | 2,277 | | | 2,247 | |
(a)Heating degree days are calculated on a 55 degree temperature base.
(b)Normal Heating/Cooling represents the thirty-year average of degree days.
(c)Cooling degree days are calculated on a 65 degree temperature base.
Reconciliation of Year Ended December 31, 2023 to Year Ended December 31, 2024
Earnings Attributable to AEP Common Shareholders from Vertically Integrated Utilities
(in millions)
| | | | | | | | |
| Year Ended December 31, 2023 | | $ | 1,090.4 | |
| | |
| Changes in Revenues: | | |
| Retail Revenues | | 71.3 | |
| Off-system Sales | | (8.0) | |
| Transmission Revenues | | 57.8 | |
| Other Revenues | | 26.0 | |
| Total Change in Revenues | | 147.1 | |
| | |
| Changes in Expenses and Other: | | |
| Purchased Electricity, Fuel and Other Consumables Used for Electric Generation | | 354.1 | |
| Other Operation and Maintenance | | (316.9) | |
| Asset Impairments and Other Related Charges | | 72.2 | |
| | |
| Depreciation and Amortization | | (94.2) | |
| Taxes Other Than Income Taxes | | (22.8) | |
| | |
| | |
| Other Income | | (1.8) | |
| Allowance for Equity Funds Used During Construction | | 6.1 | |
| Non-Service Cost Components of Net Periodic Pension Cost | | (57.2) | |
| Interest Expense | | 40.2 | |
| Total Change in Expenses and Other | | (20.3) | |
| | |
| Income Tax Benefit | | 237.0 | |
| | |
| Net Income Attributable to Noncontrolling Interests | | (1.0) | |
| | |
| Year Ended December 31, 2024 | | $ | 1,453.2 | |
The major components of the increase in Revenues were as follows:
•Retail Revenues increased $71 million primarily due to the following:
•A $114 million increase in rates at APCo due to the 2020-2022 Virginia Triennial Review.
•A $99 million increase in weather-related usage primarily in the residential class driven by a 14% increase in cooling degree days.
•A $66 million increase in base rate and rider revenues at PSO.
•A $64 million increase in rider revenues at KPCo.
•A $63 million increase in rider revenues at APCo and WPCo.
These increases were partially offset by:
•A $192 million decrease in fuel revenues primarily due to lower authorized fuel rates at PSO.
•A $148 million decrease at SWEPCo due to a revenue refund associated with the Turk Plant and SWEPCo’s 2012 Texas Base Rate Case.
•Off-system Sales decreased $8 million primarily due to economic hedging activity and Rockport Plant, Unit 2 merchant sales at I&M.
•Transmission Revenues increased $58 million primarily due to continued investment in transmission assets.
•Other Revenues increased $26 million primarily due to pole attachment revenue primarily at APCo and revenues at PSO from a customer project to enhance transmission resiliency.
Expenses and Other and Income Tax Benefit changed between years as follows:
•Purchased Electricity, Fuel and Other Consumables Used for Electric Generation expenses decreased $354 million primarily due to decreases at APCo, PSO and SWEPCo.
•Other Operation and Maintenance expenses increased $317 million primarily due to the following:
•A $154 million increase in PJM and SPP transmission services.
•A $100 million increase in employee-related expenses including a $76 million increase associated with the voluntary severance program that occurred in the second quarter of 2024.
•Asset Impairments and Other Related Charges decreased $72 million primarily due to the following:
•An $86 million decrease at SWEPCo due to the probable disallowance of Turk Plant capitalized AFUDC in excess of the Texas jurisdictional capital cost cap as a result of the PUCT’s December 2023 preliminary order in the 2012 Texas Base Rate Case.
This decrease was partially offset by:
•A $13 million increase due to the Federal EPA’s revised CCR rules.
•Depreciation and Amortization expenses increased $94 million primarily due to the following:
•A $47 million increase at SWEPCo primarily due to an increase in amortization of regulatory assets and a higher depreciable base, partially offset by the recognition of a regulatory asset related to NOLCs.
•A $31 million increase at APCo primarily due to a higher depreciable base.
•A $17 million increase at PSO primarily due to a higher depreciable base, implementation of new rates and the amortization of regulatory assets related to NCWF.
•Taxes Other Than Income Taxes increased $23 million primarily due to increased property taxes at PSO and I&M and an increase in Virginia state minimum taxes at APCo, partially offset by a decrease in property taxes at SWEPCo.
•Allowance for Equity Funds Used During Construction increased $6 million primarily due to higher CWIP and AFUDC equity rates.
•Non-Service Cost Components of Net Periodic Benefit Cost increased $57 million primarily due to an increase in loss amortization for the plans and a plan remeasurement triggered by settlements related to the voluntary severance program, partially offset by lower interest costs due to lower discount rates.
•Interest Expense decreased $40 million primarily due to the recognition of debt carrying charges as a result of the IRS PLR received regarding the treatment of stand-alone NOLCs in retail rate making.
•Income Tax Benefit increased $237 million primarily due to the following:
•A $212 million increase due to a reduction in Excess ADIT regulatory liabilities at I&M, PSO, and SWEPCo as a result of the IRS PLR received regarding the treatment of stand-alone NOLCs in retail rate making.
•A $69 million increase due to estimated Nuclear PTCs at I&M.
•A $32 million increase due to a reduction in Excess ADIT regulatory liabilities as a result of the APSC’s denial of SWEPCo’s request to allow the merchant portion of the Turk Plant to serve Arkansas customers.
These increases were partially offset by:
•An $82 million decrease due to a decrease in amortization of Excess ADIT.
TRANSMISSION AND DISTRIBUTION UTILITIES
| | | | | | | | | | | | | | | | | | | | |
| Summary of KWh Energy Sales for Transmission and Distribution Utilities |
| | | | | | |
| | Years Ended December 31, |
| | 2024 | | 2023 | | 2022 |
| | (in millions of KWhs) |
| Retail: | | | | | | |
| Residential | | 26,782 | | | 26,099 | | | 27,479 | |
| Commercial | | 36,147 | | | 30,419 | | | 27,448 | |
| Industrial | | 27,368 | | | 26,571 | | | 25,435 | |
| Miscellaneous | | 742 | | | 745 | | | 753 | |
| Total Retail (a) | | 91,039 | | | 83,834 | | | 81,115 | |
| | | | | | |
| Wholesale (b) | | 2,014 | | | 1,922 | | | 2,198 | |
| | | | | | |
| Total KWhs | | 93,053 | | | 85,756 | | | 83,313 | |
(a)Represents energy delivered to distribution customers.
(b)Primarily Ohio’s contractually obligated purchases of OVEC power sold into PJM.
Heating degree days and cooling degree days are metrics commonly used in the utility industry as a measure of the impact of weather on revenues. In general, degree day changes in the eastern region have a larger effect on revenues than changes in the western region due to the relative size of the two regions and the number of customers within each region.
| | | | | | | | | | | | | | | | | | | | |
| Summary of Heating and Cooling Degree Days for Transmission and Distribution Utilities |
| | | | | | |
| | Years Ended December 31, |
| | 2024 | | 2023 | | 2022 |
| | (in degree days) |
| Eastern Region | | | | | | |
| Actual – Heating (a) | | 2,446 | | | 2,380 | | | 3,116 | |
| Normal – Heating (b) | | 3,140 | | | 3,185 | | | 3,185 | |
| | | | | | |
| Actual – Cooling (c) | | 1,300 | | | 842 | | | 1,121 | |
| Normal – Cooling (b) | | 1,031 | | | 1,026 | | | 1,011 | |
| | | | | | |
| Western Region | | | | | | |
| Actual – Heating (a) | | 196 | | | 197 | | | 450 | |
| Normal – Heating (b) | | 316 | | | 318 | | | 312 | |
| | | | | | |
| Actual – Cooling (d) | | 3,249 | | | 3,208 | | | 2,984 | |
| Normal – Cooling (b) | | 2,770 | | | 2,737 | | | 2,714 | |
(a)Heating degree days are calculated on a 55 degree temperature base.
(b)Normal Heating/Cooling represents the thirty-year average of degree days.
(c)Eastern Region cooling degree days are calculated on a 65 degree temperature base.
(d)Western Region cooling degree days are calculated on a 70 degree temperature base.
Reconciliation of Year Ended December 31, 2023 to Year Ended December 31, 2024
Earnings Attributable to AEP Common Shareholders from Transmission and Distribution Utilities
(in millions)
| | | | | | | | |
| Year Ended December 31, 2023 | | $ | 698.7 | |
| | |
| Changes in Revenues: | | |
| Retail Revenues | | 115.0 | |
| Off-system Sales | | (7.9) | |
| Transmission Revenues | | 55.1 | |
| Other Revenues | | 32.2 | |
| Total Change in Revenues | | 194.4 | |
| | |
| Changes in Expenses and Other: | | |
| Purchased Electricity for Resale | | 316.7 | |
| Purchased Electricity from AEP Affiliates | | (11.0) | |
| Other Operation and Maintenance | | (218.3) | |
| Asset Impairments and Other Related Charges | | (52.9) | |
| Depreciation and Amortization | | (94.8) | |
| Taxes Other Than Income Taxes | | (56.2) | |
| | |
| | |
| Other Income | | 7.2 | |
| Allowance for Equity Funds Used During Construction | | 23.7 | |
| Non-Service Cost Components of Net Periodic Benefit Cost | | (24.5) | |
| Interest Expense | | (41.9) | |
| Total Change in Expenses and Other | | (152.0) | |
| | |
| Income Tax Expense | | (14.3) | |
| Equity Earnings of Unconsolidated Subsidiaries | | (1.1) | |
| | |
| Year Ended December 31, 2024 | | $ | 725.7 | |
The major components of the increase in Revenues were as follows:
•Retail Revenues increased $115 million primarily due to the following:
•A $428 million increase in rider revenues.
•A $41 million increase in weather-related usage driven by a 54% increase in cooling degree days and a 3% increase in heating degree days in Ohio.
•A $16 million increase in weather-normalized revenues due to increased load across all classes in Texas.
•An $11 million increase in revenue from the base rate case in Texas.
These increases were partially offset by:
•A $387 million decrease due to lower prices and lower customer participation in OPCo’s SSO.
•Off-system Sales decreased $8 million primarily due to 2023 PJM settlements related to winter storm Elliott.
•Transmission Revenues increased $55 million primarily due to the following:
•A $42 million increase in interim rates driven by increased transmission investments in Texas.
•A $12 million increase due to increased load in Texas.
•Other Revenues increased $32 million primarily due to the following:
•A $47 million increase due to third-party Legacy Generation Resource Rider revenue related to the recovery of OVEC costs.
This increase was partially offset by:
•A $20 million decrease in recoverable sales of renewable energy credits in Ohio.
Expenses and Other and Income Tax Expense changed between years as follows:
•Purchased Electricity for Resale expenses decreased $317 million primarily due to the following:
•A $398 million decrease in recoverable auction purchases primarily due to lower prices and lower volumes driven by lower customer participation in OPCo’s SSO.
•A $28 million decrease in recoverable alternative energy rider expenses in Ohio.
These decreases were partially offset by:
•A $110 million increase in recoverable OVEC costs.
•Purchased Electricity from AEP Affiliates expenses increased $11 million primarily due to increased recoverable purchases in OPCo’s SSO auction.
•Other Operation and Maintenance expenses increased $218 million primarily due to the following:
•A $95 million increase in recoverable transmission expenses.
•A $35 million increase in employee-related expenses due to the voluntary severance program that occurred in the second quarter of 2024.
•A $33 million increase in distribution expenses in Ohio primarily due to recoverable storm restoration costs and recoverable vegetation management expenses.
•A $28 million increase due to a prior year decrease in expenses driven by legislation passed in Texas in May 2023 allowing employee financially based incentives to be recovered.
•A $14 million increase related to recoverable energy assistance program expenses for qualified Ohio customers.
•Asset Impairments and Other Related Charges increased $53 million due to the Federal EPA's Revised CCR rules.
•Depreciation and Amortization expenses increased $95 million primarily due to a higher depreciable base in Ohio and Texas and an increase in recoverable rider depreciable assets in Ohio.
•Taxes Other Than Income Taxes increased $56 million primarily due to the following:
•A $42 million increase due to higher property taxes driven by additional investments in transmission and distribution assets and tax rate changes in Ohio.
•An $11 million increase in state excise taxes due to increased billed KWhs in 2024 resulting in a higher tax burden in Ohio.
•Other Income increased $7 million primarily due to an increase in interest income due to higher advances to affiliates.
•Allowance for Equity Funds Used During Construction increased $24 million due to a higher AFUDC base in Ohio and Texas and AFUDC equity rates in Ohio.
•Non-Service Cost Components of Net Period Benefit Cost increased $25 million primarily due to an increase in loss amortization for the plans and a plan remeasurement triggered by settlements related to the voluntary severance program, partially offset by lower interest costs due to lower discount rates.
•Interest Expense increased $42 million primarily due to higher debt balances and interest rates.
•Income Tax Expense increased $14 million primarily due to an increase in pretax book income in Texas.
AEP TRANSMISSION HOLDCO
Summary of Investment in Transmission Assets for AEP Transmission Holdco
| | | | | | | | | | | | | | |
| | December 31, |
| | 2024 | | 2023 |
| | (in millions) |
| Plant in Service | | $ | 15,834.7 | | | $ | 14,630.2 | |
| Construction Work in Progress | | 2,205.8 | | | 1,733.8 | |
| Accumulated Depreciation and Amortization | | 1,625.7 | | | 1,332.8 | |
| Total Transmission Property, Net | | $ | 16,414.8 | | | $ | 15,031.2 | |
Reconciliation of Year Ended December 31, 2023 to Year Ended December 31, 2024
Earnings Attributable to AEP Common Shareholders from AEP Transmission Holdco
(in millions)
| | | | | | | | |
| Year Ended December 31, 2023 | | $ | 702.9 | |
| | |
| Changes in Transmission Revenues: | | |
| Transmission Revenues | | 222.3 | |
| Total Change in Transmission Revenues | | 222.3 | |
| | |
| Changes in Expenses and Other: | | |
| Other Operation and Maintenance | | (21.2) | |
| Depreciation and Amortization | | (37.1) | |
| Taxes Other Than Income Taxes | | (24.8) | |
| | |
| | |
| Interest and Investment Income | | 3.0 | |
| Allowance for Equity Funds Used During Construction | | 6.3 | |
| Non-Service Cost Components of Net Periodic Pension Cost | | (8.4) | |
| Interest Expense | | (19.7) | |
| Total Change in Expenses and Other | | (101.9) | |
| | |
| Income Tax Expense | | (48.7) | |
| Equity Earnings of Unconsolidated Subsidiaries | | 16.0 | |
| Net Income Attributable to Noncontrolling Interests | | (0.4) | |
| | |
| Year Ended December 31, 2024 | | $ | 790.2 | |
The major components of the increase in Transmission Revenues, which consists of wholesale sales to affiliates and nonaffiliates were as follows:
•Transmission Revenues increased $222 million primarily due to continued investment in transmission assets.
Expenses and Other, Income Tax Expense and Equity Earnings of Unconsolidated Subsidiaries changed between years as follows:
•Other Operation and Maintenance expenses increased $21 million primarily due to an $18 million increase in employee-related expenses driven by an $11 million increase associated with the voluntary severance program that occurred in the second quarter of 2024.
•Depreciation and Amortization expenses increased $37 million primarily due to a higher depreciable base.
•Taxes Other Than Income Taxes increased $25 million primarily due to higher property taxes driven by increased transmission investment.
•Allowance for Equity Funds Used During Construction increased $6 million primarily due to a higher AFUDC base.
•Non-Service Cost Components of Net Periodic Benefit Cost increased $8 million primarily due to an increase in loss amortization for the plans and a plan remeasurement triggered by settlements related to the voluntary severance program, partially offset by lower interest costs due to lower discount rates.
•Interest Expense increased $20 million primarily due to higher long-term debt balances and interest rates.
•Income Tax Expense increased $49 million primarily due to the following:
•A $29 million increase due to an increase in pretax book income.
•A $22 million increase in state taxes primarily driven by favorable deferred state tax remeasurements in 2023.
•Equity Earnings of Unconsolidated Subsidiaries increased $16 million primarily due to higher pretax earnings at ETT.
GENERATION & MARKETING
Reconciliation of Year Ended December 31, 2023 to Year Ended December 31, 2024
Earnings Attributable to AEP Common Shareholders from Generation & Marketing
(in millions)
| | | | | | | | |
| Year Ended December 31, 2023 | | $ | (26.3) | |
| | |
| Changes in Revenues: | | |
| Merchant Generation | | (14.2) | |
| Renewable Generation | | (68.6) | |
| Retail, Trading and Marketing | | 496.0 | |
| Total Change in Revenues | | 413.2 | |
| | |
| Changes in Expenses and Other: | | |
| Purchased Electricity, Fuel and Other Consumables Used for Electric Generation | | (54.6) | |
| Other Operation and Maintenance | | 3.0 | |
| Asset Impairments and Other Related Charges | | (76.2) | |
| Loss on the Sale of the Competitive Contracted Renewables Portfolio | | 92.7 | |
| | |
| Depreciation and Amortization | | 21.8 | |
| Taxes Other Than Income Taxes | | 4.6 | |
| Interest and Investment Income | | (11.2) | |
| | |
| Non-Service Cost Components of Net Periodic Benefit Cost | | (3.0) | |
| Interest Expense | | 59.4 | |
| Total Change in Expenses and Other | | 36.5 | |
| | |
| Income Tax Expense | | (148.8) | |
| Equity Earnings of Unconsolidated Subsidiaries | | 17.4 | |
| Net Loss Attributable to Noncontrolling Interests | | (2.8) | |
| | |
| Year Ended December 31, 2024 | | $ | 289.2 | |
The major components of the increase in Revenues were as follows:
•Merchant Generation decreased $14 million primarily due to lower realized prices in 2024.
•Renewable Generation decreased $69 million primarily due to the sale of the competitive contracted renewables portfolio in August 2023 and the sale of Onsite Partners in September 2024.
•Retail, Trading and Marketing increased $496 million primarily due to a $314 million unrealized loss on economic hedge activity in 2023 and a $128 million unrealized gain on economic hedge activity in 2024 driven by changes in commodity prices.
Expenses and Other, Income Tax Expense and Equity Earnings of Unconsolidated Subsidiaries changed between years as follows:
•Purchased Electricity, Fuel and Other Consumables Used for Electric Generation expenses increased $55 million primarily due to an increase in energy costs in 2024.
•Asset Impairments and Other Related Charges increased $76 million due to the Federal EPA’s revised CCR Rules.
•Loss on the Sale of the Competitive Contracted Renewables Portfolio decreased $93 million due to the pretax loss on the sale in August 2023.
•Depreciation and Amortization expenses decreased $22 million primarily due to the sale of the competitive contracted renewables portfolio in August 2023 and the sale of Onsite Partners in September 2024.
•Interest and Investment Income decreased $11 million primarily due to the sale of the competitive contracted renewables portfolio in August 2023 and the sale of Onsite Partners in September 2024.
•Interest Expense decreased $59 million primarily due to lower advances from affiliates.
•Income Tax Expense increased $149 million primarily due to the following:
•A $97 million increase due to an increase in pretax book income.
•A $46 million increase due to a decrease in PTCs.
•Equity Earnings of Unconsolidated Subsidiaries increased $17 million primarily due to a $19 million impairment of AEP’s investment in NMRD in 2023.
CORPORATE AND OTHER
2024 Compared to 2023
Earnings Attributable to AEP Common Shareholders from Corporate and Other decreased from a loss of $258 million in 2023 to a loss of $291 million in 2024 primarily due to:
•A $69 million decrease in interest income primarily due to lower advances to affiliates.
•A $28 million decrease due to a prior-year adjustment driven by the termination of the sale of the Kentucky Operations.
•A $19 million expense recorded in 2024 associated with the SEC investigation.
These decreases in earnings were partially offset by:
•A $68 million decrease in Income Tax Expense primarily due to a decrease in state taxes.
•A $23 million decrease in corporate expenses.
AEP CONSOLIDATED INCOME TAXES
2024 Compared to 2023
•Income Tax Benefit increased $94 million primarily due to the following:
•A $212 million increase due to a reduction in Excess ADIT regulatory liabilities at I&M, PSO and SWEPCo as a result of the IRS PLR received regarding the treatment of stand-alone NOLCs in retail rate making.
•A $69 million increase due to estimated Nuclear PTCs.
•A $32 million increase due to the reversal of a regulatory liability related to the merchant portion of Turk Plant Excess ADIT as a result of the APSC's March 2024 denial of SWEPCo's request to allow the merchant portion of the Turk Plant to serve Arkansas customers.
These increases were partially offset by:
•A $140 million decrease due to an increase in pretax book income.
•A $50 million decrease due to a decrease in amortization of Excess ADIT.
FINANCIAL CONDITION
AEP measures financial condition by the strength of its balance sheet and the liquidity provided by its cash flows.
SIGNIFICANT CASH REQUIREMENTS
AEP’s contractual cash obligations include amounts reported on the balance sheets and other obligations disclosed in the footnotes. It is anticipated that these obligations will be satisfied through a combination of cash flows from operations, long-term debt issuances, short-term debt through AEP’s Commercial Paper Program or bank term loans, proceeds from the announced agreement related to the disposition of a 19.9% noncontrolling equity interest in IMTCo and OHTCo and the use of the ATM Program or other equity issuances.
Capital Expenditures
Continued capital investments reflect AEP’s commitment to enhance service and deliver safe, reliable power to customers. In November 2024, AEP announced a $54 billion capital plan for 2025-2029 driven by transmission and distribution infrastructure upgrades and new generation to support anticipated load growth. See “Budgeted Capital Expenditures” herein, for additional information.
Long-term Debt
Long-term debt maturities, including interest, represent a significant cash requirement for AEP and the Registrant Subsidiaries. See Note 15 - Financing Activities for additional information relating to the Registrant Subsidiaries’ long-term debt outstanding as of December 31, 2024, the weighted-average interest rate applicable to each debt category and a schedule of debt maturities over the next five years.
Other Significant Cash Requirements
Operating and finance leases represent a significant component of funding requirements for AEP and the Registrant Subsidiaries. See Note 13 - Leases for additional information.
AEP subsidiaries have substantial commitments for fuel, energy and capacity contracts as part of the normal course of business. See Note 6 - Commitments, Guarantees and Contingencies for additional information.
As of December 31, 2024, AEP expected to make contributions to the pension plans totaling $101 million in 2025. Estimated contributions of $100 million in 2026 and $103 million in 2027 may vary significantly based on market returns, changes in actuarial assumptions and other factors. Based upon the projected benefit obligation and fair value of assets available to pay pension benefits, the pension plans were 95% funded as of December 31, 2024. See “Estimated Future Benefit Payments and Contributions” section of Note 8 for additional information.
Standby letters of credit are entered into with third-parties. These letters of credit are issued in the ordinary course of business and cover items such as natural gas and electricity risk management contracts, construction contracts, insurance programs, security deposits and debt security reserves. There is no collateral held in relation to any guarantees in excess of the ownership percentages. In the event any letters of credit are drawn, there is no recourse to third-parties. See “Letters of Credit” section of Note 6 for additional information.
LIQUIDITY AND CAPITAL RESOURCES
Debt and Equity Capitalization
| | | | | | | | | | | | | | | | | | | | | | | | | | |
| | December 31, |
| | 2024 | | 2023 |
| | (dollars in millions) |
| Long-term Debt, including amounts due within one year | | $ | 42,642.8 | | | 59.1 | % | | $ | 40,143.2 | | | 58.8 | % |
| Short-term Debt | | 2,523.8 | | | 3.5 | | | 2,830.2 | | | 4.2 | |
| Total Debt | | 45,166.6 | | | 62.6 | | | 42,973.4 | | | 63.0 | |
| AEP Common Equity | | 26,943.8 | | | 37.3 | | | 25,246.7 | | | 37.0 | |
| Noncontrolling Interests | | 42.3 | | | 0.1 | | | 39.2 | | | — | |
| Total Debt and Equity Capitalization | | $ | 72,152.7 | | | 100.0 | % | | $ | 68,259.3 | | | 100.0 | % |
AEP’s ratio of debt-to-total capital decreased from 63.0% to 62.6% as of December 31, 2023 and December 31, 2024, respectively, primarily due to an increase in earnings and equity issued under the ATM program in 2024, partially offset by an increase in long-term debt to support distribution and transmission growth in addition to working capital needs.
Liquidity
Liquidity, or access to cash, is an important factor in determining AEP’s financial stability. Management believes AEP has adequate liquidity for the next twelve months and foreseeable future. As of December 31, 2024, AEP had $6 billion in revolving credit facilities to support its commercial paper program. Additional liquidity is available from cash from operations and a receivables securitization agreement. Management is committed to maintaining adequate liquidity. AEP generally uses short-term borrowings to fund working capital needs, property acquisitions and construction until long-term funding is arranged. Sources of long-term funding include issuance of long-term debt, long-term asset securitizations, leasing agreements, hybrid securities or common stock. AEP and its utilities finance its operations with commercial paper and other variable rate instruments that are subject to fluctuations in interest rates. To the extent that there is an increase in interest rates, it could reduce future net income and cash flows and impact financial condition. In January 2025, KPCo entered into a term loan of $150 million, due in February 2026, to address short-term liquidity needs.
Market volatility and reduced liquidity in the financial markets could affect AEP’s ability to raise capital on reasonable terms to fund capital needs, including construction costs and refinancing maturing indebtedness. AEP continues monitoring the current bank environment and any impacts thereof. AEP was not materially impacted by these conditions during the year ended December 31, 2024.
Net Available Liquidity
AEP manages liquidity by maintaining adequate external financing commitments. As of December 31, 2024, available liquidity was approximately $4.6 billion as illustrated in the table below:
| | | | | | | | | | | | | | |
| | Amount | | Maturity (a) |
| | (in millions) | | |
| Commercial Paper Backup: | | | | |
| Revolving Credit Facility | | $ | 5,000.0 | | | March 2029 |
| Revolving Credit Facility | | 1,000.0 | | | March 2027 |
| | | | |
| | | | |
| Cash and Cash Equivalents | | 202.9 | | | |
| Total Liquidity Sources | | 6,202.9 | | | |
| Less: AEP Commercial Paper Outstanding | | 1,618.3 | | | |
| Net Available Liquidity | | $ | 4,584.6 | | | |
(a)In March 2024, AEP increased its $4 billion Revolving Credit Facility to $5 billion and extended the maturity date from March 2027 to March 2029. Also, in March 2024, AEP extended the maturity date of its $1 billion Revolving Credit Facility from March 2025 to March 2027.
AEP uses its commercial paper program to meet the short-term borrowing needs of its subsidiaries. The program funds a Utility Money Pool, which funds AEP’s utility subsidiaries; a Nonutility Money Pool, which funds certain AEP nonutility subsidiaries; and the short-term debt requirements of subsidiaries that are not participating in either money pool for regulatory or operational reasons, as direct borrowers. The maximum amount of commercial paper outstanding during 2024 was $2.9 billion. The average amount of commercial paper outstanding as of December 31, 2024 was $1.5 billion. The weighted-average yield for AEP’s commercial paper during 2024 was 5.39%.
Other Credit Facilities
An uncommitted facility gives the issuer of the facility the right to accept or decline each request made under the facility. As of December 31, 2024, AEP issued letters of credit on behalf of subsidiaries under six uncommitted facilities totaling $450 million. The Registrants’ maximum future payments for letters of credit issued under the uncommitted facilities as of December 31, 2024 was $238 million with maturities ranging from January 2025 to November 2025.
Financing Plan
As of December 31, 2024, AEP had $3.3 billion of long-term debt due within one year. This included $580 million of Pollution Control Bonds with mandatory tender dates and credit support for variable interest rates that requires the debt be classified as current and $155 million of securitization bonds and DCC Fuel notes. Management plans to refinance the majority of the maturities due within one year on a long-term basis.
Securitized Accounts Receivables
AEP Credit’s receivables securitization agreement provides a commitment of $900 million from bank conduits to purchase receivables and expires in September 2026. As of December 31, 2024, the affiliated utility subsidiaries were in compliance with all requirements under the agreement.
Debt Covenants and Borrowing Limitations
AEP’s credit agreements contain certain covenants and require it to maintain a percentage of debt-to-total capitalization at a level that does not exceed 67.5%. The method for calculating outstanding debt and capitalization is contractually-defined in AEP’s credit agreements. Debt as defined in the revolving credit agreement excludes securitization bonds and debt of AEP Credit. As of December 31, 2024, this contractually-defined percentage was 59.3%. Non-performance under these covenants could result in an event of default under these credit agreements. In addition, the acceleration of AEP’s payment obligations, or the obligations of certain of AEP’s major subsidiaries, prior to maturity under any other agreement or instrument relating to debt outstanding in excess of $100 million, would cause an event of default under these credit agreements. This condition also applies, at the more restrictive level of $50 million of debt outstanding, in a majority of AEP’s non-exchange-traded commodity contracts and would similarly allow lenders and counterparties to declare the outstanding amounts payable. However, a default under AEP’s non-exchange-traded commodity contracts would not cause an event of default under its credit agreements.
The revolving credit facilities do not permit the lenders to refuse a draw on any facility if a material adverse change occurs.
Utility Money Pool borrowings and external borrowings may not exceed amounts authorized by regulatory orders and AEP manages its borrowings to stay within those authorized limits.
ATM Program
AEP participates in an ATM offering program that allows AEP to issue, from time to time, shares of its common stock, including shares of common stock that may be sold pursuant to an equity forward sales agreement. As of December 31, 2024, approximately $1.3 billion of equity is available for issuance under the ATM offering program. See Note 15 - Financing Activities for additional information.
Dividend Policy and Restrictions
The Board of Directors declared a quarterly dividend of $0.93 per share in January 2025. Future dividends may vary depending upon AEP’s profit levels, operating cash flow levels and capital requirements, as well as financial and other business conditions existing at the time. Parent’s income primarily derives from common stock equity in the earnings of its utility subsidiaries. Various financing arrangements and regulatory requirements may impose certain restrictions on the ability of the subsidiaries to transfer funds to Parent in the form of dividends. Management does not believe these restrictions will have any significant impact on its ability to access cash to meet the payment of dividends on its common stock. See “Dividend Restrictions” section of Note 15 for additional information.
Credit Ratings
AEP and its utility subsidiaries do not have any credit arrangements that would require material changes in payment schedules or terminations as a result of a credit downgrade, but its access to the commercial paper market may depend on its credit ratings. In addition, downgrades in AEP’s credit ratings by one of the rating agencies could increase its borrowing costs. Counterparty concerns about the credit quality of AEP or its utility subsidiaries could subject AEP to additional collateral demands under adequate assurance clauses under its derivative and non-derivative energy contracts.
Supply Chain Disruption and Inflation
The Registrants have experienced certain supply chain disruptions driven by several factors including international tensions and the ramifications of regional conflict, inflation, labor shortages in certain trades and shortages in the availability of certain raw materials. These supply chain disruptions have not had a material impact on the Registrants’ net income, cash flows and financial condition, but have extended lead times for certain goods and services and have contributed to higher prices for fuel, materials, labor, equipment and other needed commodities. Management has implemented risk mitigation strategies seeking to limit the impacts of these supply chain disruptions. Forecasted load growth may further impact supply chains in the future by increasing demand pressures for certain materials and services, thereby requiring additional risk mitigation strategies to be deployed.
The United States economy has been in an elevated inflationary environment. A prolonged continuation or a further increase in the severity of supply chain and inflationary disruptions could result in additional increases in the cost of certain goods, services and cost of capital and further extend lead times which could reduce future net income and cash flows and impact financial condition.
CASH FLOW
AEP relies primarily on cash flows from operations, debt issuances, issuances of common stock under the ATM program and its existing cash and cash equivalents to fund its liquidity and investing activities. AEP’s investing and capital requirements are primarily capital expenditures, repaying of long-term debt and paying dividends to shareholders. AEP uses short-term debt, including commercial paper and bank term loans, as a bridge to long-term debt financing. The levels of borrowing may vary significantly due to the timing of long-term debt financings and the impact of fluctuations in cash flows.
| | | | | | | | | | | | | | | | | | | | |
| | Years Ended December 31, |
| | 2024 | | 2023 | | 2022 |
| | (in millions) |
| Cash, Cash Equivalents and Restricted Cash at Beginning of Period | | $ | 379.0 | | | $ | 556.5 | | | $ | 451.4 | |
| Net Cash Flows from Operating Activities | | 6,804.3 | | | 5,012.2 | | | 5,288.0 | |
| Net Cash Flows Used for Investing Activities | | (7,596.5) | | | (6,266.7) | | | (7,751.8) | |
| Net Cash Flows from Financing Activities | | 659.2 | | | 1,077.0 | | | 2,568.9 | |
| | | | | | |
| Net Increase (Decrease) in Cash, Cash Equivalents and Restricted Cash | | (133.0) | | | (177.5) | | | 105.1 | |
| Cash, Cash Equivalents and Restricted Cash at End of Period | | $ | 246.0 | | | $ | 379.0 | | | $ | 556.5 | |
Operating Activities
| | | | | | | | | | | | | | | | | | | | |
| | Years Ended December 31, |
| | 2024 | | 2023 | | 2022 |
| | (in millions) |
| Net Income | | $ | 2,975.8 | | | $ | 2,212.6 | | | $ | 2,305.6 | |
| Non-Cash Adjustments to Net Income (a) | | 3,382.6 | | | 3,394.5 | | | 3,461.6 | |
| Mark-to-Market of Risk Management Contracts | | (80.4) | | | 8.8 | | | 15.5 | |
| | | | | | |
| Property Taxes | | (45.4) | | | (41.1) | | | (41.2) | |
| Deferred Fuel Over/Under Recovery, Net | | 277.0 | | | 892.8 | | | (319.2) | |
| | | | | | |
| | | | | | |
| | | | | | |
| Change in Other Noncurrent Assets (b) | | (521.9) | | | (780.9) | | | (234.4) | |
| Change in Other Noncurrent Liabilities | | 306.3 | | | 29.0 | | | 337.8 | |
| Change in Certain Components of Working Capital | | 510.3 | | | (703.5) | | | (237.7) | |
| Net Cash Flows from Operating Activities | | $ | 6,804.3 | | | $ | 5,012.2 | | | $ | 5,288.0 | |
(a)Includes Depreciation and Amortization, Deferred Income Taxes, Loss on the Expected Sale of the Kentucky Operations, Loss on the Sale of the Competitive Contracted Renewables Portfolio, Asset Impairments and Other Related Charges, Impairment of Equity Method Investment, Allowance for Equity Funds Used During Construction, Amortization of Nuclear Fuel, Gain on the Sale of Mineral Rights and Establishment of 2017-2019 Virginia Triennial Review Regulatory Asset.
(b)Includes Change in Regulatory Assets.
2024 Compared to 2023
Net Cash Flows from Operating Activities increased by $1.8 billion primarily due to the following:
•A $1.2 billion increase in cash from the Change in Certain Components of Working Capital. The increase is primarily due to a decrease in fuel, material and supplies driven by lower coal inventory on hand, employee-related benefits, proceeds received from the sale of transferable tax credits and the timing of accounts payable. These increases were partially offset by the timing of accounts receivable collections.
•A $751 million increase in cash from Net Income, after non-cash adjustments. See Results of Operations for further detail.
•A $277 million increase in cash from Changes in Other Noncurrent Liabilities. The increase is primarily due to changes in provisions for refunds and regulatory liabilities driven by timing differences in refunds to customers under rate rider mechanisms in addition to a decrease in ARO settlements in 2024. See Note 5 - Effects of Regulation and Note 19 - Property, Plant and Equipment for additional information.
•A $259 million increase in cash from Change in Other Noncurrent Assets primarily due to incremental other operation and maintenance storm restoration expenses incurred in several jurisdictions in addition to timing differences in collections from customers under rate rider mechanisms. See Note 4 - Rate Matters and Note 5 - Effects of Regulation for additional information.
These increases in cash were partially offset by:
•A $616 million decrease in cash primarily due to the timing of fuel and purchased power revenues and expenses.
Investing Activities
| | | | | | | | | | | | | | | | | | | | |
| | Years Ended December 31, |
| | 2024 | | 2023 | | 2022 |
| | (in millions) |
| Construction Expenditures | | $ | (7,630.7) | | | $ | (7,378.3) | | | $ | (6,671.7) | |
| Acquisitions of Nuclear Fuel | | (139.9) | | | (128.2) | | | (100.7) | |
| Acquisition of Renewable Energy Facilities | | (399.5) | | | (155.2) | | | (1,207.3) | |
| Proceeds from Sale of Equity Method Investment | | 114.0 | | | — | | | — | |
| Proceeds on Sale of Assets | | 362.2 | | | 1,341.4 | | | 218.0 | |
| Other | | 97.4 | | | 53.6 | | | 9.9 | |
| Net Cash Flows Used for Investing Activities | | $ | (7,596.5) | | | $ | (6,266.7) | | | $ | (7,751.8) | |
2024 Compared to 2023
Net Cash Flows Used for Investing Activities increased by $1.3 billion primarily due to the following:
•A $979 million decrease in Proceeds from Sale of Assets, primarily due to the sale of the competitive contracted renewables portfolio in 2023, partially offset by the sale of AEP Onsite Partners in 2024.
•A $252 million increase in Construction Expenditures, primarily due to increases in Corporate and Other of $430 million driven by expenditures for fuel cell generation assets partially offset by decreases in Transmission and Distribution Utilities of $124 million and Vertically Integrated Utilities of $87 million.
•A $244 million increase in Acquisition of Renewable Energy Facilities.
These increases in cash used were partially offset by:
•A $114 million increase in Proceeds from the Sale of AEP’s Equity Investment in NMRD.
See Note 7 - Acquisitions, Dispositions and Impairments for additional information.
Financing Activities
| | | | | | | | | | | | | | | | | | | | |
| | Years Ended December 31, |
| | 2024 | | 2023 | | 2022 |
| | (in millions) |
| Issuance of Common Stock | | $ | 552.1 | | | $ | 999.6 | | | $ | 826.5 | |
| Issuance/Retirement of Debt, Net | | 2,125.6 | | | 1,984.7 | | | 3,802.5 | |
| | | | | | |
| Dividends Paid on Common Stock | | (1,903.9) | | | (1,760.4) | | | (1,645.2) | |
| Principal Payments for Finance Lease Obligations | | (64.8) | | | (68.3) | | | (309.5) | |
| | | | | | |
| Other | | (49.8) | | | (78.6) | | | (105.4) | |
| Net Cash Flows from Financing Activities | | $ | 659.2 | | | $ | 1,077.0 | | | $ | 2,568.9 | |
2024 Compared to 2023
Net Cash Flows from Financing Activities decreased by $418 million primarily due to the following:
•A $489 million increase in retirements of long-term debt.
•A $448 million decrease in issuances of common stock primarily under AEP’s ATM program.
•A $346 million decrease in issuances of long-term debt.
•A $144 million decrease due to an increase in dividends paid on common stock.
These decreases in cash were partially offset by:
•A $976 million increase due to changes in short-term debt.
The following financing activities occurred during 2024:
AEP Common Stock:
•During 2024, AEP issued 6.7 million shares of common stock under the ATM offering program, incentive compensation, employee saving and dividend reinvestment plans. See “Common Stock” section of Note 15 for additional information. AEP received net proceeds of $552 million related to these issuances.
Debt:
•During 2024, AEP issued approximately $5.1 billion of long-term debt, including $2.8 billion of senior unsecured notes at interest rates ranging from 5.15% to 5.82%, $1 billion of junior subordinated notes at interest rates ranging from 6.95% to 7.05%, $530 million of notes payable at interest rates ranging from 6.41% to 6.89%, $385 million of pollution control bonds at interest rates ranging from 3.2% to 3.75%, $337 million of securitization bonds at an interest rate of 4.88% and $133 million of other debt at various interest rates. The proceeds from these issuances were primarily used to fund long-term debt maturities, construction programs and for working capital needs.
•During 2024, AEP entered into interest rate derivatives with notional amounts totaling $600 million that were designated as cash flow hedges. During 2024, settlements of AEP’s interest rate derivatives resulted in net cash paid of $49 million for derivatives designated as fair value hedges and net cash received of $4 million designated as cash flow hedges. As of December 31, 2024, AEP had a total notional amount of $950 million of outstanding interest rate derivatives designated as fair value hedges.
See “Long-term Debt Subsequent Events” section of Note 15 for Long-term debt and other securities issued, retired and principal payments made after December 31, 2024 through February 13, 2025, the date that the 10-K was issued.
BUDGETED CAPITAL EXPENDITURES
Management forecasts approximately $11.5 billion of capital expenditures in 2025. For the four year period, 2026 through 2029, management forecasts capital expenditures of $42.9 billion. Management’s forecasted capital expenditures reflect planned increases in investments for transmission infrastructure and new generation resources to support forecasted large load increases and continued improvements in distribution system reliability.
The expenditures are generally for transmission, generation, distribution, regulated renewables and required environmental investment to comply with the Federal EPA rules. Estimated capital expenditures are subject to periodic review and modification and may vary based on the ongoing effects of regulatory constraints, environmental regulations, business opportunities, market volatility, economic trends, supply chain issues, weather, legal reviews, inflation and the ability to access capital. Management expects to fund these capital expenditures through cash flows from operations, proceeds from the strategic sale of assets and financing activities. Generally, the Registrant Subsidiaries use cash or short-term borrowings under the money pool to fund these expenditures until long-term funding is arranged. The estimated capital expenditures by Business Segment are as follows:
| | | | | | | | | | | | | | | | | | | | | | | | | | | | | | | | | | | | | | | | | | | | | | | | | | |
| | 2025 Budgeted Capital Expenditures | | 2026-2029 |
| Segment | | Environmental | | Generation | | Renewables | | Transmission | | Distribution | | Other (a) | | Total | | Total |
| | (in millions) |
| VIU | | $ | 54 | | | $ | 1,310 | | | $ | 2,981 | | | $ | 937 | | | $ | 1,372 | | | $ | 436 | | | $ | 7,090 | | | $ | 23,882 | |
| T&D | | — | | | — | | | — | | | 1,277 | | | 1,266 | | | 234 | | | 2,777 | | | 11,385 | |
| AEPTHCo | | — | | | — | | | — | | | 1,485 | | | — | | | 24 | | | 1,509 | | | 7,080 | |
| G&M | | — | | | 1 | | | — | | | — | | | — | | | 21 | | | 22 | | | 90 | |
| Corporate and Other | | — | | | — | | | — | | | — | | | — | | | 105 | | | 105 | | | 449 | |
| Total | | $ | 54 | | | $ | 1,311 | | | $ | 2,981 | | | $ | 3,699 | | | $ | 2,638 | | | $ | 820 | | | $ | 11,503 | | | $ | 42,886 | |
(a)Amount primarily consists of facilities, software and telecommunications.
The 2025 estimated capital expenditures by Registrant Subsidiary are as follows:
| | | | | | | | | | | | | | | | | | | | | | | | | | | | | | | | | | | | | | | | | | | | |
| | 2025 Budgeted Capital Expenditures |
| Company | | Environmental | | Generation | | Renewables | | Transmission | | Distribution | | Other (a) | | Total |
| | (in millions) |
| AEP Texas | | $ | — | | | $ | — | | | $ | — | | | $ | 1,003 | | | $ | 704 | | | $ | 139 | | | $ | 1,846 | |
| AEPTCo | | — | | | — | | | — | | | 1,442 | | | — | | | 24 | | | 1,466 | |
| APCo | | 42 | | | 130 | | | 570 | | | 281 | | | 292 | | | 146 | | | 1,461 | |
| I&M | | 1 | | | 101 | | | 3 | | | 103 | | | 303 | | | 87 | | | 598 | |
| OPCo | | — | | | — | | | — | | | 274 | | | 562 | | | 95 | | | 931 | |
| PSO | | 4 | | | 869 | | | 1,119 | | | 138 | | | 351 | | | 65 | | | 2,546 | |
| SWEPCo | | 1 | | | 150 | | | 1,289 | | | 306 | | | 298 | | | 114 | | | 2,158 | |
(a) Amount primarily consists of facilities, software and telecommunications.
CRITICAL ACCOUNTING POLICIES AND ESTIMATES AND ACCOUNTING STANDARDS
CRITICAL ACCOUNTING POLICIES AND ESTIMATES
The preparation of financial statements in accordance with GAAP requires management to make estimates and assumptions that affect reported amounts and related disclosures, including amounts related to legal matters and contingencies. Management considers an accounting estimate to be critical if:
•It requires assumptions to be made that were uncertain at the time the estimate was made; and
•Changes in the estimate or different estimates that could have been selected could have a material effect on net income or financial condition.
Management discusses the development and selection of critical accounting estimates as presented below with the Audit Committee of AEP’s Board of Directors and the Audit Committee reviews the disclosures relating to them.
Management believes that the current assumptions and other considerations used to estimate amounts reflected in the financial statements are appropriate. However, actual results can differ significantly from those estimates.
The sections that follow present information about critical accounting estimates, as well as the effects of hypothetical changes in the material assumptions used to develop each estimate.
Regulatory Accounting
Nature of Estimates Required
The Registrants’ financial statements reflect the actions of regulators that can result in the recognition of revenues and expenses in different time periods than enterprises that are not rate-regulated.
The Registrants recognize regulatory assets (deferred expenses to be recovered in the future) and regulatory liabilities (deferred future revenue reductions or refunds) for the economic effects of regulation. Specifically, the timing of expense and income recognition is matched with regulated revenues. Liabilities are also recorded for refunds, or probable refunds, to customers that have not been made.
Assumptions and Approach Used
When incurred costs are probable of recovery through regulated rates, regulatory assets are recorded on the balance sheets. Management reviews the probability of recovery at each balance sheet date and whenever new events occur. Similarly, regulatory liabilities are recorded when a determination is made that a refund is probable or when ordered by a commission. Examples of new events that affect probability include changes in the regulatory environment, issuance of a regulatory commission order or passage of new legislation. The assumptions and judgments used by regulatory authorities continue to have an impact on the recovery of costs as well as the return of revenues, rate of return earned on invested capital and timing and amount of assets to be recovered through regulated rates. If recovery of a regulatory asset is no longer probable, that regulatory asset is written-off as a charge against earnings. A write-off of regulatory assets or establishment of a regulatory liability may also reduce future cash flows since there will be no recovery through regulated rates.
Effect if Different Assumptions Used
A change in the above assumptions may result in a material impact on net income. See Note 5 - Effects of Regulation for additional information related to regulatory assets and regulatory liabilities.
Revenue Recognition – Unbilled Revenues
Nature of Estimates Required
AEP recognizes revenues from customers as the performance obligations of delivering energy to customers are satisfied. The determination of sales to individual customers is based on the reading of their meters, which is performed on a systematic basis throughout the month. At the end of each month, amounts of energy delivered to customers since the date of the last meter reading are estimated and the corresponding unbilled revenue accrual is recorded. This estimate is reversed in the following month and actual revenue is recorded based on meter readings. PSO and SWEPCo do not include the fuel portion in unbilled revenue in accordance with the applicable state commission regulatory treatment in Arkansas, Louisiana, Oklahoma and Texas.
Accrued unbilled revenues for the Vertically Integrated Utilities segment were $351 million and $288 million as of December 31, 2024 and 2023, respectively. The changes in unbilled electric utility revenues for AEP’s Vertically Integrated Utilities segment were $63 million, $(66) million and $108 million for the years ended December 31, 2024, 2023 and 2022, respectively. The changes in unbilled electric revenues are primarily due to changes in weather, rates and usage.
Accrued unbilled revenues for the Transmission and Distribution Utilities segment were $199 million and $191 million as of December 31, 2024 and 2023, respectively. The changes in unbilled electric utility revenues for AEP’s Transmission and Distribution Utilities segment were $8 million, $(30) million and $49 million for the years ended December 31, 2024, 2023 and 2022, respectively. The changes in unbilled electric revenues are primarily due to changes in weather, rates and usage.
Accrued unbilled revenues for the Generation & Marketing segment were $121 million and $111 million as of December 31, 2024 and 2023, respectively. The changes in unbilled electric utility revenues for AEP’s Generation & Marketing segment were $10 million, $2 million and $(1) million for the years ended December 31, 2024, 2023 and 2022, respectively.
Assumptions and Approach Used
For each Registrant except AEPTCo, the monthly estimate for unbilled revenues is based upon a primary computation of net generation (generation plus purchases less sales) less the current month’s billed KWhs and estimated line losses, plus the prior month’s unbilled KWhs. However, due to the potential for meter reading issues, meter drift and other anomalies, a secondary computation is made, based upon an allocation of billed KWhs to the current month and previous month, on a billing cycle-by-cycle basis, and by dividing the current month aggregated result by the billed KWhs. The two methodologies are evaluated to confirm that they are not statistically different.
For AEP’s Generation & Marketing segment, management calculates unbilled revenues based on a primary computation of load as provided by PJM less the current month’s billed KWhs and estimated line losses, plus the prior month’s unbilled KWhs. However, due to the potential for meter reading issues, meter drift and other anomalies, a secondary computation is made, based upon using the most recent historic daily activity on a per contract basis. The two methodologies are evaluated to confirm that they are not statistically different.
Effect if Different Assumptions Used
If the two methodologies used to estimate unbilled revenue are statistically different, a limiter adjustment is made to bring the primary computation within one standard deviation of the secondary computation. Additionally, significant fluctuations in energy demand for the unbilled period, weather, line losses or changes in the composition of customer classes could impact the estimate of unbilled revenue.
Accounting for Derivative Instruments
Nature of Estimates Required
Management considers fair value techniques, valuation adjustments related to credit and liquidity and judgments related to the probability of forecasted transactions occurring within the specified time period to be critical accounting estimates. These estimates are considered significant because they are highly susceptible to change from period to period and are dependent on many subjective factors.
Assumptions and Approach Used
The Registrants measure the fair values of derivative instruments and hedge instruments accounted for using MTM accounting based primarily on exchange prices and broker quotes. If a quoted market price is not available, the fair value is estimated based on the best market information available including valuation models that estimate future energy prices based on existing market and broker quotes and other assumptions. Fair value estimates, based upon the best market information available, involve uncertainties and matters of significant judgment. These uncertainties include forward market price assumptions.
The Registrants reduce fair values by estimated valuation adjustments for items such as discounting, liquidity and credit quality. Liquidity adjustments are calculated by utilizing bid/ask spreads to estimate the potential fair value impact of liquidating open positions over a reasonable period of time. Credit adjustments on risk management contracts are calculated using estimated default probabilities and recovery rates relative to the counterparties or counterparties with similar credit profiles and contractual netting agreements.
With respect to hedge accounting, management assesses hedge effectiveness and evaluates a forecasted transaction’s probability of occurrence within the specified time period as provided in the original hedge documentation.
Effect if Different Assumptions Used
There is inherent risk in valuation modeling given the complexity and volatility of energy markets. Therefore, it is possible that results in future periods may be materially different as contracts settle.
The probability that hedged forecasted transactions will not occur by the end of the specified time period could change operating results by requiring amounts currently classified in Accumulated Other Comprehensive Income (Loss) to be classified into Operating Income.
For additional information see Note 10 - Derivatives and Hedging and Note 11 - Fair Value Measurements. See “Fair Value Measurements of Assets and Liabilities” section of Note 1 for AEP’s fair value calculation policy.
Long-Lived Assets
Nature of Estimates Required
In accordance with the requirements of “Property, Plant and Equipment” accounting guidance and “Regulated Operations” accounting guidance, the Registrants evaluate long-lived assets for impairment whenever events or changes in circumstances indicate that the carrying amount of any such assets may not be recoverable. Such events or changes in circumstance include planned abandonments, probable disallowances for rate-making purposes of assets determined to be recently completed plant and assets that meet the held-for-sale criteria. The Registrants utilize a group composite method of depreciation to estimate the useful lives of long-lived assets.
An impairment evaluation of a long-lived, held and used asset may result from an abandonment, significant decreases in the market price of an asset, a significant adverse change in the extent or manner in which an asset is being used or in its physical condition, a significant adverse change in legal factors or in the business climate that could affect the value of an asset, as well as other economic or operations analyses. If the book value of the asset is not recoverable through estimated, future undiscounted cash flows, the Registrants record an impairment to the extent that the fair value of the asset is less than its book value. Performing an impairment evaluation involves a significant degree of estimation and judgment in areas such as identifying circumstances that indicate an impairment may exist, identifying and grouping affected assets and developing the non-discounted and discounted future cash flows (used to estimate fair value in the absence of market-based value, in some instances) associated with the asset. Assets held for sale must be measured at the lower of the book value or fair value less cost to sell. An impairment is recognized if an asset’s fair value less costs to sell is less than its book value. Any impairment charge is recorded as a reduction to earnings.
Assumptions and Approach Used
The fair value of an asset is the amount at which that asset could be bought or sold in a current transaction between willing parties other than in a forced or liquidation sale. Quoted market prices in active markets are the best evidence of fair value and are used as the basis for the measurement, if available. In the absence of quoted prices for identical or similar assets in active markets, the Registrants estimate fair value using various internal and external valuation methods including cash flow projections or other market indicators of fair value such as bids received, comparable sales or independent appraisals. Cash flow estimates are based on relevant information available at the time the estimates are made. Estimates of future cash flows are, by nature, highly uncertain and may vary significantly from actual results. Also, when measuring fair value, management evaluates the characteristics of the asset or liability to determine if market participants would take those characteristics into account when pricing the asset or liability at the measurement date. Such characteristics include, for example, the condition and location of the asset or restrictions on the use of the asset. The Registrants perform depreciation studies that include a review of any external factors that may affect the useful life to determine composite depreciation rates and related lives which are subject to periodic review by state regulatory commissions for regulated assets. The fair value of the asset could be different using different estimates and assumptions in these valuation techniques.
Effect if Different Assumptions Used
In connection with the evaluation of long-lived assets in accordance with the requirements of “Property, Plant and Equipment” accounting guidance, the fair value of the asset can vary if different estimates and assumptions are used in the applied valuation techniques. Estimates for depreciation rates contemplate the history of interim capital replacements and the amount of salvage expected. In cases of impairment, the best estimate of fair value was made using valuation methods based on the most current information at that time. Differences in realized sales proceeds versus the estimated fair value of the asset are generally due to a variety of factors including, but not limited to, differences in subsequent market conditions, the level of bidder interest, the timing and terms of the transactions and management’s analysis of the benefits of the transaction.
Pension and OPEB
AEPSC maintains a qualified, defined benefit pension plan (Qualified Plan), which covers substantially all nonunion and certain union employees, and unfunded, non-qualified supplemental plans (Nonqualified Plans) to provide benefits in excess of amounts permitted under the provisions of the tax law for participants in the Qualified Plan (collectively the Pension Plans). AEPSC also sponsors OPEB plans to provide health and life insurance benefits for retired employees. The Pension Plans and OPEB plans are collectively referred to as the Plans.
For a discussion of investment strategy, investment limitations, target asset allocations and the classification of investments within the fair value hierarchy, see “Investments Held in Trust for Future Liabilities” and “Fair Value Measurements of Assets and Liabilities” sections of Note 1. See Note 8 - Benefit Plans for information regarding costs and assumptions for the Plans.
The following table shows the net periodic cost (credit) of the Plans:
| | | | | | | | | | | | | | | | | | | | |
| | Years Ended December 31, |
| Net Periodic Cost (Credit) | | 2024 | | 2023 | | 2022 |
| | (in millions) |
| Pension Plans | | $ | 86.1 | | | $ | (24.3) | | | $ | 80.9 | |
| OPEB | | (71.0) | | | (107.1) | | | (144.8) | |
The net periodic benefit cost is calculated based upon a number of actuarial assumptions, including expected long-term rates of return on the Plans’ assets. In developing the expected long-term rate of return assumption for 2025, management evaluated input from actuaries and investment consultants, including their reviews of asset class return expectations as well as long-term inflation assumptions. Management also considered historical returns of the investment markets and tax rates which affect a portion of the OPEB plans’ assets. Management anticipates that the investment managers employed for the Plans will invest the assets to generate future returns averaging 7% for the Qualified Plan and 6.5% for the OPEB plans.
The expected long-term rate of return on the Plans’ assets is based on management’s targeted asset allocation and expected investment returns for each investment category. Assumptions for the Plans are summarized in the following table:
| | | | | | | | | | | | | | | | | | | | | | | |
| Pension Plans | | OPEB |
| | | Assumed/Expected | | | | Assumed/Expected |
| 2025 Target | | Long-Term | | 2025 Target | | Long-Term |
| Asset Allocation | | Rate of Return | | Asset Allocation | | Rate of Return |
| Equity | 35 | % | | 8.61 | % | | 67 | % | | 7.51 | % |
| Fixed Income | 49 | % | | 5.48 | % | | 32 | % | | 4.43 | % |
| Other Investments | 15 | % | | 9.12 | % | | — | | | — | |
| Cash and Cash Equivalents | 1 | % | | 3.36 | % | | 1 | % | | 3.36 | % |
| Total | 100 | % | | | | 100 | % | | |
Management regularly reviews the actual asset allocation and periodically rebalances the investments to the targeted allocation. Management believes that 7% for the Qualified Plan and 6.5% for the OPEB plans are reasonable estimates of the long-term rate of return on the Plans’ assets. The Pension Plans’ assets had an actual gain of 2.59% and an actual gain of 9.50% for the years ended December 31, 2024 and 2023, respectively. The OPEB plans’ assets had an actual gain of 8.98% and an actual gain of 15.48% for the years ended December 31, 2024 and 2023, respectively. Management will continue to evaluate the actuarial assumptions, including the expected rate of return, at least annually, and will adjust the assumptions as necessary.
AEP bases the determination of pension expense or income on a market-related valuation of assets, which reduces year-to-year volatility. This market-related valuation recognizes investment gains or losses over a five-year period from the year in which they occur. Investment gains or losses for this purpose are the difference between the expected return calculated using the market-related value of assets and the actual return based on the market-related value of assets. Since the market-related value of assets recognizes gains or losses over a five-year period, the future value of assets will be impacted as previously deferred gains or losses are recorded. As of December 31, 2024, AEP had cumulative gains of approximately $529 million for the Qualified Plan that remain to be recognized in the calculation of the market-related value of assets. These unrecognized market-related net actuarial gains may result in decreases in the future pension costs depending on several factors, including whether such gains at each measurement date exceed the corridor in accordance with “Compensation – Retirement Benefits” accounting guidance.
The method used to determine the discount rate that AEP utilizes for determining future obligations is a duration-based method in which a hypothetical portfolio of high quality corporate bonds is constructed with cash flows matching the benefit plan liability. The composite yield on the hypothetical bond portfolio is used as the discount rate for the plan. The discount rate as of December 31, 2024 under this method was 5.65% for the Qualified Plan, 5.6% for the Nonqualified Plans and 5.6% for the OPEB plans. Due to the effect of the unrecognized net actuarial losses and based on an expected rate of return, discount rates and various other assumptions, management estimates costs (credits) for the Pension Plans will approximate $43 million, $99 million and $139 million in 2025, 2026 and 2027, respectively. Based on an expected rate of return discount rate and various other assumptions, management estimates OPEB plan credits will approximate $78 million, $74 million and $80 million in 2025, 2026 and 2027, respectively. Future actual costs will depend on future investment performance, changes in future discount rates and various other factors related to the populations participating in the Plans. The actuarial assumptions used may differ materially from actual results. The effects of a 50 basis point change to selective actuarial assumptions are included in the “Effect if Different Assumptions Used” section below.
The value of AEP’s Pension Plans’ assets is $3.7 billion as of December 31, 2024 and $4.1 billion as of December 31, 2023. During 2024, the Qualified Plan paid $219 million and the Nonqualified Plans paid $5 million in benefits to plan participants. The value of AEP’s OPEB plans’ assets increased to $1.8 billion as of December 31, 2024 from $1.7 billion as of December 31, 2023 primarily due to positive investment returns. During 2024, the OPEB plans paid $106 million in benefits to plan participants.
Nature of Estimates Required
AEPSC sponsors pension and OPEB plans in various forms covering all employees who meet eligibility requirements. These benefits are accounted for under “Compensation” and “Plan Accounting” accounting guidance. The measurement of pension and OPEB obligations, costs and liabilities is dependent on a variety of assumptions.
Assumptions and Approach Used
The critical assumptions used in developing the required estimates includes discount rate, compensation increase rate, cash balance crediting rate, health care cost trend rate and expected return on plan assets. Other assumptions, such as retirement, mortality and turnover, are evaluated periodically and updated to reflect actual experience.
Effect if Different Assumptions Used
The actuarial assumptions used may differ materially from actual results due to changing market and economic conditions, higher or lower withdrawal rates, longer or shorter life spans of participants or higher or lower lump sum versus annuity payout elections by plan participants. These differences may result in a significant impact to the amount of pension and OPEB expense recorded. If a 50 basis point change were to occur for the following assumptions, the approximate effect on the financial statements would be as follows:
| | | | | | | | | | | | | | | | | | | | | | | | | | |
| | Pension Plans | | OPEB |
| | +0.5% | | -0.5% | | +0.5% | | -0.5% |
| | (in millions) |
| Effect on December 31, 2024 Benefit Obligations | | | | | | | | |
| Discount Rate | | $ | (154.7) | | | $ | 168.0 | | | $ | (26.0) | | | $ | 28.2 | |
| Compensation Increase Rate | | 21.7 | | | (20.3) | | | NA | | NA |
| Cash Balance Crediting Rate | | 53.5 | | | (50.5) | | | NA | | NA |
| Health Care Cost Trend Rate | | NA | | NA | | 3.3 | | | (2.5) | |
| | | | | | | | |
| Effect on 2024 Periodic Cost | | | | | | | | |
| Discount Rate | | $ | (9.9) | | | $ | 10.8 | | | $ | (1.4) | | | $ | 1.5 | |
| Compensation Increase Rate | | 5.5 | | | (5.1) | | | NA | | NA |
| Cash Balance Crediting Rate | | 11.4 | | | (10.8) | | | NA | | NA |
| Health Care Cost Trend Rate | | NA | | NA | | 0.5 | | | (0.4) | |
| Expected Return on Plan Assets | | (22.1) | | | 22.1 | | | (8.3) | | | 8.3 | |
NA Not applicable.
Asset Retirement Obligations – Impact of the 2024 CCR Rule
Nature of Estimates Required
In April 2024, the Federal EPA finalized revisions to the CCR Rule to expand the scope of the rule to include inactive impoundments at inactive facilities as well as to establish requirements for currently exempt solid waste management units that involve the direct placement of CCR on the land. Accounting for the incremental asset retirement obligation arising from the revised CCR Rule requires significant judgment by management due to the significant measurement uncertainty in estimating the incremental liability. As a result of the rule, AEP recorded an incremental ARO of $674 million in the second quarter of 2024.
Assumptions and Approach Used
AROs are computed as the present value of the estimated costs associated with the future retirement of an asset and are recorded in the period in which the liability is incurred. Projections of the timing and amounts of future cash outlays are based on estimation of the extent and quantity of coal ash present at sites, projections of the when and how the liabilities will be remediated as well as the rate at which costs will escalate over time and discount rate, which may change significantly over time.
Effect if Different Assumptions Used
As further groundwater monitoring and other analysis is performed, management expects to refine the assumptions and underlying cost estimates used in recording the incremental asset retirement obligation arising from the revised CCR Rule. The estimated liability can significantly change if there are changes in the impacted coal ash site acreage inputs or if refinements in the assumptions over the remediation costs for legacy CCR surface impoundments and CCR management units, including assumptions over future groundwater monitoring requirements vary from the initial estimates. These future changes could have a material impact on the ARO and materially reduce future net income, cash flows and financial condition if AEP cannot ultimately recover these additional costs of compliance. See Note 6 – Commitments, Guarantees and Contingencies and Note 19 – Property, Plant and Equipment for additional information related to AROs and the CCR Rule.
ACCOUNTING STANDARDS
See Note 2 - New Accounting Standards for information related to accounting standards and SEC rulemaking activity.
QUANTITATIVE AND QUALITATIVE DISCLOSURES ABOUT MARKET RISK
Market Risks
The Vertically Integrated Utilities segment is exposed to certain market risks as a major power producer and through transactions in power, coal, natural gas and marketing contracts. These risks include commodity price risks which may be subject to capacity risk, credit risk as well as interest rate risk. These risks represent the risk of loss that may impact this segment due to changes in the underlying market prices or rates.
The Transmission and Distribution Utilities segment is exposed to energy procurement risk and interest rate risk.
The Generation & Marketing segment conducts marketing, risk management and retail activities in ERCOT, PJM, SPP and MISO. This segment is exposed to certain market risks as a marketer of wholesale and retail electricity. These risks include commodity price risks which may be subject to capacity risk, credit risk as well as interest rate risk. These risks represent the risk of loss that may impact this segment due to changes in the underlying market prices or rates. In addition, the Generation & Marketing segment is also exposed to certain market risks as a power producer and through transactions in wholesale electricity, natural gas and marketing contracts.
Management employs risk management contracts including physical forward and financial forward purchase-and-sale contracts. Management engages in risk management of power, capacity, coal, natural gas and, to a lesser extent, heating oil, gasoline and other commodity contracts to manage the risk associated with the energy business. As a result, AEP is subject to price risk. The amount of risk taken is determined by the Commercial Operations, Energy Supply and Finance groups in accordance with established risk management policies as approved by the Finance Committee of the Board of Directors. AEPSC’s market risk oversight staff independently monitors risk policies, procedures and risk levels and provides members of the Regulated Risk Committee and the Energy Supply Risk Committee (Competitive Risk Committee) various reports regarding compliance with policies, limits and procedures. The Regulated Risk Committee consists of AEPSC’s Chief Financial Officer, Executive Vice President and Chief Commercial Officer, Executive Vice President Grid Solutions, Senior Vice President and Treasurer, and Senior Vice President of Regulated Commercial Operations. The Competitive Risk Committee consists of AEPSC’s Chief Financial Officer, Executive Vice President and Chief Commercial Officer, Senior Vice President and Treasurer, and Senior Vice President of Competitive Commercial Operations. When commercial activities exceed predetermined limits, positions are modified to reduce the risk to be within the limits unless specifically approved by the respective committee.
The following table summarizes the reasons for changes in total MTM value as compared to December 31, 2023:
| | | | | | | | | | | | | | | | | | | | | | | | | | |
| MTM Derivative Contract Net Assets (Liabilities) |
| | | | | | | | |
| Year Ended December 31, 2024 |
| | | | | | | | |
| | Vertically
Integrated
Utilities | | Transmission
and
Distribution
Utilities | | Generation
&
Marketing | | Total |
| | (in millions) |
| Total MTM Risk Management Contracts - Commodity Net Assets (Liabilities) as of December 31, 2023 | | $ | 16.9 | | | $ | (51.0) | | | $ | 92.4 | | | $ | 58.3 | |
| Loss from Contracts Realized/Settled During the Period and Entered in a Prior Period | | 9.1 | | | 7.1 | | | 43.6 | | | 59.8 | |
| Fair Value of New Contracts at Inception When Entered During the Period (a) | | — | | | — | | | (47.1) | | | (47.1) | |
| Changes in Fair Value Due to Market Fluctuations During the Period (b) | | (24.0) | | | — | | | 72.9 | | | 48.9 | |
| Changes in Fair Value Allocated to Regulated Jurisdictions (c) | | 89.8 | | | (4.1) | | | — | | | 85.7 | |
| | | | | | | | |
| Total MTM Risk Management Contracts - Commodity Net Assets (Liabilities) as of December 31, 2024 | | $ | 91.8 | | | $ | (48.0) | | | $ | 161.8 | | | $ | 205.6 | |
| | | | | | | | |
| Commodity Cash Flow Hedge Contracts | | | | | | | | 124.7 | |
| | | | | | | | |
| Fair Value Hedge Contracts | | | | | | | | (71.6) | |
| Collateral Deposits | | | | | | | | (83.6) | |
| | | | | | | | |
| Total MTM Derivative Contract Net Assets as of December 31, 2024 | | | | | | | | $ | 175.1 | |
(a)Reflects fair value on primarily auctions or long-term structured contracts which are typically with customers that seek fixed pricing to limit their risk against fluctuating energy prices. The contract prices are valued against market curves associated with the delivery location and delivery term. A significant portion of the total volumetric position has been economically hedged.
(b)Market fluctuations are attributable to various factors such as supply/demand, weather, etc.
(c)Relates to the net gains (losses) of those contracts that are not reflected on the statements of income. These net gains (losses) are recorded as regulatory liabilities/assets or accounts payable on the balance sheet.
See Note 10 – Derivatives and Hedging and Note 11 – Fair Value Measurements for additional information related to risk management contracts. The following tables and discussion provide information on credit risk and market volatility risk.
Credit Risk
Credit risk is mitigated in wholesale marketing and trading activities by assessing the creditworthiness of potential counterparties before entering into transactions with them and continuing to evaluate their creditworthiness on an ongoing basis. Management uses credit agency ratings and current market-based qualitative and quantitative data as well as financial statements to assess the financial health of counterparties on an ongoing basis.
AEP has risk management contracts (includes non-derivative contracts) with numerous counterparties. Since open risk management contracts are valued based on changes in market prices of the related commodities, exposures change daily. As of December 31, 2024, credit exposure net of collateral to sub investment grade counterparties was approximately 18.2%, expressed in terms of net MTM assets, net receivables and the net open positions for contracts not subject to MTM (representing economic risk even though there may not be risk of accounting loss).
As of December 31, 2024, the following table approximates AEP’s counterparty credit quality and exposure based on netting across commodities, instruments and legal entities where applicable:
| | | | | | | | | | | | | | | | | | | | | | | | | | | | | | | | |
| Counterparty Credit Quality | | Exposure
Before
Credit
Collateral | | Credit
Collateral | | Net
Exposure | | Number of
Counterparties
>10% of
Net Exposure | | Net Exposure
of
Counterparties
>10% |
| | (in millions, except number of counterparties) |
| Investment Grade | | $ | 639.2 | | | $ | 88.0 | | | $ | 551.2 | | | 3 | | | $ | 333.9 | |
| | | | | | | | | | |
| | | | | | | | | | |
| Split Rating | | 8.6 | | | — | | | 8.6 | | | 1 | | | 8.6 | |
| Noninvestment Grade | | 3.6 | | | — | | | 3.6 | | | 2 | | | 3.6 | |
| No External Ratings: | | | | | | | | | | |
| Internal Investment Grade | | 17.7 | | | — | | | 17.7 | | | 3 | | | 10.7 | |
| Internal Noninvestment Grade | | 195.0 | | | 69.8 | | | 125.2 | | | 2 | | | 112.8 | |
| Total as of December 31, 2024 | | $ | 864.1 | | | $ | 157.8 | | | $ | 706.3 | | | | | |
All exposure in the table above relates to AEPSC and AEPEP as AEPSC is agent for and transacts on behalf of certain AEP subsidiaries, including the Registrant Subsidiaries and AEPEP is agent for, and transacts on behalf of, other AEP subsidiaries.
In addition, AEP is exposed to credit risk related to participation in RTOs. For each of the RTOs in which AEP participates, this risk is generally determined based on the proportionate share of member gross activity over a specified period of time.
Value at Risk (VaR) Associated with Risk Management Contracts
Management uses a risk measurement model, which calculates VaR, to measure AEP’s commodity price risk in the risk management portfolio. The VaR is based on the variance-covariance method using historical prices to estimate volatilities and correlations and assumes a 95% confidence level and a one-day holding period. Based on this VaR analysis, as of December 31, 2024, a near term typical change in commodity prices is not expected to materially impact net income, cash flows or financial condition.
Management calculates the VaR for both a trading and non-trading portfolio. The trading portfolio consists primarily of contracts related to energy trading and marketing activities. The non-trading portfolio consists primarily of economic hedges of generation and retail supply activities.
The following tables show the end, high, average and low market risk as measured by VaR for the periods indicated:
VaR Model
Trading Portfolio
| | | | | | | | | | | | | | | | | | | | | | | | | | | | | | | | | | | | | | | | | | | | |
| Twelve Months Ended | | Twelve Months Ended |
| December 31, 2024 | | December 31, 2023 |
| End | | High | | Average | | Low | | End | | High | | Average | | Low |
| (in millions) | | (in millions) |
| $ | 0.2 | | | $ | 1.7 | | | $ | 0.3 | | | $ | 0.1 | | | $ | 0.2 | | | $ | 0.9 | | | $ | 0.2 | | | $ | 0.1 | |
VaR Model
Non-Trading Portfolio
| | | | | | | | | | | | | | | | | | | | | | | | | | | | | | | | | | | | | | | | | | | | |
| Twelve Months Ended | | Twelve Months Ended |
| December 31, 2024 | | December 31, 2023 |
| End | | High | | Average | | Low | | End | | High | | Average | | Low |
| (in millions) | | (in millions) |
| $ | 37.9 | | | $ | 98.6 | | | $ | 19.3 | | | $ | 7.6 | | | $ | 17.7 | | | $ | 32.7 | | | $ | 16.4 | | | $ | 6.1 | |
Management back-tests VaR results against performance due to actual price movements. Based on the assumed 95% confidence interval, the performance due to actual price movements would be expected to exceed the VaR at least once every 20 trading days.
As the VaR calculation captures recent price movements, management also performs regular stress testing of the trading portfolio to understand AEP’s exposure to extreme price movements. A historical-based method is employed whereby the current trading portfolio is subjected to actual, observed price movements from the last several years in order to ascertain which historical price movements translated into the largest potential MTM loss. Management then researches the underlying positions, price movements and market events that created the most significant exposure and reports the findings to the Risk Executive Committee, Regulated Risk Committee or Competitive Risk Committee as appropriate.
Interest Rate Risk
AEP is exposed to interest rate market fluctuations in the normal course of business operations. Prior to 2022, interest rates remained at low levels and the Federal Reserve maintained the federal funds target range at 0.0% to 0.25% for much of 2021. During 2022 and 2023, the Federal Reserve approved 11 rate increases for a cumulative total of 5.25% increase. In light of the progress on inflation and the balance of risks, during 2024, the Federal Reserve authorized three rate decreases for a cumulative total of 1.0% rate decrease. AEP has outstanding short and long-term debt which is subject to variable rates. AEP manages interest rate risk by limiting variable-rate exposures to a percentage of total debt, by entering into interest rate derivative instruments and by monitoring the effects of market changes in interest rates. For the twelve months ended December 31, 2024, 2023 and 2022, a 100 basis point change in the benchmark rate on AEP’s variable rate debt would impact pretax interest expense annually by $33 million, $40 million and $47 million, respectively.
REPORT OF INDEPENDENT REGISTERED PUBLIC ACCOUNTING FIRM
To the Board of Directors and Shareholders of
American Electric Power Company, Inc.
Opinions on the Financial Statements and Internal Control over Financial Reporting
We have audited the accompanying consolidated balance sheets of American Electric Power Company, Inc. and its subsidiaries (the "Company") as of December 31, 2024 and 2023, and the related consolidated statements of income, of comprehensive income (loss), of changes in equity and of cash flows for each of the three years in the period ended December 31, 2024, including the related notes and financial statement schedules listed in the index appearing under Item 15(a)(2) (collectively referred to as the "consolidated financial statements"). We also have audited the Company's internal control over financial reporting as of December 31, 2024, based on criteria established in Internal Control - Integrated Framework (2013) issued by the Committee of Sponsoring Organizations of the Treadway Commission (COSO).
In our opinion, the consolidated financial statements referred to above present fairly, in all material respects, the financial position of the Company as of December 31, 2024 and 2023, and the results of its operations and its cash flows for each of the three years in the period ended December 31, 2024 in conformity with accounting principles generally accepted in the United States of America. Also in our opinion, the Company maintained, in all material respects, effective internal control over financial reporting as of December 31, 2024, based on criteria established in Internal Control - Integrated Framework (2013) issued by the COSO.
Basis for Opinions
The Company's management is responsible for these consolidated financial statements, for maintaining effective internal control over financial reporting, and for its assessment of the effectiveness of internal control over financial reporting, included in Management’s Report on Internal Control over Financial Reporting appearing under Item 8. Our responsibility is to express opinions on the Company’s consolidated financial statements and on the Company's internal control over financial reporting based on our audits. We are a public accounting firm registered with the Public Company Accounting Oversight Board (United States) (PCAOB) and are required to be independent with respect to the Company in accordance with the U.S. federal securities laws and the applicable rules and regulations of the Securities and Exchange Commission and the PCAOB.
We conducted our audits in accordance with the standards of the PCAOB. Those standards require that we plan and perform the audits to obtain reasonable assurance about whether the consolidated financial statements are free of material misstatement, whether due to error or fraud, and whether effective internal control over financial reporting was maintained in all material respects.
Our audits of the consolidated financial statements included performing procedures to assess the risks of material misstatement of the consolidated financial statements, whether due to error or fraud, and performing procedures that respond to those risks. Such procedures included examining, on a test basis, evidence regarding the amounts and disclosures in the consolidated financial statements. Our audits also included evaluating the accounting principles used and significant estimates made by management, as well as evaluating the overall presentation of the consolidated financial statements. Our audit of internal control over financial reporting included obtaining an understanding of internal control over financial reporting, assessing the risk that a material weakness exists, and testing and evaluating the design and operating effectiveness of internal control based on the assessed risk. Our audits also included performing such other procedures as we considered necessary in the circumstances. We believe that our audits provide a reasonable basis for our opinions.
Definition and Limitations of Internal Control over Financial Reporting
A company’s internal control over financial reporting is a process designed to provide reasonable assurance regarding the reliability of financial reporting and the preparation of financial statements for external purposes in accordance with generally accepted accounting principles. A company’s internal control over financial reporting includes those policies and procedures that (i) pertain to the maintenance of records that, in reasonable detail, accurately and fairly reflect the transactions and dispositions of the assets of the company; (ii) provide reasonable assurance that transactions are recorded as necessary to permit preparation of financial statements in accordance with generally accepted accounting principles, and that receipts and expenditures of the company are being made only in accordance with authorizations of management and directors of the company; and (iii) provide reasonable assurance regarding prevention or timely detection of unauthorized acquisition, use, or disposition of the company’s assets that could have a material effect on the financial statements.
Because of its inherent limitations, internal control over financial reporting may not prevent or detect misstatements. Also, projections of any evaluation of effectiveness to future periods are subject to the risk that controls may become inadequate because of changes in conditions, or that the degree of compliance with the policies or procedures may deteriorate.
Critical Audit Matters
The critical audit matters communicated below are matters arising from the current period audit of the consolidated financial statements that were communicated or required to be communicated to the audit committee and that (i) relate to accounts or disclosures that are material to the consolidated financial statements and (ii) involved our especially challenging, subjective, or complex judgments. The communication of critical audit matters does not alter in any way our opinion on the consolidated financial statements, taken as a whole, and we are not, by communicating the critical audit matters below, providing separate opinions on the critical audit matters or on the accounts or disclosures to which they relate.
Accounting for the Effects of Cost-Based Regulation
As described in Notes 1 and 5 to the consolidated financial statements, the Company's consolidated financial statements reflect the actions of regulators that result in the recognition of certain revenues and expenses in different time periods than enterprises that are not rate-regulated. Regulatory assets (deferred expenses to be recovered in the future) and regulatory liabilities (deferred future revenue reductions or refunds) are recorded to reflect the economic effects of regulation in the same accounting period by matching expenses with their recovery through regulated revenues and matching income with its passage to customers in cost-based regulated rates. As of December 31, 2024, there were $5,575 million of deferred costs included in regulatory assets, $1,311 million of which were pending final regulatory approval, and $8,398 million of regulatory liabilities awaiting potential refund or future rate reduction, $322 million of which were pending final regulatory determination. Management reviews the probability of recovery of regulatory assets and refund of regulatory liabilities at each balance sheet date and whenever new events occur, such as changes in the regulatory environment, issuance of regulatory commission orders, or passage of new legislation.
The principal considerations for our determination that performing procedures relating to the accounting for the effects of cost-based regulation is a critical audit matter are (i) the significant judgment by management in assessing probability of the recovery of regulatory assets and refund of regulatory liabilities and (ii) a high degree of auditor judgment, subjectivity, and effort in performing procedures and evaluating audit evidence related to the probability of recovery of regulatory assets and refund of regulatory liabilities.
Addressing the matter involved performing procedures and evaluating audit evidence in connection with forming our overall opinion on the consolidated financial statements. These procedures included testing the effectiveness of controls relating to management's evaluation of new events, such as changes in the regulatory environment, issuance of regulatory commission orders, or passage of new legislation, including controls over the probability of recovery of regulatory assets and refund of regulatory liabilities. These procedures also included, among others (i) evaluating the reasonableness of management's assessment of probability of future recovery for regulatory assets and refund of regulatory liabilities; (ii) testing, on a sample basis, the regulatory assets and liabilities, including those subject to pending rate cases and regulatory proceedings, by considering (a) the provisions and formulas outlined in rate orders; (b) other regulatory correspondence; and (c) application of relevant regulatory precedents.
Valuation of Level 3 Energy Contracts
As described in Notes 1, 10 and 11 to the consolidated financial statements, the Company employs risk management commodity contracts including physical and financial forward purchase and sale contracts and, to a lesser extent, over-the-counter swaps and options to accomplish its risk management strategies. Certain over-the-counter and bilaterally executed derivative instruments are executed in less active markets with a lower availability of pricing information. As disclosed by management, the fair value of these risk management commodity contracts is estimated based on the best market information available, including valuation models that estimate future energy prices based on existing market and broker quotes, and other assumptions. Fair value estimates, based upon the best market information available, involve uncertainties and matters of significant judgment including forward market price assumptions. Risk management commodity contracts are substantially comprised of energy contracts. The main driver of contracts being classified as Level 3 is the inability to substantiate energy price curves in the market. Management utilized a forward market price assumption to value its level 3 energy contracts. The Company’s level 3 energy contracts assets and liabilities totaled $221 million and $145 million, respectively, as of December 31, 2024.
The principal considerations for our determination that performing procedures relating to the valuation of Level 3 energy contracts is a critical audit matter are (i) the significant judgment by management when developing the fair value estimate of the level 3 energy contracts; (ii) a high degree of auditor judgment, subjectivity, and effort in performing procedures and evaluating audit evidence related to management’s significant assumption relating to the forward market price; and (iii) the audit effort involved the use of professionals with specialized skill and knowledge.
Addressing the matter involved performing procedures and evaluating audit evidence in connection with forming our overall opinion on the consolidated financial statements. These procedures included testing the effectiveness of controls relating to management's valuation of the level 3 risk management commodity contracts, including energy contracts. These procedures also included, among others (i) testing the completeness and accuracy of the underlying data provided by management; (ii) testing management's process for developing the fair value of the level 3 energy contracts; (iii) evaluating the appropriateness of the valuation models used in developing the fair value estimate of the level 3 energy contracts; and (iv) the involvement of professionals with specialized skill and knowledge to assist in evaluating the reasonableness of the forward market price assumption.
Incremental Asset Retirement Obligations arising from the Federal Environment Protection Agency’s (“Federal EPA”) Revised Coal Combustion Residuals (CCR) Rule
As described in Notes 1 and 6 to the consolidated financial statements, in April 2024, the Federal EPA finalized revisions to the CCR Rule to expand the scope of the rule to include inactive impoundments at inactive facilities (“legacy CCR surface impoundments”) as well as to establish requirements for currently exempt solid waste management units that involve the direct placement of CCR on the land (“CCR management units”). The Federal EPA is requiring that owners and operators of legacy surface impoundments comply with all of the existing CCR Rule requirements applicable to inactive CCR surface impoundments at active facilities, except for the location restrictions and liner design criteria. Management evaluated the applicability of the rule to current and former plant sites and recorded incremental asset retirement obligations (AROs) based on initial cost estimates primarily reflecting compliance with the rule through closure in place and future groundwater monitoring requirements pursuant to the revised CCR Rule. As disclosed by management, accounting for the incremental ARO arising from the revised CCR Rule requires significant judgment by management due to the significant measurement uncertainty in estimating the incremental liability. As further groundwater monitoring and other analysis is performed, management expects to refine the assumptions and underlying cost estimates used in recording the incremental ARO arising from the revised CCR Rule. The estimated liability can significantly change if there are changes in the impacted coal ash site acreage inputs or if refinements in the assumptions over the remediation costs for legacy CCR surface impoundments and CCR management units, including assumptions over future groundwater monitoring requirements vary from the initial estimates. As a result of the rule, the Company recorded an incremental ARO of $674 million in the second quarter of 2024.
The principal considerations for our determination that performing procedures relating to the incremental ARO arising from the revised CCR Rule is a critical audit matter are (i) the significant judgment by management when developing the estimate of the incremental ARO; (ii) a high degree of auditor judgment, subjectivity and effort in performing procedures and evaluating the impacted coal ash site acreage and management’s assumptions over the remediation costs for legacy CCR surface impoundments and CCR management units, including assumptions over future groundwater monitoring requirements (collectively “management’s assumptions”); and (iii) the audit effort involved the use of professionals with specialized skill and knowledge.
Addressing the matter involved performing procedures and evaluating audit evidence in connection with forming our overall opinion on the consolidated financial statements. These procedures included testing the effectiveness of controls relating to management’s assessment of the incremental ARO arising from the revised CCR Rule, including controls over the impacted coal ash site acreage and management’s assumptions used in the estimate of the incremental ARO. These procedures also included, among others, (i) testing the completeness and accuracy of data used, including the impacted coal ash site acreage, in the estimate of the incremental ARO; (ii) testing management’s process for determining estimate of the incremental ARO, and (iii) the involvement of professionals with specialized skill and knowledge to assist in (a) assessing the adequacy of the cost assessment of the incremental ARO in accordance with the remediation requirements outlined in the Federal EPA’s revised CCR rule, (b) evaluating the reasonableness of management’s process over measuring coal ash site acreage and (c) evaluating the reasonableness of management’s assumptions used in the estimate.
/s/ PricewaterhouseCoopers LLP
Columbus, Ohio
February 13, 2025
We have served as the Company’s auditor since 2017.
MANAGEMENT’S REPORT ON INTERNAL CONTROL OVER FINANCIAL REPORTING
The management of American Electric Power Company, Inc. and Subsidiary Companies (AEP) is responsible for establishing and maintaining adequate internal control over financial reporting as such term is defined in Rule 13a-15(f) and 15d-15(f) under the Securities Exchange Act of 1934, as amended. AEP’s internal control is a process designed to provide reasonable assurance regarding the reliability of financial reporting and the preparation of financial statements for external purposes in accordance with generally accepted accounting principles.
Because of its inherent limitations, internal control over financial reporting may not prevent or detect misstatements. Also, projections of any evaluation of effectiveness to future periods are subject to the risk that controls may become inadequate because of changes in conditions, or that the degree of compliance with the policies or procedures may deteriorate.
Management assessed the effectiveness of AEP’s internal control over financial reporting as of December 31, 2024. In making this assessment, management used the criteria set forth by the Committee of Sponsoring Organizations of the Treadway Commission (COSO) in Internal Control – Integrated Framework (2013). Based on management’s assessment, management concluded AEP’s internal control over financial reporting was effective as of December 31, 2024.
PricewaterhouseCoopers LLP, AEP’s independent registered public accounting firm has issued an audit report on the effectiveness of AEP’s internal control over financial reporting as of December 31, 2024. The Report of Independent Registered Public Accounting Firm appears on the previous page.
AMERICAN ELECTRIC POWER COMPANY, INC. AND SUBSIDIARY COMPANIES
CONSOLIDATED STATEMENTS OF INCOME
For the Years Ended December 31, 2024, 2023 and 2022
(in millions, except per-share and share amounts)
| | | | | | | | | | | | | | | | | | | | |
| | Years Ended December 31, |
| | 2024 | | 2023 | | 2022 |
| REVENUES | | | | | | |
| Vertically Integrated Utilities | | $ | 11,414.0 | | | $ | 11,303.7 | | | $ | 11,292.8 | |
| Transmission and Distribution Utilities | | 5,879.6 | | | 5,677.2 | | | 5,489.6 | |
| Generation & Marketing | | 1,944.7 | | | 1,543.3 | | | 2,448.9 | |
| Other Revenues | | 483.0 | | | 458.1 | | | 408.2 | |
| TOTAL REVENUES | | 19,721.3 | | | 18,982.3 | | | 19,639.5 | |
| EXPENSES | | | | | | |
| Purchased Electricity, Fuel and Other Consumables Used for Electric Generation | | 5,936.3 | | | 6,578.3 | | | 7,097.9 | |
| | | | | | |
| Other Operation | | 3,127.6 | | | 2,810.5 | | | 2,878.1 | |
| Maintenance | | 1,325.1 | | | 1,276.3 | | | 1,249.4 | |
| Loss on the Expected Sale of the Kentucky Operations | | — | | | — | | | 363.3 | |
| | | | | | |
| Asset Impairments and Other Related Charges | | 142.5 | | | 85.6 | | | 48.8 | |
| Establishment of 2017-2019 Virginia Triennial Review Regulatory Asset | | — | | | — | | | (37.0) | |
| Gain on the Sale of Mineral Rights | | — | | | — | | | (116.3) | |
| Loss on the Sale of the Competitive Contracted Renewables Portfolio | | — | | | 92.7 | | | — | |
| Depreciation and Amortization | | 3,289.9 | | | 3,090.4 | | | 3,202.8 | |
| Taxes Other Than Income Taxes | | 1,596.3 | | | 1,492.3 | | | 1,469.8 | |
| TOTAL EXPENSES | | 15,417.7 | | | 15,426.1 | | | 16,156.8 | |
| | | | | | |
| OPERATING INCOME | | 4,303.6 | | | 3,556.2 | | | 3,482.7 | |
| | | | | | |
| Other Income (Expense): | | | | | | |
| | | | | | |
| | | | | | |
| Other Income | | 65.1 | | | 63.4 | | | 11.6 | |
| Allowance for Equity Funds Used During Construction | | 211.0 | | | 174.9 | | | 133.7 | |
| Non-Service Cost Components of Net Periodic Benefit Cost | | 126.0 | | | 221.1 | | | 188.5 | |
| | | | | | |
| Interest Expense | | (1,862.8) | | | (1,806.9) | | | (1,396.1) | |
| | | | | | |
| INCOME BEFORE INCOME TAX EXPENSE (BENEFIT) AND EQUITY EARNINGS (LOSS) | | 2,842.9 | | | 2,208.7 | | | 2,420.4 | |
| | | | | | |
| Income Tax Expense (Benefit) | | (39.2) | | | 54.6 | | | 5.4 | |
| Equity Earnings (Loss) of Unconsolidated Subsidiaries | | 93.7 | | | 58.5 | | | (109.4) | |
| | | | | | |
| | | | | | |
| | | | | | |
| | | | | | |
| | | | | | |
| NET INCOME | | 2,975.8 | | | 2,212.6 | | | 2,305.6 | |
| | | | | | |
| Net Income (Loss) Attributable to Noncontrolling Interests | | 8.7 | | | 4.5 | | | (1.6) | |
| | | | | | |
| EARNINGS ATTRIBUTABLE TO AEP COMMON SHAREHOLDERS | | $ | 2,967.1 | | | $ | 2,208.1 | | | $ | 2,307.2 | |
| | | | | | |
| WEIGHTED AVERAGE NUMBER OF BASIC AEP COMMON SHARES OUTSTANDING | | 530,092,672 | | | 518,903,682 | | | 511,841,946 | |
| | | | | | |
| | | | | | |
| | | | | | |
| TOTAL BASIC EARNINGS PER SHARE ATTRIBUTABLE TO AEP COMMON SHAREHOLDERS | | $ | 5.60 | | | $ | 4.26 | | | $ | 4.51 | |
| | | | | | |
| WEIGHTED AVERAGE NUMBER OF DILUTED AEP COMMON SHARES OUTSTANDING | | 531,337,703 | | | 520,206,258 | | | 513,484,609 | |
| | | | | | |
| | | | | | |
| | | | | | |
| TOTAL DILUTED EARNINGS PER SHARE ATTRIBUTABLE TO AEP COMMON SHAREHOLDERS | | $ | 5.58 | | | $ | 4.24 | | | $ | 4.49 | |
| | | | | | |
See Notes to Financial Statements of Registrants beginning on page 177. |
AMERICAN ELECTRIC POWER COMPANY, INC. AND SUBSIDIARY COMPANIES
CONSOLIDATED STATEMENTS OF COMPREHENSIVE INCOME (LOSS)
For the Years Ended December 31, 2024, 2023 and 2022
(in millions)
| | | | | | | | | | | | | | | | | | | | |
| | Years Ended December 31, |
| | 2024 | | 2023 | | 2022 |
| Net Income | | $ | 2,975.8 | | | $ | 2,212.6 | | | $ | 2,305.6 | |
| | | | | | |
| OTHER COMPREHENSIVE INCOME (LOSS), NET OF TAXES | | | | | | |
| Cash Flow Hedges, Net of Tax of $1.3, $(33.8) and $21.6 in 2024, 2023 and 2022, Respectively | | 5.0 | | | (127.0) | | | 81.4 | |
| | | | | | |
| Amortization of Pension and OPEB Deferred Costs, Net of Tax of $(0.7), $(3.4) and $(2.8) in 2024, 2023 and 2022, Respectively | | (2.5) | | | (12.6) | | | (10.4) | |
| Pension and OPEB Funded Status, Net of Tax of $10.9, $(4.3) and $(41.3) in 2024, 2023 and 2022, Respectively | | 41.0 | | | (16.3) | | | (155.4) | |
| Recognition of Pension Settlement Costs, Net of Tax of $2.4, $0, and $0 in 2024, 2023 and 2022, Respectively | | 8.9 | | | — | | | — | |
| Reclassifications of KPCo Pension and OPEB Regulatory Assets, Net of Tax of $0, $4.4 and $(4.4) in 2024, 2023 and 2022, Respectively | | — | | | 16.7 | | | (16.7) | |
| | | | | | |
| TOTAL OTHER COMPREHENSIVE INCOME (LOSS) | | 52.4 | | | (139.2) | | | (101.1) | |
| | | | | | |
| TOTAL COMPREHENSIVE INCOME | | 3,028.2 | | | 2,073.4 | | | 2,204.5 | |
| | | | | | |
| Total Comprehensive Income (Loss) Attributable To Noncontrolling Interests | | 8.7 | | | 4.5 | | | (1.6) | |
| | | | | | |
| TOTAL COMPREHENSIVE INCOME ATTRIBUTABLE TO AEP COMMON SHAREHOLDERS | | $ | 3,019.5 | | | $ | 2,068.9 | | | $ | 2,206.1 | |
| | | | | | |
See Notes to Financial Statements of Registrants beginning on page 177. |
AMERICAN ELECTRIC POWER COMPANY, INC. AND SUBSIDIARY COMPANIES
CONSOLIDATED STATEMENTS OF CHANGES IN EQUITY
For the Years Ended December 31, 2024, 2023 and 2022
(in millions)
| | | | | | | | | | | | | | | | | | | | | | | | | | | | | | | | | | | | | | | | | |
| AEP Common Shareholders | | | | |
| Common Stock | | | | | | Accumulated
Other
Comprehensive
Income (Loss) | | | | |
| Shares | | Amount | | Paid-in
Capital | | Retained
Earnings | | | Noncontrolling
Interests | | Total |
| TOTAL EQUITY – DECEMBER 31, 2021 | 524.4 | | | $ | 3,408.7 | | | $ | 7,172.6 | | | $ | 11,667.1 | | | $ | 184.8 | | | $ | 247.0 | | | $ | 22,680.2 | |
| | | | | | | | | | | | | |
| Issuance of Common Stock | 0.7 | | | 4.4 | | | 822.1 | | | | | | | | | 826.5 | |
| Common Stock Dividends | | | | | | | (1,628.7) | | (a) | | | (16.5) | | | (1,645.2) | |
| Other Changes in Equity | | | | | 56.3 | | | | | | | 0.1 | | | 56.4 | |
| | | | | | | | | | | | | |
| | | | | | | | | | | | | |
| Net Income (Loss) | | | | | | | 2,307.2 | | | | | (1.6) | | | 2,305.6 | |
| Other Comprehensive Loss | | | | | | | | | (101.1) | | | | | (101.1) | |
| TOTAL EQUITY – DECEMBER 31, 2022 | 525.1 | | | 3,413.1 | | | 8,051.0 | | | 12,345.6 | | | 83.7 | | | 229.0 | | | 24,122.4 | |
| | | | | | | | | | | | | |
| Issuance of Common Stock | 2.3 | | | 14.8 | | | 984.8 | | | | | | | | | 999.6 | |
| Common Stock Dividends | | | | | | | (1,752.3) | | (a) | | | (8.1) | | | (1,760.4) | |
| Other Changes in Equity | | | | | 38.1 | | | (1.0) | | | | | 0.2 | | | 37.3 | |
| | | | | | | | | | | | | |
| Disposition of Competitive Contracted Renewables Portfolio | | | | | | | | | | | (186.4) | | | (186.4) | |
| Net Income | | | | | | | 2,208.1 | | | | | 4.5 | | | 2,212.6 | |
| Other Comprehensive Loss | | | | | | | | | (139.2) | | | | | (139.2) | |
| TOTAL EQUITY – DECEMBER 31, 2023 | 527.4 | | | 3,427.9 | | | 9,073.9 | | | 12,800.4 | | | (55.5) | | | 39.2 | | | 25,285.9 | |
| | | | | | | | | | | | | |
| Issuance of Common Stock | 6.7 | | | 43.7 | | | 508.4 | | | | | | | | | 552.1 | |
| Common Stock Dividends | | | | | | | (1,898.3) | | (a) | | | (5.6) | | | (1,903.9) | |
| Other Changes in Equity | | | | | 23.8 | | | | | | | | | 23.8 | |
| | | | | | | | | | | | | |
| | | | | | | | | | | | | |
| Net Income | | | | | | | 2,967.1 | | | | | 8.7 | | | 2,975.8 | |
| Other Comprehensive Income | | | | | | | | | 52.4 | | | | | 52.4 | |
| TOTAL EQUITY – DECEMBER 31, 2024 | 534.1 | | | $ | 3,471.6 | | | $ | 9,606.1 | | | $ | 13,869.2 | | | $ | (3.1) | | | $ | 42.3 | | | $ | 26,986.1 | |
(a) Cash dividends declared per AEP common share were $3.57, $3.37 and $3.17 for the years ended December 31, 2024, 2023 and 2022, respectively.
| | |
See Notes to Financial Statements of Registrants beginning on page 177. |
AMERICAN ELECTRIC POWER COMPANY, INC. AND SUBSIDIARY COMPANIES
CONSOLIDATED BALANCE SHEETS
ASSETS
December 31, 2024 and 2023
(in millions)
| | | | | | | | | | | | | | |
| | December 31, |
| | 2024 | | 2023 |
| CURRENT ASSETS | | | | |
| Cash and Cash Equivalents | | $ | 202.9 | | | $ | 330.1 | |
Restricted Cash (December 31, 2024 and 2023 Amounts Include $43.1 and $48.9, Respectively, Related to Transition Funding, Restoration Funding, Appalachian Consumer Rate Relief Funding and Storm Recovery Funding) | | 43.1 | | | 48.9 | |
Other Temporary Investments (December 31, 2024 and 2023 Amounts Include $206.7 and $205, Respectively, Related to EIS and Transource Energy) | | 215.4 | | | 214.3 | |
| Accounts Receivable: | | | | |
| Customers | | 1,100.1 | | | 1,029.9 | |
| Accrued Unbilled Revenues | | 367.0 | | | 179.5 | |
| Pledged Accounts Receivable – AEP Credit | | 1,161.5 | | | 1,249.4 | |
| Miscellaneous | | 64.1 | | | 48.7 | |
| Allowance for Credit Losses | | (60.8) | | | (60.1) | |
| Total Accounts Receivable | | 2,631.9 | | | 2,447.4 | |
| Fuel | | 748.9 | | | 853.7 | |
| Materials and Supplies | | 966.2 | | | 1,025.8 | |
| Risk Management Assets | | 210.4 | | | 217.5 | |
| Accrued Tax Benefits | | 38.2 | | | 156.2 | |
| Regulatory Asset for Under-Recovered Fuel Costs | | 445.9 | | | 514.0 | |
| | | | |
| | | | |
| Prepayments and Other Current Assets | | 285.9 | | | 274.2 | |
| TOTAL CURRENT ASSETS | | 5,788.8 | | | 6,082.1 | |
| | | | |
| PROPERTY, PLANT AND EQUIPMENT | | | | |
| Electric: | | | | |
| Generation | | 24,829.7 | | | 24,329.5 | |
| Transmission | | 38,871.9 | | | 35,934.1 | |
| Distribution | | 31,061.9 | | | 28,989.9 | |
| Other Property, Plant and Equipment (Including Coal Mining and Nuclear Fuel) | | 7,491.6 | | | 6,484.9 | |
| Construction Work in Progress | | 6,346.9 | | | 5,508.0 | |
| Total Property, Plant and Equipment | | 108,602.0 | | | 101,246.4 | |
| Accumulated Depreciation and Amortization | | 26,186.4 | | | 24,553.0 | |
| TOTAL PROPERTY, PLANT AND EQUIPMENT – NET | | 82,415.6 | | | 76,693.4 | |
| | | | |
| OTHER NONCURRENT ASSETS | | | | |
| Regulatory Assets | | 5,129.2 | | | 5,092.4 | |
| Securitized Assets | | 554.3 | | | 336.3 | |
| Spent Nuclear Fuel and Decommissioning Trusts | | 4,395.1 | | | 3,860.2 | |
| Goodwill | | 52.5 | | | 52.5 | |
| Long-term Risk Management Assets | | 289.1 | | | 321.2 | |
| Operating Lease Assets | | 580.1 | | | 620.2 | |
| Deferred Charges and Other Noncurrent Assets | | 3,873.3 | | | 3,625.7 | |
| TOTAL OTHER NONCURRENT ASSETS | | 14,873.6 | | | 13,908.5 | |
| | | | |
| TOTAL ASSETS | | $ | 103,078.0 | | | $ | 96,684.0 | |
| | | | |
See Notes to Financial Statements of Registrants beginning on page 177. |
AMERICAN ELECTRIC POWER COMPANY, INC. AND SUBSIDIARY COMPANIES
CONSOLIDATED BALANCE SHEETS
LIABILITIES AND EQUITY
December 31, 2024 and 2023
(dollars in millions)
| | | | | | | | | | | | | | | | | | | | | | | | | | | | | |
| | | | | | | December 31, |
| | | | | | | 2024 | | 2023 |
| CURRENT LIABILITIES | | | | |
| Accounts Payable | | | | | | | $ | 2,637.6 | | | $ | 2,032.5 | |
| Short-term Debt: | | | | | | | | | |
| Securitized Debt for Receivables – AEP Credit | | | | | | | 900.0 | | | 888.0 | |
| Other Short-term Debt | | | | | | | 1,623.8 | | | 1,942.2 | |
| Total Short-term Debt | | | | | | | 2,523.8 | | | 2,830.2 | |
Long-term Debt Due Within One Year (December 31, 2024 and 2023 Amounts Include $216.5 and $207.2, Respectively, Related to DCC Fuel, Transition Funding, Restoration Funding, Appalachian Consumer Rate Relief Funding, Storm Recovery Funding and Transource Energy) | | | 3,335.0 | | | 2,490.5 | |
| Risk Management Liabilities | | | | | | | 100.0 | | | 229.6 | |
| Customer Deposits | | | | | | | 454.7 | | | 423.7 | |
| Accrued Taxes | | | | | | | 1,922.1 | | | 1,800.1 | |
| Accrued Interest | | | | | | | 453.3 | | | 410.2 | |
| Obligations Under Operating Leases | | | | | | | 91.9 | | | 115.7 | |
| | | | | | | | | |
| | | | | | | | | |
| Other Current Liabilities | | | | | | | 1,490.9 | | | 1,251.1 | |
| TOTAL CURRENT LIABILITIES | | | | | | | 13,009.3 | | | 11,583.6 | |
| | | | | | | | | |
| NONCURRENT LIABILITIES | | | | |
Long-term Debt (December 31, 2024 and 2023 Amounts Include $826.5 and $556.3, Respectively, Related to DCC Fuel, Restoration Funding, Appalachian Consumer Rate Relief Funding, Storm Recovery Funding and Transource Energy) | | | 39,307.8 | | | 37,652.7 | |
| Long-term Risk Management Liabilities | | | | | | | 224.4 | | | 241.8 | |
| Deferred Income Taxes | | | | | | | 9,972.4 | | | 9,415.7 | |
| Regulatory Liabilities and Deferred Investment Tax Credits | | | | | 8,344.0 | | | 8,182.4 | |
| Asset Retirement Obligations | | | | | | | 3,530.6 | | | 2,972.5 | |
| Employee Benefits and Pension Obligations | | | | | | | 360.7 | | | 241.7 | |
| Obligations Under Operating Leases | | | | | | | 504.3 | | | 519.4 | |
| Deferred Credits and Other Noncurrent Liabilities | | | | | | | 800.6 | | | 545.8 | |
| TOTAL NONCURRENT LIABILITIES | | | | | | | 63,044.8 | | | 59,772.0 | |
| | | | | | | | | |
| TOTAL LIABILITIES | | | | | | | 76,054.1 | | | 71,355.6 | |
| | | | | | | | | |
| Rate Matters (Note 4) | | | | | | | | | |
| Commitments and Contingencies (Note 6) | | | | | | | | | |
| | | | | | | | | |
| MEZZANINE EQUITY | | | | |
| | | | | | | | | |
| Contingently Redeemable Performance Share Awards | | | | | | | 37.8 | | | 42.5 | |
| TOTAL MEZZANINE EQUITY | | | | | | | 37.8 | | | 42.5 | |
| | | | | | | | | |
| EQUITY | | | | |
| Common Stock – Par Value – $6.50 Per Share: | | | | | | | | | |
| | 2024 | | 2023 | | | | | |
| Shares Authorized | | 600,000,000 | | 600,000,000 | | | | | |
| Shares Issued | | 534,094,530 | | 527,369,157 | | | | | |
| (1,186,815 and 1,184,572 Shares were Held in Treasury as of December 31, 2024 and 2023, Respectively) | | | 3,471.6 | | | 3,427.9 | |
| Paid-in Capital | | | | | | | 9,606.1 | | | 9,073.9 | |
| Retained Earnings | | | | | | | 13,869.2 | | | 12,800.4 | |
| Accumulated Other Comprehensive Income (Loss) | | | | | | | (3.1) | | | (55.5) | |
| TOTAL AEP COMMON SHAREHOLDERS’ EQUITY | | | 26,943.8 | | | 25,246.7 | |
| | | | | | | | | |
| Noncontrolling Interests | | | | | | | 42.3 | | | 39.2 | |
| | | | | | | | | |
| TOTAL EQUITY | | | | | | | 26,986.1 | | | 25,285.9 | |
| | | | | | | | | |
| TOTAL LIABILITIES, MEZZANINE EQUITY AND EQUITY | | $ | 103,078.0 | | | $ | 96,684.0 | |
| | | | | | | | | |
See Notes to Financial Statements of Registrants beginning on page 177. |
AMERICAN ELECTRIC POWER COMPANY, INC. AND SUBSIDIARY COMPANIES
CONSOLIDATED STATEMENTS OF CASH FLOWS
For the Years Ended December 31, 2024, 2023 and 2022
(in millions)
| | | | | | | | | | | | | | | | | | | | |
| | Years Ended December 31, |
| | 2024 | | 2023 | | 2022 |
| OPERATING ACTIVITIES | | | | | | |
| Net Income | | $ | 2,975.8 | | | $ | 2,212.6 | | | $ | 2,305.6 | |
| | | | | | |
| | | | | | |
| Adjustments to Reconcile Net Income to Net Cash Flows from Operating Activities: | | | | | | |
| Depreciation and Amortization | | 3,289.9 | | | 3,090.4 | | | 3,202.8 | |
| | | | | | |
| Deferred Income Taxes | | 58.3 | | | 185.1 | | | (137.2) | |
| | | | | | |
| Loss on the Expected Sale of the Kentucky Operations | | — | | | — | | | 363.3 | |
| Loss on the Sale of the Competitive Contracted Renewables Portfolio | | — | | | 92.7 | | | — | |
| Asset Impairments and Other Related Charges | | 142.5 | | | 85.6 | | | 48.8 | |
| | | | | | |
| Impairment of Equity Method Investment | | — | | | 19.0 | | | 188.0 | |
| Allowance for Equity Funds Used During Construction | | (211.0) | | | (174.9) | | | (133.7) | |
| Mark-to-Market of Risk Management Contracts | | (80.4) | | | 8.8 | | | 15.5 | |
| Amortization of Nuclear Fuel | | 102.9 | | | 96.6 | | | 82.9 | |
| | | | | | |
| | | | | | |
| Property Taxes | | (45.4) | | | (41.1) | | | (41.2) | |
| Deferred Fuel Over/Under-Recovery, Net | | 277.0 | | | 892.8 | | | (319.2) | |
| | | | | | |
| | | | | | |
| | | | | | |
| | | | | | |
| Gain on the Sale of Mineral Rights | | — | | | — | | | (116.3) | |
| Establishment of 2017-2019 Virginia Triennial Review Regulatory Asset | | — | | | — | | | (37.0) | |
| Change in Regulatory Assets | | (174.3) | | | (315.8) | | | (46.7) | |
| Change in Other Noncurrent Assets | | (347.6) | | | (465.1) | | | (187.7) | |
| Change in Other Noncurrent Liabilities | | 306.3 | | | 29.0 | | | 337.8 | |
| Changes in Certain Components of Working Capital: | | | | | | |
| Accounts Receivable, Net | | (156.0) | | | 236.5 | | | (681.7) | |
| Fuel, Materials and Supplies | | 171.6 | | | (504.0) | | | (313.9) | |
| Accounts Payable | | 85.1 | | | (253.2) | | | 489.2 | |
| Accrued Taxes, Net | | 240.2 | | | 22.5 | | | 105.4 | |
| | | | | | |
| Other Current Assets | | (13.2) | | | (43.9) | | | 109.0 | |
| Other Current Liabilities | | 182.6 | | | (161.4) | | | 54.3 | |
| Net Cash Flows from Operating Activities | | 6,804.3 | | | 5,012.2 | | | 5,288.0 | |
| | | | | | |
| INVESTING ACTIVITIES | | | | | | |
| Construction Expenditures | | (7,630.7) | | | (7,378.3) | | | (6,671.7) | |
| | | | | | |
| Purchases of Investment Securities | | (2,922.5) | | | (2,863.6) | | | (2,784.2) | |
| Sales of Investment Securities | | 2,878.0 | | | 2,795.1 | | | 2,743.8 | |
| Acquisitions of Nuclear Fuel | | (139.9) | | | (128.2) | | | (100.7) | |
| | | | | | |
| Acquisitions of Renewable Energy Facilities | | (399.5) | | | (155.2) | | | (1,207.3) | |
| | | | | | |
| | | | | | |
| Proceeds from Sales of Assets | | 362.2 | | | 1,341.4 | | | 218.0 | |
| Proceeds from Sale of Equity Method Investment | | 114.0 | | | — | | | — | |
| Other Investing Activities | | 141.9 | | | 122.1 | | | 50.3 | |
| Net Cash Flows Used for Investing Activities | | (7,596.5) | | | (6,266.7) | | | (7,751.8) | |
| | | | | | |
| FINANCING ACTIVITIES | | | | | | |
| Issuance of Common Stock, Net | | 552.1 | | | 999.6 | | | 826.5 | |
| Issuance of Long-term Debt | | 5,117.0 | | | 5,462.8 | | | 4,649.7 | |
| Issuance of Short-term Debt with Original Maturities greater than 90 Days | | 723.8 | | | 1,069.9 | | | 833.9 | |
| Change in Short-term Debt with Original Maturities less than 90 Day, Net | | (159.1) | | | (1,223.1) | | | 1,650.4 | |
| Retirement of Long-term Debt | | (2,685.0) | | | (2,196.1) | | | (2,345.4) | |
| Redemption of Short-term Debt with Original Maturities greater than 90 Days | | (871.1) | | | (1,128.8) | | | (986.1) | |
| | | | | | |
| | | | | | |
| Principal Payments for Finance Lease Obligations | | (64.8) | | | (68.3) | | | (309.5) | |
| Dividends Paid on Common Stock | | (1,903.9) | | | (1,760.4) | | | (1,645.2) | |
| | | | | | |
| Other Financing Activities | | (49.8) | | | (78.6) | | | (105.4) | |
| Net Cash Flows from Financing Activities | | 659.2 | | | 1,077.0 | | | 2,568.9 | |
| | | | | | |
| | | | | | |
| | | | | | |
| | | | | | |
| | | | | | |
| Net Increase (Decrease) in Cash, Cash Equivalents and Restricted Cash | | (133.0) | | | (177.5) | | | 105.1 | |
| Cash, Cash Equivalents and Restricted Cash at Beginning of Period | | 379.0 | | | 556.5 | | | 451.4 | |
| Cash, Cash Equivalents and Restricted Cash at End of Period | | $ | 246.0 | | | $ | 379.0 | | | $ | 556.5 | |
| | | | | | |
See Notes to Financial Statements of Registrants beginning on page 177. |
AEP TEXAS INC. AND SUBSIDIARIES
MANAGEMENT’S NARRATIVE DISCUSSION AND ANALYSIS OF RESULTS OF OPERATIONS
RESULTS OF OPERATIONS
KWh Sales/Degree Days
| | | | | | | | | | | | | | | | | |
| Summary of KWh Energy Sales |
| | | | | |
| Years Ended December 31, |
| 2024 | | 2023 | | 2022 |
| (in millions of KWhs) |
| Retail: | | | | | |
| Residential | 12,654 | | | 12,659 | | | 13,049 | |
| Commercial | 15,852 | | | 13,549 | | | 11,435 | |
| Industrial | 13,247 | | | 12,672 | | | 11,347 | |
| Miscellaneous | 634 | | | 636 | | | 643 | |
| Total Retail | 42,387 | | | 39,516 | | | 36,474 | |
Heating degree days and cooling degree days are metrics commonly used in the utility industry as a measure of the impact of weather on revenues.
| | | | | | | | | | | | | | | | | |
| Summary of Heating and Cooling Degree Days |
| | | | | |
| Years Ended December 31, |
| 2024 | | 2023 | | 2022 |
| (in degree days) |
| Actual – Heating (a) | 196 | | | 197 | | | 450 | |
| Normal – Heating (b) | 316 | | | 318 | | | 312 | |
| | | | | |
| Actual – Cooling (c) | 3,249 | | | 3,208 | | | 2,984 | |
| Normal – Cooling (b) | 2,770 | | | 2,737 | | | 2,714 | |
(a)Heating degree days are calculated on a 55 degree temperature base.
(b)Normal Heating/Cooling represents the thirty-year average of degree days.
(c)Cooling degree days are calculated on a 70 degree temperature base.
AEP Texas Inc. and Subsidiaries
Reconciliation of Year Ended December 31, 2023 to Year Ended December 31, 2024
Net Income
(in millions)
| | | | | | | | |
| Year Ended December 31, 2023 | | $ | 370.4 | |
| | |
| Changes in Revenues: | | |
| Retail Revenues | | 123.7 | |
| | |
| Transmission Revenues | | 54.1 | |
| Other Revenues | | 0.2 | |
| Total Change in Revenues | | 178.0 | |
| | |
| Changes in Expenses and Other: | | |
| Other Operation and Maintenance | | (81.9) | |
| | |
| Depreciation and Amortization | | (25.0) | |
| Taxes Other Than Income Taxes | | (3.2) | |
| Interest Income | | 4.3 | |
| Allowance for Equity Funds Used During Construction | | 17.5 | |
| Non-Service Cost Components of Net Periodic Benefit Cost | | 1.1 | |
| Interest Expense | | (24.9) | |
| Total Change in Expenses and Other | | (112.1) | |
| | |
| Income Tax Expense | | (16.2) | |
| |
| | |
| Year Ended December 31, 2024 | | $ | 420.1 | |
The major components of the increase in Revenues were as follows:
•Retail Revenues increased $124 million primarily due to the following:
•A $96 million increase from rider revenues.
•A $16 million increase in weather-normalized revenues due to increased load across all classes.
•An $11 million increase in revenue from the base rate case.
•Transmission Revenues increased $54 million due to the following:
•A $42 million increase in interim rates driven by increased transmission investments.
•A $12 million increase due to increased load.
Expenses and Other and Income Tax Expense changed between years as follows:
•Other Operation and Maintenance expenses increased $82 million primarily due to the following:
•A $32 million increase in employee-related expenses including a $20 million increase associated with the voluntary severance program that occurred in the second quarter of 2024.
•A $28 million increase due to a prior year decrease in expenses driven by legislation passed in Texas in May 2023 allowing employee financially based incentives to be recovered.
•An $11 million increase in recoverable transmission expenses.
•A $6 million increase in distribution operation expenses.
•Depreciation and Amortization expenses increased $25 million primarily due to a higher depreciable base.
•Allowance for Equity Funds Used During Construction increased $18 million primarily due to a higher AFUDC base.
•Interest Expense increased $25 million primarily due to the following:
•A $31 million increase due to higher debt balances and interest rates.
This increase was partially offset by:
•A $7 million decrease due to a higher AFUDC base.
•Income Tax Expense increased $16 million primarily due to an increase in pretax book income.
REPORT OF INDEPENDENT REGISTERED PUBLIC ACCOUNTING FIRM
To the Board of Directors and Shareholder of
AEP Texas Inc.
Opinion on the Financial Statements
We have audited the accompanying consolidated balance sheets of AEP Texas Inc. and its subsidiaries (the "Company") as of December 31, 2024 and 2023, and the related consolidated statements of income, of comprehensive income (loss), of changes in common shareholder's equity and of cash flows for each of the three years in the period ended December 31, 2024, including the related notes (collectively referred to as the "consolidated financial statements"). In our opinion, the consolidated financial statements present fairly, in all material respects, the financial position of the Company as of December 31, 2024 and 2023, and the results of its operations and its cash flows for each of the three years in the period ended December 31, 2024 in conformity with accounting principles generally accepted in the United States of America.
Basis for Opinion
These consolidated financial statements are the responsibility of the Company’s management. Our responsibility is to express an opinion on the Company’s consolidated financial statements based on our audits. We are a public accounting firm registered with the Public Company Accounting Oversight Board (United States) (PCAOB) and are required to be independent with respect to the Company in accordance with the U.S. federal securities laws and the applicable rules and regulations of the Securities and Exchange Commission and the PCAOB.
We conducted our audits of these consolidated financial statements in accordance with the standards of the PCAOB. Those standards require that we plan and perform the audits to obtain reasonable assurance about whether the consolidated financial statements are free of material misstatement, whether due to error or fraud. The Company is not required to have, nor were we engaged to perform, an audit of its internal control over financial reporting. As part of our audits we are required to obtain an understanding of internal control over financial reporting but not for the purpose of expressing an opinion on the effectiveness of the Company's internal control over financial reporting. Accordingly, we express no such opinion.
Our audits included performing procedures to assess the risks of material misstatement of the consolidated financial statements, whether due to error or fraud, and performing procedures that respond to those risks. Such procedures included examining, on a test basis, evidence regarding the amounts and disclosures in the consolidated financial statements. Our audits also included evaluating the accounting principles used and significant estimates made by management, as well as evaluating the overall presentation of the consolidated financial statements. We believe that our audits provide a reasonable basis for our opinion.
Critical Audit Matters
The critical audit matter communicated below is a matter arising from the current period audit of the consolidated financial statements that was communicated or required to be communicated to the audit committee and that (i) relates to accounts or disclosures that are material to the consolidated financial statements and (ii) involved our especially challenging, subjective, or complex judgments. The communication of critical audit matters does not alter in any way our opinion on the consolidated financial statements, taken as a whole, and we are not, by communicating the critical audit matter below, providing a separate opinion on the critical audit matter or on the accounts or disclosures to which it relates.
Accounting for the Effects of Cost-Based Regulation
As described in Notes 1 and 5 to the consolidated financial statements, the Company's consolidated financial statements reflect the actions of regulators that result in the recognition of certain revenues and expenses in different time periods than enterprises that are not rate-regulated. Regulatory assets (deferred expenses to be recovered in the future) and regulatory liabilities (deferred future revenue reductions or refunds) are recorded to reflect the economic effects of regulation in the same accounting period by matching expenses with their recovery through regulated revenues and matching income with its passage to customers in cost-based regulated rates. As of December 31, 2024, there were $354 million of deferred costs included in regulatory assets, $77 million of which were pending final regulatory approval, and $1,285 million of regulatory liabilities awaiting potential refund or future rate reduction. Management reviews the probability of recovery of regulatory assets and refund of regulatory liabilities at each balance sheet date and whenever new events occur, such as changes in the regulatory environment, issuance of regulatory commission orders, or passage of new legislation.
The principal considerations for our determination that performing procedures relating to the accounting for the effects of cost-based regulation is a critical audit matter are (i) the significant judgment by management in assessing probability of the recovery of regulatory assets and refund of regulatory liabilities and (ii) a high degree of auditor judgment, subjectivity, and effort in performing procedures and evaluating audit evidence related to the probability of recovery of regulatory assets and refund of regulatory liabilities.
Addressing the matter involved performing procedures and evaluating audit evidence in connection with forming our overall opinion on the consolidated financial statements. These procedures included testing the effectiveness of controls relating to management's evaluation of new events, such as changes in the regulatory environment, issuance of regulatory commission orders, or passage of new legislation, including controls over the probability of recovery of regulatory assets and refund of regulatory liabilities. These procedures also included, among others (i) evaluating the reasonableness of management's assessment of probability of future recovery for regulatory assets and refund of regulatory liabilities; (ii) testing, on a sample basis, the regulatory assets and liabilities, including those subject to pending rate cases and regulatory proceedings, by considering (a) the provisions and formulas outlined in rate orders; (b) other regulatory correspondence; and (c) application of relevant regulatory precedents.
/s/ PricewaterhouseCoopers LLP
Columbus, Ohio
February 13, 2025
We have served as the Company's auditor since 2017.
MANAGEMENT’S REPORT ON INTERNAL CONTROL OVER FINANCIAL REPORTING
The management of AEP Texas Inc. and Subsidiaries (AEP Texas) is responsible for establishing and maintaining adequate internal control over financial reporting as such term is defined in Rule 13a-15(f) and 15d-15(f) under the Securities Exchange Act of 1934, as amended. AEP Texas’ internal control is a process designed to provide reasonable assurance regarding the reliability of financial reporting and the preparation of financial statements for external purposes in accordance with generally accepted accounting principles.
Because of its inherent limitations, internal control over financial reporting may not prevent or detect misstatements. Also, projections of any evaluation of effectiveness to future periods are subject to the risk that controls may become inadequate because of changes in conditions, or that the degree of compliance with the policies or procedures may deteriorate.
Management assessed the effectiveness of AEP Texas’ internal control over financial reporting as of December 31, 2024. In making this assessment, management used the criteria set forth by the Committee of Sponsoring Organizations of the Treadway Commission (COSO) in Internal Control – Integrated Framework (2013). Based on management’s assessment, management concluded AEP Texas’ internal control over financial reporting was effective as of December 31, 2024.
This annual report does not include an audit report from PricewaterhouseCoopers LLP, AEP Texas’ registered public accounting firm regarding internal control over financial reporting pursuant to the Securities and Exchange Commission rules that permit AEP Texas to provide only management’s report in this annual report.
AEP TEXAS INC. AND SUBSIDIARIES
CONSOLIDATED STATEMENTS OF INCOME
For the Years Ended December 31, 2024, 2023 and 2022
(in millions)
| | | | | | | | | | | | | | | | | | | | |
| | Years Ended December 31, |
| | | 2024 | | 2023 | | 2022 |
| REVENUES | | | | | | |
| Electric Transmission and Distribution | | $ | 2,070.8 | | | $ | 1,892.0 | | | $ | 1,839.7 | |
| Sales to AEP Affiliates | | 5.4 | | | 4.9 | | | 3.5 | |
| Other Revenues | | 3.7 | | | 5.0 | | | 3.6 | |
| TOTAL REVENUES | | 2,079.9 | | | 1,901.9 | | | 1,846.8 | |
| | | | | | | |
| EXPENSES | | | | | | |
| | | | | | |
| Other Operation | | 625.1 | | | 541.6 | | | 594.2 | |
| Maintenance | | 90.3 | | | 91.9 | | | 93.5 | |
| | | | | | |
| Depreciation and Amortization | | 493.5 | | | 468.5 | | | 452.4 | |
| Taxes Other Than Income Taxes | | 164.0 | | | 160.8 | | | 157.5 | |
| TOTAL EXPENSES | | 1,372.9 | | | 1,262.8 | | | 1,297.6 | |
| | | | | | | |
| OPERATING INCOME | | 707.0 | | | 639.1 | | | 549.2 | |
| | | | | | | |
| Other Income (Expense): | | | | | | |
| Interest Income | | 6.6 | | | 2.3 | | | 3.6 | |
| | | | | | |
| Allowance for Equity Funds Used During Construction | | 45.9 | | | 28.4 | | | 19.7 | |
| | | | | | |
| Non-Service Cost Components of Net Periodic Benefit Cost | | 20.3 | | | 19.2 | | | 16.7 | |
| Interest Expense | | (257.6) | | | (232.7) | | | (208.7) | |
| | | | | | | |
| INCOME BEFORE INCOME TAX EXPENSE | | 522.2 | | | 456.3 | | | 380.5 | |
| | | | | | | |
| Income Tax Expense | | 102.1 | | | 85.9 | | | 72.6 | |
| | | | | | |
| NET INCOME | | $ | 420.1 | | | $ | 370.4 | | | $ | 307.9 | |
| | | | | | |
| The common stock of AEP Texas is wholly-owned by Parent. |
| | | | | | |
See Notes to Financial Statements of Registrants beginning on page 177. |
AEP TEXAS INC. AND SUBSIDIARIES
CONSOLIDATED STATEMENTS OF COMPREHENSIVE INCOME (LOSS)
For the Years Ended December 31, 2024, 2023 and 2022
(in millions)
| | | | | | | | | | | | | | | | | | | | |
| | | Years Ended December 31, |
| | 2024 | | 2023 | | 2022 |
| Net Income | | $ | 420.1 | | | $ | 370.4 | | | $ | 307.9 | |
| | | | | | | |
| OTHER COMPREHENSIVE INCOME (LOSS), NET OF TAXES | | | | | | |
| Cash Flow Hedges, Net of Tax of $1.5, $0.2 and $0.3 in 2024, 2023 and 2022, Respectively | | 5.8 | | | 0.8 | | | 1.0 | |
| Amortization of Pension and OPEB Deferred Costs, Net of Tax of $0, $(0.2) and $0 in 2024, 2023 and 2022, Respectively | | — | | | (0.7) | | | 0.1 | |
| Pension and OPEB Funded Status, Net of Tax of $(0.1), $0 and $(0.9) in 2024, 2023 and 2022, Respectively | | (0.2) | | | (0.1) | | | (3.2) | |
| | | | | | |
| TOTAL OTHER COMPREHENSIVE INCOME (LOSS) | | 5.6 | | | — | | | (2.1) | |
| | | | | | | |
| TOTAL COMPREHENSIVE INCOME | | $ | 425.7 | | | $ | 370.4 | | | $ | 305.8 | |
| | | | | | |
See Notes to Financial Statements of Registrants beginning on page 177. |
AEP TEXAS INC. AND SUBSIDIARIES
CONSOLIDATED STATEMENTS OF CHANGES IN COMMON SHAREHOLDER’S EQUITY
For the Years Ended December 31, 2024, 2023 and 2022
(in millions)
| | | | | | | | | | | | | | | | | | | | | | | | | | |
| | Paid-in
Capital | | Retained
Earnings | | Accumulated
Other
Comprehensive
Income (Loss) | | Total |
| TOTAL COMMON SHAREHOLDER’S EQUITY – DECEMBER 31, 2021 | | $ | 1,553.9 | | | $ | 2,046.8 | | | $ | (6.5) | | | $ | 3,594.2 | |
| | | | | | | | |
| Capital Contribution from Parent | | 4.3 | | | | | | | 4.3 | |
| | | | | | | | |
| | | | | | | | |
| Net Income | | | | 307.9 | | | | | 307.9 | |
| Other Comprehensive Loss | | | | | | (2.1) | | | (2.1) | |
| TOTAL COMMON SHAREHOLDER’S EQUITY – DECEMBER 31, 2022 | | 1,558.2 | | | 2,354.7 | | | (8.6) | | | 3,904.3 | |
| | | | | | | | |
| Capital Contribution from Parent | | 527.0 | | | | | | | 527.0 | |
| Return of Capital to Parent | | (5.6) | | | | | | | (5.6) | |
| | | | | | | | |
| | | | | | | | |
| Net Income | | | | 370.4 | | | | | 370.4 | |
| | | | | | | | |
| TOTAL COMMON SHAREHOLDER’S EQUITY – DECEMBER 31, 2023 | | 2,079.6 | | | 2,725.1 | | | (8.6) | | | 4,796.1 | |
| | | | | | | | |
| Capital Contribution from Parent | | 13.5 | | | | | | | 13.5 | |
| Return of Capital to Parent | | (0.7) | | | | | | | (0.7) | |
| Common Stock Dividends | | | | (350.0) | | | | | (350.0) | |
| Net Income | | | | 420.1 | | | | | 420.1 | |
| Other Comprehensive Income | | | | | | 5.6 | | | 5.6 | |
| TOTAL COMMON SHAREHOLDER’S EQUITY – DECEMBER 31, 2024 | | $ | 2,092.4 | | | $ | 2,795.2 | | | $ | (3.0) | | | $ | 4,884.6 | |
| | | | | | | | |
See Notes to Financial Statements of Registrants beginning on page 177. |
AEP TEXAS INC. AND SUBSIDIARIES
CONSOLIDATED BALANCE SHEETS
ASSETS
December 31, 2024 and 2023
(in millions)
| | | | | | | | | | | | | | |
| | December 31, |
| | | 2024 | | 2023 |
| CURRENT ASSETS | | | | |
| Cash and Cash Equivalents | | $ | 0.1 | | | $ | 0.1 | |
Restricted Cash (December 31, 2024 and 2023 Amounts Include $23.5 and $34, Respectively, Related to Transition Funding and Restoration Funding) | | 23.5 | | | 34.0 | |
| Advances to Affiliates | | 7.2 | | | 7.1 | |
| Accounts Receivable: | | | | |
| Customers | | 182.8 | | | 176.5 | |
| Affiliated Companies | | 10.7 | | | 23.8 | |
| Accrued Unbilled Revenues | | 97.2 | | | 82.3 | |
| Miscellaneous | | 0.3 | | | 0.8 | |
| Allowance for Credit Losses | | (4.3) | | | (4.9) | |
| Total Accounts Receivable | | 286.7 | | | 278.5 | |
| | | | |
| Materials and Supplies | | 169.5 | | | 190.4 | |
| | | | |
| | | | |
| | | | |
| Prepayments and Other Current Assets | | 13.4 | | | 10.0 | |
| TOTAL CURRENT ASSETS | | 500.4 | | | 520.1 | |
| | | | | |
| PROPERTY, PLANT AND EQUIPMENT | | | | |
| Electric: | | | | |
| | | | |
| Transmission | | 7,546.2 | | | 6,812.6 | |
| Distribution | | 6,250.5 | | | 5,798.8 | |
| Other Property, Plant and Equipment | | 1,175.7 | | | 1,145.9 | |
| Construction Work in Progress | | 1,118.0 | | | 904.6 | |
| Total Property, Plant and Equipment | | 16,090.4 | | | 14,661.9 | |
| Accumulated Depreciation and Amortization | | 2,046.9 | | | 1,887.9 | |
| TOTAL PROPERTY, PLANT AND EQUIPMENT – NET | | 14,043.5 | | | 12,774.0 | |
| | | | | |
| OTHER NONCURRENT ASSETS | | | | |
| Regulatory Assets | | 353.6 | | | 315.3 | |
Securitized Assets (December 31, 2024 and 2023 Amounts Include $116.7 and $202.9, Respectively, Related to Transition Funding and Restoration Funding) | | 116.7 | | | 202.9 | |
| | | | |
| Deferred Charges and Other Noncurrent Assets | | 185.4 | | | 178.4 | |
| TOTAL OTHER NONCURRENT ASSETS | | 655.7 | | | 696.6 | |
| | | | |
| TOTAL ASSETS | | $ | 15,199.6 | | | $ | 13,990.7 | |
| | | | |
See Notes to Financial Statements of Registrants beginning on page 177. |
AEP TEXAS INC. AND SUBSIDIARIES
CONSOLIDATED BALANCE SHEETS
LIABILITIES AND COMMON SHAREHOLDER’S EQUITY
December 31, 2024 and 2023
(in millions)
| | | | | | | | | | | | | | |
| | December 31, |
| | | 2024 | | 2023 |
| CURRENT LIABILITIES | | | | |
| Advances from Affiliates | | $ | 284.9 | | | $ | 103.7 | |
| Accounts Payable: | | | | |
| General | | 366.2 | | | 192.3 | |
| Affiliated Companies | | 34.9 | | | 27.7 | |
Long-term Debt Due Within One Year – Nonaffiliated (December 31, 2024 and 2023 Amounts Include $24.4 and $95.9, Respectively, Related to Transition Funding and Restoration Funding) | | 324.5 | | | 96.0 | |
| | | | |
| | | | |
| Accrued Taxes | | 127.1 | | | 99.1 | |
Accrued Interest (December 31, 2024 and 2023 Amounts Include $1.9 and $2, Respectively, Related to Transition Funding and Restoration Funding) | | 55.0 | | | 49.2 | |
| | | | |
| Obligations Under Operating Leases | | 13.1 | | | 28.7 | |
| | | | |
| | | | |
| Other Current Liabilities | | 201.4 | | | 152.7 | |
| TOTAL CURRENT LIABILITIES | | 1,407.1 | | | 749.4 | |
| | | | |
| NONCURRENT LIABILITIES | | | | |
Long-term Debt – Nonaffiliated (December 31, 2024 and 2023 Amounts Include $102.4 and $125.9, Respectively, Related to Transition Funding and Restoration Funding) | | 6,117.1 | | | 5,793.8 | |
| | | | |
| Deferred Income Taxes | | 1,322.7 | | | 1,227.8 | |
| Regulatory Liabilities and Deferred Investment Tax Credits | | 1,285.4 | | | 1,261.4 | |
| | | | |
| Obligations Under Operating Leases | | 43.4 | | | 50.9 | |
| Deferred Credits and Other Noncurrent Liabilities | | 139.3 | | | 111.3 | |
| TOTAL NONCURRENT LIABILITIES | | 8,907.9 | | | 8,445.2 | |
| | | | |
| TOTAL LIABILITIES | | 10,315.0 | | | 9,194.6 | |
| | | | |
| Rate Matters (Note 4) | | | | |
| Commitments and Contingencies (Note 6) | | | | |
| | | | | |
| COMMON SHAREHOLDER’S EQUITY | | | | |
| | | | |
| | | | |
| | | | |
| Paid-in Capital | | 2,092.4 | | | 2,079.6 | |
| Retained Earnings | | 2,795.2 | | | 2,725.1 | |
| Accumulated Other Comprehensive Income (Loss) | | (3.0) | | | (8.6) | |
| TOTAL COMMON SHAREHOLDER’S EQUITY | | 4,884.6 | | | 4,796.1 | |
| | | | | |
| TOTAL LIABILITIES AND COMMON SHAREHOLDER'S EQUITY | | $ | 15,199.6 | | | $ | 13,990.7 | |
| | | | |
See Notes to Financial Statements of Registrants beginning on page 177. |
AEP TEXAS INC. AND SUBSIDIARIES
CONSOLIDATED STATEMENTS OF CASH FLOWS
For the Years Ended December 31, 2024, 2023 and 2022
(in millions)
| | | | | | | | | | | | | | | | | | | | |
| | | Years Ended December 31, |
| | | 2024 | | 2023 | | 2022 |
| OPERATING ACTIVITIES | | | | | | |
| Net Income | | $ | 420.1 | | | $ | 370.4 | | | $ | 307.9 | |
| Adjustments to Reconcile Net Income to Net Cash Flows from Operating Activities: | | | | | | |
| Depreciation and Amortization | | 493.5 | | | 468.5 | | | 452.4 | |
| Deferred Income Taxes | | 77.8 | | | 64.1 | | | 42.2 | |
| | | | | | |
| Allowance for Equity Funds Used During Construction | | (45.9) | | | (28.4) | | | (19.7) | |
| Mark-to-Market of Risk Management Contracts | | — | | | 0.4 | | | (0.4) | |
| | | | | | |
| | | | | | |
| | | | | | |
| Change in Other Noncurrent Assets | | (90.8) | | | (96.5) | | | (36.2) | |
| Change in Other Noncurrent Liabilities | | 39.2 | | | 24.3 | | | 57.6 | |
| Changes in Certain Components of Working Capital: | | | | | | |
| Accounts Receivable, Net | | (8.2) | | | (28.3) | | | (45.0) | |
| Materials and Supplies | | 20.9 | | | (51.6) | | | (64.9) | |
| Accounts Payable | | 24.8 | | | (24.1) | | | 25.0 | |
| | | | | | |
| Accrued Taxes, Net | | 30.1 | | | 11.8 | | | 14.8 | |
| | | | | | |
| Other Current Assets | | (5.6) | | | 3.0 | | | 2.2 | |
| Other Current Liabilities | | 8.2 | | | (53.9) | | | (4.0) | |
| Net Cash Flows from Operating Activities | | 964.1 | | | 659.7 | | | 731.9 | |
| | | | | | |
| INVESTING ACTIVITIES | | | | | | |
| Construction Expenditures | | (1,413.6) | | | (1,477.1) | | | (1,305.0) | |
| Change in Advances to Affiliates, Net | | (0.1) | | | (0.2) | | | — | |
| | | | | | |
| Other Investing Activities | | 54.3 | | | 69.3 | | | 35.1 | |
| Net Cash Flows Used for Investing Activities | | (1,359.4) | | | (1,408.0) | | | (1,269.9) | |
| | | | | | |
| FINANCING ACTIVITIES | | | | | | |
| Capital Contribution from Parent | | 13.5 | | | 527.0 | | | 4.3 | |
| Return of Capital to Parent | | (0.7) | | | (5.6) | | | — | |
| Issuance of Long-term Debt – Nonaffiliated | | 841.9 | | | 505.4 | | | 1,188.6 | |
| Change in Advances from Affiliates, Net | | 181.2 | | | 7.2 | | | 69.6 | |
| Retirement of Long-term Debt – Nonaffiliated | | (296.0) | | | (278.5) | | | (716.0) | |
| Principal Payments for Finance Lease Obligations | | (7.5) | | | (7.4) | | | (6.8) | |
| Dividends Paid on Common Stock | | (350.0) | | | — | | | — | |
| Other Financing Activities | | 2.4 | | | 1.5 | | | 0.6 | |
| Net Cash Flows from Financing Activities | | 384.8 | | | 749.6 | | | 540.3 | |
| | | | | | |
| Net Increase (Decrease) in Cash, Cash Equivalents and Restricted Cash | | (10.5) | | | 1.3 | | | 2.3 | |
| Cash, Cash Equivalents and Restricted Cash at Beginning of Period | | 34.1 | | | 32.8 | | | 30.5 | |
| Cash, Cash Equivalents and Restricted Cash at End of Period | | $ | 23.6 | | | $ | 34.1 | | | $ | 32.8 | |
| | | | | | |
| SUPPLEMENTARY INFORMATION | | | | | | |
| Cash Paid for Interest, Net of Capitalized Amounts | | $ | 240.7 | | | $ | 225.6 | | | $ | 198.9 | |
| Net Cash Paid for Income Taxes | | 10.9 | | | 11.5 | | | 11.0 | |
| Noncash Acquisitions Under Finance Leases | | 4.6 | | | 4.8 | | | 6.1 | |
| Construction Expenditures Included in Current Liabilities as of December 31, | | 266.0 | | | 112.2 | | | 235.4 | |
| | | | | | |
See Notes to Financial Statements of Registrants beginning on page 177. |
AEP TRANSMISSION COMPANY, LLC AND SUBSIDIARIES
MANAGEMENT’S NARRATIVE DISCUSSION AND ANALYSIS OF RESULTS OF OPERATIONS
RESULTS OF OPERATIONS
Summary of Investment in Transmission Assets for AEPTCo
| | | | | | | | | | | | | | |
| | As of December 31, |
| | 2024 | | 2023 |
| | (in millions) |
| Plant In Service | | $ | 15,429.5 | | | $ | 14,225.3 | |
| CWIP | | 1,965.4 | | | 1,563.7 | |
| Accumulated Depreciation | | 1,578.4 | | | 1,291.3 | |
| Total Transmission Property, Net | | $ | 15,816.5 | | | $ | 14,497.7 | |
AEP Transmission Company, LLC and Subsidiaries
Reconciliation of Year Ended December 31, 2023 to Year Ended December 31, 2024
Net Income
(in millions)
| | | | | | | | |
| Year Ended December 31, 2023 | | $ | 614.2 | |
| | |
| Changes in Transmission Revenues: | | |
| Transmission Revenues | | 218.9 | |
| Total Change in Transmission Revenues | | 218.9 | |
| | |
| Changes in Expenses and Other: | | |
| Other Operation and Maintenance | | (28.9) | |
| Depreciation and Amortization | | (37.1) | |
| Taxes Other Than Income Taxes | | (25.5) | |
| Interest Income - Affiliated | | 3.5 | |
| Allowance for Equity Funds Used During Construction | | 6.2 | |
| Interest Expense | | (19.7) | |
| Total Change in Expenses and Other | | (101.5) | |
| | |
| Income Tax Expense | | (43.2) | |
| | |
| | |
| Year Ended December 31, 2024 | | $ | 688.4 | |
The major components of the increase in Transmission Revenues, which consists of wholesale sales to affiliates and nonaffiliates were as follows:
•Transmission Revenues increased $219 million primarily due to continued investment in transmission assets.
Expenses and Other and Income Tax Expense changed between years as follows:
•Other Operation and Maintenance expenses increased $29 million primarily due to a $26 million increase in employee-related expenses driven by an $11 million increase associated with the voluntary severance program that occurred in the second quarter of 2024.
•Depreciation and Amortization expenses increased $37 million primarily due to a higher depreciable base.
•Taxes Other Than Income Taxes increased $26 million primarily due to higher property taxes driven by increased transmission investment.
•Allowance for Equity Funds Used During Construction increased $6 million primarily due to a higher AFUDC base.
•Interest Expense increased $20 million primarily due to higher long-term debt balances and interest rates.
•Income Tax Expense increased $43 million primarily due to the following:
•A $25 million increase due to an increase in pretax book income.
•A $20 million increase in state taxes primarily driven by favorable deferred state tax remeasurements in 2023.
REPORT OF INDEPENDENT REGISTERED PUBLIC ACCOUNTING FIRM
To the Board of Directors and Member of
AEP Transmission Company, LLC
Opinion on the Financial Statements
We have audited the accompanying consolidated balance sheets of AEP Transmission Company, LLC and its subsidiaries (the "Company") as of December 31, 2024 and 2023, and the related consolidated statements of income, of changes in member's equity and of cash flows for each of the three years in the period ended December 31, 2024, including the related notes and financial statement schedule listed in the index appearing under Item 15(a)(2) (collectively referred to as the "consolidated financial statements"). In our opinion, the consolidated financial statements present fairly, in all material respects, the financial position of the Company as of December 31, 2024 and 2023, and the results of its operations and its cash flows for each of the three years in the period ended December 31, 2024 in conformity with accounting principles generally accepted in the United States of America.
Basis for Opinion
These consolidated financial statements are the responsibility of the Company’s management. Our responsibility is to express an opinion on the Company’s consolidated financial statements based on our audits. We are a public accounting firm registered with the Public Company Accounting Oversight Board (United States) (PCAOB) and are required to be independent with respect to the Company in accordance with the U.S. federal securities laws and the applicable rules and regulations of the Securities and Exchange Commission and the PCAOB.
We conducted our audits of these consolidated financial statements in accordance with the standards of the PCAOB. Those standards require that we plan and perform the audits to obtain reasonable assurance about whether the consolidated financial statements are free of material misstatement, whether due to error or fraud. The Company is not required to have, nor were we engaged to perform, an audit of its internal control over financial reporting. As part of our audits we are required to obtain an understanding of internal control over financial reporting but not for the purpose of expressing an opinion on the effectiveness of the Company's internal control over financial reporting. Accordingly, we express no such opinion.
Our audits included performing procedures to assess the risks of material misstatement of the consolidated financial statements, whether due to error or fraud, and performing procedures that respond to those risks. Such procedures included examining, on a test basis, evidence regarding the amounts and disclosures in the consolidated financial statements. Our audits also included evaluating the accounting principles used and significant estimates made by management, as well as evaluating the overall presentation of the consolidated financial statements. We believe that our audits provide a reasonable basis for our opinion.
Critical Audit Matters
The critical audit matter communicated below is a matter arising from the current period audit of the consolidated financial statements that was communicated or required to be communicated to the audit committee and that (i) relates to accounts or disclosures that are material to the consolidated financial statements and (ii) involved our especially challenging, subjective, or complex judgments. The communication of critical audit matters does not alter in any way our opinion on the consolidated financial statements, taken as a whole, and we are not, by communicating the critical audit matter below, providing a separate opinion on the critical audit matter or on the accounts or disclosures to which it relates.
Accounting for the Effects of Cost-Based Regulation
As described in Notes 1 and 5 to the consolidated financial statements, the Company's consolidated financial statements reflect the actions of regulators that result in the recognition of certain revenues and expenses in different time periods than enterprises that are not rate-regulated. Regulatory assets (deferred expenses to be recovered in the future) and regulatory liabilities (deferred future revenue reductions or refunds) are recorded to reflect the economic effects of regulation in the same accounting period by matching expenses with their recovery through regulated revenues and matching income with its passage to customers in cost-based regulated rates. As of December 31, 2024, there were $878 million of regulatory liabilities awaiting potential refund or future rate reduction, $9 million of which were pending final regulatory determination. Management reviews the probability of recovery of regulatory assets and refund of regulatory liabilities at each balance sheet date and whenever new events occur, such as changes in the regulatory environment, issuance of regulatory commission orders, or passage of new legislation.
The principal considerations for our determination that performing procedures relating to the accounting for the effects of cost-based regulation is a critical audit matter are (i) the significant judgment by management in assessing probability of the recovery of regulatory assets and refund of regulatory liabilities and (ii) a high degree of auditor judgment, subjectivity, and effort in performing procedures and evaluating audit evidence related to the probability of recovery of regulatory assets and refund of regulatory liabilities.
Addressing the matter involved performing procedures and evaluating audit evidence in connection with forming our overall opinion on the consolidated financial statements. These procedures included testing the effectiveness of controls relating to management's evaluation of new events, such as changes in the regulatory environment, issuance of regulatory commission orders, or passage of new legislation, including controls over the probability of recovery of regulatory assets and refund of regulatory liabilities. These procedures also included, among others (i) evaluating the reasonableness of management's assessment of probability of future recovery for regulatory assets and refund of regulatory liabilities; (ii) testing, on a sample basis, the regulatory assets and liabilities, including those subject to pending rate cases and regulatory proceedings, by considering (a) the provisions and formulas outlined in rate orders; (b) other regulatory correspondence; and (c) application of relevant regulatory precedents.
/s/ PricewaterhouseCoopers LLP
Columbus, Ohio
February 13, 2025
We have served as the Company’s auditor since 2017.
MANAGEMENT’S REPORT ON INTERNAL CONTROL OVER FINANCIAL REPORTING
The management of AEP Transmission Company, LLC and Subsidiaries (AEPTCo) is responsible for establishing and maintaining adequate internal control over financial reporting as such term is defined in Rule 13a-15(f) and 15d-15(f) under the Securities Exchange Act of 1934, as amended. AEPTCo’s internal control is a process designed to provide reasonable assurance regarding the reliability of financial reporting and the preparation of financial statements for external purposes in accordance with generally accepted accounting principles.
Because of its inherent limitations, internal control over financial reporting may not prevent or detect misstatements. Also, projections of any evaluation of effectiveness to future periods are subject to the risk that controls may become inadequate because of changes in conditions, or that the degree of compliance with the policies or procedures may deteriorate.
Management assessed the effectiveness of AEPTCo’s internal control over financial reporting as of December 31, 2024. In making this assessment, management used the criteria set forth by the Committee of Sponsoring Organizations of the Treadway Commission (COSO) in Internal Control – Integrated Framework (2013). Based on management’s assessment, management concluded AEPTCo’s internal control over financial reporting was effective as of December 31, 2024.
This annual report does not include an audit report from PricewaterhouseCoopers LLP, AEPTCo’s registered public accounting firm regarding internal control over financial reporting pursuant to the Securities and Exchange Commission rules that permit AEPTCo to provide only management’s report in this annual report.
AEP TRANSMISSION COMPANY, LLC AND SUBSIDIARIES
CONSOLIDATED STATEMENTS OF INCOME
For the Years Ended December 31, 2024, 2023 and 2022
(in millions)
| | | | | | | | | | | | | | | | | | | | |
| | Years Ended December 31, |
| | 2024 | | 2023 | | 2022 |
| REVENUES | | | | | | |
| Transmission Revenues | | $ | 400.9 | | | $ | 363.3 | | | $ | 354.9 | |
| Sales to AEP Affiliates | | 1,582.3 | | | 1,463.4 | | | 1,354.5 | |
| Provision for Refund – Affiliated | | (70.0) | | | (145.6) | | | (70.7) | |
| Provision for Refund – Nonaffiliated | | (22.3) | | | (9.1) | | | (14.2) | |
| | | | | | |
| TOTAL REVENUES | | 1,890.9 | | | 1,672.0 | | | 1,624.5 | |
| | | | | | |
| EXPENSES | | | | | | |
| Other Operation | | 137.4 | | | 109.0 | | | 136.3 | |
| Maintenance | | 20.9 | | | 20.4 | | | 17.2 | |
| Depreciation and Amortization | | 430.9 | | | 393.8 | | | 346.2 | |
| | | | | | |
| Taxes Other Than Income Taxes | | 308.7 | | | 283.2 | | | 271.1 | |
| TOTAL EXPENSES | | 897.9 | | | 806.4 | | | 770.8 | |
| | | | | | |
| OPERATING INCOME | | 993.0 | | | 865.6 | | | 853.7 | |
| | | | | | |
| Other Income (Expense): | | | | | | |
| Interest Income - Affiliated | | 10.5 | | | 7.0 | | | 1.6 | |
| Allowance for Equity Funds Used During Construction | | 89.4 | | | 83.2 | | | 70.7 | |
| Interest Expense | | (214.2) | | | (194.5) | | | (162.7) | |
| | | | | | |
| INCOME BEFORE INCOME TAX EXPENSE | | 878.7 | | | 761.3 | | | 763.3 | |
| | | | | | |
| Income Tax Expense | | 190.3 | | | 147.1 | | | 169.1 | |
| | | | | | |
| NET INCOME | | $ | 688.4 | | | $ | 614.2 | | | $ | 594.2 | |
| | | | | | |
| AEPTCo is wholly-owned by AEP Transmission Holdco. | | | | | | |
| | | | | | |
See Notes to Financial Statements of Registrants beginning on page 177. |
AEP TRANSMISSION COMPANY, LLC AND SUBSIDIARIES
CONSOLIDATED STATEMENTS OF CHANGES IN MEMBER’S EQUITY
For the Years Ended December 31, 2024, 2023 and 2022
(in millions)
| | | | | | | | | | | | | | | | | | | | |
| | Paid-in
Capital | | Retained
Earnings | | Total Member’s Equity |
| TOTAL MEMBER'S EQUITY - DECEMBER 31, 2021 | | $ | 2,949.6 | | | $ | 2,426.5 | | | $ | 5,376.1 | |
| | | | | | |
| Capital Contribution from Member | | 72.7 | | | | | 72.7 | |
| | | | | | |
| Dividends Paid to Member | | | | (170.0) | | | (170.0) | |
| Net Income | | | | 594.2 | | | 594.2 | |
| TOTAL MEMBER'S EQUITY - DECEMBER 31, 2022 | | 3,022.3 | | | 2,850.7 | | | 5,873.0 | |
| | | | | | |
| Capital Contribution from Member | | 29.7 | | | | | 29.7 | |
| Return of Capital to Member | | (8.6) | | | | | (8.6) | |
| Dividends Paid to Member | | | | (175.0) | | | (175.0) | |
| Net Income | | | | 614.2 | | | 614.2 | |
| TOTAL MEMBER'S EQUITY - DECEMBER 31, 2023 | | 3,043.4 | | | 3,289.9 | | | 6,333.3 | |
| | | | | | |
| Capital Contribution from Member | | 61.7 | | | | | 61.7 | |
| Return of Capital to Member | | (4.5) | | | | | (4.5) | |
| Dividends Paid to Member | | | | (128.0) | | | (128.0) | |
| Net Income | | | | 688.4 | | | 688.4 | |
| TOTAL MEMBER'S EQUITY - DECEMBER 31, 2024 | | $ | 3,100.6 | | | $ | 3,850.3 | | | $ | 6,950.9 | |
| | | | | | |
See Notes to Financial Statements of Registrants beginning on page 177. |
AEP TRANSMISSION COMPANY, LLC AND SUBSIDIARIES
CONSOLIDATED BALANCE SHEETS
ASSETS
December 31, 2024 and 2023
(in millions)
| | | | | | | | | | | | | | |
| | December 31, |
| | 2024 | | 2023 |
| CURRENT ASSETS | | | | |
| Advances to Affiliates | | $ | 30.4 | | | $ | 67.1 | |
| Accounts Receivable: | | | | |
| Customers | | 58.9 | | | 82.2 | |
| Affiliated Companies | | 134.1 | | | 125.5 | |
| Miscellaneous | | 1.3 | | | — | |
| Total Accounts Receivable | | 194.3 | | | 207.7 | |
| | | | |
| | | | |
| | | | |
| Prepayments and Other Current Assets | | 11.1 | | | 4.0 | |
| TOTAL CURRENT ASSETS | | 235.8 | | | 278.8 | |
| | | | |
| TRANSMISSION PROPERTY | | | | |
| Transmission Property | | 14,913.4 | | | 13,723.9 | |
| Other Property, Plant and Equipment | | 516.1 | | | 501.4 | |
| Construction Work in Progress | | 1,965.4 | | | 1,563.7 | |
| Total Transmission Property | | 17,394.9 | | | 15,789.0 | |
| Accumulated Depreciation and Amortization | | 1,578.4 | | | 1,291.3 | |
TOTAL TRANSMISSION PROPERTY – NET | | 15,816.5 | | | 14,497.7 | |
| | | | |
| OTHER NONCURRENT ASSETS | | | | |
| | | | |
| Regulatory Assets | | 0.4 | | | 3.1 | |
| Deferred Property Taxes | | 308.9 | | | 286.4 | |
| Deferred Charges and Other Noncurrent Assets | | 8.7 | | | 6.5 | |
| TOTAL OTHER NONCURRENT ASSETS | | 318.0 | | | 296.0 | |
| | | | |
| TOTAL ASSETS | | $ | 16,370.3 | | | $ | 15,072.5 | |
| | | | |
See Notes to Financial Statements of Registrants beginning on page 177. |
AEP TRANSMISSION COMPANY, LLC AND SUBSIDIARIES
CONSOLIDATED BALANCE SHEETS
LIABILITIES AND MEMBER’S EQUITY
December 31, 2024 and 2023
| | | | | | | | | | | | | | |
| | December 31, |
| | 2024 | | 2023 |
| | (in millions) |
| CURRENT LIABILITIES | | | | |
| Advances from Affiliates | | $ | 84.7 | | | $ | 174.3 | |
| Accounts Payable: | | | | |
| General | | 360.5 | | | 274.7 | |
| Affiliated Companies | | 117.0 | | | 107.9 | |
| Long-term Debt Due Within One Year – Nonaffiliated | | 90.0 | | | 95.0 | |
| Accrued Taxes | | 665.9 | | | 568.6 | |
| Accrued Interest | | 44.9 | | | 39.6 | |
| Obligations Under Operating Leases | | 1.3 | | | 1.3 | |
| | | | |
| Other Current Liabilities | | 44.5 | | | 24.7 | |
| TOTAL CURRENT LIABILITIES | | 1,408.8 | | | 1,286.1 | |
| | | | |
| NONCURRENT LIABILITIES | | | | |
| Long-term Debt – Nonaffiliated | | 5,678.1 | | | 5,319.4 | |
| Deferred Income Taxes | | 1,278.6 | | | 1,147.7 | |
| Regulatory Liabilities | | 878.4 | | | 783.7 | |
| Obligations Under Operating Leases | | 1.2 | | | 1.4 | |
| Deferred Credits and Other Noncurrent Liabilities | | 174.3 | | | 200.9 | |
| TOTAL NONCURRENT LIABILITIES | | 8,010.6 | | | 7,453.1 | |
| | | | |
| TOTAL LIABILITIES | | 9,419.4 | | | 8,739.2 | |
| | | | |
| Rate Matters (Note 4) | | | | |
| Commitments and Contingencies (Note 6) | | | | |
| | | | |
| MEMBER’S EQUITY | | | | |
| Paid-in Capital | | 3,100.6 | | | 3,043.4 | |
| Retained Earnings | | 3,850.3 | | | 3,289.9 | |
| TOTAL MEMBER’S EQUITY | | 6,950.9 | | | 6,333.3 | |
| | | | |
| TOTAL LIABILITIES AND MEMBER’S EQUITY | | $ | 16,370.3 | | | $ | 15,072.5 | |
| | | | |
See Notes to Financial Statements of Registrants beginning on page 177. |
AEP TRANSMISSION COMPANY, LLC AND SUBSIDIARIES
CONSOLIDATED STATEMENTS OF CASH FLOWS
For the Years Ended December 31, 2024, 2023 and 2022
(in millions)
| | | | | | | | | | | | | | | | | | | | |
| | Years Ended December 31, |
| | 2024 | | 2023 | | 2022 |
| OPERATING ACTIVITIES | | | | | | |
| Net Income | | $ | 688.4 | | | $ | 614.2 | | | $ | 594.2 | |
| Adjustments to Reconcile Net Income to Net Cash Flows from Operating Activities: | | | | | | |
| Depreciation and Amortization | | 430.9 | | | 393.8 | | | 346.2 | |
| Deferred Income Taxes | | 109.6 | | | 44.1 | | | 62.3 | |
| Allowance for Equity Funds Used During Construction | | (89.4) | | | (83.2) | | | (70.7) | |
| Property Taxes | | (22.5) | | | (19.8) | | | (20.9) | |
| | | | | | |
| Change in Other Noncurrent Assets | | (0.6) | | | 8.6 | | | (7.4) | |
| Change in Other Noncurrent Liabilities | | (17.0) | | | 134.2 | | | 68.7 | |
| Changes in Certain Components of Working Capital: | | | | | | |
| Accounts Receivable, Net | | 13.4 | | | (41.3) | | | (46.3) | |
| Materials and Supplies | | — | | | 10.7 | | | (1.4) | |
| Accounts Payable | | 9.5 | | | 22.8 | | | 18.5 | |
| Accrued Taxes, Net | | 97.3 | | | 42.9 | | | 50.2 | |
| Accrued Interest | | 5.3 | | | 10.8 | | | — | |
| Other Current Assets | | (0.4) | | | (0.1) | | | (1.1) | |
| Other Current Liabilities | | 13.3 | | | (0.1) | | | 3.0 | |
| Net Cash Flows from Operating Activities | | 1,237.8 | | | 1,137.6 | | | 995.3 | |
| | | | | | |
| INVESTING ACTIVITIES | | | | | | |
| Construction Expenditures | | (1,477.3) | | | (1,496.2) | | | (1,458.5) | |
| Change in Advances to Affiliates, Net | | 36.7 | | | (62.7) | | | 22.8 | |
| Acquisitions of Assets | | (4.5) | | | (6.9) | | | (9.8) | |
| | | | | | |
| Other Investing Activities | | 17.0 | | | 8.1 | | | 6.3 | |
| Net Cash Flows Used for Investing Activities | | (1,428.1) | | | (1,557.7) | | | (1,439.2) | |
| | | | | | |
| FINANCING ACTIVITIES | | | | | | |
| Capital Contribution from Member | | 61.7 | | | 29.7 | | | 72.7 | |
| Return of Capital to Member | | (4.5) | | | (8.6) | | | — | |
| Issuance of Long-term Debt – Nonaffiliated | | 445.7 | | | 689.0 | | | 540.8 | |
| Change in Advances from Affiliates, Net | | (89.6) | | | (55.0) | | | 104.4 | |
| Retirement of Long-term Debt – Nonaffiliated | | (95.0) | | | (60.0) | | | (104.0) | |
| Dividends Paid to Member | | (128.0) | | | (175.0) | | | (170.0) | |
| | | | | | |
| Net Cash Flows from Financing Activities | | 190.3 | | | 420.1 | | | 443.9 | |
| | | | | | |
| Net Change in Cash and Cash Equivalents | | — | | | — | | | — | |
| Cash and Cash Equivalents at Beginning of Period | | — | | | — | | | — | |
| Cash and Cash Equivalents at End of Period | | $ | — | | | $ | — | | | $ | — | |
| | | | | | |
| SUPPLEMENTARY INFORMATION | | | | | | |
| Cash Paid for Interest, Net of Capitalized Amounts | | $ | 204.0 | | | $ | 179.9 | | | $ | 158.8 | |
| Net Cash Paid for Income Taxes | | 42.6 | | | 87.6 | | | 95.5 | |
| | | | | | |
| Construction Expenditures Included in Current Liabilities as of December 31, | | 262.7 | | | 177.6 | | | 320.7 | |
| | | | | | |
| | | | | | |
See Notes to Financial Statements of Registrants beginning on page 177. |
APPALACHIAN POWER COMPANY AND SUBSIDIARIES
MANAGEMENT’S NARRATIVE DISCUSSION AND ANALYSIS OF RESULTS OF OPERATIONS
RESULTS OF OPERATIONS
KWh Sales/Degree Days
| | | | | | | | | | | | | | | | | |
| Summary of KWh Energy Sales |
| | | | | |
| Years Ended December 31, |
| 2024 | | 2023 | | 2022 |
| (in millions of KWhs) |
| Retail: | | | | | |
| Residential | 10,483 | | | 10,126 | | | 11,159 | |
| Commercial | 5,948 | | | 5,728 | | | 6,066 | |
| Industrial | 8,666 | | | 8,710 | | | 8,849 | |
| Miscellaneous | 829 | | | 804 | | | 843 | |
| Total Retail | 25,926 | | | 25,368 | | | 26,917 | |
| | | | | |
| Wholesale (a) | 2,243 | | | 2,191 | | | 1,585 | |
| | | | | |
| Total KWhs | 28,169 | | | 27,559 | | | 28,502 | |
(a)Includes Off-system Sales, municipalities and cooperatives, unit power and other wholesale customers.
Heating degree days and cooling degree days are metrics commonly used in the utility industry as a measure of the impact of weather on revenues.
| | | | | | | | | | | | | | | | | |
| Summary of Heating and Cooling Degree Days |
| | | | | |
| Years Ended December 31, |
| 2024 | | 2023 | | 2022 |
| (in degree days) |
| Actual – Heating (a) | 1,713 | | | 1,537 | | | 2,182 | |
| Normal – Heating (b) | 2,181 | | | 2,208 | | | 2,209 | |
| | | | | |
| Actual – Cooling (c) | 1,544 | | | 1,145 | | | 1,314 | |
| Normal – Cooling (b) | 1,250 | | | 1,251 | | | 1,238 | |
(a)Heating degree days are calculated on a 55 degree temperature base.
(b)Normal Heating/Cooling represents the thirty-year average of degree days.
(c)Cooling degree days are calculated on a 65 degree temperature base.
Appalachian Power Company and Subsidiaries
Reconciliation of Year Ended December 31, 2023 to Year Ended December 31, 2024
Net Income
(in millions)
| | | | | | | | |
| Year Ended December 31, 2023 | | $ | 294.4 | |
| | |
| Changes in Revenues: | | |
| Retail Revenues | | 282.1 | |
| Off-system Sales | | (0.9) | |
| Transmission Revenues | | 17.4 | |
| Other Revenues | | 13.3 | |
| Total Change in Revenues | | 311.9 | |
| | |
| Changes in Expenses and Other: | | |
| Purchased Electricity, Fuel and Other Consumables Used for Electric Generation | | 29.0 | |
| Other Operation and Maintenance | | (107.2) | |
| | |
| | |
| | |
| Depreciation and Amortization | | (30.5) | |
| Taxes Other Than Income Taxes | | (14.4) | |
| Interest Income | | 2.3 | |
| | |
| Allowance for Equity Funds Used During Construction | | 4.2 | |
| Non-Service Cost Components of Net Periodic Benefit Cost | | (5.3) | |
| Interest Expense | | (1.8) | |
| Total Change in Expenses and Other | | (123.7) | |
| | |
| Income Tax Expense | | (60.9) | |
| | |
| Year Ended December 31, 2024 | | $ | 421.7 | |
The major components of the increase in Revenues were as follows:
•Retail Revenues increased $282 million primarily due to the following:
•A $114 million increase in rates due to the 2020-2022 Virginia Triennial Review.
•A $62 million increase in fuel revenues primarily due to an increase in ENEC revenues in West Virginia.
•A $58 million increase in rider revenues.
•A $51 million increase in weather-related usage driven by a 35% increase in cooling degree days and an 11% increase in heating degree days.
•Transmission Revenues increased $17 million primarily due to continued investment in transmission assets.
•Other Revenues increased $13 million primarily due to the following:
•An $8 million increase in pole attachment revenue.
•A $6 million increase in sales of renewable energy credits.
Expenses and Other and Income Tax Expense changed between years as follows:
•Purchased Electricity, Fuel and Other Consumables Used for Electric Generation expenses decreased $29 million primarily due to prior year disallowance of under-recovered ENEC regulatory assets in West Virginia partially offset by an increase in over-recovered fuel deferrals in West Virginia primarily driven by an increase in ENEC rates and the amortization of Excess ADIT through the ENEC.
•Other Operation and Maintenance expenses increased $107 million primarily due to the following:
•A $55 million increase in transmission expenses primarily due to an increase in recoverable PJM expenses.
•A $43 million increase in distribution expenses primarily due to the following:
•An $18 million increase in vegetation management expenses approved by the Virginia SCC and recovered through base rates.
•A $14 million increase in other distribution and vegetation management expenses.
•An $11 million increase due to the amortization of 2020-2022 storm-related regulatory assets which began in 2024.
•A $26 million increase in employee-related expenses due to the voluntary severance program that occurred in the second quarter of 2024.
•A $13 million increase due to prior year proceeds received for insurance policy settlements.
These increases were partially offset by:
•A $25 million decrease due to the January 2024 completion of regulatory asset amortization related to under-earnings during the 2017-2019 Triennial Review.
•Depreciation and Amortization expenses increased $31 million primarily due to a higher depreciable base.
•Taxes Other Than Income Taxes increased $14 million due to an increase in Virginia state minimum taxes.
•Non-Service Cost Components of Net Periodic Benefit Cost increased $5 million primarily due to the expiration of prior service credit amortization from previous plan changes partially offset by a lower loss amortization as the result of favorable asset returns during 2023.
•Income Tax Expense increased $61 million primarily due to the following:
•A $40 million increase due to an increase in pretax book income.
•A $34 million increase due to a decrease in amortization of Excess ADIT.
REPORT OF INDEPENDENT REGISTERED PUBLIC ACCOUNTING FIRM
To the Board of Directors and Shareholder of
Appalachian Power Company
Opinion on the Financial Statements
We have audited the accompanying consolidated balance sheets of Appalachian Power Company and its subsidiaries (the "Company") as of December 31, 2024 and 2023, and the related consolidated statements of income, of comprehensive income (loss), of changes in common shareholder's equity and of cash flows for each of the three years in the period ended December 31, 2024, including the related notes (collectively referred to as the "consolidated financial statements"). In our opinion, the consolidated financial statements present fairly, in all material respects, the financial position of the Company as of December 31, 2024 and 2023, and the results of its operations and its cash flows for each of the three years in the period ended December 31, 2024 in conformity with accounting principles generally accepted in the United States of America.
Basis for Opinion
These consolidated financial statements are the responsibility of the Company’s management. Our responsibility is to express an opinion on the Company’s consolidated financial statements based on our audits. We are a public accounting firm registered with the Public Company Accounting Oversight Board (United States) (PCAOB) and are required to be independent with respect to the Company in accordance with the U.S. federal securities laws and the applicable rules and regulations of the Securities and Exchange Commission and the PCAOB.
We conducted our audits of these consolidated financial statements in accordance with the standards of the PCAOB. Those standards require that we plan and perform the audits to obtain reasonable assurance about whether the consolidated financial statements are free of material misstatement, whether due to error or fraud. The Company is not required to have, nor were we engaged to perform, an audit of its internal control over financial reporting. As part of our audits we are required to obtain an understanding of internal control over financial reporting but not for the purpose of expressing an opinion on the effectiveness of the Company's internal control over financial reporting. Accordingly, we express no such opinion.
Our audits included performing procedures to assess the risks of material misstatement of the consolidated financial statements, whether due to error or fraud, and performing procedures that respond to those risks. Such procedures included examining, on a test basis, evidence regarding the amounts and disclosures in the consolidated financial statements. Our audits also included evaluating the accounting principles used and significant estimates made by management, as well as evaluating the overall presentation of the consolidated financial statements. We believe that our audits provide a reasonable basis for our opinion.
Critical Audit Matters
The critical audit matters communicated below are matters arising from the current period audit of the consolidated financial statements that were communicated or required to be communicated to the audit committee and that (i) relate to accounts or disclosures that are material to the consolidated financial statements and (ii) involved our especially challenging, subjective, or complex judgments. The communication of critical audit matters does not alter in any way our opinion on the consolidated financial statements, taken as a whole, and we are not, by communicating the critical audit matters below, providing separate opinions on the critical audit matters or on the accounts or disclosures to which they relate.
Accounting for the Effects of Cost-Based Regulation
As described in Notes 1 and 5 to the consolidated financial statements, the Company's consolidated financial statements reflect the actions of regulators that result in the recognition of certain revenues and expenses in different time periods than enterprises that are not rate-regulated. Regulatory assets (deferred expenses to be recovered in the future) and regulatory liabilities (deferred future revenue reductions or refunds) are recorded to reflect the economic effects of regulation in the same accounting period by matching expenses with their recovery through regulated revenues and matching income with its passage to customers in cost-based regulated rates. As of December 31, 2024, there were $1,514 million of deferred costs included in regulatory assets, $536 million of which were pending final regulatory approval, and $1,137 million of regulatory liabilities awaiting potential refund or future rate reduction, $19 million of which were pending final regulatory determination. Management reviews the probability of recovery of regulatory assets and refund of regulatory liabilities at each balance sheet date and whenever new events occur, such as changes in the regulatory environment, issuance of regulatory commission orders, or passage of new legislation.
The principal considerations for our determination that performing procedures relating to the accounting for the effects of cost-based regulation is a critical audit matter are (i) the significant judgment by management in assessing probability of the recovery of regulatory assets and refund of regulatory liabilities and (ii) a high degree of auditor judgment, subjectivity, and
effort in performing procedures and evaluating audit evidence related to the probability of recovery of regulatory assets and refund of regulatory liabilities.
Addressing the matter involved performing procedures and evaluating audit evidence in connection with forming our overall opinion on the consolidated financial statements. These procedures included testing the effectiveness of controls relating to management's evaluation of new events, such as changes in the regulatory environment, issuance of regulatory commission orders, or passage of new legislation, including controls over the probability of recovery of regulatory assets and refund of regulatory liabilities. These procedures also included, among others (i) evaluating the reasonableness of management's assessment of probability of future recovery for regulatory assets and refund of regulatory liabilities; (ii) testing, on a sample basis, the regulatory assets and liabilities, including those subject to pending rate cases and regulatory proceedings, by considering (a) the provisions and formulas outlined in rate orders; (b) other regulatory correspondence; and (c) application of relevant regulatory precedents.
Incremental Asset Retirement Obligations arising from the Federal Environment Protection Agency’s (“Federal EPA”) Revised Coal Combustion Residuals (CCR) Rule
As described in Notes 1 and 6 to the consolidated financial statements, in April 2024, the Federal EPA finalized revisions to the CCR Rule to expand the scope of the rule to include inactive impoundments at inactive facilities (“legacy CCR surface impoundments”) as well as to establish requirements for currently exempt solid waste management units that involve the direct placement of CCR on the land (“CCR management units”). The Federal EPA is requiring that owners and operators of legacy surface impoundments comply with all of the existing CCR Rule requirements applicable to inactive CCR surface impoundments at active facilities, except for the location restrictions and liner design criteria. Management evaluated the applicability of the rule to current and former plant sites and recorded incremental asset retirement obligations (AROs) based on initial cost estimates primarily reflecting compliance with the rule through closure in place and future groundwater monitoring requirements pursuant to the revised CCR Rule. As disclosed by management, accounting for the incremental ARO arising from the revised CCR Rule requires significant judgment by management due to the significant measurement uncertainty in estimating the incremental liability. As further groundwater monitoring and other analysis is performed, management expects to refine the assumptions and underlying cost estimates used in recording the incremental ARO arising from the revised CCR Rule. The estimated liability can significantly change if there are changes in the impacted coal ash site acreage inputs or if refinements in the assumptions over the remediation costs for legacy CCR surface impoundments and CCR management units, including assumptions over future groundwater monitoring requirements vary from the initial estimates. As a result of the rule, the Company recorded an incremental ARO of $312 million in the second quarter of 2024.
The principal considerations for our determination that performing procedures relating to the incremental ARO arising from the revised CCR Rule is a critical audit matter are (i) the significant judgment by management when developing the estimate of the incremental ARO; (ii) a high degree of auditor judgment, subjectivity and effort in performing procedures and evaluating the impacted coal ash site acreage and management’s assumptions over the remediation costs for legacy CCR surface impoundments and CCR management units, including assumptions over future groundwater monitoring requirements (collectively “management’s assumptions”); and (iii) the audit effort involved the use of professionals with specialized skill and knowledge.
Addressing the matter involved performing procedures and evaluating audit evidence in connection with forming our overall opinion on the consolidated financial statements. These procedures included testing the effectiveness of controls relating to management’s assessment of the incremental ARO arising from the revised CCR Rule, including controls over the impacted coal ash site acreage and management’s assumptions used in the estimate of the incremental ARO. These procedures also included, among others, (i) testing the completeness and accuracy of data used, including the impacted coal ash site acreage, in the estimate of the incremental ARO; (ii) testing management’s process for determining estimate of the incremental ARO , and (iii) the involvement of professionals with specialized skill and knowledge to assist in (a) assessing the adequacy of the cost assessment of the incremental ARO in accordance with the remediation requirements outlined in the Federal EPA’s revised CCR rule, (b) evaluating the reasonableness of management’s process over measuring coal ash site acreage and (c) evaluating the reasonableness of management’s assumptions used in the estimate.
/s/ PricewaterhouseCoopers LLP
Columbus, Ohio
February 13, 2025
We have served as the Company's auditor since 2017.
MANAGEMENT’S REPORT ON INTERNAL CONTROL OVER FINANCIAL REPORTING
The management of Appalachian Power Company and Subsidiaries (APCo) is responsible for establishing and maintaining adequate internal control over financial reporting as such term is defined in Rule 13a-15(f) and 15d-15(f) under the Securities Exchange Act of 1934, as amended. APCo’s internal control is a process designed to provide reasonable assurance regarding the reliability of financial reporting and the preparation of financial statements for external purposes in accordance with generally accepted accounting principles.
Because of its inherent limitations, internal control over financial reporting may not prevent or detect misstatements. Also, projections of any evaluation of effectiveness to future periods are subject to the risk that controls may become inadequate because of changes in conditions, or that the degree of compliance with the policies or procedures may deteriorate.
Management assessed the effectiveness of APCo’s internal control over financial reporting as of December 31, 2024. In making this assessment, management used the criteria set forth by the Committee of Sponsoring Organizations of the Treadway Commission (COSO) in Internal Control – Integrated Framework (2013). Based on management’s assessment, management concluded APCo’s internal control over financial reporting was effective as of December 31, 2024.
This annual report does not include an audit report from PricewaterhouseCoopers LLP, APCo’s registered public accounting firm regarding internal control over financial reporting pursuant to the Securities and Exchange Commission rules that permit APCo to provide only management’s report in this annual report.
APPALACHIAN POWER COMPANY AND SUBSIDIARIES
CONSOLIDATED STATEMENTS OF INCOME
For the Years Ended December 31, 2024, 2023 and 2022
(in millions)
| | | | | | | | | | | | | | | | | | | | |
| | Years Ended December 31, |
| | 2024 | | 2023 | | 2022 |
| REVENUES | | | | | | |
| Electric Generation, Transmission and Distribution | | $ | 3,769.3 | | | $ | 3,464.1 | | | $ | 3,245.5 | |
| Sales to AEP Affiliates | | 247.4 | | | 239.3 | | | 256.1 | |
| Other Revenues | | 15.9 | | | 17.3 | | | 18.3 | |
| TOTAL REVENUES | | 4,032.6 | | | 3,720.7 | | | 3,519.9 | |
| | | | | | |
| EXPENSES | | | | | | |
| Purchased Electricity, Fuel and Other Consumables Used for Electric Generation | | 1,405.6 | | | 1,434.6 | | | 1,173.9 | |
| | | | | | |
| | | | | | |
| Other Operation | | 804.7 | | | 748.4 | | | 724.1 | |
| Maintenance | | 322.6 | | | 271.7 | | | 297.8 | |
| Asset Impairments and Other Related Charges - Coal Fired Generation | | — | | | — | | | 24.9 | |
| Establishment of 2017-2019 Virginia Triennial Review Regulatory Asset | | — | | | — | | | (37.0) | |
| | | | | | |
| Depreciation and Amortization | | 602.4 | | | 571.9 | | | 575.9 | |
| Taxes Other Than Income Taxes | | 177.5 | | | 163.1 | | | 158.2 | |
| TOTAL EXPENSES | | 3,312.8 | | | 3,189.7 | | | 2,917.8 | |
| | | | | | |
| OPERATING INCOME | | 719.8 | | | 531.0 | | | 602.1 | |
| | | | | | |
| Other Income (Expense): | | | | | | |
| Interest Income | | 5.1 | | | 2.8 | | | 3.5 | |
| | | | | | |
| Allowance for Equity Funds Used During Construction | | 16.1 | | | 11.9 | | | 11.7 | |
| Non-Service Cost Components of Net Periodic Benefit Cost | | 27.2 | | | 32.5 | | | 29.0 | |
| Interest Expense | | (271.4) | | | (269.6) | | | (233.9) | |
| | | | | | |
| INCOME BEFORE INCOME TAX EXPENSE | | 496.8 | | | 308.6 | | | 412.4 | |
| | | | | | |
| Income Tax Expense | | 75.1 | | | 14.2 | | | 18.2 | |
| | | | | | |
| NET INCOME | | $ | 421.7 | | | $ | 294.4 | | | $ | 394.2 | |
| | | | | | |
| The common stock of APCo is wholly-owned by Parent. |
| | | | | | |
See Notes to Financial Statements of Registrants beginning on page 177. |
APPALACHIAN POWER COMPANY AND SUBSIDIARIES
CONSOLIDATED STATEMENTS OF COMPREHENSIVE INCOME (LOSS)
For the Years Ended December 31, 2024, 2023 and 2022
(in millions)
| | | | | | | | | | | | | | | | | | | | |
| | Years Ended December 31, |
| | 2024 | | 2023 | | 2022 |
| Net Income | | $ | 421.7 | | | $ | 294.4 | | | $ | 394.2 | |
| | | | | | |
| OTHER COMPREHENSIVE INCOME (LOSS), NET OF TAXES | | | | | | |
| Cash Flow Hedges, Net of Tax of $(0.2), $(0.2) and $(0.2) in 2024, 2023 and 2022, Respectively | | (0.8) | | | (0.8) | | | (0.8) | |
| Amortization of Pension and OPEB Deferred Costs, Net of Tax of $(0.3), $(0.8) and $(1.1) in 2024, 2023 and 2022, Respectively | | (1.1) | | | (3.0) | | | (4.3) | |
| Pension and OPEB Funded Status, Net of Tax of $4.5, $1.3 and $(6.4) in 2024, 2023 and 2022, Respectively | | 16.9 | | | 4.9 | | | (24.1) | |
| | | | | | |
| TOTAL OTHER COMPREHENSIVE INCOME (LOSS) | | 15.0 | | | 1.1 | | | (29.2) | |
| | | | | | |
| TOTAL COMPREHENSIVE INCOME | | $ | 436.7 | | | $ | 295.5 | | | $ | 365.0 | |
| | | | | | |
See Notes to Financial Statements of Registrants beginning on page 177. |
APPALACHIAN POWER COMPANY AND SUBSIDIARIES
CONSOLIDATED STATEMENTS OF CHANGES IN COMMON SHAREHOLDER’S EQUITY
For the Years Ended December 31, 2024, 2023 and 2022
(in millions)
| | | | | | | | | | | | | | | | | | | | | | | | | | | | | |
| Common
Stock | | Paid-in
Capital | | Retained
Earnings | | Accumulated
Other
Comprehensive
Income (Loss) | | Total |
| TOTAL COMMON SHAREHOLDER’S EQUITY – DECEMBER 31, 2021 | $ | 260.4 | | | $ | 1,828.7 | | | $ | 2,534.4 | | | $ | 24.4 | | | $ | 4,647.9 | |
| | | | | | | | | |
| Common Stock Dividends | | | | | (37.5) | | | | | (37.5) | |
| | | | | | | | | |
| Net Income | | | | | 394.2 | | | | | 394.2 | |
| Other Comprehensive Loss | | | | | | | (29.2) | | | (29.2) | |
| TOTAL COMMON SHAREHOLDER’S EQUITY – DECEMBER 31, 2022 | 260.4 | | | 1,828.7 | | | 2,891.1 | | | (4.8) | | | 4,975.4 | |
| | | | | | | | | |
| Capital Contribution from Parent | | | 6.5 | | | | | | | 6.5 | |
| Return of Capital to Parent | | | (0.7) | | | | | | | (0.7) | |
| | | | | | | | | |
| Net Income | | | | | 294.4 | | | | | 294.4 | |
| Other Comprehensive Income | | | | | | | 1.1 | | | 1.1 | |
| TOTAL COMMON SHAREHOLDER’S EQUITY – DECEMBER 31, 2023 | 260.4 | | | 1,834.5 | | | 3,185.5 | | | (3.7) | | | 5,276.7 | |
| | | | | | | | | |
| Capital Contribution from Parent | | | 114.1 | | | | | | | 114.1 | |
| Return of Capital to Parent | | | (4.5) | | | | | | | (4.5) | |
| Common Stock Dividends | | | | | (75.0) | | | | | (75.0) | |
| Net Income | | | | | 421.7 | | | | | 421.7 | |
| Other Comprehensive Income | | | | | | | 15.0 | | | 15.0 | |
| TOTAL COMMON SHAREHOLDER’S EQUITY – DECEMBER 31, 2024 | $ | 260.4 | | | $ | 1,944.1 | | | $ | 3,532.2 | | | $ | 11.3 | | | $ | 5,748.0 | |
| | | | | | | | | |
See Notes to Financial Statements of Registrants beginning on page 177. |
APPALACHIAN POWER COMPANY AND SUBSIDIARIES
CONSOLIDATED BALANCE SHEETS
ASSETS
December 31, 2024 and 2023
(in millions)
| | | | | | | | | | | | | | |
| | December 31, |
| | 2024 | | 2023 |
| CURRENT ASSETS | | | | |
| Cash and Cash Equivalents | | $ | 3.9 | | | $ | 5.0 | |
| Restricted Cash for Securitized Funding | | 16.2 | | | 14.9 | |
| Advances to Affiliates | | 17.7 | | | 18.9 | |
| Accounts Receivable: | | | | |
| Customers | | 185.7 | | | 170.3 | |
| Affiliated Companies | | 110.5 | | | 98.8 | |
| Accrued Unbilled Revenues | | 93.1 | | | 70.8 | |
| Miscellaneous | | 0.3 | | | 0.6 | |
| Allowance for Credit Losses | | (2.0) | | | (2.0) | |
| Total Accounts Receivable | | 387.6 | | | 338.5 | |
| Fuel | | 308.0 | | | 315.0 | |
| Materials and Supplies | | 131.7 | | | 148.4 | |
| Risk Management Assets | | 35.7 | | | 22.4 | |
| | | | |
| Regulatory Asset for Under-Recovered Fuel Costs | | 148.1 | | | 155.4 | |
| | | | |
| Prepayments and Other Current Assets | | 46.0 | | | 40.5 | |
| TOTAL CURRENT ASSETS | | 1,094.9 | | | 1,059.0 | |
| | | | |
| PROPERTY, PLANT AND EQUIPMENT | | | | |
| Electric: | | | | |
| Generation | | 7,272.6 | | | 7,041.3 | |
| Transmission | | 5,001.5 | | | 4,711.8 | |
| Distribution | | 5,568.5 | | | 5,176.6 | |
| Other Property, Plant and Equipment | | 1,062.9 | | | 981.3 | |
| Construction Work in Progress | | 742.6 | | | 709.2 | |
| Total Property, Plant and Equipment | | 19,648.1 | | | 18,620.2 | |
| Accumulated Depreciation and Amortization | | 6,035.6 | | | 5,688.7 | |
| TOTAL PROPERTY, PLANT AND EQUIPMENT – NET | | 13,612.5 | | | 12,931.5 | |
| | | | |
| OTHER NONCURRENT ASSETS | | | | |
| Regulatory Assets | | 1,366.0 | | | 1,155.1 | |
| Securitized Assets | | 106.2 | | | 133.4 | |
| | | | |
| Employee Benefits and Pension Assets | | 203.9 | | | 171.7 | |
| Operating Lease Assets | | 67.0 | | | 73.7 | |
| Deferred Charges and Other Noncurrent Assets | | 215.4 | | | 187.5 | |
| TOTAL OTHER NONCURRENT ASSETS | | 1,958.5 | | | 1,721.4 | |
| | | | |
| TOTAL ASSETS | | $ | 16,665.9 | | | $ | 15,711.9 | |
| | | | |
See Notes to Financial Statements of Registrants beginning on page 177. |
APPALACHIAN POWER COMPANY AND SUBSIDIARIES
CONSOLIDATED BALANCE SHEETS
LIABILITIES AND COMMON SHAREHOLDER’S EQUITY
December 31, 2024 and 2023
| | | | | | | | | | | | | | |
| | December 31, |
| | 2024 | | 2023 |
| | (in millions) |
| CURRENT LIABILITIES | | | | |
| Advances from Affiliates | | $ | 95.0 | | | $ | 339.6 | |
| Accounts Payable: | | | | |
| General | | 427.2 | | | 280.4 | |
| Affiliated Companies | | 205.9 | | | 121.3 | |
| Long-term Debt Due Within One Year - Nonaffiliated | | 798.6 | | | 538.8 | |
| | | | |
| | | | |
| Customer Deposits | | 86.6 | | | 80.0 | |
| | | | |
| Accrued Taxes | | 168.8 | | | 117.6 | |
| | | | |
| Obligations Under Operating Leases | | 13.7 | | | 14.6 | |
| | | | |
| Other Current Liabilities | | 229.7 | | | 193.6 | |
| TOTAL CURRENT LIABILITIES | | 2,025.5 | | | 1,685.9 | |
| | | | |
| NONCURRENT LIABILITIES | | | | |
| Long-term Debt – Nonaffiliated | | 4,861.7 | | | 5,049.5 | |
| | | | |
| | | | |
| Deferred Income Taxes | | 2,033.5 | | | 2,011.9 | |
| Regulatory Liabilities and Deferred Investment Tax Credits | | 1,115.8 | | | 1,081.9 | |
| Asset Retirement Obligations | | 767.4 | | | 442.5 | |
| Employee Benefits and Pension Obligations | | 29.6 | | | 32.8 | |
| Obligations Under Operating Leases | | 54.0 | | | 59.8 | |
| Deferred Credits and Other Noncurrent Liabilities | | 30.4 | | | 70.9 | |
| TOTAL NONCURRENT LIABILITIES | | 8,892.4 | | | 8,749.3 | |
| | | | |
| TOTAL LIABILITIES | | 10,917.9 | | | 10,435.2 | |
| | | | |
| Rate Matters (Note 4) | | | | |
| Commitments and Contingencies (Note 6) | | | | |
| | | | |
| COMMON SHAREHOLDER’S EQUITY | | | | |
| Common Stock – No Par Value: | | | | |
| Authorized – 30,000,000 Shares | | | | |
| Outstanding – 13,499,500 Shares | | 260.4 | | | 260.4 | |
| Paid-in Capital | | 1,944.1 | | | 1,834.5 | |
| Retained Earnings | | 3,532.2 | | | 3,185.5 | |
| Accumulated Other Comprehensive Income (Loss) | | 11.3 | | | (3.7) | |
| TOTAL COMMON SHAREHOLDER’S EQUITY | | 5,748.0 | | | 5,276.7 | |
| | | | |
| TOTAL LIABILITIES AND COMMON SHAREHOLDER’S EQUITY | | $ | 16,665.9 | | | $ | 15,711.9 | |
| | | | |
See Notes to Financial Statements of Registrants beginning on page 177. |
APPALACHIAN POWER COMPANY AND SUBSIDIARIES
CONSOLIDATED STATEMENTS OF CASH FLOWS
For the Years Ended December 31, 2024, 2023 and 2022
(in millions)
| | | | | | | | | | | | | | | | | | | | |
| | Years Ended December 31, |
| | 2024 | | 2023 | | 2022 |
| OPERATING ACTIVITIES | | | | | | |
| Net Income | | $ | 421.7 | | | $ | 294.4 | | | $ | 394.2 | |
| Adjustments to Reconcile Net Income to Net Cash Flows from Operating Activities: | | | | | | |
| Depreciation and Amortization | | 602.4 | | | 571.9 | | | 575.9 | |
| Deferred Income Taxes | | (17.4) | | | (54.3) | | | 79.6 | |
| Asset Impairments and Other Related Charges - Coal Fired Generation | | — | | | — | | | 24.9 | |
| | | | | | |
| | | | | | |
| Allowance for Equity Funds Used During Construction | | (16.1) | | | (11.9) | | | (11.7) | |
| Mark-to-Market of Risk Management Contracts | | (35.0) | | | 65.6 | | | (24.4) | |
| | | | | | |
| Deferred Fuel Over/Under-Recovery, Net | | 136.1 | | | 279.7 | | | (501.8) | |
| Change in Regulatory Assets | | (114.9) | | | (19.9) | | | (34.4) | |
| Establishment of 2017-2019 Virginia Triennial Review Regulatory Asset | | — | | | — | | | (37.0) | |
| | | | | | |
| Change in Other Noncurrent Assets | | (46.8) | | | (95.4) | | | (40.8) | |
| Change in Other Noncurrent Liabilities | | 11.9 | | | (1.9) | | | 31.4 | |
| Changes in Certain Components of Working Capital: | | | | | | |
| Accounts Receivable, Net | | (45.9) | | | 17.5 | | | (8.5) | |
| | | | | | |
| Fuel, Materials and Supplies | | 23.7 | | | (173.9) | | | (113.5) | |
| Margin Deposits | | (1.4) | | | (16.1) | | | 64.4 | |
| Accounts Payable | | 166.2 | | | (125.9) | | | 190.1 | |
| Accrued Taxes, Net | | 50.8 | | | 25.2 | | | 6.7 | |
| Other Current Assets | | (3.3) | | | 0.4 | | | 0.2 | |
| Other Current Liabilities | | 11.7 | | | (32.3) | | | 5.9 | |
| Net Cash Flows from Operating Activities | | 1,143.7 | | | 723.1 | | | 601.2 | |
| | | | | | |
| INVESTING ACTIVITIES | | | | | | |
| Construction Expenditures | | (1,009.4) | | | (1,053.0) | | | (1,048.6) | |
| Change in Advances to Affiliates, Net | | 1.2 | | | 0.9 | | | 1.0 | |
| | | | | | |
| Other Investing Activities | | 15.5 | | | (2.8) | | | 42.4 | |
| Net Cash Flows Used for Investing Activities | | (992.7) | | | (1,054.9) | | | (1,005.2) | |
| | | | | | |
| FINANCING ACTIVITIES | | | | | | |
| Capital Contribution from Parent | | 114.1 | | | 6.5 | | | — | |
| Return of Capital to Parent | | (4.5) | | | (0.7) | | | — | |
| Issuance of Long-term Debt – Nonaffiliated | | 480.8 | | | 200.0 | | | 698.0 | |
| Change in Advances from Affiliates, Net | | (244.6) | | | 157.4 | | | (17.1) | |
| Retirement of Long-term Debt – Nonaffiliated | | (413.5) | | | (26.6) | | | (230.4) | |
| | | | | | |
| | | | | | |
| Principal Payments for Finance Lease Obligations | | (8.7) | | | (8.3) | | | (7.9) | |
| Dividends Paid on Common Stock | | (75.0) | | | — | | | (37.5) | |
| Other Financing Activities | | 0.6 | | | 1.5 | | | 0.7 | |
| Net Cash Flows from (Used for) Financing Activities | | (150.8) | | | 329.8 | | | 405.8 | |
| | | | | | |
| Net Increase (Decrease) in Cash, Cash Equivalents and Restricted Cash for Securitized Funding | | 0.2 | | | (2.0) | | | 1.8 | |
| Cash, Cash Equivalents and Restricted Cash for Securitized Funding at Beginning of Period | | 19.9 | | | 21.9 | | | 20.1 | |
| Cash, Cash Equivalents and Restricted Cash for Securitized Funding at End of Period | | $ | 20.1 | | | $ | 19.9 | | | $ | 21.9 | |
| | | | | | |
| SUPPLEMENTARY INFORMATION | | | | | | |
| Cash Paid for Interest, Net of Capitalized Amounts | | $ | 256.9 | | | $ | 259.7 | | | $ | 215.1 | |
| Net Cash Paid (Received) for Income Taxes | | 47.8 | | | 47.4 | | | (88.6) | |
| Noncash Acquisitions Under Finance Leases | | 1.8 | | | 5.0 | | | 1.6 | |
| | | | | | |
| Construction Expenditures Included in Current Liabilities as of December 31, | | 159.2 | | | 100.7 | | | 164.6 | |
| | | | | | |
| | | | | | |
| | | | | | |
See Notes to Financial Statements of Registrants beginning on page 177. |
INDIANA MICHIGAN POWER COMPANY AND SUBSIDIARIES
MANAGEMENT’S NARRATIVE DISCUSSION AND ANALYSIS OF RESULTS OF OPERATIONS
RESULTS OF OPERATIONS
KWh Sales/Degree Days
| | | | | | | | | | | | | | | | | |
| Summary of KWh Energy Sales |
| | | | | |
| Years Ended December 31, |
| 2024 | | 2023 | | 2022 |
| (in millions of KWhs) |
| Retail: | | | | | |
| Residential | 5,301 | | | 5,169 | | | 5,507 | |
| Commercial | 5,273 | | | 4,971 | | | 4,740 | |
| Industrial | 7,298 | | | 7,309 | | | 7,492 | |
| Miscellaneous | 49 | | | 55 | | | 56 | |
| Total Retail | 17,921 | | | 17,504 | | | 17,795 | |
| | | | | |
| Wholesale (a) | 6,278 | | | 5,215 | | | 6,772 | |
| | | | | |
| Total KWhs | 24,199 | | | 22,719 | | | 24,567 | |
(a)Includes Off-system Sales, municipalities and cooperatives, unit power and other wholesale customers.
Heating degree days and cooling degree days are metrics commonly used in the utility industry as a measure of the impact of weather on revenues.
| | | | | | | | | | | | | | | | | |
| Summary of Heating and Cooling Degree Days |
| | | | | |
| Years Ended December 31, |
| 2024 | | 2023 | | 2022 |
| (in degree days) |
| Actual – Heating (a) | 2,859 | | | 2,917 | | | 3,804 | |
| Normal – Heating (b) | 3,721 | | | 3,734 | | | 3,725 | |
| | | | | |
| Actual – Cooling (c) | 987 | | | 751 | | | 935 | |
| Normal – Cooling (b) | 867 | | | 871 | | | 857 | |
(a)Heating degree days are calculated on a 55 degree temperature base.
(b)Normal Heating/Cooling represents the thirty-year average of degree days.
(c)Cooling degree days are calculated on a 65 degree temperature base.
Indiana Michigan Power Company and Subsidiaries
Reconciliation of Year Ended December 31, 2023 to Year Ended December 31, 2024
Net Income
(in millions)
| | | | | | | | |
| Year Ended December 31, 2023 | | $ | 335.9 | |
| | |
| Changes in Revenues: | | |
| Retail Revenues | | 46.1 | |
| | |
| Off-system Sales | | (11.2) | |
| Transmission Revenues | | 5.4 | |
| Other Revenues | | (4.2) | |
| Total Change in Revenues | | 36.1 | |
| | |
| Changes in Expenses and Other: | | |
| Purchased Electricity, Fuel and Other Consumables Used for Electric Generation | | (5.3) | |
| Purchased Electricity from AEP Affiliates | | (27.7) | |
| Other Operation and Maintenance | | (62.1) | |
| Asset Impairments and Other Related Charges | | (13.4) | |
| Depreciation and Amortization | | (11.1) | |
| Taxes Other Than Income Taxes | | (5.0) | |
| Other Income | | 0.2 | |
| | |
| | |
| Non-Service Cost Components of Net Periodic Benefit Cost | | (13.2) | |
| Interest Expense | | 3.2 | |
| Total Change in Expenses and Other | | (134.4) | |
| | |
| Income Tax Expense | | 153.8 | |
| | |
| Year Ended December 31, 2024 | | $ | 391.4 | |
The major components of the increase in Revenues were as follows:
•Retail Revenues increased $46 million primarily due to the following:
•A $30 million increase in rider revenues.
•A $22 million increase due to the implementation of new base rates in Indiana and Michigan.
•A $21 million increase in weather-related usage primarily due to a 31% increase in cooling degree days.
•A $21 million increase in weather-normalized margins primarily in the commercial class.
•An $11 million increase in fuel revenues.
These increases were partially offset by:
•A $52 million decrease due to regulatory provisions for refund.
•Off-system Sales decreased $11 million primarily due to economic hedging activity and Rockport Plant, Unit 2 merchant sales.
•Transmission Revenues increased $5 million primarily due to continued investment in transmission assets.
Expenses and Other and Income Tax Expense changed between years as follows:
•Purchased Electricity, Fuel and Other Consumables Used for Electric Generation expenses increased $5 million primarily due to an increase in merchant generation at Rockport Plant and an increase in recoverable PJM expenses, partially offset by decreased recoverable fuel costs.
•Purchased Electricity from AEP Affiliates increased $28 million primarily due to an increase in purchased electricity from the Rockport Plant.
•Other Operation and Maintenance expenses increased $62 million primarily due to the following:
•A $28 million increase in transmission expenses primarily due to an increase in recoverable PJM expenses.
•A $24 million increase in employee-related expenses including a $15 million increase associated with the voluntary severance program that occurred in the second quarter of 2024.
•A $9 million increase in non-utility operation expenses due to an increase in RTD expenses and merchant operation expenses at Rockport Plant.
•Asset Impairments and Other Related Charges increased $13 million due to the Federal EPA’s revised CCR rules.
•Depreciation and Amortization expenses increased $11 million primarily due to the following:
•A $15 million increase related to a regulatory provision for Nuclear PTCs. This increase is offset in Income Tax Expense below.
•A $14 million increase due to a higher depreciable base.
These increases were partially offset by:
•A $20 million decrease primarily due to the deferral of Excess ADIT as a result of the PLR received regarding the treatment of stand-alone NOLCs and the timing of refunds to customers under rate rider mechanisms.
•Taxes Other Than Income Taxes increased $5 million primarily due to an increase in property taxes resulting from adjustments for prior year activity.
•Non-Service Cost Components of Net Periodic Benefit Cost increased $13 million primarily due to a plan remeasurement triggered by settlements related to the voluntary severance program.
•Income Tax Expense decreased $154 million primarily due to the following:
•A $69 million decrease due to estimated Nuclear PTCs.
•A $67 million decrease due to a reduction in Excess ADIT as a result of the IRS PLR and I&M Michigan jurisdictional treatment of stand-alone NOLCs.
•A $21 million decrease due to a decrease in pretax book income.
REPORT OF INDEPENDENT REGISTERED PUBLIC ACCOUNTING FIRM
To the Board of Directors and Shareholder of
Indiana Michigan Power Company
Opinion on the Financial Statements
We have audited the accompanying consolidated balance sheets of Indiana Michigan Power Company and its subsidiaries (the "Company") as of December 31, 2024 and 2023, and the related consolidated statements of income, of comprehensive income (loss), of changes in common shareholder's equity and of cash flows for each of the three years in the period ended December 31, 2024, including the related notes (collectively referred to as the "consolidated financial statements"). In our opinion, the consolidated financial statements present fairly, in all material respects, the financial position of the Company as of December 31, 2024 and 2023, and the results of its operations and its cash flows for each of the three years in the period ended December 31, 2024 in conformity with accounting principles generally accepted in the United States of America.
Basis for Opinion
These consolidated financial statements are the responsibility of the Company’s management. Our responsibility is to express an opinion on the Company’s consolidated financial statements based on our audits. We are a public accounting firm registered with the Public Company Accounting Oversight Board (United States) (PCAOB) and are required to be independent with respect to the Company in accordance with the U.S. federal securities laws and the applicable rules and regulations of the Securities and Exchange Commission and the PCAOB.
We conducted our audits of these consolidated financial statements in accordance with the standards of the PCAOB. Those standards require that we plan and perform the audits to obtain reasonable assurance about whether the consolidated financial statements are free of material misstatement, whether due to error or fraud. The Company is not required to have, nor were we engaged to perform, an audit of its internal control over financial reporting. As part of our audits we are required to obtain an understanding of internal control over financial reporting but not for the purpose of expressing an opinion on the effectiveness of the Company's internal control over financial reporting. Accordingly, we express no such opinion.
Our audits included performing procedures to assess the risks of material misstatement of the consolidated financial statements, whether due to error or fraud, and performing procedures that respond to those risks. Such procedures included examining, on a test basis, evidence regarding the amounts and disclosures in the consolidated financial statements. Our audits also included evaluating the accounting principles used and significant estimates made by management, as well as evaluating the overall presentation of the consolidated financial statements. We believe that our audits provide a reasonable basis for our opinion.
Critical Audit Matters
The critical audit matters communicated below are matters arising from the current period audit of the consolidated financial statements that were communicated or required to be communicated to the audit committee and that (i) relate to accounts or disclosures that are material to the consolidated financial statements and (ii) involved our especially challenging, subjective, or complex judgments. The communication of critical audit matters does not alter in any way our opinion on the consolidated financial statements, taken as a whole, and we are not, by communicating the critical audit matters below, providing separate opinions on the critical audit matters or on the accounts or disclosures to which they relate.
Accounting for the Effects of Cost-Based Regulation
As described in Notes 1 and 5 to the consolidated financial statements, the Company's consolidated financial statements reflect the actions of regulators that result in the recognition of certain revenues and expenses in different time periods than enterprises that are not rate-regulated. Regulatory assets (deferred expenses to be recovered in the future) and regulatory liabilities (deferred future revenue reductions or refunds) are recorded to reflect the economic effects of regulation in the same accounting period by matching expenses with their recovery through regulated revenues and matching income with its passage to customers in cost-based regulated rates. As of December 31, 2024, there were $559 million of deferred costs included in regulatory assets, $115 million of which were pending final regulatory approval, and $2,491 million of regulatory liabilities awaiting potential refund or future rate reduction, $43 million of which were pending final regulatory determination. Management reviews the probability of recovery of regulatory assets and refund of regulatory liabilities at each balance sheet date and whenever new events occur, such as changes in the regulatory environment, issuance of regulatory commission orders, or passage of new legislation.
The principal considerations for our determination that performing procedures relating to the accounting for the effects of cost-based regulation is a critical audit matter are (i) the significant judgment by management in assessing probability of the recovery of regulatory assets and refund of regulatory liabilities and (ii) a high degree of auditor judgment, subjectivity, and
effort in performing procedures and evaluating audit evidence related to the probability of recovery of regulatory assets and refund of regulatory liabilities.
Addressing the matter involved performing procedures and evaluating audit evidence in connection with forming our overall opinion on the consolidated financial statements. These procedures included testing the effectiveness of controls relating to management's evaluation of new events, such as changes in the regulatory environment, issuance of regulatory commission orders, or passage of new legislation, including controls over the probability of recovery of regulatory assets and refund of regulatory liabilities. These procedures also included, among others (i) evaluating the reasonableness of management's assessment of probability of future recovery for regulatory assets and refund of regulatory liabilities; (ii) testing, on a sample basis, the regulatory assets and liabilities, including those subject to pending rate cases and regulatory proceedings, by considering (a) the provisions and formulas outlined in rate orders; (b) other regulatory correspondence; and (c) application of relevant regulatory precedents.
Incremental Asset Retirement Obligations arising from the Federal Environment Protection Agency’s (“Federal EPA”) Revised Coal Combustion Residuals (CCR) Rule
As described in Notes 1 and 6 to the consolidated financial statements, in April 2024, the Federal EPA finalized revisions to the CCR Rule to expand the scope of the rule to include inactive impoundments at inactive facilities (“legacy CCR surface impoundments”) as well as to establish requirements for currently exempt solid waste management units that involve the direct placement of CCR on the land (“CCR management units”). The Federal EPA is requiring that owners and operators of legacy surface impoundments comply with all of the existing CCR Rule requirements applicable to inactive CCR surface impoundments at active facilities, except for the location restrictions and liner design criteria. Management evaluated the applicability of the rule to current and former plant sites and recorded incremental asset retirement obligations (AROs) based on initial cost estimates primarily reflecting compliance with the rule through closure in place and future groundwater monitoring requirements pursuant to the revised CCR Rule. As disclosed by management, accounting for the incremental ARO arising from the revised CCR Rule requires significant judgment by management due to the significant measurement uncertainty in estimating the incremental liability. As further groundwater monitoring and other analysis is performed, management expects to refine the assumptions and underlying cost estimates used in recording the incremental ARO arising from the revised CCR Rule. The estimated liability can significantly change if there are changes in the impacted coal ash site acreage inputs or if refinements in the assumptions over the remediation costs for legacy CCR surface impoundments and CCR management units, including assumptions over future groundwater monitoring requirements vary from the initial estimates. As a result of the rule, the Company recorded an incremental ARO of $86 million in the second quarter of 2024.
The principal considerations for our determination that performing procedures relating to the incremental ARO arising from the revised CCR Rule is a critical audit matter are (i) the significant judgment by management when developing the estimate of the incremental ARO; (ii) a high degree of auditor judgment, subjectivity and effort in performing procedures and evaluating the impacted coal ash site acreage and management’s assumptions over the remediation costs for legacy CCR surface impoundments and CCR management units, including assumptions over future groundwater monitoring requirements (collectively “management’s assumptions”); and (iii) the audit effort involved the use of professionals with specialized skill and knowledge.
Addressing the matter involved performing procedures and evaluating audit evidence in connection with forming our overall opinion on the consolidated financial statements. These procedures included testing the effectiveness of controls relating to management’s assessment of the incremental ARO arising from the revised CCR Rule, including controls over the impacted coal ash site acreage and management’s assumptions used in the estimate of the incremental ARO. These procedures also included, among others, (i) testing the completeness and accuracy of data used, including the impacted coal ash site acreage, in the estimate of the incremental ARO; (ii) testing management’s process for determining estimate of the incremental ARO , and (iii) the involvement of professionals with specialized skill and knowledge to assist in (a) assessing the adequacy of the cost assessment of the incremental ARO in accordance with the remediation requirements outlined in the Federal EPA’s revised CCR rule, (b) evaluating the reasonableness of management’s process over measuring coal ash site acreage and (c) evaluating the reasonableness of management’s assumptions used in the estimate.
/s/ PricewaterhouseCoopers LLP
Columbus, Ohio
February 13, 2025
We have served as the Company's auditor since 2017.
MANAGEMENT’S REPORT ON INTERNAL CONTROL OVER FINANCIAL REPORTING
The management of Indiana Michigan Power Company and Subsidiaries (I&M) is responsible for establishing and maintaining adequate internal control over financial reporting as such term is defined in Rule 13a-15(f) and 15d-15(f) under the Securities Exchange Act of 1934, as amended. I&M’s internal control is a process designed to provide reasonable assurance regarding the reliability of financial reporting and the preparation of financial statements for external purposes in accordance with generally accepted accounting principles.
Because of its inherent limitations, internal control over financial reporting may not prevent or detect misstatements. Also, projections of any evaluation of effectiveness to future periods are subject to the risk that controls may become inadequate because of changes in conditions, or that the degree of compliance with the policies or procedures may deteriorate.
Management assessed the effectiveness of I&M’s internal control over financial reporting as of December 31, 2024. In making this assessment, management used the criteria set forth by the Committee of Sponsoring Organizations of the Treadway Commission (COSO) in Internal Control – Integrated Framework (2013). Based on management’s assessment, management concluded I&M’s internal control over financial reporting was effective as of December 31, 2024.
This annual report does not include an audit report from PricewaterhouseCoopers LLP, I&M’s registered public accounting firm regarding internal control over financial reporting pursuant to the Securities and Exchange Commission rules that permit I&M to provide only management’s report in this annual report.
INDIANA MICHIGAN POWER COMPANY AND SUBSIDIARIES
CONSOLIDATED STATEMENTS OF INCOME
For the Years Ended December 31, 2024, 2023 and 2022
(in millions)
| | | | | | | | | | | | | | | | | | | | |
| | Years Ended December 31, |
| | 2024 | | 2023 | | 2022 |
| REVENUES | | | | | | |
| Electric Generation, Transmission and Distribution | | $ | 2,552.3 | | | $ | 2,469.0 | | | $ | 2,613.7 | |
| Sales to AEP Affiliates | | 15.4 | | | 9.3 | | | 17.8 | |
| Provision for Refund – Affiliated | | (13.7) | | | (10.5) | | | (2.5) | |
| Provision for Refund – Nonaffiliated | | (56.8) | | | (3.2) | | | (25.4) | |
| Other Revenues – Affiliated | | 64.5 | | | 59.0 | | | 54.3 | |
| Other Revenues – Nonaffiliated | | 10.3 | | | 12.3 | | | 11.7 | |
| TOTAL REVENUES | | 2,572.0 | | | 2,535.9 | | | 2,669.6 | |
| | | | | | |
| EXPENSES | | | | | | |
| Purchased Electricity, Fuel and Other Consumables Used for Electric Generation | | 416.6 | | | 411.3 | | | 535.5 | |
| | | | | | |
| Purchased Electricity from AEP Affiliates | | 208.9 | | | 181.2 | | | 241.8 | |
| Other Operation | | 728.2 | | | 662.8 | | | 621.0 | |
| Maintenance | | 235.4 | | | 238.7 | | | 227.2 | |
| Asset Impairment and Other Related Charges | | 13.4 | | | — | | | — | |
| Depreciation and Amortization | | 481.1 | | | 470.0 | | | 527.2 | |
| Taxes Other Than Income Taxes | | 89.2 | | | 84.2 | | | 97.0 | |
| TOTAL EXPENSES | | 2,172.8 | | | 2,048.2 | | | 2,249.7 | |
| | | | | | |
| OPERATING INCOME | | 399.2 | | | 487.7 | | | 419.9 | |
| | | | | | |
| Other Income (Expense): | | | | | | |
| Other Income | | 12.7 | | | 12.5 | | | 9.3 | |
| | | | | | |
| | | | | | |
| | | | | | |
| Non-Service Cost Components of Net Periodic Benefit Cost | | 17.8 | | | 31.0 | | | 24.9 | |
| Interest Expense | | (133.5) | | | (136.7) | | | (125.2) | |
| | | | | | |
| INCOME BEFORE INCOME TAX EXPENSE (BENEFIT) | | 296.2 | | | 394.5 | | | 328.9 | |
| | | | | | |
| Income Tax Expense (Benefit) | | (95.2) | | | 58.6 | | | 4.2 | |
| | | | | | |
| NET INCOME | | $ | 391.4 | | | $ | 335.9 | | | $ | 324.7 | |
| | | | | | |
| The common stock of I&M is wholly-owned by Parent. |
| | | | | | |
See Notes to Financial Statements of Registrants beginning on page 177. |
INDIANA MICHIGAN POWER COMPANY AND SUBSIDIARIES
CONSOLIDATED STATEMENTS OF COMPREHENSIVE INCOME (LOSS)
For the Years Ended December 31, 2024, 2023 and 2022
(in millions)
| | | | | | | | | | | | | | | | | | | | |
| | Years Ended December 31, |
| | 2024 | | 2023 | | 2022 |
| Net Income | | $ | 391.4 | | | $ | 335.9 | | | $ | 324.7 | |
| | | | | | |
| OTHER COMPREHENSIVE INCOME (LOSS), NET OF TAXES | | | | | | |
| Cash Flow Hedges, Net of Tax of $0.1, $(0.1) and $0.4 in 2024, 2023 and 2022, Respectively | | 0.4 | | | (0.4) | | | 1.6 | |
| Amortization of Pension and OPEB Deferred Costs, Net of Tax of $0, $(0.2) and $(0.1) in 2024, 2023 and 2022, Respectively | | (0.2) | | | (0.9) | | | (0.3) | |
| Pension and OPEB Funded Status, Net of Tax of $0.2, $0.3 and $(0.1) in 2024, 2023 and 2022, Respectively | | 0.6 | | | 1.0 | | | (0.3) | |
| | | | | | |
| TOTAL OTHER COMPREHENSIVE INCOME (LOSS) | | 0.8 | | | (0.3) | | | 1.0 | |
| | | | | | |
| TOTAL COMPREHENSIVE INCOME | | $ | 392.2 | | | $ | 335.6 | | | $ | 325.7 | |
| | | | | | |
See Notes to Financial Statements of Registrants beginning on page 177. |
INDIANA MICHIGAN POWER COMPANY AND SUBSIDIARIES
CONSOLIDATED STATEMENTS OF CHANGES IN COMMON SHAREHOLDER’S EQUITY
For the Years Ended December 31, 2024, 2023 and 2022
(in millions)
| | | | | | | | | | | | | | | | | | | | | | | | | | | | | |
| Common
Stock | | Paid-in
Capital | | Retained Earnings | | Accumulated
Other
Comprehensive
Income (Loss) | | Total |
| TOTAL COMMON SHAREHOLDER’S EQUITY – DECEMBER 31, 2021 | $ | 56.6 | | | $ | 980.9 | | | $ | 1,748.5 | | | $ | (1.3) | | | $ | 2,784.7 | |
| | | | | | | | | |
| Capital Contribution from Parent | | | 7.9 | | | | | | | 7.9 | |
| Common Stock Dividends | | | | | (110.0) | | | | | (110.0) | |
| | | | | | | | | |
| Net Income | | | | | 324.7 | | | | | 324.7 | |
| Other Comprehensive Income | | | | | | | 1.0 | | | 1.0 | |
| TOTAL COMMON SHAREHOLDER’S EQUITY – DECEMBER 31, 2022 | 56.6 | | | 988.8 | | | 1,963.2 | | | (0.3) | | | 3,008.3 | |
| | | | | | | | | |
| Capital Contribution from Parent | | | 8.8 | | | | | | | 8.8 | |
| Common Stock Dividends | | | | | (212.5) | | | | | (212.5) | |
| | | | | | | | | |
| Net Income | | | | | 335.9 | | | | | 335.9 | |
| Other Comprehensive Loss | | | | | | | (0.3) | | | (0.3) | |
| TOTAL COMMON SHAREHOLDER’S EQUITY – DECEMBER 31, 2023 | 56.6 | | | 997.6 | | | 2,086.6 | | | (0.6) | | | 3,140.2 | |
| | | | | | | | | |
| Capital Contribution from Parent | | | 15.9 | | | | | | | 15.9 | |
| Return of Capital to Parent | | | (1.8) | | | | | | | (1.8) | |
| Common Stock Dividends | | | | | (150.0) | | | | | (150.0) | |
| | | | | | | | | |
| Net Income | | | | | 391.4 | | | | | 391.4 | |
| Other Comprehensive Income | | | | | | | 0.8 | | | 0.8 | |
| TOTAL COMMON SHAREHOLDER’S EQUITY – DECEMBER 31, 2024 | $ | 56.6 | | | $ | 1,011.7 | | | $ | 2,328.0 | | | $ | 0.2 | | | $ | 3,396.5 | |
| | | | | | | | | |
See Notes to Financial Statements of Registrants beginning on page 177. |
INDIANA MICHIGAN POWER COMPANY AND SUBSIDIARIES
CONSOLIDATED BALANCE SHEETS
ASSETS
December 31, 2024 and 2023
(in millions)
| | | | | | | | | | | | | | |
| | December 31, |
| | 2024 | | 2023 |
| CURRENT ASSETS | | | | |
| Cash and Cash Equivalents | | $ | 1.5 | | | $ | 2.1 | |
| | | | |
| Accounts Receivable: | | | | |
| Customers | | 58.7 | | | 66.9 | |
| Affiliated Companies | | 79.1 | | | 65.0 | |
| Accrued Unbilled Revenues | | 21.4 | | | 0.2 | |
| Miscellaneous | | 6.3 | | | 8.2 | |
| | | | |
| Total Accounts Receivable | | 165.5 | | | 140.3 | |
| Fuel | | 83.4 | | | 88.1 | |
| Materials and Supplies | | 212.2 | | | 208.2 | |
| Risk Management Assets | | 18.4 | | | 27.8 | |
| | | | |
| | | | |
| Regulatory Asset for Under-Recovered Fuel Costs | | 10.6 | | | 14.8 | |
| | | | |
| Prepayments and Other Current Assets | | 52.0 | | | 46.7 | |
| TOTAL CURRENT ASSETS | | 543.6 | | | 528.0 | |
| | | | |
| PROPERTY, PLANT AND EQUIPMENT | | | | |
| Electric: | | | | |
| Generation | | 5,503.0 | | | 5,646.8 | |
| Transmission | | 1,957.8 | | | 1,906.4 | |
| Distribution | | 3,535.0 | | | 3,254.0 | |
| Other Property, Plant and Equipment (Including Coal Mining and Nuclear Fuel) | | 992.4 | | | 898.5 | |
| Construction Work in Progress | | 334.9 | | | 301.7 | |
| Total Property, Plant and Equipment | | 12,323.1 | | | 12,007.4 | |
| Accumulated Depreciation, Depletion and Amortization | | 4,643.8 | | | 4,378.4 | |
| TOTAL PROPERTY, PLANT AND EQUIPMENT – NET | | 7,679.3 | | | 7,629.0 | |
| | | | |
| OTHER NONCURRENT ASSETS | | | | |
| Regulatory Assets | | 548.1 | | | 406.3 | |
| Spent Nuclear Fuel and Decommissioning Trusts | | 4,395.1 | | | 3,860.2 | |
| | | | |
| Operating Lease Assets | | 51.5 | | | 53.8 | |
| Deferred Charges and Other Noncurrent Assets | | 317.9 | | | 330.7 | |
| TOTAL OTHER NONCURRENT ASSETS | | 5,312.6 | | | 4,651.0 | |
| | | | |
| TOTAL ASSETS | | $ | 13,535.5 | | | $ | 12,808.0 | |
| | | | |
See Notes to Financial Statements of Registrants beginning on page 177. |
INDIANA MICHIGAN POWER COMPANY AND SUBSIDIARIES
CONSOLIDATED BALANCE SHEETS
LIABILITIES AND COMMON SHAREHOLDER’S EQUITY
December 31, 2024 and 2023
(dollars in millions)
| | | | | | | | | | | | | | |
| | December 31, |
| | 2024 | | 2023 |
| CURRENT LIABILITIES | | | | |
| Advances from Affiliates | | $ | 126.8 | | | $ | 63.3 | |
| Accounts Payable: | | | | |
| General | | 202.2 | | | 225.8 | |
| Affiliated Companies | | 98.5 | | | 107.3 | |
Long-term Debt Due Within One Year – Nonaffiliated (December 31, 2024 and 2023 Amounts Include $79.0 and $81.4, Respectively, Related to DCC Fuel) | | 269.2 | | | 83.7 | |
| | | | |
| Customer Deposits | | 59.1 | | | 72.2 | |
| Accrued Taxes | | 102.2 | | | 104.7 | |
| Accrued Interest | | 41.3 | | | 41.3 | |
| | | | |
| Obligations Under Operating Leases | | 12.3 | | | 16.8 | |
| Regulatory Liability for Over-Recovered Fuel Costs | | 10.3 | | | 23.2 | |
| Other Current Liabilities | | 149.3 | | | 91.9 | |
| TOTAL CURRENT LIABILITIES | | 1,071.2 | | | 830.2 | |
| | | | |
| NONCURRENT LIABILITIES | | | | |
| Long-term Debt – Nonaffiliated | | 3,225.1 | | | 3,415.7 | |
| | | | |
| Deferred Income Taxes | | 1,175.8 | | | 1,169.9 | |
| Regulatory Liabilities and Deferred Investment Tax Credits | | 2,480.8 | | | 2,052.3 | |
| Asset Retirement Obligations | | 2,088.8 | | | 2,104.3 | |
| Obligations Under Operating Leases | | 40.1 | | | 37.7 | |
| Deferred Credits and Other Noncurrent Liabilities | | 57.2 | | | 57.7 | |
| TOTAL NONCURRENT LIABILITIES | | 9,067.8 | | | 8,837.6 | |
| | | | |
| TOTAL LIABILITIES | | 10,139.0 | | | 9,667.8 | |
| | | | |
| Rate Matters (Note 4) | | | | |
| Commitments and Contingencies (Note 6) | | | | |
| | | | |
| COMMON SHAREHOLDER’S EQUITY | | | | |
| Common Stock – No Par Value: | | | | |
| Authorized – 2,500,000 Shares | | | | |
| Outstanding – 1,400,000 Shares | | 56.6 | | | 56.6 | |
| Paid-in Capital | | 1,011.7 | | | 997.6 | |
| Retained Earnings | | 2,328.0 | | | 2,086.6 | |
| Accumulated Other Comprehensive Income (Loss) | | 0.2 | | | (0.6) | |
| TOTAL COMMON SHAREHOLDER’S EQUITY | | 3,396.5 | | | 3,140.2 | |
| | | | |
| TOTAL LIABILITIES AND COMMON SHAREHOLDER'S EQUITY | | $ | 13,535.5 | | | $ | 12,808.0 | |
| | | | |
See Notes to Financial Statements of Registrants beginning on page 177. |
INDIANA MICHIGAN POWER COMPANY AND SUBSIDIARIES
CONSOLIDATED STATEMENTS OF CASH FLOWS
For the Years Ended December 31, 2024, 2023 and 2022
(in millions)
| | | | | | | | | | | | | | | | | | | | |
| | Years Ended December 31, |
| | 2024 | | 2023 | | 2022 |
| OPERATING ACTIVITIES | | |
| Net Income | | $ | 391.4 | | | $ | 335.9 | | | $ | 324.7 | |
| Adjustments to Reconcile Net Income to Net Cash Flows from Operating Activities: | | | | | | |
| Depreciation and Amortization | | 481.1 | | | 470.0 | | | 527.2 | |
| | | | | | |
| Deferred Income Taxes | | (117.0) | | | (54.1) | | | (45.1) | |
| Amortization (Deferral) of Incremental Nuclear Refueling Outage Expenses, Net | | 12.6 | | | 25.6 | | | (49.2) | |
| Asset Impairment and Other Related Charges | | 13.4 | | | — | | | — | |
| | | | | | |
| Allowance for Equity Funds Used During Construction | | (13.3) | | | (10.9) | | | (9.8) | |
| Mark-to-Market of Risk Management Contracts | | 19.8 | | | (22.2) | | | (16.9) | |
| Amortization of Nuclear Fuel | | 102.9 | | | 96.6 | | | 82.9 | |
| | | | | | |
| Deferred Fuel Over/Under-Recovery, Net | | (8.7) | | | 55.5 | | | (42.2) | |
| | | | | | |
| Change in Other Noncurrent Assets | | (16.9) | | | (80.3) | | | (47.3) | |
| Change in Other Noncurrent Liabilities | | 40.0 | | | 47.6 | | | 62.4 | |
| Changes in Certain Components of Working Capital: | | | | | | |
| Accounts Receivable, Net | | (23.1) | | | 71.4 | | | (82.7) | |
| Fuel, Materials and Supplies | | 0.7 | | | (61.4) | | | (2.6) | |
| Accounts Payable | | (45.3) | | | 22.5 | | | 37.3 | |
| | | | | | |
| Accrued Taxes, Net | | (2.5) | | | 1.5 | | | 9.4 | |
| | | | | | |
| | | | | | |
| Other Current Assets | | 1.5 | | | (6.2) | | | 19.5 | |
| Other Current Liabilities | | 32.3 | | | (11.6) | | | (46.9) | |
| Net Cash Flows from Operating Activities | | 868.9 | | | 879.9 | | | 720.7 | |
| | | | | | |
| INVESTING ACTIVITIES | | | | | | |
| Construction Expenditures | | (583.0) | | | (550.3) | | | (557.8) | |
| Change in Advances to Affiliates, Net | | — | | | 23.0 | | | (1.5) | |
| Purchases of Investment Securities | | (2,902.4) | | | (2,845.1) | | | (2,765.4) | |
| Sales of Investment Securities | | 2,851.2 | | | 2,787.5 | | | 2,713.6 | |
| Acquisitions of Nuclear Fuel | | (139.9) | | | (128.2) | | | (100.7) | |
| | | | | | |
| Other Investing Activities | | 6.4 | | | 6.1 | | | 10.3 | |
| Net Cash Flows Used for Investing Activities | | (767.7) | | | (707.0) | | | (701.5) | |
| | | | | | |
| FINANCING ACTIVITIES | | | | | | |
| Capital Contribution from Parent | | 15.9 | | | 8.8 | | | 7.9 | |
| Return of Capital to Parent | | (1.8) | | | — | | | — | |
| Issuance of Long-term Debt - Nonaffiliated | | 80.4 | | | 565.3 | | | 142.7 | |
| Change in Advances from Affiliates, Net | | 63.5 | | | (186.6) | | | 156.6 | |
| Retirement of Long-term Debt - Nonaffiliated | | (103.4) | | | (343.3) | | | (83.4) | |
| | | | | | |
| Principal Payments for Finance Lease Obligations | | (7.1) | | | (7.4) | | | (130.7) | |
| Dividends Paid on Common Stock | | (150.0) | | | (212.5) | | | (110.0) | |
| Other Financing Activities | | 0.7 | | | 0.7 | | | 0.6 | |
| Net Cash Flows Used for Financing Activities | | (101.8) | | | (175.0) | | | (16.3) | |
| | | | | | |
| Net Increase (Decrease) in Cash and Cash Equivalents | | (0.6) | | | (2.1) | | | 2.9 | |
| Cash and Cash Equivalents at Beginning of Period | | 2.1 | | | 4.2 | | | 1.3 | |
| Cash and Cash Equivalents at End of Period | | $ | 1.5 | | | $ | 2.1 | | | $ | 4.2 | |
| | | | | | |
| SUPPLEMENTARY INFORMATION | | | | | | |
| Cash Paid for Interest, Net of Capitalized Amounts | | $ | 144.1 | | | $ | 131.6 | | | $ | 120.9 | |
| Net Cash Paid for Income Taxes | | 24.0 | | | 109.0 | | | 10.1 | |
| Noncash Acquisitions Under Finance Leases | | 1.3 | | | 4.8 | | | 2.2 | |
| Construction Expenditures Included in Current Liabilities as of December 31, | | 77.2 | | | 67.8 | | | 71.9 | |
| Acquisition of Nuclear Fuel Included in Current Liabilities as of December 31, | | 23.5 | | | 24.2 | | | — | |
| | | | | | |
| | | | | | |
See Notes to Financial Statements of Registrants beginning on page 177. |
OHIO POWER COMPANY AND SUBSIDIARIES
MANAGEMENT’S NARRATIVE DISCUSSION AND ANALYSIS OF RESULTS OF OPERATIONS
RESULTS OF OPERATIONS
KWh Sales/Degree Days
| | | | | | | | | | | | | | | | | |
| Summary of KWh Energy Sales |
| | | | | |
| Years Ended December 31, |
| 2024 | | 2023 | | 2022 |
| (in millions of KWhs) |
| Retail: | | | | | |
| Residential | 14,128 | | | 13,440 | | | 14,430 | |
| Commercial | 20,295 | | | 16,870 | | | 16,013 | |
| Industrial | 14,121 | | | 13,899 | | | 14,088 | |
| Miscellaneous | 108 | | | 109 | | | 110 | |
| Total Retail (a) | 48,652 | | | 44,318 | | | 44,641 | |
| | | | | |
| Wholesale (b) | 2,014 | | | 1,922 | | | 2,198 | |
| | | | | |
| Total KWhs | 50,666 | | | 46,240 | | | 46,839 | |
(a)Represents energy delivered to distribution customers.
(b)Primarily Ohio’s contractually obligated purchases of OVEC power sold into PJM.
Heating degree days and cooling degree days are metrics commonly used in the utility industry as a measure of the impact of weather on revenues.
| | | | | | | | | | | | | | | | | |
| Summary of Heating and Cooling Degree Days |
| | | | | |
| Years Ended December 31, |
| 2024 | | 2023 | | 2022 |
| (in degree days) |
| Actual – Heating (a) | 2,446 | | | 2,380 | | | 3,116 | |
| Normal – Heating (b) | 3,140 | | | 3,185 | | | 3,185 | |
| | | | | |
| Actual – Cooling (c) | 1,300 | | | 842 | | | 1,121 | |
| Normal – Cooling (b) | 1,031 | | | 1,026 | | | 1,011 | |
(a)Heating degree days are calculated on a 55 degree temperature base.
(b)Normal Heating/Cooling represents the thirty-year average of degree days.
(c)Cooling degree days are calculated on a 65 degree temperature base.
Ohio Power Company and Subsidiaries
Reconciliation of Year Ended December 31, 2023 to Year Ended December 31, 2024
Net Income
(in millions)
| | | | | | | | |
| Year Ended December 31, 2023 | | $ | 328.2 | |
| | |
| Changes in Revenues: | | |
| Retail Revenues | | (8.7) | |
| Off-system Sales | | (7.9) | |
| Transmission Revenues | | 1.0 | |
| Other Revenues | | 32.0 | |
| Total Change in Revenues | | 16.4 | |
| | |
| Changes in Expenses and Other: | | |
| Purchased Electricity for Resale | | 316.7 | |
| Purchased Electricity from AEP Affiliates | | (11.0) | |
| Other Operation and Maintenance | | (151.4) | |
| Asset Impairments and Other Related Charges | | (52.9) | |
| Depreciation and Amortization | | (69.8) | |
| Taxes Other Than Income Taxes | | (52.9) | |
| | |
| Other Income | | 3.0 | |
| Allowance for Equity Funds Used During Construction | | 6.3 | |
| Non-Service Cost Components of Net Periodic Benefit Cost | | (10.7) | |
| Interest Expense | | (17.1) | |
| Total Change in Expenses and Other | | (39.8) | |
| | |
| Income Tax Expense | | 1.9 | |
| Equity Earnings of Unconsolidated Subsidiaries | | (1.1) | |
| | |
| Year Ended December 31, 2024 | | $ | 305.6 | |
The major components of the increase in Revenues were as follows:
•Retail Revenues decreased $9 million primarily due to the following:
•A $387 million decrease due to lower prices and lower customer participation in OPCo’s SSO.
This decrease was partially offset by:
•A $332 million increase in rider revenues.
•A $41 million increase in weather-related usage driven by a 54% increase in cooling degree days and a 3% increase in heating degree days.
•Off-system Sales decreased $8 million primarily due to 2023 PJM settlements related to winter storm Elliott.
•Other Revenues increased $32 million primarily due to the following:
•A $47 million increase due to third-party Legacy Generation Resource Rider revenue related to the recovery of OVEC costs.
This increase was partially offset by:
•A $20 million decrease in recoverable sales of renewable energy credits.
Expenses and Other changed between years as follows:
•Purchased Electricity for Resale expenses decreased $317 million primarily due to the following:
•A $398 million decrease in recoverable auction purchases primarily due to lower prices and lower volumes driven by lower customer participation in OPCo’s SSO.
•A $28 million decrease in recoverable alternative energy rider expenses.
These decreases were partially offset by:
•A $110 million increase in recoverable OVEC costs.
•Purchased Electricity from AEP Affiliates expenses increased $11 million primarily due to increased recoverable purchases in OPCo’s SSO auction.
•Other Operation and Maintenance expenses increased $151 million primarily due to the following:
•An $84 million increase in transmission expenses primarily due to an increase in recoverable PJM expenses.
•A $33 million increase in distribution expenses primarily due to recoverable storm restoration costs and recoverable vegetation management expenses.
•A $15 million increase in employee-related expenses due to the voluntary severance program that occurred in the second quarter of 2024.
•A $14 million increase related to recoverable energy assistance program expenses for qualified Ohio customers.
•Asset Impairments and Other Related Charges increased $53 million primarily due to the Federal EPA’s revised CCR rules.
•Depreciation and Amortization expenses increased $70 million primarily due to a higher depreciable base and an increase in recoverable rider depreciable assets.
•Taxes Other Than Income Taxes increased $53 million primarily due to the following:
•A $42 million increase due to higher property taxes driven by additional investments in transmission and distribution assets and tax rate changes.
•An $11 million increase in state excise taxes due to increased billed KWhs in 2024 resulting in a higher tax burden.
•Allowance for Equity Funds Used During Construction increased $6 million primarily due to an increase in AFUDC base and equity rates.
•Non-Service Cost Components of Net Periodic Benefit Cost increased $11 million primarily due to a plan remeasurement triggered by settlements related to the voluntary severance program.
•Interest Expense increased $17 million primarily due to higher debt balances and interest rates.
REPORT OF INDEPENDENT REGISTERED PUBLIC ACCOUNTING FIRM
To the Board of Directors and Shareholder of
Ohio Power Company
Opinion on the Financial Statements
We have audited the accompanying consolidated balance sheets of Ohio Power Company and its subsidiaries (the "Company") as of December 31, 2024 and 2023, and the related consolidated statements of income, of changes in common shareholder's equity and of cash flows for each of the three years in the period ended December 31, 2024, including the related notes (collectively referred to as the "consolidated financial statements"). In our opinion, the consolidated financial statements present fairly, in all material respects, the financial position of the Company as of December 31, 2024 and 2023, and the results of its operations and its cash flows for each of the three years in the period ended December 31, 2024 in conformity with accounting principles generally accepted in the United States of America.
Basis for Opinion
These consolidated financial statements are the responsibility of the Company’s management. Our responsibility is to express an opinion on the Company’s consolidated financial statements based on our audits. We are a public accounting firm registered with the Public Company Accounting Oversight Board (United States) (PCAOB) and are required to be independent with respect to the Company in accordance with the U.S. federal securities laws and the applicable rules and regulations of the Securities and Exchange Commission and the PCAOB.
We conducted our audits of these consolidated financial statements in accordance with the standards of the PCAOB. Those standards require that we plan and perform the audits to obtain reasonable assurance about whether the consolidated financial statements are free of material misstatement, whether due to error or fraud. The Company is not required to have, nor were we engaged to perform, an audit of its internal control over financial reporting. As part of our audits we are required to obtain an understanding of internal control over financial reporting but not for the purpose of expressing an opinion on the effectiveness of the Company's internal control over financial reporting. Accordingly, we express no such opinion.
Our audits included performing procedures to assess the risks of material misstatement of the consolidated financial statements, whether due to error or fraud, and performing procedures that respond to those risks. Such procedures included examining, on a test basis, evidence regarding the amounts and disclosures in the consolidated financial statements. Our audits also included evaluating the accounting principles used and significant estimates made by management, as well as evaluating the overall presentation of the consolidated financial statements. We believe that our audits provide a reasonable basis for our opinion.
Critical Audit Matters
The critical audit matters communicated below are matters arising from the current period audit of the consolidated financial statements that were communicated or required to be communicated to the audit committee and that (i) relate to accounts or disclosures that are material to the consolidated financial statements and (ii) involved our especially challenging, subjective, or complex judgments. The communication of critical audit matters does not alter in any way our opinion on the consolidated financial statements, taken as a whole, and we are not, by communicating the critical audit matters below, providing separate opinions on the critical audit matters or on the accounts or disclosures to which they relate.
Accounting for the Effects of Cost-Based Regulation
As described in Notes 1 and 5 to the consolidated financial statements, the Company's consolidated financial statements reflect the actions of regulators that result in the recognition of certain revenues and expenses in different time periods than enterprises that are not rate-regulated. Regulatory assets (deferred expenses to be recovered in the future) and regulatory liabilities (deferred future revenue reductions or refunds) are recorded to reflect the economic effects of regulation in the same accounting period by matching expenses with their recovery through regulated revenues and matching income with its passage to customers in cost-based regulated rates. As of December 31, 2024, there were $379 million of deferred costs included in regulatory assets, $1 million of which were pending final regulatory approval, and $988 million of regulatory liabilities awaiting potential refund or future rate reduction, $73 million of which were pending final regulatory determination. Management reviews the probability of recovery of regulatory assets and refund of regulatory liabilities at each balance sheet date and whenever new events occur, such as changes in the regulatory environment, issuance of regulatory commission orders, or passage of new legislation.
The principal considerations for our determination that performing procedures relating to the accounting for the effects of cost-based regulation is a critical audit matter are (i) the significant judgment by management in assessing probability of the recovery of regulatory assets and refund of regulatory liabilities and (ii) a high degree of auditor judgment, subjectivity, and
effort in performing procedures and evaluating audit evidence related to the probability of recovery of regulatory assets and refund of regulatory liabilities.
Addressing the matter involved performing procedures and evaluating audit evidence in connection with forming our overall opinion on the consolidated financial statements. These procedures included testing the effectiveness of controls relating to management's evaluation of new events, such as changes in the regulatory environment, issuance of regulatory commission orders, or passage of new legislation, including controls over the probability of recovery of regulatory assets and refund of regulatory liabilities. These procedures also included, among others (i) evaluating the reasonableness of management's assessment of probability of future recovery for regulatory assets and refund of regulatory liabilities; (ii) testing, on a sample basis, the regulatory assets and liabilities, including those subject to pending rate cases and regulatory proceedings, by considering (a) the provisions and formulas outlined in rate orders; (b) other regulatory correspondence; and (c) application of relevant regulatory precedents.
Incremental Asset Retirement Obligations arising from the Federal Environment Protection Agency’s (“Federal EPA”) Revised Coal Combustion Residuals (CCR) Rule
As described in Notes 1 and 6 to the consolidated financial statements, in April 2024, the Federal EPA finalized revisions to the CCR Rule to expand the scope of the rule to include inactive impoundments at inactive facilities (“legacy CCR surface impoundments”) as well as to establish requirements for currently exempt solid waste management units that involve the direct placement of CCR on the land (“CCR management units”). The Federal EPA is requiring that owners and operators of legacy surface impoundments comply with all of the existing CCR Rule requirements applicable to inactive CCR surface impoundments at active facilities, except for the location restrictions and liner design criteria. Management evaluated the applicability of the rule to current and former plant sites and recorded incremental asset retirement obligations (AROs) based on initial cost estimates primarily reflecting compliance with the rule through closure in place and future groundwater monitoring requirements pursuant to the revised CCR Rule. As disclosed by management, accounting for the incremental ARO arising from the revised CCR Rule requires significant judgment by management due to the significant measurement uncertainty in estimating the incremental liability. As further groundwater monitoring and other analysis is performed, management expects to refine the assumptions and underlying cost estimates used in recording the incremental ARO arising from the revised CCR Rule. The estimated liability can significantly change if there are changes in the impacted coal ash site acreage inputs or if refinements in the assumptions over the remediation costs for legacy CCR surface impoundments and CCR management units, including assumptions over future groundwater monitoring requirements vary from the initial estimates. As a result of the rule, the Company recorded an incremental ARO of $53 million in the second quarter of 2024.
The principal considerations for our determination that performing procedures relating to the incremental ARO arising from the revised CCR Rule is a critical audit matter are (i) the significant judgment by management when developing the estimate of the incremental ARO; (ii) a high degree of auditor judgment, subjectivity and effort in performing procedures and evaluating the impacted coal ash site acreage and management’s assumptions over the remediation costs for legacy CCR surface impoundments and CCR management units, including assumptions over future groundwater monitoring requirements (collectively “management’s assumptions”); and (iii) the audit effort involved the use of professionals with specialized skill and knowledge.
Addressing the matter involved performing procedures and evaluating audit evidence in connection with forming our overall opinion on the consolidated financial statements. These procedures included testing the effectiveness of controls relating to management’s assessment of the incremental ARO arising from the revised CCR Rule, including controls over the impacted coal ash site acreage and management’s assumptions used in the estimate of the incremental ARO. These procedures also included, among others, (i) testing the completeness and accuracy of data used, including the impacted coal ash site acreage, in the estimate of the incremental ARO; (ii) testing management’s process for determining estimate of the incremental ARO, and (iii) the involvement of professionals with specialized skill and knowledge to assist in (a) assessing the adequacy of the cost assessment of the incremental ARO in accordance with the remediation requirements outlined in the Federal EPA’s revised CCR rule, (b) evaluating the reasonableness of management’s process over measuring coal ash site acreage and (c) evaluating the reasonableness of management’s assumptions used in the estimate.
/s/ PricewaterhouseCoopers LLP
Columbus, Ohio
February 13, 2025
We have served as the Company's auditor since 2017.
MANAGEMENT’S REPORT ON INTERNAL CONTROL OVER FINANCIAL REPORTING
The management of Ohio Power Company and Subsidiaries (OPCo) is responsible for establishing and maintaining adequate internal control over financial reporting as such term is defined in Rule 13a-15(f) and 15d-15(f) under the Securities Exchange Act of 1934, as amended. OPCo’s internal control is a process designed to provide reasonable assurance regarding the reliability of financial reporting and the preparation of financial statements for external purposes in accordance with generally accepted accounting principles.
Because of its inherent limitations, internal control over financial reporting may not prevent or detect misstatements. Also, projections of any evaluation of effectiveness to future periods are subject to the risk that controls may become inadequate because of changes in conditions, or that the degree of compliance with the policies or procedures may deteriorate.
Management assessed the effectiveness of OPCo’s internal control over financial reporting as of December 31, 2024. In making this assessment, management used the criteria set forth by the Committee of Sponsoring Organizations of the Treadway Commission (COSO) in Internal Control – Integrated Framework (2013). Based on management’s assessment, management concluded OPCo’s internal control over financial reporting was effective as of December 31, 2024.
This annual report does not include an audit report from PricewaterhouseCoopers LLP, OPCo’s registered public accounting firm regarding internal control over financial reporting pursuant to the Securities and Exchange Commission rules that permit OPCo to provide only management’s report in this annual report.
OHIO POWER COMPANY AND SUBSIDIARIES
CONSOLIDATED STATEMENTS OF INCOME
For the Years Ended December 31, 2024, 2023 and 2022
(in millions)
| | | | | | | | | | | | | | | | | | | | |
| | Years Ended December 31, |
| | 2024 | | 2023 | | 2022 |
| REVENUES | | | | | | |
| Electricity, Transmission and Distribution | | $ | 3,793.0 | | | $ | 3,768.0 | | | $ | 3,635.3 | |
| Sales to AEP Affiliates | | 22.7 | | | 31.1 | | | 18.8 | |
| Other Revenues | | 12.1 | | | 12.3 | | | 11.0 | |
| TOTAL REVENUES | | 3,827.8 | | | 3,811.4 | | | 3,665.1 | |
| | | | | | |
| EXPENSES | | | | | | |
| Purchased Electricity for Resale | | 811.3 | | | 1,128.0 | | | 1,277.4 | |
| Purchased Electricity from AEP Affiliates | | 97.8 | | | 86.8 | | | 9.8 | |
| | | | | | |
| | | | | | |
| Other Operation | | 1,198.3 | | | 1,091.7 | | | 982.0 | |
| Maintenance | | 256.3 | | | 211.5 | | | 185.5 | |
| Asset Impairments and Other Related Charges | | 52.9 | | | — | | | — | |
| Depreciation and Amortization | | 386.0 | | | 316.2 | | | 294.3 | |
| Taxes Other Than Income Taxes | | 560.2 | | | 507.3 | | | 502.4 | |
| TOTAL EXPENSES | | 3,362.8 | | | 3,341.5 | | | 3,251.4 | |
| | | | | | |
| OPERATING INCOME | | 465.0 | | | 469.9 | | | 413.7 | |
| | | | | | |
| Other Income (Expense): | | | | | | |
| | | | | | |
| Other Income | | 3.4 | | | 0.4 | | | 1.3 | |
| Allowance for Equity Funds Used During Construction | | 23.4 | | | 17.1 | | | 13.9 | |
| Non-Service Cost Components of Net Periodic Benefit Cost | | 15.3 | | | 26.0 | | | 22.1 | |
| | | | | | |
| Interest Expense | | (148.0) | | | (130.9) | | | (119.6) | |
| INCOME BEFORE INCOME TAX EXPENSE AND EQUITY EARNINGS (LOSS) | | 359.1 | | | 382.5 | | | 331.4 | |
| | | | | | |
| Income Tax Expense | | 52.4 | | | 54.3 | | | 44.2 | |
| Equity Earnings (Loss) of Unconsolidated Subsidiaries | | (1.1) | | | — | | | 0.6 | |
| | | | | | |
| NET INCOME | | $ | 305.6 | | | $ | 328.2 | | | $ | 287.8 | |
| | | | | | |
| The common stock of OPCo is wholly-owned by Parent. |
| | | | | | |
See Notes to Financial Statements of Registrants beginning on page 177. |
OHIO POWER COMPANY AND SUBSIDIARIES
CONSOLIDATED STATEMENTS OF CHANGES IN COMMON SHAREHOLDER’S EQUITY
For the Years Ended December 31, 2024, 2023 and 2022
(in millions)
| | | | | | | | | | | | | | | | | | | | | | | | | |
| Common
Stock | | Paid-in
Capital | | Retained Earnings | | | | Total |
| TOTAL COMMON SHAREHOLDER’S EQUITY – DECEMBER 31, 2021 | $ | 321.2 | | | $ | 838.8 | | | $ | 1,686.3 | | | | | $ | 2,846.3 | |
| | | | | | | | | |
| Capital Contribution from Parent | | | 1.0 | | | | | | | 1.0 | |
| Return of Capital to Parent | | | (2.0) | | | | | | | (2.0) | |
| Common Stock Dividends | | | | | (45.0) | | | | | (45.0) | |
| Net Income | | | | | 287.8 | | | | | 287.8 | |
| | | | | | | | | |
| TOTAL COMMON SHAREHOLDER’S EQUITY – DECEMBER 31, 2022 | 321.2 | | | 837.8 | | | 1,929.1 | | | | | 3,088.1 | |
| | | | | | | | | |
| Capital Contribution from Parent | | | 175.0 | | | | | | | 175.0 | |
| | | | | | | | | |
| Common Stock Dividends | | | | | (20.0) | | | | | (20.0) | |
| Net Income | | | | | 328.2 | | | | | 328.2 | |
| | | | | | | | | |
| TOTAL COMMON SHAREHOLDER’S EQUITY – DECEMBER 31, 2023 | 321.2 | | | 1,012.8 | | | 2,237.3 | | | | | 3,571.3 | |
| | | | | | | | | |
| Capital Contribution from Parent | | | 7.2 | | | | | | | 7.2 | |
| | | | | | | | | |
| | | | | | | | | |
| Net Income | | | | | 305.6 | | | | | 305.6 | |
| | | | | | | | | |
| TOTAL COMMON SHAREHOLDER’S EQUITY – DECEMBER 31, 2024 | $ | 321.2 | | | $ | 1,020.0 | | | $ | 2,542.9 | | | | | $ | 3,884.1 | |
| | | | | | | | | |
See Notes to Financial Statements of Registrants beginning on page 177. |
OHIO POWER COMPANY AND SUBSIDIARIES
CONSOLIDATED BALANCE SHEETS
ASSETS
December 31, 2024 and 2023
(in millions)
| | | | | | | | | | | | | | |
| | December 31, |
| | 2024 | | 2023 |
| CURRENT ASSETS | | | | |
| Cash and Cash Equivalents | | $ | 4.5 | | | $ | 6.4 | |
| | | | |
| Advances to Affiliates | | 114.9 | | | — | |
| Accounts Receivable: | | | | |
| Customers | | 189.2 | | | 39.2 | |
| Affiliated Companies | | 117.5 | | | 129.2 | |
| Accrued Unbilled Revenues | | 31.1 | | | — | |
| Miscellaneous | | 8.6 | | | 2.3 | |
| | | | |
| Total Accounts Receivable | | 346.4 | | | 170.7 | |
| Materials and Supplies | | 141.4 | | | 175.0 | |
| Renewable Energy Credits | | — | | | 8.9 | |
| | | | |
| | | | |
| Prepayments and Other Current Assets | | 19.9 | | | 16.8 | |
| TOTAL CURRENT ASSETS | | 627.1 | | | 377.8 | |
| | | | |
| PROPERTY, PLANT AND EQUIPMENT | | | | |
| Electric: | | | | |
| Transmission | | 3,663.9 | | | 3,395.1 | |
| Distribution | | 7,244.0 | | | 6,839.4 | |
| Other Property, Plant and Equipment | | 1,256.0 | | | 1,125.0 | |
| Construction Work in Progress | | 691.1 | | | 654.0 | |
| Total Property, Plant and Equipment | | 12,855.0 | | | 12,013.5 | |
| Accumulated Depreciation and Amortization | | 2,883.9 | | | 2,713.6 | |
| TOTAL PROPERTY, PLANT AND EQUIPMENT – NET | | 9,971.1 | | | 9,299.9 | |
| | | | |
| OTHER NONCURRENT ASSETS | | | | |
| Regulatory Assets | | 379.1 | | | 455.0 | |
| | | | |
| | | | |
| Operating Lease Assets | | 60.4 | | | 69.9 | |
| Deferred Charges and Other Noncurrent Assets | | 661.0 | | | 641.1 | |
| TOTAL OTHER NONCURRENT ASSETS | | 1,100.5 | | | 1,166.0 | |
| | | | |
| TOTAL ASSETS | | $ | 11,698.7 | | | $ | 10,843.7 | |
| | | | |
See Notes to Financial Statements of Registrants beginning on page 177. |
OHIO POWER COMPANY AND SUBSIDIARIES
CONSOLIDATED BALANCE SHEETS
LIABILITIES AND COMMON SHAREHOLDER’S EQUITY
December 31, 2024 and 2023
(dollars in millions)
| | | | | | | | | | | | | | |
| | December 31, |
| | 2024 | | 2023 |
| CURRENT LIABILITIES | | | | |
| Advances from Affiliates | | $ | — | | | $ | 110.5 | |
| Accounts Payable: | | | | |
| General | | 343.6 | | | 320.7 | |
| Affiliated Companies | | 204.9 | | | 154.2 | |
| | | | |
| Risk Management Liabilities | | 7.3 | | | 6.8 | |
| Customer Deposits | | 108.1 | | | 62.0 | |
| Accrued Taxes | | 836.1 | | | 763.3 | |
| | | | |
| Obligations Under Operating Leases | | 12.3 | | | 13.5 | |
| Other Current Liabilities | | 182.2 | | | 183.3 | |
| TOTAL CURRENT LIABILITIES | | 1,694.5 | | | 1,614.3 | |
| | | | |
| NONCURRENT LIABILITIES | | | | |
| Long-term Debt – Nonaffiliated | | 3,715.7 | | | 3,366.8 | |
| Long-term Risk Management Liabilities | | 40.2 | | | 43.9 | |
| Deferred Income Taxes | | 1,201.1 | | | 1,152.7 | |
| Regulatory Liabilities and Deferred Investment Tax Credits | | 987.7 | | | 1,003.6 | |
| | | | |
| Obligations Under Operating Leases | | 48.4 | | | 56.7 | |
| Deferred Credits and Other Noncurrent Liabilities | | 127.0 | | | 34.4 | |
| TOTAL NONCURRENT LIABILITIES | | 6,120.1 | | | 5,658.1 | |
| | | | |
| TOTAL LIABILITIES | | 7,814.6 | | | 7,272.4 | |
| | | | |
| Rate Matters (Note 4) | | | | |
| Commitments and Contingencies (Note 6) | | | | |
| | | | |
| COMMON SHAREHOLDER'S EQUITY | | | | |
| Common Stock – No Par Value: | | | | |
| Authorized – 40,000,000 Shares | | | | |
| Outstanding – 27,952,473 Shares | | 321.2 | | | 321.2 | |
| Paid-in Capital | | 1,020.0 | | | 1,012.8 | |
| Retained Earnings | | 2,542.9 | | | 2,237.3 | |
| | | | |
| TOTAL COMMON SHAREHOLDER’S EQUITY | | 3,884.1 | | | 3,571.3 | |
| | | | |
| TOTAL LIABILITIES AND COMMON SHAREHOLDER'S EQUITY | | $ | 11,698.7 | | | $ | 10,843.7 | |
| | | | |
See Notes to Financial Statements of Registrants beginning on page 177. |
OHIO POWER COMPANY AND SUBSIDIARIES
CONSOLIDATED STATEMENTS OF CASH FLOWS
For the Years Ended December 31, 2024, 2023 and 2022
(in millions)
| | | | | | | | | | | | | | | | | | | | |
| | Years Ended December 31, |
| | 2024 | | 2023 | | 2022 |
| OPERATING ACTIVITIES | | | | | | |
| Net Income | | $ | 305.6 | | | $ | 328.2 | | | $ | 287.8 | |
| Adjustments to Reconcile Net Income to Net Cash Flows from Operating Activities: | | | | | | |
| Depreciation and Amortization | | 386.0 | | | 316.2 | | | 294.3 | |
| | | | | | |
| | | | | | |
| Deferred Income Taxes | | 7.8 | | | 7.9 | | | 71.5 | |
| Asset Impairments and Other Related Charges | | 52.9 | | | — | | | — | |
| | | | | | |
| Allowance for Equity Funds Used During Construction | | (23.4) | | | (17.1) | | | (13.9) | |
| Mark-to-Market of Risk Management Contracts | | (3.2) | | | 11.0 | | | (52.8) | |
| | | | | | |
| Property Taxes | | (24.5) | | | (11.5) | | | (20.0) | |
| | | | | | |
| | | | | | |
| | | | | | |
| Change in Regulatory Assets | | 45.4 | | | (90.9) | | | 30.4 | |
| Change in Other Noncurrent Assets | | (37.8) | | | (137.5) | | | (87.1) | |
| Change in Other Noncurrent Liabilities | | 57.9 | | | (0.4) | | | 91.1 | |
| Changes in Certain Components of Working Capital: | | | | | | |
| Accounts Receivable, Net | | (169.8) | | | 72.8 | | | (83.7) | |
| Materials and Supplies | | 54.8 | | | (6.9) | | | (23.4) | |
| Accounts Payable | | 6.7 | | | 23.6 | | | 112.7 | |
| Accrued Taxes, Net | | 75.9 | | | 27.5 | | | 27.8 | |
| Other Current Assets | | (7.2) | | | 0.4 | | | 11.2 | |
| Other Current Liabilities | | 43.1 | | | (61.0) | | | 40.2 | |
| Net Cash Flows from Operating Activities | | 770.2 | | | 462.3 | | | 686.1 | |
| | | | | | |
| INVESTING ACTIVITIES | | | | | | |
| Construction Expenditures | | (930.1) | | | (990.4) | | | (872.4) | |
| Change in Advances to Affiliates, Net | | (114.9) | | | — | | | 42.0 | |
| Other Investing Activities | | 34.0 | | | 41.0 | | | 27.9 | |
| Net Cash Flows Used for Investing Activities | | (1,011.0) | | | (949.4) | | | (802.5) | |
| | | | | | |
| FINANCING ACTIVITIES | | | | | | |
| Capital Contribution from Parent | | 7.2 | | | 175.0 | | | 1.0 | |
| Return of Capital to Parent | | — | | | — | | | (2.0) | |
| Issuance of Long-term Debt – Nonaffiliated | | 346.2 | | | 395.0 | | | — | |
| Change in Advances from Affiliates, Net | | (110.5) | | | (62.4) | | | 172.9 | |
| Retirement of Long-term Debt – Nonaffiliated | | — | | | (0.6) | | | (0.1) | |
| | | | | | |
| Principal Payments for Finance Lease Obligations | | (5.3) | | | (5.0) | | | (4.9) | |
| Dividends Paid on Common Stock | | — | | | (20.0) | | | (45.0) | |
| Other Financing Activities | | 1.3 | | | 1.9 | | | 1.1 | |
| Net Cash Flows from Financing Activities | | 238.9 | | | 483.9 | | | 123.0 | |
| | | | | | |
| Net Increase (Decrease) in Cash and Cash Equivalents | | (1.9) | | | (3.2) | | | 6.6 | |
| Cash and Cash Equivalents at Beginning of Period | | 6.4 | | | 9.6 | | | 3.0 | |
| Cash and Cash Equivalents at End of Period | | $ | 4.5 | | | $ | 6.4 | | | $ | 9.6 | |
| | | | | | |
| SUPPLEMENTARY INFORMATION | | | | | | |
| Cash Paid for Interest, Net of Capitalized Amounts | | $ | 138.8 | | | $ | 124.1 | | | $ | 113.4 | |
| Net Cash Paid (Received) for Income Taxes | | 18.9 | | | 38.9 | | | (19.7) | |
| Noncash Acquisitions Under Finance Leases | | 1.5 | | | 4.1 | | | 3.0 | |
| Construction Expenditures Included in Current Liabilities as of December 31, | | 157.9 | | | 97.7 | | | 109.7 | |
| | | | | | |
See Notes to Financial Statements of Registrants beginning on page 177. |
PUBLIC SERVICE COMPANY OF OKLAHOMA
MANAGEMENT’S NARRATIVE DISCUSSION AND ANALYSIS OF RESULTS OF OPERATIONS
RESULTS OF OPERATIONS
KWh Sales/Degree Days
| | | | | | | | | | | | | | | | | |
| Summary of KWh Energy Sales |
| | | | | |
| Years Ended December 31, |
| 2024 | | 2023 | | 2022 |
| (in millions of KWhs) |
| Retail: | | | | | |
| Residential | 6,293 | | | 6,138 | | | 6,618 | |
| Commercial | 5,673 | | | 5,190 | | | 5,153 | |
| Industrial | 5,882 | | | 5,932 | | | 6,073 | |
| Miscellaneous | 1,279 | | | 1,255 | | | 1,297 | |
| Total Retail | 19,127 | | | 18,515 | | | 19,141 | |
| | | | | |
| Wholesale (a) | 179 | | | 180 | | | 734 | |
| | | | | |
| Total KWhs | 19,306 | | | 18,695 | | | 19,875 | |
(a)Includes municipalities and cooperatives, unit power and other wholesale customers.
Heating degree days and cooling degree days are metrics commonly used in the utility industry as a measure of the impact of weather on revenues.
| | | | | | | | | | | | | | | | | |
| Summary of Heating and Cooling Degree Days |
| | | | | |
| Years Ended December 31, |
| 2024 | | 2023 | | 2022 |
| (in degree days) |
| Actual – Heating (a) | 1,311 | | | 1,405 | | | 1,893 | |
| Normal – Heating (b) | 1,727 | | | 1,750 | | | 1,736 | |
| | | | | |
| Actual – Cooling (c) | 2,450 | | | 2,330 | | | 2,559 | |
| Normal – Cooling (b) | 2,202 | | | 2,190 | | | 2,161 | |
(a)Heating degree days are calculated on a 55 degree temperature base.
(b)Normal Heating/Cooling represents the thirty-year average of degree days.
(c)Cooling degree days are calculated on a 65 degree temperature base.
Public Service Company of Oklahoma
Reconciliation of Year Ended December 31, 2023 to Year Ended December 31, 2024
Net Income
(in millions)
| | | | | | | | |
| Year Ended December 31, 2023 | | $ | 208.8 | |
| | |
| Changes in Revenues: | | |
| Retail Revenues (a) | | (151.3) | |
| | |
| Transmission Revenues | | 3.6 | |
| Other Revenues | | 17.1 | |
| Total Change in Revenues | | (130.6) | |
| | |
| Changes in Expenses and Other: | | |
| Purchased Electricity, Fuel and Other Consumables Used for Electric Generation | | 212.8 | |
| Other Operation and Maintenance | | (62.0) | |
| Depreciation and Amortization | | (16.7) | |
| Taxes Other Than Income Taxes | | (13.2) | |
| | |
| Allowance for Funds Used During Construction | | (1.0) | |
| Non-Service Cost Components of Net Periodic Benefit Cost | | (3.1) | |
| Interest Expense | | 8.3 | |
| Total Change in Expenses and Other | | 125.1 | |
| | |
| Income Tax Benefit | | 46.0 | |
| | |
| Year Ended December 31, 2024 | | $ | 249.3 | |
(a)Includes firm wholesale sales to municipals and cooperatives.
The major components of the decrease in Revenues were as follows:
•Retail Revenues decreased $151 million primarily due to the following:
•A $221 million decrease in fuel revenue primarily due to lower authorized fuel rates.
This decrease was partially offset by:
•A $66 million increase in base rate and rider revenues.
•A $7 million increase in weather-normalized revenues primarily in the commercial class.
•Other Revenues increased $17 million primarily due to revenues from a customer project to enhance transmission resiliency.
Expenses and Other and Income Tax Benefit changed between years as follows:
•Purchased Electricity, Fuel and Other Consumables Used for Electric Generation expenses decreased $213 million primarily due to the lower current year amortization of under-recovered fuel regulatory assets driven by lower authorized fuel rates.
•Other Operation and Maintenance expenses increased $62 million primarily due to the following:
•A $25 million increase in transmission expenses primarily due to the following:
•An $18 million increase in SPP expenses.
•A $9 million increase due to a FERC order which denied stand-alone treatment of NOLCs in transmission formula rates.
•A $13 million increase in expenses from a customer project to enhance transmission resiliency.
•A $10 million increase in employee-related expenses due to the voluntary severance program that occurred in the second quarter of 2024.
•Depreciation and Amortization expenses increased $17 million primarily due to a higher depreciable base, implementation of new rates and the amortization of regulatory assets related to NCWF.
•Taxes Other Than Income Taxes increased $13 million primarily due to an increase in property taxes.
•Interest Expense decreased $8 million primarily due to the recognition of debt carrying charges as a result of the IRS PLR received regarding the treatment of stand-alone NOLCs in retail rate making.
•Income Tax Benefit increased $46 million primarily due to a reduction in Excess ADIT regulatory liabilities as a result of the IRS PLR received regarding the treatment of stand-alone NOLCs in retail rate making.
REPORT OF INDEPENDENT REGISTERED PUBLIC ACCOUNTING FIRM
To the Board of Directors and Shareholder of
Public Service Company of Oklahoma
Opinion on the Financial Statements
We have audited the accompanying balance sheets of Public Service Company of Oklahoma (the "Company") as of December 31, 2024 and 2023, and the related statements of income, of comprehensive income (loss), of changes in common shareholder's equity and of cash flows for each of the three years in the period ended December 31, 2024, including the related notes (collectively referred to as the "financial statements"). In our opinion, the financial statements present fairly, in all material respects, the financial position of the Company as of December 31, 2024 and 2023, and the results of its operations and its cash flows for each of the three years in the period ended December 31, 2024 in conformity with accounting principles generally accepted in the United States of America.
Basis for Opinion
These financial statements are the responsibility of the Company’s management. Our responsibility is to express an opinion on the Company’s financial statements based on our audits. We are a public accounting firm registered with the Public Company Accounting Oversight Board (United States) (PCAOB) and are required to be independent with respect to the Company in accordance with the U.S. federal securities laws and the applicable rules and regulations of the Securities and Exchange Commission and the PCAOB.
We conducted our audits of these financial statements in accordance with the standards of the PCAOB. Those standards require that we plan and perform the audits to obtain reasonable assurance about whether the financial statements are free of material misstatement, whether due to error or fraud. The Company is not required to have, nor were we engaged to perform, an audit of its internal control over financial reporting. As part of our audits we are required to obtain an understanding of internal control over financial reporting but not for the purpose of expressing an opinion on the effectiveness of the Company's internal control over financial reporting. Accordingly, we express no such opinion.
Our audits included performing procedures to assess the risks of material misstatement of the financial statements, whether due to error or fraud, and performing procedures that respond to those risks. Such procedures included examining, on a test basis, evidence regarding the amounts and disclosures in the financial statements. Our audits also included evaluating the accounting principles used and significant estimates made by management, as well as evaluating the overall presentation of the financial statements. We believe that our audits provide a reasonable basis for our opinion.
Critical Audit Matters
The critical audit matters communicated below are matters arising from the current period audit of the financial statements that were communicated or required to be communicated to the audit committee and that (i) relate to accounts or disclosures that are material to the financial statements and (ii) involved our especially challenging, subjective, or complex judgments. The communication of critical audit matters does not alter in any way our opinion on the financial statements, taken as a whole, and we are not, by communicating the critical audit matters below, providing separate opinions on the critical audit matters or on the accounts or disclosures to which they relate.
Accounting for the Effects of Cost-Based Regulation
As described in Notes 1 and 5 to the financial statements, the Company's financial statements reflect the actions of regulators that result in the recognition of certain revenues and expenses in different time periods than enterprises that are not rate-regulated. Regulatory assets (deferred expenses to be recovered in the future) and regulatory liabilities (deferred future revenue reductions or refunds) are recorded to reflect the economic effects of regulation in the same accounting period by matching expenses with their recovery through regulated revenues and matching income with its passage to customers in cost-based regulated rates. As of December 31, 2024, there were $593 million of deferred costs included in regulatory assets, $30 million of which were pending final regulatory approval, and $690 million of regulatory liabilities awaiting potential refund or future rate reduction, $2 million of which were pending final regulatory determination. Management reviews the probability of recovery of regulatory assets and refund of regulatory liabilities at each balance sheet date and whenever new events occur, such as changes in the regulatory environment, issuance of regulatory commission orders, or passage of new legislation.
The principal considerations for our determination that performing procedures relating to the accounting for the effects of cost-based regulation is a critical audit matter are (i) the significant judgment by management in assessing probability of the recovery of regulatory assets and refund of regulatory liabilities and (ii) a high degree of auditor judgment, subjectivity, and
effort in performing procedures and evaluating audit evidence related to the probability of recovery of regulatory assets and refund of regulatory liabilities.
Addressing the matter involved performing procedures and evaluating audit evidence in connection with forming our overall opinion on the financial statements. These procedures included testing the effectiveness of controls relating to management's evaluation of new events, such as changes in the regulatory environment, issuance of regulatory commission orders, or passage of new legislation, including controls over the probability of recovery of regulatory assets and refund of regulatory liabilities. These procedures also included, among others (i) evaluating the reasonableness of management's assessment of probability of future recovery for regulatory assets and refund of regulatory liabilities; (ii) testing, on a sample basis, the regulatory assets and liabilities, including those subject to pending rate cases and regulatory proceedings, by considering (a) the provisions and formulas outlined in rate orders; (b) other regulatory correspondence; and (c) application of relevant regulatory precedents.
Incremental Asset Retirement Obligations arising from the Federal Environment Protection Agency’s (“Federal EPA”) Revised Coal Combustion Residuals (CCR) Rule
As described in Notes 1 and 6 to the financial statements, in April 2024, the Federal EPA finalized revisions to the CCR Rule to expand the scope of the rule to include inactive impoundments at inactive facilities (“legacy CCR surface impoundments”) as well as to establish requirements for currently exempt solid waste management units that involve the direct placement of CCR on the land (“CCR management units”). The Federal EPA is requiring that owners and operators of legacy surface impoundments comply with all of the existing CCR Rule requirements applicable to inactive CCR surface impoundments at active facilities, except for the location restrictions and liner design criteria. Management evaluated the applicability of the rule to current and former plant sites and recorded incremental asset retirement obligations (AROs) based on initial cost estimates primarily reflecting compliance with the rule through closure in place and future groundwater monitoring requirements pursuant to the revised CCR Rule. As disclosed by management, accounting for the incremental ARO arising from the revised CCR Rule requires significant judgment by management due to the significant measurement uncertainty in estimating the incremental liability. As further groundwater monitoring and other analysis is performed, management expects to refine the assumptions and underlying cost estimates used in recording the incremental ARO arising from the revised CCR Rule. The estimated liability can significantly change if there are changes in the impacted coal ash site acreage inputs or if refinements in the assumptions over the remediation costs for legacy CCR surface impoundments and CCR management units, including assumptions over future groundwater monitoring requirements vary from the initial estimates. As a result of the rule, the Company recorded an incremental ARO of $34 million in the second quarter of 2024.
The principal considerations for our determination that performing procedures relating to the incremental ARO arising from the revised CCR Rule is a critical audit matter are (i) the significant judgment by management when developing the estimate of the incremental ARO; (ii) a high degree of auditor judgment, subjectivity and effort in performing procedures and evaluating the impacted coal ash site acreage and management’s assumptions over the remediation costs for legacy CCR surface impoundments and CCR management units, including assumptions over future groundwater monitoring requirements (collectively “management’s assumptions”); and (iii) the audit effort involved the use of professionals with specialized skill and knowledge.
Addressing the matter involved performing procedures and evaluating audit evidence in connection with forming our overall opinion on the financial statements. These procedures included testing the effectiveness of controls relating to management’s assessment of the incremental ARO arising from the revised CCR Rule, including controls over the impacted coal ash site acreage and management’s assumptions used in the estimate of the incremental ARO. These procedures also included, among others, (i) testing the completeness and accuracy of data used, including the impacted coal ash site acreage, in the estimate of the incremental ARO; (ii) testing management’s process for determining estimate of the incremental ARO, and (iii) the involvement of professionals with specialized skill and knowledge to assist in (a) assessing the adequacy of the cost assessment of the incremental ARO in accordance with the remediation requirements outlined in the Federal EPA’s revised CCR rule, (b) evaluating the reasonableness of management’s process over measuring coal ash site acreage and (c) evaluating the reasonableness of management’s assumptions used in the estimate.
/s/ PricewaterhouseCoopers LLP
Columbus, Ohio
February 13, 2025
We have served as the Company's auditor since 2017.
MANAGEMENT’S REPORT ON INTERNAL CONTROL OVER FINANCIAL REPORTING
The management of Public Service Company of Oklahoma (PSO) is responsible for establishing and maintaining adequate internal control over financial reporting as such term is defined in Rule 13a-15(f) and 15d-15(f) under the Securities Exchange Act of 1934, as amended. PSO’s internal control is a process designed to provide reasonable assurance regarding the reliability of financial reporting and the preparation of financial statements for external purposes in accordance with generally accepted accounting principles.
Because of its inherent limitations, internal control over financial reporting may not prevent or detect misstatements. Also, projections of any evaluation of effectiveness to future periods are subject to the risk that controls may become inadequate because of changes in conditions, or that the degree of compliance with the policies or procedures may deteriorate.
Management assessed the effectiveness of PSO’s internal control over financial reporting as of December 31, 2024. In making this assessment, management used the criteria set forth by the Committee of Sponsoring Organizations of the Treadway Commission (COSO) in Internal Control – Integrated Framework (2013). Based on management’s assessment, management concluded PSO’s internal control over financial reporting was effective as of December 31, 2024.
This annual report does not include an audit report from PricewaterhouseCoopers LLP, PSO’s registered public accounting firm regarding internal control over financial reporting pursuant to the Securities and Exchange Commission rules that permit PSO to provide only management’s report in this annual report.
PUBLIC SERVICE COMPANY OF OKLAHOMA
STATEMENTS OF INCOME
For the Years Ended December 31, 2024, 2023 and 2022
(in millions)
| | | | | | | | | | | | | | | | | | | | |
| | Years Ended December 31, |
| | 2024 | | 2023 | | 2022 |
| REVENUES | | | | | | |
| Electric Generation, Transmission and Distribution | | $ | 1,820.0 | | | $ | 1,968.4 | | | $ | 1,865.6 | |
| Sales to AEP Affiliates | | 6.9 | | | 1.2 | | | 2.9 | |
| Other Revenues | | 19.5 | | | 7.4 | | | 6.2 | |
| TOTAL REVENUES | | 1,846.4 | | | 1,977.0 | | | 1,874.7 | |
| | | | | | |
| EXPENSES | | | | | | |
| Purchased Electricity, Fuel and Other Consumables Used for Electric Generation | | 742.5 | | | 955.3 | | | 891.5 | |
| | | | | | |
| | | | | | |
| Other Operation | | 416.8 | | | 355.8 | | | 400.4 | |
| Maintenance | | 113.0 | | | 112.0 | | | 114.4 | |
| Depreciation and Amortization | | 272.2 | | | 255.5 | | | 230.1 | |
| Taxes Other Than Income Taxes | | 77.3 | | | 64.1 | | | 57.5 | |
| TOTAL EXPENSES | | 1,621.8 | | | 1,742.7 | | | 1,693.9 | |
| | | | | | |
| OPERATING INCOME | | 224.6 | | | 234.3 | | | 180.8 | |
| | | | | | |
| Other Income (Expense): | | | | | | |
| Interest Income | | 1.8 | | | 1.8 | | | 7.4 | |
| | | | | | |
| Allowance for Equity Funds Used During Construction | | 7.4 | | | 8.4 | | | 1.5 | |
| Non-Service Cost Components of Net Periodic Benefit Cost | | 11.2 | | | 14.3 | | | 12.5 | |
| Interest Expense | | (95.3) | | | (103.6) | | | (83.8) | |
| | | | | | |
| INCOME BEFORE INCOME TAX EXPENSE (BENEFIT) | | 149.7 | | | 155.2 | | | 118.4 | |
| | | | | | |
| Income Tax Expense (Benefit) | | (99.6) | | | (53.6) | | | (49.2) | |
| | | | | | |
| NET INCOME | | $ | 249.3 | | | $ | 208.8 | | | $ | 167.6 | |
| | | | | | |
| The common stock of PSO is wholly-owned by Parent. |
| | | | | | |
See Notes to Financial Statements of Registrants beginning on page 177. |
PUBLIC SERVICE COMPANY OF OKLAHOMA
STATEMENTS OF COMPREHENSIVE INCOME (LOSS)
For the Years Ended December 31, 2024, 2023 and 2022
(in millions)
| | | | | | | | | | | | | | | | | | | | |
| | Years Ended December 31, |
| | 2024 | | 2023 | | 2022 |
| Net Income | | $ | 249.3 | | | $ | 208.8 | | | $ | 167.6 | |
| | | | | | |
| OTHER COMPREHENSIVE INCOME (LOSS), NET OF TAXES | | | | | | |
| Cash Flow Hedges, Net of Tax of $1.0, $(0.4) and $0.3 in 2024, 2023 and 2022, Respectively | | 3.8 | | | (1.5) | | | 1.3 | |
| | | | | | |
| TOTAL COMPREHENSIVE INCOME | | $ | 253.1 | | | $ | 207.3 | | | $ | 168.9 | |
| | | | | | |
See Notes to Financial Statements of Registrants beginning on page 177. |
PUBLIC SERVICE COMPANY OF OKLAHOMA
STATEMENTS OF CHANGES IN COMMON SHAREHOLDER’S EQUITY
For the Years Ended December 31, 2024, 2023 and 2022
(in millions)
| | | | | | | | | | | | | | | | | | | | | | | | | | | | | |
| Common
Stock | | Paid-in
Capital | | Retained Earnings | | Accumulated
Other
Comprehensive
Income (Loss) | | Total |
| TOTAL COMMON SHAREHOLDER’S EQUITY – DECEMBER 31, 2021 | $ | 157.2 | | | $ | 1,039.0 | | | $ | 1,095.4 | | | $ | — | | | $ | 2,291.6 | |
| | | | | | | | | |
| Capital Contribution from Parent | | | 3.6 | | | | | | | 3.6 | |
| Common Stock Dividends | | | | | (45.0) | | | | | (45.0) | |
| | | | | | | | | |
| Net Income | | | | | 167.6 | | | | | 167.6 | |
| Other Comprehensive Income | | | | | | | 1.3 | | | 1.3 | |
| TOTAL COMMON SHAREHOLDER’S EQUITY – DECEMBER 31, 2022 | 157.2 | | | 1,042.6 | | | 1,218.0 | | | 1.3 | | | 2,419.1 | |
| | | | | | | | | |
| Capital Contribution from Parent | | | 0.6 | | | | | | | 0.6 | |
| Return of Capital to Parent | | | (3.9) | | | | | | | (3.9) | |
| Common Stock Dividends | | | | | (52.5) | | | | | (52.5) | |
| Net Income | | | | | 208.8 | | | | | 208.8 | |
| Other Comprehensive Loss | | | | | | | (1.5) | | | (1.5) | |
| TOTAL COMMON SHAREHOLDER’S EQUITY – DECEMBER 31, 2023 | 157.2 | | | 1,039.3 | | | 1,374.3 | | | (0.2) | | | 2,570.6 | |
| | | | | | | | | |
| Capital Contribution from Parent | | | 1.9 | | | | | | | 1.9 | |
| | | | | | | | | |
| Common Stock Dividends | | | | | (140.0) | | | | | (140.0) | |
| | | | | | | | | |
| Net Income | | | | | 249.3 | | | | | 249.3 | |
| Other Comprehensive Income | | | | | | | 3.8 | | | 3.8 | |
| TOTAL COMMON SHAREHOLDER’S EQUITY – DECEMBER 31, 2024 | $ | 157.2 | | | $ | 1,041.2 | | | $ | 1,483.6 | | | $ | 3.6 | | | $ | 2,685.6 | |
| | | | | | | | | |
See Notes to Financial Statements of Registrants beginning on page 177. |
PUBLIC SERVICE COMPANY OF OKLAHOMA
BALANCE SHEETS
ASSETS
December 31, 2024 and 2023
(in millions)
| | | | | | | | | | | | | | |
| | December 31, |
| | 2024 | | 2023 |
| CURRENT ASSETS | | | | |
| Cash and Cash Equivalents | | $ | 1.8 | | | $ | 2.5 | |
| Advances to Affiliates | | 232.0 | | | — | |
| Accounts Receivable: | | | | |
| Customers | | 74.8 | | | 107.6 | |
| Affiliated Companies | | 32.6 | | | 31.0 | |
| Miscellaneous | | 0.3 | | | 0.8 | |
| | | | |
| Total Accounts Receivable | | 107.7 | | | 139.4 | |
| Fuel | | 17.1 | | | 33.7 | |
| Materials and Supplies | | 108.8 | | | 106.9 | |
| Risk Management Assets | | 20.6 | | | 19.0 | |
| Accrued Tax Benefits | | 35.5 | | | 31.0 | |
| Regulatory Asset for Under-Recovered Fuel Costs | | 64.7 | | | 118.3 | |
| Prepayments and Other Current Assets | | 20.2 | | | 18.7 | |
| TOTAL CURRENT ASSETS | | 608.4 | | | 469.5 | |
| | | | |
| PROPERTY, PLANT AND EQUIPMENT | | | | |
| Electric: | | | | |
| Generation | | 2,772.4 | | | 2,695.5 | |
| Transmission | | 1,345.3 | | | 1,228.3 | |
| Distribution | | 3,698.8 | | | 3,450.8 | |
| Other Property, Plant and Equipment | | 550.0 | | | 505.9 | |
| Construction Work in Progress | | 378.8 | | | 313.7 | |
| Total Property, Plant and Equipment | | 8,745.3 | | | 8,194.2 | |
| Accumulated Depreciation and Amortization | | 2,213.0 | | | 2,081.9 | |
TOTAL PROPERTY, PLANT AND EQUIPMENT – NET | | 6,532.3 | | | 6,112.3 | |
| | | | |
| OTHER NONCURRENT ASSETS | | | | |
| Regulatory Assets | | 527.8 | | | 522.7 | |
| | | | |
| Employee Benefits and Pension Assets | | 73.6 | | | 68.4 | |
| Operating Lease Assets | | 106.2 | | | 112.8 | |
| Deferred Charges and Other Noncurrent Assets | | 62.0 | | | 49.2 | |
| TOTAL OTHER NONCURRENT ASSETS | | 769.6 | | | 753.1 | |
| | | | |
| TOTAL ASSETS | | $ | 7,910.3 | | | $ | 7,334.9 | |
| | | | |
See Notes to Financial Statements of Registrants beginning on page 177. |
PUBLIC SERVICE COMPANY OF OKLAHOMA
BALANCE SHEETS
LIABILITIES AND COMMON SHAREHOLDER’S EQUITY
December 31, 2024 and 2023
| | | | | | | | | | | | | | |
| | December 31, |
| | 2024 | | 2023 |
| | (in millions) |
| CURRENT LIABILITIES | | | | |
| Advances from Affiliates | | $ | — | | | $ | 54.4 | |
| Accounts Payable: | | | | |
| General | | 200.5 | | | 159.3 | |
| Affiliated Companies | | 59.1 | | | 56.7 | |
| Long-term Debt Due Within One Year – Nonaffiliated | | 125.6 | | | 0.6 | |
| Risk Management Liabilities | | 5.8 | | | 28.9 | |
| Customer Deposits | | 72.9 | | | 81.4 | |
| Accrued Taxes | | 33.4 | | | 30.7 | |
| Accrued Interest | | 33.1 | | | 30.7 | |
| Obligations Under Operating Leases | | 10.4 | | | 10.1 | |
| | | | |
| | | | |
| Other Current Liabilities | | 78.6 | | | 106.2 | |
| TOTAL CURRENT LIABILITIES | | 619.4 | | | 559.0 | |
| | | | |
| NONCURRENT LIABILITIES | | | | |
| Long-term Debt – Nonaffiliated | | 2,730.0 | | | 2,384.0 | |
| Deferred Income Taxes | | 930.6 | | | 831.2 | |
| Regulatory Liabilities and Deferred Investment Tax Credits | | 689.7 | | | 765.6 | |
| Asset Retirement Obligations | | 118.8 | | | 83.9 | |
| | | | |
| Obligations Under Operating Leases | | 101.9 | | | 106.8 | |
| Deferred Credits and Other Noncurrent Liabilities | | 34.3 | | | 33.8 | |
| TOTAL NONCURRENT LIABILITIES | | 4,605.3 | | | 4,205.3 | |
| | | | |
| TOTAL LIABILITIES | | 5,224.7 | | | 4,764.3 | |
| | | | |
| Rate Matters (Note 4) | | | | |
| Commitments and Contingencies (Note 6) | | | | |
| | | | |
| COMMON SHAREHOLDER’S EQUITY | | | | |
| Common Stock – Par Value – $15 Per Share: | | | | |
| Authorized – 11,000,000 Shares | | | | |
| Issued – 10,482,000 Shares | | | | |
| Outstanding – 9,013,000 Shares | | 157.2 | | | 157.2 | |
| Paid-in Capital | | 1,041.2 | | | 1,039.3 | |
| Retained Earnings | | 1,483.6 | | | 1,374.3 | |
| Accumulated Other Comprehensive Income (Loss) | | 3.6 | | | (0.2) | |
| TOTAL COMMON SHAREHOLDER’S EQUITY | | 2,685.6 | | | 2,570.6 | |
| | | | |
| TOTAL LIABILITIES AND COMMON SHAREHOLDER’S EQUITY | | $ | 7,910.3 | | | $ | 7,334.9 | |
| | | | |
See Notes to Financial Statements of Registrants beginning on page 177. |
PUBLIC SERVICE COMPANY OF OKLAHOMA
STATEMENTS OF CASH FLOWS
For the Years Ended December 31, 2024, 2023 and 2022
(in millions)
| | | | | | | | | | | | | | | | | | | | |
| | Years Ended December 31, |
| | 2024 | | 2023 | | 2022 |
| OPERATING ACTIVITIES | | | | | | |
| Net Income | | $ | 249.3 | | | $ | 208.8 | | | $ | 167.6 | |
| Adjustments to Reconcile Net Income to Net Cash Flows from Operating Activities: | | | | | | |
| Depreciation and Amortization | | 272.2 | | | 255.5 | | | 230.1 | |
| Deferred Income Taxes | | 20.6 | | | 7.9 | | | (59.4) | |
| | | | | | |
| Allowance for Equity Funds Used During Construction | | (7.4) | | | (8.4) | | | (1.5) | |
| Mark-to-Market of Risk Management Contracts | | (27.1) | | | 33.0 | | | (13.7) | |
| | | | | | |
| | | | | | |
| Deferred Fuel Over/Under-Recovery, Net | | 53.6 | | | 313.2 | | | 442.4 | |
| | | | | | |
| | | | | | |
| Change in Other Regulatory Assets | | (0.3) | | | (108.3) | | | 4.7 | |
| Change in Other Noncurrent Assets | | (44.6) | | | (71.3) | | | (40.1) | |
| Change in Other Noncurrent Liabilities | | 7.6 | | | 8.2 | | | 29.9 | |
| Changes in Certain Components of Working Capital: | | | | | | |
| Accounts Receivable, Net | | 31.7 | | | (16.3) | | | (46.0) | |
| Fuel, Materials and Supplies | | 14.7 | | | (16.8) | | | (51.1) | |
| Accounts Payable | | 17.7 | | | (58.2) | | | 57.5 | |
| Accrued Taxes, Net | | (1.8) | | | (12.9) | | | 3.2 | |
| Other Current Assets | | (4.3) | | | 10.7 | | | (6.3) | |
| Other Current Liabilities | | (33.3) | | | 45.4 | | | 30.4 | |
| Net Cash Flows from Operating Activities | | 548.6 | | | 590.5 | | | 747.7 | |
| | | | | | |
| INVESTING ACTIVITIES | | | | | | |
| Construction Expenditures | | (597.6) | | | (562.3) | | | (447.0) | |
| Change in Advances to Affiliates, Net | | (232.0) | | | — | | | — | |
| Acquisitions of Renewable Energy Facilities | | — | | | (145.7) | | | (549.3) | |
| Other Investing Activities | | 5.3 | | | 15.2 | | | 4.3 | |
| Net Cash Flows Used for Investing Activities | | (824.3) | | | (692.8) | | | (992.0) | |
| | | | | | |
| FINANCING ACTIVITIES | | | | | | |
| Capital Contribution from Parent | | 1.9 | | | 0.6 | | | 3.6 | |
| Return of Capital to Parent | | — | | | (3.9) | | | — | |
| Issuance of Long-term Debt – Nonaffiliated | | 595.5 | | | 469.8 | | | 499.7 | |
| Change in Advances from Affiliates, Net | | (54.4) | | | (309.8) | | | 291.9 | |
| Retirement of Long-term Debt – Nonaffiliated | | (125.6) | | | (0.5) | | | (500.5) | |
| | | | | | |
| Principal Payments for Finance Lease Obligations | | (3.3) | | | (3.3) | | | (3.2) | |
| Dividends Paid on Common Stock | | (140.0) | | | (52.5) | | | (45.0) | |
| Other Financing Activities | | 0.9 | | | 0.4 | | | 0.5 | |
| Net Cash Flows from Financing Activities | | 275.0 | | | 100.8 | | | 247.0 | |
| | | | | | |
| Net Increase (Decrease) in Cash and Cash Equivalents | | (0.7) | | | (1.5) | | | 2.7 | |
| Cash and Cash Equivalents at Beginning of Period | | 2.5 | | | 4.0 | | | 1.3 | |
| Cash and Cash Equivalents at End of Period | | $ | 1.8 | | | $ | 2.5 | | | $ | 4.0 | |
| | | | | | |
| SUPPLEMENTARY INFORMATION | | | | | | |
| Cash Paid for Interest, Net of Capitalized Amounts | | $ | 101.8 | | | $ | 87.3 | | | $ | 79.7 | |
| Net Cash Paid (Received) for Income Taxes | | (15.1) | | | (10.6) | | | (12.5) | |
| Cash Paid (Received) for Transferable Tax Credits | | (96.0) | | | (34.6) | | | — | |
| Noncash Acquisitions Under Finance Leases | | 1.5 | | | 2.1 | | | 2.8 | |
| Construction Expenditures Included in Current Liabilities as of December 31, | | 88.4 | | | 72.9 | | | 69.8 | |
| | | | | | |
See Notes to Financial Statements of Registrants beginning on page 177. |
SOUTHWESTERN ELECTRIC POWER COMPANY CONSOLIDATED
MANAGEMENT’S NARRATIVE DISCUSSION AND ANALYSIS OF RESULTS OF OPERATIONS
RESULTS OF OPERATIONS
KWh Sales/Degree Days
| | | | | | | | | | | | | | | | | |
| Summary of KWh Energy Sales |
| | | | | |
| Years Ended December 31, |
| 2024 | | 2023 | | 2022 |
| (in millions of KWhs) |
| Retail: | | | | | |
| Residential | 6,081 | | | 6,138 | | | 6,538 | |
| Commercial | 5,588 | | | 5,538 | | | 5,732 | |
| Industrial | 5,157 | | | 5,147 | | | 5,174 | |
| Miscellaneous | 69 | | | 71 | | | 75 | |
| Total Retail | 16,895 | | | 16,894 | | | 17,519 | |
| | | | | |
| Wholesale (a) | 5,467 | | | 5,429 | | | 6,714 | |
| | | | | |
| Total KWhs | 22,362 | | | 22,323 | | | 24,233 | |
(a)Includes Off-system Sales, municipalities and cooperatives, unit power and other wholesale customers.
Heating degree days and cooling degree days are metrics commonly used in the utility industry as a measure of the impact of weather on revenues.
| | | | | | | | | | | | | | | | | |
| Summary of Heating and Cooling Degree Days |
| | | | | |
| Years Ended December 31, |
| 2024 | | 2023 | | 2022 |
| (in degree days) |
| Actual – Heating (a) | 780 | | | 727 | | | 1,149 | |
| Normal – Heating (b) | 1,158 | | | 1,174 | | | 1,170 | |
| | | | | |
| Actual – Cooling (c) | 3,041 | | | 2,853 | | | 2,833 | |
| Normal – Cooling (b) | 2,382 | | | 2,365 | | | 2,333 | |
(a)Heating degree days are calculated on a 55 degree temperature base.
(b)Normal Heating/Cooling represents the thirty-year average of degree days.
(c)Cooling degree days are calculated on a 65 degree temperature base.
Reconciliation of Year Ended December 31, 2023 to Year Ended December 31, 2024
Earnings Attributable to SWEPCo Common Shareholder
(in millions)
| | | | | | | | |
| Year Ended December 31, 2023 | | $ | 220.3 | |
| | |
| Changes in Revenues: | | |
| Retail Revenues (a) | | (173.1) | |
| Off-system Sales | | 2.9 | |
| Transmission Revenues | | 20.1 | |
| Other Revenues | | 3.6 | |
| Total Change in Revenues | | (146.5) | |
| | |
| Changes in Expenses and Other: | | |
| Purchased Electricity, Fuel and Other Consumables Used for Electric Generation | | 73.8 | |
| Other Operation and Maintenance | | (51.6) | |
| Asset Impairments and Other Related Charges | | 85.6 | |
| Depreciation and Amortization | | (46.5) | |
| Taxes Other Than Income Taxes | | 10.2 | |
| Interest Income | | (4.7) | |
| Allowance for Equity Funds Used During Construction | | 2.0 | |
| Non-Service Cost Components of Net Periodic Benefit Cost | | (12.8) | |
| Interest Expense | | 41.7 | |
| Total Change in Expenses and Other | | 97.7 | |
| | |
| Income Tax Benefit | | 150.7 | |
| | |
| Net Income Attributable to Noncontrolling Interest | | (1.0) | |
| | |
| Year Ended December 31, 2024 | | $ | 321.2 | |
(a)Includes firm wholesale sales to municipals and cooperatives.
The major components of the decrease in Revenues were as follows:
•Retail Revenues decreased $173 million primarily due to the following:
•A $148 million decrease due to a revenue refund associated with the Turk Plant and SWEPCo’s 2012 Texas Base Rate Case.
•An $82 million decrease in fuel revenues.
These decreases were partially offset by:
•A $25 million increase in rider revenues.
•A $15 million increase in weather-related usage primarily due to a 7% increase in heating degree days.
•Transmission Revenues increased $20 million primarily due to the following:
•A $13 million increase due to a FERC order which denied stand-alone treatment of NOLCs in transmission formula rates.
•A $12 million increase in transmission investment.
These increases were partially offset by:
•A $5 million decrease due to a reversal of a prior period provision for refund in 2023.
Expenses and Other and Income Tax Benefit changed between years as follows:
•Purchased Electricity, Fuel and Other Consumables Used for Electric Generation expenses decreased $74 million primarily due to a current year decrease in amortization of under-recovered fuel regulatory assets.
•Other Operation and Maintenance expenses increased $52 million primarily due to the following:
•An $18 million increase in transmission expenses primarily due to an increase in SPP expenses.
•A $17 million increase in employee-related expenses due to the voluntary severance program that occurred in the second quarter of 2024.
•A $14 million increase due to a disallowance recorded on the remaining net book value of the Dolet Hills Power Station as a result of an LPSC approved settlement agreement in April 2024.
•A $6 million increase due to the prior year capitalization of previously expensed renewable generation pre-construction charges.
•Asset Impairments and Other Related Charges decreased $86 million due to the probable disallowance of Turk Plant capitalized AFUDC in excess of the Texas jurisdictional capital cost cap as a result of the PUCT’s December 2023 preliminary order in the 2012 Texas Base Rate Case.
•Depreciation and Amortization expenses increased $47 million primarily due to an increase in amortization of regulatory assets and a higher depreciable base, partially offset by the recognition of a regulatory asset related to NOLCs.
•Taxes Other Than Income Taxes decreased $10 million primarily due to a decrease in property taxes.
•Non-Service Cost Components of Net Periodic Benefit Cost increased $13 million primarily due to a plan remeasurement triggered by settlements related to the voluntary severance program.
•Interest Expense decreased $42 million primarily due to the recognition of debt carrying charges as a result of the IRS PLR received regarding the treatment of stand-alone NOLCs in retail rate making.
•Income Tax Benefit increased $151 million primarily due to the following:
•A $109 million increase due to a reduction in Excess ADIT regulatory liabilities as a result of the IRS PLR received regarding the treatment of stand-alone NOLCs in retail rate making.
•A $32 million increase due to the reversal of a regulatory liability related to the merchant portion of Turk Plant Excess ADIT as a result of the APSC's March 2024 denial of SWEPCo's request to allow the merchant portion of the Turk Plant to serve Arkansas customers.
REPORT OF INDEPENDENT REGISTERED PUBLIC ACCOUNTING FIRM
To the Board of Directors and Shareholder of
Southwestern Electric Power Company
Opinion on the Financial Statements
We have audited the accompanying consolidated balance sheets of Southwestern Electric Power Company and its subsidiaries (the "Company") as of December 31, 2024 and 2023, and the related consolidated statements of income, of comprehensive income (loss), of changes in equity and of cash flows for each of the three years in the period ended December 31, 2024, including the related notes (collectively referred to as the "consolidated financial statements"). In our opinion, the consolidated financial statements present fairly, in all material respects, the financial position of the Company as of December 31, 2024 and 2023, and the results of its operations and its cash flows for each of the three years in the period ended December 31, 2024 in conformity with accounting principles generally accepted in the United States of America.
Basis for Opinion
These consolidated financial statements are the responsibility of the Company’s management. Our responsibility is to express an opinion on the Company’s consolidated financial statements based on our audits. We are a public accounting firm registered with the Public Company Accounting Oversight Board (United States) (PCAOB) and are required to be independent with respect to the Company in accordance with the U.S. federal securities laws and the applicable rules and regulations of the Securities and Exchange Commission and the PCAOB.
We conducted our audits of these consolidated financial statements in accordance with the standards of the PCAOB. Those standards require that we plan and perform the audits to obtain reasonable assurance about whether the consolidated financial statements are free of material misstatement, whether due to error or fraud. The Company is not required to have, nor were we engaged to perform, an audit of its internal control over financial reporting. As part of our audits we are required to obtain an understanding of internal control over financial reporting but not for the purpose of expressing an opinion on the effectiveness of the Company's internal control over financial reporting. Accordingly, we express no such opinion.
Our audits included performing procedures to assess the risks of material misstatement of the consolidated financial statements, whether due to error or fraud, and performing procedures that respond to those risks. Such procedures included examining, on a test basis, evidence regarding the amounts and disclosures in the consolidated financial statements. Our audits also included evaluating the accounting principles used and significant estimates made by management, as well as evaluating the overall presentation of the consolidated financial statements. We believe that our audits provide a reasonable basis for our opinion.
Critical Audit Matters
The critical audit matters communicated below are matters arising from the current period audit of the consolidated financial statements that were communicated or required to be communicated to the audit committee and that (i) relate to accounts or disclosures that are material to the consolidated financial statements and (ii) involved our especially challenging, subjective, or complex judgments. The communication of critical audit matters does not alter in any way our opinion on the consolidated financial statements, taken as a whole, and we are not, by communicating the critical audit matters below, providing separate opinions on the critical audit matters or on the accounts or disclosures to which they relate.
Accounting for the Effects of Cost-Based Regulation
As described in Notes 1 and 5 to the consolidated financial statements, the Company's consolidated financial statements reflect the actions of regulators that result in the recognition of certain revenues and expenses in different time periods than enterprises that are not rate-regulated. Regulatory assets (deferred expenses to be recovered in the future) and regulatory liabilities (deferred future revenue reductions or refunds) are recorded to reflect the economic effects of regulation in the same accounting period by matching expenses with their recovery through regulated revenues and matching income with its passage to customers in cost-based regulated rates. As of December 31, 2024, there were $1,028 million of deferred costs included in regulatory assets, $454 million of which were pending final regulatory approval, and $632 million of regulatory liabilities awaiting potential refund or future rate reduction, $7 million of which were pending final regulatory determination. Management reviews the probability of recovery of regulatory assets and refund of regulatory liabilities at each balance sheet date and whenever new events occur, such as changes in the regulatory environment, issuance of regulatory commission orders, or passage of new legislation.
The principal considerations for our determination that performing procedures relating to the accounting for the effects of cost-based regulation is a critical audit matter are (i) the significant judgment by management in assessing probability of the recovery of regulatory assets and refund of regulatory liabilities and (ii) a high degree of auditor judgment, subjectivity, and
effort in performing procedures and evaluating audit evidence related to the probability of recovery of regulatory assets and refund of regulatory liabilities.
Addressing the matter involved performing procedures and evaluating audit evidence in connection with forming our overall opinion on the consolidated financial statements. These procedures included testing the effectiveness of controls relating to management's evaluation of new events, such as changes in the regulatory environment, issuance of regulatory commission orders, or passage of new legislation, including controls over the probability of recovery of regulatory assets and refund of regulatory liabilities. These procedures also included, among others (i) evaluating the reasonableness of management's assessment of probability of future recovery for regulatory assets and refund of regulatory liabilities; (ii) testing, on a sample basis, the regulatory assets and liabilities, including those subject to pending rate cases and regulatory proceedings, by considering (a) the provisions and formulas outlined in rate orders; (b) other regulatory correspondence; and (c) application of relevant regulatory precedents.
Incremental Asset Retirement Obligations arising from the Federal Environment Protection Agency’s (“Federal EPA”) Revised Coal Combustion Residuals (CCR) Rule
As described in Notes 1 and 6 to the consolidated financial statements, in April 2024, the Federal EPA finalized revisions to the CCR Rule to expand the scope of the rule to include inactive impoundments at inactive facilities (“legacy CCR surface impoundments”) as well as to establish requirements for currently exempt solid waste management units that involve the direct placement of CCR on the land (“CCR management units”). The Federal EPA is requiring that owners and operators of legacy surface impoundments comply with all of the existing CCR Rule requirements applicable to inactive CCR surface impoundments at active facilities, except for the location restrictions and liner design criteria. Management evaluated the applicability of the rule to current and former plant sites and recorded incremental asset retirement obligations (AROs) based on initial cost estimates primarily reflecting compliance with the rule through closure in place and future groundwater monitoring requirements pursuant to the revised CCR Rule. As disclosed by management, accounting for the incremental ARO arising from the revised CCR Rule requires significant judgment by management due to the significant measurement uncertainty in estimating the incremental liability. As further groundwater monitoring and other analysis is performed, management expects to refine the assumptions and underlying cost estimates used in recording the incremental ARO arising from the revised CCR Rule. The estimated liability can significantly change if there are changes in the impacted coal ash site acreage inputs or if refinements in the assumptions over the remediation costs for legacy CCR surface impoundments and CCR management units, including assumptions over future groundwater monitoring requirements vary from the initial estimates. As a result of the rule, the Company recorded an incremental ARO of $24 million in the second quarter of 2024.
The principal considerations for our determination that performing procedures relating to the incremental ARO arising from the revised CCR Rule is a critical audit matter are (i) the significant judgment by management when developing the estimate of the incremental ARO; (ii) a high degree of auditor judgment, subjectivity and effort in performing procedures and evaluating the impacted coal ash site acreage and management’s assumptions over the remediation costs for legacy CCR surface impoundments and CCR management units, including assumptions over future groundwater monitoring requirements (collectively “management’s assumptions”); and (iii) the audit effort involved the use of professionals with specialized skill and knowledge.
Addressing the matter involved performing procedures and evaluating audit evidence in connection with forming our overall opinion on the consolidated financial statements. These procedures included testing the effectiveness of controls relating to management’s assessment of the incremental ARO arising from the revised CCR Rule, including controls over the impacted coal ash site acreage and management’s assumptions used in the estimate of the incremental ARO. These procedures also included, among others, (i) testing the completeness and accuracy of data used, including the impacted coal ash site acreage, in the estimate of the incremental ARO; (ii) testing management’s process for determining estimate of the incremental ARO, and (iii) the involvement of professionals with specialized skill and knowledge to assist in (a) assessing the adequacy of the cost assessment of the incremental ARO in accordance with the remediation requirements outlined in the Federal EPA’s revised CCR rule, (b) evaluating the reasonableness of management’s process over measuring coal ash site acreage and (c) evaluating the reasonableness of management’s assumptions used in the estimate.
/s/ PricewaterhouseCoopers LLP
Columbus, Ohio
February 13, 2025
We have served as the Company's auditor since 2017.
MANAGEMENT’S REPORT ON INTERNAL CONTROL OVER FINANCIAL REPORTING
The management of Southwestern Electric Power Company Consolidated (SWEPCo) is responsible for establishing and maintaining adequate internal control over financial reporting as such term is defined in Rule 13a-15(f) and 15d-15(f) under the Securities Exchange Act of 1934, as amended. SWEPCo’s internal control is a process designed to provide reasonable assurance regarding the reliability of financial reporting and the preparation of financial statements for external purposes in accordance with generally accepted accounting principles.
Because of its inherent limitations, internal control over financial reporting may not prevent or detect misstatements. Also, projections of any evaluation of effectiveness to future periods are subject to the risk that controls may become inadequate because of changes in conditions, or that the degree of compliance with the policies or procedures may deteriorate.
Management assessed the effectiveness of SWEPCo’s internal control over financial reporting as of December 31, 2024. In making this assessment, management used the criteria set forth by the Committee of Sponsoring Organizations of the Treadway Commission (COSO) in Internal Control – Integrated Framework (2013). Based on management’s assessment, management concluded SWEPCo’s internal control over financial reporting was effective as of December 31, 2024.
This annual report does not include an audit report from PricewaterhouseCoopers LLP, SWEPCo’s registered public accounting firm regarding internal control over financial reporting pursuant to the Securities and Exchange Commission rules that permit SWEPCo to provide only management’s report in this annual report.
SOUTHWESTERN ELECTRIC POWER COMPANY CONSOLIDATED
CONSOLIDATED STATEMENTS OF INCOME
For the Years Ended December 31, 2024, 2023 and 2022
(in millions)
| | | | | | | | | | | | | | | | | | | | |
| | Years Ended December 31, |
| | 2024 | | 2023 | | 2022 |
| REVENUES | | | | | | |
| Electric Generation, Transmission and Distribution | | $ | 2,148.6 | | | $ | 2,154.7 | | | $ | 2,234.9 | |
| Sales to AEP Affiliates | | 71.4 | | | 81.6 | | | 59.5 | |
| Provision for Refund - Affiliated | | (9.3) | | | (34.8) | | | (5.6) | |
| Provision for Refund | | (181.9) | | | (21.1) | | | (6.3) | |
| Other Revenues | | 7.5 | | | 2.4 | | | 1.9 | |
| TOTAL REVENUES | | 2,036.3 | | | 2,182.8 | | | 2,284.4 | |
| | | | | | |
| EXPENSES | | | | | | |
| Purchased Electricity, Fuel and Other Consumables Used for Electric Generation | | 733.3 | | | 807.1 | | | 889.5 | |
| | | | | | |
| | | | | | |
| Other Operation | | 422.4 | | | 360.5 | | | 424.7 | |
| Maintenance | | 149.1 | | | 159.4 | | | 148.6 | |
| Asset Impairments and Other Related Charges | | — | | | 85.6 | | | — | |
| Depreciation and Amortization | | 389.3 | | | 342.8 | | | 324.8 | |
| Taxes Other Than Income Taxes | | 124.9 | | | 135.1 | | | 126.8 | |
| TOTAL EXPENSES | | 1,819.0 | | | 1,890.5 | | | 1,914.4 | |
| | | | | | |
| OPERATING INCOME | | 217.3 | | | 292.3 | | | 370.0 | |
| | | | | | |
| Other Income (Expense): | | | | | | |
| Interest Income | | 14.2 | | | 18.9 | | | 17.7 | |
| Allowance for Equity Funds Used During Construction | | 13.5 | | | 11.5 | | | 4.9 | |
| Non-Service Cost Components of Net Periodic Benefit Cost | | 0.8 | | | 13.6 | | | 12.5 | |
| Interest Expense | | (105.5) | | | (147.2) | | | (137.4) | |
| | | | | | |
| INCOME BEFORE INCOME TAX EXPENSE (BENEFIT) AND EQUITY EARNINGS | | 140.3 | | | 189.1 | | | 267.7 | |
| | | | | | |
| Income Tax Expense (Benefit) | | (184.0) | | | (33.3) | | | (25.2) | |
| Equity Earnings of Unconsolidated Subsidiary | | 1.4 | | | 1.4 | | | 1.4 | |
| | | | | | |
| NET INCOME | | 325.7 | | | 223.8 | | | 294.3 | |
| | | | | | |
| Net Income Attributable to Noncontrolling Interest | | 4.5 | | | 3.5 | | | 4.2 | |
| | | | | | |
| | | | | | |
| | | | | | |
| | | | | | |
| | | | | | |
| EARNINGS ATTRIBUTABLE TO SWEPCo COMMON SHAREHOLDER | | $ | 321.2 | | | $ | 220.3 | | | $ | 290.1 | |
| | | | | | |
| The common stock of SWEPCo is wholly-owned by Parent. |
| | | | | | |
See Notes to Financial Statements of Registrants beginning on page 177. |
SOUTHWESTERN ELECTRIC POWER COMPANY CONSOLIDATED
CONSOLIDATED STATEMENTS OF COMPREHENSIVE INCOME (LOSS)
For the Years Ended December 31, 2024, 2023 and 2022
(in millions)
| | | | | | | | | | | | | | | | | | | | |
| | Years Ended December 31, |
| | 2024 | | 2023 | | 2022 |
| Net Income | | $ | 325.7 | | | $ | 223.8 | | | $ | 294.3 | |
| | | | | | |
| OTHER COMPREHENSIVE INCOME (LOSS), NET OF TAXES | | | | | | |
| Cash Flow Hedges, Net of Tax of $(0.1), $0 and $0 in 2024, 2023 and 2022, Respectively | | (0.3) | | | 0.2 | | | (0.1) | |
| Amortization of Pension and OPEB Deferred Costs, Net of Tax of $(0.1), $(0.3) and $(0.4) in 2024, 2023 and 2022, Respectively | | (0.3) | | | (1.3) | | | (1.6) | |
| Pension and OPEB Funded Status, Net of Tax of $1.7, $0.5 and $(2.5) in 2024, 2023 and 2022, Respectively | | 6.3 | | | 1.9 | | | (9.2) | |
| | | | | | |
| TOTAL OTHER COMPREHENSIVE INCOME (LOSS) | | 5.7 | | | 0.8 | | | (10.9) | |
| | | | | | |
| TOTAL COMPREHENSIVE INCOME | | 331.4 | | | 224.6 | | | 283.4 | |
| | | | | | |
| Total Comprehensive Income Attributable to Noncontrolling Interest | | 4.5 | | | 3.5 | | | 4.2 | |
| | | | | | |
| TOTAL COMPREHENSIVE INCOME ATTRIBUTABLE TO SWEPCo COMMON SHAREHOLDER | | $ | 326.9 | | | $ | 221.1 | | | $ | 279.2 | |
| | | | | | |
See Notes to Financial Statements of Registrants beginning on page 177. |
SOUTHWESTERN ELECTRIC POWER COMPANY CONSOLIDATED
CONSOLIDATED STATEMENTS OF CHANGES IN EQUITY
For the Years Ended December 31, 2024, 2023 and 2022
(in millions)
| | | | | | | | | | | | | | | | | | | | | | | | | | | | | | | | | | | |
| SWEPCo Common Shareholder | | | | |
| Common
Stock | | Paid-in
Capital | | Retained
Earnings | | Accumulated
Other
Comprehensive
Income (Loss) | | Noncontrolling
Interest | | Total |
| TOTAL EQUITY – DECEMBER 31, 2021 | $ | 0.1 | | | $ | 1,092.2 | | | $ | 2,050.9 | | | $ | 6.7 | | | $ | (0.1) | | | $ | 3,149.8 | |
| | | | | | | | | | | |
| | | | | | | | | | | |
| Capital Contribution from Parent | | | 350.0 | | | | | | | | | 350.0 | |
| Common Stock Dividends | | | | | (105.0) | | | | | | | (105.0) | |
| Common Stock Dividends – Nonaffiliated | | | | | | | | | (3.4) | | | (3.4) | |
| | | | | | | | | | | |
| | | | | | | | | | | |
| Net Income | | | | | 290.1 | | | | | 4.2 | | | 294.3 | |
| Other Comprehensive Loss | | | | | | | (10.9) | | | | | (10.9) | |
| | | | | | | | | | | |
| TOTAL EQUITY – DECEMBER 31, 2022 | 0.1 | | | 1,442.2 | | | 2,236.0 | | | (4.2) | | | 0.7 | | | 3,674.8 | |
| | | | | | | | | | | |
| | | | | | | | | | | |
| Capital Contribution from Parent | | | 50.0 | | | | | | | | | 50.0 | |
| Common Stock Dividends | | | | | (175.0) | | | | | | | (175.0) | |
| Common Stock Dividends – Nonaffiliated | | | | | | | | | (4.0) | | | (4.0) | |
| | | | | | | | | | | |
| Net Income | | | | | 220.3 | | | | | 3.5 | | | 223.8 | |
| Other Comprehensive Income | | | | | | | 0.8 | | | | | 0.8 | |
| TOTAL EQUITY – DECEMBER 31, 2023 | 0.1 | | | 1,492.2 | | | 2,281.3 | | | (3.4) | | | 0.2 | | | 3,770.4 | |
| | | | | | | | | | | |
| | | | | | | | | | | |
| Capital Contribution from Parent | | | 58.6 | | | | | | | | | 58.6 | |
| Return of Capital to Parent | | | (1.1) | | | | | | | | | (1.1) | |
| Common Stock Dividends | | | | | (250.0) | | | | | | | (250.0) | |
| Common Stock Dividends – Nonaffiliated | | | | | | | | | (4.3) | | | (4.3) | |
| | | | | | | | | | | |
| Net Income | | | | | 321.2 | | | | | 4.5 | | | 325.7 | |
| Other Comprehensive Income | | | | | | | 5.7 | | | | | 5.7 | |
| TOTAL EQUITY – DECEMBER 31, 2024 | $ | 0.1 | | | $ | 1,549.7 | | | $ | 2,352.5 | | | $ | 2.3 | | | $ | 0.4 | | | $ | 3,905.0 | |
| | | | | | | | | | | |
|
| | | | | | | | | | | |
See Notes to Financial Statements of Registrants beginning on page 177. |
SOUTHWESTERN ELECTRIC POWER COMPANY CONSOLIDATED
CONSOLIDATED BALANCE SHEETS
ASSETS
December 31, 2024 and 2023
(in millions)
| | | | | | | | | | | | | | |
| | December 31, |
| | 2024 | | 2023 |
| CURRENT ASSETS | | | | |
| Cash and Cash Equivalents | | $ | 1.2 | | | $ | 2.4 | |
Restricted Cash (December 31, 2024 and 2023 Amounts Include $3.4 and $0, Respectively, Related to Storm Recovery Funding) | | 3.4 | | | — | |
| Advances to Affiliates | | 2.3 | | | 2.2 | |
| Accounts Receivable: | | | | |
| Customers | | 34.5 | | | 39.0 | |
| Affiliated Companies | | 54.1 | | | 47.2 | |
| Miscellaneous | | 9.2 | | | 8.3 | |
| | | | |
| Total Accounts Receivable | | 97.8 | | | 94.5 | |
Fuel
| | 86.5 | | | 113.8 | |
Materials and Supplies (December 31, 2024 and 2023 Amounts Include $1.5 and $3.9, Respectively, Related to Sabine) | | 81.4 | | | 88.4 | |
| Risk Management Assets | | 18.1 | | | 11.6 | |
| | | | |
| Accrued Tax Benefits | | 26.0 | | | 28.4 | |
| Regulatory Asset for Under-Recovered Fuel Costs | | 106.6 | | | 170.8 | |
| Prepayments and Other Current Assets | | 14.7 | | | 29.2 | |
| TOTAL CURRENT ASSETS | | 438.0 | | | 541.3 | |
| | | | |
| PROPERTY, PLANT AND EQUIPMENT | | | | |
| Electric: | | | | |
| Generation | | 5,287.5 | | | 4,790.7 | |
| Transmission | | 2,863.8 | | | 2,660.6 | |
| Distribution | | 3,007.1 | | | 2,824.1 | |
Other Property, Plant and Equipment (December 31, 2024 and 2023 Amounts Include $166.8 and $182.7, Respectively, Related to Sabine) | | 940.4 | | | 814.4 | |
| Construction Work in Progress | | 627.3 | | | 555.8 | |
| Total Property, Plant and Equipment | | 12,726.1 | | | 11,645.6 | |
Accumulated Depreciation and Amortization (December 31, 2024 and 2023 Amounts Include $166.8 and $182.7, Respectively, Related to Sabine) | | 3,280.0 | | | 3,087.2 | |
| TOTAL PROPERTY, PLANT AND EQUIPMENT – NET | | 9,446.1 | | | 8,558.4 | |
| | | | |
| OTHER NONCURRENT ASSETS | | | | |
| Regulatory Assets | | 921.3 | | | 1,131.8 | |
Securitized Assets (December 31, 2024 and 2023 Amounts Include $331.4 and $0, Respectively, Related to Storm Recovery Funding) | | 331.4 | | | — | |
| Deferred Charges and Other Noncurrent Assets | | 358.2 | | | 326.1 | |
| TOTAL OTHER NONCURRENT ASSETS | | 1,610.9 | | | 1,457.9 | |
| | | | |
| TOTAL ASSETS | | $ | 11,495.0 | | | $ | 10,557.6 | |
| | | | |
See Notes to Financial Statements of Registrants beginning on page 177. |
SOUTHWESTERN ELECTRIC POWER COMPANY CONSOLIDATED
CONSOLIDATED BALANCE SHEETS
LIABILITIES AND EQUITY
December 31, 2024 and 2023
| | | | | | | | | | | | | | |
| | December 31, |
| | 2024 | | 2023 |
| | (in millions) |
| CURRENT LIABILITIES | | | | |
| Advances from Affiliates | | $ | 275.0 | | | $ | 88.7 | |
| Accounts Payable: | | | | |
| General | | 265.5 | | | 198.9 | |
| Affiliated Companies | | 57.1 | | | 45.9 | |
| Short-term Debt – Nonaffiliated | | 5.5 | | | 4.3 | |
Long-term Debt Due Within One Year – Nonaffiliated (December 31, 2024 and 2023 Amounts Include $22.7 and $0, Respectively, Related to Storm Recovery Funding) | | 22.7 | | | — | |
| Risk Management Liabilities | | 2.3 | | | 14.4 | |
| Customer Deposits | | 75.4 | | | 72.5 | |
| Accrued Taxes | | 48.6 | | | 58.7 | |
| Accrued Interest | | 40.6 | | | 39.9 | |
| | | | |
| Obligations Under Operating Leases | | 8.2 | | | 9.0 | |
| | | | |
| Provision for Refund | | 70.8 | | | 0.7 | |
| Other Current Liabilities | | 159.9 | | | 153.9 | |
| TOTAL CURRENT LIABILITIES | | 1,031.6 | | | 686.9 | |
| | | | |
| NONCURRENT LIABILITIES | | | | |
Long-term Debt – Nonaffiliated (December 31, 2024 and 2023 Amounts Include $308.7 and $0, Respectively, Related to Storm Recovery Funding) | | 3,958.1 | | | 3,646.9 | |
| | | | |
| Deferred Income Taxes | | 1,271.3 | | | 1,179.3 | |
| Regulatory Liabilities and Deferred Investment Tax Credits | | 610.8 | | | 756.1 | |
| Asset Retirement Obligations | | 257.5 | | | 258.6 | |
| Employee Benefits and Pension Obligations | | 46.5 | | | 43.1 | |
| | | | |
| Obligations Under Operating Leases | | 137.5 | | | 122.5 | |
| Provision for Refund | | 107.8 | | | 24.9 | |
| Storm Reserve | | 106.2 | | | — | |
| Deferred Credits and Other Noncurrent Liabilities | | 62.7 | | | 68.9 | |
| TOTAL NONCURRENT LIABILITIES | | 6,558.4 | | | 6,100.3 | |
| | | | |
| TOTAL LIABILITIES | | 7,590.0 | | | 6,787.2 | |
| | | | |
| Rate Matters (Notes 4) | | | | |
| Commitments and Contingencies (Note 6) | | | | |
| | | | |
| EQUITY | | | | |
| Common Stock – Par Value – $18 Per Share: | | | | |
| Authorized – 3,680 Shares | | | | |
| Outstanding – 3,680 Shares | | 0.1 | | | 0.1 | |
| Paid-in Capital | | 1,549.7 | | | 1,492.2 | |
| Retained Earnings | | 2,352.5 | | | 2,281.3 | |
| Accumulated Other Comprehensive Income (Loss) | | 2.3 | | | (3.4) | |
| TOTAL COMMON SHAREHOLDER’S EQUITY | | 3,904.6 | | | 3,770.2 | |
| | | | |
| Noncontrolling Interest | | 0.4 | | | 0.2 | |
| | | | |
| TOTAL EQUITY | | 3,905.0 | | | 3,770.4 | |
| | | | |
| TOTAL LIABILITIES AND EQUITY | | $ | 11,495.0 | | | $ | 10,557.6 | |
| | | | |
See Notes to Financial Statements of Registrants beginning on page 177. |
SOUTHWESTERN ELECTRIC POWER COMPANY CONSOLIDATED
CONSOLIDATED STATEMENTS OF CASH FLOWS
For the Years Ended December 31, 2024, 2023 and 2022
(in millions)
| | | | | | | | | | | | | | | | | | | | |
| | Years Ended December 31, |
| | 2024 | | 2023 | | 2022 |
| OPERATING ACTIVITIES | | | | | | |
| Net Income | | $ | 325.7 | | | $ | 223.8 | | | $ | 294.3 | |
| Adjustments to Reconcile Net Income to Net Cash Flows from Operating Activities: | | | | | | |
| Depreciation and Amortization | | 389.3 | | | 342.8 | | | 324.8 | |
| Deferred Income Taxes | | (74.3) | | | 54.0 | | | 9.4 | |
| Asset Impairments and Other Related Charges | | — | | | 85.6 | | | — | |
| Allowance for Equity Funds Used During Construction | | (13.5) | | | (11.5) | | | (4.9) | |
| Mark-to-Market of Risk Management Contracts | | (19.8) | | | 19.1 | | | (6.2) | |
| | | | | | |
| Deferred Fuel Over/Under-Recovery, Net | | 156.1 | | | 184.3 | | | (86.4) | |
| Change in Regulatory Assets | | (50.8) | | | (60.8) | | | 7.6 | |
| Provision for Refund – Turk Plant | | 79.2 | | | — | | | — | |
| Change in Other Noncurrent Assets | | (18.9) | | | (40.5) | | | 42.9 | |
| Change in Other Noncurrent Liabilities | | (41.4) | | | 11.0 | | | 18.3 | |
| Changes in Certain Components of Working Capital: | | | | | | |
| Accounts Receivable, Net | | (3.3) | | | 20.1 | | | (28.2) | |
| Fuel, Materials and Supplies | | 29.4 | | | (31.4) | | | (9.3) | |
| Accounts Payable | | 2.5 | | | (8.4) | | | 34.1 | |
| Accrued Taxes, Net | | (7.7) | | | (4.5) | | | 9.8 | |
| Provision for Refund – Turk Plant | | 68.3 | | | — | | | — | |
| Other Current Assets | | 9.9 | | | 20.2 | | | (9.8) | |
| Other Current Liabilities | | (13.9) | | | (0.8) | | | (9.8) | |
| Net Cash Flows from Operating Activities | | 816.8 | | | 803.0 | | | 586.6 | |
| | | | | | |
| INVESTING ACTIVITIES | | | | | | |
| Construction Expenditures | | (740.5) | | | (780.5) | | | (586.4) | |
| Change in Advances to Affiliates, Net | | (0.1) | | | (0.1) | | | 153.8 | |
| Acquisition of Renewable Energy Facilities | | (399.5) | | | — | | | (658.0) | |
| | | | | | |
| | | | | | |
| Other Investing Activities | | 11.4 | | | 3.9 | | | 5.5 | |
| Net Cash Flows Used for Investing Activities | | (1,128.7) | | | (776.7) | | | (1,085.1) | |
| | | | | | |
| FINANCING ACTIVITIES | | | | | | |
| Capital Contribution from Parent | | 58.6 | | | 50.0 | | | 350.0 | |
| Return of Capital to Parent | | (1.1) | | | — | | | — | |
| Issuance of Long-term Debt – Nonaffiliated | | 336.3 | | | 346.8 | | | — | |
| Change in Short-term Debt – Nonaffiliated | | 1.2 | | | 4.3 | | | — | |
| Change in Advances from Affiliates, Net | | 186.3 | | | (222.0) | | | 310.7 | |
| Retirement of Long-term Debt – Nonaffiliated | | — | | | (94.1) | | | (6.2) | |
| | | | | | |
| | | | | | |
| Principal Payments for Finance Lease Obligations | | (14.0) | | | (19.1) | | | (10.8) | |
| Dividends Paid on Common Stock | | (250.0) | | | (175.0) | | | (105.0) | |
| Dividends Paid on Common Stock – Nonaffiliated | | (4.3) | | | (4.0) | | | (3.4) | |
| | | | | | |
| Other Financing Activities | | 1.1 | | | 0.8 | | | 0.4 | |
| Net Cash Flows from (Used for) Financing Activities | | 314.1 | | | (112.3) | | | 535.7 | |
| | | | | | |
| Net Increase (Decrease) in Cash and Cash Equivalents | | 2.2 | | | (86.0) | | | 37.2 | |
| Cash and Cash Equivalents at Beginning of Period | | 2.4 | | | 88.4 | | | 51.2 | |
| Cash and Cash Equivalents at End of Period | | $ | 4.6 | | | $ | 2.4 | | | $ | 88.4 | |
| | | | | | |
| SUPPLEMENTARY INFORMATION | | | | | | |
| Cash Paid for Interest, Net of Capitalized Amounts | | $ | 139.0 | | | $ | 128.9 | | | $ | 131.2 | |
| Net Cash Paid (Received) for Income Taxes | | (15.1) | | | (41.0) | | | (29.1) | |
| Cash Paid (Received) for Transferable Tax Credits | | (88.6) | | | (41.4) | | | — | |
| Noncash Acquisitions Under Finance Leases | | 2.3 | | | 7.1 | | | 3.6 | |
| Construction Expenditures Included in Current Liabilities as of December 31, | | 137.3 | | | 63.7 | | | 105.6 | |
| | | | | | |
| | | | | | |
See Notes to Financial Statements of Registrants beginning on page 177. |
INDEX OF NOTES TO FINANCIAL STATEMENTS OF REGISTRANTS
The notes to financial statements are a combined presentation for the Registrants. The following list indicates Registrants to which the notes apply. Specific disclosures within each note apply to all Registrants unless indicated otherwise.
| | | | | | | | | | | | | | |
| Note | | Registrant | | Page
Number |
| | | | |
| Organization and Summary of Significant Accounting Policies | | AEP, AEP Texas, AEPTCo, APCo, I&M, OPCo, PSO, SWEPCo | | |
| New Accounting Standards | | AEP, AEP Texas, AEPTCo, APCo, I&M, OPCo, PSO, SWEPCo | | |
| Comprehensive Income | | AEP | | |
| Rate Matters | | AEP, AEP Texas, AEPTCo, APCo, I&M, OPCo, PSO, SWEPCo | | |
| Effects of Regulation | | AEP, AEP Texas, AEPTCo, APCo, I&M, OPCo, PSO, SWEPCo | | |
| Commitments, Guarantees and Contingencies | | AEP, AEP Texas, AEPTCo, APCo, I&M, OPCo, PSO, SWEPCo | | |
| Acquisitions, Dispositions and Impairments | | AEP, AEPTCo, PSO, SWEPCo | | |
| Benefit Plans | | AEP, AEP Texas, APCo, I&M, OPCo, PSO, SWEPCo | | |
| Business Segments | | AEP, AEP Texas, AEPTCo, APCo, I&M, OPCo, PSO, SWEPCo | | |
| Derivatives and Hedging | | AEP, AEP Texas, APCo, I&M, OPCo, PSO, SWEPCo | | |
| Fair Value Measurements | | AEP, AEP Texas, APCo, I&M, OPCo, PSO, SWEPCo | | |
| Income Taxes | | AEP, AEP Texas, AEPTCo, APCo, I&M, OPCo, PSO, SWEPCo | | |
| Leases | | AEP, AEP Texas, AEPTCo, APCo, I&M, OPCo, PSO, SWEPCo | | |
| Voluntary Severance Program | | AEP, AEP Texas, AEPTCo, APCo, I&M, OPCo, PSO, SWEPCo | | |
| Financing Activities | | AEP, AEP Texas, AEPTCo, APCo, I&M, OPCo, PSO, SWEPCo | | |
| Stock-based Compensation | | AEP | | |
| Related Party Transactions | | AEP, AEP Texas, AEPTCo, APCo, I&M, OPCo, PSO, SWEPCo | | |
| Variable Interest Entities and Equity Method Investments | | AEP, AEP Texas, AEPTCo, APCo, I&M, OPCo, PSO, SWEPCo | | |
| Property, Plant and Equipment | | AEP, AEP Texas, AEPTCo, APCo, I&M, OPCo, PSO, SWEPCo | | |
| Revenue from Contracts with Customers | | AEP, AEP Texas, AEPTCo, APCo, I&M, OPCo, PSO, SWEPCo | | |
| Subsequent Events | | AEP, AEPTCo | | |
| | | | |
1. ORGANIZATION AND SUMMARY OF SIGNIFICANT ACCOUNTING POLICIES
The disclosures in this note apply to all Registrants unless indicated otherwise.
ORGANIZATION
The Registrants engage in the generation, transmission and distribution of electric power. The Registrant Subsidiaries that conduct most of these activities are regulated by the FERC under the Federal Power Act and the Energy Policy Act of 2005 and maintain accounts in accordance with the FERC and other regulatory guidelines. Most of these companies are subject to further regulation with regard to rates and other matters by state regulatory commissions.
AEP also provides competitive electric and gas supply for residential, commercial and industrial customers in deregulated electricity markets. The Registrants also engage in wholesale electricity, natural gas and other commodity marketing and risk management activities in the United States and provide various energy-related services. I&M provides barging services to both affiliated and nonaffiliated companies.
SUMMARY OF SIGNIFICANT ACCOUNTING POLICIES
Rates and Service Regulation
AEP’s public utility subsidiaries’ rates are regulated by the FERC and state regulatory commissions in the eleven state operating territories in which they operate. The FERC also regulates the Registrants’ affiliated transactions, including AEPSC intercompany service billings which are generally at cost, under the 2005 Public Utility Holding Company Act and the Federal Power Act. The FERC also has jurisdiction over certain issuances and acquisitions of securities of the public utility subsidiaries, the acquisition or sale of certain utility assets and mergers with another electric utility or holding company. The state regulatory commissions also regulate certain intercompany transactions under various orders and affiliate statutes. Both the FERC and state regulatory commissions are permitted to review and audit the relevant books and records of companies within a public utility holding company system.
The FERC regulates wholesale power markets and wholesale power transactions. The Registrants’ wholesale power transactions are generally market-based. Wholesale power transactions are cost-based regulated when a cost-based contract is negotiated and filed with the FERC or the FERC determines that the Registrants have “market power” in the region where the transaction occurs. Wholesale power supply contracts have been entered into with various municipalities and cooperatives that are FERC-regulated, cost-based contracts. These contracts are generally formula rate mechanisms, which are trued-up to actual costs annually.
The state regulatory commissions regulate all of the retail distribution operations and rates of AEP’s retail public utility subsidiaries on a cost basis. The state regulatory commissions also regulate the retail generation/power supply operations and rates except in Ohio. For generation in Ohio, customers who have not switched to a CRES provider for generation pay market-based auction rates. In addition, all OPCo distribution customers continue to pay for certain legacy deferred generation-related costs through PUCO approved riders.
The FERC also regulates the Registrants’ wholesale transmission operations and rates. Retail transmission rates are based upon the FERC OATT rate when retail rates are unbundled in connection with restructuring. Retail transmission rates are based on formula rates included in the PJM OATT that are cost-based and are unbundled in Ohio for OPCo, in Virginia for APCo and in Michigan for I&M. AEP Texas’ retail transmission rates in Texas are unbundled but the retail transmission rates are regulated, on a cost basis, by the PUCT. Bundled retail transmission rates are regulated, on a cost basis, by the state commissions. Transmission rates for AEPTCo’s seven wholly-owned transmission subsidiaries within the AEP Transmission Holdco segment are based on formula rates included in the applicable RTO’s OATT that are cost-based.
In West Virginia, APCo and WPCo provide retail electric service at bundled rates approved by the WVPSC, with rates set on a combined cost-of-service basis.
In addition, the FERC regulates the Operating Agreement, TA and TCA, all of which allocate shared system costs and revenues among the utility subsidiaries that are parties to each agreement. The FERC also regulates the PCA. See Note 17 - Related Party Transactions for additional information.
Principles of Consolidation
AEP and the Registrant Subsidiaries’ consolidated financial statements include wholly-owned subsidiaries and VIEs, of which AEP or a Registrant Subsidiary is the primary beneficiary. Intercompany items are eliminated in consolidation.
The equity method of accounting is used for equity investments where the Registrants exercise significant influence but do not hold a controlling financial interest. Such investments are initially recorded at cost in Deferred Charges and Other Noncurrent Assets on the balance sheets. The proportionate share of the investee’s equity earnings or losses is included in Equity Earnings of Unconsolidated Subsidiaries on the statements of income.
AEP, I&M, PSO and SWEPCo have undivided ownership interests in generating units that are jointly-owned. The proportionate share of the operating costs associated with such facilities is included on the income statements and the assets and liabilities are reflected on the balance sheets. See Note 18 - Variable Interest Entities and Equity Method Investments and Note 19 - Property, Plant and Equipment for additional information.
Accounting for the Effects of Cost-Based Regulation
The Registrants’ financial statements reflect the actions of regulators that result in the recognition of certain revenues and expenses in different time periods than enterprises that are not rate-regulated. In accordance with accounting guidance for “Regulated Operations,” regulatory assets (deferred expenses to be recovered in the future) and regulatory liabilities (deferred revenue reductions or refunds) are recorded to reflect the economic effects of regulation in the same accounting period by matching expenses with their recovery through regulated revenues and by matching income with its passage to customers in cost-based regulated rates.
Use of Estimates
The preparation of these financial statements in conformity with GAAP requires management to make estimates and assumptions that affect the amounts reported in the financial statements and accompanying notes. These estimates include, but are not limited to, inventory valuation, allowance for credit losses, intangible and long-lived asset impairment, unbilled electricity revenue, valuation of long-term energy contracts, the effects of regulation, long-lived asset recovery, storm costs, AROs, the effects of contingencies and certain assumptions made in accounting for pension and postretirement benefits. The estimates and assumptions used are based upon management’s evaluation of the relevant facts and circumstances as of the date of the financial statements. Actual results could ultimately differ from those estimates.
Cash and Cash Equivalents
Cash and Cash Equivalents include temporary cash investments with original maturities of three months or less.
Restricted Cash (Applies to AEP, AEP Texas, APCo and SWEPCo)
Restricted Cash primarily includes funds held by trustees for the payment of securitization bonds.
Reconciliation of Cash, Cash Equivalents and Restricted Cash
The following tables provide a reconciliation of Cash, Cash Equivalents and Restricted Cash reported within the balance sheets that sum to the total of the same amounts shown on the statement of cash flows:
| | | | | | | | | | | | | | | | | | | | | | | | | | | | | | | | | | | | | | | | | | | | | | | | | | |
| | |
| | AEP | | AEP Texas | | APCo | | SWEPCo |
| | Year Ended December 31, |
| | 2024 | | 2023 | | 2024 | | 2023 | | 2024 | | 2023 | | 2024 | | 2023 |
| | (in millions) |
| Cash and Cash Equivalents | | $ | 202.9 | | | $ | 330.1 | | | $ | 0.1 | | | $ | 0.1 | | | $ | 3.9 | | | $ | 5.0 | | | $ | 1.2 | | | $ | 2.4 | |
| Restricted Cash | | 43.1 | | | 48.9 | | | 23.5 | | | 34.0 | | | 16.2 | | | 14.9 | | | 3.4 | | | — | |
| Total Cash, Cash Equivalents and Restricted Cash | | $ | 246.0 | | | $ | 379.0 | | | $ | 23.6 | | | $ | 34.1 | | | $ | 20.1 | | | $ | 19.9 | | | $ | 4.6 | | | $ | 2.4 | |
Other Temporary Investments (Applies to AEP)
Other Temporary Investments primarily include marketable securities and investments by its protected cell of EIS. These securities have readily determinable fair values and are carried at fair value with changes in fair value recognized in net income. The cost of securities sold is based on the specific identification or weighted-average cost method. See “Fair Value Measurements of Other Temporary Investments” section of Note 11 for additional information.
Inventory
Fossil fuel inventories are carried at average cost with the exception of AGR, which carries these inventories at the lower of average cost or net realizable value. Materials and supplies inventories are carried at average cost.
Accounts Receivable and Allowance for Credit Losses
Customer accounts receivable primarily include receivables from wholesale and retail energy customers, receivables from energy contract counterparties related to risk management activities and customer receivables primarily related to other revenue-generating activities.
Revenue is recognized over time as the performance obligations of delivering energy to customers are satisfied. To the extent that deliveries have occurred but a bill has not been issued, the Registrants accrue and recognize, as Accrued Unbilled Revenues on the balance sheets, an estimate of the revenues for energy delivered since the last billing.
AEP Credit factors accounts receivable on a daily basis, excluding receivables from risk management activities, through purchase agreements with I&M, KGPCo, KPCo, OPCo, PSO, SWEPCo and a portion of APCo. Since APCo does not have regulatory authority to sell accounts receivable in its West Virginia regulatory jurisdiction, only a portion of APCo’s accounts receivable are sold to AEP Credit. AEP Credit has a receivables securitization agreement with bank conduits. Under the securitization agreement, AEP Credit receives financing from bank conduits for a portion of its interests in the billed and unbilled receivables acquired from the affiliated utility subsidiaries. See “Securitized Accounts Receivable – AEP Credit” section of Note 15 for additional information.
Generally, AEP Credit recognizes bad debt expense based upon a 12-month rolling average of bad debt write-offs in proportion to gross accounts receivable purchased from participating AEP subsidiaries. The assessment is performed separately for each participating AEP subsidiary, which inherently contemplates any differences in geographical risk characteristics for the allowance for credit losses. For receivables related to APCo’s West Virginia operations, the allowance for credit losses is calculated based on a rolling two-year average write-off in proportion to gross accounts receivable.
For customer accounts receivables relating to risk management activities, accounts receivable are reviewed for potential credit losses at a specific counterparty level basis. For AEP Texas, allowances for credit losses are calculated using the specific identification of receivable balances greater than 120 days delinquent, and for those balances less than 120 days where the collection is doubtful. For miscellaneous accounts receivable, bad debt expense is recognized based upon a 12-month rolling average of bad debt write-offs in proportion to gross accounts receivable, unless specifically identified.
In addition to these processes, management contemplates available current information, as well as any reasonable and supportable forecast information, to determine if allowances for credit losses should be further adjusted in accordance with the accounting guidance for “Credit Losses.” Management’s assessments contemplate expected losses over the life of the accounts receivable.
Concentrations of Credit Risk and Significant Customers (Applies to Registrant Subsidiaries)
APCo, I&M, OPCo, PSO and SWEPCo do not have any significant customers that comprise 10% or more of their operating revenues. AEP Texas had significant customers which account for the following percentages of Total Revenues for the years ended December 31 and Accounts Receivable – Customers as of December 31:
| | | | | | | | | | | | | | | | | | | | |
| Significant Customers of AEP Texas: | | | | | | |
| NRG Energy and TXU Energy | | 2024 | | 2023 | | 2022 |
| Percentage of Total Revenues | | 40 | % | | 41 | % | | 45 | % |
| Percentage of Accounts Receivable – Customers | | 37 | % | | 34 | % | | 42 | % |
AEPTCo had significant transactions with AEP Subsidiaries which on a combined basis account for the following percentages of Total Revenues for the years ended December 31 and Total Accounts Receivable as of December 31:
| | | | | | | | | | | | | | | | | | | | |
| Significant Customers of AEPTCo: | | | | | | |
| AEP Subsidiaries | | 2024 | | 2023 | | 2022 |
| Percentage of Total Revenues | | 80 | % | | 79 | % | | 79 | % |
| Percentage of Total Accounts Receivable | | 69 | % | | 60 | % | | 72 | % |
The Registrant Subsidiaries monitor credit levels and the financial condition of their customers on a continuous basis to minimize credit risk. The regulatory commissions allow recovery in rates for a reasonable level of bad debt costs. Management believes adequate provisions for credit loss have been made in the accompanying Registrant Subsidiary financial statements.
Renewable Energy Credits (Applies to all Registrants except AEP Texas and AEPTCo)
In regulated jurisdictions, the Registrants record renewable energy credits (RECs) at cost. For RECs acquired in AEP’s nonregulated operations within the Generation & Marketing segment, management records those RECs at the lower of cost or net realizable value. The Registrants follow the inventory model for these RECs. RECs are reported in Materials and Supplies on the balance sheets. The purchases and sales of RECs are reported in the Operating Activities section of the statements of cash flows. RECs that are consumed to meet applicable state renewable portfolio standards are recorded in Fuel and Other Consumables Used for Electric Generation at an average cost on the statements of income. The net margin on sales of RECs affects the determination of deferred fuel and REC costs.
Property, Plant and Equipment
Regulated
Electric utility property, plant and equipment for rate-regulated operations are stated at original cost. Additions, major replacements and betterments are added to the plant accounts. Under the group composite method of depreciation, continuous interim routine replacements of items such as boiler tubes, pumps, motors, etc. result in original cost retirements, less salvage, being charged to accumulated depreciation. The group composite method of depreciation assumes that on average, asset components are retired at the end of their useful lives and thus there is no gain or loss. The equipment in each primary electric plant account is identified as a separate group. The depreciation rates that are established take into account the past history of interim capital replacements and the amount of removal cost incurred and salvage received. These rates and the related lives are subject to periodic review. Removal costs accrued are typically recorded as regulatory liabilities when the revenue received for removal costs accrued exceeds actual removal costs incurred. The asset removal costs liability is relieved as removal costs are incurred. A regulatory asset balance will occur if actual removal costs incurred exceed accumulated removal costs accrued.
The costs of labor, materials and overhead incurred to operate and maintain plant and equipment are included in operating expenses.
Nuclear fuel, including nuclear fuel in the fabrication phase, is included in Other Property, Plant and Equipment on the balance sheets.
Long-lived assets are required to be tested for impairment when it is determined that the carrying value of the assets may no longer be recoverable or when the assets meet the held-for-sale criteria under the accounting guidance for “Impairment or Disposal of Long-Lived Assets.” When it becomes probable that an asset in-service or an asset under construction will be abandoned and regulatory cost recovery has been disallowed or is not probable, the cost of that asset shall be written down to its then current estimated fair value, with the change charged to expense, and the asset is removed from plant-in-service or CWIP.
The fair value of an asset is the amount at which that asset could be bought or sold in a current transaction between willing parties, as opposed to a forced or liquidation sale. Quoted market prices in active markets are the best evidence of fair value and are used as the basis for the measurement, if available. In the absence of quoted prices for identical or similar assets in active markets, fair value is estimated using various internal and external valuation methods including cash flow analysis and appraisals.
Nonregulated
Nonregulated operations generally follow the policies of rate-regulated operations listed above but with the following exceptions. Property, plant and equipment of nonregulated operations are stated at original cost (or as adjusted for any
applicable impairments) plus the original cost of property acquired or constructed since the acquisition, less disposals. Normal and routine retirements from the plant accounts, net of salvage, are charged to accumulated depreciation for most nonregulated operations under the group composite method of depreciation. A gain or loss would be recorded if the retirement is not considered an interim routine replacement. Removal costs are charged to expense.
Allowance for Funds Used During Construction and Interest Capitalization
For regulated operations, AFUDC represents the estimated cost of borrowed and equity funds used to finance construction projects that is capitalized and recovered through depreciation over the service life of regulated electric utility plant. The Registrants record the equity component of AFUDC in Allowance for Equity Funds Used During Construction and the debt component of AFUDC as a reduction to Interest Expense on the statements of income. For nonregulated operations, including certain generating assets, interest is capitalized during construction in accordance with the accounting guidance for “Capitalization of Interest.”
Asset Retirement Obligations (Applies to all Registrants except AEPTCo)
The Registrants record ARO in accordance with the accounting guidance for “Asset Retirement and Environmental Obligations” for legal obligations for asbestos removal and for the retirement of certain ash disposal facilities, wind farms, solar farms and certain coal-mining facilities. I&M records ARO for the decommissioning of the Cook Plant. Certain registrants also record AROs related to the Federal EPA’s revised CCR Rule. For operating facilities, the present value of the liability is added to the cost of the associated asset and depreciated over the remaining life of the asset. For retired facilities, the present value of the liability is expensed, and where future recovery through rates is probable, the present value of the liability is subsequently deferred as a regulatory asset.
AROs are computed as the present value of the estimated costs associated with the future retirement of an asset and are recorded in the period in which the liability is incurred. Estimates of the timing and amounts of future cash outlays are based on projections of when and how the assets will be decommissioned and the liabilities will be remediated as well as the inflation rate and discount rate, which may change significantly over time. The estimated costs are capitalized as part of the related long-lived asset and depreciated over the asset's useful life. The Registrants have identified, but not recognized, ARO liabilities related to electric transmission and distribution assets as a result of certain easements on property on which assets are owned. Generally, such easements are perpetual and require only the retirement and removal of assets upon the cessation of the property’s use. The retirement obligation is not estimable for such easements since the Registrants plan to use their facilities indefinitely. The retirement obligation would only be recognized if and when the Registrants abandon or cease the use of specific easements, which is not expected.
Valuation of Nonderivative Financial Instruments
The book values of Cash and Cash Equivalents, Advances to/from Affiliates, Accounts Receivable, Accounts Payable and Short-term Debt approximate fair value because of the short-term maturity of these instruments.
Fair Value Measurements of Assets and Liabilities (Applies to all Registrants except AEPTCo)
The accounting guidance for “Fair Value Measurements and Disclosures” establishes a fair value hierarchy that prioritizes the inputs used to measure fair value. The hierarchy gives the highest priority to unadjusted quoted prices in active markets for identical assets or liabilities (Level 1 measurement) and the lowest priority to unobservable inputs (Level 3 measurement). Where observable inputs are available for substantially the full term of the asset or liability, the instrument is categorized in Level 2. When quoted market prices are not available, pricing may be completed using comparable securities, dealer values, operating data and general market conditions to determine fair value. Valuation models utilize various inputs such as commodity, interest rate and, to a lesser degree, volatility and credit that include quoted prices for similar assets or liabilities in active markets, quoted prices for identical or similar assets or liabilities in inactive markets, market corroborated inputs (i.e. inputs derived principally from, or correlated to, observable market data) and other observable inputs for the asset or liability.
For commercial activities, exchange-traded derivatives, namely futures contracts, are generally fair valued based on unadjusted quoted prices in active markets and are classified as Level 1. Level 2 inputs primarily consist of OTC broker quotes in moderately active or less active markets, as well as exchange-traded derivatives where there is insufficient market liquidity to warrant inclusion in Level 1. Management verifies price curves using these broker quotes and classifies these fair values within Level 2 when substantially all of the fair value can be corroborated. Management typically obtains multiple broker quotes,
which are nonbinding in nature but are based on recent trades in the marketplace. When multiple broker quotes are obtained, the quoted bid and ask prices are averaged. In certain circumstances, a broker quote may be discarded if it is a clear outlier. Management uses a historical correlation analysis between the broker quoted location and the illiquid locations. If the points are highly correlated, these locations are included within Level 2 as well. Certain OTC and bilaterally executed derivative instruments are executed in less active markets with a lower availability of pricing information. Illiquid transactions, complex structured transactions, FTRs and counterparty credit risk may require nonmarket-based inputs. Some of these inputs may be internally developed or extrapolated and utilized to estimate fair value. When such inputs have a significant impact on the measurement of fair value, the instrument is categorized as Level 3. The main driver of contracts being classified as Level 3 is the inability to substantiate energy price curves in the market. A portion of the Level 3 instruments have been economically hedged which limits potential earnings volatility.
AEP utilizes its trustee’s external pricing service to estimate the fair value of the underlying investments held in the benefit plan and nuclear trusts. AEP’s investment managers review and validate the prices utilized by the trustee to determine fair value. AEP’s management performs its own valuation testing to verify the fair values of the securities. AEP receives audit reports of the trustee’s operating controls and valuation processes.
Assets in the benefits and nuclear trusts, cash and cash equivalents, other temporary investments and restricted cash for securitized funding are classified using the following methods. Equities are classified as Level 1 holdings if they are actively traded on exchanges. Items classified as Level 1 are investments in money market funds, fixed income and equity mutual funds and equity securities. They are valued based on observable inputs, primarily unadjusted quoted prices in active markets for identical assets. Items classified as Level 2 are primarily investments in individual fixed income securities. Fixed income securities generally do not trade on exchanges and do not have an official closing price but their valuation inputs are based on observable market data. Pricing vendors calculate bond valuations using financial models and matrices. The models use observable inputs including yields on benchmark securities, quotes by securities brokers, rating agency actions, discounts or premiums on securities compared to par prices, changes in yields for U.S. Treasury securities, corporate actions by bond issuers, prepayment schedules and histories, economic events and, for certain securities, adjustments to yields to reflect changes in the rate of inflation. Other securities with model-derived valuation inputs that are observable are also classified as Level 2 investments. Investments with unobservable valuation inputs are classified as Level 3 investments. Investments classified as Other are valued using Net Asset Value as a practical expedient. Items classified as Other are primarily cash equivalent funds, common collective trusts, commingled funds, structured products, private equity, real estate and infrastructure investments. These investments do not have a readily determinable fair value or they contain redemption restrictions which may include the right to suspend redemptions under certain circumstances. Redemption restrictions may also prevent certain investments from being redeemed at the reporting date for the underlying value.
Deferred Fuel Costs (Applies to all Registrants except AEP Texas, AEPTCo and OPCo)
The cost of purchased electricity, fuel and related emission allowances and emission control chemicals/consumables is charged to Purchased Electricity, Fuel and Other Consumables Used for Electric Generation expense when the fuel is burned or the allowance or consumable is utilized. The cost of fuel also includes the cost of nuclear fuel burned which is computed primarily using the units-of-production method. In regulated jurisdictions with an active FAC, fuel cost over-recoveries (the excess of fuel-related revenues over applicable fuel costs incurred) are generally deferred as current regulatory liabilities and under-recoveries (the excess of applicable fuel costs incurred over fuel-related revenues) are generally deferred as current regulatory assets. Fuel cost over-recovery and under-recovery balances are classified as noncurrent when there is an expectation that refunds or recoveries will extend beyond a one year period, based on a company’s filing with a commission or a commission directive. These deferrals are incorporated into the development of future fuel rates billed to or refunded to customers. The amount of an over-recovery or under-recovery can also be affected by actions of the state regulatory commissions. On a routine basis, state regulatory commissions review and/or audit the Registrants’ fuel procurement policies and practices, the fuel cost calculations and FAC deferrals. FAC deferrals are adjusted when costs are no longer probable of recovery or when refunds of fuel reserves are probable. The Registrants share the majority of their Off-system Sales margins to customers either through an active FAC or other rate mechanisms. Where the FAC or Off-system Sales sharing mechanism is capped, frozen, non-existent or applicable to merchant operations, changes in fuel costs or sharing of Off-system Sales impact earnings.
Revenue Recognition
Regulatory Accounting
The Registrants’ financial statements reflect the actions of regulators that can result in the recognition of revenues and expenses in different time periods than enterprises that are not rate-regulated. Regulatory assets (deferred expenses or alternative
revenues recognized in accordance with the guidance for “Regulated Operations”) and regulatory liabilities (deferred revenue reductions or refunds) are recorded to reflect the economic effects of regulation in the same accounting period by matching expenses with their recovery through regulated revenues and by matching revenue with its passage to customers in cost-based regulated rates.
When regulatory assets are probable of recovery through regulated rates, assets are recorded on the balance sheets. Regulatory assets are reviewed for probability of recovery at each balance sheet date or whenever new events occur. Examples of new events include the issuance of a regulatory commission order or passage of new legislation. If it is determined that recovery of a regulatory asset is no longer probable, the regulatory asset is derecognized as a charge against income.
Retail and Wholesale Supply and Delivery of Electricity
The Registrants recognize revenues from customers for retail and wholesale electricity sales and electricity transmission and distribution delivery services. The Registrants recognize such revenues on the statements of income as the performance obligations of delivering energy to customers are satisfied. Recognized revenues include both billed and unbilled amounts. In accordance with the applicable state commission’s regulatory treatment, PSO and SWEPCo do not include the fuel portion in unbilled revenue, but rather recognize such revenues when billed to customers.
Wholesale transmission revenue is based on FERC-approved formula rate filings made for each calendar year using estimated costs. Revenues initially recognized per the annual rate filing are compared to actual costs, resulting in the subsequent recognition of an over or under-recovered amount, with interest, that is refunded or recovered, respectively, in a future year’s rates. These annual true-ups meet the definition of alternative revenues in accordance with the accounting guidance for “Regulated Operations”. An estimated annual true-up is recorded by the Registrants in the fourth quarter of each calendar year and a final annual true-up is recognized by the Registrants in the second quarter of each calendar year following the filing of annual FERC reports. Any portion of the true-ups applicable to an affiliated company is recorded as Accounts Receivable - Affiliated Companies or Accounts Payable - Affiliated Companies on the balance sheets. Any portion of the true-ups applicable to third-parties is recorded as Regulatory Assets or Regulatory Liabilities on the balance sheets. See Note 20 - Revenue from Contracts with Customers for additional information.
Gross versus Net Presentation of Certain Electricity Supply and Delivery Activities
Most of the power produced at the generation plants is sold to PJM or SPP. The Registrants also purchase power from PJM and SPP to supply power to customers. Generally, these power sales and purchases are reported on a net basis as revenues on the statements of income. However, purchases of power in excess of sales to PJM or SPP, on an hourly net basis, used to serve retail load are recorded gross as Purchased Electricity on the statements of income. With the exception of certain dedicated load bilateral power supply contracts, the transactions of AEP’s nonregulated subsidiaries are reported as gross purchases or sales.
Physical energy purchases arising from non-derivative contracts are accounted for on a gross basis in Purchased Electricity for Resale on the statements of income. Energy purchases arising from non-trading derivative contracts are recorded based on the transaction’s facts and circumstances. Certain derivatives that economically hedge future commodity risk are recorded in the same line item on the statements of income as that of the associated risk being hedged. Realized gains and losses on cash flow hedges are recorded in Total Revenues or Purchased Electricity depending on the nature of the risk being hedged. Derivative purchases elected normal used to serve accrual based obligations are recorded in Purchased Electricity on the statements of income. All other non-trading derivative purchases are recorded net in revenues.
In general, the Registrants record expenses when purchased electricity is received and when expenses are incurred, with the exception of certain power purchase contracts that are derivatives and accounted for using MTM accounting where generation/supply rates are not cost-based regulated. In jurisdictions where the generation/supply business is subject to cost-based regulation, the unrealized MTM amounts are deferred as regulatory assets (for losses) and regulatory liabilities (for gains).
Energy Marketing and Risk Management Activities (Applies to all Registrants except AEPTCo)
The Registrants engage in power, capacity and, to a lesser extent, natural gas marketing as major power producers and participants in electricity and natural gas markets. The Registrants also engage in power, capacity, coal, natural gas and, to a lesser extent, heating oil, gasoline and other commodity risk management activities focused on markets where the AEP System owns assets and on adjacent markets. These activities include the purchase-and-sale of energy under forward contracts at fixed
and variable prices. These contracts include physical transactions, exchange-traded futures, and to a lesser extent, OTC swaps and options. Certain energy marketing and risk management transactions are with RTOs.
The Registrants recognize revenues from marketing and risk management transactions that are not derivatives as the performance obligation of delivering the commodity is satisfied. Expenses from marketing and risk management transactions that are not derivatives are also recognized upon delivery of the commodity.
The Registrants use MTM accounting for marketing and risk management transactions that are derivatives unless the derivative is designated in a qualifying cash flow hedge relationship or elected normal under the normal purchase normal sale election. Unrealized MTM gains and losses are included on the balance sheets as Risk Management Assets or Liabilities, as appropriate, and on the statements of income in Total Revenues. Realized gains and losses on marketing and risk management transactions are included in revenues or expenses based on the transaction’s facts and circumstances. However, in regulated jurisdictions subject to cost-based regulation, unrealized MTM amounts and some realized gains and losses are deferred as regulatory assets (for losses) and regulatory liabilities (for gains).
Certain qualifying marketing and risk management derivatives transactions are designated as hedges of variability in future cash flows as a result of forecasted transactions (cash flow hedge). In the event the Registrants designate a cash flow hedge, the cash flow hedge’s gain or loss is initially recorded as a component of AOCI. When the forecasted transaction is realized and affects net income, the Registrants subsequently reclassify the gain or loss on the hedge from AOCI into revenues or expenses within the same financial statement line item as the forecasted transaction on their statements of income. See “Accounting for Cash Flow Hedging Strategies” section of Note 10 for additional information.
Levelization of Nuclear Refueling Outage Costs (Applies to AEP and I&M)
In accordance with regulatory orders, I&M defers incremental operation and maintenance costs associated with periodic refueling outages at its Cook Plant and amortizes the costs over approximately 18 months, beginning with the month following the start of each unit’s refueling outage and lasting until the end of the month in which the same unit’s next scheduled refueling outage begins.
Maintenance
The Registrants expense maintenance costs as incurred. If it becomes probable that the Registrants will recover specifically-incurred costs through future rates, a regulatory asset is established to match the expensing of those maintenance costs with their recovery in cost-based regulated revenues. In certain regulated jurisdictions, the Registrants defer costs above the level included in base rates and amortize those deferrals commensurate with recovery through rate riders.
Income Taxes and Investment and Production Tax Credits
The Registrants use the liability method of accounting for income taxes. Under the liability method, deferred income taxes are provided for all temporary differences between the book and tax basis of assets and liabilities which will result in a future tax consequence. Deferred tax assets and liabilities are measured using enacted tax rates expected to apply to taxable income in the years in which the temporary differences are expected to be recovered or settled.
When the flow-through method of accounting for temporary differences is required by a regulator to be reflected in regulated revenues (that is, when deferred taxes are not included in the cost-of-service for determining regulated rates for electricity), deferred income taxes are recorded and related regulatory assets and liabilities are established to match the regulated revenues and tax expense.
AEP and subsidiaries apply the deferral methodology for the recognition of ITCs. Deferred ITCs are amortized to income tax expense over the life of the asset that generated the credit. Amortization of deferred ITCs begins when the asset is placed in-service, except where regulatory commissions reflect ITCs in the rate-making process, then amortization begins when the utility is able to utilize the ITC on a stand-alone basis. Alternatively, PTCs reduce income tax expense as they are earned. PTCs are earned when electricity is produced. Absent IRS guidance on the calculation of “gross receipts”, the Nuclear PTC recognized is based on electricity produced and an estimate of gross receipts. If, and when, IRS guidance is issued, the value of the Nuclear PTC will be updated to reflect such guidance, if necessary.
Transferable tax credits established by the IRA are accounted for in accordance with the accounting guidance for “Income Taxes” by the Registrants. Proceeds from sales of transferable tax credits are included as a component of Operating Activities on the statement of cash flows and presented as gross within the Supplementary Cash Flow Information.
The Registrants account for uncertain tax positions in accordance with the accounting guidance for “Income Taxes.” The Registrants classify interest expense or income related to uncertain tax positions as interest expense or income as appropriate and classify penalties as Other Operation expense on the statements of income.
AEP and subsidiaries join in the filing of a consolidated federal income tax return. The benefit of current tax loss of the parent company (Parent Company Loss Benefit) to the AEP System subsidiaries is accounted for as an allocation through equity. The consolidated NOL of the AEP System is allocated to each company in the consolidated group with taxable loss. With the exception of the allocation of the consolidated AEP System NOL, Parent Company Loss Benefit and general business tax credits, the method of allocation reflects a separate return result for each company in the consolidated group.
Excise Taxes (Applies to all Registrants except AEPTCo)
As agents for some state and local governments, the Registrants collect from customers certain excise taxes levied by those state or local governments on customers. The Registrants do not record these taxes as revenue or expense.
Debt
Gains and losses from the reacquisition of debt used to finance regulated electric utility assets are deferred and amortized over the remaining term of the reacquired debt in accordance with their rate-making treatment unless the debt is refinanced. If the reacquired debt associated with the regulated business is refinanced, the reacquisition costs attributable to the portions of the business that are subject to cost-based regulatory accounting are generally deferred and amortized over the term of the replacement debt consistent with its recovery in rates. Operations not subject to cost-based rate regulation report gains and losses on the reacquisition of debt in Interest Expense on the statements of income upon reacquisition.
Debt discounts, premiums and debt issuance expenses are deferred and amortized generally utilizing the straight-line method over the term of the related debt. The straight-line method approximates the effective interest method and is consistent with the treatment in rates for regulated operations. The net amortization expense is included in Interest Expense on the statements of income.
Pension and OPEB Plans (Applies to all Registrants except AEPTCo)
AEPSC sponsors a qualified pension plan and two unfunded non-qualified pension plans. Substantially all AEP subsidiary employees are covered by the qualified plan or both the qualified and a non-qualified pension plan. AEPSC also sponsors OPEB plans to provide health and life insurance benefits for retired employees. The Registrant Subsidiaries account for their participation in the AEPSC sponsored pension and OPEB plans using multiple-employer accounting. See Note 8 - Benefit Plans for additional information including significant accounting policies associated with the plans.
Investments Held in Trust for Future Liabilities (Applies to all Registrants except AEPTCo)
AEP has several trust funds with significant investments intended to provide for future payments of pension and OPEB benefits, nuclear decommissioning and SNF disposal. All of the trust funds’ investments are diversified and managed in compliance with all laws and regulations. The investment strategy for the trust funds is to use a diversified portfolio of investments to achieve an acceptable rate of return while managing the investment risk of the assets relative to the associated liabilities. To minimize investment risk, the trust funds are broadly diversified among classes of assets, investment strategies and investment managers. Management regularly reviews the actual asset allocations and periodically rebalances the investments to targeted allocations when appropriate. Investment policies and guidelines allow investment managers in approved strategies to use financial derivatives to obtain or manage market exposures and to hedge assets and liabilities. The investments are reported at fair value under the “Fair Value Measurements and Disclosures” accounting guidance.
Benefit Plans
All benefit plan assets are invested in accordance with each plan’s investment policy. The investment policy outlines the investment objectives, strategies and target asset allocations by plan.
The investment philosophies for AEP’s benefit plans support the allocation of assets to minimize risks and optimize net returns. Strategies used include:
•Maintaining a long-term investment horizon.
•Diversifying assets to help control volatility of returns at acceptable levels.
•Managing fees, transaction costs and tax liabilities to maximize investment earnings.
•Using active management of investments where appropriate risk/return opportunities exist.
•Keeping portfolio structure style-neutral to limit volatility compared to applicable benchmarks.
•Using alternative asset classes such as real estate and private equity to maximize return and provide additional portfolio diversification.
The objective of the investment policy for the pension fund is to maintain the funded status of the plan while providing for growth in the plan assets to offset the growth in the plan liabilities. The current target asset allocations are as follows:
| | | | | | | | |
| Pension Plan Assets | | Target |
| Equity | | 35 | % |
| Fixed Income | | 49 | % |
| Other Investments | | 15 | % |
| Cash and Cash Equivalents | | 1 | % |
| | |
| OPEB Plans Assets | | Target |
| Equity | | 67 | % |
| Fixed Income | | 32 | % |
| Cash and Cash Equivalents | | 1 | % |
The investment policy for each benefit plan contains various investment limitations. The investment policies establish concentration limits for securities and prohibit the purchase of securities issued by AEP (with the exception of proportionate and immaterial holdings of AEP securities in passive index strategies or certain commingled funds). However, the investment policies do not preclude the benefit trust funds from receiving contributions in the form of AEP securities, provided that the AEP securities acquired by each plan may not exceed the limitations imposed by law.
For equity investments, the concentration limits are generally as follows:
•No security in excess of 5% of the outstanding class of equity of any one company.
•Cash equivalents must be less than 10% of an investment manager’s equity portfolio.
•No securities may be bought or sold on margin or other use of leverage.
For fixed income investments, each investment manager’s portfolio is compared to investment grade, diversified benchmark indices.
A portion of the pension assets is invested in real estate funds to provide diversification, add return and hedge against inflation. Real estate properties are illiquid, difficult to value and not actively traded. The pension plan uses external real estate investment managers to invest in commingled funds that hold real estate properties. To mitigate investment risk in the real estate portfolio, commingled real estate funds are used to ensure that holdings are diversified by region, property type and risk classification. Real estate holdings include core, value-added and opportunistic classifications.
A portion of the pension assets is invested in private equity. Private equity investments add return and provide diversification and typically require a long-term time horizon to evaluate investment performance. Private equity is classified as an alternative investment because it is illiquid, difficult to value and not actively traded. The pension plan uses limited partnerships to invest across the private equity investment spectrum. The private equity holdings are with multiple general partners who help monitor
the investments and provide investment selection expertise. The holdings are currently comprised of venture capital, buyout and hybrid debt and equity investments.
AEP participates in a securities lending program with BNY Mellon to provide incremental income on idle assets and to provide income to offset custody fees and other administrative expenses. AEP lends securities to borrowers approved by BNY Mellon in exchange for collateral. All loans are collateralized by at least 102% of the loaned asset’s market value and the collateral is invested. The difference between the rebate owed to the borrower and the collateral rate of return determines the earnings on the loaned security. The securities lending program’s objective is to provide modest incremental income with a limited increase in risk. As of December 31, 2024 and 2023, the fair value of securities on loan as part of the program was $60 million and $62 million, respectively. Cash and securities obtained as collateral exceeded the fair value of the securities loaned as of December 31, 2024 and 2023.
Trust owned life insurance (TOLI) underwritten by The Prudential Insurance Company is held in the OPEB plan trusts. The strategy for holding life insurance contracts in the taxable Voluntary Employees’ Beneficiary Association trust is to minimize taxes paid on the asset growth in the trust. Earnings on plan assets are tax-deferred within the TOLI contract and can be tax-free if held until claims are paid. Life insurance proceeds remain in the trust and are used to fund future retiree medical benefit liabilities. With consideration to other investments held in the trust, the cash value of the TOLI contracts is invested in two diversified funds. A portion is invested in a commingled fund with underlying investments in stocks that are actively traded on major international equity exchanges. The other portion of the TOLI cash value is invested in a diversified, commingled fixed income fund with underlying investments in government bonds, corporate bonds and asset-backed securities.
Cash and cash equivalents are held in each trust to provide liquidity and meet short-term cash needs. Cash equivalent funds are used to provide diversification and preserve principal. The underlying holdings in the cash funds are investment grade money market instruments including commercial paper, certificates of deposit, treasury bills and other types of investment grade short-term debt securities.
Nuclear Trust Funds (Applies to AEP and I&M)
Nuclear decommissioning and SNF trust funds represent funds that regulatory commissions allow I&M to collect through rates to fund future decommissioning and SNF disposal liabilities. By rules or orders, the IURC, the MPSC and the FERC established investment limitations and general risk management guidelines. In general, limitations include:
•Acceptable investments (rated investment grade or above when purchased).
•Maximum percentage invested in a specific type of investment.
•Prohibition of investment in obligations of AEP, I&M or their affiliates.
•Withdrawals permitted only for payment of decommissioning costs and trust expenses.
I&M maintains trust funds for each regulatory jurisdiction. Regulatory approval is required to withdraw decommissioning funds. These funds are managed by an external investment manager that must comply with the guidelines and rules of the applicable regulatory authorities. The trust assets are invested to optimize the net of tax earnings of the trust giving consideration to liquidity, risk, diversification and other prudent investment objectives.
I&M records securities held in these trust funds in Spent Nuclear Fuel and Decommissioning Trusts on its balance sheets. I&M records these securities at fair value. I&M classifies debt securities in the trust funds as available-for-sale due to their long-term purpose.
Other-than-temporary impairments for investments in debt securities are considered realized losses as a result of securities being managed by an external investment management firm. The external investment management firm makes specific investment decisions regarding the debt and equity investments held in these trusts and generally intends to sell debt securities in an unrealized loss position as part of a tax optimization strategy. Impairments reduce the cost basis of the securities which will affect any future unrealized gain or realized gain or loss due to the adjusted cost of investment. I&M records unrealized gains, unrealized losses and other-than-temporary impairments from securities in these trust funds as adjustments to the regulatory liability account for the nuclear decommissioning trust funds and to regulatory assets or liabilities for the SNF disposal trust funds in accordance with their treatment in rates. Consequently, changes in fair value of trust assets do not affect earnings or AOCI. See the “Nuclear Contingencies” section of Note 6 for additional discussion of nuclear matters. See “Fair Value Measurements of Trust Assets for Decommissioning and SNF Disposal” section of Note 11 for disclosure of the fair value of assets within the trusts.
Comprehensive Income (Loss) (Applies to AEP only)
Comprehensive income (loss) is defined as the change in equity (net assets) of a business enterprise during a period from transactions and other events and circumstances from non-owner sources. It includes all changes in equity during a period except those resulting from investments by owners and distributions to owners. Comprehensive income (loss) has two components: net income (loss) and other comprehensive income (loss).
Stock-Based Compensation Plans
As of December 31, 2024, AEP had performance shares and restricted stock units outstanding under the American Electric Power System 2024 Long-Term Incentive Plan (2024 LTIP) and the American Electric Power System 2015 Long-Term Incentive Plan (2015 LTIP). Upon vesting, all outstanding performance shares and restricted stock units settle in AEP common stock. The impact of AEP’s stock-based compensation plan is insignificant to the financial statements of the Registrant Subsidiaries.
AEP maintains a variety of tax qualified and non-qualified deferred compensation plans for employees and non-employee directors that include, among other options, an investment in or an investment return equivalent to that of AEP common stock. This includes AEP career shares maintained under the American Electric Power System Stock Ownership Requirement Plan (SORP), which facilitates executives in meeting minimum stock ownership requirements assigned to them by the Human Resources Committee of the Board of Directors. AEP career shares are derived from vested performance shares granted to employees under a long-term incentive plan. AEP career shares accrue additional dividend shares in an amount equal to dividends paid on AEP common shares at the closing market price on the dividend payments date. All AEP career shares are settled in shares of AEP common stock after the executive’s service with AEP ends.
Performance shares are classified as temporary equity in the Mezzanine Equity section of the balance sheets until the awards vest. Upon vesting, the performance shares are classified as permanent equity. These awards may be settled in cash upon an employee’s qualifying termination due to a change in control. Because such event is not solely within the control of the company, these awards are classified outside of permanent equity until the awards vest.
AEP compensates non-employee directors, in part, with stock units under the American Electric Power Company, Inc. Stock Unit Accumulation Plan for Non-Employee Directors. Prior to June 2022, these stock units were payable in cash to directors after their service ended and are now payable in AEP common stock.
Management measures and recognizes compensation expense for all share-based payment awards to employees and directors based on estimated fair values. For awards that are paid in shares with service only vesting conditions, management recognizes compensation expense on a straight-line basis. Stock-based compensation expense recognized on the statements of income for the years ended December 31, 2024, 2023 and 2022 is based on the number of outstanding awards at the end of each period without a reduction for estimated forfeitures. AEP accounts for forfeitures in the period in which they occur.
For the years ended December 31, 2024, 2023 and 2022, compensation costs are included in Net Income for performance shares, career shares, restricted stock units, non-employee director stock units and other qualified and non-qualified deferred compensation plans that provide an investment in or an investment return equivalent to that of AEP common stock. Compensation costs may also be capitalized. See Note 16 - Stock-based Compensation for additional information.
Equity Method Investments in Unconsolidated Entities (Applies to AEP and SWEPCo)
The equity method of accounting is used for equity investments where either AEP or SWEPCo exercise significant influence but do not hold a controlling financial interest. Such investments are initially recorded at cost in Deferred Charges and Other Noncurrent Assets on the balance sheets. The proportionate share of the investee’s equity earnings or losses is included in Equity Earnings (Loss) of Unconsolidated Subsidiaries on the statements of income. AEP and SWEPCo regularly monitor and evaluate equity method investments to determine whether they are impaired. An impairment is recognized when the investment has experienced a loss in value that is other-than-temporary in nature.
As of December 31, 2024, AEP’s significant equity method investments include ETT and DHLC. See Note 18 - Variable Interest Entities and Equity Method Investments for additional information.
Earnings Per Share (EPS) (Applies to AEP)
Basic EPS is calculated by dividing net earnings available to common shareholders by the weighted-average number of common shares outstanding during the period. Diluted EPS is calculated by adjusting the weighted-average outstanding common shares, assuming conversion of all potentially dilutive stock awards.
The following table presents AEP’s basic and diluted EPS calculations included on the statements of income:
| | | | | | | | | | | | | | | | | | | | | | | | | | | | | | | | | | | | | | |
| | Years Ended December 31, |
| | 2024 | | 2023 | | 2022 |
| | (in millions, except per-share data) |
| | | | $/share | | | | $/share | | | | $/share |
| | | | | | | | | | | | |
| | | | | | | | | | | | |
| Earnings Attributable to AEP Common Shareholders | | $ | 2,967.1 | | | | | $ | 2,208.1 | | | | | $ | 2,307.2 | | | |
| | | | | | | | | | | | |
| Weighted-Average Number of Basic AEP Common Shares Outstanding | | 530.1 | | | $ | 5.60 | | | 518.9 | | | $ | 4.26 | | | 511.8 | | | $ | 4.51 | |
| Weighted-Average Dilutive Effect of Stock-Based Awards | | 1.2 | | | (0.02) | | | 1.3 | | | (0.02) | | | 1.7 | | | (0.02) | |
| Weighted-Average Number of Diluted AEP Common Shares Outstanding | | 531.3 | | | $ | 5.58 | | | 520.2 | | | $ | 4.24 | | | 513.5 | | | $ | 4.49 | |
There were no antidilutive shares outstanding as of December 31, 2024, 2023 and 2022.
Supplementary Income Statement Information
The following tables provide the components of Depreciation and Amortization for the years ended December 31, 2024, 2023 and 2022:
| | | | | | | | | | | | | | | | | | | | | | | | | | | | | | | | | | | | | | | | | | | | | | | | | | |
| 2024 | | | | | | | | | | | | | | | | |
| | | | | | | | | | | | | | | | |
| Depreciation and Amortization | | AEP | | AEP Texas | | AEPTCo | | APCo | | I&M | | OPCo | | PSO | | SWEPCo |
| | (in millions) |
| Depreciation and Amortization of Property, Plant and Equipment | | $ | 3,148.6 | | | $ | 405.9 | | | $ | 430.9 | | | $ | 600.4 | | | $ | 456.2 | | | $ | 386.0 | | | $ | 263.1 | | | $ | 375.4 | |
| Amortization of Certain Securitized Assets | | 91.3 | | | 91.3 | | | — | | | — | | | — | | | — | | | — | | | — | |
| Amortization of Regulatory Assets and Liabilities | | 50.0 | | | (3.7) | | | — | | | 2.0 | | | 24.9 | | | — | | | 9.1 | | | 13.9 | |
| Total Depreciation and Amortization | | $ | 3,289.9 | | | $ | 493.5 | | | $ | 430.9 | | | $ | 602.4 | | | $ | 481.1 | | | $ | 386.0 | | | $ | 272.2 | | | $ | 389.3 | |
| | | | | | | | | | | | | | | | | | | | | | | | | | | | | | | | | | | | | | | | | | | | | | | | | | |
| 2023 | | | | | | | | | | | | | | | | |
| | | | | | | | | | | | | | | | |
| Depreciation and Amortization | | AEP | | AEP Texas | | AEPTCo | | APCo | | I&M | | OPCo | | PSO | | SWEPCo |
| | (in millions) |
| Depreciation and Amortization of Property, Plant and Equipment | | $ | 2,927.5 | | | $ | 380.0 | | | $ | 393.8 | | | $ | 571.1 | | | $ | 439.8 | | | $ | 315.8 | | | $ | 240.3 | | | $ | 323.4 | |
| Amortization of Certain Securitized Assets | | 91.9 | | | 91.9 | | | — | | | — | | | — | | | — | | | — | | | — | |
| Amortization of Regulatory Assets and Liabilities | | 71.0 | | | (3.4) | | | — | | | 0.8 | | | 30.2 | | | 0.4 | | | 15.2 | | | 19.4 | |
| Total Depreciation and Amortization | | $ | 3,090.4 | | | $ | 468.5 | | | $ | 393.8 | | | $ | 571.9 | | | $ | 470.0 | | | $ | 316.2 | | | $ | 255.5 | | | $ | 342.8 | |
| | | | | | | | | | | | | | | | | | | | | | | | | | | | | | | | | | | | | | | | | | | | | | | | | | |
| 2022 | | | | | | | | | | | | | | | | |
| | | | | | | | | | | | | | | | |
| Depreciation and Amortization | | AEP | | AEP Texas | | AEPTCo | | APCo | | I&M | | OPCo | | PSO | | SWEPCo |
| | (in millions) |
| Depreciation and Amortization of Property, Plant and Equipment | | $ | 3,072.8 | | | $ | 363.5 | | | $ | 346.2 | | | $ | 576.1 | | | $ | 511.9 | | | $ | 293.1 | | | $ | 226.2 | | | $ | 319.3 | |
| Amortization of Certain Securitized Assets | | 93.3 | | | 93.3 | | | — | | | — | | | — | | | — | | | — | | | — | |
| Amortization of Regulatory Assets and Liabilities | | 36.7 | | | (4.4) | | | — | | | (0.2) | | | 15.3 | | | 1.2 | | | 3.9 | | | 5.5 | |
| Total Depreciation and Amortization | | $ | 3,202.8 | | | $ | 452.4 | | | $ | 346.2 | | | $ | 575.9 | | | $ | 527.2 | | | $ | 294.3 | | | $ | 230.1 | | | $ | 324.8 | |
Supplementary Cash Flow Information (Applies to AEP)
| | | | | | | | | | | | | | | | | | | | |
| | Years Ended December 31, |
| Cash Flow Information | | 2024 | | 2023 | | 2022 |
| | (in millions) |
| Cash Paid (Received) for: | | | | | | |
| Interest, Net of Capitalized Amounts | | $ | 1,837.8 | | | $ | 1,673.5 | | | $ | 1,286.3 | |
| Income Taxes | | 133.4 | | | 78.4 | | | 116.8 | |
| Sale of Transferable Tax Credits | | (202.0) | | | (102.0) | | | — | |
| Noncash Investing and Financing Activities: | | | | | | |
| Acquisitions Under Finance Leases | | 29.5 | | | 48.7 | | | 31.8 | |
| Construction Expenditures Included in Current Liabilities as of December 31, | | 1,312.0 | | | 842.4 | | | 1,258.9 | |
| | | | | | |
| | | | | | |
| Acquisition of Nuclear Fuel Included in Current Liabilities as of December 31, | | 23.5 | | | 24.2 | | | — | |
| | | | | | |
| | | | | | |
| | | | | | |
| | | | | | |
| | | | | | |
| | | | | | |
Noncash Increase in Noncurrent Assets from the Sale of the Competitive Contracted Renewables Portfolio | | — | | | 74.7 | | | — | |
2. NEW ACCOUNTING STANDARDS
The disclosures in this note apply to all Registrants unless indicated otherwise.
Management reviews the FASB’s standard-setting process and the SEC’s rulemaking activity to determine the relevance, if any, to the Registrants’ business. The following standards/rules will impact the Registrants’ financial statements.
SEC Climate Disclosure Rule
On March 6, 2024, the SEC adopted final rules that require registrants to disclose certain climate-related information in registration statements and annual reports. The final rules require registrants to disclose, among other things, material climate-related risks, activities to mitigate such risks and information about a registrant’s board of directors oversight and management’s role in managing material climate-related risks. The final rules also require registrants to provide information related to any climate-related targets or goals that are material to a registrant’s business, results of operations or financial condition. A majority of the reporting requirements are applicable to the fiscal year beginning in 2025, with the addition of assurance reporting for GHG emissions starting in 2029 for large accelerated filers. Litigation challenging the new rules was filed by multiple parties in multiple jurisdictions, which have been consolidated and assigned to the U.S. Court of Appeals for the Eighth Circuit. On April 4, 2024, the SEC issued an order staying the final climate disclosure rules pending the completion of judicial review at the Court of Appeals. The Registrants are currently evaluating the impact of the final rules on their respective consolidated financial statements and related disclosures.
ASU 2023-07 “Improvements to Reportable Segment Disclosures” (ASU 2023-07)
In November 2023, the FASB issued ASU 2023-07, to address investors’ observations that there is limited information disclosed about segment expenses and to better understand expense categories and amounts included in segment profit or loss. The new standard requires annual and interim disclosure of (a) the categories and amounts of significant segment expenses (determined by management using both qualitative and quantitative factors) that are regularly provided to the CODM and included within each reported measure of segment profit or loss, (b) the amounts and a qualitative description of “other segment items”, defined as the difference between reported segment revenues less the significant segment expenses and each reported measure of segment profit or loss disclosed, (c) reportable segment profit or loss and assets that are currently only required annually, (d) the CODM’s title and position, and an explanation of how the CODM uses the reported measure(s) of segment profit or loss in assessing segment performance and deciding how to allocate resources and (e) a requirement that entities with a single reportable segment provide all disclosures required by ASU 2023-07 and all existing segment disclosures in Topic 280. Additionally, this new standard allows disclosure of one or more of additional profit or loss measures if the CODM uses more than one measure provided that at least one of the disclosed measures is determined in a manner “most consistent with the measurement principles under GAAP”. If multiple measures are presented, additional disclosure is required about how the CODM uses each measure to assess performance and decide how to allocate resources.
Management adopted ASU 2023-07 and its related implementation guidance effective January 1, 2024 for the annual reporting period and applied the amendments retrospectively to all prior periods presented in the consolidated financial statements. The amendments for interim periods will be adopted in our fiscal year beginning on January 1, 2025. The adoption of the new standard did not impact the results of operations, statements of financial position or cash flows. See Note 9 - Business Segments for additional information.
ASU 2023-09 “Improvements to Income Tax Disclosures” (ASU 2023-09)
In December 2023, the FASB issued ASU 2023-09, to address investors’ suggested enhancements to (a) better understand an entity’s exposure to potential changes in jurisdictional tax legislation and the ensuing risks and opportunities, (b) assess income tax information that affects cash flow forecasts and capital allocation decisions and (c) identify potential opportunities to increase future cash flows.
The new standard requires an annual rate reconciliation disclosure of the following categories regardless of materiality: state and local income tax, net of federal income tax effect, foreign tax effects, effect of changes in tax laws or rates enacted in the current period, effect of cross-border tax laws, tax credits, changes in valuation allowances, nontaxable or nondeductible items and changes in unrecognized tax benefits.
The new standard also requires an annual disclosure of the amount of income taxes paid (net of refunds received) disaggregated by federal, state and foreign taxes and by individual jurisdictions that are equal to or greater than 5 percent of total income taxes paid. Disclosure of income (loss) from continuing operations before income tax expense (benefit) disaggregated between
domestic and foreign jurisdictions and income tax expense (benefit) from continuing operations disaggregated by federal, state and foreign jurisdictions is required.
The new standard removes the requirement to disclose the cumulative amount of each type of temporary difference when a deferred tax liability is not recognized because of the exceptions to comprehensive recognition of deferred taxes related to subsidiaries and corporate joint ventures.
The amendments in the new standard may be applied on either a prospective or retrospective basis for public business entities for fiscal years beginning after December 15, 2024 with early adoption permitted. Management has concluded to adopt the amendments to this standard prospectively beginning on January 1, 2025.
ASU 2024-03 “Income Statement-Reporting Comprehensive Income-Expense Disaggregation Disclosures” (ASU 2024-03)
In November 2024, the FASB issued ASU 2024-03, the intent of which is to improve financial reporting and respond to investor input by requiring public business entities to disclose additional information about certain expenses in the notes to financial statements in interim and annual reporting periods. Among other provisions, the new standard requires disclosure of disaggregated amounts for expenses such as employee compensation, depreciation, and intangible asset amortization included in each expense caption presented on the face of the income statement. Public business entities are required to include certain amounts that are already required to be disclosed under GAAP in the same disclosure as the other disaggregation requirements as well as a qualitative description of any amounts remaining in relevant expense captions that are not separately disaggregated quantitatively. The new standard also requires disclosure of the total amount of selling expenses and, in annual reporting periods, an entity’s definition of selling expenses. An entity is not precluded from providing additional voluntary disclosures that may provide investors with additional decision-useful information.
The amendments in the new standard are effective for annual reporting periods beginning after December 15, 2026, and interim reporting periods beginning after December 15, 2027, with early adoption permitted. The amendments in the new standard should be applied either prospectively to financial statements issued for reporting periods after the effective date or retrospectively to any or all prior periods presented in the financial statements. Management is evaluating the new standard and has not yet determined when, or the method by which, the Registrants will adopt its amendments.
3. COMPREHENSIVE INCOME
The disclosures in this note apply to AEP only. The impact of AOCI is not material to the financial statements of the Registrant Subsidiaries.
Presentation of Comprehensive Income
The following tables provide AEP’s components of changes in AOCI and details of reclassifications from AOCI for the years ended December 31, 2024, 2023 and 2022. The amortization of pension and OPEB AOCI components are included in the computation of net periodic pension and OPEB costs. See Note 8 - Benefit Plans for additional information.
| | | | | | | | | | | | | | | | | | | | | | | | | | | | | | | | |
| | Cash Flow Hedges | | Pension and OPEB | | |
| For the Year Ended December 31, 2024 | | Commodity | | Interest Rate | | Amortization of Deferred Costs | | Changes in Funded Status | | Total |
| | | (in millions) |
| Balance in AOCI as of December 31, 2023 | | $ | 104.9 | | | $ | (8.1) | | | $ | 92.6 | | | $ | (244.9) | | | $ | (55.5) | |
| Change in Fair Value Recognized in AOCI, Net of Tax | | 2.5 | | | 7.1 | | | — | | | 41.0 | | | 50.6 | |
| Amount of (Gain) Loss Reclassified from AOCI | | | | | | | | | | |
| | | | | | | | | | |
| Purchased Electricity, Fuel and Other Consumables Used for Electric Generation (a) | | (11.2) | | | — | | | — | | | — | | | (11.2) | |
| Interest Expense (a) | | — | | | 5.3 | | | — | | | — | | | 5.3 | |
| Amortization of Prior Service Cost (Credit) | | — | | | — | | | (5.4) | | | — | | | (5.4) | |
| Amortization of Actuarial (Gains) Losses | | — | | | — | | | 2.2 | | | — | | | 2.2 | |
| Recognition of Pension Settlement Costs | | — | | | — | | | 11.3 | | | — | | | 11.3 | |
| Reclassifications from AOCI, before Income Tax (Expense) Benefit | | (11.2) | | | 5.3 | | | 8.1 | | | — | | | 2.2 | |
| Income Tax (Expense) Benefit | | (2.3) | | | 1.0 | | | 1.7 | | | — | | | 0.4 | |
| Reclassifications from AOCI, Net of Income Tax (Expense) Benefit | | (8.9) | | | 4.3 | | | 6.4 | | | — | | | 1.8 | |
| Net Current Period Other Comprehensive Income (Loss) | | (6.4) | | | 11.4 | | | 6.4 | | | 41.0 | | | 52.4 | |
| Balance in AOCI as of December 31, 2024 | | $ | 98.5 | | | $ | 3.3 | | | $ | 99.0 | | | $ | (203.9) | | | $ | (3.1) | |
| | | | | | | | | | | | | | | | | | | | | | | | | | | | | | | | | | |
| | | Cash Flow Hedges | | | | Pension and OPEB | | |
| For the Year Ended December 31, 2023 | | Commodity | | Interest Rate | | | | Amortization of Deferred Costs | | Changes in Funded Status | | Total |
| | | (in millions) |
| Balance in AOCI as of December 31, 2022 | | $ | 223.5 | | | $ | 0.3 | | | | | $ | 105.2 | | | $ | (245.3) | | | $ | 83.7 | |
| Change in Fair Value Recognized in AOCI, Net of Tax | | (175.8) | | | (6.4) | | | | | — | | | (16.3) | | | (198.5) | |
| Amount of (Gain) Loss Reclassified from AOCI | | | | | | | | | | | | |
| | | | | | | | | | | | |
| Purchased Electricity, Fuel and Other Consumables Used for Electric Generation (a) | | 72.2 | | | — | | | | | — | | | — | | | 72.2 | |
| Interest Expense (a) | | — | | | (2.4) | | | | | — | | | — | | | (2.4) | |
| Amortization of Prior Service Cost (Credit) | | — | | | — | | | | | (21.2) | | | — | | | (21.2) | |
| Amortization of Actuarial (Gains) Losses | | — | | | — | | | | | 5.2 | | | — | | | 5.2 | |
| Reclassifications from AOCI, before Income Tax (Expense) Benefit | | 72.2 | | | (2.4) | | | | | (16.0) | | | — | | | 53.8 | |
| Income Tax (Expense) Benefit | | 15.0 | | | (0.4) | | | | | (3.4) | | | — | | | 11.2 | |
| Reclassifications from AOCI, Net of Income Tax (Expense) Benefit | | 57.2 | | | (2.0) | | | | | (12.6) | | | — | | | 42.6 | |
| Reclassifications of KPCo Pension and OPEB Regulatory Assets to AOCI, before Income Tax (Expense) Benefit | | — | | | — | | | | | — | | | 21.1 | | | 21.1 | |
| Income Tax (Expense) Benefit | | — | | | — | | | | | — | | | 4.4 | | | 4.4 | |
| Reclassifications of KPCo Pension and OPEB Regulatory Assets to AOCI, Net of Income Tax (Expense) Benefit | | — | | | — | | | | | — | | | 16.7 | | | 16.7 | |
| Net Current Period Other Comprehensive Income (Loss) | | (118.6) | | | (8.4) | | | | | (12.6) | | | 0.4 | | | (139.2) | |
| | | | | | | | | | | | |
| | | | | | | | | | | | |
| Balance in AOCI as of December 31, 2023 | | $ | 104.9 | | | $ | (8.1) | | | | | $ | 92.6 | | | $ | (244.9) | | | $ | (55.5) | |
| | | | | | | | | | | | | | | | | | | | | | | | | | | | | | | | | | |
| | | Cash Flow Hedges | | | | Pension and OPEB | | |
| For the Year Ended December 31, 2022 | | Commodity | | Interest Rate | | | | Amortization of Deferred Costs | | Changes in Funded Status | | Total |
| | | (in millions) |
| Balance in AOCI as of December 31, 2021 | | $ | 163.7 | | | $ | (21.3) | | | | | $ | 115.6 | | | $ | (73.2) | | | $ | 184.8 | |
| Change in Fair Value Recognized in AOCI, Net of Tax | | 477.3 | | | 18.4 | | | | | — | | | (155.4) | | | 340.3 | |
| Amount of (Gain) Loss Reclassified from AOCI | | | | | | | | | | | | |
| Generation & Marketing Revenues (a) | | 0.1 | | | — | | | | | — | | | — | | | 0.1 | |
| Purchased Electricity, Fuel and Other Consumables Used for Electric Generation (a) | | (528.6) | | | — | | | | | — | | | — | | | (528.6) | |
| Interest Expense (a) | | — | | | 4.0 | | | | | — | | | — | | | 4.0 | |
| Amortization of Prior Service Cost (Credit) | | — | | | — | | | | | (21.8) | | | — | | | (21.8) | |
| Amortization of Actuarial (Gains) Losses | | — | | | — | | | | | 8.6 | | | — | | | 8.6 | |
| Reclassifications from AOCI, before Income Tax (Expense) Benefit | | (528.5) | | | 4.0 | | | | | (13.2) | | | — | | | (537.7) | |
| Income Tax (Expense) Benefit | | (111.0) | | | 0.8 | | | | | (2.8) | | | — | | | (113.0) | |
| Reclassifications from AOCI, Net of Income Tax (Expense) Benefit | | (417.5) | | | 3.2 | | | | | (10.4) | | | — | | | (424.7) | |
| Reclassifications of KPCo Pension and OPEB Regulatory Assets to AOCI, before Income Tax (Expense) Benefit | | — | | | — | | | | | — | | | (21.1) | | | (21.1) | |
| Income Tax (Expense) Benefit | | — | | | — | | | | | — | | | (4.4) | | | (4.4) | |
| Reclassifications of KPCo Pension and OPEB Regulatory Assets to AOCI, Net of Income Tax (Expense) Benefit | | — | | | — | | | | | — | | | (16.7) | | | (16.7) | |
| Net Current Period Other Comprehensive Income (Loss) | | 59.8 | | | 21.6 | | | | | (10.4) | | | (172.1) | | | (101.1) | |
| | | | | | | | | | | | |
| | | | | | | | | | | | |
| Balance in AOCI as of December 31, 2022 | | $ | 223.5 | | | $ | 0.3 | | | | | $ | 105.2 | | | $ | (245.3) | | | $ | 83.7 | |
(a)Amounts reclassified to the referenced line item on the statements of income.
4. RATE MATTERS
The disclosures in this note apply to all Registrants unless indicated otherwise.
The Registrants are involved in rate and regulatory proceedings at the FERC and their state commissions. Rate matters can have a material impact on net income, cash flows and possibly financial condition. The Registrants’ recent significant rate orders and pending rate filings are addressed in this note.
AEP Texas Rate Matters (Applies to AEP and AEP Texas)
2024 AEP Texas Base Rate Case
In February 2024, AEP Texas filed a request with the PUCT for a $164 million annual base rate increase over its adjusted test year revenues which include interim transmission and distribution rate updates. AEP Texas’s request is based upon a proposed 10.6% ROE with a capital structure of 55% debt and 45% common equity. The rate case sought a prudence determination on all capital additions placed in service during the period January 1, 2019 through September 30, 2023. In July 2024, AEP Texas filed an unopposed settlement agreement with the PUCT. The settlement agreement included a proposed annual revenue increase of $70 million based upon a 9.76% ROE with a capital structure of 57.5% debt and 42.5% common equity. In addition, the settlement agreement approved the prudency of capital investments placed in service for the period January 1, 2019 through September 30, 2023 and the associated interim revenues collected on those capital investments. In October 2024, the PUCT issued a final order approving the settlement agreement without modification.
APCo and WPCo Rate Matters (Applies to AEP and APCo)
ENEC (Expanded Net Energy Cost) Filings
In January 2024, the WVPSC issued an order resolving APCo’s and WPCo’s ( the Companies) 2021-2023 ENEC cases. In the order, the WVPSC: (a) disallowed $232 million in ENEC under-recovered costs as of February 28, 2023 ($136 million related to APCo) and (b) approved the recovery of $321 million of ENEC under-recovered costs as of February 28, 2023 ($174 million related to APCo) plus a 4% debt carrying charge rate over a ten-year recovery period starting September 1, 2024.
In February 2024, the Companies filed briefs with the West Virginia Supreme Court (WVSC) to initiate an appeal of the January 2024 order. Following arguments that were held in September 2024, the WVSC issued a November 2024 opinion affirming in part and reversing in part the WVPSC’s January 2024 ENEC order. The WVSC remanded the ENEC case to the WVPSC to afford the Companies an opportunity to examine, analyze, rebut and refute the effect of the evidence associated with the $232 million disallowance. Staff and intervenor testimony is due in August 2025 and a hearing is scheduled for October 2025.
In April 2024, the Companies submitted their annual ENEC update filing with the WVPSC proposing a $58 million annual increase in ENEC rates when compared to existing ENEC rates. The Companies proposed that this ENEC rate change would: (a) become effective September 1, 2024, (b) include a $20 million annual increase in ENEC rates related to the period ending February 29, 2024 and the forecast period September 2024 through August 2025 and (c) include a $38 million annual increase in ENEC rates for the recovery of $321 million of ENEC under-recovered costs as of February 28, 2023 over a ten-year period, plus a 4% debt carrying charge rate. In July 2024, intervenors and staff filed testimony with the WVPSC, which did not recommend any disallowances.
In August 2024, the WVPSC issued an order approving the requested $38 million annual increase effective September 1, 2024. The WVPSC will address the proposed additional $20 million annual increase in ENEC rates in a future order. If any costs included in the future filing are not approved for recovery, it could reduce future net income and cash flows and impact financial condition.
Virginia Fuel Adjustment Clause (FAC) Review
In 2023, APCo submitted its annual fuel cost filing with the Virginia SCC. Interim Virginia FAC rates were implemented in November 2023. In APCo's 2022 Virginia fuel update filing, the Virginia staff ordered the Virginia Staff to commence an audit of APCo’s fuel costs for the years ended December 31, 2019, 2020, 2021 and 2022. The Virginia staff analyzed APCo’s 2019 through 2022 fuel procurement activities and concluded the procurement practices were reasonable and prudent and recommended no disallowances. In May 2024, the Virginia SCC issued an order approving the audit of APCo’s 2019 and 2020 fuel costs but concluded that the review of APCo fuel costs for 2021 and 2022 remains open for further evaluation as part of APCo’s 2024 fuel cost filing.
In September 2024, APCo submitted its annual Virginia fuel cost filing with the Virginia SCC proposing no change in annual APCo Virginia FAC rates charged to customers. In January 2025, an intervening party recommended a minimum fuel under-recovery disallowance of $20 million related to alleged imprudent operations of Amos and Mountaineer generating units during October 2021 and November 2021. There were no other recommended disallowances by intervenors or Virginia Staff regarding APCo’s historical period Virginia fuel under-recovery balance through October 31, 2024. Virginia Staff recommended that the Virginia SCC close APCo’s open review periods related to 2021 and 2022 Virginia fuel costs. A hearing is scheduled for February 2025.
If any fuel costs are not recoverable or refunds are ordered, it could reduce future net income and cash flows and impact financial condition.
2024 Virginia Base Rate Case
In March 2024, APCo filed a request with the Virginia SCC for a $95 million annual increase in base rates based upon a proposed 10.8% ROE and a proposed capital structure of 51% debt and 49% common equity. The requested increase in base rates is primarily due to incremental rate base, proposed capital structure changes including an increase in ROE and proposed increases in distribution and generation operation and maintenance expenses. In September 2024, a hearing was held where APCo updated its requested increase in base rates to $64 million consistent with its rebuttal positions or, alternatively, an increase of $45 million if annual environmental compliance consumable expenses are moved from base rates to recovery through APCo’s environmental rate adjustment clause.
In November 2024, the Virginia SCC issued a final order approving an annual base rate increase of $10 million, effective January 2025, based on a 9.75% ROE.
2024 West Virginia Base Rate Case
In November 2024, APCo and WPCo (the Companies) filed a request with the WVPSC for a net $251 million annual increase in base rates based upon a proposed 10.8% ROE and a proposed capital structure of 52% debt and 48% common equity. The requested net annual increase in base rates excludes the Companies’ proposed $94 million annual Modified Rate Base Cost (MRBC) surcharge update proposed to be effective in a separate proceeding and the existing $21 million annual Mitchell Base Rate Surcharge that are both proposed to be rolled into base rates upon the Companies’ anticipated 2025 change in base rates. The Companies’ proposed base rate increase includes recovery of approximately $118 million in previously deferred major storm expense over a three-year period, capital structure changes including an increase in ROE, an increase in depreciation expense related to proposed changes in depreciation rates and increased capital investments and increases in distribution and generation operation and maintenance expenses.
The Companies’ November 2024 West Virginia base rate filing also included two sets of alternative frameworks to simplify rates and customer bills and provide predictable future rate increases. The Companies’ first framework includes: (a) securitization, (b) approval of a major storm expense recovery and tracking mechanism and (c) freezing of OATT revenues in the ENEC. This framework includes securitization in a concurrent proceeding of approximately $2.4 billion of West Virginia jurisdictional assets including: (a) the Companies’ remaining combined unrecovered ENEC balance related to costs incurred through February 28, 2023, (b) undepreciated West Virginia jurisdictional plant balances as of December 31, 2022 for the Amos, Mitchell and Mountaineer Plants, (c) environmental costs previously approved for recovery through a separate West Virginia surcharge and (d) deferred major storm operation and maintenance costs. Securitization of those items could reduce the Companies’ combined requested increase in annual base rates to $37 million.
The Companies also included an alternative ratemaking proposal that includes: (a) a separate surcharge that would allow the Companies up to a 3% annual increase in overall West Virginia rates for four consecutive years on April 1st of each year after the implementation of base rates in this case, (b) the elimination of all of the Companies’ existing West Virginia jurisdictional surcharges except for the ENEC, with the revenues of these eliminated riders rolled into base rates and (c) the creation of a new West Virginia jurisdictional environmental and new generation surcharge. This alternative proposal would allow the Companies to submit a base rate case filing in advance of and in lieu of the annual April 1st 3% increase and would require the Companies to submit a base rate case filing at the end of the proposed four-year period.
Staff and intervenor testimony is due in April 2025 and a hearing is scheduled for June 2025. If any costs included in this filing are not approved for recovery, it could reduce future net income and cash flows and impact financial condition.
West Virginia Modified Rate Base Cost (MRBC) Surcharge Update Filing
In March 2024, APCo and WPCo (the Companies) submitted an annual MRBC surcharge update filing with the WVPSC requesting a $32 million annual increase in the Companies’ combined MRBC rates. The MRBC is an infrastructure investment tracker that allows limited cost recovery related to capital investments between the Companies’ West Virginia jurisdictional base rate cases. WVPSC staff and an intervening party recommended revenue requirement disallowances in written and verbal testimony and briefs for certain ratemaking issues used to develop the Companies’ proposed MRBC rates, including the West Virginia jurisdictional effect of state deferred income taxes, NOLC and AROs. If any refund liabilities are imposed by the WVPSC, it could reduce future net income and cash flows and impact financial condition.
Hurricane Helene
In late September 2024, the remnants of Hurricane Helene significantly impacted APCo’s Virginia and West Virginia service territories leading to approximately 260,000 customer outages and damages to APCo’s power grid. Storm restoration efforts continued into early October and APCo completed restoration efforts for all customers who lost power by October 6, 2024. As of December 31, 2024, APCo incurred and deferred an estimated $98 million ($72 million related to the Virginia jurisdiction and $26 million related to the West Virginia jurisdiction) of incremental other operation and maintenance expenses. APCo will seek recovery of the deferred West Virginia jurisdictional incremental other operation and maintenance expenses in a future filing while recovery of the deferred Virginia jurisdictional share will be requested as part of APCo’s 2024-2025 Virginia Biennial earnings review. If any costs related to Hurricane Helene are not recoverable, it could reduce future net income and cash flows and impact financial condition.
ETT Rate Matters (Applies to AEP)
ETT Interim Transmission Rates
AEP has a 50% equity ownership interest in ETT. Predominantly all of ETT’s revenues are based on interim rate changes that can be filed twice annually and are subject to review and possible true-up in the next base rate proceeding. Through December 31, 2024, AEP’s share of ETT’s cumulative revenues from interim base rate increases that are subject to a prudency review is approximately $1.8 billion. The 2025 ETT base rate case described below could result in a refund to customers if ETT incurs a disallowance of the transmission investment on which an interim increase was based. Management is unable to determine a range of potential losses, if any, that are reasonably possible of occurring. A revenue decrease, including a refund of interim transmission rates, could reduce future net income and cash flows and impact financial condition.
2025 ETT Base Rate Case
In January 2025, ETT filed a request with the PUCT for a $57 million annual base rate increase over its adjusted test year revenues which includes interim transmission rate updates. ETT’s request is based upon a proposed 10.6% ROE with a capital structure of 55% debt and 45% common equity. The rate case seeks a prudence review determination on cumulative capital additions included in interim rates. A procedural schedule for the case is pending. If any of the costs in the case are not recoverable or refunds collected under interim transmission rates are ordered to be returned, it could reduce future net income and cash flows and impact financial condition.
I&M Rate Matters (Applies to AEP and I&M)
2023 Michigan Power Supply Cost Recovery (PSCR) Reconciliation
In March 2024, I&M submitted its 2023 PSCR Reconciliation to the MPSC. In October 2024, MPSC staff and intervenors submitted testimony recommending PSCR cost disallowances associated with the OVEC Inter-Company Power Agreement and the Rockport UPA with AEGCo ranging from $3 million to $15 million. A hearing was held in December 2024. If any PSCR costs are not recoverable, it could reduce future net income and cash flows and impact financial condition.
2023 Indiana Base Rate Case
In August 2023, I&M filed a request with the IURC for a $116 million annual increase in Indiana base rates based upon a 2024 forecasted test year, a proposed 10.5% ROE and a proposed capital structure of 48.8% debt and 51.2% common equity. I&M proposed that the annual increase in base rates be implemented in two steps, with the first increase effective in mid-2024, following an IURC order, and the second increase effective in January 2025. The proposed annual increase includes, but is not limited to, a $41 million increase related to depreciation expense, driven by increased depreciation rates and increased capital investments, and a $15 million increase related to storm expenses. I&M’s Indiana base case filing requested recovery of certain historical period regulatory asset balances and proposed deferral accounting for certain future investments and tax-related issues, including CAMT expense and PTCs related to the Cook Plant.
In December 2023, I&M and intervenors reached a settlement agreement that was submitted to the IURC recommending a two-step increase in Indiana rates with a $28 million annual increase effective upon an IURC order and the remaining $34 million annual increase effective in January 2025 subject to I&M’s level of electric plant in service as of December 31, 2024 in comparison to I&M’s 2024 forecasted test year. The recommended revenue increase includes: (a) a 9.85% ROE, (b) a two-step update of I&M’s Indiana capital structure with a capital structure of 50% for both debt and common equity effective upon an IURC order and a January 2025 update based on I&M’s actual capital structure as of December 31, 2024 with common equity not to exceed 51.2%, (c) a $25 million increase related to depreciation expense and (d) an $11 million increase related to storm expenses. In addition, I&M also agreed to withdraw its proposal to defer CAMT and Cook Plant PTCs and to instead include the Indiana jurisdictional impact of Cook Plant PTCs in I&M’s Indiana earnings test evaluations. See “Indiana Earnings Test” below for additional information.
In May 2024, the IURC issued an order approving the settlement agreement with minor modifications. In January 2025, in accordance with the IURC’s order on I&M’s 2023 Indiana base case filing, I&M submitted a filing with the IURC reflecting December 31, 2024 balances of electric plant in service in comparison to I&M’s 2024 forecasted test year, resulting in a $15 million annual increase in I&M Indiana base rates effective January 2025.
2023 Michigan Base Rate Case
In September 2023, I&M filed a request with the MPSC for a $34 million annual increase in Michigan base rates based upon a 2024 forecasted test year, a proposed 10.5% ROE and a capital structure of 49.4% debt and 50.6% common equity. The proposed annual increase includes an $11 million annual increase in depreciation expense driven by increased capital investment. I&M’s Michigan base case filing requests recovery of certain historical period regulatory asset balances and proposes deferral accounting for certain future investments and tax-related issues, including CAMT expense and PTCs related to the Cook Plant.
In July 2024, the MPSC issued a final order approving an annual base rate increase of $17 million based on a 9.86% ROE and a capital structure of 52% debt and 48% common equity. The MPSC also ordered that Michigan jurisdictional Cook Plant PTCs will be reflected as a deferral in I&M’s PSCR reconciliation and rejected I&M’s request to defer Michigan jurisdictional CAMT.
Indiana Earnings Test
I&M is required by Indiana law to submit an earnings test evaluation for the most recent one-year and five-year periods as part of I&M’s semi-annual Indiana FAC filings. These earnings test evaluations require I&M to include a credit in the FAC factor computation for periods in which I&M earned above its authorized return for both the one-year and five-year periods. The credit is determined as 50% of the lower of the one-year or five-year earnings above the authorized level. Management believes its financial statements adequately address the impact of Indiana earnings test requirements. If future IURC orders require that I&M provide credits in the FAC factor computation, it could reduce future net income and cash flows and impact financial condition.
In July 2024, I&M submitted its FAC filing and earnings test evaluation for the period ended May 2024. In September 2024, an intervenor submitted testimony suggesting that I&M failed to prorate calculations of I&M’s authorized net operating income used to establish the earnings test ceiling to reflect the last two Indiana base rate cases. In November 2024, the IURC issued an order on I&M’s July 2024 FAC filing concluding that I&M should have prorated the authorized net operating income for the May 2024 earnings test purposes. A resulting over-earnings credit to customers for the earnings test period ending May 2024 of $18 million was included in I&M’s updated FAC rates that became effective in December 2024.
In January 2025, I&M submitted its FAC filing and earnings test evaluation for the period ended November 2024. I&M proposed an over-earnings credit to customers for the earnings test period ending November 2024 of $21 million. I&M also proposed to the IURC that intervenor testimony be due in March 2025.
KPCo Rate Matters (Applies to AEP)
Investigation of the Service, Rates and Facilities of KPCo
In June 2023, the KPSC issued an order directing KPCo to show cause why it should not be subject to Kentucky statutory remedies, including fines and penalties, for failure to provide adequate service in its service territory. The KPSC’s show cause order did not make any determination regarding the adequacy of KPCo’s service. In July 2023, KPCo filed a response to the show cause order demonstrating that it has provided adequate service. In December 2023 and February 2024, KPCo and certain intervenors filed testimony with the KPSC. A hearing with the KPSC was previously scheduled to occur in June 2024. The hearing was postponed and has not yet been rescheduled. If any fines or penalties are levied against KPCo relating to the show cause order, it could reduce net income and cash flows and impact financial condition.
2023 Kentucky Base Rate and Securitization Case
In June 2023, KPCo filed a request with the KPSC for a $94 million net annual increase in base rates based upon a proposed 9.9% ROE with the increase to be implemented no earlier than January 2024. In conjunction with its June 2023 filing, KPCo further requested to finance through the issuance of securitization bonds, approximately $471 million of regulatory assets. KPCo’s proposal did not address the disposition of its 50% interest in Mitchell Plant, which will be addressed in the future. As of December 31, 2024, the net book value of KPCo’s share of the Mitchell Plant, before cost of removal including CWIP and inventory, was $547 million. If any of these costs are not recoverable, it could reduce future net income and cash flows and impact financial condition.
In November 2023, KPCo filed an uncontested settlement agreement with the KPSC, that included an annual base rate increase of $75 million, based upon a 9.75% ROE. Settlement parties agreed that the KPSC should approve KPCo’s securitization request, and that the approximately $471 million regulatory assets requested for securitization are comprised of prudently incurred costs.
In January 2024, the KPSC issued an order modifying the November 2023 uncontested settlement agreement and approving an annual base rate increase of $60 million based upon a 9.75% ROE effective with billing cycles mid-January 2024. The order reduced KPCo’s base rate revenue requirement by $14 million to allow recovery of actual test year PJM transmission costs instead of KPCo’s requested annual level of costs based on PJM 2023 projected transmission revenue requirements. In February 2024, KPCo filed an appeal with the Commonwealth of Kentucky Franklin Circuit Court, challenging among other aspects of the order, the $14 million base rate revenue requirement reduction. In January 2025, the Commonwealth of Kentucky Franklin Circuit Court issued an order agreeing with KPCo’s appeal and remanded this issue back to the KPSC with instructions to enter an order, within 30 days, which includes setting rates to allow KPCo to recover the $14 million of annual PJM transmission costs effective upon KPCo's January 2024 implementation of updated base rates.
In January 2024, consistent with the November 2023 uncontested settlement agreement, the KPSC issued a financing order approving KPCo’s request to securitize certain regulatory assets balances as of the time securitization bonds are issued and concluding that costs requested for recovery through securitization were prudently incurred. The KPSC’s financing order includes certain additional requirements related to securitization bond structuring, marketing, placement and issuance that were not reflected in KPCo’s proposal. In accordance with Kentucky statutory requirements and the financing order, the issuance of the securitized bonds is subject to final review by the KPSC after bond pricing. KPCo expects to proceed with the securitized bond issuance process and to complete the securitization process in the first half of 2025, subject to market conditions. As of December 31, 2024, regulatory asset balances expected to be recovered through securitization total $491 million and include: (a) $303 million of plant retirement costs, (b) $79 million of deferred storm costs related to 2020, 2021, 2022 and 2023 major storms, (c) $50 million of deferred purchased power expenses, (d) $57 million of under-recovered purchased power rider costs and (e) $2 million of deferred issuance-related expenses, including KPSC advisor expenses. If any of these costs are not recoverable, it could reduce future net income and cash flows and impact financial condition.
Fuel Adjustment Clause (FAC) Review
In December 2023, KPCo received intervenor testimony in its FAC review for the two-year period ending October 31, 2022, recommending a disallowance ranging from $44 million to $60 million of its total $432 million purchased power cost recoveries as a result of proposed modifications to the ratemaking methodology that limits purchased power costs recoverable through the FAC. In November 2024, KPCo and intervening parties entered into a settlement agreement whereby KPCo agreed to provide customer rate credits, which will reduce FAC costs otherwise recoverable in 2025 and 2026, for a combined
$17 million over the periods January 2025 through April 2025 and January 2026 through April 2026 based on actual customer usage. In December 2024, the KPSC issued an order approving the settlement agreement without modification.
Rockport Offset Recovery
In January 2024, KPCo filed an application with the KPSC seeking to recover an allowed cost (Rockport Offset) of $41 million in accordance with the terms of the settlement agreement in the 2017 Kentucky Base Rate Case permitting KPCo to use the level of non-fuel, non-environmental Rockport Plant UPA expense included in base rates to earn its authorized ROE in 2023 since the Rockport UPA ended in December 2022. An estimated Rockport Offset of $23 million was recovered through a rider, subject to true-up, during the 12-months ended December 2023. In February 2024, the KPSC issued an order allowing KPCo to collect the remaining $18 million through interim rates, subject to refund, over twelve months starting in March 2024. In August 2024, KPCo filed an application with the KPSC to extend the recovery of the remaining balance through September 2025. In the fourth quarter of 2024, the KPSC issued orders approving KPCo’s application to extend recovery of the Rockport Offset and affirming collection of $18 million.
OPCo Rate Matters (Applies to AEP and OPCo)
OVEC Cost Recovery Audits
In December 2021, as part of OVEC cost recovery audits pending before the PUCO, intervenors filed positions claiming that costs incurred by OPCo during the 2018-2019 audit period were imprudent and should be disallowed. In May 2022, intervenors filed for rehearing on the 2016-2017 OVEC cost recovery audit period claiming the PUCO’s April 2022 order to adopt the findings of the audit report were unjust, unlawful and unreasonable for multiple reasons, including the position that OPCo recovered imprudently incurred costs. In May 2023, as part of the OVEC cost recovery audits pending before the PUCO, intervenors filed positions claiming that costs incurred by OPCo during the 2020 audit period were imprudent and should be disallowed.
In August 2024, the PUCO issued orders pertaining to the OVEC cost recovery audits that: (a) denied intervenors’ application for rehearing on the 2016-2017 audit period, (b) determined costs incurred by OPCo during the 2018-2019 audit period were prudent, (c) determined costs incurred by OPCo during the 2020 audit period were prudent and (d) recommended no disallowances for any mentioned audit period in question. In September 2024, intervenors filed for rehearing on the 2018-2019 and 2020 OVEC cost recovery audit periods claiming the PUCO’s August 2024 orders to adopt the findings of the audit reports were unjust, unlawful and unreasonable for multiple reasons, including the position that OPCo recovered imprudently incurred costs. In October 2024, the PUCO denied the intervenors’ applications for rehearing of the 2018-2019 and 2020 audit periods. In December 2024, intervenors filed appeals with the Supreme Court of Ohio on the PUCO’s denial for rehearing.
Ohio ESP Filings
In January 2023, OPCo filed an application with the PUCO to approve an ESP that included proposed rate adjustments, proposed new riders and the continuation and modification of certain existing riders, including the DIR, effective June 2024 through May 2030. The proposal includes a return on common equity of 10.65% on capital costs for certain riders. In June 2023, intervenors filed testimony opposing OPCo’s plan for various new riders and modifications to existing riders, including the DIR. In September 2023, OPCo and certain intervenors filed a settlement agreement with the PUCO addressing the ESP application. The settlement included a four year term from June 2024 through May 2028, an ROE of 9.7% and continuation of a number of riders including the DIR subject to revenue caps. In April 2024, the PUCO issued an order approving the settlement agreement. In May 2024, intervenors filed an application for rehearing with the PUCO on the approved settlement agreement and the PUCO denied the intervenors’ application for rehearing in June 2024.
PSO Rate Matters (Applies to AEP and PSO)
2024 Oklahoma Base Rate Case
In January 2024, PSO filed a request with the OCC for a $218 million annual base rate increase based upon a 10.8% ROE with a capital structure of 48.9% debt and 51.1% common equity. PSO requested an expanded transmission cost recovery rider and a mechanism to recover generation costs necessary to comply with SPP’s 2023 increased capacity planning reserve margin requirements. PSO’s request includes the 155 MW Rock Falls Wind Facility and reflects recovery of Northeastern Plant, Unit 3 through 2040.
In October 2024, PSO, the OCC and certain intervenors filed a joint stipulation and settlement agreement with the OCC that included a net annual revenue increase of $120 million based upon a 9.5% ROE with a capital structure of 48.9% debt and 51.1% common equity. The agreement also allows for Rock Falls Wind Facility to be included in base rates and the deferral of certain generation-related costs necessary to comply with SPP’s 2023 increased capacity reserve margin requirements. One
intervenor opposed the joint stipulation and settlement agreement. In October 2024, a hearing was held at the OCC, and PSO implemented an interim annual base rate increase of $120 million, subject to refund pending a final order by the OCC.
In January 2025, the OCC issued a final order approving the joint stipulation and settlement agreement without modification.
SWEPCo Rate Matters (Applies to AEP and SWEPCo)
2012 Texas Base Rate Case
In 2012, SWEPCo filed a request with the PUCT to increase annual base rates primarily due to the completion of the Turk Plant. In 2013, the PUCT issued an order affirming the prudence of the Turk Plant but determined that the Turk Plant’s Texas jurisdictional capital cost cap established in a previous Certificate of Convenience and Necessity case also limited SWEPCo’s recovery of AFUDC in addition to limits on its recovery of cash construction costs.
Upon rehearing in 2014, the PUCT reversed its initial ruling and determined that AFUDC was excluded from the Turk Plant’s Texas jurisdictional capital cost cap. As a result, SWEPCo reversed $114 million of a previously recorded regulatory disallowance in 2013. In 2017, the Texas District Court upheld the PUCT’s 2014 order and intervenors filed appeals with the Texas Third Court of Appeals.
In August 2021, the Texas Third Court of Appeals reversed the Texas District Court judgment affirming the PUCT’s order on AFUDC, concluding that the language of the PUCT’s original 2008 order intended to include AFUDC in the Texas jurisdictional capital cost cap, and remanded the case to the PUCT for future proceedings. In November 2021, SWEPCo and the PUCT submitted Petitions for Review with the Texas Supreme Court. In October 2022, the Texas Supreme Court denied the Petitions for Review submitted by SWEPCo and the PUCT. In December 2022, SWEPCo and the PUCT filed requests for rehearing with the Texas Supreme Court. In June 2023, the Texas Supreme Court denied SWEPCo’s request for rehearing and the case was remanded to the PUCT for future proceedings. In October 2023, SWEPCo filed testimony with the PUCT in the remanded proceeding recommending no refund or disallowance.
In December 2023, the PUCT approved a preliminary order stating the PUCT will not address SWEPCo’s request that would allow the PUCT to find cause to allow SWEPCo to exceed the Texas jurisdictional capital cost cap in the current remand proceeding. As a result of the PUCT’s approval of the preliminary order, SWEPCo recorded a pretax, non-cash probable disallowance of $86 million in the fourth quarter of 2023.
The PUCT’s December 2023 approval of the preliminary order determined that it will address, in the ongoing PUCT remand proceeding, any potential revenue refunds to customers that may be required by future PUCT orders. On March 1, 2024, SWEPCo filed supplemental direct testimony with the PUCT in response to the December 2023 preliminary order. On March 8, 2024, intervenors and the PUCT staff filed a motion with the PUCT to strike portions of SWEPCo’s October 2023 direct testimony and March 2024 supplemental direct testimony. On March 19, 2024, the ALJ granted portions of the motion, which included removal of testimony supporting SWEPCo’s position that refunds were not appropriate. On March 28, 2024, SWEPCo filed an appeal of the ALJ decision with the PUCT. In April 2024, intervenors and PUCT staff submitted testimony recommending customer refunds through December 2023 ranging from $149 million to $197 million, including carrying charges, with refund periods ranging from 18 months to 48 months. In May 2024, the PUCT denied SWEPCo’s appeal of the ALJ’s March 2024 decision. In the second quarter of 2024, based on the PUCT’s decision, SWEPCo recorded a one-time, probable revenue refund provision of $160 million, including interest, associated with revenue collected from February 2013 through December 2023. In June 2024, SWEPCo and parties to the remand proceeding reached an agreement in principle that would resolve all issues in the case. In October 2024, SWEPCo filed the settlement agreement with the PUCT. Under the settlement agreement, SWEPCo would refund, over a two-year period, $148 million, including interest, associated with revenue collected from February 2013 through December 2023 and remove AFUDC in excess of the Texas jurisdictional capital cost cap from rate base. In January 2025, the settlement agreement was approved by the PUCT.
2016 Texas Base Rate Case
In 2016, SWEPCo filed a request with the PUCT for a net increase in Texas annual revenues of $69 million based upon a 10% ROE. In January 2018, the PUCT issued a final order approving a net increase in Texas annual revenues of $50 million based upon a 9.6% ROE, effective May 2017. The final order also included: (a) approval to recover the Texas jurisdictional share of environmental investments placed in-service, as of June 30, 2016, at various plants, including Welsh Plant, Units 1 and 3, (b) approval of recovery of, but no return on, the Texas jurisdictional share of the net book value of Welsh Plant, Unit 2, (c) approval of $2 million in additional vegetation management expenses and (d) the rejection of SWEPCo’s proposed transmission cost recovery mechanism.
As a result of the final order, in 2017 SWEPCo: (a) recorded an impairment charge of $19 million, which included $7 million associated with the lack of return on Welsh Plant, Unit 2 and $12 million related to other disallowed plant investments, (b)
recognized $32 million of additional revenues, for the period of May 2017 through December 2017, that was surcharged to customers in 2018 and (c) recognized an additional $7 million of expenses consisting primarily of depreciation expense and vegetation management expense, offset by the deferral of rate case expense. SWEPCo implemented new rates in February 2018 billings. The $32 million of additional 2017 revenues was collected during 2018. In March 2018, the PUCT clarified and corrected portions of the final order, without changing the overall decision or amounts of the rate change. The order was appealed by various intervenors related to limiting SWEPCo’s recovery of AFUDC on Turk Plant and recovery of Welsh Plant, Unit 2. In December 2024, the appeal was dismissed. If certain parts of the PUCT order are overturned, it could reduce future net income and cash flows and impact financial condition.
2020 Texas Base Rate Case
In October 2020, SWEPCo filed a request with the PUCT for a $105 million annual increase in Texas base rates based upon a proposed 10.35% ROE. The request would move transmission and distribution interim revenues recovered through riders into base rates. Eliminating these riders would result in a net annual requested base rate increase of $90 million primarily due to increased investments. SWEPCo subsequently filed a request with the PUCT lowering the requested annual increase in Texas base rates to $100 million which would result in an $85 million net annual base rate increase after moving the proposed riders to rate base.
In January 2022, the PUCT issued a final order approving an annual revenue increase of $39 million based upon a 9.25% ROE. The order also includes: (a) rates implemented retroactively back to March 18, 2021, (b) $5 million of the proposed increase related to vegetation management, (c) $2 million annually to establish a storm catastrophe reserve and (d) the creation of a rider to recover the Dolet Hills Power Station as if it were in rate base until its retirement at the end of 2021 and starting in 2022 the remaining net book value to be recovered as a regulatory asset through 2046. As a result of the final order, SWEPCo recorded a disallowance of $12 million in 2021 associated with the lack of return on the Dolet Hills Power Station. In February 2022, SWEPCo filed a motion for rehearing with the PUCT challenging several errors in the order, which include challenges of the approved ROE, the denial of a reasonable return or carrying costs on the Dolet Hills Power Station and the calculation of the Texas jurisdictional share of the storm catastrophe reserve. In April 2022, the PUCT denied the motion for rehearing. In May 2022, SWEPCo filed a petition for review with the Texas District Court seeking a judicial review of the several errors challenged in the PUCT’s final order.
2021 Louisiana Storm Cost Filing
In 2020, Hurricanes Laura and Delta caused power outages and extensive damage to the SWEPCo service territories, primarily impacting the Louisiana jurisdiction. Following both hurricanes, the LPSC issued orders allowing Louisiana utilities, including SWEPCo, to establish regulatory assets to track and defer expenses associated with these storms. In February 2021, severe winter weather impacted the Louisiana jurisdiction and in March 2021, the LPSC approved the deferral of incremental storm restoration expenses related to the winter storm. In March 2023, SWEPCo and the LPSC staff filed a joint stipulation and settlement agreement with the LPSC which confirmed the prudency of $150 million of deferred incremental storm restoration expenses. The agreement also authorized an interim carrying charge at a rate of 3.125% through March 2024. In April 2023, the LPSC issued an order approving the stipulation and settlement agreement. In July 2023, SWEPCo submitted additional information in phase two of this proceeding to obtain a financing order and prudency review of capital investment. In April 2024, SWEPCo and the LPSC staff filed a joint uncontested stipulation and settlement agreement with the LPSC requesting securitization of storm costs, including a storm reserve. In July 2024, the LPSC issued an order approving the joint uncontested stipulation and settlement agreement. In December 2024, SWEPCo issued $337 million of securitization bonds. The securitization bonds included $180 million for storm costs related to Hurricanes Laura and Delta and $150 million related to a storm reserve. In June 2023, SWEPCo incurred approximately $44 million in storm costs impacting the Louisiana jurisdiction. As authorized by the LPSC, the June 2023 storm costs were applied against the $150 million storm reserve. Any costs applied against the remaining storm reserve are subject to audit and prudency reviews. SWEPCo is required to accrue carrying charges on the remaining storm reserve liability. The securitization bonds also included $7 million related to estimated financing costs and carrying charges. See “Storm Recovery Funding” section of Note 18 for additional information.
February 2021 Severe Winter Weather Impacts in SPP
In February 2021, severe winter weather had a significant impact in SPP, resulting in significantly increased market prices for natural gas power plants to meet reliability needs for the SPP electric system. For the time period of February 9, 2021, to February 20, 2021, SWEPCo’s natural gas expenses and purchases of electricity still to be recovered from customers are shown in the table below:
| | | | | | | | | | | | | | | | | | | | | | | | | | |
|
| | December 31, | | Approved | | Approved |
| Jurisdiction | | 2024 | | 2023 | | Recovery Period | | Carrying Charge |
| | (in millions) | | | | |
| Arkansas | | $ | 37.2 | | | $ | 54.2 | | | 6 years | | (a) |
| Louisiana | | 70.6 | | | 97.2 | | | (b) | | (b) |
| Texas | | 72.7 | | | 101.9 | | | 5 years | | 1.65% |
| Total | | $ | 180.5 | | | $ | 253.3 | | | | | |
(a)SWEPCo is permitted to record carrying costs on the unrecovered balance of fuel costs at a weighted-cost of capital approved by the APSC. In August 2024, the APSC issued an order that found SWEPCo had prudently incurred these costs.
(b)In March 2021, the LPSC approved a special order granting a temporary modification to the FAC and shortly after SWEPCo began recovery of its Louisiana jurisdictional share of these fuel costs based on a five-year recovery period inclusive of an interim carrying charge equal to the prime rate. The special order states the fuel and purchased power costs incurred will be subject to a future LPSC audit.
If SWEPCo is unable to recover any of the costs relating to the extraordinary fuel and purchases of electricity, or obtain authorization of a reasonable carrying charge on these costs, it could reduce future net income and cash flows and impact financial condition.
Merchant Portion of Turk Plant
SWEPCo constructed the Turk Plant, a base load 600 MW (650 MW net maximum capacity) pulverized coal ultra-supercritical generating unit in Arkansas, which was placed in-service in December 2012 and is included in the Vertically Integrated Utilities segment. SWEPCo owns 73% (440 MWs/477 MWs) of the Turk Plant and operates the facility. As of December 31, 2024, the net book value of the Turk Plant was $1.3 billion, before cost of removal including CWIP and inventory.
Approximately 20% of SWEPCo’s portion of the Turk Plant output is currently not subject to cost-based rate recovery in Arkansas. This portion of the plant’s output is being sold into the wholesale market. Approximately 80% of the Turk Plant investment is recovered under retail cost-based rate recovery in Texas, Louisiana and through SWEPCo’s wholesale customers under FERC-approved rates. In November 2022, SWEPCo filed a Certificate of Public Convenience and Necessity with the APSC for approval to operate the Turk Plant to serve Arkansas customers and recover the associated costs through a cost recovery rider. Cost-based recovery of the Turk Plant would aid SWEPCo’s near-term capacity needs and support compliance with SPP’s 2023 increased capacity planning reserve margin requirements. In April 2023, intervenors filed testimony recommending the APSC deny the Certificate of Public Convenience and Necessity on the basis that the Turk Plant is not the least cost alternative. In March 2024, the APSC issued an order denying SWEPCo’s request to allow the merchant portion of the Turk Plant to serve Arkansas customers. As a result of the APSC’s March 2024 order, SWEPCo recorded a $32 million favorable impact to net income as a result of the reduction to the regulatory liability related to the merchant portion of Turk Plant Excess ADIT.
2024 Texas Fuel Reconciliation
In June 2024, SWEPCo filed a fuel reconciliation with the PUCT for its retail operation in Texas for the period of January 2022 through December 2023. The fuel reconciliation included approximately $535 million in Texas jurisdictional eligible fuel costs. In January 2025, intervenors filed testimony recommending a disallowance of Texas jurisdictional fuel costs ranging from $2 million to $25 million related to the decision made by SWEPCo to retire the Pirkey Plant, management of fuel inventory and SWEPCo’s energy price offers in SPP. Also, in January 2025, the PUCT staff filed testimony agreeing with SWEPCo’s filed fuel reconciliation. In February 2025, SWEPCo filed rebuttal testimony explaining why there should be no disallowance.
PSO and SWEPCo Rate Matters (Applies to AEP, PSO and SWEPCo)
North Central Wind Energy Facilities (NCWF)
The NCWF are subject to various regulatory performance requirements, including a Net Capacity Factor (NCF) guarantee. The NCF guarantee will be measured in MWhs across all facilities on a combined basis for each five year period for the first thirty full years of operation. The first NCF guarantee five year period began in April 2022. Certain wind turbines have experienced performance issues related to defects covered by the manufacturer’s warranty. These performance issues have prompted PSO and SWEPCo to file a lawsuit against the manufacturer in an attempt to find a resolution on the matter. If regulatory performance requirements, such as the NCF guarantee, are not met, PSO and SWEPCo may recognize a regulatory liability associated with a refund to retail customers. Management is unable to determine a range of potential losses that is reasonably possible of occurring.
FERC Rate Matters
Independence Energy Connection Project (Applies to AEP)
In 2016, PJM approved the Independence Energy Connection Project (IEC) and included it in its Regional Transmission Expansion Plan to alleviate congestion. Transource Energy has an ownership interest in the IEC, which is located in Maryland and Pennsylvania. In June 2020, the Maryland Public Service Commission approved a Certificate of Public Convenience and Necessity to construct the portion of the IEC in Maryland. In May 2021, the Pennsylvania Public Utility Commission (PAPUC) denied the IEC certificate for siting and construction of the portion in Pennsylvania. Transource Energy appealed the PAPUC ruling in Pennsylvania state court and challenged the ruling before the United States District Court for the Middle District of Pennsylvania. In May 2022, the Pennsylvania state court issued an order affirming the PAPUC decision as to state law claims. In December 2023, the United States District Court for the Middle District of Pennsylvania granted summary judgment in favor of Transource Energy, finding that the PAPUC decision violated federal law and the United States Constitution. In January 2024, the PAPUC filed an appeal of the district court’s grant of summary judgment with the United States Court of Appeals for the Third Circuit. Additional regulatory proceedings before the PAPUC are expected to resume in 2025.
In September 2021, PJM notified Transource Energy that the IEC was suspended to allow for the regulatory and related appeals process to proceed in an orderly manner without breaching milestone dates in the project agreement. At that time, PJM stated that the IEC has not been canceled and remains necessary to alleviate congestion. PJM continues to evaluate reliability and market efficiency in the area. As of December 31, 2024, AEP’s share of IEC capital expenditures was approximately $96 million, located in Total Property, Plant and Equipment - Net on AEP’s balance sheets. The FERC has previously granted abandonment benefits for this project, allowing the full recovery of prudently incurred costs if the project is canceled for reasons outside the control of Transource Energy. If any of the IEC costs are not recoverable, it could reduce future net income and cash flows and impact financial condition.
Request to Update AEGCo Depreciation Rates (Applies to AEP and I&M)
In October 2022, AEP, on behalf of AEGCo, submitted proposed revisions to AEGCo’s depreciation rates for its 50% ownership interest in Rockport Plant, Unit 1 and Unit 2, reflected in the UPA between AEGCo and I&M. The proposed depreciation rates for these assets reflect an estimated 2028 retirement date for the Rockport Plant. AEGCo’s previous FERC-approved depreciation rates for Rockport Plant, Unit 1 were based upon a December 31, 2028 estimated retirement date while AEGCo’s previous FERC-approved depreciation rates for Rockport Plant, Unit 2 leasehold improvements were based upon a December 31, 2022 estimated retirement date in conjunction with the termination of the Rockport Plant, Unit 2 lease.
In December 2022, the FERC issued an order approving the proposed AEGCo Rockport depreciation rates effective January 1, 2023, subject to further review and a potential refund. In August 2023, AEGCo reached a settlement agreement with the FERC trial staff that resolved all issues set for hearing. In September 2023, the settlement agreement was certified to the FERC as uncontested. In March 2024, the FERC issued an order approving the uncontested settlement agreement. The results of the order did not have a material impact on financial condition, results of operations or cash flows.
FERC 2021 PJM and SPP Transmission Formula Rate Challenge (Applies to AEP, AEPTCo, APCo, I&M, PSO and SWEPCo)
The Registrants transitioned to stand-alone treatment of NOLCs in its PJM and SPP transmission formula rates beginning with the 2022 projected transmission revenue requirements and 2021 true-up to actual transmission revenue requirements, and provided notice of this change in informational filings made with the FERC. Stand-alone treatment of the NOLCs for transmission formula rates increased the annual revenue requirements for years 2024, 2023, 2022 and 2021 by $52 million, $61 million, $69 million and $78 million, respectively.
In January 2024, the FERC issued two orders granting formal challenges by certain unaffiliated customers related to stand-alone treatment of NOLCs in the 2021 Transmission Formula Rates of the AEP transmission owning subsidiaries within PJM and SPP. The FERC directed the AEP transmission owning subsidiaries within PJM and SPP to provide refunds with interest on all amounts collected for the 2021 rate year, and for such refunds to be reflected in the annual update for the next rate year. Accordingly, in the third quarter of 2024, the AEP transmission owning subsidiaries within SPP provided a portion of the 2021 rate year refunds, with the remainder of the refunds expected to be provided in 2025. The AEP transmission owning subsidiaries within PJM are expected to provide their respective refunds for the 2021 rate year in 2025. In February 2024, AEPSC on behalf of the AEP transmission owning subsidiaries within PJM and SPP filed requests for rehearing. In March 2024, the FERC denied AEPSC’s requests for rehearing of the January 2024 orders by operation of law and stated it may address the requests for rehearing in future orders. In March 2024, AEPSC submitted refund compliance reports to the FERC, which preserve the non-finality of the FERC’s January 2024 orders pending further proceedings on rehearing and appeal. In April 2024, AEPSC made filings with the FERC which request that the FERC: (a) reopen the record so that the FERC may take the IRS PLRs received in April 2024 regarding the treatment of stand-alone NOLCs in ratemaking into evidence and consider them in substantive orders on rehearing and (b) stay its January 2024 orders and related compliance filings and refunds to provide time for consideration of the April 2024 IRS PLRs. In May 2024, AEPSC filed a petition for review with the United States Court of Appeals for the District of Columbia Circuit seeking review of the FERC’s January 2024 and March 2024 decisions. In July 2024, the FERC issued orders approving AEPSC’s request to reopen the record for the limited purpose of accepting into the record the IRS PLRs and establish additional briefing procedures. In August 2024, AEPSC filed briefs with the FERC requesting the commission modify or overturn their initial orders.
As a result of the January 2024 FERC orders, the Registrants’ balance sheets reflect a liability for the probable refund of all NOLC revenues included in transmission formula rates for years 2024, 2023, 2022 and 2021, with interest. The Registrants have not yet been directed to make cash refunds related to the 2024, 2023 or 2022 rate years. The probable refunds to affiliated and nonaffiliated customers are reflected as Deferred Credits and Other Noncurrent Liabilities on the balance sheets, with the exception of amounts expected to be refunded within one year which are reflected in Other Current Liabilities. Refunds probable to be received by affiliated companies, resulting in a reduction to affiliated transmission expense, were deferred as an increase to Regulatory Liabilities or a reduction to Regulatory Assets on the balance sheets where management expects that refunds would be returned to retail customers through authorized retail jurisdiction rider mechanisms.
Request to Update SWEPCo Generation Depreciation Rates (Applies to AEP and SWEPCo)
In October 2023, SWEPCo filed an application to revise its generation wholesale customer’s contracts to reflect an increase in the annual revenue requirement of approximately $5 million for updated depreciation rates and allow for the return on and of FERC customers jurisdictional share of regulatory assets associated with retired plants. In November 2023, certain intervenors filed a motion with the FERC protesting and recommending the rejection of SWEPCo’s filings. In December 2023, the FERC issued an order approving the proposed rates effective January 1, 2024, subject to further review and refund and established hearing and settlement proceedings. If SWEPCo is unable to recover the remaining regulatory assets associated with retired plants, or refunds of revenues collected under interim rates are ordered to be returned, it could reduce future net income and cash flows and impact financial condition.
5. EFFECTS OF REGULATION
The disclosures in this note apply to all Registrants unless indicated otherwise.
Regulated Generating Units (Applies to AEP, PSO and SWEPCo)
Compliance with extensive environmental regulations requires significant capital investment in environmental monitoring, installation of pollution control equipment, emission fees, disposal costs and permits. Management continuously evaluates cost estimates of complying with these regulations in balance with reliability and other factors, which has resulted in, and in the future may result in, a proposal to retire generating facilities earlier than their currently estimated useful lives.
Management is seeking or will seek regulatory recovery, as necessary, for any net book value remaining when the plants are retired. To the extent the net book value of these generation assets is not deemed recoverable, it could reduce future net income and cash flows and impact financial condition.
Regulated Generating Units that have been Retired
SWEPCo
In December 2021, the Dolet Hills Power Station was retired. As part of the 2020 Texas Base Rate Case, the PUCT authorized recovery of SWEPCo’s Texas jurisdictional share of the Dolet Hills Power Station through 2046, but denied SWEPCo the ability to earn a return on this investment resulting in a disallowance of $12 million in 2021. See “2020 Texas Base Rate Case” section of Note 4 for additional information. As part of the 2021 Arkansas Base Rate Case, the APSC authorized recovery of SWEPCo’s Arkansas jurisdictional share of the Dolet Hills Power Station through 2027, but denied SWEPCo the ability to earn a return on this investment resulting in a disallowance of $2 million in the second quarter of 2022. Also, the APSC did not rule on the prudency of the early retirement of the Dolet Hills Power Station, which will be addressed in a future proceeding. As part of the 2020 Louisiana Base Rate Case, the LPSC authorized the recovery of SWEPCo’s Louisiana share of the Dolet Hills Power Station, through a separate rider, through 2032, but did not rule on the prudency of the early retirement of the plant, which is being addressed in a separate proceeding. In April 2024, the LPSC approved a unanimous settlement agreement filed by SWEPCo, LPSC staff and certain intervenors that resolved the prudency of the retirement of the Dolet Hills Power Station and resulted in a disallowance of $14 million in the first quarter of 2024.
In March 2023, the Pirkey Plant was retired. As part of the 2020 Louisiana Base Rate Case, the LPSC authorized the recovery of SWEPCo’s Louisiana jurisdictional share of the Pirkey Plant, through a separate rider, through 2032. As part of the 2021 Arkansas Base Rate Case, the APSC granted SWEPCo regulatory asset treatment. SWEPCo will request recovery including a weighted average cost of capital carrying charge through a future proceeding. In July 2023, Texas ALJs issued a PFD that concluded the decision to retire the Pirkey Plant was prudent. In September 2023, the PUCT rejected the ALJs’ July 2023 PFD. In the open meeting, the commissioners expressed their concerns that the analysis in support of SWEPCo’s decision to retire the Pirkey Plant was not robust enough and that SWEPCo should have re-evaluated the decision following Winter Storm Uri. The treatment of the cost of recovery of the Pirkey Plant is expected to be addressed in a future rate case. As of December 31, 2024, the Texas jurisdictional share of the net book value of the Pirkey Plant was $69 million. To the extent any portion of the Texas jurisdictional share of the net book value of the Pirkey Plant is not recoverable, it could reduce future net income and cash flows and impact financial condition.
Regulated Generating Units to be Retired
PSO
In 2014, PSO received final approval from the Federal EPA to close Northeastern Plant, Unit 3, in 2026. The plant was originally scheduled to close in 2040. As a result of the early retirement date, PSO revised the useful life of Northeastern Plant, Unit 3, to the projected retirement date of 2026 and the incremental depreciation is being deferred as a regulatory asset. Following the 2024 Oklahoma Base Rate Case, PSO continues to recover Northeastern Plant, Unit 3 through 2040.
SWEPCo
In November 2020, management announced that it will cease using coal at the Welsh Plant in 2028. As a result of the announcement, SWEPCo began recording a regulatory asset for accelerated depreciation. In December 2024, SWEPCo filed an application for a Certificate of Convenience and Necessity (CCN) with the APSC, LPSC and PUCT to convert Welsh Plant, Units 1 and 3 to natural gas in 2028 and 2027, respectively.
The table below summarizes the net book value including CWIP, before cost of removal and materials and supplies, as of December 31, 2024, of generating facilities planned for early retirement:
| | | | | | | | | | | | | | | | | | | | | | | | | | | | | | | | | | | | | | | | | | | | | | | |
| Plant | | | | | | Net Book Value | | Accelerated Depreciation Regulatory Asset | | | | Cost of Removal
Regulatory Liability | | | Projected
Retirement Date | | Current Authorized
Recovery Period | | Annual
Depreciation (a) |
| | | | | | (dollars in millions) |
| Northeastern Plant, Unit 3 | | | | | | $ | 101.7 | | | $ | 189.0 | | | | | $ | 21.0 | | (b) | | 2026 | | (c) | | $ | 16.2 | |
| Welsh Plant, Units 1 and 3 | | | | | | 324.3 | | | 168.6 | | | | | 57.6 | | (d) | | 2028 | (e) | (f) | | 43.6 | |
(a)Represents the amount of annual depreciation that has been collected from customers over the prior 12-month period.
(b)Includes Northeastern Plant, Unit 4, which was retired in 2016. Removal of Northeastern Plant, Unit 4, will be performed with the removal of Northeastern Plant, Unit 3, after retirement.
(c)Northeastern Plant, Unit 3 is currently being recovered through 2040.
(d)Includes Welsh Plant, Unit 2, which was retired in 2016. Removal of Welsh Plant, Unit 2, will be performed with the removal of Welsh Plant, Units 1 and 3, after retirement.
(e)Represents projected retirement date of coal assets.
(f)Unit 1 is being recovered through 2027 in the Louisiana jurisdiction and through 2037 in the Arkansas and Texas jurisdictions. Unit 3 is being recovered through 2032 in the Louisiana jurisdiction and through 2042 in the Arkansas and Texas jurisdictions.
Dolet Hills Power Station and Related Fuel Operations (Applies to AEP and SWEPCo)
In December 2021, the Dolet Hills Power Station was retired. While in operation, DHLC provided 100% of the fuel supply to Dolet Hills Power Station. The remaining book value of Dolet Hills Power Station non-fuel related assets are recoverable by SWEPCo through rate riders. As of December 31, 2024, SWEPCo’s share of the net investment in the Dolet Hills Power Station was $74 million, including materials and supplies, net of cost of removal collected in rates. Fuel costs incurred by the Dolet Hills Power Station are recoverable by SWEPCo through active fuel clauses and are subject to prudency determinations by the various commissions. After closure of the DHLC mining operations and the Dolet Hills Power Station, additional reclamation and other land-related costs incurred by DHLC and Oxbow will continue to be billed to SWEPCo and included in existing fuel clauses. As of December 31, 2024, SWEPCo had a net under-recovered fuel balance of $22 million, inclusive of costs related to the Dolet Hills Power Station billed by DHLC, but excluding impacts of the February 2021 severe winter weather event.
In March 2021, the LPSC issued an order allowing SWEPCo to recover up to $20 million of fuel costs in 2021 and defer approximately $35 million of additional costs with a recovery period to be determined at a later date. In August 2022, the LPSC staff filed testimony recommending fuel disallowances of up to $55 million, including denial of recovery of the $35 million deferral, with refunds to customers over five years. In February 2024, an ALJ issued a final recommendation which included a proposed $55 million refund to customers and the denial of recovery of the $35 million deferral. SWEPCo filed a motion to present oral arguments with the LPSC to dispute the ALJ’s recommendations. In April 2024, the LPSC approved a unanimous settlement agreement filed by SWEPCo, LPSC staff and certain intervenors that resolved the fuel recovery dispute and resulted in a fuel disallowance of $11 million. The remaining $24 million regulatory asset balance will be recovered over three years with interest.
In March 2021, the APSC approved fuel rates that provide recovery of $20 million for the Arkansas share of the 2021 Dolet Hills Power Station fuel costs over five years through the existing fuel clause.
In September 2023, the PUCT approved an unopposed settlement agreement that provides recovery of $48 million of Oxbow mine related costs through 2035.
If any of these costs are not recoverable or customer refunds are required, it could reduce future net income and cash flows and impact financial condition.
Pirkey Plant and Related Fuel Operations (Applies to AEP and SWEPCo)
In March 2023, the Pirkey Plant was retired. SWEPCo is recovering, or will seek recovery of, the remaining net book value of Pirkey Plant non-fuel costs. As of December 31, 2024, SWEPCo’s share of the net investment in the Pirkey Plant was $188 million, including materials and supplies, net of cost of removal. See the “Regulated Generating Units that have been Retired” section above for additional information. Fuel costs are recovered through active fuel clauses and are subject to prudency determinations by the various commissions. As of March 31, 2023, SWEPCo fuel deliveries, including billings of all fixed costs, from Sabine ceased. Additionally, as of December 31, 2024, SWEPCo had a net under-recovered fuel balance of $22 million, inclusive of costs related to the Pirkey Plant billed by Sabine, but excluding impacts of the February 2021 severe winter weather event. Remaining operational, reclamation and other land-related costs incurred by Sabine will be billed to SWEPCo and included in existing fuel clauses.
In July 2023, the LPSC ordered that a separate proceeding be established to review the prudence of the decision to retire the Pirkey Plant, including the costs included in fuel for years starting in 2019 and after. In November 2024, the LPSC staff submitted testimony recommending a $5 million fuel disallowance and a lower return on the remaining Pirkey Plant balance or
recovery of the retired plant balance at a rate less than SWEPCo’s weighted average cost of capital. In December 2024, SWEPCo filed its rebuttal testimony explaining why there should be no disallowance. A hearing is scheduled for March 2025.
In September 2023, the PUCT approved an unopposed settlement agreement that provides recovery of $33 million of Sabine related fuel costs through 2035. In June 2024, SWEPCo filed a fuel reconciliation with the PUCT for its retail operation in Texas for the period of January 2022 through December 2023. In January 2025, intervenors filed testimony recommending a disallowance for fuel costs ranging from $2 million and $25 million related to SWEPCo’s decision to retire the Pirkey Plant, management of fuel inventory and SWEPCo’s energy price offers in SPP. Also, in January 2025, the PUCT staff filed testimony agreeing with SWEPCo’s filed fuel reconciliation. In February 2025, SWEPCo filed rebuttal testimony explaining why there should be no disallowance.
If any of these costs are not recoverable or customer refunds are required, it could reduce future net income and cash flows and impact financial condition.
Regulatory Assets and Liabilities
Regulatory assets and liabilities are comprised of the following items:
| | | | | | | | | | | | | | | | | | | | |
| | AEP |
| | December 31, | | Remaining Recovery Period |
| | 2024 | | 2023 | |
| Current Regulatory Assets | | (in millions) | | |
| Under-recovered Fuel Costs - earns a return | | $ | 245.7 | | | $ | 357.4 | | | 1 year |
| Under-recovered Fuel Costs - does not earn a return | | 116.0 | | | 62.7 | | | 1 year |
| Unrecovered Winter Storm Fuel Costs - earns a return (a) | | 84.2 | | | 93.9 | | | 1 year |
| Total Current Regulatory Assets | | $ | 445.9 | | | $ | 514.0 | | | |
| | | | | | |
| Noncurrent Regulatory Assets | | | | | | |
| Regulatory assets pending final regulatory approval: | | | | | | |
| | | | | | |
| Regulatory Assets Currently Earning a Return | | | | | | |
| | | | | | |
| Welsh Plant, Units 1 and 3 Accelerated Depreciation | | $ | 168.6 | | | $ | 125.6 | | | |
| Pirkey Plant Accelerated Depreciation | | 121.3 | | | 114.4 | | | |
| Storm-Related Costs | | 51.0 | | | — | | | |
| Unrecovered Winter Storm Fuel Costs (a) | | 33.5 | | | 60.1 | | | |
| | | | | | |
| | | | | | |
| | | | | | |
| | | | | | |
| | | | | | |
| | | | | | |
| | | | | | |
| | | | | | |
| Other Regulatory Assets Pending Final Regulatory Approval | | 20.7 | | | 49.8 | | | |
| Total Regulatory Assets Currently Earning a Return | | 395.1 | | | 349.9 | | | |
| Regulatory Assets Currently Not Earning a Return | | | | | | |
| Plant Retirement Costs - Asset Retirement Obligation Costs (b) | | 357.4 | | | 25.9 | | | |
| Storm-Related Costs | | 300.8 | | | 408.9 | | | |
| NOLC - Costs (c) | | 92.8 | | | — | | | |
| 2024-2025 Virginia Under-Earnings | | 78.4 | | | — | | | |
| | | | | | |
| | | | | | |
| | | | | | |
| | | | | | |
| | | | | | |
| | | | | | |
| | | | | | |
| | | | | | |
| | | | | | |
| | | | | | |
| Other Regulatory Assets Pending Final Regulatory Approval | | 86.3 | | | 52.6 | | | |
| Total Regulatory Assets Currently Not Earning a Return | | 915.7 | | | 487.4 | | | |
| | | | | | |
| Total Regulatory Assets Pending Final Regulatory Approval | | 1,310.8 | | | 837.3 | | | |
| | | | | | |
| Regulatory assets approved for recovery: | | | | | | |
| | | | | | |
| Regulatory Assets Currently Earning a Return | | | | | | |
| Plant Retirement Costs - Unrecovered Plant (d) | | 661.2 | | | 664.2 | | | 22 years |
| Long-term Under-recovered Fuel Costs - West Virginia | | 283.8 | | | 291.5 | | | 10 years |
| Plant Retirement Costs - Asset Retirement Obligation Costs | | 111.0 | | | 110.8 | | | 16 years |
| Storm-Related Costs | | 106.7 | | | 170.9 | | | 7 years |
| Fuel Mine Closure Costs - Texas | | 70.6 | | | 74.3 | | | 11 years |
| Pirkey Plant Accelerated Depreciation - Louisiana | | 66.4 | | | 65.8 | | | 8 years |
| Unrecovered Winter Storm Fuel Costs (a) | | 62.8 | | | 99.3 | | | 3 years |
| Kentucky Deferred Purchased Power Expenses | | 45.0 | | | 43.5 | | | 3 years |
| Rockport Plant Dry Sorbent Injection System and Selective Catalytic Reduction | | 37.3 | | | 46.9 | | | 4 years |
| Texas Mobile Temporary Emergency Electric Energy Facilities Rider | | 32.6 | | | 33.4 | | | 2 years |
| Environmental Control Projects | | 29.1 | | | 31.4 | | | 16 years |
| Ohio Basic Transmission Cost Rider | | 26.1 | | | 42.2 | | | 2 years |
| Plant Retirement Costs - Unrecovered Plant, Dolet Hills Power Station, Louisiana | | 19.0 | | | 40.8 | | | 8 years |
| | | | | | |
| | | | | | |
| | | | | | |
| | | | | | |
| | | | | | |
| | | | | | |
| | | | | | |
| | | | | | |
| | | | | | |
| | | | | | |
| | | | | | |
| | | | | | |
| | | | | | |
| | | | | | |
| | | | | | |
| Long-term Under-recovered Fuel Costs - Virginia | | — | | | 107.0 | | | |
| Other Regulatory Assets Approved for Recovery | | 159.9 | | | 124.9 | | | various |
| Total Regulatory Assets Currently Earning a Return | | 1,711.5 | | | 1,946.9 | | | |
| Regulatory Assets Currently Not Earning a Return | | | | | | |
| Pension and OPEB Funded Status | | 974.2 | | | 1,054.1 | | | 12 years |
| Plant Retirement Costs - Asset Retirement Obligation Costs | | 360.1 | | | 330.2 | | | 18 years |
| Unamortized Loss on Reacquired Debt | | 90.9 | | | 97.2 | | | 24 years |
| Storm-Related Costs | | 66.5 | | | 38.5 | | | 7 years |
| Fuel and Purchased Power Adjustment Rider | | 57.4 | | | 68.3 | | | 2 years |
| Unrealized Loss on Forward Commitments | | 53.3 | | | 131.4 | | | 8 years |
| OVEC Purchased Power | | 52.0 | | | 50.1 | | | 2 years |
| Plant Retirement Costs - Unrecovered Plant, Texas | | 44.5 | | | 48.7 | | | 22 years |
| Cook Plant Nuclear Refueling Outage Levelization | | 43.0 | | | 55.7 | | | 3 years |
| Smart Grid Costs | | 33.8 | | | 26.3 | | | 2 years |
| Postemployment Benefits | | 27.9 | | | 30.6 | | | 3 years |
| | | | | | |
| Ohio Enhanced Service Reliability Plan | | 26.2 | | | 35.3 | | | 2 years |
| 2020-2022 Virginia Triennial Under Earnings | | 26.0 | | | 37.4 | | | 3 years |
| Ohio Distribution Investment Rider | | 11.0 | | | 35.3 | | | 2 years |
| | | | | | |
| | | | | | |
| | | | | | |
| | | | | | |
| | | | | | |
| | | | | | |
| | | | | | |
| | | | | | |
| | | | | | |
| | | | | | |
| | | | | | |
| | | | | | |
| | | | | | |
| | | | | | |
| | | | | | |
| | | | | | |
| | | | | | |
| | | | | | |
| | | | | | |
| | | | | | |
| Other Regulatory Assets Approved for Recovery | | 240.1 | | | 269.1 | | | various |
| Total Regulatory Assets Currently Not Earning a Return | | 2,106.9 | | | 2,308.2 | | | |
| | | | | | |
| Total Regulatory Assets Approved for Recovery | | 3,818.4 | | | 4,255.1 | | | |
| | | | | | |
| Total Noncurrent Regulatory Assets | | $ | 5,129.2 | | | $ | 5,092.4 | | | |
(a)See “February 2021 Severe Winter Weather Impacts in SPP” section of Note 4 for additional information.
(b)See “Federal EPA’s Revised CCR Rule” section of Note 6 for additional information.
(c)In the second quarter of 2024, requests seeking to establish a recovery mechanism for these regulatory assets were filed in Indiana, Oklahoma and Texas. In Indiana and Oklahoma, certain intervenors have challenged the recovery, or have proposed ratemaking treatment that would offset the recovery, of the regulatory assets. In the third quarter of 2024, PUCT Staff and certain intervenors in Texas requested a hearing and direct testimony was filed by SWEPCo in October 2024. In the fourth quarter of 2024, hearings on the merits were held in Indiana and Oklahoma. In January 2025, a second hearing on the merits in Oklahoma was held. A hearing is scheduled for the first quarter of 2025 in Texas.
(d)Northeastern Plant, Unit 3 is approved for recovery through 2040, but expected to retire in 2026. PSO records a regulatory asset for accelerated depreciation. See “Regulated Generating Units to be Retired” section above for additional information.
| | | | | | | | | | | | | | | | | | | | |
| | AEP |
| | December 31, | | Remaining |
| | 2024 | | 2023 | | Refund Period |
| Current Regulatory Liabilities | | (in millions) | | |
| Over-recovered Fuel Costs - pays a return | | $ | 21.6 | | | $ | 3.3 | | | 1 year |
| Over-recovered Fuel Costs - does not pay a return | | 31.9 | | | 23.2 | | | 1 year |
| Total Current Regulatory Liabilities | | $ | 53.5 | | | $ | 26.5 | | | |
| | | | | | |
Noncurrent Regulatory Liabilities and
Deferred Investment Tax Credits | | | | | | |
| Regulatory liabilities pending final regulatory determination: | | | | | | |
| | | | | | |
| Regulatory Liabilities Currently Paying a Return | | | | | | |
| Income Taxes, Net (a) | | $ | 176.0 | | | $ | 103.1 | | | |
| | | | | | |
| Total Regulatory Liabilities Currently Paying a Return | | 176.0 | | | 103.1 | | | |
| Regulatory Liabilities Currently Not Paying a Return | | | | | | |
| | | | | | |
| FERC 2021 Transmission Formula Rate Challenge Refunds | | 131.3 | | | 103.1 | | | |
| Other Regulatory Liabilities Pending Final Regulatory Determination | | 14.7 | | | 1.7 | | | |
| Total Regulatory Liabilities Currently Not Paying a Return | | 146.0 | | | 104.8 | | | |
| | | | | | |
| Total Regulatory Liabilities Pending Final Regulatory Determination | | 322.0 | | | 207.9 | | | |
| | | | | | |
| Regulatory liabilities approved for payment: | | | | | | |
| | | | | | |
| Regulatory Liabilities Currently Paying a Return | | | | | | |
| Asset Removal Costs | | 3,828.0 | | | 3,563.5 | | | (b) |
| Income Taxes, Net (a) | | 1,622.1 | | | 2,179.7 | | | (c) |
| Rockport Plant, Unit 2 Accelerated Depreciation for Leasehold Improvements | | 35.9 | | | 44.9 | | | 4 years |
| | | | | | |
| | | | | | |
| | | | | | |
| | | | | | |
| | | | | | |
| | | | | | |
| Other Regulatory Liabilities Approved for Payment | | 40.4 | | | 35.0 | | | various |
| Total Regulatory Liabilities Currently Paying a Return | | 5,526.4 | | | 5,823.1 | | | |
| Regulatory Liabilities Currently Not Paying a Return | | | | | | |
| Excess Nuclear Decommissioning Funding | | 2,137.3 | | | 1,721.9 | | | (d) |
| Deferred Investment Tax Credits | | 65.1 | | | 154.5 | | | 29 years |
| Demand Side Management | | 52.6 | | | 31.3 | | | 2 years |
| Spent Nuclear Fuel | | 50.4 | | | 47.6 | | | (d) |
| 2017-2019 Virginia Triennial Revenue Provision | | 35.2 | | | 37.1 | | | 25 years |
| Peak Demand Reduction/Energy Efficiency | | 32.8 | | | 26.4 | | | 2 years |
| | | | | | |
| Over-recovered Fuel Costs - Ohio | | 32.1 | | | 26.1 | | | 8 years |
| | | | | | |
| | | | | | |
| | | | | | |
| | | | | | |
| | | | | | |
| | | | | | |
| | | | | | |
| | | | | | |
| | | | | | |
| | | | | | |
| | | | | | |
| | | | | | |
| | | | | | |
| Other Regulatory Liabilities Approved for Payment | | 90.1 | | | 106.5 | | | various |
| Total Regulatory Liabilities Currently Not Paying a Return | | 2,495.6 | | | 2,151.4 | | | |
| | | | | | |
| Total Regulatory Liabilities Approved for Payment | | 8,022.0 | | | 7,974.5 | | | |
| | | | | | |
| Total Noncurrent Regulatory Liabilities and Deferred Investment Tax Credits | | $ | 8,344.0 | | | $ | 8,182.4 | | | |
(a)Predominately pays a return due to the inclusion of Excess ADIT in rate base.
(b)Relieved as removal costs are incurred.
(c)Refunded over the period for which the related deferred income tax reverse, which is generally based on the expected life for the underlying assets. Excess ADIT Associated with Certain Depreciable Property is refunded over the remaining depreciable life of the underlying assets. Excess ADIT that is Not Subject to Rate Normalization Requirements were $192 million and $228 million for the years ended December 31, 2024 and 2023, respectively. The remaining balance of Excess ADIT that is Not Subject to Rate Normalization Requirements as of December 31, 2024 is to be refunded over 10 years.
(d)Relieved when plant is decommissioned.
| | | | | | | | | | | | | | | | | | | | |
| | AEP Texas |
| | December 31, | | Remaining
Recovery
Period |
| Regulatory Assets: | | 2024 | | 2023 | |
| | (in millions) | | |
| Noncurrent Regulatory Assets | | | | | | |
| Regulatory assets pending final regulatory approval: | | | | | | |
| | | | | | |
| Regulatory Assets Currently Earning a Return | | | | | | |
| | | | | | |
| | | | | | |
| Storm-Related Costs | | $ | 41.3 | | | $ | — | | | |
| Total Regulatory Assets Currently Earning a Return | | 41.3 | | | — | | | |
| Regulatory Assets Currently Not Earning a Return | | | | | | |
| Deferred Pension and OPEB Costs | | 15.6 | | | — | | | |
| Storm-Related Costs | | 13.1 | | | 37.7 | | | |
| Line Inspection Costs | | 5.8 | | | 5.7 | | | |
| | | | | | |
| | | | | | |
| | | | | | |
| | | | | | |
| | | | | | |
| Other Regulatory Assets Pending Final Regulatory Approval | | 1.3 | | | 20.9 | | | |
| Total Regulatory Assets Currently Not Earning a Return | | 35.8 | | | 64.3 | | | |
| | | | | | |
| Total Regulatory Assets Pending Final Regulatory Approval | | 77.1 | | | 64.3 | | | |
| | | | | | |
| Regulatory assets approved for recovery: | | | | | | |
| | | | | | |
| Regulatory Assets Currently Earning a Return | | | | | | |
| Texas Mobile Temporary Emergency Electric Energy Facilities Rider | | 32.6 | | | 33.4 | | | 2 years |
| Meter Replacement Costs | | 5.8 | | | 9.4 | | | 2 years |
| | | | | | |
| | | | | | |
| | | | | | |
| Other Regulatory Assets Approved for Recovery | | 22.4 | | | 0.7 | | | various |
| Total Regulatory Assets Currently Earning a Return | | 60.8 | | | 43.5 | | | |
| Regulatory Assets Currently Not Earning a Return | | | | | | |
| Pension and OPEB Funded Status | | 177.5 | | | 183.2 | | | 12 years |
| Texas Transmission Cost Recovery Factor | | 14.2 | | | — | | | 2 years |
| Peak Demand Reduction/Energy Efficiency | | 9.2 | | | 9.2 | | | 2 years |
| | | | | | |
| | | | | | |
| | | | | | |
| | | | | | |
| | | | | | |
| | | | | | |
| Other Regulatory Assets Approved for Recovery | | 14.8 | | | 15.1 | | | various |
| Total Regulatory Assets Currently Not Earning a Return | | 215.7 | | | 207.5 | | | |
| | | | | | |
| Total Regulatory Assets Approved for Recovery | | 276.5 | | | 251.0 | | | |
| | | | | | |
| Total Noncurrent Regulatory Assets | | $ | 353.6 | | | $ | 315.3 | | | |
| | | | | | | | | | | | | | | | | | | | |
| | AEP Texas |
| | December 31, | | Remaining
Refund
Period |
| Regulatory Liabilities: | | 2024 | | 2023 | |
| | (in millions) | | |
| | | | | | |
Noncurrent Regulatory Liabilities and
Deferred Investment Tax Credits | | | | | | |
| Regulatory liabilities pending final regulatory determination: | | | | | | |
| | | | | | |
| Regulatory Liabilities Currently Paying a Return | | | | | | |
| Income Taxes, Net (a) | | $ | — | | | $ | 13.0 | | | |
| | | | | | |
| Total Regulatory Liabilities Currently Paying a Return | | — | | | 13.0 | | | |
| Regulatory Liabilities Currently Not Paying a Return | | | | | | |
| Other Regulatory Liabilities Pending Final Regulatory Determination | | — | | | 1.5 | | | |
| Total Regulatory Liabilities Currently Not Paying a Return | | — | | | 1.5 | | | |
| | | | | | |
| Total Regulatory Liabilities Pending Final Regulatory Determination | | — | | | 14.5 | | | |
| | | | | | |
| Regulatory liabilities approved for payment: | | | | | | |
| | | | | | |
| Regulatory Liabilities Currently Paying a Return | | | | | | |
| Asset Removal Costs | | 844.0 | | | 797.1 | | | (b) |
| Income Taxes, Net (a) | | 409.4 | | | 412.0 | | | (c) |
| | | | | | |
| | | | | | |
| Other Regulatory Liabilities Approved for Payment | | 4.8 | | | 3.8 | | | various |
| Total Regulatory Liabilities Currently Paying a Return | | 1,258.2 | | | 1,212.9 | | | |
| Regulatory Liabilities Currently Not Paying a Return | | | | | | |
| Transition and Restoration Charges | | 21.6 | | | 26.6 | | | 5 years |
| | | | | | |
| | | | | | |
| | | | | | |
| Other Regulatory Liabilities Approved for Payment | | 5.6 | | | 7.4 | | | various |
| Total Regulatory Liabilities Currently Not Paying a Return | | 27.2 | | | 34.0 | | | |
| | | | | | |
| Total Regulatory Liabilities Approved for Payment | | 1,285.4 | | | 1,246.9 | | | |
| | | | | | |
| Total Noncurrent Regulatory Liabilities and Deferred Investment Tax Credits | | $ | 1,285.4 | | | $ | 1,261.4 | | | |
(a)Predominately pays a return due to the inclusion of Excess ADIT in rate base.
(b)Relieved as removal costs are incurred.
(c)Refunded over the period for which the related deferred income tax reverse, which is generally based on the expected life for the underlying assets. Excess ADIT Associated with Certain Depreciable Property is refunded over the remaining depreciable life of the underlying assets. Excess ADIT that is Not Subject to Rate Normalization Requirements was $22 million for the year ended December 31, 2024. The remaining balance of Excess ADIT that is Not Subject to Rate Normalization Requirements as of December 31, 2024 is to be refunded over 5 years.
| | | | | | | | | | | | | | | | | | | | |
| | AEPTCo |
| | December 31, | | Remaining
Recovery
Period |
| Regulatory Assets: | | 2024 | | 2023 | |
| | (in millions) | | |
| Noncurrent Regulatory Assets | | | | | | |
| Regulatory assets approved for recovery: | | | | | | |
| | | | | | |
| | | | | | |
| | | | | | |
| | | | | | |
| Regulatory Assets Currently Not Earning a Return | | | | | | |
| PJM/SPP Annual Formula Rate True-up | | $ | 0.4 | | | $ | 3.1 | | | 2 years |
| Total Regulatory Assets Approved for Recovery | | 0.4 | | | 3.1 | | | |
| | | | | | |
| Total Noncurrent Regulatory Assets | | $ | 0.4 | | | $ | 3.1 | | | |
| | | | | | | | | | | | | | | | | | | | |
| | AEPTCo |
| | December 31, | | Remaining
Refund
Period |
| Regulatory Liabilities: | | 2024 | | 2023 | |
| | (in millions) | | |
| Noncurrent Regulatory Liabilities | | | | | | |
| Regulatory liabilities pending final regulatory determination: | | | | | | |
| | | | | | |
| Regulatory Liabilities Currently Paying a Return | | | | | | |
| | | | | | |
| Income Taxes, Net (a) | | $ | 8.8 | | | $ | 8.7 | | | |
| | | | | | |
| Total Regulatory Liabilities Pending Final Regulatory Determination | | 8.8 | | | 8.7 | | | |
| | | | | | |
| Regulatory liabilities approved for payment: | | | | | | |
| | | | | | |
| Regulatory Liabilities Currently Paying a Return | | | | | | |
| Asset Removal Costs | | 582.3 | | | 466.3 | | | (b) |
| Income Taxes, Net (a) | | 287.3 | | | 308.7 | | | (c) |
| | | | | | |
| | | | | | |
| Total Regulatory Liabilities Approved for Payment | | 869.6 | | | 775.0 | | | |
| | | | | | |
| | | | | | |
| | | | | | |
| Total Noncurrent Regulatory Liabilities | | $ | 878.4 | | | $ | 783.7 | | | |
(a)Predominately pays a return due to the inclusion of Excess ADIT in rate base.
(b)Relieved as removal costs are incurred.
(c)Refunded over the period for which the related deferred income tax reverse, which is generally based on the expected life for the underlying assets. Excess ADIT Associated with Certain Depreciable Property is refunded over the remaining depreciable life of the underlying assets. Excess ADIT that is Not Subject to Rate Normalization Requirements were $9 million and $13 million for the years ended December 31, 2024 and 2023, respectively. The remaining balance of Excess ADIT that is Not Subject to Rate Normalization Requirements as of December 31, 2024 is to be refunded over 4 years.
| | | | | | | | | | | | | | | | | | | | |
| | APCo |
| | December 31, | | Remaining
Recovery
Period |
| Regulatory Assets: | | 2024 | | 2023 | |
| | (in millions) | | |
| Current Regulatory Assets | | | | | | |
| Under-recovered Fuel Costs, Virginia - earns a return | | $ | 148.1 | | | $ | 147.4 | | | 1 year |
| Under-recovered Fuel Costs, West Virginia - does not earn a return | | — | | | 8.0 | | | 1 year |
| Total Current Regulatory Assets | | $ | 148.1 | | | $ | 155.4 | | | |
| | | | | | |
| Noncurrent Regulatory Assets | | | | | | |
| Regulatory assets pending final regulatory approval: | | | | | | |
| | | | | | |
| Regulatory Assets Currently Earning a Return | | | | | | |
| | | | | | |
| Other Regulatory Assets Pending Final Regulatory Approval | | $ | 1.1 | | | $ | 0.6 | | | |
| | | | | | |
| Total Regulatory Assets Currently Earning a Return | | 1.1 | | | 0.6 | | | |
| Regulatory Assets Currently Not Earning a Return | | | | | | |
| Plant Retirement Costs - Asset Retirement Obligation Costs (a) | | 282.1 | | | 25.9 | | | |
| Storm-Related Costs - West Virginia | | 144.2 | | | 91.5 | | | |
| 2024-2025 Virginia Under-Earnings | | 78.4 | | | — | | | |
| Pension Settlement | | 17.8 | | | — | | | |
| | | | | | |
| | | | | | |
| | | | | | |
| | | | | | |
| | | | | | |
| Other Regulatory Assets Pending Final Regulatory Approval | | 11.9 | | | 7.5 | | | |
| | | | | | |
| | | | | | |
| | | | | | |
| Total Regulatory Assets Currently Not Earning a Return | | 534.4 | | | 124.9 | | | |
| | | | | | |
| Total Regulatory Assets Pending Final Regulatory Approval | | 535.5 | | | 125.5 | | | |
| | | | | | |
| Regulatory assets approved for recovery: | | | | | | |
| | | | | | |
| Regulatory Assets Currently Earning a Return | | | | | | |
| Long-term Under-recovered Fuel Costs - West Virginia | | 154.1 | | | 154.2 | | | 10 years |
| Plant Retirement Costs - Unrecovered Plant | | 68.0 | | | 72.0 | | | 19 years |
| | | | | | |
| | | | | | |
| | | | | | |
| Long-term Under-recovered Fuel Costs - Virginia | | — | | | 107.0 | | | |
| Other Regulatory Assets Approved for Recovery | | 5.2 | | | 7.1 | | | various |
| Total Regulatory Assets Currently Earning a Return | | 227.3 | | | 340.3 | | | |
| Regulatory Assets Currently Not Earning a Return | | | | | | |
| Plant Retirement Costs - Asset Retirement Obligation Costs | | 307.5 | | | 324.7 | | | 15 years |
| Pension and OPEB Funded Status | | 107.9 | | | 115.8 | | | 12 years |
| Unamortized Loss on Reacquired Debt | | 67.0 | | | 70.7 | | | 21 years |
| | | | | | |
| 2020-2022 Virginia Triennial Under-Earnings | | 26.0 | | | 37.4 | | | 3 years |
| Peak Demand Reduction/Energy Efficiency | | 14.2 | | | 15.0 | | | 2 years |
| Postemployment Benefits | | 13.2 | | | 14.9 | | | 3 years |
| | | | | | |
| Vegetation Management Program - West Virginia | | 11.9 | | | 12.9 | | | 2 years |
| Virginia Generation Rate Adjustment Clause | | 11.6 | | | 10.9 | | | 2 years |
Excess SO2 Allowance Inventory - Virginia | | 10.5 | | | 11.8 | | | 8 years |
| | | | | | |
| Virginia Transmission Rate Adjustment Clause | | 3.4 | | | 25.5 | | | 2 years |
| | | | | | |
| | | | | | |
| | | | | | |
| | | | | | |
| | | | | | |
| | | | | | |
| | | | | | |
| | | | | | |
| | | | | | |
| | | | | | |
| | | | | | |
| | | | | | |
| | | | | | |
| | | | | | |
| | | | | | |
| Unrealized Loss on Forward Commitments | | — | | | 21.9 | | | |
| Other Regulatory Assets Approved for Recovery | | 30.0 | | | 27.8 | | | various |
| Total Regulatory Assets Currently Not Earning a Return | | 603.2 | | | 689.3 | | | |
| | | | | | |
| Total Regulatory Assets Approved for Recovery | | 830.5 | | | 1,029.6 | | | |
| | | | | | |
| Total Noncurrent Regulatory Assets | | $ | 1,366.0 | | | $ | 1,155.1 | | | |
(a)See “Federal EPA’s Revised CCR Rule” section of Note 6 for additional information.
| | | | | | | | | | | | | | | | | | | | |
| | APCo |
| | December 31, | | Remaining
Refund
Period |
| Regulatory Liabilities: | | 2024 | | 2023 | |
| | (in millions) | | |
| Current Regulatory Liabilities | | | | | | |
| Over-recovered Fuel Costs, West Virginia - does not pay a return | | $ | 21.6 | | | $ | — | | | 1 year |
| Total Current Regulatory Liabilities | | $ | 21.6 | | | $ | — | | | |
| | | | | | |
Noncurrent Regulatory Liabilities and
Deferred Investment Tax Credits | | | | | | |
| Regulatory liabilities pending final regulatory determination: | | | | | | |
| | | | | | |
| Regulatory Liabilities Currently Paying a Return | | | | | | |
| | | | | | |
| Income Taxes, Net (a) | | $ | (6.3) | | | $ | 7.9 | | | |
| | | | | | |
| Total Regulatory Liabilities Currently Paying a Return | | (6.3) | | | 7.9 | | | |
| Regulatory Liabilities Currently Not Paying a Return | | | | | | |
| FERC 2021 Transmission Formula Rate Challenge Refunds | | 24.9 | | | 19.7 | | | |
| Total Regulatory Liabilities Currently Not Paying a Return | | 24.9 | | | 19.7 | | | |
| | | | | | |
| Total Regulatory Liabilities Pending Final Regulatory Determination | | 18.6 | | | 27.6 | | | |
| | | | | | |
| Regulatory liabilities approved for payment: | | | | | | |
| | | | | | |
| Regulatory Liabilities Currently Paying a Return | | | | | | |
| Asset Removal Costs | | 805.6 | | | 759.6 | | | (b) |
| Income Taxes, Net (a) | | 219.3 | | | 240.1 | | | (c) |
| Deferred Investment Tax Credits | | — | | | 0.3 | | | |
| Total Regulatory Liabilities Currently Paying a Return | | 1,024.9 | | | 1,000.0 | | | |
| Regulatory Liabilities Currently Not Paying a Return | | | | | | |
| 2017-2019 Virginia Triennial Revenue Provision | | 35.2 | | | 37.1 | | | 25 years |
| | | | | | |
| | | | | | |
| Virginia Transmission Rate Adjustment Clause | | 10.2 | | | 1.5 | | | 2 years |
| Energy Efficiency Rate Adjustment Clause - Virginia | | 10.0 | | | 3.2 | | | 2 years |
| | | | | | |
| | | | | | |
| | | | | | |
| Other Regulatory Liabilities Approved for Payment | | 16.9 | | | 12.5 | | | various |
| Total Regulatory Liabilities Currently Not Paying a Return | | 72.3 | | | 54.3 | | | |
| | | | | | |
| Total Regulatory Liabilities Approved for Payment | | 1,097.2 | | | 1,054.3 | | | |
| | | | | | |
| Total Noncurrent Regulatory Liabilities and Deferred Investment Tax Credits | | $ | 1,115.8 | | | $ | 1,081.9 | | | |
(a)Predominately pays a return due to the inclusion of Excess ADIT in rate base.
(b)Relieved as removal costs are incurred.
(c)Refunded over the period for which the related deferred income tax reverse, which is generally based on the expected life for the underlying assets. Excess ADIT Associated with Certain Depreciable Property is refunded over the remaining depreciable life of the underlying assets. Excess ADIT that is Not Subject to Rate Normalization Requirements were $12 million and $35 million for the years ended December 31, 2024 and 2023, respectively. The remaining balance of Excess ADIT that is Not Subject to Rate Normalization Requirements as of December 31, 2024 is to be refunded over 4 years.
| | | | | | | | | | | | | | | | | | | | |
| | I&M |
| | December 31, | | Remaining
Recovery
Period |
| Regulatory Assets: | | 2024 | | 2023 | |
| | (in millions) | | |
| Current Regulatory Assets | | | | | | |
| Under-recovered Fuel Costs, Michigan - earns a return | | $ | 10.6 | | | $ | 14.8 | | | 1 year |
| | | | | | |
| Total Current Regulatory Assets | | $ | 10.6 | | | $ | 14.8 | | | |
| | | | | | |
| Noncurrent Regulatory Assets | | | | | | |
| Regulatory assets pending final regulatory approval: | | | | | | |
| | | | | | |
| Regulatory Assets Currently Earning a Return | | | | | | |
| | | | | | |
| Other Regulatory Assets Pending Final Regulatory Approval | | $ | 6.4 | | | $ | 0.2 | | | |
| Total Regulatory Assets Currently Earning a Return | | 6.4 | | | 0.2 | | | |
| Regulatory Assets Currently Not Earning a Return | | | | | | |
| | | | | | |
| | | | | | |
| | | | | | |
| | | | | | |
| Plant Retirement Costs - Asset Retirement Obligation Costs (a) | | 74.0 | | | — | | | |
| NOLC Costs - Indiana (b) | | 26.7 | | | — | | | |
| | | | | | |
| | | | | | |
| | | | | | |
| Storm-Related Costs - Indiana | | 6.3 | | | 29.7 | | | |
| Other Regulatory Assets Pending Final Regulatory Approval | | 1.6 | | | 3.3 | | | |
| Total Regulatory Assets Currently Not Earning a Return | | 108.6 | | | 33.0 | | | |
| | | | | | |
| Total Regulatory Assets Pending Final Regulatory Approval | | 115.0 | | | 33.2 | | | |
| | | | | | |
| Regulatory assets approved for recovery: | | | | | | |
| | | | | | |
| Regulatory Assets Currently Earning a Return | | | | | | |
| Plant Retirement Costs - Unrecovered Plant | | 98.0 | | | 122.5 | | | 4 years |
| Rockport Plant Dry Sorbent Injection System and Selective Catalytic Reduction | | 37.3 | | | 46.9 | | | 4 years |
| Cook Plant Uprate Project | | 20.5 | | | 22.9 | | | 9 years |
| Deferred Cook Plant Life Cycle Management Project Costs - Michigan, FERC | | 10.1 | | | 11.1 | | | 10 years |
| Cook Plant Turbine - Indiana | | 7.8 | | | 8.4 | | | 14 years |
| | | | | | |
| | | | | | |
| | | | | | |
| | | | | | |
| Other Regulatory Assets Approved for Recovery | | 21.1 | | | 17.5 | | | various |
| Total Regulatory Assets Currently Earning a Return | | 194.8 | | | 229.3 | | | |
| Regulatory Assets Currently Not Earning a Return | | | | | | |
| Income Taxes, Net | | 108.8 | | | — | | | (c) |
| Cook Plant Nuclear Refueling Outage Levelization | | 43.0 | | | 55.7 | | | 3 years |
| Storm-Related Costs - Indiana | | 20.2 | | | 3.4 | | | 4 years |
| Pension and OPEB Funded Status | | 14.6 | | | 25.4 | | | 12 years |
Excess SO2 Allowance Inventory - Indiana | | 11.9 | | | 14.8 | | | 4 years |
| Unamortized Loss on Reacquired Debt | | 10.9 | | | 11.8 | | | 24 years |
| Postemployment Benefits | | 7.3 | | | 7.0 | | | 3 years |
| Environmental Cost Rider - Indiana | | 1.4 | | | 8.1 | | | 2 years |
| | | | | | |
| | | | | | |
| | | | | | |
| | | | | | |
| | | | | | |
| | | | | | |
| | | | | | |
| | | | | | |
| | | | | | |
| | | | | | |
| | | | | | |
| | | | | | |
| | | | | | |
| | | | | | |
| Other Regulatory Assets Approved for Recovery | | 20.2 | | | 17.6 | | | various |
| Total Regulatory Assets Currently Not Earning a Return | | 238.3 | | | 143.8 | | | |
| | | | | | |
| Total Regulatory Assets Approved for Recovery | | 433.1 | | | 373.1 | | | |
| | | | | | |
| Total Noncurrent Regulatory Assets | | $ | 548.1 | | | $ | 406.3 | | | |
(a)See “Federal EPA’s Revised CCR Rule” section of Note 6 for additional information.
(b)In the second quarter of 2024, a request seeking to establish a recovery mechanism for these regulatory assets were filed in Indiana. Certain intervenors have challenged the recovery, or have proposed ratemaking treatment that would offset the recovery, of the regulatory assets. In the fourth quarter of 2024, a hearing on the merits was held in Indiana.
(c)Recovered over the period for which the related deferred income tax reverse, which is generally based on the expected life for the underlying assets. Excess ADIT Associated with Certain Depreciable Property is refunded over the remaining depreciable life of the underlying assets. Excess ADIT that is Not Subject to Rate Normalization Requirements was $12 million for the year ended December 31, 2024 and is to be refunded over 4 years.
| | | | | | | | | | | | | | | | | | | | |
| | I&M |
| | December 31, | | Remaining
Refund
Period |
| Regulatory Liabilities: | | 2024 | | 2023 | |
| | (in millions) | | |
| Current Regulatory Liabilities | | | | | | |
| | | | | | |
| Over-recovered Fuel Costs, Indiana - does not pay a return | | $ | 10.3 | | | $ | 23.2 | | | 1 year |
| Total Current Regulatory Liabilities | | $ | 10.3 | | | $ | 23.2 | | | |
| | | | | | |
Noncurrent Regulatory Liabilities and
Deferred Investment Tax Credits | | | | | | |
| Regulatory liabilities pending final regulatory determination: | | | | | | |
| | | | | | |
| Regulatory Liabilities Currently Paying a Return | | | | | | |
| Income Taxes, Net (a) (b) | | $ | — | | | $ | (103.0) | | | |
| Total Regulatory Liabilities Currently Paying a Return | | — | | | (103.0) | | | |
| Regulatory Liabilities Currently Not Paying a Return | | | | | | |
| FERC 2021 Transmission Formula Rate Challenge Refunds | | 28.9 | | | 22.8 | | | |
| Cook Plant PTC Deferral - Michigan | | 14.5 | | | — | | | |
| Total Regulatory Liabilities Currently Not Paying a Return | | 43.4 | | | 22.8 | | | |
| | | | | | |
| Total Regulatory Liabilities Pending Final Regulatory Determination | | 43.4 | | | (80.2) | | | |
| | | | | | |
| Regulatory liabilities approved for payment: | | | | | | |
| | | | | | |
| Regulatory Liabilities Currently Paying a Return | | | | | | |
| Asset Removal Costs | | 174.2 | | | 168.1 | | | (c) |
| Renewable Energy Surcharge - Michigan | | 24.3 | | | 26.6 | | | 2 years |
| Income Taxes, Net (a) | | — | | | 116.8 | | | (d) |
| Other Regulatory Liabilities Approved for Payment | | 0.1 | | | 0.1 | | | various |
| Total Regulatory Liabilities Currently Paying a Return | | 198.6 | | | 311.6 | | | |
| Regulatory Liabilities Currently Not Paying a Return | | | | | | |
| Excess Nuclear Decommissioning Funding | | 2,137.3 | | | 1,721.9 | | | (e) |
| | | | | | |
| Spent Nuclear Fuel | | 50.4 | | | 47.6 | | | (e) |
| Demand Side Management - Indiana | | 33.0 | | | 16.7 | | | 2 years |
| Deferred Investment Tax Credits | | 13.8 | | | 15.8 | | | 26 years |
| PJM Costs and Off-system Sales Margin Sharing - Indiana | | 2.0 | | | 14.1 | | | 1 year |
| | | | | | |
| | | | | | |
| | | | | | |
| | | | | | |
| | | | | | |
| | | | | | |
| | | | | | |
| | | | | | |
| | | | | | |
| Other Regulatory Liabilities Approved for Payment | | 2.3 | | | 4.8 | | | various |
| Total Regulatory Liabilities Currently Not Paying a Return | | 2,238.8 | | | 1,820.9 | | | |
| | | | | | |
| Total Regulatory Liabilities Approved for Payment | | 2,437.4 | | | 2,132.5 | | | |
| | | | | | |
| Total Noncurrent Regulatory Liabilities and Deferred Investment Tax Credits | | $ | 2,480.8 | | | $ | 2,052.3 | | | |
(a)Predominately pays a return due to the inclusion of Excess ADIT in rate base.
(b)Represents an income tax related regulatory asset, which is presented within net regulatory liabilities on the balance sheet.
(c)Relieved as removal costs are incurred.
(d)Refunded over the period for which the related deferred income tax reverse, which is generally based on the expected life for the underlying assets. Excess ADIT Associated with Certain Depreciable Property is refunded over the remaining depreciable life of the underlying assets. Excess ADIT that is Not Subject to Rate Normalization Requirements was $25 million for the year ended December 31, 2023.
(e)Relieved when plant is decommissioned.
| | | | | | | | | | | | | | | | | | | | |
| | OPCo |
| | December 31, | | Remaining
Recovery
Period |
| Regulatory Assets: | | 2024 | | 2023 | |
| | (in millions) | | |
| | | | | | |
| | | | | | |
| | | | | | |
| | | | | | |
| | | | | | |
| Noncurrent Regulatory Assets | | | | | | |
| Regulatory assets pending final regulatory approval: | | | | | | |
| | | | | | |
| Regulatory Assets Currently Earning a Return | | | | | | |
| Other Regulatory Assets Pending Final Regulatory Approval | | $ | 0.4 | | | $ | — | | | |
| Total Regulatory Assets Currently Earning a Return | | 0.4 | | | — | | | |
| Regulatory Assets Currently Not Earning a Return | | | | | | |
| | | | | | |
| | | | | | |
| Other Regulatory Assets Pending Final Regulatory Approval | | 0.1 | | | — | | | |
| Total Regulatory Assets Pending Final Regulatory Approval | | 0.1 | | | 23.6 | | | |
| | | | | | |
| Total Regulatory Assets Pending Final Regulatory Approval | | 0.5 | | | 23.6 | | | |
| | | | | | |
| Regulatory assets approved for recovery: | | | | | | |
| | | | | | |
| Regulatory Assets Currently Earning a Return | | | | | | |
| Ohio Basic Transmission Cost Rider | | 26.1 | | | 42.2 | | | 2 years |
| Ohio Distribution Decoupling | | — | | | 1.8 | | | |
| | | | | | |
| | | | | | |
| Total Regulatory Assets Currently Earning a Return | | 26.1 | | | 44.0 | | | |
| Regulatory Assets Currently Not Earning a Return | | | | | | |
| Pension and OPEB Funded Status | | 134.0 | | | 147.1 | | | 12 years |
| OVEC Purchased Power | | 52.0 | | | 50.1 | | | 2 years |
| Unrealized Loss on Forward Commitments | | 47.6 | | | 50.8 | | | 8 years |
| Smart Grid Costs | | 33.8 | | | 26.3 | | | 2 years |
| Storm-Related Costs | | 28.6 | | | 30.9 | | | 2 years |
| Ohio Enhanced Service Reliability Plan | | 26.2 | | | 35.3 | | | 2 years |
| Bad Debt Rider | | 13.7 | | | 0.7 | | | 2 years |
| Ohio Distribution Investment Rider | | 11.0 | | | 35.3 | | | 2 years |
| | | | | | |
| | | | | | |
| | | | | | |
| | | | | | |
| | | | | | |
| | | | | | |
| | | | | | |
| Other Regulatory Assets Approved for Recovery | | 5.6 | | | 10.9 | | | various |
| Total Regulatory Assets Currently Not Earning a Return | | 352.5 | | | 387.4 | | | |
| | | | | | |
| Total Regulatory Assets Approved for Recovery | | 378.6 | | | 431.4 | | | |
| | | | | | |
| Total Noncurrent Regulatory Assets | | $ | 379.1 | | | $ | 455.0 | | | |
| | | | | | | | | | | | | | | | | | | | |
| | OPCo |
| | December 31, | | Remaining
Refund
Period |
| | 2024 | | 2023 | |
| Regulatory Liabilities: | | (in millions) | | |
| | | | | | |
| | | | | | |
| | | | | | |
| | | | | | |
| | | | | | |
| Noncurrent Regulatory Liabilities | | | | | | |
| Regulatory liabilities pending final regulatory determination: | | | | | | |
| | | | | | |
| | | | | | |
| | | | | | |
| Regulatory Liabilities Currently Not Paying a Return | | | | | | |
| FERC 2021 Transmission Formula Rate Challenge Refunds | | $ | 72.7 | | | $ | 57.0 | | | |
| Other Regulatory Liabilities Pending Final Regulatory Determination | | 0.2 | | | 0.2 | | | |
| | | | | | |
| | | | | | |
| | | | | | |
| | | | | | |
| | | | | | |
| | | | | | |
| | | | | | |
| Total Regulatory Liabilities Pending Final Regulatory Determination | | 72.9 | | | 57.2 | | | |
| | | | | | |
| Regulatory liabilities approved for payment: | | | | | | |
| | | | | | |
| Regulatory Liabilities Currently Paying a Return | | | | | | |
| Asset Removal Costs | | 480.0 | | | 475.5 | | | (a) |
| Income Taxes, Net (b) | | 367.6 | | | 408.2 | | | (c) |
| | | | | | |
| Other Regulatory Liabilities Approved for Payment | | 4.0 | | | — | | | |
| Total Regulatory Liabilities Currently Paying a Return | | 851.6 | | | 883.7 | | | |
| Regulatory Liabilities Currently Not Paying a Return | | | | | | |
| | | | | | |
| Over-recovered Fuel Costs | | 32.1 | | | 26.1 | | | 8 years |
| Peak Demand Reduction/Energy Efficiency | | 22.8 | | | 23.2 | | | 2 years |
| | | | | | |
| | | | | | |
| | | | | | |
| | | | | | |
| | | | | | |
| | | | | | |
| | | | | | |
| | | | | | |
| | | | | | |
| | | | | | |
| Other Regulatory Liabilities Approved for Payment | | 8.3 | | | 13.4 | | | various |
| Total Regulatory Liabilities Currently Not Paying a Return | | 63.2 | | | 62.7 | | | |
| | | | | | |
| Total Regulatory Liabilities Approved for Payment | | 914.8 | | | 946.4 | | | |
| | | | | | |
| Total Noncurrent Regulatory Liabilities | | $ | 987.7 | | | $ | 1,003.6 | | | |
(a)Relieved as removal costs are incurred.
(b)Predominately pays a return due to the inclusion of Excess ADIT in rate base.
(c)Refunded over the period for which the related deferred income tax reverse, which is generally based on the expected life for the underlying assets. Excess ADIT Associated with Certain Depreciable Property is refunded over the remaining depreciable life of the underlying assets. Excess ADIT that is Not Subject to Rate Normalization Requirements were $100 million and $132 million for the years ended December 31, 2024 and 2023, respectively. The remaining balance of Excess ADIT that is Not Subject to Rate Normalization Requirements as of December 31, 2024 is to be refunded over 4 years.
| | | | | | | | | | | | | | | | | | | | |
| | PSO |
| | December 31, | | Remaining
Recovery
Period |
| | 2024 | | 2023 | |
| Regulatory Assets: | | (in millions) | | |
| | | | | | |
| Current Regulatory Assets | | | | | | |
| Under-recovered Fuel Costs - earns a return | | $ | 64.7 | | | $ | 118.3 | | | 1 year |
| Total Current Regulatory Assets | | $ | 64.7 | | | $ | 118.3 | | | |
| | | | | | |
| Noncurrent Regulatory Assets | | | | | | |
| Regulatory assets pending final regulatory approval: | | | | | | |
| | | | | | |
| | | | | | |
| | | | | | |
| | | | | | |
| | | | | | |
| | | | | | |
| Regulatory Assets Currently Not Earning a Return | | | | | | |
| | | | | | |
| | | | | | |
| | | | | | |
| NOLC - Costs (a) | | $ | 16.4 | | | $ | — | | | |
| | | | | | |
| Storm-Related Costs | | 4.9 | | | 88.5 | | | |
| Other Regulatory Assets Pending Final Regulatory Approval | | 9.0 | | | 0.2 | | | |
| | | | | | |
| Total Regulatory Assets Pending Final Regulatory Approval | | 30.3 | | | 88.7 | | | |
| | | | | | |
| | | | | | |
| | | | | | |
| Regulatory assets approved for recovery: | | | | | | |
| | | | | | |
| Regulatory Assets Currently Earning a Return | | | | | | |
| Plant Retirement Costs - Unrecovered Plant (b) | | 274.0 | | | 254.1 | | | 22 years |
| Storm-Related Costs | | 106.7 | | | 26.2 | | | 7 years |
| Environmental Control Projects | | 21.2 | | | 22.5 | | | 16 years |
| Meter Replacement Costs | | 10.1 | | | 14.1 | | | 3 years |
| | | | | | |
| | | | | | |
| | | | | | |
| | | | | | |
| | | | | | |
| Other Regulatory Assets Approved for Recovery | | 13.4 | | | 8.4 | | | various |
| Total Regulatory Assets Currently Earning a Return | | 425.4 | | | 325.3 | | | |
| Regulatory Assets Currently Not Earning a Return | | | | | | |
| | | | | | |
| Pension and OPEB Funded Status | | 57.6 | | | 62.6 | | | 12 years |
| | | | | | |
| | | | | | |
| | | | | | |
| | | | | | |
| | | | | | |
| | | | | | |
| | | | | | |
| | | | | | |
| | | | | | |
| Unrealized Loss on Forward Commitments | | 3.9 | | | 29.9 | | | 2 years |
| Other Regulatory Assets Approved for Recovery | | 10.6 | | | 16.2 | | | various |
| Total Regulatory Assets Currently Not Earning a Return | | 72.1 | | | 108.7 | | | |
| | | | | | |
| Total Regulatory Assets Approved for Recovery | | 497.5 | | | 434.0 | | | |
| | | | | | |
| Total Noncurrent Regulatory Assets | | $ | 527.8 | | | $ | 522.7 | | | |
(a)In the second quarter of 2024, a request seeking to establish a recovery mechanism for these regulatory assets was filed in Oklahoma. Certain intervenors have challenged the recovery, or have proposed ratemaking treatment that would offset the recovery, of the regulatory assets. In the fourth quarter of 2024 and in January 2025 hearings on the merits were held.
(b)Northeastern Plant, Unit 3 is approved for recovery through 2040, but expected to retire in 2026. PSO records a regulatory asset for accelerated depreciation. See “Regulated Generating Units to be Retired” section above for additional information.
| | | | | | | | | | | | | | | | | | | | |
| | PSO |
| | December 31, | | Remaining
Refund
Period |
| | 2024 | | 2023 | |
| Regulatory Liabilities: | | (in millions) | | |
| | | | | | |
| | | | | | |
| | | | | | |
| | | | | | |
| | | | | | |
Noncurrent Regulatory Liabilities and
Deferred Investment Tax Credits | | | | | | |
| Regulatory liabilities pending final regulatory determination: | | | | | | |
| | | | | | |
| | | | | | |
| | | | | | |
| | | | | | |
| | | | | | |
| | | | | | |
| Regulatory Liabilities Currently Not Paying a Return | | | | | | |
| FERC 2021 Transmission Formula Rate Challenge Refunds | | $ | 1.6 | | | $ | 1.2 | | | |
| Total Regulatory Liabilities Pending Final Regulatory Determination | | 1.6 | | | 1.2 | | | |
| | | | | | |
| | | | | | |
| | | | | | |
| Regulatory liabilities approved for payment: | | | | | | |
| | | | | | |
| Regulatory Liabilities Currently Paying a Return | | | | | | |
| Asset Removal Costs | | 323.6 | | | 317.5 | | | (b) |
| Income Taxes, Net (a) | | 318.0 | | | 395.7 | | | (c) |
| | | | | | |
| Total Regulatory Liabilities Currently Paying a Return | | 641.6 | | | 713.2 | | | |
| Regulatory Liabilities Currently Not Paying a Return | | | | | | |
| | | | | | |
| Deferred Investment Tax Credits | | 46.2 | | | 47.2 | | | 12 years |
| | | | | | |
| Other Regulatory Liabilities Approved for Payment | | 0.3 | | | 4.0 | | | various |
| Total Regulatory Liabilities Currently Not Paying a Return | | 46.5 | | | 51.2 | | | |
| | | | | | |
| Total Regulatory Liabilities Approved for Payment | | 688.1 | | | 764.4 | | | |
| | | | | | |
| Total Noncurrent Regulatory Liabilities and Deferred Investment Tax Credits | | $ | 689.7 | | | $ | 765.6 | | | |
(a)Predominately pays a return due to the inclusion of Excess ADIT in rate base.
(b)Relieved as removal costs are incurred.
(c)Refunded over the period for which the related deferred income tax reverse, which is generally based on the expected life for the underlying assets. Excess ADIT Associated with Certain Depreciable Property is refunded over the remaining depreciable life of the underlying assets. Excess ADIT that is Not Subject to Rate Normalization Requirements were $46 million and $51 million for the years ended December 31, 2024 and 2023, respectively. The remaining balance of Excess ADIT that is Not Subject to Rate Normalization Requirements as of December 31, 2024 is to be refunded over 10 year.
| | | | | | | | | | | | | | | | | | | | |
| | SWEPCo |
| | December 31, | | Remaining
Recovery
Period |
| | 2024 | | 2023 | |
| Regulatory Assets: | | (in millions) | | |
| | | | | | |
| Current Regulatory Assets | | | | | | |
| | | | | | |
| Unrecovered Winter Storm Fuel Costs - earns a return (a) | | $ | 84.2 | | | $ | 93.9 | | | 1 year |
| Under-recovered Fuel Costs - earns a return (b) | | 22.4 | | | 76.9 | | | 1 year |
| Total Current Regulatory Assets | | $ | 106.6 | | | $ | 170.8 | | | |
| | | | | | |
| Noncurrent Regulatory Assets | | | | | | |
| Regulatory assets pending final regulatory approval: | | | | | | |
| | | | | | |
| Regulatory Assets Currently Earning a Return | | | | | | |
| Welsh Plant, Units 1 and 3 Accelerated Depreciation | | $ | 168.6 | | | $ | 125.6 | | | |
| Pirkey Plant Accelerated Depreciation | | 121.3 | | | 114.4 | | | |
| Unrecovered Winter Storm Fuel Costs (a) | | 33.5 | | | 60.1 | | | |
| | | | | | |
| | | | | | |
| Dolet Hills Power Station Accelerated Depreciation (c) | | 11.8 | | | 12.0 | | | |
| | | | | | |
| | | | | | |
| Other Regulatory Assets Pending Final Regulatory Approval | | 10.8 | | | 26.0 | | | |
| Total Regulatory Assets Currently Earning a Return | | 346.0 | | | 338.1 | | | |
| Regulatory Assets Currently Not Earning a Return | | | | | | |
| NOLC - Costs (d) | | 49.6 | | | — | | | |
| Storm-Related Costs - Louisiana, Texas | | 39.9 | | | 56.0 | | | |
| | | | | | |
| | | | | | |
| | | | | | |
| | | | | | |
| Other Regulatory Assets Pending Final Regulatory Approval | | 18.7 | | | 13.7 | | | |
| Total Regulatory Assets Currently Not Earning a Return | | 108.2 | | | 69.7 | | | |
| | | | | | |
| Total Regulatory Assets Pending Final Regulatory Approval | | 454.2 | | | 407.8 | | | |
| | | | | | |
| Regulatory assets approved for recovery: | | | | | | |
| | | | | | |
| Regulatory Assets Currently Earning a Return | | | | | | |
| Fuel Mine Closure Costs - Texas | | 70.6 | | | 74.3 | | | 11 years |
| Pirkey Plant Accelerated Depreciation - Louisiana | | 66.4 | | | 65.8 | | | 8 years |
| Unrecovered Winter Storm Fuel Costs (b) | | 62.8 | | | 99.3 | | | 3 years |
| Plant Retirement Costs - Unrecovered Plant, Arkansas | | 40.2 | | | 44.4 | | | 18 years |
| Dolet Hills Power Station Fuel Costs - Louisiana | | 21.7 | | | — | | | 3 years |
| Plant Retirement Costs - Unrecovered Plant, Dolet Hills Power Station - Louisiana | | 19.0 | | | 40.8 | | | 8 years |
| | | | | | |
| | | | | | |
| Storm-Related Costs - Louisiana (e) | | — | | | 144.7 | | | |
| Other Regulatory Assets Approved for Recovery | | 12.6 | | | 13.8 | | | various |
| Total Regulatory Assets Currently Earning a Return | | 293.3 | | | 483.1 | | | |
| Regulatory Assets Currently Not Earning a Return | | | | | | |
| Pension and OPEB Funded Status | | 93.2 | | | 109.2 | | | 12 years |
| Plant Retirement Costs - Unrecovered Plant, Texas | | 44.5 | | | 48.7 | | | 22 years |
| Plant Retirement Costs - Unrecovered Plant, Arkansas | | 12.8 | | | 17.3 | | | 3 years |
| Unrealized Loss on Forward Commitments | | 1.2 | | | 15.4 | | | 3 years |
| North Central Wind Rider | | — | | | 20.2 | | | |
| | | | | | |
| | | | | | |
| | | | | | |
| | | | | | |
| | | | | | |
| | | | | | |
| | | | | | |
| | | | | | |
| | | | | | |
| Other Regulatory Assets Approved for Recovery | | 22.1 | | | 30.1 | | | various |
| Total Regulatory Assets Currently Not Earning a Return | | 173.8 | | | 240.9 | | | |
| | | | | | |
| Total Regulatory Assets Approved for Recovery | | 467.1 | | | 724.0 | | | |
| | | | | | |
| Total Noncurrent Regulatory Assets | | $ | 921.3 | | | $ | 1,131.8 | | | |
(a)See “February 2021 Severe Winter Weather Impacts in SPP” section of Note 4 for additional information.
(b)2024 amount related to Arkansas, Louisiana and Texas jurisdictions. 2023 amount related to Arkansas and Texas jurisdictions.
(c)Amounts include the FERC jurisdiction.
(d)In the second quarter of 2024, a request seeking to establish a recovery mechanism for the Texas jurisdictional share of these regulatory assets was filed in Texas. In the third quarter of 2024, PUCT Staff and certain intervenors in Texas requested a hearing and direct testimony was filed by SWEPCo in October 2024. A hearing is scheduled for the first quarter of 2025 in Texas.
(e)In July 2024, the LPSC approved SWEPCo’s securitization of storm costs for Hurricanes Laura and Delta, as well as a storm reserve. See “2021 Louisiana Storm Cost Filing” section of Note 4 for additional information.
| | | | | | | | | | | | | | | | | | | | |
| | SWEPCo |
| | December 31, | | Remaining
Refund
Period |
| | 2024 | | 2023 | |
| Regulatory Liabilities: | | (in millions) | | |
| | | | | | |
| Current Regulatory Liabilities | | | | | | |
| Over-recovered Fuel Costs - pays a return (a) | | $ | 21.6 | | | $ | 3.3 | | | 1 year |
| Total Current Regulatory Liabilities | | $ | 21.6 | | | $ | 3.3 | | | |
| | | | | | |
Noncurrent Regulatory Liabilities and
Deferred Investment Tax Credits | | | | | | |
| Regulatory liabilities pending final regulatory determination: | | | | | | |
| | | | | | |
| Regulatory Liabilities Currently Paying a Return | | | | | | |
| Income Taxes, Net (b) | | $ | 7.0 | | | $ | 7.0 | | | |
| | | | | | |
| | | | | | |
| Total Regulatory Liabilities Pending Final Regulatory Determination | | 7.0 | | | 7.0 | | | |
| | | | | | |
| Regulatory liabilities approved for payment: | | | | | | |
| | | | | | |
| Regulatory Liabilities Currently Paying a Return | | | | | | |
| Asset Removal Costs | | 456.6 | | | 443.2 | | | (c) |
| Income Taxes, Net (b) | | 127.5 | | | 292.4 | | | (d) |
| | | | | | |
| | | | | | |
| Other Regulatory Liabilities Approved for Payment | | 7.3 | | | 4.4 | | | various |
| Total Regulatory Liabilities Currently Paying a Return | | 591.4 | | | 740.0 | | | |
| Regulatory Liabilities Currently Not Paying a Return | | | | | | |
| | | | | | |
| | | | | | |
| | | | | | |
| | | | | | |
| | | | | | |
| | | | | | |
| Other Regulatory Liabilities Approved for Payment | | 12.4 | | | 9.1 | | | various |
| Total Regulatory Liabilities Currently Not Paying a Return | | 12.4 | | | 9.1 | | | |
| | | | | | |
| Total Regulatory Liabilities Approved for Payment | | 603.8 | | | 749.1 | | | |
| | | | | | |
| Total Noncurrent Regulatory Liabilities and Deferred Investment Tax Credits | | $ | 610.8 | | | $ | 756.1 | | | |
(a)2024 amount related to Texas jurisdiction. 2023 amount related to Louisiana jurisdiction.
(b)Predominately pays a return due to the inclusion of Excess ADIT in rate base.
(c)Relieved as removal costs are incurred.
(d)Refunded over the period for which the related deferred income tax reverse, which is generally based on the expected life for the underlying assets. Excess ADIT Associated with Certain Depreciable Property is refunded over the remaining depreciable life of the underlying assets.
6. COMMITMENTS, GUARANTEES AND CONTINGENCIES
The disclosures in this note apply to all Registrants unless indicated otherwise.
The Registrants are subject to certain claims and legal actions arising in the ordinary course of business. In addition, the Registrants’ business activities are subject to extensive governmental regulation related to public health and the environment. The ultimate outcome of such pending or potential litigation against the Registrants cannot be predicted. Management accrues contingent liabilities only when management concludes that it is both probable that a liability has been incurred at the date of the financial statements and the amount of loss can be reasonably estimated. When management determines that it is not probable, but rather reasonably possible that a liability has been incurred at the date of the financial statements, management discloses such contingencies and the possible loss or range of loss if such estimate can be made. Any estimated range is based on currently available information and involves elements of judgment and significant uncertainties. Any estimated range of possible loss may not represent the maximum possible loss exposure. Circumstances change over time and actual results may vary significantly from estimates.
For current proceedings not specifically discussed below, management does not anticipate that the liabilities, if any, arising from such proceedings would have a material effect on the financial statements.
COMMITMENTS (Applies to all Registrants except AEP Texas and AEPTCo)
AEP subsidiaries have substantial commitments for fuel, energy and capacity contracts as part of the normal course of business. Certain contracts contain penalty provisions for early termination.
In accordance with the accounting guidance for “Commitments”, the following tables summarize the Registrants’ actual contractual commitments as of December 31, 2024:
| | | | | | | | | | | | | | | | | | | | | | | | | | | | | | | | |
| Contractual Commitments - AEP | | Less Than
1 Year | | 2-3 Years | | 4-5 Years | | After
5 Years | | Total |
| | (in millions) |
| Fuel Purchase Contracts (a) | | $ | 1,002.0 | | | $ | 942.0 | | | $ | 475.7 | | | $ | 368.3 | | | $ | 2,788.0 | |
| Energy and Capacity Purchase Contracts | | 192.8 | | | 384.0 | | | 334.3 | | | 464.0 | | | 1,375.1 | |
| Total | | $ | 1,194.8 | | | $ | 1,326.0 | | | $ | 810.0 | | | $ | 832.3 | | | $ | 4,163.1 | |
| | | | | | | | | | | | | | | | | | | | | | | | | | | | | | | | |
| Contractual Commitments - APCo | | Less Than
1 Year | | 2-3 Years | | 4-5 Years | | After
5 Years | | Total |
| | (in millions) |
| Fuel Purchase Contracts (a) | | $ | 506.7 | | | $ | 328.6 | | | $ | 167.0 | | | $ | 96.0 | | | $ | 1,098.3 | |
| Energy and Capacity Purchase Contracts | | 40.4 | | | 79.9 | | | 48.0 | | | 52.2 | | | 220.5 | |
| Total | | $ | 547.1 | | | $ | 408.5 | | | $ | 215.0 | | | $ | 148.2 | | | $ | 1,318.8 | |
| | | | | | | | | | | | | | | | | | | | | | | | | | | | | | | | |
| Contractual Commitments - I&M | | Less Than
1 Year | | 2-3 Years | | 4-5 Years | | After
5 Years | | Total |
| | (in millions) |
| Fuel Purchase Contracts (a) | | $ | 151.5 | | | $ | 346.6 | | | $ | 220.7 | | | $ | 263.9 | | | $ | 982.7 | |
| Energy and Capacity Purchase Contracts | | 119.9 | | | 236.2 | | | 231.7 | | | 321.5 | | | 909.3 | |
| Total | | $ | 271.4 | | | $ | 582.8 | | | $ | 452.4 | | | $ | 585.4 | | | $ | 1,892.0 | |
| | | | | | | | | | | | | | | | | | | | | | | | | | | | | | | | |
| Contractual Commitments - OPCo | | Less Than
1 Year | | 2-3 Years | | 4-5 Years | | After
5 Years | | Total |
| | (in millions) |
| Energy and Capacity Purchase Contracts | | $ | 33.2 | | | $ | 64.2 | | | $ | 66.3 | | | $ | 69.5 | | | $ | 233.2 | |
| | | | | | | | | | |
| | | | | | | | | | | | | | | | | | | | | | | | | | | | | | | | |
| Contractual Commitments - PSO | | Less Than
1 Year | | 2-3 Years | | 4-5 Years | | After
5 Years | | Total |
| | (in millions) |
| Fuel Purchase Contracts (a) | | $ | 27.4 | | | $ | 17.0 | | | $ | — | | | $ | — | | | $ | 44.4 | |
| Energy and Capacity Purchase Contracts | | 62.9 | | | 123.6 | | | 62.4 | | | 19.7 | | | 268.6 | |
| Total | | $ | 90.3 | | | $ | 140.6 | | | $ | 62.4 | | | $ | 19.7 | | | $ | 313.0 | |
| | | | | | | | | | | | | | | | | | | | | | | | | | | | | | | | |
| Contractual Commitments - SWEPCo | | Less Than
1 Year | | 2-3 Years | | 4-5 Years | | After
5 Years | | Total |
| | (in millions) |
| Fuel Purchase Contracts (a) | | $ | 89.4 | | | $ | 46.6 | | | $ | — | | | $ | — | | | $ | 136.0 | |
| Energy and Capacity Purchase Contracts | | 11.5 | | | 13.2 | | | — | | | — | | | 24.7 | |
| Total | | $ | 100.9 | | | $ | 59.8 | | | $ | — | | | $ | — | | | $ | 160.7 | |
(a)Represents contractual commitments to purchase coal, natural gas, uranium and other consumables as fuel for electric generation along with related transportation of the fuel.
GUARANTEES
Liabilities for guarantees are recorded in accordance with the accounting guidance for “Guarantees.” There is no collateral held in relation to any guarantees. In the event any guarantee is drawn, there is no recourse to third-parties unless specified below.
Letters of Credit (Applies to AEP and AEP Texas)
Standby letters of credit are entered into with third-parties. These letters of credit are issued in the ordinary course of business and cover items such as natural gas and electricity risk management contracts, construction contracts, insurance programs, security deposits and debt service reserves.
In March 2024, AEP increased its $4 billion revolving credit facility to $5 billion and extended the due date from March 2027 to March 2029. Also, in March 2024, AEP extended the due date of its $1 billion revolving credit facility from March 2025 to March 2027. AEP may issue up to $1.2 billion as letters of credit under these revolving credit facilities on behalf of subsidiaries. As of December 31, 2024, no letters of credit were issued under the revolving credit facility.
An uncommitted facility gives the issuer of the facility the right to accept or decline each request made under the facility. AEP issues letters of credit on behalf of subsidiaries under six uncommitted facilities totaling $450 million. The Registrants’ maximum future payments for letters of credit issued under the uncommitted facilities as of December 31, 2024 were as follows:
| | | | | | | | | | | | | | |
| Company | | Amount | | Maturity |
| | (in millions) | | |
| AEP | | $ | 238.0 | | | January 2025 to November 2025 |
| AEP Texas | | 1.8 | | | July 2025 |
Indemnifications and Other Guarantees
Contracts
The Registrants enter into certain types of contracts which require indemnifications. Typically these contracts include, but are not limited to, sale agreements, lease agreements, purchase agreements and financing agreements. Generally, these agreements may include, but are not limited to, indemnifications around certain tax, contractual and environmental matters. With respect to sale agreements, exposure generally does not exceed the sale price. As of December 31, 2024, there were no material liabilities recorded for any indemnifications.
AEPSC conducts power purchase-and-sale activity on behalf of APCo, I&M, KPCo and WPCo, who are jointly and severally liable for activity conducted on their behalf. AEPSC also conducts power purchase-and-sale activity on behalf of PSO and SWEPCo, who are jointly and severally liable for activity conducted on their behalf.
Lease Obligations
Certain Registrants lease equipment under master lease agreements. See “Master Lease Agreements” section of Note 13 for additional information.
ENVIRONMENTAL CONTINGENCIES (Applies to All Registrants except AEPTCo)
Federal EPA’s Revised CCR Rule
In April 2024, the Federal EPA finalized revisions to the CCR Rule to expand the scope of the rule to include inactive impoundments at inactive facilities (“legacy CCR surface impoundments”) as well as to establish requirements for currently exempt solid waste management units that involve the direct placement of CCR on the land (“CCR management units”). The Federal EPA is requiring that owners and operators of legacy surface impoundments comply with all of the existing CCR Rule requirements applicable to inactive CCR surface impoundments at active facilities, except for the location restrictions and liner design criteria. The rule establishes compliance deadlines for legacy surface impoundments to meet regulatory requirements, including a requirement to initiate closure within five years after the effective date of the final rule. The rule requires evaluations to be completed at both active facilities and inactive facilities with one or more legacy surface impoundments. Closure may be accomplished by applying an impermeable cover system over the CCR material (“closure in place”) or the CCR material may be excavated and placed in a compliant landfill (“closure by removal”). Groundwater monitoring and other analysis over the next three years will provide additional information on the planned closure method. AEP evaluated the applicability of the rule to current and former plant sites and recorded incremental ARO in the second quarter of 2024, as shown in the table below, based on initial cost estimates primarily reflecting compliance with the rule through closure in place and future groundwater monitoring requirements pursuant to the revised CCR Rule.
| | | | | | | | | | | | | | | | | | | | | | | | | | |
| Registrant | | Increase in ARO | | Increase in Generation Property (a) | | Increase in Regulatory Assets (b) | | Charged to Operating Expenses (c) |
| | (in millions) | | |
| APCo | | $ | 312.2 | | | $ | 75.6 | | | $ | 236.6 | | | $ | — | |
| I&M | | 85.7 | | | — | | | 72.3 | | | 13.4 | |
| OPCo | | 52.9 | | | — | | | — | | | 52.9 | |
| PSO | | 33.7 | | | 33.7 | | | — | | | — | |
| SWEPCo | | 23.8 | | | 23.8 | | | — | | | — | |
| Non-Registrants | | 166.1 | | | 43.8 | | | 46.1 | | | 76.2 | |
| Total | | $ | 674.4 | | | $ | 176.9 | | | $ | 355.0 | | | $ | 142.5 | |
(a)ARO is related to a legacy CCR surface impoundment or CCR management unit at an operating generation facility.
(b)ARO is related to a legacy CCR surface impoundment or CCR management unit at a retired generation facility and recognition of a regulatory asset in accordance with the accounting guidance for “Regulated Operations” is supported.
(c)ARO is related to a legacy CCR surface impoundment or CCR management unit and recognition of a regulatory asset in accordance with the accounting guidance for “Regulated Operations” is not yet supported.
As further groundwater monitoring and other analysis is performed, management expects to refine the assumptions and underlying cost estimates used in recording the ARO. These refinements may include, but are not limited to, changes in the expected method of closure, changes in estimated quantities of CCR at each site, the identification of new CCR management units, among other items. These future changes could have a material impact on the ARO and materially reduce future net income and cash flows and further impact financial condition.
AEP will seek cost recovery through regulated rates, including proposal of new regulatory mechanisms for cost recovery where existing mechanisms are not applicable. The rule could have an additional, material adverse impact on net income, cash flows and financial condition if AEP cannot ultimately recover these additional costs of compliance. Several parties, including AEP and one of its trade associations, have filed petitions for review of the rule with the U.S. Court of Appeals for the D.C. Circuit. One of the parties also filed a motion to stay the rule pending the outcome of the litigation. In November 2024, the court denied the stay motion. Management cannot predict the outcome of the litigation.
The Comprehensive Environmental Response Compensation and Liability Act (Superfund) and State Remediation
By-products from the generation of electricity include materials such as ash, slag, sludge, low-level radioactive waste and SNF. Coal combustion by-products, which constitute the overwhelming percentage of these materials, are typically treated and deposited in captive disposal facilities or are beneficially utilized. In addition, the generation plants and transmission and distribution facilities have used asbestos, polychlorinated biphenyls and other hazardous and non-hazardous materials. The Registrants currently incur costs to dispose of these substances safely.
Superfund addresses clean-up of hazardous substances that are released to the environment. The Federal EPA administers the clean-up programs. Several states enacted similar laws. As of December 31, 2024, AGR, APCo, OPCo and SWEPCo are named as a Potentially Responsible Party (PRP) for one, one, two and one sites, respectively, by the Federal EPA for which alleged liability is unresolved. There are 11 additional sites for which APCo, I&M, KPCo, OPCo and SWEPCo received information requests which could lead to PRP designation. In those instances where a PRP or defendant has been named, disposal or recycling activities were in accordance with the then-applicable laws and regulations. Superfund does not recognize compliance as a defense, but imposes strict liability on parties who fall within its broad statutory categories. Liability has been resolved for a number of sites with no significant effect on net income.
Management evaluates the potential liability for each Superfund site separately, but several general statements can be made about potential future liability. Allegations that materials were disposed at a particular site are often unsubstantiated and the quantity of materials deposited at a site can be small and often non-hazardous. Although Superfund liability has been interpreted by the courts as joint and several, typically many parties are named as PRPs for each site and several of the parties are financially sound enterprises. As of December 31, 2024, management’s estimates do not anticipate material clean-up costs for identified Superfund sites.
NUCLEAR CONTINGENCIES (APPLIES TO AEP AND I&M)
I&M owns and operates the two-unit 2,296 MW Cook Plant under licenses granted by the NRC. I&M has a significant future financial commitment to dispose of SNF and to safely decommission and decontaminate the plant. The licenses to operate the two nuclear units at the Cook Plant expire in 2034 and 2037. Management has started the application process for license extensions for both units that would extend Unit 1 and Unit 2 to 2054 and 2057, respectively. The operation of a nuclear facility also involves special risks, potential liabilities and specific regulatory and safety requirements. By agreement, I&M is partially liable, together with all other electric utility companies that own nuclear generation units, for a nuclear power plant incident at any nuclear plant in the U.S. Should a nuclear incident occur at any nuclear power plant in the U.S., the resultant liability could be substantial.
Decommissioning and Low-Level Waste Accumulation Disposal
The costs to decommission a nuclear plant are affected by NRC regulations and the SNF disposal program. Decommissioning costs are accrued over the service life of Cook Plant. The most recent decommissioning cost study was performed in 2024. According to that study, stated in 2024 undiscounted dollars, the estimated cost of decommissioning and disposal of low-level radioactive waste was $2.4 billion, with additional ongoing costs of $7 million per year for post decommissioning storage of SNF and an eventual cost of $45 million for the subsequent decommissioning of the SNF storage facility. I&M recovers estimated decommissioning costs for the Cook Plant in its rates. The amounts recovered in rates were $1 million, $2 million and $2 million for the years ended December 31, 2024, 2023 and 2022, respectively. Decommissioning costs recovered from customers are deposited in external trusts.
As of December 31, 2024 and 2023, the total decommissioning trust fund balances were $4 billion and $3.5 billion, respectively. The increase in the trust fund balance was driven by favorable investment performance in 2024. Trust fund earnings increase the fund assets and may decrease the amount remaining to be recovered from customers. Trust fund losses decrease the fund assets and may increase the amount remaining to be recovered from customers. The decommissioning costs (including unrealized gains and losses, interest and trust funds expenses) increase or decrease the recorded liability.
I&M continues to work with regulators and customers to establish rates designed to collect the estimated costs of decommissioning the Cook Plant. However, future net income and cash flows would be reduced and financial condition could be impacted if the cost of SNF disposal and decommissioning increases and cannot be recovered.
Spent Nuclear Fuel Disposal
The federal government is responsible for permanent SNF disposal and assesses fees to nuclear plant owners for SNF disposal. A fee of one-mill per KWh for fuel consumed after April 6, 1983 at the Cook Plant was collected from customers and remitted to the DOE through May 14, 2014. In May 2014, pursuant to court order from the U.S Court of Appeals for the District of Columbia Circuit, the DOE adjusted the fee to $0. As of December 31, 2024 and 2023, fees and related interest of $316 million and $300 million, respectively, for fuel consumed prior to April 7, 1983 were recorded as Long-term Debt and funds collected from customers along with related earnings totaling $367 million and $348 million, respectively, to pay the fee, were recorded as part of Spent Nuclear Fuel and Decommissioning Trusts on the balance sheets. I&M has not paid the government the pre-April 1983 fees due to continued delays and uncertainties related to the federal disposal program.
In 2011, I&M signed a settlement agreement with the federal government which permits I&M to make annual filings to recover certain SNF storage costs incurred as a result of the government’s delay in accepting SNF for permanent storage. Under the settlement agreement, I&M received $12 million, $21 million and $3 million in 2024, 2023 and 2022, respectively, to recover costs and will be eligible to receive additional payment of annual claims for allowed costs that are incurred through December 31, 2024. The proceeds reduced costs for dry cask storage. As of December 31, 2024 and 2023, I&M deferred $11 million and $12 million, respectively, in Prepayments and Other Current Assets and $15 million and $9 million, respectively, in Deferred Charges and Other Noncurrent Assets on the balance sheets for dry cask storage and related operation and maintenance costs for recovery under this agreement. See “Fair Value Measurements of Trust Assets for Decommissioning and SNF Disposal” section of Note 11 for additional information.
Nuclear Insurance
I&M carries nuclear property insurance of $2.7 billion to cover a nuclear incident at Cook Plant including coverage for decontamination and stabilization, as well as premature decommissioning caused by a nuclear incident. Insurance coverage for a nonnuclear property incident at Cook Plant is $750 million. Additional insurance provides coverage for a weekly indemnity payment resulting from an insured accidental outage. I&M utilizes industry mutual insurers for the placement of this insurance coverage. Coverage from these industry mutual insurance programs require a contingent financial obligation of up to $47 million for I&M, which is assessable if the insurer’s financial resources would be inadequate to pay for industry losses.
The Price-Anderson Act, extended through December 31, 2025, establishes insurance protection for public nuclear liability arising from a nuclear incident of $16.3 billion and applies to any incident at a licensed reactor in the U.S. Commercially available insurance, which must be carried for each licensed reactor, provides $500 million of primary coverage. In the event of a nuclear incident at any nuclear plant in the U.S., the remainder of the liability would be provided by a deferred premium assessment of $332 million per nuclear incident on Cook Plant’s reactors payable in annual installments of $49 million. The number of incidents for which payments could be required is not limited.
In the event of an incident of a catastrophic nature, I&M is covered for public nuclear liability for the first $500 million through commercially available insurance. The next level of liability coverage of up to $15.8 billion would be covered by claim premium assessments made under the Price-Anderson Act. In the event nuclear losses or liabilities are underinsured or exceed accumulated funds, I&M would seek recovery of those amounts from customers through a rate increase. If recovery from customers is not possible, it could reduce future net income and cash flows and impact financial condition.
OPERATIONAL CONTINGENCIES
Insurance and Potential Losses
The Registrants maintain insurance coverage normal and customary for electric utilities, subject to various deductibles. The Registrants also maintain property and casualty insurance that may cover certain physical damage or third-party injuries caused by cybersecurity incidents. Insurance coverage includes all risks of physical loss or damage to nonnuclear assets, subject to insurance policy conditions and exclusions. Covered property generally includes power plants, substations, facilities and inventories. Excluded property generally includes transmission and distribution lines, poles and towers. The insurance programs also generally provide coverage against loss arising from certain claims made by third-parties and are in excess of retentions absorbed by the Registrants. Coverage is generally provided by a combination of the protected cell of EIS and/or various industry mutual and/or commercial insurance carriers. See “Nuclear Contingencies” section above for additional information.
In July 2024, the Registrants renewed insurance programs including coverage for wildfire liability. Some potential losses or liabilities may not be insurable or the amount of insurance carried may not be sufficient to meet potential losses and liabilities, including, but not limited to, liabilities relating to a cybersecurity incident, extreme weather or wildfire related liabilities or damage to the Cook Plant and costs of replacement power in the event of an incident at the Cook Plant. Future losses or
liabilities, if they occur, which are not completely insured, unless recovered through the rate-making process, could reduce future net income and cash flows and impact financial condition.
Litigation Related to Ohio House Bill 6 (HB 6) (Applies to AEP and OPCo)
In 2019, Ohio adopted and implemented HB 6 which benefits OPCo by authorizing rate recovery for certain costs including renewable energy contracts and OVEC’s coal-fired generating units. OPCo engaged in lobbying efforts and provided testimony during the legislative process in connection with HB 6. In July 2020, an investigation led by the U.S. Attorney’s Office resulted in a federal grand jury indictment of an Ohio legislator and associates in connection with an alleged racketeering conspiracy involving the adoption of HB 6. After AEP learned of the criminal allegations against the Ohio legislator and others relating to HB 6, AEP, with assistance from outside advisors, conducted a review of the circumstances surrounding the passage of the bill. Management does not believe that AEP was involved in any wrongful conduct in connection with the passage of HB 6.
In August 2020, an AEP shareholder filed a putative class action lawsuit in the U.S. District Court for the Southern District of Ohio against AEP and certain of its officers for alleged violations of securities laws. In December 2021, the district court issued an opinion and order dismissing the securities litigation complaint with prejudice, determining that the complaint failed to plead any actionable misrepresentations or omissions. The plaintiffs did not appeal the ruling.
In January 2021, an AEP shareholder filed a derivative action in the U.S. District Court for the Southern District of Ohio purporting to assert claims on behalf of AEP against certain AEP officers and directors. In February 2021, a second AEP shareholder filed a similar derivative action in the Court of Common Pleas of Franklin County, Ohio. In April 2021, a third AEP shareholder filed a similar derivative action in the U.S. District Court for the Southern District of Ohio and a fourth AEP shareholder filed a similar derivative action in the Supreme Court for the State of New York, Nassau County. These derivative complaints allege the officers and directors made misrepresentations and omissions similar to those alleged in the putative securities class action lawsuit filed against AEP. The derivative complaints (collectively, the “Derivative Actions”) together assert claims for: (a) breach of fiduciary duty, (b) waste of corporate assets, (c) unjust enrichment, (d) breach of duty for insider trading and (e) contribution for violations of sections 10(b) and 21D of the Securities Exchange Act of 1934; and seek monetary damages and changes to AEP’s corporate governance and internal policies among other forms of relief. The court entered a scheduling order in the New York state court derivative action staying the case other than with respect to briefing the motion to dismiss. AEP filed substantive and forum-based motions to dismiss in April 2022. In June 2022, the Ohio state court entered an order continuing the stays of that case until the final resolution of the consolidated derivative actions pending in Ohio federal district court. In September 2022, the New York state court granted the forum-based motion to dismiss with prejudice and the plaintiff subsequently filed a notice of appeal with the New York appellate court. In January 2023, the New York plaintiff filed a motion to intervene in the pending Ohio federal court action and withdrew his appeal in New York. The two derivative actions pending in federal district court in Ohio have been consolidated and the plaintiffs in the consolidated action filed an amended complaint. AEP filed a motion to dismiss the amended complaint and subsequently filed a brief in opposition to the New York plaintiffs’ motion to intervene in the consolidated action in Ohio. In March 2023, the federal district court issued an order granting the motion to dismiss with prejudice and denying the New York plaintiffs’ motion to intervene. In April 2023, one of the plaintiffs filed a notice of appeal to the U.S. Court of Appeals for the Sixth Circuit of the Ohio federal district court order dismissing the consolidated action and denying the intervention.
In March 2021, AEP received a litigation demand letter from counsel representing a purported AEP shareholder. The litigation demand letter was directed to the Board of Directors of AEP (AEP Board) and contained factual allegations involving HB 6 that were generally consistent with those in the derivative litigation filed in state and federal court. The shareholder that sent the letter has since withdrawn the litigation demand, which is now terminated and of no further effect. In April 2023, AEP received a litigation demand letter from counsel representing the purported AEP shareholder who had filed the dismissed derivative action in New York state court and unsuccessfully tried to intervene in the consolidated derivative actions in Ohio federal court the (Litigation Demand). The Litigation Demand is directed to the AEP Board and contains factual allegations involving HB 6 that are generally consistent with those in the Derivative Actions. The Litigation Demand requested, among other things, that the AEP Board undertake an independent investigation into alleged legal violations by certain current and former directors and officers, and that AEP commence a civil action asserting claims similar to the claims asserted in the Derivative Actions. The AEP Board considered the Litigation Demand and formed a committee of the Board (the Demand Review Committee) to investigate, review, monitor and analyze the Litigation Demand and make a recommendation to the AEP Board regarding a reasonable and appropriate response to the same.
In April 2024, AEP reached an agreement with the four shareholders to fully and finally resolve the Derivative Actions and the Litigation Demand, and all claims asserted or that could have been asserted by any AEP shareholder based on the facts alleged, in the manner and upon the terms and conditions set forth in the settlement documents (the Settlement). In July 2024, the U.S. District Court preliminarily approved the Settlement. The Settlement includes a payment of $450 thousand for attorneys’ fees
and the implementation of certain governance changes outlined in the Settlement, many of which previously had been put in place. The Settlement does not include any admission of liability. In October 2024, the District Court issued an Order and Judgment approving the Settlement and granted an Order of Dismissal with Prejudice. Under the Settlement, all Derivative Actions have been dismissed, the Litigation Demand has been withdrawn, and those matters and claims have been resolved pursuant to the terms of the Settlement.
In May 2021, AEP received a subpoena from the SEC’s Division of Enforcement seeking various documents, including documents relating to the passage of HB 6 and documents relating to AEP’s policies and financial processes and controls. In August 2022, AEP received a second subpoena from the SEC seeking various additional documents relating to its ongoing investigation. In January 2025, AEP and the SEC reached a settlement concluding and resolving the SEC’s investigation concerning AEP’s relationship with and statements about Empowering Ohio’s Economy, a 501(c)(4) organization and AEP’s related internal accounting and disclosure controls. Under the terms of the administrative order, in which AEP neither admits nor denies the SEC’s findings, AEP agreed to pay a civil penalty of $19 million and to cease and desist from committing or causing any violations and any future violations of the specified provisions of the federal securities laws. AEP recorded an accrual for the full amount of the penalty in the third quarter of 2024. The $19 million penalty is included in Other Operation expenses on AEP’s statements of income and in Other Current Liabilities on AEP’s balance sheet.
Claims for Indemnification Made by Owners of the Gavin Power Station (Applies to AEP)
In November 2022, the Federal EPA issued a final decision denying Gavin Power LLC’s requested extension to allow a CCR surface impoundment at the Gavin Power Station to continue to receive CCR and non-CCR waste streams after April 11, 2021 until May 4, 2023 (the Gavin Denial). As part of the Gavin Denial, the Federal EPA made several assertions related to the CCR Rule (see “Environmental Issues - CCR Rule” section of Management’s Discussion and Analysis of Financial Condition and Results of Operations for additional information), including an assertion that the closure of the 300 acre unlined fly ash reservoir (FAR) is noncompliant with the CCR Rule in multiple respects. The Gavin Power Station was formerly owned and operated by AEP and was sold to Gavin Power LLC and Lightstone Generation LLC in 2017. Pursuant to the PSA, AEP maintained responsibility to complete closure of the FAR in accordance with the closure plan approved by the Ohio EPA which was completed in July 2021. The PSA contains indemnification provisions, pursuant to which the owners of the Gavin Power Station have notified AEP they believe they are entitled to indemnification for any damages that may result from these claims, including any future enforcement or litigation resulting from any determinations of noncompliance by the Federal EPA with various aspects of the CCR Rule consistent with the Gavin Denial. The owners of the Gavin Power Station have also sought indemnification for landowner claims for property damage allegedly caused by modifications to the FAR. Management does not believe that the owners of the Gavin Power Station have any valid claim for indemnity or otherwise against AEP under the PSA. In January 2024, Gavin Power LLC also filed a complaint with the United States District Court for the Southern District of Ohio, alleging various violations of the Administrative Procedure Act and asserting that the Federal EPA, through its prior inaction, has waived and is estopped from raising certain objections raised in the Gavin Denial. Management is unable to determine a range of potential losses that is reasonably possible of occurring.
Litigation Regarding Justice Thermal Coal Contract
In December 2023, APCo filed a suit in the Franklin County Ohio Court of Common Pleas seeking a declaratory judgment confirming APCo’s right to terminate a long-term coal contract with Justice Thermal LLC (Justice Thermal) based on Justice Thermal’s failure to perform under the contract. APCo terminated that contract in January 2024, and in April 2024, APCo filed an amended complaint seeking a declaration that the termination was proper and also seeking damages for Justice Thermal’s breach of contract. Justice Thermal filed an answer and counterclaim in April 2024, contesting the validity of the contract termination and asserting counterclaims. The parties entered into a Settlement Agreement and Release pursuant to which the litigation was dismissed with prejudice in September 2024 and each party released the other from all claims relating to the contract or the litigation, and as a result this matter has been resolved.
7. ACQUISITIONS, DISPOSITIONS AND IMPAIRMENTS
The disclosures in this note apply to AEP unless indicated otherwise.
ACQUISITIONS
North Central Wind Energy Facilities (Vertically Integrated Utilities Segment) (Applies to AEP, PSO and SWEPCo)
In 2020, PSO and SWEPCo received regulatory approvals to acquire the NCWF, comprised of three Oklahoma wind facilities totaling 1,484 MWs, on a fixed cost turn-key basis. PSO and SWEPCo own undivided interests of 45.5% and 54.5% of the NCWF, respectively. In total, the three wind facilities cost approximately $2 billion and consist of Traverse (998 MW), Maverick (287 MW) and Sundance (199 MW). Output from the NCWF serves retail load in PSO’s Oklahoma service territory and both retail and FERC wholesale load in SWEPCo’s service territories in Arkansas and Louisiana. The Oklahoma and Louisiana portions of the NCWF revenue requirement, net of PTC benefit, are recoverable through authorized riders until the amounts are reflected in base rates. Recovery of the Arkansas portion of the NCWF revenue requirement through base rates was approved by the APSC in May 2022. The NCWF are subject to various regulatory performance requirements. If these performance requirements are not met, PSO and SWEPCo would recognize a regulatory liability to refund retail customers.
In March 2022, PSO and SWEPCo acquired respective undivided ownership interests in the entity that owned Traverse, the final NCWF project, during its development and construction for $1.2 billion. Traverse was placed in-service in March 2022. Immediately following the acquisition, PSO and SWEPCo liquidated the entity and simultaneously distributed the assets in proportion to their undivided ownership interests. PSO and SWEPCo apply the joint plant accounting model to account for their respective undivided interests in the assets, liabilities, revenues and expenses of the NCWF projects.
Rock Falls Wind Facility (Vertically Integrated Utilities Segment) (Applies to AEP and PSO)
In November 2022, PSO entered into an agreement to acquire the Rock Falls Wind Facility. In February 2023, the FERC approved PSO’s acquisition of the Rock Falls Wind Facility under Section 203 of the Federal Power Act. In March 2023, PSO acquired an ownership interest in the entity that owned Rock Falls during its development and construction for $146 million. In accordance with the guidance for “Business Combinations,” AEP management determined that the acquisition of the Rock Falls Wind Facility represents an asset acquisition. The lease obligations related to Rock Falls were not material at the time of acquisition.
Diversion Wind Farm (Vertically Integrated Utilities Segment) (Applies to AEP and SWEPCo)
In December 2024, SWEPCo acquired 100% of the equity interests in Diversion Wind Energy, LLC, the owner of Diversion wind farm. The Diversion wind farm is a newly constructed 201 MW wind facility located in Baylor County, Texas and was placed in service in December 2024. Output from Diversion serves FERC wholesale load and retail customers in Arkansas and Louisiana. SWEPCo’s Louisiana jurisdictional share of the Diversion revenue requirement, net of PTC benefit, is recoverable through an authorized rider until the amounts are reflected in base rates. Recovery of the Arkansas portion of the Diversion revenue requirement is expected to begin in 2026 through base rates. Regulatory commission approval of the inclusion of the output from Diversion in retail rates resulted in various capital cost, performance and other guarantees for retail customers which could subject SWEPCo to future regulatory liabilities to retail customers.
In accordance with the guidance for “Business Combinations,” management determined that the acquisition of the Diversion project represents an asset acquisition. As of December 31, 2024, SWEPCo had approximately $423 million of gross Property, Plant and Equipment, inclusive of capital expenditures after the acquisition, on the balance sheets related to the Diversion project. The acquisition also resulted in the recognition of $20 million of operating leases that provide for easement and access rights to the land that Diversion was built upon and $6 million of AROs.
DISPOSITIONS
Disposition of AEP OnSite Partners (Generation & Marketing Segment) (Applies to AEP)
In April 2023, AEP initiated a sales process for its ownership in AEP OnSite Partners. AEP OnSite Partners targeted opportunities in distributed solar, combined heat and power, energy storage, waste heat recovery, energy efficiency, peaking generation and other energy solutions. In May 2024, AEP signed an agreement to sell AEP OnSite Partners to a nonaffiliated third-party. In September 2024, AEP completed the sale and received cash proceeds of approximately $318 million, net of taxes and transaction costs. The proceeds were used to pay down short-term debt.
Disposition of NMRD (Generation & Marketing Segment) (Applies to AEP)
In December 2023, AEP and the joint owner signed an agreement to sell NMRD to a nonaffiliated third party and the sale was completed in February 2024. AEP received cash proceeds of approximately $107 million, net of taxes and transaction costs. The transaction did not have a material impact on net income or financial condition.
Termination of Planned Disposition of KPCo and KTCo (Vertically Integrated Utilities and AEP Transmission Holdco Segments) (Applies to AEP and AEPTCo)
In October 2021, AEP entered into a Stock Purchase Agreement (SPA) to sell KPCo and KTCo to Liberty Utilities Co., a subsidiary of Algonquin Power & Utilities Corp. (Liberty), for approximately a $2.85 billion enterprise value. The SPA was subsequently amended in September 2022 to reduce the purchase price to approximately $2.646 billion. The sale required approval from the KPSC and from the FERC under Section 203 of the Federal Power Act. The SPA contained certain termination rights if the closing of the sale did not occur by April 26, 2023.
In May 2022, the KPSC approved the sale of KPCo to Liberty subject to certain conditions contingent upon the closing of the sale. In December 2022, the FERC issued an order denying, without prejudice, authorization of the proposed sale stating the applicants failed to demonstrate the proposed transaction will not have an adverse effect on rates. In February 2023, a new filing for approval under Section 203 of the Federal Power Act was submitted. In March 2023, the KPSC and other intervenors made filings recommending the FERC reject AEP and Liberty’s new Section 203 application seeking approval of the sale.
As a result of delays in the anticipated timing of the closing of the transaction and other factors, AEP recorded a $363 million pretax loss on the expected sale of the Kentucky Operations for the year ended December 31, 2022. In April 2023, AEP, AEPTCo and Liberty entered into a Mutual Termination Agreement (Termination Agreement) terminating the SPA. The parties entered into the Termination Agreement as all of the conditions precedent to closing the sale could not be satisfied prior to April 26, 2023. Upon termination of the sale and reverting to a held and used model, in the first quarter of 2023, AEP reversed $28 million of expected transaction costs included in the $363 million pretax loss and was required to present its investment in the Kentucky Operations at the lower of fair value or historical carrying value which resulted in a $335 million reduction recorded in Property, Plant and Equipment. The reduced investment in KPCo’s assets is being amortized over the 30-year average useful life of the KPCo assets.
Disposition of the Competitive Contracted Renewables Portfolio (Generation & Marketing Segment) (Applies to AEP)
In February 2022, AEP management announced the initiation of a process to sell all or a portion of AEP Renewables’ competitive contracted renewables portfolio (the portfolio) within the Generation & Marketing segment. In late January 2023, AEP received final bids from interested parties. In February 2023, AEP’s Board of Directors approved management’s plan to sell the portfolio and AEP signed an agreement with a nonaffiliated party.
In August 2023, AEP completed the sale of the entire portfolio to the nonaffiliated party and received cash proceeds of approximately $1.2 billion, net of taxes and transaction costs. AEP recorded a pretax loss of $93 million ($73 million after-tax) for the year ended December 31, 2023 related to the sale.
Disposition of Mineral Rights (Generation & Marketing Segment) (Applies to AEP)
In June 2022, AEP closed on the sale of certain mineral rights to a nonaffiliated third-party and received $120 million of proceeds. The sale resulted in a pretax gain of $116 million in the second quarter of 2022.
IMPAIRMENTS
2012 Texas Base Rate Case (Vertically Integrated Utilities Segment) (Applies to AEP and SWEPCo)
In December 2023, SWEPCo recorded a pretax, non-cash disallowance of $86 million in Asset Impairments and Other Related Charges on the statements of income due to regulatory disallowance of recovery of AFUDC on Turk Plant in the 2012 Texas Base Rate case. See the “2012 Texas Base Rate Case” section of Note 4 for additional information.
NMRD (Generation & Marketing Segment) (Applies to AEP)
In December 2023, as a result of sale negotiations AEP determined a decline in the fair value of AEP’s investment in NMRD was other than temporary. In accordance with the accounting guidance for “Investment - Equity Method and Joint Ventures”, in the fourth quarter of 2023 AEP recorded a pretax other than temporary impairment charge of $19 million which is presented in Equity Earnings (Losses) of Unconsolidated Subsidiaries on AEP’s statement of income. AEP’s determination of fair value utilized the accounting guidance for Fair Value Measurement market approach to valuation and was based on negotiations to sell the investment to a nonaffiliated third-party. The carrying value of the investment in NMRD was not material to AEP as of December 31, 2023.
Flat Ridge 2 Wind LLC (Generation & Marketing Segment) (Applies to AEP)
In 2019, AEP acquired a 50% ownership interest in five non-consolidated joint ventures, including Flat Ridge 2 Wind LLC (Flat Ridge 2), and two tax equity partnerships. The five non-consolidated joint ventures are jointly owned and operated by BP Wind Energy. Flat Ridge 2 sells electricity to three counterparties through long-term PPAs.
Regarding AEP’s investment in Flat Ridge 2, in June 2022, as a result of Flat Ridge 2’s deteriorating financial performance, sale negotiations and AEP’s ongoing evaluation and ultimate decision to exit the investment in the near term, AEP determined a decline in the fair value of AEP’s investment in Flat Ridge 2 was other than temporary. In accordance with the accounting guidance for “Investments - Equity Method and Joint Ventures”, in the second quarter of 2022 AEP recorded a pretax other than temporary impairment charge of $186 million which is presented in Equity Earnings (Losses) of Unconsolidated Subsidiaries on AEP’s statement of income. AEP’s determination of fair value utilized the accounting guidance for Fair Value Measurement market approach to valuation and was based on negotiations to sell the investment to a nonaffiliated third-party. In the third quarter of 2022, AEP recorded an additional $2 million pretax other than temporary impairment charge which is presented in Equity Earnings (Losses) of Unconsolidated Subsidiaries on AEP’s statement of income. In September 2022, AEP signed a Purchase and Sale Agreement with a nonaffiliate third-party for AEP’s interest in Flat Ridge 2. The transaction closed in the fourth quarter of 2022 and had an immaterial impact on the financial statements.
2020 Texas Base Rate Case (Vertically Integrated Utilities Segment) (Applies to AEP and SWEPCo)
In January 2022, the PUCT issued a final order which included a return of investment only for the recovery of the Dolet Hills Power Station. As a result of the final order, SWEPCo recorded a disallowance of $12 million associated with the lack of return on the Dolet Hills Power Station. In February 2022, SWEPCo filed a motion for rehearing with the PUCT challenging denial of a reasonable return or carrying costs on the Dolet Hills Power Station among other items. In April 2022, the PUCT denied the motion for rehearing. In May 2022, SWEPCo filed a petition for review with the Texas District Court seeking a judicial review of the several errors challenged in the PUCT’s final order. See “2020 Texas Base Rate Case” section of Note 4 for additional information.
8. BENEFIT PLANS
The disclosures in this note apply to all Registrants except AEPTCo unless indicated otherwise.
For a discussion of investment strategy, investment limitations, target asset allocations and the classification of investments within the fair value hierarchy, see “Fair Value Measurements of Assets and Liabilities” and “Investments Held in Trust for Future Liabilities” sections of Note 1.
AEPSC sponsors a qualified pension plan and two unfunded non-qualified pension plans. Substantially all AEP subsidiary employees are covered by the qualified plan or both the qualified and a non-qualified pension plan. AEPSC also sponsors OPEB plans to provide health and life insurance benefits for retired employees.
Due to the Registrant Subsidiaries’ participation in AEP’s benefit plans, the assumptions used by the actuary, with the exception of the rate of compensation increase, and the accounting for the plans by each subsidiary are the same. This section details the assumptions that apply to all Registrants and the rate of compensation increase for each Registrant.
The Registrants recognize the funded status associated with defined benefit pension and OPEB plans on the balance sheets. Disclosures about the plans are required by the “Compensation – Retirement Benefits” accounting guidance. The Registrants recognize an asset for a plan’s overfunded status or a liability for a plan’s underfunded status, and recognize, as a component of other comprehensive income, the changes in the funded status of the plan that arise during the year that are not recognized as a component of net periodic benefit cost. The Registrants record a regulatory asset instead of other comprehensive income for qualifying benefit costs of regulated operations that for rate-making purposes are deferred for future recovery. The cumulative funded status adjustment is equal to the remaining unrecognized deferrals for unamortized actuarial losses or gains, prior service costs and transition obligations, such that remaining deferred costs result in an AOCI equity reduction or regulatory asset and deferred gains result in an AOCI equity addition or regulatory liability.
Actuarial Assumptions for Benefit Obligations
The weighted-average assumptions used in the measurement of the Registrants’ benefit obligations are shown in the following tables:
| | | | | | | | | | | | | | | | | | | | | | | | | | |
| | Pension Plans | | OPEB |
| | December 31, |
| Assumption | | 2024 | | 2023 | | 2024 | | 2023 |
| Discount Rate | | 5.65 | % | | 5.15 | % | | 5.60 | % | | 5.15 | % |
| Interest Crediting Rate | | 4.55 | % | | 4.00 | % | | NA | | NA |
NA Not applicable.
| | | | | | | | | | | | | | | | | | | | | | | | | | | | | | | | | | | | | | | | | | | | |
Assumption – Rate of Compensation Increase (a) - Pension Plans |
| | AEP | | AEP Texas | | APCo | | I&M | | OPCo | | PSO | | SWEPCo |
| December 31, 2024 | | 5.55 | % | | 5.70 | % | | 5.55 | % | | 5.50 | % | | 6.00 | % | | 5.70 | % | | 5.55 | % |
| December 31, 2023 | | 5.05 | % | | 5.20 | % | | 4.95 | % | | 5.05 | % | | 5.45 | % | | 5.20 | % | | 5.00 | % |
(a)Rates are for base pay only. In addition, an amount is added to reflect target incentive compensation for exempt employees and overtime and incentive pay for nonexempt employees.
A duration-based method is used to determine the discount rate for the plans. A hypothetical portfolio of high quality corporate bonds is constructed with cash flows matching the benefit plan liability. The composite yield on the hypothetical bond portfolio is used as the discount rate for the plan. The discount rate is the same for each Registrant.
For 2024, the rate of compensation increase assumed varies with the age of the employee, ranging from 3% per year to 11.5% per year, with the average increase shown in the table above. The compensation increase rates reflect variations in each Registrants’ population participating in the pension plan.
Actuarial Assumptions for Net Periodic Benefit Costs
The weighted-average assumptions used in the measurement of each Registrants’ benefit costs are shown in the following tables:
| | | | | | | | | | | | | | | | | | | | | | | | | | | | | | | | | | | | | | |
| | Pension Plans | | OPEB |
| | Year Ended December 31, |
| Assumption | | 2024 | | 2023 | | 2022 | | 2024 | | 2023 | | 2022 |
| Discount Rate | | 5.20 | % | | 5.50 | % | | 2.90 | % | | 5.15 | % | | 5.50 | % | | 2.90 | % |
| Interest Crediting Rate | | 4.05 | % | | 4.25 | % | | 4.00 | % | | NA | | NA | | NA |
| Expected Return on Plan Assets | | 7.30 | % | | 7.50 | % | | 5.25 | % | | 6.75 | % | | 7.25 | % | | 5.50 | % |
NA Not applicable.
| | | | | | | | | | | | | | | | | | | | | | | | | | | | | | | | | | | | | | | | | | | | |
Assumption – Rate of Compensation Increase (a) - Pension Plans |
| | AEP | | AEP Texas | | APCo | | I&M | | OPCo | | PSO | | SWEPCo |
| December 31, 2024 | | 5.10 | % | | 5.25 | % | | 5.10 | % | | 5.10 | % | | 5.50 | % | | 5.20 | % | | 5.10 | % |
| December 31, 2023 | | 5.05 | % | | 5.20 | % | | 4.95 | % | | 5.05 | % | | 5.45 | % | | 5.20 | % | | 5.00 | % |
| December 31, 2022 | | 5.05 | % | | 5.15 | % | | 4.90 | % | | 5.00 | % | | 5.35 | % | | 5.15 | % | | 5.00 | % |
(a)Rates are for base pay only. In addition, an amount is added to reflect target incentive compensation for exempt employees and overtime and incentive pay for nonexempt employees.
The expected return on plan assets was determined by evaluating historical returns, the current investment climate (yield on fixed income securities and other recent investment market indicators), rate of inflation, third-party forecasts and current prospects for economic growth. The expected return on plan assets is the same for each Registrant.
The health care trend rate assumptions used for OPEB plans measurement purposes are shown below:
| | | | | | | | | | | | | | |
| Health Care Trend Rates | | December 31, 2024 | | December 31, 2023 |
| Initial | | 6.50 | % | | 7.00 | % |
| Ultimate | | 4.50 | % | | 4.50 | % |
| Year Ultimate Reached | | 2029 | | 2030 |
Significant Concentrations of Risk within Plan Assets
In addition to establishing the target asset allocation of plan assets, the investment policy also places restrictions on securities to limit significant concentrations within plan assets. The investment policy establishes guidelines that govern maximum market exposure, security restrictions, prohibited asset classes, prohibited types of transactions, minimum credit quality, average portfolio credit quality, portfolio duration and concentration limits. The guidelines were established to mitigate the risk of loss due to significant concentrations in any investment. Management monitors the plans to control security diversification and ensure compliance with the investment policy. As of December 31, 2024, the assets were invested in compliance with all investment limits. See “Investments Held in Trust for Future Liabilities” section of Note 1 for limit details.
Benefit Plan Obligations, Plan Assets, Funded Status and Amounts Recognized on the Balance Sheets
For the year ended December 31, 2024, the pension plans had an actuarial gain primarily due to an increase in discount rates, and to a lesser extent the effect of demographic experience (updated census data on January 1, 2024). These gains were partially offset by increasing the cash balance account interest crediting rate, increasing the rate used to convert lump sums to annuities and updating the compensation increase rate to reflect the results of an experience study conducted in 2024. For the year ended December 31, 2024, the OPEB plans had an actuarial gain primarily due to updated per capita cost assumptions and updated discount rates. These gains were partially offset by the addition of a life insurance administrative load of 5%, the effect of special termination benefits and earlier retirements due to the voluntary severance program that occurred in the second quarter of 2024 and assumption changes as a result of an experience study conducted in 2024. For the year ended December 31, 2023, the pension plans had an actuarial loss primarily due to a decrease in the discount rate, and to a lesser extent the effect of demographic experience (updated census data on January 1, 2023). These losses were partially offset by decreasing the cash balance account interest crediting rate. For the year ended December 31, 2023, the OPEB plans had an actuarial loss primarily due to discount rates, as well as actual benefit payments above expected. These losses were partially offset by updated per capita cost assumptions. The following tables provide a reconciliation of the changes in the plans’ benefit obligations, fair value of plan assets, funded status and the presentation on the balance sheets. The benefit obligation for the defined benefit pension and OPEB plans are the projected benefit obligation and the accumulated benefit obligation, respectively.
Pension Plans
| | | | | | | | | | | | | | | | | | | | | | | | | | | | | | | | | | | | | | | | | | | | |
| 2024 | | AEP | | AEP Texas | | APCo | | I&M | | OPCo | | PSO | | SWEPCo |
| Change in Benefit Obligation | | (in millions) |
| Benefit Obligation as of January 1, | | $ | 4,161.6 | | | $ | 343.1 | | | $ | 504.1 | | | $ | 477.0 | | | $ | 378.4 | | | $ | 202.2 | | | $ | 261.2 | |
| Service Cost | | 100.6 | | | 8.9 | | | 9.5 | | | 13.0 | | | 9.2 | | | 5.9 | | | 7.8 | |
| Interest Cost | | 207.4 | | | 17.3 | | | 24.7 | | | 23.9 | | | 18.8 | | | 10.1 | | | 12.5 | |
| Actuarial (Gain) Loss | | (44.6) | | | 5.5 | | | (12.9) | | | (8.4) | | | (8.3) | | | 0.1 | | | (11.2) | |
| | | | | | | | | | | | | | |
| Settlements | | (329.4) | | | (34.8) | | | (42.0) | | | (33.1) | | | (23.2) | | | (18.5) | | | (33.1) | |
| Benefit Payments | | (223.8) | | | (17.3) | | | (30.4) | | | (22.6) | | | (24.2) | | | (9.6) | | | (9.4) | |
| | | | | | | | | | | | | | |
| | | | | | | | | | | | | | |
| Benefit Obligation as of December 31, | | $ | 3,871.8 | | | $ | 322.7 | | | $ | 453.0 | | | $ | 449.8 | | | $ | 350.7 | | | $ | 190.2 | | | $ | 227.8 | |
| | | | | | | | | | | | | | |
| Change in Fair Value of Plan Assets | | | | | | | | | | | | | | |
| Fair Value of Plan Assets as of January 1, | | $ | 4,118.2 | | | $ | 332.7 | | | $ | 549.8 | | | $ | 550.6 | | | $ | 419.5 | | | $ | 222.7 | | | $ | 227.5 | |
| Actual Gain on Plan Assets | | 87.2 | | | 7.1 | | | 10.4 | | | 11.6 | | | 8.6 | | | 5.0 | | | 3.6 | |
| Company Contributions (a) | | 14.0 | | | 0.4 | | | — | | | — | | | — | | | 0.1 | | | 0.2 | |
| | | | | | | | | | | | | | |
| Settlements | | (329.4) | | | (34.8) | | | (42.0) | | | (33.1) | | | (23.2) | | | (18.5) | | | (33.1) | |
| Benefit Payments | | (223.8) | | | (17.3) | | | (30.4) | | | (22.6) | | | (24.2) | | | (9.6) | | | (9.4) | |
| Fair Value of Plan Assets as of December 31, | | $ | 3,666.2 | | | $ | 288.1 | | | $ | 487.8 | | | $ | 506.5 | | | $ | 380.7 | | | $ | 199.7 | | | $ | 188.8 | |
| | | | | | | | | | | | | | |
| Funded (Underfunded) Status as of December 31, | | $ | (205.6) | | | $ | (34.6) | | | $ | 34.8 | | | $ | 56.7 | | | $ | 30.0 | | | $ | 9.5 | | | $ | (39.0) | |
| | | | | | | | | | | | | | | | | | | | | | | | | | | | | | | | | | | | | | | | | | | | |
| 2023 | | AEP | | AEP Texas | | APCo | | I&M | | OPCo | | PSO | | SWEPCo |
| Change in Benefit Obligation | | (in millions) |
| Benefit Obligation as of January 1, | | $ | 4,072.7 | | | $ | 334.1 | | | $ | 485.7 | | | $ | 466.8 | | | $ | 363.6 | | | $ | 192.3 | | | $ | 250.7 | |
| Service Cost | | 94.3 | | | 8.2 | | | 9.1 | | | 11.9 | | | 8.4 | | | 5.5 | | | 7.7 | |
| Interest Cost | | 219.2 | | | 18.3 | | | 26.4 | | | 24.9 | | | 19.8 | | | 10.7 | | | 13.9 | |
| Actuarial Loss | | 144.0 | | | 20.1 | | | 23.2 | | | 8.5 | | | 17.5 | | | 13.6 | | | 16.8 | |
| | | | | | | | | | | | | | |
| Benefit Payments | | (368.6) | | | (37.6) | | | (40.3) | | | (35.1) | | | (30.9) | | | (19.9) | | | (27.9) | |
| | | | | | | | | | | | | | |
| | | | | | | | | | | | | | |
| Benefit Obligation as of December 31, | | $ | 4,161.6 | | | $ | 343.1 | | | $ | 504.1 | | | $ | 477.0 | | | $ | 378.4 | | | $ | 202.2 | | | $ | 261.2 | |
| | | | | | | | | | | | | | |
| Change in Fair Value of Plan Assets | | | | | | | | | | | | | | |
| Fair Value of Plan Assets as of January 1, | | $ | 4,124.7 | | | $ | 335.1 | | | $ | 531.7 | | | $ | 533.7 | | | $ | 406.4 | | | $ | 218.5 | | | $ | 231.3 | |
| Actual Gain on Plan Assets | | 353.8 | | | 34.8 | | | 58.4 | | | 51.5 | | | 44.0 | | | 24.0 | | | 23.9 | |
| Company Contributions (a) | | 8.3 | | | 0.4 | | | — | | | 0.5 | | | — | | | 0.1 | | | 0.2 | |
| | | | | | | | | | | | | | |
| Benefit Payments | | (368.6) | | | (37.6) | | | (40.3) | | | (35.1) | | | (30.9) | | | (19.9) | | | (27.9) | |
| Fair Value of Plan Assets as of December 31, | | $ | 4,118.2 | | | $ | 332.7 | | | $ | 549.8 | | | $ | 550.6 | | | $ | 419.5 | | | $ | 222.7 | | | $ | 227.5 | |
| | | | | | | | | | | | | | |
| Funded (Underfunded) Status as of December 31, | | $ | (43.4) | | | $ | (10.4) | | | $ | 45.7 | | | $ | 73.6 | | | $ | 41.1 | | | $ | 20.5 | | | $ | (33.7) | |
(a)No contributions were made to the qualified pension plan for the years ended December 31, 2024 and 2023, respectively. Contributions to the non-qualified pension plans were $14 million and $8 million for the years ended December 31, 2024 and 2023, respectively.
OPEB
| | | | | | | | | | | | | | | | | | | | | | | | | | | | | | | | | | | | | | | | | | | | |
| 2024 | | AEP | | AEP Texas | | APCo | | I&M | | OPCo | | PSO | | SWEPCo |
| Change in Benefit Obligation | | (in millions) |
| Benefit Obligation as of January 1, | | $ | 849.5 | | | $ | 66.4 | | | $ | 134.6 | | | $ | 98.8 | | | $ | 85.9 | | | $ | 43.7 | | | $ | 53.7 | |
| Service Cost | | 4.5 | | | 0.3 | | | 0.5 | | | 0.6 | | | 0.4 | | | 0.3 | | | 0.4 | |
| Interest Cost | | 42.0 | | | 3.3 | | | 6.6 | | | 4.8 | | | 4.2 | | | 2.1 | | | 2.7 | |
| Actuarial (Gain) Loss | | (192.3) | | | (15.4) | | | (30.4) | | | (24.7) | | | (20.7) | | | (10.4) | | | (11.5) | |
| | | | | | | | | | | | | | |
| Special/Contractual Termination Benefits | | 3.5 | | | 0.4 | | | 0.6 | | | 0.4 | | | 0.3 | | | 0.1 | | | 0.3 | |
| Benefit Payments | | (105.8) | | | (8.3) | | | (16.7) | | | (13.4) | | | (11.3) | | | (5.8) | | | (7.4) | |
| Participant Contributions | | 44.9 | | | 3.5 | | | 6.8 | | | 6.0 | | | 4.6 | | | 2.6 | | | 3.3 | |
| Medicare Subsidy | | 0.3 | | | — | | | 0.1 | | | — | | | — | | | — | | | — | |
| Benefit Obligation as of December 31, | | $ | 646.6 | | | $ | 50.2 | | | $ | 102.1 | | | $ | 72.5 | | | $ | 63.4 | | | $ | 32.6 | | | $ | 41.5 | |
| | | | | | | | | | | | | | |
| Change in Fair Value of Plan Assets | | | | | | | | | | | | | | |
| Fair Value of Plan Assets as of January 1, | | $ | 1,673.3 | | | $ | 137.5 | | | $ | 243.0 | | | $ | 204.6 | | | $ | 177.8 | | | $ | 90.2 | | | $ | 111.1 | |
| Actual Gain on Plan Assets | | 159.2 | | | 14.0 | | | 22.5 | | | 14.7 | | | 14.1 | | | 8.3 | | | 14.2 | |
| Company Contributions | | 4.3 | | | — | | | 0.8 | | | — | | | — | | | — | | | — | |
| Participant Contributions | | 44.9 | | | 3.5 | | | 6.8 | | | 6.0 | | | 4.6 | | | 2.6 | | | 3.3 | |
| Benefit Payments | | (105.8) | | | (8.3) | | | (16.7) | | | (13.4) | | | (11.3) | | | (5.8) | | | (7.4) | |
| Fair Value of Plan Assets as of December 31, | | $ | 1,775.9 | | | $ | 146.7 | | | $ | 256.4 | | | $ | 211.9 | | | $ | 185.2 | | | $ | 95.3 | | | $ | 121.2 | |
| | | | | | | | | | | | | | |
| Funded Status as of December 31, | | $ | 1,129.3 | | | $ | 96.5 | | | $ | 154.3 | | | $ | 139.4 | | | $ | 121.8 | | | $ | 62.7 | | | $ | 79.7 | |
| | | | | | | | | | | | | | | | | | | | | | | | | | | | | | | | | | | | | | | | | | | | |
| 2023 | | AEP | | AEP Texas | | APCo | | I&M | | OPCo | | PSO | | SWEPCo |
| Change in Benefit Obligation | | (in millions) |
| Benefit Obligation as of January 1, | | $ | 872.6 | | | $ | 68.6 | | | $ | 140.7 | | | $ | 101.9 | | | $ | 88.9 | | | $ | 45.7 | | | $ | 55.1 | |
| Service Cost | | 4.6 | | | 0.3 | | | 0.5 | | | 0.6 | | | 0.4 | | | 0.3 | | | 0.4 | |
| Interest Cost | | 46.2 | | | 3.6 | | | 7.4 | | | 5.4 | | | 4.7 | | | 2.4 | | | 2.9 | |
| Actuarial Loss | | 19.8 | | | 1.2 | | | 0.9 | | | 3.2 | | | 2.2 | | | 0.4 | | | 1.2 | |
| | | | | | | | | | | | | | |
| Benefit Payments | | (137.8) | | | (10.7) | | | (21.6) | | | (18.3) | | | (15.0) | | | (7.6) | | | (8.8) | |
| Participant Contributions | | 43.6 | | | 3.4 | | | 6.6 | | | 6.0 | | | 4.7 | | | 2.5 | | | 2.9 | |
| Medicare Subsidy | | 0.5 | | | — | | | 0.1 | | | — | | | — | | | — | | | — | |
| Benefit Obligation as of December 31, | | $ | 849.5 | | | $ | 66.4 | | | $ | 134.6 | | | $ | 98.8 | | | $ | 85.9 | | | $ | 43.7 | | | $ | 53.7 | |
| | | | | | | | | | | | | | |
| Change in Fair Value of Plan Assets | | | | | | | | | | | | | | |
| Fair Value of Plan Assets as of January 1, | | $ | 1,549.3 | | | $ | 128.3 | | | $ | 228.6 | | | $ | 190.5 | | | $ | 166.2 | | | $ | 85.4 | | | $ | 103.0 | |
| Actual Gain on Plan Assets | | 213.2 | | | 16.5 | | | 28.1 | | | 26.4 | | | 21.9 | | | 9.9 | | | 14.0 | |
| Company Contributions | | 5.0 | | | — | | | 1.3 | | | — | | | — | | | — | | | — | |
| Participant Contributions | | 43.6 | | | 3.4 | | | 6.6 | | | 6.0 | | | 4.7 | | | 2.5 | | | 2.9 | |
| Benefit Payments | | (137.8) | | | (10.7) | | | (21.6) | | | (18.3) | | | (15.0) | | | (7.6) | | | (8.8) | |
| Fair Value of Plan Assets as of December 31, | | $ | 1,673.3 | | | $ | 137.5 | | | $ | 243.0 | | | $ | 204.6 | | | $ | 177.8 | | | $ | 90.2 | | | $ | 111.1 | |
| | | | | | | | | | | | | | |
| Funded Status as of December 31, | | $ | 823.8 | | | $ | 71.1 | | | $ | 108.4 | | | $ | 105.8 | | | $ | 91.9 | | | $ | 46.5 | | | $ | 57.4 | |
Amounts Included on the Balance Sheets Related to Funded Status
Pension Plans
| | | | | | | | | | | | | | | | | | | | | | | | | | | | | | | | | | | | | | | | | | | | |
| December 31, 2024 | | AEP | | AEP Texas | | APCo | | I&M | | OPCo | | PSO | | SWEPCo |
| | (in millions) |
| Other Noncurrent Assets - Employee Benefits and Pension Assets | | $ | — | | | $ | — | | | $ | 35.2 | | | $ | 58.2 | | | $ | 30.3 | | | $ | 10.9 | | | $ | — | |
| Other Current Liabilities – Accrued Short-term Benefit Liability | | (5.2) | | | (0.3) | | | — | | | — | | | — | | | (0.1) | | | (0.1) | |
| Other Noncurrent Liabilities – Accrued Long-term Benefit Liability | | (200.4) | | | (34.3) | | | (0.4) | | | (1.5) | | | (0.3) | | | (1.3) | | | (38.9) | |
| Funded (Underfunded) Status | | $ | (205.6) | | | $ | (34.6) | | | $ | 34.8 | | | $ | 56.7 | | | $ | 30.0 | | | $ | 9.5 | | | $ | (39.0) | |
| | | | | | | | | | | | | | | | | | | | | | | | | | | | | | | | | | | | | | | | | | | | |
| December 31, 2023 | | AEP | | AEP Texas | | APCo | | I&M | | OPCo | | PSO | | SWEPCo |
| | (in millions) |
| Other Noncurrent Assets - Employee Benefits and Pension Assets | | $ | 17.3 | | | $ | 0.1 | | | $ | 46.0 | | | $ | 74.8 | | | $ | 41.4 | | | $ | 21.8 | | | $ | — | |
| Other Current Liabilities – Accrued Short-term Benefit Liability | | (6.7) | | | (0.3) | | | — | | | — | | | — | | | (0.1) | | | (0.1) | |
| Other Noncurrent Liabilities – Accrued Long-term Benefit Liability | | (54.0) | | | (10.2) | | | (0.3) | | | (1.2) | | | (0.3) | | | (1.2) | | | (33.6) | |
| Funded (Underfunded) Status | | $ | (43.4) | | | $ | (10.4) | | | $ | 45.7 | | | $ | 73.6 | | | $ | 41.1 | | | $ | 20.5 | | | $ | (33.7) | |
OPEB
| | | | | | | | | | | | | | | | | | | | | | | | | | | | | | | | | | | | | | | | | | | | |
| December 31, 2024 | | AEP | | AEP Texas | | APCo | | I&M | | OPCo | | PSO | | SWEPCo |
| | (in millions) |
| Other Noncurrent Assets - Employee Benefits and Pension Assets | | $ | 1,130.8 | | | $ | 96.5 | | | $ | 168.7 | | | $ | 139.4 | | | $ | 121.8 | | | $ | 62.7 | | | $ | 79.7 | |
| Other Current Liabilities – Accrued Short-term Benefit Liability | | (2.2) | | | — | | | (1.4) | | | — | | | — | | | — | | | — | |
| Other Noncurrent Liabilities – Accrued Long-term Benefit Liability | | 0.7 | | | — | | | (13.0) | | | — | | | — | | | — | | | — | |
| Funded Status | | $ | 1,129.3 | | | $ | 96.5 | | | $ | 154.3 | | | $ | 139.4 | | | $ | 121.8 | | | $ | 62.7 | | | $ | 79.7 | |
| | | | | | | | | | | | | | | | | | | | | | | | | | | | | | | | | | | | | | | | | | | | |
| December 31, 2023 | | AEP | | AEP Texas | | APCo | | I&M | | OPCo | | PSO | | SWEPCo |
| | (in millions) |
| Other Noncurrent Assets - Employee Benefits and Pension Assets | | $ | 838.0 | | | $ | 71.1 | | | $ | 125.6 | | | $ | 105.8 | | | $ | 91.9 | | | $ | 46.5 | | | $ | 57.4 | |
| Other Current Liabilities – Accrued Short-term Benefit Liability | | (2.4) | | | — | | | (1.6) | | | — | | | — | | | — | | | — | |
| Other Noncurrent Liabilities – Accrued Long-term Benefit Liability | | (11.8) | | | — | | | (15.6) | | | — | | | — | | | — | | | — | |
| Funded Status | | $ | 823.8 | | | $ | 71.1 | | | $ | 108.4 | | | $ | 105.8 | | | $ | 91.9 | | | $ | 46.5 | | | $ | 57.4 | |
Amounts Included in Regulatory Assets, Deferred Income Taxes and AOCI
The following tables show the components of the plans included in Regulatory Assets, Deferred Income Taxes and AOCI and the items attributable to the change in these components:
Pension Plans
| | | | | | | | | | | | | | | | | | | | | | | | | | | | | | | | | | | | | | | | | | | | |
| December 31, 2024 | | AEP | | AEP Texas | | APCo | | I&M | | OPCo | | PSO | | SWEPCo |
| Components | | (in millions) |
| Net Actuarial Loss | | $ | 1,153.5 | | | $ | 189.3 | | | $ | 112.1 | | | $ | 7.5 | | | $ | 140.9 | | | $ | 53.8 | | | $ | 82.9 | |
| Prior Service Cost | | 0.2 | | | — | | | — | | | — | | | — | | | — | | | — | |
| | | | | | | | | | | | | | |
| Recorded as | | | | | | | | | | | | | | |
| Regulatory Assets | | $ | 1,019.8 | | | $ | 176.7 | | | $ | 109.9 | | | $ | 17.5 | | | $ | 140.9 | | | $ | 53.8 | | | $ | 83.0 | |
| Deferred Income Taxes | | 28.2 | | | 2.8 | | | 0.4 | | | (2.2) | | | — | | | — | | | — | |
| Net of Tax AOCI | | 105.7 | | | 9.8 | | | 1.8 | | | (7.8) | | | — | | | — | | | (0.1) | |
| | | | | | | | | | | | | | | | | | | | | | | | | | | | | | | | | | | | | | | | | | | | |
| December 31, 2024 | | AEP | | AEP Texas | | APCo | | I&M | | OPCo | | PSO | | SWEPCo |
| Components | | (in millions) |
| Actuarial Loss During the Year | | $ | 188.0 | | | $ | 24.2 | | | $ | 19.4 | | | $ | 23.0 | | | $ | 15.8 | | | $ | 12.5 | | | $ | 2.7 | |
| Amortization of Actuarial Loss | | (4.5) | | | (0.3) | | | (0.4) | | | (0.4) | | | (0.3) | | | (0.2) | | | (0.1) | |
| Amounts Recognized Due to Settlement | | (93.4) | | | (9.8) | | | (11.8) | | | (9.3) | | | (6.5) | | | (5.2) | | | (9.3) | |
| | | | | | | | | | | | | | |
| | | | | | | | | | | | | | |
| Change for the Year Ended December 31, | | $ | 90.1 | | | $ | 14.1 | | | $ | 7.2 | | | $ | 13.3 | | | $ | 9.0 | | | $ | 7.1 | | | $ | (6.7) | |
| | | | | | | | | | | | | | | | | | | | | | | | | | | | | | | | | | | | | | | | | | | | |
| December 31, 2023 | | AEP | | AEP Texas | | APCo | | I&M | | OPCo | | PSO | | SWEPCo |
| Components | | (in millions) |
| Net Actuarial (Gain) Loss | | $ | 1,063.4 | | | $ | 175.2 | | | $ | 104.9 | | | $ | (5.8) | | | $ | 131.9 | | | $ | 46.7 | | | $ | 89.6 | |
| Prior Service Cost | | 0.2 | | | — | | | — | | | — | | | — | | | — | | | — | |
| | | | | | | | | | | | | | |
| Recorded as | | | | | | | | | | | | | | |
| Regulatory Assets | | $ | 938.6 | | | $ | 163.4 | | | $ | 102.6 | | | $ | 6.4 | | | $ | 131.9 | | | $ | 46.7 | | | $ | 89.7 | |
| Deferred Income Taxes | | 26.4 | | | 2.7 | | | 0.4 | | | (2.6) | | | — | | | — | | | — | |
| Net of Tax AOCI | | 98.6 | | | 9.1 | | | 1.9 | | | (9.6) | | | — | | | — | | | (0.1) | |
| | | | | | | | | | | | | | | | | | | | | | | | | | | | | | | | | | | | | | | | | | | | |
| December 31, 2023 | | AEP | | AEP Texas | | APCo | | I&M | | OPCo | | PSO | | SWEPCo |
| Components | | (in millions) |
| Actuarial Loss During the Year | | $ | 129.2 | | | $ | 13.4 | | | $ | 9.3 | | | $ | 1.2 | | | $ | 7.6 | | | $ | 7.9 | | | $ | 12.1 | |
| Amortization of Actuarial Loss | | (1.4) | | | (0.1) | | | — | | | (0.1) | | | — | | | — | | | (0.1) | |
| | | | | | | | | | | | | | |
| | | | | | | | | | | | | | |
| Change for the Year Ended December 31, | | $ | 127.8 | | | $ | 13.3 | | | $ | 9.3 | | | $ | 1.1 | | | $ | 7.6 | | | $ | 7.9 | | | $ | 12.0 | |
OPEB
| | | | | | | | | | | | | | | | | | | | | | | | | | | | | | | | | | | | | | | | | | | | |
| December 31, 2024 | | AEP | | AEP Texas | | APCo | | I&M | | OPCo | | PSO | | SWEPCo |
| Components | | (in millions) |
| Net Actuarial (Gain) Loss | | $ | (41.6) | | | $ | 1.6 | | | $ | (9.9) | | | $ | 2.3 | | | $ | (5.3) | | | $ | 4.7 | | | $ | — | |
| Prior Service Credit | | (14.7) | | | (1.3) | | | (2.3) | | | (2.0) | | | (1.6) | | | (0.9) | | | (1.0) | |
| | | | | | | | | | | | | | |
| Recorded as | | | | | | | | | | | | | | |
| Regulatory Assets | | $ | (55.4) | | | $ | 0.8 | | | $ | (2.0) | | | $ | (2.9) | | | $ | (6.9) | | | $ | 3.8 | | | $ | 0.5 | |
| Deferred Income Taxes | | (0.1) | | | — | | | (2.2) | | | 0.7 | | | — | | | — | | | (0.3) | |
| Net of Tax AOCI | | (0.8) | | | (0.5) | | | (8.0) | | | 2.5 | | | — | | | — | | | (1.2) | |
| | | | | | | | | | | | | | | | | | | | | | | | | | | | | | | | | | | | | | | | | | | | |
| December 31, 2024 | | AEP | | AEP Texas | | APCo | | I&M | | OPCo | | PSO | | SWEPCo |
| Components | | (in millions) |
| Actuarial Gain During the Year | | $ | (240.1) | | | $ | (20.3) | | | $ | (36.6) | | | $ | (25.9) | | | $ | (23.0) | | | $ | (12.6) | | | $ | (18.1) | |
| Amortization of Actuarial Loss | | (3.0) | | | (0.2) | | | (0.4) | | | (0.5) | | | (0.4) | | | (0.2) | | | (0.3) | |
| | | | | | | | | | | | | | |
| Amortization of Prior Service Credit | | 12.7 | | | 1.0 | | | 1.9 | | | 1.7 | | | 1.3 | | | 0.7 | | | 1.1 | |
| Change for the Year Ended December 31, | | $ | (230.4) | | | $ | (19.5) | | | $ | (35.1) | | | $ | (24.7) | | | $ | (22.1) | | | $ | (12.1) | | | $ | (17.3) | |
| | | | | | | | | | | | | | | | | | | | | | | | | | | | | | | | | | | | | | | | | | | | |
| December 31, 2023 | | AEP | | AEP Texas | | APCo | | I&M | | OPCo | | PSO | | SWEPCo |
| Components | | (in millions) |
| Net Actuarial Loss | | $ | 201.5 | | | $ | 22.1 | | | $ | 27.1 | | | $ | 28.7 | | | $ | 18.1 | | | $ | 17.5 | | | $ | 18.4 | |
| Prior Service Credit | | (27.4) | | | (2.3) | | | (4.2) | | | (3.7) | | | (2.9) | | | (1.6) | | | (2.1) | |
| | | | | | | | | | | | | | |
| Recorded as | | | | | | | | | | | | | | |
| Regulatory Assets | | $ | 106.1 | | | $ | 19.8 | | | $ | 13.2 | | | $ | 19.0 | | | $ | 15.2 | | | $ | 15.9 | | | $ | 10.2 | |
| Deferred Income Taxes | | 14.3 | | | — | | | 2.0 | | | 1.3 | | | — | | | — | | | 1.3 | |
| Net of Tax AOCI | | 53.7 | | | — | | | 7.7 | | | 4.7 | | | — | | | — | | | 4.8 | |
| | | | | | | | | | | | | | | | | | | | | | | | | | | | | | | | | | | | | | | | | | | | |
| December 31, 2023 | | AEP | | AEP Texas | | APCo | | I&M | | OPCo | | PSO | | SWEPCo |
| Components | | (in millions) |
| Actuarial Gain During the Year | | $ | (83.7) | | | $ | (6.4) | | | $ | (11.1) | | | $ | (9.6) | | | $ | (7.9) | | | $ | (3.7) | | | $ | (5.6) | |
| Amortization of Actuarial Loss | | (14.8) | | | (1.2) | | | (2.3) | | | (1.9) | | | (1.6) | | | (0.8) | | | (1.0) | |
| | | | | | | | | | | | | | |
| Amortization of Prior Service Credit | | 63.1 | | | 5.3 | | | 9.2 | | | 8.7 | | | 6.3 | | | 4.0 | | | 4.9 | |
| Change for the Year Ended December 31, | | $ | (35.4) | | | $ | (2.3) | | | $ | (4.2) | | | $ | (2.8) | | | $ | (3.2) | | | $ | (0.5) | | | $ | (1.7) | |
Determination of Pension Expense
The determination of pension expense or income is based on a market-related valuation of assets which reduces year-to-year volatility. This market-related valuation recognizes investment gains or losses over a five-year period from the year in which they occur. Investment gains or losses for this purpose are the difference between the expected return calculated using the market-related value of assets and the actual return.
Pension and OPEB Assets
The fair value tables within Pension and OPEB Assets present the classification of assets for AEP within the fair value hierarchy. All Level 1, 2, 3 and Other amounts can be allocated to the Registrant Subsidiaries using the percentages in the table below:
| | | | | | | | | | | | | | | | | | | | | | | | | | |
| | Pension Plan | | OPEB |
| | December 31, |
| Company | | 2024 | | 2023 | | 2024 | | 2023 |
| AEP Texas | | 7.9 | % | | 8.1 | % | | 8.3 | % | | 8.2 | % |
| APCo | | 13.3 | % | | 13.4 | % | | 14.4 | % | | 14.5 | % |
| I&M | | 13.8 | % | | 13.4 | % | | 11.9 | % | | 12.2 | % |
| OPCo | | 10.4 | % | | 10.2 | % | | 10.4 | % | | 10.6 | % |
| PSO | | 5.5 | % | | 5.4 | % | | 5.4 | % | | 5.4 | % |
| SWEPCo | | 5.2 | % | | 5.5 | % | | 6.8 | % | | 6.6 | % |
The following table presents the classification of pension plan assets for AEP within the fair value hierarchy as of December 31, 2024:
| | | | | | | | | | | | | | | | | | | | | | | | | | | | | | | | | | | | | | |
| Asset Class | | Level 1 | | Level 2 | | Level 3 | | Other | | Total | | Year End
Allocation |
| | (in millions) | | |
| Equities (a): | | | | | | | | | | | | |
| Domestic | | $ | 327.0 | | | $ | — | | | $ | — | | | $ | — | | | $ | 327.0 | | | 8.9 | % |
| International | | 290.2 | | | — | | | — | | | — | | | 290.2 | | | 7.9 | % |
| | | | | | | | | | | | |
| | | | | | | | | | | | |
| Common Collective Trusts (b) | | 176.1 | | | — | | | — | | | 472.6 | | | 648.7 | | | 17.7 | % |
| Subtotal – Equities | | 793.3 | | | — | | | — | | | 472.6 | | | 1,265.9 | | | 34.5 | % |
| | | | | | | | | | | | |
| Fixed Income (a): | | | | | | | | | | | | |
| United States Government and Agency Securities | | (2.3) | | | 865.6 | | | — | | | — | | | 863.3 | | | 23.6 | % |
| Corporate Debt | | — | | | 719.2 | | | — | | | — | | | 719.2 | | | 19.6 | % |
| Foreign Debt | | — | | | 136.1 | | | — | | | — | | | 136.1 | | | 3.7 | % |
| State and Local Government | | — | | | 25.8 | | | — | | | — | | | 25.8 | | | 0.7 | % |
| Other – Asset Backed | | — | | | 0.9 | | | — | | | — | | | 0.9 | | | — | % |
| Subtotal – Fixed Income | | (2.3) | | | 1,747.6 | | | — | | | — | | | 1,745.3 | | | 47.6 | % |
| | | | | | | | | | | | |
| Infrastructure (b) | | — | | | — | | | — | | | 112.9 | | | 112.9 | | | 3.1 | % |
| Real Estate (b) | | — | | | — | | | — | | | 227.9 | | | 227.9 | | | 6.2 | % |
| Alternative Investments (b) | | — | | | — | | | — | | | 223.8 | | | 223.8 | | | 6.1 | % |
| | | | | | | | | | | | |
| | | | | | | | | | | | |
| Cash and Cash Equivalents (b) | | — | | | 41.3 | | | — | | | 27.2 | | | 68.5 | | | 1.9 | % |
| Other – Pending Transactions and Accrued Income (c) | | — | | | — | | | — | | | 21.9 | | | 21.9 | | | 0.6 | % |
| | | | | | | | | | | | |
| Total | | $ | 791.0 | | | $ | 1,788.9 | | | $ | — | | | $ | 1,086.3 | | | $ | 3,666.2 | | | 100.0 | % |
(a)Includes investment securities loaned to borrowers under the securities lending program. See the “Investments Held in Trust for Future Liabilities” section of Note 1 for additional information.
(b)Amounts in “Other” column represent investments for which fair value is measured using net asset value per-share.
(c)Amounts in “Other” column primarily represent accrued interest, dividend receivables and transactions pending settlement.
The following table presents the classification of OPEB plan assets for AEP within the fair value hierarchy as of December 31, 2024:
| | | | | | | | | | | | | | | | | | | | | | | | | | | | | | | | | | | | | | |
| Asset Class | | Level 1 | | Level 2 | | Level 3 | | Other | | Total | | Year End
Allocation |
| | (in millions) | | |
| Equities: | | | | | | | | | | | | |
| Domestic | | $ | 616.8 | | | $ | — | | | $ | — | | | $ | — | | | $ | 616.8 | | | 34.7 | % |
| International | | 267.2 | | | — | | | — | | | — | | | 267.2 | | | 15.0 | % |
| | | | | | | | | | | | |
| Common Collective Trusts (a) | | 64.2 | | | — | | | — | | | 129.4 | | | 193.6 | | | 10.9 | % |
| Subtotal – Equities | | 948.2 | | | — | | | — | | | 129.4 | | | 1,077.6 | | | 60.6 | % |
| | | | | | | | | | | | |
| Fixed Income: | | | | | | | | | | | | |
| Common Collective Trust – Debt (a) | | — | | | — | | | — | | | 132.9 | | | 132.9 | | | 7.5 | % |
| United States Government and Agency Securities | | (0.5) | | | 157.6 | | | — | | | — | | | 157.1 | | | 8.9 | % |
| Corporate Debt | | — | | | 132.3 | | | — | | | — | | | 132.3 | | | 7.5 | % |
| Foreign Debt | | — | | | 27.1 | | | — | | | — | | | 27.1 | | | 1.5 | % |
| State and Local Government | | 57.8 | | | 5.0 | | | — | | | — | | | 62.8 | | | 3.5 | % |
| Other – Asset Backed | | — | | | 0.2 | | | — | | | — | | | 0.2 | | | — | % |
| Subtotal – Fixed Income | | 57.3 | | | 322.2 | | | — | | | 132.9 | | | 512.4 | | | 28.9 | % |
| | | | | | | | | | | | |
| Trust Owned Life Insurance: | | | | | | | | | | | | |
| International Equities | | — | | | 23.1 | | | — | | | — | | | 23.1 | | | 1.3 | % |
| United States Bonds | | — | | | 118.2 | | | — | | | — | | | 118.2 | | | 6.7 | % |
| Subtotal – Trust Owned Life Insurance | | — | | | 141.3 | | | — | | | — | | | 141.3 | | | 8.0 | % |
| | | | | | | | | | | | |
| Cash and Cash Equivalents (a) | | 27.6 | | | — | | | — | | | 3.1 | | | 30.7 | | | 1.7 | % |
| Other – Pending Transactions and Accrued Income (b) | | — | | | — | | | — | | | 13.9 | | | 13.9 | | | 0.8 | % |
| | | | | | | | | | | | |
| Total | | $ | 1,033.1 | | | $ | 463.5 | | | $ | — | | | $ | 279.3 | | | $ | 1,775.9 | | | 100.0 | % |
(a)Amounts in “Other” column represent investments for which fair value is measured using net asset value per-share.
(b)Amounts in “Other” column primarily represent accrued interest, dividend receivables and transactions pending settlement.
The following table presents the classification of pension plan assets for AEP within the fair value hierarchy as of December 31, 2023:
| | | | | | | | | | | | | | | | | | | | | | | | | | | | | | | | | | | | | | |
| Asset Class | | Level 1 | | Level 2 | | Level 3 | | Other | | Total | | Year End
Allocation |
| | (in millions) | | |
| Equities (a): | | | | | | | | | | | | |
| Domestic | | $ | 411.3 | | | $ | — | | | $ | — | | | $ | — | | | $ | 411.3 | | | 10.0 | % |
| International | | 389.8 | | | — | | | — | | | — | | | 389.8 | | | 9.5 | % |
| | | | | | | | | | | | |
| | | | | | | | | | | | |
| Common Collective Trusts (b) | | — | | | — | | | — | | | 420.9 | | | 420.9 | | | 10.2 | % |
| Subtotal – Equities | | 801.1 | | | — | | | — | | | 420.9 | | | 1,222.0 | | | 29.7 | % |
| | | | | | | | | | | | |
| Fixed Income (a): | | | | | | | | | | | | |
| | | | | | | | | | | | |
| United States Government and Agency Securities | | 8.3 | | | 1,099.2 | | | — | | | — | | | 1,107.5 | | | 26.9 | % |
| Corporate Debt | | — | | | 894.8 | | | — | | | — | | | 894.8 | | | 21.7 | % |
| Foreign Debt | | — | | | 167.1 | | | — | | | — | | | 167.1 | | | 4.1 | % |
| State and Local Government | | — | | | 38.7 | | | — | | | — | | | 38.7 | | | 0.9 | % |
| Other – Asset Backed | | — | | | 1.3 | | | — | | | — | | | 1.3 | | | — | % |
| Subtotal – Fixed Income | | 8.3 | | | 2,201.1 | | | — | | | — | | | 2,209.4 | | | 53.6 | % |
| | | | | | | | | | | | |
| Infrastructure (b) | | — | | | — | | | — | | | 101.4 | | | 101.4 | | | 2.5 | % |
| Real Estate (b) | | — | | | — | | | — | | | 239.3 | | | 239.3 | | | 5.8 | % |
| Alternative Investments (b) | | — | | | — | | | — | | | 241.8 | | | 241.8 | | | 5.8 | % |
| | | | | | | | | | | | |
| | | | | | | | | | | | |
| Cash and Cash Equivalents (b) | | — | | | 51.0 | | | — | | | 33.8 | | | 84.8 | | | 2.1 | % |
| Other – Pending Transactions and Accrued Income (c) | | — | | | — | | | 0.1 | | | 19.4 | | | 19.5 | | | 0.5 | % |
| | | | | | | | | | | | |
| Total | | $ | 809.4 | | | $ | 2,252.1 | | | $ | 0.1 | | | $ | 1,056.6 | | | $ | 4,118.2 | | | 100.0 | % |
(a)Includes investment securities loaned to borrowers under the securities lending program. See the “Investments Held in Trust for Future Liabilities” section of Note 1 for additional information.
(b)Amounts in “Other” column represent investments for which fair value is measured using net asset value per-share.
(c)Amounts in “Other” column primarily represent accrued interest, dividend receivables and transactions pending settlement.
The following table presents the classification of OPEB plan assets for AEP within the fair value hierarchy as of December 31, 2023:
| | | | | | | | | | | | | | | | | | | | | | | | | | | | | | | | | | | | | | |
| Asset Class | | Level 1 | | Level 2 | | Level 3 | | Other | | Total | | Year End
Allocation |
| | (in millions) | | |
| Equities: | | | | | | | | | | | | |
| Domestic | | $ | 540.6 | | | $ | — | | | $ | — | | | $ | — | | | $ | 540.6 | | | 32.3 | % |
| International | | 288.4 | | | — | | | — | | | — | | | 288.4 | | | 17.2 | % |
| | | | | | | | | | | | |
| Common Collective Trusts (a) | | — | | | — | | | — | | | 131.6 | | | 131.6 | | | 7.9 | % |
| Subtotal – Equities | | 829.0 | | | — | | | — | | | 131.6 | | | 960.6 | | | 57.4 | % |
| | | | | | | | | | | | |
| Fixed Income: | | | | | | | | | | | | |
| Common Collective Trust – Debt (a) | | — | | | — | | | — | | | 146.7 | | | 146.7 | | | 8.8 | % |
| United States Government and Agency Securities | | 1.4 | | | 163.3 | | | — | | | — | | | 164.7 | | | 9.8 | % |
| Corporate Debt | | — | | | 149.0 | | | — | | | — | | | 149.0 | | | 8.9 | % |
| Foreign Debt | | — | | | 28.6 | | | — | | | — | | | 28.6 | | | 1.7 | % |
| State and Local Government | | 41.5 | | | 7.8 | | | — | | | — | | | 49.3 | | | 3.0 | % |
| Other – Asset Backed | | — | | | 0.2 | | | — | | | — | | | 0.2 | | | — | % |
| Subtotal – Fixed Income | | 42.9 | | | 348.9 | | | — | | | 146.7 | | | 538.5 | | | 32.2 | % |
| | | | | | | | | | | | |
| Trust Owned Life Insurance: | | | | | | | | | | | | |
| International Equities | | — | | | 22.3 | | | — | | | — | | | 22.3 | | | 1.3 | % |
| United States Bonds | | — | | | 130.0 | | | — | | | — | | | 130.0 | | | 7.8 | % |
| Subtotal – Trust Owned Life Insurance | | — | | | 152.3 | | | — | | | — | | | 152.3 | | | 9.1 | % |
| | | | | | | | | | | | |
| Cash and Cash Equivalents (a) | | 25.9 | | | — | | | — | | | 2.9 | | | 28.8 | | | 1.7 | % |
| Other – Pending Transactions and Accrued Income (b) | | — | | | — | | | — | | | (6.9) | | | (6.9) | | | (0.4) | % |
| | | | | | | | | | | | |
| Total | | $ | 897.8 | | | $ | 501.2 | | | $ | — | | | $ | 274.3 | | | $ | 1,673.3 | | | 100.0 | % |
(a)Amounts in “Other” column represent investments for which fair value is measured using net asset value per-share.
(b)Amounts in “Other” column primarily represent accrued interest, dividend receivables and transactions pending settlement.
Accumulated Benefit Obligation
The accumulated benefit obligation for the pension plans is as follows:
| | | | | | | | | | | | | | | | | | | | | | | | | | | | | | | | | | | | | | | | | | | | |
| Accumulated Benefit Obligation | | AEP | | AEP Texas | | APCo | | I&M | | OPCo | | PSO | | SWEPCo |
| | (in millions) |
| Qualified Pension Plan | | $ | 3,602.4 | | | $ | 300.6 | | | $ | 434.3 | | | $ | 422.3 | | | $ | 326.4 | | | $ | 174.6 | | | $ | 209.5 | |
| Nonqualified Pension Plans | | 46.9 | | | 2.1 | | | 0.2 | | | 0.9 | | | 0.1 | | | 1.1 | | | 1.0 | |
| Total as of December 31, 2024 | | $ | 3,649.3 | | | $ | 302.7 | | | $ | 434.5 | | | $ | 423.2 | | | $ | 326.5 | | | $ | 175.7 | | | $ | 210.5 | |
| | | | | | | | | | | | | | | | | | | | | | | | | | | | | | | | | | | | | | | | | | | | |
| Accumulated Benefit Obligation | | AEP | | AEP Texas | | APCo | | I&M | | OPCo | | PSO | | SWEPCo |
| | (in millions) |
| Qualified Pension Plan | | $ | 3,878.7 | | | $ | 321.1 | | | $ | 485.6 | | | $ | 450.3 | | | $ | 354.0 | | | $ | 186.6 | | | $ | 241.9 | |
| Nonqualified Pension Plans | | 54.8 | | | 2.1 | | | 0.1 | | | 0.7 | | | 0.1 | | | 1.2 | | | 1.0 | |
| Total as of December 31, 2023 | | $ | 3,933.5 | | | $ | 323.2 | | | $ | 485.7 | | | $ | 451.0 | | | $ | 354.1 | | | $ | 187.8 | | | $ | 242.9 | |
Obligations in Excess of Fair Values
The tables below show the underfunded pension plans that had obligations in excess of plan assets.
Projected Benefit Obligation
| | | | | | | | | | | | | | | | | | | | | | | | | | | | | | | | | | | | | | | | | |
| AEP | | AEP Texas | | APCo | | I&M | | OPCo | | PSO | | SWEPCo |
| (in millions) |
| Projected Benefit Obligation | $ | 3,871.8 | | | $ | 322.7 | | | $ | 0.5 | | | $ | 1.5 | | | $ | 0.4 | | | $ | 1.4 | | | $ | 227.8 | |
| Fair Value of Plan Assets | 3,666.2 | | | 288.1 | | | — | | | — | | | — | | | — | | | 188.8 | |
| Underfunded Projected Benefit Obligation as of December 31, 2024 | $ | (205.6) | | | $ | (34.6) | | | $ | (0.5) | | | $ | (1.5) | | | $ | (0.4) | | | $ | (1.4) | | | $ | (39.0) | |
| | | | | | | | | | | | | | | | | | | | | | | | | | | | | | | | | | | | | | | | | |
| AEP | | AEP Texas | | APCo | | I&M | | OPCo | | PSO | | SWEPCo |
| (in millions) |
| Projected Benefit Obligation | $ | 60.7 | | | $ | 343.1 | | | $ | 0.4 | | | $ | 1.2 | | | $ | 0.3 | | | $ | 1.4 | | | $ | 261.2 | |
| Fair Value of Plan Assets | — | | | 332.7 | | | — | | | — | | | — | | | — | | | 227.5 | |
| Underfunded Projected Benefit Obligation as of December 31, 2023 | $ | (60.7) | | | $ | (10.4) | | | $ | (0.4) | | | $ | (1.2) | | | $ | (0.3) | | | $ | (1.4) | | | $ | (33.7) | |
Accumulated Benefit Obligation
| | | | | | | | | | | | | | | | | | | | | | | | | | | | | | | | | | | | | | | | | |
| AEP | | AEP Texas | | APCo | | I&M | | OPCo | | PSO | | SWEPCo |
| (in millions) |
| Accumulated Benefit Obligation | $ | 46.9 | | | $ | 302.7 | | | $ | 0.2 | | | $ | 0.9 | | | $ | 0.1 | | | $ | 1.1 | | | $ | 210.5 | |
| Fair Value of Plan Assets | — | | | 288.0 | | | — | | | — | | | — | | | — | | | 188.9 | |
| Underfunded Accumulated Benefit Obligation as of December 31, 2024 | $ | (46.9) | | | $ | (14.7) | | | $ | (0.2) | | | $ | (0.9) | | | $ | (0.1) | | | $ | (1.1) | | | $ | (21.6) | |
| | | | | | | | | | | | | | | | | | | | | | | | | | | | | | | | | | | | | | | | | |
| AEP | | AEP Texas | | APCo | | I&M | | OPCo | | PSO | | SWEPCo |
| (in millions) |
| Accumulated Benefit Obligation | $ | 54.8 | | | $ | 2.1 | | | $ | 0.1 | | | $ | 0.7 | | | $ | 0.1 | | | $ | 1.2 | | | $ | 242.9 | |
| Fair Value of Plan Assets | — | | | — | | | — | | | — | | | — | | | — | | | 227.5 | |
| Underfunded Accumulated Benefit Obligation as of December 31, 2023 | $ | (54.8) | | | $ | (2.1) | | | $ | (0.1) | | | $ | (0.7) | | | $ | (0.1) | | | $ | (1.2) | | | $ | (15.4) | |
Estimated Future Benefit Payments and Contributions
The estimated pension benefit payments and contributions to the trust are at least the minimum amount required by the Employee Retirement Income Security Act plus payment of unfunded non-qualified benefits. For the qualified pension plan, additional discretionary contributions may also be made to maintain the funded status of the plan. For OPEB plans, expected payments include the payment of unfunded benefits. The following table provides the estimated contributions and payments by Registrant for 2025:
| | | | | | | | | | | | | | | | | | | | | | | | | | | | | | | | | | | | | | | | | | | | |
| | AEP | | AEP Texas | | APCo | | I&M | | OPCo | | PSO | | SWEPCo |
| | (in millions) |
| Pension Plans | | $ | 101.2 | | | $ | 11.8 | | | $ | 0.5 | | | $ | 2.6 | | | $ | — | | | $ | 2.0 | | | $ | 8.8 | |
| OPEB | | 2.7 | | | — | | | 1.4 | | | — | | | — | | | — | | | — | |
The tables below reflect the total benefits expected to be paid from the plan or from the Registrants’ assets. The payments include the participants’ contributions to the plan for their share of the cost. Future benefit payments are dependent on the number of employees retiring, whether the retiring employees elect to receive pension benefits as annuities or as lump sum distributions, future integration of the benefit plans with changes to Medicare and other legislation, future levels of interest rates and variances in actuarial results. The estimated payments for the pension benefits and OPEB are as follows:
| | | | | | | | | | | | | | | | | | | | | | | | | | | | | | | | | | | | | | | | | | | | |
| Pension Plans | | AEP | | AEP Texas | | APCo | | I&M | | OPCo | | PSO | | SWEPCo |
| | (in millions) |
| 2025 | | $ | 341.5 | | | $ | 32.2 | | | $ | 42.3 | | | $ | 40.1 | | | $ | 31.6 | | | $ | 17.3 | | | $ | 20.7 | |
| 2026 | | 340.4 | | | 31.0 | | | 42.1 | | | 40.1 | | | 31.0 | | | 17.1 | | | 19.2 | |
| 2027 | | 334.8 | | | 28.8 | | | 40.0 | | | 39.0 | | | 30.8 | | | 17.1 | | | 20.4 | |
| 2028 | | 335.7 | | | 29.5 | | | 40.2 | | | 38.8 | | | 30.0 | | | 16.9 | | | 19.4 | |
| 2029 | | 322.7 | | | 27.8 | | | 38.6 | | | 37.1 | | | 29.5 | | | 15.1 | | | 19.0 | |
| Years 2030 to 2034, in Total | | 1,530.3 | | | 120.9 | | | 181.6 | | | 179.0 | | | 137.8 | | | 73.3 | | | 88.4 | |
| | | | | | | | | | | | | | | | | | | | | | | | | | | | | | | | | | | | | | | | | | | | |
| OPEB Benefit Payments | | AEP | | AEP Texas | | APCo | | I&M | | OPCo | | PSO | | SWEPCo |
| | (in millions) |
| 2025 | | $ | 117.6 | | | $ | 9.5 | | | $ | 18.8 | | | $ | 14.5 | | | $ | 12.0 | | | $ | 6.6 | | | $ | 8.6 | |
| 2026 | | 116.4 | | | 9.7 | | | 18.4 | | | 14.5 | | | 11.7 | | | 6.6 | | | 8.3 | |
| 2027 | | 114.6 | | | 9.7 | | | 18.1 | | | 14.2 | | | 11.5 | | | 6.3 | | | 8.0 | |
| 2028 | | 112.4 | | | 9.3 | | | 17.9 | | | 13.9 | | | 11.4 | | | 6.0 | | | 8.0 | |
| 2029 | | 109.7 | | | 8.9 | | | 17.4 | | | 13.6 | | | 11.0 | | | 5.9 | | | 7.8 | |
| Years 2030 to 2034, in Total | | 504.7 | | | 39.7 | | | 78.1 | | | 61.0 | | | 50.6 | | | 27.2 | | | 35.7 | |
| | | | | | | | | | | | | | | | | | | | | | | | | | | | | | | | | | | | | | | | | | | | |
OPEB Medicare
Subsidy Receipts | | AEP | | AEP Texas | | APCo | | I&M | | OPCo | | PSO | | SWEPCo |
| | (in millions) |
| 2025 | | $ | 0.2 | | | $ | — | | | $ | 0.1 | | | $ | — | | | $ | — | | | $ | — | | | $ | — | |
| 2026 | | 0.3 | | | — | | | 0.1 | | | — | | | — | | | — | | | — | |
| 2027 | | 0.3 | | | — | | | 0.1 | | | — | | | — | | | — | | | — | |
| 2028 | | 0.3 | | | — | | | 0.1 | | | — | | | — | | | — | | | — | |
| 2029 | | 0.3 | | | — | | | 0.1 | | | — | | | — | | | — | | | — | |
| Years 2030 to 2034, in Total | | 1.4 | | | — | | | 0.4 | | | — | | | — | | | — | | | — | |
Components of Net Periodic Benefit Cost
The following tables provide the components of net periodic benefit cost (credit) by Registrant for the plans:
Pension Plans
| | | | | | | | | | | | | | | | | | | | | | | | | | | | | | | | | | | | | | | | | | | | |
| 2024 | | AEP | | AEP Texas | | APCo | | I&M | | OPCo | | PSO | | SWEPCo |
| | (in millions) |
| Service Cost | | $ | 100.6 | | | $ | 8.9 | | | $ | 9.5 | | | $ | 13.0 | | | $ | 9.2 | | | $ | 5.9 | | | $ | 7.8 | |
| Interest Cost | | 207.4 | | | 17.3 | | | 24.7 | | | 23.9 | | | 18.8 | | | 10.1 | | | 12.5 | |
| Expected Return on Plan Assets | | (319.8) | | | (25.7) | | | (42.6) | | | (42.9) | | | (32.6) | | | (17.3) | | | (17.4) | |
| | | | | | | | | | | | | | |
| Amortization of Net Actuarial Loss | | 4.5 | | | 0.3 | | | 0.4 | | | 0.4 | | | 0.3 | | | 0.2 | | | 0.1 | |
| Settlements (a) | | 93.4 | | | 9.8 | | | 11.8 | | | 9.3 | | | 6.5 | | | 5.2 | | | 9.3 | |
| Net Periodic Benefit Cost | | 86.1 | | | 10.6 | | | 3.8 | | | 3.7 | | | 2.2 | | | 4.1 | | | 12.3 | |
| Capitalized Portion | | (46.6) | | | (5.3) | | | (4.4) | | | (3.9) | | | (5.5) | | | (2.8) | | | (3.1) | |
| Net Periodic Benefit Cost (Credit) Recognized in Expense | | $ | 39.5 | | | $ | 5.3 | | | $ | (0.6) | | | $ | (0.2) | | | $ | (3.3) | | | $ | 1.3 | | | $ | 9.2 | |
(a)AEP will seek recovery for the portion of pension settlement costs related to regulated operations. These costs were deferred as a regulatory asset for AEP, AEP Texas, APCo and PSO in the fourth quarter of 2024.
| | | | | | | | | | | | | | | | | | | | | | | | | | | | | | | | | | | | | | | | | | | | |
| 2023 | | AEP | | AEP Texas | | APCo | | I&M | | OPCo | | PSO | | SWEPCo |
| | (in millions) |
| Service Cost | | $ | 94.3 | | | $ | 8.2 | | | $ | 9.1 | | | $ | 11.9 | | | $ | 8.4 | | | $ | 5.5 | | | $ | 7.7 | |
| Interest Cost | | 219.2 | | | 18.3 | | | 26.4 | | | 24.9 | | | 19.8 | | | 10.7 | | | 13.9 | |
| Expected Return on Plan Assets | | (339.2) | | | (28.1) | | | (44.6) | | | (44.2) | | | (34.0) | | | (18.3) | | | (19.4) | |
| | | | | | | | | | | | | | |
| Amortization of Net Actuarial Loss | | 1.4 | | | 0.1 | | | — | | | 0.1 | | | — | | | — | | | 0.1 | |
| Net Periodic Benefit Cost (Credit) | | (24.3) | | | (1.5) | | | (9.1) | | | (7.3) | | | (5.8) | | | (2.1) | | | 2.3 | |
| Capitalized Portion | | (43.6) | | | (4.7) | | | (4.2) | | | (3.6) | | | (4.7) | | | (2.5) | | | (3.0) | |
| Net Periodic Benefit Credit Recognized in Expense | | $ | (67.9) | | | $ | (6.2) | | | $ | (13.3) | | | $ | (10.9) | | | $ | (10.5) | | | $ | (4.6) | | | $ | (0.7) | |
| | | | | | | | | | | | | | | | | | | | | | | | | | | | | | | | | | | | | | | | | | | | |
| 2022 | | AEP | | AEP Texas | | APCo | | I&M | | OPCo | | PSO | | SWEPCo |
| | (in millions) |
| Service Cost | | $ | 123.1 | | | $ | 11.1 | | | $ | 11.4 | | | $ | 16.2 | | | $ | 11.2 | | | $ | 7.4 | | | $ | 10.6 | |
| Interest Cost | | 148.2 | | | 12.1 | | | 17.5 | | | 17.0 | | | 13.3 | | | 7.0 | | | 9.1 | |
| Expected Return on Plan Assets | | (253.4) | | | (21.0) | | | (32.3) | | | (32.4) | | | (24.8) | | | (13.4) | | | (14.6) | |
| | | | | | | | | | | | | | |
| Amortization of Net Actuarial Loss | | 63.0 | | | 5.2 | | | 7.4 | | | 7.1 | | | 5.5 | | | 2.9 | | | 3.8 | |
| Net Periodic Benefit Cost | | 80.9 | | | 7.4 | | | 4.0 | | | 7.9 | | | 5.2 | | | 3.9 | | | 8.9 | |
| Capitalized Portion | | (53.8) | | | (6.2) | | | (5.0) | | | (4.6) | | | (6.1) | | | (3.2) | | | (4.0) | |
| Net Periodic Benefit Cost (Credit) Recognized in Expense | | $ | 27.1 | | | $ | 1.2 | | | $ | (1.0) | | | $ | 3.3 | | | $ | (0.9) | | | $ | 0.7 | | | $ | 4.9 | |
OPEB
| | | | | | | | | | | | | | | | | | | | | | | | | | | | | | | | | | | | | | | | | | | | |
| 2024 | | AEP | | AEP Texas | | APCo | | I&M | | OPCo | | PSO | | SWEPCo |
| | (in millions) |
| Service Cost | | $ | 4.5 | | | $ | 0.3 | | | $ | 0.5 | | | $ | 0.6 | | | $ | 0.4 | | | $ | 0.3 | | | $ | 0.4 | |
| Interest Cost | | 42.0 | | | 3.3 | | | 6.6 | | | 4.8 | | | 4.2 | | | 2.1 | | | 2.7 | |
| Expected Return on Plan Assets | | (111.3) | | | (9.1) | | | (16.3) | | | (13.5) | | | (11.8) | | | (6.0) | | | (7.5) | |
| Amortization of Prior Service Credit | | (12.7) | | | (1.0) | | | (1.9) | | | (1.7) | | | (1.3) | | | (0.7) | | | (1.1) | |
| Amortization of Net Actuarial Loss | | 3.0 | | | 0.2 | | | 0.4 | | | 0.5 | | | 0.4 | | | 0.2 | | | 0.3 | |
| Special/Contractual Termination Benefits | | 3.5 | | | 0.3 | | | 0.6 | | | 0.3 | | | 0.2 | | | 0.2 | | | 0.3 | |
| Net Periodic Benefit Credit | | (71.0) | | | (6.0) | | | (10.1) | | | (9.0) | | | (7.9) | | | (3.9) | | | (4.9) | |
| Capitalized Portion | | (2.1) | | | (0.2) | | | (0.2) | | | (0.2) | | | (0.2) | | | (0.1) | | | (0.2) | |
| Net Periodic Benefit Credit Recognized in Expense | | $ | (73.1) | | | $ | (6.2) | | | $ | (10.3) | | | $ | (9.2) | | | $ | (8.1) | | | $ | (4.0) | | | $ | (5.1) | |
| | | | | | | | | | | | | | | | | | | | | | | | | | | | | | | | | | | | | | | | | | | | |
| 2023 | | AEP | | AEP Texas | | APCo | | I&M | | OPCo | | PSO | | SWEPCo |
| | (in millions) |
| Service Cost | | $ | 4.6 | | | $ | 0.3 | | | $ | 0.5 | | | $ | 0.6 | | | $ | 0.4 | | | $ | 0.3 | | | $ | 0.4 | |
| Interest Cost | | 46.2 | | | 3.6 | | | 7.4 | | | 5.4 | | | 4.7 | | | 2.4 | | | 2.9 | |
| Expected Return on Plan Assets | | (109.6) | | | (9.0) | | | (16.1) | | | (13.5) | | | (11.8) | | | (5.9) | | | (7.2) | |
| Amortization of Prior Service Credit | | (63.1) | | | (5.3) | | | (9.2) | | | (8.7) | | | (6.3) | | | (4.0) | | | (4.9) | |
| Amortization of Net Actuarial Loss | | 14.8 | | | 1.2 | | | 2.3 | | | 1.9 | | | 1.6 | | | 0.8 | | | 1.0 | |
| Net Periodic Benefit Credit | | (107.1) | | | (9.2) | | | (15.1) | | | (14.3) | | | (11.4) | | | (6.4) | | | (7.8) | |
| Capitalized Portion | | (2.1) | | | (0.2) | | | (0.2) | | | (0.2) | | | (0.2) | | | (0.1) | | | (0.2) | |
| Net Periodic Benefit Credit Recognized in Expense | | $ | (109.2) | | | $ | (9.4) | | | $ | (15.3) | | | $ | (14.5) | | | $ | (11.6) | | | $ | (6.5) | | | $ | (8.0) | |
| | | | | | | | | | | | | | | | | | | | | | | | | | | | | | | | | | | | | | | | | | | | |
| 2022 | | AEP | | AEP Texas | | APCo | | I&M | | OPCo | | PSO | | SWEPCo |
| | (in millions) |
| Service Cost | | $ | 7.4 | | | $ | 0.5 | | | $ | 0.8 | | | $ | 0.9 | | | $ | 0.6 | | | $ | 0.4 | | | $ | 0.6 | |
| Interest Cost | | 29.2 | | | 2.2 | | | 4.7 | | | 3.4 | | | 3.0 | | | 1.5 | | | 1.8 | |
| Expected Return on Plan Assets | | (110.0) | | | (9.1) | | | (16.3) | | | (13.7) | | | (12.0) | | | (6.1) | | | (7.3) | |
| Amortization of Prior Service Credit | | (71.4) | | | (6.1) | | | (10.4) | | | (9.7) | | | (7.1) | | | (4.4) | | | (5.3) | |
| | | | | | | | | | | | | | |
| Net Periodic Benefit Credit | | (144.8) | | | (12.5) | | | (21.2) | | | (19.1) | | | (15.5) | | | (8.6) | | | (10.2) | |
| Capitalized Portion | | (3.2) | | | (0.3) | | | (0.4) | | | (0.3) | | | (0.3) | | | (0.2) | | | (0.2) | |
| Net Periodic Benefit Credit Recognized in Expense | | $ | (148.0) | | | $ | (12.8) | | | $ | (21.6) | | | $ | (19.4) | | | $ | (15.8) | | | $ | (8.8) | | | $ | (10.4) | |
American Electric Power System Retirement Savings Plan
AEPSC sponsors the American Electric Power System Retirement Savings Plan, a defined contribution retirement savings plan for substantially all AEP subsidiary employees who are not covered by a retirement savings plan of the UMWA. This qualified plan offers participants an opportunity to contribute a portion of their pay, includes features under Section 401(k) of the IRC and provides for company matching contributions. The matching contributions to the plan are 100% of the first 1% of eligible employee contributions and 70% of the next 5% of contributions.
The following table provides the cost for matching contributions to the retirement savings plans by Registrant:
| | | | | | | | | | | | | | | | | | | | | | | | | | | | | | | | | | | | | | | | | | | | |
| Year Ended December 31, | | AEP | | AEP Texas | | APCo | | I&M | | OPCo | | PSO | | SWEPCo |
| | (in millions) |
| 2024 | | $ | 81.5 | | | $ | 6.8 | | | $ | 8.0 | | | $ | 10.7 | | | $ | 7.9 | | | $ | 5.3 | | | $ | 6.5 | |
| 2023 | | 87.9 | | | 7.1 | | | 8.4 | | | 11.0 | | | 8.2 | | | 5.3 | | | 6.7 | |
| 2022 | | 81.9 | | | 6.5 | | | 7.8 | | | 11.1 | | | 7.7 | | | 4.7 | | | 6.4 | |
UMWA Benefits
Health and Welfare Benefits (Applies to AEP and APCo)
AEP provides health and welfare benefits negotiated with the UMWA for certain unionized employees, retirees and their survivors who meet eligibility requirements. APCo also provides the same UMWA health and welfare benefits for certain unionized mining retirees and their survivors who meet eligibility requirements. AEP and APCo administer the health and welfare benefits and pay them from their general assets.
Multiemployer Pension Benefits (Applies to AEP)
UMWA pension benefits are provided through the United Mine Workers of America 1974 Pension Plan (Employer Identification Number: 52-1050282, Plan Number 002), a multiemployer plan. The UMWA pension benefits are administered by a board of trustees appointed in equal numbers by the UMWA and the Bituminous Coal Operators’ Association (BCOA), an industry bargaining association. AEP makes contributions to the United Mine Workers of America 1974 Pension Plan based on provisions in its labor agreement and the plan documents. The UMWA pension plan is different from single-employer plans as an employer’s contributions may be used to provide benefits to employees of other participating employers. A withdrawing employer may be subject to a withdrawal liability, which is calculated based upon that employer’s share of the plan’s unfunded benefit obligations. If an employer fails to make required contributions or if its payments in connection with its withdrawal liability fall short of satisfying its share of the plan’s unfunded benefit obligations, the remaining employers may be allocated a greater share of the remaining unfunded plan obligations. Under the Pension Protection Act of 2006 (PPA), the UMWA pension plan is in Critical Status for the plan year beginning July 1, 2023 and was in Critical Status for the plan year beginning July 1, 2022. As required under the PPA, the Plan adopted a Rehabilitation Plan in 2015. The Rehabilitation Plan has been updated annually, most recently in April 2023.
AEP affiliates contributed $379 thousand, $396 thousand and $329 thousand to the United Mine Workers of America 1974 Pension Plan for the years ended December 31, 2024, 2023 and 2022, respectively. The contributions did not include surcharges. An AEP affiliate, Cook Coal Terminal (CCT), was listed in the plan’s 2022 Form 5500 as providing more than 5 percent of the total contributions for the plan year ending June 30, 2023. The plan’s 2022 Form 5500 was filed in the second quarter of 2024.
Under the terms of the UMWA pension plan, contributions will be required to continue beyond the January 25, 2026 expiration of the current collective bargaining agreement between the CCT facility and the UMWA, whether or not the term of that agreement is extended or a subsequent agreement is entered, so long as both the UMWA pension plan remains in effect and an AEP affiliate continues to operate the facility covered by the current collective bargaining agreement. The contribution rate applicable would be determined in accordance with the terms of the UMWA pension plan by reference to the National Bituminous Coal Wage Agreement, subject to periodic revisions, between the UMWA and the BCOA. If the UMWA pension plan would terminate or an AEP affiliate would cease operation of the facility without arranging for a successor operator to assume its liability, the withdrawal liability obligation would be triggered.
AEP records a UMWA pension withdrawal liability on the balance sheet that is re-measured annually and is the estimated value of the company’s anticipated contributions toward its proportionate share of the plan’s unfunded vested liabilities. As of December 31, 2024 and 2023, the liability balance was $12 million and $13 million, respectively. AEP recovers the estimated value of its UMWA pension withdrawal liability through fuel clauses in certain regulated jurisdictions. AEP records a regulatory asset on the balance sheets when the UMWA pension withdrawal liability exceeds the cumulative billings collected and a regulatory liability on the balance sheets when the cumulative billings collected exceed the withdrawal liability. If any portion of the UMWA pension withdrawal liability is not recoverable, it could reduce future net income and cash flows and impact financial condition.
9. BUSINESS SEGMENTS
The disclosures in this note apply to all Registrants unless indicated otherwise.
AEP’s Reportable Segments
AEP’s primary business is the generation, transmission and distribution of electricity. Within its Vertically Integrated Utilities segment, AEP centrally dispatches generation assets and manages its overall utility operations on an integrated basis because of the substantial impact of cost-based rates and regulatory oversight. Intersegment sales and transfers are generally based on underlying contractual arrangements and agreements.
AEP’s reportable segments and their related business activities are outlined below:
Vertically Integrated Utilities
•Generation, transmission and distribution of electricity for sale to retail and wholesale customers through assets owned and operated by AEGCo, APCo, I&M, KGPCo, KPCo, PSO, SWEPCo and WPCo.
Transmission and Distribution Utilities
•Transmission and distribution of electricity for sale to retail and wholesale customers through assets owned and operated by AEP Texas and OPCo.
•OPCo purchases energy and capacity to serve standard service offer customers and provides transmission and distribution services for all connected load.
AEP Transmission Holdco
•Development, construction and operation of transmission facilities through investments in AEPTCo. These investments have FERC-approved ROEs.
•Development, construction and operation of transmission facilities through investments in AEP’s transmission-only joint ventures. These investments have PUCT-approved or FERC-approved ROEs.
Generation & Marketing
•Marketing, risk management and retail activities in ERCOT, MISO, PJM and SPP.
•Competitive generation in PJM.
The remainder of AEP’s activities are presented as Corporate and Other. While not considered a reportable segment, Corporate and Other primarily includes the purchasing of receivables from certain AEP utility subsidiaries, Parent’s guarantee revenue received from affiliates, investment income, interest income and interest expense, income tax expense and other nonallocated costs.
The CODM of AEP is the President and CEO of AEP, who makes operating decisions, allocates resources to and assesses performance based on these reportable segments. The CODM uses earnings (loss) attributable to AEP common shareholders (presented on a GAAP basis) as a measure of segment profit or loss in making these decisions. Earnings (loss) attributable to AEP common shareholders includes intercompany revenues and expenses that are eliminated on the consolidated financial statements.
The tables below present AEP’s reportable segment income statement information for the years ended December 31, 2024, 2023 and 2022 and reportable segment balance sheet information as of December 31, 2024 and 2023. The significant expenses disclosed below align with the segment-level information that is regularly provided to the CODM.
| | | | | | | | | | | | | | | | | | | | | | | | | | | | | | | | | | | | | | | | | | | | | | | | | | |
| | VIU | | T&D | | AEPTHCo | | G&M | | Total Reportable Segments | | Corporate and Other (a) | | Reconciling Adjustments | | Consolidated |
| 2024 | | (in millions) |
| Revenues from: | | | | | | | | | | | | | | | | |
| External Customers | | $ | 11,414.0 | | | $ | 5,879.6 | | | $ | 425.0 | | | $ | 1,944.7 | | | $ | 19,663.3 | | | $ | 58.0 | | | $ | — | | | $ | 19,721.3 | |
| Other Operating Segments | | 182.6 | | | 28.1 | | | 1,525.8 | | | 100.7 | | | 1,837.2 | | | 125.1 | | | (1,962.3) | | (b) | — | |
| Total Revenues | | 11,596.6 | | | 5,907.7 | | | 1,950.8 | | | 2,045.4 | | | 21,500.5 | | | 183.1 | | | (1,962.3) | | | 19,721.3 | |
| | | | | | | | | | | | | | | | |
| Purchased Electricity, Fuel and Other Consumables Used for Electric Generation | | 3,796.2 | | | 909.1 | | | — | | | 1,542.4 | | | 6,247.7 | | | — | | | (311.4) | | | 5,936.3 | |
| Other Operation and Maintenance | | 3,528.0 | | | 2,166.1 | | | 162.8 | | | 129.9 | | | 5,986.8 | | | 136.3 | | | (1,670.4) | | | 4,452.7 | |
| | | | | | | | | | | | | | | | |
| | | | | | | | | | | | | | | | |
| | | | | | | | | | | | | | | | |
| Asset Impairments and Other Related Charges | | 13.4 | | | 52.9 | | | — | | | 76.2 | | | 142.5 | | | — | | | — | | | 142.5 | |
| | | | | | | | | | | | | | | | |
| | | | | | | | | | | | | | | | |
| Depreciation and Amortization | | 1,970.6 | | | 879.5 | | | 439.7 | | | 20.9 | | | 3,310.7 | | | (20.8) | | | — | | | 3,289.9 | |
| Taxes Other Than Income Taxes | | 535.3 | | | 724.2 | | | 314.9 | | | 2.0 | | | 1,576.4 | | | 0.4 | | | 19.5 | | | 1,596.3 | |
| | | | | | | | | | | | | | | | |
| | | | | | | | | | | | | | | | |
| | | | | | | | | | | | | | | | |
| | | | | | | | | | | | | | | | |
| Allowance for Equity Funds Used During Construction | | 52.4 | | | 69.2 | | | 89.4 | | | — | | | 211.0 | | | — | | | — | | | 211.0 | |
| | | | | | | | | | | | | | | | |
| Interest Expense | | 724.3 | | | 405.5 | | | 222.3 | | | 16.6 | | | 1,368.7 | | | 612.5 | | | (118.4) | | | 1,862.8 | |
| | | | | | | | | | | | | | | | |
| | | | | | | | | | | | | | | | |
| Income Tax Expense (Benefit) | | (282.2) | | | 154.5 | | | 214.7 | | | 25.9 | | | 112.9 | | | (152.1) | | | — | | | (39.2) | |
| Equity Earnings (Loss) of Unconsolidated Subsidiaries | | 1.4 | | | (1.1) | | | 98.9 | | | 0.9 | | | 100.1 | | | (6.4) | | | — | | | 93.7 | |
| | | | | | | | | | | | | | | | |
| | | | | | | | | | | | | | | | |
| Other Segment Items (c) | | (88.4) | | | (41.7) | | | (5.5) | | | (56.8) | | | (192.4) | | | (108.4) | | | 118.4 | | | (182.4) | |
| Earnings (Loss) Attributable to AEP Common Shareholders | | $ | 1,453.2 | | | $ | 725.7 | | | $ | 790.2 | | | $ | 289.2 | | | $ | 3,258.3 | | | $ | (291.2) | | | $ | — | | | $ | 2,967.1 | |
| | | | | | | | | | | | | | | | |
| Gross Property Additions | | $ | 3,643.5 | | | $ | 2,343.6 | | | $ | 1,572.5 | | | $ | 35.1 | | | $ | 7,594.7 | | | $ | 466.6 | | | $ | (31.1) | | | $ | 8,030.2 | |
| | | | | | | | | | | | | | | | |
| | | | | | | | | | | | | | | | |
| | | | | | | | | | | | | | | | |
| | | | | | | | | | | | | | | | |
| | | | | | | | | | | | | | | | |
| | | | | | | | | | | | | | | | |
| | | | | | | | | | | | | | | | |
| Total Assets | | $ | 54,996.5 | | | $ | 26,864.3 | | | $ | 18,011.9 | | | $ | 1,633.9 | | | $ | 101,506.6 | | | $ | 5,550.8 | | (d) | $ | (3,979.4) | | (e) | $ | 103,078.0 | |
| | | | | | | | | | | | | | | | |
| Investments in Equity Method Investees | | $ | 9.1 | | | $ | 2.0 | | | $ | 996.1 | | | $ | — | | | $ | 1,007.2 | | | $ | 48.7 | | | $ | — | | | $ | 1,055.9 | |
| | | | | | | | | | | | | | | | | | | | | | | | | | | | | | | | | | | | | | | | | | | | | | | | | | |
| | VIU | | T&D | | AEPTHCo | | G&M | | Total Reportable Segments | | Corporate and Other (a) | | Reconciling Adjustments | | Consolidated |
| 2023 | | (in millions) |
| Revenues from: | | | | | | | | | | | | | | | | |
| External Customers | | $ | 11,303.7 | | | $ | 5,677.2 | | | $ | 397.4 | | | $ | 1,543.3 | | | $ | 18,921.6 | | | $ | 60.7 | | | $ | — | | | $ | 18,982.3 | |
| Other Operating Segments | | 145.8 | | | 36.1 | | | 1,331.1 | | | 88.9 | | | 1,601.9 | | | 107.3 | | | (1,709.2) | | (b) | — | |
| Total Revenues | | 11,449.5 | | | 5,713.3 | | | 1,728.5 | | | 1,632.2 | | | 20,523.5 | | | 168.0 | | | (1,709.2) | | | 18,982.3 | |
| | | | | | | | | | | | | | | | |
| Purchased Electricity, Fuel and Other Consumables Used for Electric Generation | | 4,150.3 | | | 1,214.8 | | | — | | | 1,487.8 | | | 6,852.9 | | | — | | | (274.6) | | | 6,578.3 | |
| Other Operation and Maintenance | | 3,211.1 | | | 1,947.8 | | | 141.6 | | | 132.9 | | | 5,433.4 | | | 103.1 | | | (1,449.7) | | | 4,086.8 | |
| | | | | | | | | | | | | | | | |
| | | | | | | | | | | | | | | | |
| | | | | | | | | | | | | | | | |
| Asset Impairments and Other Related Charges | | 85.6 | | | — | | | — | | | — | | | 85.6 | | | — | | | — | | | 85.6 | |
| Loss on the Sale of the Competitive Contracted Renewables Portfolio | | — | | | — | | | — | | | 92.7 | | | 92.7 | | | — | | | — | | | 92.7 | |
| | | | | | | | | | | | | | | | |
| Depreciation and Amortization | | 1,876.4 | | | 784.7 | | | 402.6 | | | 42.7 | | | 3,106.4 | | | (16.0) | | | — | | | 3,090.4 | |
| Taxes Other Than Income Taxes | | 512.5 | | | 668.0 | | | 290.1 | | | 6.6 | | | 1,477.2 | | | 0.2 | | | 14.9 | | | 1,492.3 | |
| | | | | | | | | | | | | | | | |
| | | | | | | | | | | | | | | | |
| | | | | | | | | | | | | | | | |
| | | | | | | | | | | | | | | | |
| Allowance for Equity Funds Used During Construction | | 46.3 | | | 45.5 | | | 83.1 | | | — | | | 174.9 | | | — | | | — | | | 174.9 | |
| | | | | | | | | | | | | | | | |
| | | | | | | | | | | | | | | | |
| Interest Expense | | 764.5 | | | 363.6 | | | 202.6 | | | 76.0 | | | 1,406.7 | | | 594.7 | | | (194.5) | | | 1,806.9 | |
| | | | | | | | | | | | | | | | |
| | | | | | | | | | | | | | | | |
| Income Tax Expense (Benefit) | | (45.2) | | | 140.2 | | | 166.0 | | | (122.9) | | | 138.1 | | | (83.5) | | | — | | | 54.6 | |
| Equity Earnings (Loss) of Unconsolidated Subsidiaries | | 1.4 | | | — | | | 82.9 | | | (16.5) | | | 67.8 | | | (9.3) | | | — | | | 58.5 | |
| | | | | | | | | | | | | | | | |
| | | | | | | | | | | | | | | | |
| Other Segment Items (c) | | (148.4) | | | (59.0) | | | (11.3) | | | (73.8) | | | (292.5) | | | (182.2) | | | 194.7 | | | (280.0) | |
| Earnings (Loss) Attributable to AEP Common Shareholders | | $ | 1,090.4 | | | $ | 698.7 | | | $ | 702.9 | | | $ | (26.3) | | | $ | 2,465.7 | | | $ | (257.6) | | | $ | — | | | $ | 2,208.1 | |
| | | | | | | | | | | | | | | | |
| Gross Property Additions | | $ | 3,486.8 | | | $ | 2,467.4 | | | $ | 1,528.7 | | | $ | 12.6 | | | $ | 7,495.5 | | | $ | 36.6 | | | $ | 1.4 | | | $ | 7,533.5 | |
| | | | | | | | | | | | | | | | |
| | | | | | | | | | | | | | | | |
| | | | | | | | | | | | | | | | |
| | | | | | | | | | | | | | | | |
| | | | | | | | | | | | | | | | |
| | | | | | | | | | | | | | | | |
| | | | | | | | | | | | | | | | |
| Total Assets | | $ | 51,802.1 | | | $ | 24,838.4 | | | $ | 16,575.6 | | | $ | 2,598.5 | | | $ | 95,814.6 | | | $ | 5,194.0 | | (d) | $ | (4,324.6) | | (e) | $ | 96,684.0 | |
| | | | | | | | | | | | | | | | |
| Investments in Equity Method Investees | | $ | 10.0 | | | $ | 3.0 | | | $ | 905.8 | | | $ | 100.6 | | | $ | 1,019.4 | | | $ | 54.2 | | | $ | — | | | $ | 1,073.6 | |
| | | | | | | | | | | | | | | | | | | | | | | | | | | | | | | | | | | | | | | | | | | | | | | | | | |
| | VIU | | T&D | | AEPTHCo | | G&M | | Total Reportable Segments | | Corporate and Other (a) | | Reconciling Adjustments | | Consolidated |
| 2022 | | (in millions) |
| Revenues from: | | | | | | | | | | | | | | | | |
| External Customers | | $ | 11,292.8 | | | $ | 5,489.6 | | | $ | 357.5 | | | $ | 2,448.9 | | | $ | 19,588.8 | | | $ | 50.7 | | | $ | — | | | $ | 19,639.5 | |
| Other Operating Segments | | 184.7 | | | 22.4 | | | 1,319.5 | | | 18.0 | | | 1,544.6 | | | 59.2 | | | (1,603.8) | | (b) | — | |
| Total Revenues | | 11,477.5 | | | 5,512.0 | | | 1,677.0 | | | 2,466.9 | | | 21,133.4 | | | 109.9 | | | (1,603.8) | | | 19,639.5 | |
| | | | | | | | | | | | | | | | |
| Purchased Electricity, Fuel and Other Consumables Used for Electric Generation | | 4,007.9 | | | 1,287.3 | | | — | | | 1,984.3 | | | 7,279.5 | | | — | | | (181.6) | | | 7,097.9 | |
| Other Operation and Maintenance | | 3,287.2 | | | 1,864.2 | | | 165.7 | | | 118.7 | | | 5,435.8 | | | 130.0 | | | (1,438.3) | | | 4,127.5 | |
| | | | | | | | | | | | | | | | |
| Loss on the Expected Sale of the Kentucky Operations | | — | | | — | | | — | | | — | | | — | | | 363.3 | | | — | | | 363.3 | |
| | | | | | | | | | | | | | | | |
| Asset Impairments and Other Related Charges | | 24.9 | | | — | | | — | | | — | | | 24.9 | | | 23.9 | | | — | | | 48.8 | |
| | | | | | | | | | | | | | | | |
| Gain on Sale of Mineral Rights | | — | | | — | | | — | | | (116.3) | | | (116.3) | | | — | | | — | | | (116.3) | |
| Depreciation and Amortization | | 2,007.2 | | | 746.7 | | | 355.0 | | | 93.0 | | | 3,201.9 | | | 0.9 | | | — | | | 3,202.8 | |
| Taxes Other Than Income Taxes | | 504.9 | | | 659.9 | | | 277.6 | | | 11.1 | | | 1,453.5 | | | 0.2 | | | 16.1 | | | 1,469.8 | |
| | | | | | | | | | | | | | | | |
| | | | | | | | | | | | | | | | |
| | | | | | | | | | | | | | | | |
| | | | | | | | | | | | | | | | |
| Allowance for Equity Funds Used During Construction | | 29.5 | | | 33.6 | | | 70.6 | | | — | | | 133.7 | | | — | | | — | | | 133.7 | |
| | | | | | | | | | | | | | | | |
| Interest Expense | | 650.9 | | | 328.0 | | | 169.3 | | | 51.8 | | | 1,200.0 | | | 308.9 | | | (112.8) | | | 1,396.1 | |
| | | | | | | | | | | | | | | | |
| | | | | | | | | | | | | | | | |
| Income Tax Expense (Benefit) | | (93.8) | | | 116.9 | | | 193.6 | | | (83.1) | | | 133.6 | | | (128.2) | | | — | | | 5.4 | |
| Equity Earnings (Loss) of Unconsolidated Subsidiaries | | 1.4 | | | 0.6 | | | 83.4 | | | (192.4) | | | (107.0) | | | (2.4) | | | — | | | (109.4) | |
| | | | | | | | | | | | | | | | |
| | | | | | | | | | | | | | | | |
| Other Segment Items (c) | | (172.8) | | | (52.5) | | | (3.7) | | | (68.6) | | | (297.6) | | | (53.9) | | | 112.8 | | | (238.7) | |
| Earnings (Loss) Attributable to AEP Common Shareholders | | $ | 1,292.0 | | | $ | 595.7 | | | $ | 673.5 | | | $ | 283.6 | | | $ | 2,844.8 | | | $ | (537.6) | | | $ | — | | | $ | 2,307.2 | |
| | | | | | | | | | | | | | | | |
| Gross Property Additions | | $ | 4,164.6 | | | $ | 2,177.3 | | | $ | 1,470.8 | | | $ | 69.2 | | | $ | 7,881.9 | | | $ | 25.9 | | | $ | (28.8) | | | $ | 7,879.0 | |
| | | | | | | | | | | | | | | | |
| | | | | | | | | | | | | | | | |
| | | | | | | | | | | | | | | | |
| | | | | | | | | | | | | | | | |
| | | | | | | | | | | | | | | | |
| | | | | | | | | | | | | | | | |
| | | | | | | | | | | | | | | | |
| | | | | | | | | | | | | | | | |
| Investments in Equity Method Investees | | $ | 10.1 | | | $ | 3.0 | | | $ | 858.3 | | | $ | 337.6 | | | $ | 1,209.0 | | | $ | 67.7 | | | $ | — | | | $ | 1,276.7 | |
(a)Corporate and Other primarily includes the purchasing of receivables from certain AEP utility subsidiaries. This segment also includes Parent’s guarantee revenue received from affiliates, investment income, interest income and interest expense, income tax expense and other nonallocated costs.
(b)Represents inter-segment revenues.
(c)Other segment items included in segment earnings (loss) attributable to AEP common shareholders primarily includes Non-Service Cost Components of Net Period Benefit Cost, Net Income (Loss) Attributable to Noncontrolling Interests and Establishment of the VA Triennial Review Regulatory Asset (2022).
(d)Includes elimination of AEP Parent’s investments in wholly-owned subsidiary companies.
(e)Reconciling Adjustments for Total Assets primarily include elimination of intercompany advances to affiliates and intercompany accounts receivable.
Registrant Subsidiaries’ Reportable Segments (Applies to all Registrant Subsidiaries except AEPTCo)
The Registrant Subsidiaries each have one reportable segment, an integrated electricity generation, transmission and distribution business for APCo, I&M, PSO and SWEPCo, and an integrated electricity transmission and distribution business for AEP Texas and OPCo. Other activities are insignificant. The Registrant Subsidiaries’ operations are managed on an integrated basis because of the substantial impact of cost-based rates and regulatory oversight on the business process, cost structures and operating results. The CODM of each Registrant Subsidiary is the AEP President and CEO, who makes operating decisions, allocates resources to and assesses performance based on these reportable segments. The CODM uses net income (loss) that is reported on the Registrant Subsidiaries’ statements of income as a measure of segment profit or loss in making these decisions. Net income (loss) includes intercompany revenues and expenses that are eliminated on the consolidated financial statements. The expenses disclosed on the Registrant Subsidiaries’ statements of income align with the segment-level significant expenses that are regularly provided to the CODM. Total Assets is reported on the consolidated financial statements. Gross Property Additions for the Registrant Subsidiaries is represented by the sum of Construction Expenditures and Acquisition of Assets on the consolidated financial statements. See Registrant Subsidiaries statements of income, balance sheets and cash flows for details.
AEPTCo’s Reportable Segments
AEPTCo Parent is the holding company of seven FERC-regulated transmission-only electric utilities. The seven State Transcos have been identified as operating segments of AEPTCo under the accounting guidance for “Segment Reporting.” The State Transcos business consists of developing, constructing and operating transmission facilities at the request of the RTOs in which they operate and in replacing and upgrading facilities, assets and components of the existing AEP transmission system as needed to maintain reliability standards and provide service to AEP’s wholesale and retail customers. The State Transcos are regulated for rate-making purposes exclusively by the FERC and earn revenues through tariff rates charged for the use of their electric transmission systems.
The CODM of AEPTCo is the AEP President and CEO, who makes operating decisions, allocates resources to and assesses performance based on these operating segments. The State Transcos operating segments all have similar economic characteristics and meet all of the criteria under the accounting guidance for “Segment Reporting” to be aggregated into one reportable segment. As a result, AEPTCo has one reportable segment. The remainder of AEPTCo’s activity is presented in AEPTCo Parent. While not considered a reportable segment, AEPTCo Parent represents the activity of the holding company which primarily relates to debt financing activity and general corporate activities.
The tables below present AEPTCo’s reportable segment income statement information for the years ended December 31, 2024, 2023 and 2022 and reportable segment balance sheet information as of December 31, 2024 and 2023. The significant expenses disclosed below align with the segment-level information that is regularly provided to the CODM.
| | | | | | | | | | | | | | | | | | | | | | | |
| State Transcos | | AEPTCo Parent | | Reconciling Adjustments | | AEPTCo
Consolidated |
| 2024 | (in millions) |
| Revenues from: | | | | | | | |
| External Customers | $ | 378.6 | | | $ | — | | | $ | — | | | $ | 378.6 | |
| Sales to AEP Affiliates | 1,512.3 | | | — | | | — | | | 1,512.3 | |
| | | | | | | |
| Total Revenues | 1,890.9 | | | — | | | — | | | 1,890.9 | |
| | | | | | | |
| Other Operation and Maintenance | 156.6 | | | 1.7 | | | — | | | 158.3 | |
| | | | | | | |
| Depreciation and Amortization | 430.9 | | | — | | | — | | | 430.9 | |
| Taxes Other Than Income Taxes | 308.7 | | | — | | | — | | | 308.7 | |
| | | | | | | |
| | | | | | | |
| | | | | | | |
| Interest Income | 7.9 | | | 241.1 | | | (238.5) | | (a) | 10.5 | |
| Allowance for Equity Funds Used During Construction | 89.4 | | | — | | | — | | | 89.4 | |
| Interest Expense | 214.0 | | | 238.7 | | | (238.5) | | (a) | 214.2 | |
| | | | | | | |
| Income Tax Expense | 190.2 | | | 0.1 | | | — | | | 190.3 | |
| | | | | | | |
| | | | | | | |
| Net Income | $ | 687.8 | | | $ | 0.6 | | (b) | $ | — | | | $ | 688.4 | |
| | | | | | | |
| Gross Property Additions | $ | 1,481.8 | | | $ | — | | | $ | — | | | $ | 1,481.8 | |
| | | | | | | |
| | | | | | | |
| | | | | | | |
| | | | | | | |
| | | | | | | |
| | | | | | | |
| | | | | | | |
| | | | | | | |
| | | | | | | |
| Total Assets | $ | 16,887.7 | | | $ | 8,670.4 | | (c) | $ | (9,187.8) | | (d) | $ | 16,370.3 | |
| | | | | | | |
| | | | | | | |
| | | | | | | |
| | | | | | | | | | | | | | | | | | | | | | | |
| State Transcos | | AEPTCo Parent | | Reconciling Adjustments | | AEPTCo
Consolidated |
| 2023 | (in millions) |
| Revenues from: | | | | | | | |
| External Customers | $ | 354.2 | | | $ | — | | | $ | — | | | $ | 354.2 | |
| Sales to AEP Affiliates | 1,317.8 | | | — | | | — | | | 1,317.8 | |
| | | | | | | |
| Total Revenues | 1,672.0 | | | — | | | — | | | 1,672.0 | |
| | | | | | | |
| Other Operation and Maintenance | 129.2 | | | 0.2 | | | — | | | 129.4 | |
| | | | | | | |
| Depreciation and Amortization | 393.8 | | | — | | | — | | | 393.8 | |
| Taxes Other Than Income Taxes | 283.2 | | | — | | | — | | | 283.2 | |
| | | | | | | |
| | | | | | | |
| | | | | | | |
| Interest Income | 3.8 | | | 218.0 | | | (214.8) | | (a) | 7.0 | |
| Allowance for Equity Funds Used During Construction | 83.2 | | | — | | | — | | | 83.2 | |
| Interest Expense | 194.2 | | | 215.1 | | | (214.8) | | (a) | 194.5 | |
| | | | | | | |
| Income Tax Expense | 145.7 | | | 1.4 | | | — | | | 147.1 | |
| | | | | | | |
| | | | | | | |
| Net Income | $ | 612.9 | | | $ | 1.3 | | (b) | $ | — | | | $ | 614.2 | |
| | | | | | | |
| Gross Property Additions | $ | 1,503.1 | | | $ | — | | | $ | — | | | $ | 1,503.1 | |
| | | | | | | |
| | | | | | | |
| | | | | | | |
| | | | | | | |
| | | | | | | |
| | | | | | | |
| | | | | | | |
| | | | | | | |
| | | | | | | |
| Total Assets | $ | 15,120.6 | | | $ | 5,486.6 | | (c) | $ | (5,534.7) | | (d) | $ | 15,072.5 | |
| | | | | | | |
| | | | | | | |
| | | | | | | |
| | | | | | | | | | | | | | | | | | | | | | | |
| State Transcos | | AEPTCo Parent | | Reconciling Adjustments | | AEPTCo
Consolidated |
| 2022 | (in millions) |
| Revenues from: | | | | | | | |
| External Customers | $ | 340.9 | | | $ | — | | | $ | — | | | $ | 340.9 | |
| Sales to AEP Affiliates | 1,283.8 | | | — | | | — | | | 1,283.8 | |
| Other Revenues | (0.2) | | | — | | | — | | | (0.2) | |
| Total Revenues | 1,624.5 | | | — | | | — | | | 1,624.5 | |
| | | | | | | |
| Other Operation and Maintenance | 152.8 | | | 0.7 | | | — | | | 153.5 | |
| | | | | | | |
| Depreciation and Amortization | 346.2 | | | — | | | — | | | 346.2 | |
| Taxes Other Than Income Taxes | 271.1 | | | — | | | — | | | 271.1 | |
| | | | | | | |
| | | | | | | |
| | | | | | | |
| Interest Income | 0.7 | | | 177.8 | | | (176.9) | | (a) | 1.6 | |
| Allowance for Equity Funds Used During Construction | 70.7 | | | — | | | — | | | 70.7 | |
| Interest Expense | 162.5 | | | 177.1 | | | (176.9) | | (a) | 162.7 | |
| | | | | | | |
| Income Tax Expense | 169.1 | | | — | | | — | | | 169.1 | |
| | | | | | | |
| | | | | | | |
| Net Income | $ | 594.2 | | | $ | — | | (b) | $ | — | | | $ | 594.2 | |
| | | | | | | |
| Gross Property Additions | $ | 1,468.3 | | | $ | — | | | $ | — | | | $ | 1,468.3 | |
| | | | | | | |
| | | | | | | |
| | | | | | | |
| | | | | | | |
| | | | | | | |
| | | | | | | |
| | | | | | | |
| | | | | | | |
| | | | | | | |
| | | | | | | |
| | | | | | | |
| | | | | | | |
| | | | | | | |
(a) Elimination of intercompany interest income/interest expense on affiliated debt arrangement.
(b) Includes elimination of AEPTCo Parent’s equity earnings in the State Transcos.
(c) Primarily relates to Notes Receivable from the State Transcos.
(d) Primarily relates to elimination of Notes Receivable from the State Transcos.
10. DERIVATIVES AND HEDGING
The disclosures in this note apply to all Registrants unless indicated otherwise. For the periods presented, AEPTCo did not have any derivative and hedging activity.
OBJECTIVES FOR UTILIZATION OF DERIVATIVE INSTRUMENTS
AEPSC is agent for and transacts on behalf of certain AEP subsidiaries, including the Registrant Subsidiaries. AEPEP is agent for and transacts on behalf of other AEP subsidiaries.
The Registrants are exposed to certain market risks as major power producers and participants in the electricity, capacity, natural gas, coal and emission allowance markets. These risks include commodity price risks which may be subject to capacity risk, interest rate risk and credit risk. These risks represent the risk of loss that may impact the Registrants due to changes in the underlying market prices or rates. Management utilizes derivative instruments to manage these risks.
STRATEGIES FOR UTILIZATION OF DERIVATIVE INSTRUMENTS TO ACHIEVE OBJECTIVES
Risk Management Strategies
The strategy surrounding the use of derivative instruments primarily focuses on managing risk exposures, future cash flows and creating value utilizing both economic and formal hedging strategies. The risk management strategies also include the use of derivative instruments for trading purposes which focus on seizing market opportunities to create value driven by expected changes in the market prices of the commodities. To accomplish these objectives, the Registrants primarily employ risk management contracts including physical and financial forward purchase-and-sale contracts and, to a lesser extent, OTC swaps and options. Not all risk management contracts meet the definition of a derivative under the accounting guidance for “Derivatives and Hedging.” Derivative risk management contracts elected normal under the normal purchases and normal sales scope exception are not subject to the requirements of this accounting guidance.
The Registrants utilize power, capacity, coal, natural gas, interest rate and, to a lesser extent, heating oil, gasoline and other commodity contracts to manage the risk associated with the energy business. The Registrants utilize interest rate derivative contracts in order to manage the interest rate exposure associated with the commodity portfolio. For disclosure purposes, such risks are grouped as “Commodity,” as these risks are related to energy risk management activities. The Registrants also utilize derivative contracts to manage interest rate risk associated with debt financing. For disclosure purposes, these risks are grouped as “Interest Rate.” The amount of risk taken is determined by the Commercial Operations, Energy Supply and Finance groups in accordance with established risk management policies as approved by the Finance Committee of the Board of Directors.
The following table represents the gross notional volume of the Registrants’ outstanding derivative contracts:
| | | | | | | | | | | | | | | | | | | | | | | | | | | | | | | | | | | | | | | | | | | | | | | | | | | | | | | | | | | | | | | | | | | | | | | | | | | | | | | | | | | | | | |
| | Notional Volume of Derivative Instruments |
| | December 31, 2024 | | December 31, 2023 |
Primary Risk
Exposure | | AEP | | AEP Texas | | APCo | | I&M | | OPCo | | PSO | | SWEPCo | | AEP | | AEP Texas | | APCo | | I&M | | OPCo | | PSO | | SWEPCo |
| | (in millions) |
| Commodity: | | | | | | | | | | | | | | | | | | | | | | | | | | | | |
| Power (MWhs) | | 282.4 | | | — | | | 23.6 | | | 7.7 | | | 2.0 | | | 5.0 | | | 4.6 | | | 246.8 | | | — | | | 16.8 | | | 5.9 | | | 2.2 | | | 4.1 | | | 2.9 | |
| | | | | | | | | | | | | | | | | | | | | | | | | | | | |
| Natural Gas (MMBtus) | | 152.8 | | | — | | | 42.2 | | | — | | | — | | | 46.2 | | | 15.4 | | | 151.6 | | | — | | | 37.3 | | | — | | | — | | | 34.9 | | | 17.9 | |
| Heating Oil and Gasoline (Gallons) | | 7.9 | | | 2.0 | | | 0.9 | | | 2.0 | | | 1.1 | | | 0.7 | | | 0.9 | | | 6.5 | | | 1.8 | | | 1.0 | | | 0.6 | | | 1.2 | | | 0.7 | | | 0.9 | |
| Interest Rate (USD) | | $ | 59.3 | | | $ | — | | | $ | — | | | $ | — | | | $ | — | | | $ | — | | | $ | — | | | $ | 80.1 | | | $ | — | | | $ | — | | | $ | — | | | $ | — | | | $ | — | | | $ | — | |
| | | | | | | | | | | | | | | | | | | | | | | | | | | | |
| Interest Rate on Long-term Debt (USD) | | $ | 950.0 | | | $ | — | | | $ | — | | | $ | — | | | $ | — | | | $ | — | | | $ | — | | | $ | 1,300.0 | | | $ | 150.0 | | | $ | — | | | $ | — | | | $ | — | | | $ | — | | | $ | — | |
Fair Value Hedging Strategies (Applies to AEP)
Parent enters into interest rate derivative transactions as part of an overall strategy to manage the mix of fixed-rate and floating-rate debt. Certain interest rate derivative transactions effectively modify exposure to interest rate risk by converting a portion of fixed-rate debt to a floating-rate. Provided specific criteria are met, these interest rate derivatives may be designated as fair value hedges.
Cash Flow Hedging Strategies
The Registrants utilize cash flow hedges on certain derivative transactions for the purchase and sale of power (“Commodity”) in order to manage the variable price risk related to forecasted purchases and sales. Management monitors the potential impacts of commodity price changes and, where appropriate, enters into derivative transactions to protect profit margins for a portion of future electricity sales and purchases. The Registrants do not hedge all commodity price risk.
The Registrants utilize a variety of interest rate derivative transactions in order to manage interest rate risk exposure. The Registrants also utilize interest rate derivative contracts to manage interest rate exposure related to future borrowings of fixed-rate debt. The Registrants do not hedge all interest rate exposure.
ACCOUNTING FOR DERIVATIVE INSTRUMENTS AND THE IMPACT ON THE FINANCIAL STATEMENTS
The accounting guidance for “Derivatives and Hedging” requires recognition of all qualifying derivative instruments as either assets or liabilities on the balance sheets at fair value. The fair values of derivative instruments accounted for using MTM accounting or hedge accounting are based on exchange prices and broker quotes. If a quoted market price is not available, the estimate of fair value is based on the best information available including valuation models that estimate future energy prices based on existing market and broker quotes and other assumptions. In order to determine the relevant fair values of the derivative instruments, the Registrants apply valuation adjustments for discounting, liquidity and credit quality.
Credit risk is the risk that a counterparty will fail to perform on the contract or fail to pay amounts due. Liquidity risk represents the risk that imperfections in the market will cause the price to vary from estimated fair value based upon prevailing market supply and demand conditions. Since energy markets are imperfect and volatile, there are inherent risks related to the underlying assumptions in models used to fair value risk management contracts. Unforeseen events may cause reasonable price curves to differ from actual price curves throughout a contract’s term and at the time a contract settles. Consequently, there could be significant adverse or favorable effects on future net income and cash flows if market prices are not consistent with management’s estimates of current market consensus for forward prices in the current period. This is particularly true for longer term contracts. Cash flows may vary based on market conditions, margin requirements and the timing of settlement of risk management contracts.
According to the accounting guidance for “Derivatives and Hedging,” the Registrants reflect the fair values of derivative instruments subject to netting agreements with the same counterparty net of related cash collateral. For certain risk management contracts, the Registrants are required to post or receive cash collateral based on third-party contractual agreements and risk profiles. AEP netted cash collateral received from third-parties against short-term and long-term risk management assets in the amounts of $87 million and $46 million as of December 31, 2024 and 2023, respectively. There was no cash collateral received from third-parties netted against short-term and long-term risk management assets for the Registrant Subsidiaries as of December 31, 2024 and 2023. The amount of cash collateral paid to third-parties netted against short-term and long-term risk management liabilities was not material for the Registrants as of December 31, 2024 and 2023.
Location and Fair Value of Derivative Assets and Liabilities Recognized In the Balance Sheet
The following tables represent the gross fair value of the Registrants’ derivative activity on the balance sheets. The derivative instruments are disclosed as gross. They are subject to master netting agreements and are presented on the balance sheets on a net basis in accordance with the accounting guidance for “Derivatives and Hedging.” Unless shown as a separate line on the balance sheets due to materiality, Current Risk Management Assets are included in Prepayments and Other Current Assets, Long-term Risk Management Assets are included in Deferred Charges and Other Noncurrent Assets, Current Risk Management Liabilities are included in Other Current Liabilities and Long-term Risk Management Liabilities are included in Deferred Credits and Other Noncurrent Liabilities on the balance sheets.
| | | | | | | | | | | | | | | | | | | | | | | | | | | | | | | | | | | | | | | | | | | | |
| | | | | | | | | | | | | | |
| | December 31, 2024 |
| AEP | | AEP Texas | | APCo | | I&M | | OPCo | | PSO | | SWEPCo |
| Assets: | | (in millions) |
| Current Risk Management Assets | | | | | | | | | | | | | | |
| Risk Management Contracts - Commodity | | $ | 425.0 | | | $ | — | | | $ | 40.2 | | | $ | 28.5 | | | $ | — | | | $ | 22.3 | | | $ | 19.1 | |
| Hedging Contracts - Commodity | | 54.1 | | | — | | | — | | | — | | | — | | | — | | | — | |
| Hedging Contracts - Interest Rate | | — | | | — | | | — | | | — | | | — | | | — | | | — | |
| Total Current Risk Management Assets | | 479.1 | | | — | | | 40.2 | | | 28.5 | | | — | | | 22.3 | | | 19.1 | |
| | | | | | | | | | | | | | |
| Long-term Risk Management Assets | | | | | | | | | | | | | | |
| Risk Management Contracts - Commodity | | 475.4 | | | — | | | 2.0 | | | 1.2 | | | — | | | 1.6 | | | — | |
| Hedging Contracts - Commodity | | 84.6 | | | — | | | — | | | — | | | — | | | — | | | — | |
| Hedging Contracts - Interest Rate | | — | | | — | | | — | | | — | | | — | | | — | | | — | |
| Total Long-term Risk Management Assets | | 560.0 | | | — | | | 2.0 | | | 1.2 | | | — | | | 1.6 | | | — | |
| | | | | | | | | | | | | | |
| Total Assets | | $ | 1,039.1 | | | $ | — | | | $ | 42.2 | | | $ | 29.7 | | | $ | — | | | $ | 23.9 | | | $ | 19.1 | |
| | | | | | | | | | | | | | |
| Liabilities: | | | | | | | | | | | | | | |
| Current Risk Management Liabilities | | | | | | | | | | | | | | |
| Risk Management Contracts - Commodity | | $ | 304.1 | | | $ | 0.3 | | | $ | 6.6 | | | $ | 10.5 | | | $ | 7.5 | | | $ | 7.6 | | | $ | 3.4 | |
| Hedging Contracts - Commodity | | 11.3 | | | — | | | — | | | — | | | — | | | — | | | — | |
| Hedging Contracts - Interest Rate | | 36.3 | | | — | | | — | | | — | | | — | | | — | | | — | |
| Total Current Risk Management Liabilities | | 351.7 | | | 0.3 | | | 6.6 | | | 10.5 | | | 7.5 | | | 7.6 | | | 3.4 | |
| | | | | | | | | | | | | | |
| Long-term Risk Management Liabilities | | | | | | | | | | | | | | |
| Risk Management Contracts - Commodity | | 390.7 | | | — | | | 0.8 | | | 2.1 | | | 40.2 | | | 0.2 | | | — | |
| Hedging Contracts - Commodity | | 2.7 | | | — | | | — | | | — | | | — | | | — | | | — | |
| Hedging Contracts - Interest Rate | | 35.3 | | | — | | | — | | | — | | | — | | | — | | | — | |
| Total Long-term Risk Management Liabilities | | 428.7 | | | — | | | 0.8 | | | 2.1 | | | 40.2 | | | 0.2 | | | — | |
| | | | | | | | | | | | | | |
| Total Liabilities | | $ | 780.4 | | | $ | 0.3 | | | $ | 7.4 | | | $ | 12.6 | | | $ | 47.7 | | | $ | 7.8 | | | $ | 3.4 | |
| | | | | | | | | | | | | | |
| Total MTM Derivative Contract Net Assets (Liabilities) Recognized | | $ | 258.7 | | | $ | (0.3) | | | $ | 34.8 | | | $ | 17.1 | | | $ | (47.7) | | | $ | 16.1 | | | $ | 15.7 | |
| | | | | | | | | | | | | | | | | | | | | | | | | | | | | | | | | | | | | | | | | | | | |
| | December 31, 2023 |
| AEP | | AEP Texas | | APCo | | I&M | | OPCo | | PSO | | SWEPCo |
| Assets: | | (in millions) |
| Current Risk Management Assets | | | | | | | | | | | | | | |
| Risk Management Contracts - Commodity | | $ | 555.1 | | | $ | — | | | $ | 24.6 | | | $ | 30.1 | | | $ | — | | | $ | 19.7 | | | $ | 12.0 | |
| Hedging Contracts - Commodity | | 56.7 | | | — | | | — | | | — | | | — | | | — | | | — | |
| Hedging Contracts - Interest Rate | | — | | | — | | | — | | | — | | | — | | | — | | | — | |
| Total Current Risk Management Assets | | 611.8 | | | — | | | 24.6 | | | 30.1 | | | — | | | 19.7 | | | 12.0 | |
| | | | | | | | | | | | | | |
| Long-term Risk Management Assets | | | | | | | | | | | | | | |
| Risk Management Contracts - Commodity | | 468.8 | | | — | | | 0.3 | | | 12.0 | | | — | | | — | | | 0.5 | |
| Hedging Contracts - Commodity | | 86.8 | | | — | | | — | | | — | | | — | | | — | | | — | |
| Hedging Contracts - Interest Rate | | — | | | — | | | — | | | — | | | — | | | — | | | — | |
| Total Long-term Risk Management Assets | | 555.6 | | | — | | | 0.3 | | | 12.0 | | | — | | | — | | | 0.5 | |
| | | | | | | | | | | | | | |
| Total Assets | | $ | 1,167.4 | | | $ | — | | | $ | 24.9 | | | $ | 42.1 | | | $ | — | | | $ | 19.7 | | | $ | 12.5 | |
| | | | | | | | | | | | | | |
| Liabilities: | | | | |
| Current Risk Management Liabilities | | | | | | | | | | | | | | |
| Risk Management Contracts - Commodity | | $ | 588.0 | | | $ | 0.2 | | | $ | 18.5 | | | $ | 5.4 | | | $ | 6.9 | | | $ | 29.7 | | | $ | 14.9 | |
| Hedging Contracts - Commodity | | 8.2 | | | — | | | — | | | — | | | — | | | — | | | — | |
| Hedging Contracts - Interest Rate | | 50.5 | | | 2.7 | | | — | | | — | | | — | | | — | | | — | |
| Total Current Risk Management Liabilities | | 646.7 | | | 2.9 | | | 18.5 | | | 5.4 | | | 6.9 | | | 29.7 | | | 14.9 | |
| | | | | | | | | | | | | | |
| Long-term Risk Management Liabilities | | | | | | | | | | | | | | |
| Risk Management Contracts - Commodity | | 377.6 | | | — | | | 6.9 | | | 0.2 | | | 43.9 | | | 1.0 | | | 1.7 | |
| Hedging Contracts - Commodity | | 2.2 | | | — | | | — | | | — | | | — | | | — | | | — | |
| Hedging Contracts - Interest Rate | | 56.9 | | | — | | | — | | | — | | | — | | | — | | | — | |
| Total Long-term Risk Management Liabilities | | 436.7 | | | — | | | 6.9 | | | 0.2 | | | 43.9 | | | 1.0 | | | 1.7 | |
| | | | | | | | | | | | | | |
| Total Liabilities | | $ | 1,083.4 | | | $ | 2.9 | | | $ | 25.4 | | | $ | 5.6 | | | $ | 50.8 | | | $ | 30.7 | | | $ | 16.6 | |
| | | | | | | | | | | | | | |
| Total MTM Derivative Contract Net Assets (Liabilities) Recognized | | $ | 84.0 | | | $ | (2.9) | | | $ | (0.5) | | | $ | 36.5 | | | $ | (50.8) | | | $ | (11.0) | | | $ | (4.1) | |
Offsetting Assets and Liabilities
The following tables show the net amounts of assets and liabilities presented on the balance sheets. The gross amounts offset include counterparty netting of risk management and hedging contracts and associated cash collateral in accordance with accounting guidance for “Derivatives and Hedging.” All derivative contracts subject to a master netting arrangement or similar agreement are offset on the balance sheets.
| | | | | | | | | | | | | | | | | | | | | | | | | | | | | | | | | | | | | | | | | | | | |
| | December 31, 2024 |
| AEP | | AEP Texas | | APCo | | I&M | | OPCo | | PSO | | SWEPCo |
| Assets: | | (in millions) |
| Current Risk Management Assets | | | | | | | | | | | | | | |
| Gross Amounts Recognized | | $ | 479.1 | | | $ | — | | | $ | 40.2 | | | $ | 28.5 | | | $ | — | | | $ | 22.3 | | | $ | 19.1 | |
| Gross Amounts Offset | | (268.7) | | | — | | | (4.5) | | | (10.1) | | | — | | | (1.7) | | | (1.0) | |
| Net Amounts Presented | | 210.4 | | | — | | | 35.7 | | | 18.4 | | | — | | | 20.6 | | | 18.1 | |
| | | | | | | | | | | | | | |
| Long-term Risk Management Assets | | | | | | | | | | | | | | |
| Gross Amounts Recognized | | 560.0 | | | — | | | 2.0 | | | 1.2 | | | — | | | 1.6 | | | — | |
| Gross Amounts Offset | | (270.9) | | | — | | | (0.6) | | | (1.2) | | | — | | | (0.2) | | | — | |
| Net Amounts Presented | | 289.1 | | | — | | | 1.4 | | | — | | | — | | | 1.4 | | | — | |
| | | | | | | | | | | | | | |
| Total Assets | | $ | 499.5 | | | $ | — | | | $ | 37.1 | | | $ | 18.4 | | | $ | — | | | $ | 22.0 | | | $ | 18.1 | |
| | | | | | | | | | | | | | |
| Liabilities: | | | | |
| Current Risk Management Liabilities | | | | | | | | | | | | | | |
| Gross Amounts Recognized | | $ | 351.7 | | | $ | 0.3 | | | $ | 6.6 | | | $ | 10.5 | | | $ | 7.5 | | | $ | 7.6 | | | $ | 3.4 | |
| Gross Amounts Offset | | (251.7) | | | (0.3) | | | (4.6) | | | (10.2) | | | (0.2) | | | (1.8) | | | (1.1) | |
| Net Amounts Presented | | 100.0 | | | — | | | 2.0 | | | 0.3 | | | 7.3 | | | 5.8 | | | 2.3 | |
| | | | | | | | | | | | | | |
| Long-term Risk Management Liabilities | | | | | | | | | | | | | | |
| Gross Amounts Recognized | | 428.7 | | | — | | | 0.8 | | | 2.1 | | | 40.2 | | | 0.2 | | | — | |
| Gross Amounts Offset | | (204.3) | | | — | | | (0.6) | | | (1.7) | | | — | | | (0.2) | | | — | |
| Net Amounts Presented | | 224.4 | | | — | | | 0.2 | | | 0.4 | | | 40.2 | | | — | | | — | |
| | | | | | | | | | | | | | |
| Total Liabilities | | $ | 324.4 | | | $ | — | | | $ | 2.2 | | | $ | 0.7 | | | $ | 47.5 | | | $ | 5.8 | | | $ | 2.3 | |
| | | | | | | | | | | | | | |
| Total MTM Derivative Contract Net Assets (Liabilities) | | $ | 175.1 | | | $ | — | | | $ | 34.9 | | | $ | 17.7 | | | $ | (47.5) | | | $ | 16.2 | | | $ | 15.8 | |
| | | | | | | | | | | | | | | | | | | | | | | | | | | | | | | | | | | | | | | | | | | | |
| | December 31, 2023 |
| AEP | | AEP Texas | | APCo | | I&M | | OPCo | | PSO | | SWEPCo |
| Assets: | | (in millions) |
| Current Risk Management Assets | | | | | | | | | | | | | | |
| Gross Amounts Recognized | | $ | 611.8 | | | $ | — | | | $ | 24.6 | | | $ | 30.1 | | | $ | — | | | $ | 19.7 | | | $ | 12.0 | |
| Gross Amounts Offset | | (394.3) | | | — | | | (2.2) | | | (2.3) | | | — | | | (0.7) | | | (0.4) | |
| Net Amounts Presented | | 217.5 | | | — | | | 22.4 | | | 27.8 | | | — | | | 19.0 | | | 11.6 | |
| | | | | | | | | | | | | | |
| Long-term Risk Management Assets | | | | | | | | | | | | | | |
| Gross Amounts Recognized | | 555.6 | | | — | | | 0.3 | | | 12.0 | | | — | | | — | | | 0.5 | |
| Gross Amounts Offset | | (234.4) | | | — | | | (0.3) | | | (0.2) | | | — | | | — | | | (0.5) | |
| Net Amounts Presented | | 321.2 | | | — | | | — | | | 11.8 | | | — | | | — | | | — | |
| | | | | | | | | | | | | | |
| Total Assets | | $ | 538.7 | | | $ | — | | | $ | 22.4 | | | $ | 39.6 | | | $ | — | | | $ | 19.0 | | | $ | 11.6 | |
| | | | | | | | | | | | | | |
| Liabilities: | | | | |
| Current Risk Management Liabilities | | | | | | | | | | | | | | |
| Gross Amounts Recognized | | $ | 646.7 | | | $ | 2.9 | | | $ | 18.5 | | | $ | 5.4 | | | $ | 6.9 | | | $ | 29.7 | | | $ | 14.9 | |
| Gross Amounts Offset | | (417.1) | | | (0.2) | | | (2.6) | | | (3.4) | | | (0.1) | | | (0.8) | | | (0.5) | |
| Net Amounts Presented | | 229.6 | | | 2.7 | | | 15.9 | | | 2.0 | | | 6.8 | | | 28.9 | | | 14.4 | |
| | | | | | | | | | | | | | |
| Long-term Risk Management Liabilities | | | | | | | | | | | | | | |
| Gross Amounts Recognized | | 436.7 | | | — | | | 6.9 | | | 0.2 | | | 43.9 | | | 1.0 | | | 1.7 | |
| Gross Amounts Offset | | (194.9) | | | — | | | (0.3) | | | (0.2) | | | — | | | — | | | (0.5) | |
| Net Amounts Presented | | 241.8 | | | — | | | 6.6 | | | — | | | 43.9 | | | 1.0 | | | 1.2 | |
| | | | | | | | | | | | | | |
| Total Liabilities | | $ | 471.4 | | | $ | 2.7 | | | $ | 22.5 | | | $ | 2.0 | | | $ | 50.7 | | | $ | 29.9 | | | $ | 15.6 | |
| | | | | | | | | | | | | | |
| Total MTM Derivative Contract Net Assets (Liabilities) | | $ | 67.3 | | | $ | (2.7) | | | $ | (0.1) | | | $ | 37.6 | | | $ | (50.7) | | | $ | (10.9) | | | $ | (4.0) | |
The tables below present the Registrants’ amount of gain (loss) recognized on risk management contracts:
Amount of Gain (Loss) Recognized on Risk Management Contracts
| | | | | | | | | | | | | | | | | | | | | | | | | | | | | | | | | | | | | | | | | | | | |
| | Year Ended December 31, 2024 |
| Location of Gain (Loss) | | AEP | | AEP Texas | | APCo | | I&M | | OPCo | | PSO | | SWEPCo |
| | (in millions) |
| Vertically Integrated Utilities Revenues | | $ | (23.7) | | | $ | — | | | $ | — | | | $ | — | | | $ | — | | | $ | — | | | $ | — | |
| | | | | | | | | | | | | | |
| Generation & Marketing Revenues | | (171.5) | | | — | | | — | | | — | | | — | | | — | | | — | |
| Electric Generation, Transmission and Distribution Revenues | | — | | | — | | | 0.2 | | | (23.9) | | | — | | | — | | | — | |
| | | | | | | | | | | | | | |
| | | | | | | | | | | | | | |
| Purchased Electricity, Fuel and Other Consumables Used for Electric Generation | | 3.0 | | | — | | | 2.7 | | | 0.2 | | | — | | | — | | | — | |
| Other Operation | | (0.2) | | | — | | | — | | | — | | | — | | | — | | | (0.1) | |
| Maintenance | | (0.2) | | | (0.1) | | | — | | | — | | | — | | | — | | | — | |
| Regulatory Assets (a) | | 73.0 | | | (0.1) | | | 21.7 | | | 2.8 | | | (1.8) | | | 26.0 | | | 14.2 | |
| Regulatory Liabilities (a) | | 270.7 | | | — | | | 53.4 | | | 13.4 | | | — | | | 93.6 | | | 95.0 | |
| Total Gain (Loss) on Risk Management Contracts | | $ | 151.1 | | | $ | (0.2) | | | $ | 78.0 | | | $ | (7.5) | | | $ | (1.8) | | | $ | 119.6 | | | $ | 109.1 | |
| | | | | | | | | | | | | | | | | | | | | | | | | | | | | | | | | | | | | | | | | | | | |
| | Year Ended December 31, 2023 |
| Location of Gain (Loss) | | AEP | | AEP Texas | | APCo | | I&M | | OPCo | | PSO | | SWEPCo |
| | (in millions) |
| Vertically Integrated Utilities Revenues | | $ | 24.6 | | | $ | — | | | $ | — | | | $ | — | | | $ | — | | | $ | — | | | $ | — | |
| | | | | | | | | | | | | | |
| Generation & Marketing Revenues | | (423.8) | | | — | | | — | | | — | | | — | | | — | | | — | |
| Electric Generation, Transmission and Distribution Revenues | | — | | | — | | | 0.1 | | | 24.5 | | | — | | | — | | | — | |
| | | | | | | | | | | | | | |
| | | | | | | | | | | | | | |
| Purchased Electricity, Fuel and Other Consumables Used for Electric Generation | | 2.5 | | | — | | | 2.3 | | | 0.1 | | | — | | | — | | | — | |
| Other Operation | | (0.2) | | | (0.1) | | | — | | | — | | | — | | | — | | | — | |
| Maintenance | | (0.8) | | | (0.3) | | | (0.1) | | | (0.1) | | | (0.1) | | | (0.1) | | | (0.2) | |
| Regulatory Assets (a) | | (94.8) | | | (0.2) | | | (21.9) | | | (3.1) | | | (14.0) | | | (29.8) | | | (15.5) | |
| Regulatory Liabilities (a) | | 169.7 | | | — | | | 1.0 | | | 7.8 | | | — | | | 88.7 | | | 70.7 | |
| Total Gain (Loss) on Risk Management Contracts | | $ | (322.8) | | | $ | (0.6) | | | $ | (18.6) | | | $ | 29.2 | | | $ | (14.1) | | | $ | 58.8 | | | $ | 55.0 | |
| | | | | | | | | | | | | | | | | | | | | | | | | | | | | | | | | | | | | | | | | | | | |
| | Year Ended December 31, 2022 |
| Location of Gain (Loss) | | AEP | | AEP Texas | | APCo | | I&M | | OPCo | | PSO | | SWEPCo |
| | (in millions) |
| Vertically Integrated Utilities Revenues | | $ | 11.1 | | | $ | — | | | $ | — | | | $ | — | | | $ | — | | | $ | — | | | $ | — | |
| | | | | | | | | | | | | | |
| Generation & Marketing Revenues | | 313.8 | | | — | | | — | | | — | | | — | | | — | | | — | |
| Electric Generation, Transmission and Distribution Revenues | | — | | | — | | | 0.5 | | | 10.6 | | | — | | | — | | | — | |
| | | | | | | | | | | | | | |
| Purchased Electricity, Fuel and Other Consumables Used for Electric Generation | | 5.0 | | | — | | | 4.5 | | | 0.1 | | | — | | | 0.2 | | | — | |
| Other Operation | | 4.8 | | | 1.5 | | | 0.4 | | | 0.5 | | | 0.8 | | | 0.6 | | | 0.8 | |
| Maintenance | | 6.7 | | | 1.8 | | | 0.9 | | | 0.6 | | | 1.2 | | | 0.8 | | | 1.1 | |
| Regulatory Assets (a) | | 52.6 | | | 0.1 | | | (0.1) | | | (0.8) | | | 52.1 | | | 3.6 | | | (2.1) | |
| Regulatory Liabilities (a) | | 299.7 | | | (0.6) | | | 82.4 | | | 8.6 | | | 3.7 | | | 98.5 | | | 77.9 | |
| Total Gain on Risk Management Contracts | | $ | 693.7 | | | $ | 2.8 | | | $ | 88.6 | | | $ | 19.6 | | | $ | 57.8 | | | $ | 103.7 | | | $ | 77.7 | |
(a)Represents realized and unrealized gains and losses subject to regulatory accounting treatment recorded as either current or noncurrent on the balance sheets.
Certain qualifying derivative instruments have been designated as normal purchase or normal sale contracts, as provided in the accounting guidance for “Derivatives and Hedging.” Derivative contracts that have been designated as normal purchases or normal sales under that accounting guidance are not subject to MTM accounting treatment and are recognized on the statements of income on an accrual basis.
The accounting for the changes in the fair value of a derivative instrument depends on whether it qualifies for and has been designated as part of a hedging relationship and further, on the type of hedging relationship. Depending on the exposure, management designates a hedging instrument as a fair value hedge or a cash flow hedge.
For contracts that have not been designated as part of a hedging relationship, the accounting for changes in fair value depends on whether the derivative instrument is held for trading purposes. Unrealized and realized gains and losses on derivative instruments held for trading purposes are included in revenues on a net basis on the statements of income. Unrealized and realized gains and losses on derivative instruments not held for trading purposes are included in revenues or expenses on the statements of income depending on the relevant facts and circumstances. Certain derivatives that economically hedge future commodity risk are recorded in the same line item on the statements of income as that of the associated risk being hedged. However, unrealized and some realized gains and losses in regulated jurisdictions for both trading and non-trading derivative instruments are recorded as regulatory assets (for losses) or regulatory liabilities (for gains) in accordance with the accounting guidance for “Regulated Operations.”
Accounting for Fair Value Hedging Strategies (Applies to AEP)
For fair value hedges (i.e. hedging the exposure to changes in the fair value of an asset, liability or an identified portion thereof attributable to a particular risk), the gain or loss on the derivative instrument as well as the offsetting gain or loss on the hedged item associated with the hedged risk impacts net income during the period of change.
AEP records realized and unrealized gains or losses on interest rate swaps that are designated and qualify for fair value hedge accounting treatment and any offsetting changes in the fair value of the debt being hedged in Interest Expense on the statements of income.
The following table shows the impacts recognized on the balance sheets related to the hedged items in fair value hedging relationships:
| | | | | | | | | | | | | | | | | | | | | | | | | | |
| | Carrying Amount of the Hedged Liabilities | | Cumulative Amount of Fair Value Hedging Adjustment Included in the Carrying Amount of the Hedged Liabilities |
| | December 31, 2024 | | December 31, 2023 | | December 31, 2024 | | December 31, 2023 |
| | (in millions) |
| Long-term Debt (a) (b) | | $ | (898.6) | | | $ | (878.2) | | | $ | 49.3 | | | $ | 68.4 | |
(a)Amounts included within Noncurrent Liabilities line item Long-term Debt and Current Liabilities line item Long-term Debt Due Within One Year on the balance sheet.
(b)Amounts include $(22) million and $(30) million as of December 31, 2024 and 2023, respectively, for the fair value hedge adjustment of hedged debt obligations for which hedge accounting has been discontinued.
The pretax effects of fair value hedge accounting on income were as follows:
| | | | | | | | | | | | | | | | | |
| Years Ended December 31, |
| 2024 | | 2023 | | 2022 |
| (in millions) |
| Gain (Loss) on Interest Rate Contracts: | | | | | |
| Fair Value Hedging Instruments (a) | $ | 26.8 | | | $ | 29.0 | | | $ | (90.4) | |
| Fair Value Portion of Long-term Debt (a) | (26.8) | | | (29.0) | | | 90.4 | |
(a)Gain (Loss) is included in Interest Expense on the statements of income.
Accounting for Cash Flow Hedging Strategies (Applies to AEP, AEP Texas, APCo, I&M, PSO and SWEPCo)
For cash flow hedges (i.e. hedging the exposure to variability in expected future cash flows that is attributable to a particular risk), the Registrants initially report the gain or loss on the derivative instrument as a component of Accumulated Other Comprehensive Income (Loss) on the balance sheets until the period the hedged item affects net income.
Realized gains and losses on derivative contracts for the purchase and sale of power designated as cash flow hedges are included in Total Revenues or Purchased Electricity, Fuel and Other Consumables Used for Electric Generation on the statements of income or in Regulatory Assets or Regulatory Liabilities on the balance sheets, depending on the specific nature of the risk being hedged. During the years ended 2024, 2023 and 2022, AEP applied cash flow hedging to outstanding power derivatives and the Registrant Subsidiaries did not.
The Registrants reclassify gains and losses on interest rate derivative hedges related to debt financings from Accumulated Other Comprehensive Income (Loss) on the balance sheets into Interest Expense on the statements of income in those periods in which hedged interest payments occur. During the year ended 2024, AEP, AEP Texas and PSO applied cash flow hedging to outstanding interest rate derivatives and the other Registrant Subsidiaries did not. During the year ended 2023, AEP, AEP Texas, I&M, PSO and SWEPCo applied cash flow hedging to outstanding interest rate derivatives and the other Registrant Subsidiaries did not. During the year ended 2022, AEP and PSO applied cash flow hedging to outstanding interest rate derivatives and the other Registrant Subsidiaries did not.
For details on effective cash flow hedges included in Accumulated Other Comprehensive Income (Loss) on the balance sheets and the reasons for changes in cash flow hedges, see Note 3 - Comprehensive Income.
Cash flow hedges included in Accumulated Other Comprehensive Income (Loss) on the balance sheets were:
| | | | | | | | | | | | | | | | | | | | | | | | | | | | | | | | | | | | | | | | | | | | | | | | | | |
| | Impact of Cash Flow Hedges on the Registrants’ Balance Sheets |
| | | | | | | | | | | | | | | | |
| | December 31, 2024 | | December 31, 2023 |
| | | | | | Portion Expected to | | | | | | Portion Expected to |
| | AOCI | | be Reclassed to | | AOCI | | be Reclassed to |
| | Gain (Loss) | | Net Income During | | Gain (Loss) | | Net Income During |
| | Net of Tax | | the Next Twelve Months | | Net of Tax | | the Next Twelve Months |
| | Commodity | | Interest Rate | | Commodity | | Interest Rate | | Commodity | | Interest Rate | | Commodity | | Interest Rate |
| | (in millions) |
| AEP | | $ | 98.5 | | | $ | 3.3 | | | $ | 33.9 | | | $ | 2.8 | | | $ | 104.9 | | | $ | (8.1) | | | $ | 38.3 | | | $ | 3.2 | |
| AEP Texas | | — | | | 6.3 | | | — | | | 0.7 | | | — | | | 0.5 | | | — | | | 0.2 | |
| APCo | | — | | | 5.1 | | | — | | | 0.8 | | | — | | | 5.9 | | | — | | | 0.8 | |
| I&M | | — | | | (5.1) | | | — | | | (0.4) | | | — | | | (5.5) | | | — | | | (0.4) | |
| | | | | | | | | | | | | | | | |
| PSO | | — | | | 3.6 | | | — | | | 0.2 | | | — | | | (0.2) | | | — | | | — | |
| SWEPCo | | — | | | 1.0 | | | — | | | 0.3 | | | — | | | 1.3 | | | — | | | 0.3 | |
As of December 31, 2024 the maximum length of time that AEP is hedging its exposure to variability in future cash flows related to forecasted transactions is approximately 10 years.
The actual amounts reclassified from Accumulated Other Comprehensive Income (Loss) to Net Income can differ from the estimate above due to market price changes.
Credit Risk
Management mitigates credit risk in wholesale marketing and trading activities by assessing the creditworthiness of potential counterparties before entering into transactions with them and continuing to evaluate their creditworthiness on an ongoing basis. Management uses credit agency ratings and current market-based qualitative and quantitative data as well as financial statements to assess the financial health of counterparties on an ongoing basis.
Master agreements are typically used to facilitate the netting of cash flows associated with a single counterparty and may include collateral requirements. Collateral requirements in the form of cash, letters of credit and parental/affiliate guarantees may be obtained as security from counterparties in order to mitigate credit risk. Some master agreements include margining, which requires a counterparty to post cash or letters of credit in the event exposure exceeds the established threshold. The
threshold represents an unsecured credit limit which may be supported by a parental/affiliate guaranty, as determined in accordance with AEP’s credit policy. In addition, master agreements allow for termination and liquidation of all positions in the event of a default including a failure or inability to post collateral when required.
Credit-Risk-Related Contingent Features
Credit Downgrade Triggers (Applies to AEP)
A limited number of derivative contracts include collateral triggering events, which include a requirement to maintain certain credit ratings. On an ongoing basis, AEP’s risk management organization assesses the appropriateness of these collateral triggering events in contracts. The Registrants have not experienced a downgrade below a specified credit rating threshold that would require the posting of additional collateral. The total exposure of AEP’s derivative contracts with collateral triggering events in a net liability position was immaterial as of December 31, 2024 and 2023. The Registrant Subsidiaries had no derivative contracts with collateral triggering events in a net liability position as of December 31, 2024 and 2023.
Cross-Acceleration Triggers (Applies to AEP)
Certain interest rate derivative contracts contain cross-acceleration provisions that, if triggered, would permit the counterparty to declare a default and require settlement of the outstanding payable. These cross-acceleration provisions could be triggered if there was a non-performance event by the Registrants under any of their outstanding debt of at least $50 million and the lender on that debt has accelerated the entire repayment obligation. On an ongoing basis, AEP’s risk management organization assesses the appropriateness of these cross-acceleration provisions in contracts. AEP had derivative contracts with cross-acceleration provisions in a net liability position of $72 million and $107 million and no cash collateral posted as of December 31, 2024 and 2023, respectively. If a cross-acceleration provision would have been triggered, settlement at fair value would have been required. The Registrant Subsidiaries’ derivative contracts with cross-acceleration provisions outstanding as of December 31, 2024 and 2023 were immaterial.
Cross-Default Triggers (Applies to AEP, APCo, PSO and SWEPCo)
In addition, a majority of non-exchange traded commodity contracts contain cross-default provisions that, if triggered, would permit the counterparty to declare a default and require settlement of the outstanding payable. These cross-default provisions could be triggered if there was a non-performance event by Parent or the obligor under outstanding debt or a third-party obligation that is $50 million or greater. On an ongoing basis, AEP’s risk management organization assesses the appropriateness of these cross-default provisions in the contracts. AEP had derivative contracts with cross-default provisions in a net liability position of $164 million and $242 million and no cash collateral posted as of December 31, 2024 and 2023, respectively, after considering contractual netting arrangements. APCo, PSO and SWEPCo had derivative contracts with cross-default provisions in a net liability position of $1 million, $4 million and $2 million, respectively, and no cash collateral posted as of December 31, 2024. APCo, PSO and SWEPCo had derivative contracts with cross-default provisions in a net liability position of $22 million, $29 million and $15 million, respectively, and no cash collateral posted as of December 31, 2023. If a cross-default provision would have been triggered, settlement at fair value would have been required. The other Registrant Subsidiaries had no derivative contracts with cross-default provisions in a net liability position as of December 31, 2024 and 2023.
11. FAIR VALUE MEASUREMENTS
The disclosures in this note apply to all Registrants except AEPTCo unless indicated otherwise.
Fair Value Measurements of Long-term Debt (Applies to all Registrants)
The fair values of Long-term Debt are based on quoted market prices, without credit enhancements, for the same or similar issues and the current interest rates offered for instruments with similar maturities classified as Level 2 measurement inputs. These instruments are not marked-to-market. The estimates presented are not necessarily indicative of the amounts that could be realized in a current market exchange. The fair value of AEP’s Equity Units (Level 1) are valued based on publicly-traded securities issued by AEP.
The book values and fair values of Long-term Debt are summarized in the following table:
| | | | | | | | | | | | | | | | | | | | | | | | | | |
| | December 31, |
| | 2024 | | 2023 |
| Company | | Book Value | | Fair Value | | Book Value | | Fair Value |
| | (in millions) |
| AEP | | $ | 42,642.8 | | | $ | 38,964.7 | | | $ | 40,143.2 | | | $ | 37,325.7 | |
| AEP Texas | | 6,441.6 | | | 5,831.4 | | | 5,889.8 | | | 5,400.7 | |
| AEPTCo | | 5,768.1 | | | 4,853.1 | | | 5,414.4 | | | 4,796.9 | |
| APCo | | 5,660.3 | | | 5,346.0 | | | 5,588.3 | | | 5,390.1 | |
| I&M | | 3,494.3 | | | 3,153.8 | | | 3,499.4 | | | 3,291.6 | |
| OPCo | | 3,715.7 | | | 3,203.4 | | | 3,366.8 | | | 2,992.1 | |
| PSO | | 2,855.6 | | | 2,562.1 | | | 2,384.6 | | | 2,154.3 | |
| SWEPCo | | 3,980.8 | | | 3,431.5 | | | 3,646.9 | | | 3,209.7 | |
Fair Value Measurements of Other Temporary Investments (Applies to AEP)
Other Temporary Investments include marketable securities that management intends to hold for less than one year and investments by AEP’s protected cell of EIS. See “Other Temporary Investments” section of Note 1 for additional information.
The following is a summary of Other Temporary Investments and Restricted Cash:
| | | | | | | | | | | | | | | | | | | | | | | | | | |
| | December 31, 2024 |
| | | | Gross | | Gross | | |
| | | | Unrealized | | Unrealized | | Fair |
| Other Temporary Investments and Restricted Cash | | Cost | | Gains | | Losses | | Value |
| | (in millions) |
| Restricted Cash (a) | | $ | 43.1 | | | $ | — | | | $ | — | | | $ | 43.1 | |
| Other Cash Deposits | | 13.9 | | | — | | | — | | | 13.9 | |
| Fixed Income Securities – Mutual Funds (b) | | 167.2 | | | — | | | (5.3) | | | 161.9 | |
| Equity Securities – Mutual Funds | | 12.7 | | | 26.9 | | | — | | | 39.6 | |
| Total Other Temporary Investments and Restricted Cash | | $ | 236.9 | | | $ | 26.9 | | | $ | (5.3) | | | $ | 258.5 | |
| | | | | | | | | | | | | | | | | | | | | | | | | | |
| | December 31, 2023 |
| | | | Gross | | Gross | | |
| | | | Unrealized | | Unrealized | | Fair |
| Other Temporary Investments and Restricted Cash | | Cost | | Gains | | Losses | | Value |
| | (in millions) |
| Restricted Cash (a) | | $ | 48.9 | | | $ | — | | | $ | — | | | $ | 48.9 | |
| Other Cash Deposits | | 13.9 | | | — | | | — | | | 13.9 | |
| Fixed Income Securities – Mutual Funds (b) | | 165.9 | | | — | | | (6.2) | | | 159.7 | |
| Equity Securities – Mutual Funds | | 14.8 | | | 25.9 | | | — | | | 40.7 | |
| Total Other Temporary Investments and Restricted Cash | | $ | 243.5 | | | $ | 25.9 | | | $ | (6.2) | | | $ | 263.2 | |
(a)Primarily represents amounts held for the repayment of debt.
(b)Primarily short and intermediate maturities which may be sold and do not contain maturity dates.
The following table provides the activity for fixed income and equity securities within Other Temporary Investments:
| | | | | | | | | | | | | | | | | | | | |
| | Years Ended December 31, |
| | 2024 | | 2023 | | 2022 |
| | (in millions) |
| Proceeds from Investment Sales | | $ | 26.8 | | | $ | 7.6 | | | $ | 30.2 | |
| Purchases of Investments | | 20.1 | | | 18.5 | | | 18.8 | |
| Gross Realized Gains on Investment Sales | | 6.3 | | | 1.1 | | | 6.1 | |
| Gross Realized Losses on Investment Sales | | 0.8 | | | 0.3 | | | 1.3 | |
Fair Value Measurements of Trust Assets for Decommissioning and SNF Disposal (Applies to AEP and I&M)
Securities held in trust funds for decommissioning nuclear facilities and for the disposal of SNF are recorded at fair value. See “Nuclear Trust Funds” section of Note 1 for additional information.
The following is a summary of nuclear trust fund investments:
| | | | | | | | | | | | | | | | | | | | | | | | | | | | | | | | | | | | | | | | | | | | | | | |
| December 31, |
| 2024 | | 2023 |
| | | Gross | | Gross | | Other-Than- | | | | Gross | | Gross | | Other-Than- |
| Fair | | Unrealized | | Unrealized | | Temporary | | Fair | | Unrealized | | Unrealized | | Temporary |
| Value | | Gains | | Losses | | Impairments | | Value | | Gains | | Losses | | Impairments |
| (in millions) |
| Cash and Cash Equivalents | $ | 23.3 | | | $ | — | | | $ | — | | | $ | — | | | $ | 16.8 | | | $ | — | | | $ | — | | | $ | — | |
| Fixed Income Securities: | | | | | | | | | | | | | | | |
| United States Government | 1,322.8 | | | 8.2 | | | (5.3) | | | (20.2) | | | 1,273.0 | | | 28.6 | | | (3.9) | | | (33.2) | |
| Corporate Debt | 211.3 | | | 0.7 | | | (9.8) | | | (5.8) | | | 132.1 | | | 4.8 | | | (5.2) | | | (8.6) | |
| State and Local Government | — | | | — | | | — | | | — | | | 1.7 | | | — | | | — | | | — | |
| Subtotal Fixed Income Securities | 1,534.1 | | | 8.9 | | | (15.1) | | | (26.0) | | | 1,406.8 | | | 33.4 | | | (9.1) | | | (41.8) | |
| Equity Securities - Domestic | 2,837.7 | | | 2,288.9 | | | (0.4) | | | — | | | 2,436.6 | | | 1,869.5 | | | (0.9) | | | — | |
| Spent Nuclear Fuel and Decommissioning Trusts | $ | 4,395.1 | | | $ | 2,297.8 | | | $ | (15.5) | | | $ | (26.0) | | | $ | 3,860.2 | | | $ | 1,902.9 | | | $ | (10.0) | | | $ | (41.8) | |
The following table provides the securities activity within the decommissioning and SNF trusts:
| | | | | | | | | | | | | | | | | |
| Years Ended December 31, |
| 2024 | | 2023 | | 2022 |
| (in millions) |
| Proceeds from Investment Sales | $ | 2,851.2 | | | $ | 2,787.5 | | | $ | 2,713.6 | |
| Purchases of Investments | 2,902.4 | | | 2,845.1 | | | 2,765.4 | |
| Gross Realized Gains on Investment Sales | 125.5 | | | 99.0 | | | 52.4 | |
| Gross Realized Losses on Investment Sales | 11.5 | | | 26.6 | | | 42.6 | |
The base cost of fixed income securities was $1.5 billion and $1.4 billion as of December 31, 2024 and 2023, respectively. The base cost of equity securities was $549 million and $568 million as of December 31, 2024 and 2023, respectively.
The fair value of fixed income securities held in the nuclear trust funds, summarized by contractual maturities, as of December 31, 2024 was as follows:
| | | | | |
| Fair Value of Fixed |
| Income Securities |
| (in millions) |
| Within 1 year | $ | 376.4 | |
| After 1 year through 5 years | 598.8 | |
| After 5 years through 10 years | 236.2 | |
| After 10 years | 322.7 | |
| Total | $ | 1,534.1 | |
Fair Value Measurements of Financial Assets and Liabilities
For a discussion of fair value accounting and the classification of assets and liabilities within the fair value hierarchy, see the “Fair Value Measurements of Assets and Liabilities” section of Note 1.
The following tables set forth, by level within the fair value hierarchy, the Registrants’ financial assets and liabilities that were accounted for at fair value on a recurring basis. As required by the accounting guidance for “Fair Value Measurements and Disclosures,” financial assets and liabilities are classified in their entirety based on the lowest level of input that is significant to the fair value measurement. Management’s assessment of the significance of a particular input to the fair value measurement requires judgment and may affect the valuation of fair value assets and liabilities and their placement within the fair value hierarchy levels. There have not been any significant changes in management’s valuation techniques.
AEP
| | | | | | | | | | | | | | | | | | | | | | | | | | | | | | | | |
| | December 31, 2024 |
| | Level 1 | | Level 2 | | Level 3 | | Other | | Total |
| Assets: | | (in millions) |
| | | | | | | | | | |
| | | | | | | | | | |
| | | | | | | | | | |
| Other Temporary Investments and Restricted Cash | | | | | | | | | | |
| Restricted Cash | | $ | 43.1 | | | $ | — | | | $ | — | | | $ | — | | | $ | 43.1 | |
| Other Cash Deposits (a) | | — | | | — | | | — | | | 13.9 | | | 13.9 | |
| Fixed Income Securities – Mutual Funds | | 161.9 | | | — | | | — | | | — | | | 161.9 | |
| Equity Securities – Mutual Funds (b) | | 39.6 | | | — | | | — | | | — | | | 39.6 | |
| Total Other Temporary Investments and Restricted Cash | | 244.6 | | | — | | | — | | | 13.9 | | | 258.5 | |
| | | | | | | | | | |
| Risk Management Assets | | | | | | | | | | |
| Risk Management Commodity Contracts (c) (d) | | 2.9 | | | 597.3 | | | 291.6 | | | (517.2) | | | 374.6 | |
| Cash Flow Hedges: | | | | | | | | | | |
| Commodity Hedges (c) | | — | | | 115.6 | | | 21.9 | | | (12.6) | | | 124.9 | |
| | | | | | | | | | |
| | | | | | | | | | |
| Total Risk Management Assets | | 2.9 | | | 712.9 | | | 313.5 | | | (529.8) | | | 499.5 | |
| | | | | | | | | | |
| Spent Nuclear Fuel and Decommissioning Trusts | | | | | | | | | | |
| Cash and Cash Equivalents (e) | | 9.6 | | | — | | | — | | | 13.7 | | | 23.3 | |
| Fixed Income Securities: | | | | | | | | | | |
| United States Government | | — | | | 1,322.8 | | | — | | | — | | | 1,322.8 | |
| Corporate Debt | | — | | | 211.3 | | | — | | | — | | | 211.3 | |
| State and Local Government | | — | | | — | | | — | | | — | | | — | |
| Subtotal Fixed Income Securities | | — | | | 1,534.1 | | | — | | | — | | | 1,534.1 | |
| Equity Securities – Domestic (b) | | 2,837.7 | | | — | | | — | | | — | | | 2,837.7 | |
| Total Spent Nuclear Fuel and Decommissioning Trusts | | 2,847.3 | | | 1,534.1 | | | — | | | 13.7 | | | 4,395.1 | |
| | | | | | | | | | |
| | | | | | | | | | |
| | | | | | | | | | |
| Total Assets | | $ | 3,094.8 | | | $ | 2,247.0 | | | $ | 313.5 | | | $ | (502.2) | | | $ | 5,153.1 | |
| | | | | | | | | | |
| Liabilities: | | | | | | | | | | |
| | | | | | | | | | |
| Risk Management Liabilities | | | | | | | | | | |
| Risk Management Commodity Contracts (c) (d) | | $ | 4.4 | | | $ | 534.1 | | | $ | 147.7 | | | $ | (433.6) | | | $ | 252.6 | |
| Cash Flow Hedges: | | | | | | | | | | |
| Commodity Hedges (c) | | — | | | 12.6 | | | 0.2 | | | (12.6) | | | 0.2 | |
| | | | | | | | | | |
| Fair Value Hedges | | — | | | 71.6 | | | — | | | — | | | 71.6 | |
| Total Risk Management Liabilities | | $ | 4.4 | | | $ | 618.3 | | | $ | 147.9 | | | $ | (446.2) | | | $ | 324.4 | |
| | | | | | | | | | | | | | | | | | | | | | | | | | | | | | | | |
| | December 31, 2023 |
| | Level 1 | | Level 2 | | Level 3 | | Other | | Total |
| Assets: | | (in millions) |
| | | | | | | | | | |
| | | | | | | | | | |
| | | | | | | | | | |
| Other Temporary Investments and Restricted Cash | | | | | | | | | | |
| Restricted Cash | | $ | 48.9 | | | $ | — | | | $ | — | | | $ | — | | | $ | 48.9 | |
| Other Cash Deposits (a) | | — | | | — | | | — | | | 13.9 | | | 13.9 | |
| Fixed Income Securities – Mutual Funds | | 159.7 | | | — | | | — | | | — | | | 159.7 | |
| Equity Securities – Mutual Funds (b) | | 40.7 | | | — | | | — | | | — | | | 40.7 | |
| Total Other Temporary Investments and Restricted Cash | | 249.3 | | | — | | | — | | | 13.9 | | | 263.2 | |
| | | | | | | | | | |
| Risk Management Assets | | | | | | | | | | |
| Risk Management Commodity Contracts (c) (f) | | 9.7 | | | 736.9 | | | 274.3 | | | (617.0) | | | 403.9 | |
| Cash Flow Hedges: | | | | | | | | | | |
| Commodity Hedges (c) | | — | | | 123.5 | | | 19.8 | | | (8.5) | | | 134.8 | |
| | | | | | | | | | |
| | | | | | | | | | |
| Total Risk Management Assets | | 9.7 | | | 860.4 | | | 294.1 | | | (625.5) | | | 538.7 | |
| | | | | | | | | | |
| Spent Nuclear Fuel and Decommissioning Trusts | | | | | | | | | | |
| Cash and Cash Equivalents (e) | | 7.8 | | | — | | | — | | | 9.0 | | | 16.8 | |
| Fixed Income Securities: | | | | | | | | | | |
| United States Government | | — | | | 1,273.0 | | | — | | | — | | | 1,273.0 | |
| Corporate Debt | | — | | | 132.1 | | | — | | | — | | | 132.1 | |
| State and Local Government | | — | | | 1.7 | | | — | | | — | | | 1.7 | |
| Subtotal Fixed Income Securities | | — | | | 1,406.8 | | | — | | | — | | | 1,406.8 | |
| Equity Securities – Domestic (b) | | 2,436.6 | | | — | | | — | | | — | | | 2,436.6 | |
| Total Spent Nuclear Fuel and Decommissioning Trusts | | 2,444.4 | | | 1,406.8 | | | — | | | 9.0 | | | 3,860.2 | |
| | | | | | | | | | |
| | | | | | | | | | |
| | | | | | | | | | |
| Total Assets | | $ | 2,703.4 | | | $ | 2,267.2 | | | $ | 294.1 | | | $ | (602.6) | | | $ | 4,662.1 | |
| | | | | | | | | | |
| Liabilities: | | | | | | | | | | |
| | | | | | | | | | |
| Risk Management Liabilities | | | | | | | | | | |
| Risk Management Commodity Contracts (c) (f) | | $ | 24.7 | | | $ | 783.8 | | | $ | 154.1 | | | $ | (600.3) | | | $ | 362.3 | |
| Cash Flow Hedges: | | | | | | | | | | |
| Commodity Hedges (c) | | — | | | 9.6 | | | 0.6 | | | (8.5) | | | 1.7 | |
| Interest Rate Hedges | | — | | | 9.0 | | | — | | | — | | | 9.0 | |
| Fair Value Hedges | | — | | | 98.4 | | | — | | | — | | | 98.4 | |
| Total Risk Management Liabilities | | $ | 24.7 | | | $ | 900.8 | | | $ | 154.7 | | | $ | (608.8) | | | $ | 471.4 | |
AEP Texas
| | | | | | | | | | | | | | | | | | | | | | | | | | | | | | | | |
| | December 31, 2024 |
| | Level 1 | | Level 2 | | Level 3 | | Other | | Total |
| Assets: | | (in millions) |
| | | | | | | | | | |
| Restricted Cash for Securitized Funding | | $ | 23.5 | | | $ | — | | | $ | — | | | $ | — | | | $ | 23.5 | |
| | | | | | | | | | |
| | | | | | | | | | |
| | | | | | | | | | |
| | | | | | | | | | |
| | | | | | | | | | |
| | | | | | | | | | |
| Liabilities: | | | | | | | | | | |
| | | | | | | | | | |
| Risk Management Liabilities | | | | | | | | | | |
| Risk Management Commodity Contracts (c) | | $ | — | | | $ | 0.3 | | | $ | — | | | $ | (0.3) | | | $ | — | |
| | | | | | | | | | |
| | | | | | | | | | |
| | | | | | | | | | |
| | | | | | | | | | | | | | | | | | | | | | | | | | | | | | | | |
| | December 31, 2023 |
| | Level 1 | | Level 2 | | Level 3 | | Other | | Total |
| Assets: | | (in millions) |
| | | | | | | | | | |
| Restricted Cash for Securitized Funding | | $ | 34.0 | | | $ | — | | | $ | — | | | $ | — | | | $ | 34.0 | |
| | | | | | | | | | |
| | | | | | | | | | |
| | | | | | | | | | |
| | | | | | | | | | |
| | | | | | | | | | |
| | | | | | | | | | |
| Liabilities: | | | | | | | | | | |
| | | | | | | | | | |
| Risk Management Liabilities | | | | | | | | | | |
| Risk Management Commodity Contracts (c) | | $ | — | | | $ | 0.2 | | | $ | — | | | $ | (0.2) | | | $ | — | |
| Cash Flow Hedges: | | | | | | | | | | |
| Interest Rate Hedges | | — | | | 2.7 | | | — | | | — | | | 2.7 | |
| Total Risk Management Liabilities | | $ | — | | | $ | 2.9 | | | $ | — | | | $ | (0.2) | | | $ | 2.7 | |
APCo
| | | | | | | | | | | | | | | | | | | | | | | | | | | | | | | | |
| | December 31, 2024 |
| | Level 1 | | Level 2 | | Level 3 | | Other | | Total |
| Assets: | | (in millions) |
| | | | | | | | | | |
| Restricted Cash for Securitized Funding | | $ | 16.2 | | | $ | — | | | $ | — | | | $ | — | | | $ | 16.2 | |
| | | | | | | | | | |
| Risk Management Assets | | | | | | | | | | |
| Risk Management Commodity Contracts (c) | | — | | | 6.5 | | | 35.2 | | | (4.6) | | | 37.1 | |
| | | | | | | | | | |
| | | | | | | | | | |
| | | | | | | | | | |
| | | | | | | | | | |
| Total Assets | | $ | 16.2 | | | $ | 6.5 | | | $ | 35.2 | | | $ | (4.6) | | | $ | 53.3 | |
| | | | | | | | | | |
| Liabilities: | | | | | | | | | | |
| | | | | | | | | | |
| Risk Management Liabilities | | | | | | | | | | |
| Risk Management Commodity Contracts (c) | | $ | — | | | $ | 6.9 | | | $ | — | | | $ | (4.7) | | | $ | 2.2 | |
| | | | | | | | | | |
| | | | | | | | | | |
| | | | | | | | | | |
| | | | | | | | | | | | | | | | | | | | | | | | | | | | | | | | |
| | December 31, 2023 |
| | Level 1 | | Level 2 | | Level 3 | | Other | | Total |
| Assets: | | (in millions) |
| | | | | | | | | | |
| Restricted Cash for Securitized Funding | | $ | 14.9 | | | $ | — | | | $ | — | | | $ | — | | | $ | 14.9 | |
| | | | | | | | | | |
| Risk Management Assets | | | | | | | | | | |
| Risk Management Commodity Contracts (c) | | — | | | 1.1 | | | 23.5 | | | (2.2) | | | 22.4 | |
| | | | | | | | | | |
| | | | | | | | | | |
| | | | | | | | | | |
| | | | | | | | | | |
| Total Assets | | $ | 14.9 | | | $ | 1.1 | | | $ | 23.5 | | | $ | (2.2) | | | $ | 37.3 | |
| | | | | | | | | | |
| Liabilities: | | | | | | | | | | |
| | | | | | | | | | |
| Risk Management Liabilities | | | | | | | | | | |
| Risk Management Commodity Contracts (c) | | $ | — | | | $ | 24.0 | | | $ | 1.1 | | | $ | (2.6) | | | $ | 22.5 | |
| | | | | | | | | | |
| | | | | | | | | | |
| | | | | | | | | | |
I&M
| | | | | | | | | | | | | | | | | | | | | | | | | | | | | | | | |
| | December 31, 2024 |
| | Level 1 | | Level 2 | | Level 3 | | Other | | Total |
| Assets: | | (in millions) |
| | | | | | | | | | |
| Risk Management Assets | | | | | | | | | | |
| Risk Management Commodity Contracts (c) | | $ | — | | | $ | 19.9 | | | $ | 6.9 | | | $ | (8.4) | | | $ | 18.4 | |
| | | | | | | | | | |
| Spent Nuclear Fuel and Decommissioning Trusts | | | | | | | | | | |
| Cash and Cash Equivalents (e) | | 9.6 | | | — | | | — | | | 13.7 | | | 23.3 | |
| Fixed Income Securities: | | | | | | | | | | |
| United States Government | | — | | | 1,322.8 | | | — | | | — | | | 1,322.8 | |
| Corporate Debt | | — | | | 211.3 | | | — | | | — | | | 211.3 | |
| State and Local Government | | — | | | — | | | — | | | — | | | — | |
| Subtotal Fixed Income Securities | | — | | | 1,534.1 | | | — | | | — | | | 1,534.1 | |
| Equity Securities - Domestic (b) | | 2,837.7 | | | — | | | — | | | — | | | 2,837.7 | |
| Total Spent Nuclear Fuel and Decommissioning Trusts | | 2,847.3 | | | 1,534.1 | | | — | | | 13.7 | | | 4,395.1 | |
| | | | | | | | | | |
| Total Assets | | $ | 2,847.3 | | | $ | 1,554.0 | | | $ | 6.9 | | | $ | 5.3 | | | $ | 4,413.5 | |
| | | | | | | | | | |
| Liabilities: | | | | | | | | | | |
| | | | | | | | | | |
| Risk Management Liabilities | | | | | | | | | | |
| Risk Management Commodity Contracts (c) | | $ | — | | | $ | 9.2 | | | $ | 0.5 | | | $ | (9.0) | | | $ | 0.7 | |
| | | | | | | | | | | | | | | | | | | | | | | | | | | | | | | | |
| | December 31, 2023 |
| | Level 1 | | Level 2 | | Level 3 | | Other | | Total |
| Assets: | | (in millions) |
| | | | | | | | | | |
| Risk Management Assets | | | | | | | | | | |
| Risk Management Commodity Contracts (c) | | $ | — | | | $ | 37.4 | | | $ | 4.5 | | | $ | (2.3) | | | $ | 39.6 | |
| | | | | | | | | | |
| Spent Nuclear Fuel and Decommissioning Trusts | | | | | | | | | | |
| Cash and Cash Equivalents (e) | | 7.8 | | | — | | | — | | | 9.0 | | | 16.8 | |
| Fixed Income Securities: | | | | | | | | | | |
| United States Government | | — | | | 1,273.0 | | | — | | | — | | | 1,273.0 | |
| Corporate Debt | | — | | | 132.1 | | | — | | | — | | | 132.1 | |
| State and Local Government | | — | | | 1.7 | | | — | | | — | | | 1.7 | |
| Subtotal Fixed Income Securities | | — | | | 1,406.8 | | | — | | | — | | | 1,406.8 | |
| Equity Securities - Domestic (b) | | 2,436.6 | | | — | | | — | | | — | | | 2,436.6 | |
| Total Spent Nuclear Fuel and Decommissioning Trusts | | 2,444.4 | | | 1,406.8 | | | — | | | 9.0 | | | 3,860.2 | |
| | | | | | | | | | |
| Total Assets | | $ | 2,444.4 | | | $ | 1,444.2 | | | $ | 4.5 | | | $ | 6.7 | | | $ | 3,899.8 | |
| | | | | | | | | | |
| Liabilities: | | | | | | | | | | |
| | | | | | | | | | |
| Risk Management Liabilities | | | | | | | | | | |
| Risk Management Commodity Contracts (c) | | $ | — | | | $ | 3.7 | | | $ | 1.7 | | | $ | (3.4) | | | $ | 2.0 | |
OPCo
| | | | | | | | | | | | | | | | | | | | | | | | | | | | | | | | |
| | December 31, 2024 |
| | Level 1 | | Level 2 | | Level 3 | | Other | | Total |
| | |
| | | | | | | | | | |
| | | | | | | | | | |
| | | | | | | | | | |
| | | | | | | | | | |
| | | | | | | | | | |
| | | | | | | | | | |
| | | | | | | | | | |
| | | | | | | | | | |
| Liabilities: | | (in millions) |
| | | | | | | | | | |
| Risk Management Liabilities | | | | | | | | | | |
| Risk Management Commodity Contracts (c) | | $ | — | | | $ | 0.2 | | | $ | 47.5 | | | $ | (0.2) | | | $ | 47.5 | |
| | | | | | | | | | | | | | | | | | | | | | | | | | | | | | | | |
| | December 31, 2023 |
| | Level 1 | | Level 2 | | Level 3 | | Other | | Total |
| | |
| | | | | | | | | | |
| | | | | | | | | | |
| | | | | | | | | | |
| | | | | | | | | | |
| | | | | | | | | | |
| | | | | | | | | | |
| | | | | | | | | | |
| | | | | | | | | | |
| | | | | | | | | | |
| Liabilities: | | (in millions) |
| | | | | | | | | | |
| Risk Management Liabilities | | | | | | | | | | |
| Risk Management Commodity Contracts (c) | | $ | — | | | $ | 0.2 | | | $ | 50.6 | | | $ | (0.1) | | | $ | 50.7 | |
PSO
| | | | | | | | | | | | | | | | | | | | | | | | | | | | | | | | |
| | December 31, 2024 |
| | Level 1 | | Level 2 | | Level 3 | | Other | | Total |
| Assets: | | (in millions) |
| | | | | | | | | | |
| Risk Management Assets | | | | | | | | | | |
| Risk Management Commodity Contracts (c) | | $ | — | | | $ | 3.1 | | | $ | 20.8 | | | $ | (1.9) | | | $ | 22.0 | |
| | | | | | | | | | |
| | | | | | | | | | |
| | | | | | | | | | |
| | | | | | | | | | |
| Liabilities: | | | | | | | | | | |
| | | | | | | | | | |
| Risk Management Liabilities | | | | | | | | | | |
| Risk Management Commodity Contracts (c) | | $ | — | | | $ | 7.0 | | | $ | 0.8 | | | $ | (2.0) | | | $ | 5.8 | |
| | | | | | | | | | | | | | | | | | | | | | | | | | | | | | | | |
| | December 31, 2023 |
| | Level 1 | | Level 2 | | Level 3 | | Other | | Total |
| Assets: | | (in millions) |
| | | | | | | | | | |
| Risk Management Assets | | | | | | | | | | |
| Risk Management Commodity Contracts (c) | | $ | — | | | $ | — | | | $ | 19.7 | | | $ | (0.7) | | | $ | 19.0 | |
| | | | | | | | | | |
| | | | | | | | | | |
| | | | | | | | | | |
| | | | | | | | | | |
| Liabilities: | | | | | | | | | | |
| | | | | | | | | | |
| Risk Management Liabilities | | | | | | | | | | |
| Risk Management Commodity Contracts (c) | | $ | — | | | $ | 29.6 | | | $ | 1.1 | | | $ | (0.8) | | | $ | 29.9 | |
SWEPCo
| | | | | | | | | | | | | | | | | | | | | | | | | | | | | | | | |
| | December 31, 2024 |
| | Level 1 | | Level 2 | | Level 3 | | Other | | Total |
| Assets: | | (in millions) |
| | | | | | | | | | |
| Restricted Cash for Securitized Funding | | $ | 3.4 | | | $ | — | | | $ | — | | | $ | — | | | $ | 3.4 | |
| | | | | | | | | | |
| | | | | | | | | | |
| | | | | | | | | | |
| Risk Management Assets | | | | | | | | | | |
| Risk Management Commodity Contracts (c) | | — | | | 1.0 | | | 18.1 | | | (1.0) | | | 18.1 | |
| | | | | | | | | | |
| Total Assets | | $ | 3.4 | | | $ | 1.0 | | | $ | 18.1 | | | $ | (1.0) | | | $ | 21.5 | |
| | | | | | | | | | |
| Liabilities: | | | | | | | | | | |
| | | | | | | | | | |
| Risk Management Liabilities | | | | | | | | | | |
| Risk Management Commodity Contracts (c) | | $ | — | | | $ | 2.8 | | | $ | 0.6 | | | $ | (1.1) | | | $ | 2.3 | |
| | | | | | | | | | | | | | | | | | | | | | | | | | | | | | | | |
| | December 31, 2023 |
| | Level 1 | | Level 2 | | Level 3 | | Other | | Total |
| Assets: | | (in millions) |
| | | | | | | | | | |
| | | | | | | | | | |
| | | | | | | | | | |
| Risk Management Assets | | | | | | | | | | |
| Risk Management Commodity Contracts (c) | | $ | — | | | $ | 0.5 | | | $ | 12.0 | | | $ | (0.9) | | | $ | 11.6 | |
| | | | | | | | | | |
| | | | | | | | | | |
| | | | | | | | | | |
| Liabilities: | | | | | | | | | | |
| | | | | | | | | | |
| Risk Management Liabilities | | | | | | | | | | |
| Risk Management Commodity Contracts (c) | | $ | — | | | $ | 15.7 | | | $ | 0.9 | | | $ | (1.0) | | | $ | 15.6 | |
(a)Amounts in “Other” column primarily represent cash deposits in bank accounts with financial institutions or third-parties. Level 1 and Level 2 amounts primarily represent investments in money market funds.
(b)Amounts represent publicly-traded equity securities and equity-based mutual funds.
(c)Amounts in “Other” column primarily represent counterparty netting of risk management and hedging contracts and associated cash collateral under the accounting guidance for “Derivatives and Hedging.”
(d)The December 31, 2024 maturities of the net fair value of risk management contracts prior to cash collateral, assets/(liabilities), were as follows: Level 1 matures $(1) million in 2025; Level 2 matures $16 million in 2025, $43 million in periods 2026-2028, $4 million in periods 2029-2030; Level 3 matures $106 million in 2025, $45 million in periods 2026-2028, $9 million in periods 2029-2030 and $(16) million in periods 2031-2034. Risk management commodity contracts are substantially comprised of energy contracts.
(e)Amounts in “Other” column primarily represent accrued interest receivables from financial institutions. Level 1 amounts primarily represent investments in money market funds.
(f)The December 31, 2023 maturities of the net fair value of risk management contracts prior to cash collateral, assets/(liabilities), were as follows: Level 1 matures $(11) million in 2024 and $(4) million in 2025-2027; Level 2 matures $(99) million in 2024, $(44) million in periods 2025-2027; $7 million in periods 2028-2029 and $2 million in periods 2030-2033; Level 3 matures $74 million in 2024, $43 million in periods 2025-2027, $18 million in periods 2028-2029 and $(16) million in periods 2030-2033. Risk management commodity contracts are substantially comprised of energy contracts.
The following tables set forth a reconciliation of changes in the fair value of net trading derivatives classified as Level 3 in the fair value hierarchy:
| | | | | | | | | | | | | | | | | | | | | | | | | | | | | | | | | | | | | | |
| Year Ended December 31, 2024 | | AEP | | APCo | | I&M | | OPCo | | PSO | | SWEPCo |
| | (in millions) |
| Balance as of December 31, 2023 | | $ | 139.4 | | | $ | 22.4 | | | $ | 2.8 | | | $ | (50.6) | | | $ | 18.6 | | | $ | 11.1 | |
| Realized Gain (Loss) Included in Net Income (or Changes in Net Assets) (a) (b) | | 90.3 | | | 24.1 | | | 7.3 | | | (1.1) | | | 26.2 | | | 23.6 | |
| Unrealized Gain (Loss) Included in Net Income (or Changes in Net Assets) Relating to Assets Still Held at the Reporting Date (a) | | 14.8 | | | — | | | — | | | — | | | — | | | — | |
| Realized and Unrealized Gains (Losses) Included in Other Comprehensive Income (c) | | 3.9 | | | — | | | — | | | — | | | — | | | — | |
| Settlements | | (167.6) | | | (46.5) | | | (10.0) | | | 7.9 | | | (44.8) | | | (36.0) | |
| Transfers into Level 3 (d) (e) | | 6.8 | | | — | | | — | | | — | | | — | | | — | |
| Transfers out of Level 3 (e) | | (6.4) | | | — | | | — | | | — | | | — | | | 0.5 | |
| Changes in Fair Value Allocated to Regulated Jurisdictions (f) | | 84.4 | | | 35.2 | | | 6.3 | | | (3.7) | | | 20.0 | | | 18.3 | |
| | | | | | | | | | | | |
| Balance as of December 31, 2024 | | $ | 165.6 | | | $ | 35.2 | | | $ | 6.4 | | | $ | (47.5) | | | $ | 20.0 | | | $ | 17.5 | |
| | | | | | | | | | | | | | | | | | | | | | | | | | | | | | | | | | | | | | |
| Year Ended December 31, 2023 | | AEP | | APCo | | I&M | | OPCo | | PSO | | SWEPCo |
| | (in millions) |
| Balance as of December 31, 2022 | | $ | 160.4 | | | $ | 69.1 | | | $ | 4.6 | | | $ | (40.0) | | | $ | 23.7 | | | $ | 14.2 | |
| Realized Gain (Loss) Included in Net Income (or Changes in Net Assets) (a) (b) | | 52.1 | | | (11.7) | | | 4.2 | | | (3.6) | | | 29.8 | | | 20.0 | |
| Unrealized Gain (Loss) Included in Net Income (or Changes in Net Assets) Relating to Assets Still Held at the Reporting Date (a) | | 71.1 | | | — | | | — | | | — | | | — | | | — | |
| Realized and Unrealized Gains (Losses) Included in Other Comprehensive Income (c) | | (17.4) | | | — | | | — | | | — | | | — | | | — | |
| Settlements | | (172.2) | | | (57.3) | | | (8.8) | | | 5.6 | | | (53.4) | | | (34.2) | |
| Transfers into Level 3 (d) (e) | | (6.1) | | | — | | | — | | | — | | | — | | | — | |
| Transfers out of Level 3 (e) | | 3.8 | | | — | | | — | | | — | | | — | | | — | |
| Changes in Fair Value Allocated to Regulated Jurisdictions (f) | | 47.7 | | | 22.3 | | | 2.8 | | | (12.6) | | | 18.5 | | | 11.1 | |
| | | | | | | | | | | | |
| Balance as of December 31, 2023 | | $ | 139.4 | | | $ | 22.4 | | | $ | 2.8 | | | $ | (50.6) | | | $ | 18.6 | | | $ | 11.1 | |
| | | | | | | | | | | | | | | | | | | | | | | | | | | | | | | | | | | | | | |
| Year Ended December 31, 2022 | | AEP | | APCo | | I&M | | OPCo | | PSO | | SWEPCo |
| | (in millions) |
| Balance as of December 31, 2021 | | $ | 103.1 | | | $ | 41.7 | | | $ | (0.7) | | | $ | (92.5) | | | $ | 12.1 | | | $ | 10.9 | |
| Realized Gain (Loss) Included in Net Income (or Changes in Net Assets) (a) (b) | | 69.5 | | | 3.0 | | | 3.7 | | | 6.5 | | | 24.2 | | | 35.8 | |
| Unrealized Gain (Loss) Included in Net Income (or Changes in Net Assets) Relating to Assets Still Held at the Reporting Date (a) | | (34.9) | | | — | | | — | | | — | | | — | | | — | |
| Realized and Unrealized Gains (Losses) Included in Other Comprehensive Income (c) | | 9.6 | | | — | | | — | | | — | | | — | | | — | |
| Settlements | | (154.6) | | | (44.7) | | | (3.0) | | | 0.3 | | | (36.3) | | | (45.0) | |
| Transfers into Level 3 (d) (e) | | 1.7 | | | — | | | — | | | — | | | — | | | — | |
| Transfers out of Level 3 (e) | | 0.1 | | | — | | | — | | | — | | | — | | | 6.9 | |
| Changes in Fair Value Allocated to Regulated Jurisdictions (f) | | 165.9 | | | 69.1 | | | 4.6 | | | 45.7 | | | 23.7 | | | 5.6 | |
| Balance as of December 31, 2022 | | $ | 160.4 | | | $ | 69.1 | | | $ | 4.6 | | | $ | (40.0) | | | $ | 23.7 | | | $ | 14.2 | |
(a)Included in revenues on the statements of income.
(b)Represents the change in fair value between the beginning of the reporting period and the settlement of the risk management commodity contract.
(c)Included in cash flow hedges on the statements of comprehensive income.
(d)Represents existing assets or liabilities that were previously categorized as Level 2.
(e)Transfers are recognized based on their value at the beginning of the reporting period that the transfer occurred.
(f)Relates to the net gains (losses) of those contracts that are not reflected on the statements of income. These changes in fair value are recorded as regulatory liabilities for net gains and as regulatory assets for net losses or accounts payable.
The following tables quantify the significant unobservable inputs used in developing the fair value of Level 3 positions:
Significant Unobservable Inputs
December 31, 2024
| | | | | | | | | | | | | | | | | | | | | | | | | | | | | | | | | | | | | | | | | | | | | | | | | | |
| | | | | | | | Significant | | Input/Range |
| | Type of | | Fair Value | Valuation | | Unobservable | | | | | | Weighted |
| Company | | Input | | Assets | | Liabilities | | Technique | | Input (a) | | Low | | High | | Average (c) |
| | | | (in millions) | | | | | | | | | | |
| AEP | | Energy Contracts | | $ | 221.2 | | | $ | 144.6 | | | Discounted Cash Flow | | Forward Market Price | | $ | 2.75 | | | $ | 149.30 | | | $ | 49.34 | |
| | | | | | | | | | | | | | | | |
| AEP | | FTRs | | 92.3 | | | 3.3 | | | Discounted Cash Flow | | Forward Market Price | | (29.48) | | | 19.70 | | | 0.24 | |
| | | | | | | | | | | | | | | | |
| | | | | | | | | | | | | | | | |
| | | | | | | | | | | | | | | | |
| | | | | | | | | | | | | | | | |
| APCo | | FTRs | | 35.2 | | | — | | | Discounted Cash Flow | | Forward Market Price | | (0.25) | | | 9.32 | | | 1.56 | |
| I&M | | FTRs | | 6.9 | | | 0.5 | | | Discounted Cash Flow | | Forward Market Price | | (4.07) | | | 9.32 | | | 1.34 | |
| OPCo | | Energy Contracts | | — | | | 47.5 | | | Discounted Cash Flow | | Forward Market Price | | 14.53 | | | 72.40 | | | 42.44 | |
| PSO | | FTRs | | 20.8 | | | 0.8 | | | Discounted Cash Flow | | Forward Market Price | | (29.48) | | | 10.54 | | | (3.88) | |
| | | | | | | | | | | | | | | | |
| SWEPCo | | FTRs | | 18.1 | | | 0.6 | | | Discounted Cash Flow | | Forward Market Price | | (29.48) | | | 10.54 | | | (3.88) | |
December 31, 2023
| | | | | | | | | | | | | | | | | | | | | | | | | | | | | | | | | | | | | | | | | | | | | | | | | | |
| | | | | | | | Significant | | Input/Range |
| | Type of | | Fair Value | Valuation | | Unobservable | | | | | | Weighted |
| Company | | Input | | Assets | | Liabilities | | Technique | | Input | | Low | | High | | Average (c) |
| | | | (in millions) | | | | | | | | | | |
| AEP | | Energy Contracts | | $ | 225.5 | | | $ | 144.9 | | | Discounted Cash Flow | | Forward Market Price (a) | | $ | 5.21 | | | $ | 153.77 | | | $ | 45.05 | |
| AEP | | Natural Gas Contracts | | — | | | 0.5 | | | Discounted Cash Flow | | Forward Market Price (b) | | 3.11 | | | 3.11 | | | 3.11 | |
| AEP | | FTRs | | 68.6 | | | 9.3 | | | Discounted Cash Flow | | Forward Market Price (a) | | (25.45) | | | 17.07 | | | — | |
| | | | | | | | | | | | | | | | |
| | | | | | | | | | | | | | | | |
| | | | | | | | | | | | | | | | |
| APCo | | FTRs | | 23.5 | | | 1.1 | | | Discounted Cash Flow | | Forward Market Price (a) | | (1.04) | | | 6.45 | | | 1.36 | |
| I&M | | FTRs | | 4.5 | | | 1.7 | | | Discounted Cash Flow | | Forward Market Price (a) | | (1.48) | | | 8.40 | | | 0.85 | |
| OPCo | | Energy Contracts | | — | | | 50.6 | | | Discounted Cash Flow | | Forward Market Price (a) | | 22.92 | | | 67.53 | | | 42.85 | |
| PSO | | FTRs | | 19.7 | | | 1.1 | | | Discounted Cash Flow | | Forward Market Price (a) | | (25.45) | | | 4.80 | | | (4.33) | |
| SWEPCo | | Natural Gas Contracts | | — | | | 0.5 | | | Discounted Cash Flow | | Forward Market Price (b) | | 3.11 | | | 3.11 | | | 3.11 | |
| SWEPCo | | FTRs | | 12.0 | | | 0.4 | | | Discounted Cash Flow | | Forward Market Price (a) | | (25.45) | | | 4.80 | | | (4.33) | |
(a)Represents market prices in dollars per MWh.
(b)Represents market prices in dollars per MMBtu.
(c)The weighted-average is the product of the forward market price of the underlying commodity and volume weighted by term.
The following table provides the measurement uncertainty of fair value measurements to increases (decreases) in significant unobservable inputs related to Energy Contracts, Natural Gas Contracts, FTRs and Other Investments for the Registrants as of December 31, 2024 and 2023:
Uncertainty of Fair Value Measurements
| | | | | | | | | | | | | | | | | | | | |
| Significant Unobservable Input | | Position | | Change in Input | | Impact on Fair Value
Measurement |
| Forward Market Price | | Buy | | Increase (Decrease) | | Higher (Lower) |
| Forward Market Price | | Sell | | Increase (Decrease) | | Lower (Higher) |
| | | | | | |
| | | | | | |
| | | | | | |
12. INCOME TAXES
The disclosures in this note apply to all Registrants unless indicated otherwise.
Income Tax Expense (Benefit)
The details of the Registrants’ Income Tax Expense (Benefit) as reported are as follows:
| | | | | | | | | | | | | | | | | | | | | | | | | | | | | | | | | | | | | | | | | | | | | | | | | | |
| Year Ended December 31, 2024 | | AEP | | AEP Texas | | AEPTCo | | APCo | | I&M | | OPCo | | PSO | | SWEPCo |
| | (in millions) |
| Federal: | | | | | | | | | | | | | | | | |
| Current | | $ | (2.8) | | | $ | 22.1 | | | $ | 75.1 | | | $ | 79.9 | | | $ | 16.6 | | | $ | 41.5 | | | $ | (119.0) | | | $ | (111.4) | |
| Deferred | | (57.9) | | | 77.1 | | | 89.1 | | | (17.8) | | | (118.8) | | | (2.7) | | | 20.1 | | | (86.1) | |
| | | | | | | | | | | | | | | | |
| Total Federal | | (60.7) | | | 99.2 | | | 164.2 | | | 62.1 | | | (102.2) | | | 38.8 | | | (98.9) | | | (197.5) | |
| | | | | | | | | | | | | | | | |
| State and Local: | | | | | | | | | | | | | | | | |
| Current | | (5.2) | | | 2.9 | | | 5.6 | | | 12.6 | | | 7.0 | | | 3.1 | | | (0.2) | | | 1.8 | |
| Deferred | | 26.7 | | | — | | | 20.5 | | | 0.4 | | | — | | | 10.5 | | | (0.5) | | | 11.7 | |
| | | | | | | | | | | | | | | | |
| Total State and Local | | 21.5 | | | 2.9 | | | 26.1 | | | 13.0 | | | 7.0 | | | 13.6 | | | (0.7) | | | 13.5 | |
| | | | | | | | | | | | | | | | |
| Income Tax Expense (Benefit) | | $ | (39.2) | | | $ | 102.1 | | | $ | 190.3 | | | $ | 75.1 | | | $ | (95.2) | | | $ | 52.4 | | | $ | (99.6) | | | $ | (184.0) | |
| | | | | | | | | | | | | | | | | | | | | | | | | | | | | | | | | | | | | | | | | | | | | | | | | | |
| Year Ended December 31, 2023 | | AEP | | AEP Texas | | AEPTCo | | APCo | | I&M | | OPCo | | PSO | | SWEPCo |
| | (in millions) |
| Federal: | | | | | | | | | | | | | | | | |
| Current | | $ | (116.7) | | | $ | 19.8 | | | $ | 93.9 | | | $ | 62.2 | | | $ | 93.2 | | | $ | 46.6 | | | $ | (60.8) | | | $ | (88.1) | |
| Deferred | | 115.9 | | | 63.5 | | | 52.3 | | | (60.5) | | | (56.9) | | | 2.8 | | | 2.9 | | | 59.9 | |
| | | | | | | | | | | | | | | | |
| Total Federal | | (0.8) | | | 83.3 | | | 146.2 | | | 1.7 | | | 36.3 | | | 49.4 | | | (57.9) | | | (28.2) | |
| | | | | | | | | | | | | | | | |
| State and Local: | | | | | | | | | | | | | | | | |
| Current | | 69.0 | | | 2.7 | | | 9.1 | | | 6.3 | | | 21.1 | | | (0.3) | | | 0.3 | | | 1.0 | |
| Deferred | | (13.6) | | | (0.1) | | | (8.2) | | | 6.2 | | | 1.2 | | | 5.2 | | | 4.0 | | | (6.1) | |
| | | | | | | | | | | | | | | | |
| Total State and Local | | 55.4 | | | 2.6 | | | 0.9 | | | 12.5 | | | 22.3 | | | 4.9 | | | 4.3 | | | (5.1) | |
| | | | | | | | | | | | | | | | |
| Income Tax Expense (Benefit) | | $ | 54.6 | | | $ | 85.9 | | | $ | 147.1 | | | $ | 14.2 | | | $ | 58.6 | | | $ | 54.3 | | | $ | (53.6) | | | $ | (33.3) | |
| | | | | | | | | | | | | | | | | | | | | | | | | | | | | | | | | | | | | | | | | | | | | | | | | | |
| Year Ended December 31, 2022 | | AEP | | AEP Texas | | AEPTCo | | APCo | | I&M | | OPCo | | PSO | | SWEPCo |
| | (in millions) |
| Federal: | | | | | | | | | | | | | | | | |
| Current | | $ | 113.1 | | | $ | 29.0 | | | $ | 98.0 | | | $ | (61.0) | | | $ | 43.4 | | | $ | (27.0) | | | $ | (3.3) | | | $ | (32.3) | |
| Deferred | | (88.8) | | | 41.4 | | | 46.0 | | | 86.6 | | | (51.3) | | | 73.3 | | | (50.5) | | | 13.4 | |
| | | | | | | | | | | | | | | | |
| Total Federal | | 24.3 | | | 70.4 | | | 144.0 | | | 25.6 | | | (7.9) | | | 46.3 | | | (53.8) | | | (18.9) | |
| | | | | | | | | | | | | | | | |
| State and Local: | | | | | | | | | | | | | | | | |
| Current | | 26.6 | | | 2.2 | | | 8.8 | | | (0.4) | | | 10.9 | | | (0.3) | | | — | | | (1.8) | |
| Deferred | | (45.5) | | | — | | | 16.3 | | | (7.0) | | | 1.2 | | | (1.8) | | | 4.6 | | | (4.5) | |
| | | | | | | | | | | | | | | | |
| Total State and Local | | (18.9) | | | 2.2 | | | 25.1 | | | (7.4) | | | 12.1 | | | (2.1) | | | 4.6 | | | (6.3) | |
| | | | | | | | | | | | | | | | |
| Income Tax Expense (Benefit) | | $ | 5.4 | | | $ | 72.6 | | | $ | 169.1 | | | $ | 18.2 | | | $ | 4.2 | | | $ | 44.2 | | | $ | (49.2) | | | $ | (25.2) | |
The following are reconciliations for the Registrants between the federal income taxes computed by multiplying pretax income by the federal statutory tax rate and the income taxes reported:
| | | | | | | | | | | | | | | | | | | | | | | | | | | | | | | | | | | | | | | | | | | | | | | | | | | | | | | | | | | | | | | | | | | | | | | | | | |
| Year Ended December 31, 2024 | | AEP | | AEP Texas | | AEPTCo | | APCo | | I&M | | OPCo | | PSO | | SWEPCo |
| | (in millions) |
| Net Income | | $ | 2,975.8 | | | $ | 420.1 | | | $ | 688.4 | | | $ | 421.7 | | | $ | 391.4 | | | $ | 305.6 | | | $ | 249.3 | | | $ | 325.7 | |
| Less: Equity Earnings | | (1.4) | | | — | | | — | | | — | | | — | | | — | | | — | | | (1.4) | |
| Income Tax Expense (Benefit) | | (39.2) | | | 102.1 | | | 190.3 | | | 75.1 | | | (95.2) | | | 52.4 | | | (99.6) | | | (184.0) | |
| Pretax Income | | $ | 2,935.2 | | | $ | 522.2 | | | $ | 878.7 | | | $ | 496.8 | | | $ | 296.2 | | | $ | 358.0 | | | $ | 149.7 | | | $ | 140.3 | |
| | | | | | | | | | | | | | | | |
| Income Taxes on Pretax Income at Statutory Rate (21%) | | $ | 616.5 | | | $ | 109.7 | | | $ | 184.5 | | | $ | 104.3 | | | $ | 62.2 | | | $ | 75.2 | | | $ | 31.4 | | | $ | 29.5 | |
| Increase (Decrease) in Income Taxes Resulting from the Following Items: | | | | | | | | | | | | | | | | |
| Reversal of Origination Flow-Through | | 20.5 | | | 0.8 | | | 2.7 | | | 6.6 | | | 4.0 | | | 2.7 | | | 0.4 | | | 2.1 | |
| | | | | | | | | | | | | | | | |
| | | | | | | | | | | | | | | | |
| Investment Tax Credit Amortization | | (58.4) | | | (0.9) | | | — | | | 0.1 | | | (2.0) | | | 0.1 | | | (1.4) | | | (0.1) | |
| Production Tax Credits | | (214.2) | | | — | | | — | | | (0.3) | | | (69.0) | | | — | | | (73.8) | | | (70.7) | |
| State and Local Income Taxes, Net | | 16.7 | | | 2.3 | | | 20.5 | | | 10.3 | | | 5.5 | | | 10.7 | | | (0.6) | | | 10.6 | |
| Removal Costs | | (14.6) | | | — | | | — | | | (11.2) | | | (3.7) | | | — | | | — | | | — | |
| AFUDC Equity | | (46.5) | | | (9.6) | | | (18.8) | | | (5.3) | | | (2.8) | | | (4.9) | | | (1.6) | | | (2.8) | |
| | | | | | | | | | | | | | | | |
| | | | | | | | | | | | | | | | |
| | | | | | | | | | | | | | | | |
| | | | | | | | | | | | | | | | |
| Tax Reform Excess ADIT Reversal | | (91.6) | | | (5.1) | | | 1.6 | | | (30.1) | | | (15.5) | | | (31.1) | | | (5.5) | | | (4.0) | |
| Remeasurement of Excess ADIT | | (262.2) | | | 6.4 | | | — | | | — | | | (73.3) | | | — | | | (48.6) | | | (146.8) | |
| | | | | | | | | | | | | | | | |
| | | | | | | | | | | | | | | | |
| | | | | | | | | | | | | | | | |
| | | | | | | | | | | | | | | | |
| | | | | | | | | | | | | | | | |
| Other | | (5.4) | | | (1.5) | | | (0.2) | | | 0.7 | | | (0.6) | | | (0.3) | | | 0.1 | | | (1.8) | |
| Income Tax Expense (Benefit) | | $ | (39.2) | | | $ | 102.1 | | | $ | 190.3 | | | $ | 75.1 | | | $ | (95.2) | | | $ | 52.4 | | | $ | (99.6) | | | $ | (184.0) | |
| | | | | | | | | | | | | | | | |
| Effective Income Tax Rate | | (1.3) | | % | | 19.6 | | % | | 21.7 | | % | | 15.1 | | % | | (32.1) | | % | | 14.6 | | % | | (66.5) | | % | | (131.1) | | % |
. | | | | | | | | | | | | | | | | | | | | | | | | | | | | | | | | | | | | | | | | | | | | | | | | | | | | | | | | | | | | | | | | | | | | | | | | | | |
| Year Ended December 31, 2023 | | AEP | | AEP Texas | | AEPTCo | | APCo | | I&M | | OPCo | | PSO | | SWEPCo |
| | (in millions) |
| Net Income | | $ | 2,212.6 | | | $ | 370.4 | | | $ | 614.2 | | | $ | 294.4 | | | $ | 335.9 | | | $ | 328.2 | | | $ | 208.8 | | | $ | 223.8 | |
| Less: Equity Earnings | | (1.4) | | | — | | | — | | | — | | | — | | | — | | | — | | | (1.4) | |
| Income Tax Expense (Benefit) | | 54.6 | | | 85.9 | | | 147.1 | | | 14.2 | | | 58.6 | | | 54.3 | | | (53.6) | | | (33.3) | |
| Pretax Income | | $ | 2,265.8 | | | $ | 456.3 | | | $ | 761.3 | | | $ | 308.6 | | | $ | 394.5 | | | $ | 382.5 | | | $ | 155.2 | | | $ | 189.1 | |
| | | | | | | | | | | | | | | | |
| Income Taxes on Pretax Income at Statutory Rate (21%) | | $ | 475.8 | | | $ | 95.8 | | | $ | 159.9 | | | $ | 64.8 | | | $ | 82.8 | | | $ | 80.3 | | | $ | 32.6 | | | $ | 39.7 | |
| Increase (Decrease) in Income Taxes Resulting from the Following Items: | | | | | | | | | | | | | | | | |
| Reversal of Origination Flow-Through | | 26.0 | | | 0.6 | | | 2.4 | | | 9.9 | | | 6.4 | | | 2.6 | | | 0.4 | | | 2.1 | |
| | | | | | | | | | | | | | | | |
| | | | | | | | | | | | | | | | |
| Investment Tax Credit Amortization | | (50.3) | | | (0.7) | | | — | | | — | | | (1.6) | | | — | | | (1.4) | | | (0.2) | |
| Production Tax Credits | | (175.2) | | | — | | | — | | | (0.1) | | | — | | | — | | | (64.3) | | | (67.1) | |
| State and Local Income Taxes, Net | | 43.7 | | | 2.1 | | | 0.7 | | | 9.9 | | | 17.5 | | | 3.9 | | | 3.5 | | | (4.0) | |
| Removal Costs | | (22.0) | | | — | | | — | | | (5.1) | | | (11.8) | | | — | | | — | | | — | |
| AFUDC Equity | | (39.8) | | | (6.0) | | | (17.5) | | | (5.5) | | | (2.3) | | | (3.6) | | | (1.8) | | | (2.4) | |
| | | | | | | | | | | | | | | | |
| | | | | | | | | | | | | | | | |
| | | | | | | | | | | | | | | | |
| | | | | | | | | | | | | | | | |
| Tax Reform Excess ADIT Reversal | | (151.1) | | | (6.0) | | | 1.7 | | | (17.3) | | | (30.0) | | | (28.9) | | | (23.3) | | | (12.6) | |
| Remeasurement of Excess ADIT | | (46.0) | | | — | | | — | | | (46.0) | | | — | | | — | | | — | | | — | |
| Federal Return to Provision | | — | | | (0.1) | | | — | | | 3.4 | | | (2.5) | | | (0.4) | | | 0.6 | | | 1.0 | |
| Disallowance Cost | | — | | | — | | | — | | | — | | | — | | | — | | | — | | | 12.0 | |
| | | | | | | | | | | | | | | | |
| Other | | (6.5) | | | 0.2 | | | (0.1) | | | 0.2 | | | 0.1 | | | 0.4 | | | 0.1 | | | (1.8) | |
| Income Tax Expense (Benefit) | | $ | 54.6 | | | $ | 85.9 | | | $ | 147.1 | | | $ | 14.2 | | | $ | 58.6 | | | $ | 54.3 | | | $ | (53.6) | | | $ | (33.3) | |
| | | | | | | | | | | | | | | | |
| Effective Income Tax Rate | | 2.4 | | % | | 18.8 | | % | | 19.3 | | % | | 4.6 | | % | | 14.9 | | % | | 14.2 | | % | | (34.5) | | % | | (17.6) | | % |
| | | | | | | | | | | | | | | | | | | | | | | | | | | | | | | | | | | | | | | | | | | | | | | | | | | | | | | | | | | | | | | | | | | | | | | | | | |
| Year Ended December 31, 2022 | | AEP | | AEP Texas | | AEPTCo | | APCo | | I&M | | OPCo | | PSO | | SWEPCo |
| | (in millions) |
| Net Income | | $ | 2,305.6 | | | $ | 307.9 | | | $ | 594.2 | | | $ | 394.2 | | | $ | 324.7 | | | $ | 287.8 | | | $ | 167.6 | | | $ | 294.3 | |
| Less: Equity Earnings | | (1.4) | | | — | | | — | | | — | | | — | | | (0.6) | | | — | | | (1.4) | |
| Income Tax Expense (Benefit) | | 5.4 | | | 72.6 | | | 169.1 | | | 18.2 | | | 4.2 | | | 44.2 | | | (49.2) | | | (25.2) | |
| Pretax Income | | $ | 2,309.6 | | | $ | 380.5 | | | $ | 763.3 | | | $ | 412.4 | | | $ | 328.9 | | | $ | 331.4 | | | $ | 118.4 | | | $ | 267.7 | |
| | | | | | | | | | | | | | | | |
| Income Taxes on Pretax Income at Statutory Rate (21%) | | $ | 485.0 | | | $ | 79.9 | | | $ | 160.3 | | | $ | 86.6 | | | $ | 69.1 | | | $ | 69.6 | | | $ | 24.9 | | | $ | 56.2 | |
| Increase (Decrease) in Income Taxes Resulting from the Following Items: | | | | | | | | | | | | | | | | |
| Reversal of Origination Flow-Through | | 17.1 | | | — | | | — | | | 4.7 | | | 2.9 | | | 3.0 | | | — | | | 2.3 | |
| | | | | | | | | | | | | | | | |
| | | | | | | | | | | | | | | | |
| Investment Tax Credit Amortization | | (14.3) | | | — | | | — | | | — | | | (3.1) | | | — | | | (1.6) | | | — | |
| Production Tax Credits | | (197.1) | | | — | | | — | | | — | | | — | | | — | | | (47.7) | | | (57.1) | |
| State and Local Income Taxes, Net | | (14.0) | | | 1.7 | | | 19.8 | | | (5.9) | | | 9.6 | | | (1.6) | | | 4.3 | | | (4.9) | |
| Removal Costs | | (26.5) | | | — | | | — | | | (9.8) | | | (12.4) | | | — | | | — | | | — | |
| AFUDC Equity | | (29.3) | | | (4.1) | | | (14.8) | | | (3.7) | | | (2.1) | | | (2.9) | | | — | | | — | |
| | | | | | | | | | | | | | | | |
| | | | | | | | | | | | | | | | |
| | | | | | | | | | | | | | | | |
| | | | | | | | | | | | | | | | |
| Tax Reform Excess ADIT Reversal | | (214.5) | | | (5.5) | | | — | | | (50.9) | | | (54.0) | | | (27.5) | | | (25.4) | | | (14.8) | |
| | | | | | | | | | | | | | | | |
| Federal Return to Provision | | (17.4) | | | — | | | — | | | (2.8) | | | (6.2) | | | 3.5 | | | (3.7) | | | — | |
| | | | | | | | | | | | | | | | |
| | | | | | | | | | | | | | | | |
| Other | | 16.4 | | | 0.6 | | | 3.8 | | | — | | | 0.4 | | | 0.1 | | | — | | | (6.9) | |
| Income Tax Expense (Benefit) | | $ | 5.4 | | | $ | 72.6 | | | $ | 169.1 | | | $ | 18.2 | | | $ | 4.2 | | | $ | 44.2 | | | $ | (49.2) | | | $ | (25.2) | |
| | | | | | | | | | | | | | | | |
| Effective Income Tax Rate | | 0.2 | | % | | 19.1 | | % | | 22.2 | | % | | 4.4 | | % | | 1.3 | | % | | 13.3 | | % | | (41.6) | | % | | (9.4) | | |
Net Deferred Tax Liability
The following tables show elements of the net deferred tax liability and significant temporary differences for each Registrant. Amounts presented for 2023 were recast to allocate “Deferred State Income Taxes”, and other miscellaneous temporary differences, amongst other categories to substantively reflect the elements of the net deferred tax liability.
| | | | | | | | | | | | | | | | | | | | | | | | | | | | | | | | | | | | | | | | | | | | | | | | | | |
| Year Ended December 31, 2024 | | AEP | | AEP Texas | | AEPTCo | | APCo | | I&M | | OPCo | | PSO | | SWEPCo |
| | (in millions) |
| Deferred Tax Assets | | $ | 2,651.9 | | | $ | 139.1 | | | $ | 172.6 | | | $ | 379.1 | | | $ | 1,072.2 | | | $ | 186.5 | | | $ | 266.9 | | | $ | 292.8 | |
| Deferred Tax Liabilities | | (12,624.3) | | | (1,461.8) | | | (1,451.2) | | | (2,412.6) | | | (2,248.0) | | | (1,387.6) | | | (1,197.5) | | | (1,564.1) | |
| Net Deferred Tax Liabilities | | $ | (9,972.4) | | | $ | (1,322.7) | | | $ | (1,278.6) | | | $ | (2,033.5) | | | $ | (1,175.8) | | | $ | (1,201.1) | | | $ | (930.6) | | | $ | (1,271.3) | |
| | | | | | | | | | | | | | | | |
| Property Related Temporary Differences | | $ | (8,939.7) | | | $ | (1,364.0) | | | $ | (1,416.6) | | | $ | (1,784.8) | | | $ | (189.9) | | | $ | (1,290.9) | | | $ | (1,009.8) | | | $ | (1,353.1) | |
| Amounts Due to Customers for Future Income Taxes | | 779.6 | | | 109.3 | | | 121.4 | | | 119.0 | | | 73.1 | | | 95.6 | | | 80.7 | | | 90.2 | |
| | | | | | | | | | | | | | | | |
| | | | | | | | | | | | | | | | |
| Securitized Assets | | (133.4) | | | (26.5) | | | — | | | (25.7) | | | — | | | — | | | — | | | (81.1) | |
| | | | | | | | | | | | | | | | |
| Regulatory Assets | | (966.2) | | | (63.2) | | | (0.2) | | | (302.4) | | | (49.2) | | | (45.3) | | | (53.1) | | | (87.0) | |
| Accrued Nuclear Decommissioning | | (1,052.2) | | | — | | | — | | | — | | | (1,052.2) | | | — | | | — | | | — | |
| Net Operating Loss Carryforward | | 110.3 | | | — | | | 2.5 | | | 0.4 | | | — | | | 2.9 | | | 27.8 | | | 36.5 | |
| Valuation Allowance | | (35.0) | | | — | | | (0.1) | | | — | | | — | | | — | | | — | | | — | |
| Tax Credit Carryforward | | 197.5 | | | 4.3 | | | — | | | 0.1 | | | 39.6 | | | 38.5 | | | 26.5 | | | 31.7 | |
| Operating Lease Liability | | 145.3 | | | 12.3 | | | 0.3 | | | 16.2 | | | 13.5 | | | 13.3 | | | 27.1 | | | 35.7 | |
| Investment in Partnership | | (302.1) | | | — | | | — | | | (0.1) | | | — | | | (0.8) | | | — | | | (1.5) | |
| | | | | | | | | | | | | | | | |
| | | | | | | | | | | | | | | | |
| | | | | | | | | | | | | | | | |
| | | | | | | | | | | | | | | | |
| All Other, Net | | 223.5 | | | 5.1 | | | 14.1 | | | (56.2) | | | (10.7) | | | (14.4) | | | (29.8) | | | 57.3 | |
| Net Deferred Tax Liabilities | | $ | (9,972.4) | | | $ | (1,322.7) | | | $ | (1,278.6) | | | $ | (2,033.5) | | | $ | (1,175.8) | | | $ | (1,201.1) | | | $ | (930.6) | | | $ | (1,271.3) | |
| | | | | | | | | | | | | | | | | | | | | | | | | | | | | | | | | | | | | | | | | | | | | | | | | | |
| Year Ended December 31, 2023 | | AEP | | AEP Texas | | AEPTCo | | APCo | | I&M | | OPCo | | PSO | | SWEPCo |
| | (in millions) |
| Deferred Tax Assets | | $ | 3,216.1 | | | $ | 173.6 | | | $ | 188.0 | | | $ | 472.9 | | | $ | 1,014.0 | | | $ | 271.5 | | | $ | 282.4 | | | $ | 441.5 | |
| Deferred Tax Liabilities | | (12,631.8) | | | (1,401.4) | | | (1,335.7) | | | (2,484.8) | | | (2,183.9) | | | (1,424.2) | | | (1,113.6) | | | (1,620.8) | |
| Net Deferred Tax Liabilities | | $ | (9,415.7) | | | $ | (1,227.8) | | | $ | (1,147.7) | | | $ | (2,011.9) | | | $ | (1,169.9) | | | $ | (1,152.7) | | | $ | (831.2) | | | $ | (1,179.3) | |
| | | | | | | | | | | | | | | | |
| Property Related Temporary Differences | | $ | (8,809.0) | | | $ | (1,274.0) | | | $ | (1,304.2) | | | $ | (1,805.9) | | | $ | (315.6) | | | $ | (1,243.2) | | | $ | (941.9) | | | $ | (1,306.0) | |
| Amounts Due to Customers for Future Income Taxes | | 898.1 | | | 109.3 | | | 120.8 | | | 128.0 | | | 103.2 | | | 104.6 | | | 99.0 | | | 142.5 | |
| | | | | | | | | | | | | | | | |
| | | | | | | | | | | | | | | | |
| Securitized Assets | | (81.8) | | | (46.7) | | | — | | | (32.6) | | | — | | | (5.3) | | | — | | | 2.8 | |
| | | | | | | | | | | | | | | | |
| Regulatory Assets | | (825.9) | | | (56.2) | | | (0.7) | | | (284.3) | | | (27.7) | | | (50.1) | | | (67.2) | | | (146.9) | |
| Accrued Nuclear Decommissioning | | (923.5) | | | — | | | — | | | — | | | (923.5) | | | — | | | — | | | — | |
| Net Operating Loss Carryforward | | 155.6 | | | — | | | 3.9 | | | 0.2 | | | — | | | 2.6 | | | 25.3 | | | 47.5 | |
| Valuation Allowance | | (37.4) | | | — | | | (0.1) | | | — | | | — | | | — | | | — | | | (1.8) | |
| Tax Credit Carryforward | | 321.4 | | | 13.7 | | | — | | | 0.1 | | | 7.2 | | | 41.0 | | | 53.8 | | | 68.6 | |
| Operating Lease Liability | | 154.7 | | | 17.3 | | | 0.4 | | | 18.0 | | | 14.1 | | | 15.4 | | | 28.2 | | | 33.3 | |
| Investment in Partnership | | (296.3) | | | — | | | — | | | (0.1) | | | — | | | (0.7) | | | — | | | (1.5) | |
| | | | | | | | | | | | | | | | |
| | | | | | | | | | | | | | | | |
| | | | | | | | | | | | | | | | |
| | | | | | | | | | | | | | | | |
| All Other, Net | | 28.4 | | | 8.8 | | | 32.2 | | | (35.3) | | | (27.6) | | | (17.0) | | | (28.4) | | | (17.8) | |
| Net Deferred Tax Liabilities | | $ | (9,415.7) | | | $ | (1,227.8) | | | $ | (1,147.7) | | | $ | (2,011.9) | | | $ | (1,169.9) | | | $ | (1,152.7) | | | $ | (831.2) | | | $ | (1,179.3) | |
Federal and State Income Tax Audit Status
AEP is not currently under IRS audit and the statute of limitations (“SOL”) for the IRS to examine AEP and subsidiaries originally filed federal return has expired for tax years prior to 2017. AEP agreed to extend the SOL on the 2017-2020 tax returns to May 31, 2025, to allow the Congressional Joint Committee on Taxation (“JCT”) adequate time to complete its review of the now closed IRS audit. Following JCT’s approval, AEP received IRS confirmation that tax years 2017-2020 are now effectively closed as they only remain open for changes to other non-consolidated entities that AEP holds an interest in.
AEP and subsidiaries file income tax returns in various state and local jurisdictions. AEP and subsidiaries are not currently under any state and local income tax examinations. Generally, the SOL have expired for tax years prior to 2017. In addition, management is monitoring and continues to evaluate the potential impact of federal legislation and corresponding state conformity.
Net Income Tax Operating Loss Carryforward
As of December 31, 2024, AEP, OPCo, PSO, and SWEPCo have pretax state NOLC as indicated in the table below. Net of tax, the NOLCs for AEP and subsidiaries amount to $110.3 million of future tax benefit. Additionally, the amounts presented below for OPCo, PSO, and SWEPCo amount to $2.7 million, $27.8 million, and $36.1 million, respectively.:
| | | | | | | | | | | | | | | | | | | | | | | | | | |
| | | | State Net Income | | | | |
| | | | Tax Operating Loss | | Years of |
| Company | | State/Municipality | | Carryforward | | Expiration |
| | | | (in millions) | | | | |
| AEP | | Arkansas | | $ | 273.9 | | | 2031 | - | 2034 |
| AEP | | Colorado | | 70.5 | | | 2041 |
| AEP | | Illinois | | 53.9 | | | 2039 | - | 2041 |
| | | | | | | | |
| AEP | | Kentucky | | 186.7 | | | 2030 | - | 2037 |
| AEP | | Louisiana | | 644.8 | | | NA |
| AEP | | Michigan | | 30.9 | | | 2029 | - | 2032 |
| | | | | | | | |
| | | | | | |
| AEP | | Ohio Municipal | | 2,155.8 | | | 2025 | - | 2029 |
| AEP | | Oklahoma | | 889.8 | | | 2037 |
| AEP | | Pennsylvania | | 61.2 | | | 2030 | - | 2044 |
| AEP | | Tennessee | | 46.1 | | | 2032 | - | 2039 |
| | | | | | | | |
| | | | | | | | |
| | | | | | | | |
| | | | | | | | |
| OPCo | | Ohio Municipal | | 93.7 | | | 2025 | - | 2029 |
| PSO | | Oklahoma | | 1,010.0 | | | 2037 |
| SWEPCo | | Arkansas | | 273.5 | | | 2031 | - | 2034 |
| SWEPCo | | Louisiana | | 634.5 | | | NA |
| | | | | | | | |
| | | | | | |
NA Not applicable.
Tax Credit Carryforward
Federal and state net income tax operating losses sustained in 2017, 2019 and 2021 resulted in unused federal and state income tax credits. As of December 31, 2024, the Registrants have federal tax credit carryforwards and AEP and PSO have state tax credit carryforwards as indicated in the table below. If these credits are not utilized, federal general business tax credits will expire in the years 2036 through 2041 and state tax credits will remain available indefinitely.
| | | | | | | | | | | | | | | | | | |
| | | | | | | | |
| | Total Federal | | | | Total State | | |
| | Tax Credit | | | | Tax Credit | | |
| Company | | Carryforward | | | | Carryforward | | |
| | (in millions) |
| AEP | | $ | 197.9 | | | | | 40.2 | | | |
| | | | | | | | |
| | | | | | | | |
| | | | | | | | |
| I&M | | 37.5 | | | | | — | | | |
| | | | | | | | |
| PSO | | 26.5 | | | | | 40.2 | | | |
| SWEPCo | | 31.7 | | | | | — | | | |
The Registrants anticipate future federal taxable income will be sufficient to realize the tax benefits of the federal tax credits before they expire unused.
Valuation Allowance
AEP assesses the available positive and negative evidence to estimate whether sufficient future taxable income of the appropriate tax character will be generated to realize the benefits of existing deferred tax assets. When the evaluation of the evidence indicates that it is more-likely-than-not that AEP will not be able to realize the benefits of existing deferred tax assets, a valuation allowance is recorded to reduce existing deferred tax assets to the net realizable amount. Objective evidence evaluated includes whether AEP has a history of recognizing income, future reversals of existing temporary differences and tax planning strategies.
Valuation allowance activity for the years ended December 31, 2024, 2023 and 2022 were not material.
Uncertain Tax Positions
The amount and activity of unrecognized tax benefits was not material for the Registrants for the years ended December 31, 2024, 2023 and 2022. Management believes that there will be no significant net increase or decrease in unrecognized benefits within 12 months of the reporting date. The total amount of unrecognized tax benefits that, if recognized, would affect the effective tax rate for AEP as of December 31, 2024, 2023 and 2022 were $19 million, $13 million, and $23 million, respectively.
13. LEASES
The disclosures in this note apply to all Registrants unless indicated otherwise.
The Registrants lease property, plant and equipment including, but not limited to, fleet, information technology and real estate leases. These leases require payments of non-lease components, including related property taxes, operating and maintenance costs. AEP does not separate non-lease components from associated lease components. Many of these leases have purchase or renewal options. Leases not renewed are often replaced by other leases. Options to renew or purchase a lease are included in the measurement of lease assets and liabilities if it is reasonably certain the Registrant will exercise the option.
Lease obligations are measured using the discount rate implicit in the lease when that rate is readily determinable. AEP has visibility into the rate implicit in the lease when assets are leased from selected financial institutions under master leasing agreements. When the implicit rate is not readily determinable, the Registrants measure their lease obligation using their estimated secured incremental borrowing rate. Incremental borrowing rates are comprised of an underlying risk-free rate and a secured credit spread relative to the lessee on a matched maturity basis.
Operating lease rentals and finance lease amortization costs are generally charged to Other Operation and Maintenance expense in accordance with rate-making treatment for regulated operations. The amortization costs related to the Rockport finance lease, which ended in December 2022, were charged to Depreciation and Amortization. Interest on finance lease liabilities is generally charged to Interest Expense. Lease costs associated with capital projects are included in Property, Plant and Equipment on the balance sheets. For regulated operations with finance leases, a finance lease asset and offsetting liability are recorded at the present value of the remaining lease payments for each reporting period. Finance leases for nonregulated property are accounted for as if the assets were owned and financed. The components of rental costs were as follows:
| | | | | | | | | | | | | | | | | | | | | | | | | | | | | | | | | | | | | | | | | | | | | | | | | | |
| Year Ended December 31, 2024 | | AEP | | AEP Texas | | AEPTCo | | APCo | | I&M | | OPCo | | PSO | | SWEPCo |
| | (in millions) |
| Operating Lease Cost | | $ | 145.9 | | | $ | 32.3 | | | $ | 1.3 | | | $ | 18.4 | | | $ | 19.6 | | | $ | 16.8 | | | $ | 13.5 | | | $ | 17.8 | |
| Finance Lease Cost: | | | | | | | | | | | | | | | | |
| Amortization of Right-of-Use Assets | | 63.7 | | | 7.5 | | | — | | | 8.7 | | | 7.2 | | | 5.3 | | | 3.3 | | | 13.0 | |
| Interest on Lease Liabilities | | 11.9 | | | 1.4 | | | — | | | 1.5 | | | 2.2 | | | 0.9 | | | 0.7 | | | 1.6 | |
| Total Lease Rental Costs (a) | | $ | 221.5 | | | $ | 41.2 | | | $ | 1.3 | | | $ | 28.6 | | | $ | 29.0 | | | $ | 23.0 | | | $ | 17.5 | | | $ | 32.4 | |
| | | | | | | | | | | | | | | | | | | | | | | | | | | | | | | | | | | | | | | | | | | | | | | | | | |
| Year Ended December 31, 2023 | | AEP | | AEP Texas | | AEPTCo | | APCo | | I&M | | OPCo | | PSO | | SWEPCo |
| | (in millions) |
| Operating Lease Cost | | $ | 149.9 | | | $ | 34.0 | | | $ | 1.3 | | | $ | 18.5 | | | $ | 19.6 | | | $ | 17.3 | | | $ | 13.5 | | | $ | 17.5 | |
| Finance Lease Cost: | | | | | | | | | | | | | | | | |
| Amortization of Right-of-Use Assets | | 69.1 | | | 7.4 | | | — | | | 8.3 | | | 7.3 | | | 5.0 | | | 3.3 | | | 19.9 | |
| Interest on Lease Liabilities | | 11.9 | | | 1.4 | | | — | | | 1.8 | | | 2.5 | | | 0.9 | | | 0.7 | | | 1.4 | |
| Total Lease Rental Costs (a) | | $ | 230.9 | | | $ | 42.8 | | | $ | 1.3 | | | $ | 28.6 | | | $ | 29.4 | | | $ | 23.2 | | | $ | 17.5 | | | $ | 38.8 | |
| | | | | | | | | | | | | | | | | | | | | | | | | | | | | | | | | | | | | | | | | | | | | | | | | | |
| Year Ended December 31, 2022 | | AEP | | AEP Texas | | AEPTCo | | APCo | | I&M | | OPCo | | PSO | | SWEPCo |
| | (in millions) |
| Operating Lease Cost | | $ | 157.5 | | | $ | 18.4 | | | $ | 1.1 | | | $ | 17.9 | | | $ | 29.5 | | | $ | 16.9 | | | $ | 11.8 | | | $ | 15.3 | |
| Finance Lease Cost: | | | | | | | | | | | | | | | | |
| Amortization of Right-of-Use Assets | | 205.5 | | | 6.8 | | | — | | | 7.9 | | | 78.7 | | | 4.9 | | | 3.2 | | | 10.8 | |
| Interest on Lease Liabilities | | 13.4 | | | 1.3 | | | — | | | 2.0 | | | 3.1 | | | 0.8 | | | 0.6 | | | 2.1 | |
| Total Lease Rental Costs (a) | | $ | 376.4 | | | $ | 26.5 | | | $ | 1.1 | | | $ | 27.8 | | | $ | 111.3 | | | $ | 22.6 | | | $ | 15.6 | | | $ | 28.2 | |
(a)Excludes variable and short-term lease costs, which were immaterial.
Supplemental information related to leases are shown in the tables below:
| | | | | | | | | | | | | | | | | | | | | | | | | | | | | | | | | | | | | | | | | | | | | | | | | | |
| December 31, 2024 | | AEP | | AEP Texas | | AEPTCo | | APCo | | I&M | | OPCo | | PSO | | SWEPCo |
| Weighted-Average Remaining Lease Term (years): | | | | | | | | | | | | | | | | |
| Operating Leases | | 12.80 | | 4.45 | | 2.29 | | 5.39 | | 4.43 | | 4.64 | | 23.68 | | 21.97 |
| Finance Leases | | 4.81 | | 5.04 | | 0.00 | | 4.09 | | 4.83 | | 4.58 | | 5.44 | | 6.14 |
| Weighted-Average Discount Rate: | | | | | | | | | | | | | | | | |
| Operating Leases | | 3.89 | % | | 4.29 | % | | 4.55 | % | | 4.20 | % | | 4.11 | % | | 4.17 | % | | 3.76 | % | | 3.60 | % |
| Finance Leases | | 6.43 | % | | 5.73 | % | | — | % | | 6.69 | % | | 9.07 | % | | 5.59 | % | | 5.48 | % | | 5.73 | % |
| | | | | | | | | | | | | | | | | | | | | | | | | | | | | | | | | | | | | | | | | | | | | | | | | | |
| December 31, 2023 | | AEP | | AEP Texas | | AEPTCo | | APCo | | I&M | | OPCo | | PSO | | SWEPCo |
| Weighted-Average Remaining Lease Term (years): | | | | | | | | | | | | | | | | |
| Operating Leases | | 12.58 | | 3.99 | | 2.76 | | 6.01 | | 4.53 | | 5.36 | | 23.85 | | 22.50 |
| Finance Leases | | 4.63 | | 5.13 | | 0.00 | | 4.16 | | 4.95 | | 4.97 | | 5.76 | | 4.78 |
| Weighted-Average Discount Rate: | | | | | | | | | | | | | | | | |
| Operating Leases | | 3.73 | % | | 4.23 | % | | 3.61 | % | | 3.50 | % | | 3.89 | % | | 3.93 | % | | 3.72 | % | | 3.53 | % |
| Finance Leases | | 6.19 | % | | 5.27 | % | | — | % | | 7.04 | % | | 8.62 | % | | 5.32 | % | | 5.14 | % | | 5.22 | % |
| | | | | | | | | | | | | | | | | | | | | | | | | | | | | | | | | | | | | | | | | | | | | | | | | | |
| Year Ended December 31, 2024 | | AEP | | AEP Texas | | AEPTCo | | APCo | | I&M | | OPCo | | PSO | | SWEPCo |
| | (in millions) |
| Cash paid for amounts included in the measurement of lease liabilities: | | | | | | | | | | | | | | | | |
| Operating Cash Flows Used for Operating Leases | | $ | 143.9 | | | $ | 32.2 | | | $ | 1.3 | | | $ | 18.4 | | | $ | 19.6 | | | $ | 16.8 | | | $ | 12.5 | | | $ | 16.8 | |
| Operating Cash Flows Used for Finance Leases | | 12.0 | | | 1.4 | | | — | | | 1.5 | | | 2.2 | | | 0.9 | | | 0.7 | | | 1.7 | |
| Financing Cash Flows Used for Finance Leases | | 64.8 | | | 7.5 | | | — | | | 8.7 | | | 7.1 | | | 5.3 | | | 3.3 | | | 14.0 | |
| | | | | | | | | | | | | | | | |
| Non-cash Acquisitions Under Operating Leases | | $ | 82.3 | | | $ | 6.0 | | | $ | 1.0 | | | $ | 9.3 | | | $ | 15.0 | | | $ | 4.6 | | | $ | 2.5 | | | $ | 26.9 | |
| | | | | | | | | | | | | | | | | | | | | | | | | | | | | | | | | | | | | | | | | | | | | | | | | | |
| Year Ended December 31, 2023 | | AEP | | AEP Texas | | AEPTCo | | APCo | | I&M | | OPCo | | PSO | | SWEPCo |
| | (in millions) |
| Cash paid for amounts included in the measurement of lease liabilities: | | | | | | | | | | | | | | | | |
| Operating Cash Flows Used for Operating Leases | | $ | 146.8 | | | $ | 33.6 | | | $ | 1.3 | | | $ | 18.3 | | | $ | 19.5 | | | $ | 17.0 | | | $ | 12.5 | | | $ | 16.5 | |
| Operating Cash Flows Used for Finance Leases | | 11.9 | | | 1.4 | | | — | | | 1.8 | | | 2.5 | | | 0.9 | | | 0.7 | | | 1.4 | |
| Financing Cash Flows Used for Finance Leases | | 68.3 | | | 7.4 | | | — | | | 8.3 | | | 7.4 | | | 5.0 | | | 3.3 | | | 19.1 | |
| | | | | | | | | | | | | | | | |
| Non-cash Acquisitions Under Operating Leases | | $ | 99.8 | | | $ | 12.4 | | | $ | 1.2 | | | $ | 15.7 | | | $ | 7.9 | | | $ | 10.2 | | | $ | 15.5 | | | $ | 14.3 | |
The following tables show property, plant and equipment under finance leases and noncurrent assets under operating leases and related obligations recorded on the balance sheets. Unless shown as a separate line on the balance sheets due to materiality, net operating lease assets are included in Deferred Charges and Other Noncurrent Assets, current finance lease obligations are included in Other Current Liabilities and long-term finance lease obligations are included in Deferred Credits and Other Noncurrent Liabilities on the balance sheets. Lease obligations are not recognized on the balance sheets for lease agreements with a lease term of less than twelve months.
| | | | | | | | | | | | | | | | | | | | | | | | | | | | | | | | | | | | | | | | | | | | | | | | | | |
| December 31, 2024 | | AEP | | AEP Texas | | AEPTCo | | APCo | | I&M | | OPCo | | PSO | | SWEPCo |
| | (in millions) |
| Property, Plant and Equipment Under Finance Leases: | | | | | | | | | | | | | | | | |
| Generation | | $ | 73.8 | | | $ | — | | | $ | — | | | $ | 41.6 | | | $ | 16.6 | | | $ | — | | | $ | 0.6 | | | $ | 2.0 | |
| Other Property, Plant and Equipment | | 283.7 | | | 52.4 | | | — | | | 19.4 | | | 38.8 | | | 30.4 | | | 23.0 | | | 29.8 | |
| Total Property, Plant and Equipment | | 357.5 | | | 52.4 | | | — | | | 61.0 | | | 55.4 | | | 30.4 | | | 23.6 | | | 31.8 | |
| Accumulated Amortization | | 193.9 | | | 27.7 | | | — | | | 42.0 | | | 33.4 | | | 16.1 | | | 11.3 | | | 13.3 | |
| Net Property, Plant and Equipment Under Finance Leases | | $ | 163.6 | | | $ | 24.7 | | | $ | — | | | $ | 19.0 | | | $ | 22.0 | | | $ | 14.3 | | | $ | 12.3 | | | $ | 18.5 | |
| | | | | | | | | | | | | | | | |
| Obligations Under Finance Leases: | | | | | | | | | | | | | | | | |
| Noncurrent Liability | | $ | 117.1 | | | $ | 18.2 | | | $ | — | | | $ | 11.2 | | | $ | 15.9 | | | $ | 10.2 | | | $ | 9.5 | | | $ | 14.8 | |
| Liability Due Within One Year | | 46.5 | | | 6.5 | | | — | | | 7.8 | | | 6.1 | | | 4.1 | | | 2.8 | | | 3.7 | |
| Total Obligations Under Finance Leases | | $ | 163.6 | | | $ | 24.7 | | | $ | — | | | $ | 19.0 | | | $ | 22.0 | | | $ | 14.3 | | | $ | 12.3 | | | $ | 18.5 | |
| | | | | | | | | | | | | | | | | | | | | | | | | | | | | | | | | | | | | | | | | | | | | | | | | | |
| December 31, 2023 | | AEP | | AEP Texas | | AEPTCo | | APCo | | I&M | | OPCo | | PSO | | SWEPCo |
| | (in millions) |
| Property, Plant and Equipment Under Finance Leases: | | | | | | | | | | | | | | | | |
| Generation | | $ | 120.1 | | | $ | — | | | $ | — | | | $ | 41.0 | | | $ | 28.2 | | | $ | — | | | $ | 0.6 | | | $ | 25.3 | |
| Other Property, Plant and Equipment | | 305.9 | | | 53.9 | | | — | | | 22.1 | | | 42.3 | | | 33.7 | | | 25.5 | | | 32.0 | |
| Total Property, Plant and Equipment | | 426.0 | | | 53.9 | | | — | | | 63.1 | | | 70.5 | | | 33.7 | | | 26.1 | | | 57.3 | |
| Accumulated Amortization | | 221.5 | | | 26.3 | | | — | | | 37.1 | | | 39.0 | | | 15.5 | | | 12.3 | | | 28.3 | |
| Net Property, Plant and Equipment Under Finance Leases | | $ | 204.5 | | | $ | 27.6 | | | $ | — | | | $ | 26.0 | | | $ | 31.5 | | | $ | 18.2 | | | $ | 13.8 | | | $ | 29.0 | |
| | | | | | | | | | | | | | | | |
| Obligations Under Finance Leases: | | | | | | | | | | | | | | | | |
| Noncurrent Liability | | $ | 139.9 | | | $ | 20.6 | | | $ | — | | | $ | 17.8 | | | $ | 20.8 | | | $ | 13.2 | | | $ | 10.7 | | | $ | 18.8 | |
| Liability Due Within One Year | | 65.7 | | | 7.0 | | | — | | | 8.2 | | | 10.7 | | | 5.0 | | | 3.1 | | | 11.3 | |
| Total Obligations Under Finance Leases | | $ | 205.6 | | | $ | 27.6 | | | $ | — | | | $ | 26.0 | | | $ | 31.5 | | | $ | 18.2 | | | $ | 13.8 | | | $ | 30.1 | |
| | | | | | | | | | | | | | | | | | | | | | | | | | | | | | | | | | | | | | | | | | | | | | | | | | |
| December 31, 2024 | | AEP | | AEP Texas | | AEPTCo | | APCo | | I&M | | OPCo | | PSO | | SWEPCo |
| | (in millions) |
| Operating Lease Assets | | $ | 580.1 | | | $ | 54.4 | | | $ | 2.3 | | | $ | 67.0 | | | $ | 51.5 | | | $ | 60.4 | | | $ | 106.2 | | | $ | 141.0 | |
| | | | | | | | | | | | | | | | |
| Obligations Under Operating Leases: | | | | | | | | | | | | | | | | |
| Noncurrent Liability | | $ | 504.3 | | | $ | 43.4 | | | $ | 1.2 | | | $ | 54.0 | | | $ | 40.1 | | | $ | 48.4 | | | $ | 101.9 | | | $ | 137.5 | |
| Liability Due Within One Year | | 91.9 | | | 13.1 | | | 1.3 | | | 13.7 | | | 12.3 | | | 12.3 | | | 10.4 | | | 8.2 | |
| Total Obligations Under Operating Leases | | $ | 596.2 | | | $ | 56.5 | | | $ | 2.5 | | | $ | 67.7 | | | $ | 52.4 | | | $ | 60.7 | | | $ | 112.3 | | | $ | 145.7 | |
| | | | | | | | | | | | | | | | | | | | | | | | | | | | | | | | | | | | | | | | | | | | | | | | | | |
| December 31, 2023 | | AEP | | AEP Texas | | AEPTCo | | APCo | | I&M | | OPCo | | PSO | | SWEPCo |
| | (in millions) |
| Operating Lease Assets | | $ | 620.2 | | | $ | 77.6 | | | $ | 2.6 | | | $ | 73.7 | | | $ | 53.8 | | | $ | 69.9 | | | $ | 112.8 | | | $ | 126.3 | |
| | | | | | | | | | | | | | | | |
| Obligations Under Operating Leases: | | | | | | | | | | | | | | | | |
| Noncurrent Liability | | $ | 519.4 | | | $ | 50.9 | | | $ | 1.4 | | | $ | 59.8 | | | $ | 37.7 | | | $ | 56.7 | | | $ | 106.8 | | | $ | 122.5 | |
| Liability Due Within One Year | | 115.7 | | | 28.7 | | | 1.3 | | | 14.6 | | | 16.8 | | | 13.5 | | | 10.1 | | | 9.0 | |
| Total Obligations Under Operating Leases | | $ | 635.1 | | | $ | 79.6 | | | $ | 2.7 | | | $ | 74.4 | | | $ | 54.5 | | | $ | 70.2 | | | $ | 116.9 | | | $ | 131.5 | |
Future minimum lease payments consisted of the following as of December 31, 2024:
| | | | | | | | | | | | | | | | | | | | | | | | | | | | | | | | | | | | | | | | | | | | | | | | | | |
| Finance Leases | | AEP | | AEP Texas | | AEPTCo | | APCo | | I&M | | OPCo | | PSO | | SWEPCo |
| | (in millions) |
| 2025 | | $ | 55.6 | | | $ | 7.8 | | | $ | — | | | $ | 8.9 | | | $ | 7.7 | | | $ | 4.8 | | | $ | 3.4 | | | $ | 4.7 | |
| 2026 | | 39.8 | | | 6.2 | | | — | | | 4.0 | | | 4.9 | | | 3.6 | | | 2.9 | | | 4.0 | |
| 2027 | | 30.5 | | | 4.5 | | | — | | | 2.5 | | | 4.1 | | | 2.6 | | | 2.3 | | | 3.3 | |
| 2028 | | 23.1 | | | 3.1 | | | — | | | 2.0 | | | 3.4 | | | 2.0 | | | 1.8 | | | 2.7 | |
| 2029 | | 15.5 | | | 2.4 | | | — | | | 1.6 | | | 2.8 | | | 1.4 | | | 1.3 | | | 2.4 | |
| After 2029 | | 26.4 | | | 4.7 | | | — | | | 2.5 | | | 4.7 | | | 1.9 | | | 2.6 | | | 5.0 | |
| Total Future Minimum Lease Payments | | 190.9 | | | 28.7 | | | — | | | 21.5 | | | 27.6 | | | 16.3 | | | 14.3 | | | 22.1 | |
| Less: Imputed Interest | | 27.3 | | | 4.0 | | | — | | | 2.5 | | | 5.6 | | | 2.0 | | | 2.0 | | | 3.6 | |
| Estimated Present Value of Future Minimum Lease Payments | | $ | 163.6 | | | $ | 24.7 | | | $ | — | | | $ | 19.0 | | | $ | 22.0 | | | $ | 14.3 | | | $ | 12.3 | | | $ | 18.5 | |
| | | | | | | | | | | | | | | | | | | | | | | | | | | | | | | | | | | | | | | | | | | | | | | | | | |
| Operating Leases | | AEP | | AEP Texas | | AEPTCo | | APCo | | I&M | | OPCo | | PSO | | SWEPCo |
| | (in millions) |
| 2025 | | $ | 123.0 | | | $ | 16.7 | | | $ | 1.3 | | | $ | 17.3 | | | $ | 15.9 | | | $ | 16.3 | | | $ | 11.6 | | | $ | 17.6 | |
| 2026 | | 107.8 | | | 14.5 | | | 0.7 | | | 15.3 | | | 15.0 | | | 15.1 | | | 10.8 | | | 15.5 | |
| 2027 | | 94.0 | | | 11.9 | | | 0.3 | | | 13.6 | | | 11.0 | | | 13.5 | | | 9.8 | | | 14.1 | |
| 2028 | | 78.5 | | | 8.9 | | | 0.3 | | | 11.4 | | | 9.0 | | | 11.3 | | | 8.4 | | | 12.1 | |
| 2029 | | 52.3 | | | 4.9 | | | — | | | 8.2 | | | 4.4 | | | 6.6 | | | 6.5 | | | 9.0 | |
| After 2029 | | 340.0 | | | 6.5 | | | — | | | 10.2 | | | 2.4 | | | 4.9 | | | 123.7 | | | 178.1 | |
| Total Future Minimum Lease Payments | | 795.6 | | | 63.4 | | | 2.6 | | | 76.0 | | | 57.7 | | | 67.7 | | | 170.8 | | | 246.4 | |
| Less: Imputed Interest | | 199.4 | | | 6.9 | | | 0.1 | | | 8.3 | | | 5.3 | | | 7.0 | | | 58.5 | | | 100.7 | |
| Estimated Present Value of Future Minimum Lease Payments | | $ | 596.2 | | | $ | 56.5 | | | $ | 2.5 | | | $ | 67.7 | | | $ | 52.4 | | | $ | 60.7 | | | $ | 112.3 | | | $ | 145.7 | |
Master Lease Agreements (Applies to all Registrants except AEPTCo)
The Registrants lease certain equipment under master lease agreements. Under the lease agreements, the lessor is guaranteed a residual value up to a stated percentage of the equipment cost at the end of the lease term. If the actual fair value of the leased equipment is below the guaranteed residual value at the end of the lease term, the Registrants are committed to pay the difference between the actual fair value and the residual value guarantee. Historically, at the end of the lease term the fair value has been in excess of the amount guaranteed. As of December 31, 2024, the maximum potential loss by the Registrants for these lease agreements assuming the fair value of the equipment is zero at the end of the lease term was as follows:
| | | | | | | | |
| Company | | Maximum
Potential Loss |
| | (in millions) |
| AEP | | $ | 41.3 | |
| AEP Texas | | 9.4 | |
| APCo | | 5.4 | |
| I&M | | 3.9 | |
| OPCo | | 6.8 | |
| PSO | | 3.9 | |
| SWEPCo | | 4.7 | |
Lessor Activity
The Registrants’ lessor activity was immaterial as of and for the years ended December 31, 2024 and December 31, 2023, respectively.
14. VOLUNTARY SEVERANCE PROGRAM
In April 2024, management announced a voluntary severance program designed to achieve a reduction in the size of AEP’s workforce. Approximately 7,400 of AEP’s 16,800 employees were eligible to participate in the program. Approximately 1,000 employees chose to take the voluntary severance package and substantially all terminated employment in July 2024. The severance program provides two weeks of base pay for every year of service with a minimum of four weeks and a maximum of 52 weeks of base pay. Certain positions impacted by the voluntary severance program have been and will continue to be refilled to maintain safe, effective and efficient operations. Net savings from the program will help offset increasing operating expenses and high interest costs in order to keep electricity costs affordable for customers.
AEP recorded a charge to expense in the second quarter of 2024 related to this voluntary severance program.
| | | | | | | | | | | | | | | | | | | | | | | | | | | | | | | | | | | | | | | | | | | | | | | | | | |
| | AEP | | AEP Texas | | AEPTCo | | APCo | | I&M | | OPCo | | PSO | | SWEPCo |
| | (in millions) |
| Severance Expense Incurred | | $ | 122.0 | | | $ | 19.8 | | | $ | 10.7 | | | $ | 26.5 | | | $ | 14.8 | | | $ | 14.8 | | | $ | 10.1 | | | $ | 16.9 | |
| Settled | | 117.6 | | | 19.8 | | | 10.7 | | | 26.3 | | | 14.6 | | | 14.6 | | | 10.1 | | | 16.3 | |
| Remaining Balance as of December 31, 2024 | | $ | 4.4 | | | $ | — | | | $ | — | | | $ | 0.2 | | | $ | 0.2 | | | $ | 0.2 | | | $ | — | | | $ | 0.6 | |
These expenses were primarily included in Other Operation and Maintenance on the statements of income and Other Current Liabilities on the balance sheets. Settlement accounting was triggered for the qualified pension plan in November 2024 under the accounting guidance for “Compensation - Retirement Benefits”. A settlement charge of $90 million was recorded. AEP will seek recovery for the portion of the expense related to regulated operations. See Note 8 - Benefit Plans for additional information associated with the plan.
15. FINANCING ACTIVITIES
The disclosures in this note apply to all Registrants, unless indicated otherwise.
Common Stock (Applies to AEP)
The following table is a reconciliation of common stock share activity:
| | | | | | | | | | | | | | | | | |
| Shares of AEP Common Stock | | Issued | | Held in Treasury | |
| Balance, December 31, 2021 | | 524,416,175 | | | 20,204,160 | | |
| Issued | | 683,146 | | | — | | |
| Treasury Stock Reissued | | — | | | (8,970,920) | | (a) |
| Balance, December 31, 2022 | | 525,099,321 | | | 11,233,240 | | |
| Issued | | 2,269,836 | | | — | | |
| Treasury Stock Reissued | | — | | | (10,048,668) | | (a) |
| Balance, December 31, 2023 | | 527,369,157 | | | 1,184,572 | | |
| Issued | | 6,725,373 | | | — | | |
| Treasury Stock Reacquired | | — | | | 2,243 | | |
| Balance, December 31, 2024 | | 534,094,530 | | | 1,186,815 | | |
(a)Reissued Treasury Stock used to fulfill share commitments related to AEP’s Equity Units.
ATM Program
In 2023, AEP filed a prospectus supplement and executed an Equity Distribution Agreement, pursuant to which AEP may sell, from time to time, up to an aggregate of $1.7 billion of its common stock through an ATM offering program, including an equity forward sales component. The compensation paid to the selling agents by AEP may be up to 2% of the gross offering proceeds of the shares. For the year ended 2024, AEP issued 4,437,136 shares of common stock and received net cash proceeds of $397 million under the ATM program. As of December 31, 2024, approximately $1.3 billion of equity is available for issuance under the ATM program.
Long-term Debt
The following table details long-term debt outstanding:
| | | | | | | | | | | | | | | | | | | | | | | | | | | | | | | | | | | | | | | | |
| | | | Weighted-Average | | Interest Rate Ranges as of | | Outstanding as of | | |
| | | | Interest Rate as of | | December 31, | | December 31, | | |
| Company | | Maturity | | December 31, 2024 | | 2024 | | 2023 | | 2024 | | 2023 | | |
| AEP | | | | | | | | | | (in millions) | | |
| Senior Unsecured Notes | | 2025-2054 | | 4.32% | | 1.00%-8.13% | | 1.00%-8.13% | | $ | 36,410.9 | | | $ | 33,779.4 | | | |
| Pollution Control Bonds (a) | | 2025-2036 (b) | | 3.26% | | 0.63%-4.70% | | 0.63%-4.90% | | 1,771.3 | | | 1,771.6 | | | |
| Notes Payable – Nonaffiliated (c) | | 2025-2034 | | 6.49% | | 0.93%-6.89% | | 0.93%-6.59% | | 609.9 | | | 193.3 | | | |
| Securitization Bonds | | 2025-2039 (d) | | 4.08% | | 2.06%-4.88% | | 2.06%-3.77% | | 578.0 | | | 368.9 | | | |
| Spent Nuclear Fuel Obligation (e) | | | | | | | | | | 316.3 | | | 300.4 | | | |
| Junior Subordinated Notes | | 2025-2054 | | 5.67% | | 3.88%-7.05% | | 2.03%-5.70% | | 2,579.1 | | | 2,388.1 | | | |
| Other Long-term Debt | | 2025-2059 | | 5.60% | | 3.00%-13.72% | | 3.00%-13.72% | | 377.3 | | | 1,341.5 | | | |
| Total Long-term Debt Outstanding | | | | | | | | | | $ | 42,642.8 | | | $ | 40,143.2 | | | |
| | | | | | | | | | | | | | |
| AEP Texas | | | | | | | | | | | | | | |
| Senior Unsecured Notes | | 2025-2052 | | 4.39% | | 2.10%-6.76% | | 2.10%-6.76% | | $ | 5,873.8 | | | $ | 5,027.2 | | | |
| Pollution Control Bonds (a) | | 2029-2030 (b) | | 3.88% | | 2.60%-4.55% | | 2.60%-4.55% | | 440.3 | | | 440.3 | | | |
| | | | | | | | | | | | | | |
| Securitization Bonds | | 2025-2029 (d) | | 2.27% | | 2.06%-2.29% | | 2.06%-2.84% | | 126.8 | | | 221.8 | | | |
| Other Long-term Debt | | 2059 | | 4.50% | | 4.50% | | 4.50%-6.71% | | 0.7 | | | 200.5 | | | |
| Total Long-term Debt Outstanding | | | | | | | | | | $ | 6,441.6 | | | $ | 5,889.8 | | | |
| | | | | | | | | | | | | | |
| AEPTCo | | | | | | | | | | | | | | |
| Senior Unsecured Notes | | 2025-2053 | | 4.12% | | 2.75%-5.52% | | 2.75%-5.52% | | $ | 5,768.1 | | | $ | 5,414.4 | | | |
| | | | | | | | | | | | | | |
| | | | | | | | | | | | | | |
| | | | | | | | | | | | | | |
| Total Long-term Debt Outstanding | | | | | | | | | | $ | 5,768.1 | | | $ | 5,414.4 | | | |
| | | | | | | | | | | | | | |
| APCo | | | | | | | | | | | | | | |
| Senior Unsecured Notes | | 2025-2050 | | 4.75% | | 2.70%-7.00% | | 2.70%-7.00% | | $ | 4,984.1 | | | $ | 4,584.9 | | | |
| Pollution Control Bonds (a) | | 2025-2036 (b) | | 2.95% | | 0.63%-4.22% | | 0.63%-4.90% | | 429.9 | | | 430.0 | | | |
| | | | | | | | | | | | | | |
| Securitization Bonds | | 2028 (d) | | 3.77% | | 3.77% | | 3.77% | | 119.8 | | | 147.0 | | | |
| Other Long-term Debt | | 2025-2026 | | 5.84% | | 5.75%-13.72% | | 6.46%-13.72% | | 126.5 | | | 426.4 | | | |
| Total Long-term Debt Outstanding | | | | | | | | | | $ | 5,660.3 | | | $ | 5,588.3 | | | |
| | | | | | | | | | | | | | |
| I&M | | | | | | | | | | | | | | |
| Senior Unsecured Notes | | 2028-2053 | | 4.52% | | 3.25%-6.05% | | 3.25%-6.05% | | $ | 2,845.2 | | | $ | 2,843.6 | | | |
| Pollution Control Bonds (a) | | 2025 (b) | | 2.49% | | 0.75%-3.05% | | 0.75%-3.05% | | 189.9 | | | 189.4 | | | |
| Notes Payable – Nonaffiliated (c) | | 2025-2028 | | 5.78% | | 0.93%-6.41% | | 0.93%-6.59% | | 142.7 | | | 163.3 | | | |
| | | | | | | | | | | | | | |
| Spent Nuclear Fuel Obligation (e) | | | | | | | | | | 316.3 | | | 300.4 | | | |
| Other Long-term Debt | | 2025 | | 6.00% | | 6.00% | | 6.00% | | 0.2 | | | 2.7 | | | |
| Total Long-term Debt Outstanding | | | | | | | | | | $ | 3,494.3 | | | $ | 3,499.4 | | | |
| | | | | | | | | | | | | | |
| OPCo | | | | | | | | | | | | | | |
| Senior Unsecured Notes | | 2030-2051 | | 4.16% | | 1.63%-6.60% | | 1.63%-6.60% | | $ | 3,715.7 | | | $ | 3,366.8 | | | |
| | | | | | | | | | | | | | |
| | | | | | | | | | | | | | |
| | | | | | | | | | | | | | |
| | | | | | | | | | | | | | |
| Total Long-term Debt Outstanding | | | | | | | | | | $ | 3,715.7 | | | $ | 3,366.8 | | | |
| | | | | | | | | | | | | | |
| PSO | | | | | | | | | | | | | | |
| Senior Unsecured Notes | | 2025-2051 | | 4.29% | | 2.20%-6.63% | | 2.20%-6.63% | | $ | 2,854.2 | | | $ | 2,257.8 | | | |
| | | | | | | | | | | | | | |
| | | | | | | | | | | | | | |
| | | | | | | | | | | | | | |
| Other Long-term Debt | | 2027 | | 3.00% | | 3.00% | | 3.00%-6.71% | | 1.4 | | | 126.8 | | | |
| Total Long-term Debt Outstanding | | | | | | | | | | $ | 2,855.6 | | | $ | 2,384.6 | | | |
| | | | | | | | | | | | | | |
| SWEPCo | | | | | | | | | | | | | | |
| Senior Unsecured Notes | | 2026-2051 | | 3.73% | | 1.65%-6.20% | | 1.65%-6.20% | | $ | 3,649.4 | | | $ | 3,646.9 | | | |
| | | | | | | | | | | | | | |
| | | | | | | | | | | | | | |
| Securitization Bonds | | 2039 (d) | | 4.88% | | 4.88% | | —% | | 331.4 | | | — | | | |
| | | | | | | | | | | | | | |
| Total Long-term Debt Outstanding | | | | | | | | | | $ | 3,980.8 | | | $ | 3,646.9 | | | |
(a)For certain series of Pollution Control Bonds, interest rates are subject to periodic adjustment. Certain series may be purchased on demand at periodic interest adjustment dates. Letters of credit from banks and insurance policies support certain series. Consequently, these bonds have been classified for maturity purposes as Long-term Debt Due Within One Year - Nonaffiliated on the balance sheets.
(b)Certain Pollution Control Bonds are subject to redemption earlier than the maturity date.
(c)Notes payable represent outstanding promissory notes issued under term loan agreements and credit agreements with a number of banks and other financial institutions. At expiration, all notes then issued and outstanding are due and payable. Interest rates are both fixed and variable. Variable rates generally relate to specified short-term interest rates.
(d)Dates represent the scheduled final payment dates for the securitization bonds. The legal maturity date is one to two years later. These bonds have been classified for maturity and repayment purposes based on the scheduled final payment date.
(e)Spent Nuclear Fuel Obligation consists of a liability along with accrued interest for disposal of SNF. See “Spent Nuclear Fuel Disposal” section of Note 6 for additional information.
As of December 31, 2024, outstanding long-term debt was payable as follows:
| | | | | | | | | | | | | | | | | | | | | | | | | | | | | | | | | | | | | | | | | | | | | | | | | | |
| | AEP | | AEP Texas | | AEPTCo | | APCo | | I&M | | OPCo | | PSO | | SWEPCo |
| | (in millions) |
| 2025 | | $ | 3,335.0 | | | $ | 324.5 | | | $ | 90.0 | | | $ | 798.6 | | | $ | 269.2 | | | $ | — | | | $ | 125.6 | | | $ | 22.7 | |
| 2026 | | 1,864.4 | | | 75.0 | | | 425.0 | | | 30.9 | | | 43.6 | | | — | | | 50.6 | | | 916.6 | |
| 2027 | | 2,283.6 | | | 25.6 | | | — | | | 355.6 | | | 13.7 | | | — | | | 0.3 | | | 17.4 | |
| 2028 | | 2,592.0 | | | 526.2 | | | 60.0 | | | 117.8 | | | 356.5 | | | — | | | — | | | 593.3 | |
| 2029 | | 2,694.0 | | | 627.4 | | | 55.0 | | | — | | | — | | | — | | | 100.0 | | | 19.2 | |
| After 2029 | | 30,212.8 | | | 4,912.8 | | | 5,201.0 | | | 4,400.0 | | | 2,841.3 | | | 3,750.0 | | | 2,600.0 | | | 2,442.4 | |
| Principal Amount | | 42,981.8 | | | 6,491.5 | | | 5,831.0 | | | 5,702.9 | | | 3,524.3 | | | 3,750.0 | | | 2,876.5 | | | 4,011.6 | |
| Unamortized Discount, Net and Debt Issuance Costs | | (339.0) | | | (49.9) | | | (62.9) | | | (42.6) | | | (30.0) | | | (34.3) | | | (20.9) | | | (30.8) | |
| Total Long-term Debt Outstanding | | $ | 42,642.8 | | | $ | 6,441.6 | | | $ | 5,768.1 | | | $ | 5,660.3 | | | $ | 3,494.3 | | | $ | 3,715.7 | | | $ | 2,855.6 | | | $ | 3,980.8 | |
Long-term Debt Subsequent Events
In January and February 2025, I&M retired $9 million and $4 million, respectively, of Notes Payable related to DCC Fuel.
In January 2025, Transource Energy issued $2 million of variable rate Other Long-term Debt due in 2025.
In January 2025, KPCo entered into a $150 million term loan due in February 2026.
In February 2025, APCo retired $14 million of Securitization Bonds.
In February 2025, AEP Texas retired $12 million of Securitization Bonds.
Financing Plan (Applies to AEP and AEP Texas)
As of December 31, 2024, the balance sheet of AEP Texas reflects negative working capital primarily driven by Long-term Debt Due within One Year - Nonaffiliated, Advances from Affiliates and Accounts Payable. In the near term, AEP Texas plans to issue long- term debt to provide additional liquidity and also intends to refinance the Long-term Debt due in 2025 on a long-term basis. While AEP Texas has historically been able to access the capital markets and refinance debt as it comes due, there is no guarantee this will occur. Accordingly, Parent, having available liquidity, has committed to provide sufficient liquidity to AEP Texas, as necessary, to continue operations and meet obligations as they become due until AEP Texas is able to execute its upcoming financing plan. Therefore, management does not believe there is a substantial doubt about AEP Texas’ ability to continue as a going-concern and the AEP Texas financial statements have been prepared on a going-concern basis, which contemplates the realization of assets and the satisfaction of obligations in the normal course of business.
Debt Covenants (Applies to AEP and AEPTCo)
Covenants in AEPTCo’s note purchase agreements and indenture limit the amount of contractually-defined priority debt (which includes a further sub-limit of $50 million of secured debt) to 10% of consolidated tangible net assets. AEPTCo’s contractually-defined priority debt was 0.6% of consolidated tangible net assets as of December 31, 2024. The method for calculating the consolidated tangible net assets is contractually-defined in the note purchase agreements.
Dividend Restrictions
Subsidiary Restrictions
Parent depends on its subsidiaries to pay dividends to shareholders. AEP’s subsidiaries pay dividends to Parent provided funds are legally available. Various financing arrangements and regulatory requirements may impose certain restrictions on the ability of the subsidiaries to transfer funds to Parent in the form of dividends.
All of the dividends declared by AEP’s utility subsidiaries that provide transmission or local distribution services are subject to a Federal Power Act requirement that prohibits the payment of dividends out of capital accounts in certain circumstances; payment of dividends is generally allowed out of retained earnings. The Federal Power Act also creates a reserve on earnings attributable to hydroelectric generation plants. Because of their ownership of such plants, this reserve applies to APCo and I&M.
Certain AEP subsidiaries have credit agreements that contain covenants that limit their debt-to-capitalization ratio to 67.5%. The method for calculating outstanding debt and capitalization is contractually-defined in the credit agreements.
The most restrictive dividend limitation for certain AEP subsidiaries is through the Federal Power Act restriction, while for other AEP subsidiaries the most restrictive dividend limitation is through the credit agreements. As of December 31, 2024, the maximum amount of restricted net assets of AEP’s subsidiaries that may not be distributed to the Parent in the form of a loan, advance or dividend was $17.4 billion.
The Federal Power Act restriction limits the ability of the AEP subsidiaries owning hydroelectric generation to pay dividends out of retained earnings. Additionally, the credit agreement covenant restrictions can limit the ability of the AEP subsidiaries to pay dividends out of retained earnings. As of December 31, 2024, the amount of any such restrictions were as follows:
| | | | | | | | | | | | | | | | | | | | | | | | | | | | | | | | | | | | | | | | | | | | | | | | | | |
| | AEP | | AEP Texas | | AEPTCo | | APCo | | I&M | | OPCo | | PSO | | SWEPCo |
| | (in millions) |
| Restricted Retained Earnings | | $ | 3,247.9 | | (a) | $ | 1,109.2 | | | $ | — | | | $ | 539.2 | | | $ | 707.0 | | | $ | — | | | $ | 267.7 | | | $ | 366.5 | |
(a) Includes the restrictions of consolidated and non-consolidated subsidiaries.
Parent Restrictions (Applies to AEP)
The holders of AEP’s common stock are entitled to receive the dividends declared by the Board of Directors provided funds are legally available for such dividends. Parent’s income primarily derives from common stock equity in the earnings of its utility subsidiaries.
Pursuant to the leverage restrictions in credit agreements, AEP must maintain a percentage of debt-to-total capitalization at a level that does not exceed 67.5%. The method for calculating outstanding debt and capitalization is contractually-defined in the credit agreements. AEP may not declare or pay any cash dividend or distribution on its common stock during any period when AEP defers interest on its junior subordinated notes. As of December 31, 2024, AEP had $8.6 billion of available retained earnings to pay dividends to common shareholders. AEP paid $1.9 billion, $1.8 billion and $1.6 billion of dividends to common shareholders for the years ended December 31, 2024, 2023 and 2022, respectively.
Lines of Credit and Short-term Debt (Applies to AEP and SWEPCo)
AEP uses its commercial paper program to meet the short-term borrowing needs of its subsidiaries. The program funds a Utility Money Pool, which funds AEP’s utility subsidiaries; a Nonutility Money Pool, which funds certain AEP nonutility subsidiaries; and the short-term debt requirements of subsidiaries that are not participating in either money pool for regulatory or operational reasons, as direct borrowers. As of December 31, 2024, AEP had $6 billion in revolving credit facilities to support its commercial paper program.
Securitized Debt for Receivables, for the year ended 2024, had a weighted-average interest rate of 5.39% and a maximum amount outstanding of $900 million. The commercial paper program, for the year ended 2024, had a weighted-average yield of 5.39% and a maximum amount outstanding of $2.9 billion. AEP’s outstanding short-term debt was as follows:
| | | | | | | | | | | | | | | | | | | | | | | | | | | | | | | | |
| | | | December 31, |
| | | | 2024 | | 2023 |
| Company | | Type of Debt | | Outstanding
Amount | | Interest
Rate (a) | | Outstanding
Amount | | Interest
Rate (a) |
| | | | (in millions) | | | | (in millions) | | |
| AEP | | Securitized Debt for Receivables (b) | | $ | 900.0 | | | 4.73 | % | | $ | 888.0 | | | 5.65 | % |
| AEP | | Commercial Paper | | 1,618.3 | | | 4.70 | % | | 1,937.9 | | | 5.69 | % |
| | | | | | | | | | |
| | | | | | | | | | |
| | | | | | | | | | |
| | | | | | | | | | |
| | | | | | | | | | |
| | | | | | | | | | |
| | | | | | | | | | |
| SWEPCo | | Notes Payable | | 5.5 | | | 6.69 | % | | 4.3 | | | 7.71 | % |
| | Total Short-term Debt | | $ | 2,523.8 | | | | | $ | 2,830.2 | | | |
(a) Weighted-average rate of all borrowings outstanding as of December 31, 2024 and 2023, respectively.
(b) Amount of securitized debt for receivables as accounted for under the “Transfers and Servicing” accounting guidance.
Corporate Borrowing Program (Applies to Registrant Subsidiaries)
AEP subsidiaries use a corporate borrowing program to meet their short-term borrowing needs. The corporate borrowing program includes a Utility Money Pool, which funds AEP’s utility subsidiaries; a Nonutility Money Pool, which funds certain AEP nonutility subsidiaries; and direct borrowing from AEP. The AEP Utility Money Pool operates in accordance with the terms and conditions of its agreement filed with the FERC. The amounts of outstanding loans to (borrowings from) the Utility Money Pool as of December 31, 2024 and 2023 are included in Advances to Affiliates and Advances from Affiliates, respectively, on the Registrant Subsidiaries’ balance sheets. The Utility Money Pool participants’ money pool activity and corresponding authorized borrowing limits are described in the following tables:
Year Ended December 31, 2024:
| | | | | | | | | | | | | | | | | | | | | | | | | | | | | | | | | | | | | | | | | |
| | Maximum | | | | Average | | | | Net Loans to | | | |
| | Borrowings | | Maximum | | Borrowings | | Average | | (Borrowings from) | | Authorized | |
| | from the | | Loans to the | | from the | | Loans to the | | the Utility Money | | Short-term | |
| | Utility | | Utility | | Utility | | Utility | | Pool as of | | Borrowing | |
| Company | | Money Pool | | Money Pool | | Money Pool | | Money Pool | | December 31, 2024 | | Limit | |
| | (in millions) | |
| AEP Texas | | $ | 374.6 | | | $ | 274.3 | | | $ | 233.8 | | | $ | 165.1 | | | $ | (284.9) | | | $ | 600.0 | | |
| AEPTCo | | 313.3 | | | 332.0 | | | 71.8 | | | 138.4 | | | (72.9) | | | 820.0 | | (a) |
| APCo | | 399.5 | | | 132.3 | | | 102.6 | | | 29.7 | | | (77.3) | | | 750.0 | | |
| I&M | | 135.8 | | | 8.4 | | | 58.8 | | | 3.9 | | | (126.8) | | | 500.0 | | |
| OPCo | | 310.0 | | | 183.4 | | | 180.5 | | | 94.2 | | | 114.9 | | | 600.0 | | |
| PSO | | 308.9 | | | 314.5 | | | 171.4 | | | 287.7 | | | 232.0 | | | 750.0 | | |
| SWEPCo | | 362.2 | | | 59.3 | | | 249.5 | | | 57.3 | | | (275.0) | | | 750.0 | | |
Year Ended December 31, 2023:
| | | | | | | | | | | | | | | | | | | | | | | | | | | | | | | | | | | | | | | | | |
| | Maximum | | | | Average | | | | Net Loans to | | | |
| | Borrowings | | Maximum | | Borrowings | | Average | | (Borrowings from) | | Authorized | |
| | from the | | Loans to the | | from the | | Loans to the | | the Utility Money | | Short-term | |
| | Utility | | Utility | | Utility | | Utility | | Pool as of | | Borrowing | |
| Company | | Money Pool | | Money Pool | | Money Pool | | Money Pool | | December 31, 2023 | | Limit | |
| | (in millions) | |
| AEP Texas | | $ | 477.5 | | | $ | 42.0 | | | $ | 216.8 | | | $ | 12.9 | | | $ | (103.7) | | | $ | 600.0 | | |
| AEPTCo | | 471.3 | | | 309.4 | | | 135.6 | | | 70.5 | | | (62.8) | | | 820.0 | | (a) |
| APCo | | 388.6 | | | 19.8 | | | 283.5 | | | 19.0 | | | (320.7) | | | 750.0 | | |
| I&M | | 475.3 | | | 112.2 | | | 84.0 | | | 44.2 | | | (63.3) | | | 500.0 | | |
| OPCo | | 485.7 | | | 64.7 | | | 183.0 | | | 40.2 | | | (110.5) | | | 500.0 | | |
| PSO | | 375.0 | | | 121.5 | | | 92.5 | | | 49.6 | | | (54.4) | | | 750.0 | | |
| SWEPCo | | 401.6 | | | 25.8 | | | 150.7 | | | 16.5 | | | (88.7) | | | 750.0 | | |
(a) Amount represents the combined authorized short-term borrowing limit the State Transcos have from FERC or state regulatory commissions.
The activity in the above tables does not include short-term lending activity of certain AEP nonutility subsidiaries. AEP Texas’ wholly-owned subsidiary, AEP Texas North Generation Company, LLC and SWEPCo’s wholly-owned subsidiary, Mutual Energy SWEPCo, LLC participate in the Nonutility Money Pool. The amounts of outstanding loans to the Nonutility Money Pool as of December 31, 2024 and 2023 are included in Advances to Affiliates on each subsidiaries’ balance sheets. The Nonutility Money Pool participants’ money pool activity is described in the following tables:
Year Ended December 31, 2024:
| | | | | | | | | | | | | | | | | | | | |
| | Maximum Loans | | Average Loans | | Loans to the Nonutility |
| | to the Nonutility | | to the Nonutility | | Money Pool as of |
| Company | | Money Pool | | Money Pool | | December 31, 2024 |
| | (in millions) |
| AEP Texas | | $ | 7.2 | | | $ | 7.1 | | | $ | 7.2 | |
| SWEPCo | | 2.9 | | | 2.6 | | | 2.3 | |
Year Ended December 31, 2023:
| | | | | | | | | | | | | | | | | | | | |
| | Maximum Loans | | Average Loans | | Loans to the Nonutility |
| | to the Nonutility | | to the Nonutility | | Money Pool as of |
| Company | | Money Pool | | Money Pool | | December 31, 2023 |
| | (in millions) |
| AEP Texas | | $ | 7.1 | | | $ | 6.9 | | | $ | 7.1 | |
| SWEPCo | | 2.8 | | | 2.4 | | | 2.2 | |
AEP has a direct financing relationship with AEPTCo to meet its short-term borrowing needs. The amounts of outstanding loans to and borrowings from AEP as of December 31, 2024 and 2023 are included in Advances to Affiliates and Advances from Affiliates, respectively, on AEPTCo’s balance sheets. AEPTCo’s direct financing activities with AEP and corresponding authorized borrowing limits are described in the following tables:
Year Ended December 31, 2024:
| | | | | | | | | | | | | | | | | | | | | | | | | | | | | | | | | | | | | | | | | | | | |
| | | | | | | | | | Borrowings | | | | Authorized |
| | Maximum | | Maximum | | Average | | Average | | from AEP | | Loans to | | Short-term |
| | Borrowings | | Loans | | Borrowings | | Loans | | as of | | AEP as of | | Borrowing |
| Company | | from AEP | | to AEP | | from AEP | | to AEP | | December 31, 2024 | | December 31, 2024 | | Limit (a) |
| | (in millions) |
| AEPTCo Parent | | $ | 49.4 | | | $ | 148.5 | | | $ | 14.9 | | | $ | 57.0 | | | $ | — | | | $ | 20.4 | | | $ | — | |
| SWTCo | | 1.9 | | | — | | | 1.8 | | | — | | | 1.8 | | | — | | | 50.0 | |
Year Ended December 31, 2023:
| | | | | | | | | | | | | | | | | | | | | | | | | | | | | | | | | | | | | | | | | | | | |
| | | | | | | | | | Borrowings | | | | Authorized |
| | Maximum | | Maximum | | Average | | Average | | from AEP | | Loans to | | Short-term |
| | Borrowings | | Loans | | Borrowings | | Loans | | as of | | AEP as of | | Borrowing |
| Company | | from AEP | | to AEP | | from AEP | | to AEP | | December 31, 2023 | | December 31, 2023 | | Limit (a) |
| | (in millions) |
| AEPTCo Parent | | $ | 42.7 | | | $ | 158.1 | | | $ | 18.0 | | | $ | 64.2 | | | $ | 42.7 | | | $ | — | | | $ | — | |
| SWTCo | | 1.6 | | | — | | | 1.6 | | | — | | | 1.7 | | | — | | | 50.0 | |
(a) Amount represents the authorized short-term borrowing limit from FERC or state regulatory agencies not otherwise included in the utility money pool above. AEPTCo Parent has no short-term borrowing limit.
The maximum and minimum interest rates for funds either borrowed from or loaned to the Utility Money Pool are summarized in the following table:
| | | | | | | | | | | | | | | | | |
| Years Ended December 31, |
| 2024 | | 2023 | | 2022 |
| Maximum Interest Rate | 5.79 | % | | 5.81 | % | | 5.28 | % |
| Minimum Interest Rate | 4.74 | % | | 4.66 | % | | 0.10 | % |
The average interest rates for funds borrowed from and loaned to the Utility Money Pool are summarized in the following table:
| | | | | | | | | | | | | | | | | | | | | | | | | | | | | | | | | | | | | | |
| | Average Interest Rate for Funds Borrowed
from the Utility Money Pool for the
Years Ended December 31, | | Average Interest Rate for Funds Loaned
to the Utility Money Pool for the
Years Ended December 31, |
| Company | | 2024 | | 2023 | | 2022 | | 2024 | | 2023 | | 2022 |
| AEP Texas | | 5.48 | % | | 5.46 | % | | 1.08 | % | | 5.45 | % | | 5.71 | % | | 1.99 | % |
| AEPTCo | | 5.51 | % | | 5.41 | % | | 1.81 | % | | 5.50 | % | | 5.56 | % | | 2.47 | % |
| APCo | | 5.51 | % | | 5.54 | % | | 2.34 | % | | 5.41 | % | | 5.54 | % | | 2.39 | % |
| I&M | | 5.40 | % | | 5.14 | % | | 2.57 | % | | 5.44 | % | | 5.57 | % | | 2.20 | % |
| OPCo | | 5.70 | % | | 5.43 | % | | 3.51 | % | | 5.20 | % | | 5.60 | % | | 1.22 | % |
| PSO | | 5.50 | % | | 5.51 | % | | 2.65 | % | | 4.79 | % | | 5.35 | % | | 0.75 | % |
| SWEPCo | | 5.41 | % | | 5.34 | % | | 2.80 | % | | 4.78 | % | | 5.72 | % | | 0.55 | % |
Maximum, minimum and average interest rates for funds loaned to the Nonutility Money Pool are summarized in the following table:
| | | | | | | | | | | | | | | | | | | | | | | | | | |
| | | | Maximum Interest Rate | | Minimum Interest Rate | | Average Interest Rate |
| Year Ended | | | | for Funds Loaned to | | for Funds Loaned to | | for Funds Loaned to |
| December 31, | | Company | | the Nonutility Money Pool | | the Nonutility Money Pool | | the Nonutility Money Pool |
| 2024 | | AEP Texas | | 5.79 | % | | 4.74 | % | | 5.46 | % |
| 2024 | | SWEPCo | | 5.79 | % | | 4.74 | % | | 5.45 | % |
| | | | | | | | |
| 2023 | | AEP Texas | | 5.81 | % | | 4.66 | % | | 5.54 | % |
| 2023 | | SWEPCo | | 5.81 | % | | 4.66 | % | | 5.56 | % |
| | | | | | | | |
| 2022 | | AEP Texas | | 5.28 | % | | 0.46 | % | | 2.23 | % |
| 2022 | | SWEPCo | | 5.28 | % | | 0.46 | % | | 2.23 | % |
AEPTCo Parent’s and SWTCo’s maximum, minimum and average interest rates for funds either borrowed from or loaned to AEP are summarized in the following table:
| | | | | | | | | | | | | | | | | | | | | | | | | | | | | | | | | | | | | | |
| | | Maximum | | Minimum | | Maximum | | Minimum | | Average | | Average |
| | | Interest Rate | | Interest Rate | | Interest Rate | | Interest Rate | | Interest Rate | | Interest Rate |
| | | for Funds | | for Funds | | for Funds | | for Funds | | for Funds | | for Funds |
| Year Ended | | Borrowed from | | Borrowed from | | Loaned to | | Loaned to | | Borrowed from | | Loaned to |
| December 31, | | AEP | | AEP | | AEP | | AEP | | AEP | | AEP |
| 2024 | | 5.79 | % | | 4.66 | % | | 5.79 | % | | 4.66 | % | | 5.53 | % | | 5.56 | % |
| 2023 | | 5.81 | % | | 4.53 | % | | 5.81 | % | | 4.53 | % | | 5.56 | % | | 5.51 | % |
| 2022 | | 5.28 | % | | 0.46 | % | | 5.28 | % | | 0.46 | % | | 2.08 | % | | 2.07 | % |
Interest expense related to short-term borrowing activities with the Utility Money Pool, Nonutility Money Pool and direct borrowing financing relationship are included in Interest Expense on each of the Registrant Subsidiaries’ statements of income. The Registrant Subsidiaries incurred interest expense for all short-term borrowing activities as follows:
| | | | | | | | | | | | | | | | | | | | |
| | Years Ended December 31, |
| Company | | 2024 | | 2023 | | 2022 |
| | (in millions) |
| AEP Texas | | $ | 6.7 | | | $ | 10.8 | | | $ | 0.9 | |
| AEPTCo | | 4.3 | | | 7.6 | | | 3.5 | |
| APCo | | 6.1 | | | 16.8 | | | 5.6 | |
| I&M | | 4.3 | | | 3.2 | | | 2.9 | |
| OPCo | | 3.7 | | | 9.7 | | | 2.3 | |
| PSO | | 8.9 | | | 2.3 | | | 5.5 | |
| SWEPCo | | 13.6 | | | 7.9 | | | 4.9 | |
Interest income related to short-term lending activities with the Utility Money Pool, Nonutility Money Pool and direct borrowing financing relationship are included in Interest Income, unless shown as Other Income due to materiality, on each of the Registrant Subsidiaries’ statements of income. The Registrant Subsidiaries earned interest income for all short-term lending activities as follows:
| | | | | | | | | | | | | | | | | | | | |
| | Years Ended December 31, |
| Company | | 2024 | | 2023 | | 2022 |
| | (in millions) |
| AEP Texas | | $ | 4.4 | | | $ | 0.1 | | | $ | 2.6 | |
| AEPTCo | | 10.5 | | | 7.0 | | | 1.6 | |
| APCo | | 1.6 | | | 1.1 | | | 2.8 | |
| I&M | | — | | | 2.4 | | | 0.5 | |
| OPCo | | 3.2 | | | 0.1 | | | 0.4 | |
| PSO | | 1.0 | | | 1.5 | | | 0.3 | |
| SWEPCo | | 0.2 | | | 0.2 | | | 0.2 | |
Credit Facilities
See “Letters of Credit” section of Note 6 for additional information.
Securitized Accounts Receivables – AEP Credit (Applies to AEP)
AEP Credit has a receivables securitization agreement with bank conduits. Under the securitization agreement, AEP Credit receives financing from the bank conduits for the interest in the receivables AEP Credit acquires from affiliated utility subsidiaries. These securitized transactions allow AEP Credit to repay its outstanding debt obligations, continue to purchase the operating companies’ receivables and accelerate AEP Credit’s cash collections.
AEP Credit’s receivables securitization agreement provides a commitment of $900 million from bank conduits to purchase receivables and expires in September 2026. As of December 31, 2024, the affiliated utility subsidiaries were in compliance with all requirements under the agreement.
Accounts receivable information for AEP Credit was as follows:
| | | | | | | | | | | | | | | | | |
| Years Ended December 31, |
| 2024 | | 2023 | | 2022 |
| (dollars in millions) |
| Effective Interest Rates on Securitization of Accounts Receivable | 5.39 | % | | 5.33 | % | | 1.84 | % |
| Net Uncollectible Accounts Receivable Written Off | $ | 29.4 | | | $ | 30.7 | | | $ | 29.5 | |
| | | | | | | | | | | |
| December 31, |
| 2024 | | 2023 |
| (in millions) |
| Accounts Receivable Retained Interest and Pledged as Collateral Less Uncollectible Accounts | $ | 1,117.0 | | | $ | 1,207.4 | |
Short-term – Securitized Debt of Receivables | 900.0 | | | 888.0 | |
| Delinquent Securitized Accounts Receivable | 56.2 | | | 52.2 | |
| Bad Debt Reserves Related to Securitization | 44.5 | | | 42.0 | |
| Unbilled Receivables Related to Securitization | 335.5 | | | 409.8 | |
AEP Credit’s delinquent customer accounts receivable represent accounts greater than 30 days past due.
Securitized Accounts Receivables – AEP Credit (Applies to Registrant Subsidiaries, except AEP Texas and AEPTCo)
Under this sale of receivables arrangement, the Registrant Subsidiaries sell, without recourse, certain of their customer accounts receivable and accrued unbilled revenue balances to AEP Credit and are charged a fee based on AEP Credit’s financing costs, administrative costs and uncollectible accounts experience for each Registrant Subsidiary’s receivables. APCo does not have regulatory authority to sell its West Virginia accounts receivable. The costs of customer accounts receivable sold are reported in Other Operation expense on the Registrant Subsidiaries’ statements of income. The Registrant Subsidiaries manage and service their customer accounts receivable, which are sold to AEP Credit. AEP Credit securitizes the eligible receivables for the operating companies and retains the remainder.
The amount of accounts receivable and accrued unbilled revenues under the sale of receivables agreement were:
| | | | | | | | | | | | | | |
| | December 31, |
| Company | | 2024 | | 2023 |
| | (in millions) |
| APCo | | $ | 192.7 | | | $ | 184.6 | |
| I&M | | 160.5 | | | 156.4 | |
| OPCo | | 470.7 | | | 541.7 | |
| PSO | | 111.4 | | | 134.6 | |
| SWEPCo | | 153.5 | | | 168.3 | |
The fees paid to AEP Credit for customer accounts receivable sold were:
| | | | | | | | | | | | | | | | | | | | |
| | Years Ended December 31, |
| Company | | 2024 | | 2023 | | 2022 |
| | (in millions) |
| APCo | | $ | 15.5 | | | $ | 16.9 | | | $ | 9.4 | |
| I&M | | 15.4 | | | 16.3 | | | 9.7 | |
| OPCo | | 29.7 | | | 29.5 | | | 29.8 | |
| PSO | | 14.2 | | | 15.3 | | | 7.4 | |
| SWEPCo | | 17.6 | | | 18.5 | | | 9.4 | |
The proceeds on the sale of receivables to AEP Credit were:
| | | | | | | | | | | | | | | | | | | | |
| | Years Ended December 31, |
| Company | | 2024 | | 2023 | | 2022 |
| | (in millions) |
| APCo | | $ | 1,953.7 | | | $ | 1,819.8 | | | $ | 1,552.9 | |
| I&M | | 2,105.3 | | | 2,054.8 | | | 2,045.6 | |
| OPCo | | 3,197.8 | | | 3,339.3 | | | 3,101.3 | |
| PSO | | 1,781.3 | | | 1,944.5 | | | 1,809.5 | |
| SWEPCo | | 1,838.1 | | | 1,866.4 | | | 1,858.4 | |
16. STOCK-BASED COMPENSATION
The disclosures in this note apply to AEP only. The impact of AEP’s share-based compensation plans is insignificant to the financial statements of the Registrant Subsidiaries.
AEP’s long-term incentive plan available for eligible employees and directors, the American Electric Power System 2015 Long-Term Incentive Plan (2015 LTIP), was replaced prospectively for new grants by the American Electric Power System 2024 Long-Term Incentive Plan (2024 LTIP) effective in April 2024. The 2024 LTIP provides for a maximum of 10 million AEP common shares to be available for grant to eligible employees and directors. As of December 31, 2024, 9,806,016 shares remained available for issuance under the 2024 LTIP. No new awards may be granted under the 2015 LTIP. To the extent the issuance of a share is subject to an outstanding award under the 2015 LTIP, the issuance of that share will take place under the 2015 LTIP. Awards granted under the 2024 LTIP may be made in the form of stock options, stock appreciation rights, restricted stock, restricted stock units, performance shares, performance units, cash-based awards and other stock-based awards. All types of shares issued under the 2024 LTIP including stock options, stock appreciation rights, restricted stock units and performance shares reduce the shares remaining available for grants at a rate of 1 to 1. Cash settled awards do not reduce the number of shares remaining available under the 2024 LTIP. The following sections provide further information regarding each type of stock-based compensation award granted under these plans.
Performance Shares
Performance shares are settled in AEP common stock and reduce the aggregate share authorization. The number of performance shares held at the end of the three-year performance period is multiplied by the performance score for such period to determine the actual number of performance shares that participants realize. The performance score can range from 0% to 200% and is determined at the end of the performance period based on performance measures, which include both performance and market conditions, established for each grant at the beginning of the performance period by the Human Resources Committee of AEP’s Board of Directors (HR Committee).
Certain employees must satisfy a minimum stock ownership requirement. If those employees have not met their stock ownership requirement, a portion or all of their performance shares are mandatorily deferred upon vesting into AEP career shares to the extent needed to meet their stock ownership requirement. AEP career shares are a form of non-qualified deferred compensation that has a value equivalent to a share of AEP common stock. AEP career shares are settled in AEP common stock after the participant’s termination of employment.
AEP career shares are recorded in Paid-in Capital on the balance sheets. Amounts equivalent to cash dividends on both performance shares and AEP career shares accrue as additional shares. Management records compensation cost for performance shares over an approximately three-year vesting period. Performance shares are recorded as mezzanine equity on the balance sheets until the vesting date and compensation cost is calculated at fair value based on the performance metrics for each grant. Performance shares granted in 2024, 2023, and 2022 have three performance metrics: (a) three-year cumulative operating earnings per-share with a 50% weight, (b) relative total shareholder return with a 40% weight and (c) generation capacity additions, which focused on additions that maintain reliability for 2024 grants, renewable generation additions for 2023 grants, and non-emitting generation capacity as a percentage of total owned and purchased capacity for 2022 grants, each with a 10% weight. The three-year cumulative operating earnings per-share and renewable generation additions or non-emitting generating capacity metrics are adjusted quarterly for changes in performance relative to the metric approved by the HR Committee. The total shareholder return metric is measured relative to a peer group of similar companies and is based on a third-party Monte Carlo valuation. The value related to this metric does not change over the three-year vesting period.
The HR Committee awarded performance shares and reinvested dividends on outstanding performance shares and AEP career shares as follows:
| | | | | | | | | | | | | | | | | | | | |
| | Years Ended December 31, |
| Performance Shares | | 2024 | | 2023 | | 2022 |
| Awarded Shares (in thousands) | | 440.7 | | | 486.7 | | | 530.3 | |
| Weighted-Average Share Fair Value at Grant Date | | $ | 99.76 | | | $ | 98.63 | | | $ | 97.61 | |
| Vesting Period (in years) | | 3 | | 3 | | 3 |
| | | | | | | | | | | | | | | | | | | | |
Performance Shares and AEP Career Shares
(Reinvested Dividends Portion) | | Years Ended December 31, |
| 2024 | | 2023 | | 2022 |
| Awarded Shares (in thousands) | | 66.0 | | | 81.3 | | | 63.3 | |
| Weighted-Average Fair Value at Grant Date | | $ | 91.75 | | | $ | 82.02 | | | $ | 98.73 | |
| Vesting Period (in years) | | (a) | | (a) | | (a) |
(a)The vesting period for the reinvested dividends on performance shares is equal to the remaining life of the related performance shares. Dividends on AEP career shares vest immediately when the dividend is awarded but are not settled in AEP common stock until after the participant’s AEP employment ends.
Performance scores and final awards are determined and approved by the HR Committee in accordance with the pre-established performance measures within approximately two months after the end of the performance period.
The performance scores and shares earned for the three-year periods were as follows:
| | | | | | | | | | | | | | | | | | | | |
| | Years Ended December 31, |
| Performance Shares | | 2024 (b) | | 2023 | | 2022 |
| Performance Score | | 109.8 | % | | 106.1 | % | | 131.1 | % |
| Performance Shares Earned | | 477,487 | | | 540,863 | | | 512,660 | |
| Performance Shares Mandatorily Deferred as AEP Career Shares | | 39,172 | | | 70,377 | | | 28,282 | |
| Performance Shares Voluntarily Deferred into the Incentive Compensation Deferral Program | | 21,245 | | | 22,716 | | | 23,609 | |
| Performance Shares to be Settled (a) | | 417,070 | | | 447,770 | | | 460,769 | |
(a)Performance shares settled in AEP common stock in the quarter following the end of the year shown.
(b)Performance shares earned, deferred and settled were calculated based on the estimated performance score.
The settlements were as follows:
| | | | | | | | | | | | | | | | | | | | |
| | Years Ended December 31, |
| Performance Shares and AEP Career Shares | | 2024 | | 2023 | | 2022 |
| | (in millions) |
| AEP Common Stock Settlements for Performance Shares | | $ | 38.1 | | | $ | 41.8 | | | $ | 43.2 | |
| AEP Common Stock Settlements for Career Share Distributions | | 8.4 | | | 8.3 | | | 5.1 | |
A summary of the status of AEP’s nonvested Performance Shares as of December 31, 2024 and changes during the year ended December 31, 2024 were as follows:
| | | | | | | | | | | | | | |
| Nonvested Performance Shares | | Shares | | Weighted Average
Grant Date Fair Value |
| | (in thousands) | | |
| Nonvested as of January 1, 2024 | | 889.9 | | | $ | 99.49 | |
| Awarded | | 440.7 | | | 99.76 | |
| Dividends | | 49.4 | | | 91.82 | |
| Vested (a) | | (440.6) | | | 100.52 | |
| Forfeited | | (161.8) | | | 87.94 | |
| Nonvested as of December 31, 2024 | | 777.6 | | | 100.97 | |
(a)The vested Performance Shares will be converted to an estimated 417 thousand shares based on the closing share price on the day before settlement.
Monte Carlo Valuation
AEP engages a third-party for a Monte Carlo valuation to calculate the fair value of the total shareholder return metric for the performance shares awarded during and after 2017. The valuations use a lattice model and the expected volatility assumptions used were the historical volatilities for AEP and the members of their peer group. The assumptions used in the Monte Carlo valuations were as follows:
| | | | | | | | | | | | | | | | | | | | |
| | Years Ended December 31, |
| Assumptions | | 2024 | | 2023 | | 2022 |
| Valuation Period (in years) (a) | | 2.85 | | 2.87 | | 2.86 |
| Expected Volatility Minimum | | 18.79 | % | | 21.23 | % | | 25.92 | % |
| Expected Volatility Maximum | | 33.29 | % | | 39.00 | % | | 40.82 | % |
| Expected Volatility Average | | 22.34 | % | | 25.35 | % | | 31.09 | % |
| Dividend Rate (b) | | — | % | | — | % | | — | % |
| Risk Free Rate | | 4.43 | % | | 4.32 | % | | 1.64 | % |
(a)Period from award date to vesting date.
(b)Equivalent to reinvesting dividends.
Restricted Stock Units
The HR Committee grants restricted stock units (RSUs), which generally vest, subject to the participant’s continued AEP employment, over at least three years in approximately equal annual increments. The RSUs accrue dividends as additional RSUs. The additional RSUs granted as dividends vest on the same date, subject to the participant’s continued AEP employment, as the underlying RSUs. RSUs are converted into shares of AEP common stock upon vesting. The RSU compensation cost is measured at fair value on the grant date and recorded over the vesting period. Fair value is determined by multiplying the number of RSUs granted by the grant date market closing price. The maximum contractual term of outstanding RSUs is approximately 40 months from the grant date.
The HR Committee awarded RSUs, including additional units awarded as dividends, as follows:
| | | | | | | | | | | | | | | | | | | | |
| | Years Ended December 31, |
| Restricted Stock Units | | 2024 | | 2023 | | 2022 |
| Awarded Units (in thousands) | | 417.0 | | | 268.4 | | | 290.4 | |
| Weighted-Average Grant Date Fair Value | | $ | 87.85 | | | $ | 88.52 | | | $ | 90.48 | |
The total fair value and total intrinsic value of restricted stock units vested were as follows:
| | | | | | | | | | | | | | | | | | | | |
| | Years Ended December 31, |
| Restricted Stock Units | | 2024 | | 2023 | | 2022 |
| | (in millions) |
| Fair Value of Restricted Stock Units Vested | | $ | 25.9 | | | $ | 18.8 | | | $ | 17.8 | |
| Intrinsic Value of Restricted Stock Units Vested (a) | | 27.3 | | | 19.0 | | | 20.3 | |
(a)Intrinsic value is calculated as market price at the vesting date.
A summary of the status of AEP’s nonvested RSUs as of December 31, 2024 and changes during the year ended December 31, 2024 were as follows:
| | | | | | | | | | | | | | |
| Nonvested Restricted Stock Units | | Shares/Units | | Weighted Average
Grant Date Fair Value |
| | (in thousands) | | |
| Nonvested as of January 1, 2024 | | 431.1 | | | $ | 88.57 | |
| Awarded | | 417.0 | | | 87.85 | |
| Vested | | (296.8) | | | 87.26 | |
| Forfeited | | (74.0) | | | 89.97 | |
| Nonvested as of December 31, 2024 | | 477.3 | | | 88.37 | |
The total aggregate intrinsic value of nonvested RSUs as of December 31, 2024 was $44 million and the weighted-average remaining contractual life was 1.5 years.
Other Stock-Based Plans
AEP also has a Stock Unit Accumulation Plan (SUAP) for Non-Employee Directors providing each non-employee director with AEP stock units as a substantial portion of the compensation for their services as a director. The number of stock units provided is based on the closing price of AEP common stock on the last trading day of the quarter for which the stock units were earned. Amounts equivalent to cash dividends on the stock units accrue as additional AEP stock units. The stock units granted to non-employee directors are fully vested on their grant date. Stock units are paid to directors upon termination of their board service or up to 10 years later if the participant so elects. Cash settlements for stock units were calculated based on the average closing price of AEP common stock for the last 20 trading days prior to the distribution date. Effective June 30, 2022, the SUAP was amended to pay stock units in AEP common stock rather than cash.
Management records compensation costs for stock units when the units are awarded and prior to June 2022 adjusted the liability for changes in value based on the current 20-day average closing price of AEP common stock on the valuation date.
After five years of service on the Board of Directors, non-employee directors receive subsequent AEP stock units as contributions to an AEP stock fund under the Stock Unit Accumulation Plan. Such amounts may be exchanged into other market-based investment options available to employees that participate in AEP’s Incentive Compensation Deferral Plan. These balances are paid in cash upon termination of board service or up to 10 years later if the participant so elects.
AEP common stock and cash settlements for stock unit distributions were immaterial for the years ended December 31, 2024, 2023 and 2022.
The Board of Directors awarded stock units, including units awarded for dividends, as follows:
| | | | | | | | | | | | | | | | | | | | |
| | Years Ended December 31, |
| Stock Unit Accumulation Plan for Non-Employee Directors | | 2024 | | 2023 | | 2022 |
| Awarded Units (in thousands) | | 18.9 | | | 19.8 | | | 14.5 | |
| Weighted-Average Grant Date Fair Value | | $ | 91.42 | | | $ | 82.14 | | | $ | 95.16 | |
Share-based Compensation Plans
The compensation cost for share-based payment arrangements, the actual tax benefit from the tax deductions for compensation cost recognized in income and the total compensation cost capitalized were as follows:
| | | | | | | | | | | | | | | | | | | | |
| | Years Ended December 31, |
| Share-based Compensation Plans | | 2024 | | 2023 | | 2022 |
| | (in millions) |
| Compensation Cost for Share-based Payment Arrangements (a) | | $ | 52.9 | | | $ | 50.9 | | | $ | 63.3 | |
| Actual Tax Benefit | | 7.4 | | | 6.4 | | | 8.0 | |
| Total Compensation Cost Capitalized | | 13.9 | | | 15.3 | | | 16.0 | |
(a)Compensation cost for share-based payment arrangements is included in Other Operation and Maintenance expenses on the statements of income.
As of December 31, 2024, there was $59 million of total unrecognized compensation cost related to unvested share-based compensation arrangements granted under the 2015 LTIP and the 2024 LTIP. Unrecognized compensation cost related to unvested share-based arrangements will change as the fair value of performance shares is adjusted each period and as forfeitures for all award types are realized. AEP’s unrecognized compensation cost will be recognized over a weighted-average period of 1.5 years.
Under the 2015 LTIP and 2024 LTIP, AEP is permitted to use authorized but unissued shares, treasury shares, shares acquired in the open market specifically for distribution under these plans, or any combination thereof to fulfill share commitments. AEP’s current practice is to use authorized but unissued shares to fulfill share commitments. The number of shares used to fulfill share commitments is generally reduced to offset tax withholding obligations.
17. RELATED PARTY TRANSACTIONS
The disclosures in this note apply to all Registrant Subsidiaries unless indicated otherwise.
For other related party transactions, also see “Income Taxes and Investment and Production Tax Credits” section of Note 1 in addition to “Corporate Borrowing Program” and “Securitized Accounts Receivables – AEP Credit” sections of Note 15.
Intercompany Billings
The Registrant Subsidiaries and other AEP subsidiaries perform certain utility services for each other when necessary or practical. The costs of these services are billed on a direct-charge basis, whenever possible, or on reasonable basis of proration for services that benefit multiple companies. The billings for services are made at cost and include no compensation for the use of equity capital.
Power Coordination Agreement (Applies to all Registrant Subsidiaries except AEP Texas and AEPTCo)
Effective January 1, 2014, the FERC approved the PCA. Under the PCA, APCo, I&M, KPCo and WPCo are individually responsible for planning their respective capacity obligations. The PCA allows, but does not obligate, APCo, I&M, KPCo and WPCo to participate collectively under a common fixed resource requirement capacity plan in PJM and to participate in specified collective Off-system Sales and purchase activities.
AEPSC conducts power, capacity, coal, natural gas, interest rate and, to a lesser extent, heating oil, gasoline and other risk management activities on behalf of APCo, I&M, KPCo, PSO, SWEPCo and WPCo. Certain power and natural gas risk management activities for APCo, I&M, KPCo and WPCo are allocated based on the four member companies’ respective equity positions, while power and natural gas risk management activities for PSO and SWEPCo are allocated based on the Operating Agreement. AEPSC conducts only gasoline, diesel fuel, energy procurement and risk management activities on OPCo’s behalf.
Joint License Agreement (Applies to all Registrant Subsidiaries except AEP Texas and SWEPCo)
AEPTCo entered into a 50-year joint license agreement with APCo, I&M, KPCo, OPCo and PSO, respectively, allowing either party to occupy the granting party’s facilities or real property. In addition, AEPTCo entered into a 5-year joint license agreement with APCo and WPCo. After the expiration of these agreements, the term shall automatically renew for successive one-year terms unless either party provides notice. The joint license billing provides compensation to the granting party for the cost of carrying assets, including depreciation expense, property taxes, interest expense, return on equity and income taxes. AEPTCo recorded the costs related to these agreements in Other Operation expense on the statements of income. APCo, I&M, KPCo, OPCo, PSO and WPCo recorded income related to these agreements in Sales to AEP Affiliates on the statements of income. The impact of the joint license agreement for the years ended December 31, 2024, 2023 and 2022 was not material.
Unit Power Agreements (Applies to I&M)
A UPA between AEGCo and I&M (the I&M Power Agreement) provides for the sale by AEGCo to I&M of all the energy and capacity available to AEGCo at the Rockport Plant unless it is sold to another utility. I&M is obligated, whether or not power is available from AEGCo, to pay as a demand charge for the right to receive such power (and as an energy charge for any associated energy taken by I&M) net of amounts received by AEGCo from any other sources, sufficient to enable AEGCo to pay all of its operating and other expenses, including a rate of return on the common equity of AEGCo as approved by the FERC. The UPA will continue in effect until the debt obligations of AEGCo secured by the Rockport Plant have been satisfied and discharged (currently expected to be December 2028). I&M’s direct purchases from AEGCo were $209 million, $181 million and $242 million for the years ended December 31, 2024, 2023 and 2022, respectively. These direct purchases are presented as Purchased Electricity from AEP Affiliates on I&M’s statements of income.
Ohio Auctions (Applies to OPCo)
In connection with OPCo’s June 2012 - May 2015 ESP, the PUCO ordered OPCo to conduct energy and capacity auctions for its entire SSO load for delivery beginning in June 2015. AEP Energy and AEPEP participate in the auction process and have been awarded tranches of OPCo’s SSO load. OPCo’s auction purchases were $98 million, $87 million and $10 million for the years ended December 31, 2024, 2023 and 2022, respectively. These direct purchases are presented as Purchased Electricity from AEP Affiliates on OPCo’s statements of income.
Sales and Purchases of Property
Certain AEP subsidiaries had affiliated sales and purchases of electric property individually amounting to $100 thousand or more, sales and purchases of meters and transformers, and sales and purchases of transmission property. There were no gains or losses recorded on the transactions and the net book value of all sales and purchases for the years ended December 31, 2024, 2023 and 2022 were not material. These sales and purchases are recorded in Property, Plant and Equipment on the balance sheets.
Charitable Contributions to AEP Foundation
The American Electric Power Foundation is funded by American Electric Power and its utility operating units. The Foundation provides a permanent, ongoing resource for charitable initiatives and multi-year commitments in the communities served by AEP and initiatives outside of AEP’s 11-state service area. Charitable contributions to the AEP Foundation were not made in 2024 or 2023. Charitable contributions were recorded in Other Operation expenses on the statements of income as follows for the year ended December 31, 2022:
| | | | | | | | | | | | | | | | | | | | | | | | | | | | | | | | | | | | | | | | | | | | | | | | | | |
| | AEP | | AEP Texas | | AEPTCo | | APCo | | I&M | | OPCo | | PSO | | SWEPCo |
| | (in millions) |
| Contributions to AEP Foundation | | $ | 75.0 | | | $ | 9.9 | | | $ | 11.1 | | | $ | 12.5 | | | $ | 11.0 | | | $ | 8.1 | | | $ | 5.8 | | | $ | 8.8 | |
Other Related Party Contributions
For the years ended December 31, 2023 and 2022, AEP made contributions of $0.1 million and $0.2 million, respectively, to Clean Affordable Reliable Coalition (CARE), a 501(c)(6) organization established to encourage communication, discussion and concerted action related to tax policy associated with clean, affordable and reliable power initiatives. These contributions were made in the ordinary course of business. AEP was a member of CARE and provided the organization its primary financial support. In addition, an employee of AEP served as a board member of the organization during 2023 and 2022. AEP management has determined these contributions are Related Party transactions under ASC 850 based on AEP’s ability to significantly influence the management and operating policies of CARE. AEP made no contributions to CARE in 2024.
Beginning in August 2024, an officer of AEP also served as a member of the board of directors of a company that is a vendor of certain AEP subsidiaries. From August 2024 through December 2024, AEP purchased $44 million of distribution and transmission infrastructure services from the related party vendor in the ordinary course of business. Of this amount, $25 million was incurred by AEP Texas and $13 million was incurred by PSO. The amounts incurred by the remaining Registrant Subsidiaries were not significant.
I&M Barging, Urea Transloading and Other Services (Applies to APCo and I&M)
I&M provides barging, urea transloading and other transportation services to affiliates. Urea is a chemical used to control NOx emissions at certain generation plants in the AEP System. I&M recorded revenues from barging, transloading and other services in Other Revenues – Affiliated on the statements of income. The affiliated companies recorded these costs paid to I&M as fuel expenses or other operation expenses. The amounts of affiliated expenses were:
| | | | | | | | | | | | | | | | | | | | |
| | Years Ended December 31, |
| Company | | 2024 | | 2023 | | 2022 |
| | (in millions) |
| AEGCo | | $ | 10.0 | | | $ | 9.3 | | | $ | 11.3 | |
| APCo | | 47.0 | | | 39.2 | | | 36.1 | |
| KPCo | | — | | | — | | | 2.0 | |
| WPCo | | 7.5 | | | 10.6 | | | 4.7 | |
AEP Wind Holdings LLC PPAs (Applies to I&M, OPCo and SWEPCo)
Prior to acquisition, Fowler Ridge 2 had PPAs with I&M and OPCo and Flat Ridge 2 had a PPA with SWEPCo for a portion of their energy production. The following table shows the amounts of purchased electricity by I&M, PSO and SWEPCo:
| | | | | | | | | | | | | | | | |
| | | | Years Ended December 31, |
| Company | | | | 2023 | | 2022 |
| | | | (in millions) |
| I&M | | | | $ | 8.0 | | | $ | 11.8 | |
| OPCo | | | | 16.1 | | | 23.6 | |
| SWEPCo | | | | — | | | 13.7 | |
See Note 7 - Acquisitions, Dispositions and Impairments for additional information related to the disposal of the 50% interests in Fowler Ridge 2 which was included in the August 2023 sale of the Competitive Contracted Renewables Portfolio and Flat Ridge 2 which was sold in November 2022.
Transmission Service Charges
The AEP East Companies are parties to the TA, which defines how transmission costs through the PJM OATT are allocated among the AEP East Companies on a 12-month average coincident peak basis. Additional costs for transmission services provided by AEPTCo and other transmission affiliates are billed to AEP East Companies through the PJM OATT. PSO, SWEPCo and AEPSC are parties to the TCA in connection with the operation of the transmission assets of PSO and SWEPCo. Under the TCA, AEPSC is responsible for monitoring the reliability of their transmission systems and administering the OATT. Additional costs for transmission services provided by AEPTCo and other transmission affiliates are billed to PSO and SWEPCo through the SPP OATT. Pursuant to an order from the PUCT, ETT bills AEP Texas for its ERCOT wholesale transmission services.
The charges discussed above are recorded in Other Operation expenses on the statements of income. AEPTCo recorded affiliated transmission revenues in Sales to AEP Affiliates on the statements of income. Refer to the Affiliated Revenues section below for amounts related to these transactions.
The following table shows the net transmission service charges recorded by the Registrant Subsidiaries:
| | | | | | | | | | | | | | | | | | | | |
| | Years Ended December 31, |
| Company | | 2024 | | 2023 | | 2022 |
| | (in millions) |
| AEP Texas | | $ | 30.6 | | | $ | 28.7 | | | $ | 28.5 | |
| APCo | | 380.7 | | | 365.1 | | | 345.1 | |
| I&M | | 252.7 | | | 226.2 | | | 220.8 | |
| OPCo | | 696.1 | | | 665.3 | | | 608.2 | |
| PSO | | 127.1 | | | 100.1 | | | 110.8 | |
| SWEPCo | | 64.5 | | | 49.2 | | | 62.1 | |
Affiliated Revenues
The tables below represent revenues from affiliates, net of respective provisions for refund, by type of revenue for the Registrant Subsidiaries. Related party revenues are shown in Sales to AEP Affiliates, Provision for Refund - Affiliated and Other Revenues - Affiliated, respectively, on the Registrant Subsidiaries’ statements of income.
| | | | | | | | | | | | | | | | | | | | | | | | | | | | | | | | | | | | | | | | | | | | |
| Related Party Revenues | | AEP Texas | | AEPTCo | | APCo | | I&M | | OPCo | | PSO | | SWEPCo |
| | (in millions) |
| Year Ended December 31, 2024 | | | | | | | | | | | | | | |
| Direct Sales to East Affiliates | | $ | — | | | $ | — | | | $ | 159.0 | | | $ | — | | | $ | — | | | $ | — | | | $ | — | |
| | | | | | | | | | | | | | |
| Transmission Revenues | | — | | | 1,491.1 | | | 78.8 | | | (8.8) | | | (6.9) | | | 0.1 | | | 60.6 | |
| | | | | | | | | | | | | | |
| Other Revenues | | 5.4 | | | 21.2 | | | 9.6 | | | 75.0 | | | 29.6 | | | 6.8 | | | 1.5 | |
| Total Affiliated Revenues | | $ | 5.4 | | | $ | 1,512.3 | | | $ | 247.4 | | | $ | 66.2 | | | $ | 22.7 | | | $ | 6.9 | | | $ | 62.1 | |
| | | | | | | | | | | | | | | | | | | | | | | | | | | | | | | | | | | | | | | | | | | | |
| Related Party Revenues | | AEP Texas | | AEPTCo | | APCo | | I&M | | OPCo | | PSO | | SWEPCo |
| | (in millions) |
| Year Ended December 31, 2023 | | | | | | | | | | | | | | |
| Direct Sales to East Affiliates | | $ | — | | | $ | — | | | $ | 158.7 | | | $ | — | | | $ | — | | | $ | — | | | $ | — | |
| | | | | | | | | | | | | | |
| Transmission Revenues | | — | | | 1,304.0 | | | 70.9 | | | (11.1) | | | 3.2 | | | — | | | 45.3 | |
| Barging, Urea Transloading and Other Transportation Services | | — | | | — | | | — | | | 59.0 | | | — | | | — | | | — | |
| Other Revenues | | 4.9 | | | 13.8 | | | 9.7 | | | 9.9 | | | 27.9 | | | 1.2 | | | 1.5 | |
| Total Affiliated Revenues | | $ | 4.9 | | | $ | 1,317.8 | | | $ | 239.3 | | | $ | 57.8 | | | $ | 31.1 | | | $ | 1.2 | | | $ | 46.8 | |
| | | | | | | | | | | | | | | | | | | | | | | | | | | | | | | | | | | | | | | | | | | | |
| Related Party Revenues | | AEP Texas | | AEPTCo | | APCo | | I&M | | OPCo | | PSO | | SWEPCo |
| | (in millions) |
| Year Ended December 31, 2022 | | | | | | | | | | | | | | |
| Direct Sales to East Affiliates | | $ | — | | | $ | — | | | $ | 169.7 | | | $ | — | | | $ | — | | | $ | — | | | $ | — | |
| Direct Sales to West Affiliates | | — | | | — | | | — | | | — | | | — | | | — | | | 1.3 | |
| Transmission Revenues | | — | | | 1,276.4 | | | 77.5 | | | 7.7 | | | (3.6) | | | — | | | 51.5 | |
| Barging, Urea Transloading and Other Transportation Services | | — | | | — | | | — | | | 54.1 | | | — | | | — | | | — | |
| Other Revenues | | 3.5 | | | 7.4 | | | 8.9 | | | 7.8 | | | 22.4 | | | 2.9 | | | 1.1 | |
| Total Affiliated Revenues | | $ | 3.5 | | | $ | 1,283.8 | | | $ | 256.1 | | | $ | 69.6 | | | $ | 18.8 | | | $ | 2.9 | | | $ | 53.9 | |
18. VARIABLE INTEREST ENTITIES AND EQUITY METHOD INVESTMENTS
The disclosures in this note apply to all Registrants unless indicated otherwise.
The accounting guidance for “Variable Interest Entities” is a consolidation model that considers if a company has a variable interest in a VIE. A VIE is a legal entity that possesses any of the following conditions: the entity’s equity at risk is not sufficient to permit the legal entity to finance its activities without additional subordinated financial support, equity owners are unable to direct the activities that most significantly impact the legal entity’s economic performance (or they possess disproportionate voting rights in relation to the economic interest in the legal entity), or the equity owners lack the obligation to absorb the legal entity’s expected losses or the right to receive the legal entity’s expected residual returns. Entities are required to consolidate a VIE when it is determined that they have a controlling financial interest in a VIE and therefore, are the primary beneficiary of that VIE, as defined by the accounting guidance for “Variable Interest Entities.” In determining whether AEP is the primary beneficiary of a VIE, management considers whether AEP has the power to direct the most significant activities of the VIE and is obligated to absorb losses or receive the expected residual returns that are significant to the VIE. Management believes that significant assumptions and judgments were applied consistently.
AEP holds ownership interests in businesses with varying ownership structures. Partnership interests and other variable interests are evaluated to determine if each entity is a VIE, and if so, whether or not the VIE should be consolidated into AEP’s financial statements. AEP has not provided material financial or other support that was not previously contractually required to any of its consolidated VIEs. AEP’s interests in nonconsolidated VIEs are accounted for under the equity method of accounting.
Consolidated Variable Interests Entities
Sabine (Applies to AEP and SWEPCo)
Sabine is a mining operator whose purpose was to provide mining services to SWEPCo’s Pirkey Plant until its retirement in March 2023. See "Pirkey Plant and Related Fuel Operations" section of Note 5 for additional information. Sabine’s post-production operations primarily consist of reclamation and other land-related activities. The terms of these services are governed by a lignite mining agreement between SWEPCo and Sabine. SWEPCo has no equity investment in Sabine but is Sabine’s only customer. SWEPCo guarantees the debt obligations and lease obligations of Sabine. Under the terms of the note agreements with Sabine’s creditors, substantially all assets are pledged and all rights under the lignite mining agreement are assigned to SWEPCo. The creditors of Sabine have no recourse to any AEP entity other than SWEPCo. Under the provisions of the lignite mining agreement, SWEPCo is required to pay an amount equal to Sabine’s operating costs plus a management fee and SWEPCo holds an option agreement to purchase Sabine, which SWEPCo exercised in 2023. As a result, SWEPCo will take direct control over reclamation activities in October 2026. Based on these facts, management concluded that SWEPCo is the primary beneficiary and is required to consolidate Sabine. See the tables below for the classification of Sabine’s assets and liabilities on SWEPCo’s balance sheets.
As part of the process to receive a renewal of a Texas Railroad Commission permit for lignite mining, SWEPCo provides guarantees of mine reclamation of $155 million. Since SWEPCo uses self-bonding, the guarantee commits SWEPCo to complete the reclamation, in the event, Sabine does not complete the work. This guarantee ends upon completion of reclamation activities expected by 2037 with an estimated cost of $100 million. Actual costs may vary due to inflation and changes in reclamation scope. SWEPCo recovers these costs through its fuel clauses. As of December 31, 2024, SWEPCo has recorded an ARO of $96 million and has paid or accrued $77 million for reclamation costs billed by Sabine. To date, SWEPCo has collected $97 million from customers for reclamation costs and expects to collect an additional $76 million recorded in Deferred Charges and Other Noncurrent Assets on SWEPCo’s balance sheets.
DCC Fuel (Applies to AEP and I&M)
I&M has nuclear fuel lease agreements with DCC Fuel, which was formed for the purpose of acquiring, owning and leasing nuclear fuel to I&M. DCC Fuel purchased the nuclear fuel from I&M with funds received from the issuance of notes to financial institutions. Each DCC Fuel entity is a single-lessee leasing arrangement with only one asset and is capitalized with all debt. Each is a separate legal entity from I&M, the assets of which are not available to satisfy the debts of I&M. Payments on the leases for the years ended December 31, 2024, 2023 and 2022 were $111 million, $97 million and $84 million, respectively. The leases qualify as finance leases because title to the nuclear fuel transfers to I&M at the end of the respective lease terms, which do not exceed 54 months. Based on I&M’s control of DCC Fuel, management concluded that I&M is the primary beneficiary and is required to consolidate DCC Fuel. The finance leases are eliminated upon consolidation. See the tables below for the classification of DCC Fuel’s assets and liabilities on I&M’s balance sheets.
Transition Funding (Applies to AEP and AEP Texas)
Transition Funding was formed for the sole purpose of issuing and servicing securitization bonds related to restructuring legislation in Texas. Management concluded that AEP Texas is the primary beneficiary of Transition Funding because AEP Texas has the power to direct the most significant activities of the VIE and AEP Texas’ equity interest could potentially be significant. Therefore, AEP Texas is required to consolidate Transition Funding. In December 2024, the final AEP Texas Central Transition Funding III LLC securitization bond matured. As of December 31, 2023, the securitized bond included in Long-term Debt Due Within One Year - Nonaffiliated was $72 million and the securitized bond included in Long-term Debt - Nonaffiliated was immaterial on the balance sheet. Transition Funding’s securitized transition assets were $64 million as of December 31, 2023, which was presented separately on the face of the balance sheet.
The securitized transition assets represent the right to impose and collect Texas true-up costs from customers receiving electric transmission or distribution service from AEP Texas under-recovery mechanisms approved by the PUCT. The securitization bonds are payable only from and secured by the securitized transition assets. The bondholders have no recourse to AEP Texas or any other AEP entity. AEP Texas acts as the servicer for Transition Funding’s securitized transition assets and remits all related amounts collected from customers to Transition Funding for interest and principal payments on the securitization bonds and related costs. See the tables below for the classification of Transition Funding’s assets and liabilities on the balance sheets.
Restoration Funding (Applies to AEP and AEP Texas)
Restoration Funding was formed for the sole purpose of issuing and servicing securitization bonds related to storm restoration of AEP Texas’ distribution system primarily due to damage caused by Hurricane Harvey. Management concluded that AEP Texas is the primary beneficiary of Restoration Funding because AEP Texas has the power to direct the most significant activities of the VIE and AEP Texas’ equity interest could potentially be significant. Therefore, AEP Texas is required to consolidate Restoration Funding. As of December 31, 2024 and 2023, $24 million and $24 million of the securitized bonds were included in Long-term Debt Due Within One Year - Nonaffiliated, respectively, and $102 million and $126 million were included in Long-term Debt - Nonaffiliated, respectively, on the balance sheets. Restoration Funding’s securitized assets were $117 million and $139 million as of December 31, 2024 and 2023, respectively, which are presented separately on the face of the balance sheets.
The securitized restoration assets represent the right to impose and collect Texas storm restoration costs from customers receiving electric transmission or distribution service from AEP Texas under-recovery mechanisms approved by the PUCT. The securitization bonds are payable only from and secured by the securitized assets. The bondholders have no recourse to AEP Texas or any other AEP entity. AEP Texas acts as the servicer for Restoration Funding’s securitized assets and remits all related amounts collected from customers to Restoration Funding for interest and principal payments on the securitization bonds and related costs. See the tables below for the classification of Restoration Funding’s assets and liabilities on the balance sheets.
Appalachian Consumer Rate Relief Funding (Applies to AEP and APCo)
Appalachian Consumer Rate Relief Funding was formed for the sole purpose of issuing and servicing securitization bonds related to APCo’s under-recovered ENEC deferral balance. Management concluded that APCo is the primary beneficiary of Appalachian Consumer Rate Relief Funding because APCo has the power to direct the most significant activities of the VIE and APCo’s equity interest could potentially be significant. Therefore, APCo is required to consolidate Appalachian Consumer Rate Relief Funding. As of December 31, 2024 and 2023, $28 million and $27 million of the securitized bonds were included in Long-term Debt Due Within One Year - Nonaffiliated, respectively, and $91 million and $120 million were included in Long-term Debt - Nonaffiliated, respectively, on the balance sheets. Appalachian Consumer Rate Relief Funding’s securitized assets were $106 million and $133 million as of December 31, 2024 and 2023, respectively, which are presented separately on the face of the balance sheets.
The phase-in recovery property represents the right to impose and collect West Virginia deferred generation charges from customers receiving electric transmission, distribution and generation service from APCo under a recovery mechanism approved by the WVPSC. In November 2013, securitization bonds were issued. The securitization bonds are payable only from and secured by the securitized assets. The bondholders have no recourse to APCo or any other AEP entity. APCo acts as the servicer for Appalachian Consumer Rate Relief Funding’s securitized assets and remits all related amounts collected from customers to Appalachian Consumer Rate Relief Funding for interest and principal payments on the securitization bonds and related costs. See the tables below for the classification of Appalachian Consumer Rate Relief Funding’s assets and liabilities on APCo’s balance sheets.
Storm Recovery Funding (Applies to AEP and SWEPCo)
In August 2024, Storm Recovery Funding was formed for the sole purpose of issuing and servicing securitization bonds related to storm recovery primarily related to SWEPCo’s distribution system. Management concluded that SWEPCo is the primary beneficiary of Storm Recovery Funding because SWEPCo has the power to direct the most significant activities of the VIE and SWEPCo’s equity interest could potentially be significant. Therefore, SWEPCo is required to consolidate Storm Recovery Funding. As of December 31, 2024, $23 million of the securitized bonds was included in Long-term Debt Due Within One Year - Nonaffiliated and $309 million was included in Long-term Debt - Nonaffiliated on the balance sheet. Storm Recovery Funding’s securitized assets are $331 million as of December 31, 2024, which is presented separately on the face of the balance sheet.
The securitized assets represent the right to impose and collect SWEPCo storm recovery charges from SWEPCo’s Louisiana jurisdictional customers. The securitization bonds are payable only from and secured by the securitized assets. The bondholders have no recourse to SWEPCo or any other AEP entity. SWEPCo acts as the servicer for Storm Recovery Funding’s securitized assets and remits all related amounts collected from customers to Storm Recovery Funding for interest and principal payments on the securitization bonds and related costs. See the tables below for the classification of Storm Recovery Funding’s assets and liabilities on the balance sheet.
AEP Credit (Applies to AEP)
AEP Credit is a wholly-owned subsidiary of Parent. AEP Credit purchases, without recourse, accounts receivable from certain utility subsidiaries of AEP to reduce working capital requirements. AEP provides a minimum of 5% equity and up to 35% of AEP Credit’s short-term borrowing needs in excess of third-party financings. Any third-party financing of AEP Credit only has recourse to the receivables securitized for such financing. Based on AEP’s control of AEP Credit, management concluded that AEP is the primary beneficiary and is required to consolidate AEP Credit. See the tables below for the classification of AEP Credit’s assets and liabilities on the balance sheets. See “Securitized Accounts Receivables - AEP Credit” section of Note 15.
EIS (Applies to AEP)
AEP’s subsidiaries participate in one protected cell of EIS for seven lines of insurance. EIS has multiple protected cells. Neither AEP nor its subsidiaries have an equity investment in EIS. The AEP System is essentially this EIS cell’s only participant, but allows certain third-parties access to this insurance. AEP’s subsidiaries and any allowed third-parties share in the insurance coverage, premiums and risk of loss from claims. Based on AEP’s control and the structure of the protected cell of EIS, management concluded that AEP is the primary beneficiary of the protected cell and is required to consolidate the protected cell of EIS. The insurance premium expense to the protected cell for the years ended December 31, 2024, 2023 and 2022 was $37 million, $34 million and $31 million, respectively. See the tables below for the classification of the protected cell’s assets and liabilities on the balance sheets. The amount reported as equity is the protected cell’s policy holders’ surplus.
Transource Energy (Applies to AEP)
Transource Energy was formed for the purpose of investing in utilities which develop, acquire, construct, own and operate transmission facilities in accordance with FERC-approved rates. AEP has an 86.5% equity and voting ownership interest and the remaining 13.5% interest is held by a single third-party owner. Management concluded that Transource Energy is a VIE and that AEP is the primary beneficiary because AEP has the power to direct the most significant activities of the entity and AEP’s equity interest could potentially be significant. Therefore, AEP is required to consolidate Transource Energy. Transource Energy’s activities consist of the development, construction and operation of FERC-regulated transmission assets in Missouri, West Virginia, Pennsylvania, Maryland and Oklahoma. Transource Energy has a credit facility agreement where borrowings are loaned through intercompany lending agreements to its subsidiaries. The creditor to the agreement has no recourse to the general credit of AEP. Transource Energy’s credit facility agreement contains certain covenants and require it to maintain a percentage of debt-to-total capitalization at a level that does not exceed 67.5%. See the tables below for the classification of Transource Energy’s assets and liabilities on the balance sheets.
The balances below represent the assets and liabilities of AEP’s consolidated VIEs. These balances include intercompany transactions that are eliminated upon consolidation.
| | | | | | | | | | | | | | | | | | | | | | | | | | | | | | | | | | | | | | | | | | | | | | | | | |
| | | | | |
| | | | | |
| December 31, 2024 |
| |
| Consolidated VIEs |
| SWEPCo
Sabine | | I&M
DCC Fuel | | | | AEP Texas Restoration Funding | | APCo
Appalachian
Consumer
Rate
Relief Funding | | SWEPCo Storm Recovery Funding | | AEP Credit | | Protected
Cell
of EIS | | Transource Energy |
| (in millions) |
| ASSETS | | | | | | | | | | | | | | | | | |
| Current Assets | $ | 6.0 | | | $ | 79.3 | | | | | $ | 21.3 | | | $ | 14.2 | | | $ | 3.4 | | | $ | 1,118.3 | | | $ | 218.5 | | | $ | 40.2 | |
| Net Property, Plant and Equipment | — | | | 132.3 | | | | | — | | | — | | | — | | | — | | | — | | | 598.3 | |
| Other Noncurrent Assets | 110.8 | | 63.6 | | | | 121.9 | | (a) | 109.6 | (b) | 331.4 | | 10.5 | | | — | | | 3.5 | |
| Total Assets | $ | 116.8 | | | $ | 275.2 | | | | | $ | 143.2 | | | $ | 123.8 | | | $ | 334.8 | | | $ | 1,128.8 | | | $ | 218.5 | | | $ | 642.0 | |
| | | | | | | | | | | | | | | | | |
| LIABILITIES AND EQUITY | | | | | | | | | | | | | | | | | |
| Current Liabilities | $ | 20.1 | | | $ | 79.2 | | | | | $ | 30.7 | | | $ | 30.5 | | | $ | 24.4 | | | $ | 1,068.8 | | | $ | 54.7 | | | $ | 57.2 | |
| Noncurrent Liabilities | 96.3 | | | 196.0 | | | | | 111.2 | | | 91.4 | | 308.7 | | 1.0 | | 96.0 | | | 274.3 | |
| Equity | 0.4 | | — | | | | | 1.3 | | 1.9 | | 1.7 | | 59.0 | | | 67.8 | | | 310.5 | |
| Total Liabilities and Equity | $ | 116.8 | | | $ | 275.2 | | | | | $ | 143.2 | | | $ | 123.8 | | | $ | 334.8 | | | $ | 1,128.8 | | | $ | 218.5 | | | $ | 642.0 | |
(a)Includes an intercompany item eliminated in consolidation of $5 million.
(b)Includes an intercompany item eliminated in consolidation of $1 million.
| | | | | | | | | | | | | | | | | | | | | | | | | | | | | | | | | | | | | | | | | | | | | | | |
| | | | | |
| | | | | |
| December 31, 2023 |
| | | | | | | | | | | | | | | |
| Consolidated VIEs |
| SWEPCo
Sabine | | I&M
DCC Fuel | | AEP Texas Transition Funding | | AEP Texas Restoration Funding | | APCo
Appalachian
Consumer
Rate
Relief Funding | | AEP Credit | | Protected Cell of EIS | | Transource Energy |
| (in millions) |
| ASSETS | | | | | | | | | | | | | | | |
| Current Assets | $ | 4.2 | | | $ | 81.9 | | | $ | 25.5 | | | $ | 27.5 | | | $ | 13.3 | | | $ | 1,208.8 | | | $ | 205.3 | | | $ | 36.9 | |
| Net Property, Plant and Equipment | — | | | 153.8 | | | — | | | — | | | — | | | — | | | — | | | 533.4 | |
| Other Noncurrent Assets | 150.7 | | | 81.7 | | | 71.4 | | (a) | 145.6 | | (b) | 138.2 | | (c) | 9.6 | | | — | | | 5.1 | |
| Total Assets | $ | 154.9 | | | $ | 317.4 | | | $ | 96.9 | | | $ | 173.1 | | | $ | 151.5 | | | $ | 1,218.4 | | | $ | 205.3 | | | $ | 575.4 | |
| | | | | | | | | | | | | | | |
| LIABILITIES AND EQUITY | | | | | | | | | | | | | | | |
| Current Liabilities | $ | 19.9 | | | $ | 81.7 | | | $ | 75.5 | | | $ | 36.8 | | | $ | 29.9 | | | $ | 1,155.0 | | | $ | 49.2 | | | $ | 45.3 | |
| Noncurrent Liabilities | 134.8 | | | 235.7 | | | 17.0 | | | 135.1 | | | 119.7 | | | 0.9 | | | 91.7 | | | 241.5 | |
| Equity | 0.2 | | | — | | | 4.4 | | | 1.2 | | | 1.9 | | | 62.5 | | | 64.4 | | | 288.6 | |
| Total Liabilities and Equity | $ | 154.9 | | | $ | 317.4 | | | $ | 96.9 | | | $ | 173.1 | | | $ | 151.5 | | | $ | 1,218.4 | | | $ | 205.3 | | | $ | 575.4 | |
(a)Includes an intercompany item eliminated in consolidation of $8 million.
(b)Includes an intercompany item eliminated in consolidation of $6 million.
(c)Includes an intercompany item eliminated in consolidation of $2 million.
Non-Consolidated Significant Variable Interests - AEP
AEPSC (Applies to Registrant Subsidiaries)
AEPSC, a wholly-owned subsidiary of Parent, is consolidated by AEP. Parent is the sole equity owner of AEPSC and controls the activities of AEPSC. AEPSC provides certain managerial and professional services to AEP’s subsidiaries. The costs of the services are based on a direct-charge or on a prorated basis and billed to the AEP subsidiary companies at AEPSC’s cost. AEP subsidiaries have not provided financial or other support outside of the reimbursement of costs for services rendered. AEPSC finances its operations through cost reimbursement from other AEP subsidiaries. There are no other terms or arrangements between AEPSC and any of the AEP subsidiaries that could require additional financial support from an AEP subsidiary or expose them to losses outside of the normal course of business. AEPSC and its billings are subject to regulation by the FERC. AEP subsidiaries are exposed to losses to the extent they cannot recover the costs of AEPSC through their normal business operations. AEP subsidiaries are considered to have a significant variable interest in AEPSC due to their activity in AEPSC’s cost reimbursement structure. However, AEP subsidiaries do not have control over AEPSC. In the event AEPSC would require financing or other support outside the cost reimbursement billings, this financing would be provided by AEP.
Total AEPSC billings to the Registrant Subsidiaries were as follows:
| | | | | | | | | | | | | | | | | | | | |
| | Years Ended December 31, |
| Company | | 2024 | | 2023 | | 2022 |
| | (in millions) |
| AEP Texas | | $ | 242.6 | | | $ | 228.5 | | | $ | 236.8 | |
| AEPTCo | | 289.7 | | | 269.9 | | | 286.6 | |
| APCo | | 335.3 | | | 324.9 | | | 347.5 | |
| I&M | | 187.6 | | | 178.4 | | | 192.4 | |
| OPCo | | 283.4 | | | 269.5 | | | 272.5 | |
| PSO | | 157.4 | | | 138.6 | | | 142.3 | |
| SWEPCo | | 194.4 | | | 185.1 | | | 192.5 | |
The carrying amount and classification of variable interest in AEPSC’s accounts payable were as follows:
| | | | | | | | | | | | | | | | | | | | | | | | | | |
| | December 31, |
| | 2024 | | 2023 |
| Company | | As Reported on
the Balance Sheet | | Maximum
Exposure | | As Reported on
the Balance Sheet | | Maximum
Exposure |
| | (in millions) |
| AEP Texas | | $ | 26.1 | | | $ | 26.1 | | | $ | 15.1 | | | $ | 15.1 | |
| AEPTCo | | 29.3 | | | 29.3 | | | 17.9 | | | 17.9 | |
| APCo | | 36.4 | | | 36.4 | | | 21.1 | | | 21.1 | |
| I&M | | 25.1 | | | 25.1 | | | 14.3 | | | 14.3 | |
| OPCo | | 34.5 | | | 34.5 | | | 19.0 | | | 19.0 | |
| PSO | | 19.2 | | | 19.2 | | | 10.6 | | | 10.6 | |
| SWEPCo | | 22.0 | | | 22.0 | | | 12.7 | | | 12.7 | |
AEGCo (Applies to I&M)
AEGCo, a wholly-owned subsidiary of Parent, is consolidated by AEP. AEGCo owns a 50% ownership interest in Rockport Plant, Units 1 and 2. AEGCo sells its portion of the output from the Rockport Plant to I&M. AEP has agreed to provide AEGCo with the funds necessary to satisfy all the debt obligations of AEGCo. I&M is considered to have a significant variable interest in AEGCo due to these transactions. I&M is exposed to losses to the extent it cannot recover the costs of AEGCo through its normal business operations. In the event AEGCo requires financing or other support outside the billings to I&M, it would be provided by AEP. AEGCo’s billings to I&M for the years ended December 31, 2024, 2023 and 2022 were $209 million, $181 million and $242 million, respectively. The carrying amounts of I&M’s liabilities associated with AEGCo as of December 31, 2024 and 2023 were $14 million and $15 million, respectively. Management estimates the maximum exposure of loss to be equal to the amount of such liabilities.
AEP Development Services (Applies to OPCo)
AEP Development Services LLC (Devco), a wholly-owned subsidiary of Parent, is consolidated by AEP. Devco was formed for the purpose of developing, constructing, and installing energy projects for the regulated operating companies across the AEP system. In the fourth quarter of 2024, Devco executed a purchase agreement with Bloom Energy, acquiring 100 MWs of solid oxide fuel cells with an option to acquire up to one gigawatt in total by the end of 2025. Devco contemporaneously executed an affiliated services agreement with OPCo to establish the terms and conditions for Devco to design, procure, construct, and ultimately sell customer-sited, behind-the-meter fuel cell generation facilities to OPCo. Sales of fuel cell generation facilities will be made for OPCo to meet its obligations arising from bilateral customer-sited renewable energy resource agreements (CSRERAs) entered with its commercial customers. Sales are generally expected to close when a fuel cell generation facility is mechanically complete and will be sold at net book value plus reimbursement for the costs of Devco’s services. OPCo will own and operate the fuel cell generation facilities, and sell power produced by them to its customers under the terms of the applicable CSRERAs.
Devco is a VIE because its operations and activities, including the initial 100 MWs purchase of fuel cells from Bloom Energy, are entirely financed by Parent through borrowings from the Nonutility Money Pool. Parent controls the significant activities of Devco and is exposed to its potential losses to the extent sales of completed fuel cell generation facilities to OPCo are insufficient to cover its costs of operations. AEP intends to recover its investment through the fulfillment of contractual commitments to deploy and install fuel cells to provide electricity service to customers. Based on AEP’s control of Devco, management concluded that AEP is the primary beneficiary and is required to consolidate Devco. In addition, OPCo has a noncontrolling variable interest in Devco because of the pricing structure for the sales of fuel cell generation facilities. As of December 31, 2024, the amounts of CWIP and borrowings from the Nonutility Money Pool were $457 million and $456 million, respectively.
Non-Consolidated Significant Variable Interests - Registrant Subsidiaries
DHLC (Applies to AEP and SWEPCo)
DHLC is a mining operator which previously sold 50% of the lignite produced to SWEPCo and 50% to CLECO. The operations of DHLC are governed by the lignite mining agreement among SWEPCo, CLECO and DHLC. SWEPCo and CLECO share the executive board seats and voting rights equally. In accordance with the lignite mining agreement, each entity is responsible for 50% of DHLC’s obligations, including debt. SWEPCo and CLECO equally approve DHLC’s annual budget. The creditors of DHLC have no recourse to any AEP entity other than SWEPCo. As SWEPCo is the sole equity owner of DHLC, it receives 100% of the management fee earned by DHLC. In April 2020, SWEPCo and CLECO jointly filed a notification letter to the LPSC providing notice of the cessation of lignite mining. SWEPCo’s total billings from DHLC for the years ended December 31, 2024, 2023, and 2022 were not material. DHLC paid dividends of $1 million, $1 million, and $25 million to SWEPCo for the years ended December 31, 2024, 2023 and 2022, respectively. SWEPCo does not have the power to control decision making that significantly impacts the economic performance of DHLC because such power is shared with CLECO. As a result, SWEPCo is not required to consolidate DHLC as it is not the primary beneficiary, although it holds a significant variable interest in DHLC. SWEPCo’s equity investment in DHLC is included in Deferred Charges and Other Noncurrent Assets on SWEPCo’s balance sheets.
SWEPCo’s investment in DHLC was:
| | | | | | | | | | | | | | | | | | | | | | | |
| December 31, |
| 2024 | | 2023 |
| As Reported on
the Balance Sheet | | Maximum
Exposure | | As Reported on
the Balance Sheet | | Maximum
Exposure |
| (in millions) |
| Capital Contribution from SWEPCo | $ | 7.6 | | | $ | 7.6 | | | $ | 7.6 | | | $ | 7.6 | |
| Retained Earnings | 0.3 | | | 0.3 | | | 0.4 | | | 0.4 | |
| SWEPCo’s Share of Obligations | — | | | 15.6 | | | — | | | 19.2 | |
| Total Investment in DHLC | $ | 7.9 | | | $ | 23.5 | | | $ | 8.0 | | | $ | 27.2 | |
OVEC (Applies to AEP and OPCo)
AEP and several nonaffiliated utility companies jointly own OVEC. As of December 31, 2024, AEP’s ownership in OVEC was 43.47%. Parent owns 39.17% and OPCo owns 4.3%. APCo, I&M and OPCo are members to an intercompany power agreement. The Registrants’ power participation ratios are 15.69% for APCo, 7.85% for I&M and 19.93% for OPCo. Participants of this agreement are entitled to receive and are obligated to pay for all OVEC generating capacity, approximately 2,400 MWs, in proportion to their respective power participation ratios. The proceeds from the sale of power by OVEC are designed to be sufficient for OVEC to meet its operating expenses and fixed costs, including outstanding indebtedness, and provide a return on capital. The intercompany power agreement ends in June 2040.
AEP and other nonaffiliated owners authorized environmental investments related to their ownership interests. OVEC financed capital expenditures in connection with the engineering and construction of FGD projects and the associated waste disposal landfills at its two generation plants. These environmental projects were funded through debt issuances. As of December 31, 2024 and 2023, OVEC’s outstanding indebtedness was approximately $997 million and $1.1 billion, respectively. Although they are not an obligor or guarantor, the Registrants’ are responsible for their respective ratio of OVEC’s outstanding debt through the intercompany power agreement. Principal and interest payments related to OVEC’s outstanding indebtedness are disclosed in accordance with the accounting guidance for “Commitments.” See the “Commitments” section of Note 6 for additional information.
AEP is not required to consolidate OVEC as it is not the primary beneficiary, although AEP and OPCo each hold a significant variable interest in OVEC. Power to control decision making that significantly impacts the economic performance of OVEC is shared amongst the owners through their representation on the Board of Directors of OVEC and the representation of the sponsoring companies on the Operating Committee under the intercompany power agreement.
AEP’s investment in OVEC was:
| | | | | | | | | | | | | | | | | | | | | | | |
| December 31, |
| 2024 | | 2023 |
| As Reported on
the Balance Sheet | | Maximum
Exposure | | As Reported on
the Balance Sheet | | Maximum Exposure |
| (in millions) |
| Capital Contribution from AEP | $ | 4.4 | | | $ | 4.4 | | | $ | 4.4 | | | $ | 4.4 | |
| AEP’s Share of OVEC Debt (a) | — | | | 433.2 | | | — | | | 465.3 | |
| Total Investment in OVEC | $ | 4.4 | | | $ | 437.6 | | | $ | 4.4 | | | $ | 469.7 | |
(a)Based on the Registrants’ power participation ratios, APCo, I&M and OPCo’s share of OVEC debt was $156 million, $78 million and $199 million as of December 31, 2024, respectively, and $168 million, $84 million and $213 million as of December 31, 2023, respectively.
Power purchased by the Registrant Subsidiaries from OVEC is included in Purchased Electricity, Fuel and Other Consumables Used for Electric Generation and Purchased Electricity for Resale on the statements of income and is shown in the table below:
| | | | | | | | | | | | | | | | | | | | |
| | Years Ended December 31, |
| Company | | 2024 | | 2023 | | 2022 |
| | (in millions) |
| APCo | | $ | 133.6 | | | $ | 121.8 | | | $ | 119.3 | |
| I&M | | 66.8 | | | 60.9 | | | 59.7 | |
| OPCo | | 169.7 | | | 154.7 | | | 151.8 | |
Significant Equity Method Investment in Unconsolidated Entities (Applies to AEP)
For a discussion of the equity method of accounting, see the “Equity Method Investments in Unconsolidated Entities” section of Note 1.
ETT
ETT designs, acquires, constructs, owns and operates certain transmission facilities in ERCOT. BHE, a nonaffiliated entity, holds a 50% membership interest in ETT and AEP Transmission Holdco holds a 50% membership interest in ETT. As a result, AEP, through its wholly-owned subsidiary, holds a 50% membership interest in ETT. As of December 31, 2024 and 2023, AEP’s investment in ETT was $897 million and $811 million, respectively. AEP’s equity earnings associated with ETT were $86 million, $74 million and $74 million for the years ended December 31, 2024, 2023 and 2022, respectively.
19. PROPERTY, PLANT AND EQUIPMENT
The disclosures in this note apply to all Registrants unless indicated otherwise.
Property, Plant and Equipment is shown functionally on the face of the balance sheets. The following tables include the total plant balances as of December 31, 2024 and 2023:
| | | | | | | | | | | | | | | | | | | | | | | | | | | | | | | | | | | | | | | | | | | | | | | | | | | | | |
| December 31, 2024 | | AEP | | AEP Texas | | AEPTCo | | APCo | | I&M | | OPCo | | PSO | | SWEPCo | |
| | (in millions) | |
| Regulated Property, Plant and Equipment | | | | | | | | | | | | | | | | | |
| Generation | | $ | 24,694.5 | | (a) | $ | — | | | $ | — | | | $ | 7,272.6 | | | $ | 5,438.5 | | | $ | — | | | $ | 2,772.4 | | | $ | 5,287.5 | | (a) |
| Transmission | | 38,871.9 | | | 7,546.2 | | | 14,913.4 | | | 5,001.5 | | | 1,957.8 | | | 3,663.9 | | | 1,345.3 | | | 2,863.8 | | |
| Distribution | | 31,061.9 | | | 6,250.5 | | | — | | | 5,568.5 | | | 3,535.0 | | | 7,244.0 | | | 3,698.8 | | | 3,007.1 | | |
| Other | | 6,544.9 | | | 1,172.9 | | | 515.9 | | | 1,023.9 | | | 948.3 | | | 1,245.3 | | | 546.8 | | | 682.7 | | |
| CWIP | | 6,321.5 | | (a) | 1,118.0 | | | 1,965.4 | | | 742.6 | | | 330.1 | | | 691.1 | | | 378.8 | | | 627.3 | | (a) |
| Less: Accumulated Depreciation | | 25,794.0 | | | 2,045.7 | | | 1,578.5 | | | 6,030.9 | | | 4,607.0 | | | 2,883.0 | | | 2,214.7 | | | 3,048.5 | | |
| Total Regulated Property, Plant and Equipment - Net | | 81,700.7 | | | 14,041.9 | | | 15,816.2 | | | 13,578.2 | | | 7,602.7 | | | 9,961.3 | | | 6,527.4 | | | 9,419.9 | | |
| Nonregulated Property, Plant and Equipment - Net | | 714.9 | | | 1.6 | | | 0.3 | | | 34.3 | | | 76.6 | | | 9.8 | | | 4.9 | | | 26.2 | | |
| Total Property, Plant and Equipment - Net | | $ | 82,415.6 | | | $ | 14,043.5 | | | $ | 15,816.5 | | | $ | 13,612.5 | | | $ | 7,679.3 | | | $ | 9,971.1 | | | $ | 6,532.3 | | | $ | 9,446.1 | | |
| | | | | | | | | | | | | | | | | | | | | | | | | | | | | | | | | | | | | | | | | | | | | | | | | | | | | |
| December 31, 2023 | | AEP | | AEP Texas | | AEPTCo | | APCo | | I&M | | OPCo | | PSO | | SWEPCo | |
| | (in millions) | |
| Regulated Property, Plant and Equipment | | | | | | | | | | | | | | | | | |
| Generation | | $ | 23,862.7 | | (a) | $ | — | | | $ | — | | | $ | 7,041.3 | | | $ | 5,588.7 | | | $ | — | | | $ | 2,695.5 | | | $ | 4,790.7 | | (a) |
| Transmission | | 35,903.6 | | | 6,812.6 | | | 13,723.9 | | | 4,711.8 | | | 1,906.4 | | | 3,395.1 | | | 1,228.3 | | | 2,660.6 | | |
| Distribution | | 28,989.9 | | | 5,798.8 | | | — | | | 5,176.6 | | | 3,254.0 | | | 6,839.4 | | | 3,450.8 | | | 2,824.1 | | |
| Other | | 5,986.1 | | | 1,142.9 | | | 501.2 | | | 943.7 | | | 856.8 | | | 1,114.4 | | | 502.7 | | | 544.1 | | |
| CWIP | | 5,480.6 | | (a) | 904.6 | | | 1,563.7 | | | 709.2 | | | 294.1 | | | 654.0 | | | 313.7 | | | 555.8 | | (a) |
| Less: Accumulated Depreciation | | 24,093.8 | | | 1,886.7 | | | 1,291.4 | | | 5,684.0 | | | 4,353.7 | | | 2,712.7 | | | 2,083.6 | | | 2,840.8 | | |
| Total Regulated Property, Plant and Equipment - Net | | 76,129.1 | | | 12,772.2 | | | 14,497.4 | | | 12,898.6 | | | 7,546.3 | | | 9,290.2 | | | 6,107.4 | | | 8,534.5 | | |
| Nonregulated Property, Plant and Equipment - Net | | 564.3 | | | 1.8 | | | 0.3 | | | 32.9 | | | 82.7 | | | 9.7 | | | 4.9 | | | 23.9 | | |
| Total Property, Plant and Equipment - Net | | $ | 76,693.4 | | | $ | 12,774.0 | | | $ | 14,497.7 | | | $ | 12,931.5 | | | $ | 7,629.0 | | | $ | 9,299.9 | | | $ | 6,112.3 | | | $ | 8,558.4 | | |
(a)AEP and SWEPCo’s regulated generation and regulated CWIP include amounts related to SWEPCo’s Arkansas jurisdictional share of the Turk Plant.
Depreciation, Depletion and Amortization
The Registrants provide for depreciation of Property, Plant and Equipment, excluding coal-mining properties, on a straight-line basis over the estimated useful lives of property, generally using composite rates by functional class. The following tables provide total regulated annual composite depreciation rates and depreciable lives for the Registrants:
| | | | | | | | | | | | | | | | | | | | | | | | | | | | | | | | | | | | | | | | | | | | | | | | | | | | | | | | | | | | | | | | | | | | | | | | | | |
| AEP | | | | | | | | | | | | | | | | | | | | | | | | |
| | 2024 | | 2023 | | 2022 |
| Functional Class of Property | | Annual Composite
Depreciation Rate Ranges | | Depreciable
Life Ranges | | Annual Composite
Depreciation Rate Ranges | | Depreciable
Life Ranges | | Annual Composite
Depreciation Rate Ranges | | Depreciable
Life Ranges |
| | | | | | (in years) | | | | | | (in years) | | | | | | (in years) |
| Generation | | 2.7% | - | 4.9% | | 20 | - | 162 | | 2.7% | - | 4.7% | | 20 | - | 162 | | 2.7% | - | 7.6% | | 20 | - | 132 |
| Transmission | | 2.1% | - | 2.7% | | 15 | - | 79 | | 2.0% | - | 2.7% | | 15 | - | 78 | | 2.0% | - | 2.7% | | 24 | - | 75 |
| Distribution | | 2.8% | - | 3.5% | | 7 | - | 85 | | 2.9% | - | 3.6% | | 7 | - | 85 | | 2.7% | - | 3.6% | | 7 | - | 78 |
| Other | | 3.0% | - | 8.9% | | 5 | - | 75 | | 3.8% | - | 9.1% | | 5 | - | 75 | | 3.1% | - | 14.4% | | 5 | - | 75 |
| | | | | | | | | | | | | | | | | | | | | | | | | | | | | | | | | | | | | | | | | | | | | | | | | | | | | | | | |
| AEP Texas | | | | | | | | | | | | | | | | | | |
| | 2024 | | 2023 | | 2022 |
| Functional Class of Property | | Annual Composite
Depreciation Rate | | Depreciable
Life Ranges | | Annual Composite
Depreciation Rate | | Depreciable
Life Ranges | | Annual Composite
Depreciation Rate | | Depreciable
Life Ranges |
| | | | (in years) | | | | (in years) | | | | (in years) |
| Transmission | | 2.2% | | 50 | - | 79 | | 2.2% | | 50 | - | 75 | | 2.2% | | 50 | - | 75 |
| Distribution | | 2.8% | | 15 | - | 74 | | 2.9% | | 7 | - | 70 | | 2.9% | | 7 | - | 70 |
| Other | | 5.9% | | 5 | - | 54 | | 6.0% | | 5 | - | 50 | | 6.2% | | 5 | - | 50 |
| | | | | | | | | | | | | | | | | | | | | | | | | | | | | | | | | | | | | | | | | | | | | | | | | | | | | | | | |
| AEPTCo | | | | | | | | | | | | | | | | | | |
| | 2024 | | 2023 | | 2022 |
| Functional Class of Property | | Annual Composite
Depreciation Rate | | Depreciable
Life Ranges | | Annual Composite
Depreciation Rate | | Depreciable
Life Ranges | | Annual Composite
Depreciation Rate | | Depreciable
Life Ranges |
| | | | (in years) | | | | (in years) | | | | (in years) |
| Transmission | | 2.7% | | 24 | - | 78 | | 2.6% | | 24 | - | 78 | | 2.6% | | 24 | - | 75 |
| Other | | 7.1% | | 5 | - | 58 | | 7.0% | | 5 | - | 58 | | 6.6% | | 5 | - | 56 |
| | | | | | | | | | | | | | | | | | | | | | | | | | | | | | | | | | | | | | | | | | | | | | | | | | | | | | | | |
| APCo | | | | | | | | | | | | | | | | | | |
| | 2024 | | 2023 | | 2022 |
| Functional Class of Property | | Annual Composite
Depreciation Rate | | Depreciable
Life Ranges | | Annual Composite
Depreciation Rate | | Depreciable
Life Ranges | | Annual Composite
Depreciation Rate | | Depreciable
Life Ranges |
| | | | (in years) | | | | (in years) | | | | (in years) |
| Generation | | 3.2% | | 35 | - | 162 | | 3.3% | | 35 | - | 162 | | 3.6% | | 35 | - | 118 |
| Transmission | | 2.3% | | 15 | - | 78 | | 2.3% | | 15 | - | 78 | | 2.2% | | 24 | - | 75 |
| Distribution | | 3.5% | | 12 | - | 60 | | 3.6% | | 12 | - | 60 | | 3.6% | | 12 | - | 57 |
| Other | | 6.8% | | 5 | - | 55 | | 7.4% | | 5 | - | 55 | | 7.3% | | 5 | - | 55 |
| | | | | | | | | | | | | | | | | | | | | | | | | | | | | | | | | | | | | | | | | | | | | | | | | | | | | | | | |
| I&M | | | | | | | | | | | | | | | | | | |
| | 2024 | | 2023 | | 2022 |
| Functional Class of Property | | Annual Composite
Depreciation Rate | | Depreciable
Life Ranges | | Annual Composite
Depreciation Rate | | Depreciable
Life Ranges | | Annual Composite
Depreciation Rate | | Depreciable
Life Ranges |
| | | | (in years) | | | | (in years) | | | | (in years) |
| Generation | | 4.9% | | 20 | - | 132 | | 4.7% | | 20 | - | 132 | | 4.9% | | 20 | - | 132 |
| Transmission | | 2.6% | | 44 | - | 67 | | 2.5% | | 44 | - | 67 | | 2.5% | | 44 | - | 67 |
| Distribution | | 2.8% | | 15 | - | 76 | | 2.9% | | 14 | - | 71 | | 3.1% | | 14 | - | 71 |
| Other | | 8.9% | | 5 | - | 45 | | 9.1% | | 5 | - | 45 | | 10.1% | | 5 | - | 45 |
| | | | | | | | | | | | | | | | | | | | | | | | | | | | | | | | | | | | | | | | | | | | | | | | | | | | | | | | |
| OPCo | | | | | | | | | | | | | | | | | | |
| | 2024 | | 2023 | | 2022 |
| Functional Class of Property | | Annual Composite
Depreciation Rate | | Depreciable
Life Ranges | | Annual Composite
Depreciation Rate | | Depreciable
Life Ranges | | Annual Composite
Depreciation Rate | | Depreciable
Life Ranges |
| | | | (in years) | | | | (in years) | | | | (in years) |
| Transmission | | 2.3% | | 39 | - | 60 | | 2.3% | | 39 | - | 60 | | 2.3% | | 39 | - | 60 |
| Distribution | | 3.1% | | 11 | - | 70 | | 3.1% | | 11 | - | 70 | | 2.7% | | 11 | - | 70 |
| Other | | 5.9% | | 5 | - | 50 | | 6.4% | | 5 | - | 50 | | 6.1% | | 5 | - | 50 |
| | | | | | | | | | | | | | | | | | | | | | | | | | | | | | | | | | | | | | | | | | | | | | | | | | | | | | | | |
| PSO | | | | | | | | | | | | | | | | | | |
| | 2024 | | 2023 | | 2022 |
| Functional Class of Property | | Annual Composite
Depreciation Rate | | Depreciable
Life Ranges | | Annual Composite
Depreciation Rate | | Depreciable
Life Ranges | | Annual Composite
Depreciation Rate | | Depreciable
Life Ranges |
| | | | (in years) | | | | (in years) | | | | (in years) |
| Generation | | 3.3% | | 30 | - | 78 | | 3.0% | | 25 | - | 75 | | 3.1% | | 30 | - | 75 |
| Transmission | | 2.6% | | 41 | - | 75 | | 2.6% | | 41 | - | 75 | | 2.5% | | 42 | - | 75 |
| Distribution | | 2.8% | | 15 | - | 85 | | 2.9% | | 15 | - | 85 | | 2.9% | | 15 | - | 78 |
| Other | | 6.6% | | 5 | - | 58 | | 6.8% | | 5 | - | 58 | | 6.8% | | 5 | - | 56 |
| | | | | | | | | | | | | | | | | | | | | | | | | | | | | | | | | | | | | | | | | | | | | | | | | | | | | | | | |
| SWEPCo | | | | | | | | | | | | | | | | | | |
| | 2024 | | 2023 | | 2022 |
| Functional Class of Property | | Annual Composite
Depreciation Rate | | Depreciable
Life Ranges | | Annual Composite
Depreciation Rate | | Depreciable
Life Ranges | | Annual Composite
Depreciation Rate | | Depreciable
Life Ranges |
| | | | (in years) | | | | (in years) | | | | (in years) |
| Generation | | 3.7% | | 30 | - | 65 | | 2.9% | | 30 | - | 65 | | 2.7% | | 30 | - | 65 |
| Transmission | | 2.2% | | 46 | - | 70 | | 2.2% | | 46 | - | 70 | | 2.3% | | 44 | - | 70 |
| Distribution | | 2.9% | | 7 | - | 75 | | 2.9% | | 7 | - | 75 | | 2.9% | | 15 | - | 75 |
| Other | | 6.7% | | 5 | - | 58 | | 8.5% | | 5 | - | 58 | | 9.0% | | 5 | - | 57 |
The following table includes the nonregulated annual composite depreciation rate ranges and nonregulated depreciable life ranges for AEP. With the exception of I&M, the Registrants' depreciation rate ranges and depreciable life ranges are not meaningful for nonregulated property for 2024, 2023 and 2022.
| | | | | | | | | | | | | | | | | | | | | | | | | | | | | | | | | | | | | | | | | | | | | | | | | | | | | | | | | | | | | | | | | | | | | | | | | | |
| | 2024 | | 2023 | | 2022 |
| Functional Class of Property | | Annual Composite
Depreciation Rate Ranges (a) | | Depreciable
Life Ranges (a) | | Annual Composite
Depreciation Rate Ranges | | Depreciable
Life Ranges | | Annual Composite
Depreciation Rate Ranges | | Depreciable
Life Ranges |
| | | | | | (in years) | | | | | | (in years) | | | | | | (in years) |
| Generation | | 1.8% | - | 6.0% | | 39 | - | 61 | | 4.8% | - | 6.7% | | 10 | - | 61 | | 3.8% | - | 8.7% | | 3 | - | 61 |
| Transmission | | NA | | NA | | 2.5% | | 62 | | 2.8% | | 10 | - | 62 |
| Distribution | | NA | | NA | | NA | | NA | | NA | | NA |
| Other | | 9.7% | | 5 | - | 35 | | 10.6% | | 5 | - | 35 | | 25.2% | | 5 | - | 35 |
(a) I&M's annual composite depreciation rate for Generation property is 1.8% and the depreciable life is 39 years.
NA Not applicable.
For regulated operations, the composite depreciation rate generally includes a component for non-ARO removal costs, which is credited to Accumulated Depreciation and Amortization on the balance sheets. Actual removal costs incurred are charged to Accumulated Depreciation and Amortization. Any excess of accrued non-ARO removal costs over actual removal costs incurred is reclassified from Accumulated Depreciation and Amortization and reflected as a regulatory liability. For nonregulated operations, non-ARO removal costs are expensed as incurred.
Asset Retirement Obligations (Applies to all Registrants except AEPTCo)
Listed below are significant changes to the Registrants ARO balances as of December 31, 2024 and 2023:
•In April 2024, the Federal EPA finalized revisions to the CCR Rule to expand the scope of the rule to include inactive impoundments at inactive facilities as well as to establish requirements for currently exempt solid waste management units that involve the direct placement of CCR on the land. In the second quarter of 2024, AEP evaluated the applicability of the rule to current and former plant sites and incurred ARO liabilities of $602 million and revised cash flow estimates by an additional $72 million based on initial cost estimates. See the “Federal EPA’s Revised CCR Rule” section of Note 6 for additional information.
•In December 2024, I&M recorded a $176 million revision as a result of the completion of the latest Cook Plant nuclear decommissioning study. I&M's ARO related to nuclear decommissioning costs for the Cook Plant was $1.97 billion and $2.11 billion as of December 31, 2024 and 2023. As of December 31, 2024 and 2023, the fair value of I&M’s assets that are legally restricted for purposes of settling decommissioning liabilities totaled $4.03 billion and $3.51 billion, respectively. These assets are included in Spent Nuclear Fuel and Decommissioning Trusts on I&M’s balance sheets.
The following is a reconciliation of the 2024 and 2023 aggregate carrying amounts of ARO by Registrant:
| | | | | | | | | | | | | | | | | | | | | | | | | | | | | | | | | | | | | | |
| Company | | ARO as of December 31, 2023 | | Accretion
Expense | | Liabilities
Incurred | | Liabilities
Settled | | Revisions in
Cash Flow
Estimates (a) | | ARO as of December 31, 2024 |
| | (in millions) |
| AEP(b)(c)(d)(e)(f) | | $ | 3,031.2 | | | $ | 140.1 | | | $ | 612.4 | | | $ | (102.4) | | | $ | (69.6) | | | $ | 3,611.7 | |
| AEP Texas (e) | | 4.5 | | | 0.2 | | | — | | | (0.8) | | | — | | | 3.9 | |
| APCo (b)(e)(f) | | 464.0 | | | 27.7 | | | 247.1 | | | (18.1) | | | 81.0 | | | 801.7 | |
| I&M (b)(c)(e) | | 2,106.0 | | | 80.2 | | | 85.7 | | | (2.2) | | | (175.9) | | | 2,093.8 | |
| OPCo (b)(e) | | 2.1 | | | 1.4 | | | 52.9 | | | (0.1) | | | — | | | 56.3 | |
| PSO (b)(e)(f) | | 84.2 | | | 5.8 | | | 33.7 | | | (1.9) | | | — | | | 121.8 | |
| SWEPCo (b)(d)(e)(f) | | 281.6 | | | 16.2 | | | 30.2 | | | (69.2) | | | 19.9 | | | 278.7 | |
| | | | | | | | | | | | | | | | | | | | | | | | | | | | | | | | | | | | | | |
| Company | | ARO as of December 31, 2022 | | Accretion
Expense | | Liabilities
Incurred | | Liabilities
Settled | | Revisions in
Cash Flow
Estimates (a) | | ARO as of December 31, 2023 |
| | (in millions) |
| AEP (b)(c)(d)(e)(f) | | $ | 2,943.6 | | | $ | 116.3 | | | $ | 38.9 | | | $ | (130.6) | | | $ | 63.0 | | | $ | 3,031.2 | |
| AEP Texas (e) | | 4.5 | | | 0.2 | | | — | | | (0.3) | | | 0.1 | | | 4.5 | |
| APCo (b)(e)(f) | | 427.7 | | | 16.8 | | | 16.1 | | | (23.1) | | | 26.5 | | | 464.0 | |
| I&M (b)(c)(e) | | 2,028.1 | | | 74.8 | | | 4.8 | | | (3.7) | | | 2.0 | | | 2,106.0 | |
| OPCo (e) | | 5.0 | | | 0.2 | | | — | | | (3.1) | | | — | | | 2.1 | |
| PSO (b)(e)(f) | | 75.7 | | | 4.7 | | | 5.8 | | | (1.2) | | | (0.8) | | | 84.2 | |
| SWEPCo (b)(d)(e)(f) | | 280.9 | | | 13.7 | | | 7.5 | | | (55.0) | | | 34.5 | | | 281.6 | |
(a)Unless discussed above, primarily related to ash ponds, landfills and mine reclamation, generally due to changes in estimated closure area, volumes and/or unit costs.
(b)Includes ARO related to ash disposal facilities.
(c)Includes ARO related to nuclear decommissioning costs for the Cook Plant.
(d)Includes ARO related to Sabine and DHLC.
(e)Includes ARO related to asbestos removal.
(f)Includes ARO related to renewables.
Allowance for Funds Used During Construction and Interest Capitalization
The Registrants’ amounts of Allowance for Equity Funds Used During Construction are summarized in the following table:
| | | | | | | | | | | | | | | | | | | | |
| | Years Ended December 31, |
| Company | | 2024 | | 2023 | | 2022 |
| | (in millions) |
| AEP | | $ | 211.0 | | | $ | 174.9 | | | $ | 133.7 | |
| AEP Texas | | 45.9 | | | 28.4 | | | 19.7 | |
| AEPTCo | | 89.4 | | | 83.2 | | | 70.7 | |
| APCo | | 16.1 | | | 11.9 | | | 11.7 | |
| I&M | | 13.3 | | | 10.9 | | | 9.8 | |
| OPCo | | 23.4 | | | 17.1 | | | 13.9 | |
| PSO | | 7.4 | | | 8.4 | | | 1.5 | |
| SWEPCo | | 13.5 | | | 11.5 | | | 4.9 | |
The Registrants’ amounts of allowance for borrowed funds used during construction, including capitalized interest, are summarized in the following table:
| | | | | | | | | | | | | | | | | | | | |
| | Years Ended December 31, |
| Company | | 2024 | | 2023 | | 2022 |
| | (in millions) |
| AEP | | $ | 129.8 | | | $ | 117.3 | | | $ | 63.0 | |
| AEP Texas | | 30.7 | | | 23.4 | | | 11.5 | |
| AEPTCo | | 33.7 | | | 31.4 | | | 22.4 | |
| APCo | | 10.5 | | | 14.1 | | | 6.5 | |
| I&M | | 9.2 | | | 7.7 | | | 5.7 | |
| OPCo | | 12.8 | | | 14.0 | | | 6.7 | |
| PSO | | 9.7 | | | 5.2 | | | 2.7 | |
| SWEPCo | | 15.1 | | | 9.8 | | | 4.3 | |
Jointly-owned Electric Facilities (Applies to AEP, I&M, PSO and SWEPCo)
The Registrants have electric facilities that are jointly-owned with affiliated and nonaffiliated companies. Using its own financing, each participating company is obligated to pay its share of the costs of these jointly-owned facilities in the same proportion as its ownership interest. Each Registrant’s proportionate share of the operating costs associated with these facilities is included in its statements of income and the investments and accumulated depreciation are reflected in its balance sheets under Property, Plant and Equipment as follows:
| | | | | | | | | | | | | | | | | | | | | | | | | | | | | |
| | | | | Registrant’s Share as of December 31, 2024 |
| Fuel
Type | | Percent of
Ownership | | Utility Plant
in Service | | Construction
Work in
Progress | | Accumulated
Depreciation |
| | | | | (in millions) |
| AEP | | | | | | | | | |
| Flint Creek Generating Station, Unit 1 (a) | Coal | | 50.0 | % | | $ | 404.1 | | | $ | 3.4 | | | $ | 188.8 | |
| | | | | | | | | |
| Turk Generating Plant (a) | Coal | | 73.3 | % | | 1,517.0 | | | 1.2 | | | 350.2 | |
| Total | | | | | $ | 1,921.1 | | | $ | 4.6 | | | $ | 539.0 | |
| | | | | | | | | |
| I&M | | | | | | | | | |
| Rockport Generating Plant (b)(c) | Coal | | 50.0 | % | | $ | 1,345.0 | | | $ | 10.9 | | | $ | 1,181.8 | |
| | | | | | | | | |
| PSO | | | | | | | | | |
| North Central Wind Energy Facilities (d)(e) | Wind | | 45.5 | % | | $ | 912.3 | | | $ | 1.0 | | | $ | 77.6 | |
| | | | | | | | | |
| SWEPCo | | | | | | | | | |
| Flint Creek Generating Station, Unit 1 (a) | Coal | | 50.0 | % | | $ | 404.1 | | | $ | 3.4 | | | $ | 188.8 | |
| | | | | | | | | |
| Turk Generating Plant (a) | Coal | | 73.3 | % | | 1,517.0 | | | 1.2 | | | 350.2 | |
| North Central Wind Energy Facilities (d)(e) | Wind | | 54.5 | % | | 1,093.5 | | | 1.2 | | | 98.1 | |
| Total | | | | | $ | 3,014.6 | | | $ | 5.8 | | | $ | 637.1 | |
| | | | | | | | | | | | | | | | | | | | | | | | | | | | | |
| | | | | Registrant’s Share as of December 31, 2023 |
| Fuel
Type | | Percent of
Ownership | | Utility Plant
in Service | | Construction
Work in
Progress | | Accumulated
Depreciation |
| | | | | (in millions) |
| AEP | | | | | | | | | |
| Flint Creek Generating Station, Unit 1 (a) | Coal | | 50.0 | % | | $ | 402.8 | | | $ | 1.6 | | | $ | 167.5 | |
| | | | | | | | | |
| Turk Generating Plant (a) | Coal | | 73.3 | % | | 1,504.0 | | | 10.1 | | | 323.3 | |
| Total | | | | | $ | 1,906.8 | | | $ | 11.7 | | | $ | 490.8 | |
| | | | | | | | | |
| I&M | | | | | | | | | |
| Rockport Generating Plant (b)(c) | Coal | | 50.0 | % | | $ | 1,341.4 | | | $ | 7.9 | | | $ | 1,018.9 | |
| | | | | | | | | |
| PSO | | | | | | | | | |
| North Central Wind Energy Facilities (d)(e) | Wind | | 45.5 | % | | $ | 906.3 | | | $ | 2.4 | | | $ | 54.1 | |
| | | | | | | | | |
| SWEPCo | | | | | | | | | |
| Flint Creek Generating Station, Unit 1 (a) | Coal | | 50.0 | % | | $ | 402.8 | | | $ | 1.6 | | | $ | 167.5 | |
| | | | | | | | | |
| Turk Generating Plant (a) | Coal | | 73.3 | % | | 1,504.0 | | | 10.1 | | | 323.3 | |
| North Central Wind Energy Facilities (d)(e) | Wind | | 54.5 | % | | 1,086.3 | | | 2.9 | | | 67.9 | |
| Total | | | | | $ | 2,993.1 | | | $ | 14.6 | | | $ | 558.7 | |
(a)Operated by SWEPCo.
(b)Operated by I&M.
(c)AEGCo owns 50%.
(d)Operated by PSO.
(e)PSO and SWEPCo own undivided interests of 45.5% and 54.5% of the NCWF, respectively.
20. REVENUE FROM CONTRACTS WITH CUSTOMERS
The disclosures in this note apply to all Registrants, unless indicated otherwise.
Disaggregated Revenues from Contracts with Customers
The table below represents AEP’s reportable segment revenues from contracts with customers, net of respective provisions for refund, by type of revenue:
| | | | | | | | | | | | | | | | | | | | | | | | | | | | | | | | | | | | | | | | | | | | |
| | Year Ended December 31, 2024 |
| | VIU | | T&D | | AEPTHCo | | G&M | | Corporate and Other | | Reconciling Adjustments | | AEP Consolidated |
| | (in millions) |
| Retail Revenues: | | | | | | | | | | | | | | |
| Residential Revenues | | $ | 4,561.9 | | | $ | 2,755.7 | | | $ | — | | | $ | — | | | $ | — | | | $ | — | | | $ | 7,317.6 | |
| Commercial Revenues | | 2,731.4 | | | 1,567.4 | | | — | | | — | | | — | | | — | | | 4,298.8 | |
| Industrial Revenues (a) | | 2,659.0 | | | 515.2 | | | — | | | — | | | — | | | (0.9) | | | 3,173.3 | |
| Other Retail Revenues | | 231.5 | | | 56.4 | | | — | | | — | | | — | | | — | | | 287.9 | |
| Total Retail Revenues | | 10,183.8 | | | 4,894.7 | | | — | | | — | | | — | | | (0.9) | | | 15,077.6 | |
| | | | | | | | | | | | | | |
| Wholesale and Competitive Retail Revenues: | | | | | | | | | | | | | | |
| Generation Revenues | | 747.8 | | | — | | | — | | | 103.2 | | | — | | | — | | | 851.0 | |
| Transmission Revenues (b) | | 483.3 | | | 769.5 | | | 1,978.3 | | | — | | | — | | | (1,620.1) | | | 1,611.0 | |
| Renewable Generation Revenues (a) | | — | | | — | | | — | | | 23.2 | | | — | | | (4.4) | | | 18.8 | |
| Retail, Trading and Marketing Revenues (c) | | — | | | — | | | — | | | 2,080.5 | | | 1.3 | | | (96.4) | | | 1,985.4 | |
| Total Wholesale and Competitive Retail Revenues | | 1,231.1 | | | 769.5 | | | 1,978.3 | | | 2,206.9 | | | 1.3 | | | (1,720.9) | | | 4,466.2 | |
| | | | | | | | | | | | | | |
| Other Revenues from Contracts with Customers (d) | | 227.3 | | | 197.5 | | | 25.8 | | | 4.1 | | | 184.7 | | | (213.5) | | | 425.9 | |
| | | | | | | | | | | | | | |
| Total Revenues from Contracts with Customers | | 11,642.2 | | | 5,861.7 | | | 2,004.1 | | | 2,211.0 | | | 186.0 | | | (1,935.3) | | | 19,969.7 | |
| | | | | | | | | | | | | | |
| Other Revenues: | | | | | | | | | | | | | | |
| Alternative Revenue Programs (e) | | (22.0) | | | 26.0 | | | (53.3) | | | — | | | — | | | (29.8) | | | (79.1) | |
| Other Revenues (a) (f) | | (23.6) | | | 20.0 | | | — | | | (165.6) | | | (2.9) | | | 2.8 | | | (169.3) | |
| Total Other Revenues | | (45.6) | | | 46.0 | | | (53.3) | | | (165.6) | | | (2.9) | | | (27.0) | | | (248.4) | |
| | | | | | | | | | | | | | |
| Total Revenues | | $ | 11,596.6 | | | $ | 5,907.7 | | | $ | 1,950.8 | | | $ | 2,045.4 | | | $ | 183.1 | | | $ | (1,962.3) | | | $ | 19,721.3 | |
(a)Amounts include affiliated and nonaffiliated revenues.
(b)Amounts include affiliated and nonaffiliated revenues. The affiliated revenue for AEP Transmission Holdco was $1.6 billion and Vertically Integrated Utilities was $177 million. The remaining affiliated amounts were immaterial.
(c)Amounts include affiliated and nonaffiliated revenues. The affiliated revenue for Generation & Marketing was $96 million. The remaining affiliated amounts were immaterial.
(d)Amounts include affiliated and nonaffiliated revenues. The affiliated revenue for Corporate and Other was $137 million. The remaining affiliated amounts were immaterial.
(e)Alternative revenue programs in certain jurisdictions include regulatory mechanisms that periodically adjust for over/under collection of related revenues.
(f)Generation & Marketing includes economic hedge activity.
| | | | | | | | | | | | | | | | | | | | | | | | | | | | | | | | | | | | | | | | | | | | |
| | Year Ended December 31, 2023 |
| | VIU | | T&D | | AEPTHCo | | G&M | | Corporate and Other | | Reconciling Adjustments | | AEP Consolidated |
| | (in millions) |
| Retail Revenues: | | | | | | | | | | | | | | |
| Residential Revenues | | $ | 4,479.3 | | | $ | 2,609.1 | | | $ | — | | | $ | — | | | $ | — | | | $ | — | | | $ | 7,088.4 | |
| Commercial Revenues | | 2,678.8 | | | 1,497.2 | | | — | | | — | | | — | | | — | | | 4,176.0 | |
| Industrial Revenues (a) | | 2,748.2 | | | 642.1 | | | — | | | — | | | — | | | (0.9) | | | 3,389.4 | |
| Other Retail Revenues | | 242.7 | | | 50.7 | | | — | | | — | | | — | | | — | | | 293.4 | |
| Total Retail Revenues | | 10,149.0 | | | 4,799.1 | | | — | | | — | | | — | | | (0.9) | | | 14,947.2 | |
| | | | | | | | | | | | | | |
| Wholesale and Competitive Retail Revenues: | | | | | | | | | | | | | | |
| Generation Revenues | | 662.5 | | | — | | | — | | | 111.3 | | | — | | | — | | | 773.8 | |
| Transmission Revenues (b) | | 444.0 | | | 701.6 | | | 1,748.9 | | | — | | | — | | | (1,418.3) | | | 1,476.2 | |
| Renewable Generation Revenues (a) | | — | | | — | | | — | | | 80.6 | | | — | | | (6.7) | | | 73.9 | |
| Retail, Trading and Marketing Revenues (c) | | — | | | — | | | — | | | 1,836.2 | | | 0.6 | | | (82.2) | | | 1,754.6 | |
| Total Wholesale and Competitive Retail Revenues | | 1,106.5 | | | 701.6 | | | 1,748.9 | | | 2,028.1 | | | 0.6 | | | (1,507.2) | | | 4,078.5 | |
| | | | | | | | | | | | | | |
| Other Revenues from Contracts with Customers (d) | | 204.4 | | | 208.1 | | | 16.8 | | | 8.6 | | | 151.5 | | | (160.3) | | | 429.1 | |
| | | | | | | | | | | | | | |
| Total Revenues from Contracts with Customers | | 11,459.9 | | | 5,708.8 | | | 1,765.7 | | | 2,036.7 | | | 152.1 | | | (1,668.4) | | | 19,454.8 | |
| | | | | | | | | | | | | | |
| Other Revenues: | | | | | | | | | | | | | | |
| Alternative Revenue Programs (e) | | (35.0) | | | (19.5) | | | (37.1) | | | — | | | — | | | (25.5) | | | (117.1) | |
| Other Revenues (a) (f) | | 24.6 | | | 24.0 | | | (0.1) | | | (404.5) | | | 15.9 | | | (15.3) | | | (355.4) | |
| Total Other Revenues | | (10.4) | | | 4.5 | | | (37.2) | | | (404.5) | | | 15.9 | | | (40.8) | | | (472.5) | |
| | | | | | | | | | | | | | |
| Total Revenues | | $ | 11,449.5 | | | $ | 5,713.3 | | | $ | 1,728.5 | | | $ | 1,632.2 | | | $ | 168.0 | | | $ | (1,709.2) | | | $ | 18,982.3 | |
(a)Amounts include affiliated and nonaffiliated revenues.
(b)Amounts include affiliated and nonaffiliated revenues. The affiliated revenue for AEP Transmission Holdco was $1.5 billion and Vertically Integrated Utilities was $205 million. The remaining affiliated amounts were immaterial.
(c)Amounts include affiliated and nonaffiliated revenues. The affiliated revenue for Generation & Marketing was $82 million. The remaining affiliated amounts were immaterial.
(d)Amounts include affiliated and nonaffiliated revenues. The affiliated revenue for Corporate and Other was $100 million. The remaining affiliated amounts were immaterial.
(e)Alternative revenue programs in certain jurisdictions include regulatory mechanisms that periodically adjust for over/under collection of related revenues.
(f)Generation & Marketing includes economic hedge activity.
| | | | | | | | | | | | | | | | | | | | | | | | | | | | | | | | | | | | | | | | | | | | |
| | Year Ended December 31, 2022 |
| | VIU | | T&D | | AEPTHCo | | G&M | | Corporate and Other | | Reconciling Adjustments | | AEP Consolidated |
| | (in millions) |
| Retail Revenues: | | | | | | | | | | | | | | |
| Residential Revenues | | $ | 4,498.6 | | | $ | 2,497.3 | | | $ | — | | | $ | — | | | $ | — | | | $ | — | | | $ | 6,995.9 | |
| Commercial Revenues | | 2,576.5 | | | 1,365.2 | | | — | | | — | | | — | | | — | | | 3,941.7 | |
| Industrial Revenues (a) | | 2,543.8 | | | 711.3 | | | — | | | — | | | — | | | (0.9) | | | 3,254.2 | |
| Other Retail Revenues | | 212.2 | | | 49.1 | | | — | | | — | | | — | | | — | | | 261.3 | |
| Total Retail Revenues | | 9,831.1 | | | 4,622.9 | | | — | | | — | | | — | | | (0.9) | | | 14,453.1 | |
| | | | | | | | | | | | | | |
| Wholesale and Competitive Retail Revenues: | | | | | | | | | | | | | | |
| Generation Revenues | | 958.3 | | | — | | | — | | | 271.2 | | | — | | | — | | | 1,229.5 | |
| Transmission Revenues (b) | | 442.8 | | | 650.0 | | | 1,700.6 | | | — | | | — | | | (1,413.2) | | | 1,380.2 | |
| Renewable Generation Revenues (a) | | — | | | — | | | — | | | 129.1 | | | — | | | (8.0) | | | 121.1 | |
| Retail, Trading and Marketing Revenues (a) | | — | | | — | | | — | | | 1,713.2 | | | 6.9 | | | (10.1) | | | 1,710.0 | |
| Total Wholesale and Competitive Retail Revenues | | 1,401.1 | | | 650.0 | | | 1,700.6 | | | 2,113.5 | | | 6.9 | | | (1,431.3) | | | 4,440.8 | |
| | | | | | | | | | | | | | |
| Other Revenues from Contracts with Customers (c) | | 241.1 | | | 247.3 | | | 8.2 | | | 12.1 | | | 93.9 | | | (104.8) | | | 497.8 | |
| | | | | | | | | | | | | | |
| Total Revenues from Contracts with Customers | | 11,473.3 | | | 5,520.2 | | | 1,708.8 | | | 2,125.6 | | | 100.8 | | | (1,537.0) | | | 19,391.7 | |
| | | | | | | | | | | | | | |
| Other Revenues: | | | | | | | | | | | | | | |
| Alternative Revenue Programs (d) | | 3.8 | | | (26.8) | | | (31.8) | | | — | | | — | | | (57.7) | | | (112.5) | |
| Other Revenues (a) (e) | | 0.4 | | | 18.6 | | | — | | | 341.3 | | | 9.1 | | | (9.1) | | | 360.3 | |
| Total Other Revenues | | 4.2 | | | (8.2) | | | (31.8) | | | 341.3 | | | 9.1 | | | (66.8) | | | 247.8 | |
| | | | | | | | | | | | | | |
| Total Revenues | | $ | 11,477.5 | | | $ | 5,512.0 | | | $ | 1,677.0 | | | $ | 2,466.9 | | | $ | 109.9 | | | $ | (1,603.8) | | | $ | 19,639.5 | |
(a)Amounts include affiliated and nonaffiliated revenues.
(b)Amounts include affiliated and nonaffiliated revenues. The affiliated revenue for AEP Transmission Holdco was $1.3 billion. The remaining affiliated amounts were immaterial.
(c)Amounts include affiliated and nonaffiliated revenues. The affiliated revenue for Corporate and Other was $59 million. The remaining affiliated amounts were immaterial.
(d)Alternative revenue programs in certain jurisdictions include regulatory mechanisms that periodically adjust for over/under collection of related revenues.
(e)Generation & Marketing includes economic hedge activity.
The table below represents revenues from contracts with customers, net of respective provisions for refund, by type of revenue for the Registrant Subsidiaries:
| | | | | | | | | | | | | | | | | | | | | | | | | | | | | | | | | | | | | | | | | | | | |
| | Year Ended December 31, 2024 |
| | AEP Texas | | AEPTCo | | APCo | | I&M | | OPCo | | PSO | | SWEPCo |
| | (in millions) |
| Retail Revenues: | | | | | | | | | | | | | | |
| Residential Revenues | | $ | 724.8 | | | $ | — | | | $ | 1,772.0 | | | $ | 847.2 | | | $ | 2,030.8 | | | $ | 799.6 | | | $ | 726.4 | |
| Commercial Revenues | | 466.6 | | | — | | | 764.4 | | | 605.1 | | | 1,100.7 | | | 509.5 | | | 558.1 | |
| Industrial Revenues (a) | | 141.5 | | | — | | | 813.1 | | | 595.6 | | | 373.7 | | | 349.1 | | | 367.9 | |
| Other Retail Revenues | | 38.9 | | | — | | | 113.0 | | | 5.1 | | | 17.4 | | | 100.5 | | | 9.2 | |
| Total Retail Revenues | | 1,371.8 | | | — | | | 3,462.5 | | | 2,053.0 | | | 3,522.6 | | | 1,758.7 | | | 1,661.6 | |
| | | | | | | | | | | | | | |
| Wholesale Revenues: | | | | | | | | | | | | | | |
| Generation Revenues (b) | | — | | | — | | | 304.5 | | | 393.9 | | | — | | | 9.4 | | | 176.9 | |
| Transmission Revenues (c) | | 673.2 | | | 1,924.6 | | | 184.6 | | | 40.6 | | | 96.3 | | | 42.1 | | | 172.1 | |
| Total Wholesale Revenues | | 673.2 | | | 1,924.6 | | | 489.1 | | | 434.5 | | | 96.3 | | | 51.5 | | | 349.0 | |
| | | | | | | | | | | | | | |
| Other Revenues from Contracts with Customers (d) | | 35.8 | | | 25.9 | | | 87.2 | | | 116.0 | | | 162.0 | | | 39.3 | | | 32.7 | |
| | | | | | | | | | | | | | |
| Total Revenues from Contracts with Customers | | 2,080.8 | | | 1,950.5 | | | 4,038.8 | | | 2,603.5 | | | 3,780.9 | | | 1,849.5 | | | 2,043.3 | |
| | | | | | | | | | | | | | |
| Other Revenues: | | | | | | | | | | | | | | |
| Alternative Revenue Programs (e) | | (0.9) | | | (59.6) | | | (6.4) | | | (7.6) | | | 26.9 | | | (3.1) | | | (7.0) | |
| Other Revenues (a) | | — | | | — | | | 0.2 | | | (23.9) | | | 20.0 | | | — | | | — | |
| Total Other Revenues | | (0.9) | | | (59.6) | | | (6.2) | | | (31.5) | | | 46.9 | | | (3.1) | | | (7.0) | |
| | | | | | | | | | | | | | |
| Total Revenues | | $ | 2,079.9 | | | $ | 1,890.9 | | | $ | 4,032.6 | | | $ | 2,572.0 | | | $ | 3,827.8 | | | $ | 1,846.4 | | | $ | 2,036.3 | |
(a)Amounts include affiliated and nonaffiliated revenues.
(b)Amounts include affiliated and nonaffiliated revenues. The affiliated revenue for APCo was $159 million primarily relating to the PPA with KGPCo. The remaining affiliated amounts were immaterial.
(c)Amounts include affiliated and nonaffiliated revenues. The affiliated revenue for AEPTCo was $1.6 billion, APCo was $87 million and SWEPCo was $65 million. The remaining affiliated amounts were immaterial.
(d)Amounts include affiliated and nonaffiliated revenues. The affiliated revenue for I&M was $75 million primarily relating to barging, urea transloading and other transportation services. The remaining affiliated amounts were immaterial.
(e)Alternative revenue programs in certain jurisdictions include regulatory mechanisms that periodically adjust for over/under collection of related revenues.
| | | | | | | | | | | | | | | | | | | | | | | | | | | | | | | | | | | | | | | | | | | | |
| | Year Ended December 31, 2023 |
| | AEP Texas | | AEPTCo | | APCo | | I&M | | OPCo | | PSO | | SWEPCo |
| | (in millions) |
| Retail Revenues: | | | | | | | | | | | | | | |
| Residential Revenues | | $ | 655.5 | | | $ | — | | | $ | 1,612.9 | | | $ | 841.9 | | | $ | 1,953.7 | | | $ | 831.2 | | | $ | 799.5 | |
| Commercial Revenues | | 415.2 | | | — | | | 699.6 | | | 575.2 | | | 1,082.0 | | | 538.8 | | | 609.4 | |
| Industrial Revenues (a) | | 145.0 | | | — | | | 778.4 | | | 614.2 | | | 497.1 | | | 423.1 | | | 415.9 | |
| Other Retail Revenues | | 35.5 | | | — | | | 106.3 | | | 5.0 | | | 15.1 | | | 112.8 | | | 10.1 | |
| Total Retail Revenues | | 1,251.2 | | | — | | | 3,197.2 | | | 2,036.3 | | | 3,547.9 | | | 1,905.9 | | | 1,834.9 | |
| | | | | | | | | | | | | | |
| Wholesale Revenues: | | | | | | | | | | | | | | |
| Generation Revenues (b) | | — | | | — | | | 288.2 | | | 327.1 | | | — | | | 11.7 | | | 176.9 | |
| Transmission Revenues (c) | | 619.0 | | | 1,703.9 | | | 181.0 | | | 38.6 | | | 82.6 | | | 37.5 | | | 150.8 | |
| Total Wholesale Revenues | | 619.0 | | | 1,703.9 | | | 469.2 | | | 365.7 | | | 82.6 | | | 49.2 | | | 327.7 | |
| | | | | | | | | | | | | | |
| Other Revenues from Contracts with Customers (d) | | 35.9 | | | 16.7 | | | 74.2 | | | 120.3 | | | 172.3 | | | 21.5 | | | 29.5 | |
| | | | | | | | | | | | | | |
| Total Revenues from Contracts with Customers | | 1,906.1 | | | 1,720.6 | | | 3,740.6 | | | 2,522.3 | | | 3,802.8 | | | 1,976.6 | | | 2,192.1 | |
| | | | | | | | | | | | | | |
| Other Revenues: | | | | | | | | | | | | | | |
| Alternative Revenue Programs (e) | | (4.2) | | | (48.6) | | | (20.1) | | | (10.9) | | | (15.3) | | | 0.5 | | | (9.4) | |
| Other Revenues (a) | | — | | | — | | | 0.2 | | | 24.5 | | | 23.9 | | | (0.1) | | | 0.1 | |
| Total Other Revenues | | (4.2) | | | (48.6) | | | (19.9) | | | 13.6 | | | 8.6 | | | 0.4 | | | (9.3) | |
| | | | | | | | | | | | | | |
| Total Revenues | | $ | 1,901.9 | | | $ | 1,672.0 | | | $ | 3,720.7 | | | $ | 2,535.9 | | | $ | 3,811.4 | | | $ | 1,977.0 | | | $ | 2,182.8 | |
(a)Amounts include affiliated and nonaffiliated revenues.
(b)Amounts include affiliated and nonaffiliated revenues. The affiliated revenue for APCo was $159 million primarily relating to the PPA with KGPCo. The remaining affiliated amounts were immaterial.
(c)Amounts include affiliated and nonaffiliated revenues. The affiliated revenue for AEPTCo was $1.4 billion, APCo was $93 million and SWEPCo was $73 million. The remaining affiliated amounts were immaterial.
(d)Amounts include affiliated and nonaffiliated revenues. The affiliated revenue for I&M was $68 million primarily relating to barging, urea transloading and other transportation services. The remaining affiliated amounts were immaterial.
(e)Alternative revenue programs in certain jurisdictions include regulatory mechanisms that periodically adjust for over/under collection of related revenues.
| | | | | | | | | | | | | | | | | | | | | | | | | | | | | | | | | | | | | | | | | | | | |
| | Year Ended December 31, 2022 |
| | AEP Texas | | AEPTCo | | APCo | | I&M | | OPCo | | PSO | | SWEPCo |
| | (in millions) |
| Retail Revenues: | | | | | | | | | | | | | | |
| Residential Revenues | | $ | 667.2 | | | $ | — | | | $ | 1,558.7 | | | $ | 852.4 | | | $ | 1,830.2 | | | $ | 816.3 | | | $ | 820.7 | |
| Commercial Revenues | | 417.5 | | | — | | | 643.4 | | | 550.2 | | | 947.7 | | | 489.2 | | | 612.3 | |
| Industrial Revenues (a) | | 139.6 | | | — | | | 664.0 | | | 602.9 | | | 571.7 | | | 372.5 | | | 393.5 | |
| Other Retail Revenues | | 35.3 | | | — | | | 87.1 | | | 5.0 | | | 13.9 | | | 102.9 | | | 10.1 | |
| Total Retail Revenues | | 1,259.6 | | | — | | | 2,953.2 | | | 2,010.5 | | | 3,363.5 | | | 1,780.9 | | | 1,836.6 | |
| | | | | | | | | | | | | | |
| Wholesale Revenues: | | | | | | | | | | | | | | |
| Generation Revenues (b) | | — | | | — | | | 299.9 | | | 490.0 | | | — | | | 26.5 | | | 273.2 | |
| Transmission Revenues (c) | | 563.8 | | | 1,643.5 | | | 167.0 | | | 36.8 | | | 86.2 | | | 39.2 | | | 148.7 | |
| Total Wholesale Revenues | | 563.8 | | | 1,643.5 | | | 466.9 | | | 526.8 | | | 86.2 | | | 65.7 | | | 421.9 | |
| | | | | | | | | | | | | | |
| Other Revenues from Contracts with Customers (d) | | 24.6 | | | 8.2 | | | 100.6 | | | 122.4 | | | 222.4 | | | 29.1 | | | 24.7 | |
| | | | | | | | | | | | | | |
| Total Revenues from Contracts with Customers | | 1,848.0 | | | 1,651.7 | | | 3,520.7 | | | 2,659.7 | | | 3,672.1 | | | 1,875.7 | | | 2,283.2 | |
| | | | | | | | | | | | | | |
| Other Revenues: | | | | | | | | | | | | | | |
| Alternative Revenue Programs (e) | | (1.2) | | | (27.2) | | | (1.3) | | | 10.0 | | | (25.6) | | | (1.0) | | | 1.2 | |
| Other Revenues (a) | | — | | | — | | | 0.5 | | | (0.1) | | | 18.6 | | | — | | | — | |
| Total Other Revenues | | (1.2) | | | (27.2) | | | (0.8) | | | 9.9 | | | (7.0) | | | (1.0) | | | 1.2 | |
| | | | | | | | | | | | | | |
| Total Revenues | | $ | 1,846.8 | | | $ | 1,624.5 | | | $ | 3,519.9 | | | $ | 2,669.6 | | | $ | 3,665.1 | | | $ | 1,874.7 | | | $ | 2,284.4 | |
(a)Amounts include affiliated and nonaffiliated revenues.
(b)Amounts include affiliated and nonaffiliated revenues. The affiliated revenue for APCo was $170 million primarily relating to the PPA with KGPCo. The remaining affiliated amounts were immaterial.
(c)Amounts include affiliated and nonaffiliated revenues. The affiliated revenue for AEPTCo was $1.3 billion, APCo was $78 million and SWEPCo was $51 million. The remaining affiliated amounts were immaterial.
(d)Amounts include affiliated and nonaffiliated revenues. The affiliated revenue for I&M was $62 million primarily relating to barging, urea transloading and other transportation services. The remaining affiliated amounts were immaterial.
(e)Alternative revenue programs in certain jurisdictions include regulatory mechanisms that periodically adjust for over/under collection of related revenues.
Performance Obligations
AEP has performance obligations as part of its normal course of business. A performance obligation is a promise to transfer a distinct good or service, or a series of distinct goods or services that are substantially the same and have the same pattern of transfer to a customer. The invoice practical expedient within the accounting guidance for “Revenue from Contracts with Customers” allows for the recognition of revenue from performance obligations in the amount of consideration to which there is a right to invoice the customer and when the amount for which there is a right to invoice corresponds directly to the value transferred to the customer.
The purpose of the invoice practical expedient is to depict an entity’s measure of progress toward completion of the performance obligation within a contract and can only be applied to performance obligations that are satisfied over time and when the invoice is representative of services provided to date. AEP subsidiaries elected to apply the invoice practical expedient to recognize revenue for performance obligations satisfied over time as the invoices from the respective revenue streams are representative of services or goods provided to date to the customer. Performance obligations for AEP’s subsidiaries are summarized as follows:
Retail Revenues
AEP’s subsidiaries within the Vertically Integrated Utilities and Transmission and Distribution Utilities segments have performance obligations to generate, transmit and distribute electricity for sale to rate-regulated retail customers. The performance obligation to deliver electricity is satisfied over time as the customer simultaneously receives and consumes the benefits provided. Revenues are variable as they are subject to the customer’s usage requirements.
Rate-regulated retail customers typically have the right to discontinue receiving service at will, therefore these contracts between AEP’s subsidiaries and their customers for rate-regulated services are generally limited to the services requested and received to date for such arrangements. Retail customers are generally billed on a monthly basis, and payment is typically due within 15 to 20 days after the issuance of the invoice. Payments from REPs are due to AEP Texas within 35 days.
Wholesale Revenues - Generation
AEP’s subsidiaries within the Vertically Integrated Utilities and Generation & Marketing segments have performance obligations to sell electricity to wholesale customers from generation assets in PJM, SPP and ERCOT. The performance obligation to deliver electricity from generation assets is satisfied over time as the customer simultaneously receives and consumes the benefits provided. Wholesale generation revenues are variable as they are subject to the customer’s usage requirements.
AEP’s subsidiaries within the Vertically Integrated Utilities and Generation & Marketing segments also have performance obligations to stand ready in order to promote grid reliability. Stand ready services are sold into PJM’s RPM capacity market. RPM entails a base auction and at least three incremental auctions for a specific PJM delivery year, with the incremental auctions spanning three years. The performance obligation to stand ready is satisfied over time and the consideration for which is variable until the occurrence of the final incremental auction, at which point the performance obligation becomes fixed.
Payments from the RTO for stand ready services are typically received within one week from the issuance of the invoice, which is typically issued weekly. Gross margin resulting from generation sales within the Vertically Integrated Utilities segment are primarily subject to margin sharing agreements with customers and vary by state, where the revenues are reflected gross in the disaggregated revenues tables above.
APCo has a performance obligation to supply wholesale electricity to KGPCo through a PPA. The FERC regulates the cost-based wholesale power transactions between APCo and KGPCo. The purchased power agreement includes a component for the recovery of transmission costs under the FERC OATT. The transmission cost component of purchased power is cost-based and regulated by the Tennessee Regulatory Authority. APCo’s performance obligation under the purchased power agreement is satisfied over time as KGPCo simultaneously receives and consumes the wholesale electricity. APCo’s revenues from the purchased power agreement are presented within the Generation Revenues line in the disaggregated revenues tables above.
Wholesale Revenues - Transmission
AEP’s subsidiaries within the Vertically Integrated Utilities, Transmission and Distribution Utilities and AEP Transmission Holdco segments have performance obligations to transmit electricity to wholesale customers through assets owned and operated by AEP subsidiaries. The performance obligation to provide transmission services in PJM, SPP and ERCOT is partially fixed for a period of one year or less. Payments from the RTO for transmission services are typically received within one week from the issuance of the invoice, which is issued monthly for SPP and ERCOT and weekly for PJM.
AEP subsidiaries within the PJM and SPP regions collect revenues through transmission formula rates. The FERC-approved rates establish the annual transmission revenue requirement (ATRR) and transmission service rates for transmission owners. The formula rates establish rates for a one year period and also include a true-up calculation for the prior year’s billings, allowing for over/under-recovery of the transmission owner’s ATRR. The annual true-ups meet the definition of alternative revenues in accordance with the accounting guidance for “Regulated Operations,” and are therefore presented as such in the disaggregated revenues tables above. AEP subsidiaries within the ERCOT region collect revenues through a combination of base rates and interim Transmission Costs of Services filings that are approved by the PUCT.
The AEP East Companies are parties to the TA, which defines how transmission costs are allocated among the AEP East Companies on a 12-month average coincident peak basis. PSO, SWEPCo and AEPSC are parties to the TCA by and among PSO, SWEPCo and AEPSC, in connection with the operation of the transmission assets of the two AEP utility subsidiaries. AEPTCo is a transmission owner within the PJM and SPP regions providing transmission services to affiliates in accordance with the OATT, TA and TCA. Affiliate revenues as a result of the respective TA and the TCA are reflected as Transmission Revenues in the disaggregated revenues tables above.
Marketing, Competitive Retail and Renewable Revenues
AEP’s subsidiaries within the Generation & Marketing segment have performance obligations to deliver electricity to competitive retail and wholesale customers. Performance obligations for marketing, competitive retail and renewable offtake sales are satisfied over time as the customer simultaneously receives and consumes the benefits provided. Revenues are primarily variable as they are subject to customer’s usage requirements; however, certain contracts mandate a delivery of a set quantity of electricity at a predetermined price, resulting in a fixed performance obligation.
Payment terms under marketing arrangements typically follow standard Edison Electric Institute and International Swaps and Derivatives Association terms, which call for payment in 20 days. Payments for competitive retail and offtake arrangements for renewable assets range from 15 to 60 days and are dependent on the product sold, location and the creditworthiness of customer. Invoices for marketing arrangements, competitive retail and offtake arrangements for renewable assets are issued monthly.
Fixed Performance Obligations (Applies to AEP, APCo and I&M)
The following table represents the Registrants’ remaining fixed performance obligations satisfied over time as of December 31, 2024. Fixed performance obligations primarily include electricity sales for fixed amounts of energy and stand ready services into PJM’s RPM market. The Registrants elected to apply the exemption to not disclose the value of unsatisfied performance obligations for contracts with an original expected term of one year or less. Due to the annual establishment of revenue requirements, transmission revenues are excluded from the table below. The Registrant Subsidiaries amounts shown in the table below include affiliated and nonaffiliated revenues.
| | | | | | | | | | | | | | | | | | | | | | | | | | | | | | | | |
| Company | | 2025 | | 2026-2027 | | 2028-2029 | | After 2029 | | Total |
| | (in millions) |
| AEP | | $ | 93.7 | | | $ | 143.0 | | | $ | 48.8 | | | $ | 16.1 | | | $ | 301.6 | |
| | | | | | | | | | |
| | | | | | | | | | |
| APCo | | 16.1 | | | 32.1 | | | 23.1 | | | 11.6 | | | 82.9 | |
| I&M | | 4.4 | | | 8.8 | | | 6.8 | | | 2.4 | | | 22.4 | |
| | | | | | | | | | |
| | | | | | | | | | |
| | | | | | | | | | |
Contract Assets and Liabilities
Contract assets are recognized when the Registrants have a right to consideration that is conditional upon the occurrence of an event other than the passage of time, such as future performance under a contract. The Registrants did not have any material contract assets as of December 31, 2024 and 2023.
When the Registrants receive consideration, or such consideration is unconditionally due from a customer prior to transferring goods or services to the customer under the terms of a sales contract, they recognize a contract liability on the balance sheet in the amount of that consideration. Revenue for such consideration is subsequently recognized in the period or periods in which the remaining performance obligations in the contract are satisfied. The Registrants’ contract liabilities typically arise from services provided under joint use agreements for utility poles. The Registrants did not have any material contract liabilities as of December 31, 2024 and 2023.
Accounts Receivable from Contracts with Customers
Accounts receivable from contracts with customers are presented on the Registrants’ balance sheets within the Accounts Receivable - Customers line item. The Registrants’ balances for receivables from contracts that are not recognized in accordance with the accounting guidance for “Revenue from Contracts with Customers” included in Accounts Receivable - Customers were not material as of December 31, 2024 and 2023. See “Securitized Accounts Receivable - AEP Credit” section of Note 15 for additional information.
The following table represents the amount of affiliated accounts receivable from contracts with customers included in Accounts Receivable - Affiliated Companies on the Registrant Subsidiaries’ balance sheets:
| | | | | | | | | | | | | | | | | | | | | | | | | | | | | | | | | | | | | | | | | | | | |
| Years Ended December 31, | | AEP Texas | | AEPTCo | | APCo | | I&M | | OPCo | | PSO | | SWEPCo |
| | (in millions) |
| 2024 | | $ | — | | | $ | 131.6 | | | $ | 83.7 | | | $ | 55.0 | | | $ | 63.6 | | | $ | 13.0 | | | $ | 21.4 | |
| 2023 | | — | | | 123.2 | | 71.7 | | 44.0 | | 70.1 | | 12.4 | | 27.4 |
Contract Costs
Contract costs to obtain or fulfill a contract for AEP subsidiaries within the Generation & Marketing segment are accounted for under the guidance for “Other Assets and Deferred Costs” and presented as a single asset and are neither bifurcated nor reclassified between current and noncurrent assets on the Registrants’ balance sheets. Contract costs to acquire a contract are amortized in a manner consistent with the transfer of goods or services to the customer in Other Operation on the Registrants’ income statements. The Registrants did not have material contract costs as of December 31, 2024 and 2023.
21. SUBSEQUENT EVENTS
Noncontrolling Interest in OHTCo and IMTCo (Applies to AEP and AEPTCo)
In January 2025, AEP announced a partnership between nonaffiliated entities to acquire a 19.9% noncontrolling interest in OHTCo and IMTCo for $2.82 billion. Net proceeds will be used to help finance AEP’s $54 billion capital plan for 2025-2029, announced in November 2024, driven by transmission and distribution infrastructure upgrades and new generation to support anticipated load growth. The transaction is subject to FERC approval and clearance from the Committee on Foreign Investment in the United States. AEP expects to close on the transaction in the second half of 2025. If the transaction does not close, it could reduce expected future cash flows and impact financial condition.
ITEM 9. CHANGES IN AND DISAGREEMENTS WITH ACCOUNTANTS ON ACCOUNTING AND FINANCIAL DISCLOSURE
AEP, AEP Texas, AEPTCo, APCo, I&M, OPCo, PSO and SWEPCo
Information required by this item is set forth under the caption Proposal to Ratify the Appointment of the Independent Registered Public Accounting Firm in the 2025 Proxy Statement, which is incorporated by reference into this item.
ITEM 9A. CONTROLS AND PROCEDURES
Disclosure Controls and Procedures
During 2024, management, including the principal executive officer and principal financial officer of each of the Registrants evaluated each respective Registrant’s disclosure controls and procedures. Disclosure controls and procedures are defined as controls and other procedures of the Registrant that are designed to ensure that information required to be disclosed by the Registrants in the reports that they file or submit under the Exchange Act are recorded, processed, summarized and reported within the time periods specified in the Commission’s rules and forms. Disclosure controls and procedures include, without limitation, controls and procedures designed to ensure that information required to be disclosed by the Registrants in the reports that they file or submit under the Exchange Act is accumulated and communicated to each Registrant’s management, including the principal executive and principal financial officers, or persons performing similar functions, as appropriate to allow timely decisions regarding required disclosure.
As of December 31, 2024, the principal executive officer and financial officer of each of the Registrants concluded that the disclosure controls and procedures in place were effective at the reasonable assurance level. The Registrants continually strive to improve their disclosure controls and procedures to enhance the quality of their financial reporting and to maintain dynamic systems that change as events warrant.
Changes in Internal Control over Financial Reporting
There have been no changes in the Registrants’ internal control over financial reporting (as such term is defined in Rule 13a-15(f) and 15d-15(f) under the Exchange Act) during the fourth quarter 2024 that materially affected, or are reasonably likely to materially affect, the Registrants’ internal control over financial reporting.
Internal Control over Financial Reporting
See Management’s Report on Internal Control over Financial Reporting for each Registrant under Item 8. As discussed in that report, management assessed and reported on the effectiveness of each Registrant’s internal control over financial reporting as of December 31, 2024. As a result of that assessment, management concluded that each Registrant’s internal control over financial reporting was effective as of December 31, 2024.
ITEM 9B. OTHER INFORMATION
During the three months ended December 31, 2024, none of the Company’s directors or officers (as defined in Rule 16a-1(f) of the Securities Exchange Act of 1934) adopted, terminated or modified a Rule 10b5-1 trading arrangement or non-Rule 10b5-1 trading arrangement (as such terms are defined in Item 408 of Regulation S-K of the Securities Act of 1933).
ITEM 9C. DISCLOSURE REGARDING FOREIGN JURISDICTIONS THAT PREVENT INSPECTIONS
None.
PART III
ITEM 10. DIRECTORS, EXECUTIVE OFFICERS AND CORPORATE GOVERNANCE
AEP
Directors, Director Nomination Process and Audit Committee
Certain of the information called for in this Item 10, including the information relating to directors, is incorporated herein by reference to AEP’s definitive proxy statement (which will be filed with the SEC pursuant to Regulation 14A under the Exchange Act) relating to the 2025 Annual Meeting of Shareholders (the 2025 Annual Meeting) including under the captions “Election of Directors,” “AEP’s Board of Directors and Committees,” “Directors” and “Nominees for Directors.”
Executive Officers
Reference also is made under the caption “Information About our Executive Officers” in Part I, Item 1 of this report.
Code of Ethics
AEP’s Principles of Business Conduct is the code of ethics that applies to AEP’s Chief Executive Officer, Chief Financial Officer and principal accounting officer. The Principles of Business Conduct is available on AEP’s website at www.aep.com. The Principles of Business Conduct will be made available, without charge, in print to any shareholder who requests such document from Investor Relations, American Electric Power Company, Inc., 1 Riverside Plaza, Columbus, Ohio 43215.
If any substantive amendments to the Principles of Business Conduct are made or any waivers are granted, including any implicit waiver, from a provision of the Principles of Business Conduct, to its Chief Executive Officer, Chief Financial Officer or principal accounting officer, AEP will disclose the nature of such amendment or waiver on AEP’s website, www.aep.com, or in a report on Form 8-K.
Insider Trading Policies and Procedures
AEP has an insider trading policy governing the purchase, sale and other dispositions of the company’s debt and equity securities that applies to all company personnel, including directors, officers, employees, and other covered persons. The policy also applies to the company. The company believes that its insider trading policy is reasonably designed to promote compliance with insider trading laws, rules, and regulations, and NASDAQ listing standards applicable to the company. A copy of the company’s insider trading policy is filed as Exhibit 19.1 to this Form 10-K. The remaining information required by this Item will be included in the company’s definitive proxy statement which will be filed with the SEC pursuant to Regulation 14A under the Exchange Act, relating to the 2025 Annual Meeting under the caption “Corporate Governance” and is incorporated herein by reference.
Delinquent Section 16(a) Reports
None.
AEP Texas, AEPTCo, APCo, I&M, OPCo, PSO and SWEPCo
Omitted pursuant to Instruction I(2)(c).
ITEM 11. EXECUTIVE COMPENSATION
AEP
The information called for by this Item 11 is incorporated herein by reference to AEP’s definitive proxy statement (which will be filed with the SEC pursuant to Regulation 14A under the Exchange Act) relating to the 2025 Annual Meeting including under the captions “Compensation Discussion and Analysis,” “Executive Compensation”, “Director Compensation” and “2024 Director Compensation Table”. The information set forth under the subcaption “Human Resources Committee Report” and “Audit Committee Report” should not be deemed filed nor should it be incorporated by reference into any other filing under the Securities Act of 1933, as amended, or the Exchange Act except to the extent AEP specifically incorporates such report by reference therein.
AEP Texas, AEPTCo, APCo, I&M, OPCo, PSO and SWEPCo
Omitted pursuant to Instruction I(2)(c).
ITEM 12. SECURITY OWNERSHIP OF CERTAIN BENEFICIAL OWNERS AND MANAGEMENT AND RELATED STOCKHOLDER MATTERS
AEP
The information relating to Security Ownership of Certain Beneficial Owners is incorporated herein by reference to AEP’s definitive proxy statement (which will be filed with the SEC pursuant to Regulation 14A under the Exchange Act) relating to 2025 Annual Meeting under the caption “Share Ownership of Certain Beneficial Owners” and “Share Ownership of Directors and Executive Officers.”
EQUITY COMPENSATION PLAN INFORMATION
The following table summarizes the ability of AEP to issue common stock pursuant to equity compensation plans as of December 31, 2024:
| | | | | | | | | | | | | | | | | | | | |
| Plan Category | | Number of Securities to be Issued upon Exercise of Outstanding Options, Warrants and Rights (a) | | Weighted-Average Exercise Price of Outstanding Options, Warrants and Rights (b) | | Number of Securities Remaining
Available for Future Issuance under Equity Compensation Plans |
| Equity Compensation Plans Approved by Security Holders | | 2,190,348 | | | — | | | 9,806,016 | |
| Equity Compensation Plans Not Approved by Security Holders | | — | | | — | | | — | |
| Total | | 2,190,348 | | | — | | | 9,806,016 | |
(a)The balance includes unvested performance shares and restricted stock units as well as vested performance shares deferred as AEP career shares and stock units payable to outside directors after their service to the Company ends, all of which will be settled and paid in shares of AEP common stock. For performance shares, the total includes the target number of shares that could be granted if performance meets target objectives. The number of securities that would be granted, with respect to performance shares, if performance meets the maximum payout level, is two times the amount included in this total.
(b)No consideration is required from participants for the exercise or vesting of any outstanding AEP equity compensation awards.
AEP Texas, AEPTCo, APCo, I&M, OPCo, PSO and SWEPCo
Omitted pursuant to Instruction I(2)(c).
ITEM 13. CERTAIN RELATIONSHIPS AND RELATED TRANSACTIONS AND DIRECTOR INDEPENDENCE
AEP
The information called for by this Item 13 is incorporated herein by reference to AEP’s definitive proxy statement (which will be filed with the SEC pursuant to Regulation 14A under the Exchange Act) relating to the 2025 Annual Meeting under the captions “Transactions with Related Persons” and “Director Independence.”
AEP Texas, AEPTCo, APCo, I&M, OPCo, PSO and SWEPCo
Omitted pursuant to Instruction I(2)(c).
ITEM 14. PRINCIPAL ACCOUNTING FEES AND SERVICES
AEP
The information called for by this Item 14 is incorporated herein by reference to AEP’s definitive proxy statement (which will be filed with the SEC pursuant to Regulation 14A under the Exchange Act) relating to the 2025 Annual Meeting under the captions “Audit and Non-Audit Fees,” “Audit Committee Report” and “Policy on Audit Committee Pre-Approval of Audit and Permissible Non-Audit Services of the Independent Auditor.”
AEP Texas, AEPTCo, APCo, I&M, OPCo, PSO and SWEPCo
Each of the above is a wholly-owned subsidiary of AEP and does not have a separate audit committee. A description of the AEP Audit Committee pre-approval policies, which apply to these companies, is contained in the definitive proxy statement (which will be filed with the SEC pursuant to Regulation 14A under the Exchange Act) relating to the 2025 Annual Meeting under the captions “Audit and Non-Audit Fees,” “Audit Committee Report” and “Policy on Audit Committee Pre-Approval of the Audit and Permissible Non-Audit Services of the Independent Auditor.” The following table presents directly billed fees for professional services rendered by PricewaterhouseCoopers LLP for the audit of these companies’ annual financial statements for the years ended December 31, 2024 and 2023, and fees directly billed for other services rendered by PricewaterhouseCoopers LLP during those periods. PricewaterhouseCoopers LLP also provides additional professional and other services to AEP subsidiaries, the cost of which may ultimately be allocated to these companies though not billed directly to them. For a description of these fees and services, see the description of principal accounting fees and services for AEP above.
| | | | | | | | | | | | | | | | | | | | | | | | | | | | | | | | | | | |
| | AEP Texas | | AEPTCo | | APCo |
| | 2024 | | 2023 | | 2024 | | 2023 | | 2024 | | 2023 |
| Audit Fees | $ | 1,450,607 | | | $ | 1,465,285 | | | $ | 1,670,508 | | | $ | 1,633,905 | | | $ | 1,768,558 | | | $ | 1,702,568 | |
| Audit-Related Fees | 56,917 | | | 38,333 | | | — | | | — | | | 120,500 | | | 44,250 | |
| | | | | | | | | | | |
| | | | | | | | | | | |
| Total | $ | 1,507,524 | | | $ | 1,503,618 | | | $ | 1,670,508 | | | $ | 1,633,905 | | | $ | 1,889,058 | | | $ | 1,746,818 | |
| | | | | | | | | | | | | | | | | | | | | | | | | | | | | | | | | | | |
| | I&M | | OPCo | | PSO |
| | 2024 | | 2023 | | 2024 | | 2023 | | 2024 | | 2023 |
| Audit Fees | $ | 1,374,594 | | | $ | 1,459,950 | | | $ | 1,231,434 | | | $ | 1,191,662 | | | $ | 745,452 | | | $ | 770,975 | |
| Audit-Related Fees | 49,160 | | | 15,833 | | | 14,250 | | | 15,833 | | | 63,000 | | | 44,250 | |
| | | | | | | | | | | |
| | | | | | | | | | | |
| Total | $ | 1,423,754 | | | $ | 1,475,783 | | | $ | 1,245,684 | | | $ | 1,207,495 | | | $ | 808,452 | | | $ | 815,225 | |
| | | | | | | | | | | |
| | SWEPCo |
| | 2024 | | 2023 |
| Audit Fees | $ | 1,109,336 | | | $ | 1,123,641 | |
| Audit-Related Fees | 85,833 | | | 27,667 | |
| | | |
| | | |
| Total | $ | 1,195,169 | | | $ | 1,151,308 | |
PART IV
ITEM 15. EXHIBITS AND FINANCIAL STATEMENT SCHEDULES
The following documents are filed as a part of this report:
(a)(1) FINANCIAL STATEMENTS:
The following financial statements have been incorporated herein by reference pursuant to Item 8.
AEP and Subsidiary Companies:
Report of Independent Registered Public Accounting Firm; Management’s Report on Internal Control over Financial Reporting; Consolidated Statements of Income for the years ended December 31, 2024, 2023 and 2022; Consolidated Statements of Comprehensive Income (Loss) for the years ended December 31, 2024, 2023 and 2022; Consolidated Statements of Changes in Equity for the years ended December 31, 2024, 2023 and 2022; Consolidated Balance Sheets as of December 31, 2024 and 2023; Consolidated Statements of Cash Flows for the years ended December 31, 2024, 2023 and 2022; Notes to Financial Statements of Registrants.
AEP Texas, APCo and I&M:
Report of Independent Registered Public Accounting Firm; Management’s Report on Internal Control over Financial Reporting; Consolidated Statements of Income for the years ended December 31, 2024, 2023 and 2022; Consolidated Statements of Comprehensive Income (Loss) for the years ended December 31, 2024, 2023 and 2022; Consolidated Statements of Changes in Common Shareholder’s Equity for the years ended December 31, 2024, 2023 and 2022; Consolidated Balance Sheets as of December 31, 2024 and 2023; Consolidated Statements of Cash Flows for the years ended December 31, 2024, 2023 and 2022; Notes to Financial Statements of Registrants.
AEPTCo:
Report of Independent Registered Public Accounting Firm; Management’s Report on Internal Control over Financial Reporting; Consolidated Statements of Income for the years ended December 31, 2024, 2023 and 2022; Consolidated Statements of Changes in Member’s Equity for the years ended December 31, 2024, 2023 and 2022; Consolidated Balance Sheets as of December 31, 2024 and 2023; Consolidated Statements of Cash Flows for the years ended December 31, 2024, 2023 and 2022; Notes to Financial Statements of Registrants.
OPCo:
Report of Independent Registered Public Accounting Firm; Management’s Report on Internal Control over Financial Reporting; Consolidated Statements of Income for the years ended December 31, 2024, 2023 and 2022; Consolidated Statements of Changes in Common Shareholder’s Equity for the years ended December 31, 2024, 2023 and 2022; Consolidated Balance Sheets as of December 31, 2024 and 2023; Consolidated Statements of Cash Flows for the years ended December 31, 2024, 2023 and 2022; Notes to Financial Statements of Registrants.
PSO:
Report of Independent Registered Public Accounting Firm; Management’s Report on Internal Control over Financial Reporting; Statements of Income for the years ended December 31, 2024, 2023 and 2022; Statements of Comprehensive Income (Loss) for the years ended December 31, 2024, 2023 and 2022; Statements of Changes in Common Shareholder’s Equity for the years ended December 31, 2024, 2023 and 2022; Balance Sheets as of December 31, 2024 and 2023; Statements of Cash Flows for the years ended December 31, 2024, 2023 and 2022; Notes to Financial Statements of Registrants.
SWEPCo:
Report of Independent Registered Public Accounting Firm; Management’s Report on Internal Control over Financial Reporting; Consolidated Statements of Income for the years ended December 31, 2024, 2023 and 2022; Consolidated Statements of Comprehensive Income (Loss) for the years ended December 31, 2024, 2023 and 2022; Consolidated Statements of Changes in Equity for the years ended December 31, 2024, 2023 and 2022; Consolidated Balance Sheets as of December 31, 2024 and 2023; Consolidated Statements of Cash Flows for the years ended December 31, 2024, 2023 and 2022; Notes to Financial Statements of Registrants.
| | | | | | | | |
| (a)(2) FINANCIAL STATEMENT SCHEDULES: | | Page Number |
| Schedule I | | |
| Condensed Financial Information of American Electric Power Company, Inc. (Parent) | | |
Condensed Statements of Income and Comprehensive Income - Years Ended December 31, 2024, 2023 and 2022 | | |
| Condensed Balance Sheets - December 31, 2024 and 2023 | | |
| Condensed Statements of Cash Flows - Years Ended December 31, 2024, 2023 and 2022 | | |
| Condensed Notes to Condensed Financial Information | | |
| | |
| Schedule II | | |
| AEP | | |
Valuation and Qualifying Accounts and Reserves - Years Ended December 31, 2024, 2023 and 2022 | | |
| | |
| Schedule I | | |
| Condensed Financial Information of AEP Transmission Company, LLC (AEPTCo Parent) | | |
| Condensed Statements of Income - Years Ended December 31, 2024, 2023 and 2022 | | |
| Condensed Balance Sheets - December 31, 2024 and 2023 | | |
| Condensed Statements of Cash Flows - Years Ended December 31, 2024, 2023 and 2022 | | |
| Condensed Notes to Condensed Financial Information | | |
| | |
| Certain schedules have been omitted because the required information is contained in the notes to financial statements or because such schedules are not required or are not applicable. | | |
| | |
| (a)(3) EXHIBITS: | | |
| Exhibits for AEP, AEP Texas, AEPTCo, APCo, I&M, OPCo, PSO and SWEPCo are listed in the Exhibit Index beginning on page E-1 and are incorporated herein by reference. | | |
ITEM 16. FORM 10-K SUMMARY
None.
SIGNATURES
Pursuant to the requirements of Section 13 or 15(d) of the Securities Exchange Act of 1934, the registrant has duly caused this report to be signed on its behalf by the undersigned, thereunto duly authorized.
| | | | | | | | |
| | American Electric Power Company, Inc. |
| | | |
| | By: | /s/ Trevor I. Mihalik |
| | | (Trevor I. Mihalik, Executive Vice President |
| | | and Chief Financial Officer) |
Date: February 13, 2025
Pursuant to the requirements of the Securities Exchange Act of 1934, this report has been signed below by the following persons on behalf of the registrant and in the capacities and on the dates indicated.
| | | | | | | | | | | | | | | | | |
| Signature | | Title | | Date |
| | | | | | |
| (i) | Principal Executive Officer: | | | | |
| | | | | | |
| /s/ William J. Fehrman | | Chief Executive Officer and President | | February 13, 2025 |
| (William J. Fehrman) | | | |
| | | | | | |
| (ii) | Principal Financial Officer: | | | | |
| | | | | | |
| /s/ Trevor I. Mihalik | | Executive Vice President and Chief Financial Officer | | February 13, 2025 |
| (Trevor I. Mihalik) | | | |
| | | | | | |
| (iii) | Principal Accounting Officer: | | | | |
| | | | | | |
| /s/ Kate Sturgess | | Senior Vice President, Controller and Chief Accounting Officer | | February 13, 2025 |
| (Kate Sturgess) | | | |
| | | | | | |
| (iv) | A Majority of the Directors: | | | | |
| | | | | | |
| /s/ William J. Fehrman | | | | |
| *Benjamin G.S. Fowke, III | | | | |
| *Art A. Garcia | | | | |
| *Hunter C. Gary | | | | |
| *Donna A. James | | | | |
| *Sandra Beach Lin | | | | |
| *Henry P. Linginfelter | | | | |
| *Margaret M. McCarthy | | | | |
| *Daryl Roberts | | | | |
| *Daniel G. Stoddard | | | | |
| *Sara Martinez Tucker | | | | |
| *Lewis Von Thaer | | | | |
| | | | | | |
| *By: | /s/ Trevor I. Mihalik | | | | February 13, 2025 |
| | (Trevor I. Mihalik, Attorney-in-Fact) | | | | |
SIGNATURES
Pursuant to the requirements of Section 13 or 15(d) of the Securities Exchange Act of 1934, the registrant has duly caused this report to be signed on its behalf by the undersigned, thereunto duly authorized. The signature of the undersigned company shall be deemed to relate only to matters having reference to such company and any subsidiaries thereof.
| | | | | | | | |
| AEP Texas Inc. |
| | | |
| | By: | /s/ Trevor I. Mihalik |
| | | (Trevor I. Mihalik, Vice President and Chief Financial Officer) |
Date: February 13, 2025
Pursuant to the requirements of the Securities Exchange Act of 1934, this report has been signed below by the following persons on behalf of the registrant and in the capacities and on the dates indicated. The signature of each of the undersigned shall be deemed to relate only to matters having reference to the above-named company and any subsidiaries thereof.
| | | | | | | | | | | | | | | | | |
| Signature | | Title | | Date |
| | | | | | |
| (i) | Principal Executive Officer: | | | | |
| | | | | | |
| /s/ William J. Fehrman | | Chair of the Board, Chief Executive Officer and Director | | February 13, 2025 |
| (William J. Fehrman) | | | |
| | | | | | |
| (ii) | Principal Financial Officer: | | | | |
| | | | | | |
| /s/ Trevor I. Mihalik | | Vice President, Chief Financial Officer and Director | | February 13, 2025 |
| (Trevor I. Mihalik) | | | |
| | | | | | |
| (iii) | Principal Accounting Officer: | | | | |
| | | | | | |
| /s/ Kate Sturgess | | Controller and Chief Accounting Officer | | February 13, 2025 |
| (Kate Sturgess) | | | |
| | | | | | |
| (iv) | A Majority of the Directors: | | | | |
| | | | | | |
| *William J. Fehrman | | | | |
| *David M. Feinberg | | | | |
| *Judith E. Talavera | | | | |
| Trevor I. Mihalik | | | | |
| | | | | |
| *By: | /s/ Trevor I. Mihalik | | | | February 13, 2025 |
| (Trevor I. Mihalik, Attorney-in-Fact) | | | | |
SIGNATURES
Pursuant to the requirements of Section 13 or 15(d) of the Securities Exchange Act of 1934, the registrant has duly caused this report to be signed on its behalf by the undersigned, thereunto duly authorized. The signature of the undersigned company shall be deemed to relate only to matters having reference to such company and any subsidiaries thereof.
| | | | | | | | |
| | AEP Transmission Company, LLC |
| | | |
| | By: | /s/ Trevor I. Mihalik |
| | | (Trevor I. Mihalik, Vice President |
| | | and Chief Financial Officer) |
Date: February 13, 2025
Pursuant to the requirements of the Securities Exchange Act of 1934, this report has been signed below by the following persons on behalf of the registrant and in the capacities and on the dates indicated. The signature of each of the undersigned shall be deemed to relate only to matters having reference to the above-named company and any subsidiaries thereof.
| | | | | | | | | | | | | | | | | |
| Signature | | Title | | Date |
| | | | | | |
| (i) | Principal Executive Officer: | | | | |
| | | | | | |
| /s/ William J. Fehrman | | Chair of the Board, Chief Executive Officer and Manager | | February 13, 2025 |
| (William J. Fehrman) | | | |
| | | | | | |
| (ii) | Principal Financial Officer: | | | | |
| | | | | | |
| /s/ Trevor I. Mihalik | | Vice President, Chief Financial Officer and Manager | | February 13, 2025 |
| (Trevor I. Mihalik) | | | |
| | | | | | |
| (iii) | Principal Accounting Officer: | | | | |
| | | | | | |
| /s/ Kate Sturgess | | Controller and Chief Accounting Officer | | February 13, 2025 |
| (Kate Sturgess) | | | |
| | | | | | |
| (iv) | A Majority of the Managers: | | | | |
| | | | | | |
| *William J. Fehrman | | | | |
| *David M. Feinberg | | | | |
| Trevor I. Mihalik | | | | |
| | | | | |
| *By: | /s/ Trevor I. Mihalik | | | | February 13, 2025 |
| (Trevor I. Mihalik, Attorney-in-Fact) | | | | |
SIGNATURES
Pursuant to the requirements of Section 13 or 15(d) of the Securities Exchange Act of 1934, the registrant has duly caused this report to be signed on its behalf by the undersigned, thereunto duly authorized. The signature of the undersigned company shall be deemed to relate only to matters having reference to such company and any subsidiaries thereof.
| | | | | | | | |
| | Appalachian Power Company |
| | | |
| | By: | /s/ Trevor I. Mihalik |
| | | (Trevor I. Mihalik, Vice President and Chief Financial Officer) |
Date: February 13, 2025
Pursuant to the requirements of the Securities Exchange Act of 1934, this report has been signed below by the following persons on behalf of the registrant and in the capacities and on the dates indicated. The signature of each of the undersigned shall be deemed to relate only to matters having reference to the above-named company and any subsidiaries thereof.
| | | | | | | | | | | | | | | | | |
| Signature | | Title | | Date |
| | | | | | |
| (i) | Principal Executive Officer: | | | | |
| | | | | | |
| /s/ William J. Fehrman | | Chair of the Board, Chief Executive Officer and Director | | February 13, 2025 |
| (William J. Fehrman) | | | |
| | | | | | |
| (ii) | Principal Financial Officer: | | | | |
| | | | | | |
| /s/ Trevor I. Mihalik | | Vice President, Chief Financial Officer and Director | | February 13, 2025 |
| (Trevor I. Mihalik) | | | |
| | | | | | |
| (iii) | Principal Accounting Officer: | | | | |
| | | | | | |
| /s/ Kate Sturgess | | Controller and Chief Accounting Officer | | February 13, 2025 |
| (Kate Sturgess) | | | |
| | | | | | |
| (iv) | A Majority of the Directors: | | | | |
| | | | | | |
| *William J. Fehrman | | | | |
| *David M. Feinberg | | | | |
| *Aaron D. Walker | | | | |
| Trevor I. Mihalik | | | | |
| | | | | |
| *By: | /s/ Trevor I. Mihalik | | | | February 13, 2025 |
| (Trevor I. Mihalik, Attorney-in-Fact) | | | | |
SIGNATURES
Pursuant to the requirements of Section 13 or 15(d) of the Securities Exchange Act of 1934, the registrant has duly caused this report to be signed on its behalf by the undersigned, thereunto duly authorized. The signature of the undersigned company shall be deemed to relate only to matters having reference to such company and any subsidiaries thereof.
| | | | | | | | |
| | Indiana Michigan Power Company |
| | | |
| | By: | /s/ Trevor I. Mihalik |
| | | (Trevor I. Mihalik, Vice President, |
| | | and Chief Financial Officer) |
Date: February 13, 2025
Pursuant to the requirements of the Securities Exchange Act of 1934, this report has been signed below by the following persons on behalf of the registrant and in the capacities and on the dates indicated. The signature of each of the undersigned shall be deemed to relate only to matters having reference to the above-named company and any subsidiaries thereof.
| | | | | | | | | | | | | | | | | |
| Signature | | Title | | Date |
| | | | | | |
| (i) | Principal Executive Officer: | | | | |
| | | | | | |
| /s/ William J. Fehrman | | Chair of the Board, Chief Executive Officer and Director | | February 13, 2025 |
| (William J. Fehrman) | | | |
| | | | | | |
| (ii) | Principal Financial Officer: | | | | |
| | | | | | |
| /s/ Trevor I. Mihalik | | Vice President, Chief Financial Officer and Director | | February 13, 2025 |
| (Trevor I. Mihalik) | | | |
| | | | | | |
| (iii) | Principal Accounting Officer: | | | | |
| | | | | | |
| /s/ Kate Sturgess | | Controller and Chief Accounting Officer | | February 13, 2025 |
| (Kate Sturgess) | | | |
| | | | | | |
| (iv) | A Majority of the Directors: | | | | |
| | | | | | |
| *Steven F. Baker | | | | |
| *Katherine K. Davis | | | | |
| *William J. Fehrman | | | | |
| *David M. Feinberg | | | | |
| *Scott A. Huebner | | | | |
| *Stephanny L. Smith | | | | |
| *Andrew J. Williamson | | | | |
| Trevor I. Mihalik | | | | |
| | | | | |
| *By: | /s/ Trevor I. Mihalik | | | | February 13, 2025 |
| (Trevor I. Mihalik, Attorney-in-Fact) | | | | |
SIGNATURES
Pursuant to the requirements of Section 13 or 15(d) of the Securities Exchange Act of 1934, the registrant has duly caused this report to be signed on its behalf by the undersigned, thereunto duly authorized. The signature of the undersigned company shall be deemed to relate only to matters having reference to such company and any subsidiaries thereof.
| | | | | | | | |
| | Ohio Power Company |
| | | |
| | By: | /s/ Trevor I. Mihalik |
| | | (Trevor I. Mihalik, Vice President and Chief Financial Officer) |
Date: February 13, 2025
Pursuant to the requirements of the Securities Exchange Act of 1934, this report has been signed below by the following persons on behalf of the registrant and in the capacities and on the dates indicated. The signature of each of the undersigned shall be deemed to relate only to matters having reference to the above-named company and any subsidiaries thereof.
| | | | | | | | | | | | | | | | | |
| Signature | | Title | | Date |
| | | | | | |
| (i) | Principal Executive Officer: | | | | |
| | | | | | |
| /s/ William J. Fehrman | | Chair of the Board, Chief Executive Officer and Director | | February 13, 2025 |
| (William J. Fehrman) | | | |
| | | | | | |
| (ii) | Principal Financial Officer: | | | | |
| | | | | | |
| /s/ Trevor Mihalik | | Vice President, Chief Financial Officer and Director | | February 13, 2025 |
| (Trevor I. Mihalik) | | | |
| | | | | | |
| (iii) | Principal Accounting Officer: | | | | |
| | | | | | |
| /s/ Kate Sturgess | | Controller and Chief Accounting Officer | | February 13, 2025 |
| (Kate Sturgess) | | | |
| | | | | | |
| (iv) | A Majority of the Directors: | | | | |
| | | | | | |
| *William J. Fehrman | | | | |
| *David M. Feinberg | | | | |
| *Marc D. Reitter | | | | |
| Trevor I. Mihalik | | | | |
| | | | | |
| *By: | /s/ Trevor I. Mihalik | | | | February 13, 2025 |
| (Trevor I. Mihalik, Attorney-in-Fact) | | | | |
SIGNATURES
Pursuant to the requirements of Section 13 or 15(d) of the Securities Exchange Act of 1934, the registrant has duly caused this report to be signed on its behalf by the undersigned, thereunto duly authorized. The signature of the undersigned company shall be deemed to relate only to matters having reference to such company and any subsidiaries thereof.
| | | | | | | | |
| | Public Service Company of Oklahoma |
| | | |
| | By: | /s/ Trevor I. Mihalik |
| | | (Trevor I. Mihalik, Vice President and Chief Financial Officer) |
Date: February 13, 2025
Pursuant to the requirements of the Securities Exchange Act of 1934, this report has been signed below by the following persons on behalf of the registrant and in the capacities and on the dates indicated. The signature of each of the undersigned shall be deemed to relate only to matters having reference to the above-named company and any subsidiaries thereof.
| | | | | | | | | | | | | | | | | |
| Signature | | Title | | Date |
| | | | | | |
| (i) | Principal Executive Officer: | | | | |
| | | | | | |
| /s/ William J. Fehrman | | Chair of the Board, Chief Executive Officer and Director | | February 13, 2025 |
| (William J. Fehrman) | | | |
| | | | | | |
| (ii) | Principal Financial Officer: | | | | |
| | | | | | |
| /s/ Trevor I. Mihalik | | Vice President, Chief Financial Officer and Director | | February 13, 2025 |
| (Trevor I. Mihalik) | | | |
| | | | | | |
| (iii) | Principal Accounting Officer: | | | | |
| | | | | | |
| /s/ Kate Sturgess | | Controller and Chief Accounting Officer | | February 13, 2025 |
| (Kate Sturgess) | | | |
| | | | | | |
| (iv) | A Majority of the Directors: | | | | |
| | | | | | |
| *William J. Fehrman | | | | |
| *David M. Feinberg | | | | |
| *Leigh Anne Strahler | | | | |
| Trevor I. Mihalik | | | | |
| | | | | |
| *By: | /s/ Trevor I. Mihalik | | | | February 13, 2025 |
| (Trevor I. Mihalik, Attorney-in-Fact) | | | | |
SIGNATURES
Pursuant to the requirements of Section 13 or 15(d) of the Securities Exchange Act of 1934, the registrant has duly caused this report to be signed on its behalf by the undersigned, thereunto duly authorized. The signature of the undersigned company shall be deemed to relate only to matters having reference to such company and any subsidiaries thereof.
| | | | | | | | |
| | Southwestern Electric Power Company |
| | | |
| | By: | /s/ Trevor I. Mihalik |
| | | (Trevor I. Mihalik, Vice President and Chief Financial Officer) |
Date: February 13, 2025
Pursuant to the requirements of the Securities Exchange Act of 1934, this report has been signed below by the following persons on behalf of the registrant and in the capacities and on the dates indicated. The signature of each of the undersigned shall be deemed to relate only to matters having reference to the above-named company and any subsidiaries thereof.
| | | | | | | | | | | | | | | | | |
| Signature | | Title | | Date |
| | | | | | |
| (i) | Principal Executive Officer: | | | | |
| | | | | | |
| /s/ William J. Fehrman | | Chair of the Board, Chief Executive Officer and Director | | February 13, 2025 |
| (William J. Fehrman) | | | |
| | | | | | |
| (ii) | Principal Financial Officer: | | | | |
| | | | | | |
| /s/ Trevor I. Mihalik | | Vice President, Chief Financial Officer and Director | | February 13, 2025 |
| (Trevor I. Mihalik) | | | |
| | | | | | |
| (iii) | Principal Accounting Officer: | | | | |
| | | | | | |
| /s/ Kate Sturgess | | Controller and Chief Accounting Officer | | February 13, 2025 |
| (Kate Sturgess) | | | |
| | | | | | |
| (iv) | A Majority of the Directors: | | | | |
| | | | | | |
| *William J. Fehrman | | | | |
| *David M. Feinberg | | | | |
| *D. Brett Mattison | | | | |
| Trevor I. Mihalik | | | | |
| | | | | |
| *By: | /s/ Trevor I. Mihalik | | | | February 13, 2025 |
| (Trevor I. Mihalik, Attorney-in-Fact) | | | | |
INDEX OF FINANCIAL STATEMENT SCHEDULES
| | | | | |
| Page
Number |
| The following financial statement schedules are included in this report on the pages indicated: | |
| | |
| American Electric Power Company, Inc. (Parent): | |
| Schedule I – Condensed Financial Information | |
| |
| | |
| American Electric Power Company, Inc. and Subsidiary Companies: | |
| |
SCHEDULE I
AMERICAN ELECTRIC POWER COMPANY, INC. (Parent)
CONDENSED FINANCIAL INFORMATION
CONDENSED STATEMENTS OF INCOME AND COMPREHENSIVE INCOME
For the Years Ended December 31, 2024, 2023 and 2022
(in millions, except per-share and share amounts)
| | | | | | | | | | | | | | | | | | | | |
| | | Years Ended December 31, |
| | | 2024 | | 2023 | | 2022 |
| REVENUES | | | | | | |
| | | | | | |
| | | | | | |
| Revenues | | $ | 5.5 | | | $ | 5.1 | | | $ | 5.1 | |
| | | | | | |
| TOTAL REVENUES | | 5.5 | | | 5.1 | | | 5.1 | |
| | | | | | |
| EXPENSES | | | | | | |
| Other Operation | | 66.0 | | | 16.7 | | | 84.9 | |
| | | | | | |
| Loss on the Expected Sale of the Kentucky Operations | | — | | | — | | | 363.3 | |
| Depreciation and Amortization | | 0.6 | | | 0.5 | | | 0.4 | |
| Amortization of KPCo Basis Difference | | (21.4) | | | (16.5) | | | — | |
| | | | | | |
| TOTAL EXPENSES | | 45.2 | | | 0.7 | | | 448.6 | |
| | | | | | |
| OPERATING INCOME (LOSS) | | (39.7) | | | 4.4 | | | (443.5) | |
| | | | | | |
| Other Income (Expense): | | | | | | |
| | | | | | |
| Interest Income | | 107.9 | | | 181.0 | | | 80.3 | |
| Interest Expense | | (531.8) | | | (526.3) | | | (275.5) | |
| | | | | | |
| LOSS BEFORE INCOME TAX BENEFIT AND EQUITY EARNINGS | | (463.6) | | | (340.9) | | | (638.7) | |
| | | | | | |
| Income Tax Benefit | | (150.5) | | | (80.8) | | | (136.3) | |
| Equity Earnings of Unconsolidated Subsidiaries | | 3,280.2 | | | 2,468.2 | | | 2,809.6 | |
| | | | | | |
| | | | | | |
| | | | | | |
| | | | | | |
| | | | | | |
| NET INCOME | | 2,967.1 | | | 2,208.1 | | | 2,307.2 | |
| | | | | | |
| Other Comprehensive Income (Loss) | | 52.4 | | | (139.2) | | | (101.1) | |
| | | | | | |
| TOTAL COMPREHENSIVE INCOME | | $ | 3,019.5 | | | $ | 2,068.9 | | | $ | 2,206.1 | |
| | | | | | |
| WEIGHTED AVERAGE NUMBER OF BASIC AEP COMMON SHARES OUTSTANDING | | 530,092,672 | | | 518,903,682 | | | 511,841,946 | |
| | | | | | |
| | | | | | |
| | | | | | |
| TOTAL BASIC EARNINGS PER SHARE ATTRIBUTABLE TO AEP COMMON SHAREHOLDERS | | $ | 5.60 | | | $ | 4.26 | | | $ | 4.51 | |
| | | | | | |
| WEIGHTED AVERAGE NUMBER OF DILUTED AEP COMMON SHARES OUTSTANDING | | 531,337,703 | | | 520,206,258 | | | 513,484,609 | |
| | | | | | |
| | | | | | |
| | | | | | |
| TOTAL DILUTED EARNINGS PER SHARE ATTRIBUTABLE TO AEP COMMON SHAREHOLDERS | | $ | 5.58 | | | $ | 4.24 | | | $ | 4.49 | |
| | | | | | |
See Condensed Notes to Condensed Financial Information beginning on page S-6. |
SCHEDULE I
AMERICAN ELECTRIC POWER COMPANY, INC. (Parent)
CONDENSED FINANCIAL INFORMATION
CONDENSED BALANCE SHEETS
ASSETS
December 31, 2024 and 2023
(in millions)
| | | | | | | | | | | | | | |
| | | December 31, |
| | | 2024 | | 2023 |
| CURRENT ASSETS | | | | |
| Cash and Cash Equivalents | | $ | 87.5 | | | $ | 197.8 | |
| Other Temporary Investments | | 2.9 | | | 2.6 | |
| Advances to Affiliates | | 1,944.6 | | | 2,004.5 | |
| Accounts Receivable: | | | | |
| Affiliated Companies | | 32.5 | | | 47.7 | |
| General | | — | | | 2.7 | |
| | | | |
| Total Accounts Receivable | | 32.5 | | | 50.4 | |
| | | | |
| Accrued Tax Benefits | | 93.7 | | | 77.7 | |
| | | | |
| Prepayments and Other Current Assets | | 11.6 | | | 11.6 | |
| TOTAL CURRENT ASSETS | | 2,172.8 | | | 2,344.6 | |
| | | | |
| PROPERTY, PLANT AND EQUIPMENT | | | | |
| General | | 3.2 | | | 3.1 | |
| | | | |
| Total Property, Plant and Equipment | | 3.2 | | | 3.1 | |
| Accumulated Depreciation, Depletion and Amortization | | 1.7 | | | 1.4 | |
| TOTAL PROPERTY, PLANT AND EQUIPMENT – NET | | 1.5 | | | 1.7 | |
| | | | |
| OTHER NONCURRENT ASSETS | | | | |
| Investments in Unconsolidated Subsidiaries | | 35,306.2 | | | 33,598.6 | |
| | | | |
| Affiliated Notes Receivable | | 105.0 | | | 295.0 | |
| Deferred Charges and Other Noncurrent Assets | | 184.6 | | | 137.0 | |
| TOTAL OTHER NONCURRENT ASSETS | | 35,595.8 | | | 34,030.6 | |
| | | | |
| TOTAL ASSETS | | $ | 37,770.1 | | | $ | 36,376.9 | |
| | | | |
See Condensed Notes to Condensed Financial Information beginning on page S-6. |
SCHEDULE I
AMERICAN ELECTRIC POWER COMPANY, INC. (Parent)
CONDENSED FINANCIAL INFORMATION
CONDENSED BALANCE SHEETS
LIABILITIES AND EQUITY
December 31, 2024 and 2023
(dollars in millions)
| | | | | | | | | | | | | | | | | | | | | | | | | | |
| | December 31, |
| | | 2024 | | 2023 |
| CURRENT LIABILITIES | | | | |
| Advances from Affiliates | | $ | 506.6 | | | $ | 728.3 | |
| Accounts Payable: | | | | |
| General | | 4.7 | | | 11.1 | |
| Affiliated Companies | | 2.2 | | | 12.3 | |
| Short-term Debt | | 1,618.3 | | | 1,937.9 | |
| Long-term Debt Due Within One Year – Nonaffiliated | | 1,281.5 | | | 1,104.0 | |
| | | | |
| Other Current Liabilities | | 202.4 | | | 137.7 | |
| TOTAL CURRENT LIABILITIES | | 3,615.7 | | | 3,931.3 | |
| | | | |
| NONCURRENT LIABILITIES | | | | |
| Long-term Debt – Nonaffiliated | | 7,124.3 | | | 7,086.9 | |
| Deferred Credits and Other Noncurrent Liabilities | | 48.5 | | | 69.5 | |
| TOTAL NONCURRENT LIABILITIES | | 7,172.8 | | | 7,156.4 | |
| | | | |
| TOTAL LIABILITIES | | 10,788.5 | | | 11,087.7 | |
| | | | |
| MEZZANINE EQUITY | | | | |
| Contingently Redeemable Performance Share Awards | | 37.8 | | | 42.5 | |
| | | | |
| COMMON SHAREHOLDERS’ EQUITY | | | | |
| Common Stock – Par Value – $6.50 Per Share: | | | | |
| | 2024 | | 2023 | | | | | |
| Shares Authorized | 600,000,000 | | 600,000,000 | | | | | |
| Shares Issued | 534,094,530 | | 527,369,157 | | | | | |
| (1,186,815 and 1,184,572 Shares were Held in Treasury as of December 31, 2024 and 2023, Respectively) | | 3,471.6 | | | 3,427.9 | |
| Paid-in Capital | | 9,606.1 | | | 9,073.9 | |
| Retained Earnings | | 13,869.2 | | | 12,800.4 | |
| Accumulated Other Comprehensive Income (Loss) | | (3.1) | | | (55.5) | |
| TOTAL AEP COMMON SHAREHOLDERS’ EQUITY | | 26,943.8 | | | 25,246.7 | |
| | | | |
| TOTAL LIABILITIES, MEZZANINE EQUITY AND TOTAL EQUITY | | $ | 37,770.1 | | | $ | 36,376.9 | |
| | | | | |
See Condensed Notes to Condensed Financial Information beginning on page S-6. |
SCHEDULE I
AMERICAN ELECTRIC POWER COMPANY, INC. (Parent)
CONDENSED FINANCIAL INFORMATION
CONDENSED STATEMENTS OF CASH FLOWS
For the Years Ended December 31, 2024, 2023 and 2022
(in millions)
| | | | | | | | | | | | | | | | | | | | |
| | | Years Ended December 31, |
| | | 2024 | | 2023 | | 2022 |
| OPERATING ACTIVITIES | | | | | | |
| Net Income | | $ | 2,967.1 | | | $ | 2,208.1 | | | $ | 2,307.2 | |
| | | | | | |
| | | | | | |
| Adjustments to Reconcile Net Income to Net Cash Flows from Operating Activities: | | | | | | |
| Depreciation and Amortization | | 0.6 | | | 0.5 | | | 0.4 | |
| Amortization of KPCo Basis Difference | | (21.4) | | | (16.5) | | | — | |
| Deferred Income Taxes | | (53.3) | | | 59.7 | | | (63.3) | |
| Loss on the Expected Sale of the Kentucky Operations | | — | | | — | | | 363.3 | |
| | | | | | |
| Equity Earnings of Unconsolidated Subsidiaries | | (3,280.2) | | | (2,468.2) | | | (2,809.6) | |
| Cash Dividends Received from Unconsolidated Subsidiaries | | 1,143.4 | | | 686.3 | | | 603.9 | |
| Change in Other Noncurrent Assets | | 4.9 | | | (28.4) | | | (5.0) | |
| Change in Other Noncurrent Liabilities | | 70.8 | | | 92.3 | | | 83.5 | |
| Changes in Certain Components of Working Capital: | | | | | | |
| Accounts Receivable, Net | | 17.9 | | | 28.7 | | | (61.0) | |
| Accounts Payable | | (16.5) | | | (15.9) | | | 1.1 | |
| | | | | | |
| | | | | | |
| Other Current Assets | | — | | | (3.6) | | | (6.0) | |
| Other Current Liabilities | | 55.3 | | | (14.5) | | | (76.6) | |
| Net Cash Flows from Operating Activities | | 888.6 | | | 528.5 | | | 337.9 | |
| | | | | | |
| INVESTING ACTIVITIES | | | | | | |
| | | | | | |
| | | | | | |
| Construction Expenditures | | (0.6) | | | (0.8) | | | (0.7) | |
| | | | | | |
| Change in Advances to Affiliates, Net | | 59.9 | | | 2,007.6 | | | (1,411.3) | |
| Capital Contributions to Unconsolidated Subsidiaries | | (399.9) | | | (789.9) | | | (568.3) | |
| Return of Capital Contributions from Unconsolidated Subsidiaries | | 898.9 | | | 56.6 | | | 24.5 | |
| Issuance of Notes Receivable to Unconsolidated Subsidiaries | | — | | | (210.0) | | | (20.0) | |
| Repayment of Notes Receivable from Unconsolidated Subsidiaries | | 190.0 | | | — | | | — | |
| Other Investing Activities | | — | | | — | | | (0.2) | |
| Net Cash Flows from (Used for) Investing Activities | | 748.3 | | | 1,063.5 | | | (1,976.0) | |
| | | | | | |
| FINANCING ACTIVITIES | | | | | | |
| Issuance of Common Stock, Net | | 552.1 | | | 999.6 | | | 826.5 | |
| Issuance of Long-term Debt | | 1,285.4 | | | 1,829.8 | | | 986.6 | |
| Issuance of Short-term Debt with Original Maturities Greater Than 90 Days | | 723.8 | | | 1,069.9 | | | 833.9 | |
| Change in Short-term Debt with Original Maturities Less Than 90 Day, Net | | (172.3) | | | (1,365.4) | | | 1,650.4 | |
| Retirement of Long-term Debt | | (1,104.0) | | | (1,050.0) | | | (300.0) | |
| Change in Advances from Affiliates, Net | | (221.7) | | | (191.6) | | | 336.9 | |
| Redemption of Short-term Debt with Original Maturities Greater Than 90 Days | | (871.1) | | | (1,128.8) | | | (986.1) | |
| | | | | | |
| Dividends Paid on Common Stock | | (1,898.3) | | | (1,752.3) | | | (1,628.7) | |
| Other Financing Activities | | (41.1) | | | (59.6) | | | (74.5) | |
| Net Cash Flows from (Used for) Financing Activities | | (1,747.2) | | | (1,648.4) | | | 1,645.0 | |
| | | | | | |
| | | | | | |
| | | | | | |
| | | | | | |
| | | | | | |
| Net Increase (Decrease) in Cash and Cash Equivalents | | (110.3) | | | (56.4) | | | 6.9 | |
| Cash and Cash Equivalents at Beginning of Period | | 197.8 | | | 254.2 | | | 247.3 | |
| Cash and Cash Equivalents at End of Period | | $ | 87.5 | | | $ | 197.8 | | | $ | 254.2 | |
| | | | | | |
See Condensed Notes to Condensed Financial Information beginning on page S-6. |
1. SUMMARY OF SIGNIFICANT ACCOUNTING POLICIES
Basis of Presentation
The condensed financial information of Parent is required as a result of the restricted net assets of AEP consolidated subsidiaries exceeding 25% of AEP consolidated net assets as of December 31, 2024. Parent is a public utility holding company that owns all of the outstanding common stock of its public utility subsidiaries and varying percentages of other subsidiaries, including joint ventures and equity investments. The primary source of income for Parent is equity in its subsidiaries’ earnings. Its major source of cash is dividends from the subsidiaries, which are evaluated for cash flow presentation based on the nature of the distribution. Parent borrows the funds for the money pool that is used by the subsidiaries for their short-term cash needs. Parent financial statements should be read in conjunction with the AEP consolidated financial statements and the accompanying notes thereto. For purposes of these condensed financial statements, AEP wholly-owned and majority-owned subsidiaries are recorded based upon its proportionate share of the subsidiaries’ net assets (similar to presenting them on the equity method).
Income Taxes
Parent files a consolidated federal income tax return with its subsidiaries. The benefit of current tax loss of the parent company (Parent Company Loss Benefit) to the AEP System subsidiaries is accounted for as an allocation through equity. The consolidated NOL of the AEP System is allocated to each company in the consolidated group with taxable loss. With the exception of the allocation of the consolidated AEP System NOL, Parent Company Loss Benefit and general business tax credits, the method of allocation reflects a separate return result for each company in the consolidated group.
2. COMMITMENTS, GUARANTEES AND CONTINGENCIES
Parent and its subsidiaries are parties to environmental and other legal matters. For further discussion, see Note 6 - Commitments, Guarantees and Contingencies.
3. FINANCING ACTIVITIES
The following details long-term debt outstanding as of December 31, 2024 and 2023:
Long-term Debt
| | | | | | | | | | | | | | | | | | | | | | | | | | | | | | | | | | | | | | |
| | | | | Weighted-Average | | Interest Rate Ranges as of | | Outstanding as of |
| | | | Interest Rate as of | | December 31, | | December 31, |
| Type of Debt | | Maturity | | December 31, 2024 | | 2024 | | 2023 | | 2024 | | 2023 |
| | | | | | | | | | | (in millions) |
| Senior Unsecured Notes | | 2025-2050 | | 4.29% | | 1.00%-5.95% | | 1.00%-5.95% | | $ | 5,290.0 | | | $ | 5,265.0 | |
| Pollution Control Bonds | | 2026-2029 (a) | | 3.12% | | 2.40%-3.75% | | 1.90%-2.60% | | 536.8 | | | 537.8 | |
| Junior Subordinated Notes | | 2025-2027 | | 5.67% | | 3.88%-7.05% | | 2.03%-5.70% | | 2,579.0 | | | 2,388.1 | |
| Total Long-term Debt Outstanding | | | | | | | | | | 8,405.8 | | | 8,190.9 | |
| Long-term Debt Due Within One Year | | | | | | | | | | 1,281.5 | | | 1,104.0 | |
| Long-term Debt | | | | | | | | | | $ | 7,124.3 | | | $ | 7,086.9 | |
(a)Certain Pollution Control Bonds are subject to redemption earlier than the maturity date.
Long-term debt outstanding as of December 31, 2024 is payable as follows:
| | | | | | | | | | | | | | | | | | | | | | | | | | | | | | | | | | | | | | | | | |
| 2025 | | 2026 | | 2027 | | 2028 | | 2029 | | After 2029 | | Total |
| | (in millions) |
| Principal Amount (a) | $ | 1,281.5 | | | $ | 50.0 | | | $ | 1,758.3 | | | $ | 930.4 | | | $ | 1,694.5 | | | $ | 2,750.0 | | | $ | 8,464.7 | |
| Unamortized Discount, Net and Debt Issuance Costs | | | | | | | | | | | | | (58.9) | |
| Total Long-term Debt Outstanding | | | | | | | | | | | | | $ | 8,405.8 | |
(a)Amounts reflect the impact of fair value hedge accounting. See “Accounting for Fair Value Hedging Strategies” section of Note 10 included in the 2024 Annual Report for additional information.
Short-term Debt
Parent’s outstanding short-term debt was as follows:
| | | | | | | | | | | | | | | | | | | | | | | | | | |
| | | December 31, 2024 | | December 31, 2023 |
| Type of Debt | | Outstanding
Amount | | Weighted-Average
Interest Rate | | Outstanding
Amount | | Weighted-Average
Interest Rate |
| | | (in millions) | | | | (in millions) | | |
| Commercial Paper | | $ | 1,618.3 | | | 4.70 | % | | $ | 1,937.9 | | | 5.69 | % |
| | | | | | | | |
| | | | | | | | |
| | | | | | | | |
| | | | | | | | |
| Total Short-term Debt | | $ | 1,618.3 | | | | | $ | 1,937.9 | | | |
4. RELATED PARTY TRANSACTIONS
Payments on Behalf of Subsidiaries
Due to occasional time sensitivity and complexity of payments, Parent makes certain insurance, tax and benefit payments on behalf of subsidiary companies. Parent is then fully reimbursed by the subsidiary companies.
Short-term Lending to Subsidiaries
Parent uses a commercial paper program to meet the short-term borrowing needs of subsidiaries. The program is used to fund both a Utility Money Pool, which funds the utility subsidiaries, and a Nonutility Money Pool, which funds certain nonutility subsidiaries. In addition, the program also funds, as direct borrowers, the short-term debt requirements of other subsidiaries that are not participants in either money pool for regulatory or operational reasons. The program also allows some direct borrowers to invest excess cash with Parent.
Interest expense related to Parent’s short-term borrowing is included in Interest Expense on Parent’s statements of income. Parent incurred interest expense for amounts borrowed from subsidiaries of $28 million, $33 million and $30 million for the years ended December 31, 2024, 2023 and 2022, respectively.
Interest income related to Parent’s short-term lending is included in Interest Income on Parent’s statements of income. Parent earned interest income for amounts advanced to subsidiaries of $84 million, $164 million and $71 million for the years ended December 31, 2024, 2023 and 2022, respectively.
Affiliated Notes
Parent issued long-term debt, portions of which were loaned to its subsidiaries. Parent pays interest on the affiliated notes, but the subsidiaries accrue interest for their share of the affiliated borrowing and remit the interest to Parent. Interest income related to Parent’s loans to subsidiaries is included in Interest Income on Parent’s statements of income. Parent earned interest income on loans to subsidiaries of $7 million, $6 million and $3 million for the years ended December 31, 2024, 2023 and 2022, respectively.
SCHEDULE II – VALUATION AND QUALIFYING ACCOUNTS AND RESERVES
| | | | | | | | | | | | | | | | | | | | | | | | | | | | | | | | |
| AEP | | | | Additions | | | | |
| Description | | Balance at
Beginning
of Period | | Charged to
Costs and
Expenses | | Charged to Other
Accounts (a) | | Deductions (b) | | Balance at
End of
Period |
| | | (in millions) |
| Deducted from Assets: | | | | | | | | | | |
| Allowance for Credit Losses: | | | | | | | | | | |
| Year Ended December 31, 2024 | | $ | 60.1 | | | $ | 45.3 | | | $ | 2.9 | | | $ | 47.5 | | | $ | 60.8 | |
| Year Ended December 31, 2023 | | 57.1 | | | 15.0 | | | — | | | 12.0 | | | 60.1 | |
| Year Ended December 31, 2022 | | 55.4 | | | 41.2 | | | 0.8 | | | 40.3 | | | 57.1 | |
(a)Recoveries offset by reclasses to other assets and liabilities.
(b)Uncollectible accounts written off.
Schedule II for the Registrant Subsidiaries is not presented because the amounts are not material.
INDEX OF AEP TRANSMISSION COMPANY, LLC (AEPTCO PARENT)
FINANCIAL STATEMENT SCHEDULES
| | | | | |
| Page
Number |
| The following financial statement schedules are included in this report on the pages indicated: | |
| | |
| AEP Transmission Company, LLC (AEPTCo Parent): | |
| Schedule I – Condensed Financial Information | |
| |
SCHEDULE I
AEP TRANSMISSION COMPANY, LLC (AEPTCo Parent)
CONDENSED FINANCIAL INFORMATION
CONDENSED STATEMENTS OF INCOME
For the Years Ended December 31, 2024, 2023 and 2022
(in millions)
| | | | | | | | | | | | | | | | | | | | |
| | | Years Ended December 31, |
| | | 2024 | | 2023 | | 2022 |
| EXPENSES | | | | | | |
| Other Operation | | $ | 1.7 | | | $ | 0.2 | | | $ | 0.7 | |
| | | | | | |
| TOTAL EXPENSES | | 1.7 | | | 0.2 | | | 0.7 | |
| | | | | | |
| OPERATING LOSS | | (1.7) | | | (0.2) | | | (0.7) | |
| | | | | | |
| Other Income (Expense): | | | | | | |
| | | | | | |
| Interest Income - Affiliated | | 241.1 | | | 218.0 | | | 177.8 | |
| Interest Expense | | (238.7) | | | (215.1) | | | (177.1) | |
| | | | | | |
| INCOME BEFORE INCOME TAX EXPENSE AND EQUITY EARNINGS OF UNCONSOLIDATED SUBSIDIARIES | | 0.7 | | | 2.7 | | | — | |
| | | | | | |
| Income Tax Expense | | 0.1 | | | 1.4 | | | — | |
| Equity Earnings of Unconsolidated Subsidiaries | | 687.8 | | | 612.9 | | | 594.2 | |
| | | | | | |
| NET INCOME | | $ | 688.4 | | | $ | 614.2 | | | $ | 594.2 | |
| | | | | | |
See Condensed Notes to Condensed Financial Information beginning on page S-15. |
SCHEDULE I
AEP TRANSMISSION COMPANY, LLC (AEPTCo Parent)
CONDENSED FINANCIAL INFORMATION
CONDENSED BALANCE SHEETS
ASSETS
December 31, 2024 and 2023
(in millions)
| | | | | | | | | | | | | | |
| | | December 31, |
| | | 2024 | | 2023 |
| CURRENT ASSETS | | | | |
| | | | |
| | | | |
| Advances to Affiliates | | $ | 20.4 | | | $ | — | |
| Accounts Receivable: | | | | |
| General | | — | | | 28.1 | |
| Affiliated Companies | | 61.7 | | | 44.0 | |
| | | | |
| Total Accounts Receivable | | 61.7 | | | 72.1 | |
| | | | |
| | | | |
| Notes Receivable - Affiliated | | 90.0 | | | 95.0 | |
| | | | |
| | | | |
| TOTAL CURRENT ASSETS | | 172.1 | | | 167.1 | |
| | | | |
| | | | |
| | | | |
| | | | |
| | | | |
| | | | |
| | | | |
| | | | |
| | | | |
| OTHER NONCURRENT ASSETS | | | | |
| Notes Receivable - Affiliated | | 8,498.1 | | | 5,319.4 | |
| | | | |
| Investments in Unconsolidated Subsidiaries | | 4,272.8 | | | 6,476.2 | |
| Deferred Charges and Other Noncurrent Assets | | 0.3 | | | — | |
| TOTAL OTHER NONCURRENT ASSETS | | 12,771.2 | | | 11,795.6 | |
| | | | |
| TOTAL ASSETS | | $ | 12,943.3 | | | $ | 11,962.7 | |
| | | | |
See Condensed Notes to Condensed Financial Information beginning on page S-15. |
SCHEDULE I
AEP TRANSMISSION COMPANY, LLC (AEPTCo Parent)
CONDENSED FINANCIAL INFORMATION
CONDENSED BALANCE SHEETS
LIABILITIES AND EQUITY
December 31, 2024 and 2023
(in millions)
| | | | | | | | | | | | | | | | | | | | | | | | | | |
| | December 31, |
| | | 2024 | | 2023 |
| CURRENT LIABILITIES | | | | |
| Advances from Affiliates | | $ | — | | | $ | 42.7 | |
| Accounts Payable: | | | | |
| General | | 69.4 | | | 35.4 | |
| Affiliated Companies | | 95.1 | | | 81.5 | |
| | | | |
| Long-term Debt Due Within One Year – Nonaffiliated | | 90.0 | | | 95.0 | |
| | | | |
| Accrued Interest | | 45.0 | | | 39.6 | |
| | | | |
| Other Current Liabilities | | 14.8 | | | 15.8 | |
| TOTAL CURRENT LIABILITIES | | 314.3 | | | 310.0 | |
| | | | |
| NONCURRENT LIABILITIES | | | | |
| Long-term Debt – Nonaffiliated | | 5,678.1 | | | 5,319.4 | |
| | | | |
| | | | |
| | | | |
| | | | |
| TOTAL NONCURRENT LIABILITIES | | 5,678.1 | | | 5,319.4 | |
| | | | |
| TOTAL LIABILITIES | | 5,992.4 | | | 5,629.4 | |
| | | | |
| MEMBER’S EQUITY | | | | |
| Paid-in Capital | | 3,100.6 | | | 3,043.4 | |
| Retained Earnings | | 3,850.3 | | | 3,289.9 | |
| TOTAL MEMBER’S EQUITY | | 6,950.9 | | | 6,333.3 | |
| | | | |
| TOTAL LIABILITIES AND MEMBER’S EQUITY | | $ | 12,943.3 | | | $ | 11,962.7 | |
| | | | | | | | |
See Condensed Notes to Condensed Financial Information beginning on page S-15. |
SCHEDULE I
AEP TRANSMISSION COMPANY, LLC (AEPTCo Parent)
CONDENSED FINANCIAL INFORMATION
CONDENSED STATEMENTS OF CASH FLOWS
For the Years Ended December 31, 2024, 2023 and 2022
(in millions)
| | | | | | | | | | | | | | | | | | | | |
| | | Years Ended December 31, |
| | | 2024 | | 2023 | | 2022 |
| OPERATING ACTIVITIES | | | | | | |
| Net Income | | $ | 688.4 | | | $ | 614.2 | | | $ | 594.2 | |
| Adjustments to Reconcile Net Income to Net Cash Flows from (Used for) Operating Activities: | | | | | | |
| | | | | | |
| | | | | | |
| | | | | | |
| | | | | | |
| | | | | | |
| Equity Earnings of Unconsolidated Subsidiaries | | (687.8) | | | (612.9) | | | (594.2) | |
| Change in Other Noncurrent Assets | | — | | | 3.8 | | | — | |
| Change in Other Noncurrent Liabilities | | 4.0 | | | 11.5 | | | 9.1 | |
| Changes in Certain Components of Working Capital: | | | | | | |
| Accounts Receivable, Net | | 10.4 | | | (37.5) | | | (2.2) | |
| | | | | | |
| Accounts Payable | | 12.9 | | | 36.6 | | | (0.6) | |
| | | | | | |
| Accrued Interest | | 5.4 | | | 10.8 | | | — | |
| | | | | | |
| Other Current Liabilities | | 34.0 | | | (30.5) | | | (0.8) | |
| Net Cash Flows from (Used for) Operating Activities | | 67.3 | | | (4.0) | | | 5.5 | |
| | | | | | |
| INVESTING ACTIVITIES | | | | | | |
| | | | | | |
| | | | | | |
| | | | | | |
| | | | | | |
| Change in Advances to Affiliates, Net | | (20.4) | | | — | | | 12.7 | |
| Repayment of Notes Receivable from Affiliated Companies | | 95.0 | | | 60.0 | | | 104.0 | |
| Issuance of Notes Receivable to Affiliated Companies | | (450.0) | | | (700.0) | | | (550.0) | |
| Return of Capital Contributions from Unconsolidated Subsidiaries | | 132.8 | | | 183.7 | | | 130.0 | |
| Capital Contributions to Subsidiaries | | (61.7) | | | (29.7) | | | (69.5) | |
| | | | | | |
| Net Cash Flows Used for Investing Activities | | (304.3) | | | (486.0) | | | (372.8) | |
| | | | | | |
| FINANCING ACTIVITIES | | | | | | |
| | | | | | |
| Capital Contributions from Member | | 61.7 | | | 29.7 | | | 72.7 | |
| Return of Capital to Member | | (4.5) | | | (8.6) | | | — | |
| Issuance of Long-term Debt – Nonaffiliated | | 445.7 | | | 689.0 | | | 540.8 | |
| | | | | | |
| | | | | | |
| Retirement of Long-term Debt – Nonaffiliated | | (95.0) | | | (60.0) | | | (104.0) | |
| Change in Advances from Affiliates, Net | | (42.7) | | | 14.9 | | | 27.8 | |
| Dividends Paid to Member | | (128.0) | | | (175.0) | | | (170.0) | |
| Other Financing Activities | | (0.2) | | | — | | | — | |
| Net Cash Flows from Financing Activities | | 237.0 | | | 490.0 | | | 367.3 | |
| | | | | | |
| Net Change in Cash and Cash Equivalents | | — | | | — | | | — | |
| Cash and Cash Equivalents at Beginning of Period | | — | | | — | | | — | |
| Cash and Cash Equivalents at End of Period | | $ | — | | | $ | — | | | $ | — | |
| | | | | | |
See Condensed Notes to Condensed Financial Information beginning on page S-15. |
1. SUMMARY OF SIGNIFICANT ACCOUNTING POLICIES
Basis of Presentation
The condensed financial information of AEPTCo Parent is required as a result of the restricted net assets of AEPTCo consolidated subsidiaries exceeding 25% of AEPTCo consolidated net assets as of December 31, 2024. AEPTCo Parent is the direct holding company for the seven State Transcos. The primary source of income for AEPTCo Parent is equity in its subsidiaries’ earnings. AEPTCo Parent financial statements should be read in conjunction with the AEPTCo consolidated financial statements and the accompanying notes thereto. For purposes of these condensed financial statements, AEPTCo wholly-owned and majority-owned subsidiaries are recorded based upon its proportionate share of the subsidiaries’ net assets (similar to presenting them on the equity method).
Income Taxes
AEPTCo Parent joins in the filing of a consolidated federal income tax return with its affiliates in the AEP System. The benefit of current tax loss of the parent company (Parent Company Loss Benefit) to the AEP System subsidiaries is accounted for as an allocation through equity. The consolidated NOL of the AEP System is allocated to each company in the consolidated group with taxable loss. With the exception of the allocation of the consolidated AEP System NOL, Parent Company Loss Benefit and general business tax credits, the method of allocation reflects a separate return result for each company in the consolidated group.
Noncontrolling Interest in OHTCo and IMTCo
In January 2025, AEP announced a partnership between nonaffiliated entities to acquire a 19.9% noncontrolling interest in OHTCo and IMTCo for $2.82 billion. The transaction is subject to FERC approval and clearance from the Committee on Foreign Investment in the United States. In December 2024, Midwest Transmission Holdings, LCC was formed as a consolidated joint venture by AEPTCo Parent in anticipation of the transaction being finalized in the second half of 2025. AEPTCo Parent recorded Notes Receivable – Affiliated of $2.82 billion as of December 31, 2024 in relation to Midwest Transmission Holdings, LLC. See Note 4 - Related Party Transactions for additional information.
2. COMMITMENTS, GUARANTEES AND CONTINGENCIES
AEPTCo Parent and its subsidiaries are parties to legal matters. For further discussion, see Note 6 - Commitments, Guarantees and Contingencies.
3. FINANCING ACTIVITIES
For discussion of Financing Activities, see Note 15 - Financing Activities to AEPTCo’s audited consolidated financial statements.
4. RELATED PARTY TRANSACTIONS
Payments on Behalf of Subsidiaries
Due to occasional time sensitivity and complexity of payments, Parent makes certain insurance, tax and other payments on behalf of subsidiary companies. Parent is then fully reimbursed by the subsidiary companies. AEPTCo Parent also makes convenience payments on behalf of its State Transcos. AEPTCo Parent is then fully reimbursed by its State Transcos.
Long-term Lending to Subsidiaries
AEPTCo Parent enters into debt arrangements with nonaffiliated entities. AEPTCo Parent has long-term debt of $5.8 billion and $5.4 billion as of December 31, 2024 and 2023, respectively. AEPTCo Parent uses the proceeds from these nonaffiliated debt arrangements to make affiliated loans to its State Transcos using the same interest rates and maturity dates as the nonaffiliated debt arrangements. AEPTCo Parent has recorded Notes Receivable – Affiliated of $8.6 billion and $5.4 billion as of December 31, 2024 and 2023, respectively. Related to these nonaffiliated and affiliated debt arrangements, AEPTCo Parent has recorded Accrued Interest of $45 million and $40 million as of December 31, 2024 and 2023, respectively. AEPTCo Parent has also recorded Accounts Receivable – Affiliated Companies of $62 million and $44 million as of December 31, 2024 and 2023, respectively. AEPTCo Parent has recorded Interest Income – Affiliated of $238 million, $215 million and $177 million for the years ended December 31, 2024, 2023 and 2022, respectively, related to the Notes Receivable – Affiliated. AEPTCo
Parent has recorded Interest Expense of $238 million, $215 million and $177 million for the years ended December 31, 2024, 2023 and 2022, respectively, related to the nonaffiliated debt arrangements.
Short-term Lending to Subsidiaries
Parent uses a commercial paper program to meet the short-term borrowing needs of subsidiaries. The program is used to fund both a Utility Money Pool, which funds the utility subsidiaries, and a Nonutility Money Pool, which funds certain nonutility subsidiaries. In addition, the program also funds, as direct borrowers, the short-term debt requirements of other subsidiaries that are not participants in either money pool for regulatory or operational reasons. The program also allows some direct borrowers to invest excess cash with Parent.
Interest expense related to AEPTCo Parent’s short-term borrowing is included in Interest Expense on AEPTCo Parent’s statements of income. AEPTCo Parent incurred immaterial interest expense for amounts borrowed from AEP affiliates for the years ended December 31, 2024, 2023 and 2022.
Interest income related to AEPTCo Parent’s short-term lending is included in Interest Income – Affiliated on AEPTCo Parent’s statements of income. AEPTCo Parent earned interest income for amounts advanced to AEP affiliates of $3 million, $3 million and $915 thousand for the years ended December 31, 2024, 2023 and 2022, respectively.
EXHIBIT INDEX
The documents listed below are being filed or have previously been filed on behalf of the Registrants shown and are incorporated herein by reference to the documents indicated and made a part hereof. Exhibits (“Ex”) not identified as previously filed are filed herewith. Exhibits designated with a dagger (†) are management contracts or compensatory plans or arrangements required to be filed as an Exhibit to this Form. Exhibits designated with an asterisk (*) are filed herewith.
| | | | | | | | | | | | | | |
Exhibit
Designation | | Nature of Exhibit | | Previously Filed as Exhibit to: |
| | | |
| AEP‡ File No. 1-3525 | | |
| | | | | |
| 3(a) | | Composite of the Restated Certificate of Incorporation of AEP, dated April 26, 2022. | | |
| | | | |
| 3(b) | | Composite By-Laws of AEP amended as of April 25, 2023. | | |
| | | | |
| 4(a) | | Indenture (for unsecured debt securities), dated as of May 1, 2001, between AEP and The Bank of New York, as Trustee. | | Registration Statement No. 333-86050, Ex 4(a)(b)(c) Registration Statement No. 333-105532, Ex 4(d)(e)(f) Registration Statement No. 333-200956, Ex 4(b) Registration Statement No. 333-222068, Ex 4(b) Registration Statement No. 333-249918, Ex 4(b)(c) Registration Statement No. 333-275345, Ex 4(b)(c)(d) |
| | | | |
| 4(a)1 | | Company Order and Officer’s Certificate between AEP and The Bank of New York Mellon Trust Company, N.A. as Trustee dated December 8, 2023 establishing terms of the 5.20% Senior Notes, Series R due 2029. | | |
| | | | |
| 4(b) | | Junior Subordinated Indenture, dated March 1, 2008, between AEP and The Bank of New York Mellon Trust Company, N.A., as Trustee for the Junior Subordinated Debentures. | | Registration Statement No. 333-156387, Ex 4(c)(d) Registration Statement No. 333-249918, Ex 4(f)(g) |
| | | | |
| 4(b)1 | | Supplemental Indenture No. 6 between AEP and The Bank of New York Mellon Trust Company, N.A., as Trustee, dated June 20, 2024, establishing the terms of 7.050% Fixed-to-Fixed Reset Rate Junior Subordinated Debentures, Series A, due 2054 and the 6.950% Fixed-to-Fixed Reset Rate Junior Subordinated Debentures, Series B, due 2054. | | |
| | | | |
| 4(c) | | $4,000,000,000 Credit Agreement dated March 31, 2021 among AEP, Initial Lenders and Wells Fargo Bank National Association as Administrative Agent. | | |
| | | | |
| 4(c)1 | | April 7, 2022 Amendment and extension to $4,000,000,000 Credit Agreement dated March 31, 2021 among AEP, Initial Lenders and Wells Fargo Bank National Association as Administrative Agent. | | |
| | | | |
| 4(c)2 | | March 28, 2024 Amendment and extension to $5,000,000,000 of the $4,000,000 Credit Agreement dated March 31, 2021 among AEP, Initial Lenders and Wells Fargo Bank National Association as Administrative Agent. | | |
| | | | |
| | | | | | | | | | | | | | |
Exhibit
Designation | | Nature of Exhibit | | Previously Filed as Exhibit to: |
| | | |
| 4(d) | | $1,000,000,000 Credit Agreement dated March 31, 2021 among AEP, Initial Lenders and Wells Fargo Bank National Association as Administrative Agent. | | |
| | | | |
| 4(d)1 | | April 7, 2022 Amendment and extension to $1,000,000,000 Credit Agreement dated March 31, 2021 among AEP, Initial Lenders and Wells Fargo Bank National Association as Administrative Agent. | | |
| | | | |
| 4(d)2 | | March 31, 2023 Amendment and extension to $1,000,000,000 Credit Agreement dated March 31, 2021 among AEP, Initial Lenders and Wells Fargo Bank National Association as Administrative Agent. | | |
| | | | |
| 4(d)3 | | March 28, 2024 Amendment and extension to $1,000,000,000 Credit Agreement dated March 31, 2021 among AEP, Initial Lenders and Wells Fargo Bank National Association as Administrative Agent. | | |
| | | | |
| 4(e) | | Distribution Agreement, dated November 16, 2023, among AEP and Barclays Capital Inc., BofA Securities, Inc., Citigroup Global Markets Inc., Mizuho Securities USA LLC, MUFG Securities Americas Inc., Scotia Capital (USA) Inc., Barclays Bank PLC, Bank of America, N.A. Wells Fargo Securities, LLC, Citibank, N.A., Mizuho Markets Americas LLC, MUFG Securities EMEA plc, The Bank of Nova Scotia and Wells Fargo Bank National Association. | | |
| | | | |
| 4(f) | | Description of Securities. | | |
| | | | |
| 10(a) | | Consent Decree with U.S. District Court dated October 9, 2007, as modified July 17, 2019. | | |
| | | | |
| †10(b) | | AEP Retainer Deferral Plan for Non-Employee Directors, as Amended and Restated effective October 1, 2020. | | |
| | | | |
| †10(c) | | AEP Stock Unit Accumulation Plan for Non-Employee Directors as amended October 1, 2020. | | |
| | | | |
| †10(c)1 | | AEP Stock Unit Accumulation Plan for Non-Employee Directors as amended June 1, 2022. | | |
| | | | |
| †10(d) | | AEP System Excess Benefit Plan, Amended and Restated as of January 1, 2020. | | |
| | | | |
| †10(d)1 | | Guaranty by AEP of AEPSC Excess Benefits Plan. | | 1990 Form 10-K, Ex 10(h)(1)(B) |
| | | | |
| †10(e) | | AEP System Supplemental Retirement Savings Plan, Amended and Restated as of October 6, 2021 (Non-Qualified). | | |
| | | | |
| †10(f) | | AEPSC Umbrella Trust for Executives. | | 1993 Form 10-K, Ex 10(g)(3) |
| | | | |
| †10(f)1A | | First Amendment to AEPSC Umbrella Trust for Executives. | | |
| | | | | | | | | | | | | | |
Exhibit
Designation | | Nature of Exhibit | | Previously Filed as Exhibit to: |
| | | |
| | | | |
| †10(f)2A | | Second Amendment to AEPSC Umbrella Trust for Executives. | | |
| | | | |
| †10(g) | | AEP System Incentive Compensation Deferral Plan Amended and Restated as of June 1, 2019. | | |
| | | | |
| †10(h) | | AEP Change In Control Agreement, as Revised Effective January 1, 2017. | | |
| | | | |
| †10(i) | | AEP System Long-Term Incentive Plan effective as of April 23, 2024 | | |
| | | | |
| †10(i)1A | | Performance Share Award Agreement furnished to participants of the AEP System Long-Term Incentive Plan, as amended. | | |
| | | | |
| †10(i)2A | | Restricted Stock Unit Agreement furnished to participants of the AEP System Long-Term Incentive Plan as Amended and Restated effective January 1, 2022. | | |
| | | | |
| †10(j) | | AEP System Stock Ownership Requirement Plan Amended and Restated effective October 1, 2020. | | |
| | | | |
| †10(k) | | Central and South West System Special Executive Retirement Plan Amended and Restated effective January 1, 2020. | | |
| | | | |
| †10(l) | | AEP Executive Severance Plan Amended effective January 4, 2021. | | |
| | | | |
| †10(l)(1) | | AEP Executive Severance Plan Amended and Restated effective February 20, 2023. | | |
| | | | |
| †10(l)(2) | | AEP Executive Severance Plan Amended and Restated effective July 15, 2024. | | |
| | | | |
| †10(m) | | Severance, Release of All Claims, and Non-competition Agreement between American Electric Power Company, Inc. and Julia A. Sloat. | | |
| | | | |
| | Severance, Release of All Claims, and Non-competition Agreement between American Electric Power Company, Inc. and Peggy I. Simmons. | | |
| | | | |
| †10(o) | | AEP Aircraft Timesharing Agreement dated July 16, 2024 between American Electric Power Service Corporation and William J. Fehrman | | |
| | | | |
| †10(p) | | Director Appointment and Nomination Agreement. | | |
| | | | |
| | AEP Insider Trading Policy. | | |
| | | | |
| | List of subsidiaries of AEP. | | |
| | | | |
| | Consent of PricewaterhouseCoopers LLP. | | |
| | | | |
| | Power of Attorney. | | |
| | | | |
| | | | | | | | | | | | | | |
Exhibit
Designation | | Nature of Exhibit | | Previously Filed as Exhibit to: |
| | | |
| | Certification of Chief Executive Officer Pursuant to Section 302 of the Sarbanes-Oxley Act of 2002. | | |
| | | | |
| | Certification of Chief Financial Officer Pursuant to Section 302 of the Sarbanes-Oxley Act of 2002. | | |
| | | | |
| | Certification of Chief Executive Officer Pursuant to Section 1350 of Chapter 63 of Title 18 of the United States Code. | | |
| | | | |
| | Certification of Chief Financial Officer Pursuant to Section 1350 of Chapter 63 of Title 18 of the United States Code. | | |
| | | | |
| 97 | | AEP Policy on Recouping Incentive Compensation | | |
| | | | |
| 101.INS | | XBRL Instance Document. The instance document does not appear in the interactive data file because its XBRL tags are embedded within the inline XBRL document. | | |
| | | | |
| 101.SCH | | XBRL Taxonomy Extension Schema. | | |
| | | | |
| 101.CAL | | XBRL Taxonomy Extension Calculation Linkbase. | | |
| | | | |
| 101.DEF | | XBRL Taxonomy Extension Definition Linkbase. | | |
| | | | |
| 101.LAB | | XBRL Taxonomy Extension Label Linkbase. | | |
| | | | |
| 101.PRE | | XBRL Taxonomy Extension Presentation Linkbase. | | |
| | | | |
| 104 | | Cover Page Interactive Data File. Formatted as inline XBRL and contained in Exhibit 101. | | |
| | | | |
| AEP TEXAS‡ File No. 333-221643 | | |
| | | | |
| 3(a) | | Composite of the Restated Certificate of Incorporation, as amended. | | |
| | | | |
| 3(b) | | Bylaws. | | |
| | | | |
| 4(a) | | Indenture, dated as of September 1, 2017, between AEP Texas and The Bank of New York Mellon Trust Company, N.A., as Trustee. | |
|
| | | | |
| 4(b) | | Company Order and Officer’s Certificate between AEP Texas and The Bank of New York Mellon Trust Company, N.A. as Trustee dated May 22, 2024 establishing terms of the 5.45% Senior Notes, Series N due 2029 and 5.70% Senior Notes Series O due 2034. | | |
| | | | |
| | Consent of PricewaterhouseCoopers LLP. | | |
| | | | |
| | Power of Attorney. | | |
| | | | |
| | | | | | | | | | | | | | |
Exhibit
Designation | | Nature of Exhibit | | Previously Filed as Exhibit to: |
| | | |
| | Certification of Chief Executive Officer Pursuant to Section 302 of the Sarbanes-Oxley Act of 2002. | | |
| | | | |
| | Certification of Chief Financial Officer Pursuant to Section 302 of the Sarbanes-Oxley Act of 2002. | | |
| | | | |
| | Certification of Chief Executive Officer Pursuant to Section 1350 of Chapter 63 of Title 18 of the United States Code. | | |
| | | | |
| | Certification of Chief Financial Officer Pursuant to Section 1350 of Chapter 63 of Title 18 of the United States Code. | | |
| | | | |
| 101.INS | | XBRL Instance Document. The instance document does not appear in the interactive data file because its XBRL tags are embedded within the inline XBRL document. | | |
| | | | |
| 101.SCH | | XBRL Taxonomy Extension Schema. | | |
| | | | |
| 101.CAL | | XBRL Taxonomy Extension Calculation Linkbase. | | |
| | | | |
| 101.DEF | | XBRL Taxonomy Extension Definition Linkbase. | | |
| | | | |
| 101.LAB | | XBRL Taxonomy Extension Label Linkbase. | | |
| | | | |
| 101.PRE | | XBRL Taxonomy Extension Presentation Linkbase. | | |
| | | | |
| 104 | | Cover Page Interactive Data File. Formatted as inline XBRL and contained in Exhibit 101. | | |
| | | | |
| AEPTCo‡ File No. 333-217143 | | |
| | | | |
| 3(a) | | Limited Liability Company Agreement of AEP Transmission Company, LLC dated as of January 27, 2006. | | |
| | | | |
| 3(b) | | First Amendment to Limited Liability Company Agreement of AEPTCo dated as of May 21, 2013. | | |
| | | | |
| 4(a) | | Indenture, dated as of November 1, 2016, between AEPTCo and The Bank of New York Mellon Trust Company, N.A., as Trustee. | | Registration Statement No. 333-225325, Ex 4(b)(c)(d) Registration Statement No. 333-277662 Ex 4(b)(c)(d) |
| | | | |
| 4(b) | | Company Order and Officer’s Certificate between AEPTCo and The Bank of New York Mellon Trust Company, N.A. as Trustee dated March 13, 2024 establishing terms of the 5.15% Senior Notes, Series Q due 2034 | | |
| | | | |
| 4(c) | | Note Purchase Agreement, dated as of October 18, 2012 between AEPTCo and the Initial Purchasers. | | |
| | | | |
| 4(c)1 | | Supplement to Note Purchase Agreement, dated as of November 7, 2013 between AEPTCo and the Initial Purchasers. | | |
| | | | | | | | | | | | | | |
Exhibit
Designation | | Nature of Exhibit | | Previously Filed as Exhibit to: |
| | | |
| | | | |
| 4(c)2 | | Supplement to Note Purchase Agreement, dated as of November 14, 2014 between AEP Transmission Company, LLC and the Initial Purchasers. | | |
| | | | |
| 10 (a) | | Stock Purchase Agreement dated as of October 26, 2021 among AEP, AEPTCo and Liberty Utilities Co. | | |
| | | | |
| 10(a)1 | | First Amendment to Stock Purchase Agreement dated September 29, 2022 among AEP, AEPTCo and Liberty Utilities Co. | | |
| | | | |
| 10(a)2 | | Second Amendment to Stock Purchase Agreement dated January 16, 2023 among AEP, AEPTCo and Liberty Utilities Co. | | |
| | | | |
| 10(a)3 | | Mutual Termination Agreement dated and effective April 17, 2023 among AEP, AEPTCo and Liberty Utilities Co. terminating the Stock Purchase Agreement dated October 26, 2021 the First Amendment to the Stock Purchase Agreement, dated as of September 29, 2022, and the Second Amendment to the Stock Purchase Agreement, dated as of January 16, 2023. | | |
| | | | |
| | Contribution Agreement by and among AEPTCo, Midwest Transmission Company, LLC and Olympus BidCo L.P. dated as of January 9, 2025. | | |
| | | | |
| | Consent of PricewaterhouseCoopers LLP. | | |
| | | | |
| | Power of Attorney. | | |
| | | | |
| | Certification of Chief Executive Officer Pursuant to Section 302 of the Sarbanes-Oxley Act of 2002. | | |
| | | | |
| | Certification of Chief Financial Officer Pursuant to Section 302 of the Sarbanes-Oxley Act of 2002. | | |
| | | | |
| | Certification of Chief Executive Officer Pursuant to Section 1350 of Chapter 63 of Title 18 of the United States Code. | | |
| | | | |
| | Certification of Chief Financial Officer Pursuant to Section 1350 of Chapter 63 of Title 18 of the United States Code. | | |
| | | | |
| 101.INS | | XBRL Instance Document. The instance document does not appear in the interactive data file because its XBRL tags are embedded within the inline XBRL document. | | |
| | | | |
| 101.SCH | | XBRL Taxonomy Extension Schema. | | |
| | | | |
| 101.CAL | | XBRL Taxonomy Extension Calculation Linkbase. | | |
| | | | |
| 101.DEF | | XBRL Taxonomy Extension Definition Linkbase. | | |
| | | | |
| 101.LAB | | XBRL Taxonomy Extension Label Linkbase. | | |
| | | | |
| | | | | | | | | | | | | | |
Exhibit
Designation | | Nature of Exhibit | | Previously Filed as Exhibit to: |
| | | |
| 101.PRE | | XBRL Taxonomy Extension Presentation Linkbase. | | |
| | | | |
| 104 | | Cover Page Interactive Data File. Formatted as inline XBRL and contained in Exhibit 101. | | |
| | | | |
| APCo‡ File No. 1-3457 | | |
| | | | |
| 3(a) | | Composite of the Restated Articles of Incorporation of APCo, amended as of March 7, 1997. | | |
| | | | |
| 3(b) | | Composite By-Laws of APCo, amended as of February 26, 2008. | | |
| | | | |
| 4(a) | | Indenture (for unsecured debt securities), dated as of January 1, 1998, between APCo and The Bank of New York, As Trustee. | | Registration Statement No. 333-116284, Ex 4(b)(c) Registration Statement No. 333-123348, Ex 4(b)(c) Registration Statement No. 333-136432, Ex 4(b)(c)(d) Registration Statement No. 333-161940, Ex 4(b)(c)(d) Registration Statement No. 333-182336, Ex 4(b)(c) Registration Statement No. 333-200750, Ex 4(b)(c) Registration Statement No. 333-236613, Ex 4(b)(c)
|
| | | | |
| 4(b) | | Company Order and Officer’s Certificate between APCo and The Bank of New York Mellon Trust Company, N.A. as Trustee dated March 20, 2024 establishing terms of the 5.65% Senior Notes, Series CC due 2034. | | |
| | | | |
| 10(a) | | Inter-Company Power Agreement, dated as of July 10, 1953, among OVEC and the Sponsoring Companies, as amended September 10, 2010. | | |
| | | | |
| 10(b) | | Consent Decree with U.S. District Court dated October 9, 2007, as modified July 17, 2019. | | |
| | | | |
| | Consent of PricewaterhouseCoopers LLP. | | |
| | | | |
| | Power of Attorney. | | |
| | | | |
| | Certification of Chief Executive Officer Pursuant to Section 302 of the Sarbanes-Oxley Act of 2002. | | |
| | | | |
| | Certification of Chief Financial Officer Pursuant to Section 302 of the Sarbanes-Oxley Act of 2002. | | |
| | | | |
| | Certification of Chief Executive Officer Pursuant to Section 1350 of Chapter 63 of Title 18 of the United States Code. | | |
| | | | |
| | Certification of Chief Financial Officer Pursuant to Section 1350 of Chapter 63 of Title 18 of the United States Code. | | |
| | | | |
| | | | | | | | | | | | | | |
Exhibit
Designation | | Nature of Exhibit | | Previously Filed as Exhibit to: |
| | | |
| 101.INS | | XBRL Instance Document. The instance document does not appear in the interactive data file because its XBRL tags are embedded within the inline XBRL document. | | |
| | | | |
| 101.SCH | | XBRL Taxonomy Extension Schema. | | |
| | | | |
| 101.CAL | | XBRL Taxonomy Extension Calculation Linkbase. | | |
| | | | |
| 101.DEF | | XBRL Taxonomy Extension Definition Linkbase. | | |
| | | | |
| 101.LAB | | XBRL Taxonomy Extension Label Linkbase. | | |
| | | | |
| 101.PRE | | XBRL Taxonomy Extension Presentation Linkbase. | | |
| | | | |
| 104 | | Cover Page Interactive Data File. Formatted as inline XBRL and contained in Exhibit 101. | | |
| | | | |
| I&M‡ File No. 1-3570 | | |
| | | | |
| 3(a) | | Composite of the Amended Articles of Acceptance of I&M, dated of March 7, 1997. | | |
| | | | |
| 3(b) | | Composite By-Laws of I&M, amended as of February 26, 2008. | | |
| | | | |
| 4 | | Indenture (for unsecured debt securities), dated as of October 1, 1998, between I&M and The Bank of New York, as Trustee. | | Registration Statement No. 333-225103, Ex 4(b)(c)(d) Registration Statement No. 333-268880 Ex. 4(b)(c) |
| | | | |
| 4(a) | | Company Order and Officer’s Certificate between I&M and The Bank of New York Mellon Trust Company, N.A. as Trustee dated March 23, 2023 establishing terms of the 5.625% Senior Notes, Series P, due 2053. | | |
| | | | |
| 10(a) | | Inter-Company Power Agreement, dated as of July 10, 1953, among OVEC and the Sponsoring Companies, as amended September 10, 2010. | | |
| | | | |
| 10(b) | | Unit Power Agreement dated as of March 31, 1982 between AEGCo and I&M, as amended. | | Registration Statement No. 33-32752, Ex 28(b)(1)(A)(B) |
| | | | |
| 10(c) | | Consent Decree with U.S. District Court dated October 9, 2007, as modified July 17, 2019. | | |
| | | | |
| | Consent of PricewaterhouseCoopers LLP. | | |
| | | | |
| | Power of Attorney. | | |
| | | | |
| | Certification of Chief Executive Officer Pursuant to Section 302 of the Sarbanes-Oxley Act of 2002. | | |
| | | | |
| | | | | | | | | | | | | | |
Exhibit
Designation | | Nature of Exhibit | | Previously Filed as Exhibit to: |
| | | |
| | Certification of Chief Financial Officer Pursuant to Section 302 of the Sarbanes-Oxley Act of 2002. | | |
| | | | |
| | Certification of Chief Executive Officer Pursuant to Section 1350 of Chapter 63 of Title 18 of the United States Code. | | |
| | | | |
| | Certification of Chief Financial Officer Pursuant to Section 1350 of Chapter 63 of Title 18 of the United States Code. | | |
| | | | |
| 101.INS | | XBRL Instance Document. The instance document does not appear in the interactive data file because its XBRL tags are embedded within the inline XBRL document. | | |
| | | | |
| 101.SCH | | XBRL Taxonomy Extension Schema. | | |
| | | | |
| 101.CAL | | XBRL Taxonomy Extension Calculation Linkbase. | | |
| | | | |
| 101.DEF | | XBRL Taxonomy Extension Definition Linkbase. | | |
| | | | |
| 101.LAB | | XBRL Taxonomy Extension Label Linkbase. | | |
| | | | |
| 101.PRE | | XBRL Taxonomy Extension Presentation Linkbase. | | |
| | | | |
| 104 | | Cover Page Interactive Data File. Formatted as inline XBRL and contained in Exhibit 101. | | |
| | |
| OPCo‡ File No. 1-6543 | | |
| | | | |
| 3(a) | | Composite of the Amended Articles of Incorporation of OPCo, dated June 3, 2002. | | |
| | | | |
| 3(b) | | Amended Code of Regulations of OPCo. | | |
| | | | |
| 4(a) | | Indenture (for unsecured debt securities), dated as of September 1, 1997, between OPCo and Bankers Trust Company (now The Bank of New York Mellon Trust Company, N.A. as assignee of Deutsche Bank Trust Company Americas), as Trustee. | | Registration Statement No. 333-255600, Ex 4(b)(c)(d) Registration Statement No. 333-275801, Ex 4(b) |
| | | | |
| 4(a)1 | | Resignation of Deutsche Bank Trust Company Americas, as Trustee and appointment of The Bank of New York Mellon Trust Company, N.A. as Trustee of Indenture with OPCo dated as of September 1, 1997. | | |
| | | | |
| 4(a)2 | | Company Order and Officer’s Certificate between OPCo and The Bank of New York Mellon Trust Company, N.A. as Trustee dated September 9, 2021 establishing terms of the 2.90% Senior Notes, Series R, due 2051. | | |
| | | | |
| | | | | | | | | | | | | | |
Exhibit
Designation | | Nature of Exhibit | | Previously Filed as Exhibit to: |
| | | |
| 4(a)3 | | Company Order and Officer’s Certificate between OPCo and The Bank of New York Mellon Trust Company, N.A. as Trustee dated May 6, 2024 establishing terms of the 5.65% Senior Notes, Series T due 2034. | | |
| | | | |
| 4(b) | | Indenture (for unsecured debt securities), dated as of February 1, 2003, between OPCo and Bank One, N.A., as Trustee. | | Registration Statement No. 333-127913, Ex 4(d)(e)(f) |
| | | | |
| 4(c) | | Indenture (for unsecured debt securities), dated as of September 1, 1997, between CSPCo (predecessor in interest to OPCo) and Bankers Trust Company, as Trustee. | | |
| | | | |
| 4(d) | | Indenture (for unsecured debt securities), dated as of February 1, 2003, between CSPCo (predecessor in interest to OPCo) and Bank One, N.A., as Trustee. | | |
| | | | |
| 4(e) | | First Supplemental Indenture, dated as of December 31, 2011, by and between OPCo and The Bank of New York Mellon Trust Company, N.A., as trustee, supplementing the Indenture dated as of September 1, 1997 between CSPCo (predecessor in interest to OPCo) and the trustee. | | |
| | | | |
| 4(f) | | Third Supplemental Indenture, dated as of December 31, 2011, by and between OPCo and The Bank of New York Mellon Trust Company, N.A., as trustee, supplementing the Indenture dated as of February 14, 2003 between CSPCo (predecessor in interest to OPCo) and the trustee. | | |
| | | | |
| 10(a) | | Inter-Company Power Agreement, dated July 10, 1953, among OVEC and the Sponsoring Companies, as amended September 10, 2010. | | |
| | | | |
| 10(b) | | Consent Decree with U.S. District Court dated October 9, 2007, as modified July 17, 2019. | | |
| | | | |
| | Consent of PricewaterhouseCoopers LLP. | | |
| | | | |
| | Power of Attorney. | | |
| | | | |
| | Certification of Chief Executive Officer Pursuant to Section 302 of the Sarbanes-Oxley Act of 2002. | | |
| | | | |
| | Certification of Chief Financial Officer Pursuant to Section 302 of the Sarbanes-Oxley Act of 2002. | | |
| | | | |
| | Certification of Chief Executive Officer Pursuant to Section 1350 of Chapter 63 of Title 18 of the United States Code. | | |
| | | | |
| | Certification of Chief Financial Officer Pursuant to Section 1350 of Chapter 63 of Title 18 of the United States Code. | | |
| | | | |
| | | | | | | | | | | | | | |
Exhibit
Designation | | Nature of Exhibit | | Previously Filed as Exhibit to: |
| | | |
| 101.INS | | XBRL Instance Document. The instance document does not appear in the interactive data file because its XBRL tags are embedded within the inline XBRL document. | | |
| | | | |
| 101.SCH | | XBRL Taxonomy Extension Schema. | | |
| | | | |
| 101.CAL | | XBRL Taxonomy Extension Calculation Linkbase. | | |
| | | | |
| 101.DEF | | XBRL Taxonomy Extension Definition Linkbase. | | |
| | | | |
| 101.LAB | | XBRL Taxonomy Extension Label Linkbase. | | |
| | | | |
| 101.PRE | | XBRL Taxonomy Extension Presentation Linkbase. | | |
| | | | |
| 104 | | Cover Page Interactive Data File. Formatted as inline XBRL and contained in Exhibit 101. | | |
| | |
| PSO‡ File No. 0-343 | | |
| | | | |
| 3(a) | | Certificate of Amendment to Restated Certificate of Incorporation of PSO. | | |
| | | | |
| 3(b) | | Composite By-Laws of PSO amended as of February 26, 2008. | | |
| | | | |
| 4(a) | | Indenture (for unsecured debt securities), dated as of November 1, 2000, between PSO and The Bank of New York, as Trustee. | | Registration Statement No. 333-100623, Ex 4(a)(b)
Registration Statement No. 333-114665, Ex 4(b)(c)
Registration Statement No. 333-133548, Ex 4(b)(c)
Registration Statement No. 333-156319, Ex 4(b)(c) Registration Statement No. 333-251378, Ex 4(b)(c) Registration Statement No. 333-282058 Ex. 4(b)(c) |
| | | | |
| 4(b) | | Twelfth Supplemental Indenture dated as of December 1, 2024 between PSO and The Bank of New York Mellon Trust Company, N.A. as Trustee establishing terms of the 5.20% Senior Notes, Series M, due 2035. | | |
| | | | |
| 4(c) | | Credit Agreement dated as of January 19, 2021 among PSO as Borrower, Initial Lenders and Sumitomo Mitsui Banking Corporation as Administrative Agent. | | |
| | | | |
| 4(c)A | | April 19, 2022 Amendment and extension to $500,000,000 Credit Agreement dated January 19, 2021 among PSO, Initial Lenders and Sumitomo Mitsui Banking Corporation as Administrative Agent. | | |
| | | | |
| | Consent of PricewaterhouseCoopers LLP. | | |
| | | | |
| | Power of Attorney. | | |
| | | | |
| | Certification of Chief Executive Officer Pursuant to Section 302 of the Sarbanes-Oxley Act of 2002. | | |
| | | | |
| | Certification of Chief Financial Officer Pursuant to Section 302 of the Sarbanes-Oxley Act of 2002. | | |
| | | | |
| | | | | | | | | | | | | | |
Exhibit
Designation | | Nature of Exhibit | | Previously Filed as Exhibit to: |
| | | |
| | Certification of Chief Executive Officer Pursuant to Section 1350 of Chapter 63 of Title 18 of the United States Code. | | |
| | | | |
| | Certification of Chief Financial Officer Pursuant to Section 1350 of Chapter 63 of Title 18 of the United States Code. | | |
| | | | |
| 101.INS | | XBRL Instance Document. The instance document does not appear in the interactive data file because its XBRL tags are embedded within the inline XBRL document. | | |
| | | | |
| 101.SCH | | XBRL Taxonomy Extension Schema. | | |
| | | | |
| 101.CAL | | XBRL Taxonomy Extension Calculation Linkbase. | | |
| | | | |
| 101.DEF | | XBRL Taxonomy Extension Definition Linkbase. | | |
| | | | |
| 101.LAB | | XBRL Taxonomy Extension Label Linkbase. | | |
| | | | |
| 101.PRE | | XBRL Taxonomy Extension Presentation Linkbase. | | |
| | | | |
| 104 | | Cover Page Interactive Data File. Formatted as inline XBRL and contained in Exhibit 101. | | |
| | |
| SWEPCo‡ File No. 1-3146 | | |
| | | | |
| 3(a) | | Composite of Amended Restated Certificate of Incorporation of SWEPCo. | | |
| | | | |
| 3(a)(A) | | Amendment to Amended Restated Certificate of Incorporation. | | |
| | | | |
| 3(b) | | Composite By-Laws of SWEPCo amended as of February 26, 2008. | | |
| | | | |
| 4(a) | | Indenture (for unsecured debt securities), dated as of February 4, 2000, between SWEPCo and The Bank of New York, as Trustee. | | Registration Statement No. 333-226856, Ex 4(b)(c) Registration Statement No. 333-282060, Ex 4(b)(c) |
| | | | |
| | Consent of PricewaterhouseCoopers LLP. | | |
| | | | |
| | Power of Attorney. | | |
| | | | |
| | Certification of Chief Executive Officer Pursuant to Section 302 of the Sarbanes-Oxley Act of 2002. | | |
| | | | |
| | Certification of Chief Financial Officer Pursuant to Section 302 of the Sarbanes-Oxley Act of 2002. | | |
| | | | |
| | | | | | | | | | | | | | |
Exhibit
Designation | | Nature of Exhibit | | Previously Filed as Exhibit to: |
| | | |
| | Certification of Chief Executive Officer Pursuant to Section 1350 of Chapter 63 of Title 18 of the United States Code. | | |
| | | | |
| | Certification of Chief Financial Officer Pursuant to Section 1350 of Chapter 63 of Title 18 of the United States Code. | | |
| | | | |
| 101.INS | | XBRL Instance Document. The instance document does not appear in the interactive data file because its XBRL tags are embedded within the inline XBRL document. | | |
| | | | |
| 101.SCH | | XBRL Taxonomy Extension Schema. | | |
| | | | |
| 101.CAL | | XBRL Taxonomy Extension Calculation Linkbase. | | |
| | | | |
| 101.DEF | | XBRL Taxonomy Extension Definition Linkbase. | | |
| | | | |
| 101.LAB | | XBRL Taxonomy Extension Label Linkbase. | | |
| | | | |
| 101.PRE | | XBRL Taxonomy Extension Presentation Linkbase. | | |
| | | | |
| 104 | | Cover Page Interactive Data File. Formatted as inline XBRL and contained in Exhibit 101. | | |
‡ Certain instruments defining the rights of holders of long-term debt of the registrants included in the financial statements of registrants filed herewith have been omitted because the total amount of securities authorized thereunder does not exceed 10% of the total assets of registrants. The registrants hereby agree to furnish a copy of any such omitted instrument to the SEC upon request.
The agreements and other documents filed as exhibits to this report are not intended to provide factual information or other disclosure other than with respect to the terms of the agreements or other documents themselves, and you should not rely on them for that purpose. In particular, any representations and warranties made by us in these agreements or other documents were made solely within the specific context of the relevant agreement or document and may not describe the actual state of affairs as of the date they were made or at any other time.