Table of Contents
Filed Pursuant to Rule 424(b)(4)
Registration No. 333-223444
PROSPECTUS
OP Bancorp
2,000,000 Shares
Common Stock
This is the initial public offering of OP Bancorp. We are offering 2,000,000 shares of our common stock.
The initial public offering price of our common stock is $ 11.00 per share.
We have received approval to list our common stock on the Nasdaq Global Market under the symbol “OPBK.”
Our common stock was previously quoted on the OTC Market Group’s OTCQB Market under the symbol “OPBK”, and the last reported closing sale price for our common stock as reported on the OTCQB Market on March 26, 2018 was $11.90 per share.
Investing in our common stock involves risk. See “Risk Factors” beginning on page 13.
We are an “emerging growth company” under the federal securities laws and will be subject to reduced public company reporting requirements.
| Per Share | Total | |||||||
Public offering price | $ | 11.0000 | $ | 22,000,000 | ||||
Underwriting discounts (1) | $ | 0.7535 | $ | 1,507,000 | ||||
Proceeds to us, before expenses | $ | 10.2465 | $ | 20,493,000 | ||||
| (1) | Represents a weighted average. See “Underwriting” for information regarding the calculation of the weighted average and additional information regarding underwriting compensation. |
The underwriters have an option to purchase up to an additional 300,000 shares from us at the public offering price, less the underwriting discount, within 30 days from the date of this prospectus.
Neither the Securities and Exchange Commission nor any other regulatory body has approved or disapproved of these securities or passed upon the accuracy or adequacy of this prospectus. Any representation to the contrary is a criminal offense.
Shares of our common stock are not savings accounts or deposits and are not insured or guaranteed by the Federal Deposit Insurance Corporation or any other government agency.
The shares of common stock will be ready for delivery on or about March 29, 2018.
Book-Running Manager
Keefe, Bruyette & Woods
A Stifel Company
Co-Manager
D.A. Davidson & Co.
The date of this prospectus is March 27, 2018.
Table of Contents
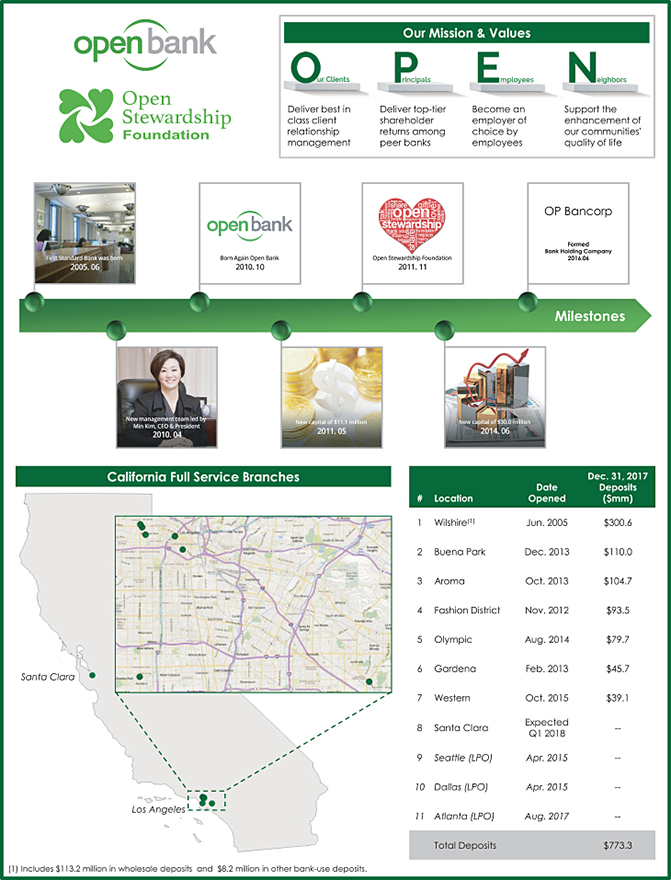
Table of Contents
| Page | ||||
| 1 | ||||
SUMMARY HISTORICAL CONSOLIDATED FINANCIAL AND OPERATING INFORMATION | 11 | |||
| 13 | ||||
| 43 | ||||
| 45 | ||||
| 46 | ||||
| 47 | ||||
| 48 | ||||
SELECTED HISTORICAL CONSOLIDATED FINANCIAL AND OPERATING INFORMATION | 49 | |||
GAAP RECONCILIATION AND MANAGEMENT EXPLANATION OFNON-GAAP FINANCIAL MEASURES | 51 | |||
MANAGEMENT’S DISCUSSION AND ANALYSIS OF FINANCIAL CONDITION AND RESULTS OF OPERATIONS | 52 | |||
| 79 | ||||
| 97 | ||||
| 111 | ||||
| 121 | ||||
| 133 | ||||
| 135 | ||||
| 137 | ||||
| 141 | ||||
MATERIAL UNITED STATES FEDERAL INCOME TAX CONSIDERATIONS FORNON-U.S. HOLDERS | 143 | |||
| 147 | ||||
| 152 | ||||
| 152 | ||||
| 152 | ||||
| F-1 | ||||
About this Prospectus
You should rely only on the information contained in this prospectus or in any free writing prospectus that we authorize to be delivered to you. We and the underwriters have not authorized anyone to provide you with different or additional information. We and the underwriters are not making an offer of these securities in any jurisdiction where the offer is not permitted. You should not assume that the information contained in this prospectus is accurate as of any date other than the date on the front of this prospectus. Our business, financial condition, results of operations and prospects may have changed since that date.
Unless we state otherwise or the context otherwise requires, references in this prospectus to “we”, “our”, “us,” “ourselves,” “the company” and “the Company” refer to OP Bancorp, a California corporation, and its consolidated wholly-owned subsidiary, Open Bank, a California corporation (“Open Bank” or “the Bank”), for all periods following the formation of OP Bancorp as a bank holding company under the Bank Holding Company Act of 1956, as amended, and the completion of the transactions under which Open Bank became a wholly-owned subsidiary of OP Bancorp. For all periods prior to the completion of such transactions, these terms refer to Open Bank, a California corporation.
i
Table of Contents
Market and Industry Data
Within this prospectus, we reference certain market, industry and demographic data and other statistical information. We have obtained this data and information from various independent, third party industry sources and publications. Nothing in the data or information used or derived from third party sources should be construed as advice. Some data and other information are also based on our good faith estimates, which are derived from our review of internal surveys and independent sources. We believe that these external sources and estimates are reliable, but have not independently verified them. Statements as to our market position are based on market data currently available to us. Although we are not aware of any misstatements regarding the economic, employment, industry and other market data presented herein, these estimates involve inherent risks and uncertainties and are based on assumptions that are subject to change.
Implications of Being an Emerging Growth Company
As a company with less than $1.07 billion in revenue during our last fiscal year, we qualify as an “emerging growth company” under the Jumpstart Our Business Startups Act of 2012, or the JOBS Act. An emerging growth company may take advantage of reduced reporting requirements and is relieved of certain other significant requirements that are otherwise generally applicable to public companies. As an emerging growth company:
| • | we may present as few as two years of audited financial statements and two years of related management discussion and analysis of financial condition and results of operations; |
| • | we are exempt from the requirement to obtain an attestation and report from our auditors on management’s assessment of our internal control over financial reporting under the Sarbanes-Oxley Act of 2002; |
| • | we are permitted to provide less extensive disclosure about our executive compensation arrangements; and |
| • | we are not required to give our shareholdersnon-binding advisory votes on executive compensation or golden parachute arrangements. |
In this prospectus we have elected to take advantage of the reduced disclosure requirements relating to executive compensation, and in the future we may take advantage of any or all of these exemptions for so long as we remain an emerging growth company. We will remain an emerging growth company until the earliest of (i) the end of the fiscal year during which we have total annual gross revenues of $1.07 billion or more, (ii) the end of the fiscal year following the fifth anniversary of the completion of this offering, (iii) the date on which we have, during the previous three-year period, issued more than $1.0 billion innon-convertible debt and (iv) the date on which we are deemed to be a “large accelerated filer” under the Securities Exchange Act of 1934, as amended.
In addition to the relief described above, the JOBS Act permits us an extended transition period for complying with new or revised accounting standards affecting public companies. We have elected not to take advantage of this extended transition period, which means that the financial statements included in this prospectus, as well as any financial statements that we file in the future, will be subject to all new or revised accounting standards generally applicable to public companies.
ii
Table of Contents
This summary highlights selected information contained in this prospectus. It does not contain all the information that you should consider before deciding to invest in our common stock. You should read the entire prospectus carefully, including the “Risk Factors” and “Management’s Discussion and Analysis of Financial Condition and Results of Operations” sections, and the historical financial statements and the accompanying notes included in this prospectus.
Our Company
We are a bank holding company headquartered in Los Angeles, California. Our commercial banking activities are operated through Open Bank, our banking subsidiary. We offer commercial banking services to small andmedium-sized businesses, their owners and retail customers with a focus on theKorean-American community. Having grown our branch and loan production office network over the past seven years, we now operate through seven full service branches located in the greater metropolitan area of Los Angeles, California, and Orange County, California, and three loan production offices in theKorean-American communities in Atlanta, Georgia, Dallas, Texas, and Seattle, Washington. In addition, we intend to open a full service branch in Santa Clara, California in the first quarter of 2018. As of December 31, 2017, we had consolidated total assets of $901.0 million, total deposits of $773.3 million, total loans outstanding (net of allowance for loan losses) of $738.9 million, and total shareholders’ equity of $91.5 million.
We provide our customers with a high degree of service, convenience and the products they need to achieve their financial objectives, by offering a customer-oriented product mix, competitive pricing, and convenient locations. Our lending activities are diversified and include commercial real estate (“CRE”), commercial and industrial, Small Business Administration (“SBA”) guaranteed, home mortgage, and consumer loans. We generally lend in markets where we have a physical presence through our branch and loan production offices. We attract retail deposits through our branch network which offers a wide range of deposit products for business and consumer banking customers. We offer a multitude of other products and services to our customers to complement our lending and deposit business.
We have a strong, values-based corporate culture rooted in personal community-based relationship banking that permeates throughout our entire organization. We strive to provide quality customer service that exceeds our customers’ expectations. We also heavily invest in ourKorean-American communities through our annual contributions to the Open Stewardship Foundation. We believe that customers value a banking partner knowledgeable about their business needs with a willingness and commitment to reinvest back into the community. We convey to our customers that banking with us indirectly provides them an opportunity to contribute to the community. We believe our strategic approach creates opportunities for expanding our banking relationships with new and existing customers who value personalized attention, local decision making and view us as an alternative to the large consolidated Korean-American financial institutions.
We established the Open Stewardship Foundation, or the Foundation, in 2011 to actively support civic organizations, schools and other eligible charitablenon-profit organizations that provide public benefit services in the communities we serve. The Foundation operates through a board of directors that consists of individuals who are members of our board of directors and executive management team, including our President and Chief Executive Officer and our Chairman of the Board. The Foundation board of directors reviews and approves award grants. We have committed to contribute annually 10% of our consolidated net income after taxes to the Foundation. Since inception, we have donated over $2.9 million to the Foundation, aiding over 120 localnon-profits.
Our experienced executive management team has been in place since 2010 and averages more than 30 years’ experience in the banking industry. Min Kim, our President and Chief Executive Officer, has over 35 years of
1
Table of Contents
banking experience in the Korean-American banking community. Ms. Kim previously served as Chief Executive Officer of Nara Bancorp and Nara Bank (now part of Hope Bancorp and Bank of Hope). After joining us, Ms. Kim implemented her strategic vision to take advantage of the opportunities to build a Korean-American community-based bank focused on personal relationships as an alternative to the larger Korean-American financial institutions that she believed through consolidation provided an opportunity for Open Bank to better serve small tomedium-sized businesses in the Korean-American community.
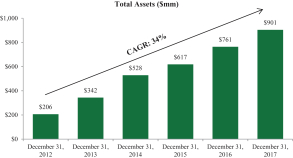
Since 2012 we have achieved significant organic growth in many of our key financial performance metrics. From December 31, 2012 through December 31, 2017, total assets have grown at a compounded annual growth rate (“CAGR”) of 34% from $206 million to $901 million, total gross loans (including loansheld-for-sale) at a CAGR of 36% from $162 million to $764 million, and total deposits at a CAGR of 35% from $174 million to $773 million. The charts below illustrate the growth in the dollar balances of our total assets, loans and deposits.
 | 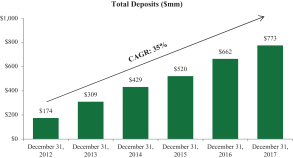 |
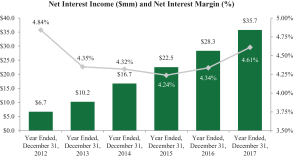
Over this same period, our profitability also significantly increased. The charts below illustrate our net income and diluted earnings per share (“EPS”) and net interest income and net interest margin (“NIM”) during this period. We believe our earnings growth during this period was primarily attributable to our organic growth initiatives, which improved our loan portfolio, our deposit mix and our efficiency ratio.
 |  |
2
Table of Contents
We plan to continue to leverage our experienced management team, our personal relationship community banking focus in the attractiveKorean-American communities in which we serve, and our diversified lending approach to drive future organic growth. While other institutions frequently enter new geographies through acquisitions, we have grown our geographic footprint through de novo branches while remaining true to our business model. We intend to continue our organic growth while further diversifying our geographical concentration with the anticipated expansion in Santa Clara, California, in the first quarter of 2018, our first branch in northern California. We also are targeting markets where we have loan production offices for future expansion and development of de novo branches. Supplementing deposit products to our borrowers in those markets is expected to provide the profitability to support our investment in full service branches. Although our growth has historically been organic, we are amenable to considering opportunistic strategic acquisitions to enhance our long-term growth strategy.
Our History
We began operations in 2005 as a California chartered banking association under the name First Standard Bank. In 2010, we rebranded the bank as “Open Bank.” In 2016, we incorporated OP Bancorp as a bank holding company under the Bank Holding Company Act of 1956, as amended (“BHCA”), and Open Bank became its sole subsidiary. OP Bancorp is regulated by the Board of Governors of the Federal Reserve (“Federal Reserve”). Open Bank is regulated by the California Department of Business Oversight (“DBO”), as its primary state regulator, and the Federal Deposit Insurance Corporation (“FDIC”), as its primary federal regulator.
From our founding date through the2008-2009 financial crisis and prior to our new management team joining us in 2010, we had experienced lagging profitability, deficient credit quality and below “well capitalized” capital levels. Our management team worked through our credit quality issues bringing our nonperforming assets (“NPA”) as a percentage of total gross loans and other real estate owned (“OREO”) ratio down from its peak of 9.60% at September 30, 2009 to 0.14% as of December 31, 2017. Profitability has increased year over year for the past five years as described above. We raised $11.1 million of capital ($10.9 million net of expenses) in 2010 and 2011 from directors and accredited investors, and an additional $30.0 million ($28.3 million net of expenses) in 2014 from institutional and accredited investors through the issuance of common stock in private placement transactions. We have been “well capitalized” for bank regulatory purposes since 2010.
Our Strategies
Our vision is to be the leading Korean-American community-based commercial bank in the Korean-American communities we serve, to meet the financial needs of underserved small andmedium-sized business and individuals, and to give back to these communities.
Our more specific strategic initiatives are discussed below.
| • | Leverage our Franchise in theKorean-American Communities We Serve. The Korean-American banking landscape has seen increased consolidation of the larger Korean-American financial institutions that do business in our market areas. We believe that the customers at these larger institutions will look for an alternative banking experience that is tailored towards their specific financial objectives and we strive to be the most prominent alternative to the largerKorean-American financial institutions. We differentiate ourselves from our competitors by developing meaningful and personal relationships with our customers, combined with a superior level of service to make Open Bank an attractive choice for small tomedium-sized businesses, professionals and individuals. Our strong financial performance and growth derives in part for the desire by small andmedium-sized businesses and individuals for quality personal relationship banking, local and responsive decision making and flexible and competitive pricing of deposit |
3
Table of Contents
and loan products. Our commitment to the Open Stewardship Foundation raises our profile and reinforces our position as a community partner committed to the success of the communities we serve. We convey to our customers that banking with us provides them with an indirect opportunity to contribute to the community. In addition, we have invested in developing a distinct corporate culture guided by a core set of values. These values underlie everything we do, including the way we engage with customers, collaborate with colleagues, do business and manage our resources. We believe our commitment to our communities, culture and quality of our people have been catalysts of our success and will continue to propel our future. |
| • | Focus on Organic Growth. We intend to grow organically and believe the markets in which we operate currently provide meaningful opportunities to expand our commercial customer base and increase our market share. We believe that our overall capabilities, culture and opportunities for career growth will allow us to continue to attract talented and entrepreneurial commercial and retail bankers from larger Korean-American financial institutions. Our bankers have further capacity to penetrate the markets and communities they serve and drive loan and deposit growth as our brand awareness continues to grow. We also seek to offer our various banking products, including our deposit products, residential loan products and cash management services to our commercial loan and SBA borrowers, which we believe provides a basis for expanding our banking relationships. We believe we have built a scalable platform that will support our continual organic growth. Although we are currently focused on organic growth, we will also look for opportunistic strategic acquisitions that complement our commercial banking and the strong personal community-based relationship orientation of our franchise. |
| • | Increase our Share of Lower-Cost Deposits. We believe the quality of our deposit base and access to stable funding are key components of our success. We have a strong deposit base characterized by a high level of core deposits, high proportion ofnon-interest bearing accounts and relatively low funding costs. As of December 31, 2017, deposits accounted for 95.5% of our total liabilities. Core deposits, which we define as all deposits excluding time deposits exceeding $250,000, constituted 85.9% of our total deposits. We increased ournon-interest bearing deposits as a percentage of total deposits from 31.6% as of December 31, 2012 to 37.4% as of December 31, 2017. Our cost of total deposits was 0.62% for the year ended December 31, 2017. We employ conventional marketing initiatives and advertising and leverage our community commitment activities to generate new accounts. Deposit rates and terms are based primarily on current operating strategies and market interest rates, liquidity requirements and our deposit growth goals. Our bankers offer a full suite of products and services to our loan customers, with a specific focus on acquiring and maintaining core deposits as we depend on them to fund the majority of our loans. Small businesses are a significant source of low cost deposits and represent opportunities for future growth. We believe that small business owners value our ability to provide convenience and access to local, responsive decision makers. Commercial accounts also generally have higher deposit balances and transaction volumes than individual deposit accounts. As of December 31, 2017, commercial deposits represented 45% of our total deposits. We take specific initiatives to establish banking relationships with our SBA borrowers with the goal of securing their future banking business as they continue to grow their businesses. We typically require, depending on the circumstances and the type of relationship, our borrowers to maintain deposit accounts as a condition of granting loans. We believe that our convenient branch network, personal relationship-driven culture, diversified product offering, and flexible pricing allow us to accelerate deposit growth. We plan to continue investing in our franchise brand, our community reputation, employees, and product capabilities to further improve customer loyalty with a view toward growing our high quality deposit portfolio. |
| • | Branch Expansion. We intend to continue our strategy of opening and developing de novo branches particularly into Korean-American populated areas. We have pursued this growth strategy since the beginning of 2012 when we only had one branch location. As of December 31, 2017, we had seven branches in the greater Los Angeles and Orange County areas and anticipate opening an eighth branch in the first quarter of 2018 in Santa Clara, California. We will review future potential target areas for de novo expansion based on our ability to attract experienced bankers within such targeted regions. In addition, we currently operate three loan production offices located in Atlanta, Georgia, Dallas, Texas and Seattle, |
4
Table of Contents
Washington. We will continue to look for additional markets to expand our loan production capabilities and, if we believe there are opportunities to develop deposit business in these markets, we may expand one or more loan production offices into de novo branches. |
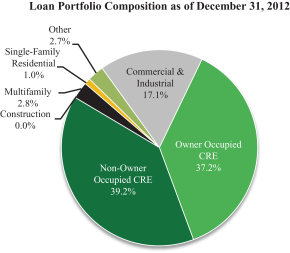
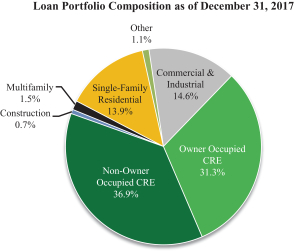
| • | Expand and Diversify our Commercial Lending. We are committed to continuing to expand and continuing to grow our commercial loan portfolios while maintaining what we believe are conservative underwriting standards. We focus our commercial lending to small andmedium-sized businesses in our market areas. Since 2012, our commercial loan portfolio has grown from $148.2 million at December 31, 2012 to $640.0 million at December 31, 2017, representing 85.6% of our total loans as of December 31, 2017. We expect to expand our commercial lending business in our expanding branch network, where we can continue to leverage our ability to develop personal community-based relationships and leverage our quality service model into new opportunities. We believe we can leverage our personalized customer service, extensive knowledge of our local markets and high visibility community activities to attract and retain customers seeking alternatives to the larger Korean-American financial institutions. We are also focused on diversifying our loan portfolio. As of December 31, 2017, total CRE loans had declined to 70.4% of our loan portfolio from 79.2% at December 31, 2012. |
 |  |
| • | Preserve Our Asset Quality Through Disciplined Lending Practices. Our approach to credit management uses well-defined policies and procedures, disciplined underwriting criteria and ongoing risk management. This approach has allowed us to maintain loan growth with a diversified portfolio of high quality assets. We believe our credit culture supports accountable bankers, who maintain an ability to expand our customer base as well as make sound decisions for our company. As of December 31, 2017, our ratio of nonperforming assets to total assets was 0.12% and our ratio of nonperforming loans to total loans was 0.14%. However, as a result of the organic growth of our loan portfolio over the past five years, a large portion of our loans and lending relationships are of relatively recent origin and the current level of delinquencies and defaults may not represent the level that may prevail as the portfolio becomes more seasoned. |
| • | Leverage Public Company Status. In addition to raising capital to support our growth as further discussed under “Use of Proceeds,” we believe becoming a public reporting company, while increasing our operating costs, will provide us with additional options and better pricing to manage our cost of capital that were previously unavailable to us when our shares were quoted on the OTCQB Market. While we have not historically engaged in any merger and acquisition activity, the ability to issue publicly-traded stock as consideration may enable us to opportunistically approach potential transactions. In addition, we believe the additional liquidity provided by being listed on the Nasdaq Global Market and being a public reporting company will enhance the equity component of our compensation programs, which will enable us to better incent and retain key employees in the competitive markets in which we operate. |
5
Table of Contents
Our Competitive Strengths
Our management team has identified the following competitive strengths that we believe will allow us to continue to achieve our principal objective of increasing shareholder value and generating consistent earnings growth through the organic and strategic expansion of our commercial banking franchise:
| • | Experienced Leadership and Management Team. Our experienced executive management team and senior leaders have exhibited the ability to strengthen shareholder value by consistently growing profitably. Our Chief Executive Officer was previously the chief executive officer of a multi-billion dollar bank holding company and bank focused on the Korean-American community. The members of our executive management team have, on average, more than 30 years’ experience working for large, billion-dollar-plus financial institutions in our markets during various economic cycles. They have been with Open Bank for an average of seven years, and substantially all have known and worked with our Chief Executive Officer prior to joining Open Bank. Our executive management team has instilled a transparent and entrepreneurial culture that rewards leadership, innovation, and problem solving. Our annual compensation plan is designed to provide employees with the incentive to perform at a consistently high level and provide financial rewards for performance that meets or exceeds defined financial, strategic-related, risk-mitigating targets and individual expectations on a consistent basis. |
| • | Personal Relationship-Based Customer Service. We strive to differentiate ourselves from our competition by providing the best “relationship-based” services to small- andmedium-sized businesses and their owners and residents in our Korean-American communities. We accomplish this by striving to provide our customers with a superior level of personal and responsive service delivered by experienced bankers in a manner that timely meets our customers’ financial objectives. Our management team’s significant banking and lending experience in our markets has provided us with an understanding of the commercial banking needs of our customers, which allows us to tailor our products and services to meet our customers’ financial objectives. We believe we have also been successful in attracting customers from larger Korean-American financial institutions because of our flexible and responsive approach in providing banking solutions while maintaining disciplined underwriting standards. To enhance our relationships with our customers and to identify and meet their particular needs, each customer is assigned a relationship officer (including our SBA borrowers). Approximately 56% of our borrowers also have a deposit relationship with us, providing us with visibility into their liquidity profile and contributing to our ability to manage our asset quality. We instill in our employees the importance of delivering outstanding customer service and seeking opportunities to strengthen relationships with both customers and the communities we serve. |
| • | Strong Community Relationships. A primary mission of Open Bank is to meet the financial services needs of underserved customers in our markets, and we strive to distinguish ourselves by giving back to these communities. In October 2011, we established the Open Stewardship Foundation to actively support local civic organizations, schools, and public services. We have committed to fund the Foundation in an amount equal to 10% of our annual consolidated net income after taxes. This commitment is in the Bank’s bylaws and our annual operating budget each year. We believe that our community commitment distinguishes us from our competitors and enhances and expands business relationships within the Korean-American communities we serve. Since inception, we have donated over $2.9 million to the Foundation, aiding over 120 localnon-profits. Our President and Chief Executive Officer and our Chairman of the Board are among those who serve on the Foundation’s board of directors, enabling the Foundation to focus its awards in a manner that best comports with our overall community and business goals. Additionally, our management team has strong ties and relationships within the Korean-American communities where we operate. The Foundation and our employees and board of directors are involved in community activities that enhance our relationships with a variety of industry leadership groups, including the Korean-American Federation of Los Angeles, the Korean-American Chamber of Commerce of Los Angeles, the Korean-American Manufacturers Association, the Korean-American CPA Society of Southern California, California KAGRO |
6
Table of Contents
Association, and the Korean Real Estate Brokers Association of Southern California. Affiliation with these local organizations provide our management team with knowledge of local markets and industries, as well as market developments that may impact the evolving business environment in which we operate. |
| • | Strong Credit Quality. We have implemented policies and procedures for credit underwriting and administration which have enabled us to maintain strong asset quality while at the same time growing our banking business. As of December 31, 2017, our NPAs as a percentage of total gross loans and OREO was 0.14%. |
| • | Strong Risk Management Practices. We place significant emphasis on risk management as an integral component of our organizational culture without sacrificing growth. We believe our comprehensive risk management system is designed to ensure that we have sound policies, procedures, and practices for the management of key risks under our risk framework (which includes market, operational, liquidity, interest rate sensitivity, credit, regulatory, legal and reputational risk) and that any exceptions to written policy are reported by senior management to our board of directors or audit committee. Our risk management practices are overseen by the chairman of our audit committee and the chairman of Open Bank’s risk and compliance committees, who have more than 20 years of combined banking experience, and our chief risk officer, who has more than 35 years of banking experience. We believe that our enterprise risk management philosophy has been important in gaining and maintaining the confidence of our various constituencies and growing our business and footprint within our markets. We also believe our strong risk management practices are manifested in our asset quality metrics. |
| • | Efficient and Scalable Platform with Capacity to Support Our Growth. Our management team has built an efficient and scalable corporate infrastructure within our commercial banking franchise, including the areas of banking processes, technology, data processing, underwriting and risk management, which we believe will support our continued growth. For example, during 2016 we introduced enhanced enterprise risk software and cybersecurity monitoring software to strengthen our operations and risk culture. While expanding our infrastructure, several departmental functions have been outsourced to gain the experience of outside professionals while at the same time achieving more favorable economics and cost-effective solutions. Such outsourced areas include the internal audit function, investment securities management, select loan review, interest rate risk management and stress testing. This outsourcing strategy is designed to control costs while adding enhanced controls and/or service levels. We believe that our scalable infrastructure will continue to allow us to efficiently and effectively manage our anticipated growth. |
Market Area
We are headquartered in Los Angeles, California. We currently have one branch in the financial district of downtown Los Angeles and, directly adjacent to downtown Los Angeles, we have one branch in the fashion district and three branches in Koreatown. In addition, we operate a branch in Gardena, California and a branch in Buena Park, in Orange County, California. These branches are located in the Los Angeles-Long Beach-Anaheim, California Metropolitan Statistical Area, or MSA. With over 13 million residents, it is the largest MSA in California, the second largest MSA in the United States, and one of the most significant business markets in the world. It is estimated that the greater Los Angeles area has a gross domestic product of approximately $1 trillion, which would rank it as the 16th largest economy in the world. The economic base of the area is heavily dependent on small- andmedium-sized businesses, providing us with a market rich in potential customers. According to the U.S. Census Bureau, Asian-Americans accounted for 15.1% of the over 10.1 million residents in Los Angeles County as of July 1, 2016.
We anticipate opening a branch in Santa Clara, California in the first quarter of 2018.
We also operate loan production offices in Atlanta, Georgia, Dallas, Texas and Seattle, Washington to support our SBA lending efforts.
7
Table of Contents
Our Competition
In our primary markets in Southern California, we view the Korean-American direct banking market, including Open Bank, as comprised of nine banks divided into three segments: large publicly-traded banks (two banks), locally-owned banks (five banks), and banks that are subsidiaries of Korean banks (two banks). In addition to Open Bank, all of the locally-owned banks are based in California. As of December 31, 2017, we are the seventh-largest bank among this group of nine banks based on total assets.
The table below provides more details on the Korean-American banking landscape as of December 31, 2017.
(Dollars in millions) Institution Name | Headquarters | U.S. Offices | Total Assets | Total Loans | Total Deposits | Total Equity(1) | ||||||||||||||||
Large Publicly-Traded Korean-American Banks | ||||||||||||||||||||||
Hope Bancorp, Inc. | Los Angeles, CA | 63 | 14,207 | 11,132 | 10,847 | 1,928 | ||||||||||||||||
Hanmi Financial Corporation | Los Angeles, CA | 40 | 5,210 | 4,311 | 4,349 | 562 | ||||||||||||||||
Locally-Owned Korean-American Banks | ||||||||||||||||||||||
Pacific City Financial Corporation | Los Angeles, CA | 13 | 1,442 | 1,195 | 1,251 | 142 | ||||||||||||||||
MetroCity Bankshares, Inc. | Doraville, GA | 15 | 1,292 | 1,103 | 1,027 | 132 | ||||||||||||||||
CBB Bancorp, Inc. | Los Angeles, CA | 8 | 1,079 | 816 | 896 | 115 | ||||||||||||||||
OP Bancorp(2) | Los Angeles, CA | 8 | 901 | 764 | 773 | 91 | ||||||||||||||||
First IC Corporation | Doraville, GA | 7 | 404 | 323 | 337 | 63 | ||||||||||||||||
Noah Bank | Elkins Park, PA | 5 | 381 | 327 | 326 | 43 | ||||||||||||||||
NewBank | Flushing, NY | 5 | 349 | 214 | 297 | 44 | ||||||||||||||||
NOA Bancorp, Inc. | Duluth, GA | 5 | 327 | 240 | 273 | 42 | ||||||||||||||||
US Metro Bank | Garden Grove, CA | 4 | 325 | 218 | 269 | 49 | ||||||||||||||||
Uniti Financial Corporation | Buena Park, CA | 3 | 320 | 250 | 278 | 44 | ||||||||||||||||
U&I Financial Corp. | Lynnwood, WA | 4 | 274 | 181 | 231 | 39 | ||||||||||||||||
Ohana Pacific Bank | Honolulu, HI | 2 | 144 | 118 | 127 | 17 | ||||||||||||||||
Korean Bank Subsidiaries in the U.S. | ||||||||||||||||||||||
Woori America Bank | New York, NY | 19 | 1,817 | 1,426 | 1,544 | 249 | ||||||||||||||||
Shinhan Bank America | New York, NY | 16 | 1,337 | 1,223 | 1,167 | 162 | ||||||||||||||||
KEB Hana Bank USA, N.A. | Fort Lee, NJ | 3 | 209 | 132 | 161 | 46 | ||||||||||||||||
Source: S&P Global Market Intelligence. GAAP data when available, otherwise FR Y-9C’s and bank call reports.
| (1) | Total equity includes minority interest. |
| (2) | U.S. Offices is pro forma pending opening of the Santa Clara office in the first quarter of 2018, and does not include loan production offices. |
In addition to these Korean-American banks, we also compete with other banks in our market areas, particularly with Chinese-American banks. In certain geographic markets where we currently operate, there is overlap between Chinese-American, Korean-American and other Asian-American banks for loan and deposit business. We aim to grow both organically and potentially through acquisitions in these markets.
8
Table of Contents
Risks Related to Our Company and an Investment in Our Common Stock
An investment in our common stock involves substantial risks and uncertainties. Investors should carefully consider all of the information in this prospectus, including the detailed discussion of these and other risks under “Risk Factors” beginning on page 13, prior to investing in our common stock. Some of the more significant risks include the following:
| • | a decline in general business and economic conditions, and any regulatory responses to such conditions, could have a material adverse effect on us; |
| • | fluctuations in interest rates may reduce net interest income and otherwise negatively impact our financial condition and results of operations; |
| • | liquidity risks could affect operations and jeopardize our business, financial condition, and results of operations; |
| • | if we do not effectively manage our credit risk, we may experience increased levels of delinquencies, nonperforming loans and charge-offs, which could require increases in our provision for loan losses; |
| • | we could recognize losses on securities held in our securities portfolio, particularly if interest rates increase or economic and market conditions deteriorate; |
| • | our allowance for loan losses may prove to be insufficient to absorb potential losses in our loan portfolio; |
| • | we are subject to extensive state and federal financial regulation, and compliance with changing requirements may restrict our activities or have an adverse effect on our results of operations; |
| • | a significant portion of our loan portfolio is comprised of real estate loans, and negative changes in the economy affecting real estate values and liquidity could impair the value of collateral securing our real estate loans and result in loan and other losses; |
| • | the small andmedium-sized businesses that we lend to may have fewer resources to weather adverse business developments, which may impair a borrower’s ability to repay a loan, and such impairment could adversely affect our results of operations and financial condition; |
| • | we must effectively manage our branch growth strategy; |
| • | our ability to expand our business or make strategic acquisitions outside of California may be limited by our coexistence agreement that restricts our use of the name “Open Bank”; |
| • | system failure or breaches of our network security could subject us to increased operating costs as well as litigation and other liabilities; |
| • | severe weather, natural disasters, acts of war or terrorism and other external events could significantly impact our business; and |
| • | we are highly dependent on our management team, and the loss of our senior executive officers or other key employees could harm our ability to implement our strategic plan, impair our relationships with customers and adversely affect our business, results of operations and growth prospects. |
Corporate Information
Our principal executive office is located at 1000 Wilshire Boulevard, Suite 500, Los Angeles, California 90017, telephone number: (213)892-9999. Our website address is www.myopenbank.com. The information contained on our website is not part of, or incorporated by reference into, this prospectus.
9
Table of Contents
The Offering
Common stock offered by us | 2,000,000 shares. | |
Underwriters’ overallotment option | 300,000 shares. | |
Common stock outstanding after completion of this offering | 15,190,527 shares (or 15,490,527 shares if the underwriters exercise their overallotment option in full). | |
Use of proceeds | We estimate that the net proceeds to us from this offering, after deducting underwriting discounts and estimated offering expenses, will be approximately $19.6 million (or approximately $22.6 million if the underwriters exercise their option to purchase 300,000 additional shares in full). We intend to use the net proceeds from this offering to support our organic growth and other general corporate purposes, which could include opportunistic strategic acquisitions. However, as of the date of this prospectus, we do not have any immediate plans, arrangements or understandings relating to any material acquisition. See “Use of Proceeds.” | |
Dividends | We have not paid dividends to holders of common stock since our inception and have no present intention to commence the payment of dividends in the future. Any future determination by our board of directors to pay dividends to holders of our common stock will depend on our results of operations, financial condition, capital requirements, regulatory restrictions and any other factors that our board of directors may deem relevant. See “Dividend Policy.” | |
Directed Share Program | At our request, the underwriters have reserved for sale, at the initial public offering price, 100,000 shares offered by this prospectus for sale to the directors, officers and employees of OP Bancorp and Open Bank. If these persons purchase reserved shares, it will reduce the number of shares available for sale to the general public. Any reserved shares that are not so purchased will be offered by the underwriters to the general public on the same terms as the other shares offered by this prospectus. | |
Risk Factors | Investing in shares of our common stock involves a high degree of risk. See “Risk Factors,” beginning on page 13, for a discussion of certain factors you should consider carefully before deciding to invest. | |
10
Table of Contents
Nasdaq symbol | We have received approval to list our common stock for trading on the Nasdaq Global Market under the trading symbol “OPBK”. | |
Unless otherwise indicated, all information in this prospectus relating to the number of shares of common stock to be outstanding immediately after the completion of this offering is based on 13,190,527 shares outstanding as of December 31, 2017 and:
| • | excludes 1,130,000 shares of common stock issuable upon exercise of stock options outstanding at December 31, 2017 at a weighted average exercise price of $4.15 per share; |
| • | excludes 218,605 shares of common stock reserved at December 31, 2017 available for future awards under our 2010 Equity Incentive Plan; and |
| • | assumes the underwriters do not exercise their overallotment option to purchase up to 300,000 additional shares from us. |
SUMMARY HISTORICAL CONSOLIDATED FINANCIAL AND OPERATING INFORMATION
The following table sets forth summary historical consolidated financial data as of the dates and for the periods shown. The summary balance sheet data as of December 31, 2017 and 2016 and the summary income statement data for the years ended December 31, 2017, 2016 and 2015 have been derived from our audited consolidated financial statements included elsewhere in this prospectus. The summary balance sheet data as of December 31, 2015 has been derived from our audited consolidated financial statements that are not included in this prospectus.
11
Table of Contents
You should read the following financial data in conjunction with the other information contained in this prospectus, including under “Management’s Discussion and Analysis of Financial Condition and Results of Operations” and in the financial statements and related notes included elsewhere in this prospectus.
| As of or for the year ended December 31, | ||||||||||||
| 2017 | 2016 | 2015 | ||||||||||
| (dollars in thousands, except per share data) | ||||||||||||
Income Statement Data: | ||||||||||||
Interest income | $ | 40,283 | $ | 31,701 | $ | 25,192 | ||||||
Interest expense | 4,573 | 3,371 | 2,689 | |||||||||
Net interest income | 35,710 | 28,330 | 22,503 | |||||||||
Provision for loan losses | 1,311 | 1,682 | 553 | |||||||||
Non-interest income | 8,986 | 9,007 | 7,978 | |||||||||
Non-interest expense | 26,257 | 23,334 | 19,795 | |||||||||
Income before taxes | 17,128 | 12,320 | 10,133 | |||||||||
Provision for income taxes | 7,892 | 4,894 | 4,170 | |||||||||
Net income | 9,236 | 7,425 | 5,963 | |||||||||
Per Share Data: | ||||||||||||
Basic income per share | $ | 0.68 | $ | 0.55 | $ | 0.44 | ||||||
Diluted income per share | $ | 0.66 | $ | 0.53 | $ | 0.43 | ||||||
Book value (at period end) | $ | 6.94 | $ | 6.30 | $ | 5.71 | ||||||
Shares of common stock outstanding | 13,190,527 | 12,896,548 | 12,682,510 | |||||||||
Weighted average diluted shares | 13,485,791 | 13,158,155 | 12,944,867 | |||||||||
Balance Sheet Data: | ||||||||||||
Loans held for investment | $ | 748,024 | $ | 674,227 | $ | 507,286 | ||||||
Loans held for sale | 15,739 | 1,646 | 5,579 | |||||||||
Allowance for loan losses | 9,139 | 7,910 | 6,390 | |||||||||
Total assets | 900,999 | 761,250 | 617,350 | |||||||||
Deposits | 773,306 | 661,784 | 519,721 | |||||||||
Shareholders’ equity | 91,480 | 81,284 | 72,479 | |||||||||
Performance Ratios: | ||||||||||||
Return on average assets | 1.13 | % | 1.08 | % | 1.05 | % | ||||||
Return on average equity | 10.63 | 9.69 | 8.63 | |||||||||
Yield on total loans | 5.48 | 5.20 | 5.18 | |||||||||
Yield on average earning assets | 5.20 | 4.85 | 4.70 | |||||||||
Cost of average interest bearing liabilities | 0.97 | 0.83 | 0.79 | |||||||||
Cost of deposits | 0.62 | 0.56 | 0.55 | |||||||||
Net interest margin | 4.61 | 4.34 | 4.20 | |||||||||
Efficiency ratio (1) | 58.74 | 62.50 | 64.94 | |||||||||
Asset Quality Data (at Period End): | ||||||||||||
Net charge-offs to average loans held for investment | 0.01 | % | 0.03 | % | (0.02 | )% | ||||||
Nonperforming assets to loans held for investment plus OREO | 0.14 | 0.09 | 0.20 | |||||||||
ALL to nonperforming loans | 881.29 | 1,373.26 | 615.01 | |||||||||
ALL to loans held for investment | 1.22 | 1.17 | 1.26 | |||||||||
Balance Sheet and Capital Ratios: | ||||||||||||
Loans held for investment to deposits | 96.73 | % | 101.88 | % | 97.61 | % | ||||||
Noninterest bearing deposits to deposits | 37.43 | 37.38 | 29.85 | |||||||||
Tangible common equity to tangible assets (2) | 10.15 | 10.70 | 11.74 | |||||||||
Average equity to average total assets | 10.59 | 11.18 | 12.20 | |||||||||
Leverage ratio | 10.46 | 10.89 | 11.70 | |||||||||
Common equity tier 1 ratio | 12.26 | 12.20 | 14.28 | |||||||||
Tier 1 risk-based capital ratio | 12.26 | 12.20 | 14.28 | |||||||||
Total risk-based capital ratio | 13.49 | 13.40 | 15.53 | |||||||||
Non-owner occupied CRE to total risk-based capital | 296.69 | 293.56 | 233.83 | |||||||||
| (1) | Representsnon-interest expense divided by the sum of net interest income plusnon-interest income. |
| (2) | Represents anon-GAAP financial measure. See “GAAP Reconciliation and Management Explanation ofNon-GAAP Financial Measures” for a reconciliation of ournon-GAAP measure to the most comparable financial measure. |
12
Table of Contents
Investing in our common stock involves a high degree of risk. Before you decide to invest, you should carefully consider the risks described below, together with all other information included in this prospectus. We believe the risks described below are the risks that are material to us. Any of the following risks, as well as risks that we do not know or currently deem immaterial, could have a material adverse effect on our business, financial condition, results of operations and growth prospects. In that case, you could experience a partial or complete loss of your investment.
Risks Related to Our Business
A decline in general business and economic conditions and any regulatory responses to such conditions could have a material adverse effect on our business, financial position, results of operations and growth prospects.
Our business and operations are sensitive to general business and economic conditions in the United States, generally, and particularly the state of California and the Los Angeles-Long Beach-Anaheim, California MSA. Unfavorable or uncertain economic and market conditions could lead to credit quality concerns related to borrower repayment ability and collateral protection as well as reduced demand for the products and services we offer. In recent years, there has been a gradual improvement in the U.S. economy as evidenced by a rebound in the housing market, lower unemployment and higher valuations in the equities markets. However, economic growth has been uneven, and opinions vary on the strength and direction of the economy. Uncertainties also have arisen regarding the potential for a reversal or renegotiation of international trade agreements under the administration of U.S. President Donald J. Trump, and the impact such actions and other policies of the new administration may have on economic and market conditions. In addition, concerns about the performance of international economies, especially in Europe and emerging markets, and economic conditions in Asia, particularly the economies of China, South Korea and Japan, can impact the economy and financial markets here in the United States. If the national, regional and local economies experience worsening economic conditions, including high levels of unemployment, our growth and profitability could be constrained. Weak economic conditions are characterized by, among other indicators, deflation, elevated levels of unemployment, fluctuations in debt and equity capital markets, increased delinquencies on mortgage, commercial and consumer loans, residential and commercial real estate price declines, and lower home sales and commercial activity. All of these factors are generally detrimental to our business. Our business is significantly affected by monetary and other regulatory policies of the U.S. federal government, its agencies and government-sponsored entities. Changes in any of these policies are influenced by macroeconomic conditions and other factors that are beyond our control, are difficult to predict and could have a material adverse effect on our business, financial position, results of operations and growth prospects.
Fluctuations in interest rates may reduce net interest income and otherwise negatively impact our financial condition and results of operations.
Shifts in short-term interest rates may reduce net interest income, which is the principal component of our earnings. Net interest income is the difference between the amounts received by us on our interest-earning assets and the interest paid by us on our interest-bearing liabilities. When interest rates rise, the rate of interest we receive on our assets, such as loans, rises more quickly than the rate of interest that we pay on our interest-bearing liabilities, such as deposits, which may cause our profits to increase. When interest rates decrease, the rate of interest we receive on our assets, such as loans, declines more quickly than the rate of interest that we pay on our interest-bearing liabilities, such as deposits, which may cause our profits to decrease. The impact on earnings is more adverse when the slope of the yield curve flattens, that is, when short-term interest rates increase more than long-term interest rates or when long-term interest rates decrease more than short-term interest rates.
Changes in interest rates could influence our ability to originate loans and deposits. Historically, there has been an inverse correlation between the demand for loans and interest rates. Loan origination volume usually declines
13
Table of Contents
during periods of rising or high interest rates and increases during periods of declining or low interest rates. For example, mortgage production historically, including refinancing activity, declines in rising interest rate environments. Changes in interest rates also have a significant impact on the carrying value of certain of our assets, including loans, real estate and investment securities, on our balance sheet.
Interest rate increases often result in larger payment requirements for our borrowers, which increases the potential for default. At the same time, the marketability of any underlying property that serves as collateral for such loans may be adversely affected by any reduced demand resulting from higher interest rates.
Changes in interest rates can also affect the level of loan refinancing activity, which impacts the amount of prepayment penalty income we receive on loans we hold. Because prepayment penalties are recorded as interest income when received, the extent to which they increase or decrease during any given period could have a significant impact on the level of net interest income and net income we generate during that time. A decrease in our prepayment penalty income resulting from any change in interest rates or as a result of regulatory limitations on our ability to charge prepayment penalties could therefore adversely affect our net interest income, net income or results of operations.
An increase in interest rates that adversely affects the ability of borrowers to pay the principal or interest on loans may lead to an increase in nonperforming assets and a reduction of income recognized, which could have a material adverse effect on our results of operations and cash flows. Further, when we place a loan on nonaccrual status, we reverse any accrued but unpaid interest receivable, which decreases interest income. Subsequently, we continue to have a cost to fund the loan, which is reflected as interest expense, without any interest income to offset the associated funding expense. Thus, an increase in the amount of nonperforming assets would have an adverse impact on net interest income.
Changes in interest rates also can affect the value of loans, securities and other assets. Rising interest rates will result in a decline in value of the fixed-rate debt securities we hold in our investment securities portfolio. The unrealized losses resulting from holding these securities would be recognized in accumulated other comprehensive income and reduce total shareholders’ equity. Unrealized losses do not negatively impact our regulatory capital ratios. However, tangible common equity and the associated ratios would be reduced. If debt securities in an unrealized loss position are sold, such losses become realized and will reduce our regulatory capital ratios.
If short-term interest rates remain at their historically low levels for a prolonged period, and if longer term interest rates fall, we could experience net interest margin compression as our interest earning assets would continue to reprice downward while our interest-bearing liability rates could fail to decline in tandem. This would have a material adverse effect on our net interest income and our results of operations.
We could recognize losses on securities held in our securities portfolio, particularly if interest rates increase or economic and market conditions deteriorate.
Factors beyond our control can significantly influence the fair value of securities in our portfolio and can cause potential adverse changes to the fair value of these securities. For example, fixed-rate securities acquired by us are generally subject to decreases in market value when interest rates rise. Additional factors include, but are not limited to, rating agency downgrades of the securities or our own analysis of the value of the security, defaults by the issuer or individual mortgagors with respect to the underlying securities, or instability in the credit markets. Any of the foregoing factors could cause other-than-temporary impairment in future periods and result in realized losses. The process for determining whether impairment is other-than-temporary usually requires difficult, subjective judgments about the future financial performance of the issuer and any collateral underlying the security in order to assess the probability of receiving all contractual principal and interest payments on the security. Because of changing economic and market conditions affecting interest rates, the financial condition of
14
Table of Contents
issuers of the securities and the performance of the underlying collateral, we may recognize realized and/or unrealized losses in future periods, which could have an adverse effect on our financial condition and results of operations.
Liquidity risks could affect operations and jeopardize our business, financial condition, and results of operations.
Liquidity is essential to our business. An inability to raise funds through deposits, borrowings, the sale of loans and/or investment securities and through other sources could have a substantial negative effect on our liquidity. Our most important source of funds consists of our customer deposits. Such deposit balances can decrease when customers perceive alternative investments, such as the stock market, as providing a better risk/return tradeoff. If customers move money out of bank deposits and into other investments, we could lose a relatively low cost source of funds, which would require us to seek wholesale funding alternatives in order to continue to grow, thereby increasing our funding costs and reducing our net interest income and net income.
Other primary sources of funds consist of cash from operations, investment maturities and sales, sale of loans and proceeds from the issuance and sale of our equity securities to investors. Additional liquidity is provided by our ability to borrow from the Federal Reserve Bank of San Francisco and the Federal Home Loan Bank of San Francisco. We also may borrow from third-party lenders from time to time. Our access to funding sources in amounts adequate to finance or capitalize our activities or on terms that are acceptable to us could be impaired by factors that affect us directly or the financial services industry or economy in general, such as disruptions in the financial markets or negative views and expectations about the prospects for the financial services industry.
Any decline in available funding could adversely impact our ability to continue to implement our strategic plan, including our ability to originate loans, invest in securities, meet our expenses, or to fulfill obligations such as repaying our borrowings or meeting deposit withdrawal demands, any of which could have a material adverse impact on our liquidity, business, financial condition and results of operations.
Our business depends on our ability to successfully manage credit risk.
The operation of our business requires us to manage credit risk. As a lender, we are exposed to the risk that our borrowers will be unable to repay their loans according to their terms, and that the collateral securing repayment of their loans, if any, may not be sufficient to ensure repayment. In addition, there are risks inherent in making any loan, including risks with respect to the period of time over which the loan may be repaid, risks relating to proper loan underwriting, risks resulting from changes in economic and industry conditions and risks inherent in dealing with individual borrowers. In order to successfully manage credit risk, we must, among other things, maintain disciplined and prudent underwriting standards and ensure that our bankers follow those standards. The weakening of these standards for any reason, such as an attempt to attract higher yielding loans, a lack of discipline or diligence by our employees in underwriting and monitoring loans, the inability of our employees to adequately adapt policies and procedures to changes in economic or any other conditions affecting borrowers and the quality of our loan portfolio, may result in loan defaults, foreclosures and additional charge-offs and may necessitate that we significantly increase our allowance for loan losses, each of which could adversely affect our net income. As a result, our inability to successfully manage credit risk could have a material adverse effect on our business, financial condition or results of operations.
An important feature of our credit risk management system is our use of an internal credit risk rating and control system through which we identify, measure, monitor and mitigate existing and emerging credit risk of our customers. As this process involves detailed analysis of the customer or credit risk, taking into account both quantitative and qualitative factors, it is subject to human error. In exercising their judgment, our employees may not always be able to assign an accurate credit rating to a customer or credit risk, which may result in our exposure to higher credit risks than indicated by our risk rating and control system. Although our management seeks to address possible credit risk proactively, it is possible that the credit risk rating and control system will not identify credit risk in our loan portfolio and that we may fail to manage credit risk effectively.
15
Table of Contents
Some of our tools and metrics for managing credit risk and other risks are based upon our use of observed historical market behavior and assumptions. We rely on quantitative models to measure risks and to estimate certain financial values. Models may be used in such processes as determining the pricing of various products, grading loans and extending credit, measuring interest rates and other market risks, predicting losses, assessing capital adequacy and calculating regulatory capital levels, as well as estimating the value of financial instruments and balance sheet items. Poorly designed or implemented models present the risk that our business decisions based on information incorporating such models will be adversely affected due to the inadequacy of that information. Moreover, our models may fail to predict future risk exposures if the information used in the model is incorrect, obsolete or not sufficiently comparable to actual events as they occur, or if our model assumptions prove incorrect. We seek to incorporate appropriate historical data in our models, but the range of market values and behaviors reflected in any period of historical data is not at all times predictive of future developments in any particular period and the period of data we incorporate into our models may turn out to be inappropriate for the future period being modeled. In such case, our ability to manage risk would be limited and our risk exposure and losses could be significantly greater than our models indicated.
Risks Related to Our Loans
Because a significant portion of our loan portfolio is comprised of real estate loans, negative changes in the economy affecting real estate values and liquidity could impair the value of collateral securing our real estate loans and result in loan and other losses.
At December 31, 2017, approximately 84% of our loan portfolio was comprised of loans with real estate as a primary or secondary component of collateral. As a result, adverse developments affecting real estate values in our market areas could increase the credit risk associated with our real estate loan portfolio. The market value of real estate can fluctuate significantly in a short period of time as a result of market conditions in the geographic area in which the real estate is located. Real estate values and real estate markets are generally affected by changes in national, regional or local economic conditions, the rate of unemployment, fluctuations in interest rates and the availability of loans to potential purchasers, changes in tax laws and other governmental statutes, regulations and policies and acts of nature, such as earthquakes and natural disasters. Adverse changes affecting real estate values and the liquidity of real estate in one or more of our markets could increase the credit risk associated with our loan portfolio, significantly impair the value of property pledged as collateral on loans and affect our ability to sell the collateral upon foreclosure without a loss or additional losses, which could result in losses that would adversely affect profitability. Such declines and losses would have a material adverse impact on our business, results of operations and growth prospects. In addition, if hazardous or toxic substances are found on properties pledged as collateral, the value of the real estate could be impaired. If we foreclose on and take title to such properties, we may be liable for remediation costs, as well as for personal injury and property damage. Environmental laws may require us to incur substantial expenses to address unknown liabilities and may materially reduce the affected property’s value or limit our ability to use or sell the affected property.
Many of our loans are to commercial borrowers, which have a higher degree of risk than other types of loans.
At December 31, 2017, we had $640.0 million of commercial loans, consisting of $420.8 million of commercial real estate loans, $106.9 million of SBA loans, and $103.7 million of commercial and industrial loans, including trade finance loans, for which real estate is not the primary source of collateral. Commercial loans represented 85.6% of our total loan portfolio at December 31, 2017. Commercial loans are often larger and involve greater risks than other types of lending. Because payments on such loans are often dependent on the successful operation or development of the property or business involved, repayment of such loans is often more sensitive than other types of loans to adverse conditions in the real estate market or the general business climate and economy. Accordingly, a downturn in the real estate market and a challenging business and economic environment may increase our risk related to commercial loans, particularly commercial real estate loans. Unlike home mortgage loans, which generally are made on the basis of the borrowers’ ability to make repayment from their employment and other income and which are secured by real property whose value tends to be more easily
16
Table of Contents
ascertainable, commercial loans typically are made on the basis of the borrowers’ ability to make repayment from the cash flow of the commercial venture. Our commercial and industrial loans are primarily made based on the identified cash flow of the borrower and secondarily on the collateral underlying the loans. Most often, collateral consists of accounts receivable, inventory and equipment. Inventory and equipment may depreciate over time, may be difficult to appraise and may fluctuate in value based on the success of the business. Accounts receivable may be uncollectable. If the cash flow from business operations is reduced, the borrower’s ability to repay the loan may be impaired. Due to the larger average size of each commercial loan as compared with other loans such as residential loans, as well as collateral that is generally less readily-marketable, losses incurred on a small number of commercial loans could have a material adverse impact on our financial condition and results of operations.
We have a concentration in commercial real estate lending which could cause our regulators to restrict our ability to grow.
As a part of their regulatory oversight, the Office of the Comptroller of the Currency, the Board of Governors of the Federal Reserve System and the Federal Deposit Insurance Corporation have issued the Commercial Real Estate (CRE) Concentration Guidance on sound risk management practices with respect to a financial institution’s concentrations in commercial real estate lending activities. These guidelines were issued in response to the agencies’ concerns that rising CRE concentrations might expose financial institutions to unanticipated earnings and capital volatility in the event of adverse changes in the commercial real estate market. Existing guidance reinforces and enhances existing regulations and guidelines for safe and sound real estate lending by providing supervisory criteria, including numerical indicators to assist in identifying institutions with potentially significant commercial real estate loan concentrations that may warrant greater supervisory scrutiny. The guidance does not limit banks’ commercial real estate lending, but rather guides institutions in developing risk management practices and levels of capital that are commensurate with the level and nature of their commercial real estate concentrations. The CRE Concentration Guidance identifies certain concentration levels that, if exceeded, will expose the institution to additional supervisory analysis with regard to the institution’s CRE concentration risk. The CRE Concentration Guidance is designed to promote appropriate levels of capital and sound loan and risk management practices for financial institutions with a concentration of CRE loans. In general, the CRE Concentration Guidance establishes the following supervisory criteria as preliminary indications of possible CRE concentration risk: (1) the institution’s total construction, land development and other land loans represent 100% or more of total risk-based capital; or (2) total CRE loans as defined in the regulatory guidelines represent 300% or more of total risk-based capital, and the institution’s CRE loan portfolio has increased by 50% or more during the prior36-month period. Pursuant to the CRE Concentration Guidelines, loans secured by owner occupied commercial real estate are not included for purposes of CRE Concentration calculation. We believe that the CRE Concentration Guidance is applicable to us. As of December 31, 2017, ournon-owner occupied CRE loans represented 296.7% of our total risk-based capital, as compared to 293.6% and 233.8% as of December 31, 2016 and 2015, respectively. Although we are actively working to manage our CRE concentration and believe that our underwriting policies, management information systems, independent credit administration process, and monitoring of real estate loan concentrations are currently sufficient to address the CRE Concentration Guidance, the FDIC or other federal regulators could become concerned about our CRE loan concentrations, and they could limit our ability to grow by, among other things, restricting their approvals for the establishment or acquisition of branches, or approvals of mergers or other acquisition opportunities.
Our single family residential loan product consists primarily ofnon-qualified single family home mortgage loans which may be considered less liquid and more risky.
As of December 31, 2017, our single family home mortgage loan portfolio amounted to $104.1 million or 13.9% of our total loan portfolio. As of December 31, 2017, all of our single family home mortgage loans werenon-qualified mortgage loans. We originated $42.1 million and $53.3 million ofnon-qualified single family home mortgage loans for the years ended December 31, 2017 and 2016, respectively. As of December 31, 2017, ournon-qualified single family home mortgage loans had an averageloan-to-value of 60%.
17
Table of Contents
Thenon-qualified single-family home mortgage loans that we originate are designed to assist Korean-Americans who have recently immigrated to the United States and those Korean-Americans without sufficient documentation to qualify for a traditional home mortgage loan and as such are willing to provide higher down payment amounts and pay higher interest rates and fees in return for reduced documentation requirements.Non-qualified single-family home mortgage loans are considered to have a higher degree of risk and are less liquid than qualified single-family home mortgage loans because non-qualified loans are not able to be securitized and can only be sold directly to other financial institutions. Qualified loans require a minimum of two years of tax returns for borrowers to demonstrate their ability to repay the loan and other standard documentation to qualify for securitization. For non-qualified loans we do not require the standard documentation required for qualified loans. For example, we will typically require only one year of tax returns and only pay-stub verification of employment. We attempt to address this enhanced risk through our underwriting process, including requiring larger down payments and, in some cases, interest reserves.
Our use of appraisals in deciding whether to make a loan on or secured by real property does not ensure the value of the real property collateral.
In considering whether to make a loan secured by real property we generally require an appraisal of the property. However, an appraisal is only an estimate of the value of the property at the time the appraisal is conducted, and an error in fact or judgment could adversely affect the reliability of an appraisal. In addition, events occurring after the initial appraisal may cause the value of the real estate to decrease. As a result of any of these factors the value of collateral securing a loan may be less than estimated, and if a default occurs we may not recover the outstanding balance of the loan.
The small andmedium-sized businesses that we lend to may have fewer resources to weather adverse business developments, which may impair a borrower’s ability to repay a loan, and such impairment could adversely affect our results of operations and financial condition.
We target our business development and marketing strategy primarily to serve the banking and financial services needs of small tomedium-sized businesses. These businesses generally have fewer financial resources in terms of capital or borrowing capacity than larger entities, frequently have smaller market shares than their competition, may be more vulnerable to economic downturns, often need substantial additional capital to expand or compete and may experience substantial volatility in operating results, any of which may impair a borrower’s ability to repay a loan. In addition, the success of a small andmedium-sized business often depends on the management talents and efforts of one or two people or a small group of people, and the death, disability or resignation of one or more of these people could have a material adverse impact on the business and its ability to repay its loan. If general economic conditions negatively impact the markets in which we operate and small tomedium-sized businesses are adversely affected or our borrowers are otherwise affected by adverse business developments, our business, financial condition and results of operations may be adversely affected.
We may suffer losses in our loan portfolio despite our underwriting practices.
We mitigate the risks inherent in our loan portfolio by adhering to sound and proven underwriting practices, managed by experienced and knowledgeable credit professionals. These practices include analysis of a borrower’s prior credit history, financial statements, tax returns, and cash flow projections, valuations of collateral based on reports of independent appraisers and verifications of liquid assets. Although we believe that our underwriting criteria is appropriate for the various kinds of loans we make, we may incur losses on loans that meet our underwriting criteria, and these losses may exceed the amounts set aside as reserves in our allowance for loan loss.
Lack of seasoning of our loan portfolio could increase risk of credit defaults in the future.
As a result of the organic growth of our loan portfolio over the past five years, a large portion of our loans and of our lending relationships are of relatively recent origin. In general, loans do not begin to show signs of credit deterioration or default until they have been outstanding for some period of time, a process referred to as “seasoning.” As a result, a portfolio of older loans will usually behave more predictably than a newer portfolio.
18
Table of Contents
Because a large portion of our portfolio is relatively new, the current level of delinquencies and defaults may not represent the level that may prevail as the portfolio becomes more seasoned. If delinquencies and defaults increase, we may be required to increase our provision for loan losses, which could materially and adversely affect our business, financial condition and results of operations. For information about the average age of our loans, see “Management’s Discussion and Analysis of Financial Condition and Results of Operations-Financial Condition-Non-Performing Loans”.
Risks Related to our SBA Loan Program
Small Business Administration lending is an important part of our business. Our SBA lending program is dependent upon the U.S. federal government, and we face specific risks associated with originating SBA loans.
Our SBA lending program is dependent upon the U.S. federal government. As an approved participant in the SBA Preferred Lender’s Program (an “SBA Preferred Lender”), we enable our clients to obtain SBA loans without being subject to the potentially lengthy SBA approval process necessary for lenders that are not SBA Preferred Lenders. The SBA periodically reviews the lending operations of participating lenders to assess, among other things, whether the lender exhibits prudent risk management. When weaknesses are identified, the SBA may request corrective actions or impose enforcement actions, including revocation of the lender’s SBA Preferred Lender status. If we lose our status as an SBA Preferred Lender, we may lose some or all of our customers to lenders who are SBA Preferred Lenders, and as a result we could experience a material adverse effect to our financial results. Any changes to the SBA program, including but not limited to changes to the level of guarantee provided by the federal government on SBA loans, changes to program specific rules impacting volume eligibility under the guaranty program, as well as changes to the program amounts authorized by Congress may also have a material adverse effect on our business. In addition, any default by the U.S. government on its obligations or any prolonged government shutdown could, among other things, impede our ability to originate SBA loans or sell such loans in the secondary market, which could materially and adversely affect our business, results of operations and financial condition.
The SBA’s 7(a) Loan Program is the SBA’s primary program for helpingstart-up and existing small businesses, with financing guaranteed for a variety of general business purposes. Generally, we sell the guaranteed portion of our SBA 7(a) loans in the secondary market. These sales result in premium income for us at the time of sale and create a stream of future servicing income, as we retain the servicing rights to these loans. For the reasons described above, we may not be able to continue originating these loans or sell them in the secondary market. Furthermore, even if we are able to continue to originate and sell SBA 7(a) loans in the secondary market, we might not continue to realize premiums upon the sale of the guaranteed portion of these loans or the premiums may decline due to economic and competitive factors. When we originate SBA loans, we incur credit risk on thenon-guaranteed portion of the loans, and if a customer defaults on a loan, we share any loss and recovery related to the loanpro-rata with the SBA. If the SBA establishes that a loss on an SBA guaranteed loan is attributable to significant technical deficiencies in the manner in which the loan was originated, funded or serviced by us, the SBA may seek recovery of the principal loss related to the deficiency from us. Generally, we do not maintain reserves or loss allowances for such potential claims and any such claims could materially and adversely affect our business, financial condition or results of operations.
The laws, regulations and standard operating procedures that are applicable to SBA loan products may change in the future. We cannot predict the effects of these changes on our business and profitability. Because government regulation greatly affects the business and financial results of all commercial banks and bank holding companies and especially our organization, changes in the laws, regulations and procedures applicable to SBA loans could adversely affect our ability to operate profitably.
The recognition of gains on the sale of loans and servicing asset valuations reflect certain assumptions.
We expect that gains on the sale of U.S. government guaranteed loans will comprise a significant component of our revenue. The gains on such sales recognized for the year ended December 31, 2017 was $4.8 million. The
19
Table of Contents
determination of these gains is based on assumptions regarding the value of unguaranteed loans retained, servicing rights retained and deferred fees and costs, and net premiums paid by purchasers of the guaranteed portions of U.S. government guaranteed loans. The value of retained unguaranteed loans and servicing rights are determined based on market derived factors such as prepayment rates, current market conditions and recent loan sales. Deferred fees and costs are determined using internal analysis of the cost to originate loans. Significant errors in assumptions used to compute gains on sale of loans or servicing asset valuations could result in material revenue misstatements, which may have a material adverse effect on our business, results of operations and profitability. In addition, while we believe these valuations reflect fair value and such valuations are subject to validation by an independent third party, if such valuations are not reflective of fair market value then our business, results of operations and financial condition may be materially and adversely affected.
Thenon-guaranteed portion of SBA loans that we retain on our balance sheet as well as the guaranteed portion of SBA loans that we sell could expose us to various credit and default risks.
We originated $99.7 million for the year ended December 31, 2017, and $111.5 million for the year ended December 31, 2016 of SBA loans. We sold $66.2 million for the year ended December 31, 2017, and $83.4 million for the year ended December 31, 2016, of the guaranteed portion of our SBA loans. We generally retain thenon-guaranteed portions of the SBA loans that we originate. Consequently, as of December 31, 2017, we held $131.3 million of SBA loans on our balance sheet, $115.6 million of which consisted of thenon-guaranteed portion of SBA loans and $15.7 million, or 12%, consisted of the guaranteed portion of SBA loans which we intend to sell in 2018. Thenon-guaranteed portion of SBA loans have a higher degree of credit risk and risk of loss as compared to the guaranteed portion of such loans. We generally retain thenon-guaranteed portions of the SBA loans that we originate and sell, and to the extent the borrowers of such loans experience financial difficulties, our financial condition and results of operations would be adversely impacted.
When we sell the guaranteed portion of SBA loans in the ordinary course of business, we are required to make certain representations and warranties to the purchaser about the SBA loans and the manner in which they were originated. Under these agreements, we may be required to repurchase the guaranteed portion of the SBA loan if we have breached any of these representations or warranties, in which case we may record a loss. In addition, if repurchase and indemnity demands increase on loans that we sell from our portfolio, our liquidity, results of operations and financial condition could be adversely affected.
Risks Related to Our Deposits
Our deposit portfolio includes significant concentrations and a large percentage of our deposits are attributable to a relatively small number of clients.
As a commercial bank, we provide services to a number of clients whose deposit levels vary considerably and have some seasonality. Our 10 largest depositor relationships accounted for approximately 12.2% of our deposits at December 31, 2017. Our largest depositor relationship accounted for approximately 2.1% of our deposits at December 31, 2017. These deposits can and do fluctuate substantially. The depositors are not concentrated in any industry or business. The loss of any combination of these depositors, or a significant decline in the deposit balances due to ordinary course fluctuations related to these customers’ businesses, would adversely affect our liquidity and require us to raise deposit rates to attract new deposits, purchase federal funds or borrow funds on a short-term basis to replace such deposits. Depending on the interest rate environment and competitive factors, low cost deposits may need to be replaced with higher cost funding, resulting in a decrease in net interest income and net income. While these events could have a material impact on our results, we expect, in the ordinary course of business, that these deposits will fluctuate and believe we are capable of mitigating this risk, as well as the risk of losing one of these depositors, through additional liquidity, and business generation in the future. However, should a significant number of these customers leave, it could have a material adverse impact on us.
20
Table of Contents
Competition among U.S. banks for customer deposits is intense, may increase the cost of retaining current deposits or procuring new deposits, and may otherwise negatively affect our ability to grow our deposit base.
Any changes we make to the rates offered on our deposit products to remain competitive with other financial institutions may adversely affect our profitability and liquidity. Interest-bearing accounts earn interest at rates established by management based on competitive market factors. The demand for the deposit products we offer may also be reduced due to a variety of factors, such as demographic patterns, changes in customer preferences, reductions in consumers’ disposable income, regulatory actions that decrease customer access to particular products, or the availability of competing products.
Risks Related to our Management
We are highly dependent on our management team, and the loss of our senior executive officers or other key employees could harm our ability to implement our strategic plan, impair our relationships with customers and adversely affect our business, results of operations and growth prospects.
Our success depends, in large degree, on the skills of our management team and our ability to retain, recruit and motivate key officers and employees. Our senior management team has significant industry experience, and their knowledge and relationships would be difficult to replace. Leadership changes will occur from time to time, and we cannot predict whether significant resignations will occur or whether we will be able to recruit additional qualified personnel. Competition for senior executives and skilled personnel in the financial services and banking industry is intense, which means the cost of hiring, incentivizing and retaining skilled personnel may continue to increase. We need to continue to attract and retain key personnel and to recruit qualified individuals to succeed existing key personnel to ensure the continued growth and successful operation of our business. In addition, as a provider of relationship-based commercial banking services, we must attract and retain qualified banking personnel to continue to grow our business, and competition for such personnel can be intense. Our ability to effectively compete for senior executives and other qualified personnel by offering competitive compensation and benefit arrangements may be restricted by applicable banking laws and regulations as discussed in “Supervision and Regulation—Incentive Compensation.” The loss of the services of any senior executive and, in particular Ms. Min Kim, our President and Chief Executive Officer, or other key personnel, or the inability to recruit and retain qualified personnel in the future, could have a material adverse effect on our business, financial condition or results of operations. In addition, to attract and retain personnel with appropriate skills and knowledge to support our business, we may offer a variety of benefits, which could reduce our earnings.
Risks Related to our Credit Quality
Nonperforming assets take significant time to resolve and adversely affect our results of operations and financial condition, and could result in further losses in the future.
As of December 31, 2017, our nonperforming loans (which consist of nonaccrual loans, loans past due 90 days or more and still accruing interest and loans modified under troubled debt restructurings) totaled $1.0 million, or 0.14% of our gross loans, and our nonperforming assets (which include nonperforming loans plus other real estate owned) totaled $1.0 million, or 0.12% of total assets. In addition, we had $201,000 in accruing loans that were30-89 days delinquent as of December 31, 2017.
Our nonperforming assets adversely affect our net income in various ways. We do not record interest income on nonaccrual loans or other real estate owned, thereby adversely affecting our net interest income, net income and returns on assets and equity, and our loan administration costs increase, which together with reduced interest income adversely affects our efficiency ratio. When we take collateral in foreclosure and similar proceedings, we are required to mark the collateral to its then-fair market value, which may result in a loss. These nonperforming loans and other real estate owned also increase our risk profile and the level of capital our regulators believe is appropriate for us to maintain in light of such risks. The resolution of nonperforming assets requires significant
21
Table of Contents
time commitments from management and can be detrimental to the performance of their other responsibilities. If we experience increases in nonperforming loans and nonperforming assets, our net interest income may be negatively impacted and our loan administration costs could increase, each of which would have an adverse effect on our net income and related ratios, such as return on assets and equity.
Our allowance for loan losses may prove to be insufficient to absorb potential losses in our loan portfolio.
We maintain an allowance for loan losses for probable incurred losses in our loan portfolio. The allowance is established through a provision for loan losses based on management’s evaluation of the risks inherent in the loan portfolio and the general economy. The allowance is also appropriately increased for new loan growth. The allowance is based upon a number of factors, including the size of the loan portfolio, asset classifications, economic trends, industry experience and trends, industry and geographic concentrations, estimated collateral values, management’s assessment of the credit risk inherent in the portfolio, historical loan loss experience and loan underwriting policies. The allowance is only an estimate of the probable incurred losses in the loan portfolio and may not represent actual losses realized over time, either of losses in excess of the allowance or of losses less than the allowance.
In addition, we evaluate all loans identified as impaired loans and allocate an allowance based upon our estimation of the potential loss associated with those problem loans. While we strive to carefully manage and monitor credit quality and to identify loans that may be deteriorating, at any time there are loans included in the portfolio that may result in losses, but that have not yet been identified asnon-performing or potential problem loans. Through established credit practices, we attempt to identify deteriorating loans and adjust the allowance for loan losses accordingly. However, because future events are uncertain and because we may not successfully identify all deteriorating loans in a timely manner, there may be loans that deteriorate in an accelerated time frame. We cannot be sure that we will be able to identify deteriorating loans before they become nonperforming assets, or that we will be able to limit losses on those loans that have been so identified. Changes in economic, operating and other conditions which are beyond our control, including interest rate fluctuations, deteriorating values in underlying collateral (most of which consists of real estate), and changes in the financial condition of borrowers, may cause our estimate of probable losses or actual loan losses to exceed our current allowance. As a result, future additions to the allowance may be necessary. Further, because the loan portfolio contains a number of commercial real estate loans with relatively large balances, deterioration in the credit quality of one or more of these loans may require a significant increase to the allowance for loan losses.
As of December 31, 2017, our allowance for loan losses as a percentage of total loans held for investment was 1.22% and as a percentage of total nonperforming loans was 881%. Although management believes that the allowance for loan losses is adequate to absorb losses on any existing loans that may become uncollectible, we may be required to take additional provisions for loan losses in the future to further supplement the allowance for loan losses, either due to management’s decision to do so or because our banking regulators require us to do so. Our bank regulatory agencies will periodically review our allowance for loan losses and the value attributed to nonaccrual loans or to real estate acquired through foreclosure and may require us to adjust our determination of the value for these items. These adjustments may adversely affect our business, financial condition and results of operations.
The current expected credit loss standard established by the Financial Accounting Standards Board will require significant data requirements and changes to methodologies.
In the aftermath of the 2007-2008 financial crisis, the Financial Accounting Standards Board, or FASB, decided to review how banks estimate losses in the allowance for loan losses, or ALL, calculation, and it issued the final Current Expected Credit Loss, or CECL, standard on June 16, 2016. Currently, the impairment model used by financial institutions is based on incurred losses, and loans are recognized as impaired when there is no longer an assumption that future cash flows will be collected in full under the originally contracted terms. This model will be replaced by the CECL model that will become effective for us for the fiscal year beginning after
22
Table of Contents
December 15, 2019 in which financial institutions will be required to use historical information, current conditions and reasonable forecasts to estimate the expected loss over the life of the loan. Management established a task force to begin the implementation process. The transition to the CECL model will require significantly greater data requirements and changes to methodologies to accurately account for expected loss. There can be no assurance that we will not be required to increase our reserves and ALL as a result of the implementation of CECL.
Risks Related to our Growth Strategy
We may not be able to continue growing our business, particularly if we cannot increase loans and deposits through organic growth.
We have grown our consolidated assets from $125.5 million as of December 31, 2010 to $901.0 million as of December 31, 2017, and our deposits from $103.6 million as of December 31, 2010 to $773.3 million as of December 31, 2017. Our ability to continue to grow successfully will depend to a significant extent on our capital resources. It also will depend, in part, upon our ability to attract deposits and grow our loan portfolio and investment opportunities and on whether we can continue to fund growth while maintaining cost controls and asset quality, as well on other factors beyond our control, such as national, regional and local economic conditions and interest rate trends.
There is risk related to acquisitions.
We plan to continue to grow our business organically. However, from time to time, we may consider opportunistic strategic acquisitions that we believe support our long-term business strategy. We face significant competition from numerous other financial services institutions, many of which will have greater financial resources than we do, when considering acquisition opportunities. Accordingly, attractive acquisition opportunities may not be available to us. There can be no assurance that we will be successful in identifying or completing any future acquisitions. Acquisitions of financial institutions involve operational risks and uncertainties and acquired companies may have unforeseen liabilities, exposure to asset quality problems, key employee and customer retention problems and other problems that could negatively affect our organization. We may not be able to complete future acquisitions and, if we do complete such acquisitions, we may not be able to successfully integrate the operations, management, products and services of the entities that we acquire and eliminate redundancies. The integration process could result in the loss of key employees or disruption of the combined entity’s ongoing business or inconsistencies in standards, controls, procedures, and policies that adversely affect our ability to maintain relationships with customers and employees or achieve the anticipated benefits of the transaction. The integration process may also require significant time and attention from our management that they would otherwise direct at servicing existing business and developing new business. We may not be able to realize any projected cost savings, synergies or other benefits associated with any such acquisition we complete. We cannot determine all potential events, facts and circumstances that could result in loss or give assurances that our investigation or mitigation efforts will be sufficient to protect against any such loss.
Our ability to expand our business or make strategic acquisitions outside of California may be limited by our license agreement that restricts our ability to use the name “Open Bank.”
The intellectual property rights to the use of our name “Open Bank” will continue to be one of the components of our strategy to build a relationship community bank focused on the Korean-American population base. We have not registered the trademark “Open Bank” under the trademark laws of the United States. Open Bank, S.A., a corporation organized and existing under the laws of Spain with its principal office located in Ciudad Grupo Santander, Av. Catabria Boadilla del Monte Madrid Spain (“Open Bank S.A.”) originally registered the trademark “Open Bank” (U.S. Registration No. 3397518) in 2008 with the United States Patent and Trademark Office. Open Bank S.A. provides financial services in Spain and solicits financial services in the United States
23
Table of Contents
through the internet. Open Bank S.A. is not licensed to engage in banking services in the United States or California and to our knowledge in any other state in the United States. In February 2014, we entered into a Coexistence Agreement with Open Bank S.A. (the “Coexistence Agreement”), under which both parties agreed that we may use the name “Open Bank” in connection with banking and banking related services in the state of California and the cities of New York, Dallas, Atlanta, Chicago, Seattle and Fort Lee, New Jersey (the “Permitted Markets”). We agreed to limit all of the Bank’s marketing, advertising, publicity, soliciting and or media efforts using the “Open Bank” name to primarily the Korean-American community in the Permitted Markets, however, we have the right under the Coexistence Agreement to market through the internet. The Coexistence Agreement states that these limitations are not intended to mean that we should in any way engage in discriminatory tactics or policy or in any way discriminate againstnon-Korean-American customers or potential customers. Under the Coexistence Agreement, Open Bank S.A. retains the right to use and market its services in relation to its registered trademark in any state or territory in the United States. The Bank further agreed not to challenge Open Bank, S.A.’s trademark registration or any future applications by Open Bank S.A. The Coexistence Agreement has no termination date and is perpetual. If Open Bank S.A. decides to become a licensed bank in California or in any of the other Permitted Markets, depending on its business and marketing plan, there could be confusion created by the use of the name “Open Bank” which could have a material adverse impact on our ability to build our brand in the Permitted Markets. In addition, if Open Bank, S.A. were to assert that we breached the Coexistence Agreement, Open Bank, S.A. could file for an injunction, seek to have us change our name or seek monetary damages, all of which could have a material adverse impact on our financial condition and results of operations. There are no approval rights of either party for any of the actions or omissions that either party may take under the Coexistence Agreement.
The Coexistence Agreement will limit our potential geographic expansion to the Permitted Markets. Those limitations could affect our overall growth over the long term. To our knowledge, Open Bank S.A. had not undertaken any actions to engage in any business or marketing activities in the United States other than have a presence on the internet through their Spanish website.
As we expand our business outside of California markets, we will encounter risks that could adversely affect us.
We primarily operate in California markets with a concentration of Korean-American individuals and businesses. However, one of our strategies is to expand beyond California into other domestic markets that have concentrations of Korean-American individuals and businesses. For example, we have loan production operations in Atlanta, Georgia, Dallas, Texas and Seattle, Washington, which have relatively high concentrations of Korean-American individuals and businesses. In the course of this expansion, we will encounter significant risks and uncertainties that could have a material adverse effect on our operations. These risks and uncertainties include increased expenses and operational difficulties arising from, among other things, our ability to attract sufficient business in new markets, to manage operations in noncontiguous market areas, to comply with all of the various local laws and regulations, and to anticipate events or differences in markets in which we have no current experience.
We must effectively manage our branch growth strategy.
We seek to expand our franchise safely and consistently. A successful growth strategy requires us to manage multiple aspects of our business simultaneously, such as following adequate loan underwriting standards, balancing loan and deposit growth without increasing interest rate risk or compressing our net interest margin, maintaining sufficient capital, maintaining proper systems and controls, and recruiting, training and retaining qualified professionals. We also may experience a lag in profitability associated with new branch openings. As part of our general growth strategy we may expand into additional communities or attempt to strengthen our position in our current markets by opening new offices, subject to any regulatory constraints on our ability to open new offices. To the extent that we are able to open additional offices, we are likely to experience the effects of higher operating expenses relative to operating income from the new operations for a period of time which
24
Table of Contents
would have an adverse effect on our levels of reported net income, return on average equity and return on average assets.
New lines of business or new products and services may subject us to additional risks.
From time to time, we may implement or may acquire new lines of business or offer new products and services within existing lines of business. There are substantial risks and uncertainties associated with these efforts, particularly in instances where the markets are not fully developed. In developing and marketing new lines of business and new products and services we may invest significant time and resources. We may not achieve target timetables for the introduction and development of new lines of business and new products or services and price and profitability targets may not prove feasible. External factors, such as regulatory compliance obligations, competitive alternatives, and shifting market preferences, may also impact the successful implementation of a new line of business or a new product or service. Furthermore, any new line of business and/or new product or service could have a significant impact on the effectiveness of our system of internal controls. Failure to successfully manage these risks in the development and implementation of new lines of business or new products or services could have a material adverse effect on our business, results of operations and financial condition.
Risks Related to Our Capital
As a result of the Dodd-Frank Act and recent rulemaking, we are subject to more stringent capital requirements.
In July 2013, the U.S. federal banking authorities approved the implementation of the global Basel III regulatory capital reforms, or the Basel III Capital Rules, and issued rules effecting certain changes required by the U.S. Dodd-Frank Act. The Basel III Capital Rules are applicable to all U.S. banks that are subject to minimum capital requirements as well as to bank and saving and loan holding companies, other than “small bank holding companies” (generally bank holding companies with consolidated assets of less than $1.0 billion). The Basel III Capital Rules not only increase most of the required minimum regulatory capital ratios, they introduce a new common equity Tier 1 capital ratio and the concept of a capital conservation buffer. The Basel III Capital Rules also expand the current definition of capital by establishing additional criteria that capital instruments must meet to be considered additional Tier 1 and Tier 2 capital. In order to be a “well-capitalized” depository institution under the new regime, an institution must maintain: a common equity Tier 1 capital ratio of 6.5% or more; a Tier 1 capital ratio of 8% or more; a total capital ratio of 10% or more; and a Tier 1 leverage ratio of 5% or more. The Basel III Capital Rules became effective as applied to us and the Bank on January 1, 2015 with aphase-in period that generally extends through January 1, 2019 for many of the changes.
The failure to meet applicable regulatory capital requirements could result in one or more of our regulators placing limitations or conditions on our activities, including our growth initiatives, or restricting the commencement of new activities, and could affect customer and investor confidence, our costs of funds and FDIC insurance costs, our ability to pay dividends on our common stock, our ability to make acquisitions, and our business, results of operations and financial conditions, generally.
We may need to raise additional capital in the future, and if we fail to maintain sufficient capital, whether due to losses, an inability to raise additional capital or otherwise, our financial condition, liquidity and results of operations, as well as our ability to maintain regulatory compliance, would be adversely affected.
We face significant capital and other regulatory requirements as a financial institution. Although management believes that the funds expected to be raised in this offering will be sufficient to fund operations and growth initiatives for at least the next eighteen to twenty-four months based on our estimated future operations, we may need to raise additional capital in the future to provide us with sufficient capital resources and liquidity to meet our commitments and business needs, which could include the possibility of financing acquisitions. In addition, the Company, on a consolidated basis, and the Bank, on a stand-alone basis, must meet certain regulatory capital requirements and maintain sufficient liquidity. Importantly, regulatory capital requirements could increase from
25
Table of Contents
current levels, which could require us to raise additional capital or contract our operations. Our ability to raise additional capital depends on conditions in the capital markets, economic conditions and a number of other factors, including investor perceptions regarding the banking industry, market conditions and governmental activities, and on our financial condition and performance. Any occurrence that may limit our access to the capital markets may adversely affect our capital costs and our ability to raise capital. Moreover, if we need to raise capital in the future, we may have to do so when many other financial institutions are also seeking to raise capital and would have to compete with those institutions for investors. Accordingly, we cannot assure you that we will be able to raise additional capital if needed or on terms acceptable to us. If we fail to maintain capital to meet regulatory requirements, our financial condition, liquidity and results of operations would be materially and adversely affected.
We are committed to contribute 10% of our consolidated after tax net income to the Open Stewardship Foundation.
The Open Stewardship Foundation is our platform for our community outreach activities. We support the Foundation through our commitment formalized in the Bank’sby-laws to donate an amount equal to 10% of our consolidated after tax net income to the Foundation, subject to legal and regulatory restrictions. This commitment, therefore, reduces our net income and our ability to build capital through our retained earnings.
Other Risks Related to Our Business
We face strong competition from financial services companies and other companies that offer commercial banking services, which could harm our business.
Our operations consist of offering commercial banking services to generate both interest and noninterest income. Many of our competitors offer the same, or a wider variety of, banking and related financial services within our market areas. These competitors include national banks, regional banks and other community banks. We also face competition from many other types of financial institutions, including savings and loan institutions, finance companies, brokerage firms, insurance companies, credit unions, mortgage banks and other financial intermediaries. In addition, a number ofout-of-state financial intermediaries have opened production offices or otherwise solicit deposits in our market areas. Additionally, we face growing competition fromso-called “online businesses” with few or no physical locations, including online banks, lenders and consumer and commercial lending platforms, as well as automated retirement and investment service providers. Many of these competing institutions have much greater financial and marketing resources than we have. Due to their size, many competitors can achieve larger economies of scale and may offer a broader range of products and services than we can. If we are unable to offer competitive products and services, our business may be negatively affected. Some of the financial services organizations with which we compete are not subject to the same degree of regulation as is imposed on bank holding companies and federally insured financial institutions or are not subject to increased supervisory oversight arising from regulatory examinations. As a result, thesenon-bank competitors have certain advantages over us in accessing funding and in providing various services and they may be subject to lower regulatory costs.
New technology and other changes are allowing parties to effectuate financial transactions that previously required the involvement of banks. For example, consumers can maintain funds in brokerage accounts or mutual funds that would have historically been held as bank deposits. Consumers can also complete transactions such as paying bills and transferring funds directly without the assistance of banks. The process of eliminating banks as intermediaries, known as “disintermediation,” could result in the loss of fee income, as well as the loss of customer deposits and the related income generated from those deposits. The loss of these revenue streams and access to lower cost deposits as a source of funds could have a material adverse effect on our business, results of operations and financial condition.
Increased competition in our markets may result in reduced loans, deposits and commissions and brokers’ fees, as well as reduced net interest margin and profitability. Ultimately, we may not be able to compete successfully
26
Table of Contents
against current and future competitors. If we are unable to attract and retain banking and mortgage loan customers and expand our sales market for such loans, we may be unable to continue to grow our business, and our financial condition and results of operations may be adversely affected.
Our modest size makes it more difficult for us to compete.
Our modest size makes it more difficult for us to compete with other financial institutions which are generally larger and can more easily afford to invest in the marketing and technologies needed to attract and retain customers. Because our principal source of income is the net interest income we earn on our loans and investments after deducting interest paid on deposits and other sources of funds, our ability to generate the revenues needed to cover our expenses and finance such investments is limited by the size of our loan and investment portfolios. Accordingly, we are not always able to offer new products and services as quickly as our competitors. As a smaller institution, we are also disproportionately affected by the continually increasing costs of compliance with new banking and other regulations.
We focus on marketing our services to a limited segment of the population and any adverse change impacting such segment is likely to have an adverse impact on us.
Our marketing focuses primarily on the banking needs of small- andmedium-sized businesses, professionals and residents in the Korean-American communities that we serve. This demographic concentration makes us more prone to circumstances that particularly affect this segment of the population. As a result, our financial condition and results of operations are subject to changes in the economic conditions affecting these communities. Our success depends upon the business activity, population, income levels, deposits and real estate activity in these communities. Although our customers’ business and financial interests may extend well beyond these communities, adverse economic conditions that affect these communities could reduce our growth rate, affect the ability of our customers to repay their loans to us and generally affect our financial condition and results of operations. Because of our geographic concentration, we are less able than regional or national financial institutions to diversify our credit risks across multiple markets.
Adverse conditions in Asia and elsewhere could adversely affect our business.
Although we believe we have minimal exposure to customers that have direct economic ties to South Korea and other countries in Asia, we are still likely to feel the effects of adverse economic and political conditions in South Korea and Asia, including the effects of rising inflation or slowing growth and volatility in the real estate and stock markets in South Korea and other regions. U.S. and global economic policies, military tensions in North Korea, and unfavorable global economic conditions may adversely impact the South Korean and other Asian economies. In addition, pandemics and other public health crises or concerns over the possibility of such crises could create economic and financial disruptions in the region. A significant deterioration of economic conditions in Asia could expose us to, among other things, economic and transfer risk, and we could experience an outflow of deposits by those of our customers with connections to Asia. Transfer risk may result when an entity is unable to obtain the foreign exchange needed to meet its obligations or to provide liquidity. This may adversely impact the recoverability of investments with, or loans made to, such entities. Adverse economic conditions in Asia, and in South Korea in particular, may also negatively impact asset values and the profitability and liquidity of our customers who operate in this region.
The costs and effects of litigation, investigations or similar matters, or adverse facts and developments related thereto, could materially affect our business, operating results and financial condition.
We may be involved from time to time in a variety of litigation, investigations or similar matters arising out of our business. It is inherently difficult to assess the outcome of these matters, and we may not prevail in any proceedings or litigation. Our insurance may not cover all claims that may be asserted against us and indemnification rights to which we are entitled may not be honored, and any claims asserted against us,
27
Table of Contents
regardless of merit or eventual outcome, may harm our reputation. Should the ultimate judgments or settlements in any litigation or investigation significantly exceed our insurance coverage, they could have a material adverse effect on our business, financial condition and results of operations. In addition, premiums for insurance covering the financial and banking sectors are rising. We may not be able to obtain appropriate types or levels of insurance in the future, nor may we be able to obtain adequate replacement policies with acceptable terms or at historic rates, if at all.
Liabilities from environmental regulations could materially and adversely affect our business and financial condition.
In the course of our business, we may foreclose and take title to real estate, and could be subject to environmental liabilities with respect to these properties. We may be held liable to a governmental entity or to third parties for property damage, personal injury, investigation andclean-up costs incurred by these parties in connection with environmental contamination, or may be required to investigate or clear up hazardous or toxic substances, or chemical releases at a property. The costs associated with investigation or remediation activities could be substantial. In addition, as the owner or former owner of any contaminated site, we may be subject to common law claims by third parties based on damages, and costs resulting from environmental contamination emanating from the property. If we ever become subject to significant environmental liabilities, our business, financial condition, liquidity, and results of operations could be materially and adversely affected.
We may be adversely affected by the soundness of other financial institutions.
Our ability to engage in routine funding transactions could be adversely affected by the actions and commercial soundness of other financial institutions. Financial services companies are interrelated as a result of trading, clearing, counterparty, and other relationships. We have exposure to different industries and counterparties, and through transactions with counterparties in the financial services industry, including brokers and dealers, commercial banks, investment banks, and other institutional clients. As a result, defaults by, or even rumors or questions about, one or more financial services companies, or the financial services industry generally, have led to market-wide liquidity problems and could lead to losses or defaults by us or by other institutions. These losses or defaults could have a material adverse effect on our business, financial condition, results of operations and growth prospects. Additionally, if our competitors were extending credit on terms we found to pose excessive risks, or at interest rates which we believed did not warrant the credit exposure, we may not be able to maintain our business volume and could experience deteriorating financial performance.
Downgrades to the credit rating of the U.S. government or of its securities or any of its agencies by one or more of the credit ratings agencies could have a material adverse effect on general economic conditions, as well as our business.
On August 5, 2011, Standard & Poor’s cut the credit rating of the U.S. federal government’s long-term sovereign debt from AAA to AA+, while also keeping its outlook negative. Moody’s had lowered its own outlook for the same debt to “Negative” on August 2, 2011, and Fitch also lowered its outlook for the same debt to “Negative”, on November 28, 2011. In 2013, both Moody’s and Standard & Poor’s revised their outlooks from “Negative” to “Stable”, and on March 21, 2014, Fitch revised its outlook from “Negative” to “Stable”. Further downgrades of the U.S. federal government’s sovereign credit rating, and the perceived creditworthiness of U.S. government-backed obligations, could affect our ability to obtain funding that is collateralized by affected instruments and our ability to access capital markets on favorable terms. Such downgrades could also affect the pricing of funding, when funding is available. A downgrade of the credit rating of the U.S. government, or of its agencies, government-sponsored enterprises or related institutions or instrumentalities, may also adversely affect the market value of such instruments and, further, exacerbate the other risks to which we are subject and any related adverse effects on our business, financial condition or results of operations.
28
Table of Contents
Severe weather, natural disasters, acts of war or terrorism and other external events could significantly impact our business.
Severe weather, natural disasters (including earthquakes), acts of war or terrorism and other adverse external events could have a significant impact on our ability to conduct business. Such events could affect the stability of our deposit base, impair the ability of borrowers to repay outstanding loans, impair the value of collateral securing loans, cause significant property damage, result in loss of revenue and/or cause us to incur additional expenses. For example, our primary market areas in California are subject to earthquakes and fires. Operations in our market areas could be disrupted by both the evacuation of large portions of the population as well as damage to and/or lack of access to our banking and operation facilities. While we have not experienced such event to date, other severe weather or natural disasters, acts of war or terrorism or other adverse external events may occur in the future. Although management has established disaster recovery policies and procedures, the occurrence of any such events could have a material adverse effect on our business financial condition and results of operations.
We have a continuing need for technological change, and we may not have the resources to effectively implement new technology or we may experience operational challenges when implementing new technology.
The financial services industry is undergoing rapid technological changes with frequent introductions of new technology-driven products and services. In addition to better serving customers, the effective use of technology increases efficiency and enables financial institutions to reduce costs. Our future success will depend in part upon our ability to address the needs of our customers by using technology to provide products and services that will satisfy customer demands for convenience as well as to create additional efficiencies in our operations as we continue to grow and expand our market area. We may experience operational challenges as we implement these new technology enhancements, or seek to implement them across all of our offices and business units, which could result in us not fully realizing the anticipated benefits from such new technology or require us to incur significant costs to remedy any such challenges in a timely manner.
Many of our larger competitors have substantially greater resources to invest in technological improvements. As a result, they may be able to offer additional or superior products to those that we will be able to offer, which would put us at a competitive disadvantage. Accordingly, a risk exists that we will not be able to effectively implement new technology-driven products and services or be successful in marketing such products and services to our customers.
Risks Related to Our Reputation and Operations
Our ability to maintain our reputation is critical to the success of our business, and the failure to do so may materially adversely affect our business and the value of our common stock.
We are a community bank, and our reputation is one of the most valuable components of our business. Threats to our reputation can come from many sources, including adverse sentiment about financial institutions generally, unethical practices, employee misconduct, failure to deliver minimum standards of service or quality, compliance deficiencies, and questionable or fraudulent activities of our customers. Negative publicity regarding our business, employees, or customers, with or without merit, may result in the loss of customers, investors and employees, costly litigation, a decline in revenues and increased governmental regulation. If our reputation is negatively affected, by the actions of our employees or otherwise, our business and, therefore, our operating results and the value of our common stock may be materially adversely affected.
Our risk management framework may not be effective in mitigating risks and/or losses to us.
Our risk management framework is comprised of various processes, systems and strategies, and is designed to manage the types of risk to which we are subject, including, among others, credit, market, liquidity, interest rate
29
Table of Contents
and compliance. Our framework also includes financial or other modeling methodologies that involve management assumptions and judgment. Our risk management framework may not be effective under all circumstances and may not adequately mitigate any risk or loss to us. If our risk management framework is not effective, we could suffer unexpected losses and our business, financial condition, results of operations or growth prospects could be materially and adversely affected. We may also be subject to potentially adverse regulatory consequences.
System failure or breaches of our network security could subject us to increased operating costs as well as litigation and other liabilities.
The computer systems and network infrastructure we use could be vulnerable to hardware and cyber security issues. Our operations are dependent upon our ability to protect our computer equipment against damage from fire, power loss, telecommunications failure or a similar catastrophic event. We could also experience a breach by intentional or negligent conduct on the part of employees or other internal or external sources, including our third-party vendors. Any damage or failure that causes an interruption in our operations could have an adverse effect on our financial condition and results of operations. In addition, our operations are dependent upon our ability to protect the computer systems and network infrastructure utilized by us, including our internet banking activities, against damage from physicalbreak-ins, cyber security breaches and other disruptive problems caused by the internet or other users. Such computerbreak-ins and other disruptions would jeopardize the security of information stored in and transmitted through our computer systems and network infrastructure, which may result in significant liability, damage our reputation and inhibit the use of our internet banking services by current and potential customers, any of which may result in a material adverse impact on our financial condition, results of operations or the market price of our common stock.
We rely heavily on communications, information systems (both internal and provided by third parties) and the internet to conduct our business. Our business is dependent on our ability to process and monitor large numbers of daily transactions in compliance with legal, regulatory and internal standards and specifications. In addition, a significant portion of our operations relies heavily on the secure processing, storage and transmission of personal and confidential information, such as the personal information of our customers and clients.
In addition, several U.S. financial institutions have recently experienced significant distributeddenial-of-service attacks, some of which involved sophisticated and targeted attacks intended to disable or degrade service, or sabotage systems. Other attacks have attempted to obtain unauthorized access to confidential information or destroy data, often through the introduction of computer viruses or malware, cyber-attacks and other means. To date, none of these types of attacks have had a material effect on our business or operations. However, no assurances can be provided that we may not suffer from such an attack in the future that may cause us material harm. Such security attacks can originate from a wide variety of sources, including persons who are involved with organized crime or who may be linked to terrorist organizations or hostile foreign governments. Those same parties may also attempt to fraudulently induce employees, customers or other users of our systems to disclose sensitive information in order to gain access to our data or that of our customers or clients. We are also subject to the risk that our employees may intercept and transmit unauthorized confidential or proprietary information. An interception, misuse or mishandling of personal, confidential or proprietary information being sent to or received from a customer or third party could result in legal liability, remediation costs, regulatory action and reputational harm to us.
Although we regularly add additional security measures to our computer systems and network infrastructure to mitigate the possibility of cyber security breaches, including firewalls and penetration testing, it is difficult or impossible to defend against every risk being posed by changing technologies as well as criminals intent on committing cyber-crime. Increasing sophistication of cyber criminals and terrorists make keeping up with new threats difficult and could result in a data security breach. Controls employed by our information technology department and cloud vendors could prove inadequate. A breach of our security that results in unauthorized access to our data could expose us to a disruption or challenges relating to our daily operations, as well as to data
30
Table of Contents
loss, litigation, damages, fines and penalties, significant increases in compliance costs and reputational damage, any of which could have an adverse effect on our business, financial condition and results of operations.
We maintain a system of internal controls and insurance coverage to mitigate against operational risks, including data processing system failures and errors and customer or employee fraud. If our internal controls fail to prevent or detect an occurrence, or if any resulting loss is not insured or exceeds applicable insurance limits, it could have a material adverse effect on our business, financial condition and results of operations.
Our operations could be interrupted if our third-party service providers experience difficulty, terminate their services or fail to comply with banking regulations.
We depend to a significant extent on a number of relationships with third-party service providers. Specifically, we receive core systems processing, essential web hosting and other internet systems, deposit processing and other processing services from third-party service providers. If these third-party service providers experience financial, operational, or technological difficulties or terminate their services and we are unable to replace them with other suitable service providers, our operations could be interrupted. If an interruption were to continue for a significant period of time, our business, financial condition and results of operations could be adversely affected, perhaps materially. Even if we are able to replace our service providers, it may be at a higher cost to us, which could adversely affect our business, financial condition and results of operations.
Confidential customer information transmitted through our online banking service is vulnerable to security breaches and computer viruses, which could expose us to litigation and adversely affect our reputation and ability to generate deposits.
We provide our customers the ability to bank online. The secure transmission of confidential information over the Internet is a critical element of online banking. Our network could be vulnerable to unauthorized access, computer viruses, phishing schemes and other security problems. We may be required to spend significant capital and other resources to protect against the threat of security breaches and computer viruses, or to alleviate problems caused by security breaches or viruses. To the extent that our activities or the activities of our customers involve the storage and transmission of confidential information, security breaches and viruses could expose us to claims, litigation and other possible liabilities. Any inability to prevent security breaches or computer viruses could also cause existing customers to lose confidence in our systems and could adversely affect our reputation and our ability to generate deposits.
We depend on the accuracy and completeness of information provided by customers and counterparties and any misrepresented information could adversely affect our business, financial condition and results of operations.
In deciding whether to extend credit or to enter into other transactions with customers and counterparties, we rely on information furnished to us by or on behalf of such customers and counterparties, including financial statements and other financial information. Some of the information regarding customers provided to us is also used in our proprietary credit decisioning and scoring models, which we use to determine whether to do business with customers and the risk profiles of such customers which are subsequently utilized by counterparties who lend us capital to fund our operations. We also rely on representations of customers and counterparties as to the accuracy and completeness of that information and, with respect to financial statements, on reports of independent auditors. While we have a practice of seeking to independently verify some of the customer information that we use in deciding whether to extend credit or to agree to a loan modification, including employment, assets, income and credit score, not all customer information is independently verified, and if any of the information that is independently verified (or any other information considered in the loan review process) is misrepresented and such misrepresentation is not detected prior to loan funding, the value of the loan may be significantly lower than expected. Whether a misrepresentation is made by the applicant, another third party or one of our employees, we generally bear the risk of loss associated with the misrepresentation. We may not
31
Table of Contents
detect all misrepresented information in our originations or from service providers we engage to assist in the approval process. Any such misrepresented information could adversely affect our business, financial condition and results of operations.
Credit and other information that we receive from third parties about a borrower may be inaccurate or may not accurately reflect the borrower’s creditworthiness, which may cause us to inaccurately price loans.
We obtain borrower credit information from consumer reporting agencies, such as TransUnion, Experian or Equifax, and assign loan grades to loan requests based on our credit decisioning that takes into account reported credit score, other information reported by the consumer reporting agencies and the requested loan amount, in addition to a variety of other factors. A credit score or loan grade assigned to a borrower may not reflect that borrower’s actual creditworthiness because the credit score may be based on outdated, incomplete, fraudulent or inaccurate consumer reporting data, and we do not independently verify the information obtained from the borrower’s credit report. Additionally, there is a risk that, following the date of the credit report that we obtain and review, a borrower may have:
| • | become delinquent in the payment of an outstanding obligation; |
| • | defaulted on apre-existing debt obligation; |
| • | taken on additional debt; |
| • | lost his or her job or other sources of income; or |
| • | sustained other adverse financial events. |
If borrowers default on loans that are not priced correctly, our reputation may be harmed and we may suffer other adverse effects.
We are subject to customer or employee fraud and data processing system failures and errors.
Employee errors and employee and customer misconduct could subject us to financial losses or regulatory sanctions and seriously harm our reputation. Misconduct by our employees could include hiding unauthorized activities from us, improper or unauthorized activities on behalf of our customers or improper use of confidential information. It is not always possible to prevent employee errors and misconduct, and the precautions we take to prevent and detect this activity may not be effective in all cases. Because the nature of the financial services business involves a high volume of transactions, certain errors may be repeated or compounded before they are discovered and successfully rectified. Our necessary dependence upon processing systems to record and process transactions and our large transaction volume may further increase the risk that employee tampering or manipulation of those systems will result in losses that are difficult to detect. Employee errors could also subject us to financial claims for negligence.
Finance and Accounting Risks
Our accounting estimates and risk management processes rely on analytical and forecasting models.
Processes that management uses to estimate our probable credit losses and to measure the fair value of financial instruments, as well as the processes used to estimate the effects of changing interest rates and other market measures on our financial condition and results of operations, depend upon the use of analytical and forecasting models. These models reflect assumptions that may not be accurate, particularly in times of market stress or other unforeseen circumstances. Even if these assumptions are accurate, the models may prove to be inadequate or inaccurate because of other flaws in their design or their implementation.
If the models that management uses for interest rate risk and asset liability management are inadequate, we may incur increased or unexpected losses upon changes in market interest rates or other market measures. If the
32
Table of Contents
models that management uses for determining our probable credit losses are inadequate, the allowance for loan losses may not be sufficient to support future charge offs. If the models that management uses to measure the fair value of financial instruments are inadequate, the fair value of such financial instruments may fluctuate unexpectedly or may not accurately reflect what we could realize upon sale or settlement of such financial instruments. Any such failure in management’s analytical or forecasting models could have a material adverse effect on our business, financial condition and results of operations.
The value of our net deferred asset was reduced as a result of the recently enacted federal tax legislation, and we cannot assure that it will be fully realized.
Deferred tax assets and liabilities are the expected future tax amounts for the temporary differences between the carrying amounts and tax basis of assets and liabilities computed using enacted tax rates. On December 22, 2017, H.R.1, commonly known as the Tax Cuts and Jobs Act (the “Tax Act”), was signed into law, which among other items reduces the federal corporate tax rate to 21% from 35%, effective January 1, 2018. U.S. generally accepted accounting principles requires companies to revalue certain tax-related assets as of the date of enactment of the new legislation with resulting tax effects accounted for in the reporting period of enactment. As a result, we performed an analysis to determine the impact of the revaluation of our net deferred tax asset. The value of our deferred tax asset was reduced by $1.3 million and such amount was recorded as a tax expense for the year ended December 31, 2017.
We regularly assess available positive and negative evidence to determine whether it is more likely than not that our net deferred tax asset will be realized. Realization of a deferred tax asset requires us to apply significant judgment and is inherently speculative because it requires estimates that cannot be made with certainty. If we were to determine at some point in the future that we will not achieve sufficient future taxable income to realize our net deferred tax asset, we would be required, under U.S. generally accepted accounting principles, to establish a full or partial valuation allowance which would require us to incur a charge to operations for the period in which the determination was made.
Changes in accounting standards could materially impact our financial statements.
From time to time, the FASB or the Securities and Exchange Commission, or SEC, may change the financial accounting and reporting standards that govern the preparation of our financial statements. Such changes may result in us being subject to new or changing accounting and reporting standards. In addition, the bodies that interpret the accounting standards (such as banking regulators or outside auditors) may change their interpretations or positions on how these standards should be applied. These changes may be beyond our control, can be hard to predict and can materially impact how we record and report our financial condition and results of operations. In some cases, we could be required to apply a new or revised standard retrospectively, or apply an existing standard differently, also retrospectively, in each case resulting in our needing to revise or restate prior period financial statements. Restating or revising our financial statements may result in reputational harm or may have other adverse effects on us.
Failure to maintain effective internal controls over financial reporting could have a material adverse effect on our business and stock price.
We are not currently required to comply with the rules of the SEC implementing Section 404 of the Sarbanes-Oxley Act of 2002, or the Sarbanes-Oxley Act, and are therefore not required to make a formal assessment of the effectiveness of our internal control over financial reporting for that purpose. Upon becoming subject to the Securities Exchange Act of 1934, or the Exchange Act, after completion of this offering, we will be required to comply with the SEC’s rules implementing Sections 302 and 404 of the Sarbanes-Oxley Act, which will require management to certify financial and other information in our quarterly and annual reports and provide an annual management report on the effectiveness of controls over financial reporting. In particular, we will be required to certify our compliance with Section 404 of the Sarbanes-Oxley Act beginning with our second annual report on
33
Table of Contents
Form10-K, which will require us to furnish annually a report by management on the effectiveness of our internal control over financial reporting. Although we are currently an emerging growth company and have elected additional transitional relief available to emerging growth companies, if we are unable to continue to qualify as an emerging growth company in the future, then our independent registered public accounting firm will be required to report on the effectiveness of our internal control over financial reporting, beginning as of that second annual report.
If we identify any material weaknesses in our internal control over financial reporting or are unable to comply with the requirements of Section 404 in a timely manner or assert that our internal control over financial reporting is effective, or if our independent registered public accounting firm is unable to express an opinion as to the effectiveness of our internal control over financial reporting once we are no longer an emerging growth company, then: investors, counterparties and customers may lose confidence in the accuracy and completeness of our financial statements and reports; our liquidity, access to capital markets and perceptions of our creditworthiness could be adversely affected; and the market price of our common stock could decline. In addition, we could become subject to investigations by the stock exchange on which our securities are listed, the SEC, the Board of Governors of the Federal Reserve System, the FDIC, the DBO or other regulatory authorities, which could require additional financial and management resources. These events could have an adverse effect on our business, financial condition and results of operations.
The obligations associated with being a public company will require significant resources and management attention, which may divert from our business operations.
As a result of this offering, we will become subject to the reporting requirements of the Exchange Act and the Sarbanes-Oxley Act. The Exchange Act requires that we file annual, quarterly and current reports with respect to our business and financial condition and proxy statements with the SEC. The Sarbanes-Oxley Act requires, among other things, that we establish and maintain effective internal controls and procedures for financial reporting. As a result, we will incur significant legal, accounting and other expenses that we did not previously incur. We anticipate that these costs will materially increase our general and administrative expenses. Furthermore, the need to establish the corporate infrastructure demanded of a public company may divert management’s attention from implementing our strategic plan, which could prevent us from successfully implementing our growth initiatives and improving our business, results of operations and financial condition. We cannot predict or estimate the amount of additional costs we may incur as a result of becoming a public reporting company or the timing of such costs.
Legislative and Regulatory Risks
We are subject to extensive government regulation that could limit or restrict our activities, which in turn may adversely impact our ability to increase our assets and earnings.
We operate in a highly regulated environment and are subject to supervision and regulation by a number of governmental regulatory agencies, including the Federal Reserve, the DBO and the FDIC. Regulations adopted by these agencies, which are generally intended to provide protection for depositors and customers rather than for the benefit of shareholders, govern a comprehensive range of matters relating to ownership and control of our shares, our acquisition of other companies and businesses, permissible activities for us to engage in, maintenance of adequate capital levels, and other aspects of our operations. These bank regulators possess broad authority to prevent or remedy unsafe or unsound practices or violations of law. The laws and regulations applicable to the banking industry could change at any time and we cannot predict the effects of these changes on our business, profitability or growth strategy. Increased regulation could increase our cost of compliance and adversely affect profitability. Moreover, certain of these regulations contain significant punitive sanctions for violations, including monetary penalties and limitations on a bank’s ability to implement components of its business plan, such as expansion through mergers and acquisitions or the opening of new branch offices. In addition, changes in regulatory requirements may add costs associated with compliance efforts. Furthermore, government policy and
34
Table of Contents
regulation, particularly as implemented through the Federal Reserve System, significantly affect credit conditions. Negative developments in the financial industry and the impact of new legislation and regulation in response to those developments could negatively impact our business operations and adversely impact our financial performance.
Legislative and regulatory actions taken now or in the future may increase our costs and impact our business, governance structure, financial condition or results of operations. Proposed legislative and regulatory actions, including changes to financial regulation, may not occur on the timeframe that is expected, or at all, which could result in additional uncertainty for our business.
We are subject to extensive regulation by multiple regulatory bodies. These regulations may affect the manner and terms of delivery of our services. If we do not comply with governmental regulations, we may be subject to fines, penalties, lawsuits or material restrictions on our businesses in the jurisdiction where the violation occurred, which may adversely affect our business operations. Changes in these regulations can significantly affect the services that we provide as well as our costs of compliance with such regulations. In addition, adverse publicity and damage to our reputation arising from the failure or perceived failure to comply with legal, regulatory or contractual requirements could affect our ability to attract and retain customers.
Current and recent economic conditions, particularly in the financial markets, have resulted in government regulatory agencies and political bodies placing increased focus and scrutiny on the financial services industry. The Dodd-Frank Act significantly changed the regulation of financial institutions and the financial services industry. The Dodd-Frank Act and the regulations thereunder affect large and small financial institutions, including several provisions that will affect how community banks, thrifts and small bank and thrift holding companies will be regulated in the future.
The Dodd-Frank Act, among other things: imposed new capital requirements on bank holding companies; changed the base for FDIC insurance assessments to a bank’s average consolidated total assets minus average tangible equity, rather than upon its deposit base; and permanently raised the current standard deposit insurance limit to $250,000 and expanded the FDIC’s authority to raise insurance premiums. The Dodd-Frank Act established the Consumer Financial Protection Bureau (the “CFPB”) as an independent entity within the Federal Reserve, which has broad rulemaking, supervisory and enforcement authority over consumer financial products and services, including deposit products, home mortgages, home-equity loans and credit cards, and contains provisions on mortgage-related matters, such as steering incentives, determinations as to a borrower’s ability to repay and prepayment penalties. Although the applicability of certain elements of the Dodd-Frank Act is limited to institutions with more than $10 billion in assets, there can be no guarantee that such applicability will not be extended in the future or that regulators or other third parties will not seek to impose such requirements on institutions with less than $10 billion in assets, such as the Bank. Compliance with the Dodd-Frank Act and its implementing regulations has and will continue to result in additional operating and compliance costs that could have a material adverse effect on our business, financial condition, results of operations and growth prospects.
New proposals for legislation continue to be introduced in the U.S. Congress that could further substantially increase regulation of the financial services industry, impose restrictions on the operations and general ability of firms within the industry to conduct business consistent with historical practices, including in the areas of compensation, interest rates, financial product offerings and disclosures, and have an effect on bankruptcy proceedings with respect to consumer residential real estate mortgages, among other things. Federal and state regulatory agencies also frequently adopt changes to their regulations or change the manner in which existing regulations are applied. In addition, U.S. President Donald J. Trump has issued an executive order directing the review of existing financial regulations. The Trump administration has also indicated in public statements that the Dodd-Frank Act will be under scrutiny and that some of its provisions and the rules promulgated thereunder may be revised, repealed or amended. In June 2017, the U.S. House of Representatives approved the Financial Choice Act, which would revise, repeal and amend various provisions of and rules promulgated under the Dodd-Frank Act. However, it has been indicated by several commentators that the Financial Choice Act is not expected
35
Table of Contents
to be passed by the U.S. Senate in its current form. These statements and actions have created uncertainty regarding changes to the Dodd-Frank Act that could apply to us in the future.
Certain aspects of current or proposed regulatory or legislative changes, including to laws applicable to the financial industry and further changes to the U.S. corporate tax code, if enacted or adopted, may impact the profitability of our business activities, require more oversight or change certain of our business practices, including the ability to offer new products, obtain financing, attract deposits, make loans and achieve satisfactory interest spreads, and could expose us to additional costs, including increased compliance costs. These changes also may require us to invest significant management attention and resources to make any necessary changes to operations to comply, and could have a material adverse effect on our business, financial condition and results of operations. In addition, any proposed legislative or regulatory changes, including those that could benefit our business, financial condition and results of operations, may not occur on the timeframe that is proposed, or at all, which could result in additional uncertainty for our business.
Monetary policies and regulations of the Federal Reserve could adversely affect our business, financial condition and results of operations.
In addition to being affected by general economic conditions, our earnings and growth are affected by the policies of the Federal Reserve. An important function of the Federal Reserve is to regulate the money supply and credit conditions. Among the instruments used by the Federal Reserve to implement these objectives are open market purchases and sales of U.S. government securities, adjustments of the discount rate and changes in banks’ reserve requirements against bank deposits. These instruments are used in varying combinations to influence overall economic growth and the distribution of credit, bank loans, investments and deposits. Their use also affects interest rates charged on loans or paid on deposits.
The monetary policies and regulations of the Federal Reserve have had a significant effect on the operating results of commercial banks in the past and are expected to continue to do so in the future. The effects of such policies upon our business, financial condition and results of operations cannot be predicted.
Federal and state regulators periodically examine our business, and we may be required to remediate adverse examination findings.
The Federal Reserve, the FDIC, and the DBO periodically examine our business, including our compliance with laws and regulations. If, as a result of an examination, a banking agency were to determine that our financial condition, capital resources, asset quality, earnings prospects, management, liquidity or other aspects of any of our operations had become unsatisfactory, or that we were in violation of any law or regulation, they may take a number of different remedial actions as they deem appropriate. These actions include the power to enjoin “unsafe or unsound” practices, to require affirmative action to correct any conditions resulting from any violation or practice, to issue an administrative order that can be judicially enforced, to direct an increase in our capital, to restrict our growth, to assess civil money penalties, to fine or remove officers and directors and, if it is concluded that such conditions cannot be corrected or there is an imminent risk of loss to depositors, to terminate our deposit insurance and place us into receivership or conservatorship. Any regulatory action against us could have an adverse effect on our business, financial condition and results of operations.
We are subject to numerous laws designed to protect consumers, including the Community Reinvestment Act and fair lending laws, and failure to comply with these laws could lead to a wide variety of sanctions.
The Community Reinvestment Act, the Equal Credit Opportunity Act, the Fair Housing Act and other fair lending laws and regulations prohibit discriminatory lending practices by financial institutions. The U.S. Department of Justice, federal banking agencies, and other federal agencies are responsible for enforcing these laws and regulations. A challenge to an institution’s compliance with fair lending laws and regulations could result in a wide variety of sanctions, including damages and civil money penalties, injunctive relief, restrictions
36
Table of Contents
on mergers and acquisitions activity, restrictions on expansion, and restrictions on entering new business lines. Private parties may also challenge an institution’s performance under fair lending laws in private class action litigation. Such actions could have a material adverse effect on our business, financial condition, results of operations and growth prospects.
The federal government is increasingly seeking significant monetary damages and penalties against mortgage lenders and servicers under the Financial Institutions Reform, Recovery, and Enforcement Act of 1989 (“FIRREA”) and the False Claims Act (“FCA”) for making false statements and seeking reimbursement for ineligible costs and expenses.
The federal government has initiated a number of actions against mortgage lenders and servicers alleging violations of FIRREA and the FCA. Some of the actions against lenders allege that the lenders sold defective loans to Fannie Mae and Freddie Mac, while representing that the loans complied with the government-sponsored enterprise’s underwriting guidelines. The federal government has also brought actions against lenders asserting that they submitted claims for loans insured by the Fair Housing Administration, or FHA, that the lender falsely certified to U.S. Department of Housing and Urban Development met FHA underwriting requirements that resulted in FHA paying out millions of dollars in insurance claims to cover the defaulted loans. Other allegations involve the Home Affordable Modification Program (“HAMP”), which is a federal program established to help eligible homeowners impacted by financial hardship by offering them loan modifications on their mortgages. HAMP requires participating mortgage servicers to file annual certifications that they have been truthful and accurate in their HAMP-related activities, including reports they submitted to the government in which they acknowledged that providing false or fraudulent information may violate the FCA. Actions have also been filed against certain banks alleging they improperly denied borrowers access to HAMP services, and submitted fraudulent certifications and accepted financial incentives for HAMP participation. Because these actions carry the possibility for treble damages, many have resulted in settlements totaling in the hundreds of millions of dollars, as well as required lenders and servicers to make significant changes in their practices.
We may be subject to liability for potential violations of predatory lending laws, which could adversely impact our results of operations, financial condition and business.
Various U.S. federal, state and local laws have been enacted that are designed to discourage predatory lending practices. The U.S. Home Ownership and Equity Protection Act of 1994 (“HOEPA”) prohibits inclusion of certain provisions in mortgages that have interest rates or origination costs in excess of prescribed levels and requires that borrowers be given certain disclosures prior to origination. Some states have enacted, or may enact, similar laws or regulations, which in some cases impose restrictions and requirements greater than those in HOEPA. In addition, under the anti-predatory lending laws of some states, the origination of certain mortgages, including loans that are not classified as “high-cost” loans under applicable law, must satisfy a net tangible benefit test with respect to the related borrower. Such tests may be highly subjective and open to interpretation. As a result, a court may determine that a home mortgage, for example, does not meet the test even if the related originator reasonably believed that the test was satisfied. If any of our mortgages are found to have been originated in violation of predatory or abusive lending laws, we could incur losses, which could adversely impact our results of operations, financial condition and business.
Regulatory agencies and consumer advocacy groups are becoming more aggressive in asserting claims that the practices of lenders and loan servicers result in a disparate impact on protected classes.
Antidiscrimination statutes, such as the Fair Housing Act and the Equal Credit Opportunity Act (“ECOA”), prohibit creditors from discriminating against loan applicants and borrowers based on certain characteristics, such as race, religion and national origin. Various federal regulatory agencies and departments, including the U.S. Department of Justice and the CFPB, take the position that these laws apply not only to intentional discrimination, but also to neutral practices that have a disparate impact on a group that shares a characteristic that a creditor may not consider in making credit decisions protected classes (i.e., creditor or servicing practices that have a disproportionate negative affect on a protected class of individuals).
37
Table of Contents
These regulatory agencies, as well as consumer advocacy groups and plaintiffs’ attorneys, are focusing greater attention on “disparate impact” claims. The U.S. Supreme Court recently confirmed that the “disparate impact” theory applies to cases brought under the Fair Housing Act, while emphasizing that a causal relationship must be shown between a specific policy of the defendant and a discriminatory result that is not justified by a legitimate objective of the defendant. Although it is still unclear whether the theory applies under ECOA, regulatory agencies and private plaintiffs can be expected to continue to apply it to both the Fair Housing Act and ECOA in the context of mortgage lending and servicing. To extent that the “disparate impact” theory continues to apply, we will be faced with significant administrative burdens in attempting to comply, and potential liability for failures to comply.
In addition to reputational harm, violations of the ECOA and the Fair Housing Act can result in actual damages, punitive damages, injunctive or equitable relief, attorneys’ fees and civil money penalties.
We face a risk of noncompliance and enforcement action with the Bank Secrecy Act and other anti-money laundering statutes and regulations.
The Bank Secrecy Act, the USA Patriot Act and other laws and regulations require financial institutions, among other duties, to institute and maintain an effective anti-money laundering program and to file reports such as suspicious activity reports and currency transaction reports. We are required to comply with these and other anti-money laundering requirements. The federal banking agencies and Financial Crimes Enforcement Network are authorized to impose significant civil money penalties for violations of those requirements and have recently engaged in coordinated enforcement efforts against banks and other financial services providers with the U.S. Department of Justice, Drug Enforcement Administration and Internal Revenue Service. We are also subject to increased scrutiny of compliance with the rules enforced by the Office of Foreign Assets Control. If our policies, procedures and systems are deemed deficient, we would be subject to liability, including fines and regulatory actions, which may include restrictions on our ability to pay dividends and the necessity to obtain regulatory approvals to proceed with certain aspects of our business plan, including our acquisition plans.
Failure to maintain and implement adequate programs to combat money laundering and terrorist financing could also have serious reputational consequences for us. Any of these results could have a material adverse effect on our business, financial condition, results of operations and growth prospects.
The Federal Reserve may require us to commit capital resources to support the Bank.
As a matter of policy, the Federal Reserve expects a bank holding company to act as a source of financial and managerial strength to a subsidiary bank and to commit resources to support such subsidiary bank. The Dodd-Frank Act codified the Federal Reserve’s policy on serving as a source of financial strength. Under the “source of strength” doctrine, the Federal Reserve may require a bank holding company to make capital injections into a troubled subsidiary bank and may charge the bank holding company with engaging in unsafe and unsound practices for failure to commit resources to a subsidiary bank. A capital injection may be required at times when the bank holding company may not have the resources to provide it and therefore may be required to borrow the funds or raise capital. Any loans by a bank holding company to its subsidiary banks are subordinate in right of payment to deposits and to certain other indebtedness of such subsidiary bank. In the event of a bank holding company’s bankruptcy, the bankruptcy trustee will assume any commitment by the bank holding company to a federal bank regulatory agency to maintain the capital of a subsidiary bank. Moreover, bankruptcy law provides that claims based on any such commitment will be entitled to a priority of payment over the claims of the institution’s general unsecured creditors, including the holders of its note obligations. Thus, any borrowing that must be incurred by us to make a required capital injection to Open Bank becomes more difficult and expensive and could have an adverse effect on our business, financial condition and results of operations.
38
Table of Contents
Potential limitations on incentive compensation contained in proposed federal agency rulemaking may adversely affect our ability to attract and retain our highest performing employees.
During the second quarter of 2016, the Federal Reserve and the FDIC, along with other U.S. regulatory agencies, jointly published proposed rules designed to implement provisions of the Dodd-Frank Act prohibiting incentive compensation arrangements that would encourage inappropriate risk taking at covered financial institutions, which includes a bank or bank holding company with $1 billion or more in assets. It cannot be determined at this time whether or when a final rule will be adopted and whether compliance with such a final rule will substantially affect the manner in which we structure compensation for our executives and other employees once the Bank has assets exceed $1 billion. Depending on the nature and application of the final rules, we may not be able to compete successfully with certain financial institutions and other companies that are not subject to some or all of the rules to retain and attract executives and other high performing employees. If this were to occur, relationships that we have established with our clients may be impaired and our business, financial condition and results of operations could be adversely affected, perhaps materially.
Risks Related to this Offering and an Investment in Our Common Stock
An active, liquid trading market for our common stock may not develop for several reasons, and you may not be able to sell your common stock at or above the public offering price, or at all.
Prior to this offering, there has been a limited public market for our common stock on the OTCQB Market. Although we have applied to list our common stock on the Nasdaq Global Market, an active trading market for shares of our common stock may never develop or be sustained following this offering even if our common stock is listed on Nasdaq. If an active trading market does not develop, you may have difficulty selling your shares of common stock at an attractive price, or at all. The public offering price for the common stock sold in this offering will be determined by negotiations between us and the representatives of the underwriters and may not be indicative of prices that will prevail in the open market following this offering. Consequently, you may not be able to sell your common stock at or above the public offering price or at any other price or at the time that you would like to sell. An inactive market may also impair our ability to raise capital by selling our common stock and may impair our ability to expand our business by using our common stock as consideration in an acquisition of another company or business.
The price of our common stock could be volatile following this offering.
The market price of our common stock following this offering may be volatile and could be subject to wide fluctuations in price in response to various factors, some of which are beyond our control. These factors include, among other things:
| • | actual or anticipated variations in our quarterly results of operations; |
| • | recommendations by securities analysts; |
| • | operating and stock price performance of other companies that investors deem comparable to us; |
| • | news reports relating to trends, concerns and other issues in the financial services industry generally; |
| • | perceptions in the marketplace regarding us and/or our competitors; |
| • | fluctuations in the stock price and operating results of our competitors; |
| • | domestic and international economic factors unrelated to our performance; |
| • | general market conditions and, in particular, developments related to market conditions for the financial services industry. |
| • | new technology used, or services offered, by competitors; and |
| • | changes in government regulations. |
39
Table of Contents
In addition, if the market for stocks in our industry, or the stock market in general, experiences a loss of investor confidence, the trading price of our common stock could decline for reasons unrelated to our business, financial condition or results of operations. If any of the foregoing occurs, it could cause our stock price to fall and may expose us to lawsuits that, even if unsuccessful, could be costly to defend and a distraction to management.
An investment in our common stock is not an insured deposit.
An investment in our common stock is not a bank deposit and, therefore, is not insured against loss by the FDIC, any other deposit insurance fund or by any other public or private entity. Investment in our common stock is inherently risky for the reasons described herein, and is subject to the same market forces that affect the price of common stock in any company. As a result, if you acquire our common stock, you could lose some or all of your investment.
If equity research analysts do not publish research or reports about our business, or if they do publish such reports but issue unfavorable commentary or downgrade our common stock, the price and trading volume of our common stock could decline.
The trading market for our common stock could be affected by whether equity research analysts publish research or reports about us and our business. We cannot predict at this time whether any research analysts will publish research and reports on us and our common stock. If one or more equity analysts do cover us and our common stock and publish research reports about us, the price of our stock could decline if one or more securities analysts downgrade our stock or if those analysts issue other unfavorable commentary or cease publishing reports about us or our business.
If any of the analysts who elect to cover us downgrades our stock, our stock price could decline rapidly. If any of these analysts ceases coverage of us, we could lose visibility in the market, which in turn could cause our common stock price or trading volume to decline and our common stock to be less liquid.
It is unlikely that we will pay dividends on our common stock in the near term or over a broader time frame, and consequently, your only opportunity to achieve a return on your investment may be if the price of our common stock appreciates.
We have no obligation to pay dividends and have not paid dividends since the inception of the Bank or the Company. Holders of our common stock are entitled to receive only such cash dividends as our board of directors, in its discretion, may declare out of funds legally available for such payments. Furthermore, consistent with our strategic plans, growth initiatives, capital availability and requirements, projected liquidity needs, financial condition, and other factors, we have made, and will continue to make, capital management decisions and policies that could adversely impact our determination to pay dividends to our common shareholders.
We are a separate and distinct legal entity from our subsidiary, the Bank. We receive substantially all of our revenue from dividends from the Bank, which we use as the principal source of funds to pay our expenses. Various federal and/or state laws and regulations limit the amount of dividends that the Bank may pay us. Such limits are also tied to the earnings of our subsidiary. If the Bank does not receive regulatory approval or if the Bank’s earnings are not sufficient to make dividend payments to us while maintaining adequate capital levels, our ability to pay our expenses and our business, financial condition or results of operations could be materially and adversely impacted.
We have limited the circumstances in which our directors will be liable for monetary damages.
We have included in our articles of incorporation a provision to eliminate the liability of directors for monetary damages to the maximum extent permitted by California law. The effect of this provision will be to reduce the situations in which we or our shareholders will be able to seek monetary damages from our directors.
40
Table of Contents
Our bylaws also have a provision providing for indemnification of our directors and executive officers and advancement of litigation expenses to the fullest extent permitted or required by California law, including circumstances in which indemnification is otherwise discretionary. Also, we have entered into agreements with our officers and directors in which we similarly agreed to provide indemnification that is otherwise discretionary. Such indemnification may be available for liabilities arising in connection with this offering.
Shares of certain shareholders may be sold into the public market in the near future. This could cause the market price of our common stock to drop significantly.
In connection with this offering, we, our directors, our executive officers and certain of our shareholders have each agreed to enter intolock-up agreements that restrict the sale of their holdings of our common stock for a period of 180 days from the date of this prospectus, subject to an extension in certain circumstances. The underwriters, in their discretion, may release any of the shares of our common stock subject to theselock-up agreements at any time without notice. In addition, after this offering, approximately 3,127,436 shares of our common stock that are currently issued and outstanding will be subject tolock-up. We also have outstanding options to purchase 1,130,000 shares of our common stock as of December 31, 2017 that may be exercised and sold, and we have the ability to issue options exercisable for up to an additional 218,605 shares of common stock pursuant to our 2010 Equity Incentive Plan. The resale of such shares could cause the market price of our stock to drop significantly, and concerns that those sales may occur could cause the trading price of our common stock to decrease or to be lower than it might otherwise be.
Our management will have broad discretion as to the use of proceeds from this offering, and we may not use the proceeds effectively.
We are not required to apply any portion of the net proceeds of this offering for any particular purpose. Accordingly, our management will have broad discretion as to the application of the net proceeds of this offering and could use them for purposes other than those contemplated at the time of this offering. A portion of the proceeds are expected to be used to provide additional capital as a cushion against minimum regulatory capital requirements, which may tend to reduce our return on equity as opposed to if such proceeds were used for further growth. Our shareholders may not agree with the manner in which our management chooses to allocate and invest the net proceeds. We may not be successful in using the net proceeds from this offering to increase our profitability or market value and we cannot predict whether the proceeds will be invested to yield a favorable return. As of December 31, 2017, our return on average equity was 10.63% with total shareholders’ equity of approximately $91.5 million. After the completion of this offering, shareholders’ equity will be approximately $111.0 million (or approximately $114.1 million if the underwriters exercise their option to purchase additional shares in full), based on the public offering price of $11.00 per share.
You will incur immediate dilution as a result of this offering.
If you purchase common stock in this offering, you will pay more for your shares than our existing net tangible book value per share. As a result, you will incur immediate dilution of $3.69 per share, representing the difference between the public offering price of $11.00 per share and our adjusted net tangible book value per share after giving effect to this offering. This represents 34% dilution from the public offering price. If the underwriters exercise their option to purchase additional shares from us in full, you will incur an immediate dilution of $3.63 per share to new investors. This represents 33% dilution from the public offering price.
Future equity issuances could result in dilution, which could cause our common stock price to decline.
We are generally not restricted from issuing additional shares of our common stock, up to the 50 million shares of voting common stock and 10 million shares of preferred stock authorized in our articles of incorporation (subject to Nasdaq shareholder approval rules), which in each case could be increased by a vote of a majority of our shares. We may issue additional shares of our common stock in the future pursuant to current or
41
Table of Contents
future equity compensation plans, upon conversions of preferred stock or debt, upon exercise of warrants or in connection with future acquisitions or financings. If we choose to raise capital by selling shares of our common stock for any reason, the issuance could have a dilutive effect on the holders of our common stock and could have a material negative effect on the market price of our common stock.
We may issue shares of preferred stock in the future, which could make it difficult for another company to acquire us or could otherwise adversely affect holders of our common stock, which could depress the price of our common stock.
Although there are currently no shares of our preferred stock issued and outstanding, our articles of incorporation authorize us to issue up to 10 million shares of one or more series of preferred stock. Our board of directors also has the power, without shareholder approval (subject to Nasdaq shareholder approval rules), to set the terms of any series of preferred stock that may be issued, including voting rights, dividend rights, preferences over our common stock with respect to dividends or in the event of a dissolution, liquidation or winding up and other terms. In the event that we issue preferred stock in the future that has preference over our common stock with respect to payment of dividends or upon our liquidation, dissolution or winding up, or if we issue preferred stock with voting rights that dilute the voting power of our common stock, the rights of the holders of our common stock or the market price of our common stock could be adversely affected. In addition, the ability of our board of directors to issue shares of preferred stock without any action on the part of our shareholders (subject to Nasdaq shareholder approval rules) may impede a takeover of us and prevent a transaction perceived to be favorable to our shareholders.
Provisions in our charter documents and California law may have an anti-takeover effect, and there are substantial regulatory limitations on changes of control of bank holding companies.
Provisions of our charter documents and the California General Corporation Law, or the CGCL, could make it more difficult for a third party to acquire us, even if doing so would be perceived to be beneficial by our shareholders. Furthermore, with certain limited exceptions, federal regulations prohibit a person or company or a group of persons deemed to be “acting in concert” from, directly or indirectly, acquiring more than 10% (5% if the acquirer is a bank holding company) of any class of our voting stock or obtaining the ability to control in any manner the election of a majority of our directors or otherwise direct the management or policies of our company without prior notice or application to and the approval of the Federal Reserve. Accordingly, prospective investors need to be aware of and comply with these requirements, if applicable, in connection with any purchase of shares of our common stock. Moreover, the combination of these provisions effectively inhibits certain mergers or other business combinations, which, in turn, could adversely affect the market price of our common stock.
We are an “emerging growth company,” and the reduced regulatory and reporting requirements applicable to emerging growth companies may make our common stock less attractive to investors.
We are an “emerging growth company,” as described in the JOBS Act. For as long as we continue to be an emerging growth company, we may take advantage of reduced regulatory and reporting requirements that are otherwise generally applicable to public companies. These include, without limitation, not being required to comply with the auditor attestation requirements of Section 404(b) of the Sarbanes-Oxley Act, reduced financial reporting requirements, reduced disclosure obligations regarding executive compensation, and exemptions from the requirements of holdingnon-binding advisory votes on executive compensation and golden parachute payments. We cannot predict if investors will find our common stock less attractive because of our reliance on certain of these exemptions. If some investors find our common stock less attractive as a result, then there may be a less active trading market for our common stock, our stock price may be more volatile and the price of our common stock may decline.
42
Table of Contents
CAUTIONARY NOTE REGARDING FORWARD-LOOKING STATEMENTS
This prospectus contains forward-looking statements within the meaning of the federal securities laws. These forward-looking statements reflect our current views with respect to, among other things, future events and our financial performance. These statements are often, but not always, made through the use of words or phrases such as “may,” “might,” “should,” “could,” “predict,” “potential,” “believe,” “expect,” “continue,” “will,” “anticipate,” “seek,” “estimate,” “intend,” “plan,” “strive,” “projection,” “goal,” “target,” “outlook,” “aim,” “would,” “annualized” and “outlook,” or the negative version of those words or other comparable words or phrases of a future or forward-looking nature. These forward-looking statements are not historical facts, and are based on current expectations, estimates and projections about our industry, management’s beliefs and certain assumptions made by management, many of which, by their nature, are inherently uncertain and beyond our control. Accordingly, we caution you that any such forward-looking statements are not guarantees of future performance and are subject to risks, assumptions, estimates and uncertainties that are difficult to predict. Although we believe that the expectations reflected in these forward-looking statements are reasonable as of the date made, actual results may prove to be materially different from the results expressed or implied by the forward-looking statements.
A number of important factors could cause our actual results to differ materially from those indicated in these forward-looking statements, including those factors identified in “Risk Factors” or “Management’s Discussion and Analysis of Financial Condition and Results of Operations” or the following:
| • | business and economic conditions, particularly those affecting the financial services industry and our primary market areas; |
| • | our ability to successfully manage our credit risk and the sufficiency of our allowance for loan loss; |
| • | factors that can impact the performance of our loan portfolio, including real estate values and liquidity in our primary market areas, the financial health of our commercial borrowers and the success of construction projects that we finance, including any loans acquired in acquisition transactions; |
| • | our ability to effectively execute our strategic plan and manage our growth; |
| • | interest rate fluctuations, which could have an adverse effect on our profitability; |
| • | liquidity issues, including fluctuations in the fair value and liquidity of the securities we hold for sale and our ability to raise additional capital, if necessary; |
| • | external economic and/or market factors, such as changes in monetary and fiscal policies and laws, including the interest rate policies of the Federal Reserve, inflation or deflation, changes in the demand for loans, and fluctuations in consumer spending, borrowing and savings habits, which may have an adverse impact on our financial condition; |
| • | continued or increasing competition from other financial institutions, credit unions, andnon-bank financial services companies, many of which are subject to different regulations than we are; |
| • | challenges arising from unsuccessful attempts to expand into new geographic markets, products, or services; |
| • | restraints on the ability of the Bank to pay dividends to us, which could limit our liquidity; |
| • | increased capital requirements imposed by banking regulators, which may require us to raise capital at a time when capital is not available on favorable terms or at all; |
| • | a failure in the internal controls we have implemented to address the risks inherent to the business of banking; |
| • | inaccuracies in our assumptions about future events, which could result in material differences between our financial projections and actual financial performance; |
| • | changes in our management personnel or our inability to retain motivate and hire qualified management personnel; |
43
Table of Contents
| • | disruptions, security breaches, or other adverse events, failures or interruptions in, or attacks on, our information technology systems; |
| • | disruptions, security breaches, or other adverse events affecting the third-party vendors who perform several of our critical processing functions; |
| • | an inability to keep pace with the rate of technological advances due to a lack of resources to invest in new technologies; |
| • | risks related to potential acquisitions; |
| • | incremental costs and obligations associated with operating as a public company; |
| • | the impact of any claims or legal actions to which we may be subject, including any effect on our reputation; |
| • | compliance with governmental and regulatory requirements, including the Dodd-Frank Act and others relating to banking, consumer protection, securities and tax matters, and our ability to maintain licenses required in connection with commercial mortgage origination, sale and servicing operations; |
| • | changes in federal tax law or policy; and |
| • | risks related to this offering. |
The foregoing factors should not be construed as exhaustive and should be read together with the other cautionary statements included in this prospectus. Because of these risks and other uncertainties, our actual future results, performance or achievement, or industry results, may be materially different from the results indicated by the forward looking statements in this prospectus. In addition, our past results of operations are not necessarily indicative of our future results. You should not rely on any forward looking statements, which represent our beliefs, assumptions and estimates only as of the dates on which they were made, as predictions of future events. Any forward-looking statement speaks only as of the date on which it is made, and we do not undertake any obligation to update or review any forward-looking statement, whether as a result of new information, future developments or otherwise.
44
Table of Contents
We estimate that the net proceeds to us from this offering, after deducting underwriting discounts and estimated offering expenses, will be approximately $19.6 million (or approximately $22.6 million if the underwriters exercise their overallotment option to purchase additional shares from us in full), based on the public offering price of $11.00 per share.
We intend to use the net proceeds to us from this offering to further implement our organic growth in our banking markets and for general corporate purposes. We have not specifically allocated the amount of net proceeds to us that will be used for these purposes and our management will have broad discretion over how these proceeds are used. We are conducting this offering at this time because we believe that it will allow us to better execute our growth strategy. Although we may, from time to time in the ordinary course of business, evaluate potential acquisition opportunities for other financial institutions, particularly in ethnic communities that we believe provide attractive risk-adjusted returns, we do not have any immediate plans, arrangements or understanding relating to any acquisitions, nor are we engaged in negotiations with any potential acquisition targets. The ability to issue publicly-traded stock as consideration may enable us to opportunistically approach potential transactions.
Likewise, we regularly consider establishing de novo banking locations and organic growth initiatives within our current and potential new markets. Approximately $1 million of the proceeds will be used to support our new branch opening in Santa Clara, California in the first quarter of 2018. We do not have any other immediate plans, arrangements or understanding relating to the establishment of any de novo banking locations or any other organic growth initiatives outside of the ordinary course of business.
Proceeds held by us will be invested in short-term investments until needed for the uses described above.
45
Table of Contents
The following table shows our capitalization, including regulatory capital ratios, on a consolidated basis, as of December 31, 2017:
| • | on an actual basis; and |
| • | on an as adjusted basis after giving effect to the net proceeds from the sale of 2,000,000 shares by us (assuming the underwriters do not exercise their overallotment option to purchase additional shares) at the public offering price of $11.00 per share, after deducting underwriting discounts and estimated offering expenses. |
You should read the following table in conjunction with the sections titled “Selected Historical Consolidated Financial Data” and “Management’s Discussion and Analysis of Financial Condition and Results of Operations,” and our consolidated financial statements and related notes appearing elsewhere in this prospectus.
| As of December 31, 2017 | ||||||||
| Actual | As adjusted (3) | |||||||
Shareholders’ Equity: | ||||||||
Preferred stock, no par value, 10,000,000 shares authorized; none issued or outstanding | — | — | ||||||
Common stock, no par value, 50,000,000 shares authorized; 13,190,527 shares outstanding; 15,490,527 shares outstanding, as adjusted (1) | $ | 67,925,860 | $ | 87,493,860 | ||||
Additionalpaid-in-capital | 5,279,991 | 5,279,991 | ||||||
Retained earnings | 18,623,952 | 18,623,952 | ||||||
Accumulated other comprehensive loss | (349,853 | ) | (349,853 | ) | ||||
|
|
|
| |||||
Total shareholders’ equity | $ | 91,479,950 | $ | 111,047,950 | ||||
|
|
|
| |||||
Capital ratios: | ||||||||
Tangible common equity to tangible assets (2) | 10.15 | % | 12.06 | % | ||||
Tier 1 leverage average assets | 10.46 | % | 12.41 | % | ||||
Tier 1 common capital to risk-weighted assets | 12.26 | % | 14.80 | % | ||||
Tier 1 capital to risk-weighted assets | 12.26 | % | 14.80 | % | ||||
Total capital to risk-weighted assets | 13.49 | % | 16.03 | % | ||||
|
|
|
| |||||
| (1) | Does not reflect 1,130,000 unissued shares subject to outstanding stock options at December 31, 2017. |
| (2) | Tangible common equity to tangible assets is anon-GAAP financial measure. See “GAAP Reconciliation and Management Explanation ofNon-GAAP Financial Measures” for a reconciliation of this measure to its most comparable GAAP measure. |
46
Table of Contents
If you purchase shares of our common stock in this offering, your ownership interest will experience immediate book value dilution to the extent the public offering price per share exceeds our net tangible book value per share immediately after this offering. Net tangible book value per share represents the amount of our total tangible assets less our total liabilities, divided by the number of shares of common stock outstanding.
Our net tangible book value at December 31, 2017 was $91.5 million, or $6.94 per share based on the number of shares outstanding as of such date. After giving effect to our sale of 2,000,000 shares in this offering at the public offering price of $11.00 per share, and after deducting underwriting discounts and estimated offering expenses, our as adjusted net tangible book value at December 31, 2017, would have been approximately $111.0 million, or $7.31 per share. Therefore, this offering would have resulted in an immediate increase of $0.37 in the net tangible book value per share to our existing shareholders, and immediate dilution of $3.69 in the net tangible book value per share to investors purchasing shares in this offering. The following table illustrates this per share dilution.
Public offering price per share | $ | 11.00 | ||||||
Net tangible book value per share at December 31, 2017 | $ | 6.94 | ||||||
Increase in net tangible book value per share attributable to this offering | $ | 0.37 | ||||||
As adjusted net tangible book value per share after this offering | $ | 7.31 | ||||||
|
| |||||||
Dilution in net tangible book value per share to new investors | $ | 3.69 | ||||||
|
|
If the underwriters exercise their overallotment option to purchase additional shares from us in full, the as adjusted net tangible book value after giving effect to this offering would be $7.37 per share. This represents an increase in net tangible book value of $0.43 per share to existing shareholders and dilution of $3.63 per share to new investors.
The following table sets forth information regarding the shares issued to, and consideration paid by, our existing shareholders and the shares to be issued to, and consideration to be paid by, investors in this offering at the public offering price of $11.00 per share, before deducting underwriting discounts and estimated offering expenses.
| Shares purchased | Total consideration | |||||||||||||||||||
| Number | Percent | Amount | Percent | Average price per share | ||||||||||||||||
Shareholders as of December 31, 2017 | 13,190,527 | 87 | % | $ | 73,205,851 | (1) | 77 | % | $ | 5.55 | ||||||||||
Investors in this offering | 2,000,000 | 13 | % | 22,000,000 | 23 | % | 11.00 | |||||||||||||
|
|
|
|
|
|
|
|
|
| |||||||||||
Total | 15,190,527 | 100.0 | % | $ | 95,205,851 | 100.0 | % | $ | 6.27 | |||||||||||
| (1) | Calculated as approximately $67.9 million in common stock plus approximately $5.3 million in additional paid in capital. |
The tables above exclude 1,130,000 shares of common stock issuable upon exercise of stock options outstanding at December 31, 2017 at a weighted average exercise price of $4.15 per share. If all of these options were exercised as of December 31, 2017, then new investors in this offering would have experienced an additional $0.22 of dilution in net tangible book value per share.
47
Table of Contents
Prior to this offering, the common stock of the Company was quoted on the OTCQB Market, under the symbol “OPBK.” The following table shows the high and low bid quotations of the common stock in each of the previous eight quarters. There may also have been transactions at prices other than those shown during that time.
The Historical Bid Quotations of the Common Stock
Quarters Ending | High | Low | ||||||
December 31, 2017 | $ | 9.95 | $ | 9.11 | ||||
September 30, 2017 | $ | 9.30 | $ | 7.75 | ||||
June 30, 2017 | $ | 7.90 | $ | 7.30 | ||||
March 31, 2017 | $ | 7.70 | $ | 6.95 | ||||
December 31, 2016 | $ | 7.70 | $ | 6.10 | ||||
September 30, 2016 | $ | 6.40 | $ | 5.95 | ||||
June 30, 2016 | $ | 6.10 | $ | 5.65 | ||||
March 31, 2016 | $ | 6.55 | $ | 5.64 | ||||
On December 31, 2017, we had approximately 390 record holders of our common stock. There has been no regular and liquid trading market for the common stock. We have received approval to list our common stock on the Nasdaq Global Market under the symbol “OPBK.” The quoting of our shares on the OTCQB Market will be discontinued concurrently with the listing of our shares on the Nasdaq Global Market.
As of March 26, 2018, the high and low bid quotations of our common stock on the OTCQB were $11.90 and $11.36, respectively.
Dividend Policy
Our shareholders are entitled to receive dividends only if, when and as declared by our board of directors and out of funds legally available therefore. We have paid no cash dividends since our inception and we have no present intent to commence the payment of dividends in the foreseeable future. We anticipate that all of our future earnings will be retained to support our operations and finance the growth and development of our business. Whether or not dividends, either cash or stock, will be paid in the future will be determined by our board of directors in their sole discretion, subject to the satisfaction of any regulatory requirements. Our profitability and regulatory capital ratios, in addition to other financial conditions, will be key factors in determining the payment of dividends.
As a California corporation, we are subject to certain restrictions on dividends under the California General Corporation Law. We are also subject to certain restrictions on the payment of cash dividends as a result of banking laws, regulations and policies. See “Supervision and Regulation—Company—Dividend Payments.”
48
Table of Contents
SELECTED HISTORICAL CONSOLIDATED FINANCIAL AND OPERATING INFORMATION
You should read the selected historical consolidated financial and operating data set forth below in conjunction with the sections titled “Management’s Discussion and Analysis of Financial Condition and Results of Operations” and “Capitalization”, as well as our consolidated financial statements and the related notes included elsewhere in this prospectus. The following table sets forth selected historical consolidated financial data as of the dates and for the periods shown. The selected balance sheet data as of December 31, 2017 and 2016 and the selected income statement data for the years ended December 31, 2017, 2016 and 2015 have been derived from our audited consolidated financial statements included elsewhere in this prospectus. The selected balance sheet data as of December 31, 2015 has been derived from our audited consolidated financial statements that are not included in this prospectus. Our historical results may not be indicative of our future performance. The selected historical consolidated financial and operating information presented below contains financial measures that are not presented in accordance with accounting principles generally accepted in the United States and have not been audited. See “GAAP Reconciliation and Management Explanation ofNon-GAAP Financial Measures.”
| As of or for the year ended December 31, | ||||||||||||
| 2017 | 2016 | 2015 | ||||||||||
| (dollars in thousands, except per share data) | ||||||||||||
Income Statement Data: | ||||||||||||
Interest income | $ | 40,283 | $ | 31,701 | $ | 25,192 | ||||||
Interest expense | 4,573 | 3,371 | 2,689 | |||||||||
Net interest income | 35,710 | 28,330 | 22,503 | |||||||||
Provision for loan losses | 1,311 | 1,682 | 553 | |||||||||
Non-interest income | 8,986 | 9,007 | 7,978 | |||||||||
Non-interest expense | 26,257 | 23,334 | 19,795 | |||||||||
Income before taxes | 17,128 | 12,320 | 10,133 | |||||||||
Provision for income taxes | 7,892 | 4,894 | 4,170 | |||||||||
Net income | 9,236 | 7,425 | 5,963 | |||||||||
Per Share Data: | ||||||||||||
Basic income per share | $ | 0.68 | $ | 0.55 | $ | 0.44 | ||||||
Diluted income per share | $ | 0.66 | $ | 0.53 | $ | 0.43 | ||||||
Book value per share (at period end) | $ | 6.94 | $ | 6.30 | $ | 5.71 | ||||||
Shares of common stock outstanding | 13,190,527 | 12,896,548 | 12,682,510 | |||||||||
Weighted average diluted shares | 13,485,791 | 13,158,155 | 12,944,867 | |||||||||
Balance Sheet Data: | ||||||||||||
Loans held for investment | $ | 748,024 | $ | 674,227 | $ | 507,286 | ||||||
Loans held for sale | 15,739 | 1,646 | 5,579 | |||||||||
Allowance for loan losses | 9,139 | 7,910 | 6,390 | |||||||||
Total assets | 900,999 | 761,250 | 617,350 | |||||||||
Deposits | 773,306 | 661,784 | 519,721 | |||||||||
Shareholders’ equity | 91,480 | 81,284 | 72,479 | |||||||||
Performance Ratios: | ||||||||||||
Return on average assets | 1.13 | % | 1.08 | % | 1.05 | % | ||||||
Return on average equity | 10.63 | 9.69 | 8.63 | |||||||||
Yield on total loans | 5.48 | 5.20 | 5.18 | |||||||||
Yield on average earning assets | 5.20 | 4.85 | 4.70 | |||||||||
Cost of average interest bearing liabilities | 0.97 | 0.83 | 0.79 | |||||||||
Cost of deposits | 0.62 | 0.56 | 0.55 | |||||||||
Net interest margin | 4.61 | 4.34 | 4.20 | |||||||||
Efficiency ratio (1) | 58.74 | 62.50 | 64.94 | |||||||||
49
Table of Contents
| As of or for the year ended December 31, | ||||||||||||
| 2017 | 2016 | 2015 | ||||||||||
| (dollars in thousands, except per share data) | ||||||||||||
Asset Quality Data (at Period End): | ||||||||||||
Net charge-offs to average loans held for investment | 0.01 | % | 0.03 | % | (0.02 | )% | ||||||
Nonperforming assets to loans held for investment plus OREO | 0.14 | 0.09 | 0.20 | |||||||||
ALL to nonperforming loans | 881.29 | 1,373.26 | 615.01 | |||||||||
ALL to loans held for investment | 1.22 | 1.17 | 1.26 | |||||||||
Balance Sheet and Capital Ratios: | ||||||||||||
Loans held for investment to deposits | 96.73 | % | 101.88 | % | 97.61 | % | ||||||
Noninterest bearing deposits to deposits | 37.43 | 37.38 | 29.85 | |||||||||
Tangible common equity to tangible assets (2) | 10.15 | 10.70 | 11.74 | |||||||||
Average equity to average total assets | 10.59 | 11.18 | 12.20 | |||||||||
Leverage ratio | 10.46 | 10.89 | 11.70 | |||||||||
Common equity tier 1 ratio | 12.26 | 12.20 | 14.28 | |||||||||
Tier 1 risk-based capital ratio | 12.26 | 12.20 | 14.28 | |||||||||
Total risk-based capital ratio | 13.49 | 13.40 | 15.53 | |||||||||
Non-owner occupied CRE to total risk-based capital | 296.69 | 293.56 | 233.83 | |||||||||
| (1) | Representsnon-interest expense divided by the sum of net interest income plusnon-interest income. |
| (2) | Represents anon-GAAP financial measure. See “GAAP Reconciliation and Management Explanation ofNon-GAAP Financial Measures” for a reconciliation of ournon-GAAP measure to the most comparable financial measure. |
50
Table of Contents
GAAP RECONCILIATION AND MANAGEMENT EXPLANATION OFNON-GAAP FINANCIAL MEASURES
Some of the financial measures included in our “Summary Historical Consolidated Financial and Operating Information” and “Selected Historical Consolidated Financial and Operating Information” are not measures of financial performance recognized by GAAP. Our management uses thenon-GAAP financial measures set forth below in its analysis of our performance.
| • | “Tangible common equity” is defined as total shareholders’ equity reduced by preferred stock and goodwill and other intangible assets. Management does not consider loan servicing rights as an intangible asset for purposes of this calculation. |
| • | “Tangible assets” is defined as total assets reduced by goodwill and other intangible assets. Management does not consider loan servicing rights as an intangible asset for purposes of this calculation. |
| • | “Tangible common equity to tangible assets” is calculated as tangible common equity divided by tangible assets. This measure is important to investors interested in relative changes in the ratio of total shareholders’ equity to total assets, each exclusive of changes in intangible assets. |
Our management, banking regulators, many financial analysts and other investors use these measures in conjunction with more traditional bank capital ratios to compare the capital adequacy of banking organizations with significant amounts of goodwill or other intangible assets, which typically stem from the use of the purchase accounting method of accounting for mergers and acquisitions. Tangible common equity, tangible assets and related measures should not be considered in isolation or as a substitute for total shareholders’ equity, total assets or any other measure calculated in accordance with GAAP. Moreover, the manner in which we calculate tangible common equity, tangible assets and any other related measures may differ from that of other companies reporting measures with the same or similar names.
The following reconciliation table provides a more detailed analysis of thesenon-GAAP financial measures:
| As of and for the year ended December 31, | ||||||||||||
| 2017 | 2016 | 2015 | ||||||||||
Tangible common equity: | ||||||||||||
Total shareholders’ equity | $ | 91,480 | $ | 81,284 | $ | 72,479 | ||||||
Less: Preferred stock | — | — | — | |||||||||
Less: Goodwill | — | — | — | |||||||||
Less: Core deposit intangibles and other intangibles | — | — | — | |||||||||
Tangible common equity | $ | 91,480 | $ | 81,284 | $ | 72,479 | ||||||
Tangible assets: | ||||||||||||
Total assets | $ | 900,999 | $ | 761,250 | $ | 617,350 | ||||||
Less: Goodwill | — | — | — | |||||||||
Less: Core deposit intangibles and other intangibles | — | — | — | |||||||||
Tangible assets | $ | 900,999 | $ | 761,250 | $ | 617,350 | ||||||
Tangible common equity to tangible assets: | ||||||||||||
Tangible common equity | $ | 91,480 | $ | 81,284 | $ | 72,479 | ||||||
Tangible assets | 900,999 | 761,250 | 617,350 | |||||||||
Tangible common equity to tangible assets | 10.15 | % | 10.68 | % | 11.74 | % | ||||||
51
Table of Contents
MANAGEMENT’S DISCUSSION AND ANALYSIS OF FINANCIAL CONDITION AND RESULTS OF OPERATIONS
The following discussion and analysis of our financial condition and results of operations should be read in conjunction with the “Selected Historical Consolidated Financial Data” and our consolidated financial statements and related notes included elsewhere in this prospectus. This discussion and analysis contains forward-looking statements that involve risks, uncertainties and assumptions. Certain risks, uncertainties and other factors, including but not limited to those set forth under “Cautionary Note Regarding Forward-Looking Statements,” “Risk Factors” and elsewhere in this prospectus, may cause actual results to differ materially from those projected in the forward looking statements. We assume no obligation to update any of these forward-looking statements.
Overview
We are a bank holding company headquartered in Los Angeles, California. Our commercial community banking activities are operated through Open Bank, our banking subsidiary. We offer commercial banking services to small andmedium-sized businesses, their owners and retail customers primarily in the Korean-American community.
Our lending activities are diversified and include commercial real estate, Small Business Administration (“SBA”) guaranteed, commercial and industrial, home mortgage, and consumer loans. We generally lend in markets where we have a physical presence through our branch and loan production offices, and attract deposits throughout our market area through a wide range of deposit products for business banking and retail markets. We offer a multitude of other products and services to our customers to complement our lending and deposit business.
We derive our income primarily from interest received on our loan portfolio, and fee income we receive in connection with our deposits and the sale and service of SBA loans. Our major operating expenses are the interest we pay on deposits, the salaries and related benefits we pay our management and staff and the rent we pay on our leased properties. We rely primarily on locally-generated deposits, mostly from the Korean-American market within California, to fund our loan activities. We currently operate seven branches in Los Angeles County and Orange County. We have three loan production offices in Dallas, Texas, Seattle, Washington and Atlanta, Georgia.
As of December 31, 2017, we had total assets of $901.0 million, gross loans of $748.0 million, total deposits of $773.3 million, and total consolidated shareholders’ equity of $91.5 million. For the years ended December 31, 2017, 2016 and 2015, we recorded net income of $9.2 million, $7.4 million, and $6.0 million, respectively.
Critical Accounting Policies and Estimates
Our accounting and reporting policies conform to accounting principles generally accepted in the United States of America (“GAAP”) and conform to general practices within the industry in which we operate. To prepare financial statements in conformity with GAAP, management makes estimates, assumptions and judgments based on available information. These estimates, assumptions and judgments affect the amounts reported in the financial statements and accompanying notes. These estimates, assumptions and judgments are based on information available as of the date of the financial statements and, as this information changes, actual results could differ from the estimates, assumptions and judgments reflected in the financial statement. In particular, management has identified several accounting policies that, due to the estimates, assumptions and judgments inherent in those policies, are critical in understanding our financial statements.
The following is a discussion of the critical accounting policies and significant estimates that require us to make complex and subjective judgments. Additional information about these policies can be found in Note 2 of our consolidated financial statements as of December 31, 2017, included elsewhere in this prospectus.
52
Table of Contents
Allowance for Loan Losses
The allowance for loan losses (“ALL”) is a valuation allowance for probable incurred credit losses. Loan losses are charged against the allowance when management believes the uncollectibility of a loan balance is confirmed. Subsequent recoveries, if any, are credited to the allowance. Management estimates the allowance balance required using past loan loss experience, the nature and volume of the portfolio, information about specific borrower situations and estimated collateral values, economic conditions, and other factors. Allocations of the allowance may be made for specific loans, but the entire allowance is available for any loan that, in management’s judgment, should be charged off.
The ALL is maintained at a level that management believes is appropriate to provide for known and inherent incurred loan losses as of the date of the consolidated balance sheet and we have established methodologies for the determination of its adequacy. The methodologies are set forth in a formal policy and take into consideration the need for an overall general valuation allowance as well as specific allowances that are determined on an individual loan basis.
The evaluation is inherently subjective, as it requires estimates that are susceptible to significant revision as more information becomes available. While management uses available information to recognize losses on loans, changes in economic or other conditions may necessitate revision of the estimate in future periods.
Servicing Assets
Servicing assets are recognized separately when loans are sold and the rights to service loans are retained. When loans are sold, servicing assets are recorded at fair value in accordance with ASC Topic 860,Transfers and Servicing (“ASC 860”). Fair value is based on market prices for comparable servicing contracts, when available, or alternatively, is based on a valuation model that calculates the present value of estimated future net servicing income. The fair value of servicing rights is highly sensitive to changes in underlying assumptions. Changes in the prepayment speed and discount rate assumptions have the most significant impact on the fair value of servicing assets.
Servicing fee income, which is reported on the income statement as other income, is recorded for fees earned for servicing loans. The fees are based on a contractual percentage of the outstanding principal and are recorded as income when earned. The amortization of servicing assets is netted against loan servicing fee income. Late fees and ancillary fees related to loan servicing are not material.
Fair Value of Financial Instruments
ASC Topic 820,Fair Value Measurement (“ASC 820”), defines fair value as the price that would be received to sell a financial asset or paid to transfer a financial liability in an orderly transaction between market participants at the measurement date. The degree of management judgment involved in determining the fair value of assets and liabilities is dependent upon the availability of quoted market prices or observable market parameters. For financial instruments that trade actively and have quoted market prices or observable market parameters, there is minimal subjectivity involved in measuring fair value. When observable market prices and parameters are not available, management judgment is necessary to estimate fair value. In addition, changes in market conditions may reduce the availability of quoted prices or observable date. See Note 13 of our consolidated financial statements as of December 31, 2017, included elsewhere in this prospectus, for a complete discussion of fair value of financial assets and liabilities and their related measurement practices.
Stock-Based Compensation
We grant stock options to purchase our common stock and restricted stock to our employees and directors under the 2010 Equity Incentive Plan. Additionally, we have outstanding options that were granted under option
53
Table of Contents
plans from which we no longer make grants. The benefits provided under all of these plans are subject to the provisions of accounting guidance related to share based payments. Our results of operations for the calendar years ended December 31, 2017, 2016 and 2015 were impacted by the recognition ofnon-cash expense related to the fair value of our share based compensation awards.
The determination of fair value of stock-based payment awards on the date of grant using the Black Scholes model is affected by our stock price, as well as the input of other subjective assumptions. These assumptions include, but are not limited to, the expected term of stock options and our stock price volatility. Our stock options have characteristics significantly different from those of traded options, and changes in the assumptions can materially affect the fair value estimates.
Current accounting guidance requires forfeitures to be estimated at the time of grant and revised, if necessary, in subsequent periods if actual forfeitures differ from those estimates. If actual forfeitures vary from our estimates, we will recognize the difference in compensation expense in the period the actual forfeitures occur.
Income Taxes
We use the asset and liability method of accounting for income taxes. Under this method, deferred tax assets and liabilities are recognized for the future tax consequences attributable to differences between the financial statement carrying amounts of existing assets and liabilities and their respective tax bases. Deferred tax assets and liabilities are measured using enacted tax rates expected to apply to taxable income in the years in which those temporary differences are expected to be recovered or settled. If current available information raises doubt as to the realization of the deferred tax assets, a valuation allowance may be established. We consider the determination of this valuation allowance to be a critical accounting policy because of the need to exercise significant judgment in evaluating the amount and timing of recognition of deferred tax liabilities and assets, including projections of future taxable income. These judgments and estimates are reviewed on a continual basis as regulatory and business factors change. See Note 9 of our consolidated financial statements as of December 31, 2017, included elsewhere in this prospectus, for additional information. A valuation allowance for deferred tax assets may be required in the future if the amounts of taxes recoverable through loss carry backs decline, if we project lower levels of future taxable income, or we project lower levels of tax planning strategies. Such valuation allowance would be established through a charge to income tax expense that would adversely affect our operating results.
Results of Operations—Comparison of Results of Operations for the Years Ended December 31, 2017 and 2016
The following discussion of our results of operations compares the year ended December 31, 2017 to the year ended December 31, 2016.
We reported net income for the year ended December 31, 2017 of $9.2 million compared to net income of $7.4 million for the year ended December 31, 2016. The increase was due to a $7.4 million increase in net interest income and a $371,000 decrease in provision for loan losses, offset by a $2.9 million increase in noninterest expense and a $3.0 million increase in provision for income taxes, which included a revaluation of deferred tax assets of $1.3 million.
Net Interest Income
The management of interest income and expense is fundamental to our financial performance. Net interest income, the difference between interest income and interest expense, is the largest component of the Company’s total revenue. Management closely monitors both total net interest income and the net interest margin (net interest income divided by average earning assets). We seek to maximize net interest income without exposing the Company to an excessive level of interest rate risk through our asset and liability policies. Interest rate risk is
54
Table of Contents
managed by monitoring the pricing, maturity and repricing options of all classes of interest-bearing assets and liabilities. Our net interest margin is also adversely impacted by the reversal of interest on nonaccrual loans and the reinvestment of loan payoffs into lower yielding investment securities and other short-term investments.
The following table presents, for the periods indicated, information about: (i) weighted average balances, the total dollar amount of interest income from interest-earning assets and the resultant average yields; (ii) average balances, the total dollar amount of interest expense on interest-bearing liabilities and the resultant average rates; (iii) net interest income; (iv) the interest rate spread; and (v) the net interest margin.
| Year Ended December 31, | ||||||||||||||||||||||||
| 2017 | 2016 | |||||||||||||||||||||||
(Dollars in thousands) | Average Balance | Interest and Fees | Yield / Rate | Average Balance | Interest and Fees | Yield / Rate | ||||||||||||||||||
Earning assets: | ||||||||||||||||||||||||
Federal funds sold and other investments (1) | $ | 22,926 | $ | 495 | 2.16 | % | $ | 26,213 | $ | 507 | 1.93 | % | ||||||||||||
Securities available for sale | 37,620 | 676 | 1.80 | 40,159 | 664 | 1.65 | ||||||||||||||||||
|
|
|
|
|
|
|
|
|
|
|
| |||||||||||||
Total investments | 60,546 | 1,171 | 1.93 | 66,372 | 1,171 | 1.76 | ||||||||||||||||||
Real estate | 384,462 | 18,721 | 4.87 | 315,244 | 14,046 | 4.46 | ||||||||||||||||||
SBA | 123,822 | 9,430 | 7.62 | 103,313 | 7,414 | 7.18 | ||||||||||||||||||
C & I | 98,455 | 5,346 | 5.43 | 73,803 | 3,845 | 5.21 | ||||||||||||||||||
Home Mortgage | 103,191 | 5,344 | 5.18 | 88,282 | 4,694 | 5.32 | ||||||||||||||||||
Consumer | 4,385 | 271 | 6.18 | 5,986 | 531 | 8.87 | ||||||||||||||||||
|
|
|
|
|
|
|
|
|
|
|
| |||||||||||||
Loans (2) | 714,315 | 39,112 | 5.48 | 586,628 | 30,530 | 5.20 | ||||||||||||||||||
|
|
|
|
|
|
|
|
|
|
|
| |||||||||||||
Total earning assets | 774,861 | 40,283 | 5.20 | 653,000 | 31,701 | 4.85 | ||||||||||||||||||
Noninterest-earning assets | 45,499 | 32,617 | ||||||||||||||||||||||
|
|
|
| |||||||||||||||||||||
Total assets | 820,360 | 685,617 | ||||||||||||||||||||||
|
|
|
| |||||||||||||||||||||
Interest-bearing liabilities: | ||||||||||||||||||||||||
NOW and savings deposits | 6,137 | 15 | 0.24 | % | 4,058 | 10 | 0.25 | % | ||||||||||||||||
Money market deposits | 258,019 | 2,344 | 0.91 | 202,737 | 1,736 | 0.86 | ||||||||||||||||||
Time deposits | 196,831 | 2,111 | 1.07 | 181,191 | 1,540 | 0.85 | ||||||||||||||||||
|
|
|
|
|
|
|
|
|
|
|
| |||||||||||||
Total interest-bearing deposits | 460,987 | 4,470 | 0.97 | 387,986 | 3,286 | 0.85 | ||||||||||||||||||
Borrowings | 9,302 | 103 | 1.11 | 16,986 | 85 | 0.50 | ||||||||||||||||||
|
|
|
|
|
|
|
|
|
|
|
| |||||||||||||
Total interest-bearing liabilities | 470,289 | 4,573 | 0.97 | 404,972 | 3,371 | 0.83 | ||||||||||||||||||
|
|
|
|
|
|
|
|
|
|
|
| |||||||||||||
Noninterest-bearing liabilities: | ||||||||||||||||||||||||
Noninterest-bearing deposits | 256,267 | 198,413 | ||||||||||||||||||||||
Other noninterest-bearing liabilities | 6,895 | 5,585 | ||||||||||||||||||||||
|
|
|
| |||||||||||||||||||||
Total noninterest-bearing liabilities | 263,162 | 203,998 | ||||||||||||||||||||||
Shareholders’ equity | 86,909 | 76,647 | ||||||||||||||||||||||
|
|
|
| |||||||||||||||||||||
Total liabilities and shareholders’ equity | $ | 820,360 | $ | 685,617 | ||||||||||||||||||||
|
|
|
| |||||||||||||||||||||
|
|
|
|
|
|
|
| |||||||||||||||||
Net interest income / interest rate spreads | $ | 35,710 | 4.23 | % | $ | 28,330 | 4.02 | % | ||||||||||||||||
|
|
|
| |||||||||||||||||||||
|
|
|
| |||||||||||||||||||||
Net interest margin | 4.61 | % | 4.34 | % | ||||||||||||||||||||
|
|
|
| |||||||||||||||||||||
| (1) | Includes income and average balances for FHLB and Pacific Coast Bankers Bank (“PCBB”) stock, term federal funds, interest-earning time deposits and other miscellaneous interest-earning assets. |
| (2) | Average loan balances include non-accrual loans and loans held for sale. |
Increases and decreases in interest income and interest expense result from changes in average balances (volume) of interest-earning assets and interest-bearing liabilities, as well as changes in average interest rates.
55
Table of Contents
The following tables set forth the effects of changing rates and volumes on our net interest income during the period shown. Information is provided with respect to (i) effects on interest income attributable to changes in volume (change in volume multiplied by prior rate) and (ii) effects on interest income attributable to changes in rate (changes in rate multiplied by prior volume). Change applicable to both volume and rate have been allocated to volume.
| Year Ended December 31, | ||||||||||||
| 2017 over 2016 | ||||||||||||
| Change due to: | ||||||||||||
| Volume | Rate | Interest Variance | ||||||||||
| (Dollars in thousands) | ||||||||||||
Earning assets: | ||||||||||||
Federal funds sold and other investments | $ | (68 | ) | $ | 56 | $ | (12 | ) | ||||
Securities available for sale | (47 | ) | 59 | 12 | ||||||||
|
|
|
|
|
| |||||||
Total investments | (115 | ) | 115 | — | ||||||||
Real estate | 3,295 | 1,380 | 4,675 | |||||||||
SBA | 1,540 | 476 | 2,016 | |||||||||
C & I | 1,333 | 168 | 1,501 | |||||||||
Home Mortgage | 776 | (126 | ) | 650 | ||||||||
Consumer | (122 | ) | (138 | ) | (260 | ) | ||||||
|
|
|
|
|
| |||||||
Loans | 6,822 | 1,760 | 8,582 | |||||||||
|
|
|
|
|
| |||||||
Total earning assets | 6,707 | 1,875 | 8,582 | |||||||||
NOW and savings deposits | 5 | — | 5 | |||||||||
Money market deposits | 501 | 107 | 608 | |||||||||
Time deposits | 143 | 428 | 571 | |||||||||
|
|
|
|
|
| |||||||
Total interest-bearing deposits | 649 | 535 | 1,184 | |||||||||
Borrowings | (51 | ) | 69 | 18 | ||||||||
|
|
|
|
|
| |||||||
Total interest-bearing liabilities | 598 | 604 | 1,202 | |||||||||
|
|
|
|
|
| |||||||
Net interest income | $ | 6,109 | $ | 1,271 | $ | 7,380 | ||||||
|
|
|
|
|
| |||||||
Net interest income for the year ended December 31, 2017 was $35.7 million compared to $28.3 million for the year ended December 31, 2016, an increase of $7.4 million, or 26.1%. This increase was primarily due to an 18.7% increase in the average balance of interest-earning assets, coupled with a 35 basis point improvement in the average yield on interest-earning assets, offset by a 14 basis point increase in the average rate paid on interest-bearing liabilities. The increase in the average balance of interest-earning assets was primarily due to an increase in average loans outstanding. The increase in the average yield on interest-earning assets was primarily due to cumulative market rate increases by the Federal Reserve of 100 basis points through four rate increases in each of December 2016, March 2017, June 2017 and December 2017.
Total interest income was $40.3 million in 2017 compared to $31.7 million in 2016, an increase of $8.6 million, or 27.1%. This increase was primarily due to an increase in interest earned on our loan portfolio. Interest and fees on loans was $39.1 million in 2017 compared to $30.5 million in 2016, an increase of $8.6 million, or 28.1%. This increase in interest income on loans was primarily due to a 21.8% increase in the average balance of loans outstanding and a 28 basis point improvement in the average yield on loans.
Interest income on total investments was $1.2 million in 2017 and 2016. Interest income on the securities portfolio increased $12,000, or 1.8%, to $676,000 in 2017 compared to $664,000 in 2016. The increase in interest income on the securities portfolio was primarily due to a 15 basis point increase in the average yield on the securities portfolio. Interest income on federal funds sold and other investments decreased $12,000, or 2.4%, to $495,000 in 2017 from $507,000 in 2016, due to a 12.5% decrease in the average balance of federal funds sold, offset by a 23 basis point increase in the average yield on federal fund sold and other investments.
56
Table of Contents
Total interest expense was $4.6 million in 2017 compared to $3.4 million in 2016, an increase of $1.2 million, or 35.7%. The increase was primarily due to increases in interest expense on deposits. Interest expense on deposits was $4.5 million in 2017 compared to $3.3 million in 2016, an increase of $1.2 million, or 36.0%. This increase was primarily due to an 18.8% increase in the average balance of interest-bearing deposits, coupled with a 12 basis point increase in the average interest rate paid.
Net interest margins for the years ended December 31, 2017 and 2016 were 4.61% and 4.34%, respectively.
Provision for Loan Losses
Credit risk is inherent in the business of making loans. We establish an allowance for loan losses through charges to earnings, which are shown in the statements of operations as the provision for loan losses. Specifically identifiable and quantifiable known losses are promptly charged off against the allowance. The provision for loan losses is determined by conducting a quarterly evaluation of the adequacy of our allowance for loan losses and charging the shortfall or excess, if any, to the current quarter’s expense. This has the effect of creating variability in the amount and frequency of charges to earnings. The provision for loan losses and level of allowance for each period are dependent upon many factors, including loan growth, net charge-offs, changes in the composition of the loan portfolio, delinquencies, management’s assessment of the quality of the loan portfolio, the valuation of problem loans and the general economic conditions in our market area.
The provision for loan losses for the year ended December 31, 2017 was $1.3 million compared to $1.7 million for the year ended December 31, 2016, a decrease of $371,000, or 22.1%. The decrease was primarily due to slower growth in our loan portfolio in 2017 compared to in 2016. Our gross loans increased 11% in 2017 compared to 33% in 2016.
The allowance for loan losses as a percentage of loans held for investment was 1.22% at December 31, 2017 and 1.17% at December 31, 2016.
Noninterest Income
While interest income remains the largest single component of total revenues, noninterest income is also an important component. A portion of our noninterest income is associated with SBA lending activity, consisting of gains on the sale of loans sold in the secondary market and servicing income from loans sold with servicing retained. Other sources of noninterest income include loan servicing fees, service charges and fees, and gains on the sale of securities.
Noninterest income for the year ended December 31, 2017 was $9.0 million, a decrease of $21,000, or 0.2%, compared to $9.0 million for the year ended December 31, 2016.
The following table sets forth the various components of our noninterest income for the years ended December 31, 2017 and 2016:
| Year Ended December 31, | ||||||||||||
| (Dollars in thousands) | 2017 | 2016 | Increase (decrease) | |||||||||
Noninterest income: | ||||||||||||
Service charges on deposit accounts | $ | 1,656 | $ | 1,275 | $ | 381 | ||||||
Loan servicing fees, net of amortization | 1,127 | 1,313 | (186 | ) | ||||||||
Gain on sale of loans | 4,939 | 5,507 | (568 | ) | ||||||||
Other income and fees | 1,264 | 912 | 352 | |||||||||
|
|
|
|
|
| |||||||
Total noninterest income | $ | 8,986 | $ | 9,007 | $ | (21 | ) | |||||
|
|
|
|
|
| |||||||
57
Table of Contents
Total gain on sale of loans was $4.9 million in the year ended December 31, 2017 compared to $5.5 million for the same period of 2016, a decrease of $568,000 or 10.3%.
Gain on sale of SBA loans totaled $4.8 million in the year ended December 31, 2017 compared to $5.4 million for the same period of 2016. We sold $66.2 million in SBA loans with an average premium of 9.30% in the year ended December 31, 2017 compared to the sale of $83.4 million in SBA loans with an average premium of 8.93% in the same period of 2016, primarily due to a lower production in SBA loans in 2017 compared to 2016. We originated $99.7 million of SBA loans in 2017 compared to $111.5 million in 2016. Other loans sold by us during both periods were immaterial.
Loan servicing income, net of amortization decreased by $186,000 to $1.1 million in 2017 compared to $1.3 million in 2016. The decrease in loan servicing income was due, in part, to a $521,000 increase in servicing asset amortization expense, offset by a $335,000 increase in servicing fees. Our total SBA loan servicing portfolio was $309.3 million as of December 31, 2017 compared to $303.8 million as of December 31, 2016. The increase in the servicing portfolio reflects the sales of SBA loans in 2017.
The servicing assets that result from the sales of SBA loans with servicing retained are amortized over the expected term of the loans using a method approximating the interest method. Servicing income generally declines as the respective loans are repaid.
Noninterest Expense
Noninterest expense for the year ended December 31, 2017 was $26.3 million compared to $23.3 million for the year ended December 31, 2016, an increase of $2.9 million, or 12.5%. The following table sets forth the major components of our noninterest expense for the years ended December 31, 2017 and 2016:
| Year Ended December 31, | ||||||||||||
| (Dollars in thousands) | 2017 | 2016 | Increase (decrease) | |||||||||
Noninterest expense: | ||||||||||||
Salaries and employee benefits | $ | 16,474 | $ | 14,556 | $ | 1,918 | ||||||
Occupancy and equipment | 3,918 | 3,616 | 302 | |||||||||
Data processing and communication | 1,323 | 1,087 | 236 | |||||||||
Professional fees | 589 | 684 | (95 | ) | ||||||||
FDIC insurance and regulatory assessments | 377 | 369 | 8 | |||||||||
Promotion and advertising | 631 | 557 | 74 | |||||||||
Directors’ fees and stock-based compensation | 796 | 758 | 38 | |||||||||
Foundation donation and other contributions | 954 | 745 | 209 | |||||||||
Other expenses | 1,195 | 962 | 233 | |||||||||
|
|
|
|
|
| |||||||
Total noninterest expense | 26,257 | 23,334 | 2,923 | |||||||||
|
|
|
|
|
| |||||||
Salaries and employee benefits expense for the year ended December 31, 2017 was $16.5 million compared to $14.6 million for the year ended December 31, 2016, an increase of $1.9 million, or 13.2%. This increase was attributable to an increase in the number of employees to support continued growth, annual salary adjustments, increased bonus and incentives and increased benefit costs. The average number of full-time equivalent employees was 130.4 in 2017 compared to 125.0 in 2016.
Occupancy and equipment expense for 2017 was $3.9 million compared to $3.6 million for 2016, an increase of $302,000, or 8.4%. This increase was primarily due to the commencement of the lease for the Santa Clara office in mid-2017 which will open in the first quarter of 2018, and the increased rental expense from the lease renewals of the Fashion District and Gardena Offices in 2017.
58
Table of Contents
Data processing and communication expense for 2017 was $1.3 million compared to $1.1 million for 2016, an increase of $236,000, or 21.7%. This increase was primarily due a continued growth in our loans and deposits.
Professional fees for 2017 were $589,000 compared to $684,000 for 2016, a decrease of $95,000, or 13.9%. This decrease was primarily due to the costs incurred in 2016 associated with the formation of OP Bancorp as a bank holding company and the completion of the transactions under which Open Bank became a wholly-owned subsidiary of OP Bancorp, offset by the professional fees incurred in the fourth quarter of 2017 attributable to this offering.
FDIC insurance and regulatory assessment expense for 2017 was $377,000 compared to $369,000 for 2016, an increase of $8,000 or 2.2%. This increase was primarily due to an increase in our FDIC insurance and DBO regulatory assessment as the size of our assets continued to grow.
Promotion and advertising expense for 2017 was $631,000 compared to $557,000 for 2016, an increase of $74,000 or 13.3%. The increase was consistent with a continued growth of our loans and deposits.
Directors’ fees and expenses for 2017 were $796,000 compared to $758,000 for 2016, an increase of $38,000 or 5.0%. Directors’ fees and expenses include a monthly retainer fee, reimbursement for travel and other expenses, and stock-based expenses relating to equity awards granted in prior years under our equity plans to our directors. Directors’ fees and expenses (not including stock-based expenses) for 2017 was $365,000 compared to $327,000 in 2016, an increase of $38,000, or 11.5%. The increase was due to the increase in directors’ monthly retainer fees in 2017. Directors’ stock-based expenses for 2017 and 2016 were $431,000.
Our aggregate donations to the Foundation and other charitable and community contributions for 2017 were $954,000 compared to $745,000 for 2016, an increase of $209,000, or 28.1%. The increase was due to increased donation accruals for Open Stewardship Foundation, which is directly proportionate to the growth in our after tax income. On an annual basis, we donate 10% of our consolidated net income after taxes to the Foundation.
Other expenses for 2017 were $1.2 million compared to $964,000 in 2016, an increase of $232,000, or 24.1%. The increase was primarily due to increased operating expenses and customer service expenses.
Income Tax Expense
Income tax expense was $7.9 million in 2017 compared to $4.9 million in 2016. The increase in income tax expense was related to growth in pre-tax income and a revaluation of deferred tax assets of $1.3 million, as discussed below. Effective tax rates were 46.1% and 39.7% in 2017 and 2016, respectively.
On December 22, 2017, H.R.1, commonly known as the Tax Cuts and Jobs Act (the “Tax Act”), was signed into law, which among other items reduces the federal corporate tax rate to 21% from 34%, effective January 1, 2018. U.S. generally accepted accounting principles require companies to revalue certain tax-related assets as of the date of enactment of the new legislation with resulting tax effects accounted for in the reporting period of enactment. As a result, we performed an analysis to determine the impact of the revaluation of the net deferred tax asset. The value of the deferred tax asset was reduced by $1.3 million, and recorded as tax expense for the year ended December 31, 2017.
Some items of income and expense are recognized in different years for tax purposes than when applying generally accepted accounting principles leading to timing differences between our actual tax liability, and the amount accrued for this liability based on book income. These temporary differences comprise the “deferred” portion of our tax expense or benefit, which accumulates on our books as a deferred tax asset or deferred tax liability until such time as they reverse.
59
Table of Contents
Realization of deferred tax assets is primarily dependent upon us generating sufficient future taxable income to obtain benefit from the reversal of net deductible temporary differences and the utilization of tax credit carry forwards and the net operating loss carry forwards for Federal and California state income tax purposes. The amount of deferred tax assets considered realizable is subject to adjustment in future periods based on estimates of future taxable income. Under generally accepted accounting principles a valuation allowance is required to be recognized if it is “more likely than not” that the deferred tax assets will not be realized. The determination of the realizability of the deferred tax assets is highly subjective and dependent upon judgment concerning management’s evaluation of both positive and negative evidence, including forecasts of future income, cumulative losses, applicable tax planning strategies, and assessments of current and future economic and business conditions.
We had net deferred tax assets of $3.4 million and $3.3 million at December 31, 2017, and December 31, 2016, respectively.
After consideration of the matters in the preceding paragraph, we have determined that it is more likely than not that net deferred tax assets at December 31, 2017 and December 31, 2016 will be fully realized in future years.
Results of Operations—Comparison of Results of Operations for the Years Ended December 31, 2016 and 2015
The following discussion of our results of operations compares the year ended December 31, 2016 to the year ended December 31, 2015.
We reported net income for the year ended December 31, 2016 of $7.4 million compared to net income of $6.0 million for the year ended December 31, 2015. The increase was due to a $5.8 million increase in net interest income and a $1.0 million increase in noninterest income offset by a $3.5 million increase in noninterest expense and a $1.1 million increase in provision for loan losses and a $700,000 increase in provision for income taxes.
60
Table of Contents
Net Interest Income
The following table presents, for the periods indicated, information about our: (i) weighted average balances, the total dollar amount of interest income from interest-earning assets and the resultant average yields; (ii) average balances, the total dollar amount of interest expense on interest-bearing liabilities and the resultant average rates; (iii) net interest income; (iv) the interest rate spread; and (v) the net interest margin.
| Year Ended December 31, | ||||||||||||||||||||||||
| 2016 | 2015 | |||||||||||||||||||||||
| (Dollars in thousands) | Average Balance | Interest and Fees | Yield / Rate | Average Balance | Interest and Fees | Yield / Rate | ||||||||||||||||||
Earning assets: | ||||||||||||||||||||||||
Federal funds sold and other investments (1) | $ | 26,213 | $ | 507 | 1.93 | % | $ | 36,963 | $ | 383 | 1.04 | % | ||||||||||||
Securities available for sale | 40,159 | 664 | 1.65 | 28,577 | 480 | 1.68 | ||||||||||||||||||
|
|
|
|
|
|
|
|
|
|
|
| |||||||||||||
Total investments | 66,372 | 1,171 | 1.76 | 65,540 | 863 | 1.32 | ||||||||||||||||||
Real estate | 315,244 | 14,046 | 4.46 | 243,621 | 10,963 | 4.50 | ||||||||||||||||||
SBA | 103,313 | 7,414 | 7.18 | 84,751 | 6,088 | 7.18 | ||||||||||||||||||
Commercial & Industrial | 73,803 | 3,845 | 5.21 | 64,702 | 3,066 | 4.74 | ||||||||||||||||||
Home Mortgage | 88,282 | 4,694 | 5.32 | 68,979 | 3,698 | 5.36 | ||||||||||||||||||
Consumer | 5,986 | 531 | 8.87 | 7,774 | 514 | 6.61 | ||||||||||||||||||
|
|
|
|
|
|
|
|
|
|
|
| |||||||||||||
Loans (2) | 586,628 | 30,530 | 5.20 | 469,827 | 24,329 | 5.18 | ||||||||||||||||||
|
|
|
|
|
|
|
|
|
|
|
| |||||||||||||
Total earning assets | 653,000 | 31,701 | 4.85 | 535,367 | 25,192 | 4.70 | ||||||||||||||||||
Noninterest-earning assets | 32,617 | 30,800 | ||||||||||||||||||||||
|
|
|
| |||||||||||||||||||||
Total assets | 685,617 | 566,167 | ||||||||||||||||||||||
|
|
|
| |||||||||||||||||||||
Interest-bearing liabilities: | ||||||||||||||||||||||||
NOW and savings deposits | 4,058 | 10 | 0.25 | % | 3,276 | 8 | 0.24 | % | ||||||||||||||||
Money market deposits | 202,737 | 1,736 | 0.86 | 163,887 | 1,505 | 0.92 | ||||||||||||||||||
Time deposits | 181,191 | 1,540 | 0.85 | 151,715 | 1,092 | 0.72 | ||||||||||||||||||
|
|
|
|
|
|
|
|
|
|
|
| |||||||||||||
Total interest-bearing deposits | 387,986 | 3,286 | 0.85 | 318,878 | 2,605 | 0.82 | ||||||||||||||||||
Borrowings | 16,986 | 85 | 0.50 | 20,001 | 84 | 0.42 | ||||||||||||||||||
|
|
|
|
|
|
|
|
|
|
|
| |||||||||||||
Total interest-bearing liabilities | 404,972 | 3,371 | 0.83 | 338,879 | 2,689 | 0.79 | ||||||||||||||||||
|
|
|
|
|
|
|
|
|
|
|
| |||||||||||||
Noninterest-bearing liabilities: | ||||||||||||||||||||||||
Noninterest-bearing deposits | 198,413 | 153,435 | ||||||||||||||||||||||
Other noninterest-bearing liabilities | 5,585 | 4,784 | ||||||||||||||||||||||
|
|
|
| |||||||||||||||||||||
Total noninterest-bearing liabilities | 203,998 | 158,219 | ||||||||||||||||||||||
Shareholders’ equity | 76,647 | 69,069 | ||||||||||||||||||||||
|
|
|
| |||||||||||||||||||||
Total liabilities and shareholders’ equity | $ | 685,617 | $ | 566,167 | ||||||||||||||||||||
|
|
|
| |||||||||||||||||||||
|
|
|
|
|
|
|
| |||||||||||||||||
Net interest income / interest rate spreads | $ | 28,330 | 4.02 | % | $ | 22,503 | 3.91 | % | ||||||||||||||||
|
|
|
| |||||||||||||||||||||
|
|
|
| |||||||||||||||||||||
Net interest margin | 4.34 | % | 4.20 | % | ||||||||||||||||||||
|
|
|
| |||||||||||||||||||||
| (1) | Includes income and average balances for FHLB and PCBB stock, term federal funds, interest-earning time deposits and other miscellaneous interest-earning assets. |
| (2) | Average loan balances include non-accrual loans and loans held for sale. |
61
Table of Contents
Increases and decreases in interest income and interest expense result from changes in average balances (volume) of interest-earning assets and interest-bearing liabilities, as well as changes in average interest rates. The following tables set forth the effects of changing rates and volumes on our net interest income during the period shown. Information is provided with respect to (i) effects on interest income attributable to changes in volume (change in volume multiplied by prior rate) and (ii) effects on interest income attributable to changes in rate (changes in rate multiplied by prior volume). Change applicable to both volume and rate have been allocated to volume.
| Year Ended December 31, | ||||||||||||
| 2016 over 2015 | ||||||||||||
| Increase (Decrease) Due to Change due in: | ||||||||||||
| (Dollars in thousands) | Average Volume | Average Rate | Net Interest Variance | |||||||||
Earning assets: | ||||||||||||
Federal funds sold and other investments | $ | (135 | ) | $ | 259 | $ | 124 | |||||
Securities available for sale | 194 | (10 | ) | 184 | ||||||||
|
|
|
|
|
| |||||||
Total investments | 59 | 249 | 308 | |||||||||
Real estate | 3,182 | (99 | ) | 3,083 | ||||||||
SBA | 1,326 | — | 1,326 | |||||||||
Commercial & Industrial | 457 | 322 | 779 | |||||||||
Home Mortgage | 1,024 | (28 | ) | 996 | ||||||||
Consumer | (134 | ) | 151 | 17 | ||||||||
|
|
|
|
|
| |||||||
Total loans | 5,855 | 346 | 6,201 | |||||||||
|
|
|
|
|
| |||||||
Total earning assets | 5,914 | 595 | 6,509 | |||||||||
Expense from interest-bearing liabilities | ||||||||||||
NOW and savings deposits | $ | 2 | $ | — | $ | 2 | ||||||
Money market deposits | 335 | (104 | ) | 231 | ||||||||
Time deposits | 232 | 216 | 448 | |||||||||
|
|
|
|
|
| |||||||
Total interest-bearing deposits | 569 | 112 | 681 | |||||||||
Borrowings | (14 | ) | 15 | 1 | ||||||||
|
|
|
|
|
| |||||||
Total interest-bearing liabilities | 555 | 127 | 682 | |||||||||
|
|
|
|
|
| |||||||
Net interest income | $ | 5,359 | $ | 468 | $ | 5,827 | ||||||
|
|
|
|
|
| |||||||
Net interest income for the year ended December 31, 2016 was $28.3 million compared to $22.5 million for the year ended December 31, 2015, an increase of $5.8 million, or 25.9%. This increase was primarily due to a 22.0% increase in the average balance of interest-earning assets, coupled with a 15 basis point improvement in the average yield on interest-earning assets. The increase in the average balance of interest-earning assets was primarily due to an increase in average loans outstanding. The increase in the average yield on interest-earning assets was primarily due to an increase in the federal funds rate of 25 basis points in December 2015.
Total interest income was $31.7 million in 2016 compared to $25.2 million in 2015, an increase of $6.5 million, or 25.8%. This increase was primarily due to an increase in interest earned on our loan portfolio. Interest and fees on loans was $30.5 million in 2016 compared to $24.3 million in 2015, an increase of $6.2 million, or 25.5%. This increase in interest income on loans was primarily due to a 24.9% increase in the average balance of loans outstanding. The increase in the average balance of loans outstanding was primarily due to continued organic growth in most of our loan categories.
Interest income on total investments increased $308,000, or 35.7%, to $1.2 million in 2016 compared to $864,000 in 2015. Interest income on the securities portfolio increased $184,000, or 38.3%, to $664,000 in 2016
62
Table of Contents
compared to $480,000 in 2015. The increase in interest income on the securities portfolio was primarily due to a $11.6 million, or 40.5%, increase in the average balance of our securities portfolio. We purchased $30.1 million of home mortgage-backed securities and collateralized mortgage obligations in 2015. Interest income on federal funds sold, cash equivalents and other investments increased $124,000, or 32.0%, to $507,000 in 2016 from $383,000 in 2015 primarily due to an increase of $95,000 in FHLB stock dividend in 2016.
Total interest expense was $3.4 million in 2016 compared to $2.7 million in 2015, an increase of $700,000, or 25.4%. The increase was primarily due to increases in interest expense on deposits. Interest expense on deposits was $3.3 million in 2016 compared to $2.6 million in 2015, an increase of $700,000, or 26.1%. This increase was primarily due to a 21.7% increase in the average balance of interest-bearing deposits, coupled with a three basis point increase in the average interest rate paid.
Net interest margins for the years ended December 31, 2016 and 2015 were 4.34% and 4.20%, respectively.
Provision for Loan Losses
The provision for loan losses for the year ended December 31, 2016 was $1.7 million compared to $553,000 for the year ended December 31, 2015, an increase of $1.1 million, or 204%, which was primarily due to the growth of our loan portfolio. The allowance for loan losses as a percentage of loans was 1.17% at December 31, 2016 and 1.26% at December 31, 2015.
Noninterest Income
Noninterest income for the year ended December 31, 2016 was $9.0 million compared to $8.0 million for the year ended December 31, 2015, an increase of $1.0 million, or 12.9%. The following table sets forth the various components of our noninterest income for the years ended December 31, 2016 and 2015:
| Year Ended December 31, | ||||||||||||
| (Dollars in thousands) | 2016 | 2015 | Increase (decrease) | |||||||||
Noninterest Income: | ||||||||||||
Service charges on deposit accounts | $ | 1,275 | $ | 1,278 | $ | (3 | ) | |||||
Loan servicing fees, net of amortization | 1,313 | 1,131 | 182 | |||||||||
Gain on sale of loans | 5,507 | 4,669 | 838 | |||||||||
Other income and fees | 912 | 900 | 12 | |||||||||
|
|
|
|
|
| |||||||
Total noninterest income | $ | 9,007 | $ | 7,978 | $ | 1,029 | ||||||
|
|
|
|
|
| |||||||
Total gain on sale of loans during 2016 was $5.5 million in the year ended December 31, 2016 compared to $4.7 million for the same period of 2015, an increase of $800,000 or 17.9%.
Gain on sale of SBA loans totaled $5.4 million in the year ended December 31, 2016 compared to $4.6 million for the same period of 2015. We sold $83.4 million in SBA loans with an average premium of 8.93% in the year ended December 31, 2016 compared to the sale of $64.8 million with an average premium of 9.46% in the same period of 2015. Other loans sold by us during the period were immaterial.
Loan servicing income, net of amortization increased by $200,000 to $1.3 million in 2016 compared to $1.1 million in 2015. The increase in loan servicing income was due to an increase in SBA loans being serviced. Our total SBA loan servicing portfolio was $303.8 million as of December 31, 2016 compared to $260.5 million as of December 31, 2015. The increase in the servicing portfolio reflects the growth in our originations and sales of SBA loans in 2016.
63
Table of Contents
Noninterest Expense
Noninterest expense for the year ended December 31, 2016 was $23.3 million compared to $19.8 million for the year ended December 31, 2015, an increase of $3.5 million, or 17.9%. The following table sets forth the various components of our noninterest expense for the years ended December 31, 2016 and 2015:
| Year Ended December 31, | ||||||||||||
| (Dollars in thousands) | 2016 | 2015 | Increase (decrease) | |||||||||
Noninterest expense: | ||||||||||||
Salaries and employee benefits | $ | 14,556 | $ | 12,253 | $ | 2,303 | ||||||
Occupancy and equipment | 3,616 | 3,162 | 454 | |||||||||
Data processing and communication | 1,087 | 784 | 303 | |||||||||
Professional fees | 684 | 413 | 271 | |||||||||
FDIC insurance and regulatory assessments | 369 | 307 | 62 | |||||||||
Promotion and advertising | 557 | 532 | 25 | |||||||||
Directors’ fees and stock-based compensation | 758 | 784 | (26 | ) | ||||||||
Foundation donation and other contributions | 745 | 602 | 143 | |||||||||
Other expenses | 962 | 958 | 4 | |||||||||
|
|
|
|
|
| |||||||
Total noninterest expense | 23,334 | 19,795 | 3,539 | |||||||||
|
|
|
|
|
| |||||||
Salaries and employee benefits expense for the year ended December 31, 2016 was $14.6 million compared to $12.3 million for the year ended December 31, 2015, an increase of $2.3 million, or 18.8%. This increase was attributable to an increase in the number of employees to support continued growth, annual salary adjustments, increased bonus and incentives and increased benefit costs. The number of full-time equivalent employees was 129.5 at December 31, 2016 compared to 115.5 at December 31, 2015.
Occupancy and equipment expense for 2016 was $3.6 million compared to $3.2 million for 2015, an increase of $454,000, or 14.4%. This increase was mainly due to the opening of the Western office inmid-2015 and the three loan production offices in 2016.
Data processing and communication expense for 2016 was $1.1 million compared to $784,000 for 2015, an increase of $303,000, or 38.6%. This increase was primarily due a continued growth in operations.
Professional fees for 2016 was $684,000 compared to $413,000 for 2015, and increase of $271,000, or 65.6%. This increase was primarily due to higher costs associated with the PCAOB standards audit conducted during 2016 for years 2016 and 2015 and the costs incurred in 2016 associated with the formation of OP Bancorp as a bank holding company and completion of the transactions under which Open Bank became a wholly-owned subsidiary of OP Bancorp.
FDIC insurance and regulatory assessment expense for 2016 was $369,000 compared to $307,000 for 2015, an increase of $62,000 or 20.2%. This increase was primarily due to an increase in our FDIC insurance and DBO regulatory assessment as we continued to grow in assets.
Promotion and advertising expense for 2016 was $557,000 compared to $532,000 for 2015, an increase of $25,000 or 4.7%. The increase was consistent with a continued growth of our loans and deposits.
Directors’ fees and expenses for 2016 were $758,000 compared to $784,000 for 2015, a decrease of $26,000 or 3.3%. Directors’ fees and expenses include a monthly retainer fee, reimbursement for traveling and other expenses, and stock-based expenses relating to equity awards granted in prior years under our equity plans to our directors. Directors’ fees and expenses (not including stock-based expenses) for 2016 was $327,000 compared to
64
Table of Contents
$282,000 for 2015, an increase of $45,000, or 16.0%. The increase was due to the increase in directors’ monthly retainer fees in 2016. Director’s stock-based expenses for 2016 was $431,000 compared to $502,000 for 2015, a decrease of $71,000, or 14.1%. The decrease was the result of more stock options vesting in 2015 compared to 2016.
Our aggregate donations to the Foundation and other charitable and community contributions for 2016 were $745,000 compared to $602,000 for 2015, an increase of $143,000, or 23.8%.
Income Tax Expense
Income tax expense was $4.9 million in 2016 compared to $4.2 million in 2015. The increase in income tax expense was consistent with the related growth in ourpre-tax income. Our effective tax rates were 39.7% and 41.2% in 2016 and 2015, respectively. The lower effective tax rate in 2016 was primarily due to benefits recognized from the change in tax accounting associated with the treatment of our stock options.
Financial Condition
Total assets increased $139.7 million, or 18.4%, to $901.0 million at December 31, 2017 as compared to $761.3 million at December 31, 2016. This increase primarily resulted from an increase of $73.8 million, or 10.9%, in gross loans and an increase of $43.1 million in cash and cash equivalents. We funded our asset growth primarily with an increase of $111.5 million in deposits and additional advances from FHLB of $15.0 million.
Investment portfolio
The securities portfolio is the second largest component of our interest earning assets, and the structure and composition of this portfolio is important to an analysis of our financial condition. The portfolio serves the following purposes: (i) it provides a source of pledged assets for securing certain deposits and borrowed funds, as may be required by law or by specific agreement with a depositor or lender; (ii) it provides liquidity to even out cash flows from the loan and deposit activities of customers; (iii) it can be used as an interest rate risk management tool, because it provides a large base of assets, the maturity and interest rate characteristics of which can be changed more readily than the loan portfolio to better match changes in the deposit base and our other funding sources; and (iv) it is an alternative interest-earning use of funds when loan demand is weak or when deposits grow more rapidly than loans.
We classify our securities as either available-for-sale or held-to-maturity at the time of purchase. Accounting guidance requires available-for-sale securities to be marked to fair value with an offset to accumulated other comprehensive income (loss), a component of shareholders’ equity. Monthly adjustments are made to reflect changes in the fair value of our available-for-sale securities.
All of the securities in our investment portfolio were classified asavailable-for-sale at December 31, 2017. There were noheld-to-maturity or trading securities in our investment portfolio at December 31, 2017. Allavailable-for-sale securities are carried at fair value. Securitiesavailable-for-sale consist primarily of US government-sponsored agency securities, home mortgage-backed securities and collateralized mortgage obligations.
Securitiesavailable-for-sale increased $6.0 million, or 16.9%, to $41.5 million at December 31, 2017 from $35.5 million at December 31, 2016. Securitiesavailable-for-sale decreased $8.4 million to $35.5 million at December 31, 2016 from $43.9 million at December 31, 2015. No issuer of theavailable-for-sale securities, other than FNMA and FHLMC, comprised more than ten percent of our shareholders’ equity as of December 31, 2017, 2016, or 2015.
65
Table of Contents
The following table summarizes the fair value of theavailable-for-sale securities portfolio as of the dates presented.
| December 31, 2017 | December 31, 2016 | December 31, 2015 | ||||||||||||||||||||||||||||||||||
| (Dollars in thousands) | Amortized Cost | Fair Value | Unrealized Gain/(Loss) | Amortized Cost | Fair Value | Unrealized Gain/(Loss) | Amortized Cost | Fair Value | Unrealized Gain/(Loss) | |||||||||||||||||||||||||||
Available for sale: | ||||||||||||||||||||||||||||||||||||
U.S. Government agencies | $ | 6,989 | $ | 6,932 | $ | (57 | ) | $ | 6,984 | $ | 6,977 | $ | (7 | ) | $ | 7,978 | $ | 7,949 | $ | (29 | ) | |||||||||||||||
Mortgage-backed securities—residential | 14,109 | 13,941 | (168 | ) | 17,721 | 17,556 | (165 | ) | 22,615 | 22,444 | (171 | ) | ||||||||||||||||||||||||
Collateralized mortgage obligations | 18,459 | 18,113 | (346 | ) | 11,124 | 10,930 | (194 | ) | 13,690 | 13,496 | (194 | ) | ||||||||||||||||||||||||
Other securities | 2,518 | 2,486 | (32 | ) | — | — | — | — | — | — | ||||||||||||||||||||||||||
|
|
|
|
|
|
|
|
|
|
|
|
|
|
|
|
|
| |||||||||||||||||||
Total available for sale | $ | 42,075 | $ | 41,472 | $ | (603 | ) | $ | 35,829 | $ | 35,463 | $ | (366 | ) | $ | 44,283 | $ | 43,889 | $ | (394 | ) | |||||||||||||||
|
|
|
|
|
|
|
|
|
|
|
|
|
|
|
|
|
| |||||||||||||||||||
Certain securities have fair values less than amortized cost and, therefore, contain unrealized losses. At December 31, 2017, we evaluated the securities which had an unrealized loss for other than temporary impairment (OTTI) and determined all decline in value to be temporary. We anticipate full recovery of amortized cost with respect to these securities by maturity, or sooner in the event of a more favorable market interest rate environment. We do not intend to sell these securities and it is not more likely than not that we will be required to sell them before recovery of the amortized cost basis, which may be at maturity.
The following table sets forth certain information regarding contractual maturities and the weighted average yields of our investment securities as of the dates presented. Expected maturities may differ from contractual maturities if borrowers have the right to call or prepay obligations with or without call or prepayment penalties. We have no securities with contractual maturities due in one year or less as of December 31, 2017.
| As of December 31, 2017 | ||||||||||||||||||||||||
| Due after One Year Through Five Years | Due after Five Years Through Ten Years | Due after Ten Years | ||||||||||||||||||||||
| (Dollars in thousands) | Amortized Cost | Weighted Average Yield | Amortized Cost | Weighted Average Yield | Amortized Cost | Weighted Average Yield | ||||||||||||||||||
Available for sale: | ||||||||||||||||||||||||
U.S. Government agencies | $ | 6,989 | 1.68 | % | $ | — | — | $ | — | — | ||||||||||||||
Mortgage-backed securities—residential | — | — | 5,545 | 1.98 | % | 8,564 | 1.89 | % | ||||||||||||||||
Collateralized mortgage obligations | — | — | — | — | 18,459 | 2.03 | % | |||||||||||||||||
Other securities | — | — | — | — | 2,518 | — | ||||||||||||||||||
|
|
|
|
|
|
|
|
|
|
|
| |||||||||||||
Total available for sale | 6,989 | 1.68 | % | $ | 5,545 | 1.98 | % | $ | 29,541 | 1.82 | % | |||||||||||||
|
|
|
|
|
|
|
|
|
|
|
| |||||||||||||
We have not used interest rate swaps or other derivative instruments to hedge fixed rate loans or securities to otherwise mitigate interest rate risk.
Loans
Our loans represent the largest portion of our earning assets, substantially greater than the securities portfolio or any other asset category, and the quality and diversification of the loan portfolio is an important consideration when reviewing our financial condition.
66
Table of Contents
At December 31, 2017, gross loans including deferred costs totaled $748.0 million compared to $674.2 million at December 31, 2016 and $507.3 million at December 31, 2015.
The loan distribution table that follows sets forth our gross loans outstanding, and the percentage distribution in each category as of the dates indicated:
| As of December 31, | ||||||||||||||||||||||||
| 2017 | 2016 | 2015 | ||||||||||||||||||||||
| (Dollars in thousands) | Amount | % of Total | Amount | % of Total | Amount | % of Total | ||||||||||||||||||
Real estate: | ||||||||||||||||||||||||
Commercial real estate | $ | 420,760 | 56 | % | $ | 362,585 | 54 | % | $ | 272,394 | 54 | % | ||||||||||||
SBA loans—real estate | 106,924 | 14 | % | 97,411 | 14 | % | 75,641 | 15 | % | |||||||||||||||
|
|
|
|
|
|
|
|
|
|
|
| |||||||||||||
Total real estate | 527,684 | 70 | % | 459,996 | 68 | % | 348,035 | 69 | % | |||||||||||||||
SBAloan—non-real estate | 8,635 | 1 | % | 6,875 | 1 | % | 6,814 | 1 | % | |||||||||||||||
Commercial and industrial | 103,681 | 14 | % | 97,660 | 14 | % | 70,629 | 14 | % | |||||||||||||||
Home mortgage | 104,068 | 13.9 | % | 104,809 | 16 | % | 76,866 | 15 | % | |||||||||||||||
Consumer | 3,955 | 1 | % | 4,887 | 1 | % | 4,942 | 1 | % | |||||||||||||||
|
|
|
|
|
|
|
|
|
|
|
| |||||||||||||
Gross loans | 748,023 | 100 | % | 674,227 | 100 | % | 507,286 | 100 | % | |||||||||||||||
Allowance for loan losses | (9,139 | ) | (7,910 | ) | (6,390 | ) | ||||||||||||||||||
|
|
|
|
|
| |||||||||||||||||||
Net loans | $ | 738,884 | $ | 666,317 | $ | 500,896 | ||||||||||||||||||
|
|
|
|
|
| |||||||||||||||||||
Gross loans increased $73.8 million, or 10.9%, to $748.0 million as of December 31, 2017 compared to $674.2 million as of December 31, 2016. The increase in our gross loans resulted from organic growth in most of our loan categories.
The following tables presents the maturity distribution of our loans as of December 31, 2017 and 2016. The table shows the distribution of such loans between those loans with predetermined (fixed) interest rates and those with variable (floating) interest rates.
| As of December 31, 2017 | ||||||||||||||||||||||||||||
| Due in One Year or Less | Due after One Year Through Five Years | Due after Five Years | ||||||||||||||||||||||||||
| (Dollars in thousands) | Fixed Rate | Adjustable Rate | Fixed Rate | Adjustable Rate | Fixed Rate | Adjustable Rate | Total | |||||||||||||||||||||
Real estate: | ||||||||||||||||||||||||||||
Commercial real estate | $ | 24,364 | $ | 38,629 | $ | 171,457 | $ | 88,328 | $ | 39,120 | $ | 58,862 | $ | 420,760 | ||||||||||||||
SBA loans—real estate | — | — | — | — | — | 106,924 | 106,924 | |||||||||||||||||||||
|
|
|
|
|
|
|
|
|
|
|
|
|
| |||||||||||||||
Total real estate | 24,364 | 38,629 | 171,457 | 88,328 | 39,120 | 165,786 | 527,684 | |||||||||||||||||||||
SBAloan—non-real estate | — | — | — | 764 | — | 7,871 | 8,635 | |||||||||||||||||||||
Commercial and industrial | — | 58,900 | 2,188 | 25,876 | — | 16,717 | 103,681 | |||||||||||||||||||||
Home mortgage | — | — | — | — | 104,068 | — | 104,068 | |||||||||||||||||||||
Consumer | — | 1,821 | 11 | 1,202 | — | 921 | 3,955 | |||||||||||||||||||||
|
|
|
|
|
|
|
|
|
|
|
|
|
| |||||||||||||||
Gross loans | $ | 24,364 | $ | 99,350 | $ | 173,656 | $ | 116,170 | $ | 143,188 | $ | 191,295 | $ | 748,023 | ||||||||||||||
|
|
|
|
|
|
|
|
|
|
|
|
|
| |||||||||||||||
67
Table of Contents
| As of December 31, 2016 | ||||||||||||||||||||||||||||
| Due in One Year or Less | Due after One Year Through Five Years | Due after Five Years | ||||||||||||||||||||||||||
| (Dollars in thousands) | Fixed Rate | Adjustable Rate | Fixed Rate | Adjustable Rate | Fixed Rate | Adjustable Rate | Total | |||||||||||||||||||||
Real estate: | ||||||||||||||||||||||||||||
Commercial real estate | $ | 4,541 | $ | 26,034 | $ | 183,869 | $ | 41,074 | $ | 62,842 | $ | 44,225 | $ | 362,585 | ||||||||||||||
SBA loans—real estate | — | — | — | — | — | 97,411 | 97,411 | |||||||||||||||||||||
|
|
|
|
|
|
|
|
|
|
|
|
|
| |||||||||||||||
Total real estate | 4,541 | 26,034 | 183,869 | 41,074 | 62,842 | 141,636 | 459,996 | |||||||||||||||||||||
SBAloan—non-real estate | — | 15 | — | 701 | — | 6,159 | 6,875 | |||||||||||||||||||||
Commercial and industrial | 75 | 46,933 | 2,908 | 25,248 | — | 22,496 | 97,660 | |||||||||||||||||||||
Home mortgage | — | — | — | — | 104,809 | — | 104,809 | |||||||||||||||||||||
Consumer | — | 2,548 | — | 1,419 | — | 920 | 4,887 | |||||||||||||||||||||
|
|
|
|
|
|
|
|
|
|
|
|
|
| |||||||||||||||
Gross loans | $ | 4,616 | $ | 75,530 | $ | 186,777 | $ | 68,442 | $ | 167,651 | $ | 171,211 | $ | 674,227 | ||||||||||||||
|
|
|
|
|
|
|
|
|
|
|
|
|
| |||||||||||||||
Our loan portfolio is concentrated in commercial real estate, commercial (primarily manufacturing, wholesale, and services oriented entities), SBA loans (unguaranteed portion) with the remaining balance in home mortgage, and consumer loans. We do not have any material concentrations by industry or group of industries in the loan portfolio. However, 84.5% of our gross loans was secured by real property as of December 31, 2017, compared to 83.8% as of December 31, 2016.
We have established concentration limits in the loan portfolio for commercial real estate loans, commercial and industrial loans, and unsecured lending, among others. All loan types are within established limits. We use underwriting guidelines to assess the borrowers’ historical cash flow to determine debt service, and we further stress test the debt service under higher interest rate scenarios. Financial and performance covenants are used in commercial lending agreements to allow us to react to a borrower’s deteriorating financial condition, should that occur.
Commercial real estate loans include owner-occupied andnon-occupied commercial real estate. We originate both fixed and adjustable rate loans. Adjustable rate loans are based on theWall Street Journal prime rate. At December 31, 2017, approximately 56% of the commercial real estate portfolio consisted of fixed-rate loans. Our policy maximumloan-to-value, or LTV, is 70% for commercial real estate loans. At December 31, 2017, our average loan to value for commercial real estate loans was 72.1%. Our commercial real estate loan portfolio totaled $420.8 million at December 31, 2017 compared to $362.6 million at December 31, 2016.
We are designated an SBA Preferred Lender under the SBA Preferred Lender Program. We offer mostly SBA 7(a) variable-rate loans. We generally sell the 75% guaranteed portion of the SBA loans that we originate. Our SBA loans are typically made tosmall-sized manufacturing, wholesale, retail, hotel/motel and service businesses for working capital needs or business expansions. SBA loans have maturities up to 25 years. Typically,non-real estate secured loans mature in less than 10 years. Collateral may also include inventory, accounts receivable and equipment, and may include personal guarantees. Our unguaranteed SBA loans collateralized by real estate are monitored by collateral type and included in our CRE Concentration Guidance.
As of December 31, 2017 our SBA portfolio totaled $115.6 million compared to $104.3 million as of December 31, 2016. These increases were primarily due to continued growth of our SBA loan portfolio partially offset by the sales of those loans. We originated $99.7 million and $111.5 million during the years ended December 31, 2017 and 2016, respectively. We sold $66.2 million and $83.4 million of SBA loans during the years ended December 31, 2017 and 2016, respectively.
From our total SBA loan portfolio, $106.9 million is secured by real estate and $8.6 million is unsecured or secured by business assets at December 31, 2017.
68
Table of Contents
Commercial and industrial loans totaled $103.7 million at December 31, 2017 compared to $97.7 million at December 31, 2016 and $70.6 million at December 31, 2015. The increase resulted primarily from organic loan growth.
We originate mainlynon-qualified, alternative documentation single-family home mortgage loans (“home mortgage”) primarily through broker relationships, but also through our branch network. The loan product is a five-year or seven-year hybrid adjustable rate mortgage which reprices after five years to theone-year LIBOR plus certain spreads. We originate thenon-qualified single-family home mortgage loans held by us for investment.
Home mortgage loans totaled $104.1 million at December 31, 2017 compared to $104.8 million at December 31, 2016, a decrease of $700,000, or 0.7%. The decrease was primarily due to lower loan origination and higher loan payoffs in 2017 compared to 2016. During the year ended December 31, 2017, we originated $42.1 million and sold $9.5 million in home mortgage loans. Payoffs and paydowns for the same period were $31.2 million and $2.8 million, respectively. During the same period in 2016, we originated $53.3 million and sold $5.8 million in home mortgage loans. Payoffs and paydowns for the same period were $17.3 million and $2.3 million, respectively.
Loan Servicing
As of December 31, 2017, 2016, and 2015, we serviced $309.3 million, $303.8 million, and $260.5 million respectively, of SBA loans for others. Activity for loan servicing rights was as follows:
| Year Ended December 31, | ||||||||||||
| (Dollars in thousands) | 2017 | 2016 | 2015 | |||||||||
Beginning balance | $ | 6,783 | $ | 5,551 | $ | 4,670 | ||||||
Additions | 1,923 | 2,645 | 2,148 | |||||||||
Amortized to expense | (1,935 | ) | (1,413 | ) | (1,267 | ) | ||||||
|
|
|
|
|
| |||||||
Ending balance | $ | 6,771 | $ | 6,783 | $ | 5,551 | ||||||
|
|
|
|
|
| |||||||
Loan servicing rights are included in accrued interest receivable and other assets on our consolidated balance sheets and reported net of amortization.
Allowance for loan losses
The allowance for loan losses is an estimate of probable incurred losses in the loan portfolio. Loans are charged-off against the allowance when management believes a loan balance is uncollectible. Subsequent recoveries, if any, are credited to the allowance for loan losses. Management’s methodology for estimating the allowance balance consists of several key elements, which include specific allowances on individual impaired loans and the formula driven allowances on pools of loans with similar risk characteristics. Allocations of the allowance may be made for specific loans, but the entire allowance is available for any loan that, in management’s judgment, should be charged-off.
The allowance for loan losses is determined on a quarterly basis and reflects management’s estimate of probable incurred credit losses inherent in the loan portfolio. We also rely on internal and external loan review procedures to further assess individual loans and loan pools, and economic data for overall industry and geographic trends. The computation includes element of judgment and high levels of subjectivity.
A loan is considered impaired when it is probable that we will be unable to collect all amounts due according to the contractual terms of the loan agreement. Impaired loans include loans onnon-accrual status and performing restructured loans. Income from loans onnon-accrual status is recognized to the extent cash is
69
Table of Contents
received and when the loan’s principal balance is deemed collectible. Depending on a particular loan’s circumstances, we measure impairment of a loan based upon either the present value of expected future cash flows discounted at the loan’s effective interest rate, the loan’s observable market price, or the fair value of the collateral less estimated costs to sell if the loan is collateral dependent. A loan is considered collateral dependent when repayment of the loan is based solely on the liquidation of the collateral. Fair value, where possible, is determined by independent appraisals, typically on an annual basis. Between appraisal periods, the fair value may be adjusted based on specific events, such as if deterioration of quality of the collateral comes to our attention as part of our problem loan monitoring process, or if discussions with the borrower lead us to believe the last appraised value no longer reflects the actual market value for the collateral. The impairment amount on a collateral-dependent loan ischarged-off to the allowance if deemed not collectible and the impairment amount on a loan that is not collateral-dependent is set up as a specific reserve.
In cases where a borrower experiences financial difficulties and we make certain concessionary modifications to contractual terms, the loan is classified as a troubled debt restructuring. These concessions may include a reduction of the interest rate, principal or accrued interest, extension of the maturity date or other actions intended to minimize potential losses. Loans restructured at a rate equal to or greater than that of a new loan with comparable risk at the time the loan is modified may be excluded from restructured loan disclosures in years subsequent to the restructuring if the loans are in compliance with their modified terms. A restructured loan is considered impaired despite its accrual status and a specific reserve is calculated based on the present value of expected cash flows discounted at the loan’s effective interest rate or the fair value of the collateral less estimated costs to sell if the loan is collateral dependent. Interest income on impaired loans is accrued as earned, unless the loan is placed onnon-accrual status.
The allowance for loan losses was $9.1 million at December 31, 2017 compared to $7.9 million at December 31, 2016, an increase of $1.2 million, or 15.5%. The increase was primarily due to the overall growth in the size of our gross loan portfolio, which grew $73.8 million, or 10.9%, to $748.0 million at December 31, 2017 from $674.2 million at December 31, 2016.
In determining the allowance and the related provision for loan losses, we consider three principal elements: (i) valuation allowances based upon probable losses identified during the review of impaired commercial and industrial, commercial real estate, construction and land development loans, (ii) allocations, by loan classes, on loan portfolios based on historical loan loss experience and qualitative factors and (iii) review of the credit discounts in relationship to the valuation allowance calculated for purchased loans. Provisions for loan losses are charged to operations to record changes to the total allowance to a level deemed appropriate by us.
It is the policy of management to maintain the allowance for loan losses at a level adequate for risks inherent in the loan portfolio. The Federal Reserve Board and the California Department of Business Oversight also review the allowance for loan losses as an integral part of their examination process. Based on information currently available, management believes that our allowance for loan losses is adequate. However, the loan portfolio can be adversely affected if California economic conditions and the real estate market in our market area were to weaken. The effect of such events, although uncertain at this time, could result in an increase in the level of nonperforming loans and increased loan losses, which could adversely affect our future growth and profitability. No assurance of the ultimate level of credit losses can be given with any certainty.
70
Table of Contents
Analysis of the Allowance for Loan Losses.
The following table provides an analysis of the allowance for loan losses, provision for loan losses and net charge-offs, by category, for the years ended December 31, 2017, 2016 and 2015.
| As of and For the Year Ended December 31, 2017 | As of and For the Year Ended December 31, 2016 | As of and For the Year Ended December 31, 2015 | ||||||||||||||||||||||||||||||||||
| (Dollars in thousands) | Provision | Net Charge-offs | ALL Balance | Provision | Net Charge-offs | ALL Balance | Provision | Net Charge-offs | ALL Balance | |||||||||||||||||||||||||||
Real estate: | ||||||||||||||||||||||||||||||||||||
Commercial real estate | $ | 584 | $ | — | $ | 4,801 | $ | 985 | $ | — | $ | 4,217 | $ | 751 | $ | — | $ | 3,232 | ||||||||||||||||||
SBA loans—real estate | 189 | — | 1,082 | 189 | — | 893 | (42 | ) | 1 | 704 | ||||||||||||||||||||||||||
|
|
|
|
|
|
|
|
|
|
|
|
|
|
|
|
|
| |||||||||||||||||||
Total real estate | 773 | — | 5,883 | 1,174 | — | 5,110 | 709 | 1 | 3,936 | |||||||||||||||||||||||||||
SBAloan—non-real estate | 633 | 155 | 538 | (50 | ) | 20 | 59 | (7 | ) | (7 | ) | 129 | ||||||||||||||||||||||||
Commercial and industrial | (57 | ) | — | 1,265 | 130 | 142 | 1,322 | (336 | ) | (70 | ) | 1,334 | ||||||||||||||||||||||||
Home mortgage | 44 | (73 | ) | 1,408 | 427 | — | 1,364 | 227 | — | 937 | ||||||||||||||||||||||||||
Consumer | (83 | ) | — | 45 | 1 | — | 55 | (40 | ) | (4 | ) | 54 | ||||||||||||||||||||||||
|
|
|
|
|
|
|
|
|
|
|
|
|
|
|
|
|
| |||||||||||||||||||
Total | $ | 1,310 | $ | 82 | $ | 9,139 | $ | 1,682 | $ | 162 | $ | 7,910 | $ | 553 | $ | (80 | ) | $ | 6,390 | |||||||||||||||||
|
|
|
|
|
|
|
|
|
|
|
|
|
|
|
|
|
| |||||||||||||||||||
Gross loans | $ | 748,023 | $ | 674,227 | $ | 507,286 | ||||||||||||||||||||||||||||||
Average gross loans | 705,748 | 578,262 | 462,870 | |||||||||||||||||||||||||||||||||
Net charge-offs to average loans(1) | 0.01 | % | 0.03 | % | (0.02 | )% | ||||||||||||||||||||||||||||||
Allowance for loans losses to gross loans | 1.22 | % | 1.17 | % | 1.26 | % | ||||||||||||||||||||||||||||||
| (1) | Net charge-offs are loan charge-offs net of loan recoveries. |
Non-performing Loans
Loans are considered delinquent when principal or interest payments are past due 30 days or more. Delinquent loans may remain on accrual status between 30 days and 90 days past due. Loans on which the accrual of interest has been discontinued are designated asnon-accrual loans. Typically, the accrual of interest on loans is discontinued when principal or interest payments are past due 90 days or when, in the opinion of management, there is a reasonable doubt as to collectability in the normal course of business. When loans are placed onnon-accrual status, all interest previously accrued but not collected is reversed against current period interest income. Income onnon-accrual loans is subsequently recognized only to the extent that cash is received and the loan’s principal balance is deemed collectible. Loans are restored to accrual status when loans become well-secured and management believes full collectability of principal and interest is probable.
Real estate we acquire as a result of foreclosure or bydeed-in-lieu of foreclosure is classified as OREO until sold, and is initially recorded at fair value less costs to sell when acquired, establishing a new cost basis. We had no OREO at December 31, 2017, 2016 and 2015.
Non-performing loans include loans 90 days past due and still accruing, loans accounted for on anon-accrual basis and accruing restructured loans.Non-performing assets consist ofnon-performing loans plus OREO.
Non-performing loans were $1.0 million at December 31, 2017 compared to $576,000 at December 31, 2016 and $1.0 million at December 31, 2015. The increase in the year ended December 31, 2017 was primarily due to twonon-accrual home mortgage loans which were non-performing. The decrease in the year ended December 31, 2016 was primarily due to one large principal paydown on one of thenon-performing loans. We did not
71
Table of Contents
recognize any interest income onnon-accrual loans during the years ended December 31, 2017, 2016 and 2015 while the loans were innon-accrual status. Additional interest income that we would have recognized on these loans had they been current in accordance with their original terms was $10,000 in the year ended December 31, 2016 and $5,000 for the same period of 2015. There was no such additional interest income in the year ended December 31, 2017.
We recognized interest income on loans modified under troubled debt restructurings of $9,000 in the year ended December 31, 2017, $25,000 in the year ended December 31, 2016, and $34,000 in the year ended December 31, 2015.
The following table sets forth the allocation of ournon-performing assets among our different asset categories as of the dates indicated.Non-performing loans includenon-accrual loans, loans past due 90 days or more and still accruing interest, and loans modified under troubled debt restructurings.
| As of December 31, | ||||||||||||
| (Dollars in thousands) | 2017 | 2016 | 2015 | |||||||||
Non-accrual loans | $ | 683 | $ | 209 | $ | 657 | ||||||
Past due loans 90 days or more and still accruing | — | — | — | |||||||||
Accruing troubled debt restructured loans | 354 | 367 | 382 | |||||||||
|
|
|
|
|
| |||||||
Totalnon-performing loans | 1,037 | 576 | 1,039 | |||||||||
Other real estate owned | — | — | — | |||||||||
|
|
|
|
|
| |||||||
Totalnon-performing assets | $ | 1,037 | $ | 576 | $ | 1,039 | ||||||
|
|
|
|
|
| |||||||
Non-performing loans to gross loans | 0.14 | % | 0.09 | % | 0.20 | % | ||||||
Non-performing assets to total assets | 0.12 | % | 0.08 | % | 0.17 | % | ||||||
Allowance for loan losses tonon-performing loans | 881 | % | 1373 | % | 615 | % | ||||||
In addition to the nonperforming assets described above we have a lending relationship with two companies that are affiliated with each other comprised of two loans to a retail company and one loan to a related online company totaling $1.9 million. These loans were current at December 31, 2017 and accordingly, they were not included in the nonperforming asset categories above. In March 2018, even though the loans were current, the retail company with a $1.4 million loan outstanding filed for reorganization under Chapter 11 of the federal bankruptcy laws. We will reassess the risk ratings and potential loss exposure of these loans on a prospective basis as we continue to work with the borrower and obtain further information. The $500,000 loan to the online company, representing the balance of the borrowing relationship, is current and remains a performing loan.
Deposits
We gather deposits primarily through our branch locations. We offer a variety of deposit products including demand deposits accounts, interest-bearing products, savings accounts and certificate of deposits. We put continued effort into gathering noninterest demand deposits accounts through marketing to our existing and new loan customers, customer referrals, our marketing staff and various involvement with community networks.
Total deposits at December 31, 2017 were $773.3 million, representing an increase of $111.5 million, or 16.9%, compared to $661.8 million at December 31, 2016. As of December 31, 2017, 37.4% of total deposits were comprised of noninterest-bearing demand accounts, 32.5% of interest-bearing transaction accounts and 30.1% of time deposits.
Total deposits at December 31, 2016 were $661.8 million, representing an increase of $142.1 million, or 27.3%, compared to $519.7 million at December 31, 2015. As of December 31, 2016, 37.4% of total deposits were comprised of noninterest-bearing demand accounts, 35.2% of interest-bearing transaction accounts and 27.4% of time deposits.
72
Table of Contents
The following table summarizes our average deposit balances and weighted average rates for the years ended December 31, 2017, 2016 and 2015:
| As of December 31, | ||||||||||||||||||||||||
| 2017 | 2016 | 2015 | ||||||||||||||||||||||
| (Dollars in thousands) | Average Balance | Weighted Average Rate | Average Balance | Weighted Average Rate | Average Balance | Weighted Average Rate | ||||||||||||||||||
Noninterest-bearing demand | $ | 256,267 | — | % | $ | 198,413 | — | % | $ | 153,435 | — | % | ||||||||||||
Interest-bearing: | ||||||||||||||||||||||||
NOW and Savings deposits | 6,137 | 0.25 | 4,058 | 0.25 | 3,276 | 0.25 | ||||||||||||||||||
Money market | 258,019 | 0.91 | 202,737 | 0.86 | 163,888 | 0.92 | ||||||||||||||||||
Time deposits ($250,000 or less) | 106,676 | 1.08 | 108,912 | 0.94 | 58,882 | 0.74 | ||||||||||||||||||
Time deposits (more than $250,000) | 90,155 | 1.06 | 72,279 | 0.71 | 92,832 | 0.71 | ||||||||||||||||||
|
|
|
|
|
|
|
|
|
|
|
| |||||||||||||
Total interest-bearing | 460,987 | 0.97 | 387,986 | 0.85 | 318,878 | 0.82 | ||||||||||||||||||
|
|
|
|
|
|
|
|
|
|
|
| |||||||||||||
Total deposits | $ | 717,254 | 0.62 | $ | 586,399 | 0.56 | $ | 472,313 | 0.55 | |||||||||||||||
|
|
|
|
|
|
|
|
|
|
|
| |||||||||||||
The following tables set forth the maturity of time deposits as of December 31, 2017 and 2016:
| As of December 31, 2017 Maturity Within: | ||||||||||||||||||||
| (Dollars in thousands) | Three Months | Three to Six Months | Six to 12 Months | After 12 Months | Total | |||||||||||||||
Time deposits ($250,000 or less) | $ | 49,491 | $ | 28,128 | $ | 37,414 | $ | 8,748 | $ | 123,781 | ||||||||||
Time deposits (more than $250,000) | 52,245 | 13,673 | 36,832 | 6,202 | 108,952 | |||||||||||||||
|
|
|
|
|
|
|
|
|
| |||||||||||
Total time deposits | $ | 101,736 | $ | 41,801 | $ | 74,246 | $ | 14,950 | $ | 232,733 | ||||||||||
|
|
|
|
|
|
|
|
|
| |||||||||||
| As of December 31, 2016 Maturity Within: | ||||||||||||||||||||
| (Dollars in thousands) | Three Months | Three to Six Months | Six to 12 Months | After 12 Months | Total | |||||||||||||||
Time deposits ($250,000 or less) | $ | 14,302 | $ | 15,801 | $ | 31,060 | $ | 10,441 | $ | 71,604 | ||||||||||
Time deposits (more than $250,000) | 35,699 | 53,235 | 15,497 | 5,600 | 110,031 | |||||||||||||||
|
|
|
|
|
|
|
|
|
| |||||||||||
Total time deposits | $ | 50,001 | $ | 69,036 | $ | 46,557 | $ | 16,041 | $ | 181,635 | ||||||||||
|
|
|
|
|
|
|
|
|
| |||||||||||
Borrowed Funds
Other than deposits, we also utilized FHLB advances as a supplementary funding source to finance our operations. The advances from the FHLB are collateralized by residential and commercial real estate loans. At December 31, 2017, 2016 and 2015, we had maximum borrowing capacity from the FHLB of $308.5 million, $248.3 million and $211.3 million, respectively. We had $25 million of advances from FHLB at December 31, 2017, compared to $10 million at December 31, 2016 and $20 million at December 31, 2015.
Liquidity
Liquidity refers to the measure of our ability to meet the cash flow requirements of depositors and borrowers, while at the same time meeting our operating, capital and strategic cash flow needs, all at a reasonable cost. We continuously monitor our liquidity position to ensure that assets and liabilities are managed in a manner that will meet all short-term and long-term cash requirements. We manage our liquidity position to meet the daily cash flow needs of customers, while maintaining an appropriate balance between assets and liabilities to meet the return on investment objectives of our shareholders.
73
Table of Contents
Our liquidity position is supported by management of liquid assets and access to alternative sources of funds. Our liquid assets include cash, interest-bearing deposits in correspondent banks, federal funds sold, and fair value of unpledged investment securities. Other available sources of liquidity include wholesale deposits, and additional borrowings from correspondent banks, FHLB advances, and the Federal Reserve discount window.
Our short-term and long-term liquidity requirements are primarily met through cash flow from operations, redeployment of prepaying and maturing balances in our loan and investment portfolios, and increases in customer deposits. Other alternative sources of funds will supplement these primary sources to the extent necessary to meet additional liquidity requirements on either a short-term or long-term basis.
As of December 31, 2017, 2016 and 2015, we had $9.5 million of unsecured federal funds lines with no amounts advanced. In addition, on such dates we had lines of credit from the Federal Reserve discount window of $92.8 million, $84.0 million and $45.1 million, respectively. The Federal Reserve discount window lines were collateralized by a pool of commercial real estate loans and commercial and industrial loans totaling $156.2 million, $152.9 million and $92.3 million as of December 31, 2017, 2016 and 2015, respectively. We did not have any borrowings outstanding with the Federal Reserve at December 31, 2017, 2016 or 2015, and our borrowing capacity is limited only by eligible collateral.
At December 31, 2017 we had a $25 million advance from the FHLB which had an overnight borrowing interest rate of 1.41%. We had a $10 million FHLB advance outstanding at December 31, 2016 which was an overnight borrowing at an interest rate of 0.55%. At December 31, 2015, we had an aggregate of $20 million of outstanding advances from FHLB of which $10 million was a one year advance maturing on June 2, 2016 at an interest rate of 0.49% and $10 million was a one year advance maturing on August 8, 2016 at an interest rate of 0.57%. Based on the values of loans pledged as collateral, we had $145.8 million of additional borrowing availability with the FHLB as of December 31, 2017. We also maintain relationships in the capital markets with brokers to issue certificates of deposit and money market accounts.
Capital Requirements
We are subject to various regulatory capital requirements administered by the federal and state banking regulators. Failure to meet regulatory capital requirements may result in certain mandatory and possible additional discretionary actions by regulators that, if undertaken, could have a direct material effect on our financial statements. Under capital adequacy guidelines and the regulatory framework for “prompt corrective action” (described below), we must meet specific capital guidelines that involve quantitative measures of our assets, liabilities and certainoff-balance sheet items as calculated under regulatory accounting policies. The capital amounts and classifications are subject to qualitative judgments by the federal banking regulators about components, risk weightings and other factors. Qualitative measures established by regulation to ensure capital adequacy required us to maintain minimum amounts and ratio of CET1 capital, Tier 1 capital and total capital to risk-weighted assets and of Tier 1 capital to average consolidated assets, referred to as the “leverage ratio.” For further information, see “Supervision and Regulation—Regulatory Capital Requirements” and “Supervision and Regulation—Prompt Corrective Action Framework.”
In the wake of the global financial crisis of 2008 and 2009, the role of capital has become fundamentally more important, as banking regulators have concluded that the amount and quality of capital held by banking organizations was insufficient to absorb losses during periods of severely distressed economic conditions. The Dodd-Frank Act and new banking regulations promulgated by the U.S. federal banking regulators to implement the Basel III Capital Rules have established strengthened capital standards for banks and bank holding companies and require more capital to be held in the form of common stock. These provisions, which generally became applicable to us on January 1, 2015, impose meaningfully more stringent regulatory capital requirements than those applicable to us prior to that date. In addition, the Basel III Capital Rules will implement a concept known as the “capital conservation buffer.” In general, banks and bank holding companies will be required to hold a buffer of common equity Tier 1 capital equal to 2.5% of risk-weighted assets over each minimum capital ratio to
74
Table of Contents
avoid being subject to limits on capital distributions (e.g., dividends, stock buybacks, etc.) and certain discretionary bonus payments to executive officers. For community banks, the capital conservation buffer requirement commenced on January 1, 2016, with a gradualphase-in. Full compliance with the capital conservation buffer will be required by January 1, 2019.
The table below also summarizes the capital requirements applicable to us and the Bank in order to be considered “well-capitalized” from a regulatory perspective, as well as our and the Bank’s capital ratios as of December 31, 2017 and 2016. We and the Bank exceeded all regulatory capital requirements under the Basel III Capital Rules and were considered to be “well-capitalized” as of the dates reflected in the table below. As of December 31, 2017, the FDIC categorized us as well-capitalized under the prompt corrective action framework. There have been no conditions or events since December 31, 2017 that management believes would change this classification.
| Actual | Regulatory Capital Ratio Requirements | Minimum To be Considered “Well Capitalized” | Regulatory Capital Ratio Requirements, including fully phased in Capital Conservation Buffer | |||||||||||||||||||||||||||||
| (Dollars in thousands) | Amount | Ratio | Amount | Ratio | Amount | Ratio | Amount | Ratio | ||||||||||||||||||||||||
As of December 31, 2017: | ||||||||||||||||||||||||||||||||
Total capital (to risk-weighted assets) | ||||||||||||||||||||||||||||||||
Consolidated | $ | 100,713 | 13.49 | % | $ | 59,729 | 8.00 | % | N/A | N/A | $ | 78,394 | 10.50 | % | ||||||||||||||||||
Bank | 100,648 | 13.48 | % | 59,726 | 8.00 | % | 74,658 | 10.00 | % | 78,391 | 10.50 | % | ||||||||||||||||||||
Tier 1 capital (to risk-weighted assets) | ||||||||||||||||||||||||||||||||
Consolidated | 91,510 | 12.26 | % | 44,797 | 6.00 | % | N/A | N/A | 63,462 | 8.50 | % | |||||||||||||||||||||
Bank | 91,445 | 12.25 | % | 44,795 | 6.00 | % | 59,726 | 8.00 | % | 63,459 | 8.50 | % | ||||||||||||||||||||
CET1 capital (to risk-weighted assets) | ||||||||||||||||||||||||||||||||
Consolidated | 91,510 | 12.26 | % | 33,597 | 4.50 | % | N/A | N/A | 52,263 | 7.00 | % | |||||||||||||||||||||
Bank | 91,445 | 12.25 | % | 33,596 | 4.50 | % | 48,528 | 6.50 | % | 52,260 | 7.00 | % | ||||||||||||||||||||
Tier 1 capital (to average assets) | ||||||||||||||||||||||||||||||||
Consolidated | 91,510 | 10.46 | % | 35,009 | 4.00 | % | N/A | N/A | 35,009 | 4.00 | % | |||||||||||||||||||||
Bank | 91,445 | 10.45 | % | 35,007 | 4.00 | % | 43,759 | 5.00 | % | 35,007 | 4.00 | % | ||||||||||||||||||||
| Actual | Regulatory Capital Ratio Requirements | Minimum To be Considered “Well Capitalized” | Regulatory Capital Ratio Requirements, including fully phased in Capital Conservation Buffer | |||||||||||||||||||||||||||||
| (Dollars in thousands) | Amount | Ratio | Amount | Ratio | Amount | Ratio | Amount | Ratio | ||||||||||||||||||||||||
As of December 31, 2016: | ||||||||||||||||||||||||||||||||
Total capital (to risk-weighted assets) | ||||||||||||||||||||||||||||||||
Consolidated | $ | 89,286 | 13.40 | % | $ | 53,311 | 8.00 | % | N/A | N/A | $ | 69,970 | 10.50 | % | ||||||||||||||||||
Bank | 89,225 | 13.39 | % | 53,306 | 8.00 | % | 66,632 | 10.00 | % | 69,964 | 10.50 | % | ||||||||||||||||||||
Tier 1 capital (to risk-weighted assets) | ||||||||||||||||||||||||||||||||
Consolidated | 81,304 | 12.20 | % | 39,983 | 6.00 | % | N/A | N/A | 56,643 | 8.50 | % | |||||||||||||||||||||
Bank | 81,244 | 12.19 | % | 39,979 | 6.00 | % | 53,306 | 8.00 | % | 56,637 | 8.50 | % | ||||||||||||||||||||
CET1 capital (to risk-weighted assets) | ||||||||||||||||||||||||||||||||
Consolidated | 81,304 | 12.20 | % | 29,987 | 4.50 | % | N/A | N/A | 46,647 | 7.00 | % | |||||||||||||||||||||
Bank | 81,244 | 12.19 | % | 29,985 | 4.50 | % | 43,311 | 6.50 | % | 46,643 | 7.00 | % | ||||||||||||||||||||
Tier 1 capital (to average assets) | ||||||||||||||||||||||||||||||||
Consolidated | 81,304 | 10.89 | % | 29,859 | 4.00 | % | N/A | N/A | 29,859 | 4.00 | % | |||||||||||||||||||||
Bank | 81,244 | 10.88 | % | 29,857 | 4.00 | % | 37,321 | 5.00 | % | 29,857 | 4.00 | % | ||||||||||||||||||||
75
Table of Contents
Contractual Obligations
The following tables contain supplemental information regarding our total contractual obligations at December 31, 2017 and 2016:
| Payments Due at December 31, 2017 | ||||||||||||||||||||
| (Dollars in thousands) | Within One Year | One to Three Years | Three to Five Years | After Five Years | Total | |||||||||||||||
Deposits without a stated maturity | $ | 540,573 | $ | — | $ | — | $ | — | $ | 540,573 | ||||||||||
Time deposits | 217,783 | 14,768 | 182 | — | 232,733 | |||||||||||||||
Operating lease commitments | 1,630 | 3,251 | 3,378 | 3,763 | 12,022 | |||||||||||||||
Advances from FHLB | 25,000 | 25,000 | ||||||||||||||||||
|
|
|
|
|
|
|
|
|
| |||||||||||
Total contractual obligations | $ | 784,986 | $ | 18,019 | $ | 3,560 | $ | 3,763 | $ | 810,328 | ||||||||||
|
|
|
|
|
|
|
|
|
| |||||||||||
| Payments Due at December 31, 2016 | ||||||||||||||||||||
| (Dollars in thousands) | Within One Year | One to Three Years | Three to Five Years | After Five Years | Total | |||||||||||||||
Deposits without a stated maturity | $ | 480,149 | $ | — | $ | — | $ | — | $ | 480,149 | ||||||||||
Time deposits | 165,594 | 16,041 | — | — | 181,635 | |||||||||||||||
Operating lease commitments | 1,459 | 2,775 | 2,806 | 4,572 | 11,612 | |||||||||||||||
Advances from FHLB | 10,000 | 10,000 | ||||||||||||||||||
|
|
|
|
|
|
|
|
|
| |||||||||||
Total contractual obligations | $ | 657,202 | $ | 18,816 | $ | 2,806 | $ | 4,572 | $ | 683,396 | ||||||||||
|
|
|
|
|
|
|
|
|
| |||||||||||
We believe that we will be able to meet our contractual obligations as they come due through the maintenance of adequate cash levels. We expect to maintain adequate cash levels through profitability, loan and securities repayment and maturity activity and continued deposit gathering activities. We have in place various borrowing mechanisms for both short-term and long-term liquidity needs.
Off-Balance Sheet Arrangements
We are a party to financial instruments withoff-balance sheet risk in the normal course of business to meet the financing needs of our customers. These financial instruments include commitments to extend credit and standby letters of credit. Those instruments involve, to varying degrees, elements of credit and interest rate risk in excess of the amount recognized in our consolidated balance sheet. The contractual or notional amounts of those instruments reflect the extent of involvement we have in particular classes of financial instruments.
Commitments to extend credit are agreements to lend to a customer as long as there is no violation of any condition established in the contract. Commitments generally have fixed expiration dates or other termination clauses and may require payment of a fee. Since many of the commitments are expected to expire without being drawn upon, the total commitment amount does not necessarily represent future cash requirements. We evaluate each customer’s creditworthiness on acase-by-case basis. The amount of collateral obtained, if we deem collateral is necessary upon extension of credit, is based on management’s credit evaluation of the counterparty.
Standby letters of credit are conditional commitments issued by us to guarantee the performance of a customer to a third party. They are intended to be disbursed, subject to certain condition, upon request of the borrower.
The following table summarized commitments as of the dates presented.
| December 31, | ||||||||||||
| (Dollars in thousands) | 2017 | 2016 | 2015 | |||||||||
Commitments to extend credit | $ | 62,356 | $ | 55,689 | $ | 53,013 | ||||||
Standby letters of credit | 1,627 | 1,499 | 3,166 | |||||||||
|
|
|
|
|
| |||||||
Total | $ | 63,983 | $ | 57,188 | $ | 56,179 | ||||||
|
|
|
|
|
| |||||||
76
Table of Contents
Quantitative and Qualitative Disclosures about Market Risk
Market risk represents the risk of loss due to changes in market values of assets and liabilities. We incur market risk in the normal course of business through exposures to market interest rates, equity prices, and credit spreads. We have identified interest rate risk as our primary source of market risk.
Interest Rate Risk
Interest rate risk is the risk to earnings and value arising from changes in market interest rates. Interest rate risk arises from timing differences in the repricings and maturities of interest-earning assets and interest-bearing liabilities (repricing risk), changes in the expected maturities of assets and liabilities arising from embedded options, such as borrowers’ ability to prepay home mortgage loans at any time and depositors’ ability to redeem certificates of deposit before maturity (option risk), changes in the shape of the yield curve where interest rates increase or decrease in a nonparallel fashion (yield curve risk), and changes in spread relationships between different yield curves, such as U.S. Treasuries and LIBOR (basis risk).
Our board’s asset liability committee, or ALM, establishes broad policy limits with respect to interest rate risk. Our management’s asset liability committee, or ALCO, establishes specific operating guidelines within the parameters of the policies set by the ALM. In general, we seek to minimize the impact of changing interest rates on net interest income and the economic values of assets and liabilities. Our ALCO monitors the level of interest rate risk sensitivity on a quarterly basis to ensure compliance with the ALM-approved risk limits. The policy requires a periodic review of all key assumptions used, such as identifying appropriate interest rate scenarios, setting loan prepayment rates based on historical analysis, and noninterest-bearing and interest-bearing deposit durations based on historical analysis.
Interest rate risk management is an active process that encompasses monitoring loan and deposit flows complemented by investment and funding activities. Effective management of interest rate risk begins with understanding the dynamic characteristics of assets and liabilities and determining the appropriate interest rate risk posture given business forecasts, management objectives, market expectations, and policy constraints.
An asset sensitive position refers to a balance sheet position in which an increase in short-term interest rates is expected to generate higher net interest income, as rates earned on our interest-earning assets would reprice upward more quickly than rates paid on our interest-bearing liabilities, thus expanding our net interest margin. Conversely, a liability sensitive position refers to a balance sheet position in which an increase in short-term interest rates is expected to generate lower net interest income, as rates paid on our interest-bearing liabilities would reprice upward more quickly than rates earned on our interest-earning assets, thus compressing our net interest margin.
Interest rate risk measurement is calculated and reported to the ALCO and ALM at least quarterly. The information reported includesperiod-end results and identifies any policy limits exceeded, along with an assessment of the policy limit breach and the action plan and timeline for resolution, mitigation, or assumption of the risk.
Evaluation of Interest Rate Risk
We use a net interest income simulation model to measure and evaluate potential changes in our net interest income. We run various hypothetical interest rate scenarios at least quarterly and compare these results against a scenario with no changes in interest rates. We use two approaches to model interest rate risk: Earnings at Risk, or EAR, and Economic Value of Equity, or EVE. Under EAR, net interest income is modeled utilizing various assumptions for assets and liabilities. EVE measures the period end market value of assets minus the market value of liabilities and the change in this value as rates change. EVE is a period end measurement.
77
Table of Contents
Our simulation model incorporates various assumptions, which we believe are reasonable but which may have a significant impact on results such as: (i) the timing of changes in interest rates; (ii) shifts or rotations in the yield curve;(iii) re-pricing characteristics for market-rate-sensitive instruments; (iv) varying loan prepayment speeds for different interest rate scenarios; and (v) the overall growth and mix of assets and liabilities. Because of limitations inherent in any approach used to measure interest rate risk, simulation results are not intended as a forecast of the actual effect of a change in market interest rates on our results but rather as a means to better plan and execute appropriate asset-liability management strategies and manage our interest rate risk.
Potential changes to our net interest income in hypothetical rising and declining rate scenarios calculated as of December 31, 2017, 2016 and 2015 are presented in the following table. The projections assume (1) immediate, parallel shifts downward of the yield curve of 100 basis points and (2) immediate, parallel shifts upward of the yield curve of 100, 200, 300 and 400 basis points over 12 months. In the current interest rate environment, a downward shift of the yield curve of 200, 300 and 400 basis points does not provide us with meaningful results. In a downward parallel shift of the yield curve, interest rate at theshort-end of the yield curve are not modeled to decline any further than 0%.
| Net Interest Income Sensitivity | Economic Value of Equity Sensitivity | |||||||||||||||||||||||
| December 31, | December 31, | |||||||||||||||||||||||
| 2017 | 2016 | 2015 | 2017 | 2016 | 2015 | |||||||||||||||||||
+400 basis points | 11.58 | % | 9.95 | % | 2.49 | % | 6.28 | % | (4.63 | )% | (14.04 | )% | ||||||||||||
+300 basis points | 9.14 | % | 7.57 | % | 3.23 | % | 5.85 | % | (2.15 | )% | (9.36 | )% | ||||||||||||
+200 basis points | 6.42 | % | 5.58 | % | 2.58 | % | 4.90 | % | (0.02 | )% | (5.69 | )% | ||||||||||||
+100 basis points | 3.43 | % | 3.19 | % | 1.66 | % | 4.09 | % | 1.65 | % | (2.02 | )% | ||||||||||||
-100 basis points | (2.24 | )% | (1.47 | )% | (2.70 | )% | (3.06 | )% | (6.42 | )% | (1.29 | )% | ||||||||||||
We are within board-established policy limits for the all rate scenarios. The EAR reported at December 31, 2017 projects that our earnings are expected to be sensitive to changes in interest rates over the next year. In recent periods, the amount of fixed rate assets decreased resulting in a position shift to be slightly more asset sensitive.
78
Table of Contents
Our Company
We are a bank holding company headquartered in Los Angeles, California. Our commercial banking activities are operated through Open Bank, our banking subsidiary. We offer commercial banking services to small andmedium-sized businesses, their owners and retail customers with a focus on the Korean-American community. Having grown our branch and loan production office network over the past seven years, we now operate through seven full service branches located in the greater metropolitan area of Los Angeles, California, and Orange County, California, and three loan production offices in the Korean-American communities in Atlanta, Georgia, Dallas, Texas, and Seattle, Washington. In addition, we intend to open a full service branch in Santa Clara, California in the first quarter of 2018. As of December 31, 2017, we had consolidated total assets of $901.0 million, total deposits of $773.3 million, total loans outstanding (net of allowance for loan losses) of $738.9 million, and total shareholders’ equity of $91.5 million.
We believe that we provide our customers with a high degree of service, convenience and the financial products they need to achieve their financial objectives, by offering a customer-oriented product mix, competitive pricing, and convenient locations. Our lending activities are diversified and include CRE, commercial and industrial, SBA, home mortgage, and consumer loans. We generally lend in markets where we have a physical presence through our branch and loan production offices. We attract retail deposits through our branch network which offers a wide range of deposit products for business and consumer banking customers. We offer a multitude of other products and services to our customers to complement our lending and deposit business.
We have a strong, values-based corporate culture rooted in personal community-based relationship banking that permeates throughout our entire organization. We strive to provide quality customer service that exceeds our customers’ expectations. We also heavily invest in our Korean-American communities through our annual contributions to the Open Stewardship Foundation. We believe that customers value a banking partner knowledgeable about their business needs with a willingness and commitment to reinvest back into the community. We convey to our customers that banking with us indirectly provides them an opportunity to contribute to the community. We believe our strategic approach creates opportunities for expanding our banking relationships with new and existing customers who value personalized attention, local decision making and view us as an alternative to the large consolidated Korean-American financial institutions.
We established the Open Stewardship Foundation in 2011 to actively support civic organizations, schools and other eligible charitablenon-profit organizations that provide public benefit services in the communities we serve. The Foundation operates through a board of directors that includes individuals who are members of our board of directors and executive management team, including our President and Chief Executive Officer and our Chairman of the Board. The Foundation board of directors reviews and approves award grants. We have committed to contribute annually 10% of our consolidated net income after taxes to the Foundation. Since inception, we have donated over $2.9 million to the Foundation, aiding over 120 localnon-profits.
Our experienced executive management team has been in place since 2010 and averages more than 30 years’ experience in the banking industry. Min Kim, our President and Chief Executive Officer, has over 35 years of banking experience in the Korean-American banking community. Ms. Kim previously served as Chief Executive Officer of Nara Bancorp and Nara Bank (now part of Hope Bancorp and Bank of Hope). After joining us, Ms. Kim implemented her strategic vision to take advantage of the opportunities to build a Korean-American community-based bank focused on personal relationships as an alternative to the larger Korean-American financial institutions that she believed through consolidation provided an opportunity for Open Bank to better serve small tomedium-sized businesses in the Korean-American community.
Since 2012 we have achieved significant organic growth in many of our key financial performance metrics. From December 31, 2012 through December 31, 2017, total assets have grown at a compounded annual growth
79
Table of Contents
rate (“CAGR”) of 34% from $206 million to $901 million, total gross loans (including loansheld-for-sale) at a CAGR of 36% from $162 million to $764 million, and total deposits at a CAGR of 35% from $174 million to $773 million. The charts below illustrate the growth in the dollar balances of our total assets, loans and deposits.
| |
Over this same period, our profitability also significantly increased. The charts below illustrate our net income and diluted earnings per share (“EPS”) and net interest income and net interest margin (“NIM”) during this period. We believe our earnings growth during this period was primarily attributable to our organic growth initiatives, which improved our loan portfolio, our deposit mix and our efficiency ratio.
| |
We plan to continue to leverage our experienced management team, our personal relationship community banking focus in the attractive Korean-American communities in which we serve, and our diversified lending approach to drive future organic growth. While other institutions frequently enter new geographies through acquisitions, we have grown our geographic footprint through de novo branches while remaining true to our business model. We intend to continue our organic growth while further diversifying our geographical concentration with the anticipated expansion in Santa Clara, California, in the first quarter of 2018, our first branch in northern California. We also are targeting markets where we have loan production offices for future expansion and development of de novo branches. Supplementing deposit products to our borrowers in those markets provides the profitability to support the investment in full service branches. Although our growth has historically been organic, we are amenable to considering opportunistic strategic acquisitions to enhance our long-term growth strategy.
80
Table of Contents
Our Strategies
Our vision is to be the leading Korean-American community-based commercial bank in the Korean-American communities we serve, to meet the financial needs of underserved small andmedium-sized business and individuals, and to give back to these communities.
Our more specific strategic initiatives are discussed below.
| • | Leverage our Franchise in the Korean-American Communities We Serve. The Korean-American banking landscape has seen increased consolidation of the larger Korean-American financial institutions that do business in our market areas. We believe that the customers at these larger institutions will look for an alternative banking experience that is tailored towards their specific financial objectives and we strive to be the most prominent alternative to the larger Korean-American financial institutions. We differentiate ourselves from our competitors by developing meaningful and personal relationships with our customers, combined with a superior level of service to make Open Bank an attractive choice for small tomedium-sized businesses, professionals and individuals. Our strong financial performance and growth derives in part for the desire by small andmedium-sized businesses and individuals for quality personal relationship banking, local and responsive decision making and flexible and competitive pricing of deposit and loan products. Our commitment to the Open Stewardship Foundation raises our profile and reinforces our position as a community partner committed to the success of the communities we serve. We convey to our customers that banking with us provides them with an indirect opportunity to contribute to the community. In addition, we have invested in developing a distinct corporate culture guided by a core set of values. These values underlie everything we do, including the way we engage with customers, collaborate with colleagues, do business and manage our resources. We believe our commitment to our communities, culture and quality of our people have been catalysts of our success and will continue to propel our future. |
| • | Focus on Organic Growth. We intend to grow organically and believe the markets in which we operate currently provide meaningful opportunities to expand our commercial customer base and increase our market share. We believe that our overall capabilities, culture and opportunities for career growth will allow us to continue to attract talented and entrepreneurial commercial and retail bankers from larger Korean-American financial institutions. Our bankers have further capacity to penetrate the markets and communities they serve and drive loan and deposit growth as our brand awareness continues to grow. We also seek to offer our various banking products, including our deposit products, residential loan products and cash management services to our commercial loan and SBA borrowers, which we believe provides a basis for expanding our banking relationships. We believe we have built a scalable platform that will support our continual organic growth. Although we are currently focused on organic growth, we will also look for opportunistic strategic acquisitions that complement our commercial banking and the strong personal community-based relationship orientation of our franchise. |
| • | Increase our Share of Lower-Cost Deposits. We believe the quality of our deposit base and access to stable funding are key components of our success. We have a strong deposit base characterized by a high level of core deposits, high proportion ofnon-interest bearing accounts and relatively low funding costs. As of December 31, 2017, deposits accounted for 95.5% of total liabilities. Core deposits, which we define as all deposits excluding time deposits exceeding $250,000, constituted 85.9% of total deposits. We increased ournon-interest bearing deposits as a percentage of total deposits from 31.6% as of December 31, 2012 to 37.4% as of December 31, 2017. Our cost of total deposits was 0.62% for the year ended December 31, 2017. We employ conventional marketing initiatives and advertising and leverage our community commitment activities to generate new accounts. Deposit rates and terms are based primarily on current operating strategies and market interest rates, liquidity requirements and our deposit growth goals. Our bankers offer a full suite of products and services to our loan customers, with a specific focus on acquiring and maintaining core deposits as we depend on them to fund the majority of our loans. Small businesses are a significant source of low cost deposits and represent opportunities for future growth. We believe that small business owners value our ability to provide convenience and access to local, responsive decision makers. Commercial accounts also generally have higher deposit balances and transaction volumes than individual |
81
Table of Contents
deposit accounts. As of December 31, 2017, commercial deposits represented 45% of total deposits. We take specific initiatives to establish banking relationships with our SBA borrowers with the goal of securing their future banking business as they continue to grow their businesses. We typically require, depending on the circumstances and the type of relationship, our borrowers to maintain deposit accounts as a condition of granting loans. We believe that our convenient branch network, personal relationship-driven culture, diversified product offering, and flexible pricing allow us to accelerate deposit growth. We plan to continue investing in our franchise brand, our community reputation, employees, and product capabilities to further improve customer loyalty with a view toward growing our high quality deposit portfolio. |
| • | Branch Expansion. We intend to continue our strategy of opening and developing de novo branches particularly into Korean-American populated areas. We have pursued this growth strategy since the beginning of 2012 when we only had one branch location. As of December 31, 2017, we had seven branches in the greater Los Angeles and Orange County areas and anticipate opening an eighth branch in the first quarter of 2018 in Santa Clara, California. We will review future potential target areas for de novo expansion based on our ability to attract experienced bankers within such targeted regions. In addition, we currently operate three loan production offices located in Atlanta, Georgia, Dallas, Texas and Seattle, Washington. We will continue to look for additional markets to expand our loan production capabilities and, if we believe there are opportunities to develop deposit business in these markets, we may expand one or more loan production offices into de novo branches. |
| • | Expand and Diversify our Commercial Lending. We are committed to continuing to expand and continue to grow our commercial loan portfolios while maintaining what we believe are conservative underwriting standards. We focus our commercial lending to small andmedium-sized businesses in our market areas. Since 2012, our commercial loan portfolio has grown from $148.2 million at December 31, 2012 to $640.0 million at December 31, 2017, representing 85.6% of our total loans as of December 31, 2017. We expect to expand our commercial lending business in our expanding branch network, where we can continue to leverage our ability to develop personal community-based relationships and leverage our quality service model into new opportunities. We believe we can leverage our personalized customer service, extensive knowledge of our local markets and high visibility community activities to attract and retain customers seeking alternatives to the larger Korean-American financial institutions. We are also focused on diversifying our loan portfolio. As of December 31, 2017, total CRE loans had declined to 70.4% of our loan portfolio from 79.2% at December 31, 2012. |
|
|
| • | Preserve Our Asset Quality Through Disciplined Lending Practices. Our approach to credit management uses well-defined policies and procedures, disciplined underwriting criteria and ongoing risk management. This approach has allowed us to maintain loan growth with a diversified portfolio of high quality assets. We believe our credit culture supports accountable bankers, who maintain an ability to expand our customer base |
82
Table of Contents
as well as make sound decisions. As of December 31, 2017, our ratio of nonperforming assets to total assets was 0.12% and our ratio of nonperforming loans to total loans was 0.14%. However, as a result of the organic growth of our loan portfolio over the past five years, a large portion of our loans and lending relationships are of relatively recent origin and the current level of delinquencies and defaults may not represent the level that may prevail as the portfolio becomes more seasoned. |
| • | Leverage Public Company Status. In addition to raising capital to support our growth as further discussed under “Use of Proceeds,” we believe becoming a public reporting company, while increasing our operating costs, will provide us with additional options and better pricing to manage our cost of capital that were previously unavailable to us when our shares were quoted on the OTCQB Market. While we have not historically engaged in any merger and acquisition activity, the ability to issue publicly-traded stock as consideration may enable us to opportunistically approach potential transactions. In addition, we believe the additional liquidity provided by being listed on the Nasdaq Global Market and being a public reporting company will enhance the equity component of our compensation programs, which will enable us to better incent and retain key employees in the competitive markets in which we operate. |
Our Competitive Strengths
Our management team has identified the following competitive strengths that we believe will allow us to continue to achieve our principal objective of increasing shareholder value and generating consistent earnings growth through the organic and strategic expansion of our commercial banking franchise:
| • | Experienced Leadership and Management Team. Our experienced executive management team and senior leaders have exhibited the ability to strengthen shareholder value by consistently growing profitably. Our Chief Executive Officer was previously the chief executive officer of a multi-billion dollar bank holding company and bank focused on the Korean-American community. The members of our executive management team have, on average, more than 30 years’ experience working for large, billion-dollar-plus financial institutions in our markets during various economic cycles. They have been with Open Bank for an average of seven years, and substantially all have known and worked with our Chief Executive Officer, prior to joining Open Bank. Our executive management team has instilled a transparent and entrepreneurial culture that rewards leadership, innovation, and problem solving. Our annual compensation plan is designed to provide employees with the incentive to perform at a consistently high level and provide financial rewards for performance that meets or exceeds defined financial, strategic-related, risk-mitigating targets and individual expectations on a consistent basis. |
| • | Personal Relationship-Based Customer Service. We strive to differentiate ourselves from our competition by providing the best “relationship-based” services to small- andmedium-sized businesses and their owners and residents in the Korean-American communities in which we operate. We accomplish this by striving to provide our customers with a superior level of personal and responsive service delivered by experienced bankers in a manner that timely meets our customers’ financial objections. Our management team’s significant banking and lending experience in our markets has provided us with an understanding of the commercial banking needs of our customers, which allows us to tailor our products and services to meet our customers’ financial objectives. We believe we have also been successful in attracting customers from larger Korean-American financial institutions because of our flexible and responsive approach in providing banking solutions while maintaining disciplined underwriting standards. To enhance our relationships with our customers and to identify and meet their particular needs, each customer is assigned a relationship officer (including our SBA borrowers). Approximately 56% of our borrowers also have a deposit relationship with us, providing us with visibility into their liquidity profile and contributing to our ability to manage our asset quality. We instill the importance of delivering outstanding customer service and seeking opportunities to strengthen relationships with both customers and the communities we serve in our employees. |
| • | Strong Community Relationships. A primary mission of Open Bank is to meet the financial services needs of underserved customers in our markets, and we strive to distinguish ourselves by giving back to these |
83
Table of Contents
communities. In October 2011, we established the Open Stewardship Foundation to actively support local civic organizations, schools, and public services. We have committed to fund the Foundation in an amount equal to 10% of our annual consolidated net income after taxes. This commitment is in our annual operating budget each year. We believe that our community commitment distinguishes us from our competitors and enhances and expands business relationships within the Korean-American communities we serve. Since inception, we have donated over $2.9 million to the Foundation, aiding over 120 localnon-profits. Our President and Chief Executive Officer and our Chairman of the Board are among those who serve on the Foundation’s board of directors, enabling the Foundation to focus its awards in a manner that best comports with our overall community and business goals. Additionally, our management team has strong ties and relationships within the Korean-American communities where we operate. The Foundation and our employees and board of directors are involved in community activities that enhance our relationships with a variety of industry leadership groups, including the Korean-American Federation of Los Angeles, the Korean-American Chamber of Commerce of Los Angeles, the Korean-American Manufacturers Association, the Korean-American CPA Society of Southern California, California KAGRO Association, and the Korean Real Estate Brokers Association of Southern California. Affiliation with these local organizations provide our management team with knowledge of local markets and industries, as well as market developments that may impact the evolving business environment in which we operate. |
| • | Strong Credit Quality. We have implemented policies and procedures for credit underwriting and administration which have enabled us to maintain strong asset quality while at the same time growing our banking business. As of December 31, 2017, our NPA as a percentage of total gross loans and OREO was 0.14%. |
| • | Strong Risk Management Practices. We place significant emphasis on risk management as an integral component of our organizational culture without sacrificing growth. We believe our comprehensive risk management system is designed to make sure that we have sound policies, procedures, and practices for the management of key risks under our risk framework (which includes market, operational, liquidity, interest rate sensitivity, credit, regulatory, legal and reputational risk) and that any exceptions to written policy are reported by senior management to our board of directors or audit committee. Our risk management practices are overseen by the chairman of our audit committee and the chairman of Open Bank’s risk and compliance committees, who have more than 20 years of combined banking experience, and our chief risk officer, who has more than 35 years of banking experience. We believe that our enterprise risk management philosophy has been important in gaining and maintaining the confidence of our various constituencies and growing our business and footprint within our markets. We also believe our strong risk management practices are manifested in our asset quality metrics. |
| • | Efficient and Scalable Platform with Capacity to Support Our Growth. Our management team has built an efficient and scalable corporate infrastructure within our commercial banking franchise, including the areas of banking processes, technology, data processing, underwriting and risk management, which we believe will support our continued growth. For example, during 2016 we introduced enhanced enterprise risk software and cybersecurity monitoring software to strengthen our operations and risk culture. While expanding our infrastructure, several departmental functions have been outsourced to gain the experience of outside professionals while at the same time achieving more favorable economics and cost-effective solutions. Such outsourced areas include the internal audit function, investment securities management, and select loan review, interest rate risk management and stress testing. This outsourcing strategy is designed to control costs while adding enhanced controls and/or service levels. We believe that our scalable infrastructure will continue to allow us to efficiently and effectively manage our anticipated growth. |
Market Area
We are headquartered in Los Angeles, California. We currently have one branch in the financial district of downtown Los Angeles and, directly adjacent to downtown Los Angeles, we have one branch in the fashion district and three branches in Koreatown. In addition, we operate a branch in Gardena, California and a branch in Buena Park, in Orange County, California. These branches are located in the Los Angeles-Long Beach-Anaheim,
84
Table of Contents
California Metropolitan Statistical Area, or MSA. With over 13 million residents, it is the largest MSA in California, the second largest MSA in the United States, and one of the most significant business markets in the world. It is estimated that the greater Los Angeles area has a gross domestic product of approximately $1 trillion, which would rank it as the 16th largest economy in the world. The economic base of the area is heavily dependent on small- andmedium-sized businesses, providing us with a market rich in potential customers. According to the U.S. Census Bureau, Asian-Americans accounted for 15.1% of the over 10.1 million residents in Los Angeles County as of July 1, 2016.
We anticipate opening a branch in Santa Clara, California in the first quarter of 2018.
We also operate loan production offices in Atlanta, Georgia, Dallas, Texas and Seattle, Washington to support our SBA lending efforts.
Deposit Products
We offer customers traditional retail deposit products through our branch network and the ability to access their accounts through online and mobile banking platforms. We offer a variety of deposit accounts with a wide range of interest rates and terms including demand, savings, money market and time deposits with the goal of attracting a wide variety of customers, including small tomedium-sized businesses. We consider our core deposits, defined as all deposits except for time deposits exceeding $250,000, to be our primary and most valuablelow-cost funding source for our lending business, and as of December 31, 2017, core deposits represented 86% of our total deposits. We strive to retain an attractive deposit mix from both large and small customers as well as a broad market reach, which has resulted in our top 10 customers accounting for only 12.2% of all deposits as of December 31, 2017. We believe our competitive pricing and products, convenient branch locations, and quality personal customer service enable us to attract and retain deposits. We employ conventional marketing initiatives and advertising and in addition leverage our community commitment activities, including our Foundation, to generate new accounts. Our bankers offer our deposit products to our loan customers. We typically require, depending on the circumstances and the type of relationship, our borrowers to maintain deposit accounts as a condition of granting loans. To enhance our relationships with our customers and to identify and meet their particular needs, each customer is assigned a relationship officer (including our SBA borrowers). Approximately 56% of our borrowers also have a deposit relationship with us. Interest rates, maturity terms, service fees and withdrawal penalties are established on a periodic basis. Deposit rates and terms are based primarily on current operating strategies and market interest rates, liquidity requirements and our deposit growth goals. We do utilize wholesale deposits to supplement our core retail deposits for funding purposes, including brokered accounts. As of December 31, 2017, wholesale deposits totaled $113.2 million, or 14.6% of total deposits. As of December 31, 2017, we had $773.3 million of deposits, and our cost of deposits was 0.62% for the year ended December 31, 2017.
Lending Activities
Our lending strategy is to maintain a broadly diversified loan portfolio based on the type of customer (i.e., businesses versus individuals), type of loan product (e.g., owner occupied commercial real estate, commercial and industrial loans, etc.), geographic location and industries in which our business customers are engaged (e.g., manufacturing, retail, hospitality, etc.). We principally focus our lending activities on loans that we originate from borrowers located in our market areas. We seek to be the premier provider of lending products and services in our market areas and serve the credit needs of high-quality business and individual borrowers in the communities that we serve.
We offer a variety of loans, including CRE loans (including loans secured by owner occupied commercial properties), SBA loans, and commercial and industrial loans to local manufacturing and industrial companies and other businesses. We also offer various consumer loans to individuals and professionals including residential real estate loans, and unsecured personal lines of credit. Lending activities originate from the relationships and efforts
85
Table of Contents
of our bankers, with an emphasis on providing banking solutions tailored to meet our customers’ needs while maintaining our underwriting standards.
As of December 31, 2017, our loan portfolio held for investment consisted of the following:
| December 31, 2017 | ||||
| (dollars in thousands) | ||||
Commercial real estate | $ | 420,760 | ||
Small business administration loans | $ | 115,559 | ||
Commercial and industrial | $ | 103,682 | ||
Home mortgage | $ | 104,068 | ||
Consumer | $ | 3,955 | ||
|
| |||
Gross loans receivable | $ | 748,024 | ||
|
| |||
For additional information concerning our loan portfolio, see “Management’s Discussion and Analysis of Financial Condition and Results of Operations—Financial Condition—Loan Portfolio.”
Concentrations of Credit Risk. Most of our lending activity is conducted with businesses and individuals in our market areas. Our loan portfolio consists primarily of CRE loans, which were $420.8 million and constituted 56.2% of our total loans as of December 31, 2017, SBA loans, which were $115.6 million and constituted 15.4% of our total loans as of December 31, 2017, and commercial and industrial loans, including trade finance loans, which were $103.7 million and constituted 13.9% of our total loans as of December 31, 2017. Our commercial real estate loans are secured by first liens on real property. The remaining commercial and industrial loans are typically secured by general business assets, accounts receivable inventory, real estate and/or the corporate guaranty of the borrower and personal guaranty of its principals. The geographic concentration subjects the loan portfolio to the general economic conditions within Southern California. The risks created by such concentrations have been considered by management in the determination of the adequacy of the allowance for loan losses. Management believes the allowance for loan losses is adequate to cover incurred losses in our loan portfolio as of December 31, 2017.
Sound risk management practices and appropriate levels of capital are essential elements of a sound commercial real estate lending program. Concentrations of commercial real estate exposures add a dimension of risk that compounds the risk inherent in individual loans. Interagency guidance on commercial real estate concentrations describe sound risk management practices which include board and management oversight, portfolio management, management information systems, market analysis, portfolio stress testing and sensitivity analysis, credit underwriting standards, and credit risk review functions. Management believes it has implemented these practices in order to monitor concentrations in commercial real estate in our loan portfolio.
Large Credit Relationships. As of December 31, 2017, the aggregate amount of loans to our 10 and 25 largest borrowers (including related entities) amounted to approximately $107.8 million, or 14.4% of total loans, and $206.4 million, or 27.6% of total loans, respectively.
Loan Underwriting and Approval. Historically, we believe we have made sound, high quality loans while recognizing that lending money involves a degree of business risk. We have loan policies designed to assist us in managing this business risk. These policies provide a general framework for our loan origination, monitoring and funding activities, while recognizing that not all risks can be anticipated. Open Bank’s board of directors delegates loan authority up to board-approved limits collectively to its Loan & Credit Policy Committee, which is comprised of members of its board of directors. Our board of directors also delegates limited lending authority to our internal management loan committee, which is comprised of members of our executive management team. No individual at the Bank has sole loan approval authority. The objective of our approval process is to provide a disciplined, collaborative approach to larger credits while maintaining responsiveness to client needs.
Loan decisions are documented as to the borrower’s business, purpose of the loan, evaluation of the repayment source and the associated risks, evaluation of collateral, covenants and monitoring requirements, and the risk
86
Table of Contents
rating rationale. Our strategy for approving or disapproving loans is to follow conservative loan policies and consistent underwriting practices which include:
| • | maintaining close relationships among our customers and their designated banker to ensure ongoing credit monitoring and loan servicing; |
| • | granting credit on a sound basis with full knowledge of the purpose and source of repayment for such credit; |
| • | ensuring that primary and secondary sources of repayment are adequate in relation to the amount of the loan; |
| • | developing and maintaining targeted levels of diversification for our loan portfolio as a whole and for loans within each category; and |
| • | ensuring that each loan is properly documented and that any insurance coverage requirements are satisfied. |
Managing credit risk is an enterprise-wide process. Our strategy for credit risk management includes well-defined, centralized credit policies, uniform underwriting criteria and ongoing risk monitoring and review processes for all credit exposures. Our processes emphasize early-stage review of loans, regular credit evaluations and management reviews of loans, which supplement the ongoing and proactive credit monitoring and loan servicing provided by our bankers. Our Chief Credit Officer provides company-wide credit oversight and periodically reviews all credit risk portfolios to ensure that the risk identification processes are functioning properly and that our credit standards are followed. In addition, a third-party loan review is performed to assist in the identification of problem assets and to confirm our internal risk rating of loans. We attempt to identify potential problem loans early in an effort to seek aggressive resolution of these situations before the loans become a loss, record any necessary charge-offs promptly and maintain adequate allowance levels for probable loan losses inherent in the loan portfolio.
Our loan policies generally include other underwriting guidelines for loans collateralized by real estate. These underwriting standards are designed to determine the maximum loan amount that a borrower has the capacity to repay based upon the type of collateral securing the loan and the borrower’s income. Such loan policies include maximum amortization schedules and loan terms for each category of loans collateralized by liens on real estate.
In addition, our loan policies provide guidelines for: personal guarantees; an environmental review; loans to employees, executive officers and directors; problem loan identification; maintenance of an adequate allowance for loan losses and other matters relating to lending practices.
Lending Limits. Our lending activities are subject to a variety of lending limits imposed by federal law. In general, the Bank is subject to a legal lending limit on loans to a single borrower based on the Bank’s capital level. The dollar amounts of the Bank’s lending limit increases or decreases as the Bank’s capital increases or decreases. The Bank is able to sell participations in its larger loans to other financial institutions, which allows it to manage the risk involved in these loans and to meet the lending needs of its customers that require extensions of credit in excess of these limits.
The Bank’s legal lending limit as of December 31, 2017 on loans to a single borrower was $25.2 million for secured loans and $15.1 million for unsecured loans, which are expected to increase following the consummation of this offering.
Our loan policies provide general guidelines forloan-to-value ratios that restrict the size of loans to a maximum percentage of the value of the collateral securing the loans, which percentage varies by the type of collateral. Our internalloan-to-value limitations follow limits established by applicable law.
We provide a variety of loans to meet our customers’ needs. The section below discusses our general loan categories:
Commercial Real Estate Loans. We offer commercial real estate loans collateralized by real estate, which may be owner occupied ornon-owner occupied real estate. Commercial real estate lending typically involves
87
Table of Contents
higher loan principal amounts and the repayment is dependent, in large part, on sufficient income from the properties securing the loans to cover operating expenses and debt service. We believe that our management team has extensive knowledge of our borrowers and the markets where we operate, and takes a conservative approach to commercial real estate lending, focusing on what we believe to be high quality credits with lowloan-to-value ratios income-producing properties with strong cash flow characteristics, and strong collateral profiles.
We require our commercial real estate loans to be secured by what we believe to be well-managed property with adequate margins and we generally obtain a personal guarantee from responsible parties. Our commercial real estate loans are secured by professional office buildings, shopping centers, manufacturing facilities, and special purpose properties such as restaurants, retail operations and service stations. We originate both fixed- and adjustable-rate loans with terms up to 25 years. Fixed-rate loans have provisions that allow us to call the loan after five to seven years. Adjustable-rate loans are generally based on the prime rate and adjust with the prime rate. At December 31, 2017, approximately 56% of the commercial real estate loan portfolio consisted of fixed rate loans. Loan amounts generally do not exceed 70% of the lesser of the appraised value or the purchase price depending on the property audits we utilize.
Our total commercial real estate loan portfolio totaled $420.8 million at December 31, 2017 and $362.6 million at December 31, 2016. We had nonon-performing commercial real estate loans as of December 31, 2017 and 2016.
Payments on loans secured by such properties are often dependent on the successful operation (in the case of owner occupied real estate) or management (in the case ofnon-owner occupied real estate) of the properties. Accordingly, repayment of these loans may be subject to adverse conditions in the real estate market or the economy to a greater extent than other types of loans. In underwriting commercial real estate loans, we seek to minimize these risks in a variety of ways, including giving careful consideration to the property’s age, condition, operating history, future operating projections, current and projected market rental rates, vacancy rates, location and physical condition. The underwriting analysis also may include credit verification, reviews of appraisals, environmental hazard reports, the borrower’s liquidity and leverage, management experience of the owners or principals, economic condition and industry trends.
Small Business Administration Loans. We offer SBA loans for qualifying businesses for loan amounts up to $5 million. The Bank primarily extends SBA loans known as SBA 7(a) loans and SBA 504 loans. SBA 7(a) loans are typically extended for working capital needs, purchase of inventory, purchase of machinery and equipment, debt refinance, business acquisitions,start-up financing or to purchase or construct owner-occupied commercial property. SBA 7(a) loans are typically term loans with maturities up to 10 years for loans not secured by real estate and up to 25 years for real estate secured loans. SBA loans are fully amortizing with monthly payments of principal and interest. SBA 7(a) loans are typically floating rate loans that are secured by business assets and/or real estate. Depending on the loan amount, each loan is typically guaranteed 75% to 85% by the SBA, with a maximum gross loan amount to any one small business borrower of $5 million and a maximum SBA guaranteed amount of $3.75 million.
We are generally able to sell the guaranteed portion of the SBA 7(a) loans in the secondary market at a premium, while earning servicing fee income on the sold portion over the remaining life of the loan. In addition to the interest yield earned on the unguaranteed portion of the SBA 7(a) loans that are not sold, we recognize income from gains on sales and from loan servicing on the SBA 7(a) loans that are sold.
SBA 504 loans are typically extended for the purpose of purchasing owner-occupied commercial real estate or long-term capital equipment. SBA 504 loans are typically extended for up to 20 years or the life of the asset being financed. SBA 504 loans are financed as a participation loan between the Bank and the SBA through a Certified Development Company (“CDC”). Generally, the loans are structured to give the Bank a 50% first deed of trust (“TD”), the CDC a 40% second TD, and the remaining 10% is funded by the borrower. Interest rates for
88
Table of Contents
the first TD Bank loans are subject to normal bank commercial rates and terms and the second TD CDC loans are fixed for the life of the loans based on certain indices.
All of our SBA loans are originated through our SBA Loan Department. The SBA Loan Department is staffed by loan officers who provide assistance to qualified businesses. The Bank has been designated as an SBA Preferred Lender, which is the highest designation awarded by the SBA. This designation generally facilitates a more efficient marketing and approval process for SBA loans. We have attained SBA Preferred Lender status nationwide.
We originate SBA loans through our branch staff, loan production officers, marketing officers and through SBA brokers.
As of December 31, 2017, our SBA loan portfolio totaled $115.6 million ofnon-guaranteed loans, $106.9 million of which was secured by real estate and $8.6 million of which was unsecured or secured by business assets.
Commercial and Industrial Business Loans. We have significant expertise in small to middle market commercial and industrial lending, including trade finance loans. We believe that our success is the result of our product and market expertise, and our focus on delivering high-quality, customized and quick turnaround service for our clients due to our focus on maintaining an appropriate balance between prudent, disciplined underwriting, on the one hand, and flexibility in our decision making and responsiveness to our clients, on the other hand, which has allowed us to grow our commercial and industrial loan portfolio, while maintaining strong asset quality.
We provide a mix of variable and fixed rate commercial and industrial loans. The loans are typically made to small- andmedium-sized manufacturing, wholesale, retail and service businesses for working capital needs, business expansions and for international trade financing. We extend commercial business loans on an unsecured and secured basis advanced for working capital, accounts receivable and inventory financing, machinery and equipment purchases, and other business purposes. Generally, short-term loans have maturities ranging from six months to one year, and “term loans” have maturities ranging from five to seven years. Loans are generally intended to finance current transactions and typically provide for periodic principal payments, with interest payable monthly. Term loans generally provide for floating interest rates, with monthly payments of both principal and interest. Repayment of secured and unsecured commercial loans depends substantially on the borrower’s underlying business, financial condition and cash flows, as well as the sufficiency of the collateral. Compared to real estate, the collateral may be more difficult to monitor, evaluate and sell. Where the borrower is a corporation, partnership or other entity, we typically require personal guarantees from significant equity holders.
Our trade finance unit supplies financial needs to many of our commercial and industrial loan customers. The unit provides, international letters of credit, SWIFT, and export advice. Our trade finance unit has a correspondent relationship with many of the largest banks in South Korea. All of our international letters of credit, SWIFT, and export advice are denominated in U.S. dollars.
The total commercial and industrial loan portfolio totaled $103.7 million at December 31, 2017 and $97.7 million at December 31, 2016. Ournon-performing commercial and industrial loans as of December 31, 2017 were $354,000 and have not changed materially from $367,000 at December 31, 2016.
In general, commercial and industrial loans may involve increased credit risk and, therefore, typically yield a higher return. The increased risk in commercial and industrial loans derives from the expectation that such loans generally are serviced principally from the operations of the business, and those operations may not be successful. Any interruption or discontinuance of operating cash flows from the business, which may be influenced by events not under the control of the borrower such as economic events and changes in governmental
89
Table of Contents
regulations, could materially affect the ability of the borrower to repay the loan. In addition, the collateral securing commercial and industrial loans generally includes moveable property such as equipment and inventory, which may decline in value more rapidly than we anticipate exposing us to increased credit risk. As a result of these additional complexities, variables and risks, commercial and industrial loans require extensive underwriting and servicing.
Single-Family Residential Loans. We originate residential real estate loans collateralized by owner occupied andnon-owner occupied properties located in our market areas to enable borrowers to purchase or refinance existing homes. We offer adjustable-rate mortgage loans with the interest rate fixed for the first five years followed by rate adjustments each year with terms up to 30 years. The relative amount of adjustable-rate mortgage loans that can be originated at any time is largely determined by the demand for each in a competitive environment and the effect each has on our interest rate risk.
Loans collateralized by single-family residential real estate generally are originated in amounts of no more than 70% of appraised value. In connection with such loans, we retain a valid lien on real estate, obtain a title insurance policy that insures that the property is free from encumbrances and require hazard insurance.
Loan fees on these products, interest rates and other provisions of mortgage loans are determined by us on the basis of our own pricing criteria and competitive market conditions. Interest rates and payments on our adjustable-rate loans generally are adjusted annually based on the 1 year-LIBOR rate.
While single-family residential real estate loans are normally originated with up to30-year terms, such loans typically remain outstanding for substantially shorter periods because borrowers often prepay their loans in full upon sale of the property pledged as security or upon refinancing the original loan. In addition, all of the mortgage loans in our loan portfolio containdue-on-sale clauses providing that the Bank may declare the unpaid amount due and payable upon the sale of the property securing the loan.
The total single-family residential real estate loan portfolio totaled $104.1 million at December 31, 2017 and $104.8 million at December 31, 2016. Ournon-performing single-family residential real estate loans as of December 31, 2017 were $662,000 as compared to nonon-performing single-family residential real estate loans as of December 31, 2016.
Consumer Loans. We offer unsecured lines of credit and term loans to high net worth individuals. Consumer loans are underwritten based on the individual borrower’s income, current debt level, and past credit history. The terms of consumer loans are up to seven years. Consumer loans entail greater risk than do residential real estate loans because they are unsecured. Consumer loan collections are dependent on the borrower’s continuing financial stability, and thus are more likely to be adversely affected by job loss, divorce, illness or personal bankruptcy. Furthermore, the application of various federal and state laws may limit the amount which can be recovered on such loans.
The total consumer loan portfolio totaled $4.0 million at December 31, 2017 and $4.9 million at December 31, 2016. Ournon-performing consumer loans as of December 31, 2017 were $21,000 as compared to nonon-performing consumer loans as of December 31, 2016.
The procedures for underwriting consumer loans include an assessment of the applicant’s payment history and the applicant’s credit worthiness.
Loan Participations. When loans exceed our lending limit, we as the lead bank will sell a portion of the loan in order to remain within our lending limit. We also sell loan participations to reduce risk and manage credit concentrations in particular businesses and industries. Banks with which we participate are generally located in California. We do not participate in syndicated loans (loans made by a group of lenders who share or participate in a specific loan) with a larger regional financial institution as the lead lender.
90
Table of Contents
Investment Activities
We manage our securities portfolio and cash to maintain adequate liquidity and to ensure the safety and preservation of invested principal, with a secondary focus on yield and returns. Specific goals of our investment portfolio are as follows:
| • | provide a ready source of balance sheet liquidity, ensuring adequate availability of funds to meet fluctuations in loan demand, deposit balances and other changes in balance sheet volumes and composition; |
| • | serve as a tool to manage asset-quality diversification of our assets; and |
| • | provide a vehicle to help manage our interest rate risk profile pursuant to our established policies and maximize our overall return. |
With the exception of U.S. government agency issues and short term money market instruments, no one type or segment of security exceeds 40% of the portfolio.
Open Bank’s board of directors is responsible for the oversight of investment activities and has delegated the responsibility of monitoring our investment activities to the Asset/Liability Management Board Committee (“ALM”). Our investment policy is reviewed and approved annually by ALM and ratified by our board of directors.
ALM establishes risk limits and policy for conducting investment activities. ALM receives monthly reports from management’s Asset Liability Management Committee (“ALCO”), which approves investment strategies and meets monthly to review investment reports and monitor investment activities. ALCO receives investment related reports and any policy exceptions from the investment officer, who is appointed by ALM and responsible for ensuring compliance and implementation of investment policy guidelines.Day-to-day activities pertaining to the securities portfolio are conducted by the investment officer under the supervision of our Chief Executive Officer and Chief Financial Officer. We actively monitor our investments on an ongoing basis to identify any material changes in the securities. We also review our securities for potential other-than-temporary impairment at least quarterly.
Limits for investment transactions are based on total transaction amount and require approval if they exceed designated thresholds. Investment transactions up to $5 million require Chief Executive Officer and Chief Financial Officer approval. Investment transactions that exceed $5 million, up to $10 million, require ALCO approval and any investment transaction greater than $10 million must bepre-approved by ALM.
Other Products and Services
We offer banking products and services that are competitively priced with a focus on convenience and accessibility. We offer a full suite of online banking solutions including access to account balances, online transfers, online bill payment and electronic delivery of customer statements, mobile banking solutions for iPhone and Android phones, including remote check deposit with mobile bill pay. We offer ATMs and banking by telephone, mail and personal appointment. We offer debit cards with no ATM surcharges or foreign ATM fees for checking customers, direct deposit, cashier’s checks, as well as treasury management services, wire transfer services and automated clearing house (“ACH”) services.
We offer a full array of commercial treasury management services designed to be competitive with banks of all sizes. Treasury management services include balance reporting (including current day and previous day activity), transfers between accounts, wire transfer initiation, ACH origination and stop payments. Cash management deposit products consist of remote deposit capture, positive pay, zero balance accounts and sweep accounts.
91
Table of Contents
We evaluate our services on an ongoing basis, and will add or remove services based upon the perceived needs and financial requirements of our customers, competitive factors and our financial and other capabilities. Future services may also be significantly influenced by improvements and developments in technology and evolving state and federal laws and regulations.
Competition
In our primary markets in Southern California, we view the Korean-American direct banking market competition, including Open Bank, as comprised of nine banks divided into three segments: large publicly-traded banks (two banks), locally-owned banks (five banks), and banks that are subsidiaries of Korean banks (two banks). In addition to Open Bank, all of the locally-owned banks are based in California. As of December 31, 2017, we are the seventh-largest bank among this group of nine banks based on total assets.
The table below provides more details on the current Korean-American banking landscape as of December 31, 2017.
(Dollars in millions) Institution Name | Headquarters | U.S. Offices | Total Assets | Total Loans | Total Deposits | Total Equity(1) | ||||||||||||||||||
Large Publicly-Traded Korean-American Banks | ||||||||||||||||||||||||
Hope Bancorp, Inc. | Los Angeles, CA | 63 | 14,207 | 11,132 | 10,847 | 1,928 | ||||||||||||||||||
Hanmi Financial Corporation | Los Angeles, CA | 40 | 5,210 | 4,311 | 4,349 | 562 | ||||||||||||||||||
Locally-Owned Korean-American Banks | ||||||||||||||||||||||||
Pacific City Financial Corporation | Los Angeles, CA | 13 | 1,442 | 1,195 | 1,251 | 142 | ||||||||||||||||||
MetroCity Bankshares, Inc. | Doraville, GA | 15 | 1,292 | 1,103 | 1,027 | 132 | ||||||||||||||||||
CBB Bancorp, Inc. | Los Angeles, CA | 8 | 1,079 | 816 | 896 | 115 | ||||||||||||||||||
OP Bancorp(2) | Los Angeles, CA | 8 | 901 | 764 | 773 | 91 | ||||||||||||||||||
First IC Corporation | Doraville, GA | 7 | 404 | 323 | 337 | 63 | ||||||||||||||||||
Noah Bank | Elkins Park, PA | 5 | 381 | 327 | 326 | 43 | ||||||||||||||||||
NewBank | Flushing, NY | 5 | 349 | 214 | 297 | 44 | ||||||||||||||||||
NOA Bancorp, Inc. | Duluth, GA | 5 | 327 | 240 | 273 | 42 | ||||||||||||||||||
US Metro Bank | Garden Grove, CA | 4 | 325 | 218 | 269 | 49 | ||||||||||||||||||
Uniti Financial Corporation | Buena Park, CA | 3 | 320 | 250 | 278 | 44 | ||||||||||||||||||
U&I Financial Corp. | Lynnwood, WA | 4 | 274 | 181 | 231 | 39 | ||||||||||||||||||
Ohana Pacific Bank | Honolulu, HI | 2 | 144 | 118 | 127 | 17 | ||||||||||||||||||
Korean Bank Subsidiaries in the U.S. | ||||||||||||||||||||||||
Woori America Bank | New York, NY | 19 | 1,817 | 1,426 | 1,544 | 249 | ||||||||||||||||||
Shinhan Bank America | New York, NY | 16 | 1,337 | 1,223 | 1,167 | 162 | ||||||||||||||||||
KEB Hana Bank USA, N.A. | Fort Lee, NJ | 3 | 209 | 132 | 161 | 46 | ||||||||||||||||||
Source: S&P Global Market Intelligence. GAAP data when available, otherwise FR Y-9C’s and bank call reports.
| (1) | Total equity includes minority interest. |
| (2) | U.S. Offices is pro forma pending opening of the Santa Clara office in the first quarter of 2018, and does not include loan production offices. |
In addition to these Korean-American banks, we also compete with other banks in the region, particularly with Chinese-American banks in our market areas. In certain geographic markets where we currently operate, there is overlap between Chinese-American, Korean-American and other Asian-American banks for loan and deposit business. We aim to grow both organically and potentially through acquisitions in these markets.
The banking and financial services industry is highly competitive. The increasingly competitive environment is a result primarily of changes in regulation, changes in technology and product delivery systems, and the accelerating pace of consolidation among financial services providers. We compete for loan and deposit
92
Table of Contents
customers with other commercial banks, savings and loan associations, securities and brokerage companies, mortgage companies, insurance companies, finance companies, money market funds, credit unions, and other nonbank financial service providers. Many of these competitors, including the majority of the other Korean-American banks located in greater Los Angeles County, have a longer operating history, are much larger in total assets and capitalization, have greater access to capital markets and offer a broader range of financial services than we do.
Large commercial bank competitors have, among other advantages, the ability to finance wide-ranging and effective advertising campaigns and to allocate their investment resources to areas of highest yield and demand. Many of the major banks operating in our market area offer certain services, which we do not offer directly (but some of which we offer through correspondent institutions). By virtue of their greater total capitalization, such banks also have substantially higher lending limits (restricted to a percentage of our total shareholders’ equity, depending upon the nature of the loan transaction) than us.
In addition to other banks, our competitors include savings institutions, credit unions, thrift and loan companies and numerousnon-banking institutions, such as finance companies, leasing companies, insurance companies, brokerage firms, and investment banking firms located in our primary market area. In recent years, increased competition has also developed from specialized finance andnon-finance companies that offer money market and mutual funds, wholesale finance, credit card, and other consumer finance services, includingon-line banking services and personal finance software. We also face growing competition fromso-called “online businesses” with few or no physical locations. Strong competition for deposit and loan products affects the rates of those products as well as the terms on which they are offered to customers.
To the extent that we are affected by more general competitive trends in the industry, those trends are focused towards increased consolidation and competition. Strong competitors, other than financial institutions, have entered banking markets with focused products targeted at highly profitable customer segments. Many of these competitors are able to compete across geographic boundaries and provide customers increasing access to meaningful alternatives to banking services in nearly all significant products. Mergers between financial institutions have placed additional pressure on banks within the industry to streamline their operations, reduce expenses, and increase revenues to remain competitive.
Technological innovations have also resulted in increased competition in the financial services industry. Such innovations have, for example, made it possible fornon-depository institutions to offer customers automated transfer payment services that previously have been considered traditional banking products. In addition, many customers now expect a choice of several delivery systems and channels, including telephone, mail, home computer, ATMs, self-service branches and/or in store branches. In addition to other banks, the sources of competition for such high-tech products include savings associations, credit unions, brokerage firms, money market and other mutual funds, asset management groups, finance and insurance companies, and mortgage banking firms.
Information Technology Systems
We have made and continue to make significant investments in our information technology systems and staff for our banking and lending operations and treasury management activities. We believe this investment will support our continued growth and enable us to enhance our capabilities to offer new products and overall customer experience, and to provide scale for future growth and acquisitions. We utilize a nationally recognized software vendor, and their support allows us to outsource our data processing. Our internal network ande-mail systems are outsourced to a third party and we have aback-up site at our Buena Park location. Thisback-up site provides for redundancy and disaster recovery capabilities.
The majority of our other systems including our electronic funds transfer, transaction processing and our online banking services are hosted by third-party service providers. The scalability of this infrastructure will
93
Table of Contents
support our growth strategy. In addition, the tested capability of these vendors to automatically switch over to standby systems should allow us to recover our systems and provide business continuity quickly in case of a disaster.
Employees
As of December 31, 2017, we had approximately 129.0 full-time equivalent employees. None of our employees are represented by any collective bargaining unit or is a party to a collective bargaining agreement. We consider our relationship with our employees to be good and have not experienced interruptions of operations due to labor disagreements.
Properties
Corporate Offices
Our corporate offices are located at 1000 Wilshire Blvd., Los Angeles, California, 90017 on the fifth floor of atwenty-two storyClass-A type office building. Our corporate office space consists of 15,239 square feet and is subject to a lease which expires in December 2024. The current monthly rent for the fifth floor, is $27,753 and is subject to 3% annual increases until the lease expires. We have one five-year option to extend the term of the lease.
Branch Offices
Office | Location | |
Wilshire Office | 1000 Wilshire Blvd., Los Angeles, CA 90017 | |
Fashion District Office | 747 East 10th Street, 3rd Floor Los Angeles, CA 90021 | |
Aroma Office | 3680 Wilshire Blvd. Los Angeles, CA 90010 | |
Olympic Office | 3030 West Olympic Blvd. Los Angeles, CA 90006 | |
Western Office | 550 South Western Avenue Los Angeles, CA 90020 | |
Gardena Office | 15435 South Western Avenue Gardena, CA 90249 | |
Buena Park Office | 5141 Beach Blvd. Buena Park, CA 90621 | |
Santa Clara Office (*) | 2998 East El Camino Real Santa Clara, CA 95051 |
| * | We anticipate the Santa Clara Office to initiate operations in the first quarter of 2018. |
Wilshire Office. The Wilshire Office is located on the first floor at 1000 Wilshire Blvd, Los Angeles, California, where our corporate offices are also located. The branch consists of 11,115 square feet and is subject to a lease dated December 2013, which expires in December 2024. The current monthly rent is $20,243 and is subject to 3% annual increases until the lease expires. We have one five-year option to extend the term of the lease.
Fashion District Office. In July 2012, we leased approximately 2,189 square feet on the third floor in a four-story multi-tenantmulti-use stand-alone building. The initial five-year lease expired in July 2017 and we renewed for another five years at a monthly rent of $5,144.
94
Table of Contents
Aroma Office. In June 2013, we leased approximately 2,734 square feet on the ground floor in a five-story multi-tenantmulti-use stand-alone building located in Koreatown, Los Angeles, California. The current monthly rent is $7,977 and is subject to annual increases equal to the Consumer Price Index (CPI), not to exceed 3% until the lease expires in June 2023. We have reserved the right to extend the term of the lease for two additional periods of five years.
Olympic Office. In April 2014, we leased approximately 3,800 square feet in aone-story shopping strip building. The current monthly rent is $10,000 until the end of 2017, and will be $9,500 plus common area maintenance charges for the following two years, and is subject to annual CPI adjustments thereafter until the lease expires in March 2024. We have reserved the right to extend the term of the lease for two additional periods of five years.
Western Office. In June 2015, we leased approximately a 12,450 square feet building. The current monthly rent is $46,687 and is subject to annual increases until the lease expires in May 2025. We have reserved the right to extend the term of the lease for two additional periods of five years. The branch utilizes approximately 4,000 square feet and the remaining space, including the common area, is being used by three other departments.
Gardena Office. In September 2012, we leased approximately 1,520 square feet on the first floor in atwo-story multi-tenantmulti-use stand-alone building. The current monthly rent payment is $2,280 for the first year and $3,040 for the remaining lease period. We have reserved the right to extend the term of the lease for one additional period of five years.
Buena Park Office. In March 2013, we leased approximately 3,047 square feet in a newly built class A shopping strip building. The current monthly rent is $9,141 through October 2017, $10,665 for one year thereafter, and is subject to annual increases based on the CPI until the lease expires in March 2023. We have reserved the right to extend the term of the lease for two additional periods of five years.
Santa Clara Office. In August 2017, we leased approximately 2,678 square feet in a building. The current monthly rent is $9,597 and is fixed for three years and is subject to annual increases of 3% thereafter until the lease expires in August 2027. We have reserved the right to extend the term of the lease for two additional periods of five years. We anticipate the branch to initiate operations in the first quarter of 2018.
Loan Production Offices
We maintain loan production offices in Atlanta, Georgia, Dallas, Texas and Seattle, Washington.
Coexistence Agreement between the Bank and Open Bank S.A.
We have not registered the trademark “Open Bank” under the trademark laws of the United States. Open Bank, S.A., a corporation organized and existing under the laws of Spain with its principal office located in Ciudad Grupo Santander, Av. Catabria Boadilla del Monte Madrid Spain (“Open Bank S.A.”) originally registered the trademark “Open Bank” (U.S. Registration No. 3397518) in 2008 with the United States Patent and Trademark Office. Open Bank S.A. provides financial services in Spain and solicits financial services in the United States through the internet. Open Bank S.A. is not licensed to engage in banking services in the United States or California and to our knowledge in any other state in the United States. In February 2014, we entered into a Coexistence Agreement with Open Bank S.A. (the “Coexistence Agreement”), under which both parties agreed that we may use the name “Open Bank” in connection with banking and banking related services in the state of California and the cities of New York, Dallas, Atlanta, Chicago, Seattle and Fort Lee, New Jersey (the “Permitted Markets”). We agreed to limit all of the Bank’s marketing, advertising, publicity, soliciting and or media efforts using the “Open Bank” name to primarily the Korean-American community in the Permitted Markets. However, we have the right under the Coexistence Agreement to market through the internet. The Coexistence Agreement states that these limitations are not intended to mean that we should in any way engage
95
Table of Contents
in discriminatory tactics or policy or in any way discriminate againstnon-Korean-American customers or potential customers. Under the Coexistence Agreement, Open Bank S.A. retains the right to use and market its services in relation to its registered trademark in any state or territory in the United States. We further agreed not to challenge Open Bank, S.A.’s trademark registration or any future applications by Open Bank S.A. The Coexistence Agreement has no termination date and is perpetual. If Open Bank S.A. decides to become a licensed bank in California or in any of the other Permitted Markets, depending on its business and marketing plan, there could be confusion created by the use of the name “Open Bank” which could have a material adverse impact on our ability to build its brand in the Permitted Markets. In addition, if Open Bank, S.A. were to assert that we breached the Coexistence Agreement, Open Bank, S.A. could file for an injunction, seek to have the Bank change its name or seek monetary damages, all of which could have a material adverse impact on our financial condition and results of operations. There are no approval rights of either party for any of the actions or no actions that either party may take under the Coexistence Agreement. To our knowledge Open Bank, S.A. has not initiated any business or marketing activities in the United States other than on the worldwide interest through its Spanish language website.
Litigation
From time to time, we are party to claims and legal proceedings arising in the ordinary course of business. There are currently no claims or legal proceedings filed against us.
96
Table of Contents
General
We are extensively regulated under U.S. federal and state law. As a result, our growth and earnings performance may be affected not only by management decisions and general economic conditions, but also by federal and state statutes and by the regulations and policies of various bank regulatory agencies, including the DBO, the Federal Reserve, the FDIC and the CFPB. Furthermore, tax laws administered by the Internal Revenue Service and state taxing authorities, accounting rules developed by the FASB, securities laws administered by the SEC and state securities authorities, anti-money laundering laws enforced by the U.S. Department of the Treasury, or Treasury, and mortgage related rules, including with respect to loan securitization and servicing by the U.S. Department of Housing and Urban Development and agencies such as Fannie Mae and Freddie Mac, also impact our business. The effect of these statutes, regulations, regulatory policies and rules are significant to our financial condition and results of operations. Further, the nature and extent of future legislative, regulatory or other changes affecting financial institutions are impossible to predict with any certainty.
Federal and state banking laws impose a comprehensive system of supervision, regulation and enforcement on the operations of banks, their holding companies and their affiliates. These laws are intended primarily for the protection of the FDIC’s Deposit Insurance Fund and bank customers rather than shareholders. Federal and state laws, and the related regulations of the bank regulatory agencies, affect, among other things, the scope of business, the kinds and amounts of investments banks may make, reserve requirements, capital levels relative to operations, the nature and amount of collateral for loans, the establishment of branches, the ability to merge, consolidate and acquire, dealings with insiders and affiliates and the payment of dividends.
This supervisory and regulatory framework subjects banks and bank holding companies to regular examination by their respective regulatory agencies, which results in examination reports and ratings that, while not publicly available, can affect the conduct and growth of their businesses. These examinations consider not only compliance with applicable laws and regulations, but also capital levels, asset quality and risk, management ability and performance, earnings, liquidity, and various other factors. The regulatory agencies have broad discretion to impose restrictions and limitations on the operations of a regulated entity where the agencies determine, among other things, that such operations are unsafe or unsound, fail to comply with applicable law or are otherwise inconsistent with laws and regulations or with the supervisory policies of these agencies.
The following is a summary of the material elements of the supervisory and regulatory framework applicable to the Company and its subsidiary, the Bank. It does not describe all of the statutes, regulations and regulatory policies that apply, nor does it restate all of the requirements of those that are described. The descriptions are qualified in their entirety by reference to the particular statutory and regulatory provision.
Regulatory Capital Requirements
The federal banking agencies have risk-based capital adequacy requirements intended to provide a measure of capital adequacy that reflects the perceived degree of risk associated with a banking organization’s operations, both for transactions reported on the balance sheet as assets and for transactions, such as letters of credit and recourse arrangements, that are recorded asoff-balance sheet items. In 2013, the bank regulatory agencies issued final rules (the “Basel III Capital Rules”) establishing a new comprehensive capital framework for U.S. banking organizations. The Basel III Capital Rules implement the Basel Committee’s December 2010 framework for strengthening international capital standards and certain provisions of the Dodd-Frank Act. The Basel III Capital Rules became effective on January 1, 2015.
The Basel III Capital Rules require the Bank comply with several minimum capital standards. The Bank must maintain a Tier 1 leverage ratio of at least 4.0%; a common equity Tier 1, which we refer to as CET1, to risk-weighted assets of 4.5%; a Tier 1 capital (that is, CET1 plus Additional Tier 1 capital) to risk-weighted assets of at least 6.0% and a total capital (that is, Tier 1 capital plus Tier 2 capital) to risk-weighted assets of at least 8.0%.
97
Table of Contents
CET1 capital is generally defined as common shareholders’ equity and retained earnings. Tier 1 capital is generally defined as CET1 and Additional Tier 1 capital. Additional Tier 1 capital generally includes certain noncumulative perpetual preferred stock and related surplus and minority interests in equity accounts of consolidated subsidiaries. Total capital includes Tier 1 capital (CET1 capital plus Additional Tier 1 capital) and Tier 2 capital. Tier 2 capital is comprised of capital instruments and related surplus meeting specified requirements, and may include cumulative preferred stock and long-term perpetual preferred stock, mandatory convertible securities, intermediate preferred stock and subordinated debt. Also included in Tier 2 capital is the ALL limited to a maximum of 1.25% of risk-weighted assets and, for institutions that have exercised anopt-out election regarding the treatment of Accumulated Other Comprehensive Income (“AOCI”), up to 45% of net unrealized gains onavailable-for-sale equity securities with readily determinable fair market values. Institutions that have not exercised the AOCIopt-out have AOCI incorporated into CET1 capital (including unrealized gains and losses onavailable-for-sale-securities). We exercised theopt-out election regarding the treatment of AOCI in part to avoid significant variations in the our capital levels resulting changes in the fair value of ouravailable-for-sale investment securities portfolio as interest rates fluctuate. The calculation of all types of regulatory capital is subject to deductions and adjustments specified in the regulations.
The Basel III Capital Rules provide for a number of deductions from and adjustments to CET1. These include, for example, the requirement that (i) mortgage servicing rights, (ii) deferred tax assets arising from temporary differences that could not be realized through net operating loss carrybacks, and (iii) significant investments innon-consolidated financial entities be deducted from CET1 to the extent that any one such category exceeds 10% of CET1 or all such items, in the aggregate, exceed 15% of CET1. Implementation of the deductions and other adjustments to CET1 began on January 1, 2015 and would bephased-in over a four-year period (beginning at 40% on January 1, 2015 and an additional 20% per year thereafter).
In addition to establishing the minimum regulatory capital requirements, the Basel III Capital Rules limit capital distributions and certain discretionary bonus payments to management if an institution does not hold a “capital conservation buffer” consisting of an additional 2.5% of CET1, on top of the minimum risk-weighted asset ratios. The capital conservation buffer is designed to absorb losses during periods of economic stress. The capital conservation buffer requirement is being phased in over a four-year period beginning on January 1, 2016 at 0.625%, increasing by 0.625% each January 1 until it reaches 2.5% on January 1, 2019.
During 2018, banking organizations, including the Company and the Bank, are required to maintain a CET1 capital ratio of at least 6.375%, a Tier 1 capital ratio of at least 7.875%, and a total capital ratio of at least 9.875% to avoid limitations on capital distributions and certain discretionary incentive compensation payments. When fullyphased-in on January 1, 2019, the Company and the Bank will be required to meet minimum Tier 1 leverage ratio of 4.0%, a minimum CET1 to risk-weighted assets of 4.5% (7% with the capital conservation buffer), a Tier 1 capital to risk-weighted assets of 6.0% (8.5% including the capital conservation buffer) and a minimum total capital to risk-weighted assets of 8.0% (10.5% including the capital conservation buffer).
In determining the amount of risk-weighted assets for purposes of calculating risk-based capital ratios, a bank’s assets, including certainoff-balance sheet assets (e.g., recourse obligations, direct credit substitutes, residual interests), are multiplied by a risk weight factor assigned by the regulations based on perceived risks inherent in the type of asset. As a result, higher levels of capital are required for asset categories believed to present greater risk. For example, a risk weight of 0% is assigned to cash and U.S. government securities, a risk weight of 50% is generally assigned to prudently underwritten first lien 1—4 family residential mortgages, a risk weight of 100% is assigned to commercial and consumer loans, a risk weight of 150% is assigned to certain past due loans and a risk weight of between 0% to 600% is assigned to permissible equity interests, depending on certain specified factors. The Basel III Capital Rules increased the risk weights for a variety of asset classes, including certain CRE mortgages. Additional aspects of the Basel III Capital Rules’ risk weighting requirements that are relevant to the Company and the Bank include:
| • | assigning exposures secured by single-family residential properties to either a 50% risk weight for first-lien mortgages that meet prudent underwriting standards or a 100% risk weight category for all other mortgages; |
98
Table of Contents
| • | providing for a 20% credit conversion factor for the unused portion of a commitment with an original maturity of one year or less that is not unconditionally cancellable (increased from 0% under the previous risk-based capital rules); |
| • | assigning a 150% risk weight to all exposures that are nonaccrual or 90 days or more past due (increased from 100% under the previous risk-based capital rules), except for those secured by single-family residential properties, which will be assigned a 100% risk weight, consistent with the Basel I risk-based capital rules; |
| • | applying a 150% risk weight instead of a 100% risk weight for certain high volatility CRE acquisition, development and construction loans; and |
| • | applying a 250% risk weight to the portion of mortgage servicing rights and deferred tax assets arising from temporary differences that could not be realized through net operating loss carrybacks that are not deducted from CET1 capital (increased from 100% under the previous Basel I risk-based capital rules). |
As of December 31, 2017, the Company’s and the Bank’s capital ratios exceeded the minimum capital adequacy guideline percentage requirements of the federal banking agencies for “well capitalized” institutions under the Basel III Capital Rules on a fullyphased-in basis.
Prompt Corrective Action
The Federal Deposit Insurance Act requires federal banking agencies to take “prompt corrective action” with respect to depository institutions that do not meet minimum capital requirements. For purposes of prompt corrective action, the law establishes five capital tiers: “well capitalized,” “adequately capitalized,” “undercapitalized,” “significantly undercapitalized,” and “critically undercapitalized.” A depository institution’s capital tier depends on its capital levels and certain other factors established by regulation. The applicable FDIC regulations were amended to incorporate the increased capital requirements required by the Basel III Capital Rules that became effective on January 1, 2015. Under the amended regulations, an institution is deemed to be “well capitalized” if it has a total risk-based capital ratio of 10.0% or greater, a Tier 1 risk-based capital ratio of 8.0% or greater, a leverage ratio of 5.0% or greater and a CET1 ratio of 6.5% or greater.
At each successively lower capital category, a bank is subject to increased restrictions on its operations. For example, a bank is generally prohibited from and making capital distributions and paying management fees to its holding company if doing so would make the bank “undercapitalized.” Asset growth and branching restrictions apply to undercapitalized banks, which are required to submit written capital restoration plans meeting specified requirements (including a guarantee by the parent holding company, if any). “Significantly undercapitalized” banks are subject to broad regulatory authority, including among other things, capital directives, forced mergers, restrictions on the rates of interest they may pay on deposits, restrictions on asset growth and activities, and prohibitions on paying bonuses or increasing compensation to senior executive officers without FDIC approval. “Critically undercapitalized” are subject to even more severe restrictions, including, subject to a narrow exception, the appointment of a conservator or receiver with 90 days after becoming critically undercapitalized.
The appropriate federal banking agency may determine (after notice and opportunity for a hearing) that the institution is in an unsafe or unsound condition or deems the institution to be engaging in an unsafe or unsound practice. The appropriate agency is also permitted to require an adequately capitalized or undercapitalized institution to comply with the supervisory provisions as if the institution were in the next lower category (but not treat a significantly undercapitalized institution as critically undercapitalized) based on supervisory information other than the capital levels of the institution.
The capital classification of a bank holding company and a bank affects the frequency of regulatory examinations, the bank holding company’s and the bank’s ability to engage in certain activities and the deposit insurance premium paid by the bank. A bank’s capital category is determined solely for the purpose of applying prompt correct action regulations and the capital category may not accurately reflect the bank’s overall financial condition or prospects.
99
Table of Contents
As of December 31, 2017, we met the requirements for being considered “well-capitalized” for purposes of the prompt corrective action regulations.
Enforcement Powers of Federal and State Banking Agencies
The federal bank regulatory agencies have broad enforcement powers, including the power to terminate deposit insurance, impose substantial fines and other civil and criminal penalties, and appoint a conservator or receiver for financial institutions. Failure to comply with applicable laws and regulations could subject us and our officers and directors to administrative sanctions and potentially substantial civil money penalties. In addition to the grounds discussed above under “—Prompt Corrective Actions,” the appropriate federal bank regulatory agency may appoint the FDIC as conservator or receiver for a depository institution (or the FDIC may appoint itself, under certain circumstances) if any one or more of a number of circumstances exist, including, without limitation, the fact that the depository institution is undercapitalized and has no reasonable prospect of becoming adequately capitalized, fails to become adequately capitalized when required to do so, fails to submit a timely and acceptable capital restoration plan or materially fails to implement an accepted capital restoration plan. The DBO also has broad enforcement powers over us, including the power to impose orders, remove officers and directors, impose fines and appoint supervisors and conservators.
The Company
General. As a bank holding company, the Company is subject to regulation and supervision by, the Federal Reserve under the Bank Holding Company Act of 1956, as amended, or the BHCA. Under the BHCA, the Company is subject to periodic examination by the Federal Reserve. The Company is required to file with the Federal Reserve periodic reports of the its operations and such additional information as the Federal Reserve may require. In accordance with Federal Reserve policy, and as now codified by the Dodd-Frank Act, the Company is legally obligated to act as a source of financial strength to the Bank and to commit resources to support the Bank in circumstances where the Company might not otherwise do so.
The Company is also a bank holding company within the meaning of Section 1280 of the California Financial Code. Consequently, the Company is subject to examination by, and may be required to file reports with, the DBO.
Acquisitions, Activities and Change in Control. The BHCA generally requires the prior approval by the Federal Reserve for any merger involving a bank holding company or any bank holding company’s acquisition of more than 5% of a class of voting securities of any additional bank or bank holding company or to acquire all or substantially all, the assets of any additional bank or bank holding company. In reviewing applications seeking approval of merger and acquisition transactions, Federal Reserve considers, among other things, the competitive effect and public benefits of the transactions, the capital position and managerial resources of the combined organization, the risks to the stability of the U.S. banking or financial system, the applicant’s performance record under the Community Reinvestment Act of 1977, as amended (“CRA”), the applicant’s compliance with fair housing and other consumer protection laws and the effectiveness of all organizations involved in combating money laundering activities. In addition, failure to implement or maintain adequate compliance programs could cause bank regulators not to approve an acquisition where regulatory approval is required or to prohibit an acquisition even if approval is not required.
Subject to certain conditions (including deposit concentration limits established by the BHCA and the Dodd-Frank Act), the Federal Reserve may allow a bank holding company to acquire banks located in any state of the United States. In approving interstate acquisitions, the Federal Reserve is required to give effect to applicable state law limitations on the aggregate amount of deposits that may be held by the acquiring bank holding company and its insured depository institution affiliates in the state in which the target bank is located (provided that those limits do not discriminate againstout-of-state depository institutions or their holding companies) and state laws that require that the target bank have been in existence for a minimum period of time (not to exceed
100
Table of Contents
five years) before being acquired by anout-of-state bank holding company. Furthermore, in accordance with the Dodd-Frank Act, bank holding companies must be well-capitalized and well-managed in order to complete interstate mergers or acquisitions. For a discussion of the capital requirements, see “—Regulatory Capital Requirements” above.
Federal law also prohibits any person or company from acquiring “control” of an FDIC-insured depository institution or its holding company without prior notice to the appropriate federal bank regulator. “Control” is conclusively presumed to exist upon the acquisition of 25% or more of the outstanding voting securities of a bank or bank holding company, but may arise under certain circumstances between 5% and 24.99% ownership.
Under the California Financial Code, any proposed acquisition of “control” of the Bank by any person (including a company) must be approved by the Commissioner of the DBO. The California Financial Code defines “control” as the power, directly or indirectly, to direct the Bank’s management or policies or to vote 25% or more of any class of the Bank’s outstanding voting securities. Additionally, a rebuttable presumption of control arises when any person (including a company) seeks to acquire, directly or indirectly, 10% or more of any class of the Bank’s outstanding voting securities.
Permitted Activities.The BHCA generally prohibits the Company from controlling or engaging in any business other than that of banking, managing and controlling banks or furnishing services to banks and their subsidiaries. This general prohibition is subject to a number of exceptions. The principal exception allows bank holding companies to engage in, and to own shares of companies engaged in, certain businesses found by the Federal Reserve prior to November 11, 1999 to be “so closely related to banking as to be a proper incident thereto.” This authority would permit the Company to engage in a variety of banking-related businesses, including the ownership and operation of a savings association, or any entity engaged in consumer finance, equipment leasing, the operation of a computer service bureau (including software development) and mortgage banking and brokerage. The BHCA generally does not place territorial restrictions on the domestic activities of nonbank subsidiaries of bank holding companies. The Federal Reserve has the power to order any bank holding company or its subsidiaries to terminate any activity or to terminate its ownership or control of any subsidiary when the Federal Reserve has reasonable grounds to believe that continuing such activity, ownership or control constitutes a serious risk to the financial soundness, safety or stability of any bank subsidiary of the bank holding company.
Additionally, bank holding companies that meet certain eligibility requirements prescribed by the BHCA and elect to operate as financial holding companies may engage in, or own shares in companies engaged in, a wider range of nonbanking activities, including securities and insurance underwriting and sales, merchant banking and any other activity that the Federal Reserve, in consultation with the Secretary of the Treasury, determines by regulation or order is financial in nature or incidental to any such financial activity or that the Federal Reserve determines by order to be complementary to any such financial activity and does not pose a substantial risk to the safety or soundness of depository institutions or the financial system generally. The Company has not elected to be a financial holding company, and we have not engaged in any activities determined by the Federal Reserve to be financial in nature or incidental or complementary to activities that are financial in nature.
If the Company should elect to become a financial holding company, in order to maintain the Company’s status as a financial holding company, the Company and the Bank must be well-capitalized, well-managed, and have a least a satisfactory CRA, rating. If the Company were to become a financial holding company and the Federal Reserve subsequently determined that the Company, as a financial holding company, is not well-capitalized or well-managed, the Company would have a period of time during which to achieve compliance, but during the period of noncompliance, the Federal Reserve may place any limitations on the Company it believes to be appropriate. Furthermore, if the Company became a financial holding company and the Federal Reserve subsequently determined that the Bank, as a financial holding company subsidiary, has not received a satisfactory CRA rating, the Company would not be able to commence any new financial activities or acquire a company that engages in such activities.
101
Table of Contents
Capital Requirements. Bank holding companies are required to maintain capital in accordance with Federal Reserve capital adequacy requirements, as affected by the Dodd-Frank Act and Basel III. For a discussion of capital requirements, see “—Regulatory Capital Requirements” above.
Source of Strength Doctrine. Federal Reserve policy historically required bank holding companies to act as a source of financial and managerial strength to their subsidiary banks. The Dodd-Frank Act codified this policy as a statutory requirement. Under this requirement the Company is expected to commit resources to support the Bank, including at times when the Company may not be in a financial position to provide it. The Company must stand ready to use its available resources to provide adequate capital to the subsidiary bank during periods of financial stress or adversity. The Company must also maintain the financial flexibility and capital raising capacity to obtain additional resources for assisting the Bank. The Company’s failure to meet its source of strength obligations may constitute an unsafe and unsound practice or a violation of the Federal Reserve’s regulations or both. The source of strength doctrine most directly affects bank holding companies where a bank holding company’s subsidiary bank fails to maintain adequate capital levels. In such a situation, the subsidiary bank will be required by the bank’s federal regulator to take “prompt corrective action.” Any capital loans by a bank holding company to a subsidiary bank are subordinate in right of payment to deposits and to certain other indebtedness of such bank. The BHCA provides that in the event of the bank holding company’s bankruptcy any commitment by a bank holding company to a federal bank regulatory agency to maintain the capital of its subsidiary bank will be assumed by the bankruptcy trustee and entitled to priority of payment.
Safe and Sound Banking Practices. Bank holding companies and theirnon-banking subsidiaries are prohibited from engaging in activities that represent unsafe and unsound banking practices or that constitute violation of law or regulations. Under certain conditions the Federal Reserve may conclude that certain actions of a bank holding company such as a payment of a cash dividend, would constitute an unsafe and unsound banking practice. The Federal Reserve also has the authority to regulate the debt of bank holding companies, including the authority to impose interest rate ceilings and reserve requirements on such debt. Under certain circumstances the Federal Reserve may require a bank holding company to file written notice and obtain its approval prior to purchasing or redeeming its equity securities, unless certain conditions are met.
Tie in Arrangements. Federal law prohibits a bank holding company and any subsidiary banks from engaging in certain tie in arrangements in connection with the extension of credit. For example, the Bank may not extend credit, lease or sell property, or furnish any services, or fix or vary the consideration for any of the foregoing on the condition that (i) the customer must obtain or provide some additional credit, property or services from or to the Bank other than a loan, discount, deposit or trust services, (ii) the customer must obtain or provide some additional credit, property or service from or to the Company or the Bank, or (iii) the customer must not obtain some other credit, property or services from competitors, except reasonable requirements to assure soundness of credit extended.
Dividend Payments, Stock Redemptions and Repurchases. The Company’s ability to pay dividends to its shareholders is affected by both general corporate law considerations and the policies of the Federal Reserve applicable to bank holding companies. It is the Federal Reserve’s policy that bank holding companies should generally pay dividends on common stock only out of income available over the past year, and only if prospective earnings retention is consistent with the organization’s expected future needs and financial condition. It is also the Federal Reserve’s policy that bank holding companies should not maintain dividend levels that undermine their ability to be a source of strength to its banking subsidiaries. Additionally, in consideration of the current financial and economic environment, the Federal Reserve has indicated that bank holding companies should carefully review their dividend policy and has discouraged payment ratios that are at maximum allowable levels unless both asset quality and capital are very strong. The Federal Reserve possesses enforcement powers over bank holding companies and their nonbank subsidiaries to prevent or remedy actions that represent unsafe or unsound practices or violations of applicable statutes and regulations. Among these powers is the ability to proscribe the payment of dividends by banks and bank holding companies. In addition, under the Basel Capital III Rules, institutions that seek to pay dividends must maintain a capital conservation buffer of 2.5% in CET1,
102
Table of Contents
which is to be phased in over a three year period that began on January 1, 2016. See “—Regulatory Capital Requirements” above.
Bank holding companies must consult with the Federal Reserve before redeeming any equity or other capital instrument included in Tier 1 or Tier 2 capital prior to stated maturity, if such redemption could have a material effect on the level or composition of the organization’s capital base. Bank holding companies experiencing financial weaknesses, or that are at significant risk of developing financial weaknesses, must consult with the Federal Reserve before redeeming or repurchasing common stock or other regulatory capital instruments.
As a California corporation, the Company is subject to the limitations of California law, which allows a corporation to distribute cash or property to shareholders, including a dividend or repurchase or redemption of shares, if the corporation meets either a retained earnings test or a “balance sheet” test. Under the retained earnings test, the Company may make a distribution from retained earnings to the extent that its retained earnings exceed the sum of (a) the amount of the distribution plus (b) the amount, if any, of dividends in arrears on shares with preferential dividend rights. The Company may also make a distribution if, immediately after the distribution, the value of its assets equals or exceeds the sum of (a) its total liabilities plus (b) the liquidation preference of any shares which have a preference upon dissolution over the rights of shareholders receiving the distribution. Indebtedness is not considered a liability if the terms of such indebtedness provide that payment of principal and interest thereon are to be made only if, and to the extent that, a distribution to shareholders could be made under the balance sheet test. In addition, the Company may not make distributions if it is, or as a result of the distribution would be, likely to be unable to meet its liabilities (except those whose payment is otherwise adequately provided for) as they mature. A California corporation may specify in its articles of incorporation that distributions under the retained earnings test or balance sheet test can be made without regard to the preferential rights amount. The Company’s articles of incorporation do not address distributions under either the retained earnings test or the balance sheet test.
The Bank
General. The Bank is a California-chartered bank. The Bank’s deposit accounts are insured by the FDIC’s Deposit Insurance Fund (“DIF”) to the maximum extent provided under federal law and FDIC regulations. The Bank is not a member of the Federal Reserve System. As a California-charterednon-member bank, the Bank is subject to the examination, supervision and regulation by the DBO, the chartering authority for California banks, and by the FDIC.
Depositor Preference. In the event of the “liquidation or other resolution” of an insured depository institution, the claims of depositors of the institution, including the claims of the FDIC as subrogee of insured depositors, and certain claims for administrative expenses of the FDIC as a receiver, will have priority over other general unsecured claims against the institution. If an insured depository institution fails, insured and uninsured depositors along with the FDIC, will have priority in payment ahead of unsecured,non-deposit creditors including the parent bank holding company with respect to any extensions of credit they have made to such insured depository institution.
Brokered Deposit Restrictions. Well capitalized institutions are not subject to limitations on brokered deposits, while adequately capitalized institutions are able to accept, renew or roll over brokered deposits only with a waiver from the FDIC and subject to certain restrictions on the yield paid on such deposits. Undercapitalized institutions are generally not permitted to accept, renew, or roll over brokered deposits. As of December 31, 2017, the Bank was eligible to accept brokered deposits without a waiver from FDIC.
Loans to One Borrower. With certain limited exceptions, the maximum amount that a California bank may lend to any borrower at any one time (including the obligations to the bank of certain related entities of the borrower) may not exceed 25% (and unsecured loans may not exceed 15%) of the bank’s shareholders’ equity, allowance for loan loss, and any capital notes and debentures of the bank.
103
Table of Contents
Deposit Insurance. As an FDIC-insured institution, the Bank is required to pay deposit insurance premium assessments to the FDIC. The FDIC has adopted a risk-based assessment system whereby FDIC-insured depository institutions pay insurance premiums at rates based on their risk classification. An institution’s risk classification is assigned based on its capital levels and the level of supervisory concern the institution poses to the regulators. For deposit insurance assessment purposes, an insured depository institution is placed in one of four risk categories each quarter. An institution’s assessment is determined by multiplying its assessment rate by its assessment base. The total base assessment rates range from 2.5 basis points to 45 basis points. While in the past an insured depository institution’s assessment base was determined by its deposit base, amendments to the Federal Deposit Insurance Act revised the assessment base so that it is calculated using average consolidated total assets minus average tangible equity.
Additionally, the Dodd-Frank Act altered the minimum designated reserve ratio of the DIF, increasing the minimum from 1.15% to 1.35% of the estimated amount of total insured deposits, and eliminating the requirement that the FDIC pay dividends to depository institutions when the reserve ratio exceeds certain thresholds. The FDIC has until September 3, 2020 to meet the 1.35% reserve ratio target. At least semi-annually, the FDIC updates its loss and income projections for the DIF and, if needed, may increase or decrease the assessment rates, following notice and comment on proposed rulemaking. As a result, the Bank’s FDIC deposit insurance premiums could increase. During the year ended December 31, 2017, the Bank paid $211,000 in aggregate FDIC deposit insurance premiums.
FICO Assessments. In addition to paying basic deposit insurance assessments, insured depository institutions must pay Financing Corporation, or FICO, assessments. FICO is a mixed-ownership governmental corporation chartered by the former Federal Home Loan Bank Board to recapitalize of the former Federal Savings and Loan Insurance Corporation. FICO issued30-year noncallable bonds of approximately $8.1 billion that mature in 2017 through 2019. Since 1996, federal legislation requires that all FDIC-insured depository institutions pay assessments to cover interest payments on FICO’s outstanding obligations. During the year ended December 31, 2017, the Bank paid $37,000 in aggregate FICO assessments.
Supervisory Assessments. California-chartered banks are required to pay supervisory assessments to the DBO to fund its operations. The amount of the assessment paid by a California bank to the DBO is calculated on the basis of the institution’s total assets, including consolidated subsidiaries, as reported to the DBO. During the year ended December 31, 2017, the Bank paid supervisory assessments to the DBO totaling $87,000.
Capital Requirements. Banks are generally required to maintain capital levels in excess of other businesses. For a discussion of capital requirements, see “—Regulatory Capital Requirements” above.
Dividend Payments. The primary source of funds for the Company is dividends from the Bank. Under the California Financial Code, the Bank is permitted to pay a dividend in the following circumstances: (i) without the consent of either the DBO or the Bank’s shareholders, in an amount not exceeding the lesser of (a) the retained earnings of the Bank; or (b) the net income of the Bank for its last three fiscal years, less the amount of any distributions made during the prior period; (ii) with the prior approval of the DBO, in an amount not exceeding the greatest of: (a) the retained earnings of the Bank; (b) the net income of the Bank for its last fiscal year; or (c) the net income for the Bank for its current fiscal year; and (iii) with the prior approval of the DBO and the Bank’s shareholders (i.e., the Company) in connection with a reduction of its contributed capital.
The payment of dividends by any financial institution is affected by the requirement to maintain adequate capital pursuant to applicable capital adequacy guidelines and regulations, and a financial institution generally is prohibited from paying any dividends if, following payment thereof, the institution would be undercapitalized. In addition, in order to pay a dividend, the Basel III Capitals Rules’ capital conservation buffer generally requires that an institutions maintain 2.5% in CET1, which is to be phased in over a three-year period that began on January 1, 2016. See “—Regulatory Capital Requirements” above. As described above, the Bank exceeded its minimum capital requirements under applicable regulatory guidelines as of December 31, 2017.
104
Table of Contents
Transactions with Affiliates. The Bank is subject to certain restrictions imposed by federal law on “covered transactions” between the Bank and its “affiliates.” The Company is an affiliate of the Bank for purposes of these restrictions, and covered transactions subject to the restrictions include extensions of credit to the Company, investments in the stock or other securities of the Company and the acceptance of the stock or other securities of the Company as collateral for loans made by the Bank. The Dodd-Frank Act enhances the requirements for certain transactions with affiliates, including an expansion of the definition of “covered transactions” and an increase in the amount of time for which collateral requirements regarding covered transactions must be maintained.
Loans to Directors, Executive Officers and Principal Shareholders. The authority of the Bank to extend credit to its directors, executive officers and principal shareholders, including their immediate family members and corporations and other entities that they control, is subject to substantial restrictions and requirements under the Federal Reserve’s Regulation O, as well as the Sarbanes-Oxley Act. These statutes and regulations impose limits the amount of loans the Bank may make to directors and other insiders and require that: (i) the loans must be made on substantially the same terms, including interest rates and collateral, as prevailing at the time for comparable transactions with persons not affiliated with the Company or the Bank; (ii) the Bank must follow credit underwriting procedures at least as stringent as those applicable to comparable transactions with persons who are not affiliated with the Company or the Bank; and (iii) the loans must not involve a greater than normal risk ofnon-payment or include other features not favorable to the Bank. Furthermore, the Bank must periodically report all loans made to directors and other insiders to the bank regulators.
Safety and Soundness Standards/Risk Management. The federal banking agencies have adopted guidelines establishing operational and managerial standards to promote the safety and soundness of federally insured depository institutions. The guidelines set forth standards for internal controls, information systems, internal audit systems, loan documentation, credit underwriting, interest rate exposure, asset growth, compensation, fees and benefits, asset quality and earnings.
In general, the safety and soundness guidelines prescribe the goals to be achieved in each area, and each institution is responsible for establishing its own procedures to achieve those goals. If an institution fails to comply with any of the standards set forth in the guidelines, the financial institution’s primary federal regulator may require the institution to submit a plan for achieving and maintaining compliance. If a financial institution fails to submit an acceptable compliance plan, or fails in any material respect to implement a compliance plan that has been accepted by its primary federal regulator, the regulator is required to issue an order directing the institution to cure the deficiency. Until the deficiency cited in the regulator’s order is cured, the regulator may restrict the financial institution’s rate of growth, require the financial institution to increase its capital, restrict the rates the institution pays on deposits or require the institution to take any action the regulator deems appropriate under the circumstances. Noncompliance with the standards established by the safety and soundness guidelines may also constitute grounds for other enforcement action by the federal bank regulatory agencies, including cease and desist orders and civil money penalty assessments.
During the past decade, the bank regulatory agencies have increasingly emphasized the importance of sound risk management processes and strong internal controls when evaluating the activities of the financial institutions they supervise. Properly managing risks has been identified as critical to the conduct of safe and sound banking activities and has become even more important as new technologies, product innovation, and the size and speed of financial transactions have changed the nature of banking markets. The agencies have identified a spectrum of risks facing a banking institution including, but not limited to, credit, market, liquidity, operational, legal, and reputational risk. In particular, recent regulatory pronouncements have focused on operational risk, which arises from the potential that inadequate information systems, operational problems, breaches in internal controls, fraud, or unforeseen catastrophes will result in unexpected losses. New products and services, third-party risk management and cybersecurity are critical sources of operational risk that financial institutions are expected to address in the current environment. The Bank is expected to have active board and senior management oversight; adequate policies, procedures, and limits; adequate risk measurement, monitoring, and management information systems; and comprehensive internal controls.
105
Table of Contents
Branching Authority. California law permits California banks, such as the Bank, to establish an additional banking office with notice to the DBO. Deposit-taking banking offices must be also be approved by the FDIC, which considers a number of factors, including financial history, capital adequacy, earnings prospects, character of management, needs of the community and consistency with corporate power. The Dodd-Frank Act permits insured state banks to engage in interstate branching if the laws of the state where the new banking office is to be established would permit the establishment of the banking office if it were chartered by a bank in such state. Finally, we may also establish banking offices in other states by merging with banks or by purchasing banking offices of other banks in other states, subject to certain restrictions.
Community Reinvestment Act. The CRA is intended to encourage insured depository institutions, while operating safely and soundly, to help meet the credit needs of their communities. The CRA specifically directs the federal bank regulatory agencies, in examining insured depository institutions, to assess their record of helping to meet the credit needs of their entire community, including low and moderate income neighborhoods, consistent with safe and sound banking practices. The CRA further requires the agencies to take a financial institution’s record of meeting its community credit needs into account when evaluating applications for, among other things, domestic branches, consummating mergers or acquisitions or holding company formations.
The federal banking agencies have adopted regulations which measure a bank’s compliance with its CRA obligations on a performance based evaluation system. This system bases CRA ratings on an institution’s actual lending service and investment performance rather than the extent to which the institution conducts needs assessments, documents community outreach or complies with other procedural requirements. The ratings range from “outstanding” to a low of “substantial noncompliance.” The Bank had a CRA rating of “satisfactory” as of its most recent regulatory examination.
Anti-Money Laundering and the Office of Foreign Assets Control Regulation. The Uniting and Strengthening America by Providing Appropriate Tools Required to Intercept and Obstruct Terrorism Act of 2001, or the Patriot Act, is designed to deny terrorists and criminals the ability to obtain access to the U.S. financial system and has significant implications for depository institutions, brokers, dealers and other businesses involved in the transfer of money. The Patriot Act, substantially broadened the scope of United States anti-money laundering laws and regulations by imposing significant new compliance and due diligence obligations, creating new crimes and penalties and expanding the extra territorial jurisdiction of the United States. Financial institutions are also prohibited from entering into specified financial transactions and account relationships and must use enhanced due diligence procedures in their dealings with certain types of high risk customers and implement a written customer identification program. Financial institutions must take certain steps to assist government agencies in detecting and preventing money laundering and report certain types of suspicious transactions. Regulatory authorities routinely examine financial institutions for compliance with these obligations, and failure of a financial institution to maintain and implement adequate programs to combat money laundering and terrorist financing, or to comply with all of the relevant laws or regulations, could have serious legal and reputational consequences for the institution, including causing applicable bank regulatory authorities not to approve merger or acquisition transactions when regulatory approval is required or to prohibit such transactions even if approval is not required. Regulatory authorities have imposed cease and desist orders and civil money penalties against institutions found to be violating these obligations.
Treasury’s Office of Foreign Assets Control (“OFAC”), administers and enforces economic and trade sanctions against targeted foreign countries and regimes under authority of various laws, including designated foreign countries, nationals and others. OFAC publishes lists of specially designated targets and countries. Financial Institutions are responsible for, among other things, blocking accounts of and transactions with such targets and countries, prohibiting unlicensed trade and financial transactions with them and reporting blocked transactions after their occurrence.
Failure of a financial institution to maintain and implement adequate anti-money laundering and OFAC programs, or to comply with all of the relevant laws or regulations, could have serious legal and reputational consequences for the institution.
106
Table of Contents
Concentrations in Commercial Real Estate. Concentration risk exists when financial institutions deploy too many assets to any one industry or segment. Concentration stemming from commercial real estate is one area of regulatory concern. The CRE Concentration Guidance provides supervisory criteria, including the following numerical indicators, to assist bank examiners in identifying banks with potentially significant commercial real estate loan concentrations that may warrant greater supervisory scrutiny: (i) commercial real estate loans exceeding 300% of capital and increasing 50% or more in the preceding three years; or (ii) construction and land development loans exceeding 100% of capital. The CRE Concentration Guidance does not limit banks’ levels of commercial real estate lending activities, but rather guides institutions in developing risk management practices and levels of capital that are commensurate with the level and nature of their commercial real estate concentrations. Based on the Bank’s loan portfolio, the Bank does not exceed these guidelines as of December 31, 2017.
Consumer Financial Services
We are subject to a number of federal and state consumer protection laws that extensively govern our relationship with our customers. These laws include the Equal Credit Opportunity Act, the Fair Credit Reporting Act, the Truth in Lending Act, the Truth in Savings Act, the Electronic Fund Transfer Act, the Expedited Funds Availability Act, the Home Mortgage Disclosure Act, the Fair Housing Act, the Real Estate Settlement Procedures Act, the Fair Debt Collection Practices Act, the Service Members Civil Relief Act, the Military Lending Act, and these laws’ respective state law counterparts, as well as state usury laws and laws regarding unfair and deceptive acts and practices. These and other federal laws, among other things, require disclosures of the cost of credit and terms of deposit accounts, provide substantive consumer rights, prohibit discrimination in credit transactions, regulate the use of credit report information, provide financial privacy protections, prohibit unfair, deceptive and abusive practices, restrict our ability to raise interest rates and subject us to substantial regulatory oversight. Violations of applicable consumer protection laws can result in significant potential liability from litigation brought by customers, including actual damages, restitution and attorneys’ fees. Federal bank regulators, state attorneys general and state and local consumer protection agencies may also seek to enforce consumer protection requirements and obtain these and other remedies, including regulatory sanctions, customer rescission rights, action by the state and local attorneys general in each jurisdiction in which we operate and civil money penalties. Failure to comply with consumer protection requirements may also result in our failure to obtain any required bank regulatory approval for merger or acquisition transactions we may wish to pursue or our prohibition from engaging in such transactions even if approval is not required.
Many states and local jurisdictions have consumer protection laws analogous, and in addition, to those listed above. These federal, state and local laws regulate the manner in which financial institutions deal with customers when taking deposits, making loans or conducting other types of transactions. Failure to comply with these laws and regulations could give rise to regulatory sanctions, customer rescission rights, action by state and local attorneys general and civil or criminal liability.
The structure of federal consumer protection regulation applicable to all providers of consumer financial products and services changed significantly on July 21, 2011, when the CFPB commenced operations to supervise and enforce consumer protection laws.
The consumer protection provisions of the Dodd-Frank Act and the examination, supervision and enforcement of those laws and implementing regulations by the CFPB have created a more intense and complex environment for consumer finance regulation. The CFPB has significant authority to implement and enforce federal consumer protection laws and new requirements for financial services products provided for in the Dodd-Frank Act, as well as the authority to identify and prohibit unfair, deceptive or abusive acts and practices. The review of products and practices to prevent such acts and practices is a continuing focus of the CFPB, and of banking regulators more broadly. The ultimate impact of this heightened scrutiny is uncertain but could result in changes to pricing, practices, products and procedures. It could also result in increased costs related to regulatory oversight, supervision and examination, additional remediation efforts and possible penalties. In addition, the Dodd-Frank Act provides the CFPB with broad supervisory, examination and enforcement authority over various consumer
107
Table of Contents
financial products and services, including the ability to require reimbursements and other payments to customers for alleged legal violations and to impose significant penalties, as well as injunctive relief that prohibits lenders from engaging in allegedly unlawful practices. The CFPB also has the authority to obtain cease and desist orders providing for affirmative relief or monetary penalties. The Dodd-Frank Act does not prevent states from adopting stricter consumer protection standards. State regulation of financial products and potential enforcement actions could also adversely affect our business, financial condition or results of operations.
The CFPB has examination and enforcement authority over providers with more than $10 billion in assets. Banks and savings institutions with $10 billion or less in assets, like the Bank, will continue to be examined by their applicable bank regulators.
Mortgage and Mortgage-Related Products, Generally. Because abuses in connection with home mortgages were a significant factor contributing to the financial crisis, many new rules issued by the CFPB and required by the Dodd-Frank Act address mortgage and mortgage-related products, their underwriting, origination, servicing and sales. The Dodd-Frank Act significantly expanded underwriting requirements applicable to loans secured by1-4 family residential real property and augmented federal law combating predatory lending practices. In addition to numerous disclosure requirements, the Dodd-Frank Act imposed new standards for mortgage loan originations on all lenders, including banks and savings associations, in an effort to strongly encourage lenders to verify a borrower’s ability to repay, while also establishing a presumption of compliance for certain “qualified mortgages.” The Dodd-Frank Act generally required lenders or securitizers to retain an economic interest in the credit risk relating to loans that the lender sells, and other asset-backed securities that the securitizer issues, if the loans do not comply with theability-to-repay standards described below. The risk retention requirement generally is 5%, but could be increased or decreased by regulation. The Bank does not currently expect the CFPB’s rules to have a significant impact on its operations, except for higher compliance costs.
Ability-to-Repay Requirement and Qualified Mortgage Rule. On January 10, 2013, the CFPB issued a final rule implementing the Dodd-Frank Act’sability-to-repay requirements. Under the final rule, lenders, in assessing a borrower’s ability to repay a mortgage-related obligation, must consider eight underwriting factors: (i) current or reasonably expected income or assets; (ii) current employment status; (iii) monthly payment on the subject transaction; (iv) monthly payment on any simultaneous loan; (v) monthly payment for all mortgage-related obligations; (vi) current debt obligations, alimony, and child support; (vii) monthlydebt-to-income ratio or residual income; and (viii) credit history. The final rule also includes guidance regarding the application of, and methodology for evaluating, these factors.
Further, the final rule clarified that qualified mortgages do not include“no-doc” loans and loans with negative amortization, interest-only payments, balloon payments, terms in excess of 30 years, or points and fees paid by the borrower that exceed 3% of the loan amount, subject to certain exceptions. In addition, for qualified mortgages, the rule mandated that the monthly payment be calculated on the highest payment that will occur in the first five years of the loan, and required that the borrower’s totaldebt-to-income ratio generally may not be more than 43%. The final rule also provided that certain mortgages that satisfy the general product feature requirements for qualified mortgages and that also satisfy the underwriting requirements of Fannie Mae and Freddie Mac (while they operate under federal conservatorship or receivership), the U.S. Department of Housing and Urban Development, the Department of Veterans Affairs, the Department of Agriculture or the Rural Housing Service are also considered to be qualified mortgages. This second category of qualified mortgages will phase out as the aforementioned federal agencies issue their own rules regarding qualified mortgages, the conservatorship of Fannie Mae and Freddie Mac ends, and, in any event, after seven years.
As set forth in the Dodd-Frank Act, subprime (or higher-priced) mortgage loans are subject to theability-to-repay requirement, and the final rule provided for a rebuttable presumption of lender compliance for those loans. The final rule also applied theability-to-repay requirement to prime loans, while also providing a conclusive presumption of compliance (i.e., a safe harbor) for prime loans that are also qualified mortgages. Additionally, the final rule generally prohibits prepayment penalties (subject to certain exceptions) and sets forth a3-year record retention period with respect to documenting and demonstrating theability-to-repay requirement and other provisions.
108
Table of Contents
Mortgage Loan Originator Compensation. As a part of the overhaul of mortgage origination practices, mortgage loan originators’ compensation has been limited such that they may no longer receive compensation based on a mortgage transaction’s terms or conditions other than the amount of credit extended under the mortgage loan. Further, the total points and fees that a bank and/or a broker may charge on conforming and jumbo loans has been limited to 3.0% of the total loan amount. Mortgage loan originators may receive compensation from a consumer or from a lender, but not both. These rules contain requirements designed to prohibit mortgage loan originators from “steering” consumers to loans that provide mortgage loan originators with greater compensation. In addition, the rules contain other requirements concerning recordkeeping.
Home Mortgage Servicing. Pursuant to the Dodd-Frank Act, the CFPB has implemented certain provisions of the Dodd-Frank Act relating to mortgage servicing through rulemaking. The servicing rules require servicers to meet certain benchmarks for loan servicing and customer service in general. Servicers must provide periodic billing statements and certain required notices and acknowledgments, promptly credit borrowers’ accounts for payments received and promptly investigate complaints by borrowers. Servicers also are required to take additional steps before purchasing insurance to protect the lender’s interest in the property. The servicing rules call for additional notice, review and timing requirements with respect to delinquent borrowers, including early intervention, ongoing access to servicer personnel and specific loss mitigation and foreclosure procedures. The rules provide for an exemption from most of these requirements for “small servicers”, which are defined as loan servicers that service 5,000 or fewer mortgage loans and service only mortgage loans that they or an affiliate originated or own.
Incentive Compensation Guidance
The federal bank regulatory agencies have issued comprehensive guidance intended to ensure that the incentive compensation policies of banking organizations do not undermine the safety and soundness of those organizations by encouraging excessive risk-taking. The incentive compensation guidance sets expectations for banking organizations concerning their incentive compensation arrangements and related risk-management, control and governance processes. The incentive compensation guidance, which covers all employees that have the ability to materially affect the risk profile of an organization, either individually or as part of a group, is based upon three primary principles: (i) balanced risk-taking incentives; (ii) compatibility with effective controls and risk management; and (iii) strong corporate governance. Any deficiencies in compensation practices that are identified may be incorporated into the organization’s supervisory ratings, which can affect its ability to make acquisitions or take other actions. In addition, under the incentive compensation guidance, a banking organization’s federal supervisor may initiate enforcement action if the organization’s incentive compensation arrangements pose a risk to the safety and soundness of the organization. Further, the Basel III Capital Rules limit discretionary bonus payments to bank executives if the institution’s regulatory capital ratios fail to exceed certain thresholds starting January 1, 2016. The scope and content of the U.S. banking regulators’ policies on executive compensation are continuing to develop and are likely to continue evolving in the near future.
Financial Privacy
The federal bank regulatory agencies have adopted rules that limit the ability of banks and other financial institutions to disclosenon-public information about consumers tonon-affiliated third parties. These limitations require disclosure of privacy policies to consumers and, in some circumstances, allow consumers to prevent disclosure of certain personal information to anon-affiliated third party. These regulations affect how consumer information is transmitted through financial services companies and conveyed to outside vendors. In addition, consumers may also prevent disclosure of certain information among affiliated companies that is assembled or used to determine eligibility for a product or service, such as that shown on consumer credit reports and asset and income information from applications. Consumers also have the option to direct banks and other financial institutions not to share information about transactions and experiences with affiliated companies for the purpose of marketing products or services.
109
Table of Contents
Impact of Monetary Policy
The monetary policy of the Federal Reserve has a significant effect on the operating results of financial or bank holding companies and their subsidiaries. Among the tools available to the Federal Reserve to affect the money supply are open market transactions in U.S. government securities, changes in the discount rate on member bank borrowings and changes in reserve requirements against member bank deposits. These means are used in varying combinations to influence overall growth and distribution of bank loans, investments and deposits, and their use may affect interest rates charged on loans or paid on deposits.
Other Pending and Proposed Legislation
Other legislative and regulatory initiatives which could affect the Company, the Bank and the banking industry in general may be proposed or introduced before the United States Congress, the California legislature and other governmental bodies in the future. Such proposals, if enacted, may further alter the structure, regulation and competitive relationship among financial institutions, and may subject the Company or the Bank to increased regulation, disclosure and reporting requirements. In addition, the various banking regulatory agencies often adopt new rules and regulations to implement and enforce existing legislation. It cannot be predicted whether, or in what form, any such legislation or regulations may be enacted or the extent to which the business of the Company or the Bank would be affected thereby.
On February 3, 2017, President Trump signed an executive order calling for his administration to review existing U.S. financial laws and regulations, including the Dodd-Frank Act, in order to determine their consistency with a set of “core principles” of financial policy. The core financial principles identified in the executive order include the following: empowering Americans to make independent financial decisions and informed choices in the marketplace, save for retirement, and build individual wealth; preventing taxpayer-funded bailouts; fostering economic growth and vibrant financial markets through more rigorous regulatory impact analysis that addresses systemic risk and market failures, such as moral hazard and information asymmetry; enabling American companies to be competitive with foreign firms in domestic and foreign markets; advancing American interests in international financial regulatory negotiations and meetings; and restoring public accountability within Federal financial regulatory agencies and “rationalizing” the Federal financial regulatory framework.
Many aspects of the Dodd-Frank Act are subject to continued rulemaking and will take effect over several years, making it difficult to anticipate the overall financial impact on us. Although the reforms primarily target systemically important financial service providers, the Dodd-Frank Act’s influence has and is expected to continue to filter down in varying degrees to smaller institutions over time. We will continue to evaluate the effect of the Dodd-Frank Act. However, in many respects, the ultimate impact of the Dodd-Frank Act will not be fully known for years, and no current assurance may be given that the Dodd-Frank Act, or any other new legislative changes, will not have a negative impact on the results of operations and financial condition of the Company and the Bank.
110
Table of Contents
Board of Directors
The following table sets forth certain information about our directors, including their names, ages and year in which they began serving as a director of the Company (or the Bank prior to the Company’s formation in 2016).
Name | Age | Position | Director Since | |||||||
Brian Choi | 68 | Chairman of the Board | 2008 | |||||||
Ernest E. Dow | 68 | Director | 2005 | |||||||
Jason Hwang | 67 | Director | 2005 | |||||||
Soo Hun Jung, M.D. | 68 | Director | 2005 | |||||||
Min J. Kim | 58 | Director, President and Chief Executive Officer of the Company and the Bank | 2010 | |||||||
Ock Hee Kim | 76 | Director | 2005 | |||||||
Myung Ja (Susan) Park | 69 | Director | 2005 | |||||||
Yong Sin Shin | 58 | Director | 2005 | |||||||
The board of directors oversees our business and monitors the performance of management. In accordance with corporate governance principles, the independent members of the board do not involve themselves inday-to-day operations. The directors keep themselves informed through, among other things, discussions with the Chief Executive Officer, other key executives and our principal outside advisors (legal counsel, outside auditors, and other consultants), by reading reports and other materials that we send them and by participating in board and committee meetings.
Pursuant to OP Bancorp’s articles and bylaws, our board of directors is authorized to have not less than seven members nor more than 13 members, and is currently comprised of eight members. Each of our directors serves for a one year term. The exact number of directors may be fixed from time to time within the range set forth in our bylaws by a bylaw or amendment thereof duly adopted by the vote of a majority of the shares entitled to vote represented at a duly held meeting at which a quorum is present, or by the written consent of the holders of a majority of the outstanding shares entitled to vote, or by resolution of our board. As discussed in greater detail below, our board of directors has affirmatively determined that seven of our eight current directors qualify as independent directors based upon the rules of the Nasdaq Stock Market and the SEC. There are no arrangements or understandings between any of the directors and any other person pursuant to which he or she was selected as a director.
The business experience of each of the current directors is set forth below. No current director has any family relationship, as defined in Item 401 of RegulationS-K, with any other director or with any of our executive officers.
All of the directors of Open Bank became members of the OP Bancorp board of directors when we reorganized into our present bank holding company structure in 2016.
Brian Choi. Mr. Choi, a director of the Bank since 2008, has served as the Chairman of the Board of the Bank since 2010, and OP Bancorp since 2016. Mr. Choi has served as Chairman and Chief Executive Officer of Universal Financing Corporation since 1991, and as Chairman and Chief Executive Officer of Ehese Investments, LLC since 2001. Mr. Choi has previous experience as a bank director with Alaska First Bank & Trust (formerly First Interstate Bank of Alaska) where he served on the board from 1999 through 2008. He was the president of the Korean Community of Anchorage, Alaska from 2003 to 2004. He was the President of the Korean Christian Businessmen’s Committee of North America from 2006 to 2008. He also served as the President of the Federation of Korean American Association of Northwest States of United States of America, which included Oregon, Washington, Idaho, Montana, and Alaska from 2010 to 2012. Mr. Choi is a graduate of
111
Table of Contents
Korea University where he received a Bachelor of Science in Political Science and Foreign Relations. Mr. Choi contributes to the board over 16 years of leadership and substantial experience in the community banking industry. He brings a wide-ranging understanding of the bank management, finance and operations. His leadership ability, judgment and prior business executive experience led the Board to elect him as Chairman of the Board.
Ernest E. Dow. Mr. Dow has served as a member of the board since the founding of the Bank in 2005. He is a Certified Public Accountant and a Principal of Ernest E. Dow & Co., accountancy corporation. He has maintained his accounting practice for the past 35 years providing accounting, auditing, tax and business consulting services for international and local companies operating in Southern California. Mr. Dow served as a director for Pacific Union Bank from May 2003 until the bank’s acquisition by Hanmi Bank in April 2004. Mr. Dow is a member of the California Society of Certified Public Accountants. Mr. Dow obtained his Bachelor of Science from California State University, Northridge, in 1976. Mr. Dow’s significant accounting experience provides among other thingsin-depth knowledge of generally accepted accounting principles and auditing standards to the board. Mr. Dow was a member of Choi Dow Ivan Hong & Lee Accountancy Corporation (“CDIH&L”) from August 1992 to December 2007. In July 2008, the SEC entered an order finding that (i) CDIH&L and Dow did not possess the requisite qualifications to represent others and (ii) CDIH&L willfully violated Section 102(a) of the Sarbanes-Oxley Act of 2002. The order related to the failure of CDIH&L to register with the Public Company Accounting Oversight Board (“PCAOB”) in connection with the preparation and issuance of an audit report with respect to a public company client in December 2004, and Mr. Dow’s participation in the preparation and issuance of such audit report. Under the order, CDIH&L was denied the privilege of practicing before the SEC and Mr. Dow was personally censured. However, Mr. Dow was permitted to continue to practice before the SEC as an independent accountant, provided that (i) the public accounting firm with which he is associated is registered with the PCAOB in accordance with the Exchange Act, and such registration continues to be effective, and (ii) he has submitted to the SEC staff the PCAOB’s letter notifying the public accounting firm with which he is associated that its registration application has been approved. Mr. Dow failed to report the SEC order to the California State Board of Accountancy (“CBA”) and as a result he was reprimanded and place on three-years’ probation under a settlement agreement reached with the CBA. The probationary period was completed on June 30, 2013.
Jason Hwang. Mr. Hwang, a director of the Bank since 2005, is a certified public accountant and the owner of the accounting firm, Jason Hwang CPA, which he founded in 1983. In addition, he is a registered representative providing financial planning for his clients. He holds General Securities Registered Representative (Series 7), license. He actively supports local civic and community organizations. From 1975 to 2012, he served as Director of Korean-American Scholarship Fund and from 1996 to 1999, he served as Director of Korean-American National Museum in Los Angeles, California. He obtained his B.S. in Accounting from California State University, Los Angeles. Mr. Hwang’s significant accounting experience provides among other thingsin-depth knowledge of generally accepted accounting principles and auditing standards to the board as well as extensive understanding of corporate and personal financial planning and he is particularly suited to serve as Chair of the audit committee. He also contributes valuable insights from the local business community as a result of his involvement in local community organizations.
Soo Hun Jung, M.D. Dr. Jung has served as a board member since the founding of the Bank in 2005. He is a medical doctor who has been in private medical practice since 1982. Dr. Jung obtained his medical degree from Pusan National University College of Medicine, Pusan, South Korea, in 1975. He subsequently completed his general surgery internship at Mount Sinai Hospital, New York, in 1979 and his internal medicine residency at Hospital of the Good Samaritan (affiliated with U.S.C. Medical School) Los Angeles, in 1982. Dr. Jung is affiliated with various hospitals and medical associations. He is a Member of the Board of Good Samaritan Medical Practice Association; Good Samaritan Hospital, and Korean-American Medical Group. In addition, he is a member of American Medical Association, American College of Physicians, and Korean Medical Association. He serves as Clinical Assistant Professor of Medicine for U.S.C. School of Medicine. As a long-term member of
112
Table of Contents
the board, Mr. Jung has a broad based understanding of the Company and the Bank and is deeply committed to the community through his medical practice and affiliations with medical organizations and associations.
Min J. Kim. Ms. Kim has served as the President and Chief Executive Officer and a member of the board of the Company and the Bank since April 2010. She has over 35 years of banking experience in the Korean banking community. Prior to joining the Bank, she served as Chief Executive Officer and President of Nara Bancorp and Nara Bank (now Bank of Hope and Hope Bancorp Inc) for three and half years assuming those positions in 2006. From 1996 to March 2006, Ms. Kim served in various executive positions with Nara Bancorp and Nara Bank, including Executive Vice President and Chief Operating Officer, Executive Vice President and Chief Credit Officer, and Senior Vice President and Chief Credit Administrator. Prior to joining Nara Bancorp and Nara Bank in 1995, Ms. Kim served in numerous positions with Hanmi Bank, including Vice President and Manager of the Western Street Branch of Hanmi Bank in Los Angeles from 1985 to 1995. Ms. Kim has a Bachelor of Sciences degree in Finance from the University of Southern California. Ms. Kim contributes to the board her breadth of knowledge of the Company’s bank business, markets, community and culture. She provides the board with an overall perspective of all facets of the Company’s business, financial condition and strategic direction.
Ock Hee Kim. Mrs. Kim has served as a member of the board since the founding of the Bank in 2005. She was the owner of Lily’s Dress Co., an apparel manufacturing company she founded in 1974 for 30 years. Mrs. Kim is actively involved in the L.A. Central Lions Club. Mrs. Kim serves as a deaconess in Torrance Presbyterian Church. Mrs. Kim obtained her Bachelor of Arts degree in Music from Kyung Hee University in Seoul, Korea. Ms. Kim is brings a valuable perspective to the board as result of her over 30 years of experience in the apparel and garment business which is an important industry in our downtown Los Angeles and Koreatown marketing areas, as well as and her involvement in local community activities.
Myung Ja (Susan) Park. Ms. Park has served as a board member since the founding of the Bank in 2005. She is the owner and President of Royal Accessories, a retailer of artificial flowers and bridal accessories, a company she founded in 1986. From 1977 to 2003, Ms. Park was the sole shareholder and Chief Executive Officer of Showroom 3, Inc., a manufacturer of wedding accessories. Over that same time period, Ms. Park was part owner of B. B. World, an importer/exporter and nationwide distributor of artificial flowers and wedding accessories. Ms. Park is the vice president of the Korean Business and Professional Women’s Association. She also serves as the chairman of the Fundraising Board of Children of Afghanistan Relief Initiative. Ms. Park contributes to the board her over 30 years of experience and knowledge of the import/export business, and has an insightful understanding of the Korean-American community through her involvement with the Korean Business and Professional Women’s Association.
Yong Sin Shin. Ms. Shin has served as a board member since the founding of the Bank in 2005. She is part owner and Secretary of CJS Groups Inc (DBA Bicici & Coty Fashion), an apparel manufacturer and wholesaler in Los Angeles, California which she founded in 1994. Ms. Shin was a fashion designer andco-manager of Coty Fashion in Sao Paulo, Brazil, from 1985 to 1994. Ms. Shin obtained her Bachelor of Science in Dietary Nutrition from University of Sao Paulo, Sao Paulo, Brazil, in 1982. Ms. Shinco-founded her own manufacturing and wholesale business in Los Angeles, California and contributes to the board her substantial business acumen developed though years of proven entrepreneurial success. Also as an active member of the Korean Chamber of Commerce in Los Angeles she brings to the board various business and cultural insights from the local community.
113
Table of Contents
Executive Officers
The following table sets forth certain information regarding our executive officers, including their names, ages and positions:
Name | Age | Position | ||||
Min J. Kim | 58 | President and Chief Executive Officer of the Company and the Bank | ||||
Christine Y. Oh | 51 | Executive Vice President and Chief Financial Officer of the Company and the Bank | ||||
Steve K. Park | 53 | Executive Vice President and Chief Credit Officer of the Bank | ||||
Ki Won Yoon | 59 | Executive Vice President and Chief Lending Officer of the Bank | ||||
Kathrine Duncan | 61 | Executive Vice President and Chief Risk Officer of the Bank | ||||
The business experience of each of our executive officers, other than Ms. Kim, is set forth below. No executive officer has any family relationship, as defined in Item 401 of RegulationS-K, with any other executive officer or any of our current directors. There are no arrangements or understandings between any of the officers and any other person pursuant to which he or she was selected as an officer.
Christine Y. Oh. Ms. Oh was appointed Executive Vice President and Chief Financial Officer of the Bank in July 2010 and of the Company in March 2016. Ms. Oh has over 25 years of banking experience. Prior to joining the Bank, from January 2010 to July 2010 she served as Interim Chief Financial Officer and Controller of Nara Bancorp and Nara Bank (now Bank of Hope and Hope Bancorp Inc), headquartered in Los Angeles, California. Prior to assuming those positions, Ms. Oh served as Senior Vice President and Controller of Nara Bancorp and Nara Bank to positions she assumed in 2003. Ms. Oh served as Interim Chief Financial Officer of Nara Bancorp and Nara Bank from March 2005 to July 2005. She joined Nara Bank in 1993. Prior to joining Nara Bank, Ms. Oh was a credit analyst at Center Bank. She is currently serving as a director at Korean-American Family Services, anon-profit organization. Ms. Oh has a Bachelor of Science in Accounting from California State University, Northridge.
Steve K. Park. Mr. Park has served as Executive Vice President and Chief Credit Officer of the Bank since June 2010. Mr. Park has over 28 years of banking experience. Prior to joining the Bank, he served as Executive Vice President and Chief Credit Officer for the five years at Commonwealth Business Bank, Los Angeles, California. From 2000 to 2004, Mr. Park was Senior Vice President and SBA Loan Manager at Hanmi Bank, Los Angeles. Prior to joining Hanmi, Mr. Park was Vice President, Commercial Loan Manager for one year and SBA Loan Manager for four years at Saehan Bank, Los Angeles. Mr. Park has a Bachelor of Arts in Economics from the University of California, Berkeley.
Ki Won Yoon. Ms. Yoon has served as Executive Vice President and Chief Lending Officer since October 2013. Ms. Yoon has over 30 years of relevant lending experience, with strong ties in the Korean-American business community. Prior to joining Open Bank, Ms. Yoon was District Manager at BBCN Bank (now Bank of Hope and Hope Bancorp Inc), which she joined in 1999, and where she managed a loan portfolio of over $450 million. Ms. Yoon has a Bachelor of Arts in Food & Nutrition from Sook Myung Women’s University.
Kathrine Duncan. Kathrine Duncan joined the Bank in April 2010 as Executive Vice President and Chief Risk Officer. Ms. Duncan has over 35 years of banking experience. Prior to joining the Bank, Ms. Duncan had a consulting business performing audits, compliance/CRA reviews and writing policies. From 2005 to 2009, she was Senior Vice President, Chief Corporate Services Officer at Nara Bank (now Bank of Hope and Hope Bancorp Inc.) Los Angeles, California. Prior to joining Nara Bank, she was Senior Vice President and Director of General and Administrative Services at Pacific Premier Bank from 2000 to 2005. Prior to joining Pacific Premier Bank, Ms. Duncan was Senior Vice President, Risk Management Group at Hawthorne Savings (acquired) from 1994 to 2000. Prior to 1994, she was Vice President, Audit, Compliance, CRA at East-West Bank. Ms. Duncan has a Masters of Arts in Leadership and Organizational Studies from Azusa Pacific University and a Bachelor of Science in Business Administration from California State University, Los Angeles.
114
Table of Contents
Corporate Governance Principles and Board Matters
Corporate Governance Guidelines. We are committed to having sound corporate governance principles, which are essential to running our business efficiently and maintaining our integrity in the marketplace. Our board of directors has adopted Corporate Governance Guidelines, which will become effective upon completion of this offering, that set forth the framework within which our board of directors, assisted by the committees of our board of directors, directs the affairs of our organization. The Corporate Governance Guidelines address, among other things, the composition and functions of our board of directors, director independence, compensation of directors, management succession and review, committees of our board of directors and selection of new directors. Upon completion of this offering, our Corporate Governance Guidelines will be available on our website at www.myopenbank.com under the “Investor Relations” tab.
Director Qualifications. We believe that our directors should have the highest professional and personal ethics and values. They should have broad experience at the policy-making level in areas relevant to our business. They should be committed to enhancing shareholder value and should have sufficient time to carry out their duties and to provide insight and practical wisdom based on experience. Each director must represent the interests of all shareholders. When considering potential director candidates, our board of directors also considers the candidate’s character, judgment, diversity, skill-sets, specific business background and global or international experience in the context of our needs and those of the board of directors.
Director Independence. We have applied to list our common stock on the Nasdaq Global Market and, upon successful listing, we will be required to comply with the rules of the Nasdaq Stock Market with respect to the independence of directors who serve on our board of directors and its committees. Under the rules of the Nasdaq Stock Market, independent directors must comprise a majority of our board of directors within a specified period of time following this offering. The rules of the Nasdaq Stock Market, as well as those of the SEC, also impose several other requirements with respect to the independence of our directors.
Our board of directors has evaluated the independence of its members based upon the rules of the Nasdaq Stock Market and the SEC. Applying these standards, our board of directors has affirmatively determined that, with the exception of Ms. Min J. Kim, each of our current directors is an independent director, as defined under the applicable rules. The board determined that Ms. Kim does not qualify as an independent director because she is an executive officer of the Company.
Board Leadership Structure. The board of directors is committed to maintaining an independent board, and for many years a majority of the board has been comprised of independent directors. Further, it is the practice of the Company to separate the roles of Chairman of the Board and Chief Executive Officer in recognition of the differences between the two roles. The Chief Executive Officer is responsible for setting our strategic direction and theday-to-day leadership and performance. The Chairman of the Board provides guidance to the Chief Executive Officer, sets the agenda for board meetings, presides over meetings of the full board (including executive sessions), and facilitates communication among the independent directors and between the independent directors and the Chief Executive Officer. The board further believes that the separation of the duties of the Chief Executive Officer and the Chairman of the board eliminates any inherent conflict of interest that may arise when the roles are combined, and that an independent director who has not served as an executive of the Company or the Bank can best provide the necessary leadership and objectivity required as Chairman of the Board.
The boards of directors of the Company and the Bank are comprised of the same individuals. Historically, the Company’s board of directors and the Bank’s board of directors have eleven regular meetings per year. Following the completion of this offering, both boards will continue to meet at least eleven times per year. To further strengthen the oversight of the board of directors, following completion of the offering, our directors expect to hold executive sessions. The executive sessions will be scheduled in connection with regularly scheduled board meetings at least twice a year. The executive sessions will be presided over by the Chairman of the Board.
115
Table of Contents
Code of Business Conduct and Business Ethics Policy. Our board of directors has adopted a Code of Business Conduct and Business Ethics Policy that applies to all of our directors and employees. The code provides fundamental ethical principles to which these individuals are expected to adhere to and will operate as a tool to help our directors, officers and employees understand the high ethical standards required for employment by, or association with, our Company. Our Code of Business Conduct and Business Ethics Policy, upon the completion of this offering, will be available on our website at www.myopenbank.com under the “Investor Relations” tab. We expect that any amendments to the code, or any waivers of its requirements, will be disclosed on our website, as well as any other means required by Nasdaq Stock Market rules.
Compensation Committee Interlocks and Insider Participation. Upon completion of this offering, none of the members of our Human Resources & Compensation Committee will be or will have been one of our officers or employees. In addition, none of our executive officers serves or has served as a member of the compensation committee or other board committee performing equivalent functions of any entity that has one or more executive officers serving as one of our directors or on our Human Resources & Compensation Committee.
Risk Management and Oversight. The board of directors has ultimate authority and responsibility for overseeing our risk management. The board of directors monitors, reviews and reacts to material enterprise risks identified by management. The board receives specific reports from executive management on financial, credit, liquidity, interest rate, capital, operational, legal compliance and reputation risks and the degree of exposure to those risks. The board helps ensure that management is properly focused on risk by, among other things, reviewing and discussing the performance of senior management and business line leaders. Board committees have responsibility for risk oversight in specific areas. The Audit Committee oversees financial, accounting and internal control risk management policies. The Human Resources & Compensation Committee assesses and monitors risks in our compensation program. The Nomination & Governance Committee oversees the nomination and evaluation of the board and is responsible for overseeing our corporate governance principles. The Bank’s Risk and Compliance Committee oversees the risk and compliance programs, adherence to management policies and procedures, compliance with regulatory requirements and information technology strategies and activities. The Bank’s Loan & Credit Policy Committee is primarily responsible for credit and other risks arising in connection with our lending activities, which includes overseeing management committees that also address these risks. The Bank’s Asset/Liability Management Committee monitors our interest rate risk, with the goal of structuring our asset-liability composition to maximize net interest income while minimizing the adverse impact of changes in interest rates on net interest income and capital.
Committees of the Board
Our board of directors has established standing committees in connection with the discharge of its responsibilities. These committees include the Audit Committee, the Human Resource & Compensation Committee, and the Nomination & Governance Committee. Our board of directors also may establish such other committees as it deems appropriate, in accordance with applicable law and regulations and our articles and bylaws.
Audit Committee. The Company has a separately designated standing Audit Committee as required by the rules of the Nasdaq Stock Market. The Audit Committee charter adopted by the board sets out the responsibilities, authority and specific duties of the Audit Committee. The Audit Committee charter will be available on the Company’s website at www.myopenbank.com under the “Investor Relations” tab upon completion of this offering.
The responsibilities of the Audit Committee include the following:
| • | oversee the quality and integrity of regulatory and financial accounting, financial statements, financial reporting processes and systems of internal accounting and financial controls; |
116
Table of Contents
| • | oversee the annual independent audit of the Company’s financial statements and internal control over financial reporting, the engagement of the independent registered public accounting firm and the evaluation of the independent registered public accounting firm’s qualifications, independence and performance; |
| • | oversee and retain internal audit and/or outsourced internal audit and review; |
| • | oversee the performance of our internal/external audit function and independent registered public accounting firm; |
| • | approve related-person transactions subject to Item 404 of RegulationS-K; and |
| • | upon completion of the offering, review and discuss the annual audited financial statements with management and the independent auditors prior to publishing the annual report and filing the Annual Report on Form10-K with the SEC. |
Each member of the Audit Committee meets the independence criteria as defined by applicable rules and regulations of the SEC for audit committee membership and is independent and is “financially sophisticated” as defined by the applicable rules and regulations of the Nasdaq Stock Market. The members of the Audit Committee are Brian Choi, Jason Hwang (committee chair), Soo Hun Jung, M.D., Ock Hee Kim, Myung Ja (Susan) Park, and Yong Sin Shin.
The board of directors has determined that Jason Hwang has: (i) an understanding of generally accepted accounting principles and financial statements; (ii) an ability to assess the general application of such principles in connection with the accounting for estimates, accruals and reserves; (iii) an experience preparing, auditing, analyzing or evaluating financial statements that present a breadth and level of complexity of accounting issues that are generally comparable to the breadth and complexity of issues that can reasonably be expected to be raised by our financial statements, or experience actively supervising one or more persons engaged in such activities; (iv) an understanding of internal control over financial reporting; and (v) an understanding of audit committee functions.
Therefore, the board determined that Mr. Hwang meets the definition of “audit committee financial expert” under the applicable rules and regulations of the SEC and is “financially sophisticated” as defined by the applicable rules and regulations of the Nasdaq Stock Market. The designation of a person as an audit committee financial expert does not result in the person being deemed an expert for any purpose, including under Section 11 of the Securities Act of 1933, as amended (the “Securities Act”). The designation does not impose on the person any duties, obligations or liability greater than those imposed on any other audit committee member or any other director and does not affect the duties, obligations or liability of any other member of the Audit Committee or board of directors.
Human Resources & Compensation Committee. The Company has a separately designated Human Resources & Compensation Committee, which consists entirely of independent directors as defined by the applicable rules and regulations of the Nasdaq Stock Market. The Human Resources & Compensation Committee has adopted a charter, which will be available on our website at www.myopenbank.com under the “Investor Relations” tab upon completion of this offering. The Human Resources & Compensation Committee has the following responsibilities:
| • | annually review the Company’s competitive position for each component of the overall human resource and compensation plan (especially base salary, annual incentives, long term incentives, and supplemental executive benefit programs); |
| • | review trends in compensation in all industries; |
| • | annually review with the Chief Executive Officer, the Company’s compensation strategy to assure that the Chief Executive Officer and the management team (senior vice president and above) and their compensation is in relation to their contributions to the Company’s growth, profitability, and meeting strategic goals; |
117
Table of Contents
| • | annually review and recommend for approval to the board the overall performance and total compensation for the Chief Executive Officer, including agreed upon goals and objectives relevant to the Chief Executive Officer’s compensation, evaluate the performance of the Chief Executive Officer in light of those goals and objectives, and set the Chief Executive Officer’s compensation level based upon this evaluation, taking into consideration the Company’s performance and relative shareholder return, and the value of similar incentive awards to Chief Executive Officers at comparable companies; |
| • | annually review and recommend to the board the annual director’s compensation and any additional compensation for services on committees of the board, service as a committee or board chairman, meeting fees or any other benefit payable by virtue of the director’s position as a member of the board; |
| • | evaluate and approve recommendations from the Chief Executive Officer regarding compensation and other employment related matters such as hiring, promotions, terminations or severance payments for all executive vice presidents, and post review of recommendations from the CEO regarding compensation and other employment related matters such as hiring, compensation, promotions, terminations or severance payments for all senior vice presidents; |
| • | periodically review and recommend to the board all matters pertaining to broad based benefit plans of the Company, equity plans, senior management or director bonus plans and pension plans and performance based plans; |
| • | review, establish and modify, as it sees fit, all employment policies and procedures related to officers and directors; |
| • | administer the annual executive incentive compensation plan in a manner consistent with the Company’s compensation strategy including the following incentive plan elements: eligibility and participation; annual allocation and actual award of equity incentive grants paid to the Chief Executive Officer and the members of the management team; corporate financial goals as the relate to total compensation; total funds reserved for payment under the plan; and annual review of the incentive equity and cash management incentive plan; |
| • | recommend to the board for approval of the submission to shareholders of all new equity-related incentive plans, and administer the Company’s long term incentive programs in a manner consistent with the terms of the plans including the following: eligibility; vesting terms and conditions; and total shares reserved for grants; |
| • | annually review the Chief Executive Officer and management succession plan; |
| • | in consultation with management, oversee regulatory compliance with respect to compensation matters, including overseeing the Company’s policies on structuring compensation programs to preserve tax deductibility; |
| • | perform any other duties or responsibilities the board may expressly delegate to the committee from time to time on matters relating to the Company’s compensation programs; and |
| • | review and approve general employee welfare benefit plans and other plans on an as needed basis. |
The members of the Human Resources & Compensation Committee are Brian Choi, Jason Hwang, Soo Hun Jung, M.D. (committee chair), Ock Hee Kim, Myung Ja (Susan) Park, and Yong Sin Shin.
Nomination & Governance Committee. The Company has a separately designated the Nomination & Governance Committee, which consists of entirely independent directors as defined by the applicable rules and regulations of the Nasdaq Stock Market. The Nomination & Governance Committee has adopted a charter, which will be available on the Company’s website at www.myopenbank.com under the “Investor Relations” tab upon completion of this offering.
The purposes of the Nomination & Governance Committee include the following responsibilities:
| • | identifying individuals qualified to become board members; |
118
Table of Contents
| • | recommend to the board director nominees for election at each annual meeting of shareholders or to fill vacancies on the board; |
| • | formulate and recommend for adoption by the full board a policy for consideration of nominees for election to the board who are recommended by shareholders of the Company; |
| • | consider candidates recommended by the shareholders of the Company in accordance with the board’s policy for such consideration; |
| • | consider the following qualifications or factors when evaluating and selecting potential new directors: |
| • | commitment to ethical conduct and personal and professional integrity as evidenced through the person’s business associations, service as a director or executive officer or other commitment to ethical conduct and personal and professional integrity as evidenced organizations and/or education; |
| • | objective perspective and mature judgment developed through business experiences and/or educational endeavors; |
| • | the candidate’s ability to work with other members of the board and management to further the Company’s goals and increase shareholder value; |
| • | the ability and commitment to devote sufficient time to carry out the duties and responsibilities as a director; |
| • | experience at policy making levels in various organizations and in areas that are relevant to the Company’s activities; |
| • | the skills and experience of the potential nominee in relation to the capabilities already present on the board; |
| • | broad experience in business, finance or administration, and familiarity with national and international business matters; |
| • | familiarity with the commercial banking industry; |
| • | prominence and reputation, and ability to enhance the reputation of the Company; |
| • | activities and associations of each candidate to ensure that there is no legal impediment, conflict of interest, or other consideration that might hinder or prevent service on the board; |
| • | in considering diversity of the board (in all aspects of the term) as a criteria for selecting nominees to the board the committee shall take into account various factors and perspectives, including differences of viewpoint, high quality business and professional experience, education, skills and other individual qualities and attributes that contribute to board heterogeneity, as well as race, gender and national origin; and |
| • | consider the impact of a material change in qualifications of a director arising from the retirement or a change in the principal occupation, position or responsibility of a director as such a change relates to continued service on the board; |
| • | evaluate board performance and annually review the appropriate skills and characteristics required of board members in the context of the currentmake-up or the board, including such factors as business and professional experience, diversity and personal skills in finance, real estate capital markets, government regulation, financial reporting and other areas that are expected to contribute to an effective board; |
| • | review the effectiveness, structure and operation of committees of the board and the qualifications of members of the board committees, and recommend to the board the directors to serve or be removed as members of each committee and to recommend additional committee members to fill any vacancies; |
| • | develop for board approval a set of corporate governance guidelines applicable to the Company and its subsidiary, periodically review and assess these and their application, and recommend to the board any changes that the Committee deems appropriate; and |
119
Table of Contents
| • | develop for board approval the Company’s Code of Ethics and Business Conduct and the Director Code of Ethics and Business Conduct and periodically review and assess the codes and their application, and recommend to the board any changes that the committee deems appropriate. |
The members of the Nomination & Governance Committee are Brian Choi (committee chair), Ernest E. Dow, Jason Hwang, and Soo Hun Jung, M.D.
120
Table of Contents
Our named executive officers for 2017, which consist of our principal executive officer and the company’s two other most highly compensated executive officers, are:
| • | Min J. Kim, President and Chief Executive Officer; |
| • | Christine Y. Oh, Executive Vice President and Chief Financial Officer; and |
| • | Steve K. Park, Executive Vice President and Chief Credit Officer. |
Summary Compensation Table
The following table sets forth information regarding the compensation paid, awarded to, or earned for our fiscal years ended December 31, 2017 and 2016 for each of our named executive officers.
Name and Principal Position | Year | Salary ($) | Bonus ($) (1) | Stock Awards | Option Awards | Non Equity Incentive Plan Compensation (2) | Other Compensation ($) (3) | Total Compensation ($) | ||||||||||||||||||||||||
Min J. Kim | 2017 | $ | 389,737 | $ | 57,709 | $ | — | $ | — | $ | 761,110 | $ | 33,209 | $ | 1,241,765 | |||||||||||||||||
President and Chief Executive Officer | 2016 | $ | 374,667 | $ | 31,708 | $ | — | $ | — | $ | 320,000 | $ | 32,720 | $ | 759,095 | |||||||||||||||||
Christine Y. Oh | 2017 | $ | 218,807 | $ | 32,608 | $ | — | $ | — | $ | 180,000 | $ | 25,128 | $ | 456,543 | |||||||||||||||||
Executive Vice President | 2016 | $ | 212,375 | $ | 17,917 | $ | — | $ | — | $ | 89,000 | $ | 24,166 | $ | 343,458 | |||||||||||||||||
and Chief Financial Officer | ||||||||||||||||||||||||||||||||
Steve K. Park | 2017 | $ | 218,807 | $ | 32,608 | $ | — | $ | — | $ | 155,000 | $ | 25,128 | $ | 431,543 | |||||||||||||||||
Executive Vice President | 2016 | $ | 212,375 | $ | 17,917 | $ | — | $ | — | $ | 90,000 | $ | 24,743 | $ | 345,035 | |||||||||||||||||
and Chief Credit Officer | ||||||||||||||||||||||||||||||||
| (1) | Discretionary cash bonus awarded at end of year. |
| (2) | Cash bonuses awarded under the Company’s Management Incentive Plan, described below. Amounts for 2017 were determined and paid in March 2018. |
| (3) | Other Compensation for the named executive officers for our fiscal year ended December 31, 2017 includes the following: |
Name | Perquisites (i) | Company 401(k) Match (ii) | Total “All Other Compensation” | |||||||||
Min J. Kim | $ | 16,800 | $ | 16,409 | $ | 33,209 | ||||||
Christine Y. Oh | $ | 12,000 | $ | 13,128 | $ | 25,128 | ||||||
Steve K. Park | $ | 12,000 | $ | 13,128 | $ | 25,128 | ||||||
| (i) | Amounts reflect automobile and cell phone allowances. |
| (ii) | Amounts reflect Company matching contribution under the 401(k) Plan. |
General
We compensate our named executive officers through a combination of base salary, annual bonuses, equity awards, and other benefits including perquisites. Our Human Resources & Compensation Committee, sometimes referred to as the HRCC, believes the executive compensation packages that we provide to our executives, including the named executive officers, should include both cash and equity compensation that reward performance as measured against established corporate goals. Each element of compensation is designed to achieve a specific purpose and to contribute to a total package that is competitive with similar packages provided by other institutions that compete for the services of individuals like our named executive officers. The Tax Cuts and Jobs Act recently signed into law repeals the exemption from Section 162(m) of the Code’s deduction limit for performance-based compensation effective for taxable years beginning after December 31, 2017, such that performance-based compensation paid to our covered executive officers in excess of $1 million will not be deductible in upcoming years, except to the extent grandfathered in under a transition rule. For a greater discussion see “Equity-Based Plans — Section 162(m) of the Internal Revenue Code.”
121
Table of Contents
Chief Executive Officer Agreements
During the periods covered by the Summary Compensation Table and thereafter, we were party to two employment agreements with Ms. Min J. Kim, our President and Chief Executive Officer. The agreements generally describe the position and duties of the Chief Executive Officer, provide for a specified term of employment, describe base salary, bonus opportunity and other benefits and perquisites to which Ms. Kim is entitled, set forth the duties and obligations of each party in the event of a termination of employment prior to expiration of the employment term and provide us with a measure of protection by obligating Ms. Kim to abide by the terms of restrictive covenants during the terms of her employment and thereafter for a specified period of time.
Current Employment Agreement
On November 1, 2017, we entered into an employment agreement that provides for a three-year term and is then automatically renewed each year for a one-year term thereafter unless terminated by either party upon 45 days written notice prior to the end of the then-current term. Ms. Kim receives a base salary of $410,000 with annual minimum increases of 3%, as determined by the board of directors’ annual review of executive salaries. In addition to her salary, she is eligible to participate in the annual Management Incentive Plan, and will be entitled to equity award grants in accordance with the Company’s equity incentive plans and as approved by the board of directors. The Company provides Ms. Kim, at no cost to her, group life, health, accident and disability insurance coverage for herself and her dependents. She is entitled to six weeks paid vacation annually. She receives an automobile allowance in the amount of $1,200 per month. If Ms. Kim’s employment is terminated without Cause she will be entitled to 175% of her base salary paid over a period of 12 months and the Company will pay her COBRA health insurance premiums for 12 months. If Ms. Kim’s employment is terminated by the Company without Cause or she resigns for Good Reason within six months before or two years after a Change in Control, she will be paid 225% of her base salary over 12 months and the Company will pay her COBRA health insurance premiums for 24 months. The agreement provides that if any payments to Ms. Kim are limited by Section 280G of the Internal Revenue Code of 1986, as amended (the “Internal Revenue Code” or the “Code”), our obligations will be limited to such amounts that results in the greatest amount of the payment that is deductible for federal minimum tax purposes after taking into account all other compensation payments to or for the benefit of Ms. Kim that are included in determining the deductibility of such payments under Section 280G. The agreement contains anon-solicitation provision, whereby Ms. Kim may not solicit the Company’s employees for two years after the termination of her employment.
For purposes of Ms. Kim’s contract the following terms are defined as follows:
“Cause” means: (i) the willful and continuing failure to perform her obligations to the Company; (ii) the conviction of, or plea of nolo contendere to, a crime of embezzlement or fraud or any felony under the laws of the United States or any state thereof; (iii) the breach of fiduciary responsibility; (iv) an act of dishonesty that is injurious to the Company; (v) engagement in one or more unsafe or unsound banking practices that has an adverse effect on the Company; (vi) removal or permanent suspension from banking pursuant to regulatory and other applicable state or federal laws; (vii) an act or omission that leads to a harm (financial or reputational or otherwise) to the Company; or (viii) a material breach of Company policies as may be in effect from time to time.
“Change in Control” means the first to occur of (a) the consummation of the acquisition by any “person” (as such term is defined in Section 13(d) or 14(d) of the Exchange Act) of “beneficial ownership” (within the meaning of Rule13d-3 promulgated under the Exchange Act) of more than fifty percent (50%) of the combined voting power of the then outstanding voting securities of the Company; or (b) the consummation by the Company of: (i) a merger, consolidation, or similar transaction if the Company’s shareholders immediately before such merger or consolidation do not, as a result of such merger or consolidation, own, directly or indirectly, more than fifty percent (50%) of the combined voting power of the then outstanding voting securities of the entity resulting from such merger, consolidation or similar transaction in substantially the same proportion as their ownership of the combined voting power of the voting securities of the Company outstanding immediately before such merger
122
Table of Contents
or consolidation; or (ii) a complete liquidation or dissolution of, or an agreement for the sale or other disposition of all or substantially all of the assets of, the Company (including a transaction described in clause (a) or (b) as if applicable to the Bank or a sale of substantially all of the Bank’s assets). Notwithstanding any provision of this definition to the contrary, a Change in Control shall not be deemed to have occurred solely because more than fifty percent (50%) of the combined voting power of the then outstanding securities of the Company are acquired by (i) a trustee or other fiduciary holding securities under one or more employee benefit plans maintained by the Company or an affiliate thereof or (ii) any corporation that, immediately prior to such acquisition, is owned directly or indirectly by the Company’s shareholders in the same proportion as their ownership of “Voting Securities” immediately prior to such acquisition. Further, notwithstanding any provision of this definition to the contrary, in the event that any amount or benefit under the agreement constitutes deferred compensation under the Section 409A of the Internal Revenue Code and the settlement of or distribution of such amount or benefit is to be triggered by a change in control, then such settlement or distribution shall be subject to the event constituting the change in control also constituting a “change in control event” (as defined in Section 409A).
“Good Reason” means the occurrence of any one of the following events, unless Ms. Kim agrees in writing that such event shall not constitute “Good Reason”: (i) a material, adverse change in the nature, scope, or status of Ms. Kim’s position, authorities, or duties from those in effect immediately prior to the applicable change in control; (ii) a material reduction in her aggregate compensation or benefits in effect immediately prior to the applicable Change in Control; or (iii) a relocation of Ms. Kim’s primary place of employment of more than fifty (50) miles from the her primary place of employment immediately prior to the applicable Change in Control. Prior to the Ms. Kim’s termination of service for Good Reason, Ms. Kim must give the Company written notice of the existence of the condition that gives rise to an event of a Good Reason within 90 days of its occurrence and then the Company has 30 days to cure the situation.
Prior Employment Agreement
Previously, we entered into an employment agreement with Ms. Kim, dated as of April 1, 2014, which provided for a term of seven years. Under the agreement Ms. Kim’s annual base salary was $350,000 with a minimum annual increase of 3% per year on each anniversary date. She was entitled to bonuses equal to 5% of the Bank’s gross income before taxes, subject to a cap of 200% of her base salary. In addition, Ms. Kim was issued 210,000 stock options under the 2010 Equity Incentive Plan with an exercise price of $8.00 per share (based on the fair market value as of April 1, 2014) which vest pro rata over the term of the agreement on each anniversary of the grant date. In addition, Ms. Kim received a grant of 70,000 restricted stock units on April 1, 2014 with a grant date value of $8.00 per share. The restricted stock units vest pro rata over the term of the agreement on each anniversary of the grant date. Ms. Kim received six weeks per year of paid time off and an automobile allowance of $1,200 per month. She participated in all other benefits plans generally available to all employees.
Executive Offer Letters
Christine Oh. Ms. Oh received an offer letter for employment providing for a start date of July 1, 2010. The letter provided for an initial gross annual salary of $170,000, 70,000 stock options vesting equally over five years on her anniversary date, four weeks per year of paid time off and an automobile allowance of $800 per month. Ms. Oh is eligible to participate in all employee benefit plans and to receive a discretionary bonus cash incentive bonus tied to the Bank’s performance and her individual goals. Ms. Oh’s salary is reviewed by the HRCC annually. In 2016, her salary increased to $212,375, and in 2017 it increased to $220,375.
Steve Park. Mr. Park received an offer letter for employment providing for a start date of June 1, 2010. The letter provided for an initial gross annual salary of $170,000, 70,000 stock options vesting equally over five years on his anniversary date, four weeks per year of paid time off and an automobile allowance of $700 per month. Mr. Park is eligible to participate in all employee benefit plans and to receive a discretionary bonus cash incentive bonus tied to the Bank’s performance and his individual goals. Mr. Park’s salary is reviewed by the HRCC annually. In 2016, his salary increased to $212,375, and in 2017 it increased to $220,375.
123
Table of Contents
Management Incentive Plan
The Company offers eligible executives an opportunity to earn cash bonuses in addition to their annual base salaries. Each year the management incentive plan (“Management Incentive Plan”) is reviewed and approved by the HRCC. The Management Incentive Plan for each of 2016 and 2017 provides for an opportunity for the President and Chief Executive Officer to earn a bonus up to 5% of pre-tax earnings (before bonus expense), not to exceed 200% of her base salary for the applicable year, and an additional pool of up to 8% of pre-tax earnings (before bonus expense) for bonuses for the other executive officers and other key employees, not to exceed in the aggregate an amount that is 400% of the President and Chief Executive Officer’s base salary for the applicable year.
The availability of bonuses and the amounts earned is based on various metrics approved by the HRCC. These metrics may change from year to year. For each of 2016 and 2017, the HRCC determined that the relevant performance metric would be return on average assets (ROAA) for the year, with the President and Chief Executive Officer and the other executive officers eligible to earn bonuses as follows, subject to adjustment based on achievement of individual performance goals as set forth in the Management Incentive Plan:
| • | If the ROAA for such year was less than 1%, then no bonus distributions would be made; |
| • | If the ROAA for such year was between 1% and 1.09%, then the President and Chief Executive Officer would be eligible to earn up to 3% of pre-tax income (before bonus expense) and the other executive officers and other key employees would collectively be eligible to earn up to 4% of pre-tax income (before bonus expense) for 2016 and up to 5% of pre-tax income (before bonus expense) for 2017; |
| • | If the ROAA for such year was between 1.1% and 1.19%, then the President and Chief Executive Officer would be eligible to earn up to 4% of pre-tax income (before bonus expense) and the other executive officers and other key employees would collectively be eligible to earn up to 6% of pre-tax income (before bonus expense); and |
| • | If the ROAA for such year was 1.2% or higher, then the President and Chief Executive Officer would be eligible to earn up to 5% of pre-tax income (before bonus expense) and the other executive officers and other key employees would collectively be eligible to earn up to 8% of pre-tax income (before bonus expense). |
However, no eligible executive would receive a bonus if less than 80% of his or her individual performance goals set forth in the Management Incentive Plan were achieved.
Specific bonuses payouts are recommended by the President and Chief Executive Officer to the HRCC. The HRCC reviews the recommendations and, based on its evaluation, recommends the final bonus amounts paid. In addition, the board has the discretion to approve any additional cash bonuses as they deem appropriate and in line with the profits and the growth of the Company.
For 2016, ROAA was 1.08%. Accordingly, Ms. Kim was eligible to earn up to 3% of pre-tax income (before bonus expense) for 2016, and the other executive officers and other key employees were collectively eligible to earn 4% of pre-tax income (before bonus expense) for 2016. Pre-tax income (before bonus expense) for 2016 was $13,462,093. Notwithstanding such ROAA, the HRCC determined to keep the size of the 2016 bonus pool, for employees other than the President and the Chief Executive Officer, the same as in 2015, recognizing that the Company exceeded its budgeted net income and asset growth targets for 2016. To partially fund the increased size of the bonus pool, Ms. Kim elected to re-allocate a portion of her bonus to the other participants under the plan. The total amount of bonuses paid under the plan for 2016 performance was $1,142,267, including $320,000 for Ms. Kim, $89,000 for Ms. Oh and $90,000 for Mr. Park.
For 2017, ROAA was 1.29%, as adjusted by the HRCC to exclude the negative impact of the revaluation of the Company’s net deferred tax asset as a result of the Tax Act, which resulted in a $1.3 million decrease in 2017 net income. The HRCC determined that plan participants should not have 2017 bonuses reduced on account of an unexpected event occurring late in the year that was outside of their control. Accordingly, Ms. Kim was eligible to earn up to 5% of pre-tax income (before bonus expense) for 2017, and the other executive officers and other
124
Table of Contents
key employees were eligible to earn up to 8% of pre-tax income (before bonus expense) for 2017. Pre-tax income (before bonus expense) for 2017 was $19,357,918. Ms. Kim received the maximum bonus amount of $761,110 based on 2017 performance, equal to 200% of her annual base salary for 2017. Following adjustments based on achievement of individual performance goals, the other executive officers and other key employees were entitled to receive bonuses in the aggregate amount of $1,468,000. Ms. Oh and Mr. Park received $180,000 and $155,000, respectively, based on 2017 performance.
Benefits and Other Perquisites
The named executive officers are eligible to participate in the same benefit plans designed for all of our full-time employees, including health, dental, vision, disability and basic group life insurance coverage. We also provide our employees, including our named executive officers, with various retirement benefits. Our retirement plans are designed to assist our employees in planning for retirement and securing appropriate levels of income during retirement. The purpose of our retirement plans is to attract and retain quality employees, including executives, by offering benefit plans similar to those typically offered by our competitors.
Open Bank Employee’s 401(k) Plan. The Open Bank Employee’s 401(k) Plan is designed to provide retirement benefits to all eligible full-time and part-time employees of the Company and its subsidiary. The 401(k) Plan provides employees with the opportunity to save for retirement on atax-favored basis. Named executive officers, all of whom were eligible during 2016, may elect to participate in the 401(k) Plan on the same basis as all other employees. Employees may defer 1% to 100% of their compensation to the 401(k) Plan up to the applicable IRS limit. We currently match employee contributions on the first 6% of employee compensation (50 cents for each $1). The Company match is contributed in the form of cash and is invested according to the employee’s current investment allocation. No discretionary profit sharing contribution was made to the 401(k) Plan for 2016 or 2015.
Bank Owned Life Insurance or BOLI Policies. In 2014, the Company purchased single premium BOLI Policies for certain executives and senior officers of the Company and to use the income from the BOLI Policies to offset benefit expenses. Further, the Company benefits from any future death benefits paid out under these BOLI Policies. The Company entered into arrangements with certain executive and senior officers to pay their beneficiaries a death benefit. The amount of the arrangement for executive officers was equal to 20% of the net amount of insurance, and for senior officers between 10% and 15% of the net amount of insurance. If the officer or director retires or is terminated, the arrangement terminates.
Health and Welfare Benefits. Our named executive officers are eligible to participate in our standard health and welfare benefits program, which offers medical, dental, vision, life, accident, and disability coverage to all of our eligible employees. We do not provide the named executive officers with any health and welfare benefits that are not generally available to our other employees.
Perquisites. We provide our named executive officers with certain perquisites that we believe are reasonable and consistent with our overall compensation program to better enable us to attract and retain superior employees for key positions. The HRCC periodically reviews the levels of perquisites and other personal benefits provided to named executive officers. Based on this periodic review, perquisites are awarded or adjusted on an individual basis. The perquisites received by our named executive officers in 2016 included an automobile and cell phone allowance.
Executive Change in Control Plan
In connection with this offering, our board of directors adopted an Executive Change in Control Plan, or Severance Plan. Participants in the Severance Plan are selected by the HRCC and the board of directors. Our Chief Executive Officer is not eligible to participate in the Severance Plan. If a participant in the Severance Plan is terminated without cause or resigns for a “good reason” within a determined period of time before or following a change in control, the participant will be paid an individually determined severance amount and benefits. Upon
125
Table of Contents
termination of the participant’s employment in a manner that results in severance to the participant under the Severance Plan, the participant agrees not to solicit employees and not solicit customers to terminate their relationships with the Company for a period of one year.
Christine Oh and Steve Park are each a participant in the Severance Plan. If either is terminated without cause within six months before or 12 months after a change in control (the “change of control period”) or he or she resigns for good reason during the change of control period, he or she would be entitled to 150% his or her base salary and the Company will pay his or her COBRA health insurance premiums for 12 months.
The terms “cause,” “change of control” and “good reason” have substantially the same meanings as provided in Min Kim’s employment agreement, as described above.
Equity-Based Plans
2010 Equity Incentive Plan
General. On August 19, 2010, the shareholders of Open Bank approved the 2010 Equity Incentive Plan (the “2010 Plan”). The 2010 Plan was amended by the board and shareholders of Open Bank in 2013 to increase the number of authorized shares for issuance from 1,350,000 shares to 2,500,000 shares of common stock. In June 2016, OP Bancorp assumed the 2010 Plan in connection with the formation of the bank holding company. The purpose of the 2010 Plan is to advance the interest of the Company and its shareholders by providing an incentive to attract, retain and reward key employees, officers (whether or not directors) andnon-employee directors of the Company and/or the Bank and by motivating such persons to contribute to the growth and profitability of the Company.
The shares of common stock are authorized and reserved for issuance for equity awards including stock options and restricted stock and restricted stock units. Option exercise prices are the fair market value of the underlying stock as of the grant date. Restricted stock units are valued at the fair market value on the date of grant. As of December 31, 2017, we had options outstanding to purchase a total of 795,000 shares of our common stock under the 2010 Plan, at an average exercise price of $4.22 per share, and 453,500 restricted stock awards at an average issue price of $5.95 were outstanding, leaving 218,605 shares available for future grants.
We intend to propose to amend the 2010 Plan to increase the amount of shares available for grant to shares at our next shareholder meeting.
Administration. The 2010 Plan is administered by the HRCC. Subject to the provisions of the 2010 Plan, the HRCC determines in its discretion the persons to whom and the times at which awards are granted, the types and sizes of such awards, and all of their terms and conditions. All awards must be evidenced by a written agreement between us and the participant. The HRCC may amend, cancel or renew any award, waive any restrictions or conditions applicable to any award, and accelerate, continue, extend or defer the vesting of any award. The HRCC will not have the authority to reprice, adjust or amend the exercise price of options or the grant price of stock appreciation rights previously awarded to any participant, whether through amendment, cancellation and replacement grant, or any other means. The HRCC has the authority to construe and interpret the terms of the 2010 Plan and awards granted under it.
Eligibility. Awards may be granted under the 2010 Equity Plan to our employees, officers, directors, or those of the Company. While we grant incentive stock options only to employees, we may grant nonstatutory stock options, restricted stock awards, performance awards, and restricted stock units to any eligible participant. The actual number of individuals who will receive an award under the 2010 Plan cannot be determined in advance because the HRCC has the discretion to select the participants. The maximum number of shares of stock with respect to an award or awards that may be granted to any participant may not exceed 15% of the total outstanding shares of common stock issued and outstanding.
126
Table of Contents
Types of Awards. The 2010 Plan provides for the award of incentive stock options, nonstatutory stock options, restricted stock awards, performance awards, restricted stock unit awards.
Options. The HRCC may grant nonstatutory stock options, “incentive stock options” within the meaning of Section 422 of the Code, or any combination of these. The number of shares of our common stock covered by each option will be determined by the HRCC.
The exercise price of each option may not be less than the fair market value of a share of our common stock on the date of grant. Any incentive stock option granted to a person who owns stock possessing more than 10% of the total combined voting power of all classes of our stock or of any parent or subsidiary corporation must have an exercise price equal to at least 110% of the fair market value of a share of our common stock on the date of grant and a term not exceeding five years. In addition, the aggregate fair market value of the shares (determined on the grant date) covered by incentive stock options which first become exercisable by any participant during any calendar year may not exceed $100,000. The term of all options other than any incentive stock option granted to a person who owns stock possessing more than 10% of the total combined voting power of all classes of our stock or of any parent or subsidiary corporation may not exceed ten years.
Options vest and become exercisable at such times or upon such events and subject to such terms, conditions, performance criteria or restrictions as specified by the HRCC. Unless a longer period is provided by the HRCC, an option generally will remain exercisable for ninety days following the participant’s termination of service, except that if service terminates as a result of the participant’s death or disability, the option generally will remain exercisable for one year, but in any event not beyond the expiration of its term.
The exercise price of each option must be paid in full in cash (or cash equivalent) at the time of exercise, payment through the tender of shares of our common stock that are already owned by the participant, or through cashless exercise, any other consideration approved by the HRCC, or by any combination thereof. At the time of exercise, a participant who is an employee must pay any taxes that the Company is required to withhold.
Restricted Stock Awards. The HRCC may grant awards of restricted stock under the 2010 Plan. Awards of restricted stock may vest subject to the attainment of performance goals similar to those described below or satisfaction of certain service-based or other vesting conditions as the HRCC specifies, and the shares acquired may not be transferred by the participant until vested. Unless otherwise determined by the HRCC, a participant will forfeit any unvested shares upon voluntary or involuntary termination of service with us for any reason, including death or disability. Except as otherwise provided in the 2010 Plan or award agreement, participants holding restricted stock will have the right to vote the shares and to receive any dividends paid, except that dividends or other distributions paid in shares will be subject to the same restrictions as the original award.
Performance Awards. The HRCC may grant performance shares and performance units under the 2010 Plan, which are awards that will result in a payment to a participant only if specified performance goals are achieved during a specified performance period. Awards of performance shares are denominated in shares of our common stock, while awards of performance units are denominated in dollars. In granting an award of performance shares or units, the HRCC establishes the applicable performance goals based on one or more measures of business performance enumerated in the 2010 Plan and described in the performance goal section below.
To the extent earned, awards of performance shares and units may be settled in cash, shares of our common stock or any combination thereof. Unless otherwise determined by the HRCC, if a participant’s service terminates due to death or disability prior to completion of the applicable performance period, the final award value is determined at the end of the period on the basis of the performance goals attained during the entire period, but payment is prorated for the portion of the period during which the participant remained in service. Except as otherwise provided by the 2010 Plan, if a participant’s service terminates for any other reason, the participant’s performance shares or units are forfeited.
127
Table of Contents
Restricted Stock Units. Restricted stock units granted under the 2010 Plan represent a right to receive shares of our common stock at a future date determined in accordance with the participant’s award agreement. The HRCC may grant restricted stock units subject to the attainment of performance goals similar to those described below, or may make the awards subject to service-based and other vesting conditions.
Performance Goals. The HRCC (in its discretion) may make performance goals applicable to a participant with respect to an award, including but not limited to performance shares and performance units. If the HRCC desires that an award qualify as performance-based compensation under former Section 162(m) of the Internal Revenue Code, then, at the HRCC’s discretion, one or more of the following performance goals may apply: revenue, gross margin, operating margin, operating income,pre-tax profit, earnings before interest, taxes and depreciation, net income, cash flow, expenses, the market price of the stock, earnings per share, return on shareholder equity, return on capital, return on net assets, economic value added, number of customers, and market share. Such goals may reflect absolute entity or business unit performance or a relative comparison to the performance of a peer group of entities or other external measure of the selected performance criteria. The performance measures shall have the same meanings as used in the Company’s financial statements, or, if such terms are not used in the Company’s financial statements, they shall have the meaning applied pursuant to generally accepted accounting principles, or as used generally in the banking industry.
As discussed in more detail under the heading “—Section 162(m) of the Internal Revenue Code” below, Section 162(m) of the Code generally imposes a $1 million annual limitation on the amount of compensation that certain corporations can deduct with respect to “covered employees” (generally, certain executive officers). Prior to the effectiveness of the Tax Cuts and Jobs Act, Section 162(m) of the Code contained an exemption for certain performance-based compensation. Effective for taxable years beginning after December 31, 2017, this exemption is no longer applicable, except to the extent grandfathered in under a transition rule. As a result, any performance-based compensation paid to our covered employees in excess of $1 million will not be deductible in upcoming years (except to the extent another exception applies).
Adjustments. The committee will make appropriate adjustments in outstanding awards and the number of shares of common stock available for issuance under the 2010 Plan should any change be made to the common stock by reason of any stock split, reverse stock split, stock dividend, recapitalization, combination of shares, exchange of shares or other change affecting the outstanding common stock as a class without the Company’s receipt of consideration.
Amendments and Termination. Unless earlier terminated, the 2010 Plan shall terminate automatically ten (10) years after its adoption only with respect to the Company’s ability to grant incentive stock options under the 2010 Plan. The committee may terminate or amend the 2010 Plan at any time and for any reason, in its discretion; however, certain amendments, including amendments that increase the number of shares of common stock available for issuance under the 2010 Plan or change the class of persons who are eligible for the grant of incentive stock options, shall be subject to the approval of the Company’s shareholders. Amendments will be submitted for shareholder approval to the extent necessary and desirable to comply with applicable laws.
Change in Control. In the event that the Company is a party to a change in control, generally, outstanding awards that are not yet vested shall be subject to the agreement of merger or consolidation or asset sale. With regard to options, options shall become 100% vested and exercisable immediately prior to the change in control. The committee may, in its sole discretion and without consent of any participant, determine that, upon the occurrence of a change in control, each or any option outstanding immediately prior to the change in control shall be cancelled in exchange for payment with respect to each vested share of stock subject to such cancelled option in cash or stock of the other entity party to the change in control in an amount equal to the fair market value of the consideration to be paid per share in the change in control over the exercise price per share under such option. With respect to restricted stock, a participant shall be 100% vested immediately prior to a change in control.
Forfeiture Provision. To the extent an award of our common stock expires, is surrendered pursuant to an exchange program or becomes unexercisable without having been exercised, forfeited to or repurchased by the
128
Table of Contents
Company due to failure to vest, the unpurchased shares will become available for future grant or sale under the 2010 Plan, unless the 2010 Plan has terminated. Notwithstanding the foregoing (and except with respect to shares of restricted stock that are forfeited rather than vesting), shares that have actually been issued under the 2010 Plan under any award will not be returned to the 2010 Plan and will not become available for future distribution under the 2010 Plan; provided, however, that if shares issued pursuant to awards granted under the 2010 Plan are repurchased by or are forfeited to the Company, such shares will become available for future grant under the 2010 Plan. Shares used to pay the exercise price of an award or to satisfy the tax withholding obligations related to an award will become available for future grant or sale under the 2010 Plan. To the extent an award under the 2010 Plan is paid out in cash rather than shares, such cash payment will not result in reducing the number of shares available for issuance under the 2010 Plan.
Section 162(m) of the Internal Revenue Code. Under Section 162(m) of the Code, the deduction for a publicly held corporation for otherwise deductible compensation to a “covered employee” (the chief executive officer, the chief financial officer and the next three most highly compensated officers (other than the chief executive officer or the chief financial officer)) is generally limited to $1 million per year. However, in the case of a corporation that becomes a publicly held corporation in connection with an initial public offering, the $1 million per year deduction limit does not apply during a limited “transition period” to any remuneration paid pursuant to a compensation plan that existed during the period in which the corporation was not publicly held, if the prospectus accompanying the initial public offering disclosed information concerning those plans that satisfied all applicable securities laws then in effect.
The Company intends to rely on the transition relief described in the immediately preceding paragraph in connection with awards under the 2010 Plan until the earliest of the four following events: (i) the expiration of the 2010 Plan; (ii) the material modification of the 2010 Plan; (iii) the issuance of all stock and other compensation that has been allocated under the 2010 Plan; or (iv) the first meeting of the Company’s shareholders at which directors are to be elected that occurs after the close of the third calendar year following the calendar year in which the initial public offering of the Company’s common stock occurs.
As discussed under the heading “—Performance Goals” above, the performance-based compensation exemption to deduction limitation under Section 162(m) of the Code has been repealed effective for taxable years beginning after December 31, 2017. Thus, any annual compensation paid to covered employees in excess of $1 million generally will not be deductible unless it qualifies under the transition relief discussed above.
U.S. Federal Income Tax Treatment. The following paragraphs are a summary of some of the general federal income tax consequences to U.S. taxpayers and the Company of Awards granted under the 2010 Plan. Tax consequences for any particular individual may be different.
The following discussion assumes that the fair market value of our common stock on the date of exercise is greater than the per share exercise price.
Non-Qualified Stock Options. The grant of anon-qualified option generally will not result in taxable income to the participant. The participant generally will realize ordinary income at the time of exercise in an amount equal to the excess of the fair market value of the shares acquired over the exercise price for those shares, and the Company will be entitled to a corresponding deduction. Gains or losses realized by the participant upon disposition of such shares generally will be treated as capital gains and losses, with the basis in such shares equal to the fair market value of the shares at the time of exercise.
Incentive Stock Options. The grant of an incentive stock option generally will not result in taxable income to the participant. The exercise of an incentive stock option generally will not result in taxable income to the participant, provided that the participant was (without a break in service) an employee of the Company or a subsidiary during the period beginning on the date of the grant of the option and ending on the date three months prior to the date of exercise (one year prior to the date of exercise if the participant is “disabled,” as that term is defined in the Code).
129
Table of Contents
The excess of the fair market value of the shares at the time of the exercise of an incentive stock option over the exercise price generally will be an adjustment that is included in the calculation of the participant’s alternative minimum taxable income for the tax year in which the incentive stock option is exercised. For purposes of determining the participant’s alternative minimum tax liability for the year of disposition of the shares acquired pursuant to the incentive stock option exercise, the participant will have a basis in those shares equal to the fair market value of the shares at the time of exercise.
If the participant does not sell or otherwise dispose of the shares within two years from the date of the grant of the incentive stock option or within one year after the transfer of such shares to the participant, then, upon disposition of such shares, any amount realized in excess of the exercise price generally will be taxed to the participant as capital gain. A capital loss will be recognized to the extent that the amount realized is less than the exercise price.
If the foregoing holding period requirements are not met, the participant generally will realize ordinary income at the time of the disposition of the shares in an amount equal to the excess of the fair market value of the shares on the date of exercise over the exercise price. However, if the shares are disposed of for an amount that is less than their fair market value as of the exercise date, then the amount of ordinary income is limited to the excess of the amount realized upon disposition of the shares over the participant’s adjusted tax basis in the disposed shares. The Company generally will be entitled to a corresponding deduction. If the amount realized exceeds the value of the shares on the date of exercise, any additional amount generally will be short term or long term capital gain depending on whether the participant help the shares for more than one year. If the amount realized is less than the exercise price, the participant generally will recognize no income, and a capital loss will generally be recognized equal to the excess of the exercise price over the amount realized upon the disposition of the shares.
Restricted Stock Awards, Restricted Stock Units, Performance Shares and Performance Units. A participant generally will not have taxable income at the time an award of restricted stock, restricted stock units, performance shares, or performance units are granted. Instead, he or she will recognize ordinary income in the first taxable year in which his or her interest in the shares underlying the award becomes either: (i) freely transferable; or (ii) no longer subject to a substantial risk of forfeiture. However, the recipient of an award of restricted stock may elect to recognize income at the time he or she receives the award in an amount equal to the fair market value of the shares underlying the award (less any cash paid for the shares on the date the award is granted). A participant who makes an election under Section 83(b) of the Code within thirty days of the date of grant of the restricted stock, will recognize ordinary income on the date of grant of the shares equal to the excess of the fair market value of the restricted shares (determined without regard to the risk of forfeiture or restrictions on transfer) over any purchase price paid for the shares. If a Section 83(b) election has not been made, any dividends received with respect to restricted shares of stock that are subject at that time to a risk of forfeiture or restrictions on transfer generally will be treated as compensation that is taxable as ordinary income to the recipient (instead of being treated as dividend income).
Section 409A. Section 409A of the Code (“Section 409A”) contains certain requirements fornon-qualified deferred compensation arrangements, which may include awards under the 2010 Plan, with respect to an individual’s deferral and distribution elections and permissible distribution events. Awards granted under the 2010 Plan with a deferral feature will be subject to the requirements of Section 409A. If an award is subject to and fails to satisfy the requirements of Section 409A, the recipient of that award may recognize ordinary income on the amounts deferred under the award, at the time of vesting, which may be prior to when the compensation is actually or constructively received. Also, if an award that is subject to Section 409A fails to comply with Section 409A’s provisions, Section 409A imposes an additional 20% federal income tax on compensation recognized as ordinary income, as well as interest on such deferred compensation. In addition, certain states (such as California) have laws similar to Section 409A and as a result, failure to comply with such similar laws may result in additional state income, penalty and interest charges.
Withholding of Taxes. All distributions under the 2010 Plan are subject to withholding of all applicable taxes and the board of directors may condition the delivery of any shares or other benefits under the 2010 Plan on
130
Table of Contents
satisfaction of the applicable withholding obligations. Except as otherwise provided by the board of directors, such withholding obligations generally may be satisfied through cash payment by the participant, through the surrender of shares of Company stock that the participant already owns or through the surrender of shares of Company stock to which the participant is otherwise entitled under the 2010 Plan.
2005 Director and Employee Stock Option Plan
On February 10, 2005, the board of directors of Open Bank adopted and on December 21, 2005 shareholders of Open Bank approved the Director and Employee Stock Option Plan (the “2005 Plan”). In June 2016, OP Bancorp assumed the 2005 Plan in connection with the formation of the bank holding company. The 2005 Plan expired in February of 2015 and no more new options may be issued under the 2005 Plan. The 2005 Plan provided for the issuance of up to 770,000 shares of common stock. Option exercise prices were the fair market value of the underlying stock as of the grant date. Options granted to employees vest at the rate of 20% per year. Options granted tonon-employee directors vested immediately.
As of December 31, 2017, the Company had options outstanding to purchase a total of 335,000 shares of common stock under the 2005 Plan, at an average exercise price of $3.99 per share.
Outstanding Equity Awards
The following table provides information for each of our named executive officers regarding outstanding stock options held by the officers as of December 31, 2017.
Outstanding Equity Awards at Fiscal Year End
| Option Awards | Stock Awards | |||||||||||||||||||||||
Name | Number of Securities Underlying Unexercised Options (#) Exercisable | Number of Securities Underlying Unexercised Options (#) Unexercisable | Option Exercise Price ($) | Option Expiration Date | Number of Shares or Units of Stock That Have Not Vested (#) (1) | Market Value of Shares or Units of Stock That Have Not Vested ($) (2) | ||||||||||||||||||
Min J. Kim | 50,000 | — | $ | 3.05 | 4/1/2020 | 85,000 | $ | 833,000 | ||||||||||||||||
| 90,000 | 120,000 | (3) | $ | 8.00 | 4/1/2024 | |||||||||||||||||||
Christine Y. Oh | 60,000 | — | $ | 2.53 | 7/28/2020 | 24,000 | $ | 235,200 | ||||||||||||||||
Steve K. Park | 70,000 | — | $ | 2.88 | 6/1/2020 | 24,000 | $ | 235,200 | ||||||||||||||||
| (1) | This column represents the unvested restricted stock units granted. With regard to 40,000 restricted stock units for Ms. Kim, restricted stock units vest 1/7th per year from the date of grant of April 1, 2014, subject to continuing service. With regard to 45,000 restricted stock units for Ms. Kim, and all restricted stock units for Ms. Oh and Mr. Park, restricted stock units vest 1/7th per year from the date of grant of July 25, 2013, subject to continuing service. |
| (2) | The market value of the shares of restricted stock units that have not vested is calculated by multiplying the number of shares of stock underlying the restricted stock units that have not vested by the closing price of our common stock at December 31, 2017. |
| (3) | This option vests at the rate of 30,000 shares each April 1, subject to continuing service. |
131
Table of Contents
Director Compensation
The following table sets forth compensation paid or awarded to, or earned by, each of our directors (except for Min J. Kim, whose compensation is disclosed under “—Summary Compensation Table”) during 2017. Officers earn no additional compensation for director service.
Name | Fees Earned or Paid in Cash ($) (1) | |||
Brian Choi | $ | 59,000 | ||
Ernest E. Dow | $ | 41,000 | ||
Jason Hwang | $ | 41,000 | ||
Soo Hun Jung, M.D. | $ | 41,000 | ||
Ock Hee Kim | $ | 41,000 | ||
Myung Ja (Susan) Park | $ | 41,000 | ||
Yong Sin Shin | $ | 41,000 | ||
| (1) | Excludes reimbursement for traveling and other expenses and stock-based expenses relating to equity awards granted in prior years under our equity plans. |
The Company paid fees to thenon-officer directors for attendance at board of directors and board of directors’ committee meetings or for performing other services in connection with operation of the Company. The Chairman of the Board received $4,500 per month and all other directors received $3,000 per month. In 2017, after reviewing peer bank’s board of director compensation trends, the board of directors approved an increase to the fees paid to thenon-officer directors in lieu of health insurance coverage, adding $500 per month as of March 1, 2017 and subsequent increases in increments of $500 on January 1, 2018 and January 1, 2019, for an aggregate increase of $1,500 per month. Directors receive reimbursement for theirout-of-pocket expenses incurred in connection with their duties as directors, including their attendance at director meetings.
132
Table of Contents
CERTAIN RELATIONSHIPS AND RELATED PARTY TRANSACTIONS
Policies and Procedures Regarding Related Party Transactions
Our board of directors has adopted a written Statement of Policy with Respect to Related Party Transactions. Under this policy, any “related party transaction” may be consummated or may continue only if the Audit Committee approves or ratifies the transaction in accordance with the guidelines in the policy and if the transaction is on terms comparable to those that could be obtained in arm’s length dealings with an unrelated third party. For purposes of this policy, a “related person” means: (i) any person who is, or at any time since the beginning of the Company’s last fiscal year was, a director or executive officer of the Company or a nominee to become a director of the Company; (ii) any person who is known to be the beneficial owner of more than 5% of any class of the Company’s voting securities; (iii) any immediate family member of any of the foregoing persons, which means any child, stepchild, parent, stepparent, spouse, sibling,mother-in-law,father-in-law,son-in-law,daughter-in-law,brother-in-law, orsister-in-law of the director, executive officer, nominee or more than 5% beneficial owner, and any person (other than a tenant or employee) sharing the household of such director, executive officer, nominee or more than 5% beneficial owner; and (iv) any firm, corporation or other entity in which any of the foregoing persons is employed or is a partner, principal or in a similar position, or in which such person has a 10% or greater beneficial ownership interest.
A “related party transaction” is a transaction in which the Company or its subsidiary is a participant and in which a related person had or will have a direct or indirect interest, other than transactions involving: (i) less than $5,000 when aggregated with all similar transactions; (ii) customary bank deposits and accounts (including certificates of deposit); and (iii) loans and commitments to lend included in such transactions that are made in the ordinary course of business on substantially the same terms, including interest rates and collateral, as those prevailing for comparable transactions with other persons of similar creditworthiness, and do not involve more than the normal risk of collectability or present other unfavorable features to the Company.
A related party who has a position or relationship with a firm, corporation, or other entity that engaged in a transaction with the Company shall not be deemed to have an indirect material interest within the meaning of this policy where the interest in the transaction arises only: (i) from such related party’s position as a director of another corporation or organization that is party to the transaction; (ii) from the direct or indirect ownership by the related party of less than a 10% equity interest in another person (other than a partnership) which is a party to the transaction; or (iii) from the related party’s position as a limited partner in a partnership in which the related party has an interest of less than 10%, and the related party is not a general partner of and does not hold another position in the partnership.
The board of directors has determined that the Audit Committee is best suited to review and approve related party transactions. The Committee considers all of the relevant facts and circumstances available to the Committee, including (if applicable) but not limited to: (i) the benefits to the Company; (ii) the impact on a director’s independence in the event the related person is a director, an immediate family member of a director or an entity in which a director is a partner, shareholder or executive officer; (iii) the availability of other sources for comparable products or services; (iv) the terms of the transaction; and (v) the terms available to unrelated third parties or to employees generally. No member of the Audit Committee may participate in any review, consideration or approval of any related person transaction with respect to which such member or any of his or her immediate family members is the related person. The Committee will approve only those related person transactions that are in, or are not inconsistent with, the best interests of the Company and its shareholders, as the Committee determines in good faith. The Audit Committee will convey its decision to the board of directors. The Chief Executive Officer will convey the decision to the appropriate persons within the Company.
Ordinary Banking Relationships
Certain of our officers, directors and principal shareholders, as well as their immediate family members and affiliates, are customers of, or have or have had transactions with us in the ordinary course of business. These
133
Table of Contents
transactions include deposits, loans and other financial services related transactions. Related party transactions are made in the ordinary course of business, on substantially the same terms, including interest rates and collateral (where applicable), as those prevailing at the time for comparable transactions with persons not related to us, and do not involve more than normal risk of collectability or present other features unfavorable to us. Any loans we originate with officers, directors and principal shareholders, as well as their immediate family members and affiliates, are approved by our board of directors in accordance with the bank regulatory requirements.
As of December 31, 2017, our officers and directors as well as their immediate families and affiliated companies, taken as a group, were indebted directly and indirectly to us in the amount of $10,768, while deposits from this group totaled $1,068,580 as of such date. As of the date of this prospectus, no related party loans were categorized as nonaccrual, past due, restructured or potential problem loans. We expect to continue to enter into transactions in the ordinary course of business on similar terms with our officers, directors and principal shareholders, as well as their immediate family members and affiliates.
Open Stewardship Foundation
In 2011, the Open Stewardship Foundation, anon-profit organization, was created to actively support civic organizations, schools and other eligible charitablenon-profit organizations that provide public benefit services in the communities we serve. We have committed to fund the Foundation in an amount equal to 10% of our consolidated annual income after taxes each year. We also permit the Foundation to use our premises for activities on behalf of non-profit organizations. This commitment is included in our annual operating budget each year and the board of directors and management believe that such activities have benefited us through stronger and expanded business relationships within the Korean-American community. Since inception, we have donated over $2.9 million to the Foundation, aiding over 120 localnon-profits. The Foundation’s board of directors is comprised of five of our directors, Brian Choi, Ernest E. Dow, Min J. Kim, Ock Hee Kim, and Myung Ja (Susan) Park. Our Chief Financial Officer serves as the president of the Foundation. Our directors and officers receive no additional compensation for their service at the Foundation. The board of directors of the Foundation maintains a selection committee that is responsible for reviewing and recommending grant applications from local nonprofits. The selection committee has four members annually selected by the Foundation board of directors, which is traditionally comprised of Min J. Kim and three customers of Open Bank. We do not control the Foundation’s activities, and accordingly, we do not consolidate the financial statements of the Foundation.
Other Related Party Transactions
Other than the compensation arrangements with directors and executive officers described in “Executive Compensation” and the ordinary banking relationships described above, none of our directors, executive officers or beneficial holders of more than 5% of our capital stock, or their immediate family members or entities affiliated with them, had or will have a direct or indirect material interest, in any transactions to which we have been a party.
At our request, the underwriters have reserved for sale, at the initial public offering price, 100,000 of the shares offered by this prospectus for sale to the directors, senior management and certain employees of the Company and the Bank through a directed share program. See “Underwriting—Directed Share Program” for additional information regarding the directed share program.
134
Table of Contents
The following table provides information regarding the beneficial ownership of our common stock as of December 31, 2017, and as adjusted to reflect the completion of this offering, for:
| • | each of our directors; |
| • | each of our named executive officers; and |
| • | all of our directors and executive officers as a group; |
We have determined beneficial ownership in accordance with the rules of the SEC. These rules generally provide that a person is the beneficial owner of securities if such person has or shares the power to vote or direct the voting of securities, or to dispose or direct the disposition of securities, or has the right to acquire such powers within 60 days. For purposes of calculating each person’s percentage ownership, common stock issuable pursuant to options that are currently exercisable or will become exercisable within 60 days are included as outstanding and beneficially owned for that person or group, but are not deemed outstanding for the purposes of computing the percentage ownership of any other person. Except as disclosed in the footnotes to this table and subject to applicable community property laws, we believe that each person identified in the table has sole voting and investment power over all of the shares shown opposite such person’s name.
The percentage of beneficial ownership is based on 13,190,527 shares of our common stock outstanding as of December 31, 2017 and 15,190,527 shares to be outstanding after the completion of this offering (or 15,490,527 shares if the underwriters exercise their overallotment option in full). The table does not reflect any shares of common stock that may be purchased in this offering by the named individuals.
Except as indicated below, the address for each shareholder listed in the table below is: OP Bancorp, 1000 Wilshire Blvd., Suite 500, Los Angeles, California 90017.
| Shares Beneficially Owned Following Offering (13) | ||||||||||||||||||||
| Shares Beneficially Owned Prior to Offering | If Option Not Exercised | If Option Exercised in Full | ||||||||||||||||||
Name | Number | % | Number | % | % | |||||||||||||||
Directors and named executive officers: | ||||||||||||||||||||
Min J. Kim (1) | 427,072 | 3.24 | % | 427,072 | 2.81 | % | 2.76 | % | ||||||||||||
Brian Choi (2) | 771,785 | 5.85 | % | 771,785 | 5.08 | % | 4.98 | % | ||||||||||||
Ernest E. Dow (3) | 193,044 | 1.46 | % | 193,044 | 1.27 | % | 1.25 | % | ||||||||||||
Jason Hwang (4) | 178,100 | 1.35 | % | 178,100 | 1.17 | % | 1.15 | % | ||||||||||||
Soo Hun Jung, M.D. (5) | 229,826 | 1.74 | % | 229,826 | 1.51 | % | 1.48 | % | ||||||||||||
Ock Hee Kim (6) | 389,700 | 2.95 | % | 389,700 | 2.57 | % | 2.52 | % | ||||||||||||
Christine Y. Oh (7) | 115,903 | * | 115,903 | * | * | |||||||||||||||
Myung Ja (Susan) Park (8) | 180,000 | 1.36 | % | 180,000 | 1.18 | % | 1.16 | % | ||||||||||||
Steve K. Park (9) | 117,811 | * | 117,811 | * | * | |||||||||||||||
Yong Sin Shin (10) | 498,000 | 3.78 | % | 498,000 | 3.28 | % | 3.21 | % | ||||||||||||
Directors & officers as a group (12 in number) (11) | 3,212,436 | 24.35 | % | 3,212,436 | 21.15 | % | 20.74 | % | ||||||||||||
135
Table of Contents
| Shares Beneficially Owned Following Offering (13) | ||||||||||||||||||||
| Shares Beneficially Owned Prior to Offering | If Option Not Exercised | If Option Exercised in Full | ||||||||||||||||||
Name | Number | % | Number | % | % | |||||||||||||||
Other principal shareholders: | ||||||||||||||||||||
Stuart Whang (12) | 730,000 | 5.53 | % | 730,000 | 4.81 | % | 4.71 | % | ||||||||||||
| (*) | Less than 1% |
| (1) | Consists of 287,072 shares held by Ms. Kim individually and 140,000 shares that are subject to options that are currently exercisable or are exercisable within 60 days of December 31, 2017. |
| (2) | Consists of 671,785 shares held by Mr. Choi individually and 100,000 shares that are subject to options that are currently exercisable or are exercisable within 60 days of December 31, 2017. |
| (3) | Consists of 108,044 shares held by Mr. Dow individually and 85,000 shares that are subject to options that are currently exercisable or are exercisable within 60 days of December 31, 2017. |
| (4) | Consists of 148,100 shares held by Mr. Hwang individually and 30,000 shares that are subject to options that are currently exercisable or are exercisable within 60 days of December 31, 2017. |
| (5) | Consists of 149,826 shares held by Mr. Jung individually and 80,000 shares that are subject to options that are currently exercisable or are exercisable within 60 days of December 31, 2017. |
| (6) | Consists of 369,700 shares held by Mrs. Kim individually and 20,000 shares that are subject to options that are currently exercisable or are exercisable within 60 days of December 31, 2017. |
| (7) | Consists of 55,903 shares held by Ms. Oh individually and 60,000 shares that are subject to options that are currently exercisable or are exercisable within 60 days of December 31, 2017. |
| (8) | Consists of 80,000 shares held by Ms. Park individually and 100,000 shares that are subject to options that are currently exercisable or are exercisable within 60 days of December 31, 2017. |
| (9) | Consists of 47,811 shares held by Mr. Park individually and 70,000 shares that are subject to options that are currently exercisable or are exercisable within 60 days of December 31, 2017. |
| (10) | Consists of 398,000 shares held by Ms. Shin individually and 100,000 shares that are subject to options that are currently exercisable or are exercisable within 60 days of December 31, 2017. |
| (11) | Includes 855,000 shares that are subject to options that are currently exercisable or are exercisable within 60 days of December 31, 2017. |
| (12) | Address: 2400 S. Wilmington Ave., Compton, California 90220. |
| (13) | Does not include shares purchased in the Directed Share Program. |
136
Table of Contents
The following is a summary of the material rights of our capital stock and related provisions of our articles of incorporation, or articles, and bylaws. The following description of our capital stock does not purport to be complete and is subject to, and qualified in its entirety by, our articles and bylaws, which we have included as exhibits to the registration statement of which this prospectus is a part. We urge you to read these documents for a more complete understanding of shareholder rights.
Our articles authorize the issuance of up to 50,000,000 shares of common stock, no par value per share, and up to 10,000,000 shares of preferred stock. At December 31, 2017, we had issued and outstanding 13,190,527 shares of our common stock, and no shares of preferred stock. We have reserved 2,500,000 shares for issuance upon the exercise of outstanding stock options, restricted stock and other awards that remain available for issuance under our 2010 Plan. As of December 31, 2017, we had options outstanding to purchase a total of 795,000 shares of our common stock and 453,500 restricted stock awards under the 2010 Plan, leaving 218,605 shares available for future grants. In addition, as of December 31, 2017, the Company had options outstanding to purchase a total of 335,000 shares of common stock under the 2005 Plan. The 2005 Plan provided for the issuance of up to 770,000 shares of common stock; however, the 2005 Plan expired in February 2015 and no more new options may be issued under the 2005 Plan.
Common Stock
Each share of common stock has the same rights, privileges and preferences as every other share of common stock, and there is no preemptive, conversion, redemption rights or sinking fund provisions applicable to our common stock. The designations and powers, preferences and rights and the qualifications, limitations or restrictions of the common stock are described below.
Dividend Rights. Subject to the rights of preferred stock we may use in the future, each share of common stock will participate equally in dividends, which are payable when and as declared by our board of directors.
Liquidation and Dissolution. After the return of all funds to depositors and the payment of creditors and after distribution in full of the preferential amounts to be distributed to the holders of all classes and series of stock entitled thereto or the holders of capital notes, if any, in the event of a voluntary or involuntary liquidation, dissolution or winding up of the corporation, as provided for in the California Financial Code, the holders of the common stock shall be entitled to receive all our remaining assets.
Voting Rights. Each holder of common stock is entitled to one vote per share on any issue requiring a vote, except in the election of directors. Shareholders have cumulative voting rights in the election of directors; that is, as to any candidates whose names are placed in nomination prior to voting, a shareholder has the right to vote the number of shares owned for as many persons as there are directors to be elected, or to cumulate such votes and give one candidate as many votes as the number of directors multiplied by the number of shares owned equals, or to distribute such votes on the same principle among as many candidates as the shareholder deems appropriate. However, cumulative voting will be dispensed with unless a shareholder gives notice at the shareholders’ meeting of his intention to cumulate his votes. If any one shareholder gives notice of an intention to cumulate votes, then all shareholders may cumulate their votes for candidates in nomination.
Absence of Preemptive Rights. Our common stock does not have preemptive rights or other rights to subscribe for additional shares.
Stock Exchange Listing. We have received approval to list our common stock on the Nasdaq Global Market under the symbol “OPBK.”
137
Table of Contents
Preferred Stock
Upon authorization of our board of directors, we may issue shares of one or more series of our preferred stock from time to time. Our board of directors may, without any action by holders of common stock (subject to Nasdaq shareholder approval rules) and except as may be otherwise provided in the terms of any series of preferred stock of which there are shares outstanding, adopt resolutions to designate and establish a new series of preferred stock. Upon establishing such a series of preferred stock, the board will determine the number of shares of preferred stock of that series that may be issued and the rights and preferences of that series of preferred stock. The rights of any series of preferred stock may include, among others:
| • | general or special voting rights; |
| • | preferential liquidation rights; |
| • | preferential cumulative or noncumulative dividend rights; |
| • | redemption or put rights; and |
| • | conversion or exchange rights. |
We may issue shares of, or rights to purchase shares of, one or more series of our preferred stock that have been designated from time to time, the terms of which might:
| • | adversely affect voting or other rights evidenced by, or amounts otherwise payable with respect to, the common stock or other series of preferred stock; |
| • | discourage an unsolicited proposal to acquire us; or |
| • | facilitate a particular business combination involving us. |
Any of these actions could have an anti-takeover effect and discourage a transaction that some or a majority of our shareholders might believe to be in their best interests or in which our shareholders might receive a premium for their stock over our then market price.
Anti-Takeover Considerations and Special Provisions of Our Articles, Bylaws and California Law
California law and certain provisions of our articles and bylaws could have the effect of delaying or deferring the removal of incumbent directors or delaying, deferring or discouraging another party from acquiring control of us, even if such removal or acquisition would be viewed by our shareholders to be in their best interests. These provisions, summarized below, are intended to encourage persons seeking to acquire control of us to first negotiate with our board of directors. These provisions also serve to discourage hostile takeover practices and inadequate takeover bids. We believe that these provisions are beneficial because the negotiation they encourage could result in improved terms of any unsolicited proposal.
Authorized but Unissued Capital Stock. At December 31, 2017, we had 36,809,473 shares of authorized but unissued shares of common stock, including 1,130,000 shares of common stock reserved for issuance upon the exercise of outstanding stock options. We also have 10,000,000 shares of authorized but unissued shares of preferred stock, and our board of directors may authorize the issuance of one or more series of preferred stock without shareholder approval (subject to Nasdaq shareholder approval rules). These shares could be used by our board of directors to make it more difficult or to discourage an attempt to obtain control of us through a merger, tender offer, proxy contest or otherwise.
Limitation on Right to Call a Special Meeting of Shareholders. Our bylaws provide that special meetings of shareholders may only be called by our Chairman of the Board, our President, the board of directors or by the holders of not less than 10% of our outstanding shares of capital stock entitled to vote for the purpose or purposes for which the meeting is being called.
138
Table of Contents
Advance Notice Provisions. Additionally, our bylaws provide that nominations for directors must be made in accordance with the provisions of our bylaws, which generally require, among other things, that such nominations be provided in writing to our Chief Executive Officer or President, not less than 60 days prior to the meeting or 10 days after the date of mailing of the notice of meeting to shareholders, and that the notice to our Chief Executive Officer or President contain certain information about the shareholder and the director nominee.
Filling of Board Vacancies; Removals. Any vacancies in our board of directors and any directorships resulting from any increase in the number of directors may be filled by a majority of the remaining directors, or if the number of directors then in office is less than a quorum, by (i) unanimous written consent of the directors then in office, (ii) the affirmative vote of a majority of the directors then in office at a meeting held pursuant to notice or waivers of notice, or (iii) a sole remaining director. However, a vacancy created by the removal of a director by the vote or written consent of the shareholders or by court order may be filled only by the affirmative vote of a majority of the shares represented and voting at a duly held meeting at which a quorum is present, or by the unanimous written consent of all shares entitled to vote thereon.
New or Amendment of the Bylaws. New bylaws may be adopted or the bylaws may be amended or repealed by the vote or written consent of holders of a majority of the outstanding shares entitled to vote. Our bylaws also provide that except for changing the authorized number of directors or providing for the approval by the board of directors, acting alone, of a loan or guarantee to any officer or an employee benefit plan providing for the same, our bylaws may be altered, amended or repealed by our board without prior notice to or approval by our shareholders. Accordingly, our board could take action to amend our bylaws in a manner that could have the effect of delaying, deferring or discouraging another party from acquiring control of us.
Voting Provisions. Our articles do not provide for certain heightened voting thresholds needed to consummate a change in control transaction, such as a merger, the sale of substantially all of our assets or other similar transaction. Accordingly, we will not be able to consummate a change in control transaction or sell all or substantially all of our assets without obtaining the affirmative vote of the holders of shares of our capital stock having at least a majority of the voting power of all outstanding capital stock entitled to vote thereon.
Elimination of Liability and Indemnification. Our articles of incorporation provide that a director of the Company will not incur any personal liability to us or our shareholders for monetary damages for certain breaches of fiduciary duty as a director. A director’s liability, however, is not eliminated with respect to (i) any breach of the duty of loyalty, (ii) acts or omissions not in good faith or which involve intentional misconduct or a knowing violation of law, (iii) paying a dividend or approving a stock repurchase which is illegal under certain provisions of state law, or, (iv) any transaction from which the director derived an improper personal benefit. Our articles of incorporation and bylaws also provide, among other things, for the indemnification of our directors, officers and agents, and authorize our board of directors to pay expenses incurred by, or to satisfy a judgment or fine rendered or levied against, such agents in connection with any personal legal liability incurred by the individual while acting for us within the scope of his or her employment (subject to certain limitations). We have obtained director and officer liability insurance covering all of our and the Bank’s officers and directors.
The foregoing is qualified in its entirety by reference to our articles of incorporation and bylaws, both of which are on file with the SEC.
California and Federal Banking Law. Section 1203 of the Corporations Code of California includes provisions that may have the effect of deterring hostile takeovers or delaying or preventing in control or management of the Company. If an “interested party” makes an offer to purchase the shares of some or all of our shareholders, we must obtain an affirmative opinion in writing as to the fairness of the offering price prior to completing the transaction. California law considers a person to be an “interested party” if the person directly or indirectly controls our Company, if the person is directly or indirectly controlled by one of our officers or directors, or if the person is an entity in which one of our officers or directors holds a material financial interest. If after receiving an offer from such an “interested party” we receive a subsequent offer from a neutral third
139
Table of Contents
party, then we must notify our shareholders of this offer and afford each of them the opportunity to withdraw their consent to the “interested party” offer.
Under the California Financial Code, no person shall, directly or indirectly, acquire control of a California state bank or its holding company unless the California Department of Business Oversight has approved such acquisition of control. A person would be deemed to have acquired control of the Company if such person, directly or indirectly, has the power (i) to vote 25% or more of the voting power of the Company or (ii) to direct or cause the direction of the management and policies of the Company. For purposes of this law, a person who directly or indirectly owns or controls 10% or more of our outstanding common stock would be presumed to control the Company.
The Bank Holding Company Act of 1956, as amended, generally would prohibit any company that is not engaged in financial activities and activities that are permissible for a bank holding company or a financial holding company from acquiring control of the Company. “Control” is generally defined as ownership of 25% or more of the voting stock or other exercise of a controlling influence. In addition, any existing bank holding company would need the prior approval of the Federal Reserve before acquiring 5% or more of our voting stock. The Change in Bank Control Act of 1978, as amended, prohibits a person or group of persons from acquiring control of a bank holding company unless the Federal Reserve has been notified and has not objected to the transaction. Under a rebuttable presumption established by the Federal Reserve, the acquisition of 10% or more of a class of voting stock of a bank holding company with a class of securities registered under Section 12 of the Exchange Act, such as the Company, could constitute acquisition of control of the bank holding company.
The foregoing provisions of California and federal law could make it more difficult for a third party to acquire a majority of our outstanding voting stock, by discouraging a hostile bid, or delaying, preventing or deterring a merger, acquisition or tender offer in which our shareholders could receive a premium for their shares, or effect a proxy contest for control of our company or other changes in our management.
Transfer Agent.
The Company’s transfer agent is Computershare.
140
Table of Contents
SHARES ELIGIBLE FOR FUTURE SALE
Prior to this offering, there has been a limited public market for our common stock on the OTCQB Market. Future sales of substantial amounts of our common stock in the public market, or the perception that such sales may occur, could adversely affect market prices prevailing from time to time. Furthermore, because only a limited number of shares will be available for sale shortly after this offering due to existing contractual and legal restrictions on resale as described below, there may be sales of substantial amounts of our common stock in the public market after the restrictions lapse. This may adversely affect the prevailing market price and our ability to raise equity capital in the future.
Upon completion of this offering, we will have 15,190,527 shares of common stock outstanding (or 15,490,527 shares if the underwriters exercise their overallotment option in full). All of the 2,000,000 shares of common stock (or 2,300,000 shares of common stock if the underwriters exercise their overallotment option in full) to be sold in this offering will be freely tradable without restriction or further registration under the Securities Act, except for shares purchased by any of our “affiliates” as such term is defined in Rule 144 under the Securities Act. The remaining shares of our common stock outstanding are freely tradable, except for shares held by any of our “affiliates” as such term is defined in Rule 144 under the Securities Act. As a result of the contractual 180-day lock-up period described below, 3,127,436 of these shares will be available for sale in the public market only after 180 days from the date of this prospectus (generally subject to volume and other offering limitations).
Rule 144
In general, a person who has beneficially owned restricted shares of our common stock for at least six months would be entitled to sell such securities, provided that (i) such person is not deemed to have been one of our affiliates at the time of, or at any time during the 90 days preceding, the sale and (ii) we are subject to the Exchange Act periodic reporting requirements for at least 90 days before the sale. Persons who have beneficially owned restricted shares of our common stock for at least six months but who are our affiliates at the time of, or any time during the 90 days preceding, the sale, would be subject to additional restrictions, by which such person would be entitled to sell within any three-month period only a number of securities that does not exceed the greater of the following:
| • | 1% of the number of shares of our common stock then outstanding, which will equal approximately 151,905 shares immediately after this offering (or approximately 154,905 shares if the underwriters exercise their overallotment option in full); or |
| • | the average weekly trading volume of our common stock on the Nasdaq Global Market during the four calendar weeks preceding the filing of a notice on Form 144 with respect to the sale; |
provided, in each case, that we are subject to the Exchange Act periodic reporting requirements for at least 90 days before the sale. Such sales both by affiliates and bynon-affiliates must also comply with the manner of sale and notice provisions of Rule 144 to the extent applicable.
Registration Statement on FormS-8
In connection with or as soon as practicable following the completion of this offering, we intend to file a registration statement with the SEC on FormS-8 to register an aggregate of shares of our common stock reserved for future issuance under our equity incentive plans, as described further under “Executive Compensation—Equity-Based Plans.” That registration statement will become effective upon filing and shares of common stock covered by such registration statement will be eligible for sale in the public market immediately after the effective date of such registration statement (unless held by affiliates) subject to thelock-up agreements described below.
141
Table of Contents
Rule 701
In general, under Rule 701 under the Securities Act, an employee, consultant or advisor who purchases shares of our common stock from us in connection with a compensatory stock or option plan or other written agreement is eligible to resell those shares 90 days after the effective date of the registration statement of which this prospectus forms a part in reliance on Rule 144, but without compliance with some of the restrictions, including the holding period restriction, contained in Rule 144.
Lock-up Agreements
We, each of our directors and executive officers and certain other existing security holders and purchasers of shares in the directed share program described elsewhere in this prospectus have agreed, subject to certain de minimis exceptions, not to offer, pledge, sell, contract to sell, sell any option or contract to purchase, purchase any option or contract to sell, grant any option, right or warrant for the sale of, otherwise dispose of or transfer any shares of our common stock or any securities convertible into or exchangeable or exercisable for common stock for a period of 180 days after the date of this prospectus, without the prior written consent of Keefe, Bruyette & Woods, Inc., on behalf of the underwriters. See “Underwriting.” The underwriters do not have any present intention or arrangement to release any shares of our common stock subject tolock-up agreements prior to the expiration of the180-daylock-up period.
142
Table of Contents
MATERIAL UNITED STATES FEDERAL INCOME TAX CONSIDERATIONS FORNON-U.S. HOLDERS
The following is a summary of the material United States federal income tax consequences relevant tonon-U.S. holders, as defined below, of the purchase, ownership and disposition of our common stock. The following summary is based on the provisions of the Internal Revenue Code, the applicable United States federal income tax regulations promulgated or proposed under the Code (the “Treasury Regulations”) and judicial and administrative authority as of the date hereof, all of which are subject to change, possibly with retroactive effect. We have not sought and do not plan to seek any ruling from the U.S. Internal Revenue Service (the “IRS”) with respect to the statements made and the conclusions reached in the following discussion, and we cannot assure you that the IRS or a court will agree with our statements and conclusions. This summary does not consider the consequences related to state, local, gift, estate, or foreign tax or the Medicare tax on certain investment income, nor does it address tax consequences to special classes of investors, including, but not limited to,tax-exempt organizations, insurance companies, banks or other financial institutions, partnerships or other entities classified as partnerships for United States federal income tax purposes, dealers in securities, persons liable for the alternative minimum tax, regulated investment companies, real estate investment trusts, controlled foreign corporations, passive foreign investment companies, United States expatriates or United States expatriated entities, those who are subject to the United States anti-inversion rules, traders in securities that elect to use amark-to-market method of accounting for their securities holdings, persons who have acquired our common stock as compensation or otherwise in connection with the performance of services, or persons that will hold our common stock as a position in a hedging transaction, “straddle,” “conversion transaction,” synthetic security or other integrated investment or risk reduction transaction. Tax consequences may vary depending upon the particular status of an investor. The summary is limited tonon-U.S. holders who will hold our common stock as capital assets (generally, property held for investment) within the meaning of section 1221 of the Internal Revenue Code. Each potentialnon-U.S. investor should consult its own tax advisor as to the United States federal, state, local, foreign and any other tax consequences of the purchase, ownership and disposition of our common stock.
You are a“non-U.S. holder” if you are a beneficial owner of our common stock for United States federal income tax purposes that is:
| (1) | a nonresident alien individual, other than certain former citizens and residents of the United States subject to U.S. tax as expatriates; |
| (2) | a corporation (or other entity that is taxable as a corporation) not created or organized in the United States or under the laws of the United States or of any State (or the District of Columbia); |
| (3) | an estate other than an estate the income of which is includible in gross income for United States federal income tax purposes regardless of its source; or |
| (4) | a trust other than a trust: (A) the administration of which is subject to the primary supervision of a United States court and which has one or more United States persons who have the authority to control all substantial decisions of the trust; or (B) that was in existence on August 20, 1996, was treated as a United States person on the previous day, and elected to continue to be so treated. |
If an entity or arrangement treated as a partnership for United States federal income tax purposes holds our common stock, the tax treatment of a partner in the partnership will generally depend upon the status of the partner and the activities of the partnership. If you are treated as a partner in such an entity or arrangement holding our common stock, you should consult your tax advisor as to the United States federal income tax consequences applicable to you.
Distributions
Distributions of cash or property (other than certain stock distributions) with respect to our common stock will be treated as dividends when paid to the extent of our current and accumulated earnings and profits as of the end
143
Table of Contents
of our taxable year of the distribution, determined for United States federal income tax purposes. To the extent any such distributions exceed both our current and accumulated earnings and profits, such excess amount will be allocated ratably among each share of common stock with respect to which the distribution is paid and will first be treated as atax-free return of capital reducing your adjusted tax basis in our common stock, but not below zero, and thereafter will be treated as gain from the sale or other taxable disposition of such stock, the treatment of which is discussed under “Gain on Disposition of Shares of Common Stock.” Your adjusted tax basis in a share of our common stock is generally your purchase price for such share, reduced (but not below zero) by the amount of such prior tax free returns of capital.
Except as described below, if you are anon-U.S. holder of our common stock, dividends paid to you are subject to withholding of United States federal income tax at a 30% gross rate or at a lower rate if you are eligible for the benefits of an income tax treaty that provides for a lower rate. We may withhold up to 30% of the gross amount of the entire distribution, even if greater than the amount constituting a dividend (as described in the paragraph above), to the extent provided for in the Treasury Regulations. If tax is withheld on the amount of a distribution in excess of the amount constituting a dividend, then a refund of any such excess amounts may be obtained if a refund claim is timely filed with the IRS.
Even if you are eligible for a lower treaty rate, we and other payors will generally be required to withhold at a 30% rate (rather than the lower treaty rate) on dividends paid to you, unless you have furnished to us or our paying agent:
| • | a valid IRS FormW-8BEN,W-8BEN-E or an acceptable substitute form upon which you certify, under penalties of perjury, your status as anon-U.S. person and your entitlement to the lower treaty rate with respect to such payments, or |
| • | if our common stock is held through certain foreign intermediaries or foreign partnerships, other documentary evidence establishing your entitlement to the lower treaty rate in accordance with Treasury Regulations. |
This certification must be provided to us or our paying agent prior to the payment to you of any dividends and must be updated periodically, including upon a change in circumstances that makes any information on such certificate incorrect.
If you are eligible for a reduced rate of U.S. withholding tax under a tax treaty, you may obtain a refund of any amounts withheld in excess of that rate by timely filing a refund claim with the IRS.
If dividends paid to you are “effectively connected” with your conduct of a trade or business within the United States, and, if required by a tax treaty, the dividends are attributable to a permanent establishment (or, in the case of an individual, a fixed base) that you maintain in the United States, we generally are not required to withhold tax from dividends, provided that you have furnished to us or our paying agent a valid IRS FormW-8ECI or an acceptable substitute form upon which you represent, under penalties of perjury, that:
| • | you are anon-U.S. person; and |
| • | the dividends are effectively connected with your conduct of a trade or business within the United States and are includible in your gross income. |
“Effectively connected” dividends are taxed on a net income basis at applicable graduated individual or corporate tax rates in generally the same manner as if thenon-U.S. holder were a U.S. person as defined under the Internal Revenue Code, unless an applicable income tax treaty provides otherwise. If you are a corporatenon-U.S. holder, “effectively connected” dividends that you receive may, under certain circumstances, be subject to an additional “branch profits tax” at a 30% gross rate, or at a lower rate if you are eligible for the benefits of an income tax treaty that provides for a lower rate.
144
Table of Contents
Gain on Disposition of Shares of Common Stock
Subject to the discussions below regarding backup withholding and FATCA, if you are anon-U.S. holder, you generally will not be subject to United States federal income or withholding tax on gain realized on the sale, exchange or other disposition of our common stock unless (i) you are an individual who is present in the United States for 183 or more days in the taxable year of the sale or other disposition and certain other conditions exist, (ii) the gain is “effectively connected” with your conduct of a trade or business in the United States, and the gain is attributable to a permanent establishment (or, in the case of anon-U.S. individual, a fixed base) that you maintain in the United States, if that is required by an applicable income tax treaty as a condition to subjecting you to United States taxation on a net income basis; or (iii) we are or have been a U.S. real property holding corporation, or “USRPHC,” for United States federal income tax purposes at any time during the shorter of the five-year period ending on the date of the disposition or the period that you held shares of our common stock, and certain other conditions are met.
If you are an individual described in (i) above, you will be subject to a 30% tax (or such lower rate as may be specified by an applicable income tax treaty) on the net gain derived from the sale, which may be offset by certain United States source capital losses, if any, recognized in the taxable year of the disposition of our common stock. If you are anon-U.S. holder described in (ii) above, gain recognized on the sale will generally be subject to United States federal income tax at graduated United States federal income tax rates on a net income basis and in generally the same manner as if thenon-U.S. holder were a U.S. person as defined in the Internal Revenue Code, unless an applicable income tax treaty provides otherwise. Additionally, anon-U.S. holder that is a corporation may be subject to the branch profits tax equal to 30% of its effectively connected earnings and profits, subject to certain adjustments, or at such lower rate as may be specified by an applicable income tax treaty. We believe, although we have not made a determination, that we are not currently and will not become a USRPHC.
Information Reporting and Backup Withholding
Payment of dividends, and the tax withheld on those payments, are subject to information reporting requirements. These information reporting requirements apply regardless of whether withholding was reduced or eliminated by an applicable income tax treaty. Under the provisions of an applicable income tax treaty or agreement, copies of the information returns reporting such dividends and withholding may also be made available to the tax authorities in the country in which thenon-U.S. holder resides. U.S. backup withholding will generally apply on payment of dividends tonon-U.S. holders unless suchnon-U.S. holders furnish to the payor a FormW-8BEN or FormW-8BEN-E (or other applicable form), or otherwise establish an exemption and the payor does not have actual knowledge or reason to know that the holder is a U.S. person, as defined under the Internal Revenue Code, that is not an exempt recipient or that the conditions of any other exemption are not, in fact, satisfied.
Payment of the proceeds of a sale or other disposition of our common stock within the United States or conducted through certain U.S.-related entities and financial intermediaries is subject to information reporting and, depending on the circumstances, backup withholding, unless thenon-U.S. holder, or beneficial owner thereof, as applicable, certifies that it is anon-U.S. holder on FormW-8BEN,W-8BEN-E (or other applicable form), or otherwise establishes an exemption and the payor does not have actual knowledge or reason to know the holder is a U.S. person, as defined under the Internal Revenue Code, that is not an exempt recipient or that the conditions of any other exemption are not, in fact, satisfied.
Backup withholding is not an additional tax. Any amount withheld under the backup withholding rules from a payment to anon-U.S. holder may be allowed as a refund or a credit against thenon-U.S. holder’s United States federal income tax liability, provided that thenon-U.S. holder timely provides the required information to the IRS. Moreover, certain penalties may be imposed by the IRS on anon-U.S. holder who is required to furnish information but does not do so in the proper manner.Non-U.S. holders should consult their tax advisors
145
Table of Contents
regarding the application of backup withholding in their particular circumstances and the availability of and procedure for obtaining an exemption from backup withholding under current Treasury Regulations.
FATCA Withholding
The Foreign Account Tax Compliance Act, or FATCA, imposes a 30% withholding tax on certain types of payments made to “foreign financial institutions,” or “FFIs,” and certain othernon-U.S. entities unless certain due diligence, reporting, withholding, and certification requirements are satisfied.
As a general matter, FATCA imposes a 30% withholding tax on dividends on, and, from and after January 1, 2019, gross proceeds from the sale or other disposition of, our common stock if paid to a foreign entity unless (i) the foreign entity is an FFI that undertakes certain due diligence, reporting, withholding, and certification obligations, or in the case of an FFI that is a resident in a jurisdiction that has entered into an intergovernmental agreement to implement FATCA, the entity complies with the diligence and reporting requirements of such an agreement; (ii) the foreign entity is not an FFI and either certifies that it does not have any “substantial” U.S. owners or furnishes identifying information regarding each substantial U.S. owner, or (iii) the foreign entity qualifies for an exemption from these rules. In certain cases, a “substantial” United States owner can mean an owner of any interest in the foreign entity.
If withholding is required under FATCA on a payment related to our common stock, investors that otherwise would be exempt from withholding (or that otherwise would be entitled to a reduced rate of withholding) generally will be required to seek a refund or credit from the IRS to obtain the benefit of such exemption or reduction (provided that such benefit is available).
Non-U.S. holders are encouraged to consult with their tax advisors regarding the possible implications of FATCA on their investment in our common stock.
This summary is for general information only and is not intended to constitute a complete description of all U.S. federal income tax consequences fornon-U.S. holders relating to the purchase, ownership, and disposition of shares of our common stock. If you are considering the purchase of shares of our common stock, you should consult with your tax advisor concerning the particular U.S. federal income tax consequences to you of the purchase, ownership and disposition of shares of our common stock, as well as the consequences to you arising under U.S. tax laws other than the federal income tax law discussed in this summary or under the laws of any other applicable taxing jurisdiction in light of your particular circumstances.
146
Table of Contents
Keefe, Bruyette & Woods, Inc. is acting as representative of each of the underwriters named below. Subject to the terms and conditions set forth in an underwriting agreement between us and the underwriters, we have agreed to sell to the underwriters, and each of the underwriters has agreed, severally and not jointly, to purchase from us, the number of shares of common stock set forth opposite its name below.
Underwriter | Number of Shares | |||
Keefe, Bruyette & Woods, Inc. | 1,600,000 | |||
D.A. Davidson & Co. | 400,000 | |||
|
| |||
Total | 2,000,000 | |||
|
| |||
The underwriters are committed to purchase and pay for all of the shares of common stock being offered by this prospectus, if any such shares of common stock are purchased. However, the underwriters are not obligated to purchase or pay for the shares of common stock covered by the underwriters’ over-allotment option described in this prospectus, unless and until the underwriters exercise such option. If an underwriter defaults, the underwriting agreement provides that the purchase commitments of thenon-defaulting underwriters may be increased or the underwriting agreement may be terminated, in each case, on the terms set forth therein.
The underwriting agreement provides that the underwriters’ obligations to purchase the shares of common stock depend on the satisfaction of the conditions contained in the underwriting agreement, including (among other things):
| • | the representations and warranties made by us to the underwriters are true; |
| • | there is no material adverse change in the financial markets; and |
| • | we deliver customary closing documents and legal opinions to the underwriters. |
The shares of common stock are being offered by the underwriters, subject to prior sale, when, as and if issued to and accepted by the underwriters, subject to approval of certain legal matters by counsel for the underwriters and other conditions. The underwriters reserve the right to withdraw, cancel, or modify this offering and to reject orders in whole or in part.
We have agreed to indemnify the underwriters against certain liabilities, including liabilities under the Securities Act, or to contribute to payments the underwriters may be required to make in respect of those liabilities.
Commissions and Expenses
The representative has advised us that the underwriters propose initially to offer the shares to the public at the public offering price set forth on the cover page of this prospectus and to dealers at that price less a concession not in excess of $0.462 per share. After the initial offering, the public offering price, concession or any other term of the offering may be changed.
147
Table of Contents
The following table shows the public offering price, underwriting discounts and commissions and proceeds before expenses to us. The information in the table below assumes either no exercise or full exercise by the underwriters of their over-allotment option to purchase additional shares.
| Per Share | Without Option | With Option | ||||||||||
Public offering price | $ | 11.0000 | $ | 22,000,000 | $ | 25,300,000 | ||||||
Underwriting discounts and commissions(1) | $ | 0.7535 | $ | 1,507,000 | $ | 1,738,000 | ||||||
Proceeds, before expenses, to us | $ | 10.2465 | $ | 20,493,000 | $ | 23,562,000 | ||||||
| (1) | The $0.7535 discount and commission shown in the table represents a weighted average based on a $0.44 discount and commission for the 100,000 shares to be sold under the directed share program and a $0.77 discount and commission for the remaining 1,900,000 shares to be sold in this offering. |
The expenses of the offering, not including the underwriting discounts and commissions, are estimated at $925,000 payable by us. We have also agreed to reimburse the underwriters for up to $25,000 of certain fees and expenses incurred by them in connection with this offering and this amount is included in the estimated total expenses.
Over-allotment Option to Purchase Additional Shares
We have granted an option to the underwriters, exercisable for 30 days after the date of this prospectus, to purchase up to 300,000 additional shares at the public offering price, less the underwriting discounts and commissions set forth on the cover page of this prospectus. The underwriters may exercise this option only to cover over-allotments, if any, made in connection with the sale of the shares of our common stock offered by this prospectus. If the underwriters exercise this over-allotment option, each will be obligated, subject to conditions contained in the underwriting agreement, to purchase a number of additional shares proportionate to that underwriter’s initial amount reflected in the above table.
Directed Share Program
At our request, the underwriters have reserved for sale, at the public offering price, 100,000 shares of our common stock being offered for sale by this prospectus to our directors, officers and employees through a directed share program. We will offer these shares to the extent permitted under applicable regulations in the United States and applicable jurisdictions. If these persons purchase shares pursuant to the directed share program it will reduce the number of shares available for sale to the general public. Any shares reserved under the directed share program that are not so purchased will be offered by the underwriters to the general public on the same terms as the other shares offered by this prospectus. Shares purchased in the directed share program by our directors, officers and employees will be subject to the180-daylock-up restrictions described below under “—No Sales of Similar Securities.” The shares that are sold in the directed share program will be subject to an underwriting discount in the amount of 4% of the gross sales price of such shares instead of the underwriting discount of 7% which will apply to sales of all other shares of our common stock being offered for sale by this prospectus.
No Sales of Similar Securities
We, our executive officers and directors, certain other existing security holders and purchasers of shares in the directed share program, subject to certain de minimis exceptions, have agreed not to sell or transfer any common stock or securities convertible into, exchangeable for, exercisable for, or repayable with common stock, for 180 days after the date of this prospectus without first obtaining the written consent of Keefe, Bruyette & Woods, Inc. Specifically, we and these other persons have agreed, with certain limited exceptions, not to directly or indirectly
| • | offer, pledge, sell or contract to sell any common stock, |
| • | sell any option or contract to purchase any common stock, |
| • | purchase any option or contract to sell any common stock, |
148
Table of Contents
| • | grant any option, right or warrant for the sale of any common stock, |
| • | lend or otherwise dispose of or transfer any common stock, |
| • | request or demand that we file a registration statement related to the common stock, or |
| • | enter into any swap or other agreement that transfers, in whole or in part, the economic consequence of ownership of any common stock whether any such swap or transaction is to be settled by delivery of shares or other securities, in cash or otherwise. |
Thislock-up provision applies to common stock and to securities convertible into or exchangeable or exercisable for or repayable with common stock. It also applies to common stock owned now or acquired later by the person executing the agreement or for which the person executing the agreement later acquires the power of disposition.
Listing on the Nasdaq Global Market
We have received approval to list our common stock on the Nasdaq Global Market under the symbol “OPBK.”
The initial public offering price will be determined through negotiations among us and the representative. In addition to prevailing market conditions, the factors to be considered in determining the initial public offering price are
| • | the valuation multiples of publicly traded companies that the representative believes to be comparable to us, |
| • | our financial information, |
| • | the history of, and the prospects for, our company and the industry in which we compete, |
| • | an assessment of our management, its past and present operations, and the prospects for, and timing of, our future revenues, |
| • | the present state of our development, and |
| • | the above factors in relation to market values and various valuation measures of other companies engaged in activities similar to ours. |
Prior to this offering, our common stock was quoted on the OTC Market Group’s OTCQB Market. The quoting of our shares will be discontinued concurrently with the listing of our shares on the Nasdaq Global Market.
Stabilization
In connection with this offering, the underwriters may engage in stabilizing transactions, over-allotment transactions, syndicate covering transactions and penalty bids in accordance with Regulation M promulgated under the Exchange Act.
| • | Stabilizing transactions permit bids to purchase shares of common stock so long as the stabilizing bids do not exceed a specified maximum. |
| • | Over-allotment transactions involve sales by the underwriter of shares of common stock in excess of the number of shares the underwriter is obligated to purchase. This creates a syndicate short position that may be either a covered short position or a naked short position. In a covered short position, the number of shares of common stock over-allotted by the underwriter is not greater than the number of shares that it may purchase in the over-allotment option. In a naked short position, the number of shares involved is greater than the number of shares in the over-allotment option. The underwriters may close out any short position by exercising its over-allotment option and/or purchasing shares in the open market. |
| • | Syndicate covering transactions involve purchases of common stock in the open market after the distribution has been completed to cover syndicate short positions. In determining the source of shares to close out the |
149
Table of Contents
short position, the underwriter will consider, among other things, the price of shares available for purchase in the open market as compared with the price at which it may purchase shares through exercise of the over-allotment option. If the underwriter sells more shares than could be covered by exercise of the over-allotment option and therefore has a naked short position, the position can be closed out only by buying shares in the open market. A naked short position is more likely to be created if the underwriter is concerned that after pricing there could be downward pressure on the price of the shares in the open market that could adversely affect investors who purchase in the offering. |
| • | Penalty bids permit the representative to reclaim a selling concession from a syndicate member when the common stock originally sold by that syndicate member is purchased in stabilizing or syndicate covering transactions to cover syndicate short positions. |
These stabilizing transactions, syndicate covering transactions and penalty bids may have the effect of raising or maintaining the market price of our common stock or preventing or retarding a decline in the market price of our common stock. As a result, the price of our common stock in the open market may be higher than it would otherwise be in the absence of these transactions. Neither we nor the underwriters make any representation or prediction as to the effect that the transactions described above may have on the price of our common stock. These transactions may be effected in the Nasdaq Global Market or otherwise and, if commenced, may be discontinued at any time.
Passive Market Making
In addition, in connection with this offering the underwriters and selected dealers, if any, who are qualified market makers on the Nasdaq Global Market may engage in passive market making transactions in our common stock on the Nasdaq Global Market in accordance with Rule 103 of Regulation M promulgated under the Exchange Act during a period before the commencement of offers or sales of common stock and extending through the completion of the distribution of this offering. In general, a passive market maker must display its bid at a price not in excess of the highest independent bid for the security. If all independent bids are lowered below the bid of the passive market maker, however, the bid must then be lowered when purchase limits are exceeded. Net purchases by a passive market maker on each day are limited to a specified percentage of the passive market maker’s average daily trading volume in the common stock during a specified period and must be discontinued when that limit is reached. Passive market making may cause the price of our common stock to be higher than the price that otherwise would exist in the open market in the absence of those transactions. The underwriters are not required to engage in passive market making and may end passive market making activities at any time.
Electronic Distribution
In connection with this offering, certain of the underwriters or securities dealers may distribute prospectuses by electronic means, such ase-mail.
Other Relationships with the Underwriters
Some of the underwriters and their affiliates have engaged in, and may in the future engage in, investment banking and other commercial dealings in the ordinary course of business with us or our affiliates. They have received, or may in the future receive, customary fees and commissions for these transactions. In addition, upon completion of this offering, we have granted Keefe, Bruyette & Woods, Inc. a right of first refusal to act as our exclusive structuring agent, exclusive financial advisor, lead arranger, book-running lead managing underwriter, or exclusive initial purchaser or placement agent, as the case may be, or in any other similar capacity, in connection with certain transactions, including offerings of equity or debt securities. This right of first refusal extends for 12 months from the commencement of sales of our common stock in this offering. The terms of any such future engagement of Keefe, Bruyette & Woods, Inc. will be set forth in one or more separate agreements.
150
Table of Contents
In addition, in the ordinary course of their business activities, the underwriters and their affiliates may make or hold a broad array of investments and actively trade debt and equity securities (or related derivative securities) and financial instruments (including bank loans) for their own account and for the accounts of their customers. Such investments and securities activities may involve securities and/or instruments of ours or our affiliates. The underwriters and their affiliates may also make investment recommendations and/or publish or express independent research views in respect of such securities or financial instruments and may hold, or recommend to clients that they acquire, long and/or short positions in such securities and instruments.
151
Table of Contents
The validity of the shares of common stock being offered by this prospectus will be passed upon for us by Buchalter, A Professional Corporation, Los Angeles, California. The underwriters are represented by Sheppard, Mullin, Richter & Hampton LLP, Costa Mesa, California.
The consolidated financial statements as of December 31, 2017 and 2016 and for each of the three years in the period ended December 31, 2017 included in this prospectus have been so included in reliance on the report of Crowe Horwath LLP, independent registered public accounting firm, given on the authority of said firm as experts in auditing and accounting.
WHERE YOU CAN FIND MORE INFORMATION
We have filed with the SEC a registration statement on FormS-1 under the Securities Act with respect to our common stock offered hereby. This prospectus, which constitutes part of the registration statement, does not contain all of the information set forth in the registration statement or the exhibits or schedules filed therewith. Some items are omitted in accordance with the rules and regulations of the SEC. For further information about us and our common stock that we propose to sell in this offering, we refer you to the registration statement and the exhibits and schedules filed as a part of the registration statement. Statements or summaries in this prospectus as to the contents of any contract or other document referred to in this prospectus are not necessarily complete and, where that contract or document is filed as an exhibit to the registration statement, each statement or summary is qualified in all respects by reference to the exhibit to which the reference relates. You may read and copy the registration statement, including the exhibits and schedules to the registration statement, at the SEC’s Public Reference Room at 100 F Street, N.E., Room 1580, Washington, D.C. 20549. Please call the SEC at1-800-SEC-0330 for further information on the operation of the Public Reference Room. Our filings with the SEC, including the registration statement, are also available to you for free on the SEC’s internet website at www.sec.gov.
Following the offering, we will become subject to the informational and reporting requirements of the Exchange Act and, in accordance with those requirements, will file reports and proxy and information statements and other information with the SEC. You will be able to inspect and copy these reports and proxy and information statements and other information at the addresses set forth above. We intend to furnish to our shareholders our annual reports containing our audited consolidated financial statements certified by an independent public accounting firm.
We also maintain an internet site at www.myopenbank.com. Information on, or accessible through, our website is not part of this prospectus.
152
Table of Contents
OP BANCORP
INDEX TO CONSOLIDATED FINANCIAL STATEMENTS
| Page | ||||
For the years ended December 31, 2017 and 2016 | ||||
| F-2 | ||||
| F-3 | ||||
| F-4 | ||||
| F-5 | ||||
Consolidated Statements of Cash Flows Years ended December 31, 2017, 2016, and 2015 | F-6 | |||
| F-7 | ||||
F-1
Table of Contents
Report of Independent Registered Public Accounting Firm
Shareholders and the Board of Directors of OP Bancorp
Los Angeles, California
Opinion on the Financial Statements
We have audited the accompanying consolidated balance sheets of OP Bancorp (the “Company”) as of December 31, 2017 and 2016, the related consolidated statements of income and comprehensive income, shareholders’ equity, and cash flows for each of the three years in the period ended December 31, 2017 and the related notes (collectively referred to as the “financial statements”). In our opinion, the financial statements present fairly, in all material respects, the financial position of the Company as of December 31, 2017 and 2016, and the results of its operations and its cash flows for each of the three years in the period ended December 31, 2017, in conformity with accounting principles generally accepted in the United States of America.
Basis for Opinion
These financial statements are the responsibility of the Company’s management. Our responsibility is to express an opinion on the Company’s financial statements based on our audits. We are a public accounting firm registered with the Public Company Accounting Oversight Board (United States) (“PCAOB”) and are required to be independent with respect to the Company in accordance with the U.S. federal securities laws and the applicable rules and regulations of the Securities and Exchange Commission and the PCAOB.
We conducted our audits in accordance with the standards of the PCAOB. Those standards require that we plan and perform the audit to obtain reasonable assurance about whether the financial statements are free of material misstatement, whether due to error or fraud. The Company is not required to have, nor were we engaged to perform, an audit of its internal control over financial reporting in accordance with the standards of the PCAOB. As part of our audits we are required to obtain an understanding of internal control over financial reporting but not for the purpose of expressing an opinion on the effectiveness of the Company’s internal control over financial reporting. Accordingly, we express no such opinion in accordance with the standards of the PCAOB.
Our audits included performing procedures to assess the risks of material misstatement of the financial statements, whether due to error or fraud, and performing procedures that respond to those risks. Such procedures included examining, on a test basis, evidence regarding the amounts and disclosures in the financial statements. Our audits also included evaluating the accounting principles used and significant estimates made by management, as well as evaluating the overall presentation of the financial statements. We believe that our audits provide a reasonable basis for our opinion.
/s/ Crowe Horwath LLP
We have served as the Company’s auditor since 2010.
Los Angeles, California
March 5, 2018
F-2
Table of Contents
OP BANCORP
December 31, 2017 and 2016
| December 31, 2017 | December 31, 2016 | |||||||
ASSETS | ||||||||
Cash and cash equivalents | $ | 63,249,952 | $ | 20,126,028 | ||||
Securities available for sale, at fair value | 41,471,711 | 35,463,451 | ||||||
Loans held for sale | 15,739,305 | 1,646,250 | ||||||
Loans receivable, net of allowance of $9,139,488 at December 31, 2017 and $7,909,682 at December 31, 2016 | 738,884,413 | 666,317,092 | ||||||
Premises and equipment, net | 4,480,792 | 5,067,095 | ||||||
Accrued interest receivable | 2,463,486 | 2,001,488 | ||||||
Federal Home Loan Bank and Pacific Coast Bankers Bank stock, at cost | 4,286,500 | 3,437,600 | ||||||
Servicing assets | 6,771,097 | 6,782,555 | ||||||
Company owned life insurance | 11,089,718 | 10,769,627 | ||||||
Deferred tax assets | 3,383,365 | 3,276,063 | ||||||
Other assets | 9,178,491 | 6,363,171 | ||||||
|
|
|
| |||||
Total assets | $ | 900,998,830 | $ | 761,250,420 | ||||
|
|
|
| |||||
LIABILITIES AND SHAREHOLDERS’ EQUITY | ||||||||
Liabilities | ||||||||
Deposits: | ||||||||
Noninterest bearing | $ | 289,409,876 | $ | 247,376,244 | ||||
Interest bearing: | ||||||||
Savings | 3,838,353 | 3,206,538 | ||||||
Money market and others | 247,324,292 | 229,566,160 | ||||||
Time deposits greater than $250,000 | 108,952,059 | 79,056,290 | ||||||
Other time deposits | 123,781,434 | 102,578,668 | ||||||
|
|
|
| |||||
Total deposits | 773,306,014 | 661,783,900 | ||||||
Federal Home Loan Bank advances | 25,000,000 | 10,000,000 | ||||||
Accrued interest payable | 423,239 | 321,753 | ||||||
Other liabilities | 10,789,627 | 7,860,980 | ||||||
|
|
|
| |||||
Total liabilities | 809,518,880 | 679,966,633 | ||||||
Shareholders’ equity | ||||||||
Preferred stock—no par value; 10,000,000 shares authorized; no shares issued or outstanding at December 31, 2017 and 2016 | — | — | ||||||
Common stock—no par value; 50,000,000 shares authorized; 13,190,527 and 12,896,548 shares issued and outstanding at December 31, 2017 and 2016, respectively | 67,925,860 | 67,499,310 | ||||||
Additional paid-in capital | 5,279,991 | 4,611,973 | ||||||
Retained earnings | 18,623,952 | 9,387,470 | ||||||
Accumulated other comprehensive loss | (349,853 | ) | (214,966 | ) | ||||
|
|
|
| |||||
Total shareholders’ equity | 91,479,950 | 81,283,787 | ||||||
|
|
|
| |||||
Total liabilities and shareholders’ equity | $ | 900,998,830 | $ | 761,250,420 | ||||
|
|
|
| |||||
See accompanying notes to consolidated financial statements
F-3
Table of Contents
OP BANCORP
CONSOLIDATED STATEMENTS OF INCOME AND COMPREHENSIVE INCOME
Years ended December 31, 2017, 2016 and 2015
| Years Ended December 31, | ||||||||||||
| 2017 | 2016 | 2015 | ||||||||||
Interest income | ||||||||||||
Interest and fees on loans | $ | 39,111,439 | $ | 30,529,892 | $ | 24,328,811 | ||||||
Interest on investment securities | 675,948 | 664,121 | 480,305 | |||||||||
Other interest income | 495,153 | 507,042 | 383,042 | |||||||||
|
|
|
|
|
| |||||||
Total interest income | 40,282,540 | 31,701,055 | 25,192,158 | |||||||||
Interest expense | ||||||||||||
Interest on deposits | 4,469,689 | 3,286,147 | 2,605,140 | |||||||||
Interest on borrowed funds | 103,067 | 85,290 | 83,974 | |||||||||
|
|
|
|
|
| |||||||
Total interest expense | 4,572,756 | 3,371,437 | 2,689,114 | |||||||||
|
|
|
|
|
| |||||||
Net interest income | 35,709,784 | 28,329,618 | 22,503,044 | |||||||||
Provision for loan losses | 1,310,932 | 1,682,301 | 552,843 | |||||||||
|
|
|
|
|
| |||||||
Net interest income after provision for loan losses | 34,398,852 | 26,647,317 | 21,950,201 | |||||||||
Noninterest income | ||||||||||||
Service charges on deposits | 1,656,252 | 1,274,726 | 1,277,879 | |||||||||
Loan servicing fees, net of amortization | 1,127,017 | 1,313,036 | 1,130,650 | |||||||||
Gain on sale of loans | 4,938,760 | 5,507,238 | 4,669,042 | |||||||||
Other income | 1,264,333 | 911,624 | 900,417 | |||||||||
|
|
|
|
|
| |||||||
Total noninterest income | 8,986,362 | 9,006,624 | 7,977,988 | |||||||||
Noninterest expense | ||||||||||||
Salaries and employee benefits | 16,473,500 | 14,555,542 | 12,252,708 | |||||||||
Occupancy and equipment | 3,918,219 | 3,615,843 | 3,162,047 | |||||||||
Data processing and communication | 1,322,955 | 1,086,764 | 783,657 | |||||||||
Professional fees | 588,850 | 683,531 | 412,859 | |||||||||
FDIC insurance and regulatory assessments | 376,886 | 368,557 | 306,769 | |||||||||
Promotion and advertising | 630,683 | 556,805 | 532,482 | |||||||||
Directors’ fees | 796,206 | 758,423 | 783,602 | |||||||||
Foundation donation and other contributions | 953,900 | 745,300 | 601,577 | |||||||||
Other expenses | 1,195,544 | 963,350 | 959,270 | |||||||||
|
|
|
|
|
| |||||||
Total noninterest expense | 26,256,743 | 23,334,115 | 19,794,971 | |||||||||
|
|
|
|
|
| |||||||
Income before income taxes | 17,128,471 | 12,319,826 | 10,133,218 | |||||||||
Income tax expense | 7,891,989 | 4,894,455 | 4,169,873 | |||||||||
|
|
|
|
|
| |||||||
Net income | $ | 9,236,482 | $ | 7,425,371 | $ | 5,963,345 | ||||||
|
|
|
|
|
| |||||||
Earnings per share—Basic | $ | 0.68 | $ | 0.55 | $ | 0.44 | ||||||
Earnings per share—Diluted | $ | 0.66 | $ | 0.53 | $ | 0.43 | ||||||
Other comprehensive income/(loss): | ||||||||||||
Change in unrealized gain/(loss) on securities available for sale, net of tax effects of ($103,553), $11,932, and ($100,453) in 2017, 2016 and 2015, respectively | (134,887 | ) | 17,065 | (143,663 | ) | |||||||
|
|
|
|
|
| |||||||
Total other comprehensive income/(loss) | (134,887 | ) | 17,065 | (143,663 | ) | |||||||
|
|
|
|
|
| |||||||
Comprehensive income | $ | 9,101,595 | $ | 7,442,436 | $ | 5,819,682 | ||||||
|
|
|
|
|
| |||||||
See accompanying notes to consolidated financial statements
F-4
Table of Contents
OP BANCORP
CONSOLIDATED STATEMENTS OF CHANGES IN SHAREHOLDERS’ EQUITY
Years ended December 31, 2017, 2016 and 2015
| Common Stock | Additional Paid-in Capital | Retained Earnings / (Accumulated Deficit) | Accumulated Other Comprehensive Income (Loss) | Total Shareholders’ Equity | ||||||||||||||||||||
| Shares Outstanding | Amount | |||||||||||||||||||||||
Balance at January 1, 2015 | 12,411,089 | $ | 66,993,270 | $ | 2,538,412 | $ | (4,001,246 | ) | $ | (88,368 | ) | $ | 65,442,068 | |||||||||||
Net income | — | — | — | 5,963,345 | — | 5,963,345 | ||||||||||||||||||
Stock issued under stock-based compensation plans | 271,421 | 349,090 | — | — | — | 349,090 | ||||||||||||||||||
Stock-based compensation | — | — | 868,444 | — | — | 868,444 | ||||||||||||||||||
Change in unrealized loss on securities available for sale net of reclassifications and tax effects | — | — | — | — | (143,663 | ) | (143,663 | ) | ||||||||||||||||
|
|
|
|
|
|
|
|
|
|
|
| |||||||||||||
Balance at December 31, 2015 | 12,682,510 | $ | 67,342,360 | $ | 3,406,856 | $ | 1,962,099 | $ | (232,031 | ) | $ | 72,479,284 | ||||||||||||
Net income | — | — | — | 7,425,371 | — | 7,425,371 | ||||||||||||||||||
Stock issued under stock-based compensation plans | 214,038 | 156,950 | — | — | — | 156,950 | ||||||||||||||||||
Stock-based compensation | — | — | 1,205,117 | — | — | 1,205,117 | ||||||||||||||||||
Change in unrealized gain on securities available for sale net of reclassifications and tax effects | — | — | — | — | 17,065 | 17,065 | ||||||||||||||||||
|
|
|
|
|
|
|
|
|
|
|
| |||||||||||||
Balance at December 31, 2016 | 12,896,548 | $ | 67,499,310 | $ | 4,611,973 | $ | 9,387,470 | $ | (214,966 | ) | $ | 81,283,787 | ||||||||||||
Net income | — | — | — | 9,236,482 | — | 9,236,482 | ||||||||||||||||||
Stock issued under stock-based compensation plans | 293,979 | 426,550 | — | — | — | 426,550 | ||||||||||||||||||
Stock-based compensation | — | — | 668,018 | — | — | 668,018 | ||||||||||||||||||
Change in unrealized loss on securities available for sale net of reclassifications and tax effects | — | — | — | — | (134,887 | ) | (134,887 | ) | ||||||||||||||||
|
|
|
|
|
|
|
|
|
|
|
| |||||||||||||
Balance at December 31, 2017 | 13,190,527 | $ | 67,925,860 | $ | 5,279,991 | $ | 18,623,952 | $ | (349,853 | ) | $ | 91,479,950 | ||||||||||||
|
|
|
|
|
|
|
|
|
|
|
| |||||||||||||
See accompanying notes to consolidated financial statements
F-5
Table of Contents
OP BANCORP
CONSOLIDATED STATEMENTS OF CASH FLOWS
Years ended December 31, 2017, 2016 and 2015
| 2017 | 2016 | 2015 | ||||||||||
Cash flows from operating activities | ||||||||||||
Net income | $ | 9,236,482 | $ | 7,425,371 | $ | 5,963,345 | ||||||
Adjustments to reconcile net income to net cash and cash equivalents provided by operating activities: | ||||||||||||
Provision for loan losses | 1,310,932 | 1,682,301 | 552,843 | |||||||||
Depreciation and amortization of premises and equipment | 1,007,736 | 1,084,071 | 940,404 | |||||||||
Amortization of net premiums on securities | 282,969 | 385,410 | 268,598 | |||||||||
Stock-based compensation | 668,018 | 1,205,117 | 868,444 | |||||||||
Gain on sales of loans | (4,938,760 | ) | (5,507,238 | ) | (4,669,042 | ) | ||||||
Gain on called securities | — | — | (1,383 | ) | ||||||||
Earnings on company owned life insurance | (320,091 | ) | (334,666 | ) | (353,082 | ) | ||||||
Origination of loans held for sale | (83,423,426 | ) | (84,065,452 | ) | (68,291,494 | ) | ||||||
Proceeds from sales of loans held for sale | 72,345,672 | 90,860,166 | 70,944,759 | |||||||||
Amortization of servicing assets | 1,934,917 | 1,413,698 | 1,267,603 | |||||||||
Net change in: | ||||||||||||
Accrued interest receivable | (461,998 | ) | (439,675 | ) | (386,967 | ) | ||||||
Other assets | (2,819,069 | ) | (6,159,670 | ) | 926,048 | |||||||
Accrued interest payable | 101,486 | (25,383 | ) | 214,968 | ||||||||
Other liabilities | 2,928,647 | 3,058,493 | 703,632 | |||||||||
|
|
|
|
|
| |||||||
Net cash from operating activities | (2,146,485 | ) | 10,582,543 | 8,948,676 | ||||||||
Cash flows from investing activities | ||||||||||||
Net change in loans receivable | (73,878,253 | ) | (167,103,293 | ) | (93,676,619 | ) | ||||||
Proceeds from calls of securities held to maturity | — | — | 3,000,000 | |||||||||
Proceeds from calls of securities available for sale | 6,168,924 | 8,069,010 | 5,580,479 | |||||||||
Purchase of securities available for sale | (12,698,593 | ) | — | (30,117,837 | ) | |||||||
Purchase of premises and equipment, net | (421,433 | ) | (259,033 | ) | (1,879,464 | ) | ||||||
Purchase of Federal Home Loan Bank stock | (848,900 | ) | (782,300 | ) | (755,200 | ) | ||||||
|
|
|
|
|
| |||||||
Net cash from investing activities | (81,678,255 | ) | (160,075,616 | ) | (117,848,641 | ) | ||||||
Cash flows from financing activities | ||||||||||||
Net change in deposits | 111,522,114 | 142,062,833 | 91,202,151 | |||||||||
Cash received from stock option exercises | 426,550 | 156,950 | 349,090 | |||||||||
Borrowings/(Repayment) of Federal Home Loan Bank advances | 15,000,000 | (10,000,000 | ) | (10,000,000 | ) | |||||||
|
|
|
|
|
| |||||||
Net cash from financing activities | 126,948,664 | 132,219,783 | 81,551,241 | |||||||||
|
|
|
|
|
| |||||||
Net change in cash and cash equivalents | 43,123,924 | (17,273,290 | ) | (27,348,724 | ) | |||||||
Cash and cash equivalents at beginning of period | 20,126,028 | 37,399,318 | 64,748,042 | |||||||||
|
|
|
|
|
| |||||||
Cash and cash equivalents at end of period | $ | 63,249,952 | $ | 20,126,028 | $ | 37,399,318 | ||||||
|
|
|
|
|
| |||||||
Supplemental cash flow information | ||||||||||||
Cash paid during the year for: | ||||||||||||
Income taxes | $ | 7,741,894 | $ | 5,432,000 | $ | 2,695,000 | ||||||
Interest | 4,471,270 | 3,396,820 | 2,474,146 | |||||||||
See accompanying notes to consolidated financial statements
F-6
Table of Contents
OP BANCORP
NOTES TO CONSOLIDATED FINANCIAL STATEMENTS
December 31, 2017 and 2016
NOTE 1—BUSINESS DESCRIPTION
OP Bancorp is a California corporation whose common stock is quoted on the OTCQB under the ticker symbol, “OPBK.” OP Bancorp was formed to acquire 100% of the voting equity of Open Bank (the “Bank”) and commenced operation as a bank holding company on June 1, 2016. This transaction was treated as an internal reorganization as all shareholders of the Bank became shareholders of OP Bancorp. OP Bancorp has no operations other than ownership of the Bank. The Bank is a California state-chartered and FDIC-insured financial institution, which began its operations on June 10, 2005. Headquartered in downtown Los Angeles, California, OP Bancorp operates primarily in the traditional banking business arena that includes accepting deposits and making loans and investments. OP Bancorp’s primary deposit products are demand and time deposits, and the primary lending products are commercial business loans to small to medium sized businesses. OP Bancorp is operating with seven full service branches. There are no significant concentrations of loans to any one industry or customer. However, OP Bancorp’s customers’ ability to repay their loans is dependent on the real estate and general economic conditions in OP Bancorp’s market area.
NOTE 2—SUMMARY OF SIGNIFICANT ACCOUNTING POLICIES
Basis of Presentation: The consolidated financial statements include OP Bancorp and its wholly owned subsidiary, the Bank, together referred to as the “Company.” Intercompany transactions and balances are eliminated in consolidation. The consolidated financial statements of the Company have been prepared in conformity with accounting principles generally accepted in the United States of America (“GAAP”). Certain reclassifications have been made to the prior year’s financial statements to conform to the current year’s presentation.
Use of Estimates: To prepare financial statements in conformity with GAAP, management makes estimates and assumptions based on available information. These estimates and assumptions affect the amounts reported in the financial statements and the disclosures provided, and actual results could differ.
Concentration of Risk: Most of the Company’s customers are located within Los Angeles County and the surrounding area. The concentration of loans originated in this area may subject the Company to the risk of adverse impacts of economic, regulatory or other developments that could occur in Southern California.
The Company has significant concentration in commercial real estate loans. The Company obtains what it believes to be sufficient collateral to secure potential losses. The extent and value of the collateral obtained varies based upon the details underlying each loan agreement.
Cash Flows: Cash and cash equivalents include cash, deposits with other financial institutions with original maturities less than 90 days, and federal funds sold. Net cash flows are reported for customer loan and deposit transactions.
Securities: Securities are classified as held to maturity and carried at amortized cost when management has the positive intent and ability to hold them to maturity. Securities are classified as available for sale when they might be sold before maturity. Securities available for sale are carried at fair value, with unrealized holding gains and losses reported in other comprehensive income, net of tax.
F-7
Table of Contents
OP BANCORP
NOTES TO CONSOLIDATED FINANCIAL STATEMENTS
December 31, 2017 and 2016
NOTE 2—SUMMARY OF SIGNIFICANT ACCOUNTING POLICIES (Continued)
Interest income includes amortization of purchase premium or discount. Premiums and discounts on securities are amortized on the level-yield method without anticipating prepayments. Gains and losses on sales are recorded on the trade date and determined using the specific identification method.
Management evaluates securities for other-than-temporary impairment (“OTTI”) on at least a quarterly basis, and more frequently when economic or market conditions warrant such an evaluation. For securities in an unrealized loss position, management considers the extent and duration of the unrealized loss, and the financial condition and near-term prospects of the issuer. Management also assesses whether it intends to sell, or it is more likely than not that it will be required to sell, a security in an unrealized loss position before recovery of its amortized cost basis. If either of the criteria regarding intent or requirement to sell is met, the entire difference between amortized cost and fair value is recognized as impairment through earnings. For debt securities that do not meet the aforementioned criteria, the amount of impairment is split into two components as follows: 1) OTTI related to credit loss, which must be recognized in the income statement, and 2) OTTI related to other factors, which is recognized in other comprehensive income. The credit loss is defined as the difference between the present value of the cash flows expected to be collected and the amortized cost basis.
Federal Home Loan Bank (“FHLB”) Stock: The Bank is a member of the FHLB system. Members are required to own a certain amount of stock based on the level of borrowings and other factors, and may invest in additional amounts. FHLB stock is carried at cost, classified as a restricted security, and periodically evaluated for impairment based on ultimate recovery of par value. Both cash and stock dividends are reported as income.
Pacific Coast Bankers Bank (“PCBB”) Stock: The Bank is a member of PCBB. PCBB stock is carried at cost, classified as a restricted security, and periodically evaluated for impairment based on ultimate recovery of par value. Both cash and stock dividends are reported as income.
Loans Held for Sale: Certain Small Business Administration (“SBA”) loans that may be sold prior to maturity are designated as held for sale at origination and are recorded at the lower of their cost or fair value less costs to sell, determined on an aggregate basis. A valuation allowance is established if the market value of such loans is lower than their cost, and operations are charged or credited for valuation adjustments. Origination fees on loans held for sale, net of certain costs of processing and closing the loans, are deferred until the time of sale and are included in the computation of the gain or loss from the sales of the related loans. A portion of the premium on sale of SBA loans is recognized as gains on sales of loans at the time of the sale. These loans are generally sold with servicing retained.
Loans Receivable: Loans that management has the intent and ability to hold for the foreseeable future or until maturity or payoff are reported at the principal balance outstanding, net of deferred loan fees and costs and an allowance for loan losses. Interest income is accrued on the unpaid principal balance. Loan origination fees, net of certain direct origination costs, are deferred and recognized in interest income using the level-yield method without anticipating prepayments. The recorded investment in loans includes accrued interest receivable, deferred loan fees and costs, and unearned income.
F-8
Table of Contents
OP BANCORP
NOTES TO CONSOLIDATED FINANCIAL STATEMENTS
December 31, 2017 and 2016
NOTE 2—SUMMARY OF SIGNIFICANT ACCOUNTING POLICIES (Continued)
The accrual of interest income on commercial real estate and other commercial and industrial loans is discontinued at the time the loan is 90 days delinquent unless the loan is well-secured and in process of collection. Consumer loans are typically charged off no later than 120 days past due. Past due status is based on the contractual terms of the loan. In all cases, loans are placed on nonaccrual status orcharged-off at an earlier date if collection of principal or interest is considered doubtful. Nonaccrual loans and loans past due 90 days still on accrual include both smaller balance homogeneous loans that are collectively evaluated for impairment and individually classified impaired loans.
All interest accrued but not received for loans placed on nonaccrual status is reversed against interest income. Interest received on such loans is accounted for on the cash-basis or cost-recovery method, until qualifying for return to accrual. Loans are returned to accrual status when all the principal and interest amounts contractually due are brought current and future payments are reasonably assured.
Allowance for Loan Losses: The allowance for loan losses is a valuation allowance for probable incurred credit losses. Loan losses are charged against the allowance when management believes the uncollectibility of a loan balance is confirmed. Subsequent recoveries, if any, are credited to the allowance. Management estimates the allowance balance required using past loan loss experience, the nature and volume of the portfolio, information about specific borrower situations and estimated collateral values, economic conditions, and other factors. Allocations of the allowance may be made for specific loans, but the entire allowance is available for any loan that in management’s judgment should be charged off.
The allowance consists of specific and general components. The specific component relates to loans that are individually classified as impaired. A loan is impaired when, based on current information and events, it is probable that the Company will be unable to collect all amounts due according to the contractual terms of the loan agreement.
Loans for which the terms have been modified resulting in a concession, and for which the borrower is experiencing financial difficulties, are considered troubled debt restructurings and classified as impaired. Troubled debt restructurings are separately identified for impairment disclosures and are measured at the present value of estimated future cash flows using the loan’s effective rate at inception. If a troubled debt restructuring is considered to be a collateral dependent loan, the loan is reported, net, at the fair value of the collateral. For troubled debt restructurings that subsequently default, the Company determines the amount of reserve in accordance with the accounting policy for the allowance for loan losses.
Factors considered by management in determining impairment include payment status, collateral value, and the probability of collecting scheduled principal and interest payments when due. Loans that experience insignificant payment delays and payment shortfalls generally are not classified as impaired. Management determines the significance of payment delays and payment shortfalls on acase-by-case basis, taking into consideration all of the circumstances surrounding the loan and the borrower, including the length of the delay, the reasons for the delay, the borrower’s prior payment record, and the amount of the shortfall in relation to the principal and interest owed. Impairment is measured on aloan-by-loan basis for commercial real estate and
F-9
Table of Contents
OP BANCORP
NOTES TO CONSOLIDATED FINANCIAL STATEMENTS
December 31, 2017 and 2016
NOTE 2—SUMMARY OF SIGNIFICANT ACCOUNTING POLICIES (Continued)
construction loans. Large groups of smaller balance homogeneous loans are collectively evaluated for impairment. Income recognition on impaired loans materially conforms to the method the Company uses for income recognition on nonaccrual loans.
Allowance for impaired loans is determined based on the present value of the estimated cash flows or on the fair value of the collateral if the loan is collateral dependent, less costs to sell. If the measured fair value is less than the recorded investment in the loan, the deficiency will be charged off against the allowance for loan losses, or alternatively, a specific allocation will be established. For consumer loans, management will generally charge off the balance if the loan is 90 days or more past due.
The general component of the allowance coversnon-impaired loans and is based on historical loss experience adjusted for current factors. The historical loss experience is determined by portfolio segment and is based on the actual loss history experienced by the Company over the most recent two years. For those portfolio segments that the Company does not have sufficient historical data available to track the loss migration, the loss factors are based on the actual loss history experienced by the Company over the most recent five years. This actual loss experience is supplemented with other economic factors based on the risks present for each portfolio segment. These economic factors include consideration of the following: levels of and trends in delinquencies and impaired loans; levels of and trends in charge-offs and recoveries; trends in volume and terms of loans; effects of any changes in risk selection and underwriting standards; other changes in lending policies, procedures, and practices; experience, ability, and depth of lending management and other relevant staff; national and local economic trends and conditions; industry conditions; and effects of changes in credit concentrations. Related to the current national and local economic conditions, the Company has considered risk factors including the broad deterioration of property values, reduced consumer and business spending as a result of high unemployment and reduced credit availability, and the lack of confidence in a sustainable recovery.
The following portfolio segments have been identified in the Company’s loan portfolio, and are also representative of the classes within the portfolio: commercial real estate, SBA loans—real estate, SBAloans—non-real estate, commercial and industrial, trade finance, home mortgage, and consumer. The Company reviews the credit risk exposure of all its portfolio segments by internally assigned grades. The Company categorizes loans into risk grades based on relevant information about the ability of borrowers to service their debt such as: current financial information, historical payment experience, credit documentation, public information, and current economic trends, among other factors. For the home mortgage and consumer portfolio segments, the Company’s primary monitoring tool is reviewing past due listings to determine if the loans are performing.
The determination of the allowance for loan losses is based on estimates that are particularly susceptible to changes in the economic environment and market conditions.
Management believes that as of December 31, 2017 and 2016 the allowance for loan losses is adequate based on information currently available. If a deterioration in the economy of the Company’s principal market area occurs, the Company’s loan portfolios could be adversely impacted and higher charge-offs and increases in non-performing assets could result. Such an adverse impact could also require a larger allowance for loan losses.
F-10
Table of Contents
OP BANCORP
NOTES TO CONSOLIDATED FINANCIAL STATEMENTS
December 31, 2017 and 2016
NOTE 2—SUMMARY OF SIGNIFICANT ACCOUNTING POLICIES (Continued)
Servicing Assets: When SBA loans are sold with servicing retained, servicing assets are initially recorded at fair value with the income statement effect recorded in gains on sales of loans. Fair value is based on a valuation model that calculates the present value of estimated future net servicing income. The valuation model incorporates assumptions that market participants would use in estimating future net servicing income, such as the cost to service, the discount rate, prepayment speeds, and default rates and losses. The Company compares the valuation model inputs and results to published industry data in order to validate the model results and assumptions. Servicing assets are subsequently measured using the amortization method which requires servicing assets to be amortized intonon-interest income in proportion to, and over the period of, the estimated future net servicing income of the underlying loans.
Servicing assets are evaluated for impairment based upon the fair value of the assets as compared to their carrying amount. Impairment is recognized through a valuation allowance to the extent that fair value is less than the carrying amount. If the Company later determines that all or a portion of the impairment no longer exists, a reduction of the valuation allowance may be recorded as an increase to income. Changes in the valuation allowances are reported with other incomeon the income statement. The fair values of servicing rights are subject to fluctuations as a result of changes in estimated and actual prepayment speeds, default rates, and losses.
Servicing fee income, which is reported on the income statement as other income,is recorded for fees earned for servicing loans. The fees are based on a contractual percentage of the outstanding principal and are recorded as income when earned. The amortization of servicing assets is netted against loan servicing fee income. Late fees and ancillary fees related to loan servicing are not material.
Company Owned Life Insurance: The Company has purchased life insurance policies on certain key executives. Company owned life insurance is recorded at the amount that can be realized under the insurance contract at the balance sheet date, which is the cash surrender value adjusted for other charges or other amounts due that are probable at settlement.
Transfers of Financial Assets: Transfers of financial assets are accounted for as sales when control over the assets has been relinquished. Control over transferred assets is deemed to be surrendered when the assets have been isolated from the Company, the transferee obtains the right (free of conditions that constrain it from taking advantage of that right) to pledge or exchange the transferred assets, and the Company does not maintain effective control over the transferred assets through an agreement to repurchase them before their maturity.
Premises and Equipment: Premises and equipment are stated at cost, less accumulated depreciation. Equipment and furnishings are depreciated over 3 to 10 years, and leasehold improvements are amortized over the lesser of the terms of the respective leases or the estimated useful lives. The straight-line method of depreciation is used for financial reporting purposes. Repairs and maintenance are charged to operating expenses as incurred.
Other Real Estate Owned, Net: Assets acquired through or instead of loan foreclosure are initially recorded at fair value less costs to sell when acquired, establishing a new cost basis. Physical possession of residential real estate property collateralizing a consumer mortgage loan occurs when the legal title is obtained upon completion
F-11
Table of Contents
OP BANCORP
NOTES TO CONSOLIDATED FINANCIAL STATEMENTS
December 31, 2017 and 2016
NOTE 2—SUMMARY OF SIGNIFICANT ACCOUNTING POLICIES (Continued)
of foreclosure or when the borrower conveys all interest in the property to satisfy the loan through the completion of a deed in lieu of foreclosure or through a similar legal agreement. These assets are subsequently accounted for at the lower of their cost or fair value less estimated costs to sell. If their fair value declines subsequent to foreclosure, a valuation allowance is recorded through expense. Operating costs after acquisition are expensed.
Loan Commitments and Related Financial Instruments: Financial instruments includeoff-balance sheet credit instruments, such as commitments to make loans and commercial letters of credit, issued to meet customer financing needs. The face amount for these items represents the exposure to loss, before considering customer collateral or ability to repay. Such financial instruments are recorded when they are funded.
Stock-Based Compensation: Compensation cost is recognized for stock options and restricted stock awards issued to employees based on the fair value of the awards at the date of grant. A Black-Scholes model is utilized to estimate the fair value of stock options, while the market price of the Company’s common stock at the date of the grant is used for restricted stock awards. Compensation cost is recognized over the required service period, generally defined as the vesting period. For awards with graded vesting, compensation cost is recognized on a straight-line basis over the requisite service period for the entire award.
Earnings per Common Share: Basic and diluted earnings per share is based on thetwo-class method prescribed in ASC Topic 260, Earnings Per Share (ASC 260). Stock options and restricted stock awards are considered outstanding for this calculation unless unearned. Diluted earnings per common share includes the dilutive effect of additional potential common shares issuable under stock-based compensation plans. Earnings and dividends per share are restated for all stock splits and stock dividends through the date of issuance of the financial statements.
Income Taxes: Income tax expense is the total of the current year income tax due or refundable and the change in deferred tax assets and liabilities. Deferred tax assets and liabilities are the expected future tax amounts for the temporary differences between carrying amounts and tax bases of assets and liabilities, computed using enacted tax rates. A valuation allowance, if needed, reduces deferred tax assets to the amount expected to be realized.
A tax position is recognized as a benefit only if it is “more likely than not” that the tax position would be sustained in a tax examination, with a tax examination being presumed to occur. The amount recognized is the largest amount of tax benefit that is greater than 50% likely of being realized on examination. For tax positions not meeting the “more likely than not” test, no tax benefit is recorded. The Company does not expect the total amount of unrecognized tax benefits to significantly increase or decrease in the next twelve months.
The Company recognizes interest and/or penalties related to income tax matters in income tax expense. There were no interest or penalties recognized in the years ended December 31, 2017 or 2016.
Comprehensive Income/(Loss): Comprehensive income/(loss) consists of net income and other comprehensive income. Other comprehensive income includes unrealized gains and losses on securities available for sale, which are also recognized as separate components of shareholders’ equity, net of tax.
F-12
Table of Contents
OP BANCORP
NOTES TO CONSOLIDATED FINANCIAL STATEMENTS
December 31, 2017 and 2016
NOTE 2—SUMMARY OF SIGNIFICANT ACCOUNTING POLICIES (Continued)
Loss Contingencies: Loss contingencies, including claims and legal actions arising in the ordinary course of business, are recorded as liabilities when the likelihood of loss is probable and an amount or range of loss can be reasonably estimated. Management does not believe there now are such matters that will have a material effect on the financial statements.
Fair Value of Financial Instruments: Fair values of financial instruments are estimated using relevant market information and other assumptions, as more fully disclosed in Note 13—Fair Value of Financial Instruments. Fair value estimates involve uncertainties and matters of significant judgment regarding interest rates, credit risk, prepayments, and other factors, especially in the absence of broad markets for particular items. Changes in assumptions or in market conditions could significantly affect these estimates.
Operating Segments: While the chief decision-makers monitor the revenue streams of the various products and services, operations are managed and financial performance is evaluated on a Company-wide basis. Discrete financial information is not available other than on a Company-wide basis.
Recent Accounting Pronouncements:
In May 2014, the Financial Accounting Standard Board (FASB) issued Accounting Standard Update (ASU)2014-9 (ASU2014-09), Revenue from Contracts with Customers. The core principle of ASU2014-09 is that an entity should recognize revenue to depict the transfer of promised goods or services to customers in an amount that reflects the consideration to which the entity expects to be entitled in exchange for those goods or services. The guidance also specifies the accounting for some costs to obtain or fulfill a contract with a customer, as well as enhanced disclosure requirements. In August 2015, the FASB issued ASU2015-14 which deferred the effective date of ASU2014-09 to fiscal years, and interim reporting periods within those fiscal years, beginning after December 15, 2017. In March 2016, the FASB issued ASU2016-08 which clarified the revenue recognition implementation guidance on principal versus agent considerations and is effective during the same period as ASU2014-09. In April 2016, the FASB issued ASU2016-10 which clarified the revenue recognition guidance regarding the identification of performance obligations and the licensing implementation and is effective during the same period as ASU2014-09. In May 2016, the FASB issued ASU2016-12 which narrowly amended the revenue recognition guidance regarding collectability, noncash consideration, presentation of sales tax and transition. ASU2016-12 is effective during the same period as ASU2014-09.
The majority of the Company’s revenue consists of net interest income on financial assets and financial liabilities, which is explicitly excluded from the scope of ASU2014-09. The Company adopted the new standard beginning January 1, 2018. The Company completed its analysis for determining the extent ASU2014-09 will affect its noninterest income, primarily in the area of fees and service charges on deposit accounts and trade finance activities. Based on the analysis performed, the Company did not have a material change in the timing or measurement of revenues related to noninterest income. The Company will continue to evaluate the effect that this guidance will have on other revenue streams within its scope, as well as changes in disclosures required by the new guidance. However, the Company does not expect this to have a material impact on its consolidated financial statements.
F-13
Table of Contents
OP BANCORP
NOTES TO CONSOLIDATED FINANCIAL STATEMENTS
December 31, 2017 and 2016
NOTE 2—SUMMARY OF SIGNIFICANT ACCOUNTING POLICIES (Continued)
In February 2016, the FASB issued ASU2016-02, Leases (Topic 842) (ASU2016-02). ASU2016-02 is intended to increase transparency and comparability among organizations by recognizing lease assets and liabilities on the balance sheet and disclosing key information about lease arrangements. This ASU is effective for annual periods and interim periods within those annual periods beginning after December 15, 2018. Based on leases outstanding at December 31, 2017, the Company does not expect this ASU to have a material impact on the income statement, but does anticipate a $12 million increase in assets and liabilities once this ASU becomes effective (based on the leases outstanding as of December 31, 2017).
In June 2016, the FASB issued ASU2016-13, Financial Instruments—Credit Losses (Topic 326): Measurement of Credit Losses on Financial Instruments (ASU2016-13). The objective of ASU2016-13 is to provide financial statement users with decision-useful information about the expected credit losses on financial instruments and other commitments to extend credit. ASU2016-13 includes provisions that require financial assets measured at amortized cost (such as loans and held to maturity (HTM) debt securities) to be presented at the net amount expected to be collected. This will be accomplished through recognition of an estimate of all current expected credit losses. The estimate will include forecasted information for the timeframe that an entity is able to develop reasonable and supportable forecasts. This is a change from the current practice of recognizing incurred losses based on the probable initial recognition threshold under current GAAP. In addition, credit losses on available for sale (AFS) debt securities will berecorded through an allowance for credit losses rather than as a write-down. Under ASU2016-13, an entity will be able to record reversals of credit losses in current period income when the estimate of credit losses declines, whereas current GAAP prohibits reflecting those improvements in current period earnings.
ASU2016-13 is effective for annual periods and interim periods within those annual periods beginning after December 15, 2019, and early adoption is permitted for fiscal years, including interim periods, beginning after December 15, 2018. ASU2016-13 will be applied through a cumulative effect adjustment to retained earnings (modified-retrospective approach), except for debt securities for which an other-than-temporary impairment had been recognized before the effective date. A prospective transition approach is required for these debt securities. The Company is currently evaluating the effects of ASU2016-13 on its financial statements and disclosures, including software solutions, data requirements and loss estimation methodologies. While the effects cannot yet be quantified, the Company expects ASU2016-13 to add complexity and costs to its current credit loss evaluation process.
In March 2017, the FASB issued ASU2017-08, Receivables—Nonrefundable Fees and Other Costs (Subtopic310-20) (ASU2017-08). ASU2017-08 amends the amortization period for certain purchased callable debt securities held at a premium. Prior to the issuance of this guidance, premiums were amortized as an adjustment of yield over the contractual life of the instrument. ASU2017-08 requires premiums on purchased callable debt securities that have explicit, noncontingent call features that are callable at fixed prices to be amortized to the earliest call date. There are no accounting changes for securities held at a discount. This ASU is effective for annual periods and interim periods within those annual periods beginning after December 15, 2018, and early adoption is permitted. ASU2017-08 will be applied through a cumulative effect adjustment through equity (modified-retrospective approach). The Company is currently evaluating the effects of ASU2017-08 on its financial statements and disclosures.
F-14
Table of Contents
OP BANCORP
NOTES TO CONSOLIDATED FINANCIAL STATEMENTS
December 31, 2017 and 2016
NOTE 2—SUMMARY OF SIGNIFICANT ACCOUNTING POLICIES (Continued)
In May 2017, the FASB issued ASU2017-09, Compensation—Stock Compensation (Topic 718), Scope of Modification Accounting (ASU2017-09). ASU2017-09 clarifies when changes to the terms and conditions of share-based payment awards must be treated as modifications. Specifically, the new guidance permits companies to make certain changes to awards without accounting for them as modifications. ASU2017-09 is effective for annual periods beginning after December 31, 2017 and will be applied prospectively to an award modified after the effective date. There have been no changes to the terms and conditions of share-based payment awards, and as a result the adoption of this standard did not have a material effect on the Company’s operating results or financial condition.
NOTE 3—SECURITIES
The following table summarizes the amortized cost, fair value, and the corresponding amounts of gross unrealized gains and losses for available for sale securities at December 31, 2017 and 2016:
As of December 31, 2017 | Amortized Cost | Gross Unrealized Gains | Gross Unrealized Losses | Fair Value | ||||||||||||
Available for sale | ||||||||||||||||
U.S. Government sponsored agency securities | $ | 6,988,681 | $ | 2,001 | $ | (58,674 | ) | $ | 6,932,008 | |||||||
Mortgage-backed securities: residential | 14,109,433 | — | (168,908 | ) | 13,940,525 | |||||||||||
Collateralized mortgage obligations | 18,458,814 | — | (345,316 | ) | 18,113,498 | |||||||||||
Other securities | 2,518,498 | — | (32,818 | ) | 2,485,680 | |||||||||||
|
|
|
|
|
|
|
| |||||||||
Total available for sale | $ | 42,075,426 | $ | 2,001 | $ | (605,716 | ) | $ | 41,471,711 | |||||||
|
|
|
|
|
|
|
| |||||||||
As of December 31, 2016 | Amortized Cost | Gross Unrealized Gains | Gross Unrealized Losses | Fair Value | ||||||||||||
Available for sale | ||||||||||||||||
U.S. Government sponsored agency securities | $ | 6,983,402 | $ | 27,162 | $ | (33,402 | ) | $ | 6,977,162 | |||||||
Mortgage-backed securities: residential | 17,721,150 | — | (165,113 | ) | 17,556,037 | |||||||||||
Collateralized mortgage obligations | 11,124,174 | — | (193,922 | ) | 10,930,252 | |||||||||||
|
|
|
|
|
|
|
| |||||||||
Total available for sale | $ | 35,828,726 | $ | 27,162 | $ | (392,437 | ) | $ | 35,463,451 | |||||||
|
|
|
|
|
|
|
| |||||||||
F-15
Table of Contents
OP BANCORP
NOTES TO CONSOLIDATED FINANCIAL STATEMENTS
December 31, 2017 and 2016
NOTE 3—SECURITIES (Continued)
There were no sales of securities available for sale in 2017, 2016 or 2015. The amortized cost and estimated fair value of securities available for sale at December 31, 2017, by contractual maturity, are shown below. Securities without a contractual maturity are shown separately.
As of December 31, 2017 | Amortized Cost | Fair Value | ||||||
Available for sale | ||||||||
One to five years | $ | 6,988,681 | $ | 6,932,008 | ||||
Mortgage-backed securities: residential | 14,109,433 | 13,940,525 | ||||||
Collateralized mortgage obligations | 18,458,814 | 18,113,498 | ||||||
Other securities | 2,518,498 | 2,485,680 | ||||||
|
|
|
| |||||
Total available for sale | $ | 42,075,426 | $ | 41,471,711 | ||||
|
|
|
| |||||
Expected maturities may differ from contractual maturities because borrowers may have the right to call or prepay obligations with or without call or prepayment penalties. At December 31, 2017 and 2016, there were no holdings of securities of any one issuer, other than the U.S. Government and its agencies, in an amount greater than 10% of shareholders’ equity.
The following table summarizes securities with unrealized losses at December 31, 2017 and 2016, aggregated by length of time in a continuous unrealized loss position:
| Less Than 12 Months | 12 Months or Longer | Total | ||||||||||||||||||||||
As of December 31, 2017 | Fair Value | Unrealized Losses | Fair Value | Unrealized Losses | Fair Value | Unrealized Losses | ||||||||||||||||||
Available for sale | ||||||||||||||||||||||||
U.S. Government sponsored agency securities | $ | 3,957,340 | $ | (33,620 | ) | $ | 1,974,139 | $ | (25,054 | ) | $ | 5,931,479 | $ | (58,674 | ) | |||||||||
Mortgage-backed securities: residential | 7,954,428 | (70,965 | ) | 5,986,097 | (97,943 | ) | 13,940,525 | (168,908 | ) | |||||||||||||||
Collateralized mortgage obligations | 9,642,028 | (138,243 | ) | 8,471,469 | (207,073 | ) | 18,113,497 | (345,316 | ) | |||||||||||||||
Other securities | 2,485,680 | (32,818 | ) | — | — | 2,485,680 | (32,818 | ) | ||||||||||||||||
|
|
|
|
|
|
|
|
|
|
|
| |||||||||||||
Total available for sale | $ | 24,039,476 | $ | (275,646 | ) | $ | 16,431,705 | $ | (330,070 | ) | $ | 40,471,181 | $ | (605,716 | ) | |||||||||
|
|
|
|
|
|
|
|
|
|
|
| |||||||||||||
F-16
Table of Contents
OP BANCORP
NOTES TO CONSOLIDATED FINANCIAL STATEMENTS
December 31, 2017 and 2016
NOTE 3—SECURITIES (Continued)
| Less Than 12 Months | 12 Months or Longer | Total | ||||||||||||||||||||||
As of December 31, 2016 | Fair Value | Unrealized Losses | Fair Value | Unrealized Losses | Fair Value | Unrealized Losses | ||||||||||||||||||
Available for sale | ||||||||||||||||||||||||
U.S. Government sponsored agency securities | $ | 3,965,444 | $ | (33,402 | ) | $ | — | $ | — | $ | 3,965,444 | $ | (33,402 | ) | ||||||||||
Mortgage-backed securities: residential | 17,556,036 | (165,113 | ) | — | — | 17,556,036 | (165,113 | ) | ||||||||||||||||
Collateralized mortgage obligations | 7,791,185 | (133,356 | ) | 3,139,067 | (60,566 | ) | 10,930,252 | (193,922 | ) | |||||||||||||||
|
|
|
|
|
|
|
|
|
|
|
| |||||||||||||
Total available for sale | $ | 29,312,665 | $ | (331,871 | ) | $ | 3,139,067 | $ | (60,566 | ) | $ | 32,451,732 | $ | (392,437 | ) | |||||||||
|
|
|
|
|
|
|
|
|
|
|
| |||||||||||||
The Company believes that the unrealized losses are temporary, arising mainly from fluctuations in interest rates and do not reflect a deterioration of credit quality of the issuers. In analyzing an issuer’s financial condition, the Company may consider whether the securities are issued by the federal government or its agencies, whether downgrades by bond rating agencies have occurred, and the results of reviews of the issuer’s financial condition. The fair value is expected to recover as the securities approach maturity. Management does not intend to sell and it is likely that management will not be required to sell the securities prior to their anticipated recovery.
There were no securities pledged at December 31, 2017. Securities with fair values of approximately $11,946,357 were pledged to secure public deposits, borrowings, and for other purposes as required or permitted by law at December 31, 2016.
NOTE 4—LOANS
The composition of the loan portfolio was as follows at December 31, 2017 and December 31, 2016:
| December 31, 2017 | December 31, 2016 | |||||||
Real estate: | ||||||||
Commercial real estate | $ | 420,759,900 | $ | 362,585,001 | ||||
SBA loans—real estate | 106,924,278 | 97,411,302 | ||||||
|
|
|
| |||||
Total real estate | 527,684,178 | 459,996,303 | ||||||
SBA loans—non-real estate | 8,634,879 | 6,875,189 | ||||||
Commercial and industrial | 103,681,574 | 97,660,178 | ||||||
Home mortgage | 104,067,756 | 104,808,620 | ||||||
Consumer | 3,955,514 | 4,886,484 | ||||||
|
|
|
| |||||
Gross loans receivable | 748,023,901 | 674,226,774 | ||||||
Allowance for loan losses | (9,139,488 | ) | (7,909,682 | ) | ||||
|
|
|
| |||||
Loans receivable, net | $ | 738,884,413 | $ | 666,317,092 | ||||
|
|
|
| |||||
F-17
Table of Contents
OP BANCORP
NOTES TO CONSOLIDATED FINANCIAL STATEMENTS
December 31, 2017 and 2016
NOTE 4—LOANS (Continued)
The Company had $10,768 in loans to principal officers, directors, and their affiliates at December 31, 2017. No loans were outstanding to related parties as of December 31, 2016.
The activity in the allowance for loan losses for the years ended December 31, 2017, 2016 and 2015 was as follows:
| Commercial Real Estate | SBA Loans Real Estate | SBA Loans Non- Real Estate | Commercial and Industrial | Home Mortgage | Consumer | Total | ||||||||||||||||||||||
Balance at January 1, 2015 | $ | 2,480,934 | $ | 745,363 | $ | 128,772 | $ | 1,599,594 | $ | 709,581 | $ | 90,257 | $ | 5,754,501 | ||||||||||||||
Provision for loan losses | 750,676 | (42,125 | ) | (7,015 | ) | (335,549 | ) | 226,700 | (39,844 | ) | 552,843 | |||||||||||||||||
Charge-offs | — | — | (7,880 | ) | — | — | — | (7,880 | ) | |||||||||||||||||||
Recoveries | — | 851 | 14,900 | 70,530 | — | 4,000 | 90,281 | |||||||||||||||||||||
|
|
|
|
|
|
|
|
|
|
|
|
|
| |||||||||||||||
Balance at December 31, 2015 | $ | 3,231,610 | $ | 704,089 | $ | 128,777 | $ | 1,334,575 | $ | 936,281 | $ | 54,413 | $ | 6,389,745 | ||||||||||||||
|
|
|
|
|
|
|
|
|
|
|
|
|
| |||||||||||||||
Provision for loan losses | 985,479 | 188,516 | (49,824 | ) | 130,162 | 427,347 | 621 | 1,682,301 | ||||||||||||||||||||
Charge-offs | — | — | (32,180 | ) | (142,443 | ) | — | — | (174,623 | ) | ||||||||||||||||||
Recoveries | — | — | 12,259 | — | — | — | 12,259 | |||||||||||||||||||||
|
|
|
|
|
|
|
|
|
|
|
|
|
| |||||||||||||||
Balance at December 31, 2016 | $ | 4,217,089 | $ | 892,605 | $ | 59,032 | $ | 1,322,294 | $ | 1,363,628 | $ | 55,034 | $ | 7,909,682 | ||||||||||||||
|
|
|
|
|
|
|
|
|
|
|
|
|
| |||||||||||||||
Provision for loan losses | 584,208 | 189,460 | 633,345 | (56,838 | ) | 44,114 | (83,357 | ) | 1,310,932 | |||||||||||||||||||
Charge-offs | — | — | (168,683 | ) | — | — | — | (168,683 | ) | |||||||||||||||||||
Recoveries | — | — | 14,273 | — | — | 73,284 | 87,557 | |||||||||||||||||||||
|
|
|
|
|
|
|
|
|
|
|
|
|
| |||||||||||||||
Balance at December 31, 2017 | $ | 4,801,297 | $ | 1,082,065 | $ | 537,967 | $ | 1,265,456 | $ | 1,407,742 | $ | 44,961 | $ | 9,139,488 | ||||||||||||||
|
|
|
|
|
|
|
|
|
|
|
|
|
| |||||||||||||||
F-18
Table of Contents
OP BANCORP
NOTES TO CONSOLIDATED FINANCIAL STATEMENTS
December 31, 2017 and 2016
NOTE 4—LOANS (Continued)
The following table presents the balance in the allowance for loan losses and the recorded investment in loans by portfolio segment as of December 31, 2017 and 2016:
| Loans Individually Evaluated for Impairment | Loans Collectively Evaluated for Impairment | Total | ||||||||||
2017 | ||||||||||||
Allowance for loan losses: | ||||||||||||
Commercial real estate | $ | — | $ | 4,801,297 | $ | 4,801,297 | ||||||
SBA loans—real estate | — | 1,082,065 | 1,082,065 | |||||||||
SBAloans—non-real estate | — | 537,967 | 537,967 | |||||||||
Commercial and industrial | 353,985 | 911,471 | 1,265,456 | |||||||||
Home mortgage | — | 1,407,742 | 1,407,742 | |||||||||
Consumer | — | 44,961 | 44,961 | |||||||||
|
|
|
|
|
| |||||||
Total | $ | 353,985 | $ | 8,785,503 | $ | 9,139,488 | ||||||
|
|
|
|
|
| |||||||
Loans: | ||||||||||||
Commercial real estate | $ | — | $ | 421,811,734 | $ | 421,811,734 | ||||||
SBA loans—real estate | — | 107,427,788 | 107,427,788 | |||||||||
SBAloans—non-real estate | — | 8,655,808 | 8,655,808 | |||||||||
Commercial and industrial | 353,985 | 103,601,098 | 103,955,083 | |||||||||
Home mortgage | 241,164 | 104,239,551 | 104,480,715 | |||||||||
Consumer | 20,763 | 3,946,491 | 3,967,254 | |||||||||
|
|
|
|
|
| |||||||
Total | $ | 615,912 | $ | 749,682,470 | $ | 750,298,382 | ||||||
|
|
|
|
|
| |||||||
2016 | ||||||||||||
Allowance for loan losses: | ||||||||||||
Commercial real estate | $ | — | $ | 4,217,089 | $ | 4,217,089 | ||||||
SBA loans—real estate | — | 892,605 | 892,605 | |||||||||
SBAloans—non-real estate | 3,817 | 55,215 | 59,032 | |||||||||
Commercial and industrial | 367,320 | 954,974 | 1,322,294 | |||||||||
Home mortgage | — | 1,363,628 | 1,363,628 | |||||||||
Consumer | — | 55,034 | 55,034 | |||||||||
|
|
|
|
|
| |||||||
Total | $ | 371,137 | $ | 7,538,545 | $ | 7,909,682 | ||||||
|
|
|
|
|
| |||||||
Loans: | ||||||||||||
Commercial real estate | $ | — | $ | 363,380,249 | $ | 363,380,249 | ||||||
SBA loans—real estate | — | 97,756,201 | 97,756,201 | |||||||||
SBAloans—non-real estate | 3,817 | 6,892,341 | 6,896,158 | |||||||||
Commercial and industrial | 367,320 | 97,519,413 | 97,886,733 | |||||||||
Home mortgage | — | 105,229,707 | 105,229,707 | |||||||||
Consumer | — | 4,897,862 | 4,897,862 | |||||||||
|
|
|
|
|
| |||||||
Total | $ | 371,137 | $ | 675,675,773 | $ | 676,046,910 | ||||||
|
|
|
|
|
| |||||||
F-19
Table of Contents
OP BANCORP
NOTES TO CONSOLIDATED FINANCIAL STATEMENTS
December 31, 2017 and 2016
NOTE 4—LOANS (Continued)
The following table presents information related to impaired loans by class of loans as of and for the years ended December 31, 2017, 2016 and 2015. The difference between the unpaid principal balance (net of partial charge-offs) and the recorded investment in the loans is not considered to be material.
| Recorded Investment | Allowance Allocated | Average Recorded Investment | Interest Income Recognized | |||||||||||||
2017 | ||||||||||||||||
With no related allowance recorded: | ||||||||||||||||
Home mortgage | $ | 241,164 | $ | — | $ | 242,210 | $ | — | ||||||||
Consumer | 20,763 | — | 30,521 | — | ||||||||||||
With an allowance recorded: | ||||||||||||||||
Commercial and industrial | 353,985 | 353,985 | 360,653 | 16,801 | ||||||||||||
|
|
|
|
|
|
|
| |||||||||
| $ | 615,912 | $ | 353,985 | $ | 633,384 | $ | 16,801 | |||||||||
|
|
|
|
|
|
|
| |||||||||
2016 | ||||||||||||||||
With an allowance recorded: | ||||||||||||||||
SBA loans—non-real estate | $ | 3,817 | $ | 3,817 | $ | 9,325 | $ | 1,959 | ||||||||
Commercial and industrial | 367,320 | 367,320 | 545,616 | 15,292 | ||||||||||||
|
|
|
|
|
|
|
| |||||||||
| $ | 371,137 | $ | 371,137 | $ | 554,941 | $ | 17,251 | |||||||||
|
|
|
|
|
|
|
| |||||||||
2015 | ||||||||||||||||
With an allowance recorded: | ||||||||||||||||
SBA loans—non-real estate | $ | 47,183 | $ | 47,183 | $ | 47,147 | $ | 5,618 | ||||||||
Commercial and industrial | 723,911 | 723,911 | 883,012 | 14,860 | ||||||||||||
|
|
|
|
|
|
|
| |||||||||
| $ | 771,094 | $ | 771,094 | $ | 930,159 | $ | 20,478 | |||||||||
|
|
|
|
|
|
|
| |||||||||
The difference between interest income recognized and cash basis interest recognized was immaterial.
The following table presents the recorded investment in nonaccrual loans and loans past due greater than 90 days still accruing interest by class of loans as of December 31, 2017 and 2016:
| Nonaccrual | Loans >90 Days Past Due & Still Accruing | Total | ||||||||||
2017 | ||||||||||||
Home mortgage | $ | 662,365 | $ | — | $ | 662,365 | ||||||
Consumer | 20,763 | 20,763 | ||||||||||
|
|
|
| |||||||||
Total | $ | 683,128 | $ | — | $ | 683,128 | ||||||
|
|
|
|
|
| |||||||
2016 | ||||||||||||
SBA loans—non-real estate | $ | 208,802 | $ | — | $ | 208,802 | ||||||
|
|
|
|
|
| |||||||
Total | $ | 208,802 | $ | — | $ | 208,802 | ||||||
|
|
|
|
|
| |||||||
F-20
Table of Contents
OP BANCORP
NOTES TO CONSOLIDATED FINANCIAL STATEMENTS
December 31, 2017 and 2016
NOTE 4—LOANS (Continued)
Nonaccrual loans and loans past due 90 days still on accrual include both smaller balance homogeneous loans that are collectively evaluated for impairment and individually classified impaired loans.
The following table represents the aging of the recorded investment in past due loans as of December 31, 2017 and 2016:
| 30-59 Days Past Due | 60-89 Days Past Due | > 90 Days Past Due | Total Past Due | Loans Not Past Due | Total | |||||||||||||||||||
2017 | ||||||||||||||||||||||||
Commercial real estate | $ | — | $ | — | $ | — | $ | — | $ | 421,811,734 | $ | 421,811,734 | ||||||||||||
SBA—real estate | 139,806 | — | — | 139,806 | 107,287,982 | 107,427,788 | ||||||||||||||||||
SBA—non-real estate | 61,611 | — | — | 61,611 | 8,594,197 | 8,655,808 | ||||||||||||||||||
Commercial and industrial | — | — | — | — | 103,955,083 | 103,955,083 | ||||||||||||||||||
Home mortgage | — | — | 662,365 | 662,365 | 103,818,350 | 104,480,715 | ||||||||||||||||||
Consumer | — | — | — | — | 3,967,254 | 3,967,254 | ||||||||||||||||||
|
|
|
|
|
|
|
|
|
|
|
| |||||||||||||
| $ | 201,417 | $ | — | $ | 662,365 | $ | 863,782 | $ | 749,434,600 | $ | 750,298,382 | |||||||||||||
|
|
|
|
|
|
|
|
|
|
|
| |||||||||||||
2016 | ||||||||||||||||||||||||
Commercial real estate | $ | — | $ | — | $ | — | $ | — | $ | 363,380,249 | $ | 363,380,249 | ||||||||||||
SBA—real estate | 241,576 | 825,694 | — | 1,067,270 | 96,688,931 | 97,756,201 | ||||||||||||||||||
SBA—non-real estate | — | — | 208,802 | 208,802 | 6,687,356 | 6,896,158 | ||||||||||||||||||
Commercial and industrial | — | — | — | — | 97,886,733 | 97,886,733 | ||||||||||||||||||
Home mortgage | — | 814,551 | — | 814,551 | 104,415,156 | 105,229,707 | ||||||||||||||||||
Consumer | — | — | — | — | 4,897,862 | 4,897,862 | ||||||||||||||||||
|
|
|
|
|
|
|
|
|
|
|
| |||||||||||||
| $ | 241,576 | $ | 1,640,245 | $ | 208,802 | $ | 2,090,623 | $ | 673,956,287 | $ | 676,046,910 | |||||||||||||
|
|
|
|
|
|
|
|
|
|
|
| |||||||||||||
Troubled Debt Restructurings: As of December 31, 2017 and 2016, the Company had a recorded investment in troubled debt restructurings of $353,985 and $367,320, respectively. The Company has allocated $353,985 and $367,320 of specific reserves to customers whose loan terms have been modified in troubled debt restructurings as of December 31, 2017 and 2016, respectively. The Company has not committed to lend any additional amounts to customers with outstanding loans that are classified as troubled debt restructurings.
Modifications made were primarily extensions of existing payment modifications on loans previously identified as troubled debt restructurings. There were no new loans identified as trouble debt restructurings during the years ended December 31, 2017, 2016 or 2015. There were no payment defaults during the years ended December 31, 2017, 2016 or 2015 of loans that had been modified as troubled debt restructurings within the previous twelve months.
Credit Quality Indicators: The Company categorizes loans into risk categories based on relevant information about the ability of borrowers to service their debt such as: current financial information, historical payment
F-21
Table of Contents
OP BANCORP
NOTES TO CONSOLIDATED FINANCIAL STATEMENTS
December 31, 2017 and 2016
NOTE 4—LOANS (Continued)
experience, credit documentation, public information, and current economic trends, among other factors. For consumer loans, a credit grade is established at inception, and generally only adjusted based on performance. The Company analyzes loans individually by classifying the loans as to credit risk. This analysis is performed on a quarterly basis. The Company uses the following definitions for risk ratings:
Special Mention—Loans classified as special mention have a potential weakness that deserves management’s close attention. If left uncorrected, these potential weaknesses may result in deterioration of the repayment prospects for the loan or of the Company’s credit position at some future date.
Substandard—Loans classified as substandard are inadequately protected by the current net worth and paying capacity of the obligor or of the collateral pledged, if any. Loans so classified have a well-defined weakness or weaknesses that jeopardize the liquidation of the debt. They are characterized by the distinct possibility that the institution will sustain some loss if the deficiencies are not corrected.
Doubtful—Loans classified as doubtful have all the weaknesses inherent in those classified as substandard, with the added characteristic that the weaknesses make collection or liquidation in full, on the basis of currently existing facts, conditions, and values, highly questionable and improbable.
Loans not meeting the criteria above that are analyzed individually as part of the above described process are considered to be pass-rated loans.
As of December 31, 2017 and 2016, and based on the most recent analysis performed, the risk category of loans by class of loans is as follows:
| Pass | Special Mention | Substandard | Doubtful | Total | ||||||||||||||||
2017 | ||||||||||||||||||||
Commercial real estate | $ | 421,811,734 | $ | — | $ | — | $ | — | $ | 421,811,734 | ||||||||||
SBA loans—real estate | 106,405,966 | — | 1,021,822 | — | 107,427,788 | |||||||||||||||
SBAloans—non-real estate | 8,594,375 | 32,702 | 28,731 | — | 8,655,808 | |||||||||||||||
Commercial and industrial | 103,601,098 | — | 353,985 | — | 103,955,083 | |||||||||||||||
Home mortgage | 103,818,350 | — | 662,365 | — | 104,480,715 | |||||||||||||||
Consumer | 3,946,491 | — | 20,763 | — | 3,967,254 | |||||||||||||||
|
|
|
|
|
|
|
|
|
| |||||||||||
| $ | 748,178,014 | $ | 32,702 | $ | 2,087,666 | $ | — | $ | 750,298,382 | |||||||||||
|
|
|
|
|
|
|
|
|
| |||||||||||
2016 | ||||||||||||||||||||
Commercial real estate | $ | 363,380,249 | $ | — | $ | — | $ | — | $ | 363,380,249 | ||||||||||
SBA loans—real estate | 96,847,750 | — | 908,451 | — | 97,756,201 | |||||||||||||||
SBAloans—non-real estate | 6,852,884 | 39,457 | 3,817 | — | 6,896,158 | |||||||||||||||
Commercial and industrial | 97,212,559 | 306,854 | 367,320 | — | 97,886,733 | |||||||||||||||
Home mortgage | 104,415,156 | — | 814,551 | — | 105,229,707 | |||||||||||||||
Consumer | 4,897,862 | — | — | — | 4,897,862 | |||||||||||||||
|
|
|
|
|
|
|
|
|
| |||||||||||
| $ | 673,606,460 | $ | 346,311 | $ | 2,094,139 | $ | — | $ | 676,046,910 | |||||||||||
|
|
|
|
|
|
|
|
|
| |||||||||||
F-22
Table of Contents
OP BANCORP
NOTES TO CONSOLIDATED FINANCIAL STATEMENTS
December 31, 2017 and 2016
NOTE 5—PREMISES AND EQUIPMENT
The Company’s premises and equipment consisted of the following at December 31, 2017 and 2016:
| December 31, 2017 | December 31, 2016 | |||||||
Leasehold improvements | $ | 5,061,520 | $ | 4,834,045 | ||||
Furniture and fixtures | 2,492,623 | 2,441,082 | ||||||
Equipment and others | 1,677,175 | 1,564,168 | ||||||
|
|
|
| |||||
Total cost | 9,231,318 | 8,839,295 | ||||||
Accumulated depreciation | (4,750,526 | ) | (3,772,200 | ) | ||||
|
|
|
| |||||
Net book value | $ | 4,480,792 | $ | 5,067,095 | ||||
|
|
|
| |||||
Total depreciation expense included in occupancy and equipment expenses was $1,007,736, $1,084,071, and $940,404 for the years ended December 31, 2017, 2016 and 2015, respectively.
NOTE 6—SERVICING ASSETS
Activity for loan servicing assets during the years ended December 31, 2017, 2016 and 2015 is as follows:
| Year Ended December 31, 2017 | Year Ended December 31, 2016 | Year Ended December 31, 2015 | ||||||||||
Beginning balance | 6,782,555 | 5,550,975 | 4,670,462 | |||||||||
Additions | 1,923,459 | 2,645,278 | 2,148,116 | |||||||||
Amortized to expense | (1,934,917 | ) | (1,413,698 | ) | (1,267,603 | ) | ||||||
|
|
|
|
|
| |||||||
Ending balance | 6,771,097 | 6,782,555 | 5,550,975 | |||||||||
|
|
|
|
|
| |||||||
There was no valuation allowance recorded against the carrying value of the servicing assets as of December 31, 2017 or 2016.
The fair value of the servicing assets was $8,739,146 at December 31, 2017. Fair value of the servicing assets at December 31, 2017 was determined using discount rates ranging from 4.15% to 10.40% and prepayment speeds ranging from 10.2% to 10.9%, depending on the stratification of the specific assets.
The fair value of the servicing assets was $8,703,142 at December 31, 2016. Fair value of the servicing assets atyear-end 2016 was determined using discount rates ranging from 4.50% to 10.86% and prepayment speeds ranging from 9.8% to 10.1%, depending on the stratification of the specific assets.
NOTE 7—DEPOSITS
Time deposits that exceed the FDIC insurance limit of $250,000 at December 31, 2017 and 2016 were $108,952,059 and $96,641,799, respectively.
F-23
Table of Contents
OP BANCORP
NOTES TO CONSOLIDATED FINANCIAL STATEMENTS
December 31, 2017 and 2016
NOTE 7—DEPOSITS (Continued)
The scheduled maturities of time deposits were as follows at December 31, 2017:
2018 | $ | 217,783,392 | ||
2019 | 14,325,669 | |||
2020 | 441,883 | |||
2022 | 182,549 | |||
|
| |||
Total | $ | 232,733,493 | ||
|
|
Deposits from principal officers, directors, and their affiliates at December 31, 2017 and 2016 were $1,068,580 and $597,226, respectively.
NOTE 8—BORROWING ARRANGEMENTS
As of December 31, 2017, the Company had a $25 million advance outstanding from the Federal Home Loan Bank of San Francisco. The maturity date of this advance was January 2, 2018 and the interest rate on the advances was 1.41%. The advance was paid off on January 2, 2018 as scheduled. In addition, the Company has a letter of credit with the FHLB in the amount of $49,000,000 to secure a public deposit.
The Company had available borrowings from the following institutions as of December 31, 2017:
Federal Home Loan Bank—San Francisco | $ | 145,761,000 | ||
Federal Reserve Bank | 92,830,000 | |||
Pacific Coast Bankers Bank | 4,000,000 | |||
Zions Bank | 5,500,000 | |||
|
| |||
Total | $ | 248,091,000 | ||
|
|
The Company has pledged approximately $643,724,000 of loans as collateral for these lines of credit as of December 31, 2017.
F-24
Table of Contents
OP BANCORP
NOTES TO CONSOLIDATED FINANCIAL STATEMENTS
December 31, 2017 and 2016
NOTE 9—INCOME TAXES
Income tax expense/(benefit) was as follows:
| Year Ended December 31, 2017 | Year Ended December 31, 2016 | Year Ended December 31, 2015 | ||||||||||
Current federal expense | $ | 5,893,432 | $ | 5,116,854 | $ | 2,534,570 | ||||||
Current state expense | 2,002,308 | 1,430,189 | 267,629 | |||||||||
|
|
|
|
|
| |||||||
| 7,895,740 | 6,547,043 | 2,802,199 | ||||||||||
Deferred federal expense | (1,061,464 | ) | (1,375,939 | ) | 538,824 | |||||||
Deferred state expense | (278,586 | ) | (276,649 | ) | 828,850 | |||||||
Deferred tax asset revaluation | 1,336,299 | — | — | |||||||||
|
|
|
|
|
| |||||||
| (3,751 | ) | (1,652,588 | ) | 1,367,674 | ||||||||
|
|
|
|
|
| |||||||
Total tax expense | $ | 7,891,989 | $ | 4,894,455 | $ | 4,169,873 | ||||||
|
|
|
|
|
| |||||||
Effective tax rates differ from the federal statutory rates of 35% for 2017 and 34% for 2016 and 2015 applied to income before taxes due to the following:
| Year Ended December 31, 2017 | Year Ended December 31, 2016 | Year Ended December 31, 2015 | ||||||||||
Federal statutory rate times financial statement income | $ | 5,994,965 | $ | 4,188,741 | $ | 3,445,294 | ||||||
Effect of: | ||||||||||||
Meals and entertainment | 45,246 | 36,981 | 29,622 | |||||||||
State income taxes, net of federal tax benefit | 1,096,258 | 831,920 | 656,476 | |||||||||
Stock option expense and related excess tax benefits | (300,879 | ) | 34,956 | 43,664 | ||||||||
Company owned life insurance | (112,032 | ) | (113,786 | ) | (120,048 | ) | ||||||
Other, net | (167,868 | ) | (84,357 | ) | 114,865 | |||||||
Deferred tax asset revaluation | 1,336,299 | — | — | |||||||||
|
|
|
|
|
| |||||||
| 1,897,024 | 705,714 | 724,579 | ||||||||||
|
|
|
|
|
| |||||||
Total tax expense | $ | 7,891,989 | $ | 4,894,455 | $ | 4,169,873 | ||||||
|
|
|
|
|
| |||||||
On December 22, 2017, H.R.1, commonly known as the Tax Cuts and Jobs Act (the “Tax Act”), was signed into law, which among other items reduces the federal corporate tax rate to 21% from 35%, effective January 1, 2018. U.S. generally accepted accounting principles requires companies to revalue certain tax-related assets as of the date of enactment of the new legislation with resulting tax effects accounted for in the reporting period of enactment. As a result, the Company performed an analysis to determine the impact of the revaluation of the net deferred tax asset. The value of the Company’s deferred tax asset was reduced by $1.3 million, and such $1.3 million was recorded as tax expense for the year ended December 31, 2017.
F-25
Table of Contents
OP BANCORP
NOTES TO CONSOLIDATED FINANCIAL STATEMENTS
December 31, 2017 and 2016
NOTE 9—INCOME TAXES (Continued)
ASU 2016-09, “Compensation-Stock Compensation (Topic 718) Improvements to Employee Share-Based Payment Accounting” requires the Company to recognize all excess tax benefits or tax deficiencies through the income statement as income tax expense/benefit. Under previous GAAP, any excess tax benefits were recognized in additional paid-in capital to offset current-period and subsequent-period tax deficiencies. Due to the adoption of ASU 2016-09 in 2017, the Company recorded the related excess tax benefits of $318,771 through the income statement as income tax benefit.
The net deferred tax asset included in the statement of financial position includes the following components at the dates indicated below:
| December 31, 2017 | December 31, 2016 | December 31, 2015 | ||||||||||
Deferred tax assets: | ||||||||||||
Pre-opening expense | $ | 42,265 | $ | 83,183 | $ | 107,529 | ||||||
Organizational costs | 32,040 | 47,650 | — | |||||||||
Allowance for loan losses | 2,228,954 | 2,102,881 | 1,148,132 | |||||||||
Loans held for sale | 432,739 | 60,501 | 217,202 | |||||||||
Stock-based compensation | 273,444 | 367,748 | 376,057 | |||||||||
Accrued compensation | 74,632 | 110,506 | 88,794 | |||||||||
Accrued contributions | — | 301,291 | 216,286 | |||||||||
Accrued rent | 590,118 | 862,240 | 782,016 | |||||||||
State taxes | 410,057 | 510,277 | 24,514 | |||||||||
Net unrealized loss on securities available for sale | 178,480 | 150,311 | 162,243 | |||||||||
Nonaccrual loan interest income | 48,023 | 121,605 | 111,161 | |||||||||
Other | 18,801 | 29,596 | 25,628 | |||||||||
|
|
|
|
|
| |||||||
Total deferred tax assets | 4,329,553 | 4,747,789 | 3,259,562 | |||||||||
Deferred tax liabilities: | ||||||||||||
Loan origination costs | (476,756 | ) | (490,010 | ) | (401,818 | ) | ||||||
Depreciation | (434,294 | ) | (939,524 | ) | (1,137,845 | ) | ||||||
Other | (35,138 | ) | (42,192 | ) | (84,492 | ) | ||||||
|
|
|
|
|
| |||||||
Total deferred tax liabilities | (946,188 | ) | (1,471,726 | ) | (1,624,155 | ) | ||||||
|
|
|
|
|
| |||||||
Net deferred tax asset | $ | 3,383,365 | $ | 3,276,063 | $ | 1,635,407 | ||||||
|
|
|
|
|
| |||||||
A valuation allowance for deferred tax assets is recorded when it is more likely than not that some portion or all of the deferred tax assets will not be realized. The ultimate realization of deferred tax assets is dependent upon the generation of future taxable income and tax planning strategies which will create taxable income during the periods in which those temporary differences become deductible. At December 31, 2017, management reevaluated all positive and negative evidence that existed and concluded all deferred tax assets are realizable. Therefore, no valuation allowance is necessary.
F-26
Table of Contents
OP BANCORP
NOTES TO CONSOLIDATED FINANCIAL STATEMENTS
December 31, 2017 and 2016
NOTE 9—INCOME TAXES (Continued)
The Company is subject to U.S. Federal income tax as well as various state taxing jurisdictions. The Company is no longer subject to examination by Federal taxing authorities for tax years prior to 2014 and for state taxing authorities for tax years prior to 2013.
There were no significant unrealized tax benefits recorded as of December 31, 2017, 2016 and 2015, and the Company does not expect any significant increase in unrealized tax benefits in the next twelve months.
NOTE 10—COMMITMENTS AND CONTINGENCIES
Lease Commitments: The Company leases its headquarters and office facilities from nonaffiliated parties under operating leases. Rent expense for the years ended December 31, 2017, 2016 and 2015 was $2,007,705, $1,717,807 and $1,489,736, respectively. Rent commitments related to the lease of the Company’s main office and branch facilities, before considering renewal options and additional lessor charges, were as follows:
2018 | $ | 1,629,972 | ||
2019 | 1,606,245 | |||
2020 | 1,645,328 | |||
2021 | 1,693,146 | |||
2022 | 1,684,852 | |||
Thereafter | 3,762,002 | |||
|
| |||
Total | $ | 12,021,545 | ||
|
|
Off-Balance-Sheet Credit Risk: The commitments and contingent liabilities include various commitments to extend credit and standby letters of credit, which arise in the normal course of business. Commitments to extend credit are legally binding loan commitments with set expiration dates. Standby letters of credit are conditional commitments issued by the Company to guarantee the performance of a customer to a third party. They are intended to be disbursed, subject to certain conditions, upon request of the borrower.
The Company evaluates the creditworthiness of each customer. Collateral, if deemed necessary by the Company upon the extension of credit, is obtained based on management’s evaluation of the borrower. Collateral for commercial and industrial loans may vary, but may include securities, accounts receivable, inventory, property, plant and equipment, and income producing commercial or other properties.
The Company had loan commitments granted and undisbursed of approximately $60,748,000 and $54,774,000; commitments under outstanding commercial letters of credit of approximately $1,608,000 and $915,000; and standby letters of credit and guarantee of approximately $1,627,000 and $1,499,000 at December 31, 2017 and 2016, respectively. The majority of theseoff-balance sheet commitments have a variable interest rate. Management does not anticipate any material losses as a result of these transactions.
F-27
Table of Contents
OP BANCORP
NOTES TO CONSOLIDATED FINANCIAL STATEMENTS
December 31, 2017 and 2016
NOTE 11—STOCK-BASED COMPENSATION
The Company has two stock-based compensation plans currently in effect as of December 31, 2017, as described further below. Total compensation cost that has been charged against earnings for these plans in 2017, 2016 and 2015 was $668,018, $1,205,117, and $868,444, respectively.
2005 Plan: In 2005, the Board of Directors and shareholders of the Bank approved a stock option plan for the benefit of directors and employees of the Bank (the “2005 Plan”). The 2005 Plan was assumed by the Company in 2016 at the time of the bank holding company reorganization. Under the 2005 Plan, the Bank was authorized to grant options to purchase up to 770,000 shares of the Company’s common stock. The exercise prices of the options may not be less than 100 percent of the fair value of the Company’s common stock at the date of grant.
The options, when granted, vest either immediately or ratably over five years from the date of the grant and expire after ten years if not exercised.
There were no stock options granted under the 2005 Plan during 2017 or 2016.
A summary of the transactions under the 2005 Plan for the year ended December 31, 2017 is as follows:
| Number of Options Outstanding | Weighted Average Exercise Price | Aggregate Intrinsic Value | ||||||||||
Outstanding, beginning of year | 375,000 | $ | 3.95 | |||||||||
Options granted | — | — | ||||||||||
Options exercised | (40,000 | ) | 3.54 | |||||||||
Options forfeited | — | — | ||||||||||
Options expired | — | — | ||||||||||
|
|
|
|
|
| |||||||
Outstanding, as of December 31, 2017 | 335,000 | 3.99 | $ | 1,944,950 | ||||||||
|
|
|
|
|
| |||||||
Fully vested and expected to vest | 328,500 | 3.95 | $ | 1,921,435 | ||||||||
|
|
|
|
|
| |||||||
Vested | 309,000 | $ | 3.81 | $ | 1,850,890 | |||||||
|
|
|
|
|
| |||||||
Information related to the 2005 Plan during each year follows:
| Year Ended December 31, 2017 | Year Ended December 31, 2016 | Year Ended December 31, 2015 | ||||||||||
Intrinsic value of options exercised | $ | 174,700 | $ | 71,250 | $ | 175,000 | ||||||
Cash received from option exercises | 141,550 | 76,250 | 152,500 | |||||||||
Tax benefit realized from option exercised | — | — | — | |||||||||
There were no shares available for grant under the 2005 Plan as of December 31, 2017. The weighted average remaining contractual term of stock options outstanding under the 2005 Plan at December 31, 2017 was 3.55 years. The weighted average remaining contractual term of stock options that were exercisable at December 31, 2017 was 3.37 years.
F-28
Table of Contents
OP BANCORP
NOTES TO CONSOLIDATED FINANCIAL STATEMENTS
December 31, 2017 and 2016
NOTE 11—STOCK-BASED COMPENSATION (Continued)
As of December 31, 2017, the Company had approximately $24,173 of unrecognized compensation costs related to unvested stock options under the 2005 Plan. The Company expects to recognize these costs over a weighted average period of 0.75 year.
2010 Plan: In 2010, the Board of Directors of the Bank approved a new equity incentive plan for granting stock options and restricted stock awards to key employees, officers, andnon-employee directors of the Bank (the “2010 Plan”). In 2013, the 2010 Plan was amended and approved by the shareholders to increase the number of shares authorized to be issued under from 1,350,000 shares to 2,500,000 shares of common stock. The 2010 Plan was assumed by the Company in 2016 at the time of the bank holding company reorganization.
The exercise prices of stock options granted under the plan may not be less than 100 percent of the fair value of the Company’s stock at the date of grant. The options, when granted, vest ratably over five years from the date of the grant and expire after ten years if not exercised. Option prices under the 2010 Plan are to be equal to the fair value of the Company’s common stock on the date of grant. There were no stock options granted under the 2010 Plan during 2017 or 2016.
Restricted stock awards issued under the 2010 Plan may or may not be subject to vesting provisions. Awards which were granted in 2017 and 2016 are not subject to vesting provisions. Owners of the restricted stock awards shall have all of the rights of a shareholder including the right to vote the shares and to all dividends (cash or stock). Compensation expense related to restricted stock awards will be recognized over the vesting period of the awards based on the fair value of the Company’s common stock at the issue date.
A summary of stock options issued under the 2010 Plan for the year ended December 31, 2017 is as follows:
| Number of Options Outstanding | Weighted Average Exercise Price | Aggregate Intrinsic Value | ||||||||||
Outstanding, beginning of year | 895,000 | $ | 4.07 | |||||||||
Options granted | — | — | ||||||||||
Options exercised | (100,000 | ) | 2.85 | |||||||||
Options forfeited | — | — | ||||||||||
Options expired | — | — | ||||||||||
|
|
|
| |||||||||
Outstanding, as of December 31, 2017 | 795,000 | 4.22 | $ | 4,437,350 | ||||||||
|
|
|
|
|
| |||||||
Fully vested and expected to vest | 765,000 | 4.07 | $ | 4,383,350 | ||||||||
|
|
|
|
|
| |||||||
Vested | 675,000 | $ | 3.55 | $ | 4,221,350 | |||||||
|
|
|
|
|
| |||||||
F-29
Table of Contents
OP BANCORP
NOTES TO CONSOLIDATED FINANCIAL STATEMENTS
December 31, 2017 and 2016
NOTE 11—STOCK-BASED COMPENSATION (Continued)
Information related to stock options exercised under the 2010 Plan during each year as follows:
| Year Ended December 31, 2017 | Year Ended December 31, 2016 | Year Ended December 31, 2015 | ||||||||||
Intrinsic value of options exercised | $ | 497,000 | $ | 124,900 | $ | 268,460 | ||||||
Cash received from option exercises | 285,000 | 80,700 | 196,590 | |||||||||
Tax benefit realized from option exercised | 208,988 | 37,858 | 81,374 | |||||||||
The weighted average remaining contractual term of stock options outstanding under the 2010 Plan at December 31, 2017 was 3.69 years. The weighted average remaining contractual term of stock options that were exercisable at December 31, 2017 was 3.24 years.
A summary of the changes in the Company’snon-vested restricted stock awards under the 2010 Plan for the year ended December 31, 2017 is as follows:
| Shares Issued | Weighted Average Grant Date Fair Value | Aggregate Intrinsic Value | ||||||||||
Non-vested, beginning of year | 644,000 | $ | 5.68 | |||||||||
Awards granted | 153 | 9.85 | ||||||||||
Awards vested | (188,653 | ) | 5.02 | |||||||||
Awards forfeited | (2,000 | ) | 5.75 | |||||||||
|
|
|
| |||||||||
Non-vested, end of year | 453,500 | $ | 5.95 | $ | 4,444,300 | |||||||
|
|
|
|
|
| |||||||
Information related to non-vested restricted stock awards under the 2010 Plan during each year follows:
| Year Ended December 31, 2017 | Year Ended December 31, 2016 | Year Ended December 31, 2015 | ||||||||||
Tax benefit realized from awards vested | $ | 614,711 | $ | 483,286 | $ | 488,459 | ||||||
There were 218,605 shares available for grant under the 2010 Plan as of December 31, 2017 (in either stock options or restricted stock awards). As of December 31, 2017, the Company had approximately $2,505,538 of unrecognized compensation cost related to unvested stock options and restricted stock awards under the 2010 Plan. The Company expects to recognize these costs over a weighted average period of 2.35 years. The total fair value of shares vested during 2017 was $1,039,362.
NOTE 12—EMPLOYEE BENEFIT PLAN
The Company established a 401(k) profit sharing plan (the “401(k) Plan”) which is open to all eligible employees who are at least 21 years old and have completed 90 days of service. Each employee is allowed to
F-30
Table of Contents
OP BANCORP
NOTES TO CONSOLIDATED FINANCIAL STATEMENTS
December 31, 2017 and 2016
NOTE 12—EMPLOYEE BENEFIT PLAN (Continued)
contribute to the 401(k) Plan up to the maximum percentage allowable, not to exceed the limits of applicable IRS Code Sections. Each year, the Company may, in its discretion, make matching contributions to the 401(k) Plan. Total employer contributions to the 401(k) Plan amounted to $419,733, $374,692, and $298,154 for the years ended December 31, 2017, 2016 and 2015, respectively.
NOTE 13—FAIR VALUE OF FINANCIAL INSTRUMENTS
Fair value is the exchange price that would be received for an asset or paid to transfer a liability (exit price) in the principal or most advantageous market for the asset or liability in an orderly transaction between market participants on the measurement date. There are three levels of inputs that may be used to measure fair values:
Level 1—Quoted prices (unadjusted) for identical assets or liabilities in active markets that the entity has the ability to access as of the measurement date.
Level 2—Significant other observable inputs other than Level 1 prices such as quoted prices for similar assets or liabilities, quoted prices in markets that are not active, or other inputs that are observable or can be corroborated by observable market data.
Level 3—Significant unobservable inputs that reflect a company’s own assumptions about the assumptions that market participants would use in pricing an asset or liability.
The Company used the following methods and significant assumptions to estimate fair value:
Securities Available for Sale: The fair values of investment securities are determined by matrix pricing, which is a mathematical technique used to value debt securities without relying exclusively on quoted prices for the specific securities, but rather by relying on the securities’ relationship to other benchmark quoted securities (Level 2). Management obtains the fair values of investment securities on a monthly basis from a third-party pricing service.
Impaired Loans: The fair value of impaired loans with specific allocations of the allowance for loan losses is generally based on recent real estate appraisals. These appraisals may utilize a single valuation approach or a combination of approaches including comparable sales and the income approach. Adjustments are routinely made in the appraisal process by the independent appraisers to adjust for differences between the comparable sales and income data available. Such adjustments are usually significant and typically result in a Level 3 classification of the inputs for determining fair value.Non-real estate collateral may be valued using an appraisal, net book value per the borrower’s financial statements, or aging reports, adjusted or discounted based on management’s judgment, changes in market conditions from the time of the valuation, and management’s expertise and knowledge of the client and client’s business, resulting in a Level 3 fair value classification. Impaired loans are evaluated on a quarterly basis for additional impairment and adjusted accordingly.
Appraisals for collateral-dependent impaired loans are performed by certified general appraisers (for commercial properties) or certified residential appraisers (for residential properties) whose qualifications and licenses have been reviewed and verified by the Company. Once received, a member of the credit department
F-31
Table of Contents
OP BANCORP
NOTES TO CONSOLIDATED FINANCIAL STATEMENTS
December 31, 2017 and 2016
NOTE 13—FAIR VALUE OF FINANCIAL INSTRUMENTS (Continued)
reviews the assumptions and approaches utilized in the appraisal as well as the overall resulting fair value in comparison with independent data sources such as recent market data or industry-wide statistics.
Assets and liabilities measured at fair value on a recurring basis at December 31, 2017 and 2016 are summarized below:
| Fair Value Measuring Using | ||||||||||||||||
| Total Fair Value | Quoted Prices in Active Markets (Level 1) | Significant Other Observable Inputs (Level 2) | Significant Unobservable Inputs (Level 3) | |||||||||||||
As of December 31, 2017: | ||||||||||||||||
U.S. Government sponsored agency securities | $ | 6,932,008 | $ | — | $ | 6,932,008 | $ | — | ||||||||
Mortgage-backed securities—residential | 13,940,525 | — | 13,940,525 | — | ||||||||||||
Collateralized mortgage obligations | 18,113,498 | — | 18,113,498 | — | ||||||||||||
Other securities | 2,485,680 | — | 2,485,680 | — | ||||||||||||
As of December 31, 2016: | ||||||||||||||||
U.S. Government sponsored agency securities | $ | 6,977,162 | $ | — | $ | 6,977,162 | $ | — | ||||||||
Mortgage-backed securities—residential | 17,556,037 | — | 17,556,037 | — | ||||||||||||
Collateralized mortgage obligations | 10,930,252 | — | 10,930,252 | — | ||||||||||||
There were no transfers between level 1 and level 2 during 2017 or 2016. There were no assets or liabilities measured at fair value on anon-recurring basis at December 31, 2017 or 2016.
Financial Instruments: The carrying amounts and estimated fair values of financial instruments not carried at fair value, at December 31, 2017 are as follows:
| Carrying Amount | Level 1 | Level 2 | Level 3 | Value | ||||||||||||||||
Financial Assets: | ||||||||||||||||||||
Cash and cash equivalents | $ | 63,249,952 | $ | 63,249,952 | $ | — | $ | — | $ | 63,249,952 | ||||||||||
Loans held for sale | 15,739,305 | — | 17,203,060 | — | 17,203,060 | |||||||||||||||
Loans receivable, net | 738,884,413 | — | — | 731,436,572 | 731,436,572 | |||||||||||||||
Accrued interest receivable | 2,463,486 | — | 189,005 | 2,274,481 | 2,463,486 | |||||||||||||||
FHLB and PCBB stock | 4,286,500 | N/A | N/A | N/A | N/A | |||||||||||||||
Financial Liabilities: | ||||||||||||||||||||
Deposit | $ | 773,306,014 | $ | — | $ | 773,071,521 | $ | — | $ | 773,071,521 | ||||||||||
FHLB Advances | 25,000,000 | — | 25,000,000 | — | 25,000,000 | |||||||||||||||
Accrued interest payable | 423,239 | — | 423,239 | — | 423,239 | |||||||||||||||
F-32
Table of Contents
OP BANCORP
NOTES TO CONSOLIDATED FINANCIAL STATEMENTS
December 31, 2017 and 2016
NOTE 13—FAIR VALUE OF FINANCIAL INSTRUMENTS (Continued)
The carrying amounts and estimated fair values of financial instruments not carried at fair value at December 31, 2016 are as follows:
| Carrying Amount | Level 1 | Level 2 | Level 3 | Value | ||||||||||||||||
Financial Assets: | ||||||||||||||||||||
Cash and cash equivalents | $ | 20,126,028 | $ | 20,126,028 | $ | — | $ | — | $ | 20,126,028 | ||||||||||
Loans held for sale | 1,646,250 | — | 1,793,260 | — | 1,793,260 | |||||||||||||||
Loans receivable, net | 666,317,092 | — | — | 661,997,633 | 661,997,633 | |||||||||||||||
Accrued interest receivable | 2,001,488 | — | 181,352 | 1,820,136 | 2,001,488 | |||||||||||||||
FHLB and PCBB stock | 3,437,600 | N/A | N/A | N/A | N/A | |||||||||||||||
Financial Liabilities: | ||||||||||||||||||||
Deposit | $ | 661,783,900 | $ | — | $ | 662,160,942 | $ | — | $ | 662,160,942 | ||||||||||
FHLB Advances | 10,000,000 | — | 10,000,000 | — | 10,000,000 | |||||||||||||||
Accrued interest payable | 321,753 | — | 321,753 | — | 321,753 | |||||||||||||||
The methods and assumptions, not previously presented, used to estimate fair value are described as follows:
(a) Cash and Cash equivalents
The carrying amounts of cash and short-term instruments approximate fair values and are classified as Level 1.
(b) Loans Held for Sale
The fair value of loans held for sale is estimated based upon binding contracts and quotes from third party investors resulting in a Level 2 classification.
(c) Loans Receivable, Net
Fair values of loans, excluding loans held for sale, are estimated as follows: For variable rate loans that reprice frequently and with no significant change in credit risk, fair values are based on carrying values resulting in a Level 3 classification. Fair values for other loans are estimated using discounted cash flow analyses, using interest rates currently being offered for loans with similar terms to borrowers of similar credit quality resulting in a Level 3 classification. Impaired loans are valued at the lower of cost or fair value as described previously. The methods utilized to estimate the fair value of loans do not necessarily represent an exit price.
(d) FHLB and PCBB Stock
It is not practical to determine the fair value of FHLB and PCBB stock due to restrictions placed on their transferability.
F-33
Table of Contents
OP BANCORP
NOTES TO CONSOLIDATED FINANCIAL STATEMENTS
December 31, 2017 and 2016
NOTE 13—FAIR VALUE OF FINANCIAL INSTRUMENTS (Continued)
(e) Deposits
The fair values disclosed for demand deposits (e.g., interest andnon-interest checking, passbook savings, and certain types of money market accounts) are, by definition, equal to the amount payable on demand at the reporting date (i.e., their carrying amount) resulting in a Level 2 classification. The carrying amounts of variable rate, fixed-term money market accounts and certificates of deposit approximate their fair values at the reporting date resulting in a Level 2 classification. Fair values for fixed rate certificates of deposit are estimated using a discounted cash flows calculation that applies interest rates currently being offered on certificates to a schedule of aggregated expected monthly maturities on time deposits resulting in a Level 2 classification.
(f) Federal Home Loan Bank Advances
The fair values of Federal Home Loan Bank Advances are estimated using discounted cash flow analyses based on the current borrowing rates for similar types of borrowing arrangements, resulting in a Level 2 classification.
(g) Accrued Interest Receivable/Payable
The carrying amounts of accrued interest approximate fair value and are classified within the same fair value hierarchy level as the related asset or liability.
(h)Off-balance Sheet Instruments
Fair values foroff-balance sheet, credit-related financial instruments are based on fees currently charged to enter into similar agreements, taking into account the remaining terms of the agreements and the counterparties’ credit standing. The fair value of commitments is not material.
NOTE 14—REGULATORY CAPITAL MATTERS
Banks and bank holding companies are subject to regulatory capital requirements administered by federal banking agencies. Capital adequacy guidelines and, additionally for banks, prompt corrective action regulations involve quantitative measures of assets, liabilities, and certainoff-balance-sheet items calculated under regulatory accounting practices. Capital amounts and classifications are also subject to qualitative judgments by regulators. Failure to meet capital requirements can initiate regulatory action. The final rules implementing Basel Committee on Banking Supervision’s capital guidelines for U.S. banks (Basel III rules) became effective for the Company on January 1, 2015 with full compliance with all of the requirements being phased in over a multi-year schedule, and fully phased in by January 1, 2019. Under the Basel III rules, the Company must hold a capital conservation buffer above the adequately capitalized risk-based capital ratios. The capital conservation buffer is being phased in from 0.0% for 2015 to 2.50% by 2019. The capital conservation buffers for 2016 and 2017 are 0.625% and 1.25%, respectively. The net unrealized gain or loss on available for sale securities is not included in computing regulatory capital. Management believes as of December 31, 2017 and 2016, the Company and Bank meet all capital adequacy requirements to which they are subject.
F-34
Table of Contents
OP BANCORP
NOTES TO CONSOLIDATED FINANCIAL STATEMENTS
December 31, 2017 and 2016
NOTE 14—REGULATORY CAPITAL MATTERS (Continued)
Prompt corrective action regulations provide five classifications: well capitalized, adequately capitalized, undercapitalized, significantly undercapitalized, and critically undercapitalized, although these terms are not used to represent overall financial condition. If adequately capitalized, regulatory approval is required to accept brokered deposits. If undercapitalized, capital distributions are limited, as is asset growth and expansion, and capital restoration plans are required. At December 31, 2017 and 2016, the most recent regulatory notifications categorized the Bank as well capitalized under the regulatory framework for prompt corrective action. There are no conditions or events since that notification that management believes have changed the institution’s category.
Actual and required capital amounts (in thousands) and ratios, exclusive of the capital conservation buffer, are presented below at December 31, 2017 and 2016:
| Actual | Required for Capital Adequacy Purposes | Minimum To be Considered “Well Capitalized” | ||||||||||||||||||||||
| (Dollars in thousands) | Amount | Ratio | Amount | Ratio | Amount | Ratio | ||||||||||||||||||
As of December 31, 2017: | ||||||||||||||||||||||||
Total capital (to risk-weighted assets) | ||||||||||||||||||||||||
Consolidated | $ | 100,713 | 13.49 | % | $ | 59,729 | 8.00 | % | N/A | N/A | ||||||||||||||
Bank | 100,648 | 13.48 | % | 59,726 | 8.00 | % | 74,658 | 10.00 | % | |||||||||||||||
Tier 1 capital (to risk-weighted assets) | ||||||||||||||||||||||||
Consolidated | 91,510 | 12.26 | % | 44,797 | 6.00 | % | N/A | N/A | ||||||||||||||||
Bank | 91,445 | 12.25 | % | 44,795 | 6.00 | % | 59,726 | 8.00 | % | |||||||||||||||
Common equity Tier 1 capital (to risk-weighted assets) | ||||||||||||||||||||||||
Consolidated | 91,510 | 12.26 | % | 33,597 | 4.50 | % | N/A | N/A | ||||||||||||||||
Bank | 91,445 | 12.25 | % | 33,596 | 4.50 | % | 48,528 | 6.50 | % | |||||||||||||||
Tier 1 capital (to average assets) | ||||||||||||||||||||||||
Consolidated | 91,510 | 10.46 | % | 35,009 | 4.00 | % | N/A | N/A | ||||||||||||||||
Bank | 91,445 | 10.45 | % | 35,007 | 4.00 | % | 43,759 | 5.00 | % | |||||||||||||||
F-35
Table of Contents
OP BANCORP
NOTES TO CONSOLIDATED FINANCIAL STATEMENTS
December 31, 2017 and 2016
NOTE 14—REGULATORY CAPITAL MATTERS (Continued)
| Actual | Required for Capital Adequacy Purposes | Minimum To be Considered “Well Capitalized” | ||||||||||||||||||||||
| (Dollars in thousands) | Amount | Ratio | Amount | Ratio | Amount | Ratio | ||||||||||||||||||
As of December 31, 2016: | ||||||||||||||||||||||||
Total capital (to risk-weighted assets) | ||||||||||||||||||||||||
Consolidated | $ | 89,286 | 13.40 | % | $ | 53,311 | 8.00 | % | N/A | N/A | ||||||||||||||
Bank | 89,225 | 13.39 | % | 53,306 | 8.00 | % | 66,632 | 10.00 | % | |||||||||||||||
Tier 1 capital (to risk-weighted assets) | ||||||||||||||||||||||||
Consolidated | 81,304 | 12.20 | % | 39,983 | 6.00 | % | N/A | N/A | ||||||||||||||||
Bank | 81,244 | 12.19 | % | 39,979 | 6.00 | % | 53,306 | 8.00 | % | |||||||||||||||
Common equity Tier 1 capital (to risk-weighted assets) | ||||||||||||||||||||||||
Consolidated | 81,304 | 12.20 | % | 29,987 | 4.50 | % | N/A | N/A | ||||||||||||||||
Bank | 81,244 | 12.19 | % | 29,985 | 4.50 | % | 43,311 | 6.50 | % | |||||||||||||||
Tier 1 capital (to average assets) | ||||||||||||||||||||||||
Consolidated | 81,304 | 10.89 | % | 29,859 | 4.00 | % | N/A | N/A | ||||||||||||||||
Bank | 81,244 | 10.88 | % | 29,857 | 4.00 | % | 37,321 | 5.00 | % | |||||||||||||||
NOTE 15—EARNINGS PER SHARE
Thetwo-class method is used in the calculation of basic and diluted earnings per share. Under thetwo-class method, earnings available to common shares are allocated between common shares and participating securities. The Company’s restricted stock awards are considered participating securities as the unvested awards havenon-forfeitable rights to dividends, paid or unpaid, on unvested awards. The factors used in the earnings per share computation follow:
| Year Ended December 31, | ||||||||||||
| 2017 | 2016 | 2015 | ||||||||||
Basic | ||||||||||||
Net income | $ | 9,236,482 | $ | 7,425,371 | $ | 5,963,345 | ||||||
Undistributed earnings allocated to participating securities | (366,031 | ) | (402,328 | ) | (412,190 | ) | ||||||
|
|
|
|
|
| |||||||
Net income allocated to common shares | 8,870,451 | 7,023,043 | 5,551,155 | |||||||||
|
|
|
|
|
| |||||||
Weighted average common shares outstanding | 13,063,344 | 12,788,378 | 12,549,915 | |||||||||
Basic earnings per common share | $ | 0.68 | $ | 0.55 | $ | 0.44 | ||||||
|
|
|
|
|
| |||||||
Diluted | ||||||||||||
Net income allocated to common shares | $ | 8,870,451 | $ | 7,023,043 | $ | 5,551,155 | ||||||
|
|
|
|
|
| |||||||
Weighted average common shares outstanding for basic earnings per common share | 13,063,344 | 12,788,378 | 12,549,915 | |||||||||
Add: Dilutive effects of assumed exercises of stock options | 422,447 | 369,777 | 394,952 | |||||||||
|
|
|
|
|
| |||||||
Average shares and dilutive potential common shares | 13,485,791 | 13,158,155 | 12,944,867 | |||||||||
Diluted earnings per common share | $ | 0.66 | $ | 0.53 | $ | 0.43 | ||||||
|
|
|
|
|
| |||||||
F-36
Table of Contents
OP BANCORP
NOTES TO CONSOLIDATED FINANCIAL STATEMENTS
December 31, 2017 and 2016
NOTE 15—EARNINGS PER SHARE (Continued)
Stock options and restricted stock awards for 220,000, 305,000 and 305,000 shares of common stock were not considered in computing diluted earnings per common share for the year ended December 31, 2017, 2016 and 2015 because they were antidilutive.
NOTE 16—PARENT COMPANY ONLY CONDENSED FINANCIAL INFORMATION
OP Bancorp (the “Company”) is a California corporation whose common stock is quoted on the OTCQB under the ticker symbol, “OPBK.” The Company was formed to acquire 100% of the voting equity of Open Bank (the “Bank”) and commenced operation as a bank holding company on June 1, 2016. This transaction was treated as an internal reorganization as all shareholders of the Bank became shareholders of the Company. The Company has no operations other than ownership of the Bank. For the parent company only condensed statements of income and comprehensive income, and cash flows, we have assumed that the Company existed as of January 1, 2016.
Condensed financial information of OP Bancorp follows:
CONDENSED BALANCE SHEETS
December 31, 2017 and 2016
| December 31, 2017 | December 31, 2016 | |||||||
ASSETS | ||||||||
Investment in banking subsidiaries | $ | 91,414,795 | $ | 81,223,077 | ||||
Other assets | 65,155 | 60,710 | ||||||
|
|
|
| |||||
Total assets | $ | 91,479,950 | $ | 81,283,787 | ||||
|
|
|
| |||||
LIABILITIES AND SHAREHOLDERS’ EQUITY | ||||||||
Shareholders’ equity | 91,479,950 | 81,283,787 | ||||||
|
|
|
| |||||
Total liabilities and shareholders’ equity | $ | 91,479,950 | $ | 81,283,787 | ||||
|
|
|
| |||||
CONDENSED STATEMENTS OF INCOME AND COMPREHENSIVE INCOME
Years ended December 31, 2017 and 2016
| 2017 | 2016 | |||||||
Other expense | $ | 37,824 | $ | 144,464 | ||||
|
|
|
| |||||
Income before income tax and undistributed subsidiary income | (37,824 | ) | (144,464 | ) | ||||
Income tax benefit | (15,903 | ) | (59,500 | ) | ||||
Equity in undistributed subsidiary income | 9,258,403 | 7,510,335 | ||||||
|
|
|
| |||||
Net income | $ | 9,236,482 | $ | 7,425,371 | ||||
|
|
|
| |||||
F-37
Table of Contents
OP BANCORP
NOTES TO CONSOLIDATED FINANCIAL STATEMENTS
December 31, 2017 and 2016
NOTE 16—PARENT COMPANY ONLY CONDENSED FINANCIAL INFORMATION (Continued)
CONDENSED STATEMENT OF CASH FLOWS
Years ended December 31, 2017 and 2016
| 2017 | 2016 | |||||||
Cash flows from operating activities | ||||||||
Net income | $ | 9,236,482 | $ | 7,425,371 | ||||
Adjustments: | ||||||||
Equity in undistributed subsidiary income | (9,258,403 | ) | (7,510,335 | ) | ||||
Change in other assets | 21,921 | 84,964 | ||||||
|
|
|
| |||||
Net cash from operating activities | — | — | ||||||
Cash flows from investing activities | ||||||||
Investment in subsidiaries | — | — | ||||||
|
|
|
| |||||
Net cash from investing activities | — | — | ||||||
Cash flows from financing activities | ||||||||
Proceeds from subsidiaries | — | — | ||||||
|
|
|
| |||||
Net cash from financing activities | — | — | ||||||
|
|
|
| |||||
Net change in cash and cash equivalents | — | — | ||||||
Cash and cash equivalents at beginning of year | — | — | ||||||
|
|
|
| |||||
Cash and cash equivalents at end of year | $ | — | $ | — | ||||
|
|
|
| |||||
F-38
Table of Contents
OP Bancorp
2,000,000 Shares
Common Stock
PROSPECTUS
March 27, 2018
Book-Running Manager
Keefe, Bruyette & Woods
A Stifel Company
Co-Manager
D.A. Davidson & Co.
Through and including April 21, 2018 (25 days after the date of this prospectus), all dealers that effect transactions in our common stock, whether or not participating in this offering, may be required to deliver a prospectus. This delivery requirement is in addition to the obligation of dealers to deliver a prospectus when acting as underwriters and with respect to their unsold allotments or subscriptions.