n
UNITED STATES
SECURITIES AND EXCHANGE COMMISSION
Washington, D.C. 20549
FORM 10-K
(Mark One)
| |
☒ | ANNUAL REPORT PURSUANT TO SECTION 13 OR 15(d) OF THE SECURITIES EXCHANGE ACT OF 1934 |
For the fiscal year ended December 31, 2019
or
| |
☐ | TRANSITION REPORT PURSUANT TO SECTION 13 OR 15(d) OF THE SECURITIES EXCHANGE ACT OF 1934 |
For the transition period from to
Commission File Number 001-38510
COVIA HOLDINGS CORPORATION
(Exact name of registrant as specified in its charter)
Delaware | | 13-2656671 |
(State or Other Jurisdiction | | (I.R.S. Employer |
of Incorporation or Organization) | | Identification No.) |
3 Summit Park Drive, Suite 700
Independence, Ohio 44131
(Address of Principal Executive Offices) (Zip Code)
(800) 255-7263
(Registrant’s Telephone Number, Including Area Code)
Securities registered pursuant to Section 12(b) of the Securities Act:
Title of each class | Trading Symbol(s) | Name of each exchange on which registered |
Common Stock | CVIA | New York Stock Exchange |
Securities registered pursuant to Section 12(g) of the Securities Act: None
Indicate by check mark if the registrant is a well-known seasoned issuer, as defined in Rule 405 of the Securities Act. Yes ☐ No ☒
Indicate by check mark if the registrant is not required to file reports pursuant to Section 13 or Section 15(d) of the Act. Yes ☐ No ☒
Indicate by check mark whether the registrant (1) has filed all reports required to be filed by Section 13 or 15(d) of the Securities Exchange Act of 1934 during the preceding 12 months (or for such shorter period that the registrant was required to file such reports), and (2) has been subject to such filing requirements for the past 90 days. Yes ☒ No ☐
Indicate by check mark whether the registrant has submitted electronically every Interactive Data File required to be submitted pursuant to Rule 405 of Regulation S-T (§232.405 of this chapter) during the preceding 12 months (or for such shorter period that the registrant was required to submit such files). Yes ☒ No ☐
Indicate by check mark whether the registrant is a large accelerated filer, an accelerated filer, a non-accelerated filer, a smaller reporting company, or an emerging growth company. See the definitions of “large accelerated filer,” “accelerated filer,” “smaller reporting company,” and “emerging growth company” in Rule 12b-2 of the Exchange Act:
Large accelerated filer | ☐ | | Accelerated filer | ☒ |
Non-accelerated filer | ☐ | | Smaller reporting company | ☐ |
Emerging growth company | ☐ | | | |
If an emerging growth company, indicate by check mark if the registrant has elected not to use the extended transition period for complying with any new or revised financial accounting standards provided pursuant to Section 13(a) of the Exchange Act. ☐
Indicate by check mark whether the registrant is a shell company (as defined in Rule 12b-2 of the Exchange Act). Yes ☐ No ☒
The aggregate market value of shares of common stock, par value $0.01 per share (“Common Stock”) held by non-affiliates of the registrant computed by reference to the last sales price, $1.96 as reported on the New York Stock Exchange, of such common stock as of the closing of trading on June 28, 2019: $76,748,710
Number of shares of Common Stock outstanding as of March 9, 2020: 132,023,251
DOCUMENTS INCORPORATED BY REFERENCE
Portions of the definitive proxy statement relating to the registrant’s Annual Meeting of Shareholders to be held on May 21, 2020, which will be filed within 120 days of the end of the registrant’s fiscal year ended December 31, 2019 (“Proxy Statement”), are incorporated by reference into Part III of this Form 10-K to the extent described therein.
Covia Holdings Corporation and Subsidiaries
Annual Report on Form 10-K
For the Fiscal Year Ended December 31, 2019
Table of Contents
2
PART I
Various terms used in this Annual Report on Form 10-K (this “Report”) are defined to simplify the presentation of information. Unless stated otherwise or the context otherwise requires, the terms “we,” “us,” “our,” “Covia,” and “Company” refer to Covia Holdings Corporation and its consolidated subsidiaries. In addition, “Unimin” refers to Unimin Corporation, which is now known as Covia Holdings Corporation, and “Fairmount Santrol” refers to Fairmount Santrol Holdings Inc., which is now known as Bison Merger Sub I, LLC.
Unless otherwise noted, references to a particular year are to our fiscal year, which corresponds to the calendar year ended or ending on December 31 of the same year. For example, a reference to “2019” is a reference to the year ended December 31, 2019.
Special Note of Caution Regarding Forward-Looking Statements
Certain information included in this Report or in other materials we have filed or will file with the Securities and Exchange Commission (“SEC”) (as well as information included in oral statements or other written statements made or to be made by us) contains or may contain forward-looking statements, including, but not limited to, statements regarding our future financial performance and financial condition. Similarly, all statements we make relating to our strategies, plans, goals, objectives, and targets, as well as our estimates and projections of results, sales, earnings, costs, expenditures, cash flows, growth rates, initiatives, and the outcomes or impacts of pending or threatened litigation or regulatory actions are also forward-looking statements. Words such as “anticipate,” “estimate,” “expect,” “objective,” “goal,” “project,” “intend,” “plan,” “believe,” “assume,” “will,” “should,” “may,” “can have,” “likely,” “target,” “forecast,” “guide,” “guidance,” “outlook,” “seek,” “strategy,” “future,” and variations of such words and similar expressions are intended to identify such forward-looking statements. These statements involve a number of risks and uncertainties. Any forward-looking statements that we make herein and in future reports and statements are not guarantees of future performance, and actual results may differ materially from those in such forward-looking statements as a result of various risk factors. Please see “Item 1A – Risk Factors” in Part I of this Report for more information regarding those risk factors.
Any forward-looking statement speaks only as of the date made. Except as required by applicable law, we undertake no obligation to publicly update any forward-looking statements, whether as a result of new information, future events or otherwise. However, any further disclosures made on related subjects in our subsequent reports on Forms 10-K, 10-Q and 8-K should be consulted. This discussion is provided as permitted by the Private Securities Litigation Reform Act of 1995, and all of our forward-looking statements are expressly qualified in their entirety by the cautionary statements contained or referenced in this section.
ITEM 1. BUSINESS
Our Company
Business Overview
Covia, a Delaware corporation incorporated in 1970, is a leading provider of diversified mineral-based and material solutions for the Industrial and Energy markets in North America and around the world. We produce a wide range of specialized silica sand, feldspar, nepheline syenite, calcium carbonate, clay, and kaolin products for use in the glass, ceramics, coatings, foundry, polymers, construction, water filtration, sports and recreation, and oil and gas markets. We currently have 36 active mining facilities with over 40 million tons of annual mineral processing capacity. Our mining and coating facilities span North America and have many sites in close proximity to our customer base.
Our operations are organized into two segments based on the primary end markets we serve – Energy and Industrial. Our Energy segment offers the oil and gas industry a comprehensive portfolio of raw frac sand, value-added proppants, well-cementing additives, gravel-packing media and drilling mud additives, and a fully-integrated, last mile logistic service which delivers product directly to the well site. Our Energy segment products serve hydraulic fracturing operations in the U.S., Canada, Argentina, Mexico, China, and northern Europe. The Energy segment represented approximately 54% of our total revenues for 2019.
Our Industrial segment provides whole-grain, value-added, and custom-blended products to the glass, ceramics, coatings, foundry, polymers, construction, water filtration, sports and recreation, and various other industries, primarily in North America. The Industrial segment represented approximately 46% of total revenues for 2019.
We believe our segments are complementary. Our ability to sell to a wide range of customers across multiple end markets allows us to improve the recovery of our reserve base within our mining operations and to partially insulate the cyclicality of our earnings.
3
Corporate Information
We are publicly traded on the New York Stock Exchange (“NYSE”) under the ticker symbol “CVIA.” Our corporate headquarters is located at 3 Summit Park Drive, Suite 700, Independence, Ohio 44131. Our telephone number is (800) 255-7263. Our website is located at www.coviacorp.com. We make available free of charge on or through our website our annual report on Form 10-K, quarterly reports on Form 10-Q, current reports on Form 8-K, and amendments to those reports filed or furnished pursuant to Section 13 or 15(d) of the Securities Exchange Act of 1934, as amended (“Exchange Act”), as well as our proxy materials filed pursuant to Section 14 of the Exchange Act, as soon as reasonably practicable after we file such reports or materials with, or furnish such reports or materials, to the SEC. The information on our website is not incorporated by reference in or considered to be a part of this Report. The SEC maintains a website, www.sec.gov, which contains reports, proxy and information statements, and other information regarding issuers that file electronically with the SEC.
Covia was founded through the Combination of Unimin and Fairmount Santrol
On June 1, 2018 (“Merger Date”), Unimin completed a business combination (“Merger”) whereby Fairmount Santrol merged into a wholly-owned subsidiary of Unimin and ceased to exist as a separate corporate entity. Immediately following the consummation of the Merger, Unimin changed its name to Covia Holdings Corporation and began operating under that name. The common stock of Fairmount Santrol was delisted from the NYSE prior to the market opening on June 1, 2018, and Covia commenced trading under the ticker symbol “CVIA” on that date. Upon the consummation of the Merger, the former stockholders of Fairmount Santrol (including holders of certain Fairmount Santrol equity awards) received, in the aggregate, $170 million in cash consideration and approximately 35% of the common stock of Covia. Approximately 65% of the outstanding shares of Covia common stock was owned by SCR-Sibelco NV (“Sibelco”), the parent company of Unimin prior to the Merger, as of December 31, 2019.
In connection with the Merger, we redeemed approximately 18.5 million shares of Unimin common stock from Sibelco in exchange for an amount in cash equal to approximately (i) $660 million plus interest accruing at 5.0% per annum for the period from September 30, 2017 through June 1, 2018 less (ii) $170 million in cash paid to Fairmount Santrol stockholders.
In connection with the Merger, we also completed a debt refinancing transaction, with Barclays Bank PLC as administrative agent (“Barclays”), by entering into a $1.65 billion senior secured term loan (“Term Loan”) and a $200 million revolving credit facility (“Revolver”). The proceeds of the Term Loan were used to repay the indebtedness of Unimin and Fairmount Santrol and to pay the cash portion of the Merger consideration and expenses related to the Merger. We voluntarily canceled the Revolver, effective on December 31, 2019. Under the terms of the Term Loan agreement, we pledged as collateral our mining and processing facilities within the U.S. (“Guarantor Subs”) and 65% of the equity interest of our foreign operations (“Non-Guarantor Subs”) as collateral. For more information regarding the termination of the Revolver, see “Item 7 – Management’s Discussion and Analysis – Liquidity and Capital Resources.”
As a condition to the Merger, Unimin contributed certain assets of its Electronics segment, including $31.0 million of cash to Sibelco North America, Inc. (“HPQ Co.”), a newly-formed wholly owned subsidiary of Unimin, in exchange for all of the capital stock of HPQ Co. and the assumption by HPQ Co. of certain liabilities. Unimin distributed all of the stock of HPQ Co. to Sibelco in exchange for 169,550 shares (or 15.1 million shares subsequent to the stock split, described in Note 7 in the Notes to our Consolidated Financial Statements) of Unimin common stock held by Sibelco.
Costs and expenses incurred related to the Merger are recorded in Other non-operating expense, net in the accompanying Consolidated Statements of Income and include legal, accounting, valuation and financial advisory services, integration and other costs totaling $0.9 million, $51.1 million, and $19.3 million for 2019, 2018, and 2017, respectively.
Unimin was determined to be the acquirer in the Merger for accounting purposes, and the historical financial statements and the historical amounts included in the notes to our consolidated financial statements relate to Unimin. The Consolidated Statements of Income for 2018 includes the results of Fairmount Santrol from the Merger Date. The Consolidated Balance Sheet at December 31, 2018 reflects Covia. The presentation of information for periods prior to the Merger Date are not fully comparable to the presentation of information for periods presented after the Merger Date because the results of operations for Fairmount Santrol are not included in such information prior to the Merger Date.
4
Discontinued Operations
On May 31, 2018, prior to and as a condition to the closing of the Merger, Unimin contributed certain assets comprising its global high purity quartz business in exchange for all of the stock of HPQ Co. and the assumption by HPQ Co. of certain liabilities. Unimin distributed 100% of the stock of HPQ Co. to Sibelco in exchange for 169,550 shares (or 15.1 million shares subsequent to the stock split) of Unimin common stock held by Sibelco. HPQ Co. is presented as discontinued operations in our Consolidated Financial Statements.
As part of the disposition of HPQ Co., Covia and HPQ Co. entered into an agreement that governs their respective rights, responsibilities, and obligations relating to tax liabilities, the filing of tax returns, the control of tax contests, and other tax matters (the “Tax Matters Agreement”). Under the Tax Matters Agreement, Covia and HPQ Co. (and their affiliates) are responsible for income taxes required to be reported on their respective separate and group tax returns; however, HPQ Co. is responsible for any unpaid income taxes attributable to the HPQ Co. business prior to May 31, 2018, as well as any unpaid non-income taxes as of May 31, 2018 attributable to the HPQ Co. business (whether arising prior to May 31, 2018 or not). Covia is responsible for all other non-income taxes. Covia and HPQ Co. will equally bear any transfer taxes imposed in this transaction. Rights to refunds in respect of taxes will be allocated in the same manner as the responsibility for tax liabilities.
Seasonality
Our business is affected to some extent by seasonal fluctuations that impact our production levels and our customers’ business needs. For example, demand for many of the products sold by our Industrial segment in the construction and coatings sectors tends to correlate with construction activity, which is lowest in the fourth quarter due to seasonal shift in construction driven by adverse weather conditions. Additional volumes sold by our Energy segment tend to be slower in the first and fourth quarter compared to the second and third quarter. Inclement weather may also cause temporary slowdowns for our customers, which may impact our sales volumes. A majority of our facilities are all-weather facilities capable of various levels of production throughout the year.
Employees
As of December 31, 2019, we had approximately 2,633 employees. We believe that we maintain good relations with our workforce and maintain an active dialogue with employees. We provide salaried and hourly employees a comprehensive benefits package, including medical, life and accident insurance, incentive bonus programs and a 401(k) plan with an employer match and discretionary employer contribution, company pension (for certain employees) as well as various employee training and development programs that have been developed internally or through a third party.
As of December 31, 2019, approximately 35% of our employees were parties to collective bargaining contracts covered under approximately 25 union agreements in the U.S., Canada and Mexico. We believe we have strong relationships with and maintain an active dialogue with union representatives. We have historically been able to successfully extend and renegotiate collective bargaining agreements as they expire. We have not experienced a significant work stoppage or strike at any of our facilities in nearly 20 years.
Energy Segment Overview
Advances in oil and gas extraction techniques, such as horizontal drilling and hydraulic fracturing, have allowed for significantly greater extraction of oil and gas trapped within shale formations. The hydraulic fracturing process consists of pumping fluids down a well at pressures sufficient to create fractures in the targeted hydrocarbon-bearing rock formation in order to increase the flow rate of hydrocarbons from the well. A granular material, called proppant, is suspended and transported in the fluid and fills the fracture, propping it open once high-pressure pumping stops. The proppant-filled fracture creates a conductive channel through which the hydrocarbons may flow more freely from the formation into the wellbore and then to the surface. Proppants therefore perform the vital function of promoting the flow, or conductivity, of hydrocarbons over the productive life of a well. In fracturing a well, operators select a proppant that is transportable into the fracture, is compatible with frac and wellbore fluids, permits acceptable cleanup of frac fluids and can resist proppant flowback. In addition, the proppant must be resistant to crushing under the earth’s closure stress and reservoir temperature. Our Energy segment serves customers in the oil and gas industry, providing a variety of proppants and other oilfield minerals for use in hydraulic fracturing in, primarily, the U.S. and Canada. The oil and natural gas proppant industry is comprised of businesses involved in the mining or manufacturing, distribution and sale of the propping agents used in hydraulic fracturing, the most widely used method for stimulating increased production from lower permeability oil and natural gas reservoirs.
5
Frac Sand Extraction, Processing, and Distribution
Raw frac sand is a naturally occurring mineral that we mine and process. While the specific extraction method that we utilize depends primarily on the geologic conditions, we mine most of our raw frac sand using conventional open-pit extraction methods. The composition, depth, and chemical purity of the sand also dictate the processing method and equipment utilized. After extraction, raw frac sand is washed with water to remove fine impurities such as clay and organic particles, with additional procedures used when contaminants are not easily removable. The final steps in our production process involve the drying and screening of the raw frac sand according to mesh size.
We ship most frac sand in bulk from the processing facility to customers by truck, rail or barge. Because transportation costs may represent a significant portion of the overall delivered product cost, shipping in large quantities, particularly when shipping over long distances, provides a significant cost advantage to the suppliers, which highlights the importance of rail or barge access for low cost delivery. As a result, our facility location and logistics capabilities are an important consideration for suppliers and customers.
Energy Proppant Market
There are three primary types of proppant that are utilized in the hydraulic fracturing process: raw frac sand, coated sand and manufactured ceramic beads. Our customers generally choose among these proppant types based on the geology of the reservoir, expected well pressures, proppant flowback concerns, and product cost. Given the price differences between the various proppant products and well-specific considerations, oil and natural gas exploration and production (“E&P”) and oilfield service (“OFS”) companies are continually evaluating the cost and conductivity of the various proppants that we provide in order to best address the geology of the well and to maximize well productivity and economic returns.
Our Energy Products and Services
We offer a broad suite of proppant products designed to address nearly all well environments and related down-hole challenges faced by our customers. Revenues in our Energy segment are generally derived from the sale of raw sand plus the sale of certain value-added products.
Northern White Frac Sand. Our Northern White frac sand is produced from geologically mature quartz arenite sands mined from deposits located primarily in the northern half of the U.S. These reserves are generally characterized by high purity, structural integrity, significant roundness and sphericity, and low turbidity.
In-Basin “Local” Frac Sand. Our in-basin “local” reserves are located in West Texas and Oklahoma. Our local frac sand has less crush strength, less sphericity, and lower silica content relative to our Northern White products, however, is suitable in certain well environments. These reserves are in close proximity to the Permian, Eagle Ford, and Mid-Continental basins, which provides them with a significant transportation cost advantage relative to Northern White frac sand sourced from more distant locations.
Value-Added Products. We coat a portion of our sand with resin to enhance certain performance characteristics. Our value-added proppants are generally used in higher temperature and higher pressure well environments and are marketed to end users who require increased conductivity in higher pressure wells, high crush resistance, and/or enhanced flow back control in order to enhance the productivity of their wells.
Our resin coated sand products are sold as both tempered (or pre-cured) and curable (or bonding) products. Curable coated sand bonds down hole as the formation heat causes neighboring coated sand grains to polymerize with one another holding proppant into place. This mitigates the risk of proppant flowing back out of the fracture when the oil or natural gas well commences production. For certain resin products, the resin’s chemical properties are triggered by the introduction of an activator into the frac fluid. We formulate, manufacture, and sell activators, which work with the specific chemistry of our resins. Tempered products do not require activation because they are not intended to bond, rather they are designed to bring additional strength to the proppant.
Our DST™ dust suppression technology is a coating applied to sand to minimize the risk of silica dust exposure, which is regulated by the U.S. Occupational Safety and Health Administration (“OSHA”).
Our silica-based well cementing additives keep cement strong, bonding cement together even under acidic conditions, and reduce strength retrogression in well temperatures greater than 230°F. We market these additives as SilverBond®.
6
Our silica-based gravel packing sands are high quality monocrystalline and reduce the production of reservoir sands while still producing hydrocarbons. We market these sands as Accupack®.
Last Mile Logistics Solutions. We have contracted with last mile logistics (“LML”) providers to offer an integrated mine-to-well solution to our customers. Through these relationships, we lease systems from the LML providers, allowing us to offer multiple LML options to our customers, such as silos or boxes, based on their preferences.
In selecting LML partners, we have focused on those that can provide high volume of proppant per truck load, minimized well pad footprint, fast unloading times and strong safety records.
Industrial Segment Overview
Our Industrial segment’s products are sold to customers in the glass, construction, ceramics, foundry, coatings, polymers, sports and recreation, filtration and various other industries. The sales in our Industrial segment correlate strongly with overall economic activity levels in the U.S. and Mexico as reflected in the gross domestic product (“GDP”), unemployment levels, vehicle production and growth in the housing market.
Industrial Markets and Products
Glass.
We offer one of the largest multi-facility and multi-product mineral portfolios serving the North American glass market. We believe that our longstanding customer relationships, reputation for consistent quality and operating capabilities provide us with a competitive advantage. The glass market includes three primary sub-markets: container glass; flat glass; and fiberglass. Our primary product for sale to the each of these sub-markets into the glass market is produced from high silica content sand deposits throughout North America, however, we also supply the glass industry with nepheline syenite and other mineral additives to be used in fiberglass products and other applications. Glass batch formulations determine the raw material requirements of the glass manufacturer and differ based upon the requirements of the end-use product.
The main products we supply for container glass production are whole grain silica, ground silica, feldspar and nepheline syenite. Container glass is primarily comprised of bottles and demand in the U.S. tends to follow U.S. gross domestic product growth and has driven stable volumes for suppliers of silica, feldspar and nepheline syenite. In Mexico, growth in the worldwide consumption of beer produced and bottled in Mexico has increased the demand by Mexican breweries for glass bottles, which has increased demand for high-quality silica sand.
The flat glass sub-market is primarily comprised of automotive glass and windows for residential and commercial applications. The main product we supply into the flat glass industry is whole grain silica.
The fiberglass sub-market produces fine filament fiber used in fiberglass reinforced plastic, which is used in watercrafts, automobiles and other industrial applications as well as the production of fiberglass for home and business insulation. The main products we supply to the fiberglass industry include ground silica and fiberglass grade kaolin.
Ceramics. The ceramics manufacturing market includes a diverse mix of products. The main types of ceramics produced include sanitaryware (e.g., toilets, wash basins, pedestals, bidets, urinals, sinks and bathtubs), clay brick and tiles (frequently used in residential construction). Sanitaryware is made primarily with clay (ball clay or China clay), quartz and feldspar. The majority of sanitaryware sold in the U.S. is produced in Mexico, while the ceramic tile industry has continued to grow as Italian manufacturers have established production facilities in the U.S.
We supply the ceramics market with nepheline syenite, granular silica, potassium feldspar, pressing clays, ceramic casting clays, refractory grade clays, plastic forming clays and sodium feldspar. Additionally, we distribute Ukrainian and United Kingdom ball clays, potassium feldspar from India and French pebbles used as grinding media. We believe that our low-cost production and geographic proximity to many of our customers, combined with a broad product offering, are major factors contributing to our competitive position in the ceramics market.
7
Construction. The construction market, driven by urbanization, new home construction, remodeling and repair, and commercial buildings, drives demand for many of our products, such as carpet backings and roofing tiles. Customers in the construction market seek suppliers who can offer multi-product mineral offerings, multi-plant production capabilities, diversified and low-cost logistics solutions and superior customer and technical service. Understanding the features of our products and the benefits they deliver to our customers’ processes and products are key characteristics that have made us a leading minerals supplier to the construction market. Customers also seek reliable and consistent suppliers of minerals, which vary by size, shape, chemistry or other physical characteristics. We believe we are well-situated to serve customers in the construction industry due to our mine locations and manufacturing footprint, which we believe provide broad geographic coverage and access to customers either by truck or rail.
Coatings. The architectural and industrial coatings market includes coatings and specialty materials for customers in a wide array of end uses, including industrial equipment and components, packaging material, aircraft and marine equipment and automotive original equipment. Paint and coatings manufacturers also serve commercial and residential new build and maintenance customers by supplying coatings to painting and maintenance contractors and directly to consumers for decoration and maintenance. The architectural coatings industry is highly competitive and consists of several large firms with global presence and many smaller firms serving local or regional customers. Price, product performance, technology, cost effectiveness, quality and technical and customer service are major competitive factors in the industrial, automotive OEM, packaging coatings and coatings services businesses. Our coatings products in North America include nepheline syenite, microcrystalline silica, kaolin and silica.
Polymers. Polymers are chemical compounds or a mixture of compounds formed by polymerization and consisting essentially of repeating structural units. Because of their low density and their ability to be shaped and molded at relatively low temperatures compared to traditional materials such as metals, polymers are widely used across several industrial markets. Parts and components that have traditionally been made of wood, metal, ceramic or glass are now being redesigned with polymers.
Packaging, construction, transportation and electrical & electronic (“E&E”) are the four largest polymer sub-markets. While packaging is the largest application in terms of volume, applications such as construction, transportation and E&E offer more value with intense use of additives and fillers.
The usage of our products, particularly nepheline syenite, in polymer markets has been growing due to a number of factors, including an expanded customer base as a result of approval of food-contact applications by the U.S. Food and Drug Administration and development of new products in composites, color concentrates and building and construction products (window and door frames, vinyl sidings and fencing). Our products for the polymers market include nepheline syenite, calcium carbonate, crystalline silica and kaolin.
Foundry and Metallurgical. We currently supply the foundry market with multiple grades of sands for molding and core-making applications, with products sold primarily in the U.S., Canada, Mexico, Japan, and China. Foundry sands are characterized by high purity, round and sub-angular sands precisely screened to perform under a variety of metal casting conditions. These factors dictate the refractory level and physical characteristics of the mold and core, which have a significant effect on the quality of the castings produced in the foundry. We also supply resin binders which provide the necessary bonding of molds and cores in casting applications and are designed to improve overall productivity and environmental conditions in the workplace. We supply foundries with metallurgical consumables, which are required by all metal refining and casting operations.
Our silica sand foundry activities are typically local by nature and developed in conjunction with other industries to maximize productivity and profitability of existing assets. Foundry sand availability in North America is strongly influenced by heavy industries, including glass, automotive, equipment and oil and gas. We serve the foundry market through multiple product offerings, including our silica, resin coated sand, and refractory grade clays.
Sports and Recreation. We are a leading supplier of various turf and landscape infill products to contractors, municipalities, nurseries, and mass merchandisers. Our turf-related products are used in multiple major sporting facilities, including First Energy Stadium and Progressive Field in Ohio, PNC Park in Pennsylvania, Notre Dame Stadium in Indiana, and ADPRO Sports Training Center Fieldhouse in New York. In addition, we are a significant supplier of bunker sand, top dressing sands, and all-purpose sands to golf courses and landscape contractors throughout North America. Our sands are also supplied to horse tracks and training facilities. We also provide colored sand to a variety of major retailers for use as play sand and arts and crafts.
8
Product Delivery
Among the most important purchasing criteria of our customers is the ability to deliver products upon demand at the desired time and location at the lowest possible cost. We have a comprehensive and diversified supply chain network, which we believe provides us a competitive advantage. Our size and scale provide broad supply chain flexibility, which we optimize on a weekly basis using leading technology. Our logistics network includes distribution terminals in all major oil and gas basins, as well as selected locations to serve Industrial customers.
Many of our facilities are situated with access to five Class 1 railroads providing direct service to every major oil and gas basin in the U.S. as well as transport significant industrial volumes long distances to customers. To serve these locations and customers, we have access to a fleet of railcars and are one of the few North American mineral producers capable of Class 1 railroad deliveries in each of North America’s major oil and gas producing basins. We generally ship products to either a customer-owned terminal location or a Covia owned or operated terminal, where products are stored until provided to a customer, or to one of our processing facilities for value-added processing. The direct rail access of our processing and distribution facilities reduces handling costs and lead-times while enhancing production throughput, resulting in improved responsiveness to our customers.
Last Mile Logistics Solutions. We have arrangements with third parties to provide our customers with last mile logistics (“LML”). Through these arrangements, we lease systems from LML providers, and offer our customers an integrated mine-to-well site solution. The arrangements also allow us to offer multiple LML options to our customers, such as silos or boxes, based on their preferences.
In selecting LML providers, we have focused on those that can provide high volume of proppant per truck load, minimized well pad footprint, fast unloading times and strong safety records.
Raw Materials
Our products depend on the availability of certain raw materials, including natural gas or propane, resins and additives, bagging supplies, and other raw materials. These raw materials are readily available from a variety of sources and we are not dependent on any one supplier of raw materials. See “Part I, Item 2 – Properties” of this Report for additional information regarding the sources of our mineral products.
Our Customers
Our strategy has been to partner with the largest companies in the markets they serve. The strength of our customer base is driven by our collaborative approach to product innovation and development, reputation for high quality, the consistency and reliability of our products and the scale of our operations and logistics network. We currently serve approximately 2,000 customers across a variety of industries in the U.S., Canada, Mexico and the rest of the world. A significant portion of our sales by volume is derived from customers with whom we have long-term relationships. In 2019, no customers exceeded 10% of revenues. In 2018, one customer exceeded 10% of revenues. This customer accounted for 13% of our revenues in 2018. A large portion of our Energy segment sales are generated by a limited number of customers, and the loss of, or a significant reduction in purchases by, our largest customers could adversely affect our operations. Top customers may not continue to purchase the same levels of product in the future due to a variety of reasons, notwithstanding any contract requirements.
We primarily sell products under supply agreements with terms that vary by customer. Certain of our supply agreements require the customer to purchase a specified percentage of its product requirements from us. Other agreements require the customer to purchase a minimum volume from us. These minimum volume contracts often require the customer to pay us specified liquidated damages if the purchased volume does not meet the required minimums. Specific custom orders are generally filled upon request, and backlog is not a material factor.
Intellectual Property
Our intellectual property consists primarily of patents, trade secrets, know-how, and trademarks. Our trademarks include, but are not limited to, our name Covia™ and products such as DSTTM, Unifrac®, Minex®, Glassil®, Propstar®, Imsil®, Granusil®, Puresil®, HyperProp®, and CoolSet®. We hold numerous U.S. and foreign-granted patents that are still in force as well as many U.S. and foreign patent applications that are pending. The majority of our patents have an expiration date after 2025.
9
We believe that our extensive experience, trade secrets and know-how with a variety of different products enables us to offer our customers a wide range of proppants for their particular application. We operate laboratories in the U.S. and Mexico, which provide mineral processing, analytics and materials research for product and application development across the oil and gas, glass, ceramics, coatings and polymers industries. The staffing across of our laboratories include professionals in analytical chemistry, mineral processing, mineralogy, inorganic chemistry, material science, coatings science, polymer science and related fields. We also employ technical sales personnel covering our core target industries.
Competition
In our Energy segment, we compete with numerous large and small producers operating across all of the major frac sand producing regions of North America. Our main competitors in the raw frac sand industry include Atlas Sand Company, LLC; Badger Mining Corporation; Black Mountain Silica; CARBO Ceramics, Inc.; Emerge Energy Services LP; Hi-Crush Inc.; Signal Peak Silica, LLC; Smart Sand Inc.; Superior Silica; and U.S. Silica Holdings, Inc. Our main competitors in the coated products industry include Atlas Resin Proppants LLC; CARBO Ceramics, Inc.; Momentive Performance Materials Inc.; Signal Peak Silica, LLC; Vista Sands; and U.S. Silica Holdings, Inc. The most important competitive factors in our Energy segment are reliability of supply, price, customer relationships, supply chain management, processing quality, performance, sand and proppant characteristics, transportation capabilities, and proximity of supply to a customer’s well site.
In our Industrial segment, we compete with large diversified companies but also with smaller, local producers on product quality, product consistency and reliably delivering products at a competitive price. Competitors may produce minerals similar to those sold by us or they may produce substitute products that offer similar functionality. In our Industrial segment, we compete primarily against 3M; A.F. Gelhar Co., Inc.; Active Minerals; Astra; Badger Mining Corporation; Capital Sand Company, Inc.; Cimbar; Custom Grinders; Florida Rock Industries; G3 Enterprises; Granite Mountain; Imerys; J.M. Huber; J.R. Simplot; Lane Mountain Company; Lhoist; Manley Bros. of Indiana, Inc.; Mavisa; Minerali; Old Hickory; Omya; Short Mountain Silica; Sierra Silica; The Nugent Sand Co., Inc.; U.S. Silica Holdings, Inc.; and Whibco of New Jersey, Inc.
Regulation and Legislation
Mining and Workplace Safety
Federal Regulation
The U.S. Mine Safety and Health Administration (“MSHA”) is the primary regulatory organization governing the commercial silica mining industry. Accordingly, MSHA regulates quarries, surface mines, underground mines, and the industrial mineral processing facilities associated with quarries and mines. MSHA administers the provisions of the Federal Mine Safety and Health Act of 1977 (the “Mine Act”) and enforces compliance with mandatory safety and health standards. As part of MSHA’s oversight, representatives perform at least two unannounced inspections annually for each above-ground facility. To date, these inspections have not resulted in any citations for material violations of MSHA standards.
We also are subject to the requirements of OSHA and comparable state statutes that regulate the protection of the health and safety of workers. In addition, the OSHA Hazard Communication Standard requires that information be maintained about hazardous materials used or produced in operations and that this information be provided to employees, state and local government authorities and the public. OSHA regulates users of commercial silica and provides detailed regulations requiring employers to protect employees from overexposure to silica through the enforcement of permissible exposure limits.
We adhere to an occupational health program aimed at controlling exposure to silica dust, which includes dust sampling, a respiratory protection program, medical surveillance, training, and other components. Our safety program is designed to ensure compliance with the standards of our Occupational Health and Safety Manual and MSHA regulations. For both health and safety issues, extensive training is provided to employees. We have safety committees at our plants consisting of salaried and hourly employees. We perform annual internal health and safety audits and conduct annual crisis management drills to test our plants’ abilities to respond to various situations. Our corporate health and safety department administers health and safety programs with the assistance of plant local environmental, health and safety coordinators.
10
Environmental Matters
We and our competitors are subject to extensive governmental regulation on, among other things, matters such as permitting and licensing requirements, plant and wildlife protection, hazardous materials, air and water emissions, and environmental contamination and reclamation. A variety of federal, state, and local agencies implement and enforce these regulations.
Federal Regulation
At the federal level, we may be required to obtain permits under Section 404 of the Clean Water Act from the U.S. Army Corps of Engineers for the discharge of dredged or fill material into waters of the U.S., including wetlands and streams, in connection with our operations. We also may be required to obtain permits under Section 402 of the Clean Water Act from the U.S. Environmental Protection Agency (“EPA”) (or the relevant state environmental agency in states where the permit program has been delegated to the state) for discharges of pollutants into waters of the U.S., including discharges of wastewater or storm water runoff associated with construction activities. Failure to obtain these required permits or to comply with their terms could subject us to administrative, civil and criminal penalties as well as injunctive relief.
The U.S. Clean Air Act (the “CAA”) and comparable state laws regulate emissions of various pollutants through air emissions permitting programs and the imposition of other requirements, such as monitoring and reporting requirements. These regulatory programs may require us to install expensive emissions abatement equipment, modify our operational practices and obtain permits for our existing operations. Before, commencing construction on a new or modified source of air emissions, such laws may require us to obtain pre-approval for the construction or modification of certain projects or facilities extended to produce or significantly increase air emissions. In addition, air permits are required for all of our processing and terminal operations, and certain of our frac sand mining operations that result in the emission of regulated air contaminants. Obtaining air emissions permits may delay the development or continued performance of our operations. As a result, we may be required to incur increased capital and operating costs because of these regulations. We could be subject to administrative, civil, and criminal penalties as well as injunctive relief for noncompliance with air permits or other requirements of the CAA and comparable state laws and regulations.
Methane, a primary component of natural gas, and carbon dioxide, a byproduct of the burning of natural gas, are examples of greenhouse gases (“GHGs”). In recent years, the U.S. Congress has considered legislation to reduce emissions of GHGs.
Independent of the U.S. Congress, the EPA has adopted regulations controlling GHG emissions under its existing authority under the CAA. In 2009, the EPA officially published its findings that emissions of carbon dioxide, methane and other GHGs present an endangerment to human health and the environment because emissions of such gases are, according to the EPA, contributing to warming of the earth’s atmosphere and other climatic changes. These findings by the EPA allow the agency to proceed with the adoption and implementation of regulations that would restrict emissions of GHGs under existing provisions of the CAA. In 2010, the EPA published a final rule expanding its existing GHG emissions reporting rule for certain petroleum and natural gas facilities that emit 25,000 metric tons or more of carbon dioxide equivalent per year. We are subject to annual GHG reporting obligations for our operations in Wedron, Illinois; Nephton, Ontario, Canada; Saint Canut, Quebec, Canada; Canoitas, Mexico; and Jaltipan, Mexico locations.
As part of our operations, we utilize or store petroleum products and other substances such as diesel fuel, lubricating oils, and hydraulic fluid. We are subject to regulatory programs pertaining to the storage, use, transportation, and disposal of these substances, including Spill Prevention, Control and Countermeasure planning requirements. Spills or releases may occur in the course of our operations, and we could incur substantial costs and liabilities as a result of such spills or releases, including those relating to claims for damage or injury to property and persons. Additionally, some of our operations are located on properties that historically have been used in ways that resulted in the release of contaminants, including hazardous substances, into the environment, and we could be held liable for the remediation of such historical contamination. The U.S. Comprehensive Environmental Response, Compensation, and Liability Act (“CERCLA”) and comparable state laws impose joint and several liability, without regard to fault or legality of conduct, on classes of persons who are considered to be responsible for the release of hazardous substances into the environment. These persons include the owner or operator of the site where the release occurred and anyone who disposed or arranged for the disposal of a hazardous substance released at the site. Under CERCLA, such persons may be subject to liability for the costs of cleaning up the hazardous substances, for damages to natural resources, and for the costs of certain health studies. In addition, it is not uncommon for neighboring landowners and other third parties to file claims for personal injury and property damage allegedly caused by the hazardous substances released into the environment.
In the course of our operations, we generate industrial solid wastes that may be regulated as hazardous wastes. The Resource Conservation and Recovery Act (“RCRA”) and comparable state statutes regulate the generation, transportation, treatment, storage,
11
disposal, and cleanup of hazardous and non-hazardous wastes. The EPA and the individual states, to which the EPA has delegated portions of the RCRA program for local implementation, administer the RCRA program.
In September 2013, the EPA issued RCRA consent orders to several companies, including us, in connection with historic contamination of residential drinking water wells near our Wedron, Illinois facility. The EPA identified benzene and other volatile organic compounds in some drinking water wells, some (including benzene) in excess of established standards. The consent orders required the companies to analyze conditions at their sites to determine whether operations at their sites are potential sources of groundwater contamination. We completed the study for our site, and our consultant submitted a site conditions report to the EPA in August 2014, which report concluded that our operations at the site are not a source of groundwater impacts in the Wedron community. The report recommended that no further work should be required under the consent order. In March 2015, the EPA issued a letter to us stating that we have completed all work required under the consent order to the EPA’s satisfaction, and our obligations under the consent order have now been satisfied. We have also performed environmental investigation and remediation activities under oversight of the Illinois Environmental Protection Agency (“IEPA”) at a removed underground storage tank (“UST”) system at the Wedron facility south of residential areas of the community. The investigation report approved by the IEPA concluded that the petroleum constituents reported in the groundwater in the Wedron community are not related to the former UST system. We have performed limited soil removal at the location of the former UST system pursuant to a Corrective Action Plan approved by the IEPA. The IEPA has approved the closure of this site, which is documented through a No Further Remediation Letter issued by the Agency. The No Further Remediation Letter has been recorded with the local County Recorder of Deeds and includes deed restrictions which will limit this portion of the Wedron property to industrial use in perpetuity.
Although we do not directly engage in hydraulic fracturing activities, we supply sand-based proppants to hydraulic fracturing operators in the oil and natural gas industry. Hydraulic fracturing involves the injection of water, sand, and chemicals, under pressure, into the formation to fracture the surrounding rock and stimulate production. The hydraulic fracturing process is typically regulated by state or local governmental authorities. However, the practice of hydraulic fracturing has become controversial in some areas and is undergoing increased scrutiny. Several federal agencies and regulatory authorities are investigating the potential environmental impacts of hydraulic fracturing and whether additional regulation may be necessary. The EPA has asserted limited federal regulatory authority over hydraulic fracturing and has indicated it may seek to further expand its regulation of hydraulic fracturing. The Bureau of Land Management has proposed regulations applicable to hydraulic fracturing conducted on federal and Indian oil and gas leases. The U.S. Congress has from time to time considered the adoption of legislation to provide for federal regulation of hydraulic fracturing. In addition, various state, local, and foreign governments have implemented, or are considering, increased regulatory oversight of hydraulic fracturing through additional permitting requirements, operational restrictions, disclosure requirements, and temporary or permanent bans on hydraulic fracturing in certain areas such as environmentally sensitive watersheds. Numerous states have imposed disclosure requirements on hydraulic fracturing well owners and operators. Some local governments have adopted and others may seek to adopt ordinances prohibiting or regulating the time, place, and manner of drilling activities in general or hydraulic fracturing activities within their jurisdictions.
The adoption of new laws, regulations, or enforcement policies at the federal, state, local, or foreign levels imposing reporting obligations on, or otherwise limiting or delaying, the hydraulic fracturing process could make it more difficult to complete oil and natural gas wells, increase our customers’ costs of compliance and doing business, and otherwise adversely affect the hydraulic fracturing services they perform, which could negatively impact demand for our sand-based proppants.
Our operations may also be subject to broad environmental review under the National Environmental Policy Act (“NEPA”). NEPA requires federal agencies to evaluate the environmental impact of all “major federal actions” significantly affecting the quality of the human environment. The granting of a federal permit for a major development project, such as a mining operation, may be considered a “major federal action” that requires review under NEPA. Therefore, our projects may require review and evaluation under NEPA. As part of this evaluation, the federal agency considers a broad array of environmental impacts, including, among other things, impacts on air quality, water quality, wildlife (including threatened and endangered species), historical and archeological resources, geology, socioeconomics and aesthetics. NEPA also requires the consideration of alternatives to the project. The NEPA review process, especially the preparation of a full environmental impact statement, can be time consuming and expensive. The purpose of the NEPA review process is to inform federal agencies’ decision-making on whether federal approval should be granted for a project and to provide the public with an opportunity to comment on the environmental impacts of a proposed project. Although NEPA only requires that an environmental evaluation be conducted and does not mandate a result, a federal agency could decide to deny a permit, or impose certain conditions on its approval, based on its environmental review under NEPA, or a third party may challenge the adequacy of a NEPA review and thereby delay the issuance of a federal permit or approval.
12
Federal agencies granting permits for our operations also must consider impacts to endangered and threatened species and their habitat under the Endangered Species Act. We also must comply with and are subject to liability under the Endangered Species Act, which prohibits and imposes stringent penalties for the harming of endangered or threatened species and their habitat. Some of our operations are conducted in areas where protected species or their habitats are known to exist. In these areas, we may be obligated to develop and implement plans to avoid potential adverse effects to protected species and their habitats, and we may be prohibited from conducting operations in certain locations or during certain times, such as breeding and nesting seasons, when our operations could have an adverse effect on the species. Federal agencies also must consider a project’s impacts on historic or archeological resources under the National Historic Preservation Act, and we may be required to conduct archeological surveys of project sites and to avoid or preserve historical areas or artifacts.
State and Local Regulation
Because our operations are located in numerous states, we are also subject to a variety of different state and local environmental review and permitting requirements. Some states in which our projects are located or are being developed have state laws similar to NEPA; thus our development of new sites or the expansion of existing sites may be subject to comprehensive state environmental reviews even if it is not subject to NEPA. In some cases, the state environmental review may be more stringent than the federal review. Our operations may require state law-based permits in addition to federal or local permits, requiring state agencies to consider a range of issues, many the same as federal agencies, including, among other things, a project’s impact on wildlife and their habitats, historic and archaeological sites, aesthetics, agricultural operations, and scenic areas. Some states also have specific permitting and review processes for commercial silica mining operations, and states may impose different or additional monitoring or mitigation requirements than federal agencies. The development of new sites and our existing operations also are subject to a variety of local environmental and regulatory requirements, including land use, zoning, building, and transportation requirements.
Some local communities have expressed concern regarding silica sand mining operations. These concerns have generally included exposure to ambient silica sand dust, truck traffic, water usage, and blasting. In response, certain state and local communities have developed or are in the process of developing regulations or zoning restrictions intended to minimize dust from getting airborne, controlling the flow of truck traffic, significantly curtail the amount of practicable area for mining activities, requiring compensation to local residents for potential impacts of mining activities and, in some cases, banning the issuance of new permits for mining activities. To date, we have not experienced any material impact to our existing mining operations or planned capacity expansions as a result of these types of concerns.
Planned expansion of our mining and production capacity or construction and operation of related facilities in new communities could be more significantly impacted by increased regulatory activity. Difficulty or delays in obtaining or inability to obtain new mining permits or increased costs of compliance with future state and local regulatory requirements could have a material negative impact on our ability to grow our business. In an effort to minimize these risks, we continue to be engaged with local communities in order to grow and maintain strong relationships with residents and regulators.
Costs of Compliance
We may incur significant costs and liabilities as a result of environmental, health, and safety requirements applicable to our activities. Failure to comply with environmental laws and regulations may result in the assessment of administrative, civil and criminal penalties, imposition of investigatory, cleanup and site restoration costs and liens, the denial or revocation of permits or other authorizations, and the issuance of injunctions to limit or cease operations. Compliance with these laws and regulations may also increase the cost of the development, construction and operation of our projects and may prevent or delay the commencement or continuance of a given project. In addition, claims for damages to persons or property may result from environmental and other impacts of our activities. In addition, the clear trend in environmental regulation is to place more restrictions on activities that may affect the environment, and thus, any changes in, or more stringent enforcement of, these laws and regulations that result in more stringent and costly pollution control equipment, waste handling, storage, transport, disposal, or remediation requirements could have a material adverse effect on our operations and financial position.
The process for performing environmental impact studies and reviews for federal, state, and local permits for our operations involves a significant investment of time and monetary resources. We cannot control the permit approval process. We cannot predict whether all permits required for a given project will be granted or whether such permits will be the subject of significant opposition. The denial of a permit essential to a project or the imposition of conditions with which it is not practicable or feasible to comply could impair or prevent our ability to develop a project. Significant opposition by neighboring property owners, members of the public or other third parties, as well as any delay in the environmental review and permitting process, could impair or delay our ability to develop or
13
expand a project. Additionally, the passage of more stringent environmental laws could impair our ability to develop new operations and have an adverse effect on our financial condition and results of operations.
ITEM 1A. RISK FACTORS
Our business, financial condition, results of operations, cash flows, prospects and the market value of our securities are subject to numerous risks, many of which are driven by factors that we cannot control. If any of the following risks actually occur, our business, financial condition, results of operations, cash flows, prospects and the market value of our securities may be materially and adversely affected. Other factors beyond those listed below, including factors unknown to us and factors known to us which we have not currently determined to be material, could also adversely affect our business, financial condition, results of operations, cash flows, prospects and the market value of our securities. Also see “Special Note of Caution Regarding Forward-Looking Statements” above.
Risks Related to Our Business
Our business and financial performance depend in part on the level of activity in the oil and gas industries.
Approximately 54% of our revenues for 2019 were derived from sales to companies in the oil and gas industries. As a result, our operations depend, in part, on the levels of activity in oil and gas exploration, development and production. More specifically, the demand for the proppants we produce is closely related to the number of oil and gas wells completed in geological formations where sand-based proppants are used in hydraulic fracturing activities. These activity levels are affected by both short- and long-term trends in oil and gas prices, among other factors.
Industry conditions that impact the activity levels of oil and natural gas producers and proppant sales are influenced by numerous factors over which we have no control, including:
| • | governmental regulations, including the policies of governments regarding the exploration for and production and development of their oil and natural gas reserves; |
| • | global weather conditions and natural disasters; |
| • | worldwide political, military and economic conditions; |
| • | the cost of producing and delivering oil and natural gas; |
| • | development of alternative energy sources; |
| • | changes in demand for proppants, including the types of proppants used; and |
| • | the ability of the oil and gas industry to comply with OSHA standards for respirable dust. |
In recent years, oil and gas prices and, therefore, the level of exploration, development and production activity, have experienced significant fluctuations. Worldwide economic, political and military events, including war, terrorist activity, events in the Middle East and initiatives by the Organization of the Petroleum Exporting Countries (“OPEC”) and other large non-OPEC producers have contributed, and are likely to continue to contribute, to price and volume volatility. Additionally, warmer than normal winters in North America and other weather patterns may adversely impact the short-term demand for natural gas and, therefore, demand for our products. Reduction in demand for natural gas to generate electricity could also adversely impact the demand for frac sand.
Any significant reduction in oil and natural gas prices would generally depress the level of oil and natural gas exploration, development, production and well completion activity, which could result in a corresponding decline in the demand for the frac sand we produce. Such a decline could result in Covia selling fewer tons of frac sand at lower prices or selling lower priced products, which would have a material adverse effect on our business, results of operations and financial condition. When demand for frac sand increases, there may not be a corresponding increase in the prices for our products and our customers may not switch back to higher-priced products, which could have a material adverse effect on our results of operations and financial condition. The commercial development of economically-viable alternative energy sources could have a similar effect. In addition, the price we receive for sales of frac sand may be impacted by short-term fluctuations in the demand for frac sand, and any negative fluctuations in this demand could have an adverse effect on our results of operations and cash flows.
14
Any future decreases in the rate at which oil and natural gas reserves are discovered or developed may have a material adverse effect on our business and financial condition, even in a stronger oil and natural gas price environment.
Our business is subject to the volatility in oil pricing.
Previously, the Energy Information Administration (“EIA”) assumed OPEC members and partner countries would voluntarily limit oil production in 2020 and 2021, in efforts to maintain balance in global oil markets. As a result of the March 2020 OPEC and partners meeting, the EIA no longer assumes such production management from OPEC members or partner countries. This will have a significant impact on the global oil and gas markets and present near-term supply and pricing pressures as lower forecast crude oil prices may lead to lower U.S. crude oil production, drilling, and completion activity, and lower demand for proppant. This may adversely affect our business, financial condition, results of operations, cash flows, and prospects.
Our operations are subject to the seasonal and/or cyclical nature of our customers’ businesses, which could adversely affect our results of operations.
The substantial majority of our sales are to customers in industries that have historically been seasonal, such as glassmaking, construction and foundry, and/or cyclical, such as the oil and natural gas industry. During periods of economic slowdown, such customers often reduce their production rates and capital expenditures and defer or cancel pending projects. Such developments occur even among customers that are not experiencing financial difficulties. For example, we sell more of our products in the second and third quarters to customers who operate in the Industrial segment due to the seasonal rise in construction driven by more favorable weather conditions. We sell fewer of our products in the first and fourth quarters due to reduced construction and recreational activity largely as a result of adverse weather conditions. As a result, our results of operations may fluctuate on a quarterly basis and relative to corresponding periods in prior years, and any of these factors could adversely affect our business and cause our results of operations to decline.
We cannot predict or control the factors that affect demand for our products. Negative developments in the above factors, among others, could cause the demand for industrial and recreational sand to decline, which could adversely affect our business, financial condition, results of operations, cash flows and prospects.
Due to the inherent risks of our customers’ businesses, our results may be adversely affected.
Demand for industrial minerals is driven to a large extent by the construction and automotive industries. For example, demand for flat glass depends on the automotive and commercial and residential construction and remodeling industries, demand for commercial silica used to manufacture building products is driven primarily by demand in the construction industry and demand for foundry silica substantially depends on the rate of automobile, light truck and heavy equipment production as well as construction. Other factors influencing the demand for industrial minerals include (i) the substitution of plastic or other materials for glass, (ii) competition from offshore producers of glass products, (iii) changes in demand for our products due to technological innovations and (iv) prices, availability and other factors relating to our products.
We cannot predict or control the factors that affect demand for our products. Negative developments in the above factors, among others, could cause the demand for industrial and recreational sand to decline, which could adversely affect our business, financial condition, results of operations, cash flows and prospects.
Continued weakness in the industries we serve has had, and may in the future have, an adverse effect on sales of our products and our results of operations. A continued or renewed economic downturn in one or more of the industries or geographic regions that we serve, or in the worldwide economy, could cause actual results of operations to differ materially from historical and expected results.
A lack of dependable or available transportation services or infrastructure could have a material adverse effect on our business.
We have contracts with rail, truck, ship and barge services to move materials from our mines to our production facilities and to move products on to our customers. We also have arrangements with third parties to provide our customers with last mile logistics. Any significant delays, disruptions or the unavailability of transportation systems and services caused by, among other things, labor disputes, strikes, lock-outs, lack of maintenance, human error or malfeasance, accidents, transportation delays, mechanical difficulties, shortages of trucks, ships or barges, train derailments, bottlenecks, adverse weather conditions, earthquakes, storms, flooding, drought, other natural disasters or environmental events, increased railcar congestion or other events could have a material adverse effect on
15
our business. In addition, these events could temporarily impair our ability to supply customers through our logistics network of rail-based terminals or the ability of customers to take delivery and, in certain circumstances, constitute a force majeure event under our customer contracts, permitting customers to suspend taking delivery of and paying for our products.
We depend on rail transportation to transport our products.
Our business depends significantly on rail transportation. A significant disruption of the rail transportation services utilized by us or our customers could materially and adversely affect our business and results of operations.
From time to time, high demand and unusually adverse weather conditions may cause rail congestion, delays and logistical problems. Rail congestion may affect our ability to supply our products to customers in a timely or cost-effective manner, particularly in situations where our facilities are not located close to customer locations.
In addition to the products we supply, railcars transport many types of products across various industries. If railcar owners sell or lease railcars to our competitors or to companies operating in other industries, we may not have enough railcars to transport our products.
Our failure to properly anticipate our customers’ rail transportation needs or to effectively expend capital on our railcar fleet could result in us losing business to our competitors.
In many cases, we rely on third parties to maintain the rail lines from our facilities to the national rail network, and any failure by those third parties to maintain the lines could impede our delivery of products, impose additional costs on Covia and have a material adverse effect on our business, results of operations and financial condition.
We have a large fleet of leased railcars which results in substantial fixed costs to our business. An oversized fleet relative to the demand for our product to be shipped via railroad or fleet costs which exceed the market rates for similar equipment may have a material adverse effect on our business and financial condition.
Our rail fleet primarily consists of covered sand hoppers which are used primarily to transport sand-based products. The largest use of our rail fleet is to transport our Northern White product within our Energy segment to customers. Our fleet consists of leases with maturity dates that, in some cases, extend beyond 2030. As a result of the reduction in demand for Northern White sand, a number of our leased railcars are no longer in use and are stored on track at our idled facilities or at third party locations. Additionally, the market decline for Northern White sand has caused a significant oversupply of available railcars in the market making it difficult to sub-lease excess railcars. The oversupply of these cars has also caused the market lease rates for railcars to decline significantly. Competitors who are able to procure railcars based on market lease rates today may have a cost advantage relative to Covia. The costs and liabilities associated with unused railcars can be substantial and may include storage costs, switching fees, freight costs and maintenance or repair costs. Furthermore, our railcars are stored at multiple locations with varying restrictions at each site. If we are unable to return railcars within the parameters required by the applicable lease, we may be considered in breach and incur significant costs as a result. These factors resulted in our reporting a substantial impairment in 2020 related to our right-of-use assets related to railcars.
We depend on trucking to transport a significant portion of our products, particularly in areas of increasing demand for our products. A shortage of available truck drivers and difficulty in truck driver recruitment and retention may have a material adverse effect on our business.
In addition to our rail network, we depend on trucking services, particularly in areas in which our customers’ activity has rapidly increased resulting in spikes in demand for transportation. For example, we have significant demand from the Permian Basin in West Texas. As a result, there is high demand for qualified truck drivers to supply the goods necessary to support the increased activity in West Texas at a time when unemployment in the region is low, putting significant pressure on the supply of available qualified truck drivers. Any delay or inability to secure the personnel and services necessary to deliver our products to customers in high activity areas in a timely and cost-effective manner could cause customers to use a competitor and could have a material adverse effect on our business, results of operations and financial condition.
The U.S. trucking industry periodically experiences a shortage of qualified drivers, sometimes during periods of economic expansion in which alternative employment opportunities are more plentiful and freight demand increases, or alternatively during periods of
16
economic downturns, in which unemployment benefits might be extended and financing may be limited for independent contractors who seek to purchase equipment or for students who seek financial aid for driving school. Our independent contractors are responsible for paying for their own equipment, fuel and other operating costs, and significant increases in these costs could cause them to seek higher compensation from us or seek other opportunities within or outside the trucking industry.
The U.S. trucking industry also suffers from a high driver turnover rate. If we are unable to attract qualified independent contractors, we could be forced to, among other things, limit our growth, decrease the number of tractors in service, adjust independent contractor compensation, or pay higher rates to third-party truckload carriers, which could adversely affect our profitability and results of operations if not offset by a corresponding increase in customer rates.
Increasing logistics and transportation costs could reduce our revenues by causing our customers to reduce production or seek products from competitors or by impairing our ability to deliver products to customers.
Transportation, handling and related costs, including freight charges, fuel surcharges, transloading fees, switching fees, railcar lease costs, demurrage costs and storage fees, tend to be a significant component of our total delivered cost of sales. In many instances, transportation costs can represent up to 70% of the delivered cost of our products. As a result, the cost of transportation is a critical factor in a customer’s purchasing decision. The high relative cost of transportation related expense tends to favor manufacturers located closely to the customer. Increased costs that cannot be passed on to customers could impair our ability to deliver products economically to customers or to expand our customer base. In addition, our competitors may be able to deliver products to our customers with lower transportation costs, which, in certain cases, may result in us losing business.
We transport significant volumes of minerals across long distances and international borders. Any increases in our logistics costs, as a result of increases in the price of oil or otherwise, would increase our costs and the prices of our products. In addition, any increases in customs or tariffs, as a result of changes to existing trade agreements between countries or otherwise, could increase our costs, the prices of our products to customers or decrease our margins. Such increases could harm our competitive position and could have a material adverse effect on our business, results of operations and financial condition.
Geographic shifts in demand could negatively impact our business.
A significant portion of our distribution infrastructure is in or near oil and gas producing areas. However, a significant portion of our frac sand processing facilities are located significant distances from our customers. Similarly, in our Industrial segment, a portion of our sales benefit from having facilities near customer locations. A shift in demand away from areas where we have significant distribution infrastructure or the relocation of our customers’ businesses to areas farther from our facilities or distribution infrastructure could increase our costs for delivering products or result in our inability to supply certain customers, which could have a material adverse effect on our business, financial condition or results of operations.
Our business could be adversely affected by strikes or work stoppages by railroad workers, truckers and port workers.
There has been labor unrest, including strikes and work stoppages, among workers at various transportation providers and in industries affecting the transportation industry. We could lose business due to any significant work stoppage or slowdown and, if labor unrest results in increased rates for transportation providers such as truckers or railroad workers, we may not be able to pass these cost increases on to our customers. Future strikes by railroad workers in the U.S., Canada or anywhere else where our customers’ freight travels by railroad would impact our operations. Any significant work stoppage, slowdown or other disruption involving railroads, truckers, ports or draymen could have a material adverse effect our business, financial condition or results of operations.
Our operations depend on our rights and ability to mine properties and on having renewed or received the required permits and approvals from governmental authorities and other third parties.
We hold numerous governmental, environmental, mining and other permits, water rights and approvals authorizing operations at each of our facilities. A decision by a governmental agency or other third party to deny or delay issuing a new or renewed permit or approval, or to revoke or substantially modify an existing permit or approval, could have a material adverse effect on our ability to continue operations at the affected facility. Furthermore, federal, state and local governments could impose a moratorium on mining operations in certain areas. Expansion of our existing operations is also predicated on securing the necessary environmental or other permits, and water rights or approvals, which we may not receive in a timely manner or at all.
17
In some instances, we have received access rights or easements from third parties, which allow for a more efficient operation than would exist without the access or easement. A third party could seek to suspend the access or easement, which could have a materially adverse effect on our business, results of operations or financial condition.
Changes in product mix can have an adverse effect on our gross margins and could cause our results of operations to fluctuate.
We produce many different products from the minerals we extract. Customers in the same industry may use different products for similar purposes, some of which may require more processing than others and subsequently may be more expensive for us to produce. The costs we experience at our manufacturing locations depend significantly on the mix of products produced, not all of which we may be able to pass along to customers, which can reduce our margins and which may fluctuate from period to period for a number of reasons. Furthermore, if one or more industries that we supply experience a significant shift in products, we could be forced to undertake significant expenditures to upgrade our operations to supply the products or to acquire or build additional production capacity in order to meet this demand to the extent our current operations cannot be retrofitted to supply such demand.
We may be adversely affected by decreased, or shifts in, demand for frac sand or the development of effective alternative proppants or new processes that replace hydraulic fracturing.
Frac sand and coated sand are proppants used in the completion and re-completion of oil and natural gas wells through the process of hydraulic fracturing. Frac sand is the most commonly used proppant and is less expensive than ceramic proppant. A significant shift in demand from sand-based proppants to other proppants, such as ceramic proppants, or a shift in demand from higher-margin sand-based proppants to lower-margin sand-based proppants, could have a material adverse effect on our business, financial condition and results of operations. The hydraulic fracturing industry is not fully mature and is still subject to technological change. The development and use of new technologies for effective alternative proppants, new technologies allowing for improved placement of proppants at reduced volumes, or the development of new processes to replace hydraulic fracturing altogether, could also cause a decline in demand for the sand-based proppants we produce and could have a material adverse effect on our business, financial condition and results of operations.
Similarly, over the last two years, our industry has seen a shift towards the use of in-basin sand, which is available closer to the wellsite. As a result, we have developed frac sand production capacity to meet the growing demand for in-basin sand. The increase in supply of in-basin sand, which may be of lower cost, in the Permian, Mid-Continental, and Eagle Ford basins, could adversely affect our locations where we sell Northern White sand, and our business as a whole if supply and demand are not congruent with our production capabilities.
In addition, the discovery by competitors of minerals in locations which are closer to our customers could provide competitors with a geographic advantage. Any significant reduction in demand for products sold from our facilities could have an adverse effect on our profitability, results of operations and financial condition.
A large percentage of our sales are subject to fluctuations in market pricing.
A large percentage of our supply agreements have market-based pricing mechanisms. Accordingly, in periods with decreasing prices, our results of operations may be weaker than if our supply agreements had fixed prices. In periods with increasing prices, our supply agreements permit us to increase prices; however, our customers may elect to cease purchasing our products if they do not agree with the price increases or are able to find alternative, cheaper sources of supply. Furthermore, certain volume-based supply agreements may influence our ability to fully capture current market pricing as such agreement may fix pricing. These pricing provisions may result in significant variability in our results of operations and cash flows from period to period.
A significant percentage of our volumes are also supplied under fixed price contracts. Over the life of such contracts, the contracted price for such minerals may be below the current market price, at times, significantly so. During such periods, this dynamic may depress our profit margins as compared to industry peers.
Changes in supply and demand dynamics could also impact market pricing for our products. A number of existing frac sand providers and new industry entrants have recently announced reserve acquisitions, processing capacity expansions and greenfield projects. In periods where sources of supply of raw frac sand exceed demand, prices for frac sand may decline and our results of operations and cash flows may decline, be volatile or otherwise be adversely affected. For example, several new and current sand suppliers have developed new in-basin facilities in the Permian, Mid-Continental, and Eagle Ford basins. While the quality and type of proppants
18
produced in-basin are not always the same as those produced in Northern White locations, the cost of this in-basin sand could be lower and the increase in supply of in-basin sand could become a suitable replacement for all or a portion of the Northern White sands particularly if customers change their sizing and quality specifications to favor in-basin sands. These factors could adversely affect our business, particularly at locations where we sell Northern White sand.
We may not be able to complete capital expansion projects, the actual costs of any capital expansion may exceed estimated costs, and we may not be able to secure demand for the incremental production capacity. In addition, actual operating costs for the new capacity may be higher than anticipated.
We undertake projects from time to time to expand our production capacity and distribution network and to modernize operations. For example, we are modernizing our nepheline syenite operations in Canada.
Capital expansion projects are subject to numerous regulatory, environmental, political and legal risks and uncertainties beyond our control that could delay the expansion, construction or optimization of our facilities, including but not limited to:
| • | our ability to timely obtain necessary authorizations, approvals and permits from regulatory agencies (including environmental agencies, such as the U.S. Fish and Wildlife Service agency, where our operations in West Texas may be slowed or halted due to conservation efforts targeted at the habitat of the dunes sagebrush lizard) on terms acceptable to us; |
| • | potential changes in applicable federal, state and local statutes and regulations, including environmental requirements, that prevent a project from proceeding or increase the anticipated cost of the project; |
| • | the inability to acquire rights-of-way or land or water rights on a timely basis on terms acceptable to us; |
| • | the inability to acquire necessary energy supplies, including electricity, natural gas and diesel fuel; |
| • | labor shortage risks, safety issues and work stoppages; |
| • | equipment or raw material supply constraints; and |
| • | unexpected equipment maintenance requirements. |
If our assumptions regarding our estimated capital expenditures change or are inaccurate, we may require additional funding. Such funding may not be available on acceptable terms or at all. Moreover, actual operating costs after we complete a capacity expansion project may be higher than initially anticipated. We also may not secure off-take commitments for the incremental production from the incremental capacity and may not be able to secure adequate demand for the incremental production.
If we undertake capital expansion projects, they may not be completed on schedule or at the budgeted cost or at all. Upon the expenditure of future funds on a project, our revenues may not increase immediately, or as anticipated, or at all. For instance, we may construct new facilities over an extended period and will not receive any material increases in revenues until the projects are completed. Moreover, we may construct facilities to capture anticipated future growth in a location in which such growth does not materialize or for which we are unable to acquire new customers. We may also rely on estimates of proved, probable or possible reserves in our decision to undertake expansion projects, which may prove to be inaccurate. As a result, our new facilities and infrastructure may be unable to achieve our expected investment return, which could materially and adversely affect our results of operations and financial position. Furthermore, substantial investments in our transportation infrastructure may be required to effectively execute the capacity expansion, and we may not be successful in expanding our logistical capabilities to accommodate the additional production capacity.
Any failure to successfully implement any capacity expansion plans or realize the anticipated benefits of our capacity expansion plans could have a material adverse effect on our business, financial condition and results of operations.
19
Our future performance will depend on our ability to succeed in competitive industries and to appropriately react to potential fluctuations in demand for and supply of our products.
We operate in highly competitive industries involving several large, national producers and a larger number of small, local producers. Competition in the industries in which we operate is based on price, consistency and quality of product, site location, distribution and logistics capabilities, customer service, reliability of supply, breadth of product offering, availability of economic substitutes and technical support. Certain of our large competitors may have greater financial and other resources than we do, may develop superior technology or may have production facilities that are located closer to key customers than our facilities. Furthermore, competitors may choose to consolidate, which could provide them with greater financial and other resources and negatively impact demand for our products.
We also compete with smaller, local producers. In addition, oil and natural gas exploration and production companies and other providers of hydraulic fracturing services could acquire their own frac sand reserves, expand their existing frac sand production capacity or otherwise fulfill their own proppant requirements and existing or new frac sand producers could add to or expand their frac sand production capacity, which may negatively impact demand for our frac sand products.
We may not be able to compete successfully against either larger or smaller competitors in the future, and competition could have a material adverse effect on our business, financial condition and results of operations.
Certain of our products may be susceptible to displacement by alternative products.
Our customers have limited alternatives currently available for certain of our products. For example, we are one of the world’s leading producers of low-iron nepheline syenite used in glass, ceramics, paint and plastics. However, while there are currently limited alternatives available to our nepheline syenite customers, other minerals can provide similar functional benefits. If these alternative products can be processed to provide a more cost-effective solution, the nature of the business presents an increased risk of an industry-wide switch to such alternative product, which could have a material adverse effect on our business, financial condition and results of operations.
If our customers delay or fail to pay a significant amount of their outstanding receivables, it could have a material adverse effect on our business, results of operations and financial condition.
Our credit procedures and policies may not be adequate to fully eliminate customer credit risk. Our customers may delay or fail to pay their invoices or may experience financial difficulties, including insolvency. In weak economic environments, we may experience increased delays or failures due to, among other reasons, a reduction in customers’ cash flow from operations and their access to the credit markets. We may not be able to collect sums owed customers who file for bankruptcy protection, and also may be required to refund pre-petition amounts paid during the preference period (typically 90 days) prior to the bankruptcy filing. If our customers delay or fail to pay a significant amount of their outstanding receivables, it could have a material adverse effect on our business, results of operations and financial condition. Since our credit sales are highly-concentrated with customers dependent on the oil and gas markets, downturns in that industry could have a material adverse effect on our business, financial condition, and cash flows.
A large portion of our sales is generated by a limited number of customers, and the loss of, or a significant reduction in purchases by, our largest customers could adversely affect our operations.
In 2019, our top 10 customers accounted for approximately 36% of our revenues and no customers individually exceeded 10% of our revenues. These customers may not continue to purchase the same level of our products in the future due to a variety of reasons. For example, some of our top customers could go out of business or, alternatively, be acquired by other companies that purchase the same products and services provided by us from other third-party providers. Our customers could also seek to capture and develop their own sources of minerals they purchase from us.
We have sold product to our largest customers on both a purchase order basis and pursuant to supply agreements. We currently have supply agreements with certain of our top customers that contain customary termination provisions for that would allow the customer to terminate the agreement in the event of our insolvency, upon a bankruptcy filing or upon an uncured breach of the applicable agreement. Upon the expiration of our current supply agreements, we may choose to renegotiate existing contracts on less favorable terms or at reduced volumes in order to preserve relationships with our customers. Upon the expiration of our current contract terms, we may be unable to renew existing contracts or enter into new contracts on terms favorable to us, or at all. The demand for our products or prevailing prices at the time our current supply agreements expire may render entry into new long-term supply agreements
20
difficult or impossible. Any renegotiation of our contracts on less favorable terms, or inability to enter into new contracts on economically acceptable terms upon the expiration of our current contracts, could have a material adverse effect on our business, financial condition and results of operations.
If any of our major customers substantially reduces or altogether ceases purchasing our products and we are not able to generate replacement sales, our business, financial condition and results of operations could be materially and adversely affected.
Certain of our contracts contain provisions requiring us to deliver minimum amounts of minerals or purchase minimum amounts of services. Noncompliance with these contractual obligations may result in fees or termination of the agreement.
In certain instances, we commit to deliver products or purchase services under threat of nonperformance. If we are unable to meet the minimum contract requirements, the counterparty may be permitted to terminate the agreement or require us to pay a fee. The amount of the fee may be based on the difference between the minimum amount contracted for and the amount delivered or purchased. In such events, our business, financial condition and results of operations may be materially adversely affected.
A significant portion of our volume is generated from our Utica, Wedron, Crane, Kermit, and Tunnel City production facilities. Additionally, a significant portion of our energy sales are generated at terminals located in various shale plays. Any adverse developments at any of these production facilities and terminals or in the industries they serve could have a material adverse effect on our business, financial condition and results of operations.
A significant portion of our volumes are generated from our Utica, Illinois; Wedron, Illinois; Crane, Texas; Kermit, Texas and Tunnel City, Wisconsin production facilities. For 2019, approximately 44% of our total volumes were shipped from these facilities. In addition, a significant portion of our energy sales are generated at terminals located in various shale plays. Any adverse developments at these production facilities and terminals or in the industries these facilities serve, including adverse developments due to catastrophic events or weather (including floods, windstorms, ice storms or tornadoes), adverse government regulatory impacts, private actions by residents of the local or surrounding communities, or transportation-related constraints, could have a material adverse effect on our business, financial condition and results of operations.
In addition, any adverse development at our production facilities that would cause us to curtail, suspend or terminate operations at the production facilities could result in being unable to meet contracted deliveries. If we are unable to deliver contracted volumes within the required time frame, or otherwise arrange for delivery from a third party, we could be required to pay make-whole payments to customers that could have a material adverse effect on our financial condition and results of operations.
The manufacture of our products is dependent on the availability of raw materials and feedstocks.
We depend on suppliers for the raw materials and feedstocks necessary to produce many of our products. If we are unable to secure adequate, cost effective supply commitments for the raw materials and feedstocks associated with our products, our ability to produce and sell various products at profitable margins may be adversely impacted. Many raw materials and feedstocks are not sold pursuant to long-term contracts and we cannot guarantee that our suppliers will continue to provide necessary raw materials or feedstocks at reasonable prices or at all. The loss of key suppliers could have material adverse effect on our business, financial condition and results of operations.
Reduced access, lack of or inability to obtain access to water may adversely affect our operations or the operations of our customers.
The mining and processing that we engage in at a number of our facilities require significant amounts of water, and some of our facilities are located in areas that are water-constrained. Additionally, the development of oil and gas properties through fracture stimulation requires significant water use. We have obtained water rights that we currently use to service the activities on various properties, and we plan to obtain all required water rights to service other properties we may develop or acquire in the future. However, the amount of water that we and our customers are entitled to use pursuant to our water rights must be determined by the appropriate regulatory authorities in the jurisdictions in which we and our customers operate. Such regulatory authorities may amend the regulations regarding such water rights, increase the cost of maintaining such water rights or eliminate our current water rights, and we and our customers may be unable to retain all or a portion of such water rights. These new regulations, which could also affect local municipalities and other industrial operations, could have a material adverse effect on our operating costs if implemented. Such changes in laws, regulations or government policy and related interpretations pertaining to water rights may alter the environment in
21
which we and our customers do business, which may negatively affect our financial condition and results of operations. Additionally, a water discharge permit may be required to properly dispose of water at our processing sites. The water discharge permitting process is also subject to regulatory discretion, and any inability to obtain the necessary permits could have a material adverse effect on our financial condition and results of operations.
Title to our mineral properties and water rights, and royalties related to our production, may be disputed.
Title to, and the area of, mineral properties and water rights, and royalties related to our production of sand and other minerals, may be disputed. A successful claim that we lack appropriate mineral and water rights on one or more of our properties could cause us to lose any rights to explore, develop and operate mines on that property. Any decrease or disruption in our mineral rights may adversely affect our operations. In some instances, we have received access rights or easements from third parties, which allow for a more efficient operation than would exist without the access or easement. A third party could take action to suspend the access or easement, and any such action could have a material adverse effect on our results of operations or financial condition.
We do not own the land on which the majority of our terminal facilities are located and in some cases do not own the related terminal assets and, as a result, we rely on long-term leases or access agreements with third parties, including customers, with respect to certain of our terminal facilities and related assets, the loss or renegotiation of which could disrupt our operations.
We do not own the land on which the majority of our terminals are located and instead own leasehold interests and rights-of-way for the operation of these facilities. Upon expiration, termination or other lapse of our current leasehold terms, we may be unable to renew our existing leases or rights-of-way on terms favorable to us, or at all. Any renegotiation on less favorable terms or inability to enter into new leases on economically acceptable terms upon the expiration, termination or other lapse of our current leases or rights-of-way could cause us to cease operations on the affected land, increase costs related to continuing operations elsewhere and have a material adverse effect on our business, financial condition and results of operations. In addition, operating a terminal under a lease can involve escalating costs to us and additional operational difficulties, including with regard to hiring and retaining skilled personnel, which may be specifically controlled by the lessor.
In addition, with respect to certain terminals, we do not own the terminal assets themselves and have instead negotiated either long term leases with third parties or, in the case of certain customer-owned terminals, exclusive access agreements to the terminal. Any leases are subject to the risks of renegotiation at less favorable terms or the risk of failure to enter into new leases on economically acceptable terms. In certain circumstances, the terminals we use are owned by customers and our terminal access agreements are tied to supply agreements with these customers. In these cases, it is possible that our ability to continue operating these terminals could be impeded if the customer’s volume needs diverge from our ability to supply those needs and the customer no longer allows us access to or use of the terminals.
If we cannot successfully complete acquisitions or integrate acquired businesses, our growth may be limited and our financial condition may be adversely affected.
One element of our business strategy includes supplementing internal growth by pursuing acquisitions. Any acquisition may involve potential risks, including, among other things:
| • | the validity of our assumptions about mineral reserves and future production, sales, capital expenditures, operating expenses and costs, including synergies; |
| • | difficulties and delays in realizing anticipated benefits from the acquired businesses; |
| • | an inability to successfully integrate the businesses that we acquire; |
| • | the use of a significant portion of our available cash or borrowing capacity to finance acquisitions and the subsequent decrease in our liquidity; |
| • | a significant increase in our interest expense or financial leverage if we incur additional debt to finance acquisitions; |
| • | the assumption of unknown liabilities, losses or costs for which we are not indemnified or for which the indemnity we obtained is inadequate; |
| • | the diversion of management’s attention from other business concerns; |
| • | an inability to hire, train or retain qualified personnel both to manage and to operate our growing business and assets; |
22
| • | the incurrence of other significant charges, such as impairment of goodwill or other intangible assets, asset devaluation or restructuring charges; |
| • | unforeseen difficulties encountered in operating in new geographic areas; |
| • | the loss of customers or key employees at the acquired businesses; and |
| • | the accuracy of data obtained from production reports and engineering studies, geophysical and geological analyses, and other information used when deciding to acquire a property, the results of which are often inconclusive and subject to various interpretations. |
If we cannot successfully complete acquisitions, realize the anticipated benefits of such acquisitions or integrate acquired businesses, our growth or financial condition may be adversely affected.
Inaccuracies in our estimates of mineral reserves could result in lower than expected sales and higher than expected costs.
We base our mineral reserve estimates on engineering, economic and geological data assembled and analyzed by our engineers and geologists, which are reviewed by outside firms. However, estimates of the quantities and qualities of mineral reserves and costs to mine recoverable reserves are imprecise because they are based on several factors and assumptions, all of which may vary considerably from actual results, such as:
| • | statistical inferences drawn from available drilling data; |
| • | products, operating costs, mining technology improvements, development costs and reclamation costs; |
| • | assumptions concerning future effects of regulation, including the issuance of required permits and taxes by governmental agencies; and |
Any inaccuracy in our estimates related to our mineral reserves could result in lower than expected sales and higher than expected costs.
We have incurred, and may incur in the future, costs to idle facilities, idled facility carrying costs, or increased costs to resume production at idled facilities.
As a result of new sources of supply and sequentially slower proppant demands, particularly as a result of the increase in demand for in-basin sand, we have idled operations at various mine locations, including at a number of our facilities producing Northern White. If we resume production at an idled facility, we would incur increased costs related to preparing for operation, performing any required repairs and maintenance, and training employees. We may idle additional facilities depending on future economic and market conditions and we would incur higher fixed costs to operate. Conversely, should market conditions improve rapidly, we may not be able to reactivate capacity quickly enough to capture incremental business.
Mine closures entail substantial costs, and if we close one or more of our mines sooner than anticipated, our results of operations and financial condition may be adversely affected.
We base our assumptions regarding the life of our mines on detailed studies that we perform from time to time, but these studies and the underlying assumptions are not always accurate. If we close any of our mines sooner than expected, sales will decline unless we are able to increase production at other mines, which may not be possible. The closure of a mine also involves significant fixed closure costs, including accelerated employment legacy costs, severance-related obligations, reclamation and other environmental costs and the costs of terminating long-term obligations, including energy contracts and equipment leases. We accrue for the costs of reclaiming open pits, stockpiles, tailings ponds, roads and other mining support areas over the estimated mining life of our property. If we reduce the estimated life of any of our mines, the fixed mine closure costs would be applied to a shorter period of production, which would increase production costs per ton produced and could materially and adversely affect our results of operations and financial condition.
Applicable statutes and regulations require that mining property be reclaimed following a mine closure in accordance with specified standards and an approved reclamation plan. The reclamation plan must address matters such as removal of facilities and equipment,
23
regrading, prevention of erosion and other forms of water pollution, re-vegetation and post-mining land use. We may be required to post a surety bond or other form of financial assurance equal to the cost of reclamation as set forth in the approved reclamation plan. The establishment of the final mine closure reclamation liability is based on permit requirements and requires various estimates and assumptions, principally associated with reclamation costs and production levels. If our accruals for expected reclamation and other costs associated with mine closures for which we will be responsible are determined to be insufficient, our business, results of operations and financial condition would be adversely affected.
Our production processes consume large amounts of natural gas and electricity. An increase in the price or a significant interruption in the supply of these or any other significant raw material costs could have a material adverse effect on our business, financial condition or results of operations.
Energy costs, primarily natural gas and electricity, are among our highest costs of goods sold. Natural gas is the primary fuel source used for drying sand in the commercial silica production process and, as such, our profitability is impacted by the price and availability of natural gas we purchase from third parties. The price and supply of natural gas are unpredictable and can fluctuate significantly based on international, political and economic circumstances, as well as other events outside our control, such as changes in supply and demand due to weather conditions, actions by OPEC and other oil and natural gas producers, local production patterns and environmental concerns. Furthermore, utility companies could enforce natural gas curtailments that affect our operations. In addition, potential climate change regulations or carbon or emissions taxes could result in higher production costs for energy, which may be passed on to us in whole or in part. In the past, the price of natural gas has been extremely volatile, and we expect that this volatility may continue. For example, during the year ended December 31, 2019, the monthly closing price of natural gas on the New York Mercantile Exchange ranged from a high of $3.64 per million British Thermal Units (“BTUs”) to a low of $2.14 per million BTUs. In order to manage the volatility risk, we may hedge natural gas prices through the use of derivative financial instruments, such as forwards, swaps and futures. However, these measures carry risk (including nonperformance by counterparties) and do not eliminate the risk of decreased margins as a result of natural gas price increases. A significant increase in the price of energy that is not recovered through an increase in the price of our products or an extended interruption in the supply of natural gas or electricity to our production facilities could have a material adverse effect on our business, financial condition, results of operations, cash flows and prospects.
Increases in the price of diesel fuel may adversely affect our results of operations.
Diesel fuel costs generally fluctuate with increasing and decreasing global crude oil prices and accordingly are subject to political, economic and market factors that are outside of our control. Our operations are dependent on earthmoving equipment, railcars and tractor trailers, and diesel fuel costs are a significant component of the operating expense of these vehicles. We use earthmoving equipment in our mining operations, and we ship the vast majority of our products by either railcar or tractor trailer. To the extent that we perform these services with equipment that we own, we are responsible for buying and supplying the diesel fuel needed to operate these vehicles. To the extent that these services are provided by independent contractors, we may be subject to fuel surcharges that attempt to recoup increased diesel fuel expenses. To the extent that we are unable to pass along increased diesel fuel costs to our customers, our results of operations could be adversely affected.
Phenol is the primary component of the resins we buy, and our resin supply agreements contain market-based pricing provisions based on the cost of phenol. As a result, we are exposed to fluctuations in the prices for phenol.
A significant increase in the price of phenol that is not recovered through an increase in the price of our resin products could have a material adverse effect on our business, financial condition and results of operations.
A shortage of skilled labor together with rising labor costs in the mining industry may further increase operating costs, which could adversely affect our results of operations.
Efficient mining using modern techniques and equipment requires skilled laborers, preferably with several years of experience and proficiency in multiple mining tasks, including processing of mined minerals. If the shortage of experienced labor continues or worsens or if we are unable to train the necessary number of skilled laborers, there could be an adverse impact on our labor productivity and costs and our ability to expand production.
24
Our business may suffer if we lose, or are unable to attract and retain, key personnel.
Our success depends, to a large extent, on the services of our key personnel and on our ability to attract, employ and retain highly-skilled personnel. Our key employees have extensive experience and expertise in evaluating and analyzing industrial mineral properties, building new processing facilities, maximizing production from such properties, marketing industrial mineral production, transportation, distribution and developing and executing financing and hedging strategies, as well as substantial experience and relationships with participants in the industries that we serve. Competition for management and key personnel is intense, and the pool of qualified candidates is limited. Further, most of our key employees are not employed pursuant to employment agreements. The loss of any of our key employees or the failure to attract additional personnel, as needed, could have a material adverse effect on our operations and could lead to higher labor costs or the use of less-qualified personnel. If any of our key employees join a competitor, or form a competing company, we could lose customers, suppliers, know-how and key personnel. We do not maintain key-man life insurance with respect to any of our employees.
Our profitability could be negatively affected if we fail to maintain satisfactory labor relations.
As of December 31, 2019, approximately 35% of our labor force was covered under approximately 25 union agreements in the U.S., Canada and Mexico. These agreements have varying terms and expiration dates and are renegotiated when their terms expire. If we are unable to renegotiate acceptable collective bargaining agreements with these labor unions in the future, we could experience, among other things, strikes, work stoppages or other slowdowns by our workers and increased operating costs as a result of higher wages, health care costs or benefits paid to our employees. An inability to maintain good relations with our workforce could cause a material adverse effect on our business, financial condition and results of operations.
Failure to maintain effective quality control systems at our mining, processing and production facilities could have a material adverse effect on our business, financial condition and operations.
The performance, quality and safety of our products are critical to the success of our business. These factors depend significantly on the effectiveness of our quality control systems, which, in turn, depends on a number of factors, including the design of our quality control systems, our quality-training program and our ability to ensure that our employees adhere to the quality control policies and guidelines. Any significant failure or deterioration of our quality control systems could have a material adverse effect on our business, financial condition, results of operations and reputation.
Severe weather conditions could have a material adverse impact on our business.
Our business could be materially adversely affected by weather conditions. Severe weather conditions may affect our customers’ operations, thus reducing their need for our products. Weather conditions may impact our operations, resulting in weather-related damage to facilities and equipment or an inability to deliver equipment, personnel and products to job sites in accordance with contract schedules. In addition, the EPA has stated that climate change may lead to the increased frequency and severity of extreme weather events. Any such interference with our operations could force us to delay or curtail services and potentially breach our contractual obligations or result in a loss of productivity and an increase in operating costs.
In addition, severe winter weather conditions impact our operations by causing us to halt our excavation and wet plant related production activities at many of our facilities during the winter months. At such facilities, during non-winter months, we excavate excess sand to build a washed sand stockpile that feeds the dry plant, which continues to operate during the winter months. Unexpected winter conditions (e.g., if winter conditions arrive earlier or last longer than expected) may result in us not having a sufficient sand stockpile to supply feedstock for our dry plant during winter months, which could result in us being unable to meet our contracted sand deliveries during such time and lead to a material adverse effect on our business, financial condition, results of operations and reputation.
We rely upon trade secrets, contractual restrictions and patents to protect our proprietary rights. Failure to protect our intellectual property rights may undermine our competitive position, and protecting our rights or defending against third-party allegations of infringement may be costly.
Our commercial success depends on our proprietary information and technologies, know-how and other intellectual property. Because of the technical nature of our business, we rely on patents, trade secrets, trademarks and contractual restrictions to protect our intellectual property rights. The measures we take to protect our trade secrets and other intellectual property rights may be insufficient. If we fail to protect, monitor and control the use of existing intellectual property rights, we could lose our competitive
25
advantage and incur significant expenses. Our competitors or others could independently develop the same or similar technologies or otherwise obtain access to our unpatented technologies. In such case, our trade secrets would not prevent third parties from competing with us and our results of operations may be adversely affected. Furthermore, third parties or our employees may infringe or misappropriate our proprietary technologies or other intellectual property rights, which could also harm our business and results of operations. Policing unauthorized use of intellectual property rights can be difficult and expensive, and adequate remedies may not be available.
In addition, third parties may claim that our products infringe or otherwise violate their patents or other proprietary rights and seek corresponding damages or injunctive relief. Defending against such claims, with or without merit, could be time-consuming and result in costly litigation. An adverse outcome in any such litigation could subject us to significant liability to third parties (potentially including treble damages) or temporary or permanent injunctions prohibiting the manufacture or sale of our products, the use of our technologies or the conduct of our business. Any adverse outcome could also require us to seek licenses from third parties (which may not be available on acceptable terms, or at all) or to make substantial one-time or ongoing royalty payments. Protracted litigation could also result in our customers or potential customers deferring or limiting their purchase or use of our products until resolution of such litigation. In addition, we may not have insurance coverage in connection with such litigation and may have to bear all costs arising from any such litigation to the extent we are unable to recover them from other parties. Any of these outcomes could have a material adverse effect on our business, financial condition and results of operations.
We may be subject to interruptions or failures in our information technology systems. A cyber incident could occur and result in information theft, data corruption, operational disruption and/or financial loss.
We rely on sophisticated information technology systems and infrastructure to process transactions, summarize our operating results and manage our business. Our information technology systems are subject to damage or interruption from power outages, computer and telecommunications failures, computer viruses, cyber-attack or other security breaches, catastrophic events, such as fires, floods, earthquakes, tornadoes, hurricanes, acts of war or terrorism and usage errors by our employees. If our information technology systems are damaged or cease to function properly, we may have to make a significant investment to fix or replace them, and we may suffer loss of critical data, interruptions or delays in our operations and become subject to negative publicity. The reliability and capacity of our information technology systems is critical to our operations and the implementation of our growth initiatives. Any material disruption in our information technology systems, or delays or difficulties in implementing or integrating new systems or enhancing current systems, could have an adverse effect on our business and results of operations.
Our information technologies, systems and networks, and those of our vendors, suppliers and other business partners, may become the target of cyber-attacks or information security breaches that could result in the unauthorized release, gathering, monitoring, misuse, loss or destruction of proprietary and other information (including information we collect and retain in connection with our business about our business partners and employees), or other disruption of business operations, and require us to incur significant expense (that we may not be able to recover in whole or in part from our service providers or responsible parties, or their or our insurers) to address and remediate or otherwise resolve. In addition, certain cyber incidents, such as surveillance, may remain undetected for an extended period. Our systems and insurance coverage for protecting against cyber security risks may not be sufficient. The unintended and/or unauthorized public disclosure or the misappropriation of proprietary, personal identifying or confidential information may also lead to litigation or other proceedings against us by affected individuals and/or business partners and/or by regulators, and the outcome of such proceedings, which could include losses, penalties, fines, injunctions, expenses and charges recorded against our earnings, could have a material and adverse effect on our financial position, results of operations and cash flows and harm our reputation. In addition, the costs of maintaining adequate protection against such threats, based on considerations of their evolution, increasing sophistication, pervasiveness and frequency and/or increasingly demanding government-mandated standards or obligations regarding information security and privacy, could be material to our consolidated financial statements in a particular period or over various periods.
Our international business exposes us to risks inherent in doing business abroad.
We conduct business in many parts of the world outside of the U.S., including Argentina, Mexico, Canada, Denmark, and China. Our international business is subject to the various laws and regulations of those respective countries as well as various risks peculiar to each country, which may include, but are not limited to:
| • | global economic conditions; |
26
| • | political actions and requirements of national governments, including trade restrictions, embargoes, seizure, detention, nationalization and expropriations of assets; |
| • | changes in and interpretation of tax statutes and requirements of taxing authorities worldwide, routine examination by taxing authorities and assessment of additional taxes, penalties and/or interest; |
| • | war, civil unrest, riots and insurrections; |
| • | criminal activities, including activities of drug cartels; |
| • | the potential for the expropriation and nationalization of mines and other assets; |
| • | devaluations and other fluctuations in currency exchange rates; |
| • | the impact of inflation; |
| • | changes in trade agreements, tariffs and other trade protection measures; |
| • | restrictions on foreign investments; |
| • | limitations on our ability to enforce legal rights and remedies; |
| • | difficulty in repatriating foreign currency received in excess of the local currency requirements; and |
| • | weak intellectual property protection. |
We are currently subject to the U.S. Foreign Corrupt Practice Act (“FCPA”) and other antibribery legislation and regulations applicable in other countries. Our ability to comply with the FCPA and other anti-bribery legislation is dependent on the success of our ongoing compliance program, including our ability to continue to manage agents and business partners, and supervise, train and retain competent employees. We could be subject to sanctions and civil and criminal prosecution as well as fines and penalties in the event of a finding of a violation of the FCPA by us or any of our employees.
An epidemic, pandemic or public health crisis could disrupt our operations and have a material adverse effect on our business.
Our business could be materially and adversely affected by the outbreak of a widespread health epidemic or pandemic, such as coronavirus, avian flu or African swine flu. Outbreaks of contagious illness occur from time to time around the world. The occurrence of such an outbreak or other adverse public health developments could materially disrupt our business and operations, including if government authorities impose mandatory closures, seek voluntary closures or impose restrictions on operations. Furthermore, the risk of contracting viruses or other illnesses that may be transmitted through human contact could cause employees to avoid interacting with other people, which could materially and adversely affect the ability to adequately staff our operations. An outbreak could also cause disruption in our supply chain and adversely impact our ability to ensure supplies to our facilities and to provide safety measures to protect our employees, which could materially and adversely affect our continuous operations. If an outbreak reaches pandemic levels, there may also be long-term effects on the economies of effected countries. Any of the foregoing within the countries in which we or our customers and suppliers operate or are dependent on supplies or revenues would severely disrupt our operations and could have a material adverse effect on our business, results of operations, cash flows and financial condition
The extent to which our operations will be impacted by the outbreak will depend largely on future developments, which are highly uncertain and cannot be accurately predicted, including new information which may emerge concerning the severity of the outbreak and the actions by the government authorities to contain the outbreak or treat its impact, among other things. Insurance may be unavailable to cover any losses we incur as a result of the outbreak.
Even if a virus or other illness does not spread significantly, the perceived risk of infection or health risk may affect our business. Our operations could also be disrupted if any of our employees or employees of our customers and suppliers were suspected of having a contagious illness or susceptible to becoming infected with a contagious illness, since this could require us or our customers and suppliers to screen and/or quarantine some or all of such employees.
27
A terrorist attack or armed conflict could harm our business.
Terrorist activities, anti-terrorist efforts and other armed conflicts involving the U.S. or other countries in which we operate could adversely affect the U.S. and global economies and could prevent us from meeting financial and other obligations. We could experience loss of business, delays or defaults in payments from payors or disruptions of fuel supplies and markets if pipelines, production facilities, processing facilities or refineries are direct targets or indirect casualties of an act of terror or war. Such activities could reduce the overall demand for oil and gas, which, in turn, could also reduce the demand for our products and services. Terrorist activities and the threat of potential terrorist activities and any resulting economic downturn could adversely affect our results of operations, impair our ability to raise capital or otherwise adversely impact our ability to realize certain business strategies.
We may incur substantial product liability exposure due to the use or misuse of our products, and product liability insurance may be insufficient to cover claims against us.
Our business exposes us to potential liability risks as a result of the use or misuse of our products. We may face liability to distributors and customers and could also face substantial liability for damages if the ultimate end use of our products causes harm to consumers and other users. Any such failures or defects could affect our relationships with distributors and customers, harm our reputation in the market and have an adverse effect on our business. In addition, if any judgments or liabilities are material in size, we may be unable to satisfy such liabilities. It is possible that widespread product liability claims could increase our costs and adversely affect revenues and operating income. Moreover, liability claims arising from a serious adverse event may increase our costs through higher insurance premiums and deductibles and may make it more difficult to secure adequate insurance coverage in the future. In addition, our product liability insurance may fail to cover future product liability claims, thereby requiring us to pay substantial monetary damages and adversely affecting our business.
The increasing cost of employee healthcare may have an adverse effect on our profitability.
The cost of providing healthcare coverage for employees is becoming an increasingly significant operating cost for many companies. If healthcare costs continue to increase at a rapid pace, we may not pass on these costs to employees. Therefore, if we are unable to offset rising healthcare costs through improved operating efficiencies and reduced expenditures, the increased costs of employee healthcare may have an adverse effect on our profitability and operating results.
An impairment of goodwill, intangible assets, or long-lived assets may adversely affect our financial condition and results of operations.
We recorded goodwill as a result of the Merger, and other assets were recorded as a result of the purchase price allocation performed in connection with the Merger. Under U.S. Generally Accepted Accounting Principles (“GAAP”), goodwill and intangible assets with indefinite lives are not amortized but are tested for impairment annually, or more often if an event or circumstance indicates that an impairment loss may have been incurred. Other intangible assets with a finite life are amortized on a straight-line basis over their estimated useful lives and reviewed for impairment whenever there is an indication of impairment. Long-lived assets are periodically evaluated for impairment when current events or circumstances indicate that the carrying value of our long-lived assets may not be recoverable. Impairment evaluations are, by their nature, highly subjective. The use of different estimates and assumptions could result in a materially different outcome, which could impact the need to record an impairment charge and the amount of any charge taken. Further, our products may become obsolete or commercially less desirable due to changes in technology, market demand, or market expectations, and result in a charge.
As a result of the dynamic shift in Energy markets, we incurred goodwill and other asset impairment charges of $1.4 billion and $267.0 million in the years ended December 31, 2019 and 2018, respectively. See Note 6 in the Notes to the Consolidated Financial Statements for further information. Additional impairment charges may be incurred in the future, which could be significant, and which could have an adverse effect on our financial condition and results of operations.
Risks Related to Our Indebtedness
Our substantial indebtedness and pension obligations could adversely affect our financial flexibility, competitive position and may be difficult to refinance.
In connection with the Merger, we completed a debt refinancing transaction with Barclays by entering into the Term Loan and the Revolver. The proceeds of the Term Loan were used to repay the indebtedness of Unimin and Fairmount Santrol, repurchase shares from Sibelco, and to pay the cash portion of the Merger consideration and expenses related to the Merger. We voluntarily cancelled the Revolver in conjunction with receiving a commitment from PNC Bank, National Association for a new, three-year credit facility,
28
effective on December 31, 2019. The new facility is expected to bear interest of LIBOR plus 1.75% and be secured by our U.S. accounts receivables. As of December 31, 2019, we had approximately $1.57 billion outstanding on the Term Loan compared to an Adjusted EBITDA of $143.0 million. As our Adjusted EBITDA has declined sharply since we completed the debt refinancing, we may be unable to refinance our Term Loan when it matures in 2025. See Note 14 in our consolidated financial statements included in this Report for further detail.
We also have significant pension obligations. As of December 31, 2019, the underfunded amount of our pension plans was approximately $50.0 million. In addition, we contribute to several multiemployer pension plans based on obligations arising under collective bargaining agreements with unions representing employees covered by those agreements. Approximately 7% of our current U.S. employees participate in such multiemployer plans. In 2019, our total contributions to our pension plans were approximately $3.8 million. Fairmount Santrol previously participated in a multiemployer defined benefit pension plan. Fairmount Santrol withdrew from the plan in October 2015 and recorded a liability of approximately $9.3 million as of December 31, 2016, which is payable in annual installments until November 2035 and has a net present value of $4.1 million at December 31, 2019.
Our indebtedness and pension obligations could have important consequences and significant effects on our business. For example, they could:
| • | increase our vulnerability to adverse changes in general economic, industry and competitive conditions; |
| • | require us to dedicate a substantial portion of cash flow from operations to making payments on our indebtedness and pension obligations, thereby reducing the availability of cash flow to fund working capital, capital expenditures and other general corporate purposes; |
| • | limit our flexibility in planning for, or reacting to, changes in our business and the industries in which we operate; |
| • | restrict us from exploiting business opportunities; |
| • | make it more difficult to satisfy our financial obligations, including payments on our indebtedness; |
| • | place us at a disadvantage compared to our competitors that have less debt and fewer pension obligations; and |
| • | limit our ability to refinance our current indebtedness or borrow additional funds for working capital, capital expenditures, railcar or other future purchase commitments, acquisitions, debt service requirements, execution of our business strategy or other general corporate purposes. |
In addition, we have exposure to increases in interest rates under our debt, which will accrue interest at variable rates. As a result of this variable interest rate debt, our financial condition could be adversely affected by increases in interest rates.
The agreements governing our indebtedness contain covenants and substantial restrictions that may restrict our business and financing activities.
The agreements that govern our indebtedness contain, and any future financing agreements we may enter into will likely contain, operating and financial restrictions and covenants that may restrict our ability to finance future operations or capital needs or to engage in, expand or pursue business activities. These covenants include, among other things, limitations on the incurrence of indebtedness, the incurrence of liens, investments, asset sales, affiliate transactions, repurchases of equity securities, the declaration and payment of dividends, and mergers, consolidations and other fundamental transactions.
Our ability to comply with these restrictions and covenants is uncertain and will be affected by the levels of cash flow from operations and events or circumstances beyond our control. If market or other economic conditions deteriorate, our ability to comply with these covenants may be impaired. If we violate any of the restrictions, covenants, ratios or tests set forth in the debt agreements, a significant portion of our indebtedness may become immediately due and payable and the lenders’ commitment to make further loans to us may terminate. We might not have, or be able to obtain, sufficient funds to make these accelerated payments. Even if we could obtain alternative financing, that financing may not be on terms that are favorable or acceptable to us. In addition, our obligations under the agreements governing our indebtedness will be secured by substantially all of our assets, and if we are unable to repay our indebtedness under these agreements, the lenders could seek to foreclose on our assets and could initiate a bankruptcy proceeding or liquidation proceeding against the collateral.
29
We may incur substantial additional debt in the future in order to maintain or increase production levels and to otherwise pursue our business plan. We may not be able to borrow funds successfully or, if we can, this debt may impair our ability to operate our business.
Over the past several months, we have evaluated and pursued, and we expect that we will continue to assess our strategic options, including additional external funding sources, to maximize value for our stockholders. The cost of potential borrowings and our obligations to repay such borrowings could have important consequences because:
| • | our ability to obtain additional financing, if necessary, for working capital, capital expenditures, acquisitions or other purposes may be impaired or such financing may not be available on favorable terms, or at all; |
| • | covenants contained in our existing and future credit and debt arrangements may require us to meet financial tests that may affect flexibility in planning for, and reacting to, changes in business, including possible acquisition opportunities; |
| • | we will need to dedicate a substantial portion of cash flow to make principal and interest payments on indebtedness, reducing the funds that would otherwise be available for operations and future business opportunities; and |
| • | our debt level makes us more vulnerable than less leveraged competitors to competitive pressures or a downturn in business or the economy generally. |
Our ability to service or refinance our indebtedness will depend on, among other things, our future financial and operating performance, which will be affected by prevailing economic conditions and financial, business, regulatory and other factors, some of which are beyond our control. If our operating results are not sufficient to generate cash flows in order to service current or future indebtedness, we would be forced to take actions such as reducing or delaying business activities, acquisitions, investments and/or capital expenditures, selling assets, restructuring or refinancing our indebtedness or seeking additional equity capital or bankruptcy protection. We may not be able to effect any of these remedies on satisfactory terms or at all.
Changes in the method by which LIBOR rates are determined could impact our interest payments for loans under our Term Loan and our Revolver.
Actions by the Intercontinental Exchange Benchmark Administration (“ICE”), regulators or law enforcement agencies may result in changes to the manner in which London Interbank Offered Rate (“LIBOR”) is determined or the establishment of alternative reference rates. For example, on July 27, 2017, the U.K. Financial Conduct Authority (“FCA”) announced that it will no longer compel or persuade banks to submit LIBOR rates after 2021. The FCA announcement indicates that the continuation of LIBOR on the current basis is not guaranteed after 2021. Further, the Federal Reserve began suggesting the use of the Secured Overnight Financing Rate (“SOFR”) as part of an effort to move away from LIBOR. At this time, it is not possible to predict the effect of any such changes, any establishment of alternative reference rates or any other reforms to LIBOR that may be enacted in the United Kingdom, the U.S., or elsewhere. Any changes announced by the ICE, the FCA, other regulators or any other successor governance or oversight body, or future changes adopted by such body, in the method pursuant to which the LIBOR rates are determined may result in a sudden or prolonged increase or decrease in the reported LIBOR rates. Loans under our Term Loan bear interest at either LIBOR or a base rate, at the borrower’s election, plus a spread determined by our leverage ratio. If a sudden or prolonged increase or decrease in the reported LIBOR rates were to occur, the level of interest payments for loans under our Term Loan may be affected.
Risks Related to Environmental, Mining, and Other Regulation
We and our customers are subject to extensive environmental and health and safety regulations that impose, and will continue to impose, significant costs and liabilities. In addition, future regulations, or more stringent enforcement of existing regulations, could increase those costs and liabilities, which could adversely affect our results of operations and financial condition.
We are subject to a variety of federal, state, provincial and local environmental laws and regulations applicable to the mining and mineral processing industry, including without limitation, laws and regulations relating to employee health and safety, environmental permitting and licensing, air and water emissions, GHG, water pollution, waste management, remediation of soil and groundwater contamination, land use, reclamation and restoration of properties, hazardous materials and natural resources. Some environmental laws impose substantial penalties for noncompliance, and others, such as CERCLA, impose strict, retroactive and joint and several liability for the remediation of releases of hazardous substances. Liability under CERCLA, or similar state, provincial and local laws in the jurisdictions where we operate, may be imposed as a result of conduct that was lawful at the time it occurred or for the conduct of, or conditions caused by, prior operators or other third parties. Failure to properly handle, transport, store or dispose of hazardous materials or otherwise conduct operations in compliance with applicable environmental laws and regulations could expose us to liability for governmental penalties, cleanup costs and civil or criminal liability associated with releases of such materials into the environment, damages to property or natural resources and other damages, as well as potentially impair our ability to conduct our
30
operations. In addition, future environmental laws and regulations could restrict our ability to expand our facilities or extract mineral reserves or could require us to modify operations, acquire costly equipment or incur other significant expenses in connection with our business. Future events, including changes in any environmental laws or regulations (or their interpretation or enforcement) and the costs associated with complying with such requirements, could have a material adverse effect on us.
Our failure to comply with applicable environmental laws and regulations may cause governmental authorities to take actions that could adversely impact our operations and financial condition, including:
| • | issuance of administrative, civil and criminal penalties; |
| • | denial, modification or revocation of permits or other authorizations; |
| • | imposition of injunctive obligations or other limitations on our operations, including cessation of operations; and |
| • | requirements to perform site investigatory, remedial or other corrective actions. |
Moreover, environmental requirements, and the interpretation and enforcement thereof, change frequently and have tended to become more stringent over time. For example, greenhouse gas emission regulation is becoming more rigorous. Additional greenhouse gas emission related requirements at the supranational, federal, state, regional, provincial and local levels are in various stages of development. We are required to annually calculate greenhouse gas emissions for operations in Wedron, Illinois; Nephton, Ontario, Canada; Saint Canut, Quebec, Canada; Canoitas, Mexico; and Jaltipan, Mexico. The U.S. Congress has considered, and may adopt in the future, various legislative proposals to address climate change, including a nationwide limit on greenhouse gas emissions. In addition, the EPA has issued regulations that subject greenhouse gas emissions from certain stationary sources to the Prevention of Significant Deterioration and Title V provisions of the federal Clean Air Act. Any such regulations in the U.S., Canada or Mexico could require us to modify existing permits or obtain new permits, implement additional pollution control technology, curtail operations or significantly increase operating costs. Any regulation of greenhouse gas emissions, including, for example, through a cap-and trade system, technology mandate, emissions tax, reporting requirement or other program, could adversely affect our business, financial condition, reputation, operating performance and product demand.
We may not be able to comply with any new laws and regulations that are adopted, and any new laws and regulations could have a material adverse effect on our operating results by requiring us to modify our operations or equipment or shut down some or all of our facilities. Additionally, our customers may not be able to comply with any new laws and regulations, and any new laws and regulations could have a material adverse effect on our customers by requiring them to shut down old facilities or to relocate facilities to locations with less stringent regulations farther away from our facilities. We cannot, at this time, reasonably estimate our costs of compliance or the timing of any costs associated with any new laws and regulations or any material adverse effect that any new standards will have on our customers and, consequently, on our operations.
Our customers' operations are subject to a number of risks arising out of the threat of climate change, including regulatory, political, litigation and financial risks, which could result in increased operating and capital costs for our customers and reduced demand for the products and services we provide.
Climate change continues to attract considerable attention in the United States and in foreign countries. As a result, numerous proposals have been made and are likely to continue to be made at the international, national, regional and state levels of government to monitor and limit emissions of GHGs, as well as to limit such future emissions. As a result, the operations of our customers are subject to a series of regulatory, political, litigation and financial risks associated with the production and processing of oil and gas and emission of GHGs.
In the United States, no comprehensive climate change legislation has been implemented at the federal level, to date. However, with the U.S. Supreme Court finding that GHG emissions constitute a pollutant under the CAA, the EPA has adopted rules that, among other things, establish construction and operating permit reviews for GHG emissions from certain large stationary sources, require the monitoring and annual reporting of GHG emissions from certain petroleum and natural gas system sources, and implement New Source Performance Standards directing the reduction of methane from certain new, modified or reconstructed facilities in the oil and natural gas sector. Additionally, various states and groups of states have adopted or are considering adopting legislation, regulations or other regulatory initiatives that are focused on such areas as GHG cap and trade programs, carbon taxes, reporting and tracking programs and restriction of emissions. At the international level, there exists the United Nations-sponsored “Paris Agreement,” which is a non-binding agreement for nations to limit their GHG emissions through individually-determined reduction goals every five years after 2020, although the United States has announced its withdrawal from such agreement, effective November 4, 2020.
31
Governmental, scientific and public concern over the threat of climate change arising from GHG emissions has resulted in federal political risks in the United States in the form of pledges made by certain candidates seeking the office of the President of the United States in 2020. Critical declarations made by one or more presidential candidates include proposals to ban hydraulic fracturing of oil and natural gas wells and ban new leases for production of minerals on federal properties, including onshore lands and offshore waters. Other actions to oil and natural gas production activities that could be pursued by presidential candidates may include more restrictive requirements for the establishment of pipeline infrastructure or the permitting of liquefied natural gas export facilities, as well as the rescission of the United States’ withdrawal from the Paris Agreement in November 2020. Litigation risks are also increasing, as a number of cities, local governments and other plaintiffs have sought to bring suit against the largest oil and natural gas exploration and production companies in state or federal court, alleging, among other things, that such companies created public nuisances by producing fuels that contributed to global warming effects, such as rising sea levels, and therefore are responsible for roadway and infrastructure damages as a result, or alleging that the companies have been aware of the adverse effects of climate change for some time but defrauded their investors by failing to adequately disclose those impacts.
There are also increasing financial risks for fossil fuel producers as stockholders and bondholders currently invested in fossil-fuel energy companies concerned about the potential effects of climate change may elect in the future to shift some or all of their investments into non-fossil fuel energy related sectors. Institutional lenders who provide financing to fossil-fuel energy companies also have become more attentive to sustainable lending practices and some of them may elect not to provide funding for fossil fuel energy companies. Additionally, the lending and investment practices of institutional lenders have been the subject of intensive lobbying efforts in recent years, oftentimes public in nature, by environmental activists, proponents of the international Paris Agreement and foreign citizenry concerned about climate change not to provide funding for fossil fuel producers. Limitation of investments in and financings for fossil fuel energy companies could result in the restriction, delay or cancellation of drilling programs or development or production activities.
The adoption and implementation of any federal or state legislation or regulations or international agreements that impose more stringent standards for GHG emissions from the oil and natural gas sector or otherwise restrict the areas in which this sector may produce oil and natural gas or generate GHG emissions could result in increased compliance costs or costs of consuming fossil fuels. Moreover, such new legislation or regulatory programs could also materially and adversely affect demand for the oil and natural gas our customers produce, which may reduce demand for our frac sand products and services. Additionally, political, financial and litigation risks may result in our oil and natural gas customers restricting or canceling production activities, incurring liability for infrastructure damages as a result of climatic changes, or impairing the ability to continue to operate in an economic manner, which also could reduce demand for our products and services. Any one or more of these developments could have a material adverse effect on our business, financial condition and results of operations. Finally, increasing concentrations of GHG in the Earth’s atmosphere may produce climate changes that have significant physical effects, such as increased frequency and severity of storms, droughts, floods, rising sea levels and other climatic events. If any such climate changes were to occur, they could have an adverse effect on our financial condition and results of operations and the financial condition and operations of our customers.
We are subject to the Federal Mine Safety and Health Act of 1977, the Occupational Safety and Health Act of 1970 and other laws and regulations which impose stringent health and safety standards on numerous aspects of our operations.
Our operations are subject to the Federal Mine Safety and Health Act of 1977, as amended by the Mine Improvement and New Emergency Response Act of 2006, and the Occupational Safety and Health Act of 1970. These statutes and the regulations adopted pursuant thereto impose stringent health and safety standards on numerous aspects of mineral extraction and processing operations, including the training of personnel, operating procedures, operating equipment and other matters. We are subject to laws and regulations relating to human exposure to respirable crystalline silica. Several federal and state regulatory authorities, including MSHA and OSHA, may continue to propose changes in their regulations regarding workplace exposure to respirable crystalline silica, such as permissible exposure limits and required controls and personal protective equipment. For example, in June 2016, OSHA adopted regulations that reduced permissible exposure limits to 50 micrograms of respirable crystalline silica per cubic meter of air, averaged over an eight-hour day. Our failure to comply with such laws, regulations and standards, or changes in such laws, regulations and standards or the interpretation or enforcement thereof, may have a material adverse effect on our business, financial condition and results of operations or otherwise impose significant restrictions on our ability to conduct mineral extraction and processing operations.
32
Silica-related health issues and litigation could have a material adverse effect on our business, reputation or results of operations.
The inhalation of respirable crystalline silica can lead to the lung disease silicosis. There is some evidence of an association between respirable silica exposure and lung cancer as well as a possible association with other diseases, including immune system disorders such as scleroderma. These health risks have been, and may continue to be, a significant issue confronting the silica industry. Concerns over silicosis and other potential adverse health effects, as well as concerns regarding potential liability from the use of silica, may have the effect of discouraging our customers’ use of silica products. The actual or perceived health risks of mining, processing and handling silica could materially and adversely affect silica producers, including us, through reduced use of silica products, the threat of product liability or employee lawsuits, increased scrutiny by federal, state and local regulatory authorities of us and our customers, or reduced financing sources available to the silica industry.
We and/or our predecessors have been named as a defendant, usually among many defendants, in numerous products liability lawsuits alleging damages caused by silica exposure, mostly brought by or on behalf of current or former employees of customers of the defendants. As of December 31, 2019, there were 40 active silica-related products liability claims pending in which we are a defendant. During the year ended December 31, 2019, 100 plaintiffs’ claims against us were dismissed. Many of the claims pending against us arise out of the alleged use of silica products in foundries or as an abrasive blast media and have been filed in various jurisdictions. In accordance with our insurance obligations, these claims are being defended by our subsidiaries’ insurance carriers, subject to our payment of a percentage of the defense costs. We cannot predict with certainty the outcomes of these legal proceedings and other contingencies, and the costs incurred in litigation can be substantial, regardless of the outcome. Substantial unanticipated verdicts, fines and rulings do sometimes occur. As a result, we could from time to time incur judgments, enter into settlements or revise our expectations regarding the outcome of certain matters, and such developments could have a material adverse effect on our results of operations in the period in which the amounts are accrued and/or our cash flows in the period in which the amounts are paid.
Federal, state and local legislative and regulatory initiatives relating to hydraulic fracturing and the potential for related litigation could result in increased costs and additional operating restrictions or delays for our customers, which could cause a decline in the demand for sand-based proppants and negatively impact our business, financial condition and results of operations.
A significant portion of our business supplies frac sand to hydraulic fracturing operators in the oil and natural gas industry. Although we do not directly engage in hydraulic fracturing activities, our customers purchase frac sand from us for use in their hydraulic fracturing operations. Hydraulic fracturing is a widely used industry production technique that is used to recover natural gas and/or oil from dense subsurface rock formations. The process involves the injection of water, sand and chemicals, under pressure, into the formation to fracture the surrounding rock and stimulate production.
The hydraulic fracturing process has historically been regulated by state or local governmental authorities. However, the practice of hydraulic fracturing has become controversial in some areas and is undergoing increased scrutiny. Several federal agencies, regulatory authorities and legislative entities are investigating the potential environmental impacts of hydraulic fracturing and whether additional regulation may be necessary. For instance, the EPA has asserted limited federal regulatory authority over hydraulic fracturing and has indicated it may seek to further expand its regulation of hydraulic fracturing. The U.S. Congress has from time to time considered the adoption of legislation to provide for federal regulation of hydraulic fracturing.
In addition, various state, local and foreign governments have implemented, or are considering, increased regulatory oversight of hydraulic fracturing through additional permitting requirements, operational restrictions, disclosure requirements and temporary or permanent bans on hydraulic fracturing in certain areas such as environmentally sensitive watersheds. For example, Vermont and New York banned hydraulic fracturing in 2012 and 2015, respectively. Several local municipalities across the U.S. have instituted measures temporarily or permanently banning or otherwise limiting or delaying hydraulic fracturing in their jurisdictions. Such moratoriums and bans could make it more difficult to conduct hydraulic fracturing operations and increase our customers’ cost of doing business, which could negatively impact demand for our frac sand products. In addition, new OSHA rules regulating certain aspects of the use of silica in the hydraulic fracturing industry and becoming effective in 2021 will increase costs for companies in the hydraulic fracturing industry by compelling them to meet the same standards for employees that we currently satisfy. A number of states, including the major oil and gas producing states of North Dakota, Ohio, Oklahoma, Pennsylvania, Texas and West Virginia, have also enacted legislation or issued regulations that impose various disclosure requirements on hydraulic fracturing operators. The availability of information regarding the constituents of hydraulic fracturing fluids could make it easier for third parties opposing the hydraulic fracturing process, including non-governmental organizations, to challenge the exploration, development and production of oil and natural gas, or initiate individual or class action legal proceedings based on allegations that specific chemicals used in the hydraulic fracturing process could adversely affect groundwater and drinking water supplies or otherwise cause harm to human health or the environment. Moreover, disclosure to third parties or to the public, even if inadvertent, of our customers’ proprietary chemical
33
formulas could diminish the value of those formulas and result in competitive harm to such customers, which could indirectly impact our business, financial condition and results of operations.
Although we do not conduct hydraulic fracturing, the adoption of new laws or regulations at the federal, state, local or foreign levels imposing reporting obligations on, or otherwise limiting or delaying, the hydraulic fracturing process could make it more difficult to complete oil and natural gas wells, increase our customers’ costs of compliance and doing business and otherwise adversely affect the hydraulic fracturing services they perform, which could negatively impact demand for our sand-based proppants. In addition, heightened political, regulatory and public scrutiny of hydraulic fracturing practices, including nuisance lawsuits, could expose us or our customers to increased legal and regulatory proceedings, which could be time-consuming, costly or result in substantial legal liability or significant reputational harm. We could be directly affected by adverse litigation involving us or indirectly affected if the cost of compliance limits the ability of our customers to operate. Such costs and scrutiny could directly or indirectly, through reduced demand for our sand-based proppants, have a material adverse effect on our business, financial condition and results of operations.
We and our customers are subject to other extensive regulations, including licensing, plant and wildlife protection and reclamation regulations that impose, and will continue to impose, significant costs and liabilities. In addition, future regulations, or more stringent enforcement of existing regulations, could increase those costs and liabilities, which could adversely affect our results of operations.
In addition to the regulatory matters described above, we and our customers are subject to extensive governmental regulation on matters such as permitting and licensing requirements, plant and wildlife protection, wetlands protection, and the reclamation and restoration of mining properties after mining is completed. Our future success depends on, among other things, the quantity of our mineral reserves and our ability to extract these reserves profitably and customers being able to operate their businesses as they currently do.
In order to obtain permits and renewals of permits in the future, we may be required to prepare and present data to governmental authorities pertaining to the impact that any proposed exploration or production activities, individually or in the aggregate, may have on the environment. Certain approval procedures may require preparation of archaeological surveys, endangered species studies and other studies to assess the environmental impact of new sites or the expansion of existing sites. Compliance with these regulatory requirements is expensive and significantly lengthens the time needed to develop a site. Finally, obtaining or renewing required permits is sometimes delayed or prevented due to community opposition, including nuisance lawsuits, and other factors beyond our control. The denial of a permit essential to our operations or the imposition of conditions with which it is not practicable or feasible to comply could impair or prevent our ability to develop or expand a site. New legal requirements, including those related to the protection of the environment, or the identification of certain species as threatened or endangered could be adopted that could materially adversely affect our mining operations (including our ability to extract mineral reserves), our cost structure or our customers’ ability to use sand-based proppants. Such current or future regulations could have a material adverse effect on our business and we may not be able to obtain or renew permits in the future.
Our inability to acquire, maintain or renew financial assurances related to the reclamation and restoration of mining property could have a material adverse effect on our business, financial condition and results of operations.
We are generally obligated to restore property in accordance with regulatory standards and our approved reclamation plan after it has been mined. We are required under federal, state and local laws to maintain financial assurances, such as surety bonds, to secure such obligations. The inability to acquire, maintain or renew such assurances, as required by federal, state and local laws, could subject Covia to fines and penalties as well as the revocation of operating permits. Such inability could result from a variety of factors, including:
| • | the lack of availability, higher expense or unreasonable terms of such financial assurances; |
| • | the ability of current and future financial assurance counterparties to increase required collateral; and |
| • | the exercise by financial assurance counterparties of any rights to refuse to renew the financial assurance instruments. |
Our inability to acquire, maintain or renew necessary financial assurances related to the reclamation and restoration of mining property could have a material adverse effect on our business, financial condition and results of operations.
34
Risks Related to Investing in and Ownership of Our Common Stock
Future sales or issuances of our common stock, including sales by Sibelco, could have a negative impact on our common stock price.
Sibelco owns, directly or indirectly, approximately 65% of our common stock. Sales of our common stock by Sibelco or the perception that sales may be made by Sibelco could significantly reduce the market price of our common stock. In addition, even if Sibelco does not sell a large number of shares of our common stock into the market, its right to transfer such shares may depress the stock price of our common stock.
Pursuant to the terms and conditions of a Registration Rights Agreement, Sibelco is entitled to registration rights with respect to the shares of our common stock it owns. These registration rights include the right to demand that its shares be registered, the right to choose the method by which its shares of common stock are distributed, a choice as to the underwriter and registration rights in conjunction with other registered offerings by us. Expenses incident to our performance of or compliance with a demand registration made by Sibelco will be borne by us. If Sibelco exercises its registration rights, the market price of shares of our common stock may be adversely affected.
Additionally, Sibelco is party to the Stockholders Agreement that was effective upon the closing of the Merger by and among Sibelco, Unimin and the other stockholders named therein (“Stockholders Agreement”) pursuant to which Sibelco is subject to certain transfer restrictions. In particular, for three years following the effective time, Sibelco will not, and will cause its controlled affiliates not to, transfer or agree to transfer any of our common stock or other shares of capital stock to any person (other than an affiliate of Sibelco) or group if such person or group would, following such transfer, beneficially own in excess of (i) 15% of the voting power of the outstanding shares of our voting stock or (ii) 50% of the voting power of our outstanding shares of voting stock, unless such person agrees to make an offer to purchase all shares of our common stock held by our stockholders for the same consideration and on substantially the same terms and conditions.
Notwithstanding the foregoing, Sibelco can transfer shares of our common stock at any time (i) to any wholly owned affiliate of Sibelco who signs a joinder to the Stockholders Agreement, (ii) pursuant to a public offering of shares of our common stock (including pursuant to spin-off or split-off transactions or related actions involving a person holding Sibelco’s interest in us) or (iii) in connection with a change of control of Sibelco. A change of control of Sibelco means (i) the acquisition by any other person, directly or indirectly, of record or beneficial ownership of more than 50% of the total voting securities of Sibelco, (ii) the acquisition by any other person of all or substantially all of the consolidated assets of Sibelco or (iii) the acquisition by any other person of the ability to vote or direct the voting securities of Sibelco for the election of a majority of Sibelco’s directors.
Sibelco will exercise significant influence over us, and its interests in us may be different than yours.
Sibelco beneficially owns, directly or indirectly, approximately 65% of the outstanding shares of our common stock. In addition, pursuant to the Stockholders Agreement, Sibelco has certain preemptive rights pursuant to which it will be able to purchase its pro rata portion of any new securities that we may, from time to time, propose to issue or sell to any person, with certain exceptions. Accordingly, subject to applicable law and the limitations set forth in our certificate of incorporation, bylaws and the Stockholders Agreement, Sibelco is able to exercise significant influence over our business policies and affairs, including any action requiring the approval of our stockholders, including the adoption of amendments to our certificate of incorporation and bylaws and the approval of a merger or sale of all or substantially all of our assets.
Subject to the limitations included in our certificate of incorporation, bylaws and the Stockholders Agreement, the directors nominated by Unimin in connection with the Merger will have significant authority to effect decisions affecting our capital structure, including the issuance of additional capital stock, the incurrence of additional indebtedness, the implementation of stock repurchase programs and the decision of whether or not to declare dividends. In addition, we entered into a Contribution Agreement, Tax Matters Agreement, Distribution Agreements, Agency Agreements and Non-Compete Agreement with Sibelco, which are discussed in the section entitled “Certain Relationships and Related Party Transactions – Relationship with Sibelco” in the Form S-4.
The interests of Sibelco may conflict with the interests of our other stockholders. For example, Sibelco may support certain long-term strategies or objectives for us that may not be accretive to our stockholders in the short term. The concentration of ownership may also delay, defer or even prevent a change in control of us, even if such a change in control would benefit our other stockholders, and may make some transactions more difficult or impossible without the support of Sibelco. This significant concentration of share ownership may adversely affect the trading price for our common stock because investors may perceive disadvantages in owning stock in companies with stockholders who own significant percentages of a company’s outstanding stock. In addition, sales by
35
Sibelco of shares of our common stock in the market, or the perception that Sibelco might sell shares in the market, or the fact that a large portion of our common stock is not part of the public float, could have an adverse effect on the trading market for our common stock.
We are a “controlled company” within the meaning of the rules of the NYSE and, as a result, qualify for, and may rely on, exemptions from certain corporate governance requirements.
In addition to the consequences of the concentration of share ownership and possible conflicts between the interests of Sibelco and your interests discussed above, we are a “controlled company” within the meaning of the rules of the NYSE. Under these rules, a company in which over 50% of the voting power is held by an individual, a group or another company is a “controlled company” and is not required to have:
| • | a majority of its board of directors be independent directors; |
| • | a nominating/corporate governance committee or a compensation committee, or to have such committees be composed entirely of independent directors; and |
| • | the compensation of our Chief Executive Officer be determined, or recommended to the board of directors for determination, either by a compensation committee comprised of independent directors or by a majority of the independent directors on the board of directors. |
We may rely on certain of these exemptions. Accordingly, you may not have the same protections afforded to stockholders of companies that are subject to all of the corporate governance requirements of the NYSE without regard to the exemptions available for “controlled companies,” and our status as a “controlled company” may adversely affect the trading price for our common stock.
We currently do not intend to pay dividends on our common stock, and our debt agreements place certain restrictions on our ability to do so. Consequently, unless there is a change to our dividend policy, your only opportunity to achieve a return on your investment is if the price of our common stock appreciates.
We do not plan to declare dividends on shares of our common stock in the foreseeable future. Any determination to pay dividends will be at the discretion of our Board and will be dependent on then-existing conditions, including our financial condition, earnings, legal requirements, including limitations under Delaware law, restrictions in our debt agreements that limit our ability to pay dividends to stockholders and other factors our Board deems relevant. If our Board decides to declare dividends in the future, it may, in its sole discretion, change the amount or frequency of dividends or discontinue the payment of dividends entirely. For these reasons, you will not be able to rely on dividends to receive a return on your investment. Accordingly, realization of a gain on your shares of our common stock will likely depend solely on the appreciation of the price of our common stock, which may never occur.
Our certificate of incorporation contains a provision renouncing our interest and expectancy in certain corporate opportunities.
Our certificate of incorporation provides that, to the fullest extent permitted by applicable law, we renounce any interest or expectancy we may have in, or in being offered an opportunity to participate in, business opportunities that are from time to time presented to Sibelco or any of Sibelco’s officers, directors, agents, members, affiliates and subsidiaries (other than us) (each, a “Specified Party”), or business opportunities in which a Specified Party participates or desires to participate, even if the opportunity is one that we might reasonably be deemed to have pursued or had the ability or desire to pursue if granted the opportunity to do so. In addition, each such Specified Party has no duty to communicate or offer such business opportunity to us and, to the fullest extent permitted by law, will not be liable to us or any of our stockholders for a breach of any fiduciary or other duty, as a director or officer or controlling stockholder or otherwise, by reason of the fact that such Specified Party pursues or acquires such business opportunity, directs such business opportunity to another person or fails to present such business opportunity, or information regarding such business opportunity, to us.
As a result of this provision, any of our directors who also serves as a director, officer or employee of Sibelco or any of Sibelco’s subsidiaries or affiliates may pursue certain acquisitions or other opportunities that may be complementary to our business and, as a result, such acquisition or other opportunities may not be available to us. These potential conflicts of interest could have a material adverse effect on our business, financial condition and results of operations if attractive corporate opportunities are allocated by Sibelco to itself or its subsidiaries or affiliates instead of us.
36
None.
ITEM 2. PROPERTIES
Our Reserves
We control one of the largest bases of industrial mineral reserves in North America. From our reserves, we are able to produce a broad range of specialized silica sand, micro crystalline silica, feldspar, nepheline syenite, clay, and kaolin for use by our Energy segment and Industrial segment customers in North America and around the world.
According to SEC Industry Guide 7, reserves are defined as that part of a mineral deposit which could be economically and legally extracted or produced at the time of the reserve determination. Reserves are categorized into proven (measured) reserves and probable (indicated) reserves, which are defined as follows:
| • | Proven (measured) reserves. Reserves for which (i) quantity is computed from dimensions revealed in outcrops, trenches, workings or drill holes; grade and/or quality are computed from the results of detailed sampling and (ii) the sites for inspection, sampling and measurement are spaced so closely and the geologic character is so well defined that size, shape, depth and mineral content of reserves are well-established. |
| • | Probable (indicated) reserves. Reserves for which quantity and grade and/or quality are computed from information similar to that used for proven (measured) reserves, but the sites for inspection, sampling and measurement are farther apart or are otherwise less adequately spaced. The degree of assurance, although lower than that for proven (measured) reserves, is high enough to assume continuity between points of observation. |
Our reserves meet the definition of proven or probable reserves in accordance with SEC Industry Guide 7. We estimate that we have approximately 1.0 billion tons of proven or probable mineral reserves, with estimated recoveries between 11% and 98%, as of December 31, 2019. Mineral reserve estimated quantities and characteristics at our properties are overseen by our internal geologists and engineers and validated by an independent third party consulting company, GZA GeoEnvironmental, Inc.
We assess the economic viability of our minerals reserves for each operation primarily by evaluating the following key criteria for mining feasibility: estimate of saleable quality reserves; percent recovery following processing; overburden stripping and other operational costs and annual production volumes. These factors are considered in preparation of a mine plan that ultimately estimates the tons of product to be sold per year and the estimated life of the mine. Historical mineral prices are considered in the context of market supply and demand dynamics to further assess the long-term economic viability of the mineral reserve assets. Certain reserves of properties previously owned by Fairmount Santrol have been reclassified to resources or have been reclassified as probable reserves as a result of policy and practice harmonization following the Merger, which include minimum drill core spacing and permitting requirements. Additionally, reserve estimates have been updated to reflect changes to the understanding of the various ore bodies as well as new economic assumptions over the price of frac sand (range of $25 to $35) in 2019. Prices assumed for industrial plants were left relatively unchanged from 2018 ($25 to $40). These changes have not materially altered the weighted average life of mine. The reserve estimates are updated annually based on sales, changes to reserve boundaries, new physical or chemical information on the reserve deposit or overburden, changes in the mine plan, changes in customer demand, current pricing forecasts and other business strategies.
37
Summary of Reserves
The following table provides information on each of our mining facilities with mineral reserves. Included is the location and area of the facility; the type, amount and ownership status of the location’s reserves and whether or not they meet API standards; the primary minerals produced; and the primary industries served:
38
Mine/Facility(1) | Acres(A) | API Designation(B) | Proven Reserves(2) | | Probable Reserves(2) | | Proven & Probable Reserves(2) | | Estimated Recovery Percentage | | Primary Mineral(s) | Principal Industries Served |
U.S. Operations |
Camden(6) | | 715 | | O | Non-API | | 7,160 | | | 1,442 | | | 8,602 | | 77% | | Silica Sand | Glass, Commercial |
| | 1,306 | | L | | | | | | | | | | | | | | | |
Chardon | | 583 | | O | Non-API | | - | | | 2,758 | | | 2,758 | | 80% | | Silica Sand | Glass, Construction, Non Renewable Energy |
Cleburne | | 2,075 | | O | Non-API | | 8,953 | | | 5,983 | | | 14,936 | | 81% | | Silica Sand | Glass, Construction, Non Renewable Energy |
Crane | | 7,769 | | L | API | | - | | | 32,277 | | | 32,277 | | 85% | | Silica Sand | Non Renewable Energy |
Dividing Creek | | 169 | | O | Non-API | | - | | | 10,928 | | | 10,928 | | 65% | | Silica Sand | Glass, Construction |
| | 1,969 | | L | | | | | | | | | | | | | | | |
Elco(3) | | 2,495 | | O | Non-API | | - | | | 2,932 | | | 2,932 | | 98% | | Microcrystalline Silica | Coatings & Polymers, Ceramics |
| | 1,367 | | L | | | | | | | | | | | | | | | |
| | 7,748 | | M | | | | | | | | | | | | | | | |
Emmett | | 377 | | O | Non-API | | 5,950 | | | 3,427 | | | 9,377 | | 60% | | Feldspathic Sand | Glass, Construction |
| | 423 | | M | | | | | | | | | | | | | | | |
Gore | | 937 | | O | Non-API | | - | | | 3,635 | | | 3,635 | | 83% | | Silica Sand | Glass, Construction |
| | 173 | | L | | | | | | | | | | | | | | | |
Guion(4) | | 3,835 | | O | API | | 14,403 | | | 18,426 | | | 32,829 | | 57% | | Silica Sand | Non Renewable Energy, Construction |
| | 348 | | L | | | | | | | | | | | | | | | |
| | 32 | | M | | | | | | | | | | | | | | | |
Hephzibah | | 1,481 | | O | Non-API | | 3,947 | | | 5,953 | | | 9,900 | | 68% | | Kaolin Clay | Glass, Ceramics |
| | 302 | | L | | | | | | | | | | | | | | | |
Huntingburg | | 10 | | O | Non-API | | - | | | 37 | | | 37 | | 90% | | Ball Clay | Ceramics, Commercial, Coatings & Polymers |
| | 81 | | L | | | | | | | | | | | | | | | |
Junction City(5) | | 851 | | L | Non-API | | 10,048 | | | - | | | 10,048 | | 37% | | Silica Sand | Glass, Construction |
Kermit | | 3,313 | | L | API | | 163,395 | | | - | | | 163,395 | | 87% | | Silica Sand | Non Renewable Energy |
Lugoff | | 1,811 | | L | Non-API | | 5,126 | | | 9,499 | | | 14,625 | | 74% | | Silica Sand | Glass, Commercial, Construction |
Marston | | 2,107 | | O | Non-API | | 19,387 | | | 2,265 | | | 21,652 | | 66% | | Silica Sand | Glass, Construction, Ceramics |
| | 363 | | L | | | | | | | | | | | | | | | |
McIntyre | | 587 | | O | Non-API | | 510 | | | - | | | 510 | | 73% | | Kaolin Clay | Glass, Coatings & Polymers, Ceramics |
| | 1,310 | | L | | | | | | | | | | | | | | | |
| | 215 | | M | | | | | | | | | | | | | | | |
Menomonie | | 10 | | O | API | | 12,608 | | | - | | | 12,608 | | 70% | | Silica Sand | Non Renewable Energy, Glass, Foundry |
| | 363 | | L | | | | | | | | | | | | | | | |
Oregon | | 805 | | O | API | | 30,325 | | | - | | | 30,325 | | 80% | | Silica Sand | Glass, Metals & Mining, Non Renewable Energy |
Ottawa(8) | | 2,655 | | O | API | | 11,096 | | | 20,757 | | | 31,853 | | 50% | | Silica Sand | Construction, Glass, Metals & Mining |
Pevely | | 606 | | O | API | | 9,451 | | | - | | | 9,451 | | 82% | | Silica Sand | Glass, Metals & Mining |
Portage | | 856 | | O | API | | 2,467 | | | 14,405 | | | 16,872 | | 87% | | Silica Sand | Glass, Metals & Mining |
Roff | | 2,841 | | O | API | | 6,466 | | | 1,876 | | | 8,342 | | 85% | | Silica Sand | Glass, Non Renewable Energy, Metals & Mining |
Seiling | | 320 | | L | Non-API | | 29,999 | | | - | | | 29,999 | | 74% | | Silica Sand | Non Renewable Energy |
Southern | | 102 | | O | Non-API | | 12,302 | | | - | | | 12,302 | | 60% | | Industrial Sand | Construction |
| | 382 | | L | | | | | | | | | | | | | | | |
Troup | | 402 | | O | Non-API | | 2,618 | | | 4,153 | | | 6,771 | | 90% | | Ball Clay | Ceramics |
| | 2,243 | | L | | | | | | | | | | | | | | | |
Tunnel City | | 2,171 | | O | API | | 37,544 | | | 118,832 | | | 156,376 | | 47% | | Silica Sand | Non Renewable Energy |
Tuscaloosa | | 345 | | L | Non-API | | 3,521 | | | - | | | 3,521 | | 65% | | Industrial Sand | Metals & Mining, Construction |
Utica | | 2,888 | | O | API | | 60,518 | | | 7,505 | | | 68,023 | | 60% | | Silica Sand | Non Renewable Energy, Glass |
Wedron | | 2,511 | | O | API | | 115,869 | | | 55,405 | | | 171,274 | | 75% | | Silica Sand | Non Renewable Energy, Glass, Foundry |
Canada Operations |
Nephton/Blue Mountain | | 4,302 | | L | Non-API | | 5,064 | | | 18,468 | | | 23,532 | | 74% | | Nepheline Syenite | Coatings & Polymers, Glass, Ceramics, Metals & Mining |
Saint Canut | | 539 | | L | Non-API | | 9,457 | | | - | | | 9,457 | | 97% | | Silica Sand | Glass, Construction |
| | 613 | | M | | | | | | | | | | | | | | | |
Mexico Operations |
39
Ahuazotepec | | 1,148 | | O | Non-API | | 12,926 | | | 1,110 | | | 14,036 | | 38% | | Sodium Feldspar | Ceramics, Glass |
Canoitas | | 4,967 | | O | Non-API | | 33,493 | | | - | | | 33,493 | | 60% | | Silica Sand | Glass, Ceramics, Foundry |
Jaltipan | | 1,147 | | O | Non-API | | 21,022 | | | 16,642 | | | 37,664 | | 52% | | Silica Sand | Glass, Metals & Mining |
San Juan | | 682 | | O | Non-API | | 4,989 | | | - | | | 4,989 | | 35% | | Silica Sand | Glass, Metals & Mining |
Inactive Operations |
Bay City(7) | | 62 | | O | API | | - | | | - | | | - | | 72% | | Silica Sand | Non Renewable Energy |
| | 1,431 | | L | | | | | | | | | | | | | | | |
Brewer | | 343 | | O | API | | - | | | - | | | - | | 79% | | Silica Sand | Non Renewable Energy, Glass, Foundry |
Grand Haven | | 143 | | O | Non-API | | - | | | - | | | - | | 85% | | Industrial Sand | Foundry, Construction |
Green Mountain | | 192 | | O | Non-API | | - | | | - | | | - | | 72% | | Olivine | — |
Kasota | | 3,791 | | O | API | | - | | | - | | | - | | 72% | | Silica Sand | Non Renewable Energy |
Maiden Rock(7) | | 842 | | O | API | | - | | | - | | | - | | 72% | | Silica Sand | Non Renewable Energy, Glass, Foundry |
| | 1,002 | | L | | | | | | | | | | | | | | | |
Shakopee | | 88 | | O | API | | - | | | - | | | - | | 50% | | Silica Sand | Non Renewable Energy, Glass, Foundry |
| | 161 | | L | | | | | | | | | | | | | | | |
Voca (East) | | 634 | | O | API | | - | | | - | | | - | | 42% | | Silica Sand | Non Renewable Energy |
Voca (West) | | 2,044 | | O | API | | - | | | - | | | - | | 50% | | Silica Sand | Non Renewable Energy, Glass, Foundry |
Wexford | | 401 | | O | Non-API | | - | | | - | | | - | | 72% | | Industrial Sand | Foundry, Construction |
Development Sites |
Cawood | | 988 | | M | Non-API | | - | | | - | | | - | | 50% | | Nepheline Syenite | Coatings & Polymers, Glass, Ceramics, Metals & Mining |
Dungannon | | 690 | | O | API | | - | | | - | | | | | 50% | | Nepheline Syenite | Coatings & Polymers, Glass, Ceramics, Metals & Mining |
Katemcy | | 778 | | O | API | | - | | | - | | | - | | 50% | | Silica Sand | Non Renewable Energy |
Hixton | | 228 | | O | API | | - | | | - | | | - | | 60% | | Silica Sand | Non Renewable Energy |
Magdalena Del Kino | | 4,455 | | O | Non-API | | - | | | - | | | - | | 11% | | Borate | Glass, Ceramics |
Torreon | | 361 | | O | Non-API | | - | | | - | | | - | | 75% | | Calcium Carbonate | Paints, fillers and extenders |
Wedeen River | | 201 | | M | Non-API | | - | | | - | | | - | | 22% | | Magnetite | — |
Total | | | | | | | 660,614 | | | 358,715 | | | 1,019,329 | | | | | | |
__________ | | | | | | | | | | | | | | | | | | | |
(A) Acres owned ("O") indicates combined surface and mineral rights acreage |
Acres leased ("L") indicates leased acreage |
Mineral ("M") indicates mineral rights only and mineral claims acreage |
(B) Designated as "API" if reserves meet API RC 19C and "Non-API" if reserves do not meet API RC 19C. |
(1) Delineated Facility Mineral Resources (Measured, Indicated, Inferred) are not included. |
(2) Reserves reported in U.S. Short Tons. |
(3) Elco product recovery derived from high and blend grade tripoli ore intervals is presented only. Insitu cement grade tripoli is excluded. |
(4) Guion plant recovery is 57%. Underground mine extraction recovery is 70%. Guion has both underground and open-pit mining sites. |
(5) Junction City projects a combined Glassil / Puresil product yield of 37% in 2020. |
(6) Camden recovery based on the primary B2 Mine product (77%). B1 Mine product recovery is 60%. |
(7) Bay City and Maiden Rock yield is based on a 38.7% Underground Mine extraction and 72.4% Process Plant recovery. |
(8) Ottawa currently mines from the plant's tailings cells at a recovery of 90%. Insitu Jordan Sandstone recovery is estimated at 50%. |
40
Facilities
We currently have 36 active mining facilities with reserves, six active coating facilities, 10 inactive facilities (including six development sites), and approximately 1.0 billion tons of proven and probable mineral reserves in North America, making us one of North America’s leading industrial mineral producers.
Mining Facilities with Reserves
The mineral rights and access to mineral reserves for the majority of our facilities are secured through land that is owned. There are no underlying agreements and/or royalties associated with the owned properties. For leased properties where there are associated agreements and/or royalties, we have provided more information in the facility descriptions below. We are required to pay production royalties on a per ton basis pursuant to our mineral reserve leases. For the year ended December 31, 2019, total royalty expense associated with these agreements was $11.2 million in royalty payments, representing approximately 0.7% of our revenues.
Ahuazotepec, Puebla, Mexico. We acquired our Ahuazotepec facility in 1997 from Vitro, the leading Mexican glass manufacturer. The facility was built in 1958. The Ahuazotepec facility produces sodium feldspar for sanitary ware, floor tiles and glass markets. The facility is in Ahuazotepec County, Puebla, and consists of approximately 1,100 acres of owned real property. It is about 25 miles from the city of Tulancingo, Hidalgo. The facility uses natural gas and electricity to process feldspar and has an annual capacity of approximately 412,000 short tons. The average utilization rate over the past three years was 57%. The net book value of Ahuazotepec’s real property, fixed assets, and right-of-use assets was $17.4 million at December 31, 2019. The processed dry material is shipped via truck to customers.
The mine is an open-pit, the overburden consists of an altered basalt that is removed with an excavator and hydraulic hammer. A bulldozer is then used to extract the non-compact crystalline tuff. This material is loaded and hauled to a nearby washing plant, where it is processed by screening and washing. The processed wet feldspar is then loaded and hauled to the nearby Ahuazotepec facility where the drying, screening and magnetic separation processes are applied. A portion of the coarse feldspar is ground in the Ahuazotepec facility and a portion is sent in bulk by truck to our Benito Juárez grinding facility, in Monterrey, Nuevo León, for further particle size reduction for ceramic applications.
The Ahuazotepec mine extracts a Tertiary volcanic tuff, which is characterized by containing sub-angular grains, with a size of medium to coarse of anorthoclase feldspar and iron oxide staining. The mining sequence must focus on the selection of three types of quality intended for markets in ceramic glazes, sanitary ware bodies and floor tiles. The main quality parameters are: (i) the product contents of iron oxide and (ii) aluminum oxide. Also, ore is selected based on the color that is defined by the Cielab L index. The facility has a dedicated ceramic process circuit, where the plant produces a material that is separated into two ranges of grain sizes: coarse feldspar-6+20 mesh that it is used for the ceramic market and fine-20 mesh that is used for the glass applications.
Beaver (Southern), Ohio. Our Beaver, Ohio facility, acquired in 1994 from Schrader Sand and Gravel, is located in Jackson Township, Pike County, Ohio and consists of owned and leased real property. The mineral reserves at this facility are secured under mineral leases that, with the exercise of renewal options, expire in 2024. The facility, which is approximately six miles northeast of Beaver, Ohio, is accessible via County Road 521. The facility utilizes electricity to process sand. Mining methods include the mechanical removal of glacial overburden followed by drilling, blasting and mechanical mining. The total net book value of the Beaver facility’s real property, fixed assets, and right-of-use assets was $5.6 million at December 31, 2019.
The sand reserve mined from the open-pit mine at the Beaver facility is the Sharon Conglomerate. The Beaver facility produces high purity, sub-angular grain silica sand and gravel. Mining at the Beaver facility is completed on a seasonal basis. Existing equipment dates to the 1960’s and is repaired as needed during the winter months; in addition, equipment (dating to 2013 or newer) has been acquired. The annual mining capacity is approximately 425,000 tons and the average utilization rate over the past three years was 10%. The deposit has a minimum silica content of 99% and is ideal for turf/landscaping and industrial applications. The controlling attribute is cleanliness, which is controlled through wet processing.
Camden, Tennessee. We acquired the Camden facility from the Morie Company in 1996, Morie purchased the plant in the late 1970’s from Hardy Sand Company, and Hardy Sand operated the plant for approximately 20 years prior. The facility is located in Camden, Benton County, Tennessee, off U.S. Highway 70, 90 miles west of Nashville. The site utilizes natural gas for drying and electricity to process sand. The facility consists of approximately 900 acres of owned and approximately 1,100 acres of leased real property. The leased property consists of pipeline right of ways and sand reserves. The lease for the pipeline, with the exercise of renewal options of five to 10 years, expires in 2035. The remaining lease has unlimited renewal options. The total net book value of the Camden facility’s real property, fixed assets, and right-of-use assets was $8.4 million at December 31, 2019.
41
The Camden facility mines sand via load and carry operations. The facility operations consist of washing, flotation, drying and screening processes to make finished product. Since its acquisition, Covia has made several upgrades to the facility, including safety, operational and rail loading improvements. Currently, annual capacity is approximately 837,000 tons and the average utilization rate over the past three years was 58%. Additional capacity expansions are possible depending on market conditions.
The Camden facility utilizes approximately 4,100 linear feet of rail. The sand mined at the Camden facility is sub-angular sand, which is suitable for glass, mineral fillers, foundry and general industrial use. Final product is shipped from the facility via bulk truck or bulk rail via the CSX railroad.
The site mines in an open-pit manner in the McNairy Sand. The local sand section is medium to fine grained in the upper part of the deposit (B2 grade sand) and is fine grained in the lower section (B1 grade sand). Mining is conducted from two independent pits to obtain feed from both the B2 and B1 sections of the deposit to support glass and foundry sand production. The primary key quality parameters controlling mine sequence development are: (i) the percentage of product iron oxide; (ii) the percentage of retained product-140 mesh sand; and (iii) the percentage of product-140 mesh fines fraction.
Canoitas, Coahuila, Mexico. The Canoitas facility was constructed in 1988, and was acquired by Covia in 1997 from Vitro, the Mexican glass manufacturer. The Canoitas facility mainly produces glass sand. It is in Hidalgo County, Coahuila, Mexico, approximately 55 miles northwest of Nuevo Laredo City, and is accessible via State Highway 2. The Canoitas facility utilizes diesel, heavy oil and electricity to process sand. Annual capacity at the Canoitas facility is approximately 1.2 million short tons and the average utilization rate over the past three years was 89%. The processed material is shipped via bulk truck to customers. The total net book value of the Canoitas facility’s real property, fixed assets, and right-of-use assets was $61.0 million at December 31, 2019.
The facility’s open-pit operations require drilling and blasting to fragment the silica cemented sand. The material is loaded and hauled with wheel front end loaders and rigid frame haul trucks for feeding the crushing system. The material is processed by primary and secondary crushing, screening, milling, attrition, hydro sizing, drying and magnetic separation.
The Canoitas facility extracts silica sand ore from the Carrizo Sand. The sandstone section is mined in two benches to optimize blending capabilities to support the production of glass, ceramic and foundry sand products. Mine development is focused on optimizing extraction of glass grade sand with an iron oxide content of less than 0.065%. Sand containing an iron oxide content above 0.065% is directed to the production of colored glass and float glass grade products. The primary key quality parameters controlling mine sequence development are (i) the percentage of product iron oxide and (ii) the percentage of product aluminum oxide.
Beneficiated wet sand from the Canoitas facility is shipped via trucks to our Lampazos facility for further processing. The Lampazos facility produces flint glass grade by leaching, drying and magnetic separation processes of the Canoitas sand material. The wet sand is also dried and ground to produce ceramic grade materials. The products produced at the Lampazos facility are shipped via trucks to customers in northeastern Mexico.
Chardon, Ohio. Our Chardon, Ohio facility is located in Geauga County, Ohio and consists of owned real property. The facility, which is approximately two miles south of Chardon, is accessible via State Route 44. The site utilizes natural gas and electricity to process sand. Mining methods include the mechanical removal of glacial overburden followed by drilling, blasting and mechanical mining.
The mine was opened in 1938 and acquired by Best Sand in 1978. We acquired the mine as a result of the merger of Wedron Silica and Best Sand in 1986. Upgrades were made to the wash plant in 2009, the fluid bed dryer in 2012 and the rotary dryer circuit in 2012. The total net book value of the Chardon facility’s real property, fixed assets, and right-of-use assets was $57.1 million at December 31, 2019.
The sand reserve mined from the open-pit mine at the Chardon facility is the Sharon Conglomerate formation. This plant produces high purity, sub-angular grain silica sand and gravel used for industrial and recreational markets. The mining capacity is approximately 1.1 million tons per year and the average utilization rate over the past three years was 53%. The surface deposit at the Chardon facility is a high purity, sub-round grain silica sand/gravel. The deposit has a minimum silica content of 99% ideal for glass and foundry applications. The contributing attributes are iron and grain size distribution. The mine’s iron averages 0.084%.
Cleburne, Texas. We acquired our Cleburne facility in 1983 from Martin Marietta. The facility has been in operation since 1976. The facility is located near Cleburne, Johnson County, Texas, approximately 50 miles southwest of Fort Worth, Texas and is accessible via State Highway 67 via U.S. Interstate Highway 35W. The site consists of 2,075 acres of owned real property and utilizes
42
natural gas and electricity to process sand. Annual capacity at the Cleburne facility is approximately 1.4 million tons of sand and the average utilization rate over the past three years was 76%. The total net book value of the Cleburne facility’s real property, fixed assets, and right-of-use assets was $11.7 million at December 31, 2019. Processed material is shipped via truck and is also transloaded onto the Fort Worth & Western Railroad.
The mine is an open-pit operation where silica sand is mined and transported to the facility via trucks. Mine operations are completed on a year-round basis. The whole grain material is then washed, dried and screened and sold for proppant, glass, commercial and industrial applications. The Cleburne facility also has a grinding facility for producing products servicing fiberglass, construction and ceramics.
The Cleburne facility derives its silica sand ore from the Paluxy Formation. The sand section is mined in a single bench. Dozer and excavators are used to mine ore from multiple sections of the stripped mining cuts to support optimizing production of glass and frac sand products. End users are the frac sand, glass/industrial, and ground product businesses. The Cleburne plant meets or exceeds all frac sand and industrial customer specifications.
Crane, Texas. We began construction on our Crane location in December 2017. The facility is located near the town of Crane, Crane County, Texas, and consists of approximately 7,600 acres of leased real property. The Crane deposit was a greenfield discovery in 2017. The reserves are secured by lease agreements. The facility is located approximately 50 miles southwest of Odessa and is accessible via U.S. Highway 385 & FM 1233. The facility commenced shipments and final processing refinements in late July 2018 and has an annual capacity of approximately 3 million tons. Utilization in 2018 (year of commissioning) was 16% and utilization in 2019 was 75%. The total net book value of the Crane facility’s real property, fixed assets, and right-of-use assets was $93.1 million at December 31, 2019.
The mining process at Crane is open-pit and carried out by excavators and articulated haul trucks capable of operating around the clock on a daily basis. Run of mine material does not require crushing and will be washed, dried, and screened for size before being loaded into five silos, each with a 4,000 ton capacity. The Crane facility derives its raw feed from Quaternary eolian sand dunes. The deposit is mined for frac sand and meets or exceeds all customer API specifications.
Dividing Creek, New Jersey. Our Dividing Creek facility is located near Dividing Creek, Cumberland County, New Jersey and consists of over 2,100 acres of owned and leased real property. The mineral reserves at the Dividing Creek facility are secured under a mineral lease that expires in 2035 and has a renewal option through 2065. The facility is located approximately 30 miles south of Philadelphia and is accessible via State Highway 55 as well as State Highway 77. The facility utilizes natural gas and electricity to process sand. Annual capacity is approximately 971,600 and the average utilization rate over the past three years was 70%. The total net book value of the Dividing Creek facility’s real property, fixed assets, and right-of-use assets was $8.2 million at December 31, 2019. Finished product is shipped via truck and rail with over 7,600 linear feet of rail. We use the Winchester & Western railroad to move minerals from the Dividing Creek and Gore facilities to customers via access to the Norfolk Southern and CSX railroads.
Materials are pumped from the mine location to the processing facility. The processing facility has distinct circuits to produce glass and construction products as well as frac sand. The glass circuits utilize beneficiation techniques to remove iron and other impurities that are detrimental to glass and construction customers. The frac circuits rely upon wet sizing to produce 100 mesh frac sand. The facility utilizes stock pile towers for the draining of materials prior to drying. The Dividing Creek facility was upgraded over the last five years with frac sand capacity additions and a new fluid bed dryer.
The Dividing Creek facility derives its silica sand ore from the Cohansey Formation. Mining is completed on a year-round basis. The facility utilizes dredge mining and is completed using two dredges operating in separate ponds. Products are sold into the glass, construction, and frac sand businesses. The Dividing Creek plant meets or exceeds all API and industrial customer specifications.
Elco, Illinois. We acquired our Elco facility in 1989 from The Illinois Minerals Company. The facility is located in Tamms, Alexander County, Illinois and consists of over 11,000 acres of owned and leased real property and mineral rights. The majority of the reserves are owned and approximately 10% are secured under mineral leases that, with the exercise of renewal options, expire between 2023 and 2034. The Elco facility is approximately 130 miles southeast of St. Louis and is accessible via major highways, including U.S. Interstate Highways 55 and 57. The site utilizes natural gas and electricity to process silica. The facility’s capacity is approximately 60,000 tons annually and the average utilization rate over the past three years was 71%. The total net book value of the Elco facility’s real property, fixed assets, and right-of-use assets was $2.7 million at December 31, 2019.
The Elco facility performs an initial size reduction of the ore prior to drying. From the dryer, the material is then deagglomerated and classified and conveyed to silos for shipping or packaging. Material from Elco is sold into the coatings, ceramics, rubber and
43
cementing industries. The Elco facility derives its microcrystalline silica (tripoli) ore from the Clear Creek Chert. The deposit is mined in an open pit utilizing multiple benches to optimize blending capabilities and allow for more efficient segregation of primary tripoli ore and cement grade tripoli (chert).
Emmett, Idaho. We acquired our Emmett facility in 1983 from Martin Marietta. The facility has been in operation since 1953. The facility is located in Emmett, Gem County, Idaho, approximately 30 miles northwest of Boise, Idaho, and is accessible via State Highway 52. The site consists of 723 acres of owned real property and utilizes natural gas and electricity to process sand. Annual capacity at the Emmett facility is approximately 253,000 tons of sand. The average utilization rate over the past three years was 41%. The total net book value of the Emmett facility’s real property, fixed assets, and right-of-use assets was $2.4 million at December 31, 2019. Processed material is shipped via truck and rail using the Idaho Northern Pacific railroad with access to the Union Pacific railroad.
The mine is an open-pit operation where feldspathic silica sand is mined and transported to the facility via trucks. Mining, wet processing and grinding operations are scheduled ten months out of the year to avoid cold weather. Drying and screening operations are performed all year long from damp stockpiles. The whole grain material is then washed, ground, dried and screened and sold for glass, fiberglass, construction, golf, and industrial applications. The Emmett facility also has a packaging facility for producing bagged products servicing construction, filtration, as well as, the sports and leisure industries. The Emmett facility derives its feldspathic sand ore from the Idaho Group. The deposit is mined in multiple benches. The Emmett plant meets or exceeds all industrial customer specifications.
Gore, Virginia. We acquired our Gore facility in 1972 from Virginia Glass Sand. The facility is located in Gore, Frederick County, Virginia, approximately 12 miles west of Winchester, Virginia. The site consists of approximately 1,100 combined acres of owned and leased real property and utilizes propane and electricity to process sand. The facility’s mineral reserves are secured by a lease that expires in 2033. Annual capacity at the Gore facility is approximately 750,000 tons of sand and the average utilization rate over the past three years was 75%. The total net book value of the Gore facility’s real property, fixed assets, and right-of-use assets was $5.6 million at December 31, 2019. Processed material is shipped via truck or rail. The Winchester and Western Railroad transports rail deliveries from Gore.
Mining operations consist of two open-pit quarries where sandstone ore is mined and transported to the facility via haul trucks. Mine operations are completed on a year-round basis. The material is crushed, ground, sized, floated, dried, screened, and sold for flat glass, container glass, grouts, foundries, and insulation. Byproducts are used on golf courses, horse farms and at cement plants.
The facility derives its silica sand ore from the Oriskany Sandstone. The consolidated sandstone section occurs within two limbs of an anticlinal structure trending across the property. Mining is occurring on the Cove Ridge (northwest limb) and the South Quarry (southeast limb) sections of the deposit. Overburden shale and poor-quality sandstone are selectively removed as part of stripping operations to uncover the targeted economic portion of the sandstone section. Stripping operations are performed by regional excavation contractors. Mining is conducted in multiple benches on each limb to optimize ore blending capabilities. The primary key quality parameters controlling mine sequence development are: (i) the percentage of iron oxide to support glass product production; and (ii) the percentage of +40 mesh agglomerated sand clusters remaining after crushing.
Guion, Arkansas. We acquired our Guion facility from Silica Products in 1988. The facility has been in operation since 1917. It is located in Guion, Izard County, Arkansas, approximately 95 miles west of Jonesboro, Arkansas and is accessible via County Highway 58 off County Highway 9 via U.S. Interstate Highway 40. The property consists of approximately 3,000 acres of owned real property and 300 acres of leased property (the lease is perpetual as long as we are transporting over it, mining it, sand is being shipped from our mill, and we are paying the royalty). The site utilizes natural gas and electricity to process sand. The Guion facility utilizes approximately 6,900 linear feet of rail, including 4,500 linear feet for raw sand and 2,400 linear feet for a resin-coated sand product. Annual capacity is approximately 1.2 million tons of sand and approximately 180,000 tons of resin-coated sand. The average utilization rate over the past three years was 82%. The total net book value of the Guion facility’s real property, fixed assets, and right-of-use assets was $61.0 million at December 31, 2019. Processed material is shipped via truck or rail using the Missouri Northern Arkansas railroad connecting with the Union Pacific railroad.
The sand reserve is mined from the St. Peter Sandstone. Covia utilizes both open-pit and underground mining, with the reserves located at depths of up to 200 feet. The underground mine utilizes a “room-and-pillar” mining method with both horizontal and vertical blasting. The facility utilizes multiple stages of crushing and washing to produce materials that meet API standards for proppant products as well as glass and foundry sand products. Mining operations are completed on a year-round basis.
44
The Guion facility has an integrated resin coating sand facility that can receive materials from the adjacent Guion silica sand facility or substrate from our other facilities. The resin coating facility has two processing lines, each with the capacity to coat 180 million pounds, or 90,000 tons, per year of substrate. The facility has the flexibility to coat various substrates using novolac or resole technology. The Guion resin facility was idled in 2019.
The silica sand product contains a minimum silica content of 99% and meets API standards for proppant applications. The sandstone section is mined in both open-pit and underground mining operations with approximately 40% of the facility feed derived from the open-pit operation and approximately 60% from the underground mine. The deposit typically contains varying degrees of calcite cementation in the upper part of the section and increased silica cementation in the lower part of the section. The ore control process is optimized by blending feed from multiple underground workings and from the open pit. The primary key quality parameter controlling mine sequence development is the percentage of the -40/+70 mesh sand fraction.
Hephzibah, Georgia. We acquired our Hephzibah facility in 2000 from Albion Kaolin Company. The facility is located in Hephzibah, Richmond County, Georgia and consists of over 1,700 acres of owned and leased real property. The mineral reserves at the Hephzibah facility not owned by us are secured under a mineral leases that expires in 2022. The facility is located approximately 15 miles southwest of Augusta and is accessible via State Highway 88. It utilizes methane, natural gas, and electricity in its production processes. Annual capacity is approximately 236,000 tons and the average utilization rate over the past three years was 92%. The total net book value of the Hephzibah facility’s real property, fixed assets, and right-of-use assets was $4.9 million at December 31, 2019. Finished material is shipped via truck and via rail using the Norfolk Southern railroad with approximately 6,400 linear feet of rail.
The Hephzibah property also produces construction grade sand which is mined, processed, and marketed by a regional materials contractor. This sand is produced from the overburden above the clay. Production of this material reduces the volume of overburden removal that the plant must perform to access the clay.
The Hephzibah facility utilizes open-pit mining methods to feed the facility. Overburden removal, and clay mining are both performed by a regional excavating contractor, who specializes in kaolin. After mining, the material is then shredded and sent to one of two processing lines or fed directly in a continuous blunger for producing slurry products. One of the processing lines produces materials primarily for ceramics utilizing deagglomerating systems with classifiers. The second system utilizes milling and classifying circuits to produce materials for the fiberglass industry. The final product is shipped via bulk truck and rail or via Intermediate Bulk Containers (“IBCs”).
The Hephzibah facility derives its kaolin clay ore from the Buffalo Creek Formation. At the Hephzibah operation the mineable clay ranges in thickness from 0-24 feet. The clay ore section is subdivided into three mining units (Form, Sperse and Bond) to facilitate blending to formulate the facility’s ceramic and fiberglass grade products. The primary key quality parameters controlling mine sequence development are: (i) the percentage of +325 mesh “grit” fraction; (ii) the percentage of product iron oxide; (iii) the percentage of product titanium oxide; and (iv) the specific surface area (“SSA”) of the clay product.
Huntingburg, Indiana. We acquired the Huntingburg facility in 1999 from United Clays, but the facility has been in operation since 1981. The facility is located in Huntingburg, Dubois County, Indiana, approximately 40 miles east of Evansville, Indiana, and is accessible via State Highway 231 North to State Highway 64 West from U.S. Interstate Highway 64. The site consists of 10.3 acres of owned real property and utilizes natural gas and electricity to process calcium carbonate and clays. Annual capacity at the Huntingburg facility is approximately 79,000 tons of processed calcium and clay minerals and the average utilization rate over the past three years was 31%. The total net book value of the Huntingburg facility’s real property, fixed assets, and right-of-use assets was $0.1 million at December 31, 2019. Processed material is shipped via truck in bulk or bagged quantities.
The mine is an open-pit operation where two Indiana Fire Clays are mined. The mine is located approximately 6 miles from the plant site. The mining process is campaigned annually, where a large stockpile of the clays is staged. The clays are transported to the plant processing facility throughout the year. The clays are shredded, ground, dried and packaged for brick, chemical stoneware, ceramics, sealants, rubber, and other commercial and industrial applications. The calcium carbonate is purchased from a third party and is ground, dried, packaged for rubber, anti-stick, ceramic glaze and other commercial and industrial applications.
The Huntingburg facility derives its fire clay ore primarily from the Brazil Formation. The clay ore section is derived from “underclays” associated with overlying organic-rich coal and lignite seams. Overburden shale and limestone are selectively removed to expose the target economic portion of the ball clay section. The primary clay ore unit is termed “WT” or white clay. Within the overburden section, a second clay seam, termed “RD” or red clay, is mined as a byproduct to WT clay production. The extent of overburden stripping is controlled by the thickness of consolidated limestone occurring within the section. The key quality parameters
45
defining clay ore quality and controlling mine sequence development are: (i) the percentage of iron oxide; (ii) the percentage of carbon; and (iii) the percentage of sulfur.
Jaltipan, Veracruz, Mexico. The Jaltipan facility was constructed in 1955 and was acquired by us in 1997 from Vitro. The facility is located at Jaltipan, Veracruz State, Mexico and is approximately 19 miles southwest from the Minatitlan City airport. The Jaltipan facility utilizes natural gas and electricity to process sand. Its annual capacity is approximately 1.2 million short tons and the average utilization rate over the past three years was 87%. The total net book value of the Jaltipan facility’s real property, fixed assets, and right-of-use assets was $22.2 million at December 31, 2019. The processed material is shipped via truck and rail using Ferrocarril del Sureste, commonly known as Ferrosur. The Jaltipan facility ships directly to the glass and foundry industries in central Mexico via trucks and the Ferromex railway.
The Jaltipan facility extracts silica sand ore in an open-pit operation from the Filisola Formation. The unconsolidated sand section is mined in multiple benches to produce glass and foundry sand products. The primary key quality parameters controlling mine sequence development are: (i) the percentage of product iron oxide and (ii) the percentage of total -140 mesh fine waste.
We utilize excavators and trucks in an open-pit environment to produce feed for the Jaltipan facility. The mine operation requires the extraction of interburden plastic clays as waste material that are disposed in dumps or employed in the construction of pond dikes. The mine also needs an effective dewatering operation because the water table is as shallow as 66 feet above sea level. The mining operation is carried out between minus 16 feet to 100 feet above sea level. The material is preprocessed on a pre-washing stage with mud hog, screening and dewatering processes. The preprocessed material is pumped via slurry pumping for 1.6 miles to the Jaltipan facility. The final processes applied at the Jaltipan facility are hydraulic sizing, flotation, drying and magnetic separation.
A portion of beneficiated dry sand from the Jaltipan facility is shipped via trucks to our Tlaxcala facility, which produces glass fiber grade product. Tlaxcala utilizes grinding and high efficiency classifier processes. The Tlaxcala facility ships its product to customers in glass and foundry industries in central Mexico via trucks.
Junction City, Georgia. We acquired our Junction City location from the Morie Company in 1996. The facility is located in Mauk, Marion County, Georgia and consists of leased real property. The mineral reserves are secured by a lease that expires in 2033, which Covia has the option to extend through 2053. The facility is approximately 50 miles east of Columbus, Georgia and accessible via State Highway 90. Annual capacity at the Junction City facility is approximately 887,000 tons and the average utilization rate over the past three years was 59%. The total net book value of the Junction City facility’s real property, fixed assets, and right-of-use assets was $9.7 million at December 31, 2019. Finished product is shipped via truck and via rail using the CSX railroad. The Junction City facility uses approximately 3,000 linear feet of rail. The facility utilizes natural gas and electricity to process sand.
The Junction City facility receives ore from open-pit hydraulic mining systems. It produces low iron and ultra-low iron sand products as well as coarse products. The low iron process involves washing the materials and classifying them into glass grade and industrial grades. Materials are sent to drainage areas to reduce moisture prior to being fed to the drying and screening circuit. The ultra-low iron products utilize the washing process as well as a beneficiation process to lower finished product iron values. Product from the beneficiation process is stored in a covered storage area to maintain quality control prior to being fed to the drying and screening circuit. End products are shipped via bulk rail, truck, IBCs and bags.
The operations at the Junction City facility have recently undergone a capital investment to upgrade the water conservation circuit that will allow increased operating time for the washing and beneficiation circuits. The facility currently services the glass, ceramics, concrete, industrial, and fiberglass industries.
The Junction City facility derives its silica sand ore from the Cusseta–Blufftown Sands. The sand section is mined in a single bench. The primary key quality parameters controlling mine sequence development are: (i) the percentage of product iron oxide; and (ii) the percentage of retained product +40 mesh sand fraction.
Kermit, Texas. Our Kermit, Texas reserves are located eight miles east of Kermit, Winkler County, Texas and consists of approximately 3,250 acres of leased property. The Kermit deposit was a greenfield discovery in 2017. The location is accessible via Highway 115 with access to the Delaware and Midland basins. The facility mines sand through the excavation method and uses natural gas and electricity to process sand. The sand will be transported by slurry to the processing plant where it will be washed, screened, and dried. The finished product will be shipped via truck. The plant began commercial production in mid-2018. The mining capacity is approximately 3.0 million tons. Utilization in 2018 (year of commissioning) was 14% and utilization in 2019 was 50%. The total net book value of the Kermit facility’s real property, fixed assets, and right-of-use assets was $214.7 million at
46
December 31, 2019. The Kermit facility derives its raw feed from Quaternary eolian sand dunes. The deposit is open-pit mined for frac sand and meets or exceeds all customer API specifications.
Lugoff, South Carolina. Covia acquired the Lugoff operation in 1983 from Martin Marietta. The facility has been in operation since the early 1970’s. Located just outside of Lugoff, Kershaw County, South Carolina, the operation consists of approximately 1,800 acres of leased real property. The reserves are secured by a lease agreement that expires in 2057. The facility is located approximately 20 miles northeast of Columbia, South Carolina, and is accessible via U.S. Interstate Highway 20. Annual capacity at the Lugoff facility is approximately 850,000 tons of sand and the average utilization rate over the past three years was 30%. The total net book value of the Lugoff facility’s real property, fixed assets, and right-of-use assets was $1.4 million at December 31, 2019.
Processed material is shipped via truck. Shipment by rail is also available via the CSX railroad, but not used. The mine is an open-pit operation where silica sand is mined using a front-end loader to dig sand from the face and transport it to a hopper. From the hopper, the sand is slurried and pumped to the plant. The plant sizes damp sands that are dried or sold damp to the golf, cement and EQ industries. Dried material is used for foundry, golf, cement, commercial and industrial applications. The Lugoff facility also has a grinding mill for producing products servicing the fiberglass industry.
Marston, North Carolina. We acquired our Marston operation in 1983 from Carolina Silica. The facility is located in Marston, Richmond County, North Carolina and consists of over 2,400 acres of owned and leased real property. The Marston facility is approximately 50 miles west of Fayetteville, NC and is accessible via U.S. Highway 1. Annual capacity at Marston is approximately 1.1 million tons and the average utilization rate over the past three years was 82%. The total net book value of the Marston facility’s real property, fixed assets, and right-of-use assets was $8.1 million at December 31, 2019.
Processed material is shipped via bulk truck or by bulk rail using the CSX railroad. The facility operations consist of washing, beneficiation, drying, screening, grinding, and classifying processes to make finished product servicing the concrete, ceramic, industrial, glass, fiberglass, foundry and sport and leisure industries. Marston derives its silica sand ore from the Pinehurst Sand. The sand section primarily is mined in a single bench. Open-pit mining is conducted using loaders to excavate sand from the unconsolidated above water mining face.
McIntyre, Georgia. We acquired our McIntyre facility in 2000 from Albion Kaolin, but the facility has been in continuous operation since the early 1900s. The facility is located in McIntyre, Wilkinson County, Georgia, and consists of approximately 2,100 acres of owned and leased real property and mineral rights. The reserves are secured by lease agreements that expire between 2021 and 2036. The facility is approximately 30 miles east of Macon, Georgia and 20 miles south of Milledgeville, Georgia, and is accessible via U.S. Highway 441. The site utilizes natural gas and electricity to process kaolin clay. Annual capacity at the McIntyre facility is approximately 238,000 tons and the average utilization rate over the past three years was 50%. The total net book value of the McIntyre facility’s real property, fixed assets, and right-of-use assets was $8.2 million at December 31, 2019. Processed material is shipped in bulk or bag via truck. Shipment by rail is also available via the Norfolk Southern railroad.
The kaolin clay reserves are mined from multiple open-pits within a 35-mile radius of McIntyre. Overburden ranges from 50 to 120 feet with clay seams ranging between 15 and 40 feet. Crude clay is delivered to a covered crude shed at the plant via dump trucks on a year-round basis. The milling operation is fed from the crude shed via front-end loaders. Crude clay is processed via drying and milling/classifying equipment into a minus 325-mesh powder and stored in concrete silos until bagged or loaded into bulk trucks or railcars for shipment.
The McIntyre facility derives its kaolin clay ore from the Huber Formation. The operation extracts its ore feed from multiple mining pits. The clay is subsequently blended to formulate the plant’s fiberglass, ceramic and functional filler products. Mining is completed by a third-party contractor working under an established mining supply agreement. The primary key quality parameters controlling mine sequence development are: (i) GEB Brightness; (ii) the percentage of Residue (+325 mesh); (iii) SSA; (iv) the percentage of clay passing 2 micron particle size; and (v) the percentage of iron oxide.
Menomonie, Wisconsin. Our Menomonie, Wisconsin facility is located in Menomonie, Dunn County, Wisconsin and consists primarily of leased real property. The mineral reserves at our Menomonie facility are secured under mineral subleases that expire in 2044. We constructed the Menomonie facility in 2007 approximately two miles east of Menomonie and it is accessible via US Highway 12 / State Highway 16. The Menomonie facility utilizes natural gas and electricity to process sand. Mining methods include the mechanical removal of glacial overburden followed by drilling, blasting, and mechanical mining. Mined sand is processed and shipped by truck or rail. A remote transload facility adjacent to the Union Pacific (“UP”) Railroad is located approximately one mile north of the site.
47
The sand reserve mined from the open-pit at the Menomonie facility is derived from the Wonewoc Sandstone. The ore deposit at the Menomonie facility is a high purity, round grain sand with a minimum silica content of 99%, which meets API requirements for proppant applications. Both hydraulic fracturing sand proppants and industrial sands for glass manufacturing are produced by the operation. In 2018, a total of 230,000 net tons of proppant sand and 167,000 net tons of industrial sand were shipped. The three year average utilization rate is 44% based on an operational capacity of approximately 750,000 net tons per year. The total net book value of the Menomonie facility’s real property, fixed assets, and right-of-use assets was $11.9 million at December 31, 2019. The controlling attributes are grain size, iron oxide, and turbidity. Maximum average full face iron content is 0.080%. The deposit tends to exhibit a coarser grain size distribution in top half of deposit. Turbidity is controlled though the use of attrition scrubbers during wet processing. Iron is controlled during processing through the use of magnetic separators.
Nephton, Ontario, Canada. We acquired our Nephton and Blue Mountain facilities in 1990 from Indusmin LTD. The facilities are located in Havelock-Belmont-Methuen Township in central-eastern Ontario, Canada. They are located approximately 60 kilometers north of Peterborough and consist of over 4,300 acres of leased real property. These facilities use propane and electricity to process nepheline syenite. Annual capacity at the Nephton and Blue Mountain facilities is approximately 1.1 million tons and the average utilization rate over the past three years was 58%. The total net book value of the Nephton facility’s real property, fixed assets, and right-of-use assets was $71.6 million at December 31, 2019. The facilities have over 30,000 linear feet of rail. Processed material is shipped via truck and rail using the Canadian Pacific railroad.
The facilities derive nepheline syenite ore from igneous intrusives metamorphosed during the Grenville Orogeny. The nepheline syenite ore section is open-pit mined in multiple benches to optimize blending capabilities and to allow for the more efficient removal of inner burden waste. Deposit definition employs both core and more tightly spaced percussion drilling to provide adequate grade control information to support the facility’s mining operations. The primary key quality parameters controlling mine sequence development are: (i) the percentage of iron oxide; (ii) the percentage of aluminum oxide; (iii) the percentage of sodium oxide; and (iv) the percentage of calcium oxide.
We utilize drill and blast processes in an open-pit environment to produce feed for the facility. Material is transported from the mine to the facility utilizing rigid frame haul trucks. The material is sent through drying, crushing, screening and beneficiation steps for producing products for the glass and ceramics industries and feed for grinding operations. Grinding operations for the coatings and polymers industries utilizes high efficiency classifiers for producing products that have distinct size distributions meeting customer requirements. Products are packaged in gravity and positive displacement railcars, bulk pneumatic trucks, IBCs and bags. The facility services customers in the abrasives, cement, ceramic, industrial, glass, fiberglass, coatings and polymer industries.
Beneficiated dry sand material from nepheline syenite operations in Nephton is shipped to our Tamms and Troy Grove facilities in Illinois for further processing. The Tamms facility receives nepheline syenite for grinding in circuits specifically designed for supplying the polymer industry. The facility utilizes grid electricity and finished material is packaged in IBCs and bags. The Troy Grove facility receives nepheline syenite for grinding in a dedicated circuit designed for supplying the coatings industry. The material is only produced for bulk customers. In order to produce products for the coatings industry at the Troy Grove facility, Covia installed a high efficiency classifier at the facility in order to produce products that have the necessary particle size distribution for coatings. The Troy Grove facility utilizes grid electricity.
The Blue Mountain facility is undergoing a substantial capital investment program to modernize the facility and expand our grinding capacity to serve the coatings and polymers markets.
Oregon, Illinois. We acquired our Oregon facility in 1983 from Martin Marietta. The facility is located in Oregon, Ogle County, Illinois and consists of owned real property. It is located approximately 30 miles southwest of Rockford and is accessible via State Highway 2. The Oregon facility utilizes natural gas and electricity to process sand.
Annual capacity at the Oregon facility is approximately 1.7 million tons and the average utilization rate over the past three years was 75%. The total net book value of the Oregon facility’s real property, fixed assets, and right-of-use assets was $14.9 million at December 31, 2019. Processed sand is shipped via truck or rail. The Oregon facility has unit train capabilities using the BNSF Railway and over 15,000 linear feet of rail.
We utilize drill and blast processes in an open-pit environment to produce feed for the facility. In-pit crushing, screening and secondary crushing are utilized to generate hydraulic classifier feed. The crushing and hydraulic classification operations are seasonal and large stockpiles are created to feed the facility during winter months. From the classified material piles, the facility utilizes drying and screening operations to produce frac, foundry, glass and construction products. Products are shipped via bulk rail, bulk truck, via
48
IBCs and bags. Over the last five years, we have invested in projects to increase frac sand capacity at the Oregon facility as well as its reserve base.
The Oregon facility derives its silica sand ore from the St. Peter Sandstone. The silica sand product contains a minimum silica content of 99% and meets API standards for proppant applications. The sandstone section is mined in two benches to optimize blending capabilities to support the production of glass and frac sand products. Occurrences of iron oxide in the deposit tend to be higher in the lower mining bench. The primary key quality parameters controlling mine sequence development are: (i) the percentage of iron oxide, aluminum oxide and magnesium oxide to support glass grade product production; and (ii) the percentage of retained product 140 mesh sand fraction.
Ottawa, Minnesota. We acquired our Ottawa location in 1971 from Gopher State Silica and in 1978 completed brownfield construction of its current Ottawa facility. The facility is located in Le Sueur, Le Sueur County, Minnesota, approximately 65 miles southwest of Minneapolis. It consists of approximately 2,650 acres of owned real property and is accessible by using major highways, including U.S. Interstate 169. The facility uses natural gas and electricity to process sand. Processed material is shipped via rail using the Union Pacific railroad utilizing the site’s 10,000 linear feet of rail. Currently, annual capacity is approximately 688,000 tons and the average utilization rate over the past three years was 92%. The total net book value of the Ottawa facility’s real property, fixed assets, and right-of-use assets was $4.5 million at December 31, 2019.
The sand reserve mined from the open-pit mine is from the Jordan Sandstone. The mine has overburden ranging from 10 to 100 feet that needs to be removed to access the silica sand reserves. The facility is a load and carry operation with wheel loaders feeding conveyors to the in-pit crushing system. The mining operations are completed on a year-round basis. The silica sand is processed via multiple steps of crushing and then is dried and screened to produce API grade silica sand proppant, glass sand, foundry sand and products for the construction industry.
The silica sand product contains a minimum silica content of 99% and meets API standards for proppant applications. The sandstone section is mined in two benches to optimize production of glass, foundry and frac sand products. The upper bench ore is medium to coarse grained and the underlying bench is largely fine to medium grained. The primary key quality parameters controlling mine sequence development are: (i) the percentage of iron oxide; (ii) the percentage of aluminum oxide; and (iii) the percentage of -40/+140 mesh sand fraction distribution. Mine production recently has been augmented with the extraction of sand previously disposed of in the facility’s tailings cells.
Pevely, Missouri. We acquired the Pevely facility from Bussen Quarries and the Masters Brothers Silica Sand Co in 1991. The Pevely facility is located in Pevely, Jefferson County, Missouri and consists of entirely owned real property. It is located approximately 30 miles southwest of St. Louis and is accessible via U.S. Interstate Highway 55. The Pevely facility utilizes natural gas, propane and electricity to process sand. The facility’s capacity is approximately 627,000 tons annually and the average utilization rate over the past three years was 70%. The total net book value of the Pevely facility’s real property, fixed assets, and right-of-use assets was $15.3 million at December 31, 2019. We ship processed sand via truck, and barge and railcars on the Union Pacific railroad utilizing a local third party transloading facility.
We utilize drill and blast processes in an open-pit environment to produce feed for the facility. Mining operations are performed year-round. Overburden removal to access sandstone is typically performed under contract by a regional excavating contractor. Crushing, screening, deagglomeration, dewatering, drying and screening are utilized to produce final products. During the last five years, the Pevely facility has undergone a frac sand expansion and a crushing upgrade as well as an extension of the reserve base. The Pevely facility services the concrete, glass, foundry, frac sand and ceramics industries.
The Pevely facility derives its silica sand ore from the St. Peter Sandstone and mines from a single bench. The silica sand product contains a minimum silica content of 99% and meets API standards for proppant applications. The primary key quality parameters controlling mine sequence development are the percentages of calcium oxide, iron oxide, and acid demand value (“ADV”) to support glass and foundry product production.
Portage, Wisconsin. We acquired the Portage facility from Martin Marietta in 1983. The facility is located in Pardeeville, Columbia County, Wisconsin and consists of owned real property. It is located approximately 30 miles north of Madison and is accessible via State Highway 51. The facility utilizes natural gas, propane and electricity to process sand. The facility’s capacity is approximately 660,000 tons annually and the average utilization rate over the past three years was 62%. The total net book value of the Portage facility’s real property, fixed assets, and right-of-use assets was $2.7 million at December 31, 2019. The facility utilizes approximately 3,500 linear feet of rail. Processed material is shipped via truck and rail using the Canadian Pacific railroad.
49
Mining at the Portage facility is completed on a seasonal basis. Material from the open-pit dredging operation is hydraulically transported to the facility. The facility creates a large stockpile for operations to utilize during the winter months. The facility utilizes wet screening and classifying circuits to prepare material for its drying and screening operations. During the last eight years, Covia has replaced the dredge at the Portage facility and completed upgrades to the drying, screening and packaging circuits. The facility produces products for the concrete, glass, foundry and frac sand industries. Materials are packaged in bulk rail, bulk truck, IBCs and bags.
The Portage facility derives its silica sand ore from the Wonewoc Sandstone. The silica sand product contains a minimum silica content of 99% and meets API standards for proppant applications. The sandstone is mined by dredge. The primary below-water dredge mining process is augmented by sand feed derived from the above water sandstone section. Dozers are used to rip and push above-water sandstone into the dredge pond for follow-on extraction. The primary key quality parameters controlling mine sequence development are (i) the percentage of iron oxide, aluminum oxide, and calcium oxide to support glass product production; (ii) the percentage of total -140 mesh fines; and (iii) deposit -20/+140 mesh fraction sieve distributions and associated grain fineness (“GFN”) numbers.
Roff, Oklahoma. We acquired our Roff facility in 1980 from Mid Continent Glass Co. The facility is located in Roff, Pontotoc County, Oklahoma and consists of over 3,200 acres of owned real property. It is located approximately 90 miles south of Oklahoma City and is accessible via U.S. Interstate Highway 35. The Roff facility utilizes natural gas and electricity to process sand and has an annual capacity of approximately 1.2 million tons. The average utilization rate over the past three years was 90%. The total net book value of the Roff facility’s real property, fixed assets, and right-of-use assets was $4.3 million at December 31, 2019. The facility has approximately 5,000 linear feet of rail. Processed sand is shipped via truck and rail via the BNSF Railway.
The open-pit operations at the Roff facility utilize some surface equipment to transport material to a hydraulic mining and screening system for feed to the facility. The facility hydraulically transports the material to the plant for further wet screening, beneficiation, drying and final product screening. The facility produces material for the frac, glass, foundry and fiberglass industries. Products are only shipped in bulk containers via truck and or rail. Over the last five years, Covia has invested in infrastructure improvements (rail) at the Roff facility, production capacity for frac and glass and land acquisitions to improve the resource base.
The Roff facility derives its silica sand ore from the Oil Creek Formation. As a local facility, the Roff facility has a built-in cost advantage against sand that is shipped in from outside the basin. The silica sand product contains a minimum silica content of 99% and meets API standards for proppant applications. The sandstone section is mined in multiple benches to optimize blending capabilities and allow for more efficient removal of inner burden waste. The sandstone ore sections are commonly associated with fault structures that necessitate infill drilling to adequately delineate ore and waste boundaries and support pit design development.
The primary key quality parameters controlling mine sequence development are: (i) the percentage of -40/+70 mesh sand fraction; and (ii) the percentage of iron oxide, aluminum oxide and calcium oxide to support glass product production.
Saint Canut, Quebec, Canada. We acquired the Saint Canut facility in 1990 from Indusmin LTD. The facility is located approximately 60 kilometers northwest of Montreal. It is accessible via Quebec Route 158 and consists of owned real property. The facility uses natural gas and electricity to process sand. Annual capacity at the Saint Canut facility is approximately 450,000 tons and the average utilization rate over the past three years was 47%. The total net book value of the Saint Canut facility’s real property, fixed assets, and right-of-use assets was $1.6 million at December 31, 2019.
We use drill and blast processes in an open-pit environment to produce feed for the facility. The material is sent through primary and secondary crushing to stockpiles for feeding to the drying system. From the drying system, the sand material is sent through tertiary crushing, screening and beneficiation steps for producing products for the glass and construction industries. Products are shipped via the Quebec Gatineau Railway with access to both the Canadian Pacific Railway and the Canadian National Railway and truck. Product is packaged in bulk rail, bulk trucks, IBCs and bags.
The Saint Canut facility derives its silica sand ore from the Cairnside Sandstone. The sandstone is a high purity, with minimum silica content of 99.4% ideal for glass industries. The sandstone section is mined in two benches to optimize blending capabilities to support production of glass and construction sand products. Local elevated occurrences of high iron and calcium oxide bearing sandstone are present in the deposit, which requires adequate grade control monitoring and blending. The primary key quality parameters controlling mine sequence development are: (i) the percentage of product iron oxide; (ii) the percentage of aluminum oxide; and (iii) the percentage of calcium oxide.
50
San Juan, Veracruz, Mexico. The San Juan facility was acquired in 2003 from Silices San Juan, whose initial business was the extraction of gravel. The plant process and capacity were improved to produce glass sand for the float glass, and to a lesser extent for foundry and construction. The facility is in the San Juan Evangelista County, Veracruz, Mexico, and consists of 457 acres of owned real property. It is approximately 49 miles from the international airport of Minatitlán, Veracruz, and is accessible by the road 145 Tierra Blanca–Sayula de Alemán. The San Juan facility uses electricity to process sand and has an annual capacity of approximately 320,000 short tons. The average utilization rate over the past three years was 62%. The total net book value of the San Juan facility’s real property, fixed assets, and right-of-use assets was $3.8 million at December 31, 2019. The processed material is shipped via trucks in bulk to customers.
The mine operation uses excavators and trucks in an open-pit environment to generate feed for the San Juan facility. The mine overburden is formed by soil, clays and gravels which are disposed of or used in the construction of dams for tailings ponds. The ore body transitions in depth from coarse to medium grain sand. The processes that are used at San Juan are screening, hydro sizing, washing, separation by gravity (spiral) and hydrocyclone classification. The final product is damp sand.
The operation of the mine in San Juan extracts silica sand from Filisola formation of the upper Miocene. The non-consolidated sand section is mined in multiple benches to provide the product mix for glass and foundry sand products. The main key quality parameters which control the development of the mining sequence are: (i) the percentage of product iron oxide; (ii) the percentage of product aluminum oxide; and (iii) the percentage of product oxide of titanium. The specifications of the products also require controls of the coarse grains and fine material passing the 140 mesh.
Seiling, Oklahoma. We completed greenfield construction of the Seiling facility in 2019. The facility is located 10 miles west of Canton, Dewey County, Oklahoma and consists of owned real property. It is approximately 11 miles southeast of Seiling and is accessible via State Highway 51. The Seiling facility utilizes natural gas to process and dry sand. Annual capacity at the Seiling facility is approximately 2,000,000 tons. Utilization in 2019 (year of commissioning) was 34%. The total net book value of the Seiling facility’s real property, fixed assets, and right-of-use assets was $16.5 million at December 31, 2019.
Mining operations consist of an open-pit where sand is mined and transported to the facility stockpile via haul trucks. Stockpiled sand is fed into a hopper where water is added to produce a slurry for transport into the plant. A small volume of sand and organic material is removed as stripping to reduce root contamination. Mine operations are completed on a year-round basis.
The Seiling facility derives its frac sand ore from Quaternary aged eolian sand deposits. The silica sand product contains a minimum silica content of 90% and meets API standards for proppant applications. The unconsolidated sandstone section is mined in a single bench to support production of frac sand products. The primary key quality parameter controlling mine sequence development is the percentage of the -30/+140 mesh sand fraction.
Troup, Texas. We acquired the Troup facility in 1999 from United Clays. The facility is located in Troup, Cherokee County, Texas and consists of over 2,600 acres of owned and leased real property. The facility’s mineral reserves are secured by either leases that expire between 2019 and 2036 or by perpetual leases that remain valid for so long as annual minimum royalties are paid. The Troup facility is located approximately 120 miles southeast of Dallas and is accessible via U.S. Interstate Highway 20. The Troup facility utilizes natural gas and electricity to process ball clay. Annual capacity at the Troup facility is approximately 400,000 tons and the average utilization rate over the past three years was 64%. The total net book value of the Troup facility’s real property, fixed assets, and right-of-use assets was $2.7 million at December 31, 2019. The facility has approximately 3,200 linear feet of rail. Processed material is shipped via truck and rail via the Union Pacific railroad.
The facility transports ore from the open-pit mining operations via over-the-road trucks. Material is deposited in drying sheds for preparation for processing. The material is shredded and placed in sheds for shipment or for feeding to the drying circuit for further processing. The original Shredding and Dryer processes were constructed in 1986 with additional shredded clay and crude clay storage being added later. The plant continues to use relay logic controls for all plant processes. The plant maintains a fleet of 3 front end loaders to move clay through the shredding and loadout processes. Additionally, the plant maintains two tracked excavators which are used to mine clay and miscellaneous ancillary mobile equipment to support mining and processing ball clay.
The Troup facility derives its ball clay ore from the Wilcox Formation. We extract crude clay ore feed from multiple mining pits to optimize blending capabilities. Crude clay grades are primarily delineated using water loss and loss on ignition testing (LOI). These clay grades are subsequently mined and blended to formulate the facility’s ceramic clay products. The primary key quality parameters controlling mine sequence development are: (i) the percentage of loss on ignition (LOI); (ii) the percentage of carbon; (iii) the percentage of clay shrinkage; and (iv) the percentage of sulfur.
51
Tunnel City, Wisconsin. We completed greenfield construction of our Tunnel City facility in 2014. The facility is located in Tomah, Monroe County, Wisconsin, approximately 45 miles east of La Crosse. It consists of over 2,000 acres of owned real property and is accessible by using major highways, including U.S. Interstate 90. The facility utilizes natural gas, propane and electricity to process sand. Processed material is shipped via rail using the Canadian Pacific railroad. The Tunnel City facility is unit train capable with over 42,000 linear feet of rail. Annual capacity is approximately 3.2 million tons per year and the average utilization rate over the past three years was 64%. The total net book value of the Tunnel City facility’s real property, fixed assets, and right-of-use assets was $28.3 million at December 31, 2019.
The sand reserve is mined from the open-pit mine with ripping and dozing to feed the crushing facility. The mine operations are completed on a year-round basis. The silica sand is processed via two steps of crushing and is then wet sized, dried and screened to produce API grade silica sand proppants. It utilizes “advanced technologies” to minimize water and energy consumption, implemented process and design controls to help minimize impacts to the surrounding environment and is working to re-establish pine barren habitat, oak savannah habitat and native prairie plants to the landscape. Through its Tunnel City facility, Covia is also a Wisconsin DNR Habitat Conservation Partner for the Karner Blue Butterfly and is helping to re-establish a bat hibernaculum as a partner in the Wisconsin DNR’s Bat Habitat Program.
The sand reserve mined from the open-pit is the Ironton and Galesville members of the Wonewoc Sandstone. The silica sand product contains a minimum silica content of 99% and meets API standards for proppant applications. The sandstone section is mined in two benches to optimize production of frac sand products. The upper bench derives sand feed primarily from the medium to coarse to fine grained sandstone section (Ironton–upper Galesville) and the underlying bench is comprised largely of medium to fine grained sandstone (Galesville). The primary key quality parameters controlling mine sequence development are: (i) the percentage of -20/+40 mesh sand fraction; (ii) the percentage of -40/+70 mesh sand fraction; and (iii) the percentage of silt and clay fraction to support optimizing filter press plant waste disposal operations.
Tuscaloosa, Alabama. We acquired our Tuscaloosa facility in 1996 from the Morie Company. The facility was originally opened in 1968 by Hardy Sand and has been in continuous operation ever since. It is located on the southern side of the city of Tuscaloosa in Tuscaloosa County off Highway 69 and consists of approximately 350 acres of leased real property. The mineral reserves at Tuscaloosa are secured under mineral leases that expire between 2020 and 2035. Annual capacity is approximately 270,000 tons and the average utilization rate over the past three years was 31%. The total net book value of the Tuscaloosa facility’s real property, fixed assets, and right-of-use assets was $1.8 million at December 31, 2019.
Materials produced at Tuscaloosa are sold both dry and damp and are shipped via truck. The mine is a dredging operation where gravel, silica sand and clay is dredged. The dredge then pumps the mixture to the plant where the gravel is scalped off and sand is passed through a classifier, dried and placed into silos for load out. Damp sand is sold from the stockpiles. The Tuscaloosa facility derives its industrial sand ore from the Cottondale Formation. Oversize gravel is also sold as a byproduct as market demands warrant
Utica, Illinois. We acquired our Utica operation in 1980 from Bellrose Silica. The facility is located in Utica, La Salle County, Illinois and consists of over 2,800 acres of owned real property. It is approximately 10 miles west of Ottawa and is accessible from Interstate 80 via Illinois State Highway 178. The facility is unit train capable and has over 33,000 linear feet of rail. Processed sand is shipped via truck and rail using the CSX railroad. Product can also be shipped via barge at a transload facility within 10 miles of the Utica facility. The facility’s mining operations are completed year-round in an open-pit environment to produce its plant feed. There are three operating facilities on site that utilize the ore body (Utica 1, Utica 2 and Utica 3).
The facility’s total site capacity is approximately 3.4 million tons per year and the average utilization rate over the past three years was 74%. The total net book value of the Utica facility’s real property, fixed assets, and right-of-use assets was $39.2 million at December 31, 2019. Utica derives its silica sand ore from the St. Peter Sandstone. The silica sand product contains a minimum silica content of 99% and meets API standards for proppant applications.
Wedron, Illinois. Our Wedron, Illinois facility is located in Wedron, LaSalle County, Illinois and consists of owned real property. The facility, which is approximately 6 miles northeast of Ottawa, Illinois, is accessible via County Highway 21 off of State Highway 71 and State Highway 23. The site utilizes natural gas and electricity to process sand. Mining methods include mechanical removal of glacial overburden followed by drilling, blasting, and hydraulic mining. Hydraulically mined sand is pumped to the wash plant to be hydraulically sized and sent to the dry plant where it is dried and screened.
Our Wedron facility and its predecessors have operated since 1890. The washing and drying operations at our Wedron facility were upgraded in 2012, 2013, 2014, 2015 and 2016 in conjunction with significant capacity and reserve base increases. Significant railyard
52
expansions in 2014 and 2015 facilitated greater flexibility and provided for unit train capabilities. Processed sand is shipped from the facility via truck or rail on the BNSF and CSX Railroads via the Illinois Railnet. Our Wedron facility utilizes approximately 50,000 linear feet of rail. A portion of the sand is transferred by conveyor or trucked from our Wedron facility and is coated at our Technisand Wedron and/or Troy Grove, Illinois resin-coating facilities. Annual capacity is approximately 9.0 million tons and the average utilization rate over the past three years was 72%. The total net book value of the Wedron facility’s real property, fixed assets, and right-of-use assets was $166.2 million at December 31, 2019.
The sand reserve mined from the open-pit mine at the Wedron facility is the St. Peter Sandstone formation. The Wedron facility produces high purity, round grain silica sand that meets the API requirements for proppant application. The Wedron facility production capacity is approximately 9.0 million tons per year. The surface deposit at the Wedron facility is a high purity, round grain sand with a minimum silica content of 99%, which meets API requirements for proppant application. The controlling attributes are iron and grain size. Iron is concentrated near the surface, where orange iron staining is evident and also increases where the bottom contact becomes concentrated in iron pyrite. Maximum average full face iron content is 0.020%. The deposit tends to exhibit a coarser grain size distribution in the top half of the deposit.
Processing Facilities
Apodaca, Nuevo Leon, Mexico. We acquired our Apodaca facility, then known as Molinos del Norte, from Quinsa Company in 2002. The facility is in Apodaca County, Apodaca, Nuevo Leon and consists of owned real property. The facility is 12 miles from Monterrey and is accessible via the Apodaca-Huinala road. The main process at the facility is grinding and it utilizes electricity. Annual capacity of the Apodaca facility is approximately 115,700 short tons and the average utilization rate over the past three years was 36%. The total net book value of the Apodaca facility’s real property, fixed assets, and right-of-use assets was $4.2 million at December 31, 2019.
The main product produced at the Apodaca facility is calcium carbonate which is ground from 45 to less than 5 microns. Calcium carbonate is used as a functional filler in the ceramics as well as the coatings and polymers industries. Materials needed for processing (white marble, talc and barite) are externally sourced and transported in via bulk truck and rail. The products produced at the Apodaca facility are shipped via bulk truck or in 50-pound paper bags by truck.
Benito Juarez, Nuevo Leon, Mexico. Greenfield construction of our Benito Juarez facility was completed in 2001. This facility is in Benito Juarez County, Nuevo Leon and consists of owned real property. The facility is located 17.5 miles east of Monterrey and is accessed via Monterrey-Reynosa highway 40. The facility uses electricity to process its material and has an annual capacity of approximately 138,900 short tons. The average utilization rate over the past three years was 87%. The total net book value of the Benito Juarez facility’s real property, fixed assets, and right-of-use assets was $1.5 million at December 31, 2019.
The Benito Juarez facility produces sodium feldspar, which is supplied to ceramics, sanitary-ware and tiles manufacturers who are in the same industrial area as the facility. Feldspar for the facility is supplied from the Ahuazotepec facility via truck. The Benito Juarez facility produces ground products with particle sizes less than 75 microns and they are shipped via bulk trucks over short distances to end users.
Hamilton, Ontario, Canada. We acquired our Lakeshore facility in 2000. It has been in operation since 1963. It is located in Hamilton, Ontario and is accessible via the QEW highway and consists of leased real property, fixed assets, and right-of-use assets. The facility processes lake sand GFN 50-80 (dried) and silica sand (damp) and serves the foundry, sports and recreation, building products, and glass industries. Lake sand is received from a supplier via vessel and product is dried, screen, and stored in silos. Products can be shipped to customers via bulk truck or bulk bag methods. Annual capacity of Lakeshore is approximately 336,000 tons and the average utilization rate over the past three years was 39%]. The total net book value of the Lakeshore facility’s real property, fixed assets, and right-of-use assets was $0.8 million at December 31, 2019.
Lampazos, Nuevo Leon, Mexico. We acquired our Lampazos facility from Mexican glass producer Vitro in 1997, but the facility has been operating since 1970. The facility is in Lampazos County, Nuevo Leon and consists of owned real property. The facility is located 98 miles north of Monterrey and is accessed via Interstate NL1 road. The Lampazos facility utilizes heavy fuel oil and electricity to process its material. The processes at the facility are leaching, drying, magnetic separation and grinding. The annual capacity is approximately 441,600 short tons and the average utilization rate over the past three years was 77%. The total net book value of the Lampazos facility’s real property, fixed assets, and right-of-use assets was $10.0 million at December 31, 2019.
53
The Lampazos facility produces silica sands for tableware glass, ceramics and, to a lesser extent, foundry markets. The facility’s supply comes from the Canoitas facility, where it is transported as wet sand. The Lampazos facility mainly produces silica sand with low iron oxide content for the tableware glass market. It also generates ground products from 75 to 45 microns for ceramics industry manufacturers mainly located in the city of Monterrey. Finished material is shipped either in bulk or large bags via truck.
San Jose, Guanajuato, Mexico. We acquired our San Jose facility from Vitro in 1997. It has been in operation for more than 40 years. The facility is located in San Jose Iturbide County, Guanajuato and consists of owned real property. It is located 35 miles north of Queretaro and is accessed via Highway 57 Queretaro-San Luis Potosi. The San Jose facility generates two main products: silica sand and potassium feldspar. The facility utilizes electricity to process its material. The current primary process at the San Jose facility is grinding and its annual production capacity is approximately 100,000 tons. The average utilization rate over the past three years was 15%. The total net book value of the San Jose facility’s real property, fixed assets, and right-of-use assets was $0.1 million at December 31, 2019.
Ground silica sand and feldspar produced at the San Jose facility are supplied mainly to the electric ceramics industry. The potassium feldspar is supplied by a third party and silica sand as raw material is supplied by the Jaltipan facility. The products produced at the San Jose facility are shipped via bulk truck.
Tamms, Illinois. We acquired the Tamms facility from Tammsco, Inc. in 1986. This facility has been in operation since the early 1900’s and consists of owned real property located in Tamms, Alexander County, Illinois, just off State Highway 127, 20 miles north of Cairo, Illinois, the southernmost tip of the state. The site is currently a nepheline syenite milling/sizing operation utilizing electricity with an annual capacity of approximately 28,000 tons. The average utilization rate over the past three years was 87%. The total net book value of the Tamms facility’s real property, fixed assets, and right-of-use assets was $1.0 million at December 31, 2019.
We supply products produced at the Tamms facility to the coatings and polymer industries. The site receives partially processed nepheline syenite feedstock from the Nephton facility and subsequently processes the material to produce several grades of finished products, primarily less than 15 microns in size. The products are then bagged and shipped on van or container trucks.
Tlaxcala, Tlaxcala, Mexico. We completed greenfield construction of its Tlaxcala milling facility in 2010. This facility is in Tetla County, Tlaxcala and consists of owned real property. It is located 25 miles northeast of the city of Tlaxcala and is accessed via the road 119 Apizaco-Ciudad de Mexico. The facility utilizes electricity to produce ground products of silica sand. The annual capacity is approximately 105,000 tons and the average utilization rate over the past three years was 92%. The total net book value of the Tlaxcala facility’s real property, fixed assets, and right-of-use assets was $1.5 million at December 31, 2019.
The Tlaxcala facility produces ground silica for the fiberglass industry. The silica sand is supplied from the Jaltipan facility. The Tlaxcala facility generates ground products with particle sizes from 75 to 45 microns and its processed material is shipped via bulk truck.
Troy Grove, Illinois. We acquired its Troy Grove facility from Martin Marietta in 1983. It has been in operation since 1960. The facility is located in Troy Grove, La Salle County, Illinois and consists of approximately 60 acres of owned real property. It is approximately 20 miles from Ottawa and is accessible via U.S. Interstate Highway 52. The facility uses electricity to process its material and has an annual capacity of approximately 39,000 tons. The average utilization rate over the past three years was 64%. The total net book value of the Troy Grove facility’s real property, fixed assets, and right-of-use assets was $0.9 million at December 31, 2019.
The Troy Grove facility supplies nepheline syenite to the coatings and polymers industries. The facility receives its feed stock from the Nephton facility. The facility then grinds and classifies the material into bins for sale via bulk truck or rail.
Inactive Facilities
Bay City, Wisconsin. Our Bay City, Wisconsin facility is located in Isabelle and Hartland Township, Pierce County, Wisconsin and consists of owned and leased real property. The mineral reserves at the Bay City facility are secured under mineral leases that, with the exercise of renewal terms, expire between 2045 and 2106. The Bay City facility was opened in 1919 and operated continuously until 1989. We acquired the mine through the acquisition of Wisconsin Specialty Sand and constructed the associated Hager City processing (drying) plant in 2007. This underground mine is approximately 1.5 miles northeast of Bay City on State Highway 35. The reserves are located at a depth of 230 feet. The mine utilizes electricity to process sand. Mining methods include drilling and
54
blasting. As a result of the challenging conditions in the global oil and gas markets, these operations were idled in 2015. Although the processing facility was idled, the railyard remains active and provides unit train capabilities for the Maiden Rock facility.
Mined sand is shipped approximately five miles to the Hager City plant for further processing and eventual shipment via truck or rail on the BNSF Railroad. The Hager City plant, constructed by Wisconsin Industrial Sand Company, LLC in 2007, was expanded in 2013 and 2014 with the addition of a new rail yard containing approximately 19,000 linear feet of rail for assembling unit trains.
The sand reserve mined from the underground mine at the Bay City facility is the Jordan Sandstone. The Bay City facility produces high purity, round grain silica that meets API requirements for proppant application. The mining capacity is approximately 780,000 tons per year. The facility has been idled since 2015. The railyard remains active. The total net book value of the Bay City facility’s real property, fixed assets, and right-of-use assets was $2.5 million at December 31, 2019. The underground deposit at the Bay City facility is a high purity, round grain sand with a minimum silica content of 99% which meets API requirements for proppant application. The controlling attributes are turbidity, acid solubility, and grain size. The deposit tends to exhibit a coarser grain size distribution near the top of the deposit. Grain size distributions are maintained through control of mine horizon. Turbidity and acid solubility are controlled though the use of hydrosizers during wet processing.
Brewer, Missouri. Our Brewer, Missouri mine is located in Brewer, Perry County, Missouri and consists of owned real property. The facility, approximately one-half mile northwest of Brewer, Missouri, is accessible via State Highway M. We acquired the inactive mine in 2013. The operation was reactivated and began production in December 2014 but was idled in 2015 due to the challenging conditions in the global oil and gas markets. In January 2017, the decision was made to return Brewer to full production due to an increase in demand for proppants. The mine resumed production in the first quarter of 2017. In September 2018, the decision was made to idle the Brewer site due to reduced customer demand. Mining methods include the mechanical removal of overburden followed by drilling, blasting and mechanical mining.
The sand reserve mined from the open-pit mine at the Brewer facility is the St. Peter Sandstone. The deposit produces high purity, round grain silica that meets API requirements for proppant application. The mining capacity is approximately 1.3 million tons per year and the average utilization rate over the past three years was 29%. The total net book value of the Brewer facility’s real property, fixed assets, and right-of-use assets was $0.5 million at December 31, 2019. The surface deposit at the Brewer facility is a high purity, round grain sand with a minimum silica content of 99% which meets API requirements for proppant application. The controlling attributes are turbidity and grain size. The deposit tends to exhibit a coarser grain size distribution in top half of deposit. Turbidity is controlled through the use of hydrosizers and attrition scrubbers during wet processing.
Grand Haven, Michigan. Our Grand Haven, Michigan facility is located in Grand Haven, Ottawa County, Michigan. The mine and facility consist of owned real property that is subject to a reverter to the prior property owner in 2021. The mine and facility have been closed since 2014. There is no net book value assigned to the Grand Haven facility. The facility, which is approximately two miles south of Grand Haven, Michigan, is accessible via Lakeshore drive and US Highway 31.
The sand resource historically mined from the open-pit mine at the facility is a dune sand deposit. This surface dune deposit is a high purity, sub-round grain sand with minimum silica content of 96% ideal for foundry metal casting applications. The controlling attribute is ADV. The mine’s ADV ranges from 30-50. ADV is controlled through floatation during wet processing. The grain size distribution averages greater than 50% plus 50 mesh.
Kasota, Minnesota. We completed initial greenfield construction of our Kasota site in 1982. The facility is located in Kasota, Le Sueur County, Minnesota, approximately 75 miles southwest of Minneapolis. It consists of approximately 3,700 acres of owned real property and is accessible by using major highways, including U.S. Interstate 35. The site utilizes natural gas and electricity to process sand. The site has grown through two capacity expansions, one in 2009, when 1.2 million tons of capacity per year was added to produce all grades of API grade silica sand proppant, and another in 2014, when 800,000 tons per year were added to produce 40/70 and 100 mesh grade silica sand proppants. Kasota was idled in 2019. Currently, annual capacity of the Kasota facility is approximately 3.0 million tons per year and the average utilization rate over the past three years was 66%. The total net book value of the Kasota facility’s real property, fixed assets, and right-of-use assets was $27.0 million at December 31, 2019. Processed material is shipped via rail using the Union Pacific railroad. The Kasota facility is unit train capable and utilizes approximately 25,000 linear feet of rail.
The sand reserve mined from the open-pit mine is from the Jordan Sandstone. Dolomite cap rock ranging from 0-30 feet in thickness is removed to expose the silica reserves. The open-pit operations require drilling and blasting to fragment the sandstone. The facility
55
is a load and carry operation with wheel loaders feeding conveyors to the in-pit crushing system. The mining operations occur on a year-round basis. The silica sand is processed via multiple steps of crushing and then is wet sized, dried, and screened.
The silica sand product contains a minimum silica content of 99% and meets API standards for proppant applications. The sandstone section is mined in two benches to optimize production of frac sand products. The upper bench ore is medium to coarse grained and the underlying bench is largely fine to medium grained. Mine production has been augmented with the extraction of medium to fine grained sand previously disposed of in the facility’s tailings cells
Maiden Rock, Wisconsin. Our Maiden Rock, Wisconsin facility is located in Maiden Rock, Pierce County, Wisconsin and consists of owned and leased real property. The mineral reserves at the Maiden Rock facility are secured under mineral leases that, with the exercise of renewal options, expire between 2021 and 2046. The facility is within the Village and Township of Maiden Rock along State Highway 35. The Maiden Rock facility utilizes natural gas and electricity to process sand. Maiden Rock produces from an underground mine utilizing a “room-and-pillar” mining method which includes horizontal drilling and blasting. The reserves are located at a maximum depth of 230 feet. After blasting, the sand is removed from the face of the tunnels with a front-end-loader and deposited into a hopper where it is combined with water to form a slurry. The slurry is pumped to the surface wash plant to be hydraulically sized and sent to the plant where it is dried and screened.
The Maiden Rock facility and its predecessors have operated since the 1920s. We acquired a 50% equity interest in the facility from Wisconsin Industrial Sand in 1997 and acquired the remaining equity interest in 1999. The washing and drying operations at the Maiden Rock facility were upgraded in 2012 in conjunction with a significant capacity increase. Processed sand is shipped from the Maiden Rock facility via truck or rail on the Burlington Northern Santa Fe (“BNSF”) Railway. The Maiden Rock facility has a rail loadout facility that has approximately 5,000 linear feet of rail. This plant is unit train capable utilizing the new unit train railyard, approximately 16,000 linear feet at the Hager City facility.
The sand reserve mined from the underground mine at the Maiden Rock facility is the Jordan Sandstone. The Maiden Rock facility produces high purity, round grain silica that meets API requirements for proppant application. The mining capacity is approximately 1.3 million tons per year and the average utilization rate over the past three years was 34%. The total net book value of the Maiden Rock facility’s real property, fixed assets, and right-of-use assets was $2.1 million at December 31, 2019. The sandstone deposit at this facility is a high purity, round grain sand with a minimum silica content of 99%, which meets API requirements for proppant application. The controlling attributes are turbidity, acid solubility, and grain size. The deposit tends to exhibit a coarser grain size distribution near the top of the deposit. Grain size distribution is maintained through control of mine horizon. Turbidity and acid solubility are controlled though the use of hydrosizers during wet processing. The Maiden Rock facility was idled in 2019.
Shakopee, Minnesota. Our Shakopee, Minnesota facility is located in Shakopee, Scott County, Minnesota and consists of owned and leased real property. The mineral reserves at our mine are secured by fee ownership and a lease agreement that, with the exercise of renewal options, expires in 2030. The facility is approximately four miles south of Shakopee, Minnesota and is accessible via US Highway 169. The Shakopee facility utilizes natural gas and electricity to process sand. Mining methods include the mechanical removal of glacial overburden followed by drilling, blasting, and mechanical mining.
Mining occurred at the Shakopee facility for a short time in the 1980s by others until the property was reclaimed. The mine was permitted by Great Plains Sand in 2012 and acquired by us in 2013, at which time we changed the name to Shakopee Sand LLC. The washing and drying operations were upgraded at the facility following the acquisition. Processed sand is shipped from the Shakopee facility via truck or by rail on the UP. As a result of reduced customer demand, the facility was idled in 2018 after being re-opened in 2017. Annual capacity is approximately 718,000 tons and the average utilization rate over the past three years was 14%. The total net book value of the Shakopee facility’s real property, fixed assets, and right-of-use assets was $5.5 million at December 31, 2019.
The sand reserve mined from the open-pit mine at the Shakopee facility is derived from the Jordan Sandstone. The ore deposit is a high purity, round grain sand with a minimum silica content of 99%, which meets API requirements for proppant applications. The controlling attributes are turbidity and grain size. The deposit tends to exhibit a coarser grain size distribution in the top half of deposit. Turbidity is controlled through the use of hydrosizers and attrition scrubbers (scrubbers idled in 2018) during wet processing.
Voca (East), Texas. We completed greenfield construction of the Voca facility in 1996. The facility is located in Voca, McCulloch County, Texas and consists of owned real property. It is approximately 110 miles west of Austin and is accessible via State Highway 71. The Voca East facility utilizes natural gas and electricity to process. Annual capacity at the Voca (East) facility is approximately 419,000 tons and the average utilization rate over the past three years was 46%. The total net book value of the Voca (East) facility’s real property, fixed assets, and right-of-use assets was $0.8 million at December 31, 2019. The Voca (East) facility was idled in 2018.
56
We use drill and blast processes in an open-pit environment to produce feed for the Voca East facility. Mine operations are year-round. Material is transported to the facility via rigid frame trucks. Material is processed through three stages of crushing for preparation to the hydraulic classification circuits and beneficiation circuits. Product from the wet processing circuits is stockpiled to reduce moisture and then fed to a natural gas fired dryer prior to finished product screening. Products produced from the Voca facility are utilized for frac sand. Product is shipped via bulk truck.
The Voca East facility derives its silica sand ore from the Hickory Sandstone Member of the Riley Formation. The silica sand product contains a minimum silica content of 96% and meets API standards for proppant applications. The sandstone section is mined in multiple benches to support production of frac sand products. The facility’s mine production recently has shifted to focus on the extraction of sand previously disposed of in the facility’s tailings cells. The primary key quality parameter controlling mine sequence development is the percentage of the -30/+140 mesh sand fraction.
Voca (West), Texas. Our Voca West, Texas facility is located in Voca, Mason and McCulloch Counties, Texas and consists of owned real property. The facility, which is approximately 1.5 miles southeast of Voca, is accessible via County Highway 1851, south of State Highway 71. Sand mining and processing operations were developed at the facility during 2008, with the construction of existing plants completed in 2012. We acquired the operations in 2013. The Voca West facility utilizes natural gas with propane back-up and electricity to process sand. Mining methods include the mechanical removal of thin overburden followed by drilling, blasting, and mechanical mining. Annual capacity at the Voca West facility was 1.2 million tons and the average utilization rate over the past three years was 38%. The total net book value of the Voca (West) facility’s real property, fixed assets, and right-of-use assets was $0.8 million at December 31, 2019. The Voca (West) facility was idled in 2018.
The sand reserve mined at our Voca property is the Hickory Sandstone Member of the Riley Formation. The Voca facility produces high purity, round grain silica which meets API requirements for proppant application. The surface deposit at the Voca West facility is a high purity, round grain sand with a minimum silica content of 98% which meets API requirements for proppant application. The controlling attributes are turbidity and grain size. Turbidity is controlled through the use of hydrosizers and attrition scrubbers during wet processing. Grain size is controlled through the use of hydrosizers and wet screening.
Wexford, Michigan. Our Harrietta, Michigan facility is located in Slagle Township, Wexford County, Michigan and consists of owned and leased real property. The facility, which is approximately three miles northeast of Harrietta, Michigan, is accessible via West 28th Road and State Highway 37. The facility utilizes recycled oil and electricity to process sand. Mining methods include mechanical removal of overburden and excavation of sand.
We acquired Wexford Sand from Sargent Sand in 1998. A new screen plant was installed in 2008. The processed sand is shipped from the Harrietta facility by bulk via truck or rail on the Great Lakes Central Railroad. The sand reserve mined from the open-pit mine at the Harrietta facility is a glacial outwash sand deposit for proppant applications. Glacial outwash is glacial sediments deposited by melting glacial ice at the terminus of a glacier. The mining capacity is approximately 625,000 tons per year. The total net book value of the Wexford facility’s real property, fixed assets, and right-of-use assets was $0.6 million at December 31, 2019. This surface deposit at the Harrietta facility is sub-round grain sand with minimum silica content of 96% ideal for foundry applications. The controlling attributes are ADV and grain size distribution.
As a result of challenging conditions in end markets, the Wexford plant was idled from 2014 to 2018. The plant reopened briefly in March 2018 but was idled in September 2018 due to reduced customer demand.
Development Sites
Cawood, Quebec, Canada. Our Cawood nepheline syenite prospect is located approximately 80 kilometers northwest of Ottawa, Ontario in the Cawood Township of southwestern Quebec. The Cawood property consists of 10 mineral claims (5112689 through 5112698). Covia is required to maintain these mineral claims by completing geologic work, or paying in lieu of geologic work, every two years. In 2018, geologic work was completed (diamond core drilling) that will maintain these mineral claims to approximately 2027, contingent upon Quebec Ministry review and approval.
The region lies within the Proterozoic Grenville Province of the Central Meta-Sedimentary Belt. The rock is characterized by upper amphibolite-granulite facies metamorphism and includes Grenvillian paragneiss, marble and orthogneiss with intrusions of late Proterozoic plutons and Phanerozoic easterly trending diabase dikes. The Cawood complex was identified as the only principal pluton within the property area by regional mapping and is bounded within our mineral claim block. The area has been geologically mapped. Qualitative evaluation has been completed through bulk sampling and diamond core drilling. Diamond core drilling was completed by us in 2001, 2015 and 2018.
57
The nepheline syenite is typically white to grey, medium grained and containing hornblende, biotite, magnetite and aegirine as mafic minerals. Grain size varies from fine to very coarse with the core of the complex having pegmatitic bands. Nepheline content varies from 10 to 25%.
There was no net book value assigned to the Cawood location’s real property, fixed assets, and right-of-use assets at December 31, 2019.
Dungannon, Ontario, Canada. The Dungannon nepheline syenite prospect is located approximately 2 kilometers east of Bancroft, Ontario within the Dungannon Township of southern Ontario. The Dungannon prospect consists of a total of 13 Patent Lands and one License of Occupation, for a total of 293.2 ha. The area lies within the Central Metasedimentary Belt of the Grenville Province. The majority of these lands are underlain by nepheline syenite gneiss and/or nepheline-feldspar pegmatites.
An economic evaluation was completed for Lots 25 through 29 of Concession 13 Dungannon Township (covered by Patents 9918, 9936 through 9939). No resource evaluations are available for the Morrison (Patents 9934 & 9935) or the Davis Quarry (Patents 9919 & 9920), nor the lands covered by Patents 9915 through 9917 and 9940 and License of Occupation 13624. The area has been geologically mapped. Qualitative evaluation has been completed though bulk sampling. Historic development of the Morrison and Davis quarries occurred in the late 1930’s and 1940’s for the feldspar market.
There was no net book value assigned to the Dungannon location’s real property, fixed assets, and right-of-use assets at December 31, 2019
Katemcy, Texas. Our Katemcy, Texas resources are located in Katemcy, Mason County, Texas and consist of owned real property. The mine property was purchased in September 2013 and is accessed via County Road 1222 and State Highway 87. The prospective mining area has not been developed and the property is currently used as agricultural land.
The sandstone resource at this proposed open-pit mine is derived from the Hickory Sandstone Member of the Riley Formation. This deposit is capable of producing high purity, round grain silica sand with a minimum silica content of 98% which meets API requirements for proppant applications. The controlling key quality attributes will be grain size and turbidity.
The total net book value of the Katemcy location’s real property, fixed assets, and right-of-use assets is included in the net book value of the Voca (West) facility.
Wedeen River, British Columbia, Canada. Our Wedeen River property is a magnetite prospect in British Columbia, Canada, approximately 8 miles north of the coastal town of Kitimat. The prospect is comprised of four Crown Granted mineral claims (Mineral Hill #1, #2, #3 and Summit). We acquired these properties during Unimin’s Indusmin acquisition. Several surrounding previously held mineral claims have been allowed to lapse due to the magnetite deposit being shown to lie wholly within our Crown Granted mineral claims. Geologic mapping and diamond core drilling (occurring between 1958-1962) has identified the deposit as an iron skarn deposit with high grade magnetite lenses (40-60% Fe) separated by low grade disseminated magnetite zones (5-15% Fe). In 1994, a resource estimate reported “almost 6 million net tons grading to 22.009% acid soluble Fe”, equivalent to 1.3 million tons of iron.
There was no net book value assigned to the Wedeen River location’s real property, fixed assets, and right-of-use assets at December 31, 2019.
Torreon, Coahuila, Mexico. Our Terrazo, and La Chiche properties are marble deposits, approximately 33 miles northwestern of Torreon, Coahuila Mexico. Terrazo is accessed via State Highway 40 Torreon-Cuencame, while La Chiche can be accessed via State Highway 49 Torreon-Jimenez. These properties were acquired as calcium carbonate mineral resources for our Apodaca facility. This commodity is used as a functional filler in the ceramics as well as the coatings and polymers industries. The mineral deposits are in Cretaceous limestone from de Aurora Formation located in skarn zone around the quartz monzonite igneous intrusion. Geologic mapping and diamond core drilling (occurring between 2007-2010) has identified the marble deposits. The resources of calcium carbonate in the Terrazo property are 1,201,000 net metric tons, while resources of calcium carbonate in La Chiche property are 5,776,000 net metric tons. There was no net book value assigned to the Torreon location’s real property, fixed assets, and right-of-use assets at December 31, 2019.
58
The mineral resource is a high concentration, marble product material. This mineral resource should define the reserves with a minimum calcium carbonate content of 98.5%, and a minimum LCIELAB value of 96.0 which meets specification requirements for filler and coating application.
The following map reflects the location of our mining, processing and development facilities in North America as of December 31, 2019, as well as the segment in which they serve. If a facility serves both the Industrial and Energy segments, we refer to them as Hybrid facilities:
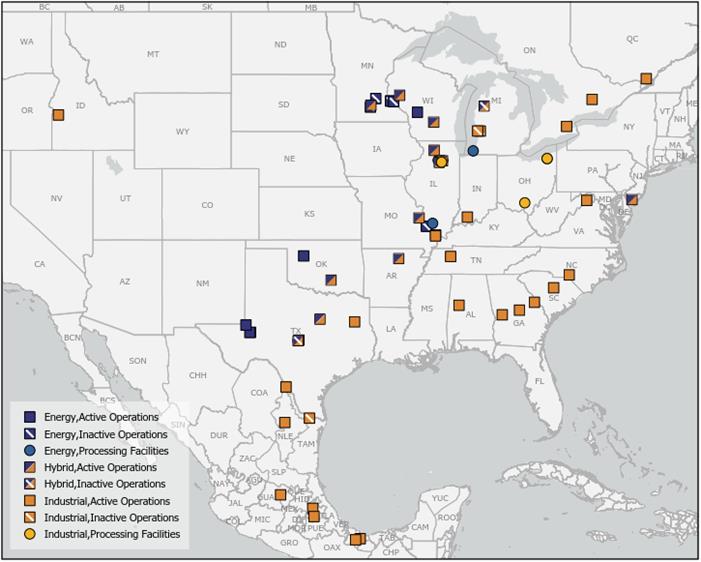
The following table reflects the segment(s) served by various locations:
| | Segment | | |
Location | | Energy | | Industrial | | Administrative |
Ahuazotepec, Puebla, Mexico | | — | | ✓ | | — |
Apodaca, Nuevo Leon, Mexico | | — | | ✓ | | — |
Bay City, WI | | ✓ | | — | | — |
Beaver, OH | | — | | ✓ | | — |
Benito Juarez, Nuevo Leon, Mexico | | — | | ✓ | | — |
Benton Harbor, MI | | — | | — | | ✓ |
Brewer, MO | | ✓ | | — | | — |
Bridgeton, NJ | | — | | — | | ✓ |
Camden, TN | | — | | ✓ | | — |
Canoitas, Coahuila, Mexico | | — | | ✓ | | — |
59
Chardon, OH | | — | | ✓ | | — |
Cleburne, TX | | ✓ | | ✓ | | — |
Cornelius, NC | | — | | — | | ✓ |
Crane, TX | | ✓ | | — | | — |
Cutler, IL | | ✓ | | — | | — |
Dividing Creek, NJ | | ✓ | | ✓ | | — |
Elco, IL | | — | | ✓ | | — |
Emmett, ID | | — | | ✓ | | — |
Fresno, TX | | — | | ✓ | | — |
Gore, VA | | — | | ✓ | | ✓ |
Grand Haven, MI | | — | | ✓ | | — |
Green Mountain, NC | | — | | ✓ | | — |
Guion, AR | | ✓ | | ✓ | | — |
Hephzibah, GA | | — | | ✓ | | — |
Huntersville, NC | | — | | — | | ✓ |
Huntingburg, IN | | — | | ✓ | | — |
Independence, OH | | — | | — | | ✓ |
Jaltipan, Veracruz, Mexico | | — | | ✓ | | — |
Junction City, GA | | — | | ✓ | | — |
Kasota, MN | | ✓ | | — | | — |
Kermit, TX | | ✓ | | — | | — |
Lakeshore Sand, Hamilton, ON, Canada | | — | | ✓ | | — |
Lampazos, Nuevo Leon, Mexico | | — | | ✓ | | — |
Lugoff, SC | | — | | ✓ | | — |
Magdalena de Kino, Sonora, Mexico | | — | | — | | ✓ |
Maiden Rock, WI | | ✓ | | — | | — |
Mankato, MN | | — | | — | | ✓ |
Marston, NC | | — | | ✓ | | — |
McIntyre, GA | | — | | ✓ | | — |
Menomonie, WI | | ✓ | | ✓ | | — |
Monterrey, Nuevo Leon, Mexico | | — | | — | | ✓ |
Nephton, Ontario, Canada | | — | | ✓ | | — |
New Canaan, CT | | — | | — | | ✓ |
Oregon, IL | | ✓ | | ✓ | | — |
Ottawa, IL | | — | | — | | ✓ |
Ottawa, MN | | ✓ | | ✓ | | — |
Peterborough, Ontario, Canada | | — | | — | | ✓ |
Pevely, MI | | ✓ | | ✓ | | — |
Portage, WI | | ✓ | | ✓ | | — |
Roff, OK | | ✓ | | ✓ | | — |
Saint Canut, Quebec, Canada | | — | | ✓ | | — |
San Jose, Guanajuato, Mexico | | — | | ✓ | | — |
San Juan, Veracruz, Mexico | | — | | ✓ | | — |
Seiling, OK | | ✓ | | — | | — |
Serena, IL | | — | | ✓ | | — |
Shakopee, MN | | ✓ | | — | | — |
Sibley, LA | | ✓ | | — | | — |
Sugar Land, TX | | — | | — | | ✓ |
Tamms, IL | | — | | ✓ | | — |
The Woodlands, TX | | — | | — | | ✓ |
Tlaxcala, Tlaxcala, Mexico | | — | | ✓ | | — |
Toronto, Ontario, Canada | | — | | — | | ✓ |
Troup, TX | | — | | ✓ | | — |
Troy Grove, IL | | ✓ | | — | | — |
Tunnel City, WI | | ✓ | | — | | — |
Tuscaloosa, AL | | — | | ✓ | | — |
Utica, IL | | ✓ | | ✓ | | — |
Voca, TX | | ✓ | | ✓ | | — |
Wedron, IL | | ✓ | | ✓ | | — |
Winchester, VA | | — | | — | | ✓ |
Product Delivery
We have established an oil and gas logistics network that we believe is highly responsive to our customers’ needs and includes distribution terminals in all major oil and gas basins, as well as selected locations to serve Industrial customers. These terminals are a combination of facilities that we own or lease, as well as properties that are owned and operated by third parties. They generally consist of rail and transload operations, plus in some cases additional storage and handling facilities.
ITEM 3. LEGAL PROCEEDINGS
Product Liability Matters
We and/or our predecessors have been named as a defendant, usually among many defendants, in numerous product liability lawsuits brought by or on behalf of current or former employees of our customers seeking monetary relief, alleging damages caused by silica
60
exposure. As of December 31, 2019, we were subject to approximately 40 active silica exposure cases. Many of the claims pending against us arise out of the alleged use of our silica products in foundries or as an abrasive blast media and have been filed in various jurisdictions over the years. In accordance with the terms of our insurance coverage, these claims are being defended by our subsidiaries’ insurance carriers, subject to our payment of a percentage of the defense costs. Based on information currently available, management cannot reasonably estimate a loss at this time. Although the outcomes of these lawsuits cannot be predicted with certainty, management does not believe that the pending lawsuits, individually or in the aggregate, are reasonably likely to have a material adverse effect on our financial position, results of operations or cash flows.
Other Matters
We are involved in other legal actions and claims arising in the ordinary course of business. We currently believe that each such action and claim will be resolved without a material adverse effect on our financial condition, results of operations, or liquidity. However, litigation involves an element of uncertainty and future developments could cause these actions or claims to have a material adverse effect on our financial condition, results of operations, and liquidity.
ITEM 4. MINE SAFETY DISCLOSURES
Our safety program establishes a system for promoting a safety culture that encourages incident prevention and continually strives to improve our safety and health performance. Our safety program includes as its domain all established safety and health specific programs and initiatives for our material compliance with all local, state and federal legislation, standards, and regulations as they apply to a safe and healthy employee, stakeholder, and work environment.
Our safety program has the ultimate goal of the identification, elimination or control of all risks to personnel, stakeholders, and facilities, that can be controlled and directly managed, and those it does not control or directly manage, but can expect to have an influence upon.
The operation of our U.S.-based mines is subject to regulation by MSHA under the Mine Act. MSHA inspects our mines on a regular basis and issues various citations and orders when it believes a violation has occurred under the Mine Act. Following passage of The Mine Improvement and New Emergency Response Act of 2006, MSHA significantly increased the numbers of citations and orders charged against mining operations. The dollar penalties assessed for citations issued has also increased in recent years.
We are required to report certain mine safety violations or other regulatory matters required by Section 1503(a) of the Dodd-Frank Wall Street Reform and Consumer Protection Act and Item 104 of Regulation S-K, and that required information is included in Exhibit 95.1 to this Report and is incorporated by reference.
PART II
ITEM 5. MARKET FOR REGISTRANT’S COMMON EQUITY, RELATED STOCKHOLDER MATTERS, AND ISSUER PURCHASES OF EQUITY SECURITIES
Market Information
Shares of our common stock, traded under the symbol “CVIA,” have been publicly traded since June 1, 2018, when our common stock was listed and began trading on the NYSE. Prior to that date, there was no public market for our common stock.
Holders of Record
On March 9, 2020, there were 132,023,251 shares of our common stock outstanding, which were held by 8,472 stockholders of record. Because many of our shares of common stock are held by brokers and other institutions on behalf of stockholders, we are unable to estimate the total number of stockholders represented by these record holders.
Comparative Stock Performance Graph
The graph below compares the cumulative total shareholder return on our common stock, the cumulative total return on the Russell 3000 Index, the Standard and Poor's Small Cap 600 GICS Oil & Gas Equipment & Services Sub-Industry index, and a composite
61
average of publicly traded proppant peer companies (U.S. Silica Holdings, Inc., Hi-Crush Inc., and Smart Sand Inc.) since June 1, 2018, the first day our stock traded on the NYSE.
The graph assumes $100 was invested on June 1, 2018, the first day our stock was traded on the NYSE, in our common stock, the Russell 3000, the Standard and Poor's Small Cap 600 GICS Oil & Gas Equipment & Services Sub-Industry Index, and a composite of publicly-traded proppant peer companies. The cumulative total return assumes the reinvestment of all dividends. We have included a composite of our proppant peers as their share performance tends to be more closely correlated with ours than our industrial peers at this time.
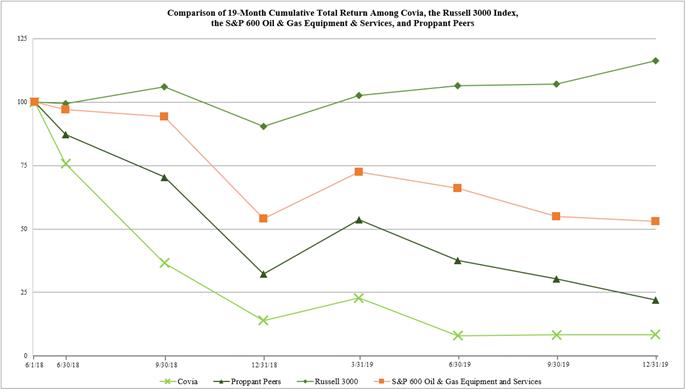
| | TOTAL RETURN | |
| | | | | | S&P Oil & Gas | | | | | | | Covia Holdings | |
| | Russell 3000 | | | Equipment & Services | | | Proppant Peers | | | Corporation | |
June 1, 2018 | | | 100.00 | | | | 100.00 | | | | 100.00 | | | | 100.00 | |
June 30, 2018 | | | 99.48 | | | | 97.03 | | | | 87.14 | | | | 75.76 | |
September 30, 2018 | | | 106.09 | | | | 94.38 | | | | 70.43 | | | | 36.61 | |
December 31, 2018 | | | 90.46 | | | | 54.16 | | | | 32.17 | | | | 13.96 | |
March 30, 2019 | | | 102.66 | | | | 72.50 | | | | 53.63 | | | | 22.82 | |
June 30, 2019 | | | 106.36 | | | | 66.11 | | | | 37.69 | | | | 8.00 | |
September 30, 2019 | | | 107.08 | | | | 54.89 | | | | 30.29 | | | | 8.24 | |
December 31, 2019 | | | 116.27 | | | | 52.94 | | | | 22.02 | | | | 8.33 | |
ITEM 6. SELECTED FINANCIAL DATA
The following table presents our consolidated statement of operations and certain operating data. The results of operations by segment are discussed in further detail following the consolidated overview.
62
| | Year Ended December 31, | |
| | 2019 | | | 2018 | | | 2017 | | | 2016 | | | 2015 | |
| | (in thousands) | |
Statement of Income Data: | | | | | | | | | | | | | | | | | | | | |
Revenues | | $ | 1,595,446 | | | $ | 1,842,937 | | | $ | 1,295,112 | | | $ | 982,696 | | | $ | 1,371,678 | |
Operating income (loss) from continuing operations | | | (1,432,642 | ) | | | (163,841 | ) | | | 162,704 | | | | 24,457 | | | | (90,289 | ) |
Income (loss) from continuing operations before provision (benefit) for income taxes | | | (1,534,113 | ) | | | (278,995 | ) | | | 122,062 | | | | (31,102 | ) | | | (121,506 | ) |
Net income (loss) from continuing operations | | | (1,289,979 | ) | | | (282,982 | ) | | | 130,887 | | | | (5,770 | ) | | | (83,350 | ) |
Income from discontinued operations, net of tax | | | - | | | | 12,587 | | | | 23,284 | | | | 9,435 | | | | 10,992 | |
Net income (loss) attributable to Covia Holdings Corporation | | $ | (1,290,102 | ) | | $ | (270,498 | ) | | $ | 154,171 | | | $ | 3,665 | | | $ | (72,358 | ) |
Continuing operations earnings (loss) per share | | | | | | | | | | | | | | | | | | | | |
Basic | | $ | (9.81 | ) | | $ | (2.26 | ) | | $ | 1.09 | | | $ | (0.05 | ) | | $ | (0.97 | ) |
Diluted | | | (9.81 | ) | | | (2.26 | ) | | | 1.09 | | | | (0.05 | ) | | | (0.97 | ) |
Earnings (loss) per share | | | | | | | | | | | | | | | | | | | | |
Basic | | | (9.81 | ) | | | (2.16 | ) | | | 1.29 | | | | 0.03 | | | | (0.58 | ) |
Diluted | | | (9.81 | ) | | | (2.16 | ) | | | 1.29 | | | | 0.03 | | | | (0.58 | ) |
Cash dividends declared per share | | $ | - | | | $ | - | | | $ | - | | | $ | 0.42 | | | $ | - | |
| | | | | | | | | | | | | | | | | | | | |
Operating Data: | | | | | | | | | | | | | | | | | | | | |
Total tons sold | | | 30,486 | | | | 29,581 | | | | 23,286 | | | | 18,923 | | | | 19,249 | |
Average selling price per ton | | $ | 52.33 | | | $ | 62.30 | | | $ | 55.62 | | | $ | 51.93 | | | $ | 71.26 | |
| | | | | | | | | | | | | | | | | | | | |
Balance Sheet Data (at period end): | | | | | | | | | | | | | | | | | | | | |
Cash and cash equivalents | | $ | 319,484 | | | $ | 134,130 | | | $ | 308,059 | | | $ | 183,361 | | | $ | 359,478 | |
Total assets | | | 2,446,518 | | | | 3,756,117 | | | | 2,040,098 | | | | 1,839,099 | | | | 2,247,580 | |
Long-term debt (including current portion) | | | 1,557,706 | | | | 1,628,369 | | | | 417,012 | | | | 367,436 | | | | 637,616 | |
Total liabilities | | | 2,269,354 | | | | 2,301,164 | | | | 814,783 | | | | 768,681 | | | | 1,142,596 | |
Total equity | | $ | 177,164 | | | $ | 1,454,953 | | | $ | 1,225,315 | | | $ | 1,070,418 | | | $ | 1,104,984 | |
63
ITEM 7. MANAGEMENT’S DISCUSSION AND ANALYSIS OF FINANCIAL CONDITION AND RESULTS OF OPERATIONS
The following management’s discussion and analysis of financial condition and results of operations (“MD&A”) should be read together with the section entitled “Business” and our consolidated financial statements and related notes thereto and other financial information appearing elsewhere in this Report. The following discussion contains forward-looking statements that involve risks, uncertainties and assumptions. See the section entitled “Cautionary Statement Regarding Forward-Looking Statements” beginning on page 3 of this Report. Our actual results could differ materially from those contained in forward-looking statements as a result of many factors, including those discussed in “Item 1A—Risk Factors” in Part I of this Report. The following discussion contains certain non-GAAP (defined herein) financial measures, including EBITDA and Adjusted EBITDA (defined herein). See “—Key Metrics Used to Evaluate Covia’s Business” for a reconciliation of net income (loss) to EBITDA and Adjusted EBITDA.
Overview
We are an application-focused minerals company providing materials solutions to customers drawing from a diversified product portfolio. We produce a wide range of specialized silica sand, feldspar, nepheline syenite, calcium carbonate, clay, and kaolin products for use in the Industrial and Energy markets in North America and around the world. We have 36 active mining facilities with over 40 million tons of annual processing capacity and significant proven and probable mineral reserves that serve both the Industrial and Energy markets and six active coating facilities with more than two million tons of annual coating capacity. Our mining and coating facilities span North America and also include operations in China and Denmark. We believe our U.S., Mexico, and Canada operations are among the largest, most flexible, and cost-efficient facilities in the industry with close proximity to our customer base.
Our operations are organized into two segments based on the primary end markets we serve – Industrial and Energy. Our Energy segment offers the oil and gas industry a comprehensive portfolio of raw frac sand, value-added proppants, well-cementing additives, gravel-packing media and drilling mud additives that meet or exceed the API standards. Our products serve hydraulic fracturing operations in the U.S., Canada, Argentina, Mexico, China, and northern Europe.
Our Industrial segment provides raw, value-added, and custom-blended products to the glass, construction, ceramics, foundry, coatings, polymers, sports and recreation, filtration and various other industries primarily in North America.
We believe our segments are complementary. Our ability to sell to a wide range of customers across multiple end markets allows us to maximize the recovery of our reserve base within our mining operations and to mitigate the cyclicality of our earnings.
Our Strategy
Our strategy is centered on three objectives – repositioning our Energy segment, growing our Industrial segment’s profitability and strengthening our balance sheet. During 2019, we made significant progress executing on these three areas.
| • | Repositioning our Energy Segment. In response to a customer shift in demand toward in-basin sand, from late 2018 through 2019, we idled approximately 15 million tons of our Northern White or regional sand production capacity. The remaining production capacity of Northern White sand is located at our lower-cost plants. We also commissioned three in-basin sand production plants to meet growing customer demand for this product. |
The market shift in demand toward in-basin sand also resulted in a reduction in demand for the railcars and terminals that are used to transport Northern White sand to an oil and gas basin. This resulted in an industry oversupply of railcars, including within our own fleet. In response, we negotiated with railcar builders to terminate approximately $195 million in future railcar purchase commitments in exchange for immaterial consideration, which included cash and lease modifications to a small portion of the fleet. Additionally, we exited leases from terminals which were no longer necessary to serve customers.
| • | Growing our Industrial Segment’s Profitability. During 2019, we successfully lowered unit production costs in our Industrial segment, which served as a tailwind to Industrial segment profitability. |
We also made capital investments within our Industrial segment to target specific growth opportunities. These investments included expanding our Canoitas, Mexico silica plant and expanding and modernizing our nepheline syenite plant in Nephton, Ontario. The Canoitas expansion was completed in 2019 and is expected to add additional capacity to meet growing customer demand in Mexico. The Nephton expansion and modernization is expected to be completed in 2021 and
64
reduce costs and maintenance capital, as well as add production capacity to meet forecasted growth in demand for nepheline syenite.
| • | Strengthening our Balance Sheet. To improve our liquidity and strengthen our balance sheet, in 2019 we successfully divested several non-core assets, including our Calera, Alabama lime processing facility and Winchester & Western Railroad, which collectively generated over $240 million in proceeds. Additionally, we took advantage of favorable trading conditions to repurchase $63 million of face value of our Term Loan for $48 million. Other actions we took to improve our balance sheet in 2019 included improving working capital by more than $100 million and securing a commitment for a $75 million standby liquidity facility. |
Recent Trends and Outlook
Energy segment market trends:
| • | Volatility of drilling activity. Demand for proppant is primarily determined by the level of drilling and well completions by E&P companies, which depends largely on the current and anticipated profitability of developing oil and natural gas reserves. In 2019, E&P capital spending on drilling and completions activity accelerated in the first half of the year, due in part to higher hydrocarbon prices. Activity declined in the second half of 2019 as many of our customers exhausted their annual budgets and did not want to outspend the cash flow they were generating. In March 2020, OPEC and non-OPEC producers failed to secure an agreement on plans for oil production cuts. This is anticipated to result in increased competition amongst oil producers for gaining market share, increasing the supply of oil. Combined with a decrease in consumer demand for oil due to the coronavirus, the supply of oil could far exceed demand and further reduce the need for drilling activity and E&P capital spending in 2020 and, relatedly, a reduction in demand for proppant. WTI pricing, as of March 11, 2020 was approximately $33 per barrel. The full impact of these dynamics are not yet known. |
| • | Shifts in drilling activity affect the mix of proppants customers require. Well design and completion trends in oil and gas impact the demand for and the mix of proppants we sell. In 2013 and 2014, well designs centered on guar and crosslinked gel utilizing coarse grade proppants with high conductivity. E&P companies also used ceramics and/or resin-coated proppants for added strength and flowback control. In 2015 and 2016, lower crude oil prices caused E&P companies to seek to reduce short-term operating costs, including experimenting with slickwater designs utilizing longer laterals and high loading of lower priced, finer grades of proppant. Beginning in 2018, E&P companies began increasing their usage of sand that is mined within the same basin as their well locations (in-basin sand) due to the lower transportation costs associated with this sand, which is almost entirely fine mesh and significant reduce the use of many more expensive value added proppants. This trend accelerated in 2019 as E&P companies increased adoption of in-basin sand and new in-basin mines opened in multiple oil and gas plays. We believe that in-basin sand adoption will continue in 2020, but at a slower pace than 2019. |
| • | Reacting to changing conditions. In response to reduced customer demand, between the third quarter of 2018 and the end of 2019, we idled mining operations at Shakopee, Minnesota; Brewer, Missouri; Wexford, Michigan; Kasota, Minnesota; Maiden Rock, Wisconsin; and resin-coating faciliities atRoff, Oklahoma; Guion, Arkansas; and Cutler, Missouri, adding to the previously idled mining operation at Hager Bay, Wisconsin. While we also idled or reduced capacity at certain of our Northern White facilities and all of our Voca, Texas facilities, we also commissioned two new facilities in the Permian basin in the third quarter 2018 and a facility in Oklahoma in the fourth quarter 2018. Through March 2020, we reduced our Energy segment nameplate annual capacity by 15 million tons through these capacity reduction measures, allowing us to lower fixed plant costs and consolidate volumes into lower cost and logistically-advantaged operations. With the reduced expectation for the future demand of Northern White sand and associated logistical assets, as well as reduced expectations for Mid-Continental in-basin sand, we incurred non-cash impairment charges of $1.4 billion in 2019 and $267.0 million in 2018. |
| • | Volatility in selling prices for proppants. The rapid decline in oil and gas prices that occurred in late 2014 into 2016, and again in 2020, reduced drilling activity and demand for proppants. As a result, the proppant market became oversupplied, which caused selling prices for all proppants to decline throughout the majority of 2016. In 2017 and the first half of 2018, the market experienced a turnaround and proppant pricing increased across all basins as growth outpaced the ability to add idled and new capacity back into the market. In the second half of 2018, decreased completions activity, combined with the opening of several new mines in basins with oil activity, namely the Permian, Eagle Ford and Mid-Continental, resulted in a significant deterioration of proppant pricing in the second half of 2018. In 2019, several new in-basin sand mines opened, while demand plateaued, resulting in a large oversupply of sand. This had a significantly negative impact on proppant |
65
| | pricing. Coupled with the low cost to reactivate idled capacity, we expect this supply imbalance to continue and do not expect significant price improvement for the foreseeable future. |
| • | Demand for in-basin delivery of proppant. A proppant vendor’s logistics capabilities have become an important differentiating factor when competing for business, on both a spot and contract basis. In recent years, many customers have sought to outsource proppant logistics and purchase proppant from a supplier’s own terminal (e.g., in-basin) or local mines, allowing them to focus on their core competencies, minimize inventory costs and maximize flexibility. Our terminal network in all major oil and gas basins differentiates us from competitors but was utilized less in 2019 than in prior years as more customers choose to use in-basin sand, which does not need to be delivered to a terminal. |
| • | In-basin supply. In 2018 and 2019, multiple sand suppliers, including Covia, commissioned new sand mines in the Permian basin and, to a lesser extent, the Eagle Ford, and Mid-Continental basins. In 2020, new in-basin mines are being developed in the Bakken and Rocky Mountain basins. Locating a plant in-basin significantly reduces the logistics costs, and therefore the overall delivered product cost. However, the quality of in-basin proppant differs from Northern White sand in that in-basin proppant generally possesses lower crush strength and less sphericity, which we believe may impact well performance under higher pressure wells. Local proppant products appear, however, to be fit for purpose in certain well applications, and given their lower costs, demand for local proppant products has strengthened considerably. Most local plants were developed to supply local basins in which they are located and lack the logistical infrastructure to economically ship product to other basins. The proliferation of in-basin mines has resulted in significant oversupply across North American and put pressure on pricing of all proppants. In the second half of 2018, we commissioned two plants in the Permian basin and one in the Mid-Continental basin with a total added nameplate capacity of 8 million tons annually. These facilities allow us to offer a low-cost local solution. In the Mid-Continental basin, demand for proppant declined precipitously late in 2019 and into 2020 causing a severe oversupply of in-basin sand. |
| • | Shift toward finer proppant grades. Slickwater frac designs, which are generally less expensive, became the dominant method for fracturing wells beginning in 2016 and continuing into recent periods. These designs rely on a higher percentage of fine grade sands compared to coarse grades. Currently, we estimate the market is over 85% fine grade (40/70 and 100 mesh) compared to roughly 55% fine grade in 2014. The strong demand for finer proppants negatively impacts production costs for facilities that have relatively coarse reserves. |
| • | Reduced consumption of value-added proppants. As E&P companies’ budgets have contracted over the last year, the demand for proppant and the average selling price of proppant both decreased. In efforts to keep well completion costs low, E&P companies significantly reduced their consumption of certain value-added proppants, leading to a decline in the sales of such value-added proppants. In response to this trend, we discontinued sales and marketing efforts related to our Propel SSP® self-suspending proppant due to lack of demand for high-price point value-added proppant. Accordingly, in the third quarter of 2019, we recorded an impairment charge of $7.8 million related to property, plant, and equipment used in the production of our Propel SSP® self-suspending proppant, as well as the associated intangible asset and earn-out contingent consideration liability. The discontinued sale of our Propel SSP® self-suspending proppant is not expected to have a material impact on our financial results in the future. |
| • | E&P direct sales. Throughout 2019, E&P companies sourced an increasing percentage of their proppant directly from proppant suppliers to control cost and have better visibility across the entire supply chain. This trend presents an opportunity to work directly with the end user and provides improved communication between supplier and consumer with respect to job or grade changes and our percentage of sales directly to E&P companies increased in 2019. Concurrently with these direct sales, many E&P companies are looking to the supplier to coordinate the “last mile” of the supply chain, or the moving of product from the in-basin terminal to the well site. In response to this trend, we have entered into agreements with last mile solutions providers that allow us to provide this service to customers who desire it. |
| • | Proppant intensity is expected to stabilize. From 2015 through 2018 the amount of proppant used per well increased as well laterals became longer, frac stages tightened and proppant per lateral foot increased. In 2019, the amount of proppant used per well was similar to 2018 and this trend is expected to continue in 2020. |
66
Industrial segment market trends:
| • | Historically stable demand in Industrial end markets. The primary end markets served by production in our Industrial segment are glass, building products, ceramics, foundry, coatings, polymers and various other industries. The sales in our Industrial segment historically correlate strongly with overall economic activity levels in the U.S. and Mexico as reflected in the gross domestic product, unemployment levels, vehicle production and growth in the housing market. Demand in our Industrial segment’s end markets is historically relatively stable and is primarily influenced by key macroeconomic drivers such as housing starts, light vehicle sales, repair and remodel activity, industrial production as well as consumer trends. To the extent these demand drivers continue on their current trends, we expect that demand for the products of our Industrial segment will remain relatively stable. The effects of the coronavirus on our Industrial segment are not yet known. Overall, we expect Industrial markets to grow at rates similar to GDP growth. To the extent trends deviate from those of 2019 due to the economic uncertainty introduced by the coronavirus pandemic or other U.S. and global market developments, we may see similar deviations in our Industrial segment trends. |
| • | Historically favorable housing, commercial constructions and consumer trends. Certain submarkets and geographies within our Industrial segment historically grow at attractive rates driven by solid housing, commercial construction and various consumer trends that utilize our products. ��These trends are expected to benefit our products serving the building products and coating and polymers end markets. |
| • | Certain U.S. end markets facing pressure. Due to reduced manufacturing activity in the U.S., foundry markets felt pressure in the second half of 2019 and are expected to face continued pressure in 2020. Consumer trends of consuming less U.S.-produced beer caused demand from containerized glass customers in the U.S. to decline in 2019. This trend is expected to continue throughout 2020. |
How We Generate Our Sales
We derive our sales from mining and processing silica sand products and other minerals that customers purchase for use in a wide variety of applications. Covia’s sales are primarily a function of the price per ton paid by the customer and the number of tons sold to the customer. The price invoiced reflects the cost of production, the cost of transportation to our distribution terminals or customer site and the cost of transloading the product from railcars to trucks, as applicable. Generally, logistics costs can comprise up to 70-80% of the delivered cost of products sold by the Energy segment, depending on the basin into which the product is delivered.
We primarily sell products under supply agreements with terms that vary by contract. Generally, the supply agreements include both fixed prices and variable prices. Fixed price agreements have prices set for one or more years while variable price agreements are subject to regular price adjustments generally tied to market pricing or other market-related indices. Our supply agreements have a variety of volume provisions. While certain of our contracts have no minimum volume requirements, certain of our supply agreements require the customer to purchase a specified percentage of its product requirements or a minimum volume of product. Certain of these minimum volume contracts include a provision which may trigger penalties if the purchased volume does not meet the required minimums.
Our Energy segment represented 54% of our revenues for the year ended December 31, 2019. A large portion of our sales are generated by our top customers, and the loss of, or significant reduction in, purchases by our largest customers could adversely affect our operations. During the years ended December 31, 2019 and 2018, our top ten customers were Energy customers and collectively represented 36% and 44% of our revenues, respectively. In 2019, no customers exceeded 10% of revenues. In 2018, one customer exceeded 10% of revenues. This customer accounted for 13% of our revenues in 2018. Our Industrial segment represented 46% of our revenues for the year ended December 31, 2019.
The Costs of Conducting Our Business
The principal costs involved in operating our business are: logistics costs associated with transporting products from our production facilities to our terminals; production costs; labor costs; maintenance and repair costs at our production facilities; raw material costs; energy costs; stripping costs; and corporate costs. We own or lease most of our sand and other mineral reserves.
Logistics Costs
Logistics costs, including freight, railcar leases, demurrage and handling, represented approximately 34% and 36% of our revenues during the years ended December 31, 2019 and 2018, respectively. Freight costs primarily represent charges to transport our product
67
by rail, but we also ship product by truck and barge. In order to move product by rail, we lease a substantial number of railcars under operating leases with durations ranging from three to 15 years. Demurrage costs are charged by the railroads based on the time a railcar spends on the railroad property in excess of an allotted time which can vary significantly from period to period depending on railcar cycle times and delivery schedules. Handling costs are incurred at our distribution and terminal facilities to move product from one mode of transportation to another (e.g., railcar to truck) and to move product into storage facilities. Railcar storage costs are incurred when railcars are temporarily stored at a rail yard or storage facility.
Labor Costs
Labor costs associated with employees at our processing and production facilities represent the most significant cost of converting raw frac sand to finished product. Labor costs, including wages and benefits, represented approximately 13% and 11% of our revenues during the years ended December 31, 2019 and 2018, respectively. Approximately 35% of our workforce was party to collective bargaining contracts as of December 31, 2019.
Maintenance and Repair Costs
We capitalize the costs of our mining and processing equipment and depreciate such equipment over their expected useful life. Depreciation, depletion, and amortization costs represented approximately 14% and 11% of revenues during the years ended December 31, 2019 and 2018, respectively. Repair and maintenance costs that do not involve the replacement of major components of our equipment and facilities are expensed through cost of goods sold as incurred. These repair and maintenance costs can be significant due to the abrasive nature of our products and represented approximately 4% of revenues during each of the years ended December 31, 2019 and 2018.
Energy Costs
We consume energy, including natural gas, diesel and electricity, for mine and plant production. Natural gas is the primary fuel source used for drying sand in the commercial silica production process. Energy costs are typically negotiated on an annual or multi-year basis and certain input costs are subject to prevailing market prices for the underlying commodity (e.g., natural gas, diesel), which can vary during the year.
Corporate Costs
Our selling, general and administrative costs, which include the wages and benefits costs noted above, represented approximately 10% and 8% of revenues during the years ended December 31, 2019 and 2018, respectively. These costs are related to our corporate functions, including costs for the sales and marketing; research and development; finance; legal; and environmental, health and safety functions of our organization, as well as non-cash stock-based compensation expense.
Combination with Fairmount Santrol
On June 1, 2018 (“Merger Date”), Unimin completed a business combination (“Merger”) whereby Fairmount Santrol merged into a wholly-owned subsidiary of Unimin and ceased to exist as a separate corporate entity. Immediately following the consummation of the Merger, Unimin changed its name and began operating as Covia. The common stock of Fairmount Santrol was delisted from the NYSE prior to the market opening on June 1, 2018, and Covia commenced trading under the ticker symbol “CVIA” on that date. Upon the consummation of the Merger, the former stockholders of Fairmount Santrol (including holders of certain Fairmount Santrol equity awards) received, in the aggregate, $170 million in cash consideration and approximately 35% of the common stock of Covia. Approximately 65% of Covia common stock is owned by SCR-Sibelco NV (“Sibelco”), previously the parent company of Unimin.
In connection with the Merger, we redeemed approximately 18.5 million shares of Unimin common stock from Sibelco in exchange for an amount in cash equal to (i) $660 million plus interest accruing at 5.0% per annum for the period from September 30, 2017 through June 1, 2018 less (ii) $170 million in cash paid to Fairmount Santrol stockholders.
In the years ended December 31, 2019, 2018, and 2017, we incurred $0.9 million, $53.0 million and $19.3 million, respectively, of costs and expenses related to the Merger, which are recorded in Other non-operating expense, net in the accompanying Consolidated Statements of Income and include legal, accounting, valuation and financial advisory services, integration and other costs.
68
Discontinued Operations
On May 31, 2018, prior to, and as a condition to the closing of the Merger, Unimin contributed certain assets, comprising its global high purity quartz business to HPQ Co. in exchange for all of the stock of HPQ Co. and the assumption by HPQ Co. of certain liabilities. Unimin distributed all of the stock of HPQ Co. to Sibelco in exchange for certain shares of Unimin common stock held by Sibelco. HPQ Co. is presented as discontinued operations in our Consolidated Financial Statements included in this Report.
As part of the disposition of HPQ Co., Covia and HPQ Co. entered into the Tax Matters Agreement. Under the Tax Matters Agreement, Covia and HPQ Co. (and their affiliates) are responsible for income taxes required to be reported on their respective separate and group tax returns; however, HPQ Co. is responsible for any unpaid income taxes attributable to the HPQ Co. business prior to May 31, 2018, as well as any unpaid non-income taxes as of May 31, 2018 attributable to the HPQ Co. business (whether arising prior to May 31, 2018 or not). Covia is responsible for all other non-income taxes. We and HPQ Co. will equally bear any transfer taxes imposed as a result of the disposition of HPQ Co. Rights to refunds in respect of taxes will be allocated in the same manner as the responsibility for tax liabilities.
Dispositions
On August 1, 2019, we completed the sale of the Calera, Alabama lime processing facility (“Calera”), to Mississippi Lime Company for approximately $135 million in cash, subject to certain adjustments. Calera was a non-core asset included within our Industrial segment. On September 10, 2019, we completed the sale of the Winchester & Western Railroad (“W&W Railroad”) to an affiliate of OmniTRAX, Inc. for approximately $105 million in cash, subject to certain adjustments. The W&W Railroad was a non-core asset that was included in both our Energy and Industrial segments.
How We Evaluate Our Business
Our management uses a variety of financial and operational metrics to analyze our performance across our Industrial and Energy segments. We determine our reportable segments based on the primary industries we serve, our management structure and the financial information reviewed by our chief operating decision maker in deciding how to allocate resources and assess performance. We evaluate the performance of our segments based on their volumes sold, average selling price, and segment contribution margin and associated per ton metrics. We evaluate the performance of our business based on company-wide operating cash flows, earnings before interest, taxes, depreciation and amortization (“EBITDA”), costs incurred that are considered non-operating, and Adjusted EBITDA. Segment contribution margin, EBITDA, and Adjusted EBITDA are defined in the Non-GAAP Financial Measures section below. We view these metrics as important factors in evaluating profitability and review these measurements frequently to analyze trends and make decisions, and believe these metrics provide beneficial information for investors for similar reasons.
Segment Gross Profit
Segment gross profit is defined as segment revenue less segment cost of sales, excluding depreciation, depletion and amortization expenses, selling, general, and administrative costs, and corporate costs.
Non-GAAP Financial Measures
Segment contribution margin, EBITDA, and Adjusted EBITDA are supplemental non-GAAP financial measures used by management in evaluating our operating performance.
Segment contribution margin is a key metric we use to evaluate our operating performance and to determine resource allocation between segments, as it excludes non-operating site costs and excess railcar costs. This metric allows for evaluation of business results without unnecessary overlap of costs that are inconsistent with current market conditions. We define segment contribution margin as segment revenue less segment cost of sales, excluding any depreciation, depletion and amortization expenses, selling, general, and administrative costs, and operating costs of idled facilities and excess railcar capacity. Segment contribution margin per ton is defined as segment contribution margin divided by tons sold. Segment contribution margin is not a measure of our financial performance under GAAP and should not be considered as an alternative or superior to measures derived in accordance with GAAP. Refer to Note 26 to our Consolidated Financial Statements for further detail regarding the use of segment contribution margin to evaluate our operating segments, including a reconciliation of operating income (loss) from continuing operations, the most directly comparable GAAP financial measure, to segment contribution margin.
69
We define EBITDA as net income before interest expense, income tax expense (benefit), depreciation, depletion and amortization. Adjusted EBITDA is defined as EBITDA before non-cash stock-based compensation and certain other income or expenses, including restructuring and other charges, impairments, and Merger-related expenses. Beginning in the first quarter of 2019, we also include non-cash lease expense of intangible assets in our calculation of Adjusted EBITDA as a result of the adoption of ASC 842.
We believe EBITDA and Adjusted EBITDA are useful because they allow management to more effectively evaluate our normalized operations from period to period as well as provide an indication of cash flow generation from operations before investing or financing activities. Accordingly, EBITDA and Adjusted EBITDA do not take into consideration our financing methods, capital structure or capital expenditure needs. As previously noted, Adjusted EBITDA excludes certain non-operational income and/or costs, the removal of which improves comparability of operating results across reporting periods. However, EBITDA and Adjusted EBITDA have limitations as analytical tools and should not be considered as alternatives to, or more meaningful than, net income as determined in accordance with GAAP as indicators of our operating performance. Certain items excluded from EBITDA and Adjusted EBITDA are significant components in understanding and assessing our financial performance, such as our cost of capital and tax structure, as well as the historic costs of depreciable assets, none of which are components of EBITDA or Adjusted EBITDA.
Additionally, Adjusted EBITDA is not intended to be a measure of free cash flow for management’s discretionary use, as it does not consider certain cash requirements such as interest payments, tax payments and debt service requirements. Adjusted EBITDA contains certain other limitations, including the failure to reflect our cash expenditures, cash requirements for working capital needs and cash costs to replace assets being depreciated and amortized, and excludes certain non-operational charges. We compensate for these limitations by relying primarily on our GAAP results and by using Adjusted EBITDA only as a supplement. Non-GAAP financial information should not be considered in isolation or viewed as a substitute for measures of performance as defined by GAAP.
Although we attempt to determine EBITDA and Adjusted EBITDA in a manner that is consistent with other companies in our industry, our computation of EBITDA and Adjusted EBITDA may not be comparable to other similarly titled measures of other companies due to potential inconsistencies in the methods of calculation. We believe that EBITDA and Adjusted EBITDA are widely followed measures of operating performance.
70
The following table sets forth a reconciliation of net income, the most directly comparable GAAP financial measure, to EBITDA and Adjusted EBITDA. Refer to Note 26 in the Notes to our Consolidated Financial Statements for a reconciliation of segment contribution margin to operating income (loss) from continuing operations, the most directly comparable GAAP financial measure:
| | Year Ended December 31, | |
| | 2019 | | | 2018 | | | 2017 | |
| | (in thousands) | |
Reconciliation of EBITDA and Adjusted EBITDA | | | | | | | | | | | | |
| | | | | | | | | | | | |
Net income (loss) from continuing operations attributable to Covia | | $ | (1,290,102 | ) | | $ | (283,085 | ) | | $ | 130,887 | |
Interest expense, net | | | 107,891 | | | | 60,322 | | | | 14,653 | |
Provision (benefit) for income taxes | | | (244,134 | ) | | | 3,987 | | | | (8,825 | ) |
Depreciation, depletion, and amortization expense | | | 222,042 | | | | 196,455 | | | | 101,560 | |
EBITDA | | | (1,204,303 | ) | | | (22,321 | ) | | | 238,275 | |
| | | | | | | | | | | | |
Non-cash stock compensation expense(1) | | | 10,028 | | | | 5,812 | | | | - | |
Goodwill and asset impairments(2) | | | 1,434,148 | | | | 267,034 | | | | - | |
Restructuring and other charges(3) | | | 33,189 | | | | 27,660 | | | | - | |
Gain on sale of subsidiaries(4) | | | (125,430 | ) | | | - | | | | - | |
Gain on debt extinguishment(5) | | | (13,411 | ) | | | - | | | | - | |
Costs and expenses related to the Merger and integration(6) | | | 896 | | | | 52,979 | | | | 19,300 | |
Non-cash charges relating to operating leases(7) | | | 7,904 | | | | - | | | | - | |
Adjusted EBITDA (non-GAAP) | | $ | 143,021 | | | $ | 331,164 | | | $ | 257,575 | |
_____________ | | | | | | | | | | | | |
| | | | | | | | | | | | |
(1) Represents the non-cash expense for stock-based awards issued to our employees and outside directors. Stock compensation expense related to the accelerated awards as a result of the Merger is included above in costs and expenses related to the Merger and integration for the 2018 periods presented. Stock compensation expenses are reported in Selling, general and administrative expenses. | |
(2) Represents expenses associated with the impairment of long-lived assets, Propel SSP® self-suspending proppant, idled facilities and railcars, and spare parts inventory in the Energy segment in 2019. Represents expenses associated with the impairment of goodwill in the Energy reporting unit and the impairment of assets from idled facilities and assets under construction in 2018. | |
(3) Represents expenses associated with restructuring activities as a result of the Merger and idled facilities, strategic costs, other charges related to executive severance and benefits, as well as restructuring-related SG&A expenses. | |
(4) Represents the gains associated with the sale of Calera and the W&W Railroad. | |
(5) Represents the gain, net of $1.0 million of deferred financing fees and $0.2 million of transaction fees, on $62.9 million of Term Loan repurchases in December 2019. | |
(6) Costs and expenses related to the Merger and integration include legal, accounting, financial advisory services, severance, debt extinguishment, integration and other expenses. | |
(7) Represents the amount of operating lease expense incurred in 2019 related to intangible assets that were reclassified to Operating right-of-use assets, net on the Consolidated Balance Sheets, as a result of the adoption of ASC 842. The expense, previously recognized as non-cash amortization expense, is now recognized in Cost of goods sold (excluding depreciation, depletion, and amortization shown separately) on the Consolidated Statement of Income (Loss). | |
71
Results of Operations
The following table presents an overview of certain operating data by segment for the years ended December 31, 2019, 2018, and 2017, which are discussed in further detail following the consolidated overview.
| | Year Ended December 31, | |
| | 2019 | | | 2018 | |
| | (in thousands) | |
Operating Data | | | | | | | | |
Energy | | | | | | | | |
Tons sold | | | 16,498 | | | | 16,101 | |
Revenues | | $ | 862,878 | | | $ | 1,114,424 | |
Segment gross profit | | | 54,083 | | | | 258,996 | |
Segment contribution margin | | $ | 89,173 | | | $ | 275,947 | |
Industrial | | | | | | | | |
Tons sold | | | 13,988 | | | | 13,480 | |
Revenues | | $ | 732,568 | | | $ | 728,513 | |
Segment gross profit | | | 222,191 | | | | 203,175 | |
Segment contribution margin | | $ | 222,191 | | | $ | 203,175 | |
Totals | | | | | | | | |
Tons sold | | | 30,486 | | | | 29,581 | |
Revenues | | $ | 1,595,446 | | | $ | 1,842,937 | |
Segment gross profit | | | 276,274 | | | | 462,171 | |
Segment contribution margin | | $ | 311,364 | | | $ | 479,122 | |
Financial results for 2018 include our results subsequent to the Merger on June 1, 2018, and legacy Unimin and legacy Fairmount Santrol for the twelve months and seven months ended December 31, 2018, respectively. Our reported financial results for 2017 include legacy Unimin. Our financial results, and the table above, exclude HPQ Co. (legacy Unimin’s Electronics segment), which is reported as discontinued operations in our consolidated financial statements for 2018 and 2017.
2019 Compared to 2018
Revenues and Volumes
Revenues were $1.6 billion for 2019 compared to $1.8 billion for 2018, a decrease of $0.2 billion, or 11%. With the inclusion of legacy Fairmount Santrol revenues of $477.3 million for the five months ended May 31, 2018, total revenues for 2018 were $2.3 billion. Total revenues for 2019 decreased $724.7 million, or 31%, from 2018, including legacy Fairmount Santrol revenues for the five months ended May 31, 2018.
Volumes were 30.5 million tons for 2019 compared to 29.6 million tons for 2018, an increase of 0.9 million tons, or 3%. With the inclusion of legacy Fairmount Santrol volumes of 5.6 million tons for the five months ended May 31, 2018, total volumes for 2018 were 35.2 million tons. Total volumes for 2019 decreased 4.7 million tons, or 13%, from 2018, including legacy Fairmount Santrol volumes for the five months ended May 31, 2018. Our revenues decreased largely due to pricing and volumes declines in Energy business, as well as a shift in mix from Northern White sand toward local sands, which carry lower average selling prices.
Revenues in the Energy segment were $862.9 million for 2019, compared to $1.1 billion for 2018, a decrease of $251.5 million, or 23%. With the inclusion of legacy Fairmount Santrol Energy revenues of $421.5 million for five months ended May 31, 2018, total Energy revenues were $1.5 billion for 2018. Total Energy revenues for 2019 decreased $673.0 million, or 44%, from 2018, including legacy Fairmount Santrol revenues for the five months ended May 31, 2018.
Volumes in the Energy segment were 16.5 million tons for 2019 compared to 16.1 million tons for 2018, an increase of 0.4 million tons, or 2%. With the inclusion of legacy Fairmount Santrol Energy volumes of 4.6 million tons for the five months ended May 31, 2018, total Energy volumes for 2018 were 20.7 million tons. Total volumes for 2019 decreased 4.2 million tons, or 20%, from 2018, including legacy Fairmount Santrol volumes for the five months ended May 31, 2018. Energy revenues decreased primarily due to pricing and volume declines coupled with product mix shifts toward local sand sales and sales at the mine, each of which carry lower average selling prices. Additionally, E&P companies reached budget exhaustion for year and began to reduce operations starting in third quarter of 2019, further impacting the proppant market and reducing demand.
72
Revenues in the Industrial segment were $732.6 million for 2019, compared to $728.5 million for 2018, an increase of $4.1 million, or 1%. With the inclusion of legacy Fairmount Santrol Industrial revenues of $55.8 million for the five months ended May 31, 2018, total Industrial revenues for 2018 were $784.3 million. Total Industrial revenues for 2019 decreased $51.7 million, or 7%, from 2018, including legacy Fairmount Santrol revenues for the five months ended May 31, 2018.
Volumes in the Industrial segment were 14.0 million tons for 2019, compared to 13.5 million tons for 2018, an increase of 0.5 million tons, or 4%. With the inclusion of legacy Fairmount Santrol Industrial volumes of 1.0 million tons for the five months ended May 31, 2018, total Industrial volumes for 2018 were 14.5 million tons. Total Industrial volumes decreased 0.5 million tons, or 3%, from 2018, including legacy Fairmount Santrol volumes for the five months ended May 31, 2018. Industrial revenues decreased primarily due to lower transportation-related revenues (for which we do not earn a margin), the sale of our Calera, Alabama lime facility and the W&W Railroad, and lower volumes in ceramics markets, offset somewhat by increased volumes in coatings and polymers markets.
Segment Gross Profit and Segment Contribution Margin
Segment gross profit was $276.3 million for 2019 compared to segment gross profit of $462.2 million for 2018, a decrease of $185.9 million, or 40%. With the inclusion of legacy Fairmount Santrol segment gross profit of $158.1 million for the five months ended May 31, 2018, total segment gross profit for 2018 was $620.3 million. Total segment gross profit for 2019 decreased $344.0 million, or 55%, from the 2018, including legacy Fairmount Santrol gross profit for the five months ended May 31, 2018. The segment gross profit decrease was primarily due to lower volumes as a result of the proppant market downturn and reductions in E&P operations. Segment gross profit was also negatively affected by downward pricing pressure and higher railcar maintenance and storage costs. Additionally, for 2019, gross profit was negatively impacted by $7.9 million in costs associated with operating lease expense related to the adoption of ASC 842.
Segment contribution margin was $311.4 million for 2019 and further excludes $5.4 million of operating costs of idled facilities and $29.7 million of excess railcar capacity costs. Segment contribution margin was $479.1 million for 2018 and further excludes $3.0 million of operating costs of idled facilities and $14.0 million of excess railcar capacity costs. These excluded costs are entirely attributable to the Energy segment
Energy segment gross profit was $54.1 million for 2019 compared to $259.0 million for 2018, a decrease of $204.9 million, or 79%. With the inclusion of legacy Fairmount Santrol Energy segment gross profit of $136.7 million for the five months ended May 31, 2018, total Energy segment gross profit was $395.7 million. Total Energy segment gross profit for 2019 decreased $341.6 million, or 86%, from 2018, including legacy Fairmount Santrol gross profit for the five months ended May 31, 2018. For 2019, the Energy segment gross profit included $7.9 million of operating lease expense related to the adoption of ASC 842, and $0.4 million of expense related to the write-up of legacy Fairmount Santrol’s inventories to fair value as a result of the Merger under GAAP. The remaining Energy segment gross profit decrease was primarily due to lower volumes, downward pricing pressure, reductions in E&P operations and higher railcar maintenance and storage costs.
Industrial segment gross profit was $222.2 million for 2019 compared to $203.2 million for 2018, an increase of $19.0 million, or 9%. With the inclusion of legacy Fairmount Santrol Industrial segment gross profit of $21.4 million for the five months ended May 31, 2018, total Industrial segment gross profit was $224.6 million, a decrease of $2.4 million, or 1% from 2018. Excluding divested Calera and W&W Railroad businesses, Industrial segment gross profit would have increased 9% in 2019 from 2018. For 2019, the Industrial segment gross profit included $0.7 million of expense related to the write-up of legacy Fairmount Santrol’s inventories to fair value as a result of the Merger under GAAP.
Selling, General and Administrative Expenses (“SG&A”)
SG&A increased $8.0 million, or 5%, to $153.6 million for 2019 compared to $145.6 million for 2018. SG&A for 2019 included stock compensation expense of $10.0 million compared to $5.8 million of stock compensation expense for 2018. With the inclusion of legacy Fairmount Santrol SG&A of $44.2 million for 2018, total SG&A was $189.8 million. Total SG&A decreased $36.2 million, or 19%, from 2018, including legacy Fairmount Santrol SG&A for the five months ended May 31, 2018. The decrease is primarily due to expense reduction initiatives, facility and headcount rationalization, and synergy realization.
73
Depreciation, Depletion and Amortization
Depreciation, depletion and amortization increased $25.5 million to $222.0 million for 2019, compared to $196.5 million for 2018. The increase compared to the prior year was due to the inclusion of mineral reserves depletion for production facilities acquired in connection with the Merger, partially offset by the full amortization, disposal, or impairment of certain intangible assets.
Goodwill and Other Asset Impairments
For 2019, goodwill and other asset impairments was $1.4 billion, an increase of $1.2 billion, compared to goodwill and other asset impairments of $267.0 million for 2018. In 2019, due to a sharp decline in customer demand for Northern White sand caused by shifts toward local in-basin frac sands with lower logistics costs, we impaired Propel SSP® technology for $7.8 million, long-lived assets and right-of-use assets for $1.4 billion, idled facilities and railcars for $11.0 million, and spare parts inventory for $3.9 million. In 2018, we impaired goodwill for $217.1 million, idled facilities for $37.7 million, and assets under construction for $12.3 million. Throughout 2019, our Energy segment was impacted by new sources of supply and sequentially slower proppant demand, resulting in a surplus of proppant and significantly lower proppant pricing. In response to changing market demands, we idled operations at certain mines, terminals, and resin-coating facilities, rationalized our railcar fleet and reduced production capacity and total production at certain of our Northern White sand plants. In total, we have reduced our Energy segment annual production capacity by over 15 million tons since September 2018.
Restructuring and Other Charges
We incurred restructuring and other charges of $30.6 million in 2019 compared to $22.0 million in 2018, an increase of $8.6 million, or 39%. Restructuring charges are primarily related to separation costs associated with plant closures and other headcount initiatives. Restructuring charges in 2019 also include minimum quantity penalties incurred in connection with reduced production at idled facilities, $5.5 million of other charges related to executive severance and benefits, and $9.0 million of strategic-related charges.
Gain on Sale of Subsidiaries
In 2019, we recorded a gain of $125.4 million on the sale of Calera and the W&W Railroad. There were no such sales in 2018.
Other Operating Income, net
Other operating income, net increased $1.0 million to $6.0 million for 2019, compared to $5.0 million for 2018. Other operating income, net for 2019 included the income related to realization of liquidated damages from certain customers who failed to meet minimum purchase obligations and income related to easements granted for consideration on certain of our properties in Mexico and Virginia.
Operating Income (Loss) from Continuing Operations
Operating loss from continuing operations increased $1.2 billion to a loss of $1.4 billion for 2019, compared to a loss of $163.8 million for 2018. The change in operating income from continuing operations for 2019 was primarily due to Energy asset impairments and lower profitability the in Energy segment, partially offset by the gain on the sales of Calera and the W&W Railroad.
Interest Expense, net
Interest expense increased $47.6 million, or 79%, to $107.9 million for 2019, compared to $60.3 million for 2018. The increase in expense was primarily due to a full year of interest on our Term Loan, compared to only seven months of 2018. The Term Loan was used to finance the Merger.
Other Non-Operating Expense, net
Other non-operating expense, net decreased $47.8 million to $7.0 million in 2019, compared to $54.8 million in 2018. The decrease was primarily due to a $49.0 million reduction in legal, accounting, and other expenses incurred in connection with the Merger, partially offset by $1.2 million in acceleration of previously deferred pension-related expenses due to settlement accounting application in 2019 as distributions exceed the current period service and interest cost recognized.
74
Provision (Benefit) for Income Taxes
The provision for income taxes decreased $248.1 million to a benefit of $244.1 million for 2019 compared to a provision of $4.0 million for 2018. Loss before income taxes increased $1.2 billion to a loss of $1.5 billion for 2019 compared to a loss of $279.0 million for 2018. The increase in tax benefit was primarily related to the asset impairment, which resulted in a large reversal of our deferred tax liability, offset by adjustments to our valuation allowance on deferred taxes.
The Tax Cuts and Jobs Act of 2017 (the “Tax Act”), effective December 22, 2017, established a corporate income tax rate of 21% replacing the 35% rate and created a territorial tax system rather than a worldwide system. The transition to a territorial system included a one-time transition tax on certain unremitted foreign earnings. The Tax Act generally eliminated the U.S. federal income tax on dividends from foreign subsidiaries but included new provisions for the taxation of global intangible low-taxed income (GILTI). The Tax Act also included new provisions limiting the deductibility of interest expense.
We applied the guidance in Staff Accounting Bulletin 118 when accounting for the enactment-date effects of the Tax Act in 2017 and throughout 2018. We completed our accounting of the Tax Act during 2018.
The effective rate for the period differs from the U.S. federal statutory rate primarily due to depletion, the impact of foreign taxes, tax provisions requiring U.S. income inclusion of foreign income, and changes to a valuation allowance set up on deferred taxes.
Net Income (Loss) Attributable to Covia
Net loss attributable to Covia increased $1.0 billion to a loss of $1.3 billion for 2019 compared to a loss of $270.5 million for 2018, which includes income of $12.6 million from discontinued operations. The remaining change in net loss attributable to Covia is primarily due to the increases in goodwill and other asset impairments and lower profitability in Energy segment, partially offset by the gain on the sales of Calera and the W&W Railroad.
Adjusted EBITDA
Adjusted EBITDA decreased $188.2 million to $143.0 million for 2019 compared to $331.2 million for 2018. Adjusted EBITDA for 2019 excludes the impact of $10.0 million of non-cash stock compensation expense, $1.4 billion of impairment charges, $33.2 million in restructuring and other charges, $125.4 million in gain on the sale of subsidiaries, $13.4 million in gain on extinguishment of debt, $0.9 million in Merger-related and integration expenses and $7.9 million in costs associated with operating lease expense related to the adoption of ASC 842. The change in Adjusted EBITDA is largely due to lower profitability.
2018 Compared to 2017
Discussions of 2017 items and full year comparisons between 2018 and 2017 that are not included in this Report can be found in “Management’s Discussion and Analysis of Financial Condition and Results of Operations” in Part II, Item 7 of our Annual Report on Form 10-K for 2018.
Liquidity and Capital Resources
Overview
Our liquidity is principally used to service our debt, meet our working capital needs, and invest in both maintenance and organic growth capital expenditures. Historically, we have met our liquidity and capital investment needs with funds generated from operations and the issuance of debt, if necessary.
On the Merger Date, we entered into the $1.65 billion Term Loan to repay the outstanding debt of each of Fairmount Santrol and Unimin and to pay the cash portion of the Merger consideration and transaction costs related to the Merger. The Term Loan was issued at par with a maturity date of June 1, 2025. The Term Loan requires quarterly principal payments of $4.1 million, reduced to $4.0 million after the December 2019 repurchases, and quarterly interest payments from September 30, 2018 through March 31, 2025 with the balance payable at the maturity date. Interest accrues at the rate of the three-month LIBOR plus 325 to 400 basis points depending on Total Net Leverage (as hereinafter defined) with a LIBOR floor of 1.0% or the Base Rate (as hereinafter defined). Total Net Leverage is defined as total debt net of up to $150.0 million of non-restricted cash, divided by EBITDA. The Term Loan is guaranteed by all of our wholly-owned, material, domestic, restricted subsidiaries (including Bison Merger Sub, LLC, as successor to
75
Fairmount Santrol, and all of the wholly-owned material restricted subsidiaries of Fairmount Santrol), subject to certain exceptions. In addition, subject to various exceptions, the Term Loan is secured by substantially all of our assets and those of each guarantor, including, but not limited to (a) a perfected first-priority pledge of all of the capital stock held by us or any guarantor of each existing or subsequently acquired or organized wholly-owned restricted subsidiary (no more than 65% of the voting stock of any foreign subsidiary) and (b) perfected first priority security interests in substantially all of our tangible and intangible assets and those of each guarantor. The Term Loan is not guaranteed by certain foreign subsidiaries, including our Mexican and Canadian subsidiaries. We have the option to prepay the Term Loan without premium or penalty other than customary breakage costs with respect to LIBOR borrowings. There are no financial covenants governing the Term Loan. The Term Loan places certain restrictions on our ability to pay dividends on our common stock.
Due to the continued challenging market conditions impacting our Energy segment, deteriorating financial performance, and the risk of exceeding the financial ratio covenant contained in the Revolver, we voluntarily cancelled the Revolver effective December 31, 2019. The Revolver, as amended by the First Amendment on March 19, 2019, included a total net leverage ratio covenant, tested on a quarterly basis, of no more than 6.60:1.00 through December 31, 2019, 5.50:1.00 for the fiscal quarters ending March 31, 2020 to December 31, 2020, 4.50:1.00 for the fiscal quarters ending March 31, 2021 to June 30, 2021, 4.25:1.00 for the fiscal quarters ending to September 30, 2021 to December 31, 2021, and 4.00:1.00 for fiscal quarters ending March 31, 2022 and thereafter. The $11.3 million of standby letters of credit issued by PNC Bank, National Association under the Revolver are now supported by a separate reimbursement agreement with PNC Bank, National Association.
Our principal sources of liquidity are cash on-hand and cash flow from operations, both now and in the near future. In addition, the Term Loan provides us flexibility to raise additional debt, including at least $75 million secured by accounts receivable and an incremental $275 million of financing at non-guarantor subsidiaries. In December 2019, we received a commitment from PNC Bank, National Association for a new, three-year credit facility for up to $75 million. The new facility is expected to bear interest of LIBOR plus 1.75% and be secured by our U.S. accounts receivable.
Interest on the Term Loan accrues at a per annum rate of either (at our option) (a) LIBOR plus a spread or (b) the alternate base rate plus a spread. The spread will vary depending on our total net leverage ratio, defined as the ratio of debt (less up to $150 million of cash) to EBITDA for the most recent four fiscal quarter period, as follows:
| | Term Loan | |
Leverage Ratio | | Applicable Margin for Eurodollar Loans | | Applicable Margin for ABR Loans | |
Greater than or equal to 2.50x | | 4.00% | | 3.00% | |
Greater than or equal to 2.0x and less than 2.50x | | 3.75% | | 2.75% | |
Greater than or equal to 1.50x and less than 2.0x | | 3.50% | | 2.50% | |
Less than 1.50x | | 3.25% | | 2.25% | |
The table below provides certain financial metrics for guarantor subsidiaries and non-guarantor subsidiaries:
| | Guarantor | | | Non-Guarantor | | | Total | |
Revenues | | $ | 1,352,204 | | | $ | 243,242 | | | $ | 1,595,446 | |
Gross profit | | | 185,787 | | | | 90,487 | | | | 276,274 | |
EBITDA | | $ | (1,268,902 | ) | | $ | 64,599 | | | $ | (1,204,303 | ) |
Adjustments | | | 1,347,324 | | | | - | | | | 1,347,324 | |
Adjusted EBITDA | | $ | 78,422 | | | $ | 64,599 | | | $ | 143,021 | |
The Term Loan contains customary representations and warranties, affirmative covenants, negative covenants and events of default. Negative covenants include, among others, limitations on debt, liens, asset sales, mergers, consolidations and fundamental changes, dividends and repurchases of equity securities, repayments or redemptions of subordinated debt, investments, transactions with affiliates, restrictions on granting liens to secure obligations, restrictions on subsidiary distributions, changes in the conduct of the business, amendments and waivers in organizational documents and junior debt instruments and changes in the fiscal year. As of December 31, 2019, we were in compliance with all covenants in accordance with the terms of the Term Loan and are no longer required to comply with the quarterly financial ratio covenant under the Credit Agreement.
76
The proceeds of the Term Loan were primarily used to repay certain debt of legacy Fairmount Santrol and legacy Unimin, which included additional debt incurred to fund the Cash Redemption and to pay $170 million to Fairmount Santrol stockholders as part of the Merger.
See Note 14 in the consolidated financial statements included in this Report for further detail regarding the credit agreement.
As of December 31, 2019, we had outstanding Term Loan borrowings of $1.57 billion and cash on-hand of $319.5 million. In the third quarter of 2019, we sold Calera and the W&W Railroad for a combined $240 million in cash.
Our operations are capital intensive and short-term capital expenditures related to certain strategic projects can be substantial. As of the date of this Report, we believe that our liquidity will be sufficient to meet cash obligations, including working capital requirements, anticipated capital expenditures, and scheduled debt service over the next 12 months.
Working Capital
Working capital is the amount by which current assets (excluding cash and cash equivalents) exceed current liabilities (excluding current portion of long-term debt) and represents a measure of liquidity. Our working capital was $61.7 million at December 31, 2019 and $216.3 million at December 31, 2018. The decrease in working capital is primarily due to improvements in cash collections and days sales outstanding ratios of our accounts receivable portfolio, cash proceeds from the sales of Calera and the W&W Railroad, increases in days payables outstanding, decreases from the dispositions of Calera and the W&W Railroad and overall lower sales levels. The decrease in working capital is primarily offset by the current portion of operating lease liabilities as a result of the adoption of ASC 842.
Cash Flow Analysis
For 2019, cash and cash equivalents increased by $185.4 million, compared with a decrease of $173.9 million for 2018. Excluding the favorable impact of changes in working capital and proceeds from asset sales, cash decreased by $161.1 million in 2019, compared to an increase of $152.1 million in 2018. This $313.2 million variance was primarily due to lower earnings, noted previously.
Net Cash Provided by (Used in) Operating Activities
Operating activities consist primarily of net income adjusted for non-cash items, including depreciation, depletion, and amortization, and the effect of changes in working capital.
Net cash provided by operating activities was $103.9 million for 2019 compared with $247.4 million in 2018. This $143.5 million variance was primarily due to lower earnings and the changes in working capital, noted previously.
Net Cash Used in Investing Activities
Investing activities consist primarily of capital expenditures for growth and maintenance. Capital expenditures generally are for expansions of production or terminal facilities, land and reserve acquisition or maintenance related expenditures for asset replacement and health, safety, and quality improvements.
Net cash provided by investing activities was $148.4 million for 2019 compared to $356.6 million used for 2018. The $505.0 million variance was primarily related to the net proceeds of $232.2 million from the sale of Calera and the W&W Railroad, the decrease in capital expenditures, and payments made in connection with the Merger in 2018.
Capital expenditures of $87.5 million, including stripping costs, in 2019 were primarily focused on growth expenditures at our Canoitas, Mexico facility and the completion of in-basin sand plants.
Capital expenditures were $264.1 million in 2018 were primarily focused on construction of new facilities in West Texas and Seiling, Oklahoma, completion of the expansion of the Utica, Illinois, and Oregon facilities, and expanding capacity at the Canoitas facility in Mexico, as well as our nepheline syenite operations in Canada.
77
For 2020, we expect capital expenditures to be in a range of $60 million to $70 million, of which $20 million to $25 million is related to the modernization and expansion of the nepheline syenite operations in Canada. We expect the remaining $40 million to $45 million is related to maintenance and growth capital expenditures at existing locations.
Net Cash Provided by (Used in) Financing Activities
Financing activities consist primarily of borrowings under our Term Loan, repayments of Unimin and Fairmount Santrol debt, and the Cash Redemption payment made in connection with the Merger.
Net cash used in financing activities was $67.6 million in 2019 compared to $66.8 million used in 2018. The $0.8 million variance is the largely due to the various debt transactions that occurred as part of the Merger in 2018, including borrowing the $1.65 billion Term Loan, $1.11 billion in payments on Unimin and Fairmount Santrol debts, a $520.4 million Cash Redemption payment, and $41.2 million in Merger-related debt refinancing fees. In December 2019, we repurchased $62.9 million of outstanding debt on the Term Loan at a weighted average of 76.8% of par value for cash of $48.5 million.
Inflation
We conduct the majority of our business operations in the U.S., Canada, and Mexico and are subject to certain inflationary pressures in these countries, should they arise.
Off-Balance Sheet Arrangements
We have no material off-balance sheet arrangements that have or are reasonably likely to have a current or future material effect on our financial condition, changes in financial condition, revenues, expenses, results of operations, liquidity, capital expenditures or capital resources.
Contractual Obligations
As of December 31, 2019, we have contractual obligations for long-term debt, finance leases, operating leases, terminal operating costs, capital commitments, and other long-term liabilities. Substantially all of the operating lease obligations are for railcars. In December 2019, we entered into definitive agreements with certain railcar manufacturers to restructure our railcar purchase obligations, which were scheduled to mature in 2020 and 2021. The agreements terminated railcar purchase obligations of approximately $195 million in exchange for immaterial consideration, which included cash and lease modifications to a small portion of the fleet. We no longer have any minimum railcar purchase obligations. See Notes 22 and 24 in the Notes to our Consolidated Financial Statements for further detail regarding our leases and commitments and contingencies.
| | Payments Due by Period | |
| | (in thousands) | |
| | Total | | | Less than 1 Year | | | 1-3 Years | | | 3-5 Years | | | More than 5 Years | |
Contractual Obligations(1) | | | | | | | | | | | | | | | | | | | | |
Long-term debt(2) | | $ | 1,576,585 | | | $ | 19,906 | | | $ | 31,794 | | | $ | 31,726 | | | $ | 1,493,159 | |
Finance lease obligations | | | 7,268 | | | | 3,713 | | | | 3,040 | | | | 515 | | | | - | |
Operating lease obligations(3) | | | 400,978 | | | | 81,148 | | | | 132,077 | | | | 94,524 | | | | 93,229 | |
Capital commitments | | | 25,677 | | | | 25,677 | | | | - | | | | - | | | | - | |
Other non-current liabilities reflected on | | | | | | | | | | | | | | | | | | | | |
the registrant's balance sheet under | | | | | | | | | | | | | | | | | | | | |
GAAP; asset retirement obligation and other | | | 46,510 | | | | 17,839 | | | | - | | | | 100 | | | | 28,571 | |
Total contractual cash obligations | | $ | 2,057,018 | | | $ | 148,283 | | | $ | 166,911 | | | $ | 126,865 | | | $ | 1,614,959 | |
_____________ | | | | | | | | | | | | | | | | | | | | |
| | | | | | | | | | | | | | | | | | | | |
(1) The amounts set forth in this table exclude our minimum pension funding obligations as required by the Employee Retirement Income Security Act of 1974 ("ERISA"). Our minimum pension funding obligations depend on several factors, including the discount rate, investment returns, and any changes in applicable laws and regulations. Currently, it is not possible to reasonably predict future contributions by year. We also have payment obligations due under the Postretirement Medical Plans (as defined in Note 20 in our consolidated financial statements), which is a pay-as-you-go plan and not required to be funded in advance. | |
(2) Consists of obligations under the Term Loan, the Industrial Revenue Bond and other borrowings, all of which are described in more detail in Note 14 in the Notes to our Consolidated Financial Statements. Interest payments on the Term Loan are calculated quarterly using variable interest rates based on market indices and, as a result, are not readily determinable for this analysis. | |
(3) Our operating lease obligations are related to land, furniture and fixtures, mobile equipment, buildings, railroad equipment, and terminals. | |
78
Environmental Matters
We are subject to various federal, state and local laws and regulations governing, among other things, hazardous materials, air and water emissions, environmental contamination and reclamation and the protection of the environment and natural resources. We have made, and expect to make in the future, expenditures to comply with such laws and regulations, but cannot predict the full amount of such future expenditures. We may also incur fines and penalties from time to time associated with noncompliance with such laws and regulations.
As of December 31, 2019 and 2018, we had $46.5 million and $31.2 million, respectively, accrued for Asset Retirement Obligations, which include future reclamation costs. The increase is primarily related to shortened mine lives and renewed estimates. There were no other significant changes with respect to environmental liabilities or future reclamation costs.
We discuss certain environmental matters relating to our various production and other facilities, certain regulatory requirements relating to human exposure to crystalline silica and our mining activity and how such matters may affect our business in the future under the “Regulation and Legislation” section in “Item 1 – Business” and “Item 1A – Risk Factors” in Part I of this Report.
Critical Accounting Policies and Estimates
Our discussion and analysis of our financial condition and results of operations are based upon our consolidated financial statements, which have been prepared in accordance with GAAP. The preparation of these financial statements requires us to make estimates and assumptions that affect the reported amounts of assets and liabilities and the disclosure of contingent assets and liabilities at the dates of the financial statements and the reported revenues and expenses during the reporting periods. We evaluate these estimates and assumptions on an ongoing basis and base our estimates on historical experience, current conditions and various other assumptions that are believed to be reasonable under the circumstances. The results of these estimates form the basis for making judgments about the carrying values of assets and liabilities as well as identifying and assessing the accounting treatment with respect to commitments and contingencies. Our actual results may materially differ from these estimates. These critical accounting policies and estimates should be read in conjunction with our consolidated financial statements as filed in this Report.
Listed below are the accounting policies we believe are critical to our financial statements due to the degree of uncertainty regarding the estimates or assumptions involved, and that we believe are critical to the understanding of our operations.
Impairment of Long-Lived Assets, Definite-Lived Intangible Assets and Goodwill
We periodically evaluate whether current events or circumstances indicate that the carrying value of our long-lived assets may not be recoverable. If such circumstances exist, an estimate of undiscounted future net cash flows produced by the asset group is compared to the carrying value of the asset group. If the carrying value of the asset group is greater than the undiscounted cash flows, we recognize an impairment loss equal to the amount by which the carrying value exceeds the fair value of the asset group. Factors we generally consider important in our evaluation and that could trigger a review of recoverability include expected operating trends, significant changes in the way assets are used, underutilization of our tangible assets, discontinuance of certain products by us or by our customers, and significant negative industry or economic trends.
The recoverability of the carrying value of our development stage mineral properties is dependent upon the successful development, start-up and commercial production of our mineral deposits and related processing facilities. Our evaluation of mineral properties for potential impairment primarily includes assessing the existence or availability of required permits and evaluating changes in our mineral reserves, or the underlying estimates and assumptions, including estimated production costs. Assessing the economic feasibility requires certain estimates, including the prices of products to be produced and processing recovery rates, as well as operating and capital costs.
Goodwill is reviewed for impairment annually as of October 31, or more frequently if events and circumstances indicate that the reporting unit to which goodwill has been allocated might be impaired. In testing goodwill for impairment, we have the option to perform a qualitative assessment to determine whether the existence of events or circumstances indicate that it is more-likely-than-not (more than 50%) that the fair value of a reporting unit is less than its carrying amount. When performing a qualitative assessment, we evaluate factors such as a sustained decrease in our share price; macroeconomic conditions; industry and market considerations; cost factors; overall financial performance; events affecting the reporting unit, such as the sale of all or a portion of the reporting unit and other relevant entity-specific events. If the qualitative assessment indicates that it is more-likely-than-not that the fair value of the reporting unit is less than its carrying amount, or if we choose not to perform the qualitative assessment, then a quantitative
79
assessment is performed to determine the reporting unit’s fair value. If the reporting unit’s carrying value exceeds its fair value, then an impairment loss is recognized for the amount of the excess of the carrying amount over the reporting unit’s fair value, not to exceed the total amount of goodwill allocated to the reporting unit.
The evaluation of goodwill for impairment includes estimating fair value using one or a combination of valuation techniques, such as discounted cash flows or comparable companies’ earnings multiples or transactions. These valuations require us to make estimates and assumptions regarding future operating results, cash flows, changes in working capital, future capital expenditures, selling prices, profitability, and the cost of capital. Although we believe our assumptions and estimates are reasonable, deviations from the assumptions and estimates could produce a materially different result.
As a result of declining market conditions in the Energy segment, we recorded goodwill and other asset impairments in the years ended December 31, 2019 and 2018. See Note 11 in the consolidated financial statements for further detail.
Asset Retirement Obligations
We estimate the future cost of dismantling, restoring, and reclaiming operating excavation sites and related facilities in accordance with federal, state, and local regulatory requirements. We record the initial estimated present value of these costs as a liability in other non-current liabilities and increase the carrying amount of the related asset by a corresponding amount on the Consolidated Balance Sheets. The accretion of the liability is recorded as other operating expense (income), net and the related asset is classified as property, plant, and equipment and amortized over the estimated life of the mine or site. We adjust the related asset and liability for changes resulting from the passage of time and revisions to either the timing or amount of the original present value estimate. Future cost estimates are escalated for inflation and market risk premium, then discounted at the credit adjusted risk free rate. If the asset retirement obligation is settled for more or less than the carrying amount of the liability, a loss or gain will be recognized in the period the obligation is settled.
Employee Benefit Plans
We provide a range of benefits to our employees and retired employees, including pensions and post-retirement healthcare and life insurance benefits. We record annual amounts relating to these plans based on calculations specified by GAAP, which include various actuarial assumptions, including discount rates, assumed rates of returns, compensation increases, turnover rates, mortality rates and healthcare cost trend rates. We review the actuarial assumptions on an annual basis and makes modifications to the assumptions based on current rates and trends when it is deemed appropriate to do so. As required by GAAP, the effect of changes in assumptions are generally recorded or amortized over future periods. We believe that the assumptions utilized in recording our obligations under the plans are reasonable based on advice from actuaries. In 2019, the assumptions included discount rates from 3.10% to 7.05% and rates of return from 2.90% to 7.05%.
Fair Value of Derivatives
Due to our variable-rate indebtedness, we are exposed to fluctuations in interest rates. We enter into interest rate swap agreements as a means to partially hedge our variable interest rate risk. The derivative instruments are reported at fair value in accrued expenses and other non-current liabilities. Changes in the fair value of derivatives are recorded each period in accumulated other comprehensive loss. For derivatives not designated as hedges, the gain or loss is recognized in current earnings. No components of our hedging instruments were excluded from the assessment of hedge effectiveness.
Interest rate swaps designated as cash flow hedges involve the receipt of variable amounts from a counterparty in exchange for us making fixed-rate payments over the life of the agreements without exchange of the underlying notional value. The gain or loss on the interest rate swap is recorded in accumulated other comprehensive loss and subsequently reclassified into interest expense in the same period during which the hedged transaction affects earnings.
80
Taxes
Deferred taxes are provided on the asset and liability method whereby deferred tax assets are recognized for deductible temporary differences and operating loss and tax credit carry-forwards and deferred tax liabilities are recognized for taxable temporary differences. This approach requires recognition of deferred tax liabilities and assets for the expected future tax consequences of events that have been included in the financial statements or tax returns. Under this method, deferred tax liabilities and assets are determined based upon the difference between the financial statement and tax basis of assets and liabilities using enacted tax rates in effect for the year in which the expenses are expected to reverse. Valuation allowances are provided if, based on the weight of available evidence, it is more likely than not that some or all of the deferred tax assets will not be realized.
We recognize a tax benefit associated with an uncertain tax position when, in our judgment, it is more likely than not that the position will be sustained upon examination by a taxing authority. For a tax position that meets the more-likely-than-not recognition threshold, we initially and subsequently measure the tax benefit as the largest amount that we judge to have a greater than 50% likelihood of being realized upon ultimate settlement with a taxing authority. The liability associated with unrecognized tax benefits is adjusted periodically due to changing circumstances, such as the progress of tax audits, case law developments and new or emerging legislation. Such adjustments are recognized entirely in the period in which they are identified. The effective tax rate includes the net impact of changes in the liability for unrecognized tax benefits and subsequent adjustments as considered appropriate by management.
We evaluate quarterly the realizability of our deferred tax assets by assessing the need for a valuation allowance and by adjusting the amount of such allowance, if necessary. The factors used to assess the likelihood of realization are our forecast of future taxable income in the appropriate jurisdiction to utilize the asset, the reversal of taxable temporary differences, and available tax planning strategies that could be implemented to realize the net deferred tax assets. Failure to achieve forecasted taxable income might affect the ultimate realization of the net deferred tax assets. Factors that may affect our ability to achieve sufficient forecasted taxable income include, but are not limited to, the following: a decline in sales or margins, increased competition or loss of market share.
In addition, we operate within multiple taxing jurisdictions and are subject to audit in these jurisdictions. These audits can involve complex issues, which may require an extended time to resolve. We believe that adequate provisions for income taxes have been made for all years.
Typically, the largest permanent item in computing both our effective rate and taxable income is the deduction for statutory depletion. The depletion deduction is dependent upon a mine-by-mine computation of both gross income from mining and taxable income.
The Tax Act subjects us to current tax on our global intangible low-taxed income (“GILTI”). To the extent that tax expense is incurred under the GILTI provisions, it will be treated as a component of income tax expense in the period incurred.
ITEM 7A. QUANTITATIVE AND QUALITATIVE DISCLOSURES ABOUT MARKET RISK
Interest Rate Swaps
Due to our variable-rate indebtedness, we are exposed to fluctuations in interest rates. We use fixed interest rate swaps to manage this exposure. These derivative instruments are reported at fair value in accrued expenses and other non-current liabilities. Changes in the fair value of derivatives are recorded each period in other comprehensive income. For derivatives not designated as hedges, the gain or loss is recognized in current earnings. No components of our hedging instruments were excluded from the assessment of hedge effectiveness. Interest rate swaps designated as cash flow hedges involve the receipt of variable amounts from a counterparty in exchange for making fixed-rate payments over the life of the agreements without exchange of the underlying notional value. The gain or loss on the interest rate swap is recorded in accumulated other comprehensive loss and subsequently reclassified into interest expense in the same period during which the hedged transaction affects earnings.
We do not use derivative financial instruments for trading or speculative purposes. By their nature, all such instruments involve risk, including the possibility that a loss may occur from the failure of another party to perform according to the terms of a contract (credit risk) or the possibility that future changes in market price may make a financial instrument less valuable or more onerous (market risk). As is customary for these types of instruments, we do not require collateral or other security from other parties to these instruments. We believe that there is no significant risk of loss in the event of nonperformance of the counterparties to these financial instruments.
81
We formally designate and document instruments at inception that qualify for hedge accounting of underlying exposures in accordance with GAAP. We assess, both at inception and for each reporting period, whether the financial instruments used in hedging transactions are effective in offsetting changes in cash flows of the related underlying exposure.
As of December 31, 2019, the fair value of the interest rate swap was a liability of $21.2 million.
A hypothetical increase or decrease in interest rates by 1.0% on variable rate debt would have had an approximate $16.4 million impact on our interest expense in the year ended December 31, 2019.
Market Risk
We are exposed to various market risks, including changes in interest rates. Market risk related to interest rates is the potential loss arising from adverse changes in interest rates. We do not believe that inflation has a material impact on our financial position or results of operations during periods covered by the financial statements included in this Report.
Credit Risk
We are subject to risks of loss resulting from nonpayment or nonperformance by our customers. In 2019, no customers exceeded 10% of revenues. In 2018, one customer exceeded 10% of revenues. This customer accounted for 13% of our revenues in 2018. At December 31, 2019, we had no customers whose accounts receivable balance exceeded 10% of total receivables. At December 31, 2018, we had two customers whose accounts receivable balances each exceeded 10% of total receivables. Approximately 10% of our accounts receivable balance at December 31, 2018 was from each of these two customers. We examine the creditworthiness of third-party customers to whom we extend credit and manage our exposure to credit risk through credit analysis, credit approval, credit limits and monitoring procedures, and for certain transactions, we may request letters of credit, prepayments or guarantees, although collateral is generally not required.
82
ITEM 8. FINANCIAL STATEMENTS AND SUPPLEMENTARY DATA
The following consolidated financial statements are filed as part of this Annual Report on Form 10-K:
Covia Holdings Corporation and Subsidiaries | | Page |
| | |
Report of Independent Registered Public Accounting Firm | | 84 |
| | |
Consolidated Statements of Income (Loss) for the years ended December 31, 2019, 2018, and 2017 | | 86 |
| | |
Consolidated Statements of Comprehensive Income (Loss) for the years ended December 31, 2019, 2018, and 2017 | | 87 |
| | |
Consolidated Balance Sheets as of December 31, 2019 and 2018 | | 88 |
| | |
Consolidated Statements of Equity for the years ended December 31, 2019, 2018, and 2017 | | 89 |
| | |
Consolidated Statements of Cash Flows for the years ended December 31, 2019, 2018, and 2017 | | 90 |
| | |
Notes to Consolidated Financial Statements | | 91 |
| | |
Schedule II – Valuation and Qualifying Accounts and Reserves for the years ended December 31, 2019, 2018, and 2017 | | 138 |
83
Report of Independent Registered Public Accounting Firm
To the Shareholders and the Board of Directors of Covia Holdings Corporation
Opinion on the Financial Statements
We have audited the accompanying consolidated balance sheets of Covia Holdings Corporation and subsidiaries (the Company) as of December 31, 2019 and 2018, the related consolidated statements of income (loss), comprehensive income (loss), equity and cash flows for each of the three years in the period ended December 31, 2019, and the related notes and financial statement schedule listed in the Index at Item 15(b) (collectively referred to as the “consolidated financial statements”). In our opinion, the consolidated financial statements present fairly, in all material respects, the financial position of the Company at December 31, 2019 and 2018, and the results of its operations and its cash flows for each of the three years in the period ended December 31, 2019, in conformity with U.S. generally accepted accounting principles.
We also have audited, in accordance with the standards of the Public Company Accounting Oversight Board (United States) (PCAOB), the Company's internal control over financial reporting as of December 31, 2019, based on criteria established in Internal Control-Integrated Framework issued by the Committee of Sponsoring Organizations of the Treadway Commission (2013 framework), and our report dated March 16, 2020 expressed an unqualified opinion thereon.
Basis for Opinion
These financial statements are the responsibility of the Company's management. Our responsibility is to express an opinion on the Company’s financial statements based on our audits. We are a public accounting firm registered with the PCAOB and are required to be independent with respect to the Company in accordance with the U.S. federal securities laws and the applicable rules and regulations of the Securities and Exchange Commission and the PCAOB.
We conducted our audits in accordance with the standards of the PCAOB. Those standards require that we plan and perform the audit to obtain reasonable assurance about whether the financial statements are free of material misstatement, whether due to error or fraud. Our audits included performing procedures to assess the risks of material misstatement of the financial statements, whether due to error or fraud, and performing procedures that respond to those risks. Such procedures included examining, on a test basis, evidence regarding the amounts and disclosures in the financial statements. Our audits also included evaluating the accounting principles used and significant estimates made by management, as well as evaluating the overall presentation of the financial statements. We believe that our audits provide a reasonable basis for our opinion.
Adoption of ASU No. 2016-02
As discussed in Note 3 to the consolidated financial statements, the Company changed its method of accounting for leases in 2019 due to the adoption of Accounting Standards Update (ASU) No. 2016-02, Leases (Topic 842), and the related amendments.
We have served as the Company’s auditor since 2013.
/s/ Ernst & Young LLP
Cleveland, Ohio
March 16, 2020
84
Report of Independent Registered Public Accounting Firm
To the Shareholders and the Board of Directors of Covia Holdings Corporation
Opinion on Internal Control Over Financial Reporting
We have audited Covia Holdings Corporation and subsidiaries internal control over financial reporting as of December 31, 2019, based on criteria established in Internal Control—Integrated Framework issued by the Committee of Sponsoring Organizations of the Treadway Commission (2013 framework) (the COSO criteria). In our opinion, Covia Holdings Corporation and subsidiaries (the Company) maintained, in all material respects, effective internal control over financial reporting as of December 31, 2019, based on the COSO criteria.
We also have audited, in accordance with the standards of the Public Company Accounting Oversight Board (United States) (PCAOB), the consolidated balance sheet of the Company as of December 31, 2019 and 2018, the related consolidated statements of income (loss), comprehensive income (loss), equity and cash flows for each of the three years in the period ended December 31, 2019, and the related notes and financial statement schedule listed in the Index at Item 15(b) (collectively referred to as the “consolidated financial statements”) and our report dated March 16, 2020 expressed an unqualified opinion thereon.
Basis for Opinion
The Company’s management is responsible for maintaining effective internal control over financial reporting and for its assessment of the effectiveness of internal control over financial reporting included in the accompanying Management’s Report on Internal Control over Financial Reporting. Our responsibility is to express an opinion on the Company’s internal control over financial reporting based on our audit. We are a public accounting firm registered with the PCAOB and are required to be independent with respect to the Company in accordance with the U.S. federal securities laws and the applicable rules and regulations of the Securities and Exchange Commission and the PCAOB.
We conducted our audit in accordance with the standards of the PCAOB. Those standards require that we plan and perform the audit to obtain reasonable assurance about whether effective internal control over financial reporting was maintained in all material respects.
Our audit included obtaining an understanding of internal control over financial reporting, assessing the risk that a material weakness exists, testing and evaluating the design and operating effectiveness of internal control based on the assessed risk, and performing such other procedures as we considered necessary in the circumstances. We believe that our audit provides a reasonable basis for our opinion.
Definition and Limitations of Internal Control Over Financial Reporting
A company’s internal control over financial reporting is a process designed to provide reasonable assurance regarding the reliability of financial reporting and the preparation of financial statements for external purposes in accordance with generally accepted accounting principles. A company’s internal control over financial reporting includes those policies and procedures that (1) pertain to the maintenance of records that, in reasonable detail, accurately and fairly reflect the transactions and dispositions of the assets of the company; (2) provide reasonable assurance that transactions are recorded as necessary to permit preparation of financial statements in accordance with generally accepted accounting principles, and that receipts and expenditures of the company are being made only in accordance with authorizations of management and directors of the company; and (3) provide reasonable assurance regarding prevention or timely detection of unauthorized acquisition, use, or disposition of the company’s assets that could have a material effect on the financial statements.
Because of its inherent limitations, internal control over financial reporting may not prevent or detect misstatements. Also, projections of any evaluation of effectiveness to future periods are subject to the risk that controls may become inadequate because of changes in conditions, or that the degree of compliance with the policies or procedures may deteriorate.
/s/ Ernst & Young LLP
Cleveland, Ohio
March 16, 2020
85
Covia Holdings Corporation and Subsidiaries
Consolidated Statements of Income (Loss)
Years Ended December 31, 2019, 2018, and 2017
| | Year Ended December 31, | |
| | 2019 | | | 2018 | | | 2017 | |
| | (in thousands, except per share amounts) | |
Revenues | | $ | 1,595,446 | | | $ | 1,842,937 | | | $ | 1,295,112 | |
Cost of goods sold (excluding depreciation, depletion, | | | | | | | | | | | | |
and amortization shown separately) | | | 1,319,172 | | | | 1,380,766 | | | | 928,659 | |
| | | | | | | | | | | | |
Operating expenses | | | | | | | | | | | | |
Selling, general and administrative expenses | | | 153,596 | | | | 145,593 | | | | 99,087 | |
Depreciation, depletion and amortization expense | | | 222,042 | | | | 196,455 | | | | 101,560 | |
Goodwill and other asset impairments, net | | | 1,434,148 | | | | 267,034 | | | | - | |
Restructuring and other charges | | | 30,600 | | | | 21,954 | | | | - | |
Gain on sale of subsidiaries | | | (125,430 | ) | | | - | | | | | |
Other operating expense (income), net | | | (6,040 | ) | | | (5,024 | ) | | | 3,102 | |
Operating income (loss) from continuing operations | | | (1,432,642 | ) | | | (163,841 | ) | | | 162,704 | |
| | | | | | | | | | | | |
Interest expense, net | | | 107,891 | | | | 60,322 | | | | 14,653 | |
Gain on extinguishment of debt | | | (13,411 | ) | | | - | | | | - | |
Other non-operating expense, net | | | 6,991 | | | | 54,832 | | | | 25,989 | |
Income (loss) from continuing operations before provision (benefit) for income taxes | | | (1,534,113 | ) | | | (278,995 | ) | | | 122,062 | |
| | | | | | | | | | | | |
Provision (benefit) for income taxes | | | (244,134 | ) | | | 3,987 | | | | (8,825 | ) |
Net income (loss) from continuing operations | | | (1,289,979 | ) | | | (282,982 | ) | | | 130,887 | |
Less: Net income (loss) from continuing operations attributable to the non-controlling interest | | | 123 | | | | 103 | | | | - | |
Net income (loss) from continuing operations attributable to Covia Holdings Corporation | | | (1,290,102 | ) | | | (283,085 | ) | | | 130,887 | |
| | | | | | | | | | | | |
Income from discontinued operations, net of tax | | | - | | | | 12,587 | | | | 23,284 | |
| | | | | | | | | | | | |
Net income (loss) attributable to Covia Holdings Corporation | | $ | (1,290,102 | ) | | $ | (270,498 | ) | | $ | 154,171 | |
| | | | | | | | | | | | |
Continuing operations earnings (loss) per share | | | | | | | | | | | | |
Basic | | $ | (9.81 | ) | | $ | (2.26 | ) | | $ | 1.09 | |
Diluted | | | (9.81 | ) | | | (2.26 | ) | | | 1.09 | |
| | | | | | | | | | | | |
Earnings (loss) per share | | | | | | | | | | | | |
Basic | | | (9.81 | ) | | | (2.16 | ) | | | 1.29 | |
Diluted | | $ | (9.81 | ) | | $ | (2.16 | ) | | $ | 1.29 | |
| | | | | | | | | | | | |
Weighted average number of shares outstanding | | | | | | | | | | | | |
Basic | | | 131,512 | | | | 125,514 | | | | 119,645 | |
Diluted | | | 131,512 | | | | 125,514 | | | | 119,645 | |
The accompanying notes are an integral part of these consolidated financial statements.
86
Covia Holdings Corporation and Subsidiaries
Consolidated Statements of Comprehensive Income (Loss)
Years Ended December 31, 2019, 2018, and 2017
| | Year Ended December 31, | |
| | 2019 | | | 2018 | | | 2017 | |
| | (in thousands) | |
Net income (loss) from continuing operations | | $ | (1,289,979 | ) | | $ | (282,982 | ) | | $ | 130,887 | |
Income from discontinued operations, net of tax | | | - | | | | 12,587 | | | | 23,284 | |
Net income (loss) before other comprehensive income (loss) | | | (1,289,979 | ) | | | (270,395 | ) | | | 154,171 | |
Other comprehensive income (loss), before tax | | | | | | | | | | | | |
Foreign currency translation adjustments | | | 5,805 | | | | 1,182 | | | | 2,606 | |
Employee benefit obligations | | | (2,154 | ) | | | 48,321 | | | | (1,991 | ) |
Amortization and change in fair value of derivative instruments | | | (17,417 | ) | | | (5,083 | ) | | | - | |
Total other comprehensive income (loss), before tax | | | (13,766 | ) | | | 44,420 | | | | 615 | |
Provision (benefit) for income taxes related to items of other comprehensive income | | | (3,905 | ) | | | 11,417 | | | | (111 | ) |
Comprehensive income (loss), net of tax | | | (1,299,840 | ) | | | (237,392 | ) | | | 154,897 | |
Comprehensive income (loss) attributable to the non-controlling interest | | | 123 | | | | 103 | | | | - | |
Comprehensive income (loss) attributable to Covia Holdings Corporation | | $ | (1,299,963 | ) | | $ | (237,495 | ) | | $ | 154,897 | |
The accompanying notes are an integral part of these consolidated financial statements.
87
Covia Holdings Corporation and Subsidiaries
Consolidated Balance Sheets
December 31, 2019 and 2018
| | December 31, 2019 | | | December 31, 2018 | |
| | (in thousands, except par value) | |
Assets | | | | | | | | |
Current assets | | | | | | | | |
Cash and cash equivalents | | $ | 319,484 | | | $ | 134,130 | |
Accounts receivable, net of allowance for doubtful accounts of $2,211 and $4,488 | | | | | | | | |
at December 31, 2019 and 2018, respectively | | | 199,027 | | | | 267,268 | |
Inventories, net | | | 121,790 | | | | 162,970 | |
Other receivables | | | 15,879 | | | | 40,306 | |
Prepaid expenses and other current assets | | | 20,843 | | | | 20,941 | |
Total current assets | | | 677,023 | | | | 625,615 | |
| | | | | | | | |
Property, plant and equipment, net | | | 1,419,982 | | | | 2,834,361 | |
Operating right-of-use assets, net | | | 158,489 | | | | - | |
Deferred tax assets, net | | | 13,725 | | | | 8,740 | |
Goodwill | | | 119,822 | | | | 131,655 | |
Intangibles, net | | | 33,630 | | | | 137,113 | |
Other non-current assets | | | 23,847 | | | | 18,633 | |
Total assets | | $ | 2,446,518 | | | $ | 3,756,117 | |
| | | | | | | | |
Liabilities and Equity | | | | | | | | |
Current liabilities | | | | | | | | |
Current portion of long-term debt | | $ | 18,633 | | | $ | 15,482 | |
Operating lease liabilities, current | | | 63,773 | | | | - | |
Accounts payable | | | 97,313 | | | | 145,070 | |
Accrued expenses | | | 126,895 | | | | 120,424 | |
Deferred revenue | | | 7,815 | | | | 9,737 | |
Total current liabilities | | | 314,429 | | | | 290,713 | |
| | | | | | | | |
Long-term debt | | | 1,539,073 | | | | 1,612,887 | |
Operating lease liabilities, non-current | | | 272,378 | | | | - | |
Employee benefit obligations | | | 66,073 | | | | 54,789 | |
Deferred tax liabilities, net | | | 131 | | | | 267,350 | |
Other non-current liabilities | | | 77,270 | | | | 75,425 | |
Total liabilities | | | 2,269,354 | | | | 2,301,164 | |
| | | | | | | | |
Commitments and contingent liabilities (Note 24) | | | | | | | | |
Equity | | | | | | | | |
Preferred stock: $0.01 par value, 15,000 authorized shares at | | | | | | | | |
December 31, 2019 and 2018 | | | | | | | | |
Shares outstanding: 0 at December 31, 2019 and 2018 | | | - | | | | - | |
Common stock: $0.01 par value, 750,000 authorized shares | | | | | | | | |
at December 31, 2019 and 2018 | | | | | | | | |
Shares issued: 158,195 at December 31, 2019 and 2018 | | | | | | | | |
Shares outstanding: 131,743 and 131,188 at December 31, 2019 | | | | | | | | |
and 2018, respectively | | | 1,777 | | | | 1,777 | |
Additional paid-in capital | | | 400,047 | | | | 388,027 | |
Retained earnings | | | 357,857 | | | | 1,647,959 | |
Accumulated other comprehensive loss | | | (105,086 | ) | | | (95,225 | ) |
Total equity attributable to Covia Holdings Corporation before treasury stock | | | 654,595 | | | | 1,942,538 | |
Less: Treasury stock at cost | | | | | | | | |
Shares in treasury: 26,452 and 27,007 at December 31, 2019 | | | | | | | | |
and 2018, respectively | | | (478,110 | ) | | | (488,141 | ) |
Total equity attributable to Covia Holdings Corporation | | | 176,485 | | | | 1,454,397 | |
Non-controlling interest | | | 679 | | | | 556 | |
Total equity | | | 177,164 | | | | 1,454,953 | |
Total liabilities and equity | | $ | 2,446,518 | | | $ | 3,756,117 | |
The accompanying notes are an integral part of these consolidated financial statements.
88
Covia Holdings Corporation and Subsidiaries
Consolidated Statements of Equity
Years Ended December 31, 2019, 2018, and 2017
| | Equity attributable to Covia Holdings Corporation | | | | | | | | | |
| | | | | | Shares of | | | Additional | | | | | | | Accumulated Other | | | | | | | Shares of | | | | | | | Non- | | | | | |
| | Common | | | Common | | | Paid-in | | | Retained | | | Comprehensive | | | Treasury | | | Treasury | | | | | | | Controlling | | | | | |
| | Stock | | | Stock | | | Capital | | | Earnings | | | Loss | | | Stock | | | Stock | | | Subtotal | | | Interest | | | Total | |
| | (in thousands) | |
Balances at December 31, 2016 | | $ | 1,777 | | | | 119,645 | | | $ | 43,941 | | | $ | 1,753,831 | | | $ | (118,499 | ) | | $ | (610,632 | ) | | | 38,550 | | | $ | 1,070,418 | | | $ | - | | | $ | 1,070,418 | |
Adoption of accounting standards update related to reclassification of certain tax effects | | | - | | | | - | | | | - | | | | 10,455 | | | | (10,455 | ) | | | - | | | | - | | | | - | | | | - | | | | - | |
Net (loss) income | | | - | | | | - | | | | - | | | | 154,171 | | | | - | | | | - | | | | - | | | | 154,171 | | | | - | | | | 154,171 | |
Other comprehensive loss | | | - | | | | - | | | | - | | | | - | | | | 726 | | | | - | | | | - | | | | 726 | | | | - | | | | 726 | |
Balances at December 31, 2017 | | $ | 1,777 | | | | 119,645 | | | $ | 43,941 | | | $ | 1,918,457 | | | $ | (128,228 | ) | | $ | (610,632 | ) | | | 38,550 | | | $ | 1,225,315 | | | $ | - | | | $ | 1,225,315 | |
Net loss | | | - | | | | - | | | | - | | | | (270,498 | ) | | | - | | | | - | | | | - | | | | (270,498 | ) | | | 103 | | | | (270,395 | ) |
Other comprehensive income | | | - | | | | - | | | | - | | | | - | | | | 33,003 | | | | - | | | | - | | | | 33,003 | | | | - | | | | 33,003 | |
Distribution of HPQ Co. to Sibelco | | | - | | | | (15,097 | ) | | | - | | | | - | | | | - | | | | (165,383 | ) | | | 15,097 | | | | (165,383 | ) | | | - | | | | (165,383 | ) |
Cash Redemption | | | - | | | | (18,528 | ) | | | - | | | | - | | | | - | | | | (520,377 | ) | | | 18,528 | | | | (520,377 | ) | | | - | | | | (520,377 | ) |
Consideration transferred for share-based awards | | | - | | | | - | | | | 40,414 | | | | - | | | | - | | | | - | | | | - | | | | 40,414 | | | | - | | | | 40,414 | |
Issuance of Covia common stock to Fairmount Santrol Holdings Inc. stockholders | | | - | | | | 45,044 | | | | 296,221 | | | | - | | | | - | | | | 807,026 | | | | (45,044 | ) | | | 1,103,247 | | | | - | | | | 1,103,247 | |
Share-based awards exercised or distributed | | | - | | | | 124 | | | | (761 | ) | | | - | | | | - | | | | 1,225 | | | | (124 | ) | | | 464 | | | | - | | | | 464 | |
Stock compensation expense | | | - | | | | - | | | | 8,212 | | | | - | | | | - | | | | - | | | | - | | | | 8,212 | | | | - | | | | 8,212 | |
Transactions with non-controlling interest | | | - | | | | - | | | | - | | | | - | | | | - | | | | - | | | | - | | | | - | | | | 453 | | | | 453 | |
Balances at December 31, 2018 | | $ | 1,777 | | | | 131,188 | | | $ | 388,027 | | | $ | 1,647,959 | | | $ | (95,225 | ) | | $ | (488,141 | ) | | | 27,007 | | | $ | 1,454,397 | | | $ | 556 | | | $ | 1,454,953 | |
Net loss | | | - | | | | - | | | | - | | | | (1,290,102 | ) | | | - | | | | - | | | | - | | | | (1,290,102 | ) | | | 123 | | | | (1,289,979 | ) |
Other comprehensive loss | | | - | | | | - | | | | - | | | | - | | | | (9,861 | ) | | | - | | | | - | | | | (9,861 | ) | | | - | | | | (9,861 | ) |
Share-based awards exercised or distributed | | | - | | | | 555 | | | | (10,017 | ) | | | - | | | | - | | | | 10,031 | | | | (555 | ) | | | 14 | | | | - | | | | 14 | |
Stock compensation expense | | | - | | | | - | | | | 10,028 | | | | - | | | | - | | | | - | | | | - | | | | 10,028 | | | | - | | | | 10,028 | |
Immaterial error | | | - | | | | - | | | | 12,009 | | | | - | | | | - | | | | - | | | | - | | | | 12,009 | | | | - | | | | 12,009 | |
Balances at December 31, 2019 | | $ | 1,777 | | | | 131,743 | | | $ | 400,047 | | | $ | 357,857 | | | $ | (105,086 | ) | | $ | (478,110 | ) | | | 26,452 | | | $ | 176,485 | | | $ | 679 | | | $ | 177,164 | |
The accompanying notes are an integral part of these consolidated financial statements.
89
Covia Holdings Corporation and Subsidiaries
Consolidated Statements of Cash Flows
Years Ended December 31, 2019, 2018, and 2017
| | Year Ended December 31, | |
| | 2019 | | | 2018 | | | 2017 | |
| | (in thousands) | |
Net income (loss) attributable to Covia Holdings Corporation | | $ | (1,290,102 | ) | | $ | (270,498 | ) | | $ | 154,171 | |
Adjustments to reconcile net loss to net cash provided by operating activities: | | | | | | | | | | | | |
Depreciation, depletion, and amortization | | | 222,042 | | | | 200,525 | | | | 112,705 | |
Amortization of deferred financing costs | | | 9,828 | | | | 3,489 | | | | - | |
Prepayment penalties on Senior Notes | | | - | | | | 2,213 | | | | - | |
Goodwill and other asset impairments | | | 1,430,166 | | | | 267,034 | | | | - | |
Inventory write-downs | | | 3,982 | | | | 6,744 | | | | - | |
(Gain) loss on disposal of fixed assets | | | (21 | ) | | | 107 | | | | - | |
Gain on sale of subsidiaries | | | (125,430 | ) | | | - | | | | - | |
Gain on extinguishment of debt | | | (13,411 | ) | | | - | | | | - | |
Change in fair value of interest rate swaps, net | | | - | | | | (296 | ) | | | - | |
Deferred income tax provision (benefit) | | | (268,345 | ) | | | (6,542 | ) | | | (47,215 | ) |
Stock compensation expense | | | 10,028 | | | | 8,212 | | | | - | |
Net income from non-controlling interest | | | 123 | | | | 103 | | | | - | |
Other, net | | | 15,659 | | | | 14,447 | | | | (1,308 | ) |
Change in operating assets and liabilities, net of business combination effect: | | | | | | | | | | | | |
Accounts receivable | | | 62,405 | | | | 105,850 | | | | (55,554 | ) |
Inventories | | | 33,607 | | | | 14,653 | | | | (7,383 | ) |
Prepaid expenses and other assets | | | 18,943 | | | | (6,067 | ) | | | 5,101 | |
Accounts payable | | | (24,458 | ) | | | (59,062 | ) | | | 32,405 | |
Accrued expenses | | | 18,898 | | | | (33,525 | ) | | | 39,285 | |
Net cash provided by operating activities | | | 103,914 | | | | 247,387 | | | | 232,207 | |
| | | | | | | | | | | | |
Cash flows from investing activities | | | | | | | | | | | | |
Capital expenditures | | | (87,535 | ) | | | (264,052 | ) | | | (108,854 | ) |
Cash of HPQ Co. distributed to Sibelco prior to Merger | | | - | | | | (31,000 | ) | | | - | |
Payments to Fairmount Santrol Holdings Inc. shareholders, net of cash acquired | | | - | | | | (64,697 | ) | | | - | |
Capitalized interest | | | (7,312 | ) | | | - | | | | - | |
Proceeds from sale of fixed assets | | | 11,025 | | | | 3,180 | | | | 695 | |
Proceeds from sale of subsidiaries | | | 232,249 | | | | - | | | | - | |
Other investing activities | | | - | | | | - | | | | 770 | |
Net cash provided by (used in) investing activities | | | 148,427 | | | | (356,569 | ) | | | (107,389 | ) |
| | | | | | | | | | | | |
Cash flows from financing activities | | | | | | | | | | | | |
Proceeds from borrowings on Term Loan | | | - | | | | 1,650,000 | | | | - | |
Payments on Term Loan | | | (12,375 | ) | | | (8,250 | ) | | | - | |
Repurchase of Term Loan | | | (48,335 | ) | | | - | | | | - | |
Fees for repurchase of Term Loan | | | (157 | ) | | | - | | | | - | |
Proceeds from borrowings on term debt | | | - | | | | - | | | | 49,642 | |
Payments on term debt | | | - | | | | - | | | | (103 | ) |
Prepayment on Unimin Term Loans | | | - | | | | (314,642 | ) | | | - | |
Prepayment on Senior Notes | | | - | | | | (100,000 | ) | | | - | |
Prepayment on Fairmount Santrol Holdings Inc. term loan | | | - | | | | (695,625 | ) | | | - | |
Fees for Term Loan and Senior Notes prepayment | | | - | | | | (36,733 | ) | | | - | |
Payments on other long-term debt | | | (1,664 | ) | | | (36,818 | ) | | | - | |
Payments on finance lease liabilities | | | (4,401 | ) | | | - | | | | - | |
Fees for Revolver | | | - | | | | (4,500 | ) | | | - | |
Cash Redemption payment to Sibelco | | | - | | | | (520,377 | ) | | | - | |
Proceeds from share-based awards exercised or distributed | | | 14 | | | | 464 | | | | - | |
Tax payments for withholdings on share-based awards exercised or distributed | | | (636 | ) | | | (318 | ) | | | - | |
Dividends paid | | | - | | | | - | | | | (50,000 | ) |
Net cash used in financing activities | | | (67,554 | ) | | | (66,799 | ) | | | (461 | ) |
| | | | | | | | | | | | |
Effect of foreign currency exchange rate changes | | | 567 | | | | 2,052 | | | | 341 | |
Increase (decrease) in cash and cash equivalents | | | 185,354 | | | | (173,929 | ) | | | 124,698 | |
| | | | | | | | | | | | |
Cash and cash equivalents [including cash of Discontinued Operations (Note 5)]: | | | | | | | | | | | | |
Beginning of period | | | 134,130 | | | | 308,059 | | | | 183,361 | |
End of period | | $ | 319,484 | | | $ | 134,130 | | | $ | 308,059 | |
| | | | | | | | | | | | |
Supplemental disclosure of cash flow information: | | | | | | | | | | | | |
Interest paid, net of capitalized interest | | $ | (77,601 | ) | | $ | (67,960 | ) | | $ | (17,360 | ) |
Income taxes (paid) refunded | | | 7,030 | | | | (15,532 | ) | | | (32,390 | ) |
Non-cash increase in asset retirement obligations | | | 13,785 | | | | - | | | | - | |
Non-cash investing activities: | | | | | | | | | | | | |
Capital expenditures and capitalized interest in accounts payable and accrued expenses | | | 2,491 | | | | 12,222 | | | | (3,063 | ) |
Right-of-use assets obtained in exchange for lease liabilities | | $ | 426,079 | | | $ | - | | | $ | - | |
The accompanying notes are an integral part of these consolidated financial statements.
90
Covia Holdings Corporation and Subsidiaries
Notes to Consolidated Financial Statements
Years Ended December 31, 2019, 2018, and 2017
Nature of Operations
Covia Holdings Corporation, including its consolidated subsidiaries (collectively, “we,” “us,” “our,” “Covia,” and “Company”), is a leading provider of diversified mineral-based and material solutions for the Industrial and Energy markets. We provide a wide range of specialized silica sand, nepheline syenite, feldspar, calcium carbonate, clay, and kaolin products for use in the glass, ceramics, coatings, foundry, polymers, construction, water filtration, sports and recreation, and oil and gas markets in North America and around the world. Our Industrial segment provides raw, value-added and custom-blended products to the glass, ceramics, metals, coatings, polymers, construction, foundry, filtration, sports and recreation and various other industries, primarily in North America. Our Energy segment offers the oil and gas industry a comprehensive portfolio of raw frac sand, value-added-proppants, well-cementing additives, gravel-packing media and drilling mud additives. Our products serve hydraulic fracturing operations in the U.S., Canada, Argentina, Mexico, China, and northern Europe.
The Merger
On June 1, 2018 (“Merger Date”), Unimin Corporation (“Unimin”) completed a business combination (“Merger”) whereby Fairmount Santrol Holdings Inc. (“Fairmount Santrol”) merged into a wholly-owned subsidiary of Unimin and ceased to exist as a separate corporate entity. Immediately following the consummation of the Merger, Unimin changed its name to Covia Holdings Corporation and began operating under that name. The common stock of Fairmount Santrol was delisted from the New York Stock Exchange (“NYSE”) prior to the market opening on June 1, 2018, and Covia commenced trading under the ticker symbol “CVIA” on that date. Upon the consummation of the Merger, the former stockholders of Fairmount Santrol (including holders of certain Fairmount Santrol equity awards) received, in the aggregate, $170.0 million in cash consideration and approximately 35% of the common stock of Covia. Approximately 65% of the outstanding shares of Covia common stock is owned by SCR-Sibelco NV (“Sibelco”), previously the parent company of Unimin. See Note 4 for further discussion of the Merger.
In connection with the Merger, we redeemed approximately 18.5 million shares of Unimin common stock from Sibelco in exchange for an amount in cash equal to approximately (i) $660.0 million plus interest accruing at 5.0% per annum for the period from September 30, 2017 through June 1, 2018 less (ii) $170.0 million in cash paid to Fairmount Santrol stockholders.
In connection with the Merger, we also completed a debt refinancing transaction, with Barclays Bank PLC as administrative agent, by entering into a $1.65 billion senior secured term loan (“Term Loan”) and a $200.0 million revolving credit facility (“Revolver”). The proceeds of the Term Loan were used to repay the indebtedness of Unimin and Fairmount Santrol and to pay the cash portion of the Merger consideration and expenses related to the Merger. In December 2019, we repurchased $62.9 million of the Term Loan and voluntarily canceled the Revolver, effective December 31, 2019. See Note 14 for further discussion of these transactions and terms of such indebtedness.
As a condition to the Merger, Unimin contributed certain of its assets comprising its global high purity quartz business (the “Electronics segment”), including $31.0 million of cash, to a newly-formed wholly-owned subsidiary of Unimin (“HPQ Co.”), in exchange for all of the stock of HPQ Co. and the assumption by HPQ Co. of certain liabilities. Unimin distributed all of the stock of HPQ Co. to Sibelco in exchange for 0.17 million shares (or 15.1 million shares subsequent to the stock split, see Note 7) of Unimin common stock held by Sibelco. See Note 5 for a discussion of HPQ Co. which is presented as discontinued operations in these consolidated financial statements.
Costs and expenses incurred related to the Merger are recorded in Other non-operating expense, net in the accompanying Consolidated Statements of Income (Loss) and include legal, accounting, valuation and financial advisory services, integration and other costs totaling $0.9 million, $51.1 million, and $19.3 million for the years ended December 31, 2019, 2018, and 2017, respectively.
Unimin was determined to be the acquirer in the Merger for accounting purposes, and the historical financial statements and certain historical amounts included in the Notes to the Consolidated Financial Statements relate to Unimin. The Consolidated Balance Sheet at December 31, 2018 reflects Covia. The presentation of information for periods prior to the Merger Date are not fully comparable to the presentation of information for periods presented after the Merger Date because the results of operations for Fairmount Santrol are not included in such information prior to the Merger Date.
91
Covia Holdings Corporation and Subsidiaries
Notes to Consolidated Financial Statements
Years Ended December 31, 2019, 2018, and 2017
Immaterial Error
In 2011, Unimin acquired the remaining 49% noncontrolling interest of a subsidiary within its resin-coated sand business. The difference between the consideration paid by Unimin to the noncontrolling interest holder and the adjustment to the carrying amount of the noncontrolling interest in the subsidiary was recognized directly in equity (e.g., additional paid-in capital). A corresponding deferred tax benefit for the resulting difference between the financial statement and income tax basis of the interest in the subsidiary of $12 million was not recorded at the time of the initial transaction.
In accordance with U.S. GAAP, management has quantitatively and qualitatively evaluated the materiality of the error and has determined that the misstatement was immaterial to the previously issued interim and annual financial statements. Accordingly, the adjustment was recorded prospectively in the Consolidated Statements of Income (Loss) in the fourth quarter of 2019 and in the Consolidated Balance Sheets as of December 31, 2019. The effect of correcting the error was not material to the 2019 financial statements. The adjustment resulted in an increase to additional paid-in capital of approximately $12.0 million, an increase in income tax expense in the Consolidated Statements of Income (Loss) of $4.4 million and an increase to Deferred tax assets, net of $7.6 million in the Consolidated Balance Sheets as of December 31, 2019. The adjustments also resulted in an increase to basic and diluted earnings per common share of $0.03 for 2019.
2. | Summary of Significant Accounting Policies |
Basis of Presentation and Principles of Consolidation
The accompanying consolidated financial statements have been prepared in accordance with GAAP and reflect all adjustments, consisting of normal recurring adjustments, which management believes are necessary to fairly present the Consolidated Balance Sheet as of December 31, 2019 and 2018, and the Consolidated Statements of Income (Loss), Comprehensive Income (Loss), Equity and Cash Flows for the years ended December 31, 2019, 2018 and 2017.
The accompanying consolidated financial statements comprise Covia Holdings Corporation and its wholly-owned and majority-owned subsidiaries. All significant intercompany balances and transactions have been eliminated in consolidation.
On June 1, 2018, following the Merger, we effected an 89:1 stock split with respect to our shares of common stock (the “Stock Split”). See Note 7 to these Consolidated Financial Statements for additional information regarding the Stock Split. Unless otherwise noted, impacted amounts and share information included in the consolidated financial statements and notes thereto have been retroactively adjusted for the stock split as if such stock split occurred on the first day of the first period presented. Certain amounts in the notes to the consolidated financial statements may be slightly different than previously reported due to rounding of fractional shares as a result of the Stock Split.
Use of Estimates
The preparation of financial statements in conformity with GAAP requires management to make estimates and assumptions that affect the reported amounts of assets and liabilities and disclosures of contingent assets and liabilities at the date of the financial statements and the reported amounts of revenue and expenses during the reporting period. The more significant areas requiring the use of management estimates and assumptions relate to: business combination purchase price allocation, the useful life of definite-lived intangible assets; future cash flow estimates utilized in impairment calculations; units-of-production amortization calculations; asset retirement obligations; estimates of allowance for doubtful accounts; estimates of fair value for reporting units and asset impairments (including impairments of goodwill and other long-lived assets); adjustments of inventories to net realizable value; post-employment, post-retirement and other employee benefit liabilities; valuation allowances for deferred tax assets; reserves for contingencies and litigation and the fair value of financial instruments, including derivative instruments. We base our estimates on historical experience and on various other assumptions that are believed to be reasonable under the circumstances, including the use of valuation experts. Accordingly, actual results may differ significantly from these estimates under different assumptions or conditions.
Reclassifications
Certain reclassifications of prior period presentations have been made to conform to the current period presentation, including deferred revenue.
92
Covia Holdings Corporation and Subsidiaries
Notes to Consolidated Financial Statements
Years Ended December 31, 2019, 2018, and 2017
Revenue Recognition
We primarily derive our revenues by mining, manufacturing, and processing minerals that our customers purchase for various uses. Revenues are primarily derived from contracts with customers with terms typically ranging from one to eight years in length, and are measured by the amount of consideration we expect to receive in exchange for transferring our products. The consideration we expect to receive is based on the volumes and price of the product per ton as defined in the underlying contract. The price per ton is based on the market value for similar products plus costs associated with transportation and transloading, as applicable. Depending on the contract, this may also be net of discounts and rebates. The transaction price is not adjusted for the effects of a significant financing component, as the time period between transfer of control of the goods and expected payment is one year or less. Sales, value-added, and other similar taxes collected are excluded from revenue.
Revenues are recognized as each performance obligation within the contract is satisfied. This occurs with the transfer of control of our product in accordance with delivery methods as defined in the underlying contract. Performance obligations do not extend beyond one year. Transfer of control to customers generally occurs when products leave our facilities or at other predetermined control transfer points. We account for shipping and handling activities that occur after control of the related good transfers as a cost of fulfillment instead of a separate performance obligation. Transportation costs to move product from our production facilities to our distribution terminals are borne by us and capitalized into inventory. These costs are included in cost of goods sold as the products are sold. Our contracts may include one or multiple distinct performance obligations. Revenues are assigned to each performance obligation based on its relative standalone selling price, which is generally the contractually-stated price.
Our products may be sold with rebates, discounts, take-or-pay provisions, or other features which are accounted for as variable consideration. Rebates and discounts are not material and have not been separately disclosed. Contracts that contain take-or-pay provisions obligate customers to pay shortfall payments if the required volumes, as defined in the contracts, are not purchased. Shortfall payments are recognized as revenues when the likelihood of the customer purchasing the minimum volume becomes remote, subject to renegotiation of the contract and collectability.
We enter into certain supply agreements with customers that include provisions requiring payment at the inception of the supply agreement. Deferred revenue is recorded when payment is received in advance of the performance obligation. See Note 13 for further detail.
We disaggregate revenues consistent with our segment reporting. See Note 26 for further detail.
Cash and Cash Equivalents
Cash and cash equivalents are comprised of cash as well as liquid investments with original maturities of three months or less. Our cash and cash equivalents are held on deposit and are available to us on demand without restriction, prior notice, or penalty. At December 31, 2019 and 2018, we had time deposits totaling $150.0 million and $60.0 million, respectively.
Accounts Receivable
Accounts receivable as presented in the consolidated balance sheets are related to our contracts and are recorded when the right to consideration becomes likely at the amount management expects to collect. Accounts receivable do not bear interest if paid when contractually due, and payments are generally due within thirty to forty-five days of invoicing. We typically do not record contract assets, as the transfer of control of our products results in an unconditional right to receive consideration.
Allowance for Doubtful Accounts
The collectability of all outstanding receivables is subject to review and evaluation by management. This review includes consideration for the risk profile of the customers, customer credit quality and certain indicators such as the aging of past-due amounts and general industry and economic conditions. If it is determined that a receivable balance will not likely be recovered, an allowance for such outstanding receivable balance is established.
Inventories
The cost of inventories is based on weighted average cost, and includes expenditures incurred in acquiring the inventories, production or conversion costs and other costs incurred in bringing inventories to their existing location and condition. In the case of finished goods and work-in-process, cost includes an appropriate share of production overhead. Consumables and regularly-replaced spare
93
Covia Holdings Corporation and Subsidiaries
Notes to Consolidated Financial Statements
Years Ended December 31, 2019, 2018, and 2017
parts are stated at cost, less any provision for obsolescence. Net realizable value is the estimated selling price in the ordinary course of business, less the estimated costs of completion and selling costs. Inventories are written down to net realizable value when the cost of the inventories exceeds that value.
Property, Plant, and Equipment
Property, plant and equipment are recorded at cost less accumulated depreciation, depletion and impairment losses (if any). Cost includes expenditures that are directly attributable to the acquisition of the asset. The cost of self-constructed assets includes the cost of materials and direct labor and other costs directly attributable to bringing the assets to a working condition for their intended use.
Gains and losses on disposal of property, plant and equipment are determined by comparing the proceeds from disposal with the carrying amount of property, plant and equipment, and are recognized within Other operating expense (income), net in the Consolidated Statements of Income (Loss).
Property, plant and equipment are depreciated on a straight-line basis over the estimated useful lives of the related assets from the date that they are installed and are ready for use, or with respect to internally constructed assets, from the date that the asset is completed and ready for use. Where components of a large item have different useful lives, they are accounted for as separate items of property, plant and equipment. The estimated service lives of property, plant and equipment are principally as follows:
Land improvements | | 2-35 years | |
Machinery and equipment | | 2-35 years | |
Buildings and improvements | | 12-50 years | |
Railroad equipment | | 3-40 years | |
Furniture, fixtures, and other | | 2-15 years | |
Depletion and amortization of mineral rights properties are recorded as the minerals are extracted, based on units of production and estimates of minable reserves.
Stripping costs are costs of removing overburden and waste materials to gain access to mineral reserves. Prior to the production phase of the mine, stripping costs are capitalized to mineral rights properties. The production phase of a mine is deemed to begin when saleable materials, beyond a de minimis amount, are produced. Stripping costs incurred during the production phase are variable production costs included in the costs of inventory, to be recognized in cost of sales in the same period as the sale of inventory. The determination of the production phase becomes complex when second and subsequent pits at multiple pit-mines are developed. The stripping costs of second and subsequent pits are expensed if they are determined to be part of the integrated operations of the first pit which is in the production phase. The stripping costs of second and subsequent pits in a mine are capitalized if the pits are not integrated operations and are separate and distinct areas within the mine. Capitalized stripping costs are amortized on a units of production method.
Assets under construction are stated at cost, which includes the cost of construction and other direct costs attributable to the construction. NaN provision for depreciation is made on assets under construction until such time as the relevant assets are completed and put into use. We capitalize interest costs incurred on funds used to construct property, plant, and equipment. The capitalized interest is recorded as part of the asset to which it relates and is amortized over the asset’s estimated useful life. Interest cost capitalized was $8.1 million and $8.6 million in 2019 and 2018, respectively. .
Deferred Financing Costs
We defer costs directly associated with acquiring third-party financing, primarily debt origination costs and related professional expenses. Deferred financing costs (“DFC”) are amortized over the term of the related debt obligations. DFC associated with the Term Loan are reflected as a direct reduction of the long-term debt and DFC associated with the Revolver are included in other assets on the Consolidated Balance Sheets. In connection with the repurchases of portions of the Term Loan and cancellation of the Revolver in December 2019, we wrote off $4.7 million of DFC that were previously capitalized. Refer to Note 14 Long Term Debt for additional information.
94
Covia Holdings Corporation and Subsidiaries
Notes to Consolidated Financial Statements
Years Ended December 31, 2019, 2018, and 2017
Amortization of DFC are included in interest expense. The following table presents DFC as of December 31, 2019 and 2018:
| | December 31, 2019 | | | December 31, 2018 | |
| | (in thousands) | |
Deferred financing costs | | $ | 33,788 | | | $ | 40,151 | |
Accumulated amortization | | | (8,034 | ) | | | (3,489 | ) |
Deferred financing costs, net | | $ | 25,754 | | | $ | 36,662 | |
Goodwill
Goodwill is reviewed for impairment annually as of October 31, or more frequently if events and circumstances indicate that the reporting unit to which goodwill has been allocated might be impaired. In testing goodwill for impairment, we have the option to perform a qualitative assessment to determine whether the existence of events or circumstances indicate that it is more-likely-than-not (more than 50%) that the fair value of a reporting unit is less than its carrying amount. When performing a qualitative assessment, we evaluate factors such as a sustained decrease in our share price, macroeconomic conditions, industry and market considerations, cost factors, overall financial performance, events affecting the reporting unit (e.g., the sale of all or a portion of the reporting unit), and other relevant entity-specific events. If the qualitative assessment indicates that it is more-likely-than-not that the fair value of the reporting unit is less than its carrying amount, or if we choose not to perform the qualitative assessment, then a quantitative assessment is performed to determine the reporting unit’s fair value. If the reporting unit’s carrying value exceeds its fair value, then an impairment loss is recognized for the amount of the excess of the carrying amount over the reporting unit’s fair value, not to exceed the total amount of goodwill allocated to the reporting unit.
The evaluation of goodwill for impairment includes estimating fair value using one or a combination of valuation techniques, such as discounted cash flows or comparable companies’ earnings multiples or transactions. These valuations require us to make estimates and assumptions regarding future operating results, cash flows, changes in working capital, future capital expenditures, selling prices, profitability, and the cost of capital. Although we believe our assumptions and estimates are reasonable, deviations from the assumptions and estimates could produce a materially different result. Refer to Note 11 for additional information.
Impairment of Long-Lived Assets
We periodically evaluate whether current events or circumstances indicate that the carrying value of our long-lived assets may not be recoverable. If such circumstances exist, an estimate of undiscounted future net cash flows produced by the asset group is compared to the carrying value of the asset group. If the carrying value of the asset group is greater than the undiscounted cash flows, we recognize an impairment loss equal to the amount by which the carrying value exceeds the fair value of the asset group. Factors we generally consider important in our evaluation and that could trigger a review of recoverability include expected operating trends, significant changes in the way assets are used, underutilization of our tangible assets, discontinuance of certain products by us or by our customers, and significant negative industry or economic trends.
The recoverability of the carrying value of our development stage mineral properties is dependent upon the successful development, start-up and commercial production of our mineral deposits and related processing facilities. Our evaluation of mineral properties for potential impairment primarily includes assessing the existence or availability of required permits and evaluating changes in our mineral reserves, or the underlying estimates and assumptions, including estimated production costs. Assessing the economic feasibility requires certain estimates, including the prices of products to be produced and processing recovery rates, as well as operating and capital costs. Refer to Note 6 for further information.
Earnings per Share
Basic and diluted earnings per share is presented for net income (loss) attributable to us. Basic earnings per share is computed by dividing income (loss) available to our common stockholders by the weighted-average number of outstanding common shares for the period. Diluted earnings per share is computed by increasing the weighted-average number of outstanding shares of common stock to include the additional shares of common stock that would be outstanding after exercise of outstanding stock options and restricted stock units calculated using the treasury stock method. Potential shares of common stock in the diluted earnings per share calculation are excluded to the extent that they would be anti-dilutive.
95
Covia Holdings Corporation and Subsidiaries
Notes to Consolidated Financial Statements
Years Ended December 31, 2019, 2018, and 2017
Prior to the Merger, we had no stock options, warrants, convertible securities, or other potentially dilutive financial instruments and, therefore, there is no difference in the number of basic weighted average shares outstanding and diluted weighted average shares outstanding.
Derivatives and Hedging Activities
Due to our variable-rate indebtedness, we are exposed to fluctuations in interest rates. We enter into interest rate swap agreements to partially hedge our variable interest rate risk. The derivative instruments are reported at fair value in accrued expenses and other non-current liabilities. Changes in the fair value of derivatives are recorded each period in accumulated other comprehensive loss. For derivatives not designated as hedges, the gain or loss is recognized in current earnings. No components of our hedging instruments were excluded from the assessment of hedge effectiveness.
Interest rate swaps designated as cash flow hedges involve the receipt of variable amounts from a counterparty in exchange for us making fixed-rate payments over the life of the agreements without exchange of the underlying notional value. The gain or loss on the interest rate swap is recorded in accumulated other comprehensive loss and subsequently reclassified into interest expense in the same period during which the hedged transaction affects earnings. See Note 16 for further information.
Foreign Currency Translation
The financial statements of subsidiaries with a functional currency other than the reporting currency are translated into U.S. dollars using month-end exchange rates for assets and liabilities and average monthly exchange rates for income and expenses. We record resulting translation adjustments in accumulated other comprehensive loss within stockholders’ equity. Foreign currency exchange gains or losses that arise from currency exchange rate changes on transactions denominated in currencies other than the functional currency are recorded in the Consolidated Statements of Income (Loss), as applicable.
Concentration of Labor
Approximately 35% of our labor force is covered under union agreements in the U.S., Canada, and Mexico. These agreements are renegotiated when their terms expire between 2020 and 2024.
Concentration of Credit Risk
At December 31, 2019, we had 0 customers whose accounts receivable balances exceeded 10% of total receivables. At December 31, 2018, we had 2 customers whose accounts receivable balance exceeded 10% of total receivables. These two customers each comprised approximately 10% of our accounts receivable balance at December 31, 2018.
Income Taxes
Deferred taxes are provided on the liability method whereby deferred tax assets are recognized for deductible temporary differences and operating loss and tax credit carry-forwards and deferred tax liabilities are recognized for taxable temporary differences. This approach requires recognition of deferred tax liabilities and assets for the expected future tax consequences of events that have been included in the financial statements or tax returns. Under this method, deferred tax liabilities and assets are determined based upon the difference between the financial statement and tax basis of assets and liabilities using enacted tax rates in effect for the year in which the expenses are expected to reverse. Valuation allowances are provided if, based on the weight of available evidence, it is more likely than not that some or all of the deferred tax assets will not be realized.
We recognize a tax benefit associated with an uncertain tax position when, in our judgment, it is more likely than not that the position will be sustained upon examination by a taxing authority. For a tax position that meets the more-likely-than-not recognition threshold, we initially and subsequently measure the tax benefit as the largest amount that we judge to have a greater than 50% likelihood of being realized upon ultimate settlement with a taxing authority. The liability associated with unrecognized tax benefits is adjusted periodically due to changing circumstances, such as the progress of tax audits, case law developments and new or emerging legislation. Such adjustments are recognized entirely in the period in which they are identified. The effective tax rate includes the net impact of changes in the liability for unrecognized tax benefits and subsequent adjustments as considered appropriate by management.
We evaluate quarterly the realizability of our deferred tax assets by assessing the need for a valuation allowance and by adjusting the amount of such allowance, if necessary. The factors used to assess the likelihood of realization are our forecast of future taxable income in the appropriate jurisdiction to utilize the asset, the reversal of taxable temporary differences, and available tax planning
96
Covia Holdings Corporation and Subsidiaries
Notes to Consolidated Financial Statements
Years Ended December 31, 2019, 2018, and 2017
strategies that could be implemented to realize the net deferred tax assets. Failure to achieve forecasted taxable income might affect the ultimate realization of the net deferred tax assets. Factors that may affect our ability to achieve sufficient forecasted taxable income include, but are not limited to, the following: a decline in sales or margins, increased competition or loss of market share.
In addition, we operate within multiple taxing jurisdictions and are subject to audit in these jurisdictions. These audits can involve complex issues, which may require an extended time to resolve. We believe that adequate provisions for income taxes have been made for all years.
Typically, the largest permanent item in computing both our effective rate and taxable income is the deduction for statutory depletion. The depletion deduction is dependent upon a mine-by-mine computation of both gross income from mining and taxable income.
The Tax Act subjects us to current tax on our GILTI. To the extent that tax expense is incurred under the GILTI provisions, it will be treated as a component of income tax expense in the period incurred.
Leases
We lease railcars, machinery, equipment, land, buildings and office space under operating lease arrangements. Certain mobile equipment leasing arrangements, subject to purchase options, are leased under finance lease arrangements.
We determine if an arrangement is or contains a lease at contract inception and exercise judgement and apply certain assumptions when determining the discount rate, lease term and lease payments. Generally, we do not have knowledge of the rate implicit in the lease and, therefore, in most cases we use the incremental borrowing rate for a lease. The incremental borrowing rate is determined based on lease term and the currency in which lease payments are made, adjusted for the impacts of collateral. The lease term includes the non-cancelable period of the lease plus any additional periods covered by an option to extend that we are reasonably certain to exercise, or an option to extend that is controlled by the lessor. Lease payments included in the measurement of the lease liability comprise fixed payments, and the exercise price of an option to purchase the underlying asset if we are reasonably certain to exercise the option.
For lease arrangements that include lease and non-lease components, we elected to use the practical expedient to combine lease and non-lease components for all classes of leased assets and have elected to apply the short-term lease exemption to all classes of leased assets. The short-term lease exemption allows for the non-recognition of right-of-use assets and lease liabilities for leases with a term of twelve months or less. Certain of our lease agreements include rental payments based on a percentage of usage and others include rental payments adjusted periodically based on an index, such as the Consumer Price Index. These payments are recorded as variable costs under operating leases.
All right-of-use assets are periodically reviewed for impairment losses and are included in our analysis of long-lived asset impairment. See Note 6 for further information.
Asset Retirement Obligation
We estimate the future cost of dismantling, restoring, and reclaiming operating excavation sites and related facilities in accordance with federal, state, and local regulatory requirements, as imposed by contract. We record the initial estimated present value of those costs as a liability in other non-current liabilities and increase the carrying amount of the related asset by a corresponding amount on the Consolidated Balance Sheets. The accretion of the liability is recorded as other operating expense (income), net and the related asset is classified as property, plant, and equipment and amortized over the estimated life of the mine or site. We adjust the related asset and liability for changes resulting from the passage of time and revisions to either the timing or amount of the original present value estimate. Future cost estimates are escalated for inflation and market risk premium, then discounted at the credit adjusted risk free rate. If the asset retirement obligation is settled for more or less than the carrying amount of the liability, a loss or gain will be recognized in the period the obligation is settled.
97
Covia Holdings Corporation and Subsidiaries
Notes to Consolidated Financial Statements
Years Ended December 31, 2019, 2018, and 2017
Accumulated Other Comprehensive Loss
Accumulated other comprehensive loss is a separate line within the Consolidated Statements of Equity that reports our cumulative income (loss) that has not been reported as part of net income (loss). The components of accumulated other comprehensive loss attributable to Covia Holdings Corporation at December 31, 2019 and 2018 were as follows:
| | December 31, 2019 | |
| | Gross | | | Tax Effect | | | Net Amount | |
| | (in thousands) | |
Foreign currency translation adjustments | | $ | (47,584 | ) | | $ | - | | | $ | (47,584 | ) |
Amounts related to employee benefit obligations | | | (54,650 | ) | | | 14,882 | | | | (39,768 | ) |
Unrealized gain (loss) on interest rate hedges | | | (22,500 | ) | | | 4,766 | | | | (17,734 | ) |
| | $ | (124,734 | ) | | $ | 19,648 | | | $ | (105,086 | ) |
| | December 31, 2018 | |
| | Gross | | | Tax Effect | | | Net Amount | |
| | (in thousands) | |
Foreign currency translation adjustments | | $ | (53,389 | ) | | $ | - | | | $ | (53,389 | ) |
Amounts related to employee benefit obligations | | | (52,496 | ) | | | 14,574 | | | | (37,922 | ) |
Unrealized gain (loss) on interest rate hedges | | | (5,083 | ) | | | 1,169 | | | | (3,914 | ) |
| | $ | (110,968 | ) | | $ | 15,743 | | | $ | (95,225 | ) |
The following tables presents the changes in accumulated other comprehensive loss by component for the year ended December 31, 2019 and 2018:
| | Year Ended December 31, 2019 | |
| | Foreign currency translation adjustments | | | Amounts related to employee benefit obligations | | | Unrealized gain (loss) on interest rate hedges | | | Total | |
| | (in thousands) | |
Beginning balance | | $ | (53,389 | ) | | $ | (37,922 | ) | | $ | (3,914 | ) | | $ | (95,225 | ) |
Other comprehensive income | | | | | | | | | | | | | | | | |
before reclassifications | | | 5,805 | | | | (7,266 | ) | | | (15,627 | ) | | | (17,088 | ) |
Amounts reclassified from | | | | | | | | | | | | | | | | |
accumulated other comprehensive loss | | | - | | | | 5,420 | | | | 1,807 | | | | 7,227 | |
Ending balance | | $ | (47,584 | ) | | $ | (39,768 | ) | | $ | (17,734 | ) | | $ | (105,086 | ) |
| | Year Ended December 31, 2018 | |
| | Foreign currency translation adjustments | | | Amounts related to employee benefit obligations | | | Unrealized gain (loss) on interest rate hedges | | | | | Total | |
| | (in thousands) | |
Beginning balance | | $ | (54,571 | ) | | $ | (73,657 | ) | | $ | - | | | | | $ | (128,228 | ) |
Other comprehensive income | | | | | | | | | | | | | | | | | | |
before reclassifications | | | 1,182 | | | | 31,829 | | | | (4,714 | ) | | | | | 28,297 | |
Amounts reclassified from accumulated | | | | | | | | | | | | | | | | | | |
other comprehensive loss | | | - | | | | 3,906 | | | | 800 | | | | | | 4,706 | |
Ending balance | | $ | (53,389 | ) | | $ | (37,922 | ) | | $ | (3,914 | ) | | | | $ | (95,225 | ) |
98
Covia Holdings Corporation and Subsidiaries
Notes to Consolidated Financial Statements
Years Ended December 31, 2019, 2018, and 2017
The following table presents the reclassifications out of accumulated other comprehensive loss during the years ended December 31, 2019, 2018, and 2017:
| | Amount reclassified | | | |
| | from accumulated | | | |
Year Ended December 31, 2019 | | other comprehensive | | | Affected line item on |
Details about accumulated other comprehensive loss | | loss | | | the statement of income (loss) |
Change in fair value of derivative swap agreements | | | | | | |
Interest rate hedging contracts | | $ | 2,277 | | | Interest expense, net |
Tax effect | | | (470 | ) | | Provision for income taxes |
| | $ | 1,807 | | | Net of tax |
Amortization of employee benefit obligations | | | | | | |
Prior service costs | | $ | 330 | | | Other non-operating expense, net |
Actuarial losses | | | 7,118 | | | Other non-operating expense, net |
Tax effect | | | (2,028 | ) | | Provision for income taxes |
| | | 5,420 | | | Net of tax |
Total reclassifications for the period | | $ | 7,227 | | | Net of tax |
| | Amount reclassified | | | |
| | from accumulated | | | |
Year Ended December 31, 2018 | | other comprehensive | | | Affected line item on |
Details about accumulated other comprehensive loss | | loss | | | the statement of income (loss) |
Change in fair value of derivative swap agreements | | | | | | |
Interest rate hedging contracts | | $ | 1,040 | | | Interest expense, net |
Tax effect | | | (240 | ) | | Provision for income taxes |
| | $ | 800 | | | Net of tax |
Amortization of employee benefit obligations | | | | | | |
Prior service costs | | $ | 1,675 | | | Other non-operating expense, net |
Actuarial losses | | | 3,606 | | | Other non-operating expense, net |
Tax effect | | | (1,375 | ) | | Provision for income taxes |
| | | 3,906 | | | Net of tax |
Total reclassifications for the period | | $ | 4,706 | | | Net of tax |
| | Amount reclassified | | | |
| | from accumulated | | | |
Year Ended December 31, 2017 | | other comprehensive | | | Affected line item on |
Details about accumulated other comprehensive loss | | loss | | | the statement of income (loss) |
Amortization of employee benefit obligations | | | | | | |
Prior service cost | | $ | 552 | | | Other non-operating expense, net |
Actuarial losses | | | 5,745 | | | Other non-operating expense, net |
Tax effect | | | (354 | ) | | Provision for income taxes |
Total reclassifications for the period | | $ | 5,943 | | | Net of tax |
3. | Recent Accounting Pronouncements |
Recently Adopted Accounting Pronouncements
On January 1, 2019, we adopted Accounting Standards Update (“ASU”) No. 2016-02 – Leases (Topic 842), which created ASC 842 and requires lessees to recognize a right-of-use asset and lease liability on their consolidated balance sheet related to the rights and obligations created by most leases, while continuing to recognize expense on their consolidated statements of income over the lease term.
We transitioned to ASC 842 using the option to apply the standard on its effective date, January 1, 2019, and elected the package of practical expedients permitted under the transition guidance. Utilizing the practical expedients, we did not reassess (i) whether any expired or existing contracts are or contain leases, (ii) the lease classification for any expired or existing leases, or (iii) initial direct costs for any existing leases.
99
Covia Holdings Corporation and Subsidiaries
Notes to Consolidated Financial Statements
Years Ended December 31, 2019, 2018, and 2017
The impact of the adoption of ASC 842 on the accompanying Consolidated Balance Sheets resulted in recording additional right-of-use assets and lease liabilities of approximately $442.1 million and $406.8 million, respectively, at January 1, 2019. The right-of-use assets at the date of adoption included approximately $36.5 million of lease intangible assets related to favorable market terms of certain railcar leases acquired in the Merger. Comparative periods presented reflect the former lease accounting guidance and the required comparative disclosures are included in Note 22. Also, see Note 6 for discussion of impairment of right-of-use assets during year ended December 31, 2019.
Recently Issued Accounting Pronouncements
In June 2016, the FASB issued ASU No. 2016-13 – Financial Instruments – Credit Losses (Topic 326) (“ASU 2016-13”). ASU 2016-13 replaces the incurred loss impairment methodology in current GAAP with a methodology that applies a forward-looking “expected loss” model to receivables, loans and other instruments. ASU 2016-13 is effective for fiscal years beginning after December 15, 2019, including interim periods within those fiscal years, and requires a modified retrospective approach. We are currently evaluating the impact of this new standard on our consolidated financial statements and disclosures however, we do not believe that the adoption of ASU 2016-13 will result in a material impact to our current methodology or our results of operations and financial condition.
In August 2018, the FASB issued ASU No. 2018-14 – Compensation – Retirement Benefits – Defined Benefit Plans – General (Subtopic 715-20): Disclosure Framework – Changes to the Disclosure Requirements for Defined Benefit Plans (“ASU 2018-14”). The amendments in ASU 2018-14 remove various disclosures that no longer are considered cost-beneficial, namely amounts in accumulated other comprehensive loss expected to be recognized as components of net periodic benefit cost over the next fiscal year. Further, ASU 2018-14 requires disclosure or clarification of the reasons for significant gains or losses related to changes in the benefit obligation for the period, as well as projected and accumulated benefit obligations in excess of plan assets. ASU 2018-14 is effective for fiscal years ending after December 15, 2020 and should be applied on a retrospective basis, with early adoption permitted. We are in the process of evaluating the impact of this new guidance on our consolidated financial statements and disclosures.
In December 2019, the FASB issued ASU No. 2019-12 – Income Taxes (Topic 740) – Simplifying the Accounting for Income Taxes (“ASU 2019-12”). The amendments in ASU 2019-12 simplify the accounting for income taxes by removing certain exceptions regarding the incremental approach for intra-period tax allocations, deferred tax liabilities for equity method investments, and general methodology calculations when a year-to-date loss exceeds the anticipated loss. Additionally, ASU 2019-12 further simplifies accounting for income taxes by requiring certain franchise taxes to be accounted for as income-based tax or non-income-based tax, requiring evaluation of the tax basis of goodwill in business combinations, specifying the requirements and elections for allocating consolidated current and deferred tax expense to legal entities separately not subject to tax and requiring reflection of the effect of an enacted change in tax laws or rates in the annual effective tax rate computation in the interim period that includes the enactment date. ASU 2019-12 is effective for fiscal years beginning after December 15, 2020, with early adoption permitted. The various amendments can be applied on a retrospective, modified retrospective, or prospective basis, depending on the amendment. We are in the process of evaluating the impact of this new guidance on our consolidated financial statements and disclosures.
4. | Merger and Purchase Accounting |
As previously noted, on June 1, 2018, Fairmount Santrol was merged into a subsidiary of Unimin, after which Fairmount Santrol ceased to exist as a separate corporate entity. Refer to Note 1 for additional information related to the Merger.
The Merger Date fair value of consideration transferred was $1.3 billion, which consisted of share-based awards, cash, and Covia common stock. The consideration transferred to Fairmount Santrol’s stockholders included cash of $170.0 million. The cash portion of the Merger consideration was funded with proceeds of the Term Loan, as well as cash on Unimin’s balance sheet. See Note 14 for additional information.
The operating results of Fairmount Santrol since the Merger Date are included in the consolidated financial statements. The Merger qualifies as a business combination and is accounted for using the acquisition method of accounting.
The estimates of fair values of the assets acquired and liabilities assumed were based on information available as of the Merger Date. During the third and fourth quarter of 2018, we refined certain underlying inputs and assumptions in our valuation models and finalized the purchase accounting fair value assessment as of December 31, 2018. The following table summarizes the purchase price accounting of the acquired assets and liabilities assumed as of June 1, 2018, including measurement period adjustments.
100
Covia Holdings Corporation and Subsidiaries
Notes to Consolidated Financial Statements
Years Ended December 31, 2019, 2018, and 2017
| | June 1, 2018 | |
| | (in thousands) | |
Cash and cash equivalents | | $ | 105,303 | |
Inventories, net | | | 108,005 | |
Accounts receivable | | | 159,373 | |
Property, plant, and equipment, net | | | 1,649,876 | |
Intangible assets, net | | | 136,222 | |
Prepaid expenses and other assets | | | 9,563 | |
Other non-current assets | | | 4,182 | |
Total identifiable assets acquired | | | 2,172,524 | |
Debt | | | 748,722 | |
Other current liabilities | | | 160,117 | |
Deferred tax liability | | | 199,627 | |
Other long-term liabilities | | | 45,169 | |
Total liabilities assumed | | | 1,153,635 | |
Net identifiable assets acquired | | | 1,018,889 | |
Non-controlling interest | | | 453 | |
Goodwill | | | 295,224 | |
Total consideration transferred | | $ | 1,313,660 | |
The fair values were based on management’s analysis, including work performed by third-party valuation specialists. Several significant assumptions and estimates were used in the application of valuation methods, including sales volumes and prices, royalty rates, production costs, tax rates, capital spending, discount rates, and working capital changes. Cash flow forecasts were generally based on Fairmount Santrol’s pre-Merger forecasts. Valuation methodologies used for the identifiable assets acquired and liabilities assumed utilize Level 1, Level 2, and Level 3 inputs including quoted prices in active markets and discounted cash flows using current interest rates.
Accounts receivable, other current liabilities, non-current assets and other long-term liabilities, excluding asset retirement obligations and contingent consideration included in other long-term liabilities, were valued at the existing carrying values as they represented the estimated fair value of those items at the Merger Date based on management’s judgement and estimates.
Raw material inventory was valued using the cost approach. The fair value of work-in-process inventory and finished goods inventory is a function of the estimated selling price less the sum of any cost to complete, costs of disposal, holding costs and a reasonable profit allowance.
The fair value of non-depletable land was determined using the market approach which arrives at an indication of value by comparing the land being valued to land recently acquired in arm’s-length transactions or land listings for similar uses. Building and site improvements were valued using the cost approach in which the value is established based on the cost of reproducing or replacing the asset, less depreciation from physical deterioration, functional obsolescence and economic obsolescence, if applicable. Personal property assets with an active and identifiable secondary market, such as mobile equipment were valued using the market approach. Other personal property assets, such as machinery and equipment, furniture and fixtures, leasehold improvements, laboratory equipment and computer software, were valued using the cost approach which is based on replacement or reproduction costs of the assets less depreciation from physical deterioration, functional obsolescence and economic obsolescence, if applicable. The fair value of the mineral reserves, which is included in property, plant, and equipment, net, were valued using the income approach which is predicated upon the value of the future cash flows that an asset will generate over its economic life.
The fair value of the customer relationship intangible assets was determined using the With and Without Method which is an income approach and considers the time needed to rebuild the customer base. The fair value of the railcar leasehold interest was determined using the discounted cash flow method which is an income approach. The fair value of the trade name and technology intangible assets was determined using the Relief from Royalty Method which is an income approach and is based on a search of comparable third party licensing agreements and internal discussions regarding the significance of the trade names and technology and the profitability of the associated revenue streams.
101
Covia Holdings Corporation and Subsidiaries
Notes to Consolidated Financial Statements
Years Ended December 31, 2019, 2018, and 2017
The fair value of the acquired intangible assets and the related estimated useful lives at the Merger Date were the following:
| | Approximate | | | |
| | Fair Value | | | Estimated |
| | (in thousands) | | | Useful Life |
Customer relationships | | $ | 73,000 | | | 6 years |
Railcar leasehold interests | | | 40,914 | | | 1-15 years |
Trade name | | | 17,000 | | | 1 year |
Technology | | | 5,000 | | | 12 years |
Other | | | 308 | | | 95 years |
Total approximate fair value | | $ | 136,222 | | | |
Goodwill is calculated as the excess of the purchase price over the fair value of net identifiable assets acquired. Goodwill represents the future economic benefits arising from other assets acquired that could not be individually identified and separately recognized. Goodwill of $78.1 million and $217.1 million allocated to the Industrial and Energy reporting units respectively, is attributable to the earnings potential of Fairmount Santrol’s product and plant portfolio, anticipated synergies, the assembled workforce of Fairmount Santrol, and other benefits that we believed would result from the Merger. During the third quarter of 2018 it was determined the goodwill allocated to the Energy reporting unit was impaired and was written off in its entirety. Refer to Note 6 and Note 11 for additional information. NaN of the goodwill was deductible for income tax purposes.
The carrying value of the debt approximated the fair value of the debt at June 1, 2018.
The deferred tax liability relates to the tax effect of fair value adjustments of the assets and liabilities acquired, including mineral reserves, property, plant and equipment and intangible assets.
Asset retirement obligations are included in other long-term liabilities in the table of fair values noted above. The related asset is included in Property, plant, and equipment, net in the table of fair values noted above. The asset retirement obligations assumed and related assets acquired in connection with the Merger were adjusted to reflect revised estimates of the future cost of dismantling, restoring, and reclaiming of certain sites and related facilities as of the Merger Date.
Included in other long-term liabilities is $9.5 million for a pre-acquisition contingent consideration arrangement in the form of earnout payments, related to the purchase of the Propel SSP® technology. We entered into an amendment to the SSP purchase agreement on June 1, 2018. Based on information and estimates at the time, we estimated the fair value of contingent consideration to be approximately $9.5 million. Subsequent to the Merger Date, changes in projected cash flows were revised downward based on post-Merger decline in the market conditions for the Energy segment and a customer supply agreement that was not renewed at December 31, 2018. These revisions gave rise to a reduction of the contingent consideration liability of approximately $5.0 million, which is recorded as income in Other operating expense (income), net in the Consolidated Statements of Income (Loss). The earnout payments are based on a fixed percentage of sales of Propel SSP® and other products incorporating the Propel SSP® technology for thirty years commencing on June 1, 2018. The amendment eliminated the threshold payments of $195 million which were previously required in order for us to retain 100% ownership of the technology. It also provides for the non-exclusive right to license the technology at a negotiated rate. The fair value of the earnout was determined using a scenario-based method due to the linear nature of the consideration payments. The assets related to Propel SSP® self-suspending proppant were impaired in September 2019. Refer to Note 6 for additional information.
We assumed the outstanding stock-based equity awards, including time-vesting restricted stock units (“RSUs”), performance-vesting restricted stock units (“PSUs”), and nonqualified stock options (“Options” and, together with the RSUs and PSUs, the “Award(s)”), of Fairmount Santrol at the Merger Date. Each outstanding Award of Fairmount Santrol was converted to a Covia award with similar terms and conditions at the exchange ratio of 5:1. We recorded $40.4 million of Merger consideration for the value of Awards earned prior to the Merger Date. The remaining value represents post-Merger compensation expense of $10.4 million, which will be recognized over the remaining vesting period of the Awards. In addition, at June 1, 2018, we recorded $2.4 million of expense for Awards whose vesting was accelerated upon a change in control and certain other terms pursuant to the Merger agreement and therefore considered a Merger related expense and recorded in Other non-operating expense, net in the accompanying Consolidated Statements of Income (Loss). Refer to Note 19 for additional information.
102
Covia Holdings Corporation and Subsidiaries
Notes to Consolidated Financial Statements
Years Ended December 31, 2019, 2018, and 2017
We have not separately disclosed the revenue and earnings of Fairmount Santrol from the Merger Date through December 31, 2018. Due to the integration of Fairmount Santrol’s operations and customer contracts into the Covia supply chain network and customer contracts, it is impracticable to provide a reasonable estimate of these revenue and earnings.
Pro Forma Condensed Combined Financial Information (Unaudited)
The following unaudited pro forma condensed combined financial information presents our combined results as if the Merger had occurred on January 1, 2017. The unaudited pro forma financial information was prepared to give effect to events that are (i) directly attributable to the Merger; (ii) factually supportable; and (iii) expected to have a continuing impact on our results. All material intercompany transactions during the periods presented have been eliminated. These pro forma results include adjustments for interest expense that would have been incurred to finance the transaction and reflect purchase accounting adjustments for additional depreciation, depletion and amortization on acquired property, plant and equipment and intangible assets. The pro forma results exclude Merger related transaction costs and expenses that were incurred in conjunction with the Merger in the years ended December 31, 2018 and 2017:
| | Year Ended December 31, | |
| | 2018 | | | 2017 | |
| | (in thousands, except per share data) | |
Revenues | | $ | 2,320,269 | | | $ | 2,254,907 | |
Net income | | | (185,497 | ) | | | 143,785 | |
Earnings (loss) per share – basic | | $ | (1.48 | ) | | $ | 1.20 | |
Earnings (loss) per share – diluted | | $ | (1.48 | ) | | | 1.20 | |
The unaudited pro-forma condensed combined financial information is presented for information purposes only and is not intended to represent or to be indicative of the combined results of operations or financial position that would have been reported had the Merger been completed as of the date and for the period presented, and should not be taken as representative of our consolidated results of operations or financial condition following the Merger. In addition, the unaudited pro-forma condensed combined financial information is not intended to project our future financial position or results of operations.
5. | Discontinued Operations |
On May 31, 2018, prior to, and as a condition to the closing of the Merger, Unimin transferred assets and liabilities of its Electronics segment to HPQ Co., a newly formed wholly-owned subsidiary of Unimin, in exchange for all of the stock of HPQ Co. and the assumption by HPQ Co. of certain liabilities and, thereafter, distributed all of the stock of HPQ Co. to Sibelco in exchange for 0.17 million shares (or 15.1 million shares subsequent to the stock split) of Unimin common stock held by Sibelco.
The transaction was between entities under common control and therefore the Unimin common stock received from Sibelco was recorded at the carrying value of the net assets transferred at May 31, 2018, in the amount of $165.4 million, in Treasury stock within Equity. The transfer of all of the stock of HPQ Co. to Sibelco was a tax-free transaction.
The disposition of HPQ Co. qualified as discontinued operations, as it represented a significant strategic shift of our operations and financial results. In addition, the operations and cash flows of HPQ Co. could be distinguished, operationally and for financial reporting purposes, from the rest of our operations.
103
Covia Holdings Corporation and Subsidiaries
Notes to Consolidated Financial Statements
Years Ended December 31, 2019, 2018, and 2017
The operating results of our discontinued operations up to the Merger Date are as follows:
| | Year Ended December 31, | |
| | 2018 | | | 2017 | |
| | (in thousands) | |
Major line items constituting income from discontinued operations | | | | | | | | |
Revenues | | $ | 74,015 | | | $ | 149,375 | |
Cost of goods sold (excluding depreciation, depletion, | | | | | | | | |
and amortization shown separately) | | | 46,442 | | | | 99,974 | |
Selling, general and administrative expenses | | | 8,762 | | | | 14,519 | |
Depreciation, depletion and amortization expense | | | 4,072 | | | | 11,145 | |
Other operating income | | | (69 | ) | | | (155 | ) |
Income from discontinued operations before provision for income taxes | | | 14,808 | | | | 23,892 | |
Provision for income taxes | | | 2,221 | | | | 608 | |
Income from discontinued operations, net of tax | | $ | 12,587 | | | $ | 23,284 | |
The significant operating and investing cash and noncash items of the discontinued operations included in the Consolidated Statements of Cash Flows for the years ended December 31, 2018 and 2017 were as follows:
| | Year Ended December 31, | |
| | 2018 | | | 2017 | |
| | (in thousands) | |
Depreciation, depletion and amortization expense | | $ | 4,072 | | | $ | 11,145 | |
Capital expenditures | | $ | 3,549 | | | $ | 2,559 | |
6. | Goodwill and Other Asset Impairments |
Throughout 2019, our Energy segment was impacted by new sources of supply and sequentially slower proppant demand, resulting in a surplus of proppant and significantly lower proppant pricing. In response to changing market demands, we idled operations at certain mines, terminals and resin-coating facilities, rationalized our railcar fleet and reduced production capacity and total production at certain of our Northern White sand plants.
We recorded the following impairments in the years ended December 31, 2019 and 2018, all of which were related to assets within our Energy segment. We did not incur impairment charges during 2017. These impairment charges are classified as Goodwill and other asset impairments in the Consolidated Statements of Income (Loss):
| | 2019 | | | 2018 | |
Description | | (in thousands) | |
Propel SSP® technology | | $ | 7,761 | | | $ | - | |
Long-lived asset impairment | | | 1,411,366 | | | | - | |
Idled facilities and railcars | | | 11,039 | | | | 37,653 | |
Spare parts | | | 3,982 | | | | - | |
Assets under construction | | | - | | | | 12,300 | |
Goodwill impairment | | | - | | | | 217,081 | |
Total | | $ | 1,434,148 | | | $ | 267,034 | |
2019
In response to the reduced consumption of certain value-added proppants, in September 2019 we discontinued sales and marketing efforts related to our Propel SSP® self-suspending proppant and recorded a total net impairment charge of $7.7 million to write-off equipment used in the production of Propel SSP® and intangible assets related to the acquired technology. These charges were offset by the reversal of the contingent consideration liability for future earnout payments related to the purchase of the Propel SSP® technology that are no longer required. Refer to Note 4 for additional information on the Propel SSP® self-suspending proppant.
104
Covia Holdings Corporation and Subsidiaries
Notes to Consolidated Financial Statements
Years Ended December 31, 2019, 2018, and 2017
We also reviewed the recoverability of our long-lived asset groups and, based upon our assessments, we determined the carrying amount of certain long-lived asset groups within the Energy segment exceeded their respective fair values. In the fourth quarter of 2019, we recorded a total impairment charge of $1.4 billion, which was allocated to the long-lived assets in the asset groups based on the relative carrying amounts of those assets. We determined the fair value of our long-lived asset groups based on the present value of the future cash flows that the underlying assets are expected to generate. Such estimates included unobservable inputs that required significant judgement.
Due to the impact of slower proppant demand, surplus of proppant and significantly lower proppant pricing, we idled certain of our mining and processing facilities and transitioned excess railcars to storage. Equipment at the idled facilities that was not redeployed to our active sites was determined to no longer be useful to us. We recorded an impairment charge of $2.8 million to adjust the useful life of the equipment to the estimated salvage value of the equipment. We lease most of our railcars under operating leases and recorded an impairment charge of $4.3 million to write-down the related right-of-use asset for those railcars we do not expect to use during their remaining lease terms.
During the fourth quarter of 2019, we evaluated our asset retirement obligations and increased our estimated future obligations at certain facilities. We recorded an impairment charge in the amount of $3.9 million for the related retirement asset costs at our idled locations.
We evaluated our spare parts inventory at our idled facilities and recorded an impairment charge of $4.0 million for spare parts that could not be redeployed to alternative sites.
2018
In the second quarter of 2018, we wrote down $12.3 million of assets under construction related to a facility expansion that was terminated. The write down reflects the cost of assets that could not be used or transferred to other facilities.
Due to the idling of certain facilities in the Energy segment, we stopped using certain long-lived assets and therefore were considered abandoned assets. We recorded an expense of $37.6 million in the fourth quarter of 2018 to adjust the carrying amount of these long-lived assets to their salvage value.
The decline in market conditions during 2018 within our Energy reporting unit combined with the decline in our share price, triggered testing for goodwill impairment at September 30, 2018 and December 31, 2018 using unobservable inputs that required significant judgement. The tests were performed using a combination of the discounted cash flow forecast methodology and using a peer-based, risk adjusted weighted average cost of capital and the market multiples approach. Upon completion of the tests, the entire amount of goodwill in the Energy reporting unit was determined to be impaired and an impairment charge in the amount of $217.1 million was recorded. The goodwill attributed to the Industrial reporting unit was determined to not be impaired for any of the testing periods.
Prior to the consummation of the Merger, Unimin redeemed 0.17 million shares (or 15.1 million shares subsequent to the stock split) of common stock from Sibelco in connection with the disposition of HPQ Co. Additionally, Unimin redeemed 0.21 million shares (or 18.5 million shares subsequent to the stock split) of common stock from Sibelco in exchange for a payment of $520.4 million to Sibelco (the “Cash Redemption”). The Cash Redemption was financed with the proceeds of the Term Loan and cash on hand. On June 1, 2018, following the Merger, we effected an 89:1 stock split with respect to our shares of common stock and, in connection therewith, amended and restated our certificate of incorporation to increase our authorized capital stock to 750.0 million shares of common stock and 15.0 million shares of preferred stock and decreased our par value per share from $1.00 to $0.01.
As a result of the Merger, Fairmount Santrol stockholders received 45.0 million shares of Covia common stock, which were issued out of Covia treasury stock.
105
Covia Holdings Corporation and Subsidiaries
Notes to Consolidated Financial Statements
Years Ended December 31, 2019, 2018, and 2017
At December 31, 2019 and 2018, inventories consisted of the following:
| | December 31, 2019 | | | December 31, 2018 | |
| | (in thousands) | |
Raw materials | | $ | 44,218 | | | $ | 30,410 | |
Work-in-process | | | 2,809 | | | | 19,886 | |
Finished goods | | | 42,766 | | | | 73,628 | |
Spare parts | | | 31,997 | | | | 39,046 | |
Inventories, net | | $ | 121,790 | | | $ | 162,970 | |
As a result of the Merger, we recorded approximately $38.4 million of fair value adjustments in inventory, which included approximately $7.6 million of spare parts. Of this amount, approximately $28.3 million was recorded in costs of goods sold, based on inventory turnover, during the year ended December 31, 2018. We recorded approximately $1.1 million of inventory adjustments through Cost of goods sold in the Consolidated Statements of Income (Loss) in 2019.
In the third quarter of 2018, we recorded the write-down of inventories at four idled facilities in the amount of $6.7 million. The expense is recorded in Cost of goods sold in the Consolidated Statements of Income (Loss). All of the idled facilities are within the Energy segment. In the fourth quarter of 2019, we recorded a $3.9 million write-down of spare parts inventory. The expense is recorded in Goodwill and other asset impairments in the Consolidated Statements of income (Loss). Refer to Note 6 additional information.
9. | Property, Plant, and Equipment, net |
At December 31, 2019 and 2018, property, plant, and equipment consisted of the following:
| | December 31, 2019 | | | December 31, 2018 | |
| | (in thousands) | |
Land and improvements | | $ | 230,300 | | | $ | 224,894 | |
Mineral rights properties | | | 677,238 | | | | 1,323,090 | |
Machinery and equipment | | | 1,338,411 | | | | 1,607,116 | |
Buildings and improvements | | | 327,314 | | | | 544,117 | |
Railroad equipment | | | 59,761 | | | | 155,998 | |
Furniture, fixtures, and other | | | 5,382 | | | | 5,260 | |
Assets under construction | | | 103,715 | | | | 184,360 | |
| | | 2,742,121 | | | | 4,044,835 | |
Accumulated depletion and depreciation | | | (1,322,139 | ) | | | (1,210,474 | ) |
Property, plant, and equipment, net | | $ | 1,419,982 | | | $ | 2,834,361 | |
Finance right-of-use assets are classified as machinery and equipment. The amortization of finance right-of-use assets is recorded in depreciation, depletion, and amortization expenses in the Consolidated Statements of Income (Loss). Their cost and related accumulated amortization in the balance sheet are as follows:
| | December 31, 2019 | | | December 31, 2018 | |
| | (in thousands) | |
Cost | | $ | 13,963 | | | $ | 19,215 | |
Accumulated depreciation | | | (2,880 | ) | | | (2,245 | ) |
Net carrying value | | $ | 11,083 | | | $ | 16,970 | |
Depreciation, depletion and amortization expense of property, plant, and equipment was $200.6 million, $171.7 million, and $98.8 million in the years ended December 31, 2019, 2018, and 2017, respectively.
We recorded impairment charges of $1.2 billion and $50.0 million related to property, plant and equipment during the years ended December 31, 2019 and 2018, respectively. Refer to Note 6 for a further discussion of asset impairments.
106
Covia Holdings Corporation and Subsidiaries
Notes to Consolidated Financial Statements
Years Ended December 31, 2019, 2018, and 2017
10. | Gain on Sale of Subsidiaries |
On August 1, 2019, we completed the sale of our former Calera, Alabama lime processing facility (“Calera”). Calera was a non-core asset included within our Industrial segment. On September 10, 2019, we completed the sale of our former Winchester & Western Railroad (“W&W Railroad”). The W&W Railroad was a non-core asset that was included in our Industrial segment.
The following is a summary of our significant disposition activity:
| | Calera | | | W&W Railroad | |
| | (in thousands) | |
Carrying value of major assets and liabilities | | | | | | | | |
Current assets | | $ | 10,674 | | | $ | 1,132 | |
Property, plant and equipment, net | | | 24,006 | | | | 61,957 | |
Goodwill | | | 8,623 | | | | 3,210 | |
Intangibles, net | | | 17,953 | | | | - | |
Current liabilities | | | 5,393 | | | | 848 | |
Non-current liabilities | | $ | - | | | $ | 14,495 | |
| | | | | | | | |
| | Year Ended | |
| | December 31, 2019 | |
| | Calera | | | W&W Railroad | |
| | (in thousands) | |
Net proceeds from dispositions | | $ | 130,481 | | | $ | 101,768 | |
Gain on sale of subsidiaries | | $ | 74,618 | | | $ | 50,812 | |
11. | Goodwill and Intangible Assets |
As of December 31, 2019 and 2018, goodwill was $119.8 million and $131.7 million, respectively, and the activity within those years is as follows:
| | Industrial | | | Energy | | | Total | |
| | (in thousands) | |
Balances at December 31, 2017 | | $ | 53,512 | | | $ | - | | | $ | 53,512 | |
Acquisitions | | | 78,143 | | | | 217,081 | | | | 295,224 | |
Impairment | | | - | | | | (217,081 | ) | | | (217,081 | ) |
Balances at December 31, 2018 | | | 131,655 | | | | - | | | | 131,655 | |
Dispositions | | | (11,833 | ) | | | - | | | | (11,833 | ) |
Balances at December 31, 2019 | | $ | 119,822 | | | $ | - | | | $ | 119,822 | |
The reported amounts of goodwill for each reporting unit are assessed for impairment on an annual basis and also on an interim basis when indicators of impairment exist. As a result of our goodwill impairment assessments performed in the year ended December 31, 2018, we determined the fair value of the Energy reporting unit was less than its carrying value, and a goodwill impairment charge of $217.1 million was recorded. The goodwill attributable to the Industrial reporting unit was determined to not be impaired in 2018. Refer to Note 6 for further discussion of goodwill and other asset impairments. The sustained decline in our share price and the disposition of Calera and the W&W Railroad triggered an assessment of goodwill impairment at August 31, 2019. Upon completion of the August 31, 2019 assessment, we determined the goodwill attributable to the Industrial reporting unit was not impaired. We evaluated goodwill again at October 31, 2019, our annual impairment assessment date, and at December 31, 2019, and determined the goodwill of the Industrial reporting unit was not impaired.
107
Covia Holdings Corporation and Subsidiaries
Notes to Consolidated Financial Statements
Years Ended December 31, 2019, 2018, and 2017
Intangible assets, net includes the following:
| | December 31, 2019 |
| | Gross Carrying Amount | | | Accumulated Amortization | | | Impairment | | | Intangible Assets, net | | | Weighted Average Amortization Period |
| | (in thousands) | | | |
Stream mitigation rights | | $ | 4,170 | | | $ | (971 | ) | | $ | (1,842 | ) | | $ | 1,357 | | | 17 years |
Customer relationships | | | 73,000 | | | | (19,264 | ) | | | (21,463 | ) | | | 32,273 | | | 4 years |
Intangible assets, net | | $ | 77,170 | | | $ | (20,235 | ) | | $ | (23,305 | ) | | $ | 33,630 | | | 5 years |
| | December 31, 2018 |
| | Gross Carrying Amount | | | Accumulated Amortization | | | Intangible Assets, net | | | Weighted Average Amortization Period |
| | (in thousands) | | | |
Supply agreements | | $ | 48,026 | | | $ | (28,598 | ) | | $ | 19,428 | | | 8 years |
Stream mitigation rights | | | 4,170 | | | | (781 | ) | | | 3,389 | | | 18 years |
Customer relationships | | | 73,000 | | | | (7,097 | ) | | | 65,903 | | | 5 years |
Railcar leasehold interests | | | 41,222 | | | | (4,669 | ) | | | 36,553 | | | 7 years |
Trade names | | | 17,000 | | | | (9,917 | ) | | | 7,083 | | | 1 year |
Technology | | | 5,000 | | | | (243 | ) | | | 4,757 | | | 11 years |
Intangible assets, net | | $ | 188,418 | | | $ | (51,305 | ) | | $ | 137,113 | | | 7 years |
Refer also to Note 4, which includes a discussion of the intangible assets acquired in the Merger included in the balance of Intangibles, net at December 31, 2018.
For the year ended December 2019, we recorded impairment charges of $4.5 million related to the Propel SSP® technology and $23.3 million of impairment charges allocated to intangible assets resulting from the impairment assessment of our long-lived asset groups. See Note 6 for further detail. Customer supply agreements related to the disposition of Calera were $17.9 million. Refer to Note 10 for information on the sale of Calera. Additionally, $36.5 million of railcar leasehold interest intangible assets were reclassified to right-of-use assets as a result of the adoption of ASC 842. See Note 3 for further detail.
Amortization expense is recognized in Depreciation, depletion, and amortization expense in the Consolidated Statements of Income (Loss). Amortization expense of intangible assets was $21.4 million, $24.7 million, and $2.9 million in years ended December 31, 2019, 2018, and 2017, respectively.
Estimated future amortization expense related to intangible assets at December 31, 2019 is as follows:
| | Amortization | |
| | (in thousands) | |
2020 | | $ | 7,388 | |
2021 | | | 7,388 | |
2022 | | | 7,388 | |
2023 | | | 7,388 | |
2024 | | | 3,125 | |
Thereafter | | | 953 | |
Total | | $ | 33,630 | |
108
Covia Holdings Corporation and Subsidiaries
Notes to Consolidated Financial Statements
Years Ended December 31, 2019, 2018, and 2017
At December 31, 2019 and 2018, accrued expenses consisted of the following:
| | December 31, 2019 | | | December 31, 2018 | |
| | (in thousands) | |
Accrued bonus & other benefits | | $ | 9,220 | | | $ | 38,445 | |
Accrued Merger related costs | | | - | | | | 502 | |
Accrued restructuring and other charges | | | 8,212 | | | | 15,819 | |
Accrued interest | | | 24,480 | | | | 1,047 | |
Accrued insurance | | | 8,770 | | | | 7,026 | |
Accrued property taxes | | | 11,741 | | | | 9,120 | |
Accrual for capital spending | | | - | | | | 19,289 | |
Other accrued expenses | | | 64,472 | | | | 29,176 | |
Accrued expenses | | $ | 126,895 | | | $ | 120,424 | |
Changes in deferred revenue were as follows:
| | Year Ended December 31, | |
| | 2019 | | | 2018 | |
| | (in thousands) | |
Beginning balance | | $ | 10,826 | | | $ | - | |
Deferral of revenue | | | 23,370 | | | | 12,349 | |
Adjustments for future orders | | | (6,660 | ) | | | - | |
Recognition of unearned revenue | | | (14,342 | ) | | | (1,523 | ) |
Ending balance | | $ | 13,194 | | | $ | 10,826 | |
At December 31, 2019 and 2018, deferred revenue balances of $7.8 million and $9.7 million, respectively, were recorded as current liabilities. At December 31, 2019 and 2018, deferred revenue balances of $5.4 million and $1.1 million, respectively, were recorded in other non-current liabilities.
At December 31, 2019 and 2018, long-term debt consisted of the following:
| | December 31, 2019 | | | December 31, 2018 | |
| | (in thousands) | |
Term Loan | | $ | 1,566,440 | | | $ | 1,641,750 | |
Finance lease liabilities | | | 6,875 | | | | 6,417 | |
Industrial Revenue Bond | | | 10,000 | | | | 10,000 | |
Other borrowings | | | 145 | | | | 1,809 | |
Term Loan deferred financing costs, net | | | (25,754 | ) | | | (31,607 | ) |
| | | 1,557,706 | | | | 1,628,369 | |
Less: current portion | | | (18,633 | ) | | | (15,482 | ) |
Long-term debt including finance leases | | $ | 1,539,073 | | | $ | 1,612,887 | |
Term Loan
On the Merger Date, we entered into the $1.65 billion Term Loan to repay certain indebtedness of each of Fairmount Santrol and Unimin and to pay the cash portion of the Merger consideration and transaction costs related to the Merger. The Term Loan was issued at par with a maturity date of June 1, 2025. The Term Loan requires quarterly principal payments of $4.1 million, reduced to $4.0 million after the December 2019 repurchases, and quarterly interest payments through March 31, 2025 with the balance payable at the maturity date. Interest accrues at the rate of the three-month LIBOR plus 325 to 400 basis points depending on Total Net
109
Covia Holdings Corporation and Subsidiaries
Notes to Consolidated Financial Statements
Years Ended December 31, 2019, 2018, and 2017
Leverage (as hereinafter defined) with a LIBOR floor of 1.0% or the Base Rate (as hereinafter defined). Total Net Leverage is defined as total debt (net of up to $150.0 million of non-restricted cash), divided by EBITDA. The Term Loan is guaranteed by all of our wholly-owned, material, domestic, restricted subsidiaries (including Bison Merger Sub, LLC, as successor to Fairmount Santrol, and all of the wholly-owned material restricted subsidiaries of Fairmount Santrol), subject to certain exceptions. In addition, subject to various exceptions, the Term Loan is secured by substantially all of our assets and those of each guarantor, including, but not limited to (a) a perfected first-priority pledge of all of the capital stock held by us or any guarantor of each existing or subsequently acquired or organized wholly-owned restricted subsidiary (no more than 65% of the voting stock of any foreign subsidiary) and (b) perfected first priority security interests in substantially all of our tangible and intangible assets and those of each guarantor. The Term Loan is not guaranteed by certain foreign subsidiaries, including our Mexican and Canadian subsidiaries. We have the option to prepay the Term Loan without premium or penalty other than customary breakage costs with respect to LIBOR borrowings. There are no financial covenants governing the Term Loan. The Term Loan places certain restrictions on our ability to pay dividends on our common stock.
At December 31, 2019 and 2018, the Term Loan had an interest rate of 6.0% and 6.6%, respectively.
In December 2019, we repurchased $62.9 million of outstanding debt on the Term Loan at a weighted average of 76.8% of par value for cash of $48.5 million. The transactions resulted in a $13.4 million gain on extinguishment of debt calculated as follows:
| | December 2019 Repurchases | |
| | (in thousands) | |
Term Loan carrying amount repurchased | | $ | 62,935 | |
Less: Unamortized DFC | | | 1,032 | |
Term Loan carrying amount, net | | | 61,903 | |
Cost to repurchase | | | 48,335 | |
Transaction fees | | | 157 | |
Reacquisition price | | | 48,492 | |
Gain on extinguishment of debt | | $ | 13,411 | |
Revolver
On the Merger Date, we entered into the Revolver. There were 0 borrowings under the Revolver at December 31, 2019 and 2018. We voluntarily cancelled the Revolver, effective December 31, 2019, in connection with receiving a commitment from PNC Bank, National Association, for a new, three-year credit facility for up to $75 million. The new facility is expected to bear interest of LIBOR plus 1.75% and be secured by our U.S. accounts receivable.
As a result of the cancellation of the Revolver, we wrote off $3.7 million of DFC that were previously capitalized. This amount is included in interest expense, net on the Consolidated Statements of Income (Loss) in the year ended December 31, 2019.
Industrial Revenue Bond
We hold a $10.0 million Industrial Revenue Bond related to the construction of a mining facility in Wisconsin. The bond bears interest, which is payable monthly at a variable rate. The rate was 1.78% and 1.75% at December 31, 2019 and 2018, respectively. The bond matures on September 1, 2027 and is collateralized by a letter of credit of $10.0 million.
Other Borrowings
Other borrowings at December 31, 2019 and 2018 were comprised of a promissory note with three unrelated third parties that Unimin entered into on January 17, 2011. Two of these unrelated parties received interest rates of 1.0% and 4.11%, respectively, at both December 31, 2019 and 2018. The third unrelated party was repaid with proceeds from the sale of the W&W Railroad and did not require any interest payments.
One of our subsidiaries has a C$2.0 million Canadian dollar overdraft facility with the Bank of Montreal. We have guaranteed the obligations of the subsidiary under the overdraft facility. As of December 31, 2019 and 2018, there were 0 borrowings outstanding under the overdraft facility. The rates of the overdraft facility were 4.95% at December 31, 2019 and 2018.
110
Covia Holdings Corporation and Subsidiaries
Notes to Consolidated Financial Statements
Years Ended December 31, 2019, 2018, and 2017
At December 31, 2019 and 2018, we had $11.3 million and $1.9 million, respectively, of outstanding standby letters of credit held outside of a credit facility.
Maturities of long-term debt are as follows:
| | Finance Lease Liabilities | | | | | | | | | |
| | Lease Payment | | | Less Interest | | | Present Value | | | Long-Term Debt | | | Aggregate Maturities of Debt | |
| | (in thousands) | |
Year Ended: | | | | | | | | | | | | | | | | | | | | |
2020 | | $ | 3,713 | | | $ | 217 | | | $ | 3,496 | | | $ | 19,906 | | | $ | 23,402 | |
2021 | | | 1,879 | | | | 115 | | | | 1,764 | | | | 15,931 | | | | 17,695 | |
2022 | | | 1,161 | | | | 47 | | | | 1,114 | | | | 15,863 | | | | 16,977 | |
2023 | | | 434 | | | | 14 | | | | 420 | | | | 15,863 | | | | 16,283 | |
2024 | | | 81 | | | | - | | | | 81 | | | | 15,863 | | | | 15,944 | |
Thereafter | | | - | | | | - | | | | - | | | | 1,493,159 | | | | 1,493,159 | |
Subtotal | | | 7,268 | | | | 393 | | | | 6,875 | | | | 1,576,585 | | | | 1,583,460 | |
Less: unamortized discount | | | - | | | | - | | | | - | | | | (25,754 | ) | | | (25,754 | ) |
Total | | $ | 7,268 | | | $ | 393 | | | $ | 6,875 | | | $ | 1,550,831 | | | $ | 1,557,706 | |
15. | Earnings (Loss) per Share |
The table below shows the computation of basic and diluted earnings (loss) per share for the years ended December 31, 2019, 2018, and 2017, respectively:
| | Year Ended December 31, | |
| | 2019 | | | 2018 | | | 2017 | |
| | (in thousands, except per share data) | |
Numerators: | | | | | | | | | | | | |
Net income (loss) from continuing operations attributable to Covia Holdings Corporation | | $ | (1,290,102 | ) | | $ | (283,085 | ) | | $ | 130,887 | |
Income from discontinued operations, net of tax | | | - | | | | 12,587 | | | | 23,284 | |
Net income (loss) attributable to Covia Holdings Corporation | | $ | (1,290,102 | ) | | $ | (270,498 | ) | | $ | 154,171 | |
Denominator: | | | | | | | | | | | | |
Basic weighted average shares outstanding | | | 131,512 | | | | 125,514 | | | | 119,645 | |
Dilutive effect of employee stock options and RSUs | | | - | | | | - | | | | - | |
Diluted weighted average shares outstanding | | | 131,512 | | | | 125,514 | | | | 119,645 | |
| | | | | | | | | | | | |
Continuing operations earnings (loss) per share – basic | | $ | (9.81 | ) | | $ | (2.26 | ) | | $ | 1.09 | |
Continuing operations earnings (loss) per share – diluted | | | (9.81 | ) | | | (2.26 | ) | | | 1.09 | |
| | | | | | | | | | | | |
Discontinued operations earnings per share – basic | | | - | | | | 0.10 | | | | 0.20 | |
Discontinued operations earnings per share – diluted | | | - | | | | 0.10 | | | | 0.20 | |
| | | | | | | | | | | | |
Earnings (loss) per share – basic | | | (9.81 | ) | | | (2.16 | ) | | | 1.29 | |
Earnings (loss) per share – diluted | | $ | (9.81 | ) | | $ | (2.16 | ) | | $ | 1.29 | |
We effected an 89:1 stock split in June 2018. The stock split is reflected in the calculations of basic and diluted weight average shares outstanding for all periods presented.
The calculation of diluted weighted average shares outstanding for 2019 and 2018 excludes 4.2 million and 1.3 million potential shares of common stock, respectively. These potential shares of common stock are excluded from the calculations of diluted weighted average shares outstanding because the effect of including these potential shares of common stock would be antidilutive.
The dilutive effect of 0.4 million and 0.2 million shares in 2019 and 2018, respectively, was omitted from the calculation of diluted weighted average shares outstanding and diluted earnings per share because we were in a loss position in those periods.
111
Covia Holdings Corporation and Subsidiaries
Notes to Consolidated Financial Statements
Years Ended December 31, 2019, 2018, and 2017
16. | Derivative Instruments |
Due to our variable-rate indebtedness, we are exposed to fluctuations in interest rates. We enter into interest rate swap agreements as a means to partially hedge our variable interest rate risk. Changes in the fair value of derivatives are recorded each period in other comprehensive income (loss). For derivatives not designated as hedges, the gain or loss is recognized in current earnings. No components of our hedging instruments were excluded from the assessment of hedge effectiveness.
Interest rate swaps involve the receipt of variable amounts from a counterparty in exchange for us making fixed-rate payments over the life of the agreements without exchange of the underlying notional value. The gain or loss on the interest rate swap is recorded in accumulated other comprehensive loss and subsequently reclassified into interest expense in the same period during which the hedged transaction affects earnings. On June 1, 2018, we entered into 2 interest rate swap agreements and, on December 20, 2018, we entered into 3 additional interest rate swap agreements as a means to partially hedge our variable interest rate risk on the Term Loan. An additional interest rate swap held by Fairmount Santrol was assumed in conjunction with the Merger. The following table summarizes our interest rate swap agreements at December 31, 2019 and 2018:
Interest Rate Swap Agreements | | Maturity Date | | Rate | | | Notional Value (in thousands) | | | Debt Instrument Hedged | | Percentage of Term Loan Outstanding | |
December 31, 2019 | | | | | | | | | | | | | | | | |
Designated as cash flow hedge | | June 1, 2023 | | 2.81% | | | $ | 100,000 | | | Term Loan | | 6% | |
Designated as cash flow hedge | | June 1, 2025 | | 2.87% | | | | 200,000 | | | Term Loan | | 13% | |
Designated as cash flow hedge | | June 1, 2024 | | 2.81% | | | | 50,000 | | | Term Loan | | 3% | |
Designated as cash flow hedge | | June 1, 2025 | | 2.85% | | | | 50,000 | | | Term Loan | | 3% | |
Designated as cash flow hedge | | June 1, 2025 | | 2.87% | | | | 50,000 | | | Term Loan | | 3% | |
| | | | | | | | $ | 450,000 | | | | | 28% | |
| | | | | | | | | | | | | | | | |
December 31, 2018 | | | | | | | | | | | | | | | | |
Designated as cash flow hedge | | June 1, 2023 | | 2.81% | | | $ | 100,000 | | | Term Loan | | 6% | |
Designated as cash flow hedge | | June 1, 2025 | | 2.87% | | | | 200,000 | | | Term Loan | | 12% | |
Designated as cash flow hedge | | September 5, 2019 | | 2.92% | | | | 210,000 | | | Term Loan | | 13% | |
Not designated as cash flow hedge | | June 1, 2024 | | 2.81% | | | | 50,000 | | | Term Loan | | 3% | |
Not designated as cash flow hedge | | June 1, 2025 | | 2.85% | | | | 50,000 | | | Term Loan | | 3% | |
Not designated as cash flow hedge | | June 1, 2025 | | 2.87% | | | | 50,000 | | | Term Loan | | 3% | |
| | | | | | | | $ | 660,000 | | | | | 40% | |
At the Merger Date, our existing interest rate swaps qualified, but were not designated for hedge accounting until August 1, 2018. The interest rate swaps entered into in December 2018 qualified, but were not designated for hedge accounting until January 2019. Changes in the fair value of the undesignated interest rate swaps were included in interest expense in the related period. Amounts reported in accumulated other comprehensive loss related to interest rate swaps will be reclassified to interest expense as interest payments are made on the Term Loan. We expect $5.3 million to be reclassified from accumulated other comprehensive loss into interest expense within the next twelve months.
The following table summarizes the fair values and the respective classification in the Consolidated Balance Sheets as of December 31, 2019 and 2018. The net amount of derivative liabilities can be reconciled to the tabular disclosure of fair value in Note 17:
| | | | Liabilities | |
| | | | December 31, 2019 | | | December 31, 2018 | |
Interest Rate Swap Agreements | | Balance Sheet Classification | | (in thousands) | |
Designated as cash flow hedges | | Other non-current liabilities | | $ | (13,420 | ) | | $ | (2,846 | ) |
Designated as cash flow hedges | | Accrued expenses | | | (7,827 | ) | | | - | |
Not designated as cash flow hedges | | Other non-current liabilities | | | - | | | | (1,271 | ) |
| | | | $ | (21,247 | ) | | $ | (4,117 | ) |
112
Covia Holdings Corporation and Subsidiaries
Notes to Consolidated Financial Statements
Years Ended December 31, 2019, 2018, and 2017
The tables below present the effect of cash flow hedge accounting on accumulated other comprehensive loss as of December 31, 2019, 2018, and 2017:
| | Amount of (Gain) Loss Recognized in Other Comprehensive Income | |
| | Year Ended December 31, | |
| | 2019 | | | 2018 | | | 2017 | |
Derivatives in Hedging Relationships | | (in thousands) | |
Designated as Cash Flow Hedges | | | | | | | | | | | | |
Interest rate swap agreements | | $ | 19,694 | | | $ | 6,124 | | | $ | - | |
| | | | Amount of Loss Reclassified from Accumulated Other Comprehensive Loss | |
| | Location of Loss | | Year Ended December 31, | |
Derivatives in | | Recognized on | | 2019 | | | 2018 | | | 2017 | |
Hedging Relationships | | Derivative | | (in thousands) | |
Designated as Cash Flow Hedges | | | | | | | | | | | | | | |
Interest rate swap agreements | | Interest expense, net | | $ | 2,277 | | | $ | 1,040 | | | $ | - | |
The table below presents the effect of our derivative financial instruments on the Consolidated Statements of Income (Loss) in the years ended December 31, 2019, 2018, and 2017, respectively:
| | Location of Loss on Derivative | |
| | Interest expense, net | |
| | Year Ended December 31, | |
| | 2019 | | | 2018 | | | 2017 | |
| | (in thousands) | |
Total Interest Expense presented in the Statements of | | | | | | | | | | | | |
Income (Loss) in which the effects of cash flow hedges are recorded | | $ | 107,891 | | | $ | 60,322 | | | $ | 14,653 | |
Effects of cash flow hedging: | | | | | | | | | | | | |
Loss on Hedging Relationships | | | | | | | | | | | | |
Interest rate swap agreements | | | | | | | | | | | | |
Amount of loss reclassified | | | | | | | | | | | | |
from accumulated other comprehensive | | | | | | | | | | | | |
loss to earnings | | $ | 2,277 | | | $ | 1,040 | | | $ | - | |
The table below presents the effect of our derivative financial instruments that were not designated as hedging instruments in the years ended December 31, 2019, 2018, and 2017, respectively:
Derivatives Not Designated | | | | Year Ended December 31, | |
as ASC 815-20 Cash Flow | | | | 2019 | | | 2018 | | | 2017 | |
Hedging Relationships | | Location of (Gain) Loss Recognized | | (in thousands) | |
Interest rate swap agreements | | Interest expense, net | | $ | - | | | $ | 1,336 | | | $ | - | |
17. | Fair Value Measurements |
Financial instruments held by us include cash equivalents, accounts receivable, accounts payable, long-term debt (including the current portion thereof) and interest rate swaps. Previously, we were also obligated for contingent consideration for our Propel SSP® self-suspending proppant that was subject to fair value measurement. The contingent consideration liability was written off in the third quarter of 2019 and was recorded in goodwill and other asset impairments on the Consolidated Statements of Income (Loss). See Note 6 for further detail.
Fair value is defined as the price that would be received to sell an asset, or paid to transfer a liability, in an orderly transaction between market participants at the measurement date. In determining fair value, we utilize certain assumptions that market participants would use in pricing the asset or liability, including assumptions about risk and/or the risks inherent in the inputs to the valuation technique.
113
Covia Holdings Corporation and Subsidiaries
Notes to Consolidated Financial Statements
Years Ended December 31, 2019, 2018, and 2017
Based on the examination of the inputs used in the valuation techniques, we are required to provide the following information according to the fair value hierarchy. The fair value hierarchy ranks the quality and reliability of the information used to determine fair values. Financial assets and liabilities at fair value will be classified and disclosed in one of the following three categories:
| |
Level 1 | Quoted market prices in active markets for identical assets or liabilities |
Level 2 | Observable market based inputs or unobservable inputs that are corroborated by market data |
Level 3 | Unobservable inputs that are not corroborated by market data |
A financial instrument’s categorization within the valuation hierarchy is based upon the lowest level of input that is significant to the fair value measurement.
The carrying value of cash equivalents, accounts receivable and accounts payable are considered to be representative of their fair values because of their short maturities. The carrying value of our long-term debt (including the current portion thereof) is recognized at amortized cost. The fair value of the Term Loan differs from amortized cost and is valued at prices obtained from a readily-available source for trading non-public debt, which represents quoted prices for identical or similar assets in markets that are not active, and therefore is considered Level 2. See Note 14 for further details on our long-term debt. The following table presents the fair value as of December 31, 2019 and 2018, respectively, for our long-term debt:
| | Quoted Prices | | | Other | | | | | | | | | |
| | in Active | | | Observable | | | Unobservable | | | | | |
| | Markets | | | Inputs | | | Inputs | | | | | |
| | (Level 1) | | | (Level 2) | | | (Level 3) | | | Total | |
Long-Term Debt Fair Value Measurements | | (in thousands) | |
December 31, 2019 | | | | | | | | | | | | | | | | |
Term Loan | | $ | - | | | $ | 1,210,075 | | | $ | - | | | $ | 1,210,075 | |
Industrial Revenue Bond | | | - | | | | 10,000 | | | | - | | | | 10,000 | |
| | $ | - | | | $ | 1,220,075 | | | $ | - | | | $ | 1,220,075 | |
| | | | | | | | | | | | | | | | |
December 31, 2018 | | | | | | | | | | | | | | | | |
Term Loan | | $ | - | | | $ | 1,182,060 | | | $ | - | | | $ | 1,182,060 | |
Industrial Revenue Bond | | | - | | | | 10,000 | | | | - | | | | 10,000 | |
| | $ | - | | | $ | 1,192,060 | | | $ | - | | | $ | 1,192,060 | |
The following table presents the amounts carried at fair value as of December 31, 2019 and 2018 for our other financial instruments.
| | Quoted Prices | | | Other | | | | | | | | | |
| | in Active | | | Observable | | | Unobservable | | | | | |
| | Markets | | | Inputs | | | Inputs | | | | | |
| | (Level 1) | | | (Level 2) | | | (Level 3) | | | Total | |
Recurring Fair Value Measurements | | (in thousands) | |
December 31, 2019 | | | | | | | | | | | | | | | | |
Interest rate swap agreements liability | | $ | - | | | $ | 21,247 | | | $ | - | | | $ | 21,247 | |
| | | | | | | | | | | | | | | | |
December 31, 2018 | | | | | | | | | | | | | | | | |
Interest rate swap agreements liability | | $ | - | | | $ | 4,117 | | | $ | - | | | $ | 4,117 | |
Contingent consideration liability | | | | | | | | | | | 4,500 | | | | 4,500 | |
| | $ | - | | | $ | 4,117 | | | $ | 4,500 | | | $ | 8,617 | |
Fair value of interest rate swap agreements is based on the present value of the expected future cash flows, considering the risks involved, and using discount rates appropriate for the maturity date. These are determined using Level 2 inputs. Refer to Note 16 for additional information.
114
Covia Holdings Corporation and Subsidiaries
Notes to Consolidated Financial Statements
Years Ended December 31, 2019, 2018, and 2017
The contingent consideration at December 31, 2018 was considered a Level 3 liability in the form of earn-out payments related to our Propel SSP® self-suspending proppant that we acquired in the Merger.
Income (loss) before provision (benefit) for income taxes includes the following components:
| | 2019 | | | 2018 | | | 2017 | |
Domestic operations | | $ | (1,587,976 | ) | | $ | (329,229 | ) | | $ | 74,547 | |
Foreign operations | | | 53,863 | | | | 50,234 | | | | 47,515 | |
Income (loss) from continuing operations before provision (benefit) for income taxes | | $ | (1,534,113 | ) | | $ | (278,995 | ) | | $ | 122,062 | |
The components of the provision (benefit) for income taxes are as follows:
| | 2019 | | | 2018 | | | 2017 | |
Current: | | | | | | | | | | | | |
Federal | | $ | (6,432 | ) | | $ | (6,549 | ) | | $ | 16,512 | |
State | | | (1,158 | ) | | | 959 | | | | 922 | |
Foreign | | | 20,051 | | | | 16,119 | | | | 15,857 | |
Total current taxes | | | 12,461 | | | | 10,529 | | | | 33,291 | |
Deferred: | | | | | | | | | | | | |
Federal | | | (241,925 | ) | | | (3,754 | ) | | | (40,804 | ) |
State | | | (10,277 | ) | | | (938 | ) | | | 1,072 | |
Foreign | | | (4,393 | ) | | | (1,850 | ) | | | (2,384 | ) |
Total deferred taxes | | | (256,595 | ) | | | (6,542 | ) | | | (42,116 | ) |
Provision (benefit) for income taxes | | $ | (244,134 | ) | | $ | 3,987 | | | $ | (8,825 | ) |
Income tax provision (benefit) differs from the amount that would result from apply the statutory federal income tax rate to our effective tax rate is as follows:
| | 2019 | | | 2018 | | | 2017 | |
Income tax provision (benefit) at U.S. statutory tax rate | | $ | (322,164 | ) | | $ | (58,589 | ) | | $ | 42,721 | |
Effect of tax rate in foreign jurisdictions | | | 3,666 | | | | 3,476 | | | | (3,140 | ) |
Nondeductible expenses | | | 4,298 | | | | 687 | | | | 142 | |
U.S. statutory depletion | | | (12,124 | ) | | | (7,618 | ) | | | (8,306 | ) |
Production activity deduction | | | - | | | | 1,417 | | | | (2,621 | ) |
Provision to return adjustments | | | (2,580 | ) | | | 1,029 | | | | (310 | ) |
State taxes | | | (23,269 | ) | | | (2,615 | ) | | | 1,146 | |
Other foreign taxes | | | 97 | | | | 1,442 | | | | 1,900 | |
Transition tax | | | - | | | | - | | | | 2,923 | |
Change in valuation allowance | | | 87,919 | | | | 13,414 | | | | - | |
Foreign provisions of the Tax Act | | | 2,510 | | | | 2,831 | | | | - | |
Deferred remeasurement | | | - | | | | - | | | | (42,180 | ) |
Nondeductible transaction costs | | | - | | | | 2,566 | | | | - | |
Goodwill impairment | | | - | | | | 45,741 | | | | - | |
Write-off of foreign capital loss | | | 14,459 | | | | - | | | | - | |
Other | | | 3,054 | | | | 206 | | | | (1,100 | ) |
Provision (benefit) for income taxes | | $ | (244,134 | ) | | $ | 3,987 | | | $ | (8,825 | ) |
The difference between the statutory U.S. tax rate of 21% and our 2019 effective tax rate of 15.9% is primarily due to adjustments to our valuation allowance on deferred taxes.
The Tax Act established a corporate income tax rate of 21%, replacing the 35% rate and created a territorial tax system rather than a worldwide system. The transition to a territorial system included a one-time transition tax on certain unremitted foreign earnings. The
115
Covia Holdings Corporation and Subsidiaries
Notes to Consolidated Financial Statements
Years Ended December 31, 2019, 2018, and 2017
Tax Act generally eliminated the U.S. federal income tax on dividends from foreign subsidiaries but included new provisions for the taxation of GILTI. The Tax Act also included new provisions limiting the deductibility of interest expense.
We applied the guidance in Staff Accounting Bulletin 118 when accounting for the enactment-date effects of the Tax Act in 2017 and throughout 2018. We completed our accounting of the Tax Act during 2018.
The effective rate differs from the U.S. federal statutory rate primarily due to depletion, the impact of foreign taxes, tax provisions requiring U.S. income inclusion of foreign income, and changes to a valuation allowance set up on deferred taxes.
Significant components of deferred tax assets and liabilities as of December 31, 2019 and 2018 are as follows:
| | 2019 | | | 2018 | |
Deferred tax assets: | | | | | | | | |
Tax credits | | $ | 16,402 | | | $ | 22,985 | |
Intangible assets | | | 23,376 | | | | - | |
Inventories | | | 3,191 | | | | 4,001 | |
Interest | | | 44,690 | | | | 20,359 | |
Accrued expenses | | | 11,061 | | | | 11,780 | |
Pension | | | 14,985 | | | | 12,892 | |
Stock compensation | | | 7,236 | | | | 10,199 | |
Other items | | | 2,988 | | | | 3,286 | |
Net operating loss carryforward | | | 92,505 | | | | 96,745 | |
Total deferred tax assets | | | 216,434 | | | | 182,247 | |
Valuation allowance | | | (140,118 | ) | | | (52,199 | ) |
Net deferred tax assets | | | 76,316 | | | | 130,048 | |
Deferred tax liabilities: | | | | | | | | |
Plant, property, equipment, and mineral reserves | | | (61,335 | ) | | | (385,800 | ) |
Intangible assets | | | - | | | | (614 | ) |
Reclamation | | | (1,387 | ) | | | (1,558 | ) |
Other items | | | - | | | | (686 | ) |
Total deferred tax liabilities | | | (62,722 | ) | | | (388,658 | ) |
Net deferred tax assets (liabilities) | | $ | 13,594 | | | $ | (258,610 | ) |
At December 31, 2019, we had $78.2 million of federal net operating loss carryforwards. Of these losses, $29.5 million expire in 2036 and $48.7 million have no expiration. Of these losses, $29.5 million were acquired as part of the Merger and are subject to IRC Section 382, which could limit annual utilization of the loss carryforward. These losses will expire in 2036 if not utilized. At December 31, 2019, we had $12.7 million of state net operating loss carryforwards. The majority of these losses expire between 2029 and 2039. At December 31, 2019, we had $1.6 million of foreign net operating loss carryforwards. These losses expire between 2021 and 2029.
At December 31, 2019, we had $2.8 million of alternative minimum tax credit carryforwards. These credits will be utilized or refunded before 2022. At December 31, 2019, we had $0.9 million of research and development tax credit carryforwards. These credits expire between 2034 and 2038. At December 31, 2019, we had $12.8 million of foreign tax credit carryforwards. These credits expire between 2021 and 2025.
A valuation allowance is set up on deferred tax assets estimated as not realizable. Valuation allowances set up on deferred taxes were $140.1 million for the year ending December 31, 2019, representing an increase of $87.9 million from the year ending December 31, 2018. The increase in the valuation allowance for the year ended December 31, 2019 was primarily due to the assessment of realizability of deferred tax assets resulting from consideration of the impact of the asset impairment.
The amount of undistributed earnings and profits of foreign subsidiaries as of December 31, 2019 is approximately $150.4 million. For subsidiaries in foreign jurisdictions where earnings are not permanently reinvested, an income and withholding tax liability of approximately $0.4 million has been recorded for the year ending December 31, 2019. For subsidiaries in foreign jurisdictions where earnings are permanently reinvested, 0 income and withholding tax liability is recorded. An estimate of the income and withholding tax liability were these earnings distributed is approximately $5.7 million as of December 31, 2019.
116
Covia Holdings Corporation and Subsidiaries
Notes to Consolidated Financial Statements
Years Ended December 31, 2019, 2018, and 2017
A reconciliation of the beginning and ending amount of unrecognized tax benefits is as follows:
| | 2019 | | | 2018 | | | 2017 | |
Unrecognized tax benefits balance at January 1 | | $ | 3,914 | | | $ | 1,460 | | | $ | 1,460 | |
Unrecognized tax benefits acquired in Merger | | | - | | | | 2,364 | | | | - | |
Increases (decreases) for tax positions in prior years | | | (1,549 | ) | | | (179 | ) | | | 164 | |
Increases (decreases) for tax positions in current year | | | 1,177 | | | | 269 | | | | (164 | ) |
Unrecognized tax benefits balance at December 31 | | $ | 3,542 | | | $ | 3,914 | | | $ | 1,460 | |
At December 31, 2019 and 2018, the Company had $3.5 million and $3.9 million, respectively, of unrecognized tax benefits. If $3.5 million were recognized, $2.8 million would affect the effective tax rate. The total amount of interest and penalties recognized in the Consolidated Statements of Income (Loss) for the years ended December 31, 2019 and 2018 was $0.1 million. Interest and penalties are included as a component of tax expense. At December 31, 2019 and 2018, the Company had $1.8 million and $1.7 million, respectively, of accrued interest and penalties related to unrecognized tax benefits recorded.
We file income tax returns in the United States, Canada, China, Mexico, and Denmark. The years 2017 through 2019 are open for examination for U.S. federal purposes. Generally, for our remaining state and foreign jurisdictions, the years 2014 through 2019 are open to examination.
19. | Common Stock and Stock-Based Compensation |
We have a single class of common stock, par value $0.01 per share. Each share of common stock has identical rights and privileges and is entitled to one vote per share. We have authorized, but not issued, a single class of preferred stock, par value $0.01 per share.
Stock-based compensation includes RSUs, PSUs, and Options. These Awards are governed by various plans: the FMSA Holdings Inc. Long Term Incentive Compensation Plan (“2006 Plan”), the FMSA Holdings, Inc. Stock Option Plan (“2010 Plan”), the FMSA Holdings Inc. Amended and Restated 2014 Long Term Incentive Plan (“2014 Plan”), and the Covia Holdings Corporation 2018 Omnibus Incentive Plan (“2018 Plan”). Options may be exercised, in whole or in part, at any time after becoming exercisable, but not later than the date the Option expires, which is typically ten years from the original grant date. All Options granted under the 2006 Plan and 2010 Plan became fully vested as part of the Merger agreement, and 0 Options have been granted since the Merger Date. PSUs granted under the 2014 Plan were converted to RSUs as part of the Merger agreement. All stock-based compensation awards granted since the Merger Date have been made under the 2018 Plan.
Award agreements issued under the 2014 Plan and the 2018 Plan provide that employees who are a minimum age of 55 and have provided a minimum of 10 consecutive years of service are deemed retirement eligible. As a result, a retirement-eligible employee can continue to vest in Options even after termination of employment, as though he or she were still an employee. Additionally, RSUs for retirement-eligible employees will continue to vest within 12 months of termination of employment. Stock compensation expense related to Awards of retirement-eligible employees is subject to acceleration once that employee attains retirement-eligible status. Further, PSUs granted in 2019 to retirement-eligible employees are subject to vesting in prorated quantities depending upon the achievement of the PSU’s performance criteria and the date of the termination of employment.
The fair values of the RSUs and Options were estimated at the Merger Date. The fair value of the RSUs was determined to be the opening share price of Covia stock at the Merger Date. The fair value of Options was estimated at the Merger date using the Black Scholes-Merton option pricing model.
Options granted from 2014 through 2015 under the 2014 Plan vest over a four-year period under various vesting methods. Options granted in 2016 and 2017 under the 2014 Plan vest ratably over a three-year period. RSUs granted in 2015 under the 2014 Plan vest after a six-year period. RSUs granted from 2016 through the Merger Date under the 2014 Plan vest ratably over a four-year period. RSUs granted subsequent to the Merger Date vest ratably over one to three years. PSUs (converted to RSUs) granted from 2016 through the Merger Date under the 2014 Plan cliff-vest over a three-year period. PSUs granted in 2019 cliff-vest over a three-year period and are subject to pre-defined performance criteria.
117
Covia Holdings Corporation and Subsidiaries
Notes to Consolidated Financial Statements
Years Ended December 31, 2019, 2018, and 2017
All Awards activity during 2019 was as follows:
| | Options | | | Weighted Average Exercise Price, Options | | | RSUs | | | Weighted Average Price at RSU Issue Date | | | PSUs | | | Weighted Average Price at PSU Issue Date | |
| | (in thousands, except per share data) | |
Outstanding at December 31, 2018 | | | 2,503 | | | $ | 33.49 | | | | 746 | | | $ | 26.12 | | | | - | | | $ | - | |
Granted | | | - | | | | - | | | | 2,444 | | | | 3.82 | | | | 1,491 | | | | 4.74 | |
Exercised or distributed | | | - | | | | - | | | | (696 | ) | | | 17.42 | | | | - | | | | - | |
Forfeited | | | (30 | ) | | | 41.97 | | | | (425 | ) | | | 8.94 | | | | (440 | ) | | | 4.74 | |
Expired | | | (769 | ) | | | 27.58 | | | | - | | | | - | | | | - | | | | - | |
Outstanding at December 31, 2019 | | | 1,704 | | | $ | 36.01 | | | | 2,069 | | | $ | 6.10 | | | | 1,051 | | | $ | 4.74 | |
| | | | | | | | | | | | | | | | | | | | | | | | |
Exercisable at December 31, 2019 | | | 1,690 | | | $ | 35.91 | | | | - | | | $ | - | | | | - | | | $ | - | |
Our policy is to issue shares from Treasury Stock upon exercise of options or distribution of RSUs and PSUs.
We recorded $10.0 million and $5.8 million of stock compensation expense in the years ended December 31, 2019 and 2018, respectively. We account for forfeitures as they occur. Stock compensation expense is included in selling, general, and administrative expenses on the Consolidated Statements of Income (Loss) and in additional paid-in capital on the Consolidated Balance Sheets.
We recorded stock compensation expense of $2.4 million in the second quarter of 2018 due to accelerated vesting of Awards because of the Merger. This amount is included in other non-operating expense, net on the Consolidated Statements of Income (Loss) and in additional paid-in capital on the Consolidated Balance Sheets. Refer to Note 4 for additional information.
Options outstanding as of December 31, 2019 and 2018 have a weighted average remaining contractual life of 2.4 years and 3.4 years, respectively, and do 0t have an aggregate intrinsic value. Options that are exercisable as of December 31, 2019 and 2018 have a weighted average remaining contractual life of 2.4 years and 2.8 years, respectively, and do 0t have an aggregate intrinsic value. The aggregate intrinsic value represents the difference between the fair value of our shares of $2.04 per share and $3.42 at December 31, 2019 and 2018, respectively, and the exercise price of the dilutive options, multiplied by the number of dilutive options outstanding at that date.
There were 0 Options exercised in 2019. The aggregate intrinsic value of Options exercised in 2018 was $0.01 million. Net cash proceeds from the exercise of Options or distribution of RSUs were $0.01 million and $0.5 million in the years ended December 31, 2019 and 2018, respectively. At December 31, 2019 and 2018, Options to purchase 1.7 million and 2.5 million common shares, respectively, were outstanding at a range of exercise prices of $10.20 to $102.60 per share and $7.15 to $102.60 per share, respectively. Unrecognized compensation cost and weighted average periods remaining for non-vested Awards as of December 31, 2019 and 2018 are as follows:
| | December 31, 2019 | | | December 31, 2018 | |
| | (in thousands) | |
Unrecognized compensation cost | | | | | | | | |
Options | | $ | 10 | | | $ | 697 | |
RSUs | | | 4,596 | | | | 6,785 | |
PSUs | | $ | 3,624 | | | $ | - | |
Weighted average period remaining | | | | | | | | |
Options | | 0.3 years | | | 1.0 years | |
RSUs | | 2.1 years | | | 2.4 years | |
PSUs | | 2.3 years | | | - | |
20. | Pension and Other Post-Employment Benefits |
We maintain retirement, post-retirement medical and long-term benefit plans in several countries.
118
Covia Holdings Corporation and Subsidiaries
Notes to Consolidated Financial Statements
Years Ended December 31, 2019, 2018, and 2017
In the U.S., we sponsor the Covia Holdings Corporation Pension Plan, formerly known as the Covia Corporation Pension Plan (the “Pension Plan”), a defined benefit plan for hourly and salaried employees, and the Covia Holdings Corporation Restoration Plan, formerly known as the Covia Corporation Pension Restoration Plan (the “Restoration Plan”), a non-qualified supplemental benefit plan. The Pension Plan is a funded plan. Minimum funding and maximum tax-deductible contribution limits for the Pension Plan are defined by the Internal Revenue Service. The Restoration Plan is unfunded. Salaried participants accrue benefits based on service and final average pay. Hourly participants' benefits are based on service and a benefit formula. The Pension Plan was closed to new entrants effective January 1, 2008, and union employee participation in the Pension Plan at the last 3 unionized locations participating in the Pension Plan was closed to new entrants effective November 1, 2017. The Pension Plan was frozen as of December 31, 2018 for all non-union employees. Until the Restoration Plan was amended to exclude new entrants on August 15, 2017, all salaried participants eligible for the Pension Plan were also eligible for the Restoration Plan. The Restoration Plan was frozen for all participants as of December 31, 2018. An independent trustee has been appointed for the Pension Plan whose responsibilities include custody of plan assets as well as recordkeeping. A pension committee consisting of members of senior management provides oversight. In addition, an independent advisor has been engaged to provide advice on the management of the plan assets. The primary risk of the Pension Plan is the volatility of the funded status. Liabilities are exposed to interest rate risk and demographic risk (e.g., mortality, turnover, etc.). Assets are exposed to interest rate risk, market risk, and credit risk. In addition to these retirement plans in the U.S., we offer a retiree medical plan to certain union employees that is exposed to risk of increases in health care costs. The retiree medical plan covers certain salaried employees and certain groups of hourly employees. Effective December 31, 2018, the retiree medical plan was terminated for salaried employees but remains open to certain groups of union employees.
In Canada, we sponsor3 defined benefit retirement plans. NaN of the plans are for hourly employees and 1 is for salaried employees. Salaried employees were eligible to participate in a plan consisting of a defined benefit portion that has been closed to new entrants since January 1, 2008 and a defined contribution portion for employees hired after January 1, 2018. Minimum funding is required under the provincial Pension Benefits Act (Ontario) and regulations and maximum funding is set in the Federal Income Tax Act of Canada and regulations. The pension plans are administered by Covia Canada. A pension committee exists to ensure proper administration, management and investment review with respect to the benefits of the pension plan through implementation of governance procedures. The medical plans are administered by an insurance company with Covia Canada having the ultimate responsibility for all decisions. In addition, there are 2 post-retirement medical plans in Canada.
In Mexico, we sponsor 4 retirement plans, 2 of which are seniority premium plans as defined by Mexican labor law. The remaining plans are defined benefit plans with a minimum benefit equal to the severance payment that would have been paid in the event of termination for other than just cause, required by Mexican labor law. Minimum funding is not required, and maximum funding is defined according to the actuarial cost method registered with the Mexican Tax Authority. Investment decisions are made by an administrative committee of Grupo de Materias Primas. All plans in Mexico pay lump sums on retirement and pension plans pay benefits through5 annual payments conditioned on compliance with non-compete covenants.
As part of the Merger, we assumed the 2 defined benefit pension plans of Fairmount Santrol, the Wedron pension plan and the Troy Grove pension plan. These plans cover union employees at certain facilities and provide benefits based upon years of service or a combination of employee earnings and length of service. Benefits under the Wedron pension plan were frozen effective December 31, 2012. Benefits under the Troy Grove pension plan were frozen effective December 31, 2016. The Wedron pension plan and the Troy Grove pension plan were merged into the Covia Pension Plan effective December 2020.
The Pension Plan, Restoration Plan, the pension plans in Canada and Mexico, and the Wedron and Troy Grove pension plans were merged into one plan, effective December 31, 2019 (the “Covia Pension Plan”). For 2018 and 2017, the Wedron and Troy Grove pension plans are collectively referred to as the “Fairmount Pension Plans.” The post-retirement medical plans in the United States and Canada are collectively referred to as the “Postretirement Medical Plans.”
We applied settlement accounting in 2019 due to distributions exceeding current period service and interest costs. These amounts are included in other non-operating expense, net on the Consolidated Statements of Income (Loss).
In June 2018, we recorded a curtailment gain of $5.2 million in connection with the transfer of HPQ Co. to Sibelco. The gain was recognized in Accumulated other comprehensive loss in the Consolidated Balance Sheet. In the third quarter of 2018, we recognized a loss on settlement of $2.6 million related to lump sum payments from the Covia Pension Plan. In the fourth quarter of 2018, we recognized an additional loss on settlement of $3.0 million related to lump sum payments from the Covia Pension Plan and $0.7 million for curtailment loss due to the freeze on the Covia Pension Plan. In connection with the termination of the retiree medical
119
Covia Holdings Corporation and Subsidiaries
Notes to Consolidated Financial Statements
Years Ended December 31, 2019, 2018, and 2017
plans, we recognized a curtailment gain of $8.0 million in the fourth quarter of 2018. These items are recorded in Other non-operating expense, net in the Consolidated Statements of Income (Loss).
The following assumptions were used to determine our obligations under the Covia Pension Plan, Postretirement Medical Plans, and, in 2018, the Fairmount Pension Plans:
| | U.S. | | | Canada | | | Mexico | |
| | 2019 | | | 2018 | | | 2019 | | | 2018 | | | 2019 | | | 2018 | |
Assumptions for Covia Pension Plan: | | | | | | | | | | | | | | | | | | | | | | | | |
Discount rate | | 3.35% | | | 4.15% | | | 3.40% | | | 3.90% | | | 7.05% | | | 8.75% | |
Rate of compensation increase | | 4.50% | | | 4.50% | | | 3.50% | | | 4.50% | | | 4.75% | | | 5.75% | |
Assumptions for Postretirement Medical Plans: | | | | | | | | | | | | | | | | | | | | | | | | |
Discount rate | | 3.15% | | | 4.10% | | | 3.10% | | | 3.90% | | | — | | | — | |
| | Wedron Pension | | | Troy Grove Pension | |
| | 2018 | | | 2018 | |
Assumptions for Fairmount Pension Plans: | | | | | | | | |
Discount rate | | 4.15% | | | 4.30% | |
The following assumptions were used to determine our net periodic benefit costs under the Covia Pension Plan, Postretirement Medical Plans, and, in 2018, the Fairmount Pension Plans:
| | U.S. | | | Canada | | | Mexico | |
| | 2019 | | | 2018 | | | 2017 | | | 2019 | | | 2018 | | | 2017 | | | 2019 | | | 2018 | | | 2017 | |
Assumptions for Covia Pension Plan: | | | | | | | | | | | | | | | | | | | | | | | | | | | | | | | | | | | | |
Discount rate | | 4.18% | | | 3.50% | | | 4.00% | | | 3.90% | | | 3.40% | | | 3.80% | | | 8.75% | | | 7.70% | | | 7.65% | |
Long-term rate of return | | 6.50% | | | 6.50% | | | 6.50% | | | 4.37% | | | 4.29% | | | 4.30% | | | 8.75% | | | 7.70% | | | 7.70% | |
Rate of compensation increase | | 4.50% | | | 4.50% | | | 4.50% | | | 4.50% | | | 4.50% | | | 4.50% | | | 5.75% | | | 5.75% | | | 5.75% | |
Assumptions for Postretirement Medical Plans: | | | | | | | | | | | | | | | | | | | | | | | | | | | | | | | | | | | | |
Discount rate | | 4.10% | | | 3.35% | | | 3.75% | | | 3.90% | | | 3.40% | | | 3.90% | | | — | | | — | | | — | |
| | Wedron Pension | | | Troy Grove Pension | |
| | 2018 | | | 2018 | |
Assumptions for Fairmount Pension Plans: | | | | | | | | |
Discount rate | | 3.95% | | | 4.10% | |
Long-term rate of return | | 7.40% | | | 7.40% | |
The difference in the discount rates used for the Covia Pension Plan is due to the differing characteristics of the plans, including employee characteristics and plan size. We use a cash flow matching approach to determine our discount rate using each plan’s projected cash flows and actuarial yield curves.
In developing the expected long-term rate of return on plan assets, we considered long-term historical rates of return, our plan asset allocations as well as the opinions and outlooks of investment professionals.
The investment policy for the Covia Pension Plan includes a target allocation of approximately 35% in equities and 65% in fixed income investments. Only high-quality diversified securities similar to stocks and bonds are used. Higher-risk securities or strategies (such as derivatives) are not currently used but could be used incidentally by mutual funds held by the plans. The Covia Pension Plan’s obligations are long-term in nature and the investment policy is therefore focused on the long-term. Goals include achieving gross returns at least equal to relevant indices. Management and the plans’ investment advisor regularly review and discuss investment performance, adherence to the investment policy, and the investment policy itself.
120
Covia Holdings Corporation and Subsidiaries
Notes to Consolidated Financial Statements
Years Ended December 31, 2019, 2018, and 2017
The following table summarizes the benefit obligations, assets and funded status associated with the Covia Pension Plan and Postretirement Medical Plans:
| | Covia Pension Plan | | | Postretirement Medical Plans | |
| | December 31, 2019 | | | December 31, 2018 | | | December 31, 2019 | | | December 31, 2018 | |
Change in benefit obligation | | | | | | | | | | | | | | | | |
Benefit obligation at beginning of year | | $ | 217,206 | | | $ | 265,380 | | | $ | 13,288 | | | $ | 25,437 | |
Assumption of Fairmount benefit obligation | | | - | | | | 8,659 | | | | - | | | | - | |
Service cost | | | 2,236 | | | | 7,213 | | | | 325 | | | | 989 | |
Interest cost | | | 8,067 | | | | 9,479 | | | | 438 | | | | 744 | |
Actuarial loss (gain) | | | 26,957 | | | | (21,129 | ) | | | (136 | ) | | | (1,228 | ) |
Other movements | | | 890 | | | | 176 | | | | - | | | | - | |
Settlements | | | (19,914 | ) | | | (23,078 | ) | | | - | | | | - | |
Curtailments | | | - | | | | (22,919 | ) | | | - | | | | (11,304 | ) |
Benefit payments | | | (6,334 | ) | | | (6,060 | ) | | | (618 | ) | | | (1,323 | ) |
Exchange differences | | | (7,226 | ) | | | (515 | ) | | | (938 | ) | | | (27 | ) |
Benefit obligation at end of year | | $ | 221,882 | | | $ | 217,206 | | | $ | 12,359 | | | $ | 13,288 | |
| | | | | | | | | | | | | | | | |
Change in plan assets | | | | | | | | | | | | | | | | |
Fair value of plan assets at beginning of year | | $ | 175,705 | | | $ | 193,019 | | | $ | - | | | $ | - | |
Assumption of Fairmount plan assets | | | - | | | | 7,688 | | | | - | | | | - | |
Actual return on plan assets | | | 25,966 | | | | (6,986 | ) | | | - | | | | - | |
Employer contributions | | | 3,754 | | | | 11,509 | | | | 618 | | | | 1,323 | |
Settlements | | | (19,914 | ) | | | (23,078 | ) | | | - | | | | - | |
Benefit payments | | | (6,334 | ) | | | (6,060 | ) | | | (618 | ) | | | (1,323 | ) |
Exchange differences | | | (7,245 | ) | | | (387 | ) | | | - | | | | - | |
Fair value of plan assets at end of year | | $ | 171,932 | | | $ | 175,705 | | | $ | - | | | $ | - | |
| | | | | | | | | | | | | | | | |
Unfunded status | | $ | (49,950 | ) | | $ | (41,501 | ) | | $ | (12,359 | ) | | $ | (13,288 | ) |
The unfunded balance of the Covia Pension Plans and the Postretirement Medical Plans is recorded in Employee benefit obligations in the Consolidated Balance Sheets.
The accumulated benefit obligation for the Covia Pension Plans totaled $214.8 million and $210.7 million at December 31, 2019 and 2018, respectively.
The following summarizes the components of net periodic benefit costs for the years ended December 31, 2019, 2018, and 2017, respectively:
| | Covia Pension Plan | |
| | Year Ended December 31, | |
| | 2019 | | | 2018 | | | 2017 | |
| | (in thousands) | |
Components of net periodic benefit cost | | | | | | | | | | | | |
Service cost | | $ | 2,236 | | | $ | 7,213 | | | $ | 8,081 | |
Interest cost | | | 8,067 | | | | 9,479 | | | | 9,590 | |
Expected return on plan assets | | | (9,208 | ) | | | (10,546 | ) | | | (9,976 | ) |
Amortization of prior service cost | | | 330 | | | | 450 | | | | 552 | |
Amortization of net actuarial loss | | | 2,082 | | | | 4,444 | | | | 4,845 | |
Settlement loss | | | 4,935 | | | | 6,727 | | | | 320 | |
Recognized curtailment prior service cost | | | - | | | | 1,224 | | | | - | |
Net periodic benefit cost | | $ | 8,442 | | | $ | 18,991 | | | $ | 13,412 | |
121
Covia Holdings Corporation and Subsidiaries
Notes to Consolidated Financial Statements
Years Ended December 31, 2019, 2018, and 2017
| | Postretirement Medical Plans | |
| | Year Ended December 31, | |
| | 2019 | | | 2018 | | | 2017 | |
| | (in thousands) | |
Components of net periodic benefit cost | | | | | | | | | | | | |
Service cost | | $ | 325 | | | $ | 989 | | | $ | 982 | |
Interest cost | | | 438 | | | | 744 | | | | 873 | |
Amortization of net actuarial loss | | | 102 | | | | 430 | | | | 580 | |
Recognized curtailment prior service cost | | | - | | | | (7,995 | ) | | | - | |
Net periodic benefit cost | | $ | 865 | | | $ | (5,832 | ) | | $ | 2,435 | |
The following summarizes the changes in other comprehensive (income) loss for the years ended December 31, 2019, 2018, and 2017 that are included in the Consolidated Statements of Comprehensive Income (Loss):
| | Covia Pension Plan | |
| | Year Ended December 31, | |
| | 2019 | | | 2018 | | | 2017 | |
Changes in other comprehensive (income) loss | | | | | | | | | | | | |
Net actuarial (gain) loss | | $ | 10,271 | | | $ | (26,516 | ) | | $ | 9,583 | |
Amortization of net actuarial (gain) loss | | | (7,016 | ) | | | (11,171 | ) | | | (4,845 | ) |
Recognized settlement loss | | | - | | | | - | | | | (320 | ) |
Prior service cost | | | 890 | | | | 176 | | | | - | |
Amortization of prior service cost | | | (330 | ) | | | (1,675 | ) | | | (552 | ) |
Exchange differences | | | (1,352 | ) | | | (3,995 | ) | | | 195 | |
Deferred tax asset | | | (308 | ) | | | 11,248 | | | | (12,955 | ) |
Other comprehensive income | | $ | 2,155 | | | $ | (31,933 | ) | | $ | (8,894 | ) |
| | Postretirement Medical Plans | |
| | Year Ended December 31, | |
| | 2019 | | | 2018 | | | 2017 | |
Changes in other comprehensive (income) loss | | | | | | | | | | | | |
Net actuarial (gain) loss | | $ | (113 | ) | | $ | (12,532 | ) | | $ | (1,208 | ) |
Amortization of net actuarial (gain) loss | | | (102 | ) | | | 7,565 | | | | (580 | ) |
Exchange differences | | | (94 | ) | | | (173 | ) | | | (282 | ) |
Deferred tax asset | | | - | | | | 1,338 | | | | (1,371 | ) |
Other comprehensive income | | $ | (309 | ) | | $ | (3,802 | ) | | $ | (3,441 | ) |
Net periodic benefit cost totaled $9.3 million, $13.2 million, and $15.8 million for the years ended December 31, 2019, 2018, and 2017, respectively. Contributions into the Covia Pension Plan and the Postretirement Medical Plans for the year ended December 31, 2020 are expected to be $4.0 million.
The actuarial loss and prior service cost that we expect will be amortized from accumulated other comprehensive loss into net periodic benefit cost in the year ending December 31, 2020 is $2.6 million and $0.3 million, respectively.
Benefits expected to be paid out over the next ten years:
| | Expected Benefit Payments | |
Year Ending | | Covia Pension Plan | | | Postretirement Medical Plans | |
2020 | | $ | 11,866 | | | $ | 545 | |
2021 | | | 11,840 | | | | 537 | |
2022 | | | 10,925 | | | | 569 | |
2023 | | | 12,655 | | | | 595 | |
2024 | | | 15,218 | | | | 635 | |
2025-2029 | | | 61,993 | | | | 3,221 | |
122
Covia Holdings Corporation and Subsidiaries
Notes to Consolidated Financial Statements
Years Ended December 31, 2019, 2018, and 2017
The expected benefit payments to be paid are based on the same assumptions used to measure our benefit obligations as of December 31, 2019, and include estimated future employee service.
The annual measurement date is December 31 for pension benefits and other postretirement benefits. For measurement purposes, the assumed health care cost trend rate for the U.S. postretirement plan was 8.4% in 2019 decreasing to an ultimate trend rate of 4.5% in 2027. For measurement purposes, the assumed health care cost trend rate for the Canada postretirement plan was 6.0%, decreasing to an ultimate trend rate of 4.5% in 2024.
The assumed health care cost trend rate assumptions can have an impact on the amounts reported for the Postretirement Medical Plans. A one percent increase or decrease each year in the health care cost trend rate utilized would have the following effects as December 31, 2019:
| | One Percentage Point | |
| | Increase | | | Decrease | |
Effect on the postretirement benefit obligation | | $ | 1,266 | | | $ | (1,047 | ) |
Effect on the net periodic benefit cost | | | 139 | | | | (108 | ) |
Fair value measurements for assets held in the benefit plans as of December 31, 2019 and 2018 are as follows:
| | Quoted Prices | | | Other | | | | | | | | | |
| | in Active | | | Observable | | | Unobservable | | | | | |
| | Markets | | | Inputs | | | Inputs | | | Balance at | |
| | (Level 1) | | | (Level 2) | | | (Level 3) | | | December 31, 2019 | |
Cash and cash equivalents | | $ | 1,811 | | | $ | - | | | $ | - | | | $ | 1,811 | |
Common stock | | | 21,870 | | | | - | | | | - | | | | 21,870 | |
Government and agency securities | | | 29,047 | | | | - | | | | - | | | | 29,047 | |
Corporate bonds | | | - | | | | 41,447 | | | | - | | | | 41,447 | |
Mutual funds | | | 9,139 | | | | - | | | | - | | | | 9,139 | |
Total(A) | | $ | 61,867 | | | $ | 41,447 | | | $ | - | | | $ | 103,314 | |
_______ | | | | | | | | | | | | | | | | |
(A) At December 31, 2019, certain investments that are measured at fair value using the net asset value (“NAV”) per share as a practical expedient have not been categorized in the fair value table above. These investments of $68.6 million are principally invested in commingled trust funds whose investment policy principally follows the investment strategy of the Covia Pension Plan. | |
| | Quoted Prices | | | Other | | | | | | | | | |
| | in Active | | | Observable | | | Unobservable | | | | | |
| | Markets | | | Inputs | | | Inputs | | | Balance at | |
| | (Level 1) | | | (Level 2) | | | (Level 3) | | | December 31, 2018 | |
Cash and cash equivalents | | $ | 6,226 | | | $ | - | | | $ | - | | | $ | 6,226 | |
Common stock | | | 22,349 | | | | - | | | | - | | | | 22,349 | |
Government and agency securities | | | 11,148 | | | | - | | | | - | | | | 11,148 | |
Corporate bonds | | | - | | | | 38,742 | | | | - | | | | 38,742 | |
Mutual funds | | | 28,319 | | | | - | | | | - | | | | 28,319 | |
Total(B) | | $ | 68,042 | | | $ | 38,742 | | | $ | - | | | $ | 106,784 | |
_______ | | | | | | | | | | | | | | | | |
(B) At December 31, 2018, certain investments that are measured at fair value using NAV per share as a practical expedient have not been categorized in the fair value table above. These investments of $68.9 million are principally invested in commingled trust funds whose investment policy principally follows the investment strategy of the Covia Pension Plan. | |
Multiemployer Pension Plans
We contribute to 4 multiemployer defined benefit pension plans under the terms of collective-bargaining agreements for union-represented employees. A multiemployer plan is subject to collective bargaining for employees of two or more unrelated companies. These plans allow multiple employers to pool their pension resources and realize efficiencies associated with the daily administration of the plan. Multiemployer plans are generally governed by a board of trustees composed of management and labor representatives and are funded through employer contributions.
123
Covia Holdings Corporation and Subsidiaries
Notes to Consolidated Financial Statements
Years Ended December 31, 2019, 2018, and 2017
The risks of participating in multiemployer plans differ from single employer plans as follows: (i) assets contributed to a multiemployer plan by one employer may be used to provide benefits to employees of other participating employers, (ii) if a participating employer stops contributing to the plan, the unfunded obligations of the plan may be borne by the remaining participating employers, and (iii) if we cease to have an obligation to contribute to one or more of the multiemployer plans to which we contribute, we may be required to pay those plans an amount based on the underfunded status of the plan, referred to as a withdrawal liability.
A summary of each multiemployer pension plan for which we participate is presented below:
| | Pension Protection Act Zone Status(A) | | Company Contributions | | | |
Pension Fund | EIN / Pension Plan No. | 2019 | 2018 | FIP / RP Status / Pending / Implemented | 2019 | | 2018 | | 2017 | | Surcharge Imposed | CBA Expiration Date |
IAM National Pension Fund | 51-6031295 | Red | Green | No | $ | 180 | | $ | 181 | | $ | 141 | | No | Apr-2021; Jul-2021 |
Laborers National Industrial Pension Fund | 52-6074345 | Red | Red | Implemented | | 8 | | | 7 | | | 7 | | Yes | Oct-2020 |
National Integrated Group Pension Plan | 22-6190618 | Red | Red | Implemented | | 75 | | | 12 | | | 12 | | Yes | Apr-2020 |
Steelworkers Pension Trust | 23-6648508 | Green | Green | No | $ | 208 | | $ | 209 | | $ | 210 | | No | Mar-2021 |
(A) The Pension Protection Act of 2006 defines the zone status as follows: green - healthy, yellow - endangered, orange - seriously endangered, and red - critical. |
Our contributions to individual multiemployer pension plans did not exceed 5% of the plan’s total contributions in any of the three years ended December 31, 2019, 2018, and 2017.
Fairmount Santrol previously participated in a multiemployer defined benefit pension plan and withdrew from the plan in October 2015 with a withdrawal liability of $9.3 million, which is payable in annual installments until November 2035. The present value and balance of this withdrawal liability was $4.1 million as of December 31, 2019.
Defined Contribution Plans
In the U.S., we sponsored the Unimin Corporation Savings Plan (“Unimin Savings Plan”), a defined contribution plan, which provides participants with an opportunity to defer their pay into an account that may be used for providing income during retirement. The Unimin Savings Plan was open to all Unimin U.S. employees. We contributed to the Unimin Savings Plan in two ways, (i) for certain employees not covered by a defined benefit plan, we made a contribution equal to 4% of salary for salaried employees and 1% for most hourly employees, (ii) we made a matching contribution for certain employees of 100% on the first 1% and 50% on the next 5% of each dollar contributed by an employee. Also for certain unionized employees, we matched 50% on the first 1% and 25% on the next 4% of each dollar contributed by an employee. The Unimin Savings Plan was fully funded by participants’ pay deferrals, employer matching and non-matching contributions. Our contributions were $4.7 million and $4.8 million for the years ended December 31, 2018, and 2017, respectively.
Fairmount Santrol had a defined contribution plan (“Fairmount 401(k) Plan”) covering substantially all employees. Under the provisions of the Fairmount 401(k) Plan, we matched 50% of the first 5% of each union employee’s contribution into the Fairmount 401(k) Plan and matched 100% of the first 3% and 50% of the next 2% of each non-union employee’s contribution. Our match contributions were $1.5 million for the year ended December 31, 2018. Included in these contributions were contributions to the Fairmount 401(k) Plan for union members, which were $0.4 million for the year ended December 31, 2018.
In May 2019, we merged the Fairmount 401(k) Plan into the Unimin Savings Plan to create the Covia Retirement Savings Plan (the “Covia Plan”). Our common stock in the Covia Plan was transferred to the Covia Plan as a frozen investment option contemporaneously with the Plan merging into the Covia Plan, and participants in the Covia Plan no longer had the option of purchasing additional shares of our common stock in the Covia Plan as of May 20, 2019. Under the Covia Plan, we match 100% of the first 3% and 50% of the next 2% of each non-union employee’s contribution. We match union employees’ contributions in accordance with the terms of the applicable collective bargaining agreement. Our contributions into the Covia Plan were $5.8 million for the year ended December 31, 2019. Participant accounts in the Covia Plan held 1.4 million shares of our common stock as of December 31, 2019.
In Canada, we sponsor a defined contribution plan covering employees not covered by the defined benefit plan. We make contributions equal to 5% of the eligible employees’ salary. In addition, we participate in a group plan that covers our hourly employees at our St. Canut location. We contribute a fixed 1 thousand dollars per employee per year, as well as make a matching
124
Covia Holdings Corporation and Subsidiaries
Notes to Consolidated Financial Statements
Years Ended December 31, 2019, 2018, and 2017
contribution for 65% of employee contributions up to a maximum of NaN dollars per year. Our contributions into the Canada and St. Canut defined contribution plans were $0.2 million for each of the years ended December 31, 2019, 2018 and 2017, respectively.
We are self-insured for medical benefits. We have an accrued liability of $6.0 million as of December 31, 2019 for anticipated future payments on claims incurred to date. Management believes this amount is adequate to cover all required payments.
Deferred Compensation Plan
In March 2019, we implemented a non-qualified deferred compensation plan for management employees that provides for supplemental payments upon termination of employment or through scheduled distributions elected by the participant. These amounts are being accrued for over the estimated employment periods of these individuals. The balance of deferred compensation was $2.4 million at December 31, 2019 and is included in Other non-current liabilities on the Consolidated Balance Sheets.
Operating leases and finance leases are included in the Consolidated Balance Sheets as follows:
| | | | December 31, 2019 | |
| | Classification | | (in thousands) | |
Lease assets | | | | | | |
Operating right-of-use assets, net | | Assets | | $ | 158,489 | |
Finance right-of-use assets, net | | Property, plant, and equipment, net | | | 11,083 | |
Total lease assets | | | | $ | 169,572 | |
Lease liabilities | | | | | | |
Operating lease liabilities, current | | Current liabilities | | $ | 63,773 | |
Operating lease liabilities, non-current | | Liabilities | | | 272,378 | |
Finance lease liabilities, current | | Current portion of long-term debt | | | 3,496 | |
Finance lease liabilities, non-current | | Long-term debt | | | 3,379 | |
Total lease liabilities | | | | $ | 343,026 | |
Operating lease rental expense for the years ended December 31, 2018 and 2017 was $73.9 million and $49.2 million, respectively. Operating lease costs are recorded on a straight-line basis over the lease term. The components of lease cost from continued operations recognized within our Consolidated Statements of Income (Loss) were as follows:
| | Year Ended December 31, | |
| | 2019 | |
| | (in thousands) | |
Operating leases | | | | |
Operating lease costs | | $ | 102,040 | |
Variable lease costs | | | 1,284 | |
Short-term lease costs | | | 17,436 | |
Total operating lease costs | | $ | 120,760 | |
Financing leases | | | | |
Amortization of right-of-use asset | | $ | 2,944 | |
Interest on finance lease liabilities | | | 295 | |
Total finance lease costs | | $ | 3,239 | |
Maturities of lease liabilities as of December 31, 2019 are as follows:
125
Covia Holdings Corporation and Subsidiaries
Notes to Consolidated Financial Statements
Years Ended December 31, 2019, 2018, and 2017
| | Operating | | | Finance | | | Total | |
| | (in thousands) | |
2020 | | $ | 81,148 | | | $ | 3,713 | | | $ | 84,861 | |
2021 | | | 70,879 | | | | 1,879 | | | | 72,758 | |
2022 | | | 61,198 | | | | 1,161 | | | | 62,359 | |
2023 | | | 54,289 | | | | 434 | | | | 54,723 | |
2024 | | | 40,235 | | | | 81 | | | | 40,316 | |
2025 and Thereafter | | | 93,229 | | | | - | | | | 93,229 | |
Total lease payments | | | 400,978 | | | | 7,268 | | | | 408,246 | |
Less imputed lease interest | | | (64,827 | ) | | | (393 | ) | | | (65,220 | ) |
Total lease liabilities | | $ | 336,151 | | | $ | 6,875 | | | $ | 343,026 | |
Minimum lease payments under ASC 840, as of December 31, 2018, are as follows:
| | (in thousands) |
2019 | | $ | 104,602 |
2020 | | | 81,365 |
2021 | | | 69,358 |
2022 | | | 59,044 |
2023 | | | 52,121 |
Thereafter | | | 121,014 |
Total | | $ | 487,504 |
Additional information related to our leasing arrangements is presented as follows:
| | Year Ended December 31, | |
| | 2019 | |
Operating leases | | | | |
Weighted average remaining lease term | | 6.4 years | |
Weighted average discount rate | | 5.7% | |
Financing leases | | | | |
Weighted average remaining lease term | | 2.5 years | |
Weighted average discount rate | | 4.2% | |
| | Year Ended December 31, | |
| | 2019 | |
| | (in thousands) | |
Cash paid for amounts included in the measurement of lease liabilities | | | | |
Operating cash flows from operating leases | | $ | 95,463 | |
Financing cash flows from finance leases | | | 4,745 | |
Total cash paid | | $ | 100,208 | |
For the year ended December 31, 2019, we recorded impairment charges of $202.8 million for right-of-use assets included in one of our long-lived asset groups and $4.3 million to impair the right-of-use asset related to certain railcars that will no longer be in use during their remaining lease term. These impairments are related to assets supporting our Northern White sand sales. Refer to Note 6 for further information.
23. | Asset Retirement Obligations |
Asset retirement obligations are recorded in Other non-current liabilities in the Consolidated Balance Sheets. Changes in the asset retirement obligations during the years ended December 31, 2019 and 2018 were as follows:
126
Covia Holdings Corporation and Subsidiaries
Notes to Consolidated Financial Statements
Years Ended December 31, 2019, 2018, and 2017
| | December 31, 2019 | | | December 31, 2018 | |
| | (in thousands) | |
Beginning balance | | $ | 31,199 | | | $ | 12,472 | |
Accretion | | | 1,526 | | | | 2,543 | |
Additions and revisions of prior estimates | | | 13,785 | | | | - | |
Adjustments related to Fairmount Santrol acquisition | | | - | | | | 16,184 | |
Ending balance | | $ | 46,510 | | | $ | 31,199 | |
24. | Commitments and Contingent Liabilities |
Contingent Liabilities
We are involved in various legal proceedings, including as a defendant in several lawsuits. Although the outcomes of these proceedings and lawsuits cannot be predicted with certainty, we do not believe that any of the pending legal proceedings and lawsuits are reasonably likely to have a material adverse effect on our financial position, results of operations or cash flows. In addition, we believe that our insurance coverage will mitigate many of these claims.
We and/or our predecessors have been named as a defendant, usually among many defendants, in numerous product liability lawsuits brought by or on behalf of current or former employees of our customers alleging damages caused by silica exposure. During the year ended December 31, 2019, 100 plaintiffs’ claims against us were dismissed. As of December 31, 2019, there were 40 active silica-related products liability lawsuits pending in which we are a defendant. Although the outcomes of these lawsuits cannot be predicted with certainty, we do not believe that these matters are reasonably likely to have a material adverse effect on our financial position, results of operations or cash flows.
On March 18, 2019, in connection with a non-public SEC investigation, we received a subpoena seeking information relating to certain value-added proppants marketed and sold by Fairmount Santrol or Covia within the Energy segment since January 1, 2014. Since the issuance of that subpoena, the SEC has requested additional information and subpoenaed certain current and former employees to testify. We have been cooperating with the SEC’s investigation. The investigation is ongoing, and we cannot provide an estimate of the potential range of loss, if any, that may result. Accordingly, no accrual has been made with respect to this matter.
Capital Commitments
As of December 31, 2019, capital commitments relating to property, plant, and equipment amount to $25.7 million.
Royalties
We have entered into numerous mineral rights agreements, in which payments under the agreements are expensed as incurred. Certain agreements require annual or quarterly payments based upon annual tons mined or the average selling price of tons sold. Total royalty expense associated with these agreements was $11.2 million, $6.3 million, and $3.3 million for the years ended December 31, 2019, 2018, and 2017, respectively.
25. | Transactions with Related Parties |
We sell minerals to Sibelco and certain of its subsidiaries (“related parties”). Sales to related parties amounted to $7.6 million, $6.7 million, and $7.3 million in the years ended December 31, 2019, 2018, and 2017, respectively. At December 31, 2019 and 2018, we had accounts receivable from related parties of $1.8 million and $0.8 million, respectively. These amounts are included in Accounts receivable, net in the accompanying Consolidated Balance Sheets.
We purchased minerals from certain of our related parties. Purchases from related parties amounted to $2.7 million, $5.3 million, and $6.8 million in the years ended December 31, 2019, 2018, and 2017, respectively. At December 31, 2019 and 2018, we had accounts payable to related parties of $0.9 million and $0.5 million, respectively. These amounts are included in Accounts payable in the accompanying Consolidated Balance Sheets.
Prior to the Merger, Sibelco provided certain services on behalf of Unimin, such as finance, treasury, legal, marketing, information technology, and other infrastructure support. The cost for information technology was allocated to Unimin on a direct usage basis. The costs for the remainder of the services were allocated to Unimin based on tons sold, revenues, gross margin, and other financial
127
Covia Holdings Corporation and Subsidiaries
Notes to Consolidated Financial Statements
Years Ended December 31, 2019, 2018, and 2017
measures for Unimin compared to the same financial measures of Sibelco. The financial information presented in these consolidated financial statements may not reflect the combined financial position, operating results and cash flows of Unimin had it not been a consolidated subsidiary of Sibelco. Actual costs that would have been incurred if Unimin had been a stand-alone company would depend on multiple factors, including organizational structure and strategic decisions made in various areas, including information technology and infrastructure. Effective on the Merger Date, Sibelco no longer provides such services to us. Prior to the Merger, during the year ended December 31, 2017 and the five months ended May 31, 2018, Unimin incurred $2.5 million and $2.4 million, respectively, for management and administrative services from Sibelco. These costs are reflected in SG&A expenses in the accompanying Consolidated Statements of Income (Loss).
Additionally, we are compensated for providing transitional services, such as accounting, human resources, information technology, mine planning, and geological services, to HPQ Co. and such compensation is recorded as a reduction of cost in selling, general, and administrative expenses. Compensation for these transitional services was $0.02 million and $0.6 million for the year ended December 31, 2019 and 2018, respectively. Amounts are included in SG&A expenses on the Consolidated Statements of Income (Loss) and in Other receivables in the Consolidated Balance Sheets at December 31, 2019 and December 31, 2018.
In connection with the Merger, we entered into a transition services agreement with Sibelco (“Sibelco Transition Services Agreement”) pursuant to which Sibelco will provide certain information technology transition services to us. In exchange, we pay a fee to Sibelco intended to allow Sibelco to recover all of its direct and indirect costs, generally without profit. The initial term of the Sibelco Transition Services Agreement is up to 24 months, varying by the type of service being provided. The initial term may be extended. Under the Sibelco Transition Services Agreement, we recognized $1.5 million of information technology related expenses in 2019. These costs are reflected in SG&A expenses on the Consolidated Statements of Income (Loss).
On June 1, 2018, we entered into an agreement with Sibelco whereby Sibelco is providing sales and marketing support for certain products supporting the performance coatings and polymer Solutions markets in North America and Mexico, for which we pay a 5% commission of revenue, and in the rest of the world, for which we pay a 10% commission of revenue. Sibelco also assists with sales and marketing efforts for certain products in the ceramics and sanitary ware industries outside of North America and Mexico for which we pays a 5% commission of revenue. In addition, we provide sales and marketing support to Sibelco for certain products used in ceramics in North America and Mexico for which we earn a 10% commission of revenue. We recorded net commission expense of $2.2 million and $2.5 million the year ended December 31, 2019 and 2018, respectively. These amounts are recorded in Selling, general, and administrative expenses.
Prior to the Merger Date, we had term loans outstanding with a wholly-owned subsidiary of Sibelco. During the year ended December 31, 2018, we incurred $3.1 million of interest expense for such term loans. These costs are reflected in Interest expense, net in the accompanying Consolidated Statements of Income (Loss). Upon closing of the Merger, these term loans were repaid with the proceeds of the Term Loan.
We organize our business into 2 reportable segments, Industrial and Energy. Our Energy segment offers the oil and gas industry a comprehensive portfolio of raw frac sand, value-added-proppants, well-cementing additives, gravel-packing media and drilling mud additives. Our products serve hydraulic fracturing operations in the U.S., Canada, Argentina, Mexico, China, and northern Europe. The Industrial segment provides raw, value-added and custom-blended products to the glass, ceramics, metals, coatings, polymers, construction, foundry, filtration, sports and recreation and various other industries.
Prior to the second quarter of 2019, the Company’s chief operating decision maker (“CODM”) primarily evaluated an operating segment’s performance based on segment gross profit, which does not include any selling, general, and administrative costs or corporate costs. Beginning with the second quarter of 2019, the CODM changed the method to evaluate the Company’s operating segments’ performance based on segment contribution margin. Segment contribution margin excludes selling, general, and administrative costs, corporate costs, operating costs of idled facilities, and operating costs of excess railcar capacity. This change was made to better measure the operating performance of the reportable segments and to monitor performance without these non-operational costs.
The reportable segments are consistent with how management views the markets served by us and the financial information reviewed by the CODM in deciding how to allocate resources and assess performance.
128
Covia Holdings Corporation and Subsidiaries
Notes to Consolidated Financial Statements
Years Ended December 31, 2019, 2018, and 2017
Segment information for all periods presented in the table below has been revised accordingly to reflect the new measure of profit and loss.
| | Year Ended December 31, | |
| | 2019 | | | 2018 | | | 2017 | |
| | (in thousands) | |
Revenues | | | | | | | | | | | | |
Energy | | $ | 862,878 | | | $ | 1,114,424 | | | $ | 655,937 | |
Industrial | | | 732,568 | | | | 728,513 | | | | 639,175 | |
Total revenues | | | 1,595,446 | | | | 1,842,937 | | | | 1,295,112 | |
| | | | | | | | | | | | |
Segment contribution margin | | | | | | | | | | | | |
Energy | | | 89,173 | | | | 275,947 | | | | 181,715 | |
Industrial | | | 222,191 | | | | 203,175 | | | | 184,738 | |
Total segment contribution margin | | | 311,364 | | | | 479,122 | | | | 366,453 | |
| | | | | | | | | | | | |
Operating costs of idled facilities and excess railcar capacity | | | 35,090 | | | | 16,951 | | | | - | |
Selling, general, and administrative | | | 153,596 | | | | 145,593 | | | | 99,087 | |
Depreciation, depletion, and amortization | | | 222,042 | | | | 196,455 | | | | 101,560 | |
Goodwill and other asset impairments | | | 1,434,148 | | | | 267,034 | | | | - | |
Restructuring and other charges | | | 30,600 | | | | 21,954 | | | | - | |
Gain on sale of subsidiaries | | | (125,430 | ) | | | - | | | | - | |
Other operating expense (income), net | | | (6,040 | ) | | | (5,024 | ) | | | 3,102 | |
Operating income (loss) from continuing operations | | | (1,432,642 | ) | | | (163,841 | ) | | | | |
Interest expense, net | | | 107,891 | | | | 60,322 | | | | 14,653 | |
Gain on extinguishment of debt | | | (13,411 | ) | | | - | | | | - | |
Other non-operating expense, net | | | 6,991 | | | | 54,832 | | | | 25,989 | |
Income (loss) from continuing operations before provision (benefit) for income taxes | | $ | (1,534,113 | ) | | $ | (278,995 | ) | | $ | 122,062 | |
On May 31, 2018, Unimin transferred certain assets, representing its Electronics segment to HPQ Co., a newly formed wholly-owned subsidiary of Unimin in exchange for all of the stock of HPQ Co. and the assumption by HPQ Co. of certain liabilities. Unimin then distributed all of the stock of HPQ Co. to Sibelco in exchange for certain shares of Unimin common stock held by Sibelco. The disposition of the Electronics segment qualifies as discontinued operations and, therefore, the Electronics segment information has been excluded from the above table.
Asset information, including capital expenditures and depreciation, depletion, and amortization, by segment is not included in reports used by management in its monitoring of performance and, therefore, is not reported by segment.
In the year ended December 31, 2019, 0 customers exceeded 10% of revenues. In the years ended December 31, 2018, and 2017, 1 customer exceeded 10% of revenues. This customer accounted for 13% of revenues in each of the years ended December 31, 2018, and 2017. This customer is part of our Energy segment.
In response to changing market demands, we idled operations and reduced capacities at facilities serving the Energy segment. We did not allocate restructuring charges to our Energy segment.
Additionally, in connection with the Merger, we initiated restructuring activities to achieve cost synergies from our combined operations. We did not allocate these Merger-related restructuring charges to either of our business segments.
129
Covia Holdings Corporation and Subsidiaries
Notes to Consolidated Financial Statements
Years Ended December 31, 2019, 2018, and 2017
The following table presents a summary of restructuring charges for the years ended December 31, 2019 and 2018:
| | Merger-related | | | Idled facilities | | | Total | |
| | (in thousands) | |
Year Ended December 31, 2019 | | | | | | | | | | | | |
Severance and relocation costs | | $ | 5,024 | | | $ | 9,825 | | | $ | 14,849 | |
Contract termination costs | | | - | | | | 1,293 | | | | 1,293 | |
Total restructuring charges | | $ | 5,024 | | | $ | 11,118 | | | $ | 16,142 | |
| | | | | | | | | | | | |
Year Ended December 31, 2018 | | | | | | | | | | | | |
Severance and relocation costs | | $ | 15,286 | | | $ | 2,487 | | | $ | 17,773 | |
Contract termination costs | | | 992 | | | | 3,189 | | | | 4,181 | |
Total restructuring charges | | $ | 16,278 | | | $ | 5,676 | | | $ | 21,954 | |
The following table presents our restructuring reserve activity during 2019 and 2018:
| | Merger-related | | | Idled facilities | | | Total | |
| | (in thousands) | |
Accrued restructuring charges | | | | | | | | | | | | |
Balances at December 31, 2017 | | $ | - | | | $ | - | | | $ | - | |
Charges | | | 16,278 | | | | 5,676 | | | | 21,954 | |
Cash payments | | | (700 | ) | | | (1,702 | ) | | | (2,402 | ) |
Balances at December 31, 2018 | | | 15,578 | | | | 3,974 | | | | 19,552 | |
Charges | | | 5,024 | | | | 11,118 | | | | 16,142 | |
Cash payments | | | (12,867 | ) | | | (14,615 | ) | | | (27,482 | ) |
Balances at December 31, 2019 | | $ | 7,735 | | | $ | 477 | | | $ | 8,212 | |
No restructuring charges were incurred in 2017. All of our restructuring reserve is current and included in Accrued expenses.
Restructuring and other charges on the Consolidated Statements of Income (Loss) for the year ended December 31, 2019 includes other charges related to executive severance and benefits of $5.5 million and consulting and strategic costs of $9.0 million. These other charges were recorded in Accrued expenses on the Consolidated Balance Sheet but not included in the above tables.
130
Covia Holdings Corporation and Subsidiaries
Notes to Consolidated Financial Statements
Years Ended December 31, 2019, 2018, and 2017
28. | Geographic Information |
The following tables show total revenues and long-lived assets. Revenues are attributed to geographic regions based on the selling location. Long-lived assets are in the respective geographic regions.
| | Year Ended December 31, | |
| | 2019 | | | 2018 | | | 2017 | |
Revenues | | | | | | | | | | | | |
Domestic | | $ | 1,421,957 | | | $ | 1,632,722 | | | $ | 1,059,938 | |
International | | | 173,489 | | | | 210,215 | | | | 235,174 | |
Total revenues | | $ | 1,595,446 | | | $ | 1,842,937 | | | $ | 1,295,112 | |
| | December 31, 2019 | | | December 31, 2018 | | | December 31, 2017 | |
Long-lived assets | | | | | | | | | | | | |
Domestic | | $ | 1,378,722 | | | $ | 2,659,254 | | | $ | 1,008,569 | |
International | | | 199,749 | | | | 175,107 | | | | 127,535 | |
Long-lived assets | | $ | 1,578,471 | | | $ | 2,834,361 | | | $ | 1,136,104 | |
29. | Quarterly Financial Data (Unaudited) |
The following tables set forth our unaudited quarterly consolidated statements of operations for each of the last four quarters for the periods ended December 31, 2019 and 2018. This unaudited quarterly information has been prepared on the same basis as our annual audited financial statements and includes all adjustments, consisting only of normal recurring adjustments that are necessary to present fairly the financial information for the fiscal quarters presented.
| | First Quarter | | | Second Quarter | | | Third Quarter | | | Fourth Quarter | |
2019: | | | | | | | | | | | | | | | | |
Revenues | | $ | 428,246 | | | $ | 444,936 | | | $ | 408,957 | | | $ | 313,307 | |
Cost of goods sold (excluding depreciation, depletion, and amortization) | | | 361,560 | | | | 345,969 | | | | 332,234 | | | | 279,409 | |
Selling, general and administrative expenses | | | 41,960 | | | | 38,644 | | | | 35,628 | | | | 37,364 | |
Depreciation, depletion and amortization expense | | | 58,095 | | | | 59,204 | | | | 51,920 | | | | 52,823 | |
Goodwill and other asset impairments | | | - | | | | - | | | | 7,761 | | | | 1,426,387 | |
Restructuring charges | | | 2,002 | | | | 9,535 | | | | 3,378 | | | | 15,685 | |
Gain on sale of subsidiaries | | | - | | | | - | | | | (127,195 | ) | | | 1,765 | |
Other operating expense (income), net | | | (6,392 | ) | | | 1,670 | | | | 18 | | | | (1,336 | ) |
Operating income (loss) from continuing operations | | | (28,979 | ) | | | (10,086 | ) | | | 105,213 | | | | (1,498,790 | ) |
Interest expense, net | | | 25,136 | | | | 27,866 | | | | 26,894 | | | | 27,995 | |
Gain on extinguishment of debt | | | - | | | | - | | | | - | | | | (13,411 | ) |
Other non-operating expense, net | | | 2,187 | | | | 1,571 | | | | 1,924 | | | | 1,309 | |
Provision (benefit) for income taxes | | | (4,054 | ) | | | (5,136 | ) | | | 22,471 | | | | (257,415 | ) |
Net income (loss) from continuing operations | | | (52,248 | ) | | | (34,387 | ) | | | 53,924 | | | | (1,257,268 | ) |
Net income (loss) from continuing operations attributable to the non-controlling interest | | | (3 | ) | | | 7 | | | | 152 | | | | (33 | ) |
Net income (loss) from continuing operations attributable to Covia Holdings Corporation | | | (52,245 | ) | | | (34,394 | ) | | | 53,772 | | | | (1,257,235 | ) |
Income (loss) from discontinued operations, net of tax | | | - | | | | - | | | | - | | | | - | |
Net income (loss) attributable to Covia Holdings Corporation | | | (52,245 | ) | | | (34,394 | ) | | | 53,772 | | | | (1,257,235 | ) |
| | | | | | | | | | | | | | | | |
Continuing operations earnings (loss) per share, basic | | $ | (0.40 | ) | | $ | (0.26 | ) | | $ | 0.41 | | | $ | (9.54 | ) |
Continuing operations earnings (loss) per share, diluted | | | (0.40 | ) | | | (0.26 | ) | | | 0.41 | | | | (9.54 | ) |
Earnings (loss) per share, basic | | | (0.40 | ) | | | (0.26 | ) | | | 0.41 | | | | (9.54 | ) |
Earnings per share, diluted | | $ | (0.40 | ) | | $ | (0.26 | ) | | $ | 0.41 | | | $ | (9.54 | ) |
Weighted average number of shares outstanding, basic | | | 131,287 | | | | 131,458 | | | | 131,562 | | | | 131,736 | |
Weighted average number of shares outstanding, diluted | | | 131,287 | | | | 131,458 | | | | 131,745 | | | | 131,736 | |
131
Covia Holdings Corporation and Subsidiaries
Notes to Consolidated Financial Statements
Years Ended December 31, 2019, 2018, and 2017
| | First Quarter | | | Second Quarter | | | Third Quarter | | | Fourth Quarter | |
2018: | | | | | | | | | | | | | | | | |
Revenues | | $ | 369,821 | | | $ | 508,418 | | | $ | 523,368 | | | $ | 441,330 | |
Cost of goods sold (excluding depreciation, depletion, and amortization) | | | 260,319 | | | | 355,311 | | | | 405,602 | | | | 359,534 | |
Selling, general and administrative expenses | | | 25,224 | | | | 31,377 | | | | 43,164 | | | | 45,828 | |
Depreciation, depletion and amortization expense | | | 27,131 | | | | 36,744 | | | | 68,584 | | | | 63,996 | |
Goodwill and other asset impairments | | | - | | | | 12,300 | | | | 265,343 | | | | (10,609 | ) |
Restructuring charges | | | - | | | | - | | | | 14,750 | | | | 7,204 | |
Other operating expense (income), net | | | - | | | | 644 | | | | (974 | ) | | | (4,694 | ) |
Operating income (loss) from continuing operations | | | 57,147 | | | | 72,042 | | | | (273,101 | ) | | | (19,929 | ) |
Interest expense, net | | | 2,298 | | | | 9,497 | | | | 23,530 | | | | 24,997 | |
Other non-operating expense (income), net | | | 8,193 | | | | 38,923 | | | | 9,043 | | | | (1,327 | ) |
Provision (benefit) for income taxes | | | 9,870 | | | | 6,454 | | | | (16,848 | ) | | | 4,511 | |
Net income (loss) from continuing operations | | | 36,786 | | | | 17,168 | | | | (288,826 | ) | | | (48,110 | ) |
Net income (loss) from continuing operations attributable to the non-controlling interest | | | - | | | | 106 | | | | (32 | ) | | | 29 | |
Net income (loss) from continuing operations attributable to Covia Holdings Corporation | | | 36,786 | | | | 17,062 | | | | (288,794 | ) | | | (48,139 | ) |
Income (loss) from discontinued operations, net of tax | | | 8,757 | | | | 3,830 | | | | - | | | | - | |
Net income (loss) attributable to Covia Holdings Corporation | | | 45,543 | | | | 20,892 | | | | (288,794 | ) | | | (48,139 | ) |
| | | | | | | | | | | | | | | | |
Continuing operations earnings (loss) per share, basic | | $ | 0.31 | | | $ | 0.14 | | | $ | (2.20 | ) | | $ | (0.37 | ) |
Continuing operations earnings (loss) per share, diluted | | | 0.31 | | | | 0.14 | | | | (2.20 | ) | | | (0.37 | ) |
Earnings (loss) per share, basic | | | 0.38 | | | | 0.17 | | | | (2.20 | ) | | | (0.37 | ) |
Earnings per share, diluted | | $ | 0.38 | | | $ | 0.17 | | | $ | (2.20 | ) | | $ | (0.37 | ) |
Weighted average number of shares outstanding, basic | | | 119,645 | | | | 123,460 | | | | 131,154 | | | | 131,182 | |
Weighted average number of shares outstanding, diluted | | | 119,645 | | | | 124,166 | | | | 131,154 | | | | 131,182 | |
132
ITEM 9. CHANGES IN AND DISAGREEMENTS WITH ACCOUNTANTS ON ACCOUNTING AND FINANCIAL DISCLOSURE
None.
ITEM 9A. CONTROLS AND PROCEDURES
Evaluation of Disclosure Controls and Procedures
We maintain disclosure controls and procedures, as that term is defined in Rules 13a-15(e) and 15d-15(e) of the Exchange Act. In designing and evaluating the disclosure controls and procedures, our management recognizes that any controls and procedures, no matter how well designed and operated, can provide only reasonable, and not absolute, assurance of achieving the desired control objectives of such controls and procedures. Our management, under the supervision and with the participation of our Chief Executive Officer (“CEO”) (our principal executive officer) and Chief Financial Officer (“CFO”) (our principal financial officer), has evaluated the effectiveness of our disclosure controls and procedures as of December 31, 2019. Based on that evaluation, our CEO and CFO have each concluded that such disclosure controls and procedures were effective as of December 31, 2019.
Report of Management on Internal Control over Financial Reporting
Management is responsible for establishing and maintaining adequate internal control over financial reporting (as such term is defined in Exchange Act Rules 13a-15(f) and 15d-15(f)) for us. Under the supervision and with the participation of our CEO and CFO, management assessed the effectiveness of our internal control over financial reporting as of December 31, 2019 based on criteria specified in Internal Control – Integrated Framework (2013) issued by the Committee of Sponsoring Organizations of the Treadway Commission (“COSO”). Based on our assessment, management, including our CEO and CFO, concluded that, as of December 31, 2019, our internal control over financial reporting was effective. Our independent registered public accounting firm, Ernst & Young LLP, has issued an attestation report on our internal control over financial reporting which appears herein.
Changes in Internal Control over Financial Reporting
There was no change in our internal control over financial reporting, as defined in Rules 13a-15(f) under the Exchange Act, that occurred during the quarter ended December 31, 2019 that has materially affected, or is reasonably likely to materially affect, our internal control over financial reporting.
ITEM 9B. OTHER INFORMATION
None.
133
PART III
ITEM 10. DIRECTORS, EXECUTIVE OFFICERS, AND CORPORATE GOVERNANCE
Except as set forth below, the information required by Item 10 is hereby incorporated by reference to the sections of the Proxy Statement for the Annual Meeting of Stockholders of Covia to be held on May 21, 2020 (the “2020 Proxy Statement”) captioned “ITEM 1 – ELECTION OF DIRECTORS,” “GOVERNANCE – Role of the Board’s Committees,” “GOVERNANCE – Nominating Procedures,” “SECURITY OWNERSHIP OF CERTAIN BENEFICIAL OWNERS AND MANAGEMENT – Delinquent Section 16(a) Reports,” and “GOVERNANCE – Code of Business Conduct and Ethics and Financial Code of Ethics.”
The information set forth below is provided as required by Item 10 and the listing standards of the NYSE.
The following table sets forth information with respect to our current executive officers, including their ages, as of March 16, 2020. There are no family relationships between any of our executive officers.
Name | | Age | | Position |
Richard A. Navarre | | 59 | | Chairman, President and CEO |
Cameron J. Berry | | 52 | | Executive Vice President, Energy |
Andrew D. Eich | | 39 | | Executive Vice President, Chief Financial Officer |
Paolo Gennari | | 41 | | Executive Vice President, Industrial |
Campbell J. Jones | | 59 | | Executive Vice President, Chief Operating Officer |
Chadwick P. Reynolds | | 46 | | Executive Vice President, Chief Legal Officer and Secretary |
Brian J. Richardson | | 47 | | Executive Vice President, Chief Transformation Officer |
Rory F. O'Donnell | | 42 | | Senior Vice President, Corporate Controller |
Executive Officers of the Registrant
Richard A. Navarre, age 59, Mr. Navarre has served as our Chairman, President, and CEO since September 2019. Prior to his permanent appointment as President and CEO, Mr. Navarre served as our Chairman beginning in June 2018 and assumed the additional roles as our President and CEO on an interim basis in May 2019. Mr. Navarre has more than 35 years of diverse international business and finance experience. From 2012 to 2019, Mr. Navarre was an independent advisor to companies in the energy industry. From 1993 until his retirement in 2012, Mr. Navarre held several executive positions with Peabody Energy Corporation, including serving as its President – Americas, President and Chief Commercial Officer, and Executive Vice President of Corporate Development and Chief Financial Officer. He is currently a director of Natural Resource Partners LP (NYSE: NRP) (where he serves as a member of the audit committee and as chairman of the conflicts committee), Arch Coal (NYSE: ARCH) (where he serves as the chair of the compensation committee and a member of the nominating and governance committee), and Civeo Corporation (NYSE: CVEO) (where he is the Chairman of the Board and serves as a member of the nominating and governance committee).
Cameron J. Berry, age 52, has served as Executive Vice President, Energy, since September 2019. In this role, Mr. Berry provides leadership for the Energy business segment, including Sales, Marketing, and Research & Development as well as Supply Chain, S&OP and Terminals. Prior to his current role, Mr. Berry served as Senior Vice President, Energy, from January 2018 to September 2019, and our Senior Vice President, Supply Chain from June 2018 to December 2018. Prior to the establishment of Covia, Mr. Berry served as Vice President of Sales for the Oil & Gas division of Connecticut-based Unimin from February 2013 to May 2018. From 2001 to 2013, Mr. Berry served in a variety of roles at Solvay Chemicals. Mr. Berry received a Bachelor of Commerce from the University of Calgary.
Andrew D. Eich, age 39, has served as our Executive Vice President and CFO since June 2018. He is responsible for our finance, accounting, treasury, investor relations, strategy and M&A functions. Mr. Eich served as Senior Vice President and Chief Commercial Officer of Unimin from June 2016 to May 2018. From 2012 to June 2016, he served as CFO of Unimin. From 2004 to 2012, Mr. Eich served in a variety of roles at Aetos Capital (private equity fund) including roles in M&A, portfolio management, corporate finance and investor relations. He started his career at KPMG LLP (audit, tax and advisory services provider) in New York, where he worked from 2002 to 2004 in KPMG’s assurance practice. Mr. Eich received a B.A. in Management Economics from Ohio Wesleyan University and is a CPA (inactive) and CFA charter holder.
134
Paolo Gennari, age 41, Mr. Gennari has served as our Executive Vice President, Industrial since October 2019. Previously, Mr. Gennari held several positions at Sibelco, including Executive Vice President, Global Business Unit, Coatings, Polymers & Chemical Solutions from January 2018 to October 2019, Executive Vice President of Global Businesses and Head of Commercial Excellence from January 2016 to December 2017, Vice President, Strategic Business Segment Specialties of Sibelco Europe, from December 2014 to January 2016, Sales Director, Industrial, of Sibelco Europe from December 2012 to December 2014, and Sales Director, Sibelco Italy from May 2011 to December 2012. Mr. Gennari received an executive master’s degree in general management from Insead Business School, and a master’s degree in industrial chemistry from Università Degli Studi Di Milano.
Campbell J. Jones, age 59, has served as our Executive Vice President and Chief Operating Officer since June 2018. He is responsible for our operations, engineering, environmental, health and safety, procurement, supply chain and R&D functions. Mr. Jones served as President and CEO of Unimin from May 2015 to May 2018, and was a member of the Unimin Board since 2015. He has also served as Group Chief Operating Officer of Sibelco (material solutions provider) from January 2016 to May 2018. Mr. Jones was with Sibelco or its affiliates since 2000. He was Managing Director of Sibelco Australia Limited from 2006 to 2014 and Executive General Manager/Chief Operating Officer of Sibelco Australia Limited from 2000 to 2006. Prior to joining Unimin, he was Executive General Manager at Commercial Minerals from 1997 to 2000 and Managing Director at Envirotech Australia from 1992 to 1997. Mr. Jones received a B.E. in Metallurgical Engineering from the University of New South Wales.
Chadwick P. Reynolds, age 46, has served as our Executive Vice President, Chief Legal Officer and Secretary since September 2019. He is responsible for the company’s legal and corporate governance, information technology, risk management and corporate real estate functions. Mr. Reynolds joined us in September 2018 as Executive Vice President, General Counsel and Secretary. Prior to joining us, Mr. Reynolds served Stage Stores, Inc. (retailer) as its Executive Vice President, Chief Legal Officer and Secretary from April 2017 to August 2018, and its Senior Vice President, Chief Legal Officer and Secretary from August 2014 to March 2017, where he oversaw its legal, risk management, real estate, construction and facilities departments. Previously, he spent 16 years with Big Lots, Inc. (retailer), where he most recently served as Vice President, Deputy General Counsel and Assistant Corporate Secretary from March 2009 to August 2014. Mr. Reynolds received a B.A. from Indiana State University and a J.D. from Capital University Law School.
Brian J. Richardson, age 47, has served as our Executive Vice President and Chief Transformation Officer since September 2019. Administrative Officer since June 2018. He is responsible for delivering value from our strategic initiatives while also taking on the challenging tasks of defining how we measure success, aligning our organizational structure to drive execution and accountability, and building a sustainable culture of performance improvement. Previously, Mr. Richardson served as our Executive Vice President and Chief Administrative Officer from June 2018 to September 2019 and Executive Vice President, Chief People Officer at Fairmount Santrol from June 2015 to May 2018. Prior to joining Fairmount Santrol, Mr. Richardson was Senior Vice President of Human Resources for the Global Finishes Group of The Sherwin-Williams Company (manufacturer of coatings and related products). Mr. Richardson received a B.A. in Finance from Baldwin-Wallace College and MBA from The Ohio State University.
Rory F. O’Donnell, age 42, has served as our Senior Vice President, Corporate Controller since April 2019. Mr. O’Donnell is responsible for the finance and accounting functions of the company. Previously, Mr. O’Donnell served as our Senior Vice President, Accounting and Tax from February 2019 to April 2019. Prior to joining us, Mr. O’Donnell was the Senior Vice President and Controller at Signet Jewelers, Inc. (retailer) from 2014 to 2018, and served as the Assistant Controller at Cliffs Natural Resources (mining) from 2012 to 2014. Mr. O’Donnell received a B.S. from the University of Dayton and is a Certified Public Accountant in the State of Ohio.
ITEM 11. EXECUTIVE COMPENSATION
The information required by Item 11 is hereby incorporated by reference to the sections of the 2020 Proxy Statement captioned “EXECUTIVE COMPENSATION,” “DIRECTOR COMPENSATION,” and “GOVERNANCE - Compensation Committee Interlocks and Insider Participation.”
ITEM 12. SECURITY OWNERSHIP OF CERTAIN BENEFICIAL OWNERS AND MANAGEMENT AND RELATED STOCKHOLDER MATTERS
The information required by Item 12 is hereby incorporated by reference to the sections of the 2020 Proxy Statement captioned “SECURITY OWNERSHIP OF CERTAIN BENEFICIAL OWNERS AND MANAGEMENT.”
135
Equity Compensation Plan Information
The table below provides information, as of December 31, 2019, with respect to compensation plans under which our securities of Covia are authorized for issuance. Please see Note 19 in our Consolidated Financial Statements for further information:
| | Number of securities to be issued upon exercise of outstanding options, warrants and rights | | | Weighted-average exercise price of outstanding options, warrants and rights | | | Number of securities remaining available for future issuance under equity compensation plans [excluding securities reflected in column (A)] | |
Number of securities in thousands | | (A)(1) | | | (B) | | | (C) | |
Equity compensation plans approved by security holders(2) | | | 1,704 | | | $ | 36.01 | | | | 6,788 | |
Equity compensation plans not approved by security holders | | | - | | | | - | | | | - | |
Total | | | 1,704 | | | $ | 36.01 | | | | 6,788 | |
_________ | | | | | | | | | | | | |
(1) In addition, as of December 31, 2019, we had 2.1 million RSUs outstanding under the 2014 Plan and 2018 Plan and 1.1 million PSUs outstanding under the 2018 Plan. | |
(2) In addition, as of December 31, 2019, we had 1.1 million Options outstanding under the 2010 Plan and 0.6 million Options outstanding under the 2014 Plan. | |
ITEM 13. CERTAIN RELATIONSHIPS AND RELATED TRANSACTIONS, AND DIRECTOR INDEPENDENCE
The information required by Item 13 is hereby incorporated by reference to the sections of the 2020 Proxy Statement captioned “GOVERNANCE – Related Party Transactions” and “GOVERNANCE – Director Independence.”
ITEM 14. PRINCIPAL ACCOUNTING FEES AND SERVICES
The information required by Item 14 is hereby incorporated by reference to the sections of the 2020 Proxy Statement captioned “AUDIT COMMITTEE MATTERS – Policy for Pre-Approval of Independent Auditor Services” and “AUDIT COMMITTEE MATTERS – Principal Accountant Fees and Services.”
136
PART IV
ITEM 15. EXHIBITS AND FINANCIAL STATEMENT SCHEDULES
The following documents are filed as part of this Report:
| A) | The consolidated financial statements of Covia Holdings Corporation and Subsidiaries contained in Part II, Item 8 of this Report: |
| • | Consolidated Statements of Income (Loss) for the years ended December 31, 2019, 2018, and 2017 |
| • | Consolidated Statements of Comprehensive Income (Loss) for the years ended December 31, 2019, 2018, and 2017 |
| • | Consolidated Balance Sheets as of December 31, 2019 and 2018 |
| • | Consolidated Statements of Equity for the years ended December 31, 2019, 2018, and 2017 |
| • | Consolidated Statements of Cash Flows for the years ended December 31, 2019, 2018, and 2017 |
| B) | Schedule II – Valuation and Qualifying Accounts and Reserves for the years ended December 31, 2019, 2018, and 2017, contained on page 138 of this Report |
| C) | The exhibits listed in the Exhibit Index beginning on page 139 of this Annual Report on Form 10-K |
ITEM 16. FORM 10-K SUMMARY
None.
137
Covia Holdings Corporation and Subsidiaries
Schedule II – Valuation and Qualifying Accounts and Reserves
Years Ended December 31, 2019, 2018, and 2017
(in thousands)
| | | | | | Charged to Cost | | | Charged to | | | | | | | | | |
| | Beginning Balance | | | and Expenses | | | Other Accounts | | | Deductions | | | Ending Balance | |
Allowance for Doubtful Accounts: | | | | | | | | | | | | | | | | | | | | |
Year ended December 31, 2019 | | $ | 4,488 | | | $ | (164 | ) | | $ | - | | | $ | (2,113 | ) | | $ | 2,211 | |
Year ended December 31, 2018 | | | 3,682 | | | | 871 | | | | - | | | | (65 | ) | | | 4,488 | |
Year ended December 31, 2017 | | | 2,645 | | | | 806 | | | | 2 | | | | 229 | | | | 3,682 | |
| | | | | | | | | | | | | | | | | | | | |
Valuation Allowance for Net Deferred Tax Assets: | | | | | | | | | | | | | | | | | | | | |
Year ended December 31, 2019 | | $ | 52,199 | | | $ | 87,919 | | | $ | - | | | $ | - | | | $ | 140,118 | |
Year ended December 31, 2018 | | | 29,206 | | | | 13,353 | | | | 9,640 | | | | - | | | | 52,199 | |
Year ended December 31, 2017 | | | 36,877 | | | | (7,671 | ) | | | - | | | | - | | | | 29,206 | |
138
COVIA HOLDINGS CORPORATION
EXHIBIT INDEX
The following documents are filed or furnished as exhibits to this Annual Report on Form 10-K. For convenient reference, each exhibit is listed in the following Exhibit Index according to the number assigned to it in the Exhibit Table of Item 601 of Regulation S-K.
(x) Filed herewith
(y) Management contract or compensatory plan or arrangement required to be filed as an exhibit to this Annual Report on Form 10-K.
Exhibit No. | | Description |
| | |
2.1 | | Agreement and Plan of Merger, dated as of December 11, 2017, by and among Unimin Corporation, Fairmount Santrol Holdings Inc., SCR-Sibelco NV, Bison Merger Sub, Inc. and Bison Merger Sub I, LLC (incorporated by reference to Exhibit 2.1 to the Current Report on Form 8-K of Fairmount Santrol Holdings Inc., filed with the SEC on December 12, 2017) (File No. 001-36670). |
| | |
2.2 | | Business Contribution Agreement, dated as of May 31, 2018, by and among Unimin Corporation, SCR-Sibelco NV and Sibelco North America, Inc. (incorporated by reference to Exhibit 2.2 to the Current Report on Form 8-K of the Company, filed with the SEC on June 6, 2018) (File No. 001-38510). |
| | |
2.3 | | Membership Interest Purchase Agreement, dated as of July 3, 2019, by and among Covia Holdings Corporation, Covia Lime, LLC and Mississippi Lime Company (incorporated by reference to Exhibit 2.1 to the Current Report on Form 8-K of the Company, filed with the SEC on July 10, 2019) (File No. 001-38510) . |
| | |
2.4 | | Stock Purchase Agreement, dated as of July 25, 2019, by and among Covia Holdings Corporation, WWRR Acquisition, LLC, and OmniTRAX, Inc. (incorporated by reference to Exhibit 2.1 to the Current Report on Form 8-K of the Company, filed with the SEC on July 30, 2019) (File No. 001-38510). |
| | |
3.1 | | Amended and Restated Certificate of Incorporation of Covia Holdings Corporation (incorporated by reference to Exhibit 3.1 to the Current Report on Form 8-K of the Company, filed with the SEC on June 6, 2018) (File No. 001-38510). |
| | |
3.2 | | Amended and Restated Bylaws of Covia Holdings Corporation incorporated by reference to Exhibit 3.2 to the Current Report on Form 8-K of the Company, filed with the SEC on June 6, 2018) (File No. 001-38510). |
| | |
4.1 | | Stockholders Agreement, dated as of June 1, 2018, by and among Covia Holdings Corporation, SCR-Sibelco NV and the other parties named therein (incorporated by reference to Exhibit 4.1 to the Current Report on Form 8-K of the Company, filed with the SEC on June 6, 2018) (File No. 001-38510). |
| | |
4.2 | | Registration Rights Agreement, dated as of June 1, 2018, by and between Covia Holdings Corporation and SCR-Sibelco NV (incorporated by reference to Exhibit 4.2 to the Current Report on Form 8-K of the Company, filed with the SEC on June 6, 2018) (File No. 001-38510). |
| | |
4.3 | | Amended and Restated Stockholders Agreement, dated as of September 1, 2019, by and among Covia Holdings Corporation, SCR-Sibelco NV and the other parties named therein (incorporated by reference to Exhibit 10.1 to the Current Report on Form 8-K of the Company, filed with the SEC on August 22, 2019) (File No. 001-38510). |
| | |
4.4(x) | | Description of Capital Stock. |
| | |
10.1 | | Redemption Agreement, dated as of May 31, 2018, by and between Unimin Corporation and SCR-Sibelco NV (incorporated by reference to Exhibit 10.1 to the Current Report on Form 8-K of the Company, filed with the SEC on June 6, 2018) (File No. 001-38510). |
| | |
10.2 | | Tax Matters Agreement, dated as of May 31, 2018, by and between Unimin Corporation and SCR-Sibelco NV (incorporated by reference to Exhibit 10.2 to the Current Report on Form 8-K of the Company, filed with the SEC on June 6, 2018) (File No. 001-38510). |
| | |
10.3 | | Distribution Agreement, dated as of June 1, 2018, by and between Covia Holdings Corporation and SCR-Sibelco NV (incorporated by reference to Exhibit 10.3 to the Current Report on Form 8-K of the Company, filed with the SEC on June 6, 2018) (File No. 001-38510). |
| | |
139
Exhibit No. | | Description |
| | |
10.4 | | Distribution Agreement, dated as of June 1, 2018, by and between Covia Holdings Corporation and SCR-Sibelco NV (incorporated by reference to Exhibit 10.4 to the Current Report on Form 8-K of the Company, filed with the SEC on June 6, 2018) (File No. 001-38510). |
| | |
10.5 | | Exclusive Agency Agreement, dated as of June 1, 2018, by and between Covia Holdings Corporation and SCR-Sibelco NV (incorporated by reference to Exhibit 10.5 to the Current Report on Form 8-K of the Company, filed with the SEC on June 6, 2018) (File No. 001-38510). |
| | |
10.6 | | Exclusive Agency Agreement, dated as of June 1, 2018, by and between Covia Holdings Corporation and SCR-Sibelco NV (incorporated by reference to Exhibit 10.6 to the Current Report on Form 8-K of the Company, filed with the SEC on June 6, 2018) (File No. 001-38510). |
| | |
10.7 | | Non-Compete Agreement, dated as of June 1, 2018, by and between Covia Holdings Corporation and SCR-Sibelco NV (incorporated by reference to Exhibit 10.7 to the Current Report on Form 8-K of the Company, filed with the SEC on June 6, 2018) (File No. 001-38510). |
| | |
10.8 | | Transition Services Agreement, dated as of May 31, 2018, by and between Unimin Corporation and Sibelco North America, Inc. (incorporated by reference to Exhibit 10.8 to the Current Report on Form 8-K of the Company, filed with the SEC on June 6, 2018) (File No. 001-38510). |
| | |
10.9 | | Transition Services Agreement, dated as of June 1, 2018, by and between Covia Holdings Corporation and SCR-Sibelco NV (incorporated by reference to Exhibit 10.9 to the Current Report on Form 8-K of the Company, filed with the SEC on June 6, 2018) (File No. 001-38510). |
| | |
10.10 | | Credit and Guarantee Agreement, dated as of June 1, 2018, by and among Covia Holdings Corporation, Barclays Bank PLC and BNP Paribas Securities Corp. as lead arrangers and joint bookrunners, and the other parties named therein (incorporated by reference to Exhibit 10.10 to the Current Report on Form 8-K of the Company, filed with the SEC on June 6, 2018) (File No. 001-38510). |
| | |
10.11 | | Pledge and Security Agreement, dated as of June 1, 2018, by and among Covia Holdings Corporation, Barclays Bank PLC and BNP Paribas Securities Corp. and the other parties named therein (incorporated by reference to Exhibit 10.11 to the Current Report on Form 8-K of the Company, filed with the SEC on June 6, 2018) (File No. 001-38510). |
| | |
10.12 | | Trademark License Agreement, dated as of June 1, 2018, by and between Covia Holdings Corporation and SCR-Sibelco NV (incorporated by reference to Exhibit 10.12 to the Current Report on Form 8-K of the Company, filed with the SEC on June 6, 2018) (File No. 001-38510). |
| | |
10.13 | | Trademark Assignment Agreement, dated as of June 1, 2018, by and between Covia Holdings Corporation and Sibelco Nederland NV (incorporated by reference to Exhibit 10.13 to the Current Report on Form 8-K of the Company, filed with the SEC on June 6, 2018) (File No. 001-38510). |
| | |
10.14 | | Patent License Agreement, dated as of June 1, 2018, by and between Covia Holdings Corporation and SCR-Sibelco NV (incorporated by reference to Exhibit 10.14 to the Current Report on Form 8-K of the Company, filed with the SEC on June 6, 2018) (File No. 001-38510). |
| | |
10.15 | | Patent License Agreement, dated as of June 1, 2018, by and between Covia Holdings Corporation and SCR-Sibelco NV (incorporated by reference to Exhibit 10.15 to the Current Report on Form 8-K of the Company, filed with the SEC on June 6, 2018) (File No. 001-38510). |
| | |
10.16 | | Patent License Agreement, dated as of June 1, 2018, by and between Covia Holdings Corporation and SCR-Sibelco NV (incorporated by reference to Exhibit 10.16 to the Current Report on Form 8-K of the Company, filed with the SEC on June 6, 2018) (File No. 001-38510). |
| | |
10.17 | | Patent License Agreement, dated as of June 1, 2018, by and between Covia Holdings Corporation and SCR-Sibelco NV (incorporated by reference to Exhibit 10.17 to the Current Report on Form 8-K of the Company, filed with the SEC on June 6, 2018) (File No. 001-38510). |
| | |
10.18 | | Patent License Agreement, dated as of June 1, 2018, by and between Covia Holdings Corporation and SCR-Sibelco NV (incorporated by reference to Exhibit 10.18 to the Current Report on Form 8-K of the Company, filed with the SEC on June 6, 2018) (File No. 001-38510). |
140
Exhibit No. | | Description |
| | |
10.19 | | Patent License Agreement, dated as of June 1, 2018, by and between Covia Holdings Corporation and SCR-Sibelco NV (incorporated by reference to Exhibit 10.19 to the Current Report on Form 8-K of the Company, filed with the SEC on June 6, 2018) (File No. 001-38510). |
10.20 | | Redemption Agreement, related to the Cash Redemption, by and between Unimin Corporation and SCR-Sibelco NV (incorporated by reference to Exhibit 10.20 to the Current Report on Form 8-K of the Company, filed with the SEC on June 6, 2018) (File No. 001-38510). |
| | |
10.21 | | Intercompany Note, dated as of May 29, 2018, by and between Unimin Corporation and SCR-Sibelco NV (incorporated by reference to Exhibit 10.21 to the Current Report on Form 8-K of the Company, filed with the SEC on June 6, 2018) (File No. 001-38510). |
| | |
10.22 | | Form of Indemnification Agreement (incorporated by reference to Exhibit 10.22 to the Current Report on Form 8-K of the Company, filed with the SEC on June 6, 2018) (File No. 001-38510). |
| | |
10.23(y) | | 2018 Omnibus Incentive Plan of Covia Holdings Corporation (incorporated by reference to Exhibit 10.23 to the Current Report on Form 8-K of the Company, filed with the SEC on June 6, 2018) (File No. 001-38510). |
| | |
10.24(y) | | Form of Restricted Stock Unit Agreement for 2018 Omnibus Incentive Plan of Covia Holdings Corporation (incorporated by reference to Exhibit 10.1 to the Current Report on Form 8-K of the Company, filed with the SEC on July 2, 2018) (File No. 001-38510). |
| | |
10.25(y) | | Form of Restricted Stock Unit Agreement for Non-Employee Directors for 2018 Omnibus Incentive Plan of Covia Holdings Corporation (incorporated by reference to Exhibit 10.2 to the Current Report on Form 8-K of the Company, filed with the SEC on July 2, 2018) (File No. 001-38510). |
| | |
10.26(y) | | Performance Measures for purposes of the 2018 Omnibus Incentive Plan of Covia Holdings Corporation (incorporated by reference to Exhibit 99.3 to the Current Report on Form 8-K of the Company, filed with the SEC on June 6, 2018) (File No. 001-38510). |
| | |
10.27(y) | | Form of Restricted Stock Unit Agreement for Interim President and CEO for 2018 Omnibus Incentive Plan of Covia Holdings Corporation (incorporated by reference to Exhibit 10.2 to the Current Report on Form 8-K of the Company, filed with the SEC on May 9, 2019) (File No. 001-38510). |
| | |
10.28(y) | | Covia Executive Severance Plan effective May 23, 2019 (incorporated by reference to Exhibit 10.1 to the Current Report on Form 8-K of the Company, filed with the SEC on May 29, 2019) (File No. 001-38510). |
| | |
10.29(y) | | Form of Restricted Stock Unit Agreement for Independent Directors Pursuant to the Covia Holdings Corporation 2018 Omnibus Incentive Plan (incorporated by reference to Exhibit 10.4 to the Quarterly Report on Form 10-Q of the Company, filed with the SEC on August 8, 2019) (File No. 001-38510). |
| | |
10.30(y) | | Letter agreement with Richard A. Navarre dated August 19, 2019 and Form of Restricted Stock Unit Agreement for President and CEO for 2018 Omnibus Incentive Plan of Covia Holdings Corporation (incorporated by reference to Exhibit 10.2 to the Current Report on Form 8-K of the Company, filed with the SEC on August 22, 2019) (File No. 001-38510). |
| | |
10.31(x)(y) | | Form of Restricted Stock Unit Agreement Pursuant to the Covia Holdings Corporation 2018 Omnibus Incentive Plan. |
| | |
10.32(x)(y) | | Form of Restricted Stock Unit Agreement (for CEO) Pursuant to the Covia Holdings Corporation 2018 Omnibus Incentive Plan. |
| | |
10.33(x)(y) | | Form of Performance Stock Unit Agreement Pursuant to the Covia Holdings Corporation 2018 Omnibus Incentive Plan. |
| | |
10.34(x)(y) | | Form of Performance Stock Unit Agreement (for CEO) Pursuant to the Covia Holdings Corporation 2018 Omnibus Incentive Plan. |
| | |
10.35(x)(y) | | Form of Performance Award Agreement Pursuant to the Covia Holdings Corporation 2018 Omnibus Incentive Plan. |
| | |
10.36(x)(y) | | Form of Performance Award Agreement (for CEO) Pursuant to the Covia Holdings Corporation 2018 Omnibus Incentive Plan. |
| | |
141
Exhibit No. | | Description |
| | |
10.37(y) | | FMSA Holdings Inc. Long Term Incentive Compensation Plan (incorporated by reference to Exhibit 10.11 to the Registration Statement on Form S-1 of Fairmont Santrol Holdings Inc., filed with the SEC on September 18, 2014) (File No. 333-198322). |
| | |
10.38(y) | | Form of Stock Option Agreement for FMSA Holdings Inc. Long Term Incentive Compensation Plan (incorporated by reference to Exhibit 10.12 to the Registration Statement on Form S-1 of Fairmont Santrol Holdings Inc., filed with the SEC on September 18, 2014) (File No. 333-198322). |
| | |
10.39(y) | | Amendment I to the Form of Stock Option Agreement for FMSA Holdings Inc. Long Term Incentive Compensation Plan (incorporated by reference to Exhibit 10.13 to the Registration Statement on Form S-1 of Fairmont Santrol Holdings Inc., filed with the SEC on September 18, 2014) (File No. 333-198322). |
| | |
10.40(y) | | FMSA Holdings Inc. Stock Option Plan (incorporated by reference to Exhibit 10.14 to the Registration Statement on Form S-1 of Fairmont Santrol Holdings Inc., filed with the SEC on September 18, 2014) (File No. 333-198322). |
| | |
10.41(y) | | Form of Stock Option Agreement for FMSA Holdings Inc. Stock Option Plan (incorporated by reference to Exhibit 10.15 to the Registration Statement on Form S-1 of Fairmont Santrol Holdings Inc., filed with the SEC on September 18, 2014) (File No. 333-198322). |
| | |
10.42(y) | | Amendment I to the Form of Stock Option Agreement for FMSA Holdings Inc. Stock Option Plan (incorporated by reference to Exhibit 10.16 to the Registration Statement on Form S-1 of Fairmont Santrol Holdings Inc., filed with the SEC on September 18, 2014) (File No. 333-198322). |
| | |
10.43(y) | | Form of Stock Option Agreement for FMSA Holdings Inc. 2014 Long Term Incentive Plan (incorporated by reference to Exhibit 10.18 to the Registration Statement on Form S-1 of Fairmont Santrol Holdings Inc., filed with the SEC on September 18, 2014) (File No. 333-198322). |
| | |
10.44(y) | | Form of Notice of Grant of Stock Option for FMSA Holdings Inc. 2014 Long Term Incentive Plan (incorporated by reference to Exhibit 10.19 to the Registration Statement on Form S-1 of Fairmont Santrol Holdings Inc., filed with the SEC on September 18, 2014) (File No. 333-198322). |
| | |
10.45(y) | | Form of Restricted Stock Unit Agreement for FMSA Holdings Inc. 2014 Long Term Incentive Plan (incorporated by reference to Exhibit 10.21 to the Registration Statement on Form S-1 of Fairmont Santrol Holdings Inc., filed with the SEC on September 18, 2014) (File No. 333-198322). |
| | |
10.46(y) | | Form of Notice of Grant of Restricted Stock Unit for FMSA Holdings Inc. 2014 Long Term Incentive Plan (incorporated by reference to Exhibit 10.22 to the Registration Statement on Form S-1 of Fairmont Santrol Holdings Inc., filed with the SEC on September 18, 2014) (File No. 333-198322)). |
| | |
10.47(y) | | Omnibus Amendment to Outstanding Stock Option Agreements under the FMSA Holdings Inc. 2014 Long Term Incentive Plan (incorporated by reference to Exhibit 10.2 to the Current Report on Form 8-K of Fairmont Santrol Holdings Inc., filed with the SEC on December 16, 2015) (File No. 001-36670). |
| | |
10.48(y) | | Omnibus Amendment to Outstanding Restricted Stock Unit Agreements under the FMSA Holdings Inc. 2014 Long Term Incentive Plan (incorporated by reference to Exhibit 10.3 to the Current Report on Form 8-K of Fairmont Santrol Holdings Inc., filed with the SEC on December 16, 2015) (File No. 001-36670). |
| | |
10.49(y) | | Omnibus Amendment to Outstanding Stock Option Agreements under FMSA Holdings Inc. 2006 Long Term Incentive Compensatory Plan (incorporated by reference to Exhibit 10.1 to the Quarterly Report on Form 10-Q of Fairmont Santrol Holdings Inc., filed with the SEC on November 3, 2016) (File No. 001-36670). |
| | |
10.50(y) | | Omnibus Amendment to Outstanding Stock Option Agreements under FMSA Holdings Inc. 2010 Stock Option Plan (incorporated by reference to Exhibit 10.2 to the Quarterly Report on Form 10-Q of Fairmont Santrol Holdings Inc., filed with the SEC on November 3, 2016) (File No. 001-36670). |
| | |
10.51(y) | | Amended and Restated Omnibus Amendment to Outstanding Stock Option Agreements under FMSA Holdings Inc. 2014 Long Term Incentive Plan (incorporated by reference to Exhibit 10.3 to the Quarterly Report on Form 10-Q of Fairmont Santrol Holdings Inc., filed with the SEC on November 3, 2016) (File No. 001-36670). |
| | |
142
Exhibit No. | | Description |
| | |
10.52(y) | | Amendment No. 1 to the FMSA Holdings Inc. 2014 Long Term Incentive Plan, dated February 1, 2017, by Fairmount Santrol Holdings Inc. (incorporated by reference to Exhibit 10.37 to the Annual Report on Form 10-K of Fairmount Santrol Holdings Inc., filed with the SEC on March 9, 2017) (File No. 001-36670). |
| | |
10.53(y) | | Fairmount Santrol Holdings Inc. 2014 Long Term Incentive Plan, as amended (incorporated by reference to Appendix A to the Definitive Proxy Statement of Fairmont Santrol Holdings Inc., filed with the SEC on April 6, 2017) (File No. 001-36670). |
| | |
10.54 | | First Amendment to Credit and Guarantee Agreement dated March 19, 2019 (incorporated by reference to Exhibit 10.1 to the Current Report on Form 8-K of the Company, filed with the SEC on March 21, 2019) (File No. 001-38510). |
| | |
10.55 | | Letter Agreement with Richard A. Navarre dated May 8, 2019 (incorporated by reference to Exhibit 10.1 to the Current Report on Form 8-K of the Company, filed with the SEC on May 9, 2019) (File No. 001-38510). |
| | |
21.1(x) | | List of Subsidiaries of Covia Holdings Corporation. |
| | |
23.1(x) | | Consent of Independent Registered Public Accounting Firm, Ernst & Young LLP. |
| | |
31.1(x) | | Certification of Chief Executive Officer pursuant to Rule 13a-14(a) or Rule 15d-14(a) under the Securities Exchange Act of 1934, as amended, as adopted pursuant to Section 302 of the Sarbanes-Oxley Act of 2002. |
| | |
31.2(x) | | Certification of Chief Financial Officer pursuant to Rules 13a-14(a) or Rule 15d-14(a) under the Securities Exchange Act of 1934, as amended, as adopted pursuant to Section 302 of the Sarbanes-Oxley Act of 2002. |
| | |
32.1(x) | | Certification of Chief Executive Officer pursuant to 18 U.S.C. Section 1350, as adopted pursuant to Section 906 of the Sarbanes-Oxley Act of 2002. |
| | |
32.2(x) | | Certification of Chief Financial Officer pursuant to 18 U.S.C. Section 1350, as adopted pursuant to Section 906 of the Sarbanes-Oxley Act of 2002. |
| | |
95.1(x) | | Mine Safety Disclosure Exhibit |
| | |
99.1(x) | | Consent of GZA GeoEnvironmental, Inc. |
| | |
101.INS(x) | | Inline XBRL Instance Document – the instance document does not appear in the Interactive Data File because its XBRL tags are embedded within the Inline XBRL document. |
| | |
101.SCH(x) | | Inline XBRL Taxonomy Extension Schema Document. |
| | |
101.CAL(x) | | Inline XBRL Taxonomy Extension Calculation Linkbase Document. |
| | |
101.DEF(x) | | Inline XBRL Taxonomy Extension Definition Linkbase Document. |
| | |
101.LAB(x) | | Inline XBRL Taxonomy Extension Label Linkbase Document. |
| | |
101.PRE(x) | | Inline XBRL Taxonomy Extension Presentation Linkbase Document. |
| | |
| | |
143
SIGNATURES
Pursuant to the requirements of Section 13 or 15(d) of the Securities Exchange Act of 1934, the registrant has duly caused this report to be signed on its behalf by the undersigned, thereunto duly authorized on March 16, 2020.
COVIA HOLDINGS CORPORATION |
| | |
By: | | /s/ Richard A. Navarre |
| | Richard A. Navarre |
| | Chairman, President, and Chief Executive Officer |
Pursuant to the requirements of the Exchange Act of 1934, this report has been signed below by the following persons on behalf of the registrant and in the capacities and on the dates indicated.
Name | | Title | | Date |
| | | | |
/s/ Richard A. Navarre | | Chairman, President, and Chief Executive Officer | | March 16, 2020 |
Richard A. Navarre | | (Principal Executive Officer) | | |
| | | | |
/s/ Andrew D. Eich | | Executive Vice President and Chief Financial Officer | | March 16, 2020 |
Andrew D. Eich | | (Principal Financial Officer) | | |
| | | | |
/s/ Rory F. O'Donnell | | Senior Vice President and Corporate Controller | | March 16, 2020 |
Rory F. O’Donnell | | (Principal Accounting Officer) | | |
| | | | |
/s/ Matthew F. LeBaron | | Lead Independent Director | | March 16, 2020 |
Matthew F. LeBaron | | | | |
| | | | |
/s/ William E. Conway | | Director | | March 16, 2020 |
William E. Conway | | | | |
| | | | |
/s/ Kurt Decat | | Director | | March 16, 2020 |
Kurt Decat | | | | |
| | | | |
/s/ Jean-Luc Deleersnyder | | Director | | March 16, 2020 |
Jean-Luc Deleersnyder | | | | |
| | | | |
/s/ Michel Delloye | | Director | | March 16, 2020 |
Michel Delloye | | | | |
| | | | |
/s/ Stephen J. Hadden | | Director | | March 16, 2020 |
Stephen J. Hadden | | | | |
| | | | |
/s/ William P. Kelly | | Director | | March 16, 2020 |
William P. Kelly | | | | |
| | | | |
/s/ Jean-Pierre Labroue | | Director | | March 16, 2020 |
Jean-Pierre Labroue | | | | |
| | | | |
/s/ Olivier Lambrechts | | Director | | March 16, 2020 |
Olivier Lambrechts | | | | |
| | | | |
/s/ Jeffrey B. Scofield | | Director | | March 16, 2020 |
Jeffrey B. Scofield | | | | |
144