| Florida Canyon Gold Mine | Page ii |
| Florida Canyon Gold Inc. | NI 43-101 Technical Report |
Date and Signature Page
This Technical Report on the Florida Canyon Gold Mine project is submitted to Florida Canyon Gold Inc. and is effective 28 June 2024.
The Qualified Persons and Responsible Report Sections follow:
Qualified Person | Responsible for Report Sections |
Dr. Todd Harvey | 1.9,1.15,1.16,1.18,1.19,1.20,1.21,1.22,1.23.3, 13,17,18,19,21,22,24,25.4,25.8,25.12,25.13,25.14,25.15,26.3,27 |
Terre Lane | 1.1, 1.2, 1.3, 1.4, 1.10,1.11, 1.12, 1.13, 1.14, 1.16, 1.18, 1.19, 1.20, 1.21, 1.22, 1.23.2, 2; 3; 4; 5; 12.6,12.7; 14; 15; 16; 18; 19; 21; 22; 23; 24; 25.1, 25.2, 25.5, 25.6, 25.7, 25.9, 25.11, 25.12, 25.13, 25.14, 25.15; 26.2; and 27 |
Dr. Hamid Samari | 1.5, 1.6, 1.7, 1.8, 1.23.1; 6; 7; 8; 9; 10; 11; 12; 25.2, 25.3; 26.1; 27 |
Larry Breckenridge | 1.17, 1.23.4; 20; 25.10; 26.4 |
| (Signed) "Todd Harvey" | 11 July 2024 | |
| Signature Dr. Todd Harvey | Date | |
| (Signed) "Terre Lane" | 11 July 2024 | |
| Signature Terre Lane | Date | |
| (Signed) "Hamid Samari" | 11 July 2024 | |
| Signature Hamid Samari | Date | |
| (Signed) "Larry Breckenridge" | 11 July 2024 | |
| Signature Larry Breckenridge | Date |
| 11 July 2024 |
| Florida Canyon Gold Mine | Page iii |
| Florida Canyon Gold Inc. | NI 43-101 Technical Report |
TABLE OF CONTENTS
| 1.0 SUMMARY | 16 |
| 1.1 Introduction | 16 |
| 1.2 Terms of Reference | 16 |
| 1.3 Project Setting | 16 |
| 1.4 Mineral Tenure, Royalties, Environmental Liabilities and Permitting | 17 |
| 1.5 Geology, Mineralization, and Deposit Type | 17 |
| 1.6 History | 18 |
| 1.7 Drilling and Sampling | 18 |
| 1.8 Data Verification | 19 |
| 1.9 Metallurgical Test Work | 19 |
| 1.10 Mineral Resource Estimation | 20 |
| 1.11 Mineral Resource Statement | 20 |
| 1.12 Mineral Reserve Estimation | 21 |
| 1.13 Mineral Reserve Statement | 22 |
| 1.14 Mining Method | 22 |
| 1.14.1 Hydrologic Considerations | 22 |
| 1.14.2 Open Pit Geotechnical Considerations | 22 |
| 1.14.3 Mine Plan | 23 |
| 1.15 Recovery Methods | 23 |
| 1.16 Project Infrastructure | 24 |
| 1.17 Environmental, Permitting and Social Considerations | 24 |
| 1.18 Markets and Contracts | 24 |
| 1.19 Capital Cost Estimates | 24 |
| 1.20 Operating Cost Estimates | 25 |
| 1.21 Economic Analysis | 25 |
| 1.22 Interpretation and Conclusions | 26 |
| 1.23 Recommendations | 26 |
| 1.23.1 Geology | 26 |
| 1.23.2 Mining | 27 |
| 1.23.3 Metallurgy and Processing | 27 |
| 1.23.4 Environmental Studies | 27 |
| 2.0 INTRODUCTION | 28 |
| 3.0 RELIANCE ON OTHER EXPERTS | 31 |
| 4.0 PROPERTY DESCRIPTION AND LOCATION | 32 |
| 4.1 Environmental Liabilities and Permitting | 33 |
| 5.0 ACCESS, CLIMATE, LOCAL RESOURCES, INFRASTRUCTURE, AND PHYSIOGRAPHY | 37 |
| 6.0 HISTORY | 38 |
| 7.0 GEOLOGIC SETTING AND MINERALIZATION | 41 |
| 7.1 Regional Geology | 41 |
| 11 July 2024 |
| Florida Canyon Gold Mine | Page iv |
| Florida Canyon Gold Inc. | NI 43-101 Technical Report |
7.2 Local Geology | 42 |
7.3 Florida Canyon Geology | 42 |
7.4 Mineralization | 44 |
8.0 DEPOSIT TYPE | 46 |
9.0 EXPLORATION | 47 |
9.1 Pre-Argonaut | 47 |
9.2 Argonaut | 47 |
9.2.1 Drilling | 47 |
9.3 Field Mapping | 47 |
9.3.1 Pre- Argonaut | 47 |
9.3.2 Argonaut | 48 |
10.0 DRILLING | 52 |
10.1 Introduction | 52 |
10.2 Drill Methods | 55 |
10.2.1 Pre-Argonaut | 55 |
10.2.2 Argonaut | 55 |
10.3 Logging Procedure | 56 |
10.3.1 Pre-Argonaut | 56 |
10.3.2 Argonaut | 57 |
10.4 Recovery | 57 |
10.4.1 Pre-Argonaut | 57 |
10.4.2 Argonaut | 57 |
10.5 Collar Survey | 58 |
10.5.1 Pre-Argonaut | 58 |
10.5.2 Argonaut | 58 |
10.6 Down-Hole Surveys | 58 |
10.6.1 Pre-Argonaut | 58 |
10.6.2 Argonaut | 58 |
10.7 QP Comments on Section 10 Drilling | 59 |
11.0 SAMPLE PREPARATION, ANALYSIS, AND SECURITY | 60 |
11.1 Sampling | 60 |
11.1.1 Pre-Argonaut | 60 |
11.1.2 Argonaut | 60 |
11.2 Sample Preparation | 60 |
11.2.1 Pre-Argonaut | 60 |
11.2.2 Argonaut | 61 |
11.3 Analytical Procedure | 61 |
11.3.1 Pre-Argonaut | 61 |
11.3.2 Argonaut | 61 |
11.4 Quality Assurance and Quality Control | 62 |
11.4.1 Pre-Argonaut | 62 |
| 7.2 Local Geology | 42 |
| 7.3 Florida Canyon Geology | 42 |
| 7.4 Mineralization | 44 |
| 8.0 DEPOSIT TYPE | 46 |
| 9.0 EXPLORATION | 47 |
| 9.1 Pre-Argonaut | 47 |
| 9.2 Argonaut | 47 |
| 9.2.1 Drilling | 47 |
| 9.3 Field Mapping | 47 |
| 9.3.1 Pre- Argonaut | 47 |
| 9.3.2 Argonaut | 48 |
| 10.0 DRILLING | 52 |
| 10.1 Introduction | 52 |
| 10.2 Drill Methods | 55 |
| 10.2.1 Pre-Argonaut | 55 |
| 10.2.2 Argonaut | 55 |
| 10.3 Logging Procedure | 56 |
| 10.3.1 Pre-Argonaut | 56 |
| 10.3.2 Argonaut | 57 |
| 10.4 Recovery | 57 |
| 10.4.1 Pre-Argonaut | 57 |
| 10.4.2 Argonaut | 57 |
| 10.5 Collar Survey | 58 |
| 10.5.1 Pre-Argonaut | 58 |
| 10.5.2 Argonaut | 58 |
| 10.6 Down-Hole Surveys | 58 |
| 10.6.1 Pre-Argonaut | 58 |
| 10.6.2 Argonaut | 58 |
| 10.7 QP Comments on Section 10 Drilling | 59 |
| 11.0 SAMPLE PREPARATION, ANALYSIS, AND SECURITY | 60 |
| 11.1 Sampling | 60 |
| 11.1.1 Pre-Argonaut | 60 |
| 11.1.2 Argonaut | 60 |
| 11.2 Sample Preparation | 60 |
| 11.2.1 Pre-Argonaut | 60 |
| 11.2.2 Argonaut | 61 |
| 11.3 Analytical Procedure | 61 |
| 11.3.1 Pre-Argonaut | 61 |
| 11.3.2 Argonaut | 61 |
| 11.4 Quality Assurance and Quality Control | 62 |
| 11.4.1 Pre-Argonaut | 62 |
| 11 July 2024 |
| Florida Canyon Gold Mine | Page v |
| Florida Canyon Gold Inc. | NI 43-101 Technical Report |
| 11.4.2 Argonaut | 63 |
| 11.5 Database | 65 |
| 11.5.1 Pre-Argonaut | 65 |
| 11.5.2 Argonaut | 65 |
| 11.6 Sample Security | 65 |
| 11.6.1 Pre-Argonaut | 65 |
| 11.6.2 Argonaut | 66 |
| 11.7 QP Comments on Section 11 Sample Preparation, Analyses, And Security | 66 |
| 12.0 DATA VERIFICATION | 68 |
| 12.1 Historical Data Verification | 68 |
| 12.2 Data Verification by International Mining Consultants | 68 |
| 12.2.1 2017 Drilling Compared to Pre-2015 Drilling | 68 |
| 12.2.2 DDH to RC Comparison | 69 |
| 12.3 Data Verification by Global Resource Engineering | 70 |
| 12.3.1 Historic Data (1981 to 2016) | 70 |
| 12.3.2 2017 QA/QC | 73 |
| 12.3.3 2020-2023 Database | 81 |
| 12.3.4 Verification of Florida Canyon Mine Analytical Quality Control Data | 82 |
| 12.3.5 2020 QA/QC | 82 |
| 12.3.6 2021 QA/QC | 87 |
| 12.3.7 2022 QA/QC | 93 |
| 12.3.8 2023 QA/QC | 101 |
| 12.3.9 The Field Visit by GRE, Geological Data Verification and Check Assays | 106 |
| 12.4 Data Verification QP Opinion on Adequacy | 124 |
| 12.5 Metallurgy QP Opinion on Adequacy | 124 |
| 12.6 Resource Estimation QP Opinion on Adequacy | 124 |
| 12.7 Mine Planning QP Opinion on Adequacy | 125 |
| 13.0 MINERALOGICAL PROCESSING AND METALLURGICAL TESTING | 126 |
| 13.1 Metallurgical Test Work | 126 |
| 13.2 Process Optimization Test Work | 127 |
| 13.3 Gold Recovery Modelling | 128 |
| 14.0 MINERAL RESOURCE ESTIMATE | 131 |
| 14.1 Database | 131 |
| 14.1.1 Samples and Composites | 131 |
| 14.1.2 Sample Capping | 131 |
| 14.2 Model Description | 132 |
| 14.2.1 Geologic Interpretation | 132 |
| 14.2.2 Density Assignment | 133 |
| 14.2.3 Domains | 134 |
| 14.3 Grade Estimation | 135 |
| 14.4 Mineral Resource Classification | 136 |
| 11 July 2024 |
| Florida Canyon Gold Mine | Page vi |
| Florida Canyon Gold Inc. | NI 43-101 Technical Report |
| 14.5 Model Validation | 136 |
| 14.5.1 Sensitivity Analysis Using Grade Smoothing in the LIK Model | 141 |
| 14.5.2 Reconciliation | 141 |
| 14.6 Mineral Resource Estimate | 145 |
| 14.7 Grade Sensitivity Analysis | 147 |
| 14.8 Factors that May Affect the Mineral Resource Estimates | 148 |
| 14.9 QP Comments on Item 14 "Mineral Resource Estimates" | 149 |
| 15.0 MINERAL RESERVE ESTIMATION | 150 |
| 15.1 Open Pit Mineral Reserve Estimates | 150 |
| 15.1.1 Material Type Classification | 150 |
| 15.1.2 Open Pit Resource Mine Planning Block Model | 150 |
| 15.1.3 Open Pit Metallurgical Recoveries | 150 |
| 15.1.4 Open Pit Cut-Off Grade | 151 |
| 15.1.5 Open Pit Optimization | 152 |
| 15.1.6 Reserve Pit Design | 153 |
| 15.2 Mineral Reserves | 155 |
| 15.3 Factors that may affect the Mineral Reserves | 155 |
| 15.4 QP comments on Section 15 Mineral Reserve Estimation | 156 |
| 16.0 MINING METHODS | 157 |
| 16.1 Hydrologic Considerations | 157 |
| 16.2 Open Pit Geotechnical Considerations | 157 |
| 16.3 Open Pit Mine Design | 158 |
| 16.4 Mining Operations | 169 |
| 16.4.1 Drilling | 169 |
| 16.4.2 Blasting | 169 |
| 16.4.3 Loading | 169 |
| 16.4.4 Hauling | 169 |
| 16.4.5 Mine planning | 170 |
| 16.4.6 Equipment Requirements | 180 |
| 17.0 RECOVERY METHODS | 181 |
| 17.1 Introduction | 181 |
| 17.2 Ore Stacking | 181 |
| 17.3 Barren and Pregnant Leaching Solution Processing | 181 |
| 17.4 Carbon Processing | 182 |
| 17.5 Refining | 182 |
| 17.6 Ventilation | 182 |
| 17.7 Planned Processing Expansion Project for 2024 | 182 |
| 17.8 Primary Process Equipment and Pond Capacities | 182 |
| 17.9 Reagents | 183 |
| 17.10 Gold Recovery | 184 |
| 18.0 PROJECT INFRASTRUCTURE | 185 |
| 11 July 2024 |
| Florida Canyon Gold Mine | Page vii |
| Florida Canyon Gold Inc. | NI 43-101 Technical Report |
| 18.1 Primary Access Road | 185 |
| 18.2 Mine Haul Roads | 185 |
| 18.3 Principal Mine and Maintenance Facilities | 185 |
| 18.3.1 Maintenance Facilities | 185 |
| 18.3.2 Truck Shop and Truck Wash | 185 |
| 18.3.3 Fuel Tank Farm | 187 |
| 18.3.4 Explosive Magazine | 187 |
| 18.3.5 Waste Rock Storage Facilities | 187 |
| 18.4 Principal Process Facilities | 187 |
| 18.4.1 Crushing Plant | 187 |
| 18.4.2 Overland Conveyor | 188 |
| 18.4.3 Leach Pad Facility | 188 |
| 18.4.4 Process Ponds | 188 |
| 18.4.5 Carbon in Column Plant | 188 |
| 18.4.6 Gold Recovery Plant | 188 |
| 18.4.7 Assay Laboratory | 189 |
| 18.5 Other Infrastructure | 189 |
| 18.5.1 Office Buildings | 189 |
| 18.5.2 Electric Power | 189 |
| 18.5.3 Water Sources | 190 |
| 19.0 MARKET STUDIES AND CONTRACTS | 191 |
| 19.1 Metal Prices | 191 |
| 19.2 Market Studies | 191 |
| 19.3 Contracts | 192 |
| 20.0 ENVIRONMENTAL STUDIES, PERMITTING, AND SOCIAL OR COMMUNITY IMPACT | 193 |
| 20.1 Environmental Studies | 193 |
| 20.2 Environmental Management Planning | 194 |
| 20.2.1 WPCP Management Plans | 195 |
| 20.2.2 Waste Rock Management | 195 |
| 20.2.3 Known Environmental Issues Nitrate Plume | 196 |
| 20.2.4 Known Environmental Issues Leak Detection System | 196 |
| 20.3 Required Permits and Status | 197 |
| 20.3.1 Federal Permitting | 200 |
| 20.3.2 State Permitting | 201 |
| 20.3.3 Local Permitting | 203 |
| 20.3.4 FCM Permit Compliance | 203 |
| 20.3.5 Future Permit Amendments | 204 |
| 20.4 Social and Community Requirements | 205 |
| 20.5 Mine Closure | 205 |
| 20.5.1 Regulatory Requirements | 205 |
| 20.5.2 Reclamation Bonding and Closure Cost Estimates | 206 |
| 20.5.3 Existing Bonding at FCM | 207 |
| 11 July 2024 |
| Florida Canyon Gold Mine | Page viii |
| Florida Canyon Gold Inc. | NI 43-101 Technical Report |
| 21.0 CAPITAL AND OPERATING COSTS | 208 |
| 21.1 Capital Costs | 208 |
| 21.2 Operating Costs | 209 |
| 21.3 QP Comments on Section 21 Capital and Operating Costs | 209 |
| 22.0 ECONOMIC ANALYSIS | 210 |
| 22.1 Introduction | 210 |
| 22.2 Methods, Assumptions, and Basis | 210 |
| 22.3 Base Case Financial Analysis Summary | 211 |
| 22.4 Mineral Reserve Case Financial Analysis Summary | 214 |
| 22.4.1 Sensitivity Analysis | 214 |
| 22.5 QP Comments on Section 22 Economic Analysis | 215 |
| 23.0 ADJACENT PROPERTIES | 216 |
| 24.0 OTHER RELEVANT DATA AND INFORMATION | 217 |
| 25.0 INTERPRETATION AND CONCLUSIONS | 218 |
| 25.1 Mineral Tenure, Royalties, Environmental Liabilities and Permitting | 218 |
| 25.2 Geology and Mineralization | 218 |
| 25.3 Exploration, Drilling and Analytical Data Collection in Support of Mineral Resource Estimation | 218 |
| 25.4 Metallurgical Test Work | 219 |
| 25.5 Mineral Resource Estimations | 219 |
| 25.6 Mineral Reserve Estimates | 219 |
| 25.7 Mine Plan | 220 |
| 25.8 Metal Recovery Plan | 220 |
| 25.9 Infrastructure | 220 |
| 25.10 Environmental, Permitting and Social Considerations | 220 |
| 25.11 Markets and Contracts | 220 |
| 25.12 Capital Cost Estimates | 221 |
| 25.13 Operating Cost Estimates | 221 |
| 25.14 Economic Analysis | 221 |
| 25.15 Conclusion | 222 |
| 26.0 RECOMMENDATIONS | 223 |
| 26.1 Geology | 223 |
| 26.2 Mining | 223 |
| 26.3 Metallurgy and Processing | 223 |
| 26.4 Environmental Studies | 224 |
| 27.0 REFERENCES | 225 |
| CERTIFICATE OF QUALIFIED PERSON | 227 |
| CERTIFICATE OF QUALIFIED PERSON | 229 |
| CERTIFICATE OF QUALIFIED PERSON | 231 |
| CERTIFICATE OF QUALIFIED PERSON | 233 |
| 11 July 2024 |
| Florida Canyon Gold Mine | Page ix |
| Florida Canyon Gold Inc. | NI 43-101 Technical Report |
LIST OF FIGURES
| Figure 4-1: Property Location in Nevada | 34 |
| Figure 4-2: Florida Canyon Land Map | 35 |
| Figure 4-3: Mining Lease and Claims | 36 |
| Figure 7-1: Florida Canyon Area Geology | 43 |
| Figure 7-2: Florida Canyon Generalized Geologic Cross Section | 44 |
| Figure 9-1: Map of Soil Sample Grids at Exploration Targets in and Surrounding the FCM | 50 |
| Figure 9-2: Map of Rock Chip Sampling at Exploration Targets in and Surrounding the FCM | 51 |
| Figure 10-1: Drill Collars over 2023 EOY Topography | 54 |
| Figure 10-2: Argonaut Drill Collars (2020-2023) | 56 |
| Figure 12-1: Field Duplicate Samples from Some Drilling Programs Prior to 2017 | 71 |
| Figure 12-2: Pulp Duplicate Samples from Some Drilling Programs Prior to 2017 | 72 |
| Figure 12-3: 2017 Drilling Campaign, Blank Results | 74 |
| Figure 12-4: 2017 Drilling Campaign, Blank Results | 74 |
| Figure 12-5: CRM MEG-Au.09.08 from the 2017 Drilling Campaign | 75 |
| Figure 12-6: CRM MEG-Au.10.03 from the 2017 Drilling Campaign | 76 |
| Figure 12-7: CRM MEG-Au.11.13 from the 2017 Drilling Campaign | 76 |
| Figure 12-8: CRM MEG-Au.12.11 from the 2017 Drilling Campaign | 77 |
| Figure 12-9: CRM MEG-Au.12.13 from the 2017 Drilling Campaign | 77 |
| Figure 12-10: CRM MEG-Au.12.20 from the 2017 Drilling Campaign | 78 |
| Figure 12-11: CRM MEG-Au.12.21 from the 2017 Drilling Campaign | 78 |
| Figure 12-12: CRM MEG-Au.12.23 from the 2017 Drilling Campaign | 79 |
| Figure 12-13: CRM MEG-Au.12.25 from the 2017 Drilling Campaign | 79 |
| Figure 12-14: CRM MEG-Au. S105006X from the 2017 Drilling Campaign | 80 |
| Figure 12-15: CRM MEG-Au. S107007X from the 2017 Drilling Campaign | 80 |
| Figure 12-16: Pulp Duplicate Samples from the 2017 Drilling Campaign | 81 |
| Figure 12-17: 2020 Drilling Campaign, Blank Results | 82 |
| Figure 12-18: CRM MEG-Au.17.04 from the 2020 Drilling Campaign | 83 |
| Figure 12-19: CRM MEG-Au.17.08 from the 2020 Drilling Campaign | 83 |
| Figure 12-20: CRM MEG-Au.17.21 from the 2020 Drilling Campaign | 84 |
| Figure 12-21: CRM MEG-Au.17.23 from the 2020 Drilling Campaign | 84 |
| Figure 12-22: CRM MEG-Au.19.05 from the 2020 Drilling Campaign | 85 |
| Figure 12-23: CRM MEG-Au.19.10 from the 2022 Drilling Campaign | 85 |
| Figure 12-24: Field Duplicate Samples from the 2020 Drilling Campaign | 86 |
| Figure 12-25: Pulp Duplicate Samples from the 2020 Drilling Campaign | 86 |
| Figure 12-26: 2021 Drilling Campaign, Blank Results | 87 |
| Figure 12-27: CRM MEG-Au.17.04 from the 2021 Drilling Campaign | 88 |
| Figure 12-28: CRM MEG-Au.17.08 from the 2021 Drilling Campaign | 88 |
| Figure 12-29: CRM MEG-Au.17.21 from the 2021 Drilling Campaign | 89 |
| 11 July 2024 |
| Florida Canyon Gold Mine | Page x |
| Florida Canyon Gold Inc. | NI 43-101 Technical Report |
| Figure 12-30: CRM MEG-Au.17.23 from the 2021 Drilling Campaign | 89 |
| Figure 12-31: CRM MEG-Au.19.05 from the 2021 Drilling Campaign | 90 |
| Figure 12-32: CRM MEG-Au.19.08 from the 2021 Drilling Campaign | 90 |
| Figure 12-33: CRM MEG-Au.19.10 from the 2021 Drilling Campaign | 91 |
| Figure 12-34: Field Duplicate Samples from the 2021 Drilling Campaign | 92 |
| Figure 12-35: Pulp Duplicate Samples from the 2021 Drilling Campaign | 92 |
| Figure 12-36: 2022 Drilling Campaign, Blank Results | 93 |
| Figure 12-37: 2022 Drilling Campaign, Blank Results | 94 |
| Figure 12-38: CRM MEG-Au.17.04 from the 2022 Drilling Campaign | 95 |
| Figure 12-39: CRM MEG-Au.17.08 from the 2022 Drilling Campaign | 95 |
| Figure 12-40: CRM MEG-Au.17.21 from the 2022 Drilling Campaign | 96 |
| Figure 12-41: CRM MEG-Au.19.05 from the 2022 Drilling Campaign | 96 |
| Figure 12-42: CRM MEG-Au.19.07 from the 2022 Drilling Campaign | 97 |
| Figure 12-43: CRM MEG-Au.19.09 from the 2022 Drilling Campaign | 97 |
| Figure 12-44: CRM MEG-Au.19.10 from the 2022 Drilling Campaign | 98 |
| Figure 12-45: CRM MEG-Au.19.11 from the 2022 Drilling Campaign | 98 |
| Figure 12-46: CRM MEG-Au.21.01 from the 2022 Drilling Campaign | 99 |
| Figure 12-47: CRM MEG-Au.21.05 from the 2022 Drilling Campaign | 99 |
| Figure 12-48: Field Duplicate Samples from the 2022 Drilling Campaign | 100 |
| Figure 12-49: Pulp Duplicate Samples from the 2022 Drilling Campaign | 101 |
| Figure 12-50: 2023 Drilling Campaign, Blank Results | 102 |
| Figure 12-51: 2023 Drilling Campaign, Blank Results | 102 |
| Figure 12-52: CRM MEG-Au.17.04 from the 2023 Drilling Campaign | 103 |
| Figure 12-53: CRM MEG-Au.19.09 from the 2023 Drilling Campaign | 104 |
| Figure 12-54: CRM MEG-Au.19.10 from the 2023 Drilling Campaign | 104 |
| Figure 12-55: CRM MEG-Au.21.01 from the 2023 Drilling Campaign | 105 |
| Figure 12-56: CRM MEG-Au.21.05 from the 2023 Drilling Campaign | 105 |
| Figure 12-57: Pulp Duplicate Samples from the 2023 Drilling Campaign | 106 |
| Figure 12-58: Inspection of the Collar Coordinates | 108 |
| Figure 12-59: GRE's QP Geological Inspections in 2024, different views of Grass Valley Formation | 109 |
| Figure 12-60: GRE's QP Geological Inspections in 2024, Fault and Q-Veins in Grass Valley Formation | 110 |
| Figure 12-61: GRE's QP Geological Inspections in 2024, Grass Valley and Natchez Pass Formations | 110 |
| Figure 12-62: Visual Inspection of RC Holes FCM-0021 and FCM-0024 | 111 |
| Figure 12-63: Core Storage and Core Logging in FCM's Facility at Lovelock, NV | 112 |
| Figure 12-64: Visual Inspection of Selected Intervals from Hole FCM-0500 | 114 |
| Figure 12-65: Visual Inspection of Selected Intervals from Hole FCM-0452 | 115 |
| Figure 12-66: Visual Inspection of Selected Intervals from Hole FCM-0438 | 118 |
| Figure 12-67: Visual Inspection of Selected Intervals from Holes FCM-0081, FCM-0083, and FCM-0505 | 120 |
| Figure 12-68: Hazen Assay Results on CRMs (Au) | 123 |
| Figure 12-69: Hazen Core Check Assay Results (Au) | 124 |
| Figure 13-1: Column Testing on Monthly Composites of Crushed Material and Column Testing of ROM Material Collected on a Quarterly Basis | 126 |
| 11 July 2024 |
| Florida Canyon Gold Mine | Page xi |
| Florida Canyon Gold Inc. | NI 43-101 Technical Report |
| Figure 13-2: Gold Recovery by Ore Source and Particle Size Over a Three-Year Period | 129 |
| Figure 14-1: Domain Codes and Locations | 134 |
| Figure 14-2: Cross Section Looking North Showing Classification of Block Model | 137 |
| Figure 14-3: Cross Section Looking North Showing Gold Grade Estimation in Block Model | 138 |
| Figure 14-4: Cross Section Looking North Showing Gold Grade Estimation in Block Model | 139 |
| Figure 14-5: Cross Section Looking North Showing Gold Grade Estimation in Block Model | 140 |
| Figure 14-6: Grade-Tonnage Sensitivity Curve for the Oxides | 148 |
| Figure 14-7: Grade-Tonnage Sensitivity Curve for the Sulfides | 148 |
| Figure 15-1: Open Pit Optimization Results at Incremental Gold Metal Price | 152 |
| Figure 15-2: Open Pit Final Limit Design | 154 |
| Figure 16-1: Phase 01 - Central Pit C1 | 159 |
| Figure 16-2: Phase 02 - Central Pit C6 | 160 |
| Figure 16-3: Phase 03 - Central Pit C7 | 161 |
| Figure 16-4: Phase 04 - Jasperoid Pit J2 | 162 |
| Figure 16-5: Phase 05 - North Pit N1 | 163 |
| Figure 16-6: Phase 06 - North Pit N2 | 164 |
| Figure 16-7: Phase 07 - North Pit N3 | 165 |
| Figure 16-8: Phase 08 - Radio Tower Pit R1 | 166 |
| Figure 16-9: Phase 09 - Radio Tower Pit R2 | 167 |
| Figure 16-10: Phase 10 - Radio Tower Pit R3 | 168 |
| Figure 16-11: Waste Rock Storage Facility | 172 |
| Figure 16-12: End of Year 2024 Site Plan | 173 |
| Figure 16-13: End of Year 2025 Site Plan | 174 |
| Figure 16-14: End of Year 2026 Site Plan | 175 |
| Figure 16-15: End of Year 2027 Site Plan | 176 |
| Figure 16-16: End of Year 2028 Site Plan | 177 |
| Figure 16-17: End of Year 2029 Site Plan | 178 |
| Figure 16-18: End of Year 2030 Site Plan | 179 |
| Figure 17-1: Gold Recovery Trend | 184 |
| Figure 18-1: Site General Arrangement | 186 |
| Figure 19-1: LBMA AM Fix gold price (daily) | 191 |
| Figure 20-1: Phase 2 Heap Leach Leak Detection System | 197 |
| Figure 22-1: Sensitivity Analysis | 214 |
LIST OF TABLES
| Table 1-1: Mineral Resource Statement - effective 31 December 2023 | 21 |
| Table 1-2: Mineral Reserve Statement - effective 31 December 2023 | 22 |
| Table 1-3: Capital Cost Estimate | 25 |
| Table 1-4: Operating Cost Estimates | 25 |
| Table 2-1: Contributing Authors | 29 |
| Table 6-1: Historic Mineral Resource Statements for Florida Canyon | 39 |
| Table 6-2: Historic Mineral Reserve Statements for Florida Canyon | 40 |
| Table 9-1: Summary of Exploration Sampling Exclusive of Drilling | 48 |
| 11 July 2024 |
| Florida Canyon Gold Mine | Page xii |
| Florida Canyon Gold Inc. | NI 43-101 Technical Report |
| Table 10-1: Drill Hole Database - Florida Canyon Mine | 52 |
| Table 10-2: Core Recovery from 2020 to 2023 | 57 |
| Table 10-3: Down-Hole Surveys (1981-2016) | 58 |
| Table 10-4: Down Hole Surveys (2017) | 58 |
| Table 10-5: Down-Hole Surveys (2020-2023) | 59 |
| Table 11-1: Pre Argonaut (QA/QC Programs Prior to 2017) | 62 |
| Table 11-2: Pre Argonaut (QA/QC Programs in 2017) | 63 |
| Table 11-3: List of Certified Reference Materials Used in the 2017 Drilling Program | 63 |
| Table 11-4: Argonaut (QA/QC Programs 2020-2023) | 64 |
| Table 11-5: List of Certified Reference Materials Used in the 2020-2023 Drilling Program | 64 |
| Table 12-1: Nearest Neighbor Test of 2017 Data vs All Previous Data | 69 |
| Table 12-2: DDH to RC Nearest Neighbor Comparison | 70 |
| Table 12-3: Collar Coordinates Inspections | 107 |
| Table 12-4: Visual Inspection of RC Sample Intervals | 111 |
| Table 12-5: Visual Inspection of Core Sample Intervals | 112 |
| Table 12-6: Check Samples Submitted to Hazen Labs | 121 |
| Table 12-7: Summary Table of Hazen Results with Original Assays | 121 |
| Table 13-1: Gold Recovery Equations by Source and Particle Size | 128 |
| Table 13-2: Annual summary of Ore and Ounces Placed, Modeled and Produced Ounces | 129 |
| Table 14-1: Basic Statistics of Fire Assays and 20-foot Composites Used for the LIK Estimation | 131 |
| Table 14-2: Model Location and Block Size | 132 |
| Table 14-3: Conversion Parameters for Florida Canyon Local Mine Grid to NAD 83 Zone 11 | 132 |
| Table 14-4: Assay Intervals with Cyanide Soluble Assays Remaining as of Year End 2023 | 133 |
| Table 14-5: Bulk Density Assignment | 133 |
| Table 14-6: Grade Estimation Parameters for OK Localizer Model | 135 |
| Table 14-7: Comparison of LIK Models to the Blasthole Block Model Showing Various FA/CN Conversion Ratios | 141 |
| Table 14-8: Comparison of LIK Model to the Ore Control Production Model for Ore Polygons Mined in 2023 | 143 |
| Table 14-9: Comparison of LIK Model to the Ore Control Production Model for Ore Polygons Mined in 2024 | 144 |
| Table 14-10: Pit Optimization Parameters for Determination of Mineral Resource | 146 |
| Table 14-11: Summary of Mineral Resources, Inclusive of Mineral Reserves - effective 31 December 2023 | 147 |
| Table 15-1: Summary of Predictive Gold Recovery | 151 |
| Table 15-2:Open Pit COG Calculation Parameters | 151 |
| Table 15-3: Summary of Mineral Reserves - effective 31 December 2023 | 155 |
| Table 16-1: Inter-Ramp Slope Design Criteria | 157 |
| Table 16-2: Open Pit Mine Ore Production Schedule | 170 |
| Table 16-3: Open Pit Mine Material Movement Schedule | 170 |
| Table 16-4: Mine Waste Rock Storage Facility Requirements and Capacities | 171 |
| Table 16-5: Current and Peak Principal Open Pit Mining Equipment Requirements | 180 |
| Table 17-1: Processing Equipment Used at FCM | 183 |
| 11 July 2024 |
| Florida Canyon Gold Mine | Page xiii |
| Florida Canyon Gold Inc. | NI 43-101 Technical Report |
| Table 17-2: Primary Reagent Consumptions and Rate for 2023. | 183 |
| Table 17-3: Consolidated Production Data for SHLP | 184 |
| Table 20-1: Current Permits for Florida Canyon | 197 |
| Table 20-2: FCM Water Rights | 202 |
| Table 21-1: Capital Costs Summary | 208 |
| Table 21-2: Operating Cost Summary | 209 |
| Table 21-3: Unit Operating Cost Summary | 209 |
| Table 22-1: Financial Analysis Summary | 212 |
| Table 22-2: Sensitivity Analysis | 213 |
| Table 25-1: Capital Cost Estimate | 220 |
| Table 25-2: Operating Cost Estimates | 220 |
LIST OF ACRONYMS AND ABBREVIATIONS
| Argonaut | Argonaut Gold Inc. |
| FCGI | Florida Canyon Gold Inc. |
| FCM | Florida Canyon Mine |
| GRE | Global Resource Engineering, Ltd |
| NI-43101 | Canadian Securities Administrators' National Instrument 43-101 |
| CIM | Canadian Institute of Mining, Metallurgy and Petroleum |
| QP | Qualified Person |
| ROM | Run-of-Mine |
| WRSF | Waste Rock Storage Facility |
| BLM | U.S. Bureau of Land Management |
| RAB | Rotary Air Blast |
| RC | Reverse Circulation |
| CIC | Carbon-in-Column |
| AA | Atomic Adsorption Spectrometer |
| LIK | Localized Indicator Kriging |
| MIK | Mixed Indicator Kriging |
| Ok | Ordinary Kriging |
| VRF | Variance Reduction Factor |
| COG | Cut-off-Grade |
| FEL | Front-End Loaders |
| tpd | Tons per day (short) |
| tpa | Tons per year (short) |
| HLP | Heap Leach Pad |
| SHLP | South Heap Leach Pad |
| NHLP | North Heap Leach Pad |
| Asahi | Asahi Refining USA Inc. |
| NPV | Net Present Value |
| I-80 | Interstate Highway I-80 |
| StdM | Standard Mine |
| Alio | Alio Gold, Inc. |
| 11 July 2024 |
| Florida Canyon Gold Mine | Page xiv |
| Florida Canyon Gold Inc. | NI 43-101 Technical Report |
| MDA | Mine Development Associates |
| IMC | Independent Mine Consultants |
| Cordex | Cordilleran Explorations |
| Montoro | Montoro Gold Company |
| Pegasus | Pegasus Gold Corporation |
| Nevoro | Nevoro Gold, Inc. |
| Apollo | Apollo Gold Corporation |
| Admiral | Admiral Financial Group |
| Rye Patch | Rye Patch Gold Corp |
| Homestake | Homestake Mining Company |
| DDH | Diamond Drill Holes |
| lb | Pound |
| lb/ton | Pounds per ton (short) |
| oz/ton | Ounces per ton (short) |
| oz | Ounces |
| RQD | Rock Quality Designation |
| IRD | International Directional Services |
| SRG | Surface Recoding Gyro |
| AAL | American Assay Labs |
| NDEP | Nevada Department of Environmental Protection |
| ppm | Parts per million |
| QA/QC | Quality Assurance / Quality Control |
| MEG | Moment Exploration Geochemistry |
| CRM | Certified Reference Material |
| KS | Komologov-Smirnoff |
| Hazen | Hazen Research Inc. |
| CNAA | Cyanide-Leach Atomic Absorption |
| AuAA | Cyanide Soluble Gold assay |
| AuFA | Gold Fire Assay |
| SMU | Selective Mining Unit |
| LOM | Life-of-Mine |
| Golder | Golder Associates Inc. |
| Barr | Barr Engineering Co. |
| UDCF | Undiscounted Cash Flow |
| DTH | Down-the-Hole |
| ADR | Adsorption, Desorption and Regeneration |
| PAG | Potentially Acid Generating |
| LBMA | London Bullion Market Association |
| PoO | Mine Plan of Operations |
| APO | Amended Plan of Operations |
| NEPA | National Environmental Policy Act |
| FONSI | Finding of No Significant Impact |
| DR | Decision Record |
| 11 July 2024 |
| Florida Canyon Gold Mine | Page xv |
| Florida Canyon Gold Inc. | NI 43-101 Technical Report |
| WPCP | Water Pollution Control Permit |
| BMRR | Bureau of Regulations and Reclamation |
| FOAV | Findings of Alleged Violation |
| LDS | Leak Detections System |
| GPD | Gallons per day |
| HDPE | High-Density Polyethylene |
| SWPPP | Stormwater Pollution Prevention Plan |
| NDWR | Nevada Division of Water Resources |
| EA | Environmental Assessment |
| EIS | Environmental Impact Statement |
| BAPC | Bureau of Air Pollution control |
| BWPC | Bureau of Water Pollution control |
| BWM | Bureau of Waste Management |
| BSDW | Bureau of Safe Drinking Water |
| NDOW | Nevada Department of Wildlife |
| HAP | Hazardous Pollutants |
| ROW | Right of Way |
| SRCE | Nevada Standardized Reclamation Cost Estimator |
| CDC | Closure Diversion Channel |
| EMS | Environmental Management System |
| IRR | Internal Rate of Return |
| SAG | Semi-Autogenous Grinding |
| 11 July 2024 |
| Florida Canyon Gold Mine | Page 16 |
| Florida Canyon Gold Inc. | NI 43-101 Technical Report |
1.0 SUMMARY
1.1 Introduction
Dr. Todd Harvey (SME Registered Member), Ms. Terre Lane (MMSA QP), Dr. Hamid Samari (MMSA QP) and Larry Breckenridge (PE) were retained by Argonaut Gold Inc. (Argonaut) to prepare this technical report (the Report) on the Florida Canyon Gold Mine (FCM) in Nevada, USA for Florida Canyon Gold Inc. (FCGI) for the purpose of documenting the technical information available on the FCM in connection with the listing of FCGI on the TSX Venture Exchange (TSXV) as required by the policies of the TSXV.
On March 27, 2024, Argonaut and Alamos Gold Inc. (Alamos) entered into an arrangement agreement (the Arrangement Agreement), whereby Alamos will acquire all of the issued and outstanding shares of Argonaut pursuant to a court approved plan of arrangement (the Arrangement). As part of the Arrangement, Alamos will acquire Argonaut's Magino mine and Argonaut's assets in the United States and Mexico will be spun out to FCGI. As a result, FCGI will own the Florida Canyon mine.
This Report has been addressed to FCGI, as the Authors intend that FCGI be entitled to rely on it in connection with the Arrangement and the transactions contemplated thereby. The authors also intend for this Report to be filed on SEDAR+ by FCGI.
Prior to the completion of the Arrangement, Argonaut wholly-owned the FCM. Argonaut acquired the property through a merger with Alio Gold Inc. (Alio) that closed on July 1, 2020. Following the completion of the Arrangement, the FCM will be wholly-owned by FCGI.
Mineral Resources and Mineral Reserves are reported for the FCM assuming open pit mining methods. The mine was in continuous operation from 1986 through 2011 and then intermittently until 2015. It was reopened in mid-2016 and has been in operation since that time.
1.2 Terms of Reference
Mineral Resources and Mineral Reserves are reported in accordance with the Canadian Institute of Mining, Metallurgy and Petroleum (CIM) Definition Standards for Mineral Resources and Mineral Reserves (May 2014; the 2014 CIM Definition Standards) and the CIM Estimation of Mineral Resources and Mineral Reserves Best Practice Guidelines (November 2019; the 2019 CIM Best Practice Guidelines).
Units used in the report are imperial units unless otherwise noted. Monetary units are in US dollars ($) unless otherwise stated. The Report uses US English.
FCM uses the term "run-of-mine" (ROM) which is material that is placed directly on the heap leach pad (HLP) without crushing and "waste rock storage facility" (WRSF) for the area where waste rock will be stored.
1.3 Project Setting
FCM is located just off Interstate Highway I-80 (I-80), 125 miles northeast of Reno, Nevada. The nearest towns are Winnemucca, 40 miles northeast with a population of 8,388 (2022) and Lovelock, 33 miles southwest, with a population of 1,854 (2022). The highway exit for the FCM from I-80 is at Imlay, Nevada. The property location is 40.586088 degrees north latitude by 118.257365 degrees west longitude. Access is reliable via the Interstate Highway year around.
| 11 July 2024 |
| Florida Canyon Gold Mine | Page 17 |
| Florida Canyon Gold Inc. | NI 43-101 Technical Report |
1.4 Mineral Tenure, Royalties, Environmental Liabilities and Permitting
The land package owned or leased by FCM covers a total of 18,630.8 acres. Fee lands total 5,520.4 acres and unpatented claims total 13,110.4 acres. Contained within the fee lands are 19 patented claims totaling 359.9 acres. This land position includes both FCM and the Standard Mine (StdM) which is located south of FCM. This report addresses FCM only and does not include any Mineral Resources within the StdM property holdings.
Royalty interests at FCM have been consolidated since publications in 2019 and are reported by FCM accounting personnel to be:
• Top Hat Partnership 2.5% NSR
• Maverix Metals, Inc. 3.0% NSR
The Maverix Metals Inc. (Maverix) royalty historically changed at different locations across the property. Alio negotiated a fixed 3% royalty with Maverix on 22 November 2019.
FCM reports that all environmental and operational permits are in place to continue operations. Specifics of environmental permitting will be summarized in Section 20. The U.S. Bureau of Land Management (BLM) and the State of Nevada regulations require closure and reclamation of mineral projects, and a reclamation permit must include a financial surety to ensure that the reclamation will be completed. FCM has a reclamation surety to fund closure and reclamation of the mine operations disturbance and is currently permitted for reclamation.
1.5 Geology, Mineralization, and Deposit Type
FCM and StdM are situated in northwestern Nevada within the Great Basin and Humboldt Range physiographic province, which is typified by a series of northward-trending elongate mountain ranges separated by alluvial valleys. Rocks exposed in the region range in age from Cambrian to Holocene and comprise thick sequences of sedimentary, volcanic, intrusive and metamorphic rocks in a complex structural environment (Johnson, 1977). Rocks of the Rochester Rhyolite, Prida Formation, Natchez Pass Limestone, and Grass Valley Formation are exposed in the FCM area. All of these units are of Triassic age. The Humboldt City Thrust Fault separated the Natchez Pass and Grass Valley formations from the underlying Prida Formation, and much of the middle and lower units of the Natchez Pass Limestone have been cut out above the thrust fault. FCM gold deposits are hosted by the Grass Valley Formation and Natchez Pass Limestone along with sill/limestone contact zones within Prida Formation. The general strike of the stratigraphy at FCM is N30oE with a 30- to 40-degree dip to the west.
The location and geometry of the mineralized bodies at FCM are a result of structure; the presence of favorable silty argillite, quartzite, and limestone host rocks; and the position of the host rocks relative to structural conduits. The higher-grade zones of mineralization tend, in general, to follow the high-angle, northeast- and northwest-trending fault and shear zones. The more moderate- or lower-grade zones are controlled by favorable host rocks more distal to feeder structures.
| 11 July 2024 |
| Florida Canyon Gold Mine | Page 18 |
| Florida Canyon Gold Inc. | NI 43-101 Technical Report |
Rock units that are more favorable hosts to mineralization include silty argillite, hornfels contact zones with mafic sills, karsted limestone, and platy, silty limestone with interbeds of calcareous shale. Local factors that influence the occurrence and geometry of mineralized bodies include variations in folds, foliation, and bedding in favorable units, intersecting structural fabrics, and proximity to low-angle structures (Taylor, 2001). Hypogene mineralization at FCM consists of native gold and electrum associated with quartz, iron oxides, pyrite, marcasite, and arsenopyrite (Hastings, et al., 1987). Quartz is the major gangue material.
FCM is a large, relatively young epithermal gold deposit adjacent to an active geothermal system. The close spatial association with the geothermal system has led to a general belief that FCM is a hot spring-style, epithermal gold deposit. Hydrothermal alteration assemblages and the mineralogy of both oxidized and unoxidized gold mineralization at FCM have been described and interpreted by Fifarek et al. (2011) as having formed in a low-sulfidation, epithermal environment.
1.6 History
Prior to Argonaut acquiring its project interest, companies involved in the project area included Pegasus Gold Corporation (Pegasus), Apollo Gold Inc. (Apollo), Jipangu Inc.(Jipangu), and Rye Patch Gold Corp (Rye Patch). Work completed included prospecting, geological mapping and reconnaissance, rock, stream, sediment, and soil geochemical sampling, trenching, RC and core drilling, open pit development, and mining studies.
In 2020, Argonaut acquired control of FCM through a merger with Alio.
FCM has completed geological mapping, soil and grab sampling, rotary air blast (RAB), reverse circulation (RC) drilling and diamond drill hole (DDH) core drilling, Mineral Resource and Mineral Reserve estimation, metallurgical test work, environmental test work as well as mining and supporting studies. A Technical Report, Preliminary Economic Assessment, was completed in 2016 and published in 2017 (Keech, 2017), a Technical Report on life of the Mine Plan and Mineral Reserves for the project was completed in 2018 and published in 2019 (SRK, 2019), and a Technical Report on Mineral Resources and Mineral Reserves was completed in 2020 (IMC, 2020). The current Technical Report was completed in 2024 and incorporates new drilling and updated information since the previous Technical Report (2020).
On March 27, 2024, Argonaut and Alamos announced they had entered into the Arrangement Agreement whereby Alamos will acquire all of the issued and outstanding shares of Argonaut pursuant to a court approved plan of arrangement. As part of the Arrangement, Alamos will acquire Argonaut's Magino mine and Argonaut's assets in the United States and Mexico (including the Florida Canyon mine) will be spun out to FCGI.
1.7 Drilling and Sampling
The drill hole database provided for modeling includes most of the historical drilling through the 2023 drill season. Some historical drilling that was either exploration drilling too distal to the deposit area to be used or could not be validated has been excluded. The current database has 4,821 holes amounting to 2,091,843 feet of drilling. Since 2020, FCM has added 32 core holes consisting of 19,341 feet of drilling and 510 RC holes consisting of 137,293 feet of drilling. The current database contains 384,919 assayed intervals for gold.
| 11 July 2024 |
| Florida Canyon Gold Mine | Page 19 |
| Florida Canyon Gold Inc. | NI 43-101 Technical Report |
Before Argonaut, at FCM eighty five percent (85%) of the drilling was RC drilling which was completed by the operators Pegasus and/or Apollo, between the years 1981 and 2004. Jipangu drilled 15%, and Rye Patch drilled less than 0.5% of the total RC holes prior to 2018. RC drilling was completed using wet methods, where water was injected down-hole from the collar until ground water was intersected in the hole. The slurry of water and drill cuttings was directed to a rotating wet splitter, where the samples were reduced to approximately 10 to 15 lbs and collected in porous sample bags. Bags were pre-labeled with drill hole ID and sample interval. RC samples were collected at 5-foot intervals at the rig by the drill contractor. The 54 DDH core holes were a mix of 50% vertical and 50% angle drilling. Angled hole inclinations varied from 40 to 75 degrees.
Since 2020, FCM has added thirty-two 32 core holes, consisting of 19,341 feet of drilling and 510 holes totaling 137,293 feet of RC. Of the 384,919 assay intervals, 57,940 have been added by FCM. Since 2020, RC drill holes have been typically 5-1/4 inches in diameter, with some collars being drilled with a 7-5/8 tri-cone when in unconsolidated material at the hole collar, and some 6 inch diameter holes were also drilled.
Recovered cuttings were delivered to a rotary splitter for sample collection. The drill contractors collected a sample of the split at the rig during drilling using a pre-labeled bag. Samples were collected at 5-foot intervals and typically range from 10 to 15 pounds in weight.
Two diameters of core have been collected since 2020. The primary core size was HQ (2-1/2 inches), with PQ (3-1/2 inches) being utilized only at the top of the hole where casing was required. Core was collected from the drill using the standard wireline method with split core tubing sampling methods. All the core was washed and placed in core boxes.
1.8 Data Verification
Internal data verification by FCM personnel consisted of a review of database inputs. Data was manually checked for errors and gaps prior to database upload, and any identified issues were corrected.
A number of verification programs were completed on historical data and in support of Technical Reports regarding FCM by third parties in the period 2016 to 2024. No material issues were identified during these programs.
The QPs individually reviewed the information in their areas of expertise and concluded that the information supported Mineral Resource and Mineral Reserve estimation and could be used in mine planning and in the economic analysis that supports the Mineral Reserve estimates.
1.9 Metallurgical Test Work
Routine metallurgical test work for ore placed on the South Heap Leach Pad (SHLP) is conducted on samples that are representative of the various types and styles of mineralization and the mineral deposit as a whole. These samples were sourced from either the Main, Central, Jasperoid and/or Radio Tower open pits. Test work consists of small (220 lb) and large (1,545 lb) test leach columns, bottle roll testing on daily crusher samples, and cyanide soluble (AuAA) analysis of blasthole samples and test column material. Carbon suite testing for carbon hardness, activity and attrition is conducted on new carbon supply options as needed. Carbon activity testing is done on every strip, acid wash and reactivated carbon batch, which informs the performance quality of both the Carbon-in-Column (CIC) and elution circuits. All metallurgical test work is supported on-site by an analytical lab equipped with atomic adsorption spectrometers (AA's), fire assay furnaces, LECO carbon/sulfur analyzer (commencing Q3-2024) and sample preparation equipment. The test work and analytical equipment are all typical of industry.
| 11 July 2024 |
| Florida Canyon Gold Mine | Page 20 |
| Florida Canyon Gold Inc. | NI 43-101 Technical Report |
FCM leach pads have been in operation for more than 35 years. In that time, several hundred columns, countless bottle roll tests and continuous pad/solution and carbon sampling campaigns have been conducted to determine expected gold recovery. This testing has been conducted on ore and exploration samples from several different pits and areas covering many rock lithologies. Apart from Radio Towers ore, testing indicates all ores behave in a similar fashion, and as such, gold recoveries are also similar and predictable. These many years of operation and testing have provided a wealth of metallurgical information that forms the knowledge base behind the FCM heap leach performance predictions.
1.10 Mineral Resource Estimation
The grade estimate was constructed using a block size of 30 x 30 x 20 feet high.
An oxide-sulfide boundary surface was interpreted from independently modeled solids built on logging data collected from drill holes. The oxide-sulfide boundary surface was assigned to the block model and used in recovery and cutoff grade parameters when calculating Mineral Resources and Mineral Reserves.
Block grade estimation was accomplished using Localized Indicator Kriging (LIK), which combines the histograms from a panel-sized Multiple Indicator Kriging (MIK) with the locations of block values from an Ordinary Kriging model (OK), which is referred to as the localizer model. Block estimation was limited by distance using the average distance to the nearest three drillholes. No blocks were estimated that had an average distance greater than 300 feet.
LIK models use a Variance Reduction Factor (VRF) to control the final block distribution and that factor was established by comparing a series of LIK models with different VFRs to the blasthole block model. This was done in a previous update in the Main domain where a VRF of 0.2 was determined and used for all the domains. However, because of significant production in the Central domain a VRF of 0.1 was determined from the blasthole model and used in that domain. The selection of this lower factor allows the LIK model to reconcile the tons and grades in the blasthole model quite closely.
The OK localizer model used the same block definition as was used in previous models (see Table 14-2), and the MIK model used 120-foot by 120-foot panels that coincided spatially with the localizer blocks. This resulted in sixteen OK blocks inside each panel.
1.11 Mineral Resource Statement
Mineral Resources are reported in-situ, using the 2014 CIM Definition Standards. Mineral Resources are reported inclusive of those Mineral Resources converted to Mineral Reserves.
Mineral Resources that are not Mineral Reserves do not have demonstrated economic viability. Mineral Resources have an effective date of 31 December 2023.
| 11 July 2024 |
| Florida Canyon Gold Mine | Page 21 |
| Florida Canyon Gold Inc. | NI 43-101 Technical Report |
The Qualified Person for the estimate is Ms. Terre Lane, MMSA QP, a GRE employee.
Table 1-1: Mineral Resource Statement - effective 31 December 2023
Material | Class | Cut-off Grade (Gold oz/ton) | Tonnage (tons x 1000) | Gold Grade (oz/ton) | Contained Au (oz x 1000) |
Oxides | Measured | 0.0039 - 0.0046 | - | - | - |
Indicated | 0.0039 - 0.0046 | 93,036 | 0.0100 | 933 | |
Sulfides | Measured | 0.0162 | - | - | - |
Indicated | 0.0162 | - | - | - | |
Sub-Total | Measured & indicated | 0.0039-0.0162 | 93,036 | 0.0100 | 933 |
Oxides | Inferred | 0.0039 - 0.0046 | 40,067 | 0.0091 | 366 |
Sulfides | Inferred | 0.0162 | 66,098 | 0.0281 | 1,854 |
Sub-Total | Inferred | 0.0039-0.0162 | 106,165 | 0.0209 | 2,220 |
1. Mineral Resources are reported, using the 2014 CIM Definition Standards, with an effective date of 31 December 2023. The Qualified Person for the estimate is Ms. Terre Lane, MMSA QP, a GRE employee. 2. Mineral Resources are reported inclusive of those Mineral Resources converted to Mineral Reserves. Mineral Resources that are not Mineral Reserves do not have demonstrated economic viability. 3. Mineral Resources are constrained within a conceptual open pit shell that uses the following assumptions: gold price of US$1,800/oz; gold recoveries ranging from 45% to 64% for oxides and 80% for sulfides; reference mining cost of $2.49/ton mined in-situ and $1.89/ton mined fill; processing cost of $4.51/ton processed for oxide crushed material and $2.42/ton processed for oxide ROM material; processing cost of $21.00/ton processed for sulfide material; general and administrative costs of $1.09/ton processed; treatment and refining costs of $6.57/oz Au recoverable; royalty of $88.00/oz Au recoverable, and pit slope overall angles ranging from 30-36°. 4. Mineral Resources are reported at a cut-off grade ranging from 0.0039 oz/ton to 0.0057 oz/ton for oxides and is 0.0162 oz/ton for sulfides. 5. Mineral Resources include a stockpile inventory of 1,206.9 ktons at an average grade of 0.0052 oz/ton and total contained gold of 6.22 koz. 6. Mineral Resources include heap leach inventory of 3,928.7 ktons at an average grade of 0.0101 oz/ton and total contained gold of 39.64 koz. 7. Numbers have been rounded and may not sum. | |||||
1.12 Mineral Reserve Estimation
Open pit Mineral Reserves were estimated by FCM through the application of a mine design, phasing sequence and subsequent mine plan to convert the Measured and Indicated Mineral Resources to Proven and Probable Mineral Reserves. Inferred Mineral Resources were not included and were assigned to waste. The estimate is based upon the application of a typical truck-loader open pit mining operation to excavate the Mineral Reserve followed by a conventional heap leaching process and by a CIC capture with loaded carbon pressure stripped. Gold is recovered by electrowinning and the precipitate melted into doré bars.
There are two principal ore type classifications used to identify Mineral Reserves at FCM: Crushed and ROM. Additionally, material is identified as being associated with the Radio Tower deposit or Central deposit (including both the Main and Jasperoid deposits). The Radio Tower deposit has been identified as having a different metallurgical recovery response than the Central deposit.
Both Crushed and ROM material meets the requirements of the breakeven cut-off grade (COG) definition as stated in the CIM Estimation of Mineral Resources and Reserves Best Practice Guidelines (2019), being "The lowest grade or value of material that can be mined and processed at an operating profit, considering all applicable costs".
| 11 July 2024 |
| Florida Canyon Gold Mine | Page 22 |
| Florida Canyon Gold Inc. | NI 43-101 Technical Report |
1.13 Mineral Reserve Statement
Mineral Reserves are reported at the point of delivery to the process plant using the 2014 CIM Definition Standards and have an effective date of 31 December 2023.
The Qualified Person for the estimate is Ms. Terre Lane, MMSA QP, a GRE employee.
Table 1-2: Mineral Reserve Statement - effective 31 December 2023
Category | Tonnage (tons x 1000) | Gold Grade (oz/ton) | Contained Gold (oz x 1000) |
Proven | - | - | - |
Probable | 85,352 | 0.0101 | 861 |
Proven & Probable | 85,352 | 0.0101 | 861 |
1. Mineral Reserves are reported at the point of delivery to the process plant, using the 2014 CIM Definition Standards, with an effective date of 31 December 2023. The Qualified Person for the estimate is Ms. Terre Lane, MMSA QP, a GRE employee. 2. Mineral Reserves are constrained within an open pit design that uses the following assumptions: gold price of US$1,800/oz considering only oxide material; gold recoveries varied by deposit and ore type, ranging from 45% to 64%; reference mining cost of $2.49/ton mined in-situ and $1.89/ton mined fill; processing cost of $4.51/ton processed for oxide crushed material and $2.42/ton for oxide ROM material; G&A costs of $1.09/ton ore processed; treatment and refining costs of $6.57/oz gold recoverable; royalty costs of $88.00/oz gold recoverable; and pit slope inter-ramp angles ranged from 38-42° for rock and 30° for alluvium / fill. 3. Mineral Reserves are reported at a cut-off grade ranging from 0.0039 oz/ton to 0.0057 oz/ton. 4. Mineral Reserves include a stockpile of 1,206.9 ktons at an average grade of 0.0052 oz/ton and total contained gold of 6.22 koz. 5. Mineral Reserves include Heap Leach Inventory of 3,928.7 ktons at an average grade of 0.0101 oz/ton and total contained gold of 39.64 koz. 6. Numbers have been rounded and may not sum. | |||
1.14 Mining Method
1.14.1 Hydrologic Considerations
Groundwater is not considered to play a role in the slope stability at FCM based on the groundwater depths. However, snow melt and surface water runoff during spring can recharge open surface fractures and potentially trigger or reactivate slide areas and therefore measures should be taken to drain runoff away from the open pits and prevent / minimize pooling, seepage, etc.
1.14.2 Open Pit Geotechnical Considerations
Recent geotechnical studies focused particularly on the west to northwest facing highwalls of the Central, Main and / or Radio Tower open pits. These pit slopes form the highest pit slopes and have had past slope failures principally restricted to the northwest facing slopes, implying a structural control on the instability.
This structural control is considered to be related to the regional structural fabric that has been recognized at FCM as well as other mine sites in the Humboldt Range including StdM, Spring Valley Mine, and the Rochester Mine. The foliation generally dips northwest; however, it is expected that there is considerable localized variability in the dip orientation.
| 11 July 2024 |
| Florida Canyon Gold Mine | Page 23 |
| Florida Canyon Gold Inc. | NI 43-101 Technical Report |
1.14.3 Mine Plan
Mining at FCM is currently conducted using conventional truck and loader open pit mining methods. The mining operation is conducted with a fleet of 100 ton payload haul trucks combined with large front-end loaders (FELs) as primary loading units. The open pit operates at a peak mining rate of 81,000 tons per day (tpd) of ore and waste and has an overall strip ratio of 0.88:1 (waste:ore).
Waste and ore are drilled and blasted, loaded by FELs and transported by haul trucks to WRSFs, stockpiles, the primary crusher, or directly to the leach pad as ROM. Crushed ore is loaded into haul trucks and stacked on the HLP where both crushed and ROM ore are co-mingled and irrigated with a dilute cyanide solution and recovered with carbon columns.
The selection of the mining phases was based upon an incremental analysis of optimized pit solutions generated at increasing gold prices, as well as geometric considerations for safe and efficient mining and access to the WRSFs, primary crusher, ore stockpiles and HLP. FCM preferentially utilizes a minimum phase width of 200 feet but at times this does become smaller in areas of limited extent.
A total of 10 phases remain to be excavated across four open pits: 03-phases in the Central Pit (Phase 01-C1, Phase 02-C6 and Phase 03-C7), 01-phase in the Jasperoid Pit (Phase 04-J2), 03-phases in the North Pit (Phase 05-N1, Phase 06-N2 and Phase 07-N3) and 03-phases in the Radio Tower Pit (Phase 08-R1, Phase 09-R2 and Phase 10-R3).
1.15 Recovery Methods
Crushed ore passes through two stages of open circuit crushing to a final crush size of 80% minus 1½ inches. The current crushing circuit target is 21,000 tpd. Crushed ore is then agglomerated with a polymer binding agent to improve solution percolation through the HLP and is delivered to the HLP via haul truck. The ore can also be delivered to the pad through a series of mobile ramp conveyors and mobile grasshopper conveyors, or a combination of both. At present, the overland conveyor system is not being utilized due to operational issues and the potential for re-implementation in the future is being studied. Crushed and ROM ores are co-mingled at the pad dump face. Lime is added directly to haul trucks carrying ROM ore from a silo or via a separate lime silo for crushed ore as it is conveyed to the stockpile.
Barren solution (cyanide-bearing solution very low in gold grade) is applied selectively to different areas of the pad through drip irrigation tubing at an average application rate of 0.003 gallons per minute per square foot.
Pregnant solution (gold bearing) from the bottom of the pad reports to the pregnant solution pond and is then pumped to one of two trains of carbon columns where precious metals are adsorbed onto activated carbon.
Loaded carbon is transported to the plant by truck where gold is eluted (stripped or redissolved) under pressure and high temperature in a 3-ton vessel. The desorbed gold and silver are recovered from solution electrolytically by two electrowinning cells in series.
| 11 July 2024 |
| Florida Canyon Gold Mine | Page 24 |
| Florida Canyon Gold Inc. | NI 43-101 Technical Report |
The plated material (sludge) from electrowinning is retorted for drying and mercury removal. Once retorted, the sludge is mixed with flux and smelted in a 150-kilowatt induction furnace. Doré bars are the final product at FCM and are shipped to a third-party refiner at 90-95% Au/Ag purity.
FCM has operated for over 35 years as a heap leach operation. Operational knowledge and experience gained during this period has allowed for the streamlined operations that exist today. As future ore types planned for the South Heap Leach Pad (SHLP) are expected to perform metallurgically like those leached in the past, it can be expected that the processing efficiencies reported in this section will continue.
1.16 Project Infrastructure
FCM has been in production intermittently since 1986 and all the infrastructure that is required to sustain production is in place. However, some infrastructure will need to be expanded or modified to complete the mine plan as developed in this Report.
1.17 Environmental, Permitting and Social Considerations
FCM has all permits in place to continue mine operations. Additional permits required for mine life extension are in progress to assure continuity of operation. Those are typically associated with the planned expansions of the SHLP. Final permitting is expected by the end of Q2-2024.
1.18 Markets and Contracts
Mineral Resources and Mineral Reserves have been assessed using the gold price of $1,800.00/oz provided by Argonaut.
Gold and silver markets are mature global markets with reputable refiners located throughout the world. Note that silver is not assayed at FCM due to its low economic impact on the operation and therefore not included in the declaration of Mineral Resources and Mineral Reserves.
Gold output from the FCM operation is in the form of doré containing approximately 55% gold and 45% silver on average. Silver credits are received from the Refiner. The doré is shipped to the Asahi Refining USA Inc. (Asahi) facility located in Salt Lake City.
1.19 Capital Cost Estimates
The capital cost estimate for the LOM is estimated as $144M and includes:
• Leach pad expansion costs, including CIC and pregnant solution pond expansions,
• Design development and quantity growth allowances, and
• Owner's costs
Total capital costs estimated are summarized in Table 1-3.
| 11 July 2024 |
| Florida Canyon Gold Mine | Page 25 |
| Florida Canyon Gold Inc. | NI 43-101 Technical Report |
Table 1-3: Capital Cost Estimate
Description | Unit | Total |
Leach Pad | $M | 56.8 |
RT Relocation | $M | 3.0 |
Equipment Lease | $M | 21.2 |
| Salvage Value | $M | (10.0) |
Reclamation | $M | 37.82 |
Other | $M | 35.2 |
Total | $M | 144.1 |
1. Numbers have been rounded and may not sum.
1.20 Operating Cost Estimates
The operating cost estimate for the LOM is estimated as $736M or $9.03/ton processed and is summarized in Table 1-4.
Table 1-4: Operating Cost Estimates
Description | Life-of-Mine ($M) | Life-of-Mine ($/ton processed) |
Mining | 340.9 | 4.19 |
Crushing | 98.5 | 1.21 |
Processing | 139.9 | 1.72 |
G&A | 152.7 | 1.88 |
Refining | 3.5 | 0.04 |
Total | 735.5 | 9.03 |
1. Mining costs include capitalized stripping costs.
2. G&A costs include Nevada Gold & Silver Excise Tax, Nevada Net Proceeds Mining Tax and royalties.
3. Numbers have been rounded and may not sum.
1.21 Economic Analysis
A financial analysis for FCM was developed by FCM and Argonaut personnel using a discounted cash flow approach on a pre-tax and after-tax basis. The net present value (NPV) was calculated from the cash flow generated by FCM based on a discount rate of 5% utilizing gold metal selling prices of $2,200/oz for 2024, $2,150/oz for 2025/2026 and thereafter $1,900/oz. Gold metal prices are elevated in the first 03-years to reflect current metal price trends with latter years reverting to slightly above the 03-year trailing average. Silver metal selling price is assumed as $20/oz. Note that silver is included in the financial model based on historical recovery of silver metal equivalent to 56% of gold production and does not form part of the Mineral Reserve declared in this Report.
The resultant pre-tax NPV discounted at 5% is $141 M, with an internal rate of return (IRR) of 257%, and a payback period is 1.44 years. On an after-tax basis, the NPV 5% is $128 M with an IRR of 246%, and the payback period is 1.46 years.
An economic analysis of FCM using the financial model adjusted for Mineral Reserve reporting metal prices declared in this report of $1,800 per ounce gold was undertaken (note that silver credits were removed as silver is not part of the declared Mineral Reserve). The pre-tax Mineral Reserve price financial model resulted in an undiscounted cash flow of $81 M with an NPV 5% of $50 M. On an after‑tax basis, the Mineral Reserve financial model resulted in an undiscounted cash flow of $78 M with an NPV 5% of $47 M. The minimal change in value between pre-tax and after-tax cash flows is a result of the utilization of current and projected tax attributes.
| 11 July 2024 |
| Florida Canyon Gold Mine | Page 26 |
| Florida Canyon Gold Inc. | NI 43-101 Technical Report |
Based on the Mineral Reserve financial analysis, on an NPV basis, FCM is most sensitive to changes in metal prices, and then to a lesser extent, to mining costs and processing costs. FCM is least sensitive to changes in the capital cost.
1.22 Interpretation and Conclusions
Under the assumptions in this Report, the Project shows a positive cash flow over the life-of-mine and supports the Mineral Resource and Mineral Reserve estimates. The projected mine plan is achievable under the set of assumptions and parameters used.
The sulfide component of Mineral Resources shows positive economic value. Historic and current metallurgical test work shows that an economic concentrate can be made from this material.
1.23 Recommendations
1.23.1 Geology
Drilling campaigns reveal great potential across the Project area, but there is significant remaining exploration potential in the principal FCM deposit and environs. Exploration targets include feeder structures at depth and along strike. Due to limited legacy exploratory drilling along the Humboldt City Thrust between FCM and StdM, additional opportunities exist to discover and delineate along this structure. Still, deep drilling needs to test areas along feeder structures and fault terminals on the western side of FCM deposits, which are covered by alluvium.
Geological and structural data is to be collected during this drilling program (and future drilling programs) and should continue to be used to increase geological understanding of the spatial correlation between mineralization and geological structures and inform the resource modeling process.
Results of the exploration RC drilling program proposed will be used to identify potential future drilling targets which will lead to potential future exploration activities to expand knowledge of mineralization and potentially expand future Mineral Resources outside of known, exploited deposits. Estimated cost associated with the exploration RC drilling - $950,000.
Oxide mining operations at FCM in addition to a potential future sulfides project would benefit from better knowledge of the oxide-sulfide boundary. There could be more leach amenable material just below the currently interpreted oxide-sulfide boundary that are not actually sulfides. As a result, more drilling is recommended within the known FCM deposit area to improve definition of the oxide-sulfide boundary, and to collect samples for process metallurgical testing. A complete metallurgical testing program should be completed on the fresh oxide, transitional and sulphide material samples obtained during the program and be used to support improved understanding of relationships between cyanide assays and fire assays results in addition to the metallurgical response of sulphide material related to a potential future development of a sulfide project. Estimated cost associated with the drilling program and assaying and metallurgical testing work - $1,300,000.
| 11 July 2024 |
| Florida Canyon Gold Mine | Page 27 |
| Florida Canyon Gold Inc. | NI 43-101 Technical Report |
1.23.2 Mining
FCM should review the re-implementation of the overland conveyor and grasshopper conveying system to minimize truck haulage hours and minimize ore re-handle. This review should result in a go, no-go decision regarding re-implementation of the system. Estimated cost associated with this review - $50,000.
Sulfide tonnage, grade, and process options should be evaluated in a timely manner such that if a sulfide operation is warranted. If results of options are positive, permit applications can be started in advance to assure a transition from oxide to sulfide operations without a major hiatus to production.
1.23.3 Metallurgy and Processing
Should transitional sulfide mineralization be treated on the existing HLPs, test work should be conducted to examine the gold recovery as well as the reagent consumption, specifically lime. It may also be important to understand the long-term stability of this material so that the heap does not become acid generating. This work could be conducted on site by the existing staff.
Carbon testing and CIC modeling should be conducted to maximize gold recovery in the carbon circuit. This testing should also model carbon stripping and regeneration to determine if future bottlenecks will arise once the CIC expansion is completed. Estimated cost is $50,000.
Additional telemetry should be installed to allow operators to monitor remote equipment without traveling to the remote location. Some of the telemetry elements are still available onsite and need to be revived. A telemetry study would be necessary to determine what additional equipment is necessary to reestablish this network. This study, which would lead to a decision as to the feasibility and cost required to expand the telemetry system is estimated to cost $50,000. If a positive decision is made to expand the system, this cost may be absorbed by the vendor in exchange for providing the equipment and installation services for the upgraded / expanded telemetry system.
1.23.4 Environmental Studies
A new Environmental Management System (EMS) should be considered for implementation. Currently, FCM operates in compliance utilizing a system of plans and permitting requirements, with data collected to series of spreadsheets making both data and information difficult to query. However, a true EMS which includes training, data management and permit obligations charts would provide much clearer and quicker access to information. Field tablets should be incorporated to assist with data collection for the EMS. The estimated cost is $130,000.
A site weather station should be considered for implementation. Currently, FCM operates with several smaller portable weather reporting units that are cloud based and have no provision for downloading data. Being cloud based, this results in data loss occurring whenever internet service is lost. The estimated cost of installation of a fixed weather station at site is $20,000.
An auto sampling unit which would help with collecting the data during well sampling should be considered. The estimated cost is $2,000.
| 11 July 2024 |
| Florida Canyon Gold Mine | Page 28 |
| Florida Canyon Gold Inc. | NI 43-101 Technical Report |
2.0 INTRODUCTION
Dr. Todd Harvey (SME Registered Member), Ms. Terre Lane (MMSA QP), Dr. Hamid Samari (MMSA QP) and Larry Breckenridge (PE) from Global Resource Engineering, Ltd. (GRE) were retained by Argonaut to prepare this Report on the FCM in Nevada, USA for FCGI for the purpose of documenting the technical information available on the FCM in connection with the listing of FCGI on the TSXV as required by the policies of the TSXV.
On March 27, 2024, Argonaut and Alamos entered into an Arrangement Agreement, whereby Alamos will acquire all of the issued and outstanding shares of Argonaut pursuant to a court approved plan of arrangement. As part of the Arrangement, Alamos will acquire Argonaut's Magino mine and Argonaut's assets in the United States and Mexico will be spun out to FCGI. As a result, FCGI will own the Florida Canyon mine.
This Report has been addressed to FCGI, as the Authors intend that FCGI be entitled to rely on it in connection with the Arrangement and the transactions contemplated thereby. The authors intend for this Report to be filed on SESAR+ by FCGI.
Prior to the completion of the Arrangement, Argonaut wholly-owned the FCM. Argonaut acquired the property through a merger with Alio Gold Inc. (Alio) that closed on July 1, 2020. Following the completion of the Arrangement, the FCM will be wholly-owned by FCGI.
This Report has been prepared in accordance with the disclosure and reporting requirements set forth in the Canadian Securities Administrators’ National Instrument 43-101 (“NI 43-101”), Companion Policy 43-101CP, and Form 43-101F1, as well as with the Canadian Institute of Mining, Metallurgy and Petroleum’s “CIM Definition Standards - For Mineral Resources and Reserves, Definitions and Guidelines” (“CIM Standards”) adopted by the CIM Council on November 29, 2019.
The Qualified Persons (QPs) responsible for the preparation of this Technical Report are:
Terre Lane, MMSA 01407QP, Society of Mining, Metallurgy, and Exploration (SME) Registered Member 4053005
Todd Harvey, PhD, PE, SME Registered Member 4144120
Hamid Samari, PhD, MMSA 01519QP
Larry Breckenridge, P.E.: No. 12694 in New Hampshire and No. 38048 in Colorado.
The QPs are collectively referred to as the "Authors" of this Report and none have an affiliation with Argonaut except for that of an independent consultant/client relationship.
Dr. Samari, Ms. Lane, and Dr. Harvey have visited the FCM property. Ms. Lane, Principal Mining Engineer for GRE, conducted a site visit to FCM in January 2023 and January 2024. Dr. Hamid Samari, Senior Geologist for GRE, conducted a site visit to FCM in January 2024. Dr. Todd Harvey, Director of Process Engineering for GRE, conducted a site visit to FCM in May 2023.
In addition to their own work, the Authors have made use of information from other sources and have listed these sources in this document under "References."
| 11 July 2024 |
| Florida Canyon Gold Mine | Page 29 |
| Florida Canyon Gold Inc. | NI 43-101 Technical Report |
Table 2-1 shows the report sections and responsible QP.
Table 2-1: Contributing Authors
Section | Section Name | Responsibility | Author/ QP |
1.0 | Summary |
|
|
1.1 | Introduction | GRE | All |
1.2 | Terms of Reference | GRE | All |
1.3 | Project Setting | GRE | Terre Lane |
1.4 | Mineral Tenure, Royalties, Environmental Liabilities and Permitting | GRE | Terre Lane |
1.5 | Geology, Mineralization, and Deposit Type | GRE | Hamid Samari |
1.6 | History | GRE | Hamid Samari |
1.7 | Drilling and Sampling | GRE | Hamid Samari |
1.8 | Data Verification | GRE | Hamid Samari |
1.9 | Metallurgical Test Work | GRE | Todd Harvey |
1.10 | Mineral Resource Estimation | GRE | Terre Lane |
1.11 | Mineral Resource Statement | GRE | Terre Lane |
1.12 | Mineral Reserve Estimation | GRE | Terre Lane |
1.13 | Mineral Reserve Statement | GRE | Terre Lane |
1.14 | Mining Method | GRE | Terre Lane |
1.15 | Recovery Methods | GRE | Todd Harvey |
1.16 | Project Infrastructure | GRE | Lane and Harvey |
1.17 | Environmental, Permitting and Social Considerations | GRE | Larry Breckenridge |
1.18 | Markets and Contracts | GRE | Lane and Harvey |
1.19 | Capital Cost Estimates | GRE | Lane and Harvey |
1.20 | Operating Cost Estimates | GRE | Lane and Harvey |
1.21 | Economic Analysis | GRE | Lane and Harvey |
1.22 | Interpretation and Conclusions | GRE | All |
1.23 | Recommendations | GRE | All |
2 | Introduction | GRE | All |
3 | Reliance on Other Experts | GRE | Terre Lane |
4 | Property Description and Location | GRE | Terre Lane |
5 | Access, Climate, Local Resources, Infrastructure and Physiography | GRE | Terre Lane |
6 | History | GRE | Hamid Samari |
7 | Geology Setting and Mineralization | GRE | Hamid Samari |
8 | Deposit Types | GRE | Hamid Samari |
9 | Exploration | GRE | Hamid Samari |
10 | Drilling | GRE | Hamid Samari |
11 | Sample Preparation, Analyses and Security | GRE | Hamid Samari |
12 | Data Verification | GRE | Hamid Samari |
13 | Mineral Processing and Metallurgical Testing | GRE | Todd Harvey |
14 | Mineral Resource Estimates | GRE | Terre Lane |
15 | Mineral Reserve Estimates | GRE | Terre Lane |
16 | Mining Methods | GRE | Terre Lane |
17 | Recovery Methods | GRE | Todd Harvey |
18 | Project Infrastructure | GRE | Lane and Harvey |
19 | Market Studies and Contracts | GRE | Lane and Harvey |
| 11 July 2024 |
| Florida Canyon Gold Mine | Page 30 |
| Florida Canyon Gold Inc. | NI 43-101 Technical Report |
Section | Section Name | Responsibility | Author/ QP |
20 | Environmental Studies, Permitting and Social or Community Impact | GRE | Larry Breckenridge |
21 | Capital and Operating Costs | GRE | Lane and Harvey |
22 | Economic Analysis | GRE | Lane and Harvey |
23 | Adjacent Properties | GRE | Terre Lane |
24 | Other Relevant Data and Information | GRE | Lane and Harvey |
25 | Interpretation and Conclusions | GRE | All |
26 | Recommendations | GRE | All |
27 | References | GRE | All |
The scope of this study included a review of pertinent technical reports and data provided to GRE by Argonaut and FCM relative to the general setting, geology, project history, exploration activities and results, methodology, quality assurance, interpretations, drilling programs, and metallurgy as cited throughout this report. The authors have reviewed much of the available data and made site visits and have made judgments about the general reliability of the underlying data. Where deemed either inadequate or unreliable, the data were either eliminated from use, or procedures were modified to account for lack of confidence in that specific information. The authors have made such independent investigations as deemed necessary in the professional judgment of the authors to reasonably present the conclusions discussed herein. The authors believe the data presented in this report are generally an accurate and reasonable representation of the project.
The Effective Date of this Technical Report is 28 June 2024.
In this report, measurements are generally reported in Imperial units. Unless otherwise indicated, all currency references to dollars ($) in this report refer to currency of the United States of America.
| 11 July 2024 |
| Florida Canyon Gold Mine | Page 31 |
| Florida Canyon Gold Inc. | NI 43-101 Technical Report |
3.0 RELIANCE ON OTHER EXPERTS
The Authors are not experts in legal matters, such as the assessment of the legal validity of mining claims, private lands, mineral rights, and property agreements in the United States of America. The Authors did not conduct any investigations of the environmental, permitting, or social-economic issues associated with FCM, and the authors are not experts with respect to these issues. The Authors have relied fully on Argonaut and FCM for information concerning the legal status of Argonaut and related companies, as well as current legal title, material terms of all agreements, existence of all applicable royalty obligations, and material environmental and permitting information that pertain to FCM.
For environmental compliances, Authors relied on David Raynor, Environmental Superintendent at FCM and an expert on the subject.
The Authors are not experts to offer an opinion regarding taxation on mine operations in Nevada. Authors have relied on the input and calculations from Argonaut regarding taxation.
As of the date of this report, the Authors are not aware of any litigation that could potentially affect FCM.
| 11 July 2024 |
| Florida Canyon Gold Mine | Page 32 |
| Florida Canyon Gold Inc. | NI 43-101 Technical Report |
4.0 PROPERTY DESCRIPTION AND LOCATION
FCM is located adjacent to Interstate Highway I-80 (I-80), 125 miles northeast of Reno, Nevada. The nearest towns are Winnemucca, 40 miles northeast with a population of 8,388 (2022) and Lovelock, 33 miles southwest, with a population of 1,854 (2022). The highway exit for FCM from I-80 is Exit 138 at Imlay, Nevada onto Frontage Road. The property location is 40.586088 degrees north latitude by 118.257365 west longitude. Access is reliable via the Interstate year around.
The land package owned or leased by FCM covers a total of 18,630.8 acres. Fee lands total 5,520.4 acres and unpatented claims total 13,110.4 acres. Contained within the fee lands are 19 patented claims totaling 359.9 acres. This land position includes both FCM and the Standard Mine (StdM) which is located south of FCM. This report addresses FCM only and does not include any Mineral Resources or Mineral Reserves within the StdM property holdings.
Royalty interests at FCM have been consolidated since publications in 2019 and are reported by FCM to be:
- Top Hat Partnership 2.5% NSR
- Maverix Metals, Inc. 3.0% NSR
The Maverix Metals Inc. (Maverix) royalty historically changed at different locations across the property. Alio Gold Inc. (Alio) negotiated a fixed 3.0% royalty with Maverix on 22 November 2019.
Figure 4-1 illustrates the location of FCM on the map of Nevada, USA, and Figure 4-2 illustrates the land map of FCM. Figure 4-3 illustrates a map of current mining leases and claims.
Argonaut acquired control of FCM through a merger with Alio Gold, Inc (Alio). The merger agreement between Alio and Argonaut was completed in 2020.
Pursuant to the Arrangement Agreement and the New Argonaut Contribution Agreement (as defined in the Arrangement Agreement), Florida Canyon Mining Inc. (FCMI), a wholly-owned indirect subsidiary of FCGI, has agreed to create, grant and convey to Alamos, a 2% net smelter return royalty (the FCMI NSR) pursuant to the FCMI NSR Agreement. FCMI may terminate this Agreement at any time, in its sole discretion: (i) upon providing notice to Alamos that the obligations of FCGI under the Alamos Surety Bond Guarantee have been discharged and an acceptable alternative form of security or collateral acceptable to the applicable surety bond providers has been secured by FCGI; or (ii) on any change of control of FCGI resulting in a third party, directly or indirectly, acquiring in any manner, more than 50% of the assets of FCGI, on a consolidated basis, or more than 50% of the common shares in the capital of FCGI (a “Change of Control”), in each case, whether by way of merger, amalgamation, statutory arrangement, recapitalization, take-over bid, issuer bid, exchange offer, sale of assets, joint venture earn-in right, liquidation, winding-up, sale or redemption of a material number of shares or rights or interests therein or thereto, where Alamos’ obligations under the Alamos Surety Bond Guarantee have been discharged and FCMI has provided evidence of such discharge to Alamos, in a form satisfactory to Alamos.
The FCMI NSR is not factored into the royalties described in this report as it is intended to be a temporary royalty arising at closing of the Arrangement Agreement and continuing only in accordance with its terms and in support of the Alamos Surety Bond Guarantee.
| Florida Canyon Gold Mine | Page 33 |
| Florida Canyon Gold Inc. | NI 43-101 Technical Report |
4.1 Environmental Liabilities and Permitting
FCM reports that all environmental and operational permits are in place to continue operations. Specifics of environmental permitting will be summarized in Section 20. The BLM and the State of Nevada regulations require closure and reclamation of mineral projects, and a reclamation permit must include a financial surety to ensure that the reclamation will be completed. FCM has a reclamation surety to fund closure and reclamation of the mine operations disturbance and is currently permitted for reclamation.
| 11 July 2024 |
| Florida Canyon Gold Mine | Page 34 |
| Florida Canyon Gold Inc. | NI 43-101 Technical Report |
Figure 4-1: Property Location in Nevada
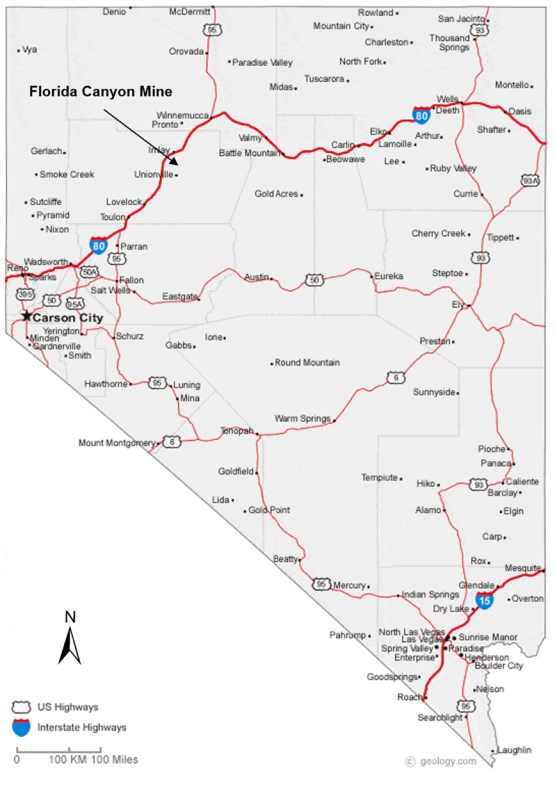
Source: FCM (2024)
| 11 July 2024 |
| Florida Canyon Gold Mine | Page 35 |
| Florida Canyon Gold Inc. | NI 43-101 Technical Report |
Figure 4-2: Florida Canyon Land Map

Source: FCM (2024)
| 11 July 2024 |
| Florida Canyon Gold Mine | Page 36 |
| Florida Canyon Gold Inc. | NI 43-101 Technical Report |
Figure 4-3: Mining Lease and Claims
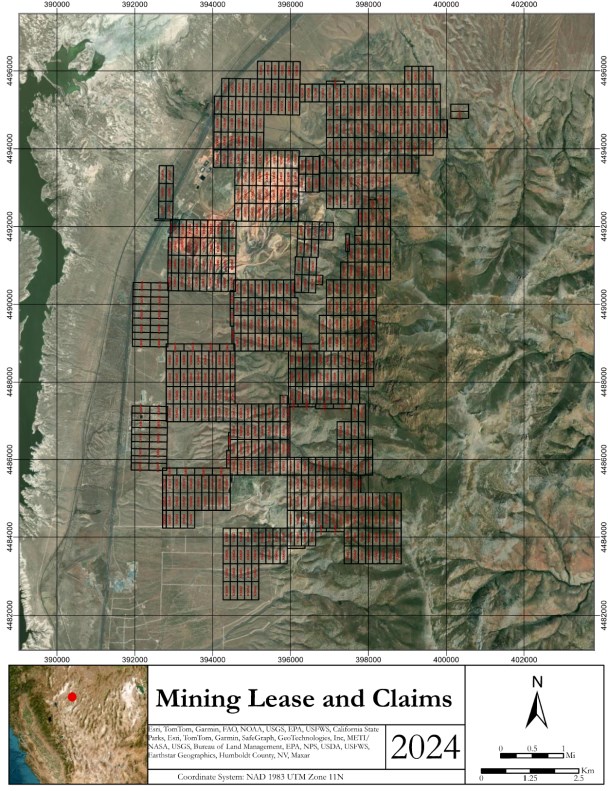
Source: FCM 2024
| 11 July 2024 |
| Florida Canyon Gold Mine | Page 37 |
| Florida Canyon Gold Inc. | NI 43-101 Technical Report |
5.0 ACCESS, CLIMATE, LOCAL RESOURCES, INFRASTRUCTURE, AND PHYSIOGRAPHY
FCM is located in the northwestern portion of the Great Basin on the western flank of the north-south trending Humboldt Range. The physiography of the area consists of basin and range structures with FCM located at the transition from one of the basins and the Humboldt Range. Elevations range from about 4,200 feet on the western side to over 6,000 feet on the east side of the property.
FCM is located adjacent to I-80, 125 miles northeast of Reno, Nevada. The nearest towns are Winnemucca, 40 miles northeast with a population of 8,388 (2022) and Lovelock, 33 miles southwest, with a population of 1,854 (2022). The highway exit for the FCM from I-80 is Exit 138 at Imlay, Nevada onto Frontage Road. The proximity to the Interstate Highway assures year around access to the mine. Power and water are available for the current operation.
The climate is classified as semi-arid characterized by low rainfall, low humidity, with large annual and daily temperature swings. Average temperatures range from 30's (°F) in January to 70's (°F) in July. Winter minimum temperatures are typically in the teens (°F) and summer high temperatures can reach into the 90's (°F). Mine Development Associates (MDA) reported the average annual precipitation for 1935 through 2022, obtained from the nearby Rye Patch Dam weather station from the Western Regional Climate center and from the National Oceanic Atmospheric Administration from the Winnemucca Airport has been 7.9 inches with most of it comprised of snow in the winter months. The minimum annual precipitation was 3.3 inches, and the maximum was 16.2 inches during that time frame. FCM operates year around.
Disturbance at site is planned and submitted for approval to the State of Nevada agencies and the Federal BLM. This disturbance includes pits, haul roads, access roads, waste rock storage facilities (WRSFs), heap leach pads (HLPs), processing ponds, process facilities, truck shop, warehouse and all other office buildings associated with operating a mine. These disturbance limits are monitored by the State and BLM through site inspections and submittals of disturbance areas by the mine to the agencies. Mine personnel are hired locally from the area at prevailing wages and benefits for the mining industry across Northern Nevada.
| 11 July 2024 |
| Florida Canyon Gold Mine | Page 38 |
| Florida Canyon Gold Inc. | NI 43-101 Technical Report |
6.0 HISTORY
The initial portions of this section were published in the Technical Report - Preliminary Economic Assessment for the Florida Canyon Mine, Pershing County, Nevada, USA, by Mine Development Associates, Mine Engineering Services (MDA), as revised on 22 June 2016. SRK added additional text in the 2019 Technical report. Independent Mine Consultants (IMC) added additional text in the later paragraphs in a 2020 Technical Report. GRE updated the history to the current situation.
Gold was discovered during 1860 in Humboldt Canyon, which led to the organization of the Imlay Mining District. Numerous claims were filed in the area and the population of Humboldt City grew to 500 by 1863. Mining in the district was limited until 1906 when the Imlay Gold Mine and the Black Jack Mercury Mine were discovered. Production from the district was low. However, continued exploration resulted in the production of gold, silver, mercury, and tungsten from small mines. The most productive mine in the district was StdM which produced more than $1 million in gold and silver between 1939 and 1949. The Valerie fluorspar deposit near the head of Black Canyon produced about 723 tons of 44% CaF2. Kaolin and sulfur were also shipped from the district.
In 1969, Homestake Mining Company (Homestake) obtained a lease on property in the Florida Canyon area. Seven widely spaced rotary holes were drilled with marginal results, and the property was dropped. Cordilleran Explorations (Cordex) next leased the property between 1972 and 1978. A comprehensive program of geologic mapping, geochemical sampling, and trenching was completed. A total of 25 of 37 drill holes completed were in a mineralized zone referred to as the West Trend, on the site of present day FCM. When Cordex dropped their lease in 1978, Flying J Mines carried out a limited heap-leach operation on the West Trend material.
Between 1969 and 1982, three major mining companies explored the property and chose not to proceed with development of the deposit. For example, during 1980 and 1981, ASARCO completed a drill program of 69 rotary holes that significantly expanded the known mineralization. The grade was low, and ASARCO dropped its interest in the property except for a portion of Section 11 where a 1% Net Profit royalty, now known as the McCullough royalty, remained in effect.
In 1982, Montoro Gold Company (Montoro), a subsidiary of Pegasus Gold Corporation (Pegasus), acquired the property. Montoro began an aggressive program to expand reserves and enlarge the property position. Detailed geologic mapping and geochemical sampling led to the discovery of other anomalous gold occurrences throughout the property. By the end of 1985, 241 drill holes were completed totaling 87,569 feet in the West Trend and adjacent deposits. In addition, 46 holes were completed in other exploration targets to the south and east.
Large-scale column-leach tests were completed in conjunction with additional ore delineation. In November 1985, a decision was made by Pegasus to put the property into production. Permitting and project development followed with startup of a new mine in 1986. Work on processing facilities began in May 1986, with the first ore crushed and delivered to the leach pad in November 1986. During the years that followed, additional drilling added minable material to the project.
Pegasus operated FCM until January 1998. Pegasus was an international gold mining company incorporated in Canada, with headquarters in Spokane, Washington and had gold production of 470,000 ounces from six operations in 1997. Pegasus began having financial problems in 1997 when the price of gold decreased from $370/ounce (oz) in January to $283/oz in December. During this period, Pegasus' Mt. Todd project came on stream and had serious operational problems. In January 1998, Pegasus was unable to service $238 million in debt and filed for bankruptcy under Chapter 11 of the U.S. Bankruptcy Code.
| 11 July 2024 |
| Florida Canyon Gold Mine | Page 39 |
| Florida Canyon Gold Inc. | NI 43-101 Technical Report |
Under two separate plans of reorganization approved by major creditors and confirmed by the court, certain former Pegasus affiliates emerged from bankruptcy protection during February 1999. The first involved the reorganization of Pegasus Gold International, Inc. (the international exploration affiliate of Pegasus) which was reincorporated as Apollo Gold, Inc. which became the holding company for three former Pegasus subsidiaries, including FCM.
Apollo Gold Inc. was acquired during the second quarter of 2002 by Nevoro Gold, Inc. (Nevoro). Nevoro became a publicly traded company on the Toronto Stock Exchange and subsequently changed its name to Apollo Gold Corporation (Apollo). Apollo operated FCM and nearby StdM through its FCM and StdM subsidiaries until Jipangu International Inc. (Jipangu), the U.S. Subsidiary of Jipangu Inc., acquired FCM and StdM properties in November 18, 2005. Jipangu operated the properties until 2015. Jipangu defaulted on debt and the property became majority owned by Admiral Financial Group (Admiral). Rye Patch Gold Corp (Rye Patch), agreed to acquire the FCM property and related assets from Admiral and Jipangu through acquisition of their three subsidiary companies, Florida Canyon Mines Inc., Standard Gold Mines Inc., and Jipangu Exploration in consideration for payment of $15.0 million and 20 million common shares of Rye Patch at closing. A further contingent payment of $5.0 million and 15 million warrants, each warrant exercisable for one common share of Rye Patch at a price of $0.50 per share, was payable following commercial production. Rye Patch agreed to assume certain liabilities of the acquired companies to a maximum aggregate amount. Rye Patch operated the property until the second quarter of 2015 and shut down for about a year.
In mid-2016, Rye Patch resumed open pit mining and heap leaching operations and declared commercial production in December 2017. In May 2018, Alio acquired Rye Patch by way of a Plan of Arrangement transaction and as a result held 100% of the FCM and StdM properties.
In 2020, Argonaut acquired control of FCM through a merger with Alio.
Mineral Resources and Mineral Reserves have been stated previously for FCM. The following tables are for historic reference and do not reflect the Mineral Resources or Mineral Reserves as currently stated by FCM and Argonaut.
Table 6-1 shows historic Mineral Resources and Mineral Reserves, respectively. Table 6-2 shows the Mineral Resources and Mineral Reserves as of 1 June 2020, respectively.
Table 6-1: Historic Mineral Resource Statements for Florida Canyon
MDA, 16 March 2016 | ||||
Class | Cut-off Grade (Gold oz/ton) | Tonnage (tons x 1000) | Gold Grade (oz/ton) | Cont. Gold (oz x 1000) |
Measured | 0.006 | 79,635.4 | 0.013 | 1,035 |
Indicated | 0.006 | 4,566.7 | 0.020 | 91 |
Measured + Indicated | 0.006 | 82,202.1 | 0.013 | 1,127 |
| Inferred | 0.006 | 3,530.8 | 0.015 | |
| 11 July 2024 |
| Florida Canyon Gold Mine | Page 40 |
| Florida Canyon Gold Inc. | NI 43-101 Technical Report |
SRK, 31 July 2018 | |||||
Class | Cut-off Value ($NSR/ton) | Tonnage (tons x 1000) | Gold Grade (oz/ton) | Cont. Gold (oz x 1000) | |
Measured | $3.94 to $4.09 | 115,817 | 0.012 | 1,371 | |
Indicated | $3.94 to $4.09 | 30,652 | 0.011 | 339 | |
Measured + Indicated | $3.94 to $4.09 | 146,469 | 0.012 | 1,711 | |
Inferred | $3.94 to $4.09 | 1,550 | 0.014 | 22 | |
IMC, 01 June 2020 | |||||
Class | Cutoff Grade | Tonnage (Tons x 1000) | Gold Grade (oz/ton) | Cont. Gold (oz x 1000) | |
(NSR$/ton) | (Gold oz/ton) | ||||
Measured | $3.21 | 0.0043-0.0051 | 0 | 0.000 | 0 |
Indicated | $3.21 | 0.0043-0.0051 | 151,040 | 0.011 | 1,667 |
Measured + Indicated | $3.21 | 0.0043-0.0051 | 151,040 | 0.011 | 1,667 |
Inferred | $3.21 | 0.0043-0.0051 | 27,263 | 0.010 | 276 |
Table 6-2: Historic Mineral Reserve Statements for Florida Canyon
SRK, 31 July 2018 | ||||
Class | Cut-off Grade (Gold oz/ton) | Tonnage (tons x 1000) | Gold Grade (oz/ton) | Cont. Gold (oz x 1000) |
Proven | 0.005 to 0.006 | 80,739 | 0.011 | 876 |
Probable | 0.005 to 0.006 | 13,896 | 0.010 | 137 |
Proven + Probable | 0.005 to 0.006 | 94,634 | 0.011 | 1,013 |
IMC, 01 June 2020 | ||||
Class | Cut-off Grade (Gold oz/ton) | Tonnage (tons x 1000) | Gold Grade (1) (oz/ton) | Cont. Gold (oz x 1000) |
Proven | 0.005 to 0.006 | 0 | 0.000 | 0 |
Probable | 0.005 to 0.006 | 82,176 | 0.012 | 1,019 |
Proven + Probable | 0.005 to 0.006 | 82,176 | 0.012 | 1,019 |
(1) Gold grade is specified as being undertaken by fire assay.
The above stated historical mineral resources are not reliable or relevant; they are historically reported information only. Please see Section 14.0 and Section 15.0 of this Report for the most recent Mineral Resources and Mineral Reserves effective as of December 31, 2023.
On March 27, 2024, Argonaut and Alamos entered into an Arrangement Agreement, whereby Alamos will acquire all of the issued and outstanding shares of Argonaut pursuant to a court approved plan of arrangement. As part of the Arrangement, Alamos will acquire Argonaut's Magino mine and Argonaut's assets in the United States and Mexico will be spun out to FCGI. As a result, FCGI will own the Florida Canyon mine.
| 11 July 2024 |
| Florida Canyon Gold Mine | Page 41 |
| Florida Canyon Gold Inc. | NI 43-101 Technical Report |
7.0 GEOLOGIC SETTING AND MINERALIZATION
The following description of the regional and local geology, lithology, structure, mineralization, and alteration specific to the FCM was prepared by MDA in 2016, SRK in 2018, and by IMC in 2020. Presented here is an excerpt from the 2020 NI 43-101 Technical Report issued by IMC for Argonaut Gold (U.S.) Corp.
Dr. Hamid Samari of GRE has reviewed this information and available associated supporting documentation in detail and finds the discussion and interpretations presented herein to be reasonable and suitable for use in this report.
7.1 Regional Geology
FCM and StdM are situated in northwestern Nevada within the Basin and Range physiographic province, which is typified by a series of northward-trending elongate mountain ranges separated by alluvial valleys. Rocks exposed in the region range in age from Cambrian to Holocene and comprise thick sequences of sedimentary, volcanic, intrusive, and metamorphic rocks in a complex structural environment (Johnson, 1977).
The region was subjected to three major pre-Cenozoic periods of deformation, characterized by large-scale folding and thrust faulting (Johnson, 1977), with intervening periods of substantial carbonate and clastic sedimentation. The late Devonian to early Mississippian Antler orogeny formed the Antler highlands, located in present-day central Nevada, east of the area of study. This uplift shed sediment westward into a marine transgressive environment (Taylor et al., 2002).
At the end of the Paleozoic (late Permian) and into the early Triassic, the Sonoma orogeny resulted in deep-water strata thrust eastward tens of miles over rocks of the Antler highlands (Johnson, 1977). During this period, thick sequences of greenstone and rhyolitic flows, tuff, and breccia of the Koipato Group were deposited in a shallow marine setting. Continual sedimentation in the Triassic was characterized by shallow-water marine carbonate deposition (Prida and Natchez Pass formations) grading westward to deeper-water clastic sedimentation, predominately mudstones. During the late Triassic to early Jurassic, sediments of the Grass Valley Formation, grading from fluvial sandstone in the east to fine grained mudstone in the west, were unconformably deposited over the Prida and Natchez Pass formations (Taylor et al., 2002).
The last major compressional event, the Sevier orogeny, was likely well underway during the late Triassic, with evidence that some mid-Triassic sediments in the region were deposited syntectonically into local troughs formed during the early stages of this tectonic event (Taylor, 2001). During this time, sandstone and mudstone of the Grass Valley Formation were weakly metamorphosed to quartzite, argillite, and slate, with a north-northeast metamorphic foliation (Taylor et al., 2002).
Cenozoic volcanism and later Basin and Range faulting, which commenced about 16 Ma, have complicated and, locally, obscured the older structural features (Johnson, 1977).
| 11 July 2024 |
| Florida Canyon Gold Mine | Page 42 |
| Florida Canyon Gold Inc. | NI 43-101 Technical Report |
7.2 Local Geology
FCM and StdM deposits are located in the Humboldt Range, which is a major north-trending anticlinal structure likely formed during the Sevier orogeny (Hastings, et al., 1987). The stratigraphy of the Humboldt Range is summarized from Taylor (2001) and Taylor et al. (2002).
The Florida Canyon area is dominated by a major regional structural zone, termed the Humboldt Structural Zone, which is interpreted to be a 200-km long northeasterly-trending structure zone with left-lateral strike slip movement (Hastings, et al., 1987). One of the principal structural features within the Humboldt Structural Zone is the Midas Trench lineament, which abruptly terminates the north end of the Humboldt Range (Rowan, et al., 1981). Mineralization and alteration in the FCM and StdM deposit areas are localized where the Midas Trench lineament is intersected by the north-south trending Basin and Range frontal faults (Hastings, et al., 1987).
A generalized geology map of the FCM and StdM region, showing the locations of known mineralization is presented in Figure 7-1.
7.3 Florida Canyon Geology
Rocks of the Rochester Rhyolite, Prida Formation, Natchez Pass Limestone, and Grass Valley Formation are exposed in the FCM area. All these units are of Triassic age. Sills of mafic composition intrude the Prida Formation and sparse, strongly clay-altered felsic dikes locally cut upward into the Grass Valley Formation. The Humboldt City Thrust Fault separated the Natchez Pass and Grass Valley formations from the underlying Prida Formation, and much of the middle and lower units of the Natchez Pass Limestone have been cut out above the thrust fault. The Florida Canyon gold deposits are hosted by the Grass Valley Formation and Natchez Pass Limestone along with sill/limestone contact zones within Prida Formation. The general strike of the stratigraphy at FCM is N30oE with a 30 to 40-degree dip to the west.
Figure 7-2 is a west-to-east cross section illustrating the general geology of the FCM deposits. Taylor (2001) described the lithologic and structural characteristics of the Grass Valley Formation in the immediate FCM area. These descriptions have been updated by Larson (2009, personal communication). The Grass Valley Formation is composed of siltstone with interbedded sandstone lenses, which were metamorphosed to argillite, phyllite, and fine-grained quartzite. At the mine site, the Grass Valley Formation can be separated into layers of silty argillite and quartzite separated by dark gray to black phyllite. The layers of more quartz-rich sediment were more strongly and preferentially fractured and faulted during periods of compressional tectonics relative to the phyllite beds.
As well, extensional tectonics during Basin and Range formation also resulted in more fault and fracture-related permeability in the silty beds relative to the phyllite.
| 11 July 2024 |
| Florida Canyon Gold Mine | Page 43 |
| Florida Canyon Gold Inc. | NI 43-101 Technical Report |
Figure 7-1: Florida Canyon Area Geology
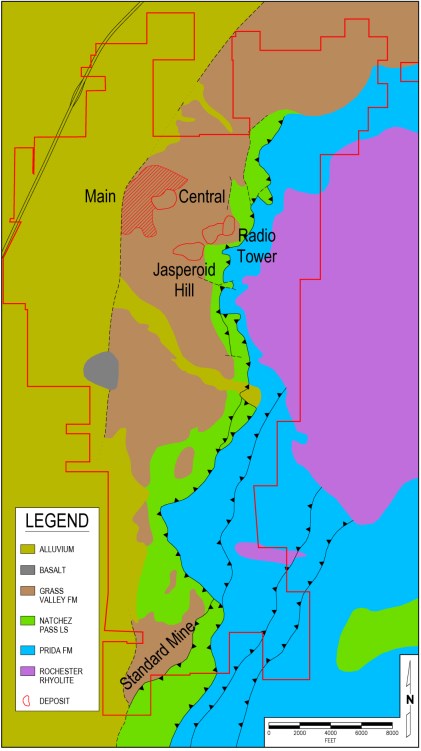
Source: FCM (2024)
There is a strong N30oE to N50oE structural fabric prevalent in and adjacent to the Florida Canyon deposits, as evidenced by the alignment of quartz veining, shear zones, and well-developed joint sets (Hastings, et al., 1987). Byington (1996) also recognized this important structural control to mineralization, particularly in the Main and Madre (aka Brown Derby) deposits. It has also been noted at other locations, specifically the Northeast Extension (aka Central) deposit that the preferentially mineralized structural trend is west-northwest. The north to north-northeast trending Basin and Range fault system limits the western near surface part of the FCM oxide deposit. The range-front fault system is a series of subparallel normal faults that "stair step" down to the west, with displacement on individual faults ranging from more than 780 feet near the range front to a few feet on parallel structure further to the west (Hastings, et al., 1987). These range-bounding faults are also listric and flatten with depth, which is an important feature in exploring for downdip blocks of mineralization to the west beneath valley-fill alluvium.
| 11 July 2024 |
| Florida Canyon Gold Mine | Page 44 |
| Florida Canyon Gold Inc. | NI 43-101 Technical Report |
Figure 7-2: Florida Canyon Generalized Geologic Cross Section
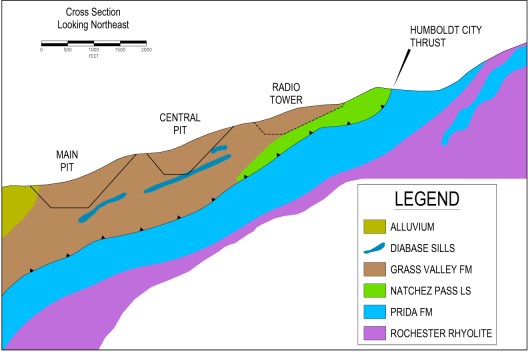
Source: FCM (2024)
7.4 Mineralization
The location and geometry of the mineralized bodies at FCM are a result of structure; the presence of favorable silty argillite, quartzite, and limestone host rocks; and the position of the host rocks relative to structural conduits. The higher-grade zones of mineralization tend, in general, to follow the high-angle, northeast- and northwest-trending fault and shear zones. The more moderate- or lower-grade zones are controlled by favorable host rocks more distal to feeder structures.
Rock units that are more favorable hosts to mineralization include silty argillite, hornfels contact zones with mafic sills, karsted limestone, and platy, silty limestone with interbeds of calcareous shale. Local factors that influence the occurrence and geometry of mineralized bodies include variations in folds, foliation, and bedding in favorable units, intersecting structural fabrics, and proximity to low-angle structures (Taylor, 2001). Hypogene mineralization at FCM consists of native gold and electrum associated with quartz, iron oxides, pyrite, marcasite, and arsenopyrite (Hastings et al., 1987). Quartz is the major gangue material. Secondary minerals identified in the FCM deposits to date include gypsum (likely remobilized from the Grass Valley Formation), alunite, barite, native sulfur, calcite, dolomite, fluorite, anhydrite, pyrargyrite, pyrrhotite, and stibnite. There are two types of hydrothermal, epithermal quartz veins at FCM (Hastings, et al., 1987). The most important are vein swarms and stockworks that contain most of the gold mineralization. These veins generally follow a north-northeast trend (Hastings, et al., 1987) and are characterized by colorless, euhedral to subhedral quartz, or banded chalcedonic white to colorless quartz that contains limonite after pyrite (Taylor, 2001).
| 11 July 2024 |
| Florida Canyon Gold Mine | Page 45 |
| Florida Canyon Gold Inc. | NI 43-101 Technical Report |
The second type of hydrothermal quartz veining occurs as large, through-going, banded fissure veins that follow the original north-northeast structural fabric (Hastings, et al., 1987). These veins are interpreted to represent a late hydrothermal event that overprinted the earlier episode of gold-bearing quartz veining and stockworks. These veins are characterized by bands of course, prismatic quartz alternating with bands of cherty chalcedony and only occasionally contain economic gold grades. Milky white bull-quartz veins, considered to be metamorphic in origin, may also be present in the mineralized zones, but they are not gold bearing (Taylor, 2001). Locally, pervasive silicification is generally associated with areas of high-density quartz veining and/or intense hydrothermal brecciation (Taylor, 2001). Sericite, adularia, clay, and chlorite occur locally in quartz veins, breccia matrix, and on fracture surfaces. There is extensive argillization and bleaching throughout the deposit area, with pervasive hematization that is largely confined to silty units marginal to the bleached areas (Hastings, et al., 1987).
A different style of mineralization has been recognized in the more recently discovered deposits east of the original FCM Main Pit. At Radio Tower, karsted surfaces in Natchez Pass Limestone are replaced by cryptocrystalline silica forming jasperoid and hornfelsed contact zones between mafic sill and limestone are strongly quartz-veined and pyritized. These ore zones represent a likely older event relative to the younger, hot-spring style mineralization in the Main Pit and Madre areas.
| 11 July 2024 |
| Florida Canyon Gold Mine | Page 46 |
| Florida Canyon Gold Inc. | NI 43-101 Technical Report |
8.0 DEPOSIT TYPE
FCM is a large, relatively young epithermal gold deposit adjacent to an active geothermal system. The close spatial association with the geothermal system has led to a general belief that FCM is a hot spring-style, epithermal gold deposit. Hydrothermal alteration assemblages and the mineralogy of both oxidized and unoxidized gold mineralization at FCM have been described and interpreted by Fifarek et al. (2011) as having formed in a low-sulfidation, epithermal environment.
Age dates on adularia from quartz-adularia-sulfide ±gold veins in the deposit indicate gold mineralization occurred episodically at about 5 Ma, 4.6 Ma, and between 4.6 and 2.2 Ma along and in the footwall of the north-south, range-bounding fault at the west margin of the Humboldt Range; this mineralization was overprinted by steam-heated alteration and oxidation at various times between 2.2 Ma and 0.9 Ma (Fifarek, et al., 2011). There are no known volcanic or intrusive rocks of similar age nearby, and the deposit has been considered to be of the amagmatic subtype of the low-sulfidation epithermal classification.
The deposit type is a large fault/fracture-controlled gold system, the overall extent being defined by alteration and oxidation of host meta-sedimentary rocks. Mineralization is preferentially located along major structural trends, in associated adjacent fracturing and rock foliations, and as disseminations in favorable host lithologies.
| 11 July 2024 |
| Florida Canyon Gold Mine | Page 47 |
| Florida Canyon Gold Inc. | NI 43-101 Technical Report |
9.0 EXPLORATION
9.1 Pre-Argonaut
Prior to 2020, exploration on site was predominately in the form of reverse circulation (RC) drilling completed primarily by Pegasus from 1983 through 1997 and Apollo from 1998 to 2004. In 2006, Jipangu began drilling with Rye Patch, completing 18 holes in 2017.
In 1969, Homestake Mining Company (Homestake) obtained a lease on property in the FCM area. Seven widely spaced rotary holes were drilled with marginal results, and the property was dropped. Cordex next leased the property between 1972 and 1978. A comprehensive program of geologic mapping, geochemical sampling, and trenching was completed.
Between 1969 and 1982, three major mining companies explored the property.
In 1982, Montoro, a subsidiary of Pegasus, acquired the property. Montoro began an aggressive program to expand reserves and enlarge the property position. Detailed geologic mapping and geochemical sampling led to the discovery of other anomalous gold occurrences throughout the property. By the end of 1985, 241 drill holes were completed totaling 87,569 feet in the West Trend and adjacent deposits. In addition, 46 holes were completed in other exploration targets to the south and east.
Between 1986 and 1997 Pegasus drilled 1,870 RC holes (977,299 feet) and 28 diamond drill (DDH) core holes for 20,162 feet. In 1998, Pegasus and Apollo drilled 84 RC holes totaling 33,540 feet of drilling.
Apollo drilled 803 RC holes between 1999 and 2004 for 238,250 feet of drilling.
Jipangu began drilling in 2006 and by 2012, 628 RC holes were drilled for 289,511 feet of total drilling at FCM.
Rye Patch drilled 18 (7,130 feet) of RC holes in 2017.
9.2 Argonaut
9.2.1 Drilling
Argonaut began drilling at FCM in 2020. From 2020 to 2023 Argonaut drilled 32 DDH core holes (19,341 feet) and 510 RC holes (137,293 feet).
9.3 Field Mapping
9.3.1 Pre- Argonaut
Soil sampling over and around the FCM area completed by Pegasus and Apollo show that the zones of best mineralization were located within the current mine areas (Figure 9-1).
Johnson Canyon shows anomalous gold trending northeast on the northern flank of the canyon.
| 11 July 2024 |
| Florida Canyon Gold Mine | Page 48 |
| Florida Canyon Gold Inc. | NI 43-101 Technical Report |
Black Canyon soil sampling indicates there may be two trends of anomalous gold mineralization, the strongest trend is approximately 45 degrees northeast, and the second (less continuous) trend is approximately 30 degrees northeast.
Antelope Canyon soil sampling indicates a possibility of two separate northeast trending anomalies separated by approximately 2,000 feet.
Soil sampling within the StdM Area shows that the mineralized anomalies were located above the historically mined pits. The High Standard and Buffalo Canyon areas have these anomalous zones, and the data appears to have been used to drill both areas.
9.3.2 Argonaut
In 2023, Argonaut identified seventeen target areas in the northern Humboldt Range for exploration based on the production of historical mines, historical drilling, anomalous gold in soils and rocks, and mapped intrusions. A 03-month mapping and rock-chip sampling program was undertaken as a first phase in evaluating the priority areas with the goals of identifying style and structural controls of gold mineralization, and the structural framework of the FCM property.
Rock chip and soil sampling completed north of the FCM within the Humboldt and Imlay canyons shows anomalous mineralization continues at an approximate trend of 40 degrees northeast and corresponds with historical mining trends. Rock chip samples in the Grass Valley Formation indicate weak mineralization near the surface (Figure 9-1 and Figure 9-2).
Florida Canyon rock chip samples indicate that the quartz veins within the Jasperoid pit area have grade, indicating the potential for expansion of the pit.
The Rye Patch Canyon area indicates that the best gold results, from rock chip samples, correspond in trend to the historical mining. This area should have a soil sampling program to support the rock chip results.
Summary of exploration sampling exclusive of drilling is shown in Table 9-1.
Table 9-1: Summary of Exploration Sampling Exclusive of Drilling
Type | Area | Hectares | Number of | Sample | Company | Program |
Rock | Rye Patch Canyon | 960 | 204 |
| Rye Patch | 2015 |
Rock | Black Canyon | 50 | 34 |
| Argonaut | 2023 |
Rock | North Range Front | 105 | 22 |
| Argonaut | 2023 |
Rock | Imlay Canyon | 145 | 68 |
| Argonaut | 2023 |
Rock | Florida Canyon Mine | 20 | 10 |
| Argonaut | 2023 |
Soils | Florida Canyon Mine | 405 | 1156 | 200 X 200 | Pegasus | 1995 |
Soil | Black canyon | 165 | 346 | 200 X 200 | Apollo | 1995 |
Soils | South Standard | 45 | 143 | 200 X 200 | Pegasus | 1998 |
Soils | Antelope Canyon | 55 | 142 | 200 X 200 | Pegasus | 1998 |
Soils | High Standard | 20 | 35 | 200 X 200 | Pegasus | 1998 |
Soils | Johnson Canyon | 50 | 154 | 200 X 200 | Apollo | 2000 |
| 11 July 2024 |
| Florida Canyon Gold Mine | Page 49 |
| Florida Canyon Gold Inc. | NI 43-101 Technical Report |
Type | Area | Hectares | Number of | Sample | Company | Program |
Soils | Eldorado Canyon | 40 | 36 | 200 X 200 | Apollo | 2000 |
Soils | North Standard\Cordex | 190 | 468 | 200 X 200 | Pegasus | 2002 |
Soils | Buffalo Canyon | 70 | 218 | 200 X 200 | Apollo | 2003 |
Soils | Imlay Canyon | 565 | 888 | 400 X 200 | Argonaut | 2021 |
| 11 July 2024 |
| Florida Canyon Gold Mine | Page 50 |
| Florida Canyon Gold Inc. | NI 43-101 Technical Report |
Figure 9-1: Map of Soil Sample Grids at Exploration Targets in and Surrounding the FCM

Source: FCM (2024)
| 11 July 2024 |
| Florida Canyon Gold Mine | Page 51 |
| Florida Canyon Gold Inc. | NI 43-101 Technical Report |
Figure 9-2: Map of Rock Chip Sampling at Exploration Targets in and Surrounding the FCM
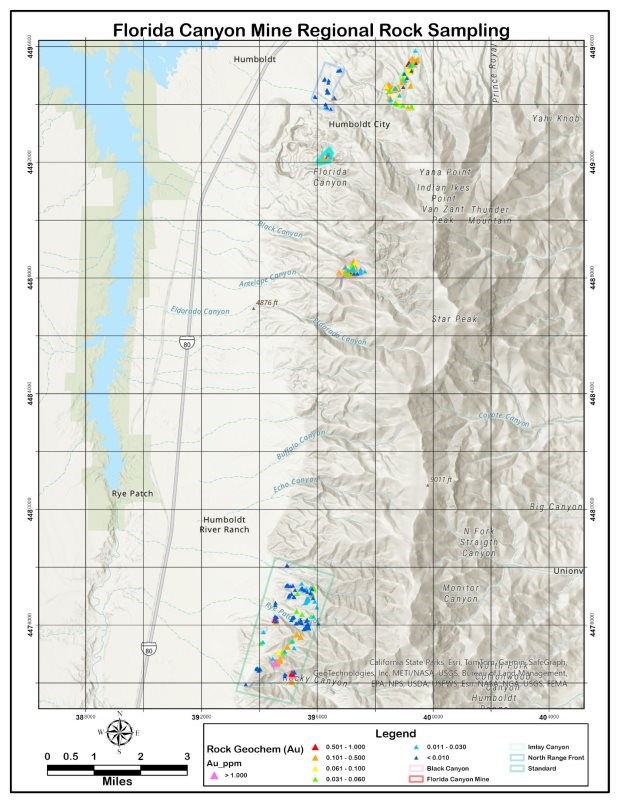
Source: FCM (2024)
| 11 July 2024 |
| Florida Canyon Gold Mine | Page 52 |
| Florida Canyon Gold Inc. | NI 43-101 Technical Report |
10.0 DRILLING
10.1 Introduction
The drill hole database provided for modeling includes most of the historical drilling through the 2023 drill season. Some historical drilling that was either exploration drilling too distal to the deposit area to be used or could not be validated has been excluded. The current database has 4,821 holes amounting to 2,091,843 feet of drilling. Since the last Technical Report was completed in 2020, FCM has added 32 core holes consisting of 19,341 feet of drilling and 510 RC holes consisting of 137,293 feet of drilling.
The current database contains 4,821 drill holes amounting to 2,091,843 feet of drilling and containing 384,468 assayed intervals for gold. Drilling spanned the period of 1981 through 2023, as summarized in Table 10-1. All this drill hole information has been used to estimate grades in the block model. However, a substantial volume of rock has been removed from FCM, and about 35% of the assay intervals are no longer in place.
Since the last Technical Report dated 2020, 542 holes, totaling 156,634 feet of drilling, have been completed.
Of the original 4,821 drill holes, 90 are reported to be DDHs and the remaining are RC. Figure 10-1 is a plot of all 4,821 drill hole collars at FCM superimposed over the 2023 EOY topography.
Table 10-1: Drill Hole Database - Florida Canyon Mine
Year | Core | RC/Rotary | All Holes | Company | Drill Company | |||
# of | Footage | # of | Footage | # of | Footage | |||
1981 |
|
| 1 | 500 | 1 | 500 | Pegasus Gold | Eklund Drilling |
1983 |
|
| 62 | 21,915 | 62 | 21,915 | Pegasus Gold | Eklund Drilling |
1984 |
|
| 111 | 37,515 | 111 | 37,515 | Pegasus Gold | Eklund Drilling |
1985 | 4 | 1,154 | 80 | 26,185 | 84 | 26,185 | Pegasus Gold | Eklund Drilling |
1986 |
|
| 21 | 7,440 | 21 | 7,440 | Pegasus Gold | Eklund Drilling |
1987 |
|
| 57 | 20,480 | 57 | 20,480 | Pegasus Gold | Eklund Drilling |
1988 |
|
| 204 | 88,590 | 204 | 88,590 | Pegasus Gold | Eklund Drilling |
1989 | 2 | 827 | 133 | 52,300 | 135 | 52,300 | Pegasus Gold | Eklund Drilling |
1990 |
|
| 61 | 22,860 | 61 | 22,860 | Pegasus Gold | Eklund Drilling |
1991 |
|
| 93 | 42,145 | 93 | 42,145 | Pegasus Gold | Eklund Drilling |
1992 | 1 | 180 | 86 | 43,800 | 87 | 43,800 | Pegasus Gold | Eklund Drilling |
1993 |
|
| 181 | 79,425 | 181 | 79,425 | Pegasus Gold | Eklund Drilling |
1994 | 1 | 550 | 89 | 46,565 | 90 | 46,565 | Pegasus Gold | Eklund Drilling |
1995 | 11 | 7,064 | 323 | 221,015 | 334 | 221,015 | Pegasus Gold | Hyne, Lang, Boart Longyear, Eklund |
1996 | 12 | 10,532 | 236 | 160,553 | 248 | 160,553 | Pegasus Gold | Lang, Boart Longyear, Eklund, Thunder Bay Testing |
| 11 July 2024 |
| Florida Canyon Gold Mine | Page 53 |
| Florida Canyon Gold Inc. | NI 43-101 Technical Report |
Year | Core | RC/Rotary | All Holes | Company | Drill Company | |||
# of | Footage | # of | Footage | # of | Footage | |||
1997 | 1 | 1,009 | 386 | 192,126 | 387 | 193,135 | Pegasus Gold | Lange, Delong, Eklund |
1998 |
|
| 84 | 33,540 | 84 | 33,540 | Pegasus Gold\Apollo Gold | Hackworth, Delong, Eklund |
1999 |
|
| 50 | 12,550 | 50 | 12,550 | Apollo Gold | Delong Drilling |
2000 |
|
| 274 | 76,475 | 274 | 76,475 | Apollo Gold | Delong Drilling |
2001 |
|
| 73 | 21,075 | 73 | 21,075 | Apollo Gold | Delong Drilling |
2002 |
|
| 208 | 62,120 | 208 | 62,120 | Apollo Gold | Delong Drilling, Eklund |
2003 |
|
| 170 | 59,580 | 170 | 59,580 | Apollo Gold | Delong Drilling |
2004 |
|
| 28 | 6,450 | 28 | 6,450 | Apollo Gold | Delong Drilling |
2005 |
|
|
|
| 0 | 0 |
|
|
2006 |
|
| 2 | 635 | 2 | 635 | Jipangu Exploration | Delong Drilling |
2007 |
|
| 211 | 91,100 | 211 | 91,100 | Jipangu Exploration | Delong Drilling |
2008 |
|
| 245 | 104,245 | 245 | 104,245 | Jipangu Exploration | Delong Drilling, O'Keefe Drilling |
2009 |
|
| 9 | 9,301 | 9 | 9,301 | Jipangu Exploration | O'Keefe Drilling |
2010 |
|
| 32 | 19,485 | 32 | 19,485 | Jipangu Exploration | Delong Drilling |
2011 |
|
| 66 | 31,190 | 66 | 31,190 | Jipangu Exploration | Delong Drilling |
2012 |
|
| 63 | 33,555 | 63 | 33,555 | Jipangu Exploration | Delong Drilling |
2013-2016 |
|
|
|
| 0 | 0 |
|
|
2017 |
|
| 18 | 7,130 | 18 | 7,130 | Rye Patch Gold | HD Drilling |
2020 |
|
| 42 | 10,630 | 42 | 10,630 | Argonaut Gold | O'Keefe Drilling |
2021 | 9 | 1,477 | 109 | 26,075 | 118 | 27,552 | Argonaut Gold | Alford Drilling, O'Keefe Drilling |
2022 | 4 | 856 | 232 | 55,108 | 236 | 55,964 | Argonaut Gold | Alford Drilling, KB Drilling |
2023 | 19 | 17,008 | 127 | 45,480 | 146 | 62,488 | Argonaut Gold | Major, Delong, Big Sky, Alford Drilling |
Undated | 26 | 14,110 | 564 | 267,939 | 590 | 282,049 |
|
|
Total | 90 | 54,766 | 4,731 | 2,037,077 | 4,821 | 2,091,843 |
|
|
| 11 July 2024 |
| Florida Canyon Gold Mine | Page 54 |
| Florida Canyon Gold Inc. | NI 43-101 Technical Report |
Figure 10-1: Drill Collars over 2023 EOY Topography
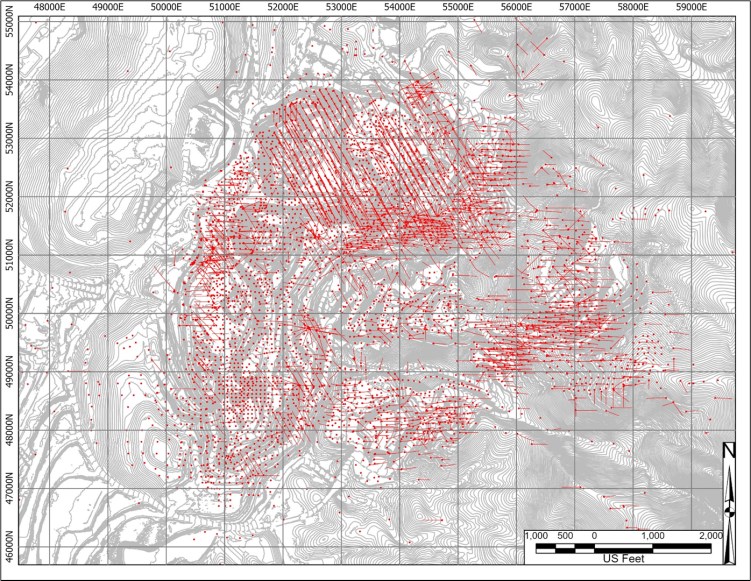
Source: FCM (2024)
| 11 July 2024 |
| Florida Canyon Gold Mine | Page 55 |
| Florida Canyon Gold Inc. | NI 43-101 Technical Report |
10.2 Drill Methods
10.2.1 Pre-Argonaut
At FCM eighty five percent (85%) of the drilling was RC drilling which was completed by the operators Pegasus and/or Apollo, between the years 1981 and 2004. Jipangu drilled 15%, and Rye Patch drilled less than 0.5% of the total RC holes prior to 2018. Several contractors were used as noted on Table 10-1.
RC drilling was completed using wet methods, where water was injected down-hole from the collar until ground water intersected in the hole. The slurry of water and drill cuttings was directed to a rotating wet splitter, where the samples were reduced to approximately 10 to 15 pounds (lbs) and collected in porous sample bags. Bags were pre-labeled with drill hole ID and sample interval. RC samples were collected at 05-foot intervals at the rig by the drill contractor.
RC holes were typically 5-1/4 inches in diameter with some 6-inch diameter holes also drilled. According to FCM personnel that were involved with the historic drilling, all RC was done using a standard RC configuration with a down-hole hammer and interchange (cross-over).
The 58 DDH core holes were a mix of 50% vertical and 50% angle drilling. Angled hole inclinations varied from 40 to 75 degrees. HQ (2-1/2 inch) and PQ (3-1/2 inch) core were drilled using standard wire line methods. Drill cores were boxed by the contractor into waxed cardboard boxes at the drill site. Footage blocks were included, and the boxes were labeled. Sample intervals were 5 feet long, and wet cuttings were collected from a rotary splitter, resulting in 10 to 15 lbs of sample.
10.2.2 Argonaut
Since the last Technical Report dated 2020, 542 holes for a total of 156,634 feet of drilling have been completed. Thirty-two (32) DDH core holes consisting of 19,341 feet of drilling and 510 holes totaling 137,293 feet of RC have been drilled since 2020 (see Figure 10-2). Of the 384,468 assay intervals, 54,687 have been added since 2020.
RC drilling was completed using a down-the-hole hammer wet drilling method. This method injects air and water to recover the cuttings from the drill hole. When cutting recovery decreases or drilling does not advance due to poor conditions a tri-cone bit is utilized to complete the hole to depth. The diameter varies from 5 to 6 inches, depending on the bit used. Since 2020 RC drill holes were typically 5-1/4 inch in diameter with some collars being drilled with a 7-5/8 inch tri-cone when in unconsolidated material, and some 6-inch diameter holes were also drilled.
Recovered cuttings were delivered to a rotary splitter for sample collection. A sample of the split at the rig during drilling was collected by the drill contractors using a pre-labeled bag. Samples were collected at 5-foot intervals and typically ranged from 10 to 15 lbs in weight.
Two diameters of core have been collected since 2020. The primary core size was HQ (2-1/2 inch) with PQ (3-1/2 inch) being utilized only at the top of the hole where casing was required. Collection of core from the drill was completed using standard wire line method with split core tubing sampling methods. All the core was washed and placed in core boxes.
| 11 July 2024 |
| Florida Canyon Gold Mine | Page 56 |
| Florida Canyon Gold Inc. | NI 43-101 Technical Report |
Figure 10-2: Argonaut Drill Collars (2020-2023)
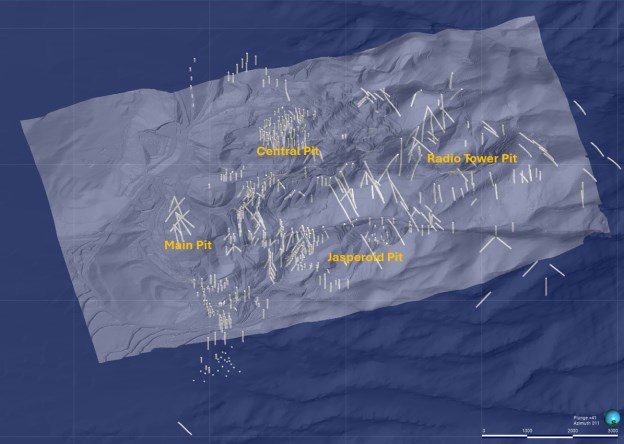
Source: FCM (2024)
10.3 Logging Procedure
10.3.1 Pre-Argonaut
Limited information is available for logging procedures used during all drill programs carried out prior to 2020. From limited information, the information presented below has been developed.
Small portions of RC drill cuttings from each drilled interval were collected for geologic logging by placing a small sieve in the sample discharge stream during each interval. These samples were placed into standard compartmentalized RC chip trays, with each tray labeled with the drill hole ID and appropriate footage. The drill chips were logged by FCM geologists (or contract geologists) using binocular microscopes, with the geologic/mineralogic information recorded on standardized logging forms. Data routinely collected included lithology, texture, color, mineral assemblages, alteration, oxidation, hydrology data, and, often, sample recovery. Numeric integer codes are assigned to the various lithologies, mineralization and alteration types and intensities, and structural types to facilitate their incorporation into the geologic, grade, and metallurgical models of the deposit.
The DDH core surface was brushed and washed with water to remove drill mud and then photographed prior to logging and sampling. The drill core was logged for lithology, mineralization (style and mineral assemblages), alteration (type and degree), and structural features on standardized logging forms. The same integer coding system described for RC data logging is also used for incorporating core data into the various deposit models. Geotechnical data was routinely collected from drill core, including core recovery, Rock Quality Designation (RQD) data, fracture density data, qualitative rock hardness information, and quantitative rock strength data from point load tests. Once logging was complete, the cores were sampled at 5-foot intervals without splitting. Pegasus and/or Apollo personnel placed samples in pre-numbered cloth bags. Since the core was not split, there is no remaining core to review or re-log.
| 11 July 2024 |
| Florida Canyon Gold Mine | Page 57 |
| Florida Canyon Gold Inc. | NI 43-101 Technical Report |
10.3.2 Argonaut
The same logging procedure described previously was used for Argonaut RC holes. For DDH core holes, upon the core's arrival at the core shed, the core was placed on logging tables, washed, and prepared for logging. The logging included structure, geologic, and geotechnical parameters. While logging, sample intervals were identified and marked out for sampling. The sample intervals were based on geology, length of sample, and recovery. If no geologic reason for sampling was present, the core was cut in 3-foot to 5-foot intervals. Before being released for cutting, each box was photographed. The cutting personnel cut the samples with half the core placed in pre-numbered cloth bags and prepared for shipping to the assay lab. The other half was returned to the core box for storage and future use.
10.4 Recovery
10.4.1 Pre-Argonaut
According to Taylor et al. (2002), recovery from RC drilling was generally good, but decreased when strongly fractured or broken ground was encountered. In these instances, tri-cone drilling was often implemented to improve sample recovery. RC and DDH core recovery data were not recorded in the FCM drill hole database. FCM should consider incorporating RC and core recovery data included in existing logs into the digital database so recovery vs grade analyses could be performed to determine if there is a relationship between metal grades and increased or decreased sample size for both drill types.
10.4.2 Argonaut
For the 2020-2023 drill campaigns core recovery was recorded during logging (see Table 10-2).
Table 10-2: Core Recovery from 2020 to 2023
Recovery % | % of Intervals |
0-10 | 2.3% |
10-20 | 0.8% |
20-30 | 1.0% |
30-40 | 2.1% |
40-50 | 2.5% |
50-60 | 1.9% |
60-70 | 2.7% |
70-80 | 4.0% |
80-90 | 8.8% |
90-100 | 74.1% |
100 | 39.3% |
| 11 July 2024 |
| Florida Canyon Gold Mine | Page 58 |
| Florida Canyon Gold Inc. | NI 43-101 Technical Report |
Recovery of RC cuttings was not recorded. Tri-cone drilling was implemented when RC recovery decreased, due to broken rock conditions.
10.5 Collar Survey
10.5.1 Pre-Argonaut
Collar locations were determined by FCM mine surveying equipment, by the Mine Engineering department (SRK, 2017). Since mining began in 1986, the Mine Survey Group has completed the collar survey for all holes drilled at FCM. The survey equipment utilized changed as survey methods advanced over the years.
10.5.2 Argonaut
All collar surveys have been completed by the Mine Survey Group. The Mine Survey Group utilizes Trimble GPS survey equipment, TSC3 and TSC5 data collectors with R2 and R10 rover units. The survey equipment gathers and reports all data into the FCM survey grid.
10.6 Down-Hole Surveys
10.6.1 Pre-Argonaut
About 20% of all drill holes completed by Pegasus/Apollo were down-hole surveyed, and 52% of the holes drilled from 1996 through 2002 were down-hole surveyed. Most down-hole surveys utilized Reflect Fotobor, or Maxibor multi-shot survey tools. Some were completed with magnetic single-shot survey tools. Down-hole surveys were completed by Wellbore Navigation, INC., Silver State Surveys, Compulog, and WELNAV ( Table 10-3 and Table 10-4).
Table 10-3: Down-Hole Surveys (1981-2016)
| Survey Provider | % Surveyed |
Surveyed | Various Companies | 15% |
Not Surveyed | Drill Log | 4% |
Unknown | 81% |
Table 10-4: Down Hole Surveys (2017)
| Survey Provider | % Surveyed |
Surveyed | IDS | 39% |
Not Surveyed | N\A | 61% |
10.6.2 Argonaut
International Directional Services (IDS) surveyed 41% of holes drilled since 2020. In 2023 Major Drilling (Major) utilized an OMNi-42 tool to survey 44 holes, representing 8% of all surveyed holes since 2020. Approximately 49% of all the holes drilled by Argonaut have been down-hole surveyed (see Table 10-5).
| 11 July 2024 |
| Florida Canyon Gold Mine | Page 59 |
| Florida Canyon Gold Inc. | NI 43-101 Technical Report |
Table 10-5: Down-Hole Surveys (2020-2023)
| Survey Provider | % Surveyed |
Surveyed | IDS | 41% |
Major | 8% | |
Not Surveyed | N\A | 51% |
Two (2) holes drilled in 2020 utilized Surface Recoding Gyro tools with 217 holes (82%) surveyed with a North Seeking Gyro. These holes were completed by a down-hole survey contractor, IDS. Forty-four (44) or 17% of the holes were surveyed using an OMNi-42 Reflex tool.
10.7 QP Comments on Section 10 Drilling
In the opinion of GREs QP Dr. Hamid Samari, drilling was conducted in accordance with industry-standard practices. The drilling, as performed, provides suitable coverage of the zones of gold mineralization. Collar and down-hole survey methods used generally provide reliable sample locations. Drilling methods provide good core recovery. Logging procedures provide consistency in descriptions.
The collected sample data adequately reflect deposit dimensions, true widths of mineralization, and the style of the deposits. Drill orientations are generally appropriate for the mineralization style for the bulk of the deposit area.
GREs QP Dr. Hamid Samari considers that the quantity and quality of the logging, collar, and down-hole survey data are sufficient to support Mineral Resource estimation.
No factors were identified with the data collection from the drill programs that could significantly affect Mineral Resource and Mineral Reserve estimation.
| 11 July 2024 |
| Florida Canyon Gold Mine | Page 60 |
| Florida Canyon Gold Inc. | NI 43-101 Technical Report |
11.0 SAMPLE PREPARATION, ANALYSIS, AND SECURITY
11.1 Sampling
11.1.1 Pre-Argonaut
Limited information is available to FCM regarding the procedures applied to the legacy database at FCM prior to 2020. From limited information, the information presented below has been developed.
RC drilling was completed using wet methods, where water was injected down-hole from the collar until groundwater was intersected in the hole. The slurry of water and drill cuttings was directed to a rotating wet splitter, where the samples were reduced to approximately 10 to 15 lbs and collected in porous sample bags. Bags were pre-labeled with drill hole ID and sample interval. The drilling contractor collected RC samples at 5-foot intervals at the rig. Small portions of drill cuttings from each drilled interval were collected for geologic logging by placing a small sieve in the sample discharge stream during each drill interval. These samples were placed into compartmentalized RC chip trays, with each tray appropriately labeled.
In DDH holes, the cores were sampled at 5-foot intervals without splitting. Pegasus and/or Apollo personnel placed the samples in pre-numbered cloth bags. Since the cores were not split before 2020, there is no remaining core to review or re-log.
11.1.2 Argonaut
For RC holes, recovered cuttings were delivered to a rotary splitter for sample collection for RC holes. The drill contractors collected a sample of the split at the rig during drilling using a pre-labeled bag. Samples are collected at 5-foot intervals and typically range from 10 to 15 pounds in weight.
For DDH's, the drill core has been cut in half, with half being sampled and sent to a lab and the remaining half stored for future reference and use. For the Argonaut drilling programs, the cores were also sampled at 5-foot intervals.
11.2 Sample Preparation
At least 10 different labs have been used over the years for fire assay of drill samples at FCM. Starting in 1991, American Assay Labs (AAL) was the primary lab and accounted for 66% of the assays in the entire database. AAL is ISO 17025 accredited and Nevada Department of Environmental Protection (NDEP) approved.
11.2.1 Pre-Argonaut
Between 1991 and 2020, the drilling and preparation of RC and DDH core samples at AAL consisted of drying the entire sample at approximately 110 degrees C, then jaw-crushing the entire sample to 100%, passing 6-mesh. A riffle splitter was used to split out approximately 500 grams, which was pulverized with a ring and puck pulverizer to a nominal -150 mesh. The pulp was then roll-mixed and transferred to a sample envelope.
| 11 July 2024 |
| Florida Canyon Gold Mine | Page 61 |
| Florida Canyon Gold Inc. | NI 43-101 Technical Report |
11.2.2 Argonaut
The preparation of RC samples from 2020 consisted of drying all the samples at approximately 110 degrees C. The sample was then crushed by a jaw crusher to a greater than 70% passing at 2 mm (10 mesh). The sample is then split to 300 grams, using a Jones Splitter which is then pulverized with a ring and puck to greater than 85% passing -75µm.
The same general preparation procedures used for RC samples are also used for DDH core samples. After drying, the entire core sample was jaw-crushed to -0.75 inches, and a 3 to 4 lb sub-sample is collected using a riffle splitter. The smaller split was then crushed, split, and pulverized following the same procedures as applied to RC samples.
11.3 Analytical Procedure
11.3.1 Pre-Argonaut
Between 1991 and 2012, drilling was analyzed for gold at AAL by fire assay using a 30-gram aliquot. AAL is an accredited analytical lab. AAL has been FCM's primary analytical lab since 1990 and is a reputable Nevada-based analytical lab servicing the mining industry. AAL is an ISO/IEC 17025:2005 accredited analytical lab and is Nevada Department of Environmental Protection approved.
Gold was analyzed by fire assay using a 30-gram aliquot. After fusion, the gold content was determined by atomic absorption (AA) spectrometry. All samples that return gold values greater than 0.30 ounces per ton (oz/ton) are re-assayed with a gravimetric finish. AAL included quality control standards and blanks with each sample batch and routinely performed duplicate analyses on about 10% of all sample pulps.
The sample analytical procedures used for 2017 were fire assay lead-collection methods for a 30-gram sample size, with ICP AES determinations having a 0.001 oz/ton detection limit. Analytical certificates from AAL provide the gold assays in both parts per million (ppm) and equivalent oz/ton values. The drill hole database used gold values as oz/ton.
Starting in June of 2008, FCM instructed AAL to change procedures on the lab sample duplicate assay procedures. The previous method was to complete the second analysis on the original pulp. The current procedure is completed on a new pulp made from the coarse rejects, providing a more in-depth analysis of the sample duplicates at the lab.
11.3.2 Argonaut
After sample preparation in AAL, 30-grams of pulp are measured and placed in a ceramic crucible with litharge, sodium carbonate, borax and flour and melted at 1080 degrees Celsius (°C). The resulting 25-50-gram lead button is then cupelled in a magnesite cupel at 900 °C for 60 minutes. The bead is then digested with concentrated nitric acid. Hydrochloric acid is added to generate chlorine and nitosoyl chloride. Digested sample is read on an ICP-EAS.
If the result of the gold fire assay (AuFA) ICP test is greater than 10.0 ppm then a AuFA gravity test is prepared on a 30-gram sample of the pulp and placed in a ceramic crucible with litharge, sodium carbonate, borax and flour and melted at 1080 °C. The resulting 25-50-gram lead button is then cupelled in a magnesite cupel at 900 °C for 60 minutes. The bead is then digested with concentrated nitric acid. The resulting material is then weighed to measure the amount of gold within the original sample and reported in parts per million.
| 11 July 2024 |
| Florida Canyon Gold Mine | Page 62 |
| Florida Canyon Gold Inc. | NI 43-101 Technical Report |
The resulting material is then weighed to measure the amount of gold within the original sample and reported in parts per million.
If the AuFA-ICP grade is greater than 0.150 ppm a cyanide digestion assay test will be performed. Thirty (30) grams of sample pulp are weighed and prepared for sample digestion. Sample digestion is completed using un-heated 0.3% sodium cyanide solution for 2.0 hours tumble at room temperature. Digested samples are read on an ICP-AES, reported in ppm. The gold lower detection limit is 0.010 ppm and the gold upper detection limit is 100 ppm.
If the Au ppm is greater than 0.150 ppm then a preg-robbing test is performed. Thirty (30) grams of sample pulp are weighed and prepared by adding a pre-determined amount of gold for sample digestion. Sample digestion is completed using un-heated 0.3% sodium cyanide solution for 2.0 hours tumble at room temperature. Digested samples are read on an ICP-AES, reported in ppm. The difference between the Au ppm grade after original Au ppm plus the added Au ppm, and the second Au ppm indicates how much gold, in ppm, is likely to be affected by the carbon.
To measure total carbon and total sulfur, 0.3 grams of the sample is heated to > 2,000 °C, in an induction furnace, to generate CO2 and SO2. To measure organic carbon and sulfide contents, 0.3 grams of sample are digested in an HCl leach, then placed in an induction furnace heating samples to >2000 °C to generate CO2 and SO2. Analysis is completed on an ELTRA C/S Analyzer machine. The method provides the percentage of total carbon, organic carbon, calculated inorganic carbon, total sulfur, sulfide, and calculated sulfate content.
AAL's analytical quality assurance / quality control (QA/QC) program for FCM samples reportedly consisted of inserting one standard, one blank and at least four duplicate pulps for every batch of 50 samples assayed. AAL also continually monitored their lab performance by participating in the CANMET round-robin surveys.
11.4 Quality Assurance and Quality Control
11.4.1 Pre-Argonaut
Prior to 2017, there was no formal QA/QC program in place; however, there are a few data points in the FCM database for some of the QA/QC programs that are presented in Table 11-1. For this period, QA/QC was limited to inserting only duplicate samples. The rate of duplicate insertion was below the standard recommended by industry which is generally accepted to be 5% of samples (see Table 11-1).
Table 11-1: Pre Argonaut (QA/QC Programs Prior to 2017)
Year | Rotary/RC | Core | RC & Core | Blank | Standard | Field | Pulp | % Of Total |
1984 | 7,539 | 0 | 7539 | N/A | N/A | 6 | N/A | 0.07 |
1995 | 40,663 | 1,438 | 42101 | N/A | N/A | 11 | N/A | 0.03 |
1996 | 31,595 | 1,256 | 32851 | N/A | N/A | 5 | N/A | 0.01 |
1997 | 38,598 | 583 | 39181 | N/A | N/A | 5 | N/A | 0.01 |
1998 | 11,501 | 0 | 11501 | N/A | N/A | 1 | N/A | 0.01 |
2003 | 11,996 | 626 | 12622 | N/A | N/A | 1 | N/A | 0.01 |
2007 | 17,583 | 0 | 17583 | N/A | N/A | 11 | 10 | 0.11 |
| 11 July 2024 |
| Florida Canyon Gold Mine | Page 63 |
| Florida Canyon Gold Inc. | NI 43-101 Technical Report |
Year | Rotary/RC | Core | RC & Core | Blank | Standard | Field | Pulp | % Of Total |
2008 | 20,819 | 0 | 20819 | N/A | N/A | 3 | 5 | 0.04 |
2011 | 6,145 | 0 | 6145 | N/A | N/A | 12 | 9 | 0.34 |
2012 | 6,546 | 0 | 6546 | N/A | N/A | N/A | 15 | 0.23 |
2013-2016 | N/A | N/A | N/A | N/A | N/A | N/A | 127 | N/A |
An official QA/QC program was undertaken in 2017, during which the Rye Patch exploration team added standards and blanks samples to the sample stream. In addition to Rye Patch, AAL inserted 372 pulp duplicate samples (see Table 11-2).
Table 11-2: Pre Argonaut (QA/QC Programs in 2017)
Year | Rotary/RC | Core | RC & Core | Blank | Standard | Field | Pulp | % Of Total |
2017 | 1,348 | 0 | 1,348 | 13 | 225 | N/A | 372 | 45.2 |
In 2017, the material used for the blanks was purchased from Moment Exploration Geochemistry (MEG), including MEG-blank 14.01 and MEG-blank 14.04. Blanks were inserted at a rate of approximately one per 104 samples.
Standards were purchased from MEG and inserted at approximately a rate of 16 standards per 100 samples.
Eleven certified reference materials (CRMs), obtained from MEG, were used during the 2017 drilling program, covering low-grade gold to a maximum of 5.40 ppm gold. Table 11-3 shows the CRMs used and their expected values and standard deviation for gold.
Table 11-3: List of Certified Reference Materials Used in the 2017 Drilling Program
Certified Reference | Year | Certified | - 3 Std dev | + 3 Std dev |
MEG-Au.09.08 | 2017 | 5.40 | 4.836 | 5.964 |
MEG-Au.10.03 | 0.06 | 0.042 | 0.078 | |
MEG-Au.11.13 | 1.80 | 1.557 | 2.043 | |
MEG-Au.12.11 | 1.50 | 1.257 | 1.338 | |
MEG-Au.12.13 | 0.90 | 0.723 | 1.077 | |
MEG-Au.12.20 | 0.50 | 0.437 | 0.563 | |
MEG-Au.12.21 | 0.14 | 0.113 | 0.167 | |
MEG-Au.12.23 | 0.29 | 0.209 | 0.371 | |
MEG-Au.12.25 | 0.72 | 0.624 | 0.816 | |
S105006X | 4.50 | 4.203 | 4.797 | |
S107007X | 1.50 | 1.296 | 1.704 |
11.4.2 Argonaut
FCM implemented formal QA/QC programs for the 2020 to 2023 drill campaigns. These included submission of blanks, CRM's, field duplicates, and completion of a check assay program. In addition to the FCM-introduced QC samples, AAL inserted their own independent check samples and duplicate samples. A summary of the QA/QC sample numbers by year is included in Table 11-4.
| 11 July 2024 |
| Florida Canyon Gold Mine | Page 64 |
| Florida Canyon Gold Inc. | NI 43-101 Technical Report |
Table 11-4: Argonaut (QA/QC Programs 2020-2023)
Year | Rotary/RC | Core | RC & Core | Blank | Standard | Field | Pulp | % Of Total |
2020 | 2,106 | 0.00 | 2,106 | 20 | 118 | 132 | 179 | 21.3 |
2021 | 4,947 | 41.00 | 4,988 | 65 | 373 | 520 | 780 | 34.9 |
2022 | 10,366 | 386.00 | 10,752 | 129 | 685 | 846 | 1,482 | 29.2 |
2023 | 8,714 | 3969.00 | 12,683 | 185 | 926 | N/A | 1,638 | 21.7 |
2024 | In progress, the program was not completed at the Report effective date. | |||||||
From 2020 to 2023, the material used for the blanks was purchased from MEG, including MEG-blank 14.01 and 14.04 (for drilling program 2020), MEG-blank 17.12 (for drilling programs 2020, 2021, and 2022), MEG-blank 21.01 (for drilling programs 2022 and 2023) and MEG-blank 21.03 for drilling program 2023. Blanks were inserted at a rate of approximately one per 100 samples from the 2020, 2021, 2022, and 2023 drilling programs.
Standards were purchased from MEG or inserted at a rate of approximately 16 standards per 100 samples.
Twelve (12) CRMs obtained from MEG were used during the 2020 to 2023 drilling programs, covering low-grade gold to a maximum of 1.723 ppm gold. Table 11-5 shows the CRMs used and their expected values and standard deviation for gold.
Table 11-5: List of Certified Reference Materials Used in the 2020-2023 Drilling Program
Certified Reference | Year | Certified Value | - 3 Std dev | + 3 Std dev |
MEG-Au.17.04 | 2020, 2021, 2022, 2023 | 0.022 | 0.013 | 0.031 |
MEG-Au.17.08 | 2020, 2021, 2022 | 0.41 | 0.35 | 0.47 |
MEG-Au.17.21 | 2020, 2021, 2022 | 1.107 | 0.906 | 1.308 |
MEG-Au.17.23 | 2020, 2021 | 0.126 | 0.108 | 0.144 |
MEG-Au.19.05 | 2020, 2021, 2022 | 0.663 | 0.492 | 0.834 |
MEG-Au.19.07 | 2022 | 0.331 | 0.277 | 0.385 |
MEG-Au.19.08 | 2021 | 0.2 | 0.182 | 0.218 |
MEG-Au.19.09 | 2022, 2023 | 0.711 | 0.615 | 0.807 |
MEG-Au.19.10 | 2020, 2021, 2022, 2023 | 0.813 | 0.705 | 0.921 |
MEG-Au.19.11 | 2022 | 1.26 | 1.173 | 1.347 |
MEG-Au.21.01 | 2022, 2023 | 0.407 | 0.338 | 0.476 |
MEG-Au.21.05 | 2022, 2023 | 1.723 | 1.447 | 1.999 |
Duplicates could be either field or pulp duplicates. The field duplicate was used just for RC holes and it was taken from the cyclone splitter reject outlet weighing approximately 10 to 15 lbs. For 2020, 2021, and 2022 drilling programs, field duplicate samples were taken at a rate of 6, 10, and 8 per 100 samples, respectively. The laboratory took pulp duplicate samples from the reject material at a rate of one 8, 16, 14, and 13 per 100 samples for the 2020, 2021, 2022, and 2023 drilling samples, respectively. Pulp duplicates were inserted at the laboratory manager's discretion.
| 11 July 2024 |
| Florida Canyon Gold Mine | Page 65 |
| Florida Canyon Gold Inc. | NI 43-101 Technical Report |
11.5 Database
11.5.1 Pre-Argonaut
The data available before 2017 from the legacy data are the Excel files of collar, survey, lithology, and assay files. Since 2020, FCM staff have located all historical paper data, including geologic logs, assay files, and survey files. These paper files have been scanned and digitized for import into the database. Once the data was imported the data was verified for accuracy with the paper data. Only data that has had the validation completed was included in the database for modelling.
11.5.2 Argonaut
Data is stored in a GeoSequel database.
Several different methods for geologic and geotechnical data entry have been performed to enter the data into the database. In 2020 and 2021, data entry personnel entered the geology and geotechnical data into a series of Excel templates with extensive pick lists and validation rules. The logging geologist checked the digital file against the paper original and signed off on a printed copy of the captured data. The data was imported into Leapfrog software to check that drill hole collars were in the correct location and that drill hole data was complete. This process was overseen by the on-site database manager. The original paper capture forms were filed by drill hole. PDF versions are stored on the FCM server and identified by drill hole ID. Since 2022, geologic logging was performed using the GeoSequel logging tool, GeoSequel Logger, where the geology was entered directly into the database. Each logging table has limited columns and selections for each column, which correspond with the previously described Excel template.
Assay data is imported as text upon receipt from the laboratory, retaining the original laboratory codes. Text is translated to numeric values within the database. Assay results are not reported from the database, until they have been QA/QC vetted. Assay results for blanks and standards are compared with expected results via database queries. Each result is graphed and validated by the senior geologist. After QA/QC validation, assays are assigned a passing or failing designation. Upon failure of the standard or blank, the failed standards and blanks and their corresponding assay batch is re-run until the results pass validation. The most recent assays for each failed batch were then utilized in the database.
QA/QC data is continuously reviewed as it is imported into the database. Comprehensive QA/QC reports are generated by a senior geologist and reviewed by senior staff at the end of each drilling campaign.
11.6 Sample Security
11.6.1 Pre-Argonaut
Very little is known about the sample security pre-Argonaut.
AAL also assayed the most recent 2017 drilling. SRK reported the sample preparation and assay procedures applied to the 2017 drilling in their Technical Report 2018. The methods are identical to those reported by MDA in earlier years. The sample security of the 2017 drilling was straightforward, with samples stored at FCM until transported by an independent contractor to the AAL lab in Reno, NV. AAL checked the list of samples shipped against the samples received to confirm all samples were received.
| 11 July 2024 |
| Florida Canyon Gold Mine | Page 66 |
| Florida Canyon Gold Inc. | NI 43-101 Technical Report |
11.6.2 Argonaut
From 2020 to 2023, FCM maintained formal chain-of-custody procedures during all segments of sample transport.
RC samples were collected at the drill site and put into a single bin until the hole was completed. Upon abandonment of the hole, the drillers delivered the bin to a secure location on the mine site for storage until the samples were picked up by the AAL pickup\delivery truck. When the AAL driver received the bin, the QA/QC samples were given to the driver. A list of the samples, including the QA/QC samples, was emailed to AAL. Upon arrival at the lab, the samples were placed in the receiving area and then inventory of the samples was completed. Upon completion of the inventory, the list was sent back to FCM geologists to verify all samples were received at the lab.
The DDH samples were delivered to a secure location on the mine site (in the same location as the RC samples) at the end of each shift. The core boxes were then picked up by core logging and cutting contractors and taken to the Lovelock, NV core shed. The core was logged and cut to geologist specifications on a Husqvarna core saw. The samples were placed in one bin per hole and stored for pick up by AAL delivery staff. The procedure for AAL pick-up was the same as for the RC samples. The core shed was always locked except when active logging or cutting was being performed. The core shed was secured with locked gates and a security system to stop unauthorized entry.
11.7 QP Comments on Section 11 Sample Preparation, Analyses, And Security
GRE's QP Dr. Hamid Samari reviewed all sample preparation procedures, analytical procedures, and security measures employed prior to 2017 and measures employed by FCM for the drilling campaign between 2020 to 2023.
GRE's QP Dr. Hamid Samari believes that although previous practices and procedures prior to Argonaut's purchase of FCM may not have met current best industry practices, based upon historical FCM production and reconciliations, it is deemed that previous entries into the drillhole database are also acceptable for Mineral Resource estimation.
In the opinion of GRE's QP Dr. Hamid Samari, the sampling preparation, security, and analytical procedures used during 2017 and 2020 to 2023 are consistent with generally accepted industry best practices and are, therefore, adequate for Mineral Resource estimation.
In the opinion of GRE's QP, Dr. Hamid Samari:
Sample collection, preparation, analysis, and security for the RC and core drill programs follow industry-standard gold deposit methods.
Drill programs included inserting blank, duplicate, and standard reference material samples in the Rye Patch and Argonaut drilling campaigns.
QA/QC program results do not indicate any problems with the analytical programs (refer to discussion in Section 12).
| 11 July 2024 |
| Florida Canyon Gold Mine | Page 67 |
| Florida Canyon Gold Inc. | NI 43-101 Technical Report |
Data is subject to validation, which includes checks on surveys, collar coordinates, and assay data. The checks are appropriate and consistent with industry standards (refer to discussion in Section 12).
All cores have been cataloged and stored in designated areas.
GRE's QP Dr. Hamid Samari is of the opinion that the quality of the gold analytical data is sufficiently reliable to support Mineral Resource estimation without limitations on Mineral Resource confidence categories.
No factors were identified with any drilling, sampling, or recovery factors that could materially impact the accuracy and reliability of the results.
| 11 July 2024 |
| Florida Canyon Gold Mine | Page 68 |
| Florida Canyon Gold Inc. | NI 43-101 Technical Report |
12.0 DATA VERIFICATION
12.1 Historical Data Verification
The data at FCM is a digital database that has been added to multiple times over the years by the staff and consultants of the previous owners and operators.
12.2 Data Verification by International Mining Consultants
Beginning in 2020, validation of historical data began. Sources of the assay and geologic data have been checked and verified. Original paper logs and certificates for historical holes have been digitized and re-imported into the database. The data that has been located begins in 1983 and continues through 1998.
Data verification was addressed in Technical Reports by MDA in 2016 and by SRK in 2018. IMC reviewed this information in 2020 and took the following approach to verify the FCM legacy database.
1. The assay certificates from the 2017 drilling were checked against the database as a partial confirmation of the database assembly.
2. The inserted QA/QC results from the most recent 2017 drill program were analyzed by IMC to develop some comfort in that drill program.
3. The 2017 drilling was compared to the pre-2017 legacy database on a nearest-neighbor basis to gain some confidence in the legacy data from 2014 and earlier.
4. The DDH data from the 1990s was compared to the nearby RC data on the nearest-neighbor basis to determine whether the two drill methods were comparable.
5. Spot checks of the database were completed by IMC for logical consistency.
6. A reconciliation of the resulting block model against the head samples of ore loaded on the pad was completed to gain some confidence in the overall set of procedures from sample collection, assaying, and modeling.
FCM has produced gold since 1986, proving the occurrence of gold in the district. The approach outlined above in conjunction with 30-years of production records were sufficient for IMC to validate the database for Mineral Resource estimation.
12.2.1 2017 Drilling Compared to Pre-2015 Drilling
The QA/QC results from the 2017 drilling indicate that the assay procedures are acceptable for that data set of 18 holes. IMC completed a nearest-neighbor comparison to determine if the 2017 drilling was similar to the previously drilled data and gain some confidence in the application of the full data set.
The nearest neighbor process starts with the 2017 drill intervals and searches the database for earlier drilling data that is within a prescribed search radius. If the search distance is small, the pair data set essentially acts like twin drilling. In this case, the search was opened to the size of two model blocks (60 feet) in order to find sufficient numbers of paired data to have some statistical basis. The process is similar to "boundary analysis" commonly applied in resource estimation. IMC applies several statistical hypothesis tests to the paired data to test if the results are sufficiently similar to have come from the same population.
| 11 July 2024 |
| Florida Canyon Gold Mine | Page 69 |
| Florida Canyon Gold Inc. | NI 43-101 Technical Report |
Table 12-1 summarizes the results of the nearest neighbor test between the 2017 drilling and all previous drilling. The maximum separation of 60 feet equates to the size of two model blocks.
Table 12-1: Nearest Neighbor Test of 2017 Data vs All Previous Data
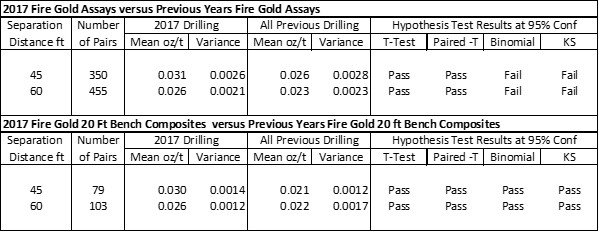
The results above indicate that the two data sets are from the same population with 95% confidence. The Binomial and Komologov-Smirnoff (KS) tests are rigorous tests of the population variability and shape of the histogram. Compositing smooths the data and reduces the variance, which allows those two tests to pass.
The 2017 data is a small sample when testing over 350,000 assays, but the indication is that the new drilling where there was conformational QA/QC on the assay methods agrees with the earlier drilling where that confirmation QA/QC information has been lost. The search distances of 60 feet did not acquire any DDH samples. These tests are comparisons that 2017 RC and previous RC drilling are similar.
12.2.2 DDH to RC Comparison
RC drilling has many benefits for rapid and low-cost collection of relatively large sample volumes for assay. RC sampling also has the potential for down-the-hole contamination which can sometimes produce overall biased assay results. In the experience of IMC, the RC sampling has the greatest potential for sampling error when sampled rock units that are easily friable or soft enough to allow down-the-hole contamination, or below the water table with wet sampling.
IMC completed a test of the 55 DDH holes against the nearest neighbor RC sampling to test the possibility of sample bias at FCM. The data was filtered to start with the DDH holes that contain assays. That limited the DDH set to 49 drill holes.
Table 12-2 summarizes the nearest neighbor comparisons of DDH to RC for both assays and 20-foot downhole composites in the oxidized portion of the deposit.
| 11 July 2024 |
| Florida Canyon Gold Mine | Page 70 |
| Florida Canyon Gold Inc. | NI 43-101 Technical Report |
Table 12-2: DDH to RC Nearest Neighbor Comparison
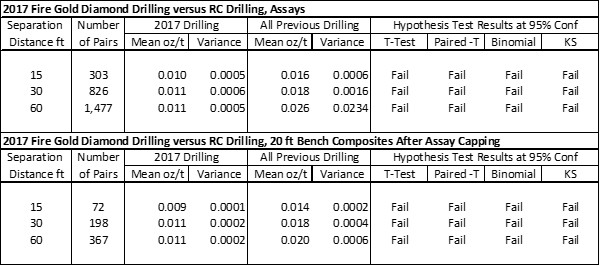
Table 12-2 illustrates a significant high bias of RC compared to DDH. At the 30-foot sample spacing (1 model block), the RC is 63% higher grade than DDH. However, when coupled with mine reconciliation information, IMC determined that the database was sufficient to use for Mineral Resource estimation.
12.3 Data Verification by Global Resource Engineering
The drilling data was submitted to GRE for a final review in January 2024. GRE's QP, Dr. Hamid Samari, conducted an independent review of the database from the 1981 to 2023 drilling programs. The data was provided to GRE in .csv format and included collar, survey, assay, geology, and QA/QC files.
12.3.1 Historic Data (1981 to 2016)
For historic drilling programs, prior to 2017, there is limited data on the QA/QC programs. It is only available for a few drilling programs and was limited to field and pulp duplicates. No blank and standard samples were inserted in the sample streams. For drillholes from this period the database contains collar, survey, assay, and geology information.
For those historic drilling programs from 1981 to 2016 with QA/QC programs, the QA/QC duplicate insertion rates fall way below the generally accepted industry standard of one duplicate sample per every 20 interval samples.
GRE's QP, Dr. Hamid Samari, reviewed all available historical QA/QC programs. Figure 12-1 and Figure 12-2 show graphs for field and pulp duplicates of available data from 1981 to 2016. As seen, most of the R2 values show high variance.
Based on reviewing the historical data, GRE's QP Dr. Hamid Samari believes that since FCM has been in production for over 35 years and has production data that reconciles well, the historical database of FCM is found appropriate for determining Mineral Resources.
| 11 July 2024 |
| Florida Canyon Gold Mine | Page 71 |
| Florida Canyon Gold Inc. | NI 43-101 Technical Report |
Figure 12-1: Field Duplicate Samples from Some Drilling Programs Prior to 2017
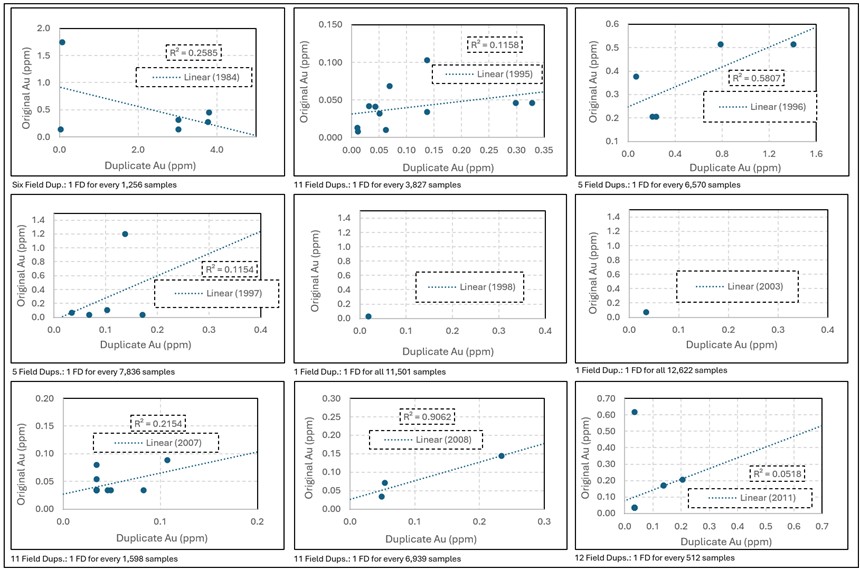
Source: GRE (2024)
| 11 July 2024 |
| Florida Canyon Gold Mine | Page 72 |
| Florida Canyon Gold Inc. | NI 43-101 Technical Report |
Figure 12-2: Pulp Duplicate Samples from Some Drilling Programs Prior to 2017
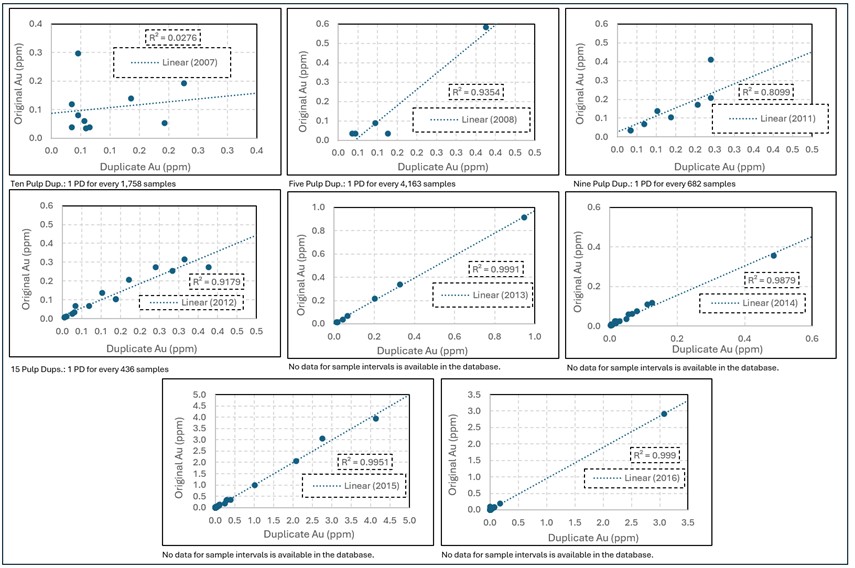
Source: GRE (2024)
| 11 July 2024 |
| Florida Canyon Gold Mine | Page 73 |
| Florida Canyon Gold Inc. | NI 43-101 Technical Report |
12.3.2 2017 QA/QC
In 2017, Rye Patch completed a total of 1,130 feet containing 1,347 assay samples in 18 RC drill holes at FCM. GRE verified IMC's previous work on 2017 data and found that material errors from the Rye Patch QA/QC data were not noted.
The 2017 data was provided to GRE in .csv format and included collar, survey, assay, geology, and QA/QC files for the 2017 drilling programs.
Rye Patch's QA/QC data from the 2017 drilling program was submitted to GRE for review and verification. GRE's QP believes the 2017 data showed satisfactory duplicate (pulp), blank, and standard results, and no errors were found.
GRE independently analyzed Rye Patch's data relevant to the 2017 drilling program, comparing the data directly with the provided assay certificates. About fifty percent (50%) of all original assay certificates from the 2017 drilling program were manually spot-checked with the database for accuracy, and no errors were found.
12.3.2.1 2017 Blank Samples
A total of 13 blank samples were used in the 2017 drilling campaign. The blank sample materials used were MEG-blank 14.01 and MEG-blank 14.04, which were inserted at a rate of approximately one per 100 samples from the 2017 drilling program.
Figure 12-3 and Figure 12-4 show the assay results of the blanks for gold. The revaluation results show zero samples registered above the 5x detection limit. Thus, there is no contamination during the lab analysis.
Generally, the QA/QC blank sample insertion rates fall below the generally accepted industry standard of one blank sample per every 20 interval samples.
| 11 July 2024 |
| Florida Canyon Gold Mine | Page 74 |
| Florida Canyon Gold Inc. | NI 43-101 Technical Report |
Figure 12-3: 2017 Drilling Campaign, Blank Results
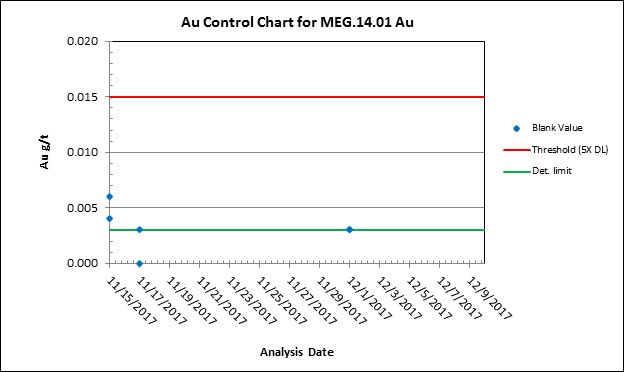
| Source: GRE (2024) |
Figure 12-4: 2017 Drilling Campaign, Blank Results
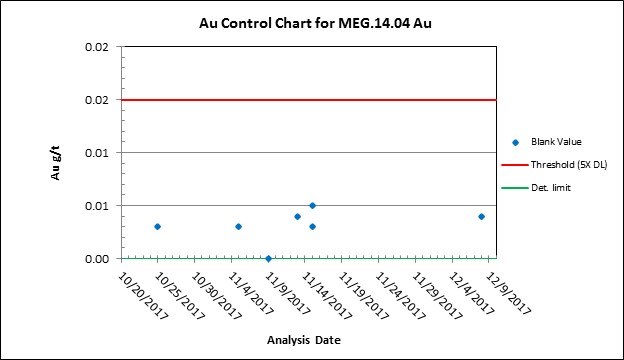 |
| Source: GRE (2024) |
| 11 July 2024 |
| Florida Canyon Gold Mine | Page 75 |
| Florida Canyon Gold Inc. | NI 43-101 Technical Report |
12.3.2.2 2017 Certified Reference Materials Analysis
Commercially prepared CRM samples for gold were inserted into the sample stream for the 2017 drilling campaign at a rate of one standard per six sample assays for all 1,348 RC samples. An analysis of 11 CRM charts for high, medium, and low gold grades showed no obvious errors or bias (see Figure 12-5 through Figure 12-15).
All CRMs demonstrated acceptable results for gold.
Figure 12-5: CRM MEG-Au.09.08 from the 2017 Drilling Campaign
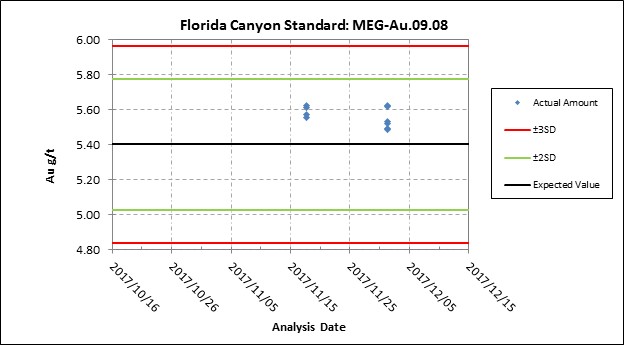 |
| Source: GRE (2024) |
| 11 July 2024 |
| Florida Canyon Gold Mine | Page 76 |
| Florida Canyon Gold Inc. | NI 43-101 Technical Report |
Figure 12-6: CRM MEG-Au.10.03 from the 2017 Drilling Campaign
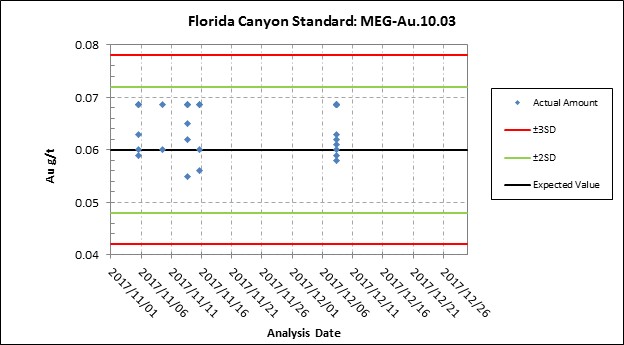 |
| Source: GRE (2024) |
Figure 12-7: CRM MEG-Au.11.13 from the 2017 Drilling Campaign
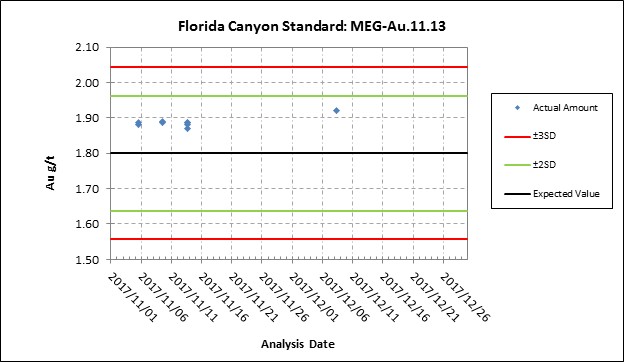 |
| Source: GRE (2024) |
| 11 July 2024 |
| Florida Canyon Gold Mine | Page 77 |
| Florida Canyon Gold Inc. | NI 43-101 Technical Report |
Figure 12-8: CRM MEG-Au.12.11 from the 2017 Drilling Campaign
|
| Source: GRE (2024) |
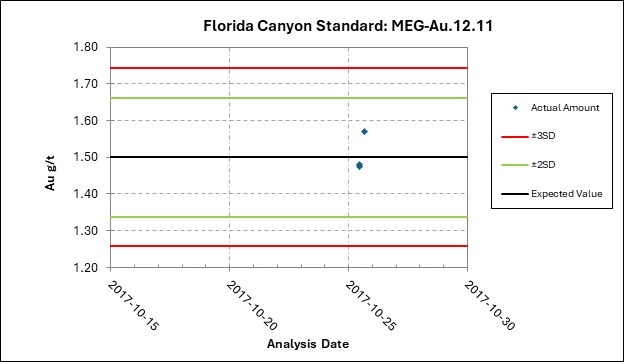
Figure 12-9: CRM MEG-Au.12.13 from the 2017 Drilling Campaign
|
| Source: GRE (2024) |
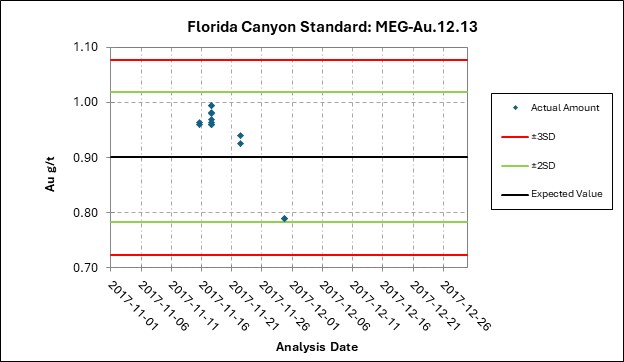
| 11 July 2024 |
| Florida Canyon Gold Mine | Page 78 |
| Florida Canyon Gold Inc. | NI 43-101 Technical Report |
Figure 12-10: CRM MEG-Au.12.20 from the 2017 Drilling Campaign
|
| Source: GRE (2024) |
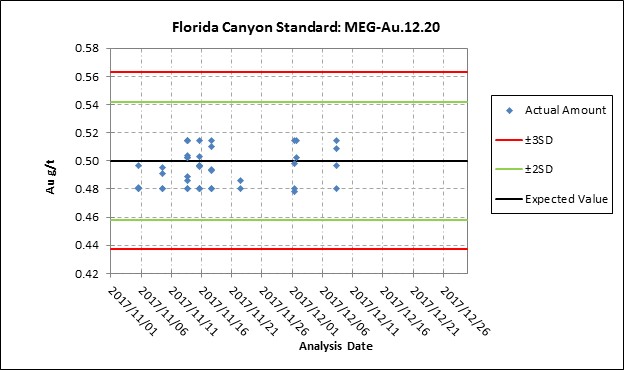
Figure 12-11: CRM MEG-Au.12.21 from the 2017 Drilling Campaign
|
| Source: GRE (2024) |
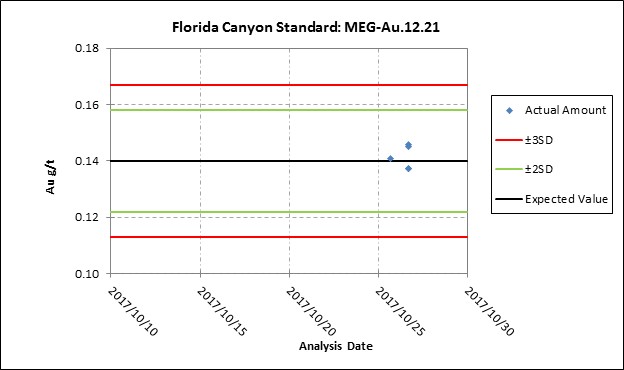
| 11 July 2024 |
| Florida Canyon Gold Mine | Page 79 |
| Florida Canyon Gold Inc. | NI 43-101 Technical Report |
Figure 12-12: CRM MEG-Au.12.23 from the 2017 Drilling Campaign
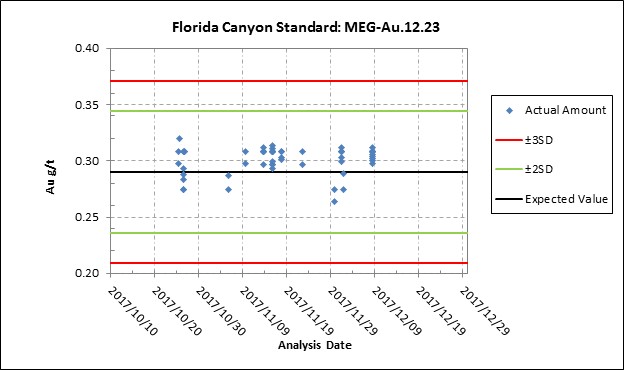 |
| Source: GRE (2024) |
Figure 12-13: CRM MEG-Au.12.25 from the 2017 Drilling Campaign
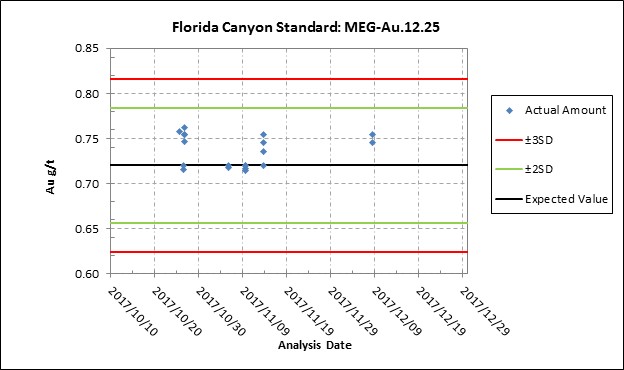 |
| Source: GRE (2024) |
| 11 July 2024 |
| Florida Canyon Gold Mine | Page 80 |
| Florida Canyon Gold Inc. | NI 43-101 Technical Report |
Figure 12-14: CRM MEG-Au. S105006X from the 2017 Drilling Campaign
|
| Source: GRE (2024) |
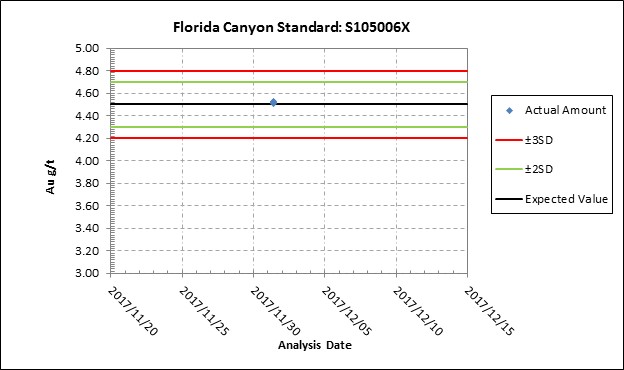
Figure 12-15: CRM MEG-Au. S107007X from the 2017 Drilling Campaign
|
| Source: GRE (2024) |
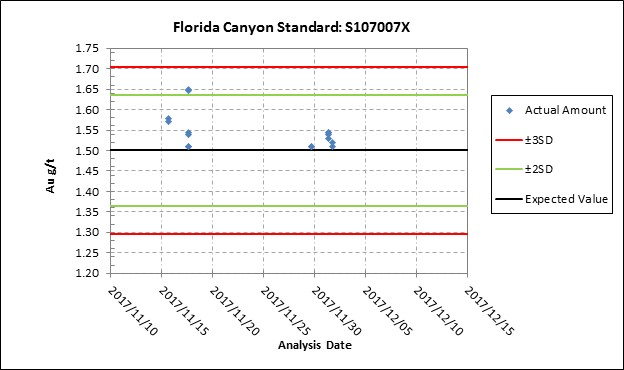
| 11 July 2024 |
| Florida Canyon Gold Mine | Page 81 |
| Florida Canyon Gold Inc. | NI 43-101 Technical Report |
12.3.2.3 2017 Duplicate Analysis
For the 2017 drilling program, total duplicate samples for gold were selected at a rate of approximately one duplicate sample per every 4 assay samples, including 372 pulp duplicates (at a rate of 27 field duplicates per every 100 assay samples) for all RC holes (Figure 12-16). In this program, no field duplicates were inserted into the sample stream. Pulp duplicates were prepared the same way as all assay samples and were assayed at AAL.
The Q-Q plot for gold effectively indicates that there is no scatter for pulp duplicates, with R2 values of 0.9984. The pulp data performed during the 2017 drilling campaigns occurred within acceptable tolerance criteria at lower and higher-grade values.
Figure 12-16: Pulp Duplicate Samples from the 2017 Drilling Campaign
|
| Source: GRE (2024) |
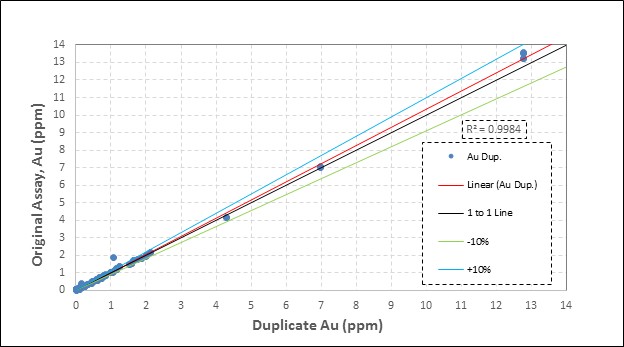
12.3.3 2020-2023 Database
From 2020 to 2023, FCM completed 156,634 feet containing 30,529 assay samples in 540 drill holes at FCM.
The current data was provided to GRE in .csv format and included collar, survey, assay, geology for the entire database, and FCMs in-house QA/QC files for the 2020 to 2023 drilling programs.
GRE performed an independent analysis of FCM's data relevant to the 2020 to 2023 drilling programs, comparing the data with the provided assay certificates. Ten percent (10%) of all original assay certificates for 54 holes, from the 2020 to 2023 drilling programs were manually spot-checked with the database for accuracy, and no errors were found.
| 11 July 2024 |
| Florida Canyon Gold Mine | Page 82 |
| Florida Canyon Gold Inc. | NI 43-101 Technical Report |
12.3.4 Verification of Florida Canyon Mine Analytical Quality Control Data
FCM's in-house QA/QC data from the 2020 to 2023 drilling programs were submitted to GRE for review and verification. The data showed satisfactory duplicate (field and pulp), blank, and standard results. All samples were analyzed at AAL, and their certificates are available.
12.3.5 2020 QA/QC
12.3.5.1 2020 Blank Samples
A total of 20 blank samples were used in the 2020 drilling campaign. The blank sample materials used were MEG-blank 17.12, which were inserted at a rate of approximately one per 100 samples from the 2020 drilling program.
Figure 12-17 shows the assay results of the blanks for gold. The revaluation results show zero samples registered above the 5x detection limit. Thus, there was no contamination during the lab analysis.
Generally, the QA/QC blank sample insertion rates fall below general accepted industry standards. For future exploration campaigns, one blank sample should be inserted every 20 interval samples, as is common within industry standards.
Figure 12-17: 2020 Drilling Campaign, Blank Results
|
| Source: GRE (2024) |
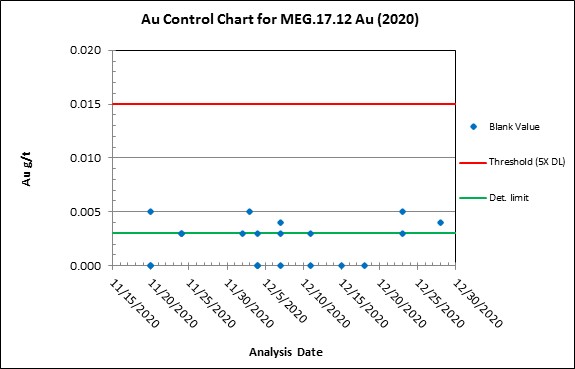
12.3.5.2 2020 Certified Reference Materials Analysis
Commercially prepared CRM samples for gold were inserted into the sample stream for the 2020 drilling campaign at a rate of one standard per 18 sample assays for all 2,106 RC samples. An analysis of six CRM charts for high, medium, and low gold grades showed no obvious errors or bias (see Figure 12-18 through Figure 12-23).
| 11 July 2024 |
| Florida Canyon Gold Mine | Page 83 |
| Florida Canyon Gold Inc. | NI 43-101 Technical Report |
All CRMs demonstrated acceptable results for gold.
Figure 12-18: CRM MEG-Au.17.04 from the 2020 Drilling Campaign
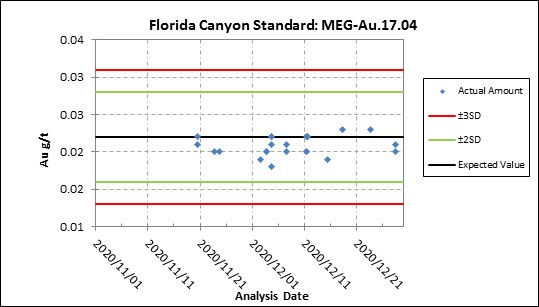 |
| Source: GRE (2024) |
Figure 12-19: CRM MEG-Au.17.08 from the 2020 Drilling Campaign
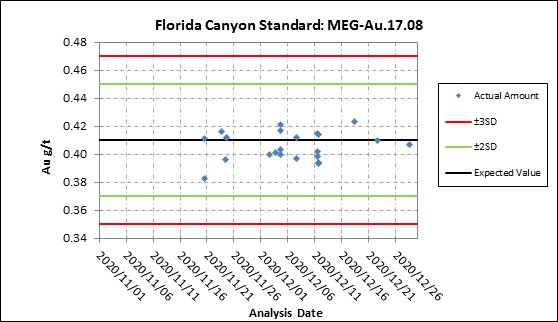 |
| Source: GRE (2024) |
| 11 July 2024 |
| Florida Canyon Gold Mine | Page 84 |
| Florida Canyon Gold Inc. | NI 43-101 Technical Report |
Figure 12-20: CRM MEG-Au.17.21 from the 2020 Drilling Campaign
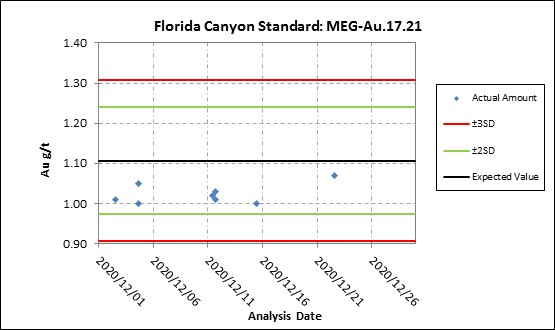 |
| Source: GRE (2024) |
Figure 12-21: CRM MEG-Au.17.23 from the 2020 Drilling Campaign
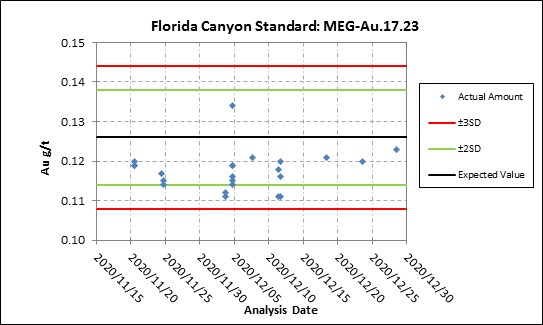 |
| Source: GRE (2024) |
| 11 July 2024 |
| Florida Canyon Gold Mine | Page 85 |
| Florida Canyon Gold Inc. | NI 43-101 Technical Report |
Figure 12-22: CRM MEG-Au.19.05 from the 2020 Drilling Campaign
|
| Source: GRE (2024) |
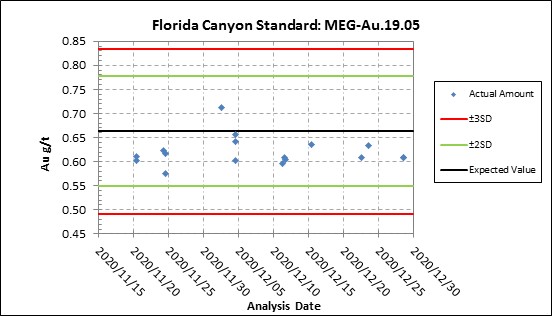
Figure 12-23: CRM MEG-Au.19.10 from the 2022 Drilling Campaign
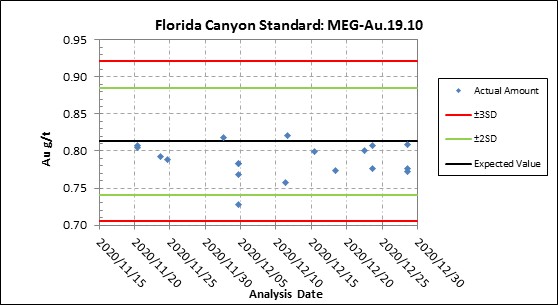 |
| Source: GRE (2024) |
12.3.5.3 2020 Duplicate Analysis
Based on FCM's in-house QA/QC report for the 2020 drilling program, total duplicate samples for gold were selected at a rate of one duplicate sample per every 7 assay samples, including 132 filed duplicates (at a rate of six field duplicates per every 100 assay samples) and 179 pulp duplicates (at a rate of eight pulp duplicates for every 100 assay samples) for all holes (Figure 12-24 and Figure 12-25 ). Duplicate samples were prepared the same way as all assay samples and were assayed at AAL.
| 11 July 2024 |
| Florida Canyon Gold Mine | Page 86 |
| Florida Canyon Gold Inc. | NI 43-101 Technical Report |
The Q-Q plot for gold effectively indicates that there are few scatters, with R2 values of 0.8101 for field duplicates and no scatter for pulp duplicates, with R2 values of 0.9357. The pulp data performed during the 2020 drilling campaigns occurred within acceptable tolerance criteria at lower- and higher-grade values.
Figure 12-24: Field Duplicate Samples from the 2020 Drilling Campaign
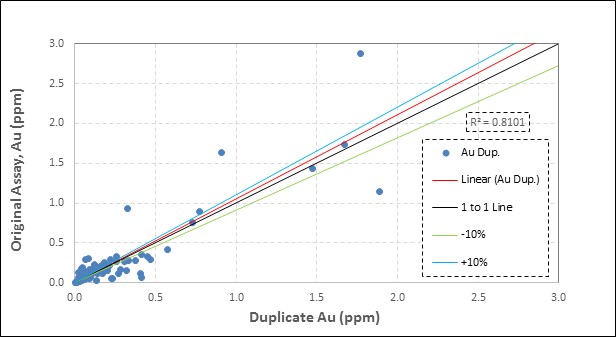 |
| Source: GRE (2024) |
Figure 12-25: Pulp Duplicate Samples from the 2020 Drilling Campaign
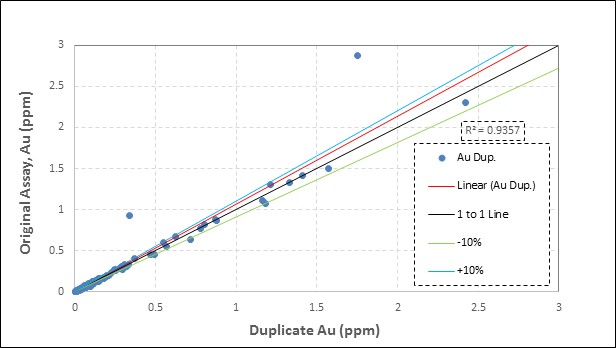 |
| Source: GRE (2024) |
| 11 July 2024 |
| Florida Canyon Gold Mine | Page 87 |
| Florida Canyon Gold Inc. | NI 43-101 Technical Report |
12.3.6 2021 QA/QC
12.3.6.1 2021 Blank Samples
A total of 65 blank samples were used in the 2021 drilling campaign. The blank sample materials used were MEG-blank 17.12, which were inserted at a rate of approximately one per 100 samples from the 2021 drilling program.
Figure 12-26 shows the assay results of the gold blanks. The revaluation results show only one sample registered above the 5x detection limit. Generally, there was no contamination during the lab analysis.
In this drilling campaign, the QA/QC blank sample insertion rates fall below generally accepted industry standards.
Figure 12-26: 2021 Drilling Campaign, Blank Results
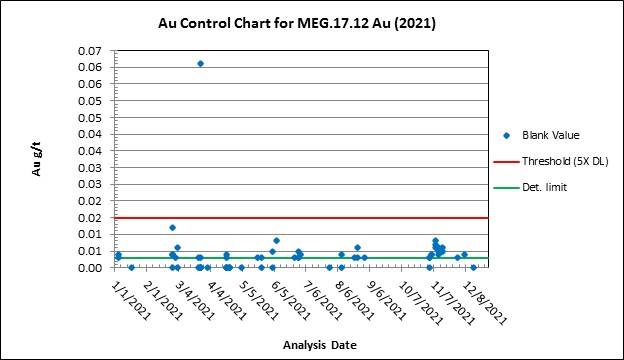 |
| Source: GRE (2024) |
12.3.6.2 2021 Certified Reference Materials Analysis
Commercially prepared CRM samples for gold were inserted into the sample stream for the 2021 drilling campaign at a rate of one standard per 13 sample assays for all 4,988 RC and core samples. An analysis of seven CRM charts for high, medium, and low gold grades showed no obvious errors or bias (see Figure 12-27 through Figure 12-33).
All CRMs demonstrated acceptable results for gold.
| 11 July 2024 |
| Florida Canyon Gold Mine | Page 88 |
| Florida Canyon Gold Inc. | NI 43-101 Technical Report |
Figure 12-27: CRM MEG-Au.17.04 from the 2021 Drilling Campaign
|
| Source: GRE (2024) |

Figure 12-28: CRM MEG-Au.17.08 from the 2021 Drilling Campaign
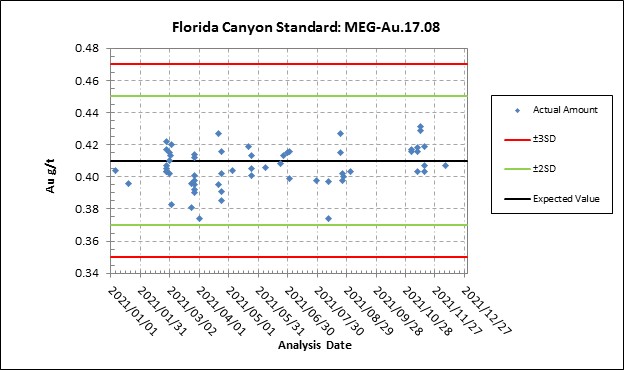 |
| Source: GRE (2024) |
| 11 July 2024 |
| Florida Canyon Gold Mine | Page 89 |
| Florida Canyon Gold Inc. | NI 43-101 Technical Report |
Figure 12-29: CRM MEG-Au.17.21 from the 2021 Drilling Campaign
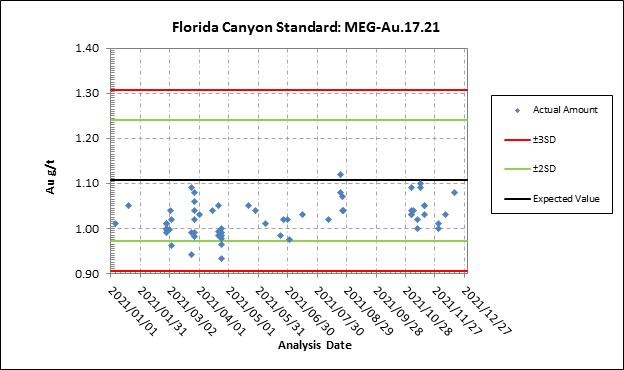 |
| Source: GRE (2024) |
Figure 12-30: CRM MEG-Au.17.23 from the 2021 Drilling Campaign
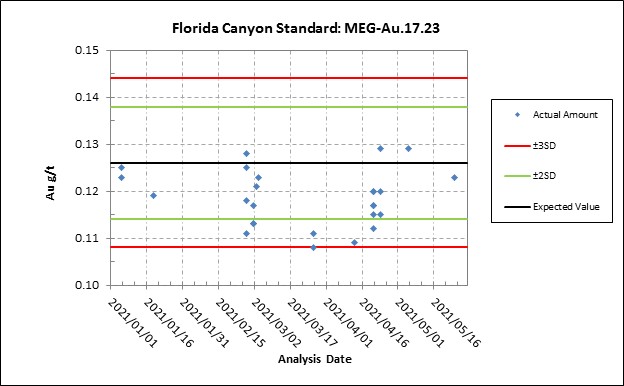 |
| Source: GRE (2024) |
| 11 July 2024 |
| Florida Canyon Gold Mine | Page 90 |
| Florida Canyon Gold Inc. | NI 43-101 Technical Report |
Figure 12-31: CRM MEG-Au.19.05 from the 2021 Drilling Campaign
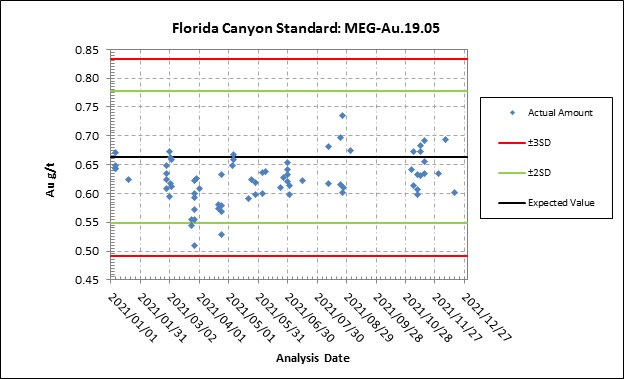 |
| Source: GRE (2024) |
Figure 12-32: CRM MEG-Au.19.08 from the 2021 Drilling Campaign
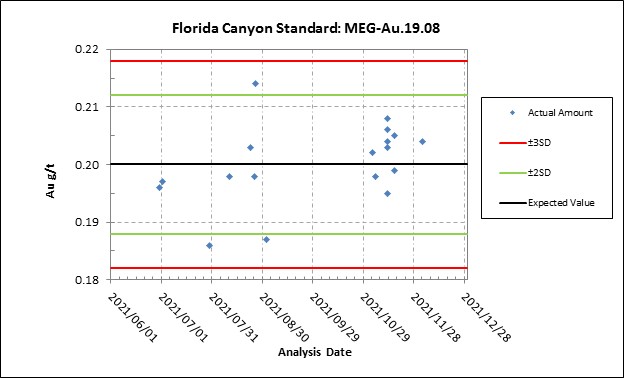 |
| Source: GRE (2024) |
| 11 July 2024 |
| Florida Canyon Gold Mine | Page 91 |
| Florida Canyon Gold Inc. | NI 43-101 Technical Report |
Figure 12-33: CRM MEG-Au.19.10 from the 2021 Drilling Campaign
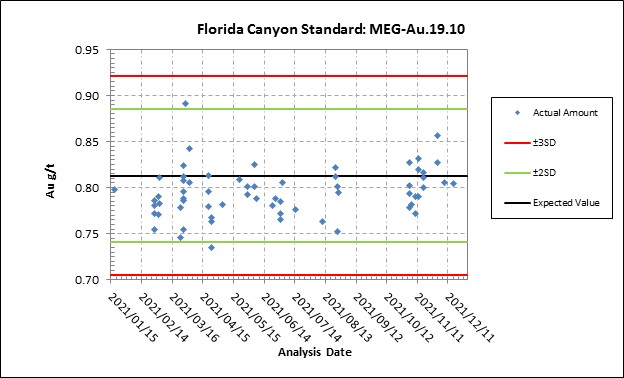 |
| Source: GRE (2024) |
12.3.6.3 2021 Duplicate Analysis
For the 2021 drilling program, total duplicate samples for gold were selected at a rate of one duplicate sample per every 4 assay samples, including 520 field duplicates (at a rate of ten field duplicates per every 100 assay samples) and 780 pulp duplicates (at a rate of 16 pulp duplicate for every 100 assay samples) for all holes (Figure 12-34 and Figure 12-35). Duplicate samples were prepared the same way as all assay samples and were assayed at AAL.
The Q-Q plot for gold effectively indicates that there are few scatters, with R2 values of 0.9329 for field duplicates and no scatter for pulp duplicates, with R2 values of 0.9980. The field and pulp duplicate data performed during the 2021 drilling campaigns occurred within acceptable tolerance criteria at lower- and higher-grade values.
| 11 July 2024 |
| Florida Canyon Gold Mine | Page 92 |
| Florida Canyon Gold Inc. | NI 43-101 Technical Report |
Figure 12-34: Field Duplicate Samples from the 2021 Drilling Campaign
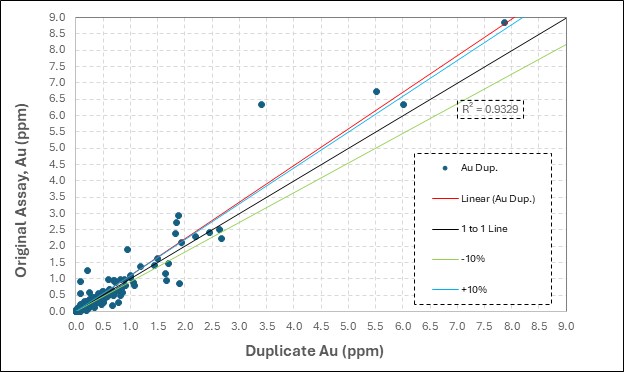 |
| Source: GRE (2024) |
Figure 12-35: Pulp Duplicate Samples from the 2021 Drilling Campaign
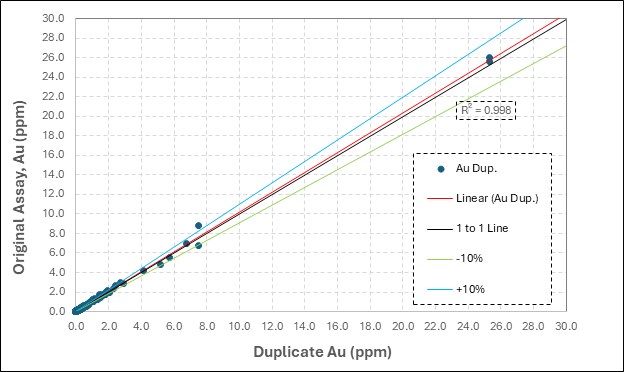 |
| Source: GRE (2024) |
| 11 July 2024 |
| Florida Canyon Gold Mine | Page 93 |
| Florida Canyon Gold Inc. | NI 43-101 Technical Report |
12.3.7 2022 QA/QC
12.3.7.1 2022 Blank Samples
A total of 129 blank samples were used in the 2022 drilling campaign. The blank sample materials used were MEG-blank 17.12 and MEG-blank 21.01, which were inserted at a rate of approximately one per 100 samples from the 2022 drilling program.
Figure 12-36 and Figure 12-37 show the assay results of the gold blanks. The revaluation results show no samples registered above the 5x detection limit. Generally, there was no contamination during the lab analysis.
The QA/QC blank sample insertion rates in this drilling campaign fall below generally accepted industry standards.
Figure 12-36: 2022 Drilling Campaign, Blank Results
|
| Source: GRE (2024) |
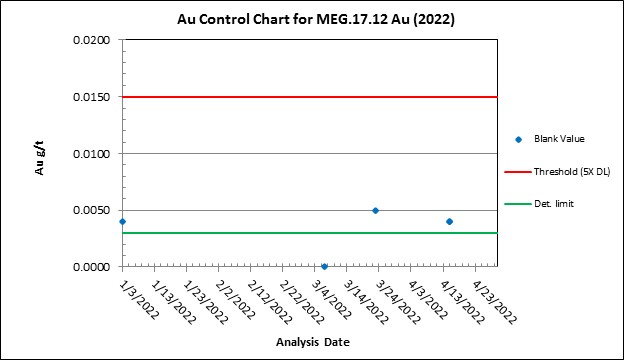
| 11 July 2024 |
| Florida Canyon Gold Mine | Page 94 |
| Florida Canyon Gold Inc. | NI 43-101 Technical Report |
Figure 12-37: 2022 Drilling Campaign, Blank Results
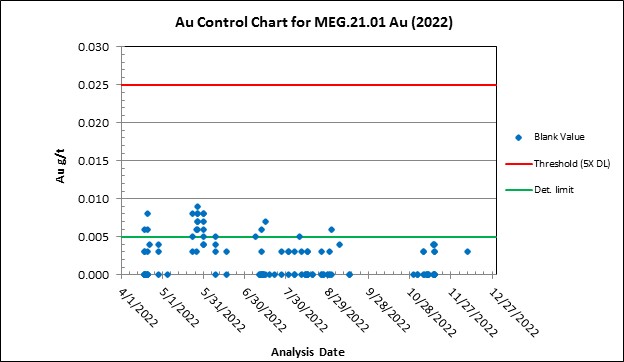 |
| Source: GRE (2024) |
12.3.7.2 2022 Certified Reference Materials Analysis
Commercially prepared CRM samples for gold were inserted into the sample stream for the 2022 drilling campaign at a rate of one standard per 16 sample assays for all 10,752 RC and core samples. An analysis of ten CRM charts for high, medium, and low gold grades showed no obvious errors or bias (see Figure 12-38 through Figure 12-47).
All CRMs demonstrated acceptable results for gold.
| 11 July 2024 |
| Florida Canyon Gold Mine | Page 95 |
| Florida Canyon Gold Inc. | NI 43-101 Technical Report |
Figure 12-38: CRM MEG-Au.17.04 from the 2022 Drilling Campaign
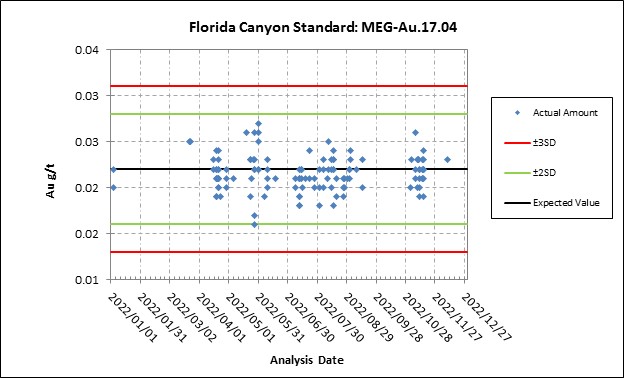 |
| Source: GRE (2024) |
Figure 12-39: CRM MEG-Au.17.08 from the 2022 Drilling Campaign
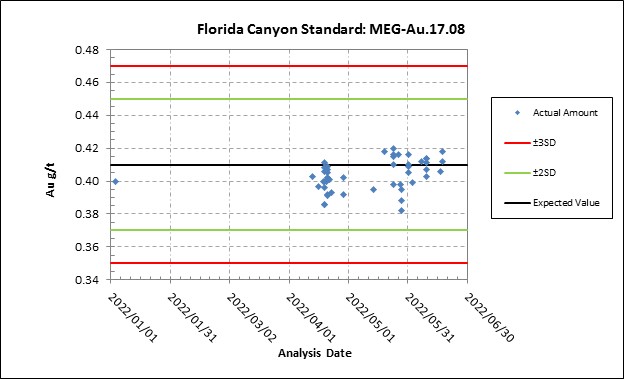 |
| Source: GRE (2024) |
| 11 July 2024 |
| Florida Canyon Gold Mine | Page 96 |
| Florida Canyon Gold Inc. | NI 43-101 Technical Report |
Figure 12-40: CRM MEG-Au.17.21 from the 2022 Drilling Campaign
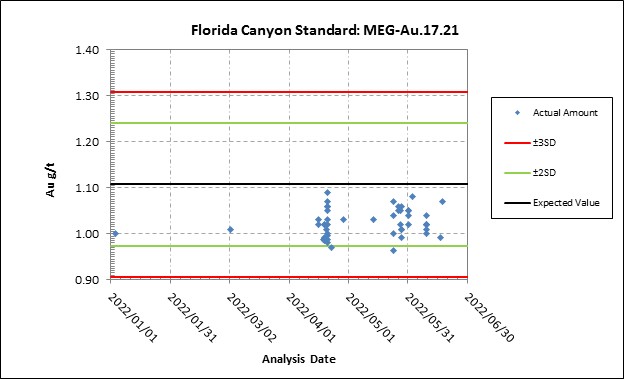 |
| Source: GRE (2024) |
Figure 12-41: CRM MEG-Au.19.05 from the 2022 Drilling Campaign
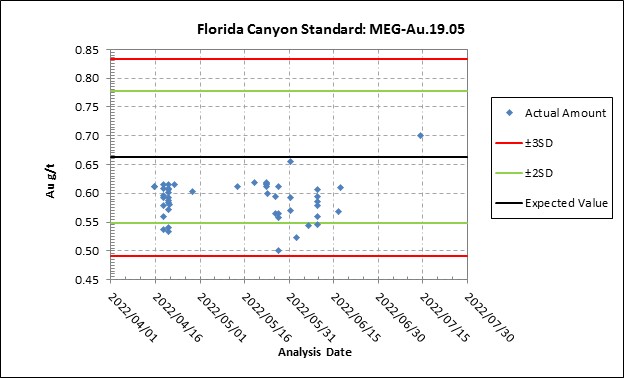 |
| Source: GRE (2024) |
| 11 July 2024 |
| Florida Canyon Gold Mine | Page 97 |
| Florida Canyon Gold Inc. | NI 43-101 Technical Report |
Figure 12-42: CRM MEG-Au.19.07 from the 2022 Drilling Campaign
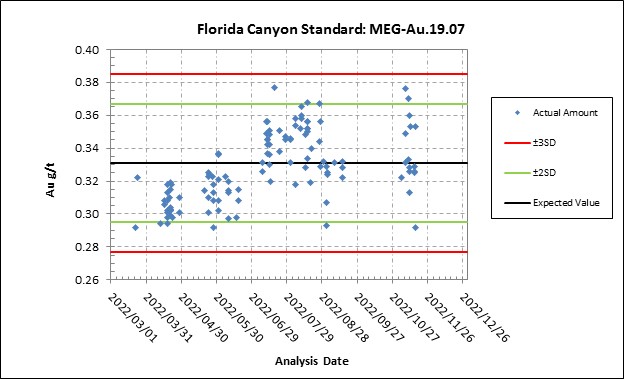 |
| Source: GRE (2024) |
Figure 12-43: CRM MEG-Au.19.09 from the 2022 Drilling Campaign
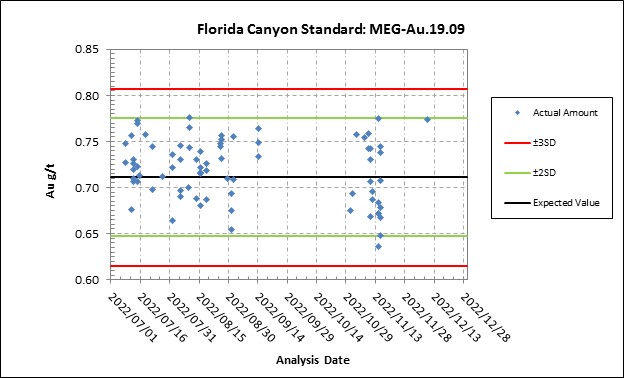 |
| Source: GRE (2024) |
| 11 July 2024 |
| Florida Canyon Gold Mine | Page 98 |
| Florida Canyon Gold Inc. | NI 43-101 Technical Report |
Figure 12-44: CRM MEG-Au.19.10 from the 2022 Drilling Campaign
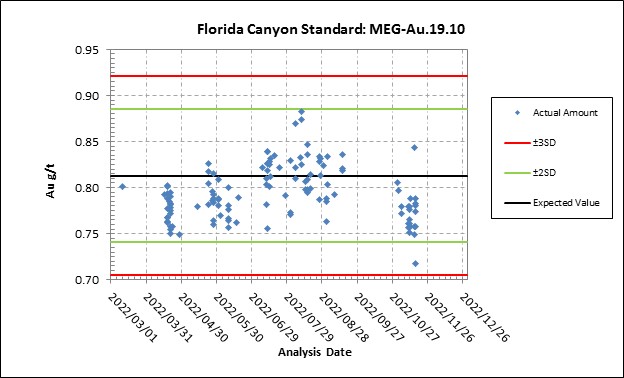 |
| Source: GRE (2024) |
Figure 12-45: CRM MEG-Au.19.11 from the 2022 Drilling Campaign
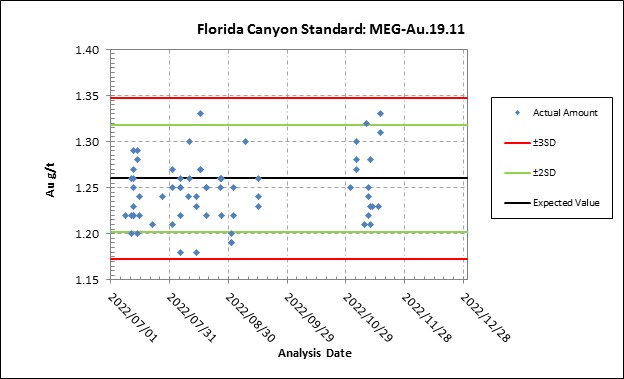 |
| Source: GRE (2024) |
| 11 July 2024 |
| Florida Canyon Gold Mine | Page 99 |
| Florida Canyon Gold Inc. | NI 43-101 Technical Report |
Figure 12-46: CRM MEG-Au.21.01 from the 2022 Drilling Campaign
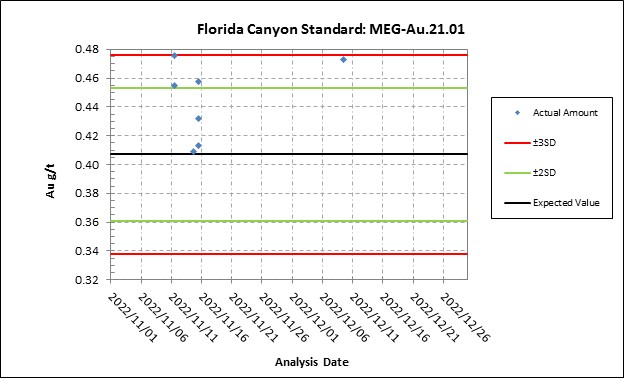 |
| Source: GRE (2024) |
Figure 12-47: CRM MEG-Au.21.05 from the 2022 Drilling Campaign
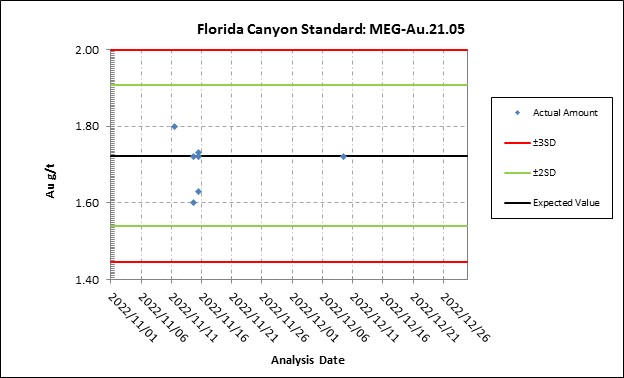 |
| Source: GRE (2024) |
| 11 July 2024 |
| Florida Canyon Gold Mine | Page 100 |
| Florida Canyon Gold Inc. | NI 43-101 Technical Report |
12.3.7.3 2022 Duplicate Analysis
In the 2022 drilling program, total duplicate samples for gold were selected at a rate of one duplicate sample per every 5 assay samples, including 846 field duplicates (at a rate of eight field duplicates per every 100 assay samples) and 1,482 pulp duplicates (at a rate of 14 pulp duplicate for every 100 assay samples) for all holes (Figure 12-48 and Figure 12-49). Duplicate samples were prepared the same way as all assay samples and were assayed at AAL.
The Q-Q plot for gold effectively indicates that there are only two scatters, with R2 values of 0.9677 for field duplicates and no scatter for pulp duplicates, with R2 values of 0.9955. The Field and pulp duplicate data performed during the 2022 drilling campaigns occurred within acceptable tolerance criteria at lower- and higher-grade values.
Figure 12-48: Field Duplicate Samples from the 2022 Drilling Campaign
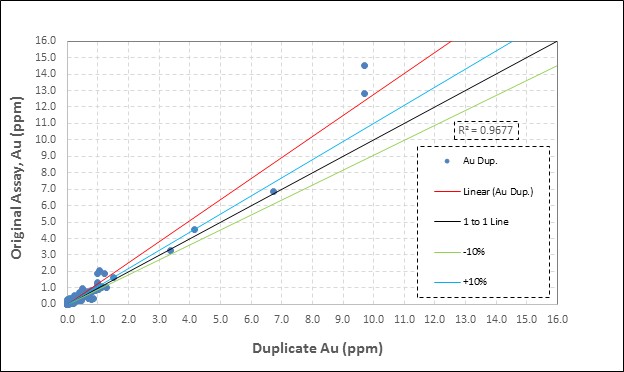 |
| Source: GRE (2024) |
| 11 July 2024 |
| Florida Canyon Gold Mine | Page 101 |
| Florida Canyon Gold Inc. | NI 43-101 Technical Report |
Figure 12-49: Pulp Duplicate Samples from the 2022 Drilling Campaign
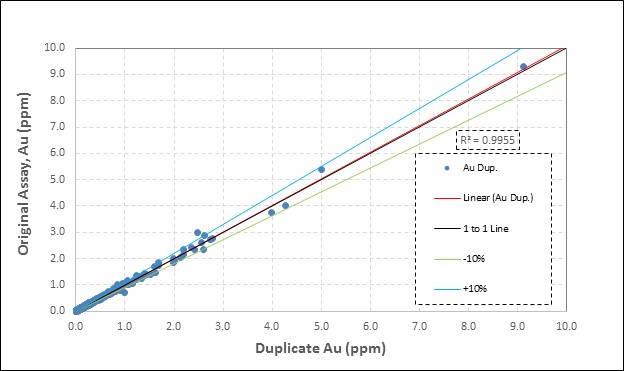 |
| Source: GRE (2024) |
12.3.8 2023 QA/QC
12.3.8.1 2023 Blank Samples
A total of 185 blank samples were used in the 2023 drilling campaign. The blank sample materials used were MEG-blank 21.01 and MEG-blank 21.03, which were inserted at a rate of approximately one per 100 samples from the 2023 drilling program.
Figure 12-50 and Figure 12-51 show the assay results of the gold blanks. The revaluation results show no samples registered above the 5x detection limit. Generally, there was no contamination during the lab analysis.
This drilling campaign's QA/QC blank sample insertion rates fall below generally accepted industry standards.
| 11 July 2024 |
| Florida Canyon Gold Mine | Page 102 |
| Florida Canyon Gold Inc. | NI 43-101 Technical Report |
Figure 12-50: 2023 Drilling Campaign, Blank Results
 |
| Source: GRE (2024) |
Figure 12-51: 2023 Drilling Campaign, Blank Results
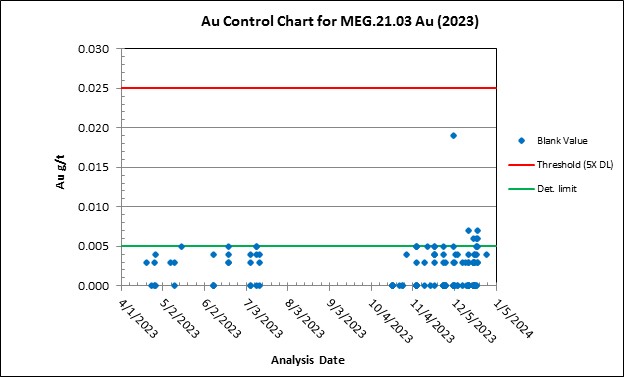 |
| Source: GRE (2024) |
| 11 July 2024 |
| Florida Canyon Gold Mine | Page 103 |
| Florida Canyon Gold Inc. | NI 43-101 Technical Report |
12.3.8.2 2023 Certified Reference Materials Analysis
Commercially prepared CRM samples for gold were inserted into the sample stream for the 2023 drilling campaign at a rate of one standard per 14 assay samples for all 12,683 RC and core samples. An analysis of five CRM charts for high, medium, and low gold grades showed only one error for MEG-Au.21.01 with an assay value slightly more than +3SD, and the rest of the results showed no obvious errors or bias (see Figure 12-52 through Figure 12-56).
All CRMs demonstrated acceptable results for gold.
Figure 12-52: CRM MEG-Au.17.04 from the 2023 Drilling Campaign
|
| Source: GRE (2024) |
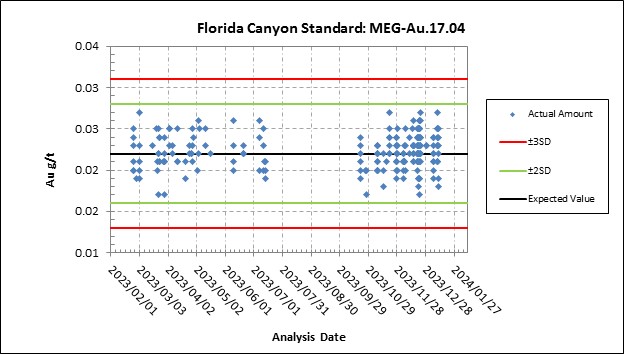
| 11 July 2024 |
| Florida Canyon Gold Mine | Page 104 |
| Florida Canyon Gold Inc. | NI 43-101 Technical Report |
Figure 12-53: CRM MEG-Au.19.09 from the 2023 Drilling Campaign
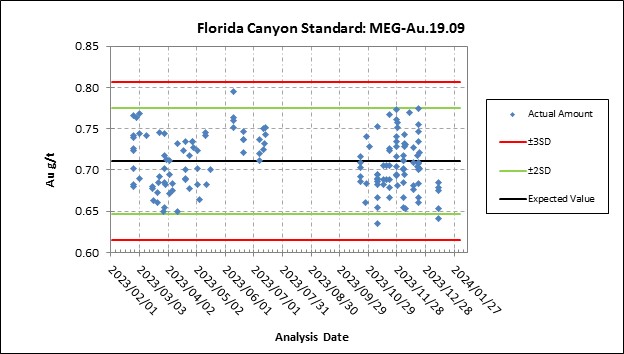 |
| Source: GRE (2024) |
Figure 12-54: CRM MEG-Au.19.10 from the 2023 Drilling Campaign
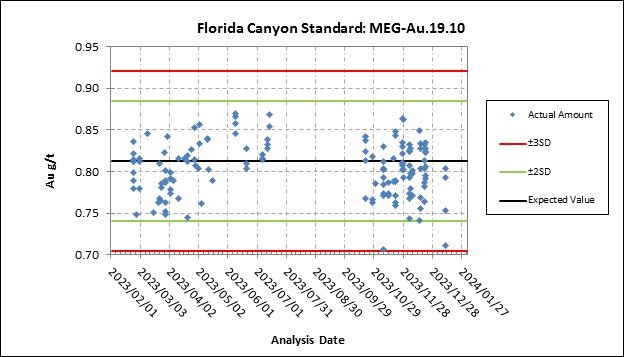 |
| Source: GRE (2024) |
| 11 July 2024 |
| Florida Canyon Gold Mine | Page 105 |
| Florida Canyon Gold Inc. | NI 43-101 Technical Report |
Figure 12-55: CRM MEG-Au.21.01 from the 2023 Drilling Campaign
 |
| Source: GRE (2024) |
Figure 12-56: CRM MEG-Au.21.05 from the 2023 Drilling Campaign
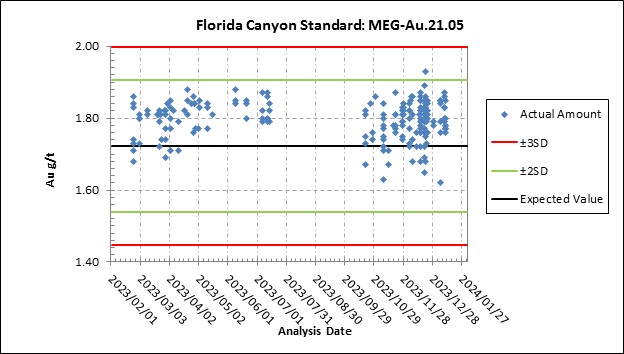 |
| Source: GRE (2024) |
12.3.8.3 2023 Duplicate Analysis
In the 2023 drilling program, total duplicate samples for gold were selected at a rate of one duplicate sample per every 8 assay samples, including 1,638 pulp duplicates (at a rate of 13 pulp duplicates for every 100 assay samples) for all holes (Figure 12-57). Duplicate samples were prepared the same way as all assay samples and were assayed at AAL.
| 11 July 2024 |
| Florida Canyon Gold Mine | Page 106 |
| Florida Canyon Gold Inc. | NI 43-101 Technical Report |
The Q-Q plot for gold effectively indicates that there is no scatter, with R2 values of 0.9975 for pulp duplicates. The pulp duplicate data performed during the 2023 drilling campaigns occurred within acceptable tolerance criteria at lower- to higher-grade values.
Figure 12-57: Pulp Duplicate Samples from the 2023 Drilling Campaign
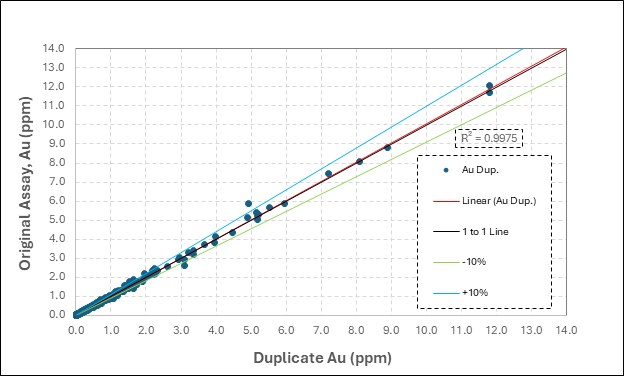 |
| Source: GRE (2024) |
12.3.9 The Field Visit by GRE, Geological Data Verification and Check Assays
GRE's QPs, Dr. Hamid Samari and Ms. Terre Lane, conducted an on-site inspection at FCM from 23 to 24 January 2024, accompanied by Argonaut's vice president of exploration, Mr. Owen Nicholls, Argonaut's senior geologist, Mr. Brian White, and Principal Modeling & Database Geologist, Mr. Wiley B Skewes. The GRE's QP, Dr. Hamid Samari conducted this field visit mainly to check all 2020-2023 exploration programs (as exploration programs prior to this had been validated within previous Technical Reports) and to conduct field checks including the validation and accuracy of collar coordinates, geological maps, and geological logging, and to take a few core samples for assay checking.
12.3.9.1 Collar Coordinate Validation
GRE used a handheld GPS, model Garmin 64st, to check the coordinates at each drill location being validated. Geographic coordinates for 13 of the existing drill hole collar locations (2022 and 2023) were recorded in the field using a hand-held GPS unit. The average variance between field collar coordinates and collar coordinates contained in the project database is roughly 8.9 feet, which is within the expected margin of error. The average variance between field collar elevation and those contained in the project database is 6.9 feet, which is within the expected margin of error (Table 12-3 and Figure 12-58).
| 11 July 2024 |
| Florida Canyon Gold Mine | Page 107 |
| Florida Canyon Gold Inc. | NI 43-101 Technical Report |
Table 12-3: Collar Coordinates Inspections
| General Holes Information | Taken from the Collar Excel Spreadsheet, FCM Database, Local Grid (US Feet) | FCM Local Grid Coordinates Converted to UTM WGS 84 Zone 11 | Taken from the hand-held GPS, UTM WGS 84 Zone 11 by GRE's QP | Difference Distance (m) | Difference Elevation (m) | |||||||||||
| No. | Hole ID | Hole Type | Depth (ft) | Drill Year | Area | Easting | Northing | Elevation | Easting | Northing | Elevation (m) | Easting | Northing | Elevation (m) | ||
| 1 | FCM-0520 | RC | 555 | 2023 | East Sulfides | 55301.71 | 48403.53 | 5458.07 | 396210.57 | 4491633.57 | 1663.6 | 396209.00 | 4491634.00 | 1669.0 | 1.6 | 5.4 |
| 2 | FCM-0291 | Core | 302 | 2022 | Radio Tower | 56847.18 | 49516.17 | 5808.41 | 396686.39 | 4491965.50 | 1770.4 | 396684.42 | 4491965.03 | 1773.0 | 2.0 | 2.6 |
| 3 | FCM-0455 | Core | 581 | 2023 | East Sulfides | 56193.67 | 51250.42 | 5429.49 | 396495.18 | 4492496.75 | 1654.9 | 396490.00 | 4492495.00 | 1658.0 | 5.5 | 3.1 |
| 4 | FCM-0454 | Core | 1028 | 2023 | East Sulfides | 56579.03 | 51508.18 | 5372.63 | 396613.74 | 4492573.52 | 1637.6 | 396609.00 | 4492575.00 | 1640.0 | 5.0 | 2.4 |
| 5 | FCM-0495 | RC | 500 | 2023 | East Sulfides | 55530.543 | 49849.541 | 5656.573 | 396286.83 | 4492073.02 | 1724.1 | 396286.00 | 4492076.00 | 1725.0 | 3.1 | 0.9 |
| 6 | FCM-0290 | Core | 302 | 2022 | Radio Tower | 55893.93 | 49323.7 | 5560.74 | 396395.14 | 4491911.19 | 1694.9 | 396393.00 | 4491911.00 | 1695.0 | 2.1 | 0.1 |
| 7 | FCM-0292 | Core | 180 | 2022 | Radio Tower | 56896.08 | 50135 | 5402.27 | 396704.09 | 4492153.78 | 1646.6 | 396702.00 | 4492155.00 | 1647.0 | 2.4 | 0.4 |
| 9 | FCM-0438 | Core | 1100.5 | 2023 | East Sulfides | 55300.8 | 49804.05 | 5645.22 | 396216.64 | 4492060.20 | 1720.7 | 396216.00 | 4492062.00 | 1718.0 | 1.9 | 2.7 |
| 10 | FCM-0494 | RC | 500 | 2023 | East Sulfides | 55324.317 | 50257.563 | 5529.196 | 396225.86 | 4492198.24 | 1685.3 | 396224.00 | 4492201.00 | 1685.0 | 3.3 | 0.3 |
| 11 | FCM-0493 | RC | 450 | 2023 | East Sulfides | 55658.698 | 50614.809 | 5585.563 | 396329.34 | 4492305.55 | 1702.5 | 396328.00 | 4492307.00 | 1702.0 | 2.0 | 0.5 |
| 12 | FCM-0492 | RC | 500 | 2023 | East Sulfides | 55660.46 | 50643.98 | 5585.21 | 396330.00 | 4492314.43 | 1702.4 | 396331.00 | 4492313.00 | 1702.0 | 1.7 | 0.4 |
| 13 | FCM-0491 | RC | 500 | 2023 | East Sulfides | 55640.3 | 50628.15 | 5584.56 | 396323.79 | 4492309.70 | 1702.2 | 396325.00 | 4492309.00 | 1701.0 | 1.4 | 1.2 |
| Distance | Elevation | |||||||||||||||
| Maximum Difference | 5.5 | 5.4 | ||||||||||||||
| Minimum Difference | 1.4 | 0.1 | ||||||||||||||
| Average Difference | 2.7 | 1.7 | ||||||||||||||
| 11 July 2024 |
| Florida Canyon Gold Mine | Page 108 |
| Florida Canyon Gold Inc. | NI 43-101 Technical Report |
Figure 12-58: Inspection of the Collar Coordinates
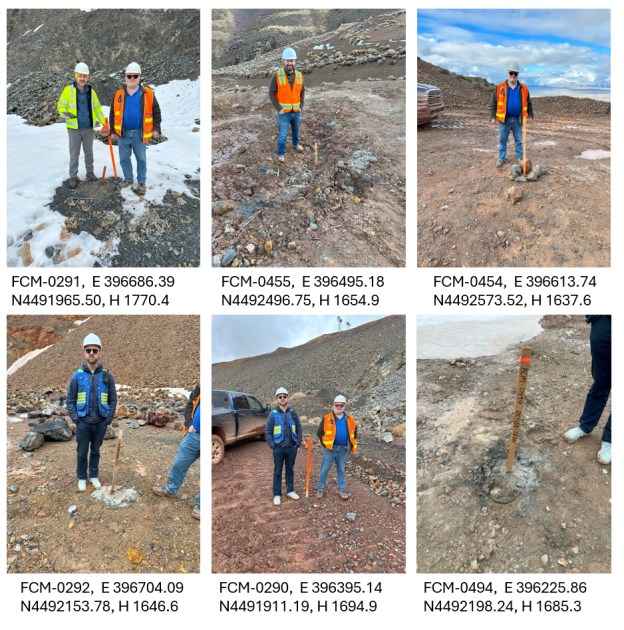
12.3.9.2 Geological Data Verification and Interpretation
From January 23 to 24, 2024, the GRE QP Dr. Hamid Samari spent one and a half days at the project site to check some of the drill collars and the geological map prepared by MDA in 2017 and modified by IMC in 2020 for FCM.
During the site visit, field visit observations generally confirmed the geologic map of the project area. The lithology of exposed bedrock, alteration types, and significant structural features is consistent with descriptions provided in previous project reports (Argonaut, 2020 and Alio, 2019). Dr. Samari did not see any evidence in the field that might significantly alter or refute the current interpretation of the local geologic setting (Figure 12-59, Figure 12-60, and Figure 12-61).
| 11 July 2024 |
| Florida Canyon Gold Mine | Page 109 |
| Florida Canyon Gold Inc. | NI 43-101 Technical Report |
Figure 12-59: GRE's QP Geological Inspections in 2024, different views of Grass Valley Formation
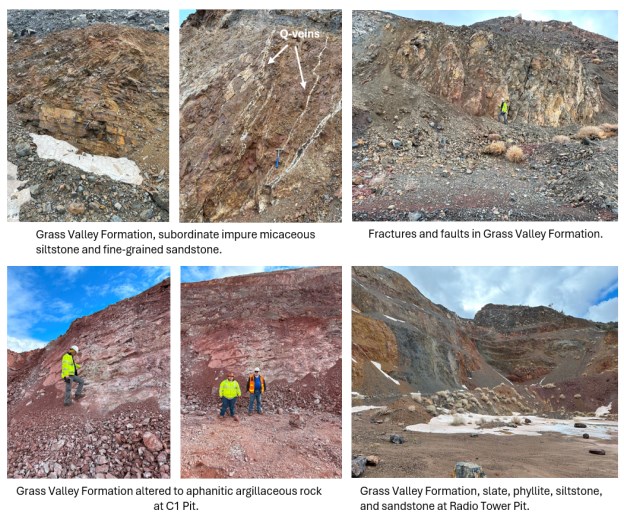
| 11 July 2024 |
| Florida Canyon Gold Mine | Page 110 |
| Florida Canyon Gold Inc. | NI 43-101 Technical Report |
Figure 12-60: GRE's QP Geological Inspections in 2024, Fault and Q-Veins in Grass Valley Formation
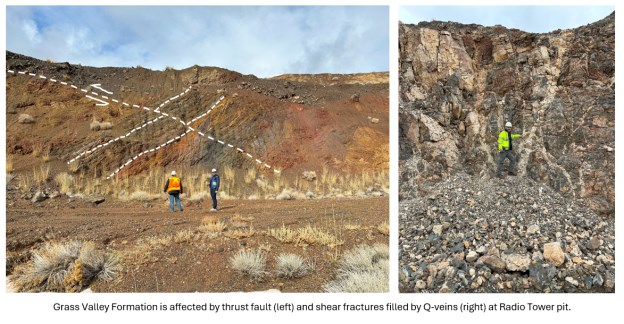
Figure 12-61: GRE's QP Geological Inspections in 2024, Grass Valley and Natchez Pass Formations
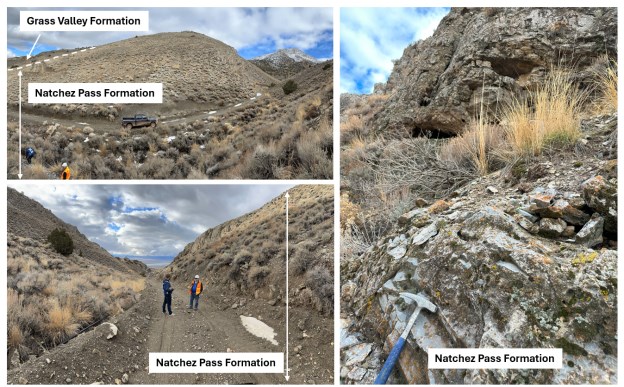
12.3.9.3 Geological Logging Accuracy
During the site visit at the project site, GRE's QP Dr. Hamid Samari checked a few chip trays from two RC holes, FCM-0021 and FCM-0024, which were drilled in 2020 (Table 12-4). The chip trays were stored at the mine site. A total of 400 feet of RC sample intervals were checked visually using a geological hand lens. The inspection results show that the RC sample intervals inspected accurately reflect the lithologies and alteration and sample descriptions recorded on the associated drill hole logs and within the project database (Figure 12-62).
| 11 July 2024 |
| Florida Canyon Gold Mine | Page 111 |
| Florida Canyon Gold Inc. | NI 43-101 Technical Report |
Table 12-4: Visual Inspection of RC Sample Intervals
No. | Hole No | Hole Type | From (ft) | To (ft) | Lithology |
1 | FCM-0021 | RC | 200 | 350 | siltstone |
2 | FCM-0024 | RC | 0 | 10 | dump |
3 | FCM-0024 | RC | 10 | 140 | siltstone |
4 | FCM-0024 | RC | 140 | 160 | gouge |
5 | FCM-0024 | RC | 160 | 350 | siltstone |
Figure 12-62: Visual Inspection of RC Holes FCM-0021 and FCM-0024
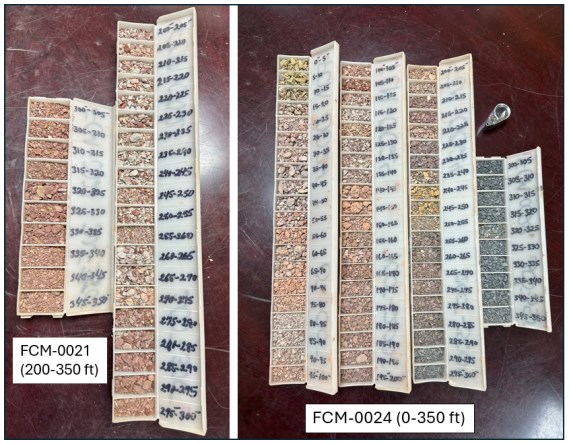
During the site visit, GRE's QP Dr. Hamid Samari also spent some of his site visit at FCM's logging facility at Lovelock, NV approximately 33 miles southwest of the project, where several core boxes were visually inspected (Figure 12-63).
GRE's QP Dr. Hamid Samari compared the core samples in core boxes in FCM's facility at Lovelock, NV to the geologic logs in FCM's database. A total of 446.4 ft core samples, including 50 core boxes, were visually inspected from six different DDH core holes of the 2021 and 2023 drilling campaigns (Table 12-5). The core samples in core boxes were inspected by the QP visually and using a geological hand lens. The sample intervals selected from different mineralization zones contained a range of assay values, lithology, alteration, and mineralization (Figure 12-64 to Figure 12-67).
| 11 July 2024 |
| Florida Canyon Gold Mine | Page 112 |
| Florida Canyon Gold Inc. | NI 43-101 Technical Report |
The GRE QP's inspection results show that the core sample intervals inspected accurately reflect the lithologies, alteration, mineralization, structure, and sample descriptions recorded on the associated drill hole logs and within the project database.
Figure 12-63: Core Storage and Core Logging in FCM's Facility at Lovelock, NV
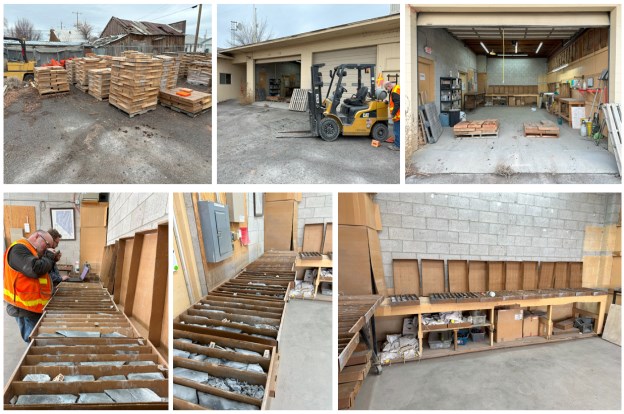
Table 12-5: Visual Inspection of Core Sample Intervals
No. | Hole No. | Core Box | From (ft) | To (ft) | Lithology |
1 | FCM-0500 | 13 | 199.5 | 208 | siltstone with 10% gouge |
2 | FCM-0500 | 18 | 243.5 | 252 | siltstone with 30% breccia |
3 | FCM-0500 | 27 | 298 | 308 | siltstone with 10% gouge |
4 | FCM-0500 | 31 | 369 | 379 | siltstone with 5% gouge |
5 | FCM-0452 | 46 | 457 | 465.5 | siltstone with 25% sandstone |
6 | FCM-0452 | 47 | 465.5 | 477 | siltstone & breccia |
7 | FCM-0452 | 52 | 511 | 521 | siltstone with 40% sandstone |
8 | FCM-0452 | 53 | 521 | 528 | siltstone with 40% sandstone |
9 | FCM-0452 | 55 | 538 | 547.5 | siltstone (breccia) |
10 | FCM-0452 | 56 | 547.5 | 556 | siltstone (breccia) |
| 11 July 2024 |
| Florida Canyon Gold Mine | Page 113 |
| Florida Canyon Gold Inc. | NI 43-101 Technical Report |
No. | Hole No. | Core Box | From | To (ft) | Lithology |
11 | FCM-0452 | 58 | 556 | 566 | siltstone (breccia) |
12 | FCM-0452 | 57 | 566 | 574 | siltstone (breccia) |
13 | FCM-0452 | 59 | 574 | 583 | siltstone |
14 | FCM-0452 | 60 | 592 | 601.5 | siltstone |
15 | FCM-0452 | 61 | 601.5 | 610.5 | siltstone (breccia) |
16 | FCM-0452 | 74 | 717.5 | 726.5 | dacite |
17 | FCM-0452 | 76 | 735 | 744.5 | dacite |
18 | FCM-0452 | 77 | 744.5 | 751.5 | dacite |
19 | FCM-0452 | 78 | 751.5 | 761 | dacite |
20 | FCM-0452 | 79 | 761 | 769 | dacite |
21 | FCM-0452 | 80 | 769 | 777.9 | dacite + Q veins |
22 | FCM-0452 | 83 | 795 | 803 | dacite + Q veins |
23 | FCM-0452 | 86 | 821 | 831 | dacite + Q veins |
24 | FCM-0452 | 87 | 831 | 840.5 | dacite + Q veins |
25 | FCM-0452 | 88 | 840.5 | 849.5 | dacite + Q veins |
26 | FCM-0452 | 89 | 849.5 | 858.5 | dacite + Q veins |
27 | FCM-0452 | 90 | 858.5 | 876 | siltstone+ Q veins |
28 | FCM-0452 | 93 | 884 | 894 | siltstone+ Q veins |
29 | FCM-0452 | 94 | 894 | 903 | siltstone+ Q veins |
30 | FCM-0452 | 96 | 912.5 | 921.5 | siltstone+ Q veins |
31 | FCM-0452 | 97 | 921 | 924 | siltstone (breccia) |
32 | FCM-0438 | 78 | 745.5 | 754 | siltstone (breccia) |
33 | FCM-0438 | 79 | 754 | 763 | siltstone (breccia) |
34 | FCM-0438 | 86 | 828 | 837 | shale & siltstone |
35 | FCM-0438 | 87 | 837 | 847 | siltstone & claystone |
36 | FCM-0438 | 97 | 932 | 942 | siltstone+Q vein |
37 | FCM-0438 | 98 | 942 | 951 | siltstone+Q vein |
38 | FCM-0438 | 100 | 960 | 969 | siltstone & shale |
39 | FCM-0438 | 101 | 969 | 977.5 | felsic intrusive & siltstone |
40 | FCM-0438 | 102 | 977.5 | 988 | intrusive+Q veins |
41 | FCM-0438 | 103 | 988 | 997.5 | intrusive+Q veins |
42 | FCM-0438 | 110 | 1060 | 1069 | intrusive+Q veins |
43 | FCM-0438 | 111 | 1069 | 1079 | intrusive+Q veins |
44 | FCM-0438 | 112 | 1079 | 1087.5 | intrusive+Q veins |
45 | FCM-0438 | 113 | 1087.5 | 1096 | intrusive+Q veins |
46 | FCM-0081 | 11 | 71.5 | 76.6 | breccia |
47 | FCM-0081 | 12 | 76.6 | 83 | breccia |
48 | FCM-0081 | 13 | 83 | 90 | breccia |
49 | FCM-0083 | 12 | 127 | 133 | dump |
50 | FCM-0505 | 26 | 261 | 270.5 | breccia |
| 11 July 2024 |
| Florida Canyon Gold Mine | Page 114 |
| Florida Canyon Gold Inc. | NI 43-101 Technical Report |
Figure 12-64: Visual Inspection of Selected Intervals from Hole FCM-0500
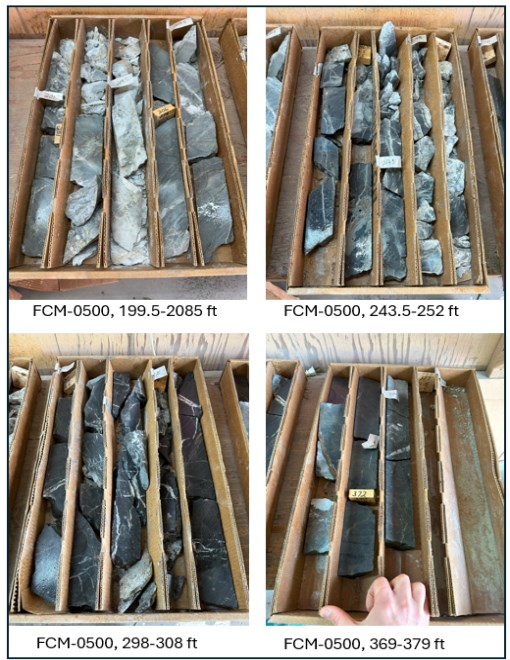
| 11 July 2024 |
| Florida Canyon Gold Mine | Page 115 |
| Florida Canyon Gold Inc. | NI 43-101 Technical Report |
Figure 12-65: Visual Inspection of Selected Intervals from Hole FCM-0452
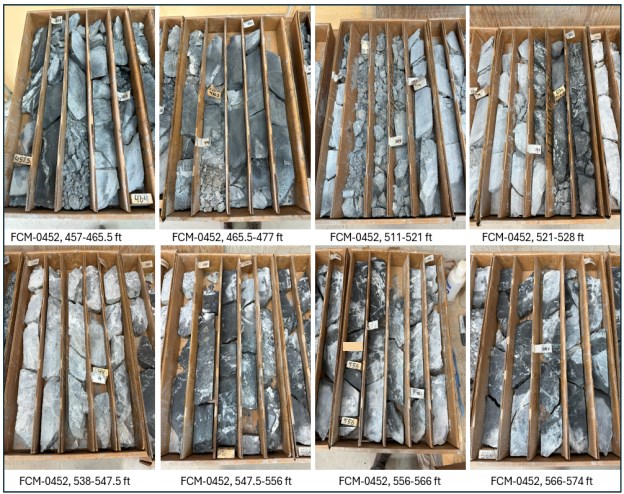
| 11 July 2024 |
| Florida Canyon Gold Mine | Page 116 |
| Florida Canyon Gold Inc. | NI 43-101 Technical Report |
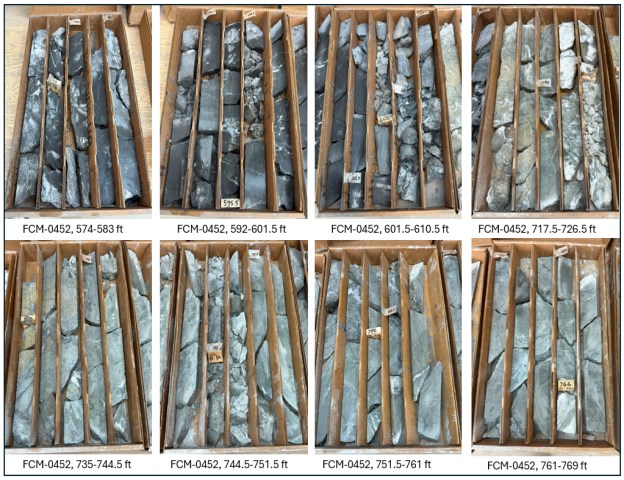
| 11 July 2024 |
| Florida Canyon Gold Mine | Page 117 |
| Florida Canyon Gold Inc. | NI 43-101 Technical Report |
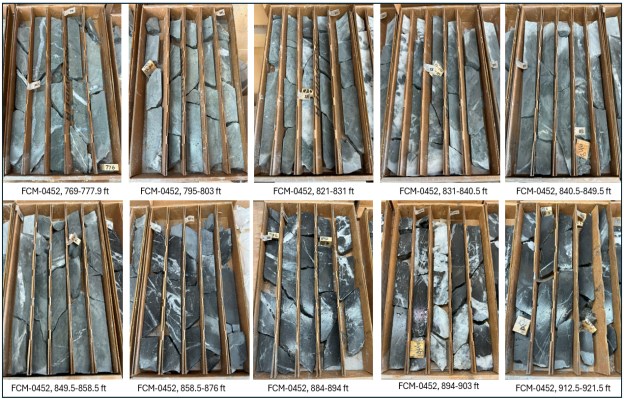
| 11 July 2024 |
| Florida Canyon Gold Mine | Page 118 |
| Florida Canyon Gold Inc. | NI 43-101 Technical Report |
Figure 12-66: Visual Inspection of Selected Intervals from Hole FCM-0438
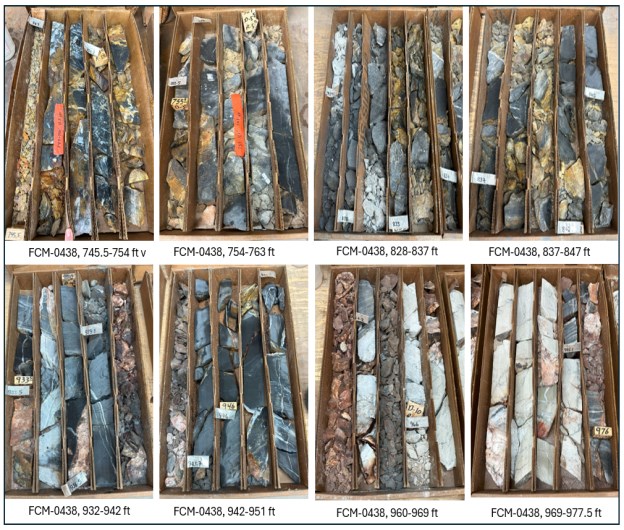
| 11 July 2024 |
| Florida Canyon Gold Mine | Page 119 |
| Florida Canyon Gold Inc. | NI 43-101 Technical Report |

| 11 July 2024 |
| Florida Canyon Gold Mine | Page 120 |
| Florida Canyon Gold Inc. | NI 43-101 Technical Report |
Figure 12-67: Visual Inspection of Selected Intervals from Holes FCM-0081, FCM-0083, and FCM-0505
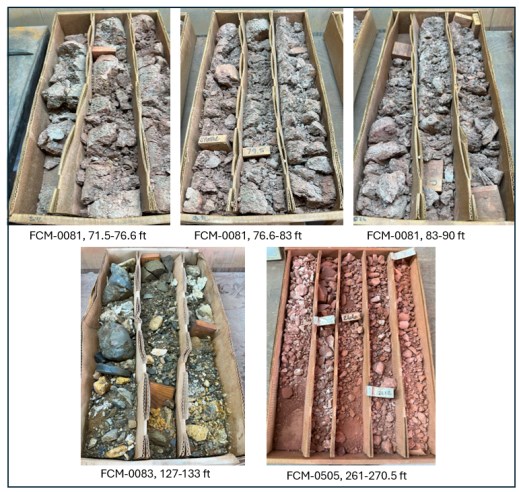
12.3.9.4 Check Assay
GREs QP Dr. Hamid Samari selected 16 core intervals together with three CRMs and one blank sample to check their assays. All sample intervals selected by Dr. Samari for check assay were selected from five DDHs in different mineralization zones drilled in 2021 and 2023 drilling programs by taking half of the remaining cores in the core boxes or pulp reject samples for some of the sample intervals. All core samples were bagged and labeled by the GREs QP Dr. Hamid Samari. A total of 20 check samples, including eight core samples (1/2 core), eight pulp samples, three CRMs, and one blank sample, were shipped by FCM's senior geologist to Hazen Research Inc. (Hazen) in Golden, Colorado, USA, for fire assay with gravitational finish for gold (Table 12-6).
Hazen received all check samples on February 05, 2024.
On February 22, 2024, GRE's QP Hamid Samari received Hazen's analytical report on the 20 selected samples by fire assay with a gravitational finish for gold (Table 12-7).
| 11 July 2024 |
| Florida Canyon Gold Mine | Page 121 |
| Florida Canyon Gold Inc. | NI 43-101 Technical Report |
Table 12-6: Check Samples Submitted to Hazen Labs
| No. | Hole No. | Type of Hole | Date of Drilling | From (ft) | To (ft) | Rock Type | FCM Sampe ID | Type of check sample | Request Analysis | ||
| Lith 1 | Litf2 | 1/2 core sample | Pulp sample | Fire Assay, Gravimetric Finish for Au | |||||||
| 1 | N/A | N/A | N/A | N/A | N/A | Blank | SlBlank 21.03 | þ | þ | ||
| 2 | N/A | N/A | N/A | N/A | N/A | Certified Reference Materials (CRMs) | MEG-Au.17.04 | þ | þ | ||
| 3 | N/A | N/A | N/A | N/A | N/A | MEG-Au.21.05 | þ | þ | |||
| 4 | N/A | N/A | N/A | N/A | N/A | MEG-Au.21.01 | þ | þ | |||
| 5 | FCM-0081 | Core | 12/13/2021 | 74.50 | 79.50 | breccia | N/A | FCM-0081 74.5-79.5 | þ | þ | |
| 6 | FCM-0500 | Core | 6/9/2023 | 201.00 | 204.50 | siltstone 90% | gouge 10% | FCM-0500 201.00-204.50 | þ | þ | |
| 7 | FCM-0500 | Core | 6/9/2023 | 247.30 | 249.90 | siltstone 70% | breccia 30% | FCM-0500 247.30-249.90 | þ | þ | |
| 8 | FCM-0500 | Core | 6/9/2023 | 372.00 | 374.70 | siltstone 95% | gouge 5% | FCM-0500 372.00-374.70 | þ | þ | |
| 9 | FCM-0452 | Core | 12/15/2023 | 523.90 | 528.00 | siltstone 50% | gouge 50% | FCM-0452 523.90-528.00 | þ | þ | |
| 10 | FCM-0452 | Core | 12/15/2023 | 771.50 | 776.00 | dacite 100% | N/A | FCM-0452 771.50-776.00 | þ | þ | |
| 11 | FCM-0452 | Core | 12/15/2023 | 897.60 | 901.20 | siltstone 100% | N/A | FCM-0452 897.60-901.20 | þ | þ | |
| 12 | FCM-0505 | Core | 7/11/2023 | 267.20 | 270.00 | breccia 90% | gouge 10% | FCM-0505 267.20-270.00 | þ | þ | |
| 13 | FCM-0438 | Core | 10/20/2023 | 747.00 | 750.00 | breccia 60% | gouge 25% | FCM-0438 747.00-750.00 | þ | þ | |
| 14 | FCM-0438 | Core | 10/20/2023 | 842.00 | 845.00 | siltstone 90% | shale 10% | FCM-0438 842.00-845.00 | þ | þ | |
| 15 | FCM-0438 | Core | 10/20/2023 | 975.10 | 978.10 | siltstone 100% | N/A | FCM-0438 975.10-978.10 | þ | þ | |
| 16 | FCM-0438 | Core | 10/20/2023 | 1074.50 | 1079.00 | intrusive 100% | N/A | FCM-0438 1074.50-1079.00 | þ | þ | |
| 17 | FCM-0452 | Core | 12/15/2023 | 523.90 | 528.00 | siltstone 50% | gouge 50% | FCM-0452 523.90-528.00 | þ | þ | |
| 18 | FCM-0452 | Core | 12/15/2023 | 599.60 | 603.70 | siltstone 100% | N/A | FCM-0452 599.60-603.70 | þ | þ | |
| 19 | FCM-0452 | Core | 12/15/2023 | 771.50 | 776.00 | dacite 100% | N/A | FCM-0452 771.50-776.00 | þ | þ | |
| 20 | FCM-0452 | Core | 12/15/2023 | 803.00 | 807.70 | dacite 100% | N/A | FCM-0452 803.00-807.70 | þ | þ | |
Table 12-7: Summary Table of Hazen Results with Original Assays
No. | Hole No. | Type of | Date of | From (ft) | To (ft) | Rock Type | FCM Sample ID | Original | Hazen | Hazen | |
Lith 1 | Litf2 | FAICP AU | Fire Assay Au | Fire Assay Au | |||||||
1 | N/A | N/A | N/A | N/A | N/A | Blank | SlBlank 21.03 | 0.003 | <0.2 |
| |
2 | N/A | N/A | N/A | N/A | N/A | Certified Reference Materials (CRMs) | MEG-Au.17.04 | 0.022 | <0.2 |
| |
3 | N/A | N/A | N/A | N/A | N/A | MEG-Au.21.05 | 1.723 | 1.78 |
| ||
| 11 July 2024 |
| Florida Canyon Gold Mine | Page 122 |
| Florida Canyon Gold Inc. | NI 43-101 Technical Report |
No. | Hole No. | Type of | Date of | From (ft) | To (ft) | Rock Type | FCM Sample ID | Original | Hazen | Hazen | |
Lith 1 | Litf2 | FAICP AU | Fire Assay Au | Fire Assay Au | |||||||
4 | N/A | N/A | N/A | N/A | N/A |
| MEG-Au.21.01 | 0.407 | 0.48 |
| |
5 | FCM-0081 | Core | 12/13/2021 | 74.50 | 79.50 | breccia | N/A | FCM-0081 74.5-79.5 | 0.002 | <0.2 |
|
6 | FCM-0500 | Core | 6/9/2023 | 201.00 | 204.50 | siltstone 90% | gouge 10% | FCM-0500 201.00-204.50 | 3.33 | 1.75 | 1.27 |
7 | FCM-0500 | Core | 6/9/2023 | 247.30 | 249.90 | siltstone 70% | breccia 30% | FCM-0500 247.30-249.90 | 1.27 | 1.17 |
|
8 | FCM-0500 | Core | 6/9/2023 | 372.00 | 374.70 | siltstone 95% | gouge 5% | FCM-0500 372.00-374.70 | 0.756 | 0.206 |
|
9 | FCM-0452 | Core | 12/15/2023 | 523.90 | 528.00 | siltstone 50% | gouge 50% | FCM-0452 523.90-528.00 | 14.8 | 1.3 | 1.23 |
10 | FCM-0452 | Core | 12/15/2023 | 771.50 | 776.00 | dacite 100% | N/A | FCM-0452 771.50-776.00 | 2.7 | 0.411 |
|
11 | FCM-0452 | Core | 12/15/2023 | 897.60 | 901.20 | siltstone 100% | N/A | FCM-0452 897.60-901.20 | 2.3 | 0.617 |
|
12 | FCM-0505 | Core | 7/11/2023 | 267.20 | 270.00 | breccia 90% | gouge 10% | FCM-0505 267.20-270.00 | 2.23 | 2.95 |
|
13 | FCM-0438 | Core | 10/20/2023 | 747.00 | 750.00 | breccia 60% | gouge 25% | FCM-0438 747.00-750.00 | 11.7 | 11.3 |
|
14 | FCM-0438 | Core | 10/20/2023 | 842.00 | 845.00 | siltstone 90% | shale 10% | FCM-0438 842.00-845.00 | 86.7 | 74.5 |
|
15 | FCM-0438 | Core | 10/20/2023 | 975.10 | 978.10 | siltstone 100% | N/A | FCM-0438 975.10-978.10 | 3.04 | 2.91 |
|
16 | FCM-0438 | Core | 10/20/2023 | 1074.50 | 1079.00 | intrusive 100% | N/A | FCM-0438 1074.50-1079.00 | 10.1 | 7.34 |
|
17 | FCM-0452 | Core | 12/15/2023 | 523.90 | 528.00 | siltstone 50% | gouge 50% | FCM-0452 523.90-528.00 | 14.8 | 7.82 | 6.65 |
18 | FCM-0452 | Core | 12/15/2023 | 599.60 | 603.70 | siltstone 100% | N/A | FCM-0452 599.60-603.70 | 0.547 | 0.617 |
|
19 | FCM-0452 | Core | 12/15/2023 | 771.50 | 776.00 | dacite 100% | N/A | FCM-0452 771.50-776.00 | 2.7 | 2.26 |
|
20 | FCM-0452 | Core | 12/15/2023 | 803.00 | 807.70 | dacite 100% | N/A | FCM-0452 803.00-807.70 | 0.755 | 0.823 |
|
| 11 July 2024 |
| Florida Canyon Gold Mine | Page 123 |
| Florida Canyon Gold Inc. | NI 43-101 Technical Report |
The assay results from Hazen on CRMs are shown in Figure 12-68. Hazen's analytical results generally correlate well with the CRM values, with no outliers. A 45-degree line represents a good correlation between the standard assay certified value and actual assay results.
Table 12-7 also shows a good correlation between the blank assay from the FCM database and the result from Hazen.
Figure 12-68: Hazen Assay Results on CRMs (Au)
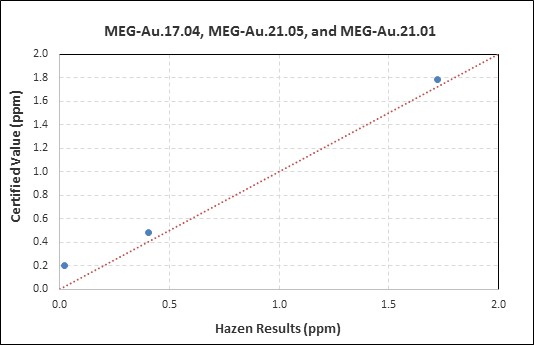
| Source: GRE (2024) |
A comparison of the original versus check assay values for the 16 core samples shows an acceptable correlation between the results, with an R2 of 0.7688, for Au (Figure 12-69).
| 11 July 2024 |
| Florida Canyon Gold Mine | Page 124 |
| Florida Canyon Gold Inc. | NI 43-101 Technical Report |
Figure 12-69: Hazen Core Check Assay Results (Au)
|
| Source: GRE (2024) |
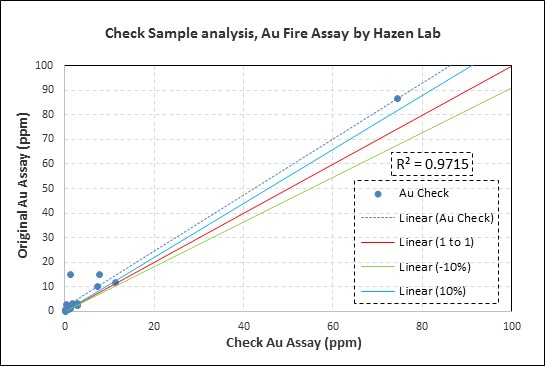
As seen in Figure 12-69 the Hazen results on three samples, FCM-0452 523.90-528.00, FCM-0438 842.00-845.00, and FCM-0452 523.90-528.00, do not correlate well with their original assays. These three samples are from high-grade zones, and surrounding grades are variable high grades. Thus, the difference in grade is due to the high nugget effect and variability in these high-grade zones.
12.4 Data Verification QP Opinion on Adequacy
Reviewing and analyzing previous Technical Reports detailing data verification and FCM's QA/QC procedure from the 2017 to 2023 drilling campaigns indicates that this data has no material issues. GRE's QP Dr. Hamid Samari is satisfied that the assay data in the project database are reasonably accurate and suitable for use in estimating Mineral Resources.
12.5 Metallurgy QP Opinion on Adequacy
The FCM leach pads have been in operation for more than 35 years and during this time several hundred columns, countless bottle roll tests and continuous pad/solution and carbon sampling campaigns have been conducted to determine expected gold recovery. GRE's QP Dr. Todd Harvey reviewed all the metallurgical data and assessed it to be current and appropriate for use.
12.6 Resource Estimation QP Opinion on Adequacy
The database used for the 2024 Mineral Resource estimation was reviewed by GRE's QP, Ms. Terre Lane, MMSA QP. The data verification of the drilling campaigns shows that data did not identify any material issues and GRE's QP, Ms. Terre Lane, MMSA QP, is satisfied that the assay data are of suitable quality to be used as the basis for the resource estimate.
| 11 July 2024 |
| Florida Canyon Gold Mine | Page 125 |
| Florida Canyon Gold Inc. | NI 43-101 Technical Report |
12.7 Mine Planning QP Opinion on Adequacy
The FCM mine has been in operation for over 35 years. Mining and processing methods, costs and infrastructure needs were based on the current operations. All costs used in the analysis were verified and reviewed by GREs QP Ms. Terre Lane, MMSA QP, and were assessed to be current and appropriate for use.
| 11 July 2024 |
| Florida Canyon Gold Mine | Page 126 |
| Florida Canyon Gold Inc. | NI 43-101 Technical Report |
13.0 MINERALOGICAL PROCESSING AND METALLURGICAL TESTING
13.1 Metallurgical Test Work
Routine metallurgical test work for ore placed on the South Heap Leach Pad (SHLP) is conducted on samples that are representative of the various types and styles of mineralization and the mineral deposit as a whole. These samples were sourced from either the Main, Central, Jasperoid and/or Radio Tower open pits. Test work consists of small (220 lb) and large (1,545 lb) test leach columns, bottle roll testing on daily crusher samples, and cyanide soluble analysis of blasthole samples and test column material. Carbon suite testing for carbon hardness, activity and attrition is conducted on new carbon supply options as needed. Carbon activity testing is done on every strip, acid wash and reactivated carbon batch, which informs the performance quality of both the carbon-in-column (CIC) and elution circuits. All metallurgical test work is supported on-site by an analytical lab equipped with atomic adsorption spectrometers (AA's), fire assay furnaces, carbon/sulfur analyzer (available Q3-2024) and sample preparation equipment. The test work and analytical equipment are all typical of industry.
The small test leach columns are conducted on monthly composites of daily crusher samples, and on geological samples of interest. The geological samples are identified by both the metallurgical and geologic teams to represent novel and upcoming or otherwise poorly understood mine areas that may deviate from the expected recovery curves. Installed in 2022, large columns allow for test work on samples with larger particle sizes to help determine the impact to recovery from larger rock size. A pair of large columns, typically containing -5" material, are run in conjunction with a pair of smaller columns, typically containing -1.5" material, as well as bottle roll tests to provide a direct comparison of the size sensitivity to recovery. Figure 13-1, below, shows that column testing of crushed material recovers consistently between 50% and 70%, while the ROM material recovers between 30% and 50%. The three completed tests show ROM recovery is also sensitive to ore source and geological variation such as fault and silicification zones.
Figure 13-1: Column Testing on Monthly Composites of Crushed Material and Column Testing of ROM Material Collected on a Quarterly Basis
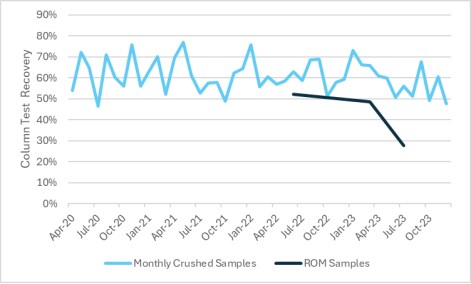 |
| Source: FCM (2024)) |
| 11 July 2024 |
| Florida Canyon Gold Mine | Page 127 |
| Florida Canyon Gold Inc. | NI 43-101 Technical Report |
There are only minor quantities of organic carbon and sulfidic sulfur in the oxide portions of the current pits being mined. To the extent known, there are no significant effects on potential economic gold extraction from these deleterious elements.
There is sulfide mineralization below the current oxide deposits that are actively mined. A third-party metallurgical testing facility is performing test work on exploration core samples. Results will be used to help determine the future benefit from processing sulfidic ores at FCM. This "proof of concept" testing will provide sulfide processing flowsheet options and associated costs of the required equipment. A LECO CS844 is expected to be installed and online in Q3-2024, which will allow for exploration and blasthole samples to be analyzed for carbon and sulfur content on site. As the mine pits approach sulfide mineralized zones, the utilization of LECO tests will determine if ore is suitable for oxide heap leaching.
13.2 Process Optimization Test Work
FCM operates at a standard dosage of 2.3 lb lime per ore ton to maintain a 10.2 pH in the effluent returning to the pregnant pond. Lime is applied to both crushed and ROM ore, which allows for consistent pH control in the leaching solution. Concentrated liquid sodium cyanide (30%) is added at the barren pump inlets to provide a constant barren solution application dosage of 0.5 lbs of sodium cyanide per ton of barren solution at the top of the pad. Leach solution is applied at 0.003 to 0.004 gallons per minute per square foot (gpm/sqft) which provides for an average percolation rate of 4.4 feet/day. New areas under leach receive a reduced application of 0.002 gpm/sqft for seven days to avoid ponding or other percolation issues before receiving the full application rate. ROM ore with higher clay content or fines-heavy ore is often routed to the crusher as the dust suppressant water at the crusher is dosed with an agglomerating polymer at 0.02 lb per ore ton, which reduces the risk of ponding and maintains good percolation rates. Reagent and application rate optimization testing is carried out when mining new pits, such as the North Pit, and previously unknown geological variations that are discovered through exploration drilling. Optimization work is done on the historic pits when blastholes show either high sulfide content as the pits grow deeper, or alterations high in clay, silica or fault zones.
FCM operates two separate carbon column trains, each containing five columns. E1 columns hold 6 tons of carbon and process 3,100 gpm of pregnant solution while the E2 columns hold 3 tons of carbon and process 1,800 gpm of solution at full capacity. Barren solution discharge from each train reports to a safety screen for carbon fines removal before discharging to the barren pond. Optimization efforts around CIC have focused on improving CIC gold recovery, which was 85.1% in 2023. Increasing the reactivation kiln availability and the addition of a barren carbon holding tank at the column area are on-going improvements that will improve CIC recovery. In Q3-2024, a third train will be constructed and commissioned along with additional barren solution pumping capacity. The new E3 columns will hold 12-15 tons of carbon and process 5,200 gpm of pregnant solution. Once the new columns are installed, the total CIC processing capacity will be 10,400 gpm. All column head and barren solution sampling systems are in process of being upgraded from wire samplers to a metered pump system.
The strip circuit, a pressurized Zadra system, consists of a three-ton carbon elution vessel, a vertical carbon reactivation kiln, and a three-ton carbon acid washing vessel. Strips run eight to fourteen hours depending on gold loading values. Strips are monitored by plant operators via atomic adsorption assay of the pregnant and barren strip solution. When the pregnant solution entering the electrowinning circuit drops below 0.2 oz/ton or the strip has reached the maximum allotted time, whichever is sooner, the strip is finished and is then offloaded for reactivation or sent directly to the acid wash. Roughly a quarter of the strip batches are moved to the kiln due to the long residence time, but all strip batches are acid washed before being returned to the CIC circuit. The acid wash utilizes two percent hydrochloric acid to remove the calcium and other hard water deposits on the carbon that reduces its activity. Acid washing is complete when the returning solution reaches a pH of two or less. A fresh-water rinse is performed to raise the pH to neutral before it is returned to the alkali environment in the CIC trains. The elution vessel operates at a maximum of 260 ⁰F and 60 gpm. The electrowinning circuit operates at 140 ⁰F and 40 gpm. The electrowinning cells use 550-560 amperes at 3 volts during active stripping. Good conductivity in the elution circuit is achieved by maintaining a concentration of 3 - 4% sodium hydroxide. Options to increase the electrowinning circuit flow rate are being evaluated, along with determining the optimum temperature and pressure to elute the gold and silver while maintaining the mechanical integrity of the strip circuit.
| 11 July 2024 |
| Florida Canyon Gold Mine | Page 128 |
| Florida Canyon Gold Inc. | NI 43-101 Technical Report |
13.3 Gold Recovery Modelling
Two sets of crushed-specific and ROM-specific recovery equations are now in use to model gold production from the SHLP. One to describe ore from the Central, Jasperiod, Main and North pits, and the other to describe the ore from the Radio Tower pit. The recovery models, developed by site metallurgists in conjunction with 3rd party consultants, stem from lab column test work and actual pad production data. These equations are shown below in Table 1 and visualized in Figure 2. They show that total recovery ranges from 50% for Radio Towers ROM ore to 64% for most crushed ores over a three-year period.
Table 13-1: Gold Recovery Equations by Source and Particle Size
Material Type | Equation | Notes |
Central, Jasperoid, Main, and North Pits | ||
Crushed | [0.080 * LN(days)] + 0.0803 | 64% after 3 years |
ROM | [0.064 * LN(days)] + 0.0835 | 53% after 3 years |
Radio Towers Pit | ||
Crushed | [0.073 * LN(days)] + 0.0703 | 58% after 3 years |
ROM | [0.060 * LN(days)] + 0.0824 | 50% after 3 years |
| 11 July 2024 |
| Florida Canyon Gold Mine | Page 129 |
| Florida Canyon Gold Inc. | NI 43-101 Technical Report |
Figure 13-2: Gold Recovery by Ore Source and Particle Size Over a Three-Year Period
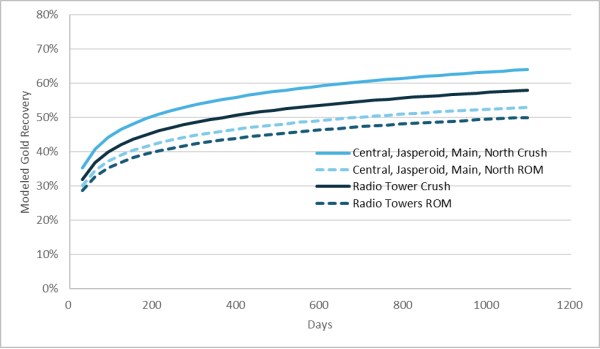 |
| Source: FCM (2024)) |
Actual SHLP production data and the variance from modeled gold production is seen in Table 13-2. Since pad inception, the overall variance from modeled production is 1.4%, or 4,708 ounces. In 2021 and 2022, significant amounts of historically placed backfill material were placed on the pad.
ROM ore tonnage to the pad increased significantly in late 2022 resulting in overall tonnage to pad exceeding the capability to supply the target solution to ore ratio (S/O) of 1.1 in the primary leach cycle. Additionally, as the pad has increased in height and area to stack new ore has decreased, lift heights have been increased from 30' to 50' to increase the unit volumes under primary leach which increases the S/O ratio. This also allowed for rinsing out gold previously dissolved but retained in the pad due to the shorter primary leach cycle which resulted in a small positive variance in production in 2023 compared to the prediction from the model. This pattern of short-cycling leach area is likely to continue until Phase III of the pad is completed and ready for new ore to be stacked. This will provide the opportunity to re-leach and rinse areas on the Phase I and II pads to fully complete the leaching cycle and recover the estimated 39,639 (Dec 2023) ounces of inventoried gold in the pad per the 03-year leach cycle recoveries. Since start-up in Jan 2017, 331,011 ounces of gold have been recovered from the SHLP through the end of 2023. Cumulative gold recovery during this time is 55.1%, see Section 17 for more details on production statistics.
Table 13-2: Annual summary of Ore and Ounces Placed, Modeled and Produced Ounces
| Item | Year | |||||||
| 2017 | 2018 | 2019 | 2020 | 2021 | 2022 | 2023 | Total | |
| Crushed Tons Placed | 6,410,555 | 8,308,801 | 7,360,531 | 8,316,953 | 7,480,205 | 7,517,761 | 7,586,825 | 52,991,631 |
| 11 July 2024 |
| Florida Canyon Gold Mine | Page 130 |
| Florida Canyon Gold Inc. | NI 43-101 Technical Report |
| Item | Year | |||||||
| 2017 | 2018 | 2019 | 2020 | 2021 | 2022 | 2023 | Total | |
| ROM Tons Placed | - | - | - | 651,128 | 1,734,925 | 2,995,642 | 7,429,151 | 12,810,846 |
| Total Tons Placed | 6,410,555 | 8,318,801 | 7,360,531 | 8,968,081 | 9,215,130 | 10,513,403 | 15,015,976 | 65,802,477 |
| Crush Au Contained Placed | 66,224 | 76,042 | 60,885 | 70,290 | 71,637 | 73,083 | 81,776 | 499,937 |
| ROM Au Contained Placed | - | - | - | 7,054 | 17,947 | 23,501 | 52,669 | 101,171 |
| Total Au Contained Placed | 66,224 | 76,042 | 60,885 | 77,344 | 89,584 | 96,584 | 134,444 | 601,107 |
| Total Ounces Produced | 23,280 | 46,081 | 41,190 | 46,655 | 53,889 | 49,439 | 70,477 | 331,011 |
| Cumulative Recovery | 35.15% | 48.75% | 54.42% | 56.05% | 57.04% | 55.83% | 55.07% | 55.07% |
| Modeled Ounces | 26,388 | 45,450 | 40,286 | 44,429 | 55,255 | 55,913 | 67,998 | 335,719 |
| Model Variance | 13.4% | -1.4% | -2.2% | -4.8% | 2.5% | 13.1% | -3.5% | 1.4% |
| 11 July 2024 |
| Florida Canyon Gold Mine | Page 131 |
| Florida Canyon Gold Inc. | NI 43-101 Technical Report |
14.0 MINERAL RESOURCE ESTIMATE
The Mineral Resource estimation is a Localized Indicator Kriging (LIK) model first developed mid-2022 and implemented for mine planning. The description of the model and methods were reported in an internal FCM document titled "Florida Canyon_Jan24_Resource Update" by William Hardtke, dated January 2024. The model methods reported here are based on that report. Where possible, GRE has checked the application of the methods and has reported the results later in Section 14.6
FCM staff and GRE have loaded the database and block model for independent review and verification. The database review by GRE has been summarized in Sections 10, 11, and 12.
The Qualified Person for the statement of Mineral Resources presented later in this section is GRE's Ms. Terre Lane, MMSA QP.
14.1 Database
14.1.1 Samples and Composites
The database used for the LIK resource estimation contained 383,382 gold fire assays. This is slightly lower than the FMC database total of 384,468 as the limits of the LIK model exclude a limited number of samples.
The assays were composited to 20ft using down-hole compositing to mimic the sample lengths of blasthole assays. This allows for a more reliable resource estimation when compared to the production model by standardizing the sample lengths when comparing variance of the data. Table 14-1 is a summary of basic statistics for original assays and composites used in the estimation.
Table 14-1: Basic Statistics of Fire Assays and 20-foot Composites Used for the LIK Estimation
| Domain | Number | Mean (oz/ton) | Variance | Standard Deviation | Coefficient of Variance |
| Assay Statistics | |||||
| Radio Tower | 63,175 | 0.0081 | 0.0015 | 0.0389 | 4.81 |
| Main | 124,204 | 0.0114 | 0.0015 | 0.0386 | 3.39 |
| Central | 159,357 | 0.0090 | 0.0021 | 0.0456 | 5.07 |
| Jasperoid | 29,927 | 0.0052 | 0.0003 | 0.0177 | 3.42 |
| Composite Statistics | |||||
| Radio Tower | 15,988 | 0.0081 | 0.0007 | 0.0267 | 3.31 |
| Main | 32,329 | 0.0113 | 0.0008 | 0.0283 | 2.50 |
| Central | 40,815 | 0.0090 | 0.0008 | 0.0278 | 3.08 |
| Jasperoid | 7,738 | 0.0052 | 0.0001 | 0.0114 | 2.21 |
14.1.2 Sample Capping
Capping of assay values was not applied to either the assays nor the 20 ft composites since all capping is done within the LIK model whereby the estimation methodology caps the histogram values and not the input data. In addition to histogram capping, the variance reduction factor (VRF) used in the LIK estimation also results in controlling the high-grade values.
| 11 July 2024 |
| Florida Canyon Gold Mine | Page 132 |
| Florida Canyon Gold Inc. | NI 43-101 Technical Report |
14.2 Model Description
The FCM model was assembled in the same block size and coordinate system as previous models reported in the 2016, 2018, and 2020 Technical Reports. The coordinate system is a local mine grid system. The model size and location in the mine grid is summarized in Table 14-2.
Table 14-2: Model Location and Block Size
| X | Y | Z |
Origin | 48,000 | 46,000 | 3700 |
Size | 30.0 | 30.0 | 20.0 |
Number of Blocks | 386 | 294 | 135 |
Maximum | 59,580 | 54,820 | 6400 |
The conversion from local grid to NAD83 is reported as defined in Table 14-3.
Table 14-3: Conversion Parameters for Florida Canyon Local Mine Grid to NAD 83 Zone 11
Variable | Value (metric) | Unit (metric) | Value (imperial) | Unit (imperial) |
Bearing: | 184.97925 | deg |
|
|
Baselength: | 9134.1702 | m | 29967.69022 | feet |
Scale Factor: | 0.999998 |
|
|
|
Scale Error: | 1.8 | mm | 0.01 | feet/mile |
Easting Origin: | 379327.2465 | m |
|
|
Northing Origin: | 4479274.247 | m |
|
|
Northing Origin: | 14695752.26 | feet |
|
|
Easting Origin: | 1244509.474 | feet |
|
|
Bearing: | 185.83097 | deg |
|
|
Baselength: | 9134.1541 | m | 29967.63732 | feet |
Base Error: | 16.12 | mm | 0.052891191 | feet |
Rotation: | 0.85172 | deg |
|
|
y adjstr | 0.99988775 |
| Northing | y adjstr |
x adjstr | -0.01486481 |
| Easting | x adjstr |
|
|
|
|
|
|
|
|
|
|
UTM-11N NAD83(2011) GROUND (meters) Reference Points |
| |||
No | Northing | Easting | Elevation |
|
206 | 4496079.1202 | 395341.0738 | 4527.3200 |
|
208 | 4486992.2269 | 394413.0973 | 4885.0720 |
|
FCM MINE-GRID Ground (meters) Reference Points |
| |||
No | Northing | Easting | Elevation |
|
206 | 17041.0900 | 15762.2840 | 4527.3200 |
|
208 | 7941.3900 | 14969.4840 | 4885.0720 |
|
14.2.1 Geologic Interpretation
Rock and alteration type codes were assigned to the block model from interpreted solids. Those codes were not used to constrain or limit grade estimation. The alteration code was used to assign density to each block.
| 11 July 2024 |
| Florida Canyon Gold Mine | Page 133 |
| Florida Canyon Gold Inc. | NI 43-101 Technical Report |
An oxide-sulfide boundary surface was interpreted from independently modeled solids built on logging data collected from drill holes. The oxide-sulfide boundary surface was assigned to the block model and used in recovery and cut-off grade parameters when calculating Mineral Resources and Mineral Reserves.
GRE used cyanide soluble assay data to check the oxide interpretation within the block model. The cyanide soluble assay divided by the fire assay (CN/FA) ratio is indicative of the cyanide leach amenability of the individual assays. High CN/FA ratios generally indicate "oxide" or cyanide leachable mineralization.
Table 14-4 summarizes the results of the GRE analysis.
Table 14-4: Assay Intervals with Cyanide Soluble Assays Remaining as of Year End 2023
| Location | Number of CN Assays | Average FA (FA oz/ton) | Average CN (CN oz/ton) | CN/FA in % (Ratio of Means) | Notes |
| Assays above the oxide/sulfide surface | 6,514 | 0.014 | 0.010 | 72.1% | 12% of samples have CN/FA ratio < 50% |
| Assays below the oxide/sulfide surface | 2,228 | 0.033 | 0.011 | 33.1% | 31.1% of samples have CN/FA ratio > 50% |
Table 14-4 indicates that the oxide zone does not contain a significant component of sulfide mineralization. Overall, 12% of the available CN soluble data in the oxide zone has CN/FA ratios less than 50%, indicating that only 12% of the intercepts might be refractory to cyanide. By comparison, 31% of the samples within the sulfide zone have CN/FA ratios over 50% indicating that there is some potential for additional heap leach ore in material currently categorized as sulfide.
In summary, the oxide-sulfide contact appears to be conservative in ore tonnage which will help assure that the Mineral Resource and Mineral Reserve can be treated with the current heap leach process.
14.2.2 Density Assignment
Rock density estimates remained the same as those assigned by SRK during 2018 and IMC in 2020. The alteration codes were used to control the in-situ material density as summarized in Table 14-5.
Table 14-5: Bulk Density Assignment
| Model Alteration Code | Description | Dry Bulk Density (ft3/ton) |
| 40 | Default | 13.88 |
| 50 | Fill/Dumps | 17.51 |
| 60 | Hematite | 13.88 |
| 70 | Siliceous | 13.88 |
| 80 | Clay | 14.20 |
| 90 | Sulfide | 12.50 |
| 100 | Alluvium | 15.50 |
FCM was careful to eliminate the back-fill and alluvium material from Mineral Resources and Mineral Reserves. The boundaries of hard rock versus in-fill were estimated by FCM as follows: a previous model assembled by SRK for the 2018 technical report estimated the top of hard rock surface. Using a combination of 15 historical surfaces to identify the minimum bedrock surface prior to any fill material being dumped over it, a comprehensive surface defining in-situ rock was created. The current model combines the SRK modeled surface with subsequent topography flights and mined pit bench surveys from 1979 to present to determine the lowest elevation as in-situ surface.
| 11 July 2024 |
| Florida Canyon Gold Mine | Page 134 |
| Florida Canyon Gold Inc. | NI 43-101 Technical Report |
A second surface of the highest filled elevation is also created from the same topographic survey flights. A solid is created where the in-situ surface and the current surveyed topography diverge and all material above the in-situ and below the current topography surfaces is modeled as fill. In the block model any blocks with a centroid located in the fill solid is flagged as fill. Finaly, the block model is checked against the historical blast hole database and where material contains historical blasthole data it is confirmed as fill.
14.2.3 Domains
FCM has four zones with different mineralization orientations caused by local structural trends. Those zones have been defined as search orientation domains by FCM during their modeling process. The domains align with the mining areas discussed previously (note that the North deposit is part of the Central Domain). Boundary analysis does not indicate that the domains should be considered as hard boundaries during estimation. They were used to control the direction of the search orientation. The four domains are illustrated in Figure 14-1.
Figure 14-1: Domain Codes and Locations
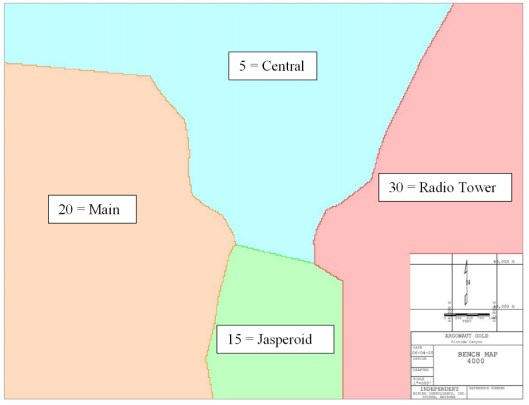 |
| Source: FCM (2024)) |
| 11 July 2024 |
| Florida Canyon Gold Mine | Page 135 |
| Florida Canyon Gold Inc. | NI 43-101 Technical Report |
14.3 Grade Estimation
Block grade estimation was accomplished using LIK, which combines the histograms from a panel-sized multiple indicator kriging (MIK) with the locations of block values from an ordinary kriging model (OK), which is referred to as the localizer model. Block estimation was limited by distance using the average distance to the nearest three drillholes. No blocks were estimated that had an average distance greater than 300 ft.
LIK models use a VRF to control the final block distribution and that factor was established by comparing a series of LIK models with different VFRs to the blasthole block model. This was done in a previous update in the Main domain where a VRF of 0.2 was determined and used for all the domains. However, because of significant production in the Central domain a VRF of 0.1 was determined from the blasthole model and used in that domain. The selection of this lower factor allows the LIK model to match the tons and grades in the blasthole model quite closely.
The OK localizer model used the same block definition as was used in previous models (see Table 14-2), and the MIK model used 120-foot by 120-foot panels that coincided spatially with the localizer blocks. This resulted in sixteen OK blocks inside each panel.
The indicator cutoffs were selected by domain so that no indicator bin would contain more than 8% of the contained metal or 8% of the composite data, which resulted in 16 to 18 indicator cutoffs.
Table 14-6: Grade Estimation Parameters for OK Localizer Model
Domain | Main | Central | Jasperoid | Tower |
Sill 1 | ||||
Nugget | 0.10 | 0.54 | 0.57 | 0.35 |
C1 | 0.435 | 0.367 | 0.231 | 0.315 |
LH Rotation Z axis | -22 | -52 | 30 | 20 |
RH Rotation Y' axis | 46 | 14 | 56 | 57 |
LH Rotation Z' axis | 68 | -7 | -107 | -8 |
Range X axis (ft.) | 14.9 | 20.0 | 72.9 | 29.5 |
Range Y axis (ft.) | 22.5 | 33.0 | 44.8 | 31.4 |
Range Z axis (ft.) | 23.2 | 46.9 | 7.1 | 13.9 |
Sill 2 | ||||
C2 | 0.465 | 0.093 | 0.199 | 0.335 |
LH Rotation Z axis | 10 | 44 | 63 | -9 |
RH Rotation Y' axis | -36 | 58 | -59 | -29 |
LH Rotation Z' axis | -10 | -11 | 51 | -8 |
Range X axis (m) | 209.8 | 142.8 | 120.1 | 278.2 |
Range Y axis (m) | 511.3 | 1145.9 | 262.1 | 211.0 |
Range Z axis (m) | 98.4 | 370.0 | 46.7 | 74.4 |
Search | ||||
LH Rotation Z axis | 10 | 44 | 63 | -9 |
RH Rotation Y' axis | -36 | 58 | -59 | -29 |
LH Rotation Z' axis | -10 | -11 | 51 | -8 |
Range X axis (m) | 500 | 250 | 250 | 600 |
Range Y axis (m) | 900 | 1500 | 600 | 500 |
| 11 July 2024 |
| Florida Canyon Gold Mine | Page 136 |
| Florida Canyon Gold Inc. | NI 43-101 Technical Report |
Domain | Main | Central | Jasperoid | Tower |
Range Z axis (m) | 300 | 700 | 800 | 200 |
14.4 Mineral Resource Classification
The classification scheme for FCM is defined below and mimics that of previous models, but the classification model was updated due to additional drilling.
- Indicated: At least two drill holes within 135 feet of the center of the block being estimated.
- Inferred: At least two drill holes within 300 feet or less of the center of the block being estimated.
Figure 14-2 shows the cross section of the mineral resource classification for North section 52,150.
14.5 Model Validation
The LIK model was validated by visual inspection and by comparing it to the production data (blasthole model) in the Central domain where most of the recent mining had been centered.
- Visual check on plan and section to confirm classification methods, grade trends, oxide/sulfide contact, and hard rock versus fill contact.
- Sensitivity analysis of LIK model compared to production model
- Reconciliation of mine production versus model prediction within the volume mined.
Figure 14-3 to Figure 14-5 shows the cross sections for the estimated gold grades in block model.
| 11 July 2024 |
| Florida Canyon Gold Mine | Page 137 |
| Florida Canyon Gold Inc. | NI 43-101 Technical Report |
Figure 14-2: Cross Section Looking North Showing Classification of Block Model
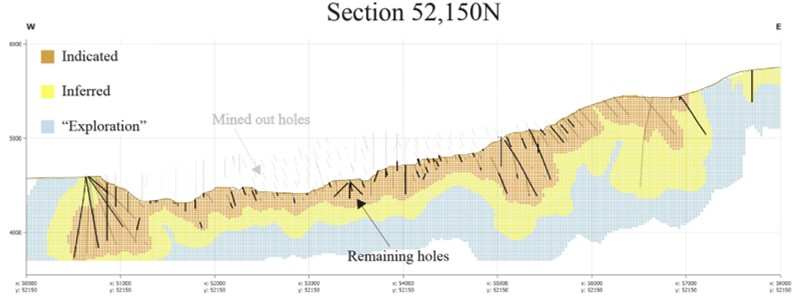
| 11 July 2024 |
| Florida Canyon Gold Mine | Page 138 |
| Florida Canyon Gold Inc. | NI 43-101 Technical Report |
Figure 14-3: Cross Section Looking North Showing Gold Grade Estimation in Block Model
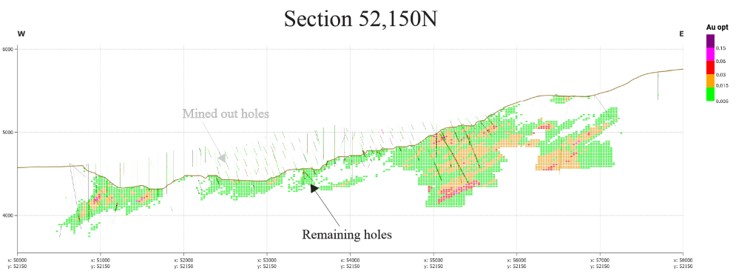
| 11 July 2024 |
| Florida Canyon Gold Mine | Page 139 |
| Florida Canyon Gold Inc. | NI 43-101 Technical Report |
Figure 14-4: Cross Section Looking North Showing Gold Grade Estimation in Block Model
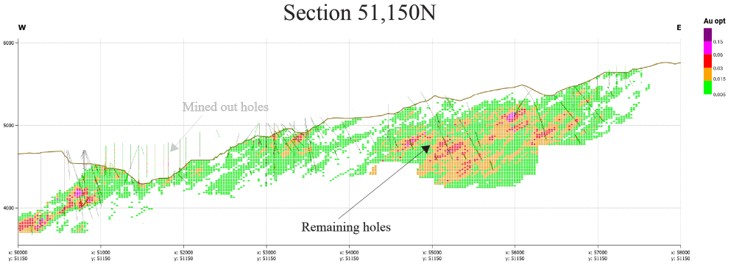
| 11 July 2024 |
| Florida Canyon Gold Mine | Page 140 |
| Florida Canyon Gold Inc. | NI 43-101 Technical Report |
Figure 14-5: Cross Section Looking North Showing Gold Grade Estimation in Block Model
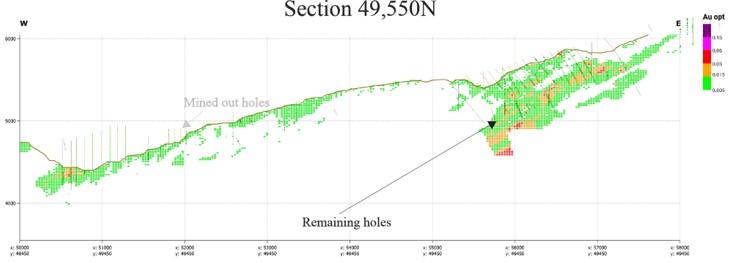
| 11 July 2024 |
| Florida Canyon Gold Mine | Page 141 |
| Florida Canyon Gold Inc. | NI 43-101 Technical Report |
14.5.1 Sensitivity Analysis Using Grade Smoothing in the LIK Model
Grade smoothing in LIK models is controlled by the VRF. Since VRF is difficult to predict, a more practical method for determining the VRF is to create a series of LIK models with different VRFs. Comparisons between LIK models with different VRFs to the production model is a tool to establish the most reliable VRF for the LIK model. Table 14-7 shows the comparison of tons and grade (smoothing) for three selected LIK models to the blasthole block model in the Central domain test area. The suffix number in the name of the LIK model represents the VRF, for example, the LIK10 model has a VRF of 0.10.
A complicating factor when comparing the LIK models to the production model is the fact that the production model is built using cyanide-leach atomic absorption (CNAA) assays. This assay method requires a conversion ratio to establish total contained gold (vs recoverable gold which the CNAA assay provides). In the Central Pit where a majority of the mining occurred in 2023 the conversion factor used when comparing to the LIK models was 1.20 FA:CNAA. Table 14-7 shows the various LIK models with different VRFs compared to the production model with a 1.20 conversion factor and an unconverted factoring.
Table 14-7: Comparison of LIK Models to the Blasthole Block Model Showing Various FA/CN Conversion Ratios
| Model | No Conversion | 1.2 Conversion | ||
| Tonnage (tons x 1000) | Gold Grade (oz/ton) | Tonnage (tons x 1000) | Gold Grade (oz/ton) | |
| Blasthole | 9,224 | 0.0084 | ||
| Lik20 | 9,405 | 0.0088 | 7,370 | 0.0082 |
| Lik15 | 9,769 | 0.0087 | 7,755 | 0.0080 |
| Lik10 | 10,137 | 0.0084 | 7,977 | 0.0077 |
(In the Central Domain Using a 0.005 oz/ton cut-off grade)
With adjustments to the VRF, only the grade and tons change while the contained gold in the estimation remains constant. If tons increase, then mean grade must decrease (or vice versa) to maintain the constant contained ounces. Selecting the proper VRF is predicated on establishing the correct amount of contained gold in the LIK estimation, which relies on selection of the right conversion factor to use with the production model. As is shown in the table the LIK10 estimation comes within <13% on tons and 8% on grade, thus guiding the selection of the 0.1 VRF for the LIK model. Considering the two different estimations (LIK and production) were built from two entirely different datasets that used different assaying and drilling techniques, the very small difference between the models indicates very good correlation.
14.5.2 Reconciliation
The most important function of a block model is its ability to provide a sound basis for mine planning by predicting the tonnage and grade of material above cut-off that is in the ground. To test the functionality of the LIK estimation, a check of the model was made against data from 2023 and the three months of operations since the model was built (Jan - Mar 2024). It is important to note that the model-to-model reconciliation was completed for in-situ material only and does not include total overall production for tons and ounces. This excludes material mined from the pits that ore control indicates as above cut-off but is in-pit backfill material deposited during mining by earlier operators.
| 11 July 2024 |
| Florida Canyon Gold Mine | Page 142 |
| Florida Canyon Gold Inc. | NI 43-101 Technical Report |
The reported head grade of material delivered to the HLP is based on ROM pit grades and crushed samples collected hourly from the conveyor discharge of the second crush stage. The hourly crush material is assayed by CN soluble method and averaged for the 24-hour period to report the head grade delivered to the pad. Monthly composites are made of that material and a monthly column leach test is completed to sample the relative recovery of that month's material on pad. Those samples are assayed by both FA and CN methods when the column is loaded. The current ore control cutoff is 0.0035 oz/ton CN soluble. The CN soluble assay was multiplied times 1.20 to obtain an estimated FA cutoff of 0.0042 oz/ton for application to the block model.
Reconciliation of the 2024 LIK10 model to 2023 mining shows an overall +21% increase in total contained ounces. Reconciliation was completed on in-situ material only, as all fill material is assumed to have 0.0 oz/ton grade in the LIK model and fill is only mined as ore after production drilling defines it as being above cut-off grade. The cut-off grade used in the production model for in-situ material in 2023 ranged from 0.0040 to 0.0055 oz/ton CN soluble assay (AuAA). To get total contained gold (AuFA) the 1.20 FA:CNAA ratio was applied to the production model. Table 14-8 details the month-by-month differences between the LIK to production models, and the general trend is the LIK model underpredicts tons by 16% and slightly underpredicts grade by 4%.
Reconciliation for the first three months of 2024 from January 1 through March 31 has also been completed. The month-by-month comparison between the production and LIK models indicates a +2% variation in tons and a +6% variation in grade for any overall +7% difference in total contained ounces (Table 14-9). One significant change in 2024 is the reduction of the ore control cut-off down to a variable 0.0035 to 0.0040 oz/ton CN soluble assay. Grades from the production model are still converted using the FA:CNAA ratio of 1.20 to estimate total contained gold in the production model to compare to the LIK model.
| 11 July 2024 |
| Florida Canyon Gold Mine | Page 143 |
| Florida Canyon Gold Inc. | NI 43-101 Technical Report |
Table 14-8: Comparison of LIK Model to the Ore Control Production Model for Ore Polygons Mined in 2023
Month | Material | 2024 01 LIK Model | 2023 Production Ore Polygons | Variance Production vs LIK | ||||||||||||
Ore | AuFA | AuFA | AuAA | AuAA | Ore | AuFA | AuFA | AuAA | AuAA | Ore Tons | AuFA | AuFA | AuAA | AuAA | ||
Jan-23 | In-Situ | 953 | 0.009 | 8,110 | 0.007 | 6,758 | 831 | 0.010 | 7,926 | 0.008 | 6,605 | 87% | 112% | 98% | 112% | 98% |
Feb-23 | In-Situ | 855 | 0.009 | 7,848 | 0.008 | 6,540 | 742 | 0.009 | 6,936 | 0.008 | 5,780 | 87% | 102% | 88% | 102% | 88% |
Mar-23 | In-Situ | 677 | 0.010 | 6,756 | 0.008 | 5,630 | 734 | 0.010 | 7,567 | 0.009 | 6,306 | 108% | 103% | 112% | 103% | 112% |
Apr-23 | In-Situ | 773 | 0.010 | 7,423 | 0.008 | 6,185 | 943 | 0.010 | 9,826 | 0.009 | 8,188 | 122% | 109% | 132% | 109% | 132% |
May-23 | In-Situ | 736 | 0.009 | 6,617 | 0.007 | 5,514 | 935 | 0.010 | 9,234 | 0.008 | 7,695 | 127% | 110% | 140% | 110% | 140% |
Jun-23 | In-Situ | 822 | 0.009 | 7,596 | 0.008 | 6,330 | 1,121 | 0.010 | 10,721 | 0.008 | 8,934 | 136% | 103% | 141% | 103% | 141% |
Jul-23 | In-Situ | 812 | 0.009 | 7,479 | 0.008 | 6,233 | 1,089 | 0.010 | 10,358 | 0.008 | 8,632 | 134% | 103% | 138% | 103% | 138% |
Aug-23 | In-Situ | 811 | 0.009 | 7,420 | 0.008 | 6,183 | 945 | 0.009 | 8,813 | 0.008 | 7,344 | 116% | 102% | 119% | 102% | 119% |
Sep-23 | In-Situ | 925 | 0.009 | 8,645 | 0.008 | 7,204 | 1,173 | 0.010 | 11,247 | 0.008 | 9,372 | 127% | 103% | 130% | 103% | 130% |
Oct-23 | In-Situ | 916 | 0.009 | 8,289 | 0.008 | 6,908 | 1,063 | 0.009 | 10,055 | 0.008 | 8,379 | 116% | 105% | 121% | 105% | 121% |
Nov-23 | In-Situ | 954 | 0.009 | 8,902 | 0.008 | 7,418 | 1,051 | 0.009 | 9,584 | 0.008 | 8,369 | 110% | 98% | 108% | 102% | 113% |
Dec-23 | In-Situ | 825 | 0.010 | 7,842 | 0.008 | 6,535 | 1,006 | 0.010 | 9,917 | 0.008 | 8,293 | 122% | 104% | 126% | 104% | 127% |
YTD | In-Situ | 10,059 | 0.009 | 92,926 | 0.008 | 77,438 | 11,634 | 0.010 | 112,183 | 0.008 | 93,897 | 116% | 104% | 121% | 105% | 121% |
| 11 July 2024 |
| Florida Canyon Gold Mine | Page 144 |
| Florida Canyon Gold Inc. | NI 43-101 Technical Report |
Table 14-9: Comparison of LIK Model to the Ore Control Production Model for Ore Polygons Mined in 2024
Month | Material | 2024 01 LIK Model | 2023 Production Ore Polygons | Variance Production vs LIK | ||||||||||||
Ore | AuFA | AuFA | AuAA | AuAA | Ore | AuFA | AuFA | AuAA | AuAA | Ore | AuFA | AuFA | AuAA | AuAA | ||
Jan-24 | In-Situ | 1,012,598 | 0.008 | 8,177 | 0.007 | 6,814 | 975,712 | 0.009 | 8,347 | 0.007 | 6,956 | 96% | 106% | 102% | 106% | 102% |
Feb-24 | In-Situ | 1,066,858 | 0.008 | 8,100 | 0.006 | 6,750 | 1,104,594 | 0.008 | 8,890 | 0.007 | 7,408 | 104% | 106% | 110% | 106% | 110% |
Mar-24 | In-Situ | 1,132,015 | 0.008 | 8,595 | 0.006 | 7,163 | 1,185,972 | 0.008 | 9,490 | 0.007 | 7,991 | 105% | 105% | 110% | 106% | 112% |
Apr-24 | In-Situ | - | - | - | - | - | - | - | - | - | - | - | - | - | - | - |
May-24 | In-Situ | - | - | - | - | - | - | - | - | - | - | - | - | - | - | - |
Jun-24 | In-Situ | - | - | - | - | - | - | - | - | - | - | - | - | - | - | - |
Jul-24 | In-Situ | - | - | - | - | - | - | - | - | - | - | - | - | - | - | - |
Aug-24 | In-Situ | - | - | - | - | - | - | - | - | - | - | - | - | - | - | - |
Sep-24 | In-Situ | - | - | - | - | - | - | - | - | - | - | - | - | - | - | - |
Oct-24 | In-Situ | - | - | - | - | - | - | - | - | - | - | - | - | - | - | - |
Nov-24 | In-Situ | - | - | - | - | - | - | - | - | - | - | - | - | - | - | - |
Dec-24 | In-Situ | - | - | - | - | - | - | - | - | - | - | - | - | - | - | - |
YTD | In-Situ | 3,211,471 | 0.008 | 24,871 | 0.006 | 20,726 | 3,266,278 | 0.008 | 26,727 | 0.007 | 22,356 | 102% | 106% | 107% | 106% | 108% |
| 11 July 2024 |
| Florida Canyon Gold Mine | Page 145 |
| Florida Canyon Gold Inc. | NI 43-101 Technical Report |
Reconciliation results suggest several potential occurrences.
- The LIK model is overly conservative in estimating ore tons at a grade > 0.0055 oz/ton. A comparison between the 2023 vs 2024 reconciliations shows that a decrease in cutoff grade reduces the variance between the models. This is a function of higher local variance in the LIK model compared to the production model. With increased data density collected in production, a more consistent grade distribution can be shown at cutoffs > 0.0055 oz/ton.
- The 1.20 FA:CNAA ratio used to convert recoverable gold to contained gold is too conservative. Sensitivity analysis on the FA:CNAA ratio done by back-calculating recoverable gold in the LIK model shows that a ratio of 1.07 reconciles to the production model within 1% on both tons and grade at a 0.0050 oz/ton cutoff.
- Finally, it must be recognized that the production model may be overestimating total ounces skewing the LIK reconciliation more negative. Complicating this potential occurrence is the ability to properly reconcile production numbers from the leach pad due to time-lag in total produced gold.
GRE's QP Ms. Terre Lane, MMSA QP, holds the opinion that some combination of all of the above occurrences are contributing to the differences in reconciliation. Communications with FCM staff indicate all three occurrences are being investigated to improve the predictability of the resource model.
Given the results above, the following trends should be expected in the mine plan and operations.
- Total contained ounces delivered to the pad will be a reasonable, or slightly conservative, estimate; thus, recoverable ounces are expected to be as predicted or slightly better, so sales income of metal is reliable.
- If additional ore tons continue to be defined during production, the currently planned leach pad capacity will become a limiting factor to processing total defined ore. If additional ore tons continue to reconcile positively, FCM should evaluate the possibility of developing additional leach pad expansion capacity that has already been identified.
- Mine operating costs may be invariant because the same amount of total material moved should result in more low-grade ore and less waste haulage.
While recognizing the issues discussed above, this model can be used as a reliable predictor of production with expected variance to the model to be positive thus underestimated tonnage and total contained ounces.
Considering that this model has reconciled well to production since the full implementation of this updated model in 2024, GRE's QP Ms. Terre Lane, MMSA QP, has concluded that the model is acceptable for estimation of Mineral Resources and Mineral Reserves.
14.6 Mineral Resource Estimate
The component of the in-ground material that meets the requirements for reasonable expectation of economic extraction and mineral resource was developed using pit optimization software and a gold price of $1,800 /oz. The following estimates of economic and recovery input parameters to the pit optimization were assembled by FCM and GRE teams based on production history and planning outlook.
| 11 July 2024 |
| Florida Canyon Gold Mine | Page 146 |
| Florida Canyon Gold Inc. | NI 43-101 Technical Report |
Economic benefit was applied to all three classes of measured, indicated, and inferred for the determination of Mineral Resources. Table 14-10 summarizes the input parameters for determination of the Mineral Resource.
Table 14-10: Pit Optimization Parameters for Determination of Mineral Resource
| Parameter | Units (Imperial) | Year-End 2023 | |
| Resources - Oxide | Resources - Sulfides | ||
| Metal Prices & Foreign Exchange | |||
| Gold | $/oz recovered | 1,800.00 | 1,800.00 |
| Mining Cost - Ore | |||
| Total ore cost - Rock | $/ton ore | 2.49 | 2.49 |
| Mining Cost - Waste | |||
| Total waste cost - Rock | $/ton waste | 2.49 | 2.49 |
| Total waste cost - Fill | $/ton waste | 1.89 | 1.89 |
| Process Cost | |||
| Crush | $/ton ore | 4.51 | 21.00 |
| ROM | $/ton ore | 2.42 | |
| Process Recoveries | |||
| Gold - Radio Tower - Crush | Pct | 58.00 | - |
| Gold - Radio Tower - ROM (1) | Pct | 45.00 | - |
| Gold - Central- Crush | Pct | 64.00 | - |
| Gold - Central - ROM | Pct | 53.00 | - |
| Gold - Sulfides (2) | Pct | - | 80.00 |
| TCRC | $/oz recovered | 6.57 | 6.57 |
| Royalties | $/oz recovered | 88.00 | 88.00 |
| G&A | $/ton ore | 1.09 | 1.09 |
| Break-Even Cut-Off Grades (In-Pit) | |||
| Radio Tower - Crush | oz/ton gold | 0.0057 | - |
| Radio Tower - ROM | oz/ton gold | 0.0046 | - |
| Central - Crush | oz/ton gold | 0.0051 | - |
| Central - ROM | oz/ton gold | 0.0039 | - |
| Sulfides | oz/ton gold | - | 0.0162 |
| Slope Angles (3) | |||
| Hard Rock | degrees | 32.00 - 36.00 | 32.00 - 36.00 |
| Alluvium and Fill | degrees | 30.00 | 30.00 |
1. Note that the Radio Tower ROM recovery used for estimation of Mineral Resources and Reserves is lower than that presented in Section 13.3 due to an abundance of caution until more experience has been gained with this material type.
2. Sulfide concentrate recovery is based on historic work performed by Pegasus and confirmed in ongoing test work.
3. Slope angles are over-all slope angles, accounting for anticipated inclusion of haul roads in the slope.
The result of applying the above input parameters to the FCM block model is the following statement of Mineral Resources in Table 14-11 that reflects the project status as of 31 December 2023. The Mineral Resource in Table 14-11 is sourced from a pit optimization run completed by FCM staff and verified by GRE. Note that all the oxide material in Table 14-11 that is part of an oxide only optimized resource pit shell is classified into indicated and inferred. All the additional oxide and sulfide material that falls into an expanded oxide + sulfide resource pit shell is considered as inferred.
| 11 July 2024 |
| Florida Canyon Gold Mine | Page 147 |
| Florida Canyon Gold Inc. | NI 43-101 Technical Report |
Table 14-11: Summary of Mineral Resources, Inclusive of Mineral Reserves - effective 31 December 2023
| Material | Class | Cut-off Grade (Gold oz/ton) | Tonnage (tons x 1000) | Gold Grade (oz/ton) | Contained Au (oz x 1000) |
| Oxides | Measured | 0.0039 - 0.0046 | - | - | - |
| Indicated | 0.0039 - 0.0046 | 93,036 | 0.0100 | 933 | |
| Sulfides | Measured | 0.0162 | - | - | - |
| Indicated | 0.0162 | - | - | - | |
| Sub-Total | Measured & Indicated | 0.0039-0.0162 | 93,036 | 0.0100 | 933 |
| Oxides | Inferred | 0.0039 - 0.0046 | 40,067 | 0.0091 | 366 |
| Sulfides | Inferred | 0.0162 | 66,098 | 0.0281 | 1,854 |
| Sub-Total | Inferred | 0.0039-0.0162 | 106,165 | 0.0209 | 2,220 |
1. Mineral Resources are reported, using the 2014 CIM Definition Standards, with an effective date of 31 December 2023. The Qualified Person for the estimate is Ms. Terre Lane, MMSA QP, a GRE employee.
2. Mineral Resources are reported inclusive of those Mineral Resources converted to Mineral Reserves. Mineral Resources that are not Mineral Reserves do not have demonstrated economic viability.
3. Mineral Resources are constrained within a conceptual open pit shell that uses the following assumptions: gold price of US$1,800/oz; gold recoveries ranging from 45% to 64% for oxides and 80% for sulfides; reference mining cost of $2.49/ton mined in-situ and $1.89/ton mined fill; processing cost of $4.51/ton processed for oxide crushed material and $2.42/ton processed for oxide ROM material; processing cost of $21.00/ton processed for sulfide material; general and administrative costs of $1.09/ton processed; treatment and refining costs of $6.57/oz Au recoverable; royalty of $88.00/oz Au recoverable, and pit slope overall angles ranging from 30-36°.
4. Mineral Resources are reported at a cut-off grade ranging from 0.0039 oz/ton to 0.0057 oz/ton for oxides and is 0.0162 oz/ton for sulfides.
5. Mineral Resources include a stockpile inventory of 1,206.9 ktons at an average grade of 0.0052 oz/ton and total contained gold of 6.22 koz.
6. Mineral Resources include heap leach inventory of 3,928.7 ktons at an average grade of 0.0101 oz/ton and total contained gold of 39.64 koz.
7. Numbers have been rounded and may not sum.
An internal evaluation has been undertaken on a potential expansion to the open pit and process plant to incorporate the oxide and sulfide Mineral Resources stated in Table 14-11. The outcome of the economic evaluation was positive and supports the Mineral Resource statement.
GRE's QP Ms. Terre Lane, MMSA QP, believes the risks associated with this statement of resources include: 1) The uncertainty in the database and the resulting block model may not reflect the distribution of tonnage and grade accurately, and 2) Environmental licensing is not sufficient to cover the entire resource pit because the resource pit may mine somewhat deeper than the estimated water table which is currently not permitted. As a result, GRE's QP Ms. Lane has established that there is no measured category mineralization and any material reported as measured from the model is reported as a component of the indicated Mineral Resource on Error! Reference source not found.Table 14‑11.
14.7 Grade Sensitivity Analysis
The FCM Mineral Resources were assessed in terms of cut-off grade selection by means of a sensitivity analysis.
| 11 July 2024 |
| Florida Canyon Gold Mine | Page 148 |
| Florida Canyon Gold Inc. | NI 43-101 Technical Report |
To illustrate this sensitivity, the global block model quantities and grade estimates are displayed at different cut-off grades in the open pit model as grade-tonnage curves in Figure 14-6 and Figure 14-7. The figures show that the Mineral Resource is not sensitive to minor adjustments in cut-off grade selection as the average grade is substantially higher than the selected cut-offs, and a significant difference in tonnage and ounces is not demonstrated.
Figure 14-6: Grade-Tonnage Sensitivity Curve for the Oxides
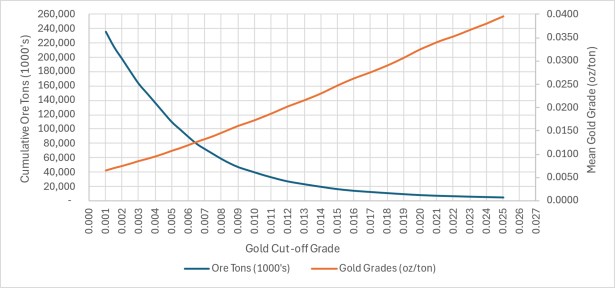
Figure 14-7: Grade-Tonnage Sensitivity Curve for the Sulfides
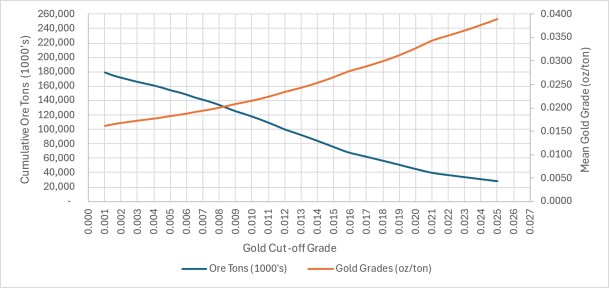
14.8 Factors that May Affect the Mineral Resource Estimates
Factors that may affect the Mineral Resource estimates include:
Metal price assumptions.
Changes to the assumptions used to generate the gold cut-off grade.
| 11 July 2024 |
| Florida Canyon Gold Mine | Page 149 |
| Florida Canyon Gold Inc. | NI 43-101 Technical Report |
Changes in local interpretations of mineralization geometry and continuity of mineralized zones.
Changes to geological and mineralization shapes, and geological and grade continuity assumptions.
Changes to the oxide and sulfide interpretation.
Density and domain assignments.
14.9 QP Comments on Item 14 "Mineral Resource Estimates"
There are no other environmental, legal, title, taxation, socioeconomic, marketing, political or other relevant factors known to GRE's QP Ms. Terre Lane, MMSA QP, that would materially affect the estimation of Mineral Resources that are not discussed in this Report.
There is upside potential for the estimates if mineralization that is currently classified as Inferred can be upgraded to higher-confidence Mineral Resource categories. There is upside potential for the sulfide material if that material is extracted and processed in the future.
| 11 July 2024 |
| Florida Canyon Gold Mine | Page 150 |
| Florida Canyon Gold Inc. | NI 43-101 Technical Report |
15.0 MINERAL RESERVE ESTIMATION
The Mineral Reserve estimates conform to CIM Definition Standards for Mineral Resources and Mineral Reserves (2014) and only includes Measured and Indicated Resources.
The open pit Mineral Reserves have been prepared by FCM under the guidance of Ms. Terre Lane, MMSA QP, a mining engineer employed by GRE. Ms. Lane is independent of Argonaut and FCM and takes QP responsibility as defined in NI 43-101 for the open pit Mineral Reserve estimate.
15.1 Open Pit Mineral Reserve Estimates
Open pit Mineral Reserves were estimated by FCM through the application of a mine design, phasing sequence and subsequent mine plan to convert the Measured and Indicated Mineral Resources to Proven and Probable Mineral Reserves. Inferred Mineral Resources were not included and were assigned to waste. The estimate is based upon the application of a typical truck-loader open pit mining operation to excavate the Mineral Reserve followed by a conventional heap leaching process and by a CIC capture with loaded carbon pressure stripped and gold recovered by electrowinning and precipitate melted into doré bars.
15.1.1 Material Type Classification
There are two principal ore type classifications used to identify Mineral Reserves at FCM: Crushed and ROM. Additionally, material is identified as being associated with the Radio Tower deposit or Central deposit (including both the North and Jasperoid deposits). The Radio Tower deposit has been identified as having a different metallurgical recovery response than the Central deposit.
Both Crushed and ROM material meets the requirements of the COG definition as stated in the CIM Estimation of Mineral Resources and Reserves Best Practice Guidelines (2019), being "The lowest grade or value of material that can be mined and processed at an operating profit, considering all applicable costs".
15.1.2 Open Pit Resource Mine Planning Block Model
The resource model used for open pit mining is discussed in Section 14 of this report. The model has block dimensions of 30 ft in the X (east) direction by 30 ft in the Y (north) direction by 20 ft in the Z (vertical) direction. These block dimensions were selected by FCM to adequately represent the dimensions of a selective mining unit (SMU) appropriate for the size of the chosen loading units.
No additional mine call factors (i.e. dilution and / or ore loss) have been applied to the model due to positive reconciliation results between the model and declared ore mined (Section 14.5.2). GRE's QP, Ms. Terre Lane, MMSA QP, believes that ore grade is adequately diluted in the mine planning block model.
15.1.3 Open Pit Metallurgical Recoveries
Predictive metal recovery values have been developed for the open pit material being extracted from the Radio Tower and Central deposits. Details of the development of these values are provided in Section 13.3. Note that the Radio Tower ROM recovery used for estimation of Mineral Reserves is lower than that presented in Section 13.3 due to an abundance of caution until more experience has been gained with this material type.
| 11 July 2024 |
| Florida Canyon Gold Mine | Page 151 |
| Florida Canyon Gold Inc. | NI 43-101 Technical Report |
The predictive gold recovery values are presented in Table 15-1.
Table 15-1: Summary of Predictive Gold Recovery
Zone | Crushed Material (%) | Run-of-Mine Material (%) |
Radio Tower | 58.0 | 45.0 |
Central (1) | 64.0 | 53.0 |
1. Includes Jasperoid and Main domains 2. Note that the Radio Tower ROM recovery used for estimation of Mineral Reserves is lower than that presented in Section 13.3 due to an abundance of caution until more experience has been gained with this material type. | ||
15.1.4 Open Pit Cut-Off Grade
The open pit COG was calculated by FCM using metal prices, operating costs, applicable sustaining capital costs and exchange rates provided by Argonaut or developed from FCM's 2024 Budget and Life of Mine (LOM) financial and cost models. Table 15-2 summarizes the open pit COG assumptions.
Table 15-2:Open Pit COG Calculation Parameters
Parameter field | Unit | Open pit Parameter Value |
Metal prices | ||
Gold | $/oz | 1,800.00 |
Mining cost | ||
Ore - Crush Ore - ROM | $/ton ore-crush $/ton ore-ROM | 2.34 2.34 |
Waste - Rock Waste - Fill | $/ton waste-rock $/ton waste-fill | 2.34 1.74 |
Sustaining capital | $/ton ore+waste | 0.15 |
Process cost | ||
Process base cost - crushed | $/ton ore crushed | 3.75 |
Process base cost - ROM | $/ton ore ROM | 1.66 |
Leach pad expansion | $/ton ore | 0.76 |
Treatment & refining | ||
Gold | $/oz recoverable | 6.57 |
Royalties | ||
Gold | $/oz recoverable | 88.00 |
G&A | ||
G&A | $/ton ore | 1.09 |
Gold recoveries | ||
Radio Tower |
|
|
Crushed | % | 58.0 |
ROM | % | 45.0 |
Central / Jasperoid / North |
|
|
Crushed | % | 64.0 |
ROM | % | 53.0 |
COG | ||
Radio Tower |
|
|
Crushed | oz/ton gold | 0.0057 |
ROM | oz/ton gold | 0.0046 |
Central / Jasperoid / North |
|
|
| 11 July 2024 |
| Florida Canyon Gold Mine | Page 152 |
| Florida Canyon Gold Inc. | NI 43-101 Technical Report |
Parameter field | Unit | Open pit Parameter Value |
Crushed | oz/ton gold | 0.0051 |
ROM | oz/ton gold | 0.0039 |
GRE's QP, Ms. Terre Lane, MMSA QP, finds the open pit COG calculation to be appropriate for the deposit based upon the assumptions used.
15.1.5 Open Pit Optimization
The pit optimization was conducted by FCM on the mine planning resource model described in Section 14 using a metal price of $1,800/oz gold. The parameters used for open pit optimization are provided in Table 15-2. Only Measured and Indicated Mineral Resources were included in the pit optimization process. Inferred Mineral Resources were treated as waste. Vulcan Pit Optimizer was the software used for the open pit optimization.
Preliminary slope estimates were included in the open pit optimization process utilizing slope recommendations from Golder Associates Inc. (Golder) and Barr Engineering Co. (Barr), as presented in Section 16.2. The slope design criteria were modified to represent overall slope angles, based on the impact resulting from the conceptual superposition of mine haul roads in the economic pit limit evaluation. Overall slope angles vary by pit and range from 32° to 36° for rock slopes and 30° for overburden and fill.
Multiple pits were generated within a range of input gold prices. The contained material quantities and metal content of each of those pits was tabulated at the base case gold metal price of $1,800/oz. Figure 15.1 illustrates the relative size of the open pit, contained gold metal and net profit (operating). Note that the net profit presented in Figure 15-1 excludes costs not associated with the COG determination and should be interpreted accordingly. See Section 21 and 22 for a better understanding of operating and capital costs related to FCM and the resulting cash flows from the mine plan, respectively.
Figure 15-1: Open Pit Optimization Results at Incremental Gold Metal Price

Source: FCM (2024)
| 11 July 2024 |
| Florida Canyon Gold Mine | Page 153 |
| Florida Canyon Gold Inc. | NI 43-101 Technical Report |
As the optimization results illustrate, the design metal price of $1,800/oz gold is in the center of a relatively flat area of the optimization results related to UDCF (undiscounted cashflow) net of operating, indicating a relative stability of value of the open pit size over a range of gold metal prices.
15.1.6 Reserve Pit Design
The optimized pit solution resulting from the criteria presented in the preceding sections was rationalized into a feasible mining geometry, and haulage ramps were superimposed. Haulage ramps were designed nominally at 85-foot width and with a maximum ±10% grade, except for the bottom few benches where widths were permitted to be reduced to one-way traffic of 55 feet. Figure 15.2 illustrates the resulting open pit final limit designs for the Central, Jasperoid, North and Radio Tower pits. The North pit lies within the Central domain.
The four reserve pits at FCM span a distance of approximately 8,500 feet in the east to west direction and 7,650 feet in the north to south direction. Maximum pit depth occurs in the Central pit where the west facing highwall has a height of approximately 1,200 feet.
Total material within the final pit limit designs as of end-2023, including waste and backfill waste, is 150 Mt.
| 11 July 2024 |
| Florida Canyon Gold Mine | Page 154 |
| Florida Canyon Gold Inc. | NI 43-101 Technical Report |
Figure 15-2: Open Pit Final Limit Design
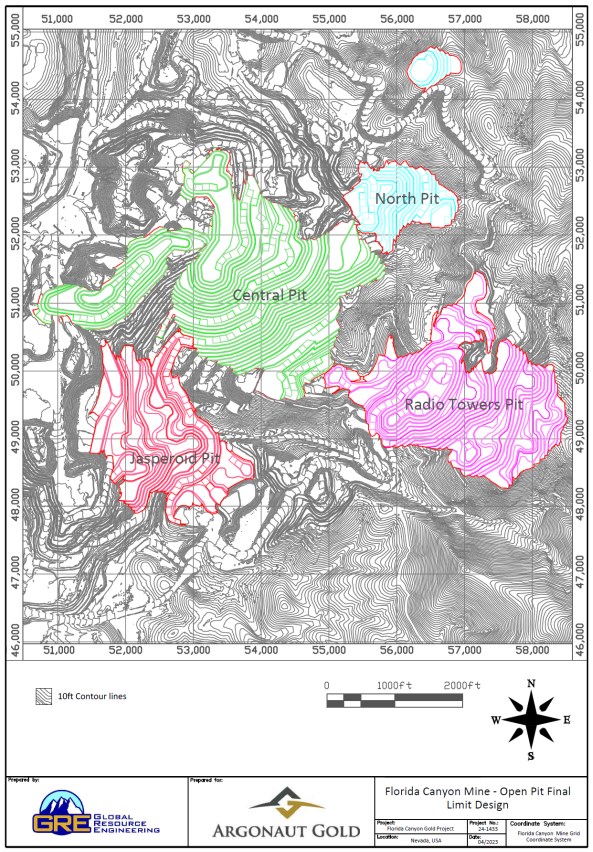
Source: FCM (2024)
| 11 July 2024 |
| Florida Canyon Gold Mine | Page 155 |
| Florida Canyon Gold Inc. | NI 43-101 Technical Report |
15.2 Mineral Reserves
Open pit Mineral Reserves at FCM are summarized in Table 15-3.
Table 15-3: Summary of Mineral Reserves - effective 31 December 2023
Category | Tons (t x 1000) | Gold Grade (oz/ton) | Contained Gold (oz x 1000) |
Proven | - | - | - |
Probable | 85,352 | 0.0101 | 861 |
Proven & Probable | 85,352 | 0.0101 | 861 |
1. Mineral Reserves are reported at the point of delivery to the process plant, using the 2014 CIM Definition Standards, with an effective date of 31 December 2023. The Qualified Person for the estimate is Ms. Terre Lane, MMSA QP, a GRE employee. 2. Mineral Reserves are constrained within an open pit design that uses the following assumptions: gold price of US$1,800/oz considering only oxide material; gold recoveries varied by deposit and ore type, ranging from 45% to 64%; reference mining cost of $2.49/ton mined in-situ and $1.89/ton mined fill; processing cost of $4.51/ton processed for oxide crushed material and $2.42/ton for oxide ROM material; G&A costs of $1.09/ton ore processed; treatment and refining costs of $6.57/oz gold recoverable; royalty costs of $88.00/oz gold recoverable; and pit slope inter-ramp angles ranged from 38-42° for rock and 30° for alluvium / fill. 3. Mineral Reserves are reported at a cut-off grade ranging from 0.0039 oz/ton to 0.0057 oz/ton. 4. Mineral Reserves include a stockpile of 1,206.9 ktons at an average grade of 0.0052 oz/ton and total contained gold of 6.22 koz. 5. Mineral Reserves include Heap Leach Inventory of 3,928.7 ktons at an average grade of 0.0101 oz/ton and total contained gold of 39.64 koz. 6. Numbers have been rounded and may not sum. | |||
The Mineral Reserves reported herein supersede the Mineral Reserves reported previously for year-end 2023 by Argonaut related to FCM.
15.3 Factors that may affect the Mineral Reserves
Factors that may affect the Mineral Reserve estimates include:
- Metal price and exchange rate assumptions,
- Changes in local interpretations of mineralization geometry and continuity of mineralized zones,
- Changes to geological and mineralization shapes, and geological and grade continuity assumptions,
- Density and domain assignments,
- Changes to geotechnical assumptions including pit slope angles,
- Changes to hydrological and hydrogeological assumptions,
- Changes to mining and metallurgical recovery assumptions,
- Changes to the input and design parameter assumptions that pertain to the open pit shell constraining the estimates,
- Assumptions as to the continued ability to access the site, retain mineral and surface rights and titles, obtain, and maintain environmental and other regulatory permits, and obtain and maintain the social license to operate, and
- Risks that could materially affect the reserve include mining selectivity near the oxide and sulfide boundary. This is considered a manageable risk, which will be mitigated as more test work is carried out during operation.
| 11 July 2024 |
| Florida Canyon Gold Mine | Page 156 |
| Florida Canyon Gold Inc. | NI 43-101 Technical Report |
15.4 QP comments on Section 15 Mineral Reserve Estimation
There are no other environmental, legal, title, taxation, socioeconomic, marketing, political or other relevant factors known to the QP that would materially affect the estimation of Mineral Reserves that are not discussed in this report.
| 11 July 2024 |
| Florida Canyon Gold Mine | Page 157 |
| Florida Canyon Gold Inc. | NI 43-101 Technical Report |
16.0 MINING METHODS
Mining at FCM is currently conducted using conventional truck and loader open pit mining methods. The mining operation is conducted with a fleet of 100 t payload haul trucks combined with large front-end loaders (FELs) as primary loading units. The open pit operates at a peak mining rate of 81 thousand tons per day (ktpd) of ore and waste and has an overall strip ratio of 0.88:1 (waste:ore).
Waste and ore are drilled and blasted, loaded by FELs and transported by haul trucks to WRSFs, stockpiles, the primary crusher or directly to the HLP as ROM. Crushed ore is loaded into haul trucks and stacked on the HLP where both crushed and ROM ore are co-mingled and irrigated with a dilute cyanide solution and recovered with carbon columns.
16.1 Hydrologic Considerations
Groundwater for the Central and Radio Tower Pits is not considered to play a role in the slope stability at FCM based on the groundwater depths (Golder, 2016; Golder, 2018).
However, snow melt and surface water runoff during spring can recharge open surface fractures and potentially trigger or reactivate slide areas and therefore measures should be taken to drain runoff away from the open pits and prevent / minimize pooling, seepage, etc.
It is recommended that future reviews should consider the potential impact of ground water levels that may exist with relation to potential Mineral Resource sulfide extraction as this material resides principally below the groundwater table.
16.2 Open Pit Geotechnical Considerations
Recent geotechnical studies have been conducted by Golder Associates Inc. (Golder) (2016; 2018) and Barr Engineering Co. (Barr) (2021; 2022). These studies focused particularly on the west to northwest facing highwalls of the Central, Main and / or Radio Tower open pits. These pit slopes form the highest pit slopes and have had past slope failures principally restricted to the northwest facing slopes, implying a structural control on the instability.
This structural control is considered to be related to the regional structural fabric that has been recognized at FCM as well as at other mine sites in the Humboldt Range including the StdM, Spring Valley mine, and Rochester mine. The foliation generally dips northwest; however, it is expected that there is considerable localized variability in the dip orientation.
In general, the various studies tend to arrive at similar recommendations for inter-ramp pit slope design criteria. Based on these studies, FCM has adopted the criteria provided in Table 16-1.
Table 16-1: Inter-Ramp Slope Design Criteria
Open Pit | Bench Face Angle (°) | Bench Height (1) (ft) | Berm Width (ft) | Inter-Ramp Angle (2) (°) |
Central | 65 | 40 | 33 | 38 |
North | 65 | 40 | 33 | 38 |
Jasperoid | 65 | 40 | 26 | 42 |
Radio Tower | 65 | 40 | 33 | 38 |
| 11 July 2024 |
| Florida Canyon Gold Mine | Page 158 |
| Florida Canyon Gold Inc. | NI 43-101 Technical Report |
1. For design slopes, two 20' benches are combined per berm.
2. Assumes fully drained wall conditions.
16.3 Open Pit Mine Design
The mine design was developed on the optimized pit shell detailed in Section 15 by rationalizing the shape into a feasible mining geometry and incorporating haulage ramps and detailed slope design criteria as presented in Section 16.2. Haulage ramps were designed nominally at 85-foot width and a maximum ± 10% grade, except for the bottom few benches where widths were permitted to be reduced to one-way traffic of 55 feet.
Following the design of the ultimate pit, the pit was subdivided into a series of mining phases. Phases are mining shapes, which except for the final pit limit, never exist exactly as depicted during the LOM. The phases determine the conceptual development of the open pit, with the objective of outlining the feasible mine development which will dictate, along with a mine plan, the order of presentation of ore and waste materials required to maximize net present value (NPV).
The selection of the mining phases was based upon an incremental analysis of optimized pit solutions generated at increasing gold prices, as well as geometric considerations for safe and efficient mining and access to the WRSFs, primary crusher, ore stockpiles and HLP. FCM preferentially utilizes a minimum phase width of 200 ft but at times this does become smaller in areas of limited extent.
A total of 10 phases remain to be excavated across four open pits: 03-phases in the Central Pit (Phase 01-C1, Phase 02-C6 and Phase 03-C7), 01-phase in the Jasperoid Pit (Phase 04-J2), 03-phases in the North Pit (Phase 05-N1, Phase 06-N2 and Phase 07-N3) and 03-phases in the Radio Tower Pit (Phase 08-R1, Phase 09-R2 and Phase 10-R3). Phases 03-C7, Phase 04-J2, Phase 07-N3 and Phase 10-R3 also represent the final pit limit designs of each pit. Figure 16-1 through Figure 16-10 illustrate the phase designs developed for FCM.
| 11 July 2024 |
| Florida Canyon Gold Mine | Page 159 |
| Florida Canyon Gold Inc. | NI 43-101 Technical Report |
Figure 16-1: Phase 01 - Central Pit C1
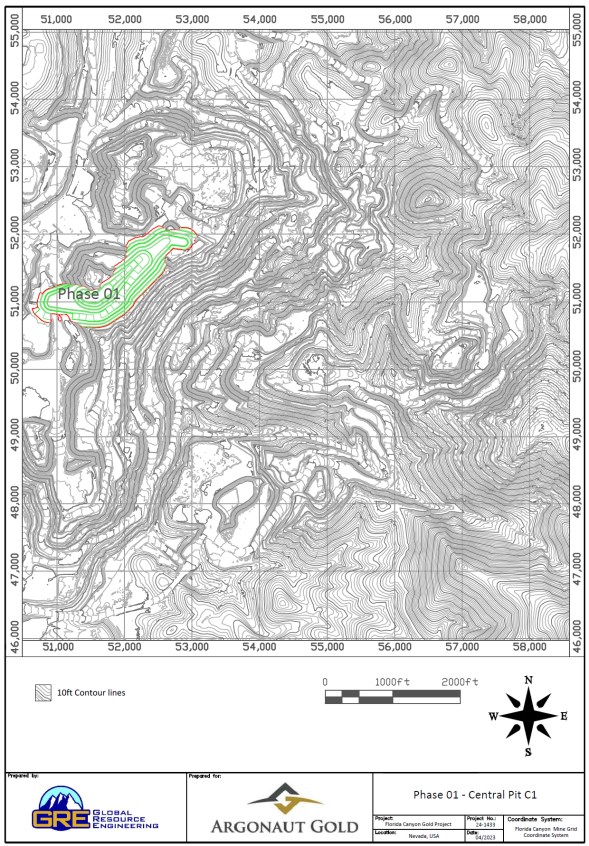
Source: FCM (2024)
| 11 July 2024 |
| Florida Canyon Gold Mine | Page 160 |
| Florida Canyon Gold Inc. | NI 43-101 Technical Report |
Figure 16-2: Phase 02 - Central Pit C6

Source: FCM (2024)
| 11 July 2024 |
| Florida Canyon Gold Mine | Page 161 |
| Florida Canyon Gold Inc. | NI 43-101 Technical Report |
Figure 16-3: Phase 03 - Central Pit C7
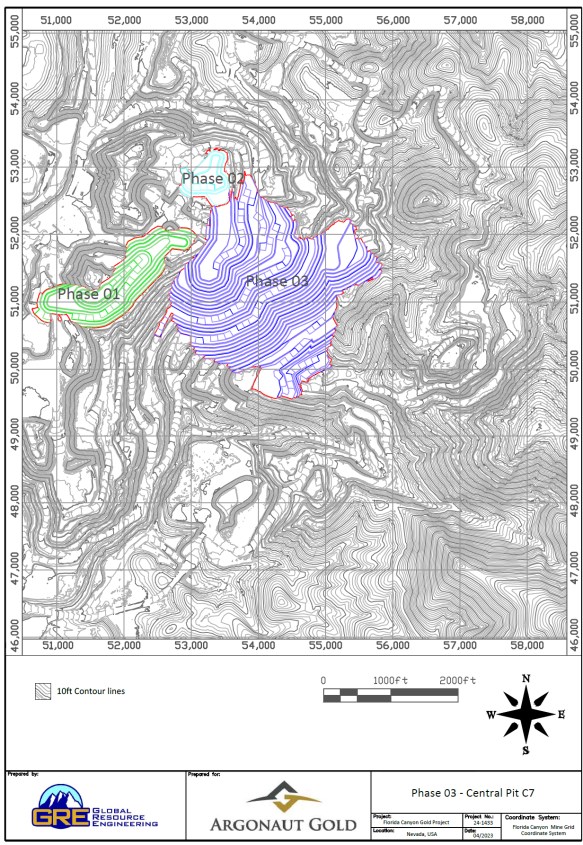
Source: FCM (2024)
| 11 July 2024 |
| Florida Canyon Gold Mine | Page 162 |
| Florida Canyon Gold Inc. | NI 43-101 Technical Report |
Figure 16-4: Phase 04 - Jasperoid Pit J2
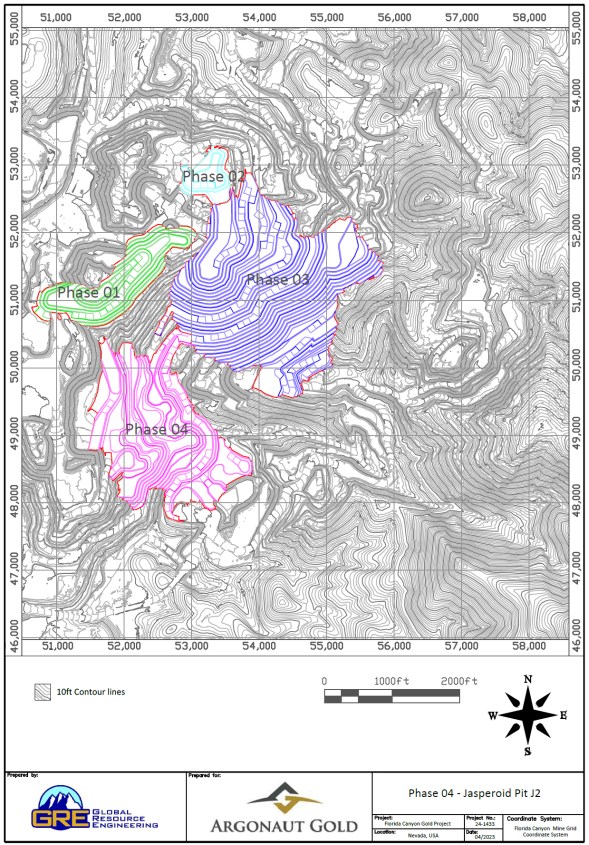
Source: FCM (2024)
| 11 July 2024 |
| Florida Canyon Gold Mine | Page 163 |
| Florida Canyon Gold Inc. | NI 43-101 Technical Report |
Figure 16-5: Phase 05 - North Pit N1
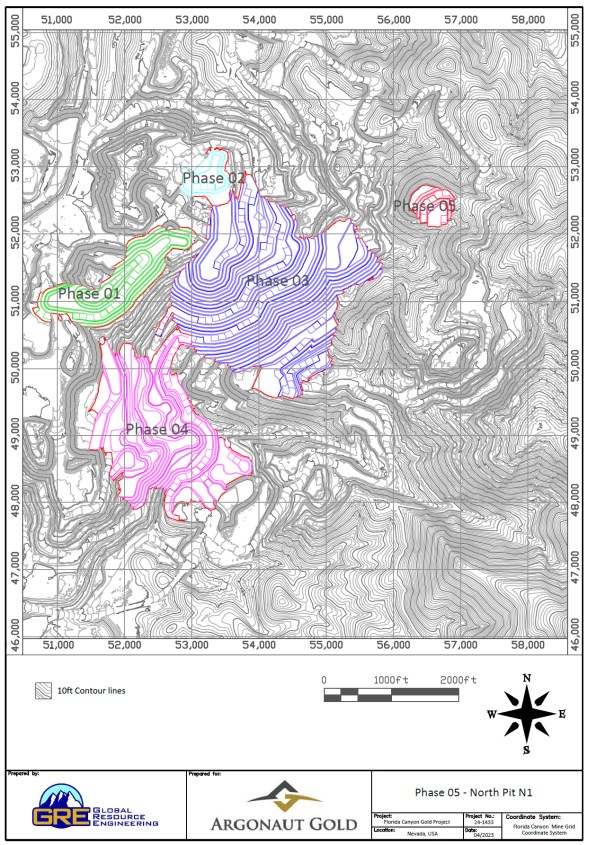
Source: FCM (2024)
| 11 July 2024 |
| Florida Canyon Gold Mine | Page 164 |
| Florida Canyon Gold Inc. | NI 43-101 Technical Report |
Figure 16-6: Phase 06 - North Pit N2
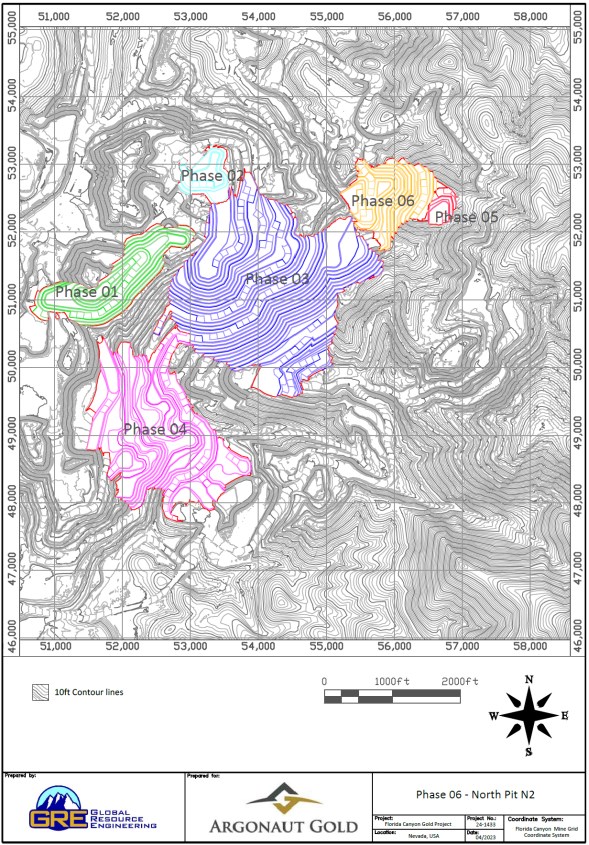
Source: FCM (2024)
| 11 July 2024 |
| Florida Canyon Gold Mine | Page 165 |
| Florida Canyon Gold Inc. | NI 43-101 Technical Report |
Figure 16-7: Phase 07 - North Pit N3
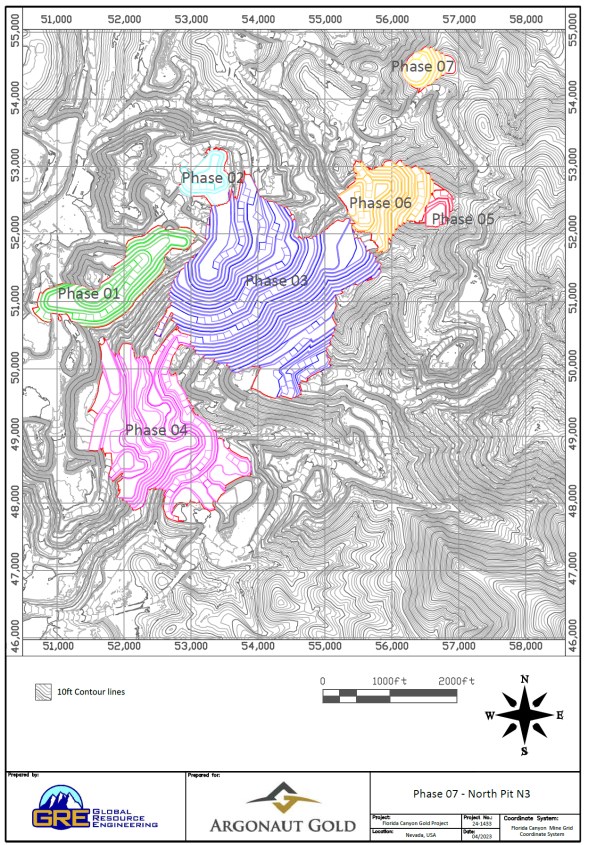
Source: FCM (2024)
| 11 July 2024 |
| Florida Canyon Gold Mine | Page 166 |
| Florida Canyon Gold Inc. | NI 43-101 Technical Report |
Figure 16-8: Phase 08 - Radio Tower Pit R1
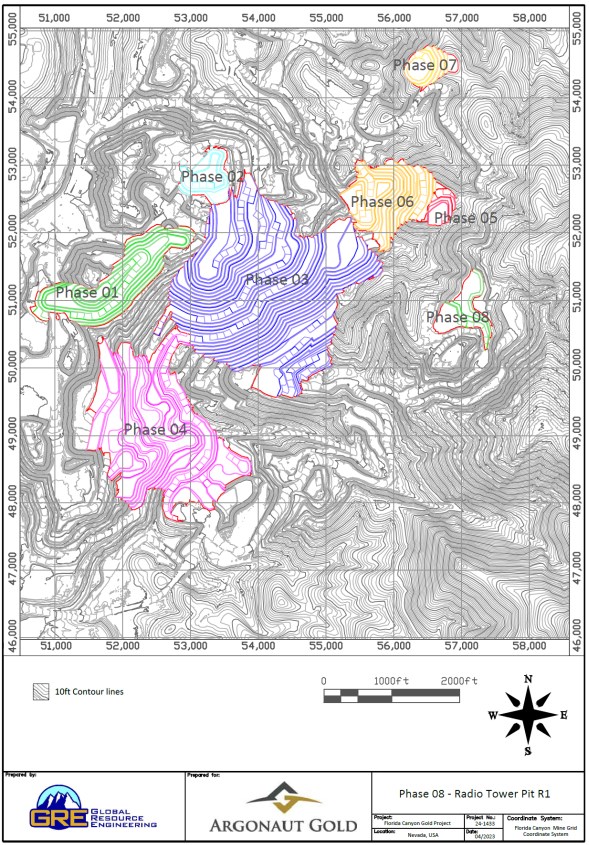
Source: FCM (2024)
| 11 July 2024 |
| Florida Canyon Gold Mine | Page 167 |
| Florida Canyon Gold Inc. | NI 43-101 Technical Report |
Figure 16-9: Phase 09 - Radio Tower Pit R2
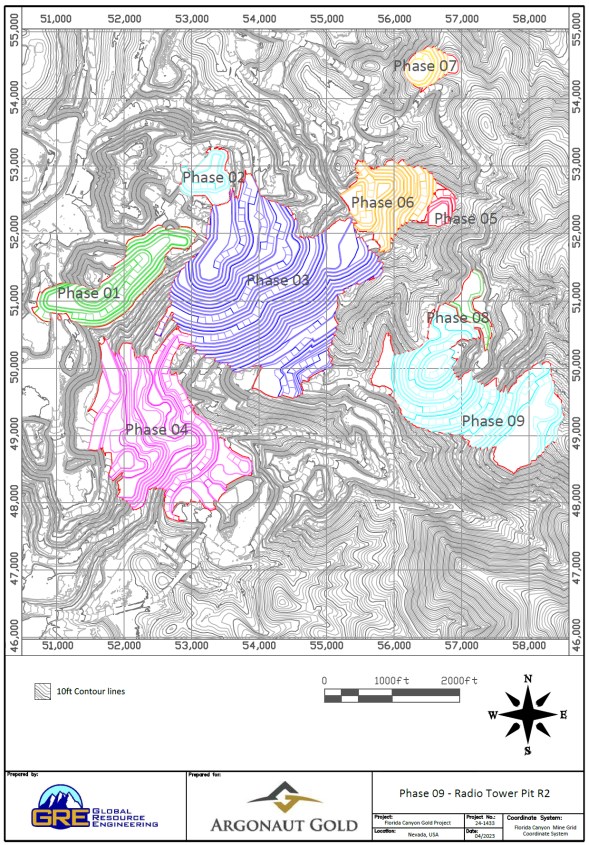
Source: FCM (2024)
| 11 July 2024 |
| Florida Canyon Gold Mine | Page 168 |
| Florida Canyon Gold Inc. | NI 43-101 Technical Report |
Figure 16-10: Phase 10 - Radio Tower Pit R3
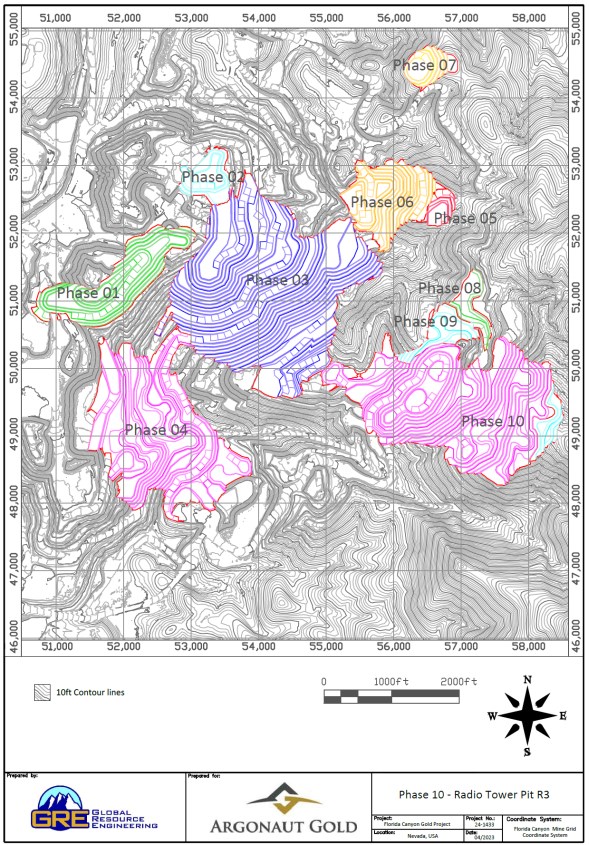
Source: FCM (2024)
| 11 July 2024 |
| Florida Canyon Gold Mine | Page 169 |
| Florida Canyon Gold Inc. | NI 43-101 Technical Report |
16.4 Mining Operations
Mining at FCM is currently conducted using conventional truck and loader open pit mining methods. The mining operation is conducted with a fleet of 100-ton payload haul trucks combined with large FELs as primary loading units. The open pit operates at a peak mining rate of 81 ktpd of ore and waste and has an overall strip ratio of 0.88:1 (waste:ore). Peak material movement rate is 119 ktpd, including stockpile re-handle.
All ore to be crushed is passed through an operational stockpile pre-crusher using a FEL to direct dump into the crusher, with all subsequent post-crusher material re-handled and loaded into haul trucks by an FEL and hauled to the leach pad. No ROM ore is re-handled unless it is placed into a stockpile for deferred processing due to operational capacity limitations on the pad. There does exist an overland conveyor and grasshopper sections for placement on the HLP, however, they are not currently being used due to operational / maintenance issues with the system.
16.4.1 Drilling
Production drilling is carried out by a fleet of three diesel powered Epiroc DM45 blasthole drill units (45,000 lb pulldown capacity) capable of drilling using a rotary or down-the-hole (DTH) method, executing 6-3/4 inch diameter holes. Rotary drilling is principally utilized in broken or highly fractured conditions while DTH is preferred for drilling in relatively solid rock.
Blasthole drills are configured to drill the 20-foot height of the bench plus 03-feet of additional subdrill under a single-pass. Drill patterns vary slightly based on material type but in general are 16.0 feet x 16.0 feet for both ore and waste. These primary drills are backed-up with two CAT MD6290 rotary drills.
Drill productivities are estimated at a rate of 76 feet/operating hour.
16.4.2 Blasting
A complete down-the-hole explosives loading and initiation service is performed by a contractor. Services include the provision of explosive products, accessories, and storage magazines. A combination of ANFO and emulsion explosives are used in combination with electronic downhole delays for accurate timing of detonation to minimize blast dilution and vibration. Explosive delivery trucks, in-hole explosive priming and pumping, and initiation services are provided by the contractor's blasting crew.
Powder factors for ore and waste are 0.40 pounds per ton (lbs/ton).
16.4.3 Loading
Primary loading activities are performed using a fleet consisting of large FELs. The FEL fleet consists of four CAT 992s (15 cubic yard (yd3) bucket - 1,270 tons per hour [tph]). The FELs are assigned to both ore and waste and as required are utilized for stockpile rehandle. An additional two CAT 993s (16 yd3 bucket - 1,270 tph) are available to assist with ROM and crushed stockpile re-handle.
16.4.4 Hauling
Hauling is currently performed by a fleet of eighteen Caterpillar 777 diesel rear-dump off-highway haul trucks in the 100-ton payload class. The fleet is primarily used for mine production and crushed ore re-handle; however, it is also involved in tasks such as clean-up and other support functions. Under certain circumstances, and providing hauling capacity exists, the fleet may be used to support transport of suitable waste materials to the leach pad expansion areas for construction purposes.
| 11 July 2024 |
| Florida Canyon Gold Mine | Page 170 |
| Florida Canyon Gold Inc. | NI 43-101 Technical Report |
16.4.5 Mine planning
The mine plan is executed to take advantage of the installed mine fleet productive capacity with pit phases sequenced to maximize NPV. Crushed ore targets of 7.0 million tons per year (Mtpa) are scheduled with ROM ore sent directly to leach pad when available up to a maximum of 15.6 Mtpa total crushed and ROM ore due to leach pad operational processing capacity (however, permitted capacity is 18.0 Mtpa). Excess crusher and/or ROM ores are stockpiled near the crusher for deferred processing. This results in an open pit mine life extending to 2030.
Table 16‑2 and Table 16‑3 Error! Reference source not found.present the open pit mine production schedule which supports the mining of the established Mineral Reserve.
Table 16-2: Open Pit Mine Ore Production Schedule
Year | Crushed | Run-of-Mine | Total (01) | ||||||
Tons (kt) | Gold (oz/t) | Gold | Tons | Gold | Gold | Tons | Gold | Gold | |
2024 | 7,000 | 0.0106 | 74.1 | 5,856 | 0.0054 | 31.8 | 12,866 | 0.0082 | 105.9 |
2025 | 7,000 | 0.0135 | 94.8 | 4,784 | 0.0053 | 25.2 | 11,784 | 0.0102 | 120.0 |
2026 | 7,000 | 0.0130 | 91.3 | 6,576 | 0.0053 | 35.0 | 13,576 | 0.0093 | 126.3 |
2027 | 7,000 | 0.0130 | 90.9 | 5,095 | 0.0060 | 30.5 | 12,095 | 0.0100 | 121.5 |
2028 | 7,000 | 0.0126 | 88.2 | 4,123 | 0.0057 | 23.4 | 11,123 | 0.0100 | 111.6 |
2029 | 7,000 | 0.0143 | 100.3 | 2,637 | 0.0056 | 14.7 | 9,637 | 0.0119 | 115.0 |
2030 | 5,129 | 0.0169 | 86.9 | 4,007 | 0.0070 | 28.1 | 9,136 | 0.0126 | 115.0 |
Total | 47,129 | 0.0133 | 626.5 | 33,088 | 0.0057 | 188.8 | 80,217 | 0.0102 | 815.3 |
1. Excludes ROM stockpile re-handle to the leach pad.
2. Excludes tonnes, grade and ounces related to leach pad inventory that are included in the Mineral Reserves.
3. Numbers have been rounded and may not sum.
Table 16-3: Open Pit Mine Material Movement Schedule
Year | Ore tons (kt) | Waste tons | Total tons | Strip Ratio | Rehandle | Total tons |
2024 | 12,866 | 10,507 | 23,372 | 0.82 | 14,000 | 37,372 |
2025 | 11,784 | 14,216 | 26,000 | 1.21 | 14,000 | 40,000 |
2026 | 13,576 | 15,920 | 29,497 | 1.17 | 14,000 | 43,497 |
2027 | 12,095 | 8,055 | 20,150 | 0.67 | 14,000 | 34,150 |
2028 | 11,123 | 9,519 | 20,643 | 0.86 | 14,000 | 34,643 |
2029 | 9,637 | 8,046 | 17,683 | 0.83 | 14,000 | 31,683 |
2030 | 9,136 | 3,939 | 13,074 | 0.43 | 11,465 | 24,539 |
Total | 80,217 | 70,201 | 150,418 | 0.88 | 95,465 | 245,884 |
1. Rehandle tons reflects ore stockpiles re-handled by an FEL directly to the primary crusher as well as crushed ore rehandle using an FEL and haulage trucks for transport to the leach pad facilities.
2. Numbers have been rounded and may not sum.
| 11 July 2024 |
| Florida Canyon Gold Mine | Page 171 |
| Florida Canyon Gold Inc. | NI 43-101 Technical Report |
Grade control is executed through the sampling of blastholes and assaying them in an onsite laboratory for cyanide soluble gold. The assays are transmitted back to the site geology department and loaded into software to develop a short-range block model for the development of mining polygons and subsequent material routing. Polygons are marked in the field after the pattern is blasted using different flag colors for routing as crusher feed, ROM, stockpile ore or waste, dependent on the short-range block grade established from the assays.
Waste from the open pit is identified either as overburden, non-acid generating waste (NAG) or potentially acid generating waste (PAG). Waste is hauled to multiple WRSF locations external to the pit as well as to various in-pit facilities. The limited amounts of PAG that are mined are encapsulated within the South WRSF. Limited amounts of overburden excavated are stockpiled in the vicinity of the leach pads for use during reclamation.
WRSF required storage capacities to accommodate the current mine plan are indicated in Figure 16-11. Additional storage capacity exists for possible future expansion of the operation.
Table 16-4: Mine Waste Rock Storage Facility Requirements and Capacities
WRSF | Total (yd3 x '000,000) |
South | 4.1 |
North | 0.1 |
Dagy | 1.5 |
Main | 2.0 |
Central | 6.0 |
Jasperoid | 19.9 |
Brown | 5.3 |
Derby | 8.4 |
Total | 47.3 |
Annual mine positions, including dump and leach pad positions, are illustrated in Figures 16-12 through 16-18.
| 11 July 2024 |
| Florida Canyon Gold Mine | Page 172 |
| Florida Canyon Gold Inc. | NI 43-101 Technical Report |
Figure 16-11: Waste Rock Storage Facility
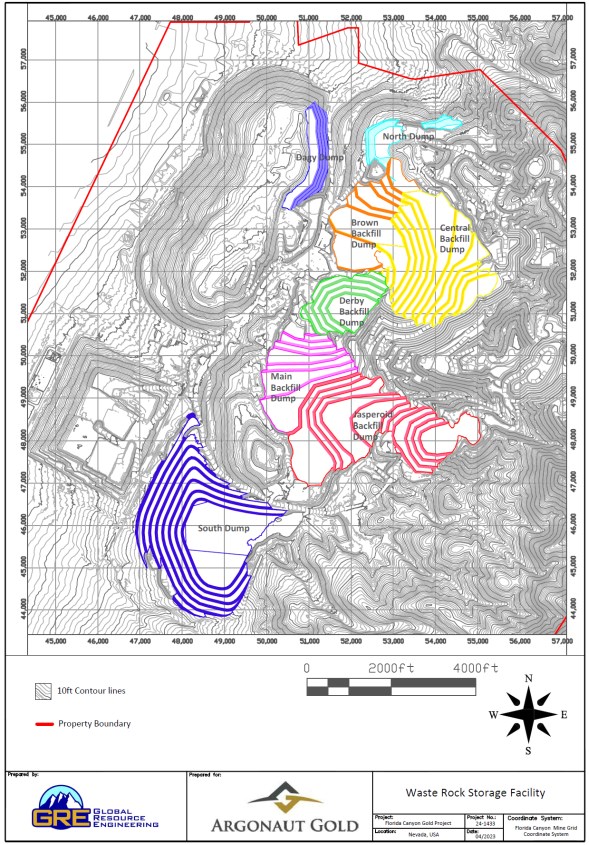
Source: FCM (2024)
| 11 July 2024 |
| Florida Canyon Gold Mine | Page 173 |
| Florida Canyon Gold Inc. | NI 43-101 Technical Report |
Figure 16-12: End of Year 2024 Site Plan
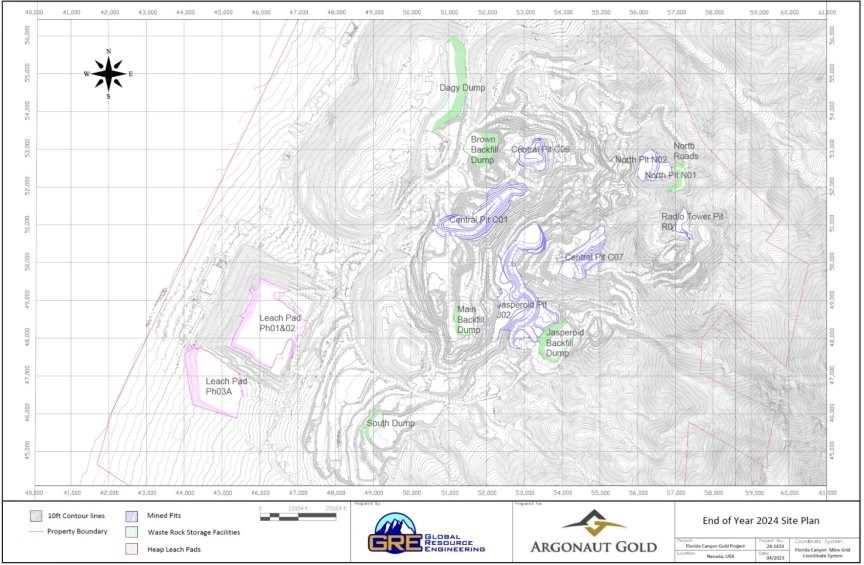
Source: FCM (2024)
| 11 July 2024 |
| Florida Canyon Gold Mine | Page 174 |
| Florida Canyon Gold Inc. | NI 43-101 Technical Report |
Figure 16-13: End of Year 2025 Site Plan
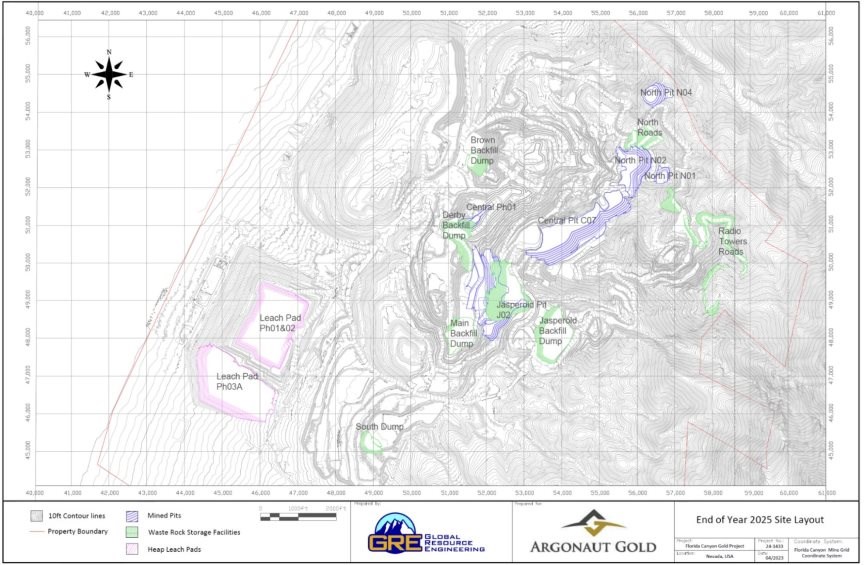
Source: FCM (2024)
| 11 July 2024 |
| Florida Canyon Gold Mine | Page 175 |
| Florida Canyon Gold Inc. | NI 43-101 Technical Report |
Figure 16-14: End of Year 2026 Site Plan
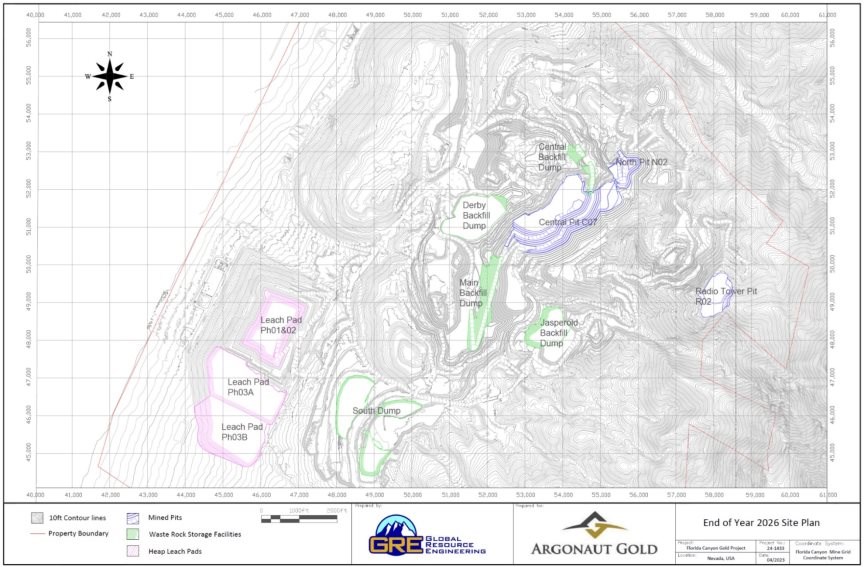
Source: FCM (2024)
| 11 July 2024 |
| Florida Canyon Gold Mine | Page 176 |
| Florida Canyon Gold Inc. | NI 43-101 Technical Report |
Figure 16-15: End of Year 2027 Site Plan
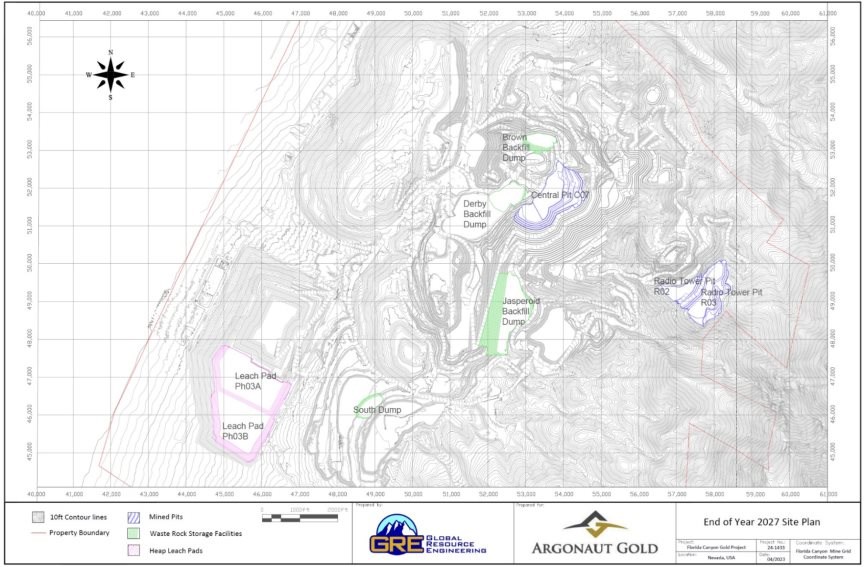
Source: FCM (2024)
| 11 July 2024 |
| Florida Canyon Gold Mine | Page 177 |
| Florida Canyon Gold Inc. | NI 43-101 Technical Report |
Figure 16-16: End of Year 2028 Site Plan
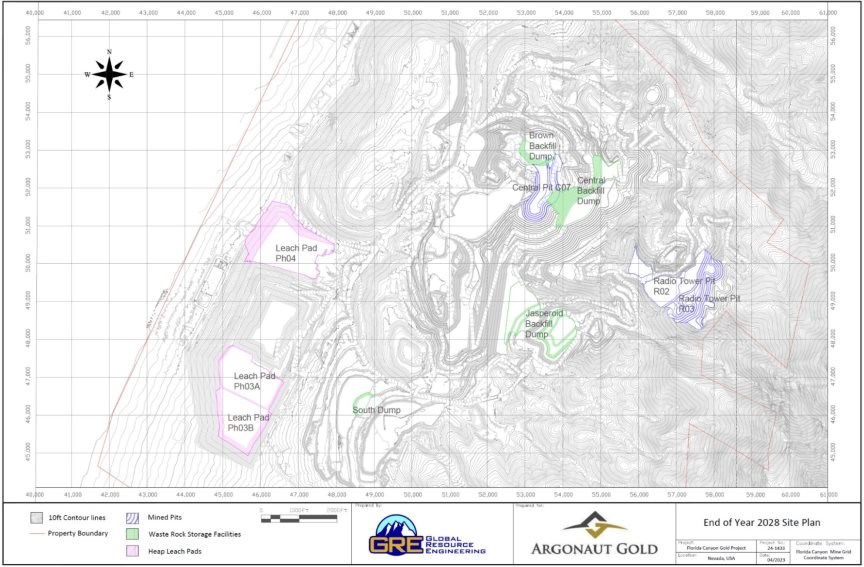
Source: FCM (2024)
| 11 July 2024 |
| Florida Canyon Gold Mine | Page 178 |
| Florida Canyon Gold Inc. | NI 43-101 Technical Report |
Figure 16-17: End of Year 2029 Site Plan

Source: FCM (2024)
| 11 July 2024 |
| Florida Canyon Gold Mine | Page 179 |
| Florida Canyon Gold Inc. | NI 43-101 Technical Report |
Figure 16-18: End of Year 2030 Site Plan

Source: FCM (2024)
| 11 July 2024 |
| Florida Canyon Gold Mine | Page 180 |
| Florida Canyon Gold Inc. | NI 43-101 Technical Report |
16.4.6 Equipment Requirements
Mine equipment requirements were developed by FCM from the annual mine production schedule, equipment availability, utilization, and equipment productivities.
Equipment productivities were determined for drills and FELs based on historical operating parameters and reasonable productivity improvements currently being implemented. Haul truck productivity is also dependent on annual cycle times. Required production hours were calculated for all primary equipment as well as support equipment. A summary of current principal open pit mining equipment requirements is presented in Table 16-5.
Table 16-5: Current and Peak Principal Open Pit Mining Equipment Requirements
Description | Manufacturer | Model | Current Units |
Production drill | Epiroc | DM45 | 3 |
Production drill | CAT | MD6290 | 2 |
Wheel loader | CAT | 993K | 2 |
Wheel loader | CAT | 992K | 4 |
Haul truck | CAT | 777G | 18 |
Track dozer | CAT | D10T | 2 |
Track dozer | CAT | D9T | 1 |
Track dozer | CAT | D6T | 1 |
Wheel dozer Grader | CAT CAT | 884H/K 16M | 2 2 |
Excavator | CAT | 336FL | 2 |
Water truck | Various | Various | 4 |
Fuel truck | Various | Various | 2 |
Lube truck | Various | Various | 5 |
Note that in addition to the principal fleet, a support fleet of smaller equipment is available for miscellaneous activities and jobs at the mine site.
The current principal mine fleet is not expected to require expansion during the LOM, however, two replacement production drills are planned for purchase in 2025 / 2026.
| 11 July 2024 |
| Florida Canyon Gold Mine | Page 181 |
| Florida Canyon Gold Inc. | NI 43-101 Technical Report |
17.0 RECOVERY METHODS
17.1 Introduction
Ores from several deposits at FCM (Main, Central, Jasperoid, and Radio Towers) are processed through conventional heap leaching, adsorption, desorption, and regeneration (ADR) technology to produce a final precious metal (doré) product.
17.2 Ore Stacking
Traditionally, ore placed on the leach pads at FCM has been crushed. In 2022, FCM began processing ROM ore in addition to the crushed ore to increase gold production. Crushed ore passes through two stages of open circuit crushing to a final crush size of 80% minus 1½ inches. The current crushing circuit target is 21,000 tons per day. Crushed ore is then agglomerated with a polymer binding agent to improve solution percolation through the leach pad and is delivered to the SHLP via haul truck. The ore can also be delivered to the pad through a series of mobile ramp conveyors and mobile grasshopper conveyors, or a combination of both. At present, the overland conveyor system is not being utilized due to operational issues and the potential for re-implementation in the future is being studied. Crushed and ROM ores are co-mingled at the pad dump face. Lime is added directly to haul trucks carrying ROM ore from a silo or via a separate lime silo for crushed ore as it is conveyed to the SHLP.
Prior to placing a new lift of ore, the area upon which material is to be stacked is deep ripped by a track dozer to break up the crust surface and remove any solution channels developed near the surface. After placement, new ore is ripped and crossed ripped twice with the final rip to a depth of 6 feet prior to placement of the drip tubing. The tubing is typically placed directly on the ore surface but burying the tubing is under evaluation.
17.3 Barren and Pregnant Leaching Solution Processing
Barren solution (cyanide-bearing solution very low in gold grade) is applied selectively to different areas of the pad through drip tubing at an average application rate of 0.003 gpm/ft2. With that application rate and a total barren solution flow rate of 5,200 gpm, approximately 1.7 million ft2 of heap area can be leached (0.003 gpm/ft2). At an ore production rate of 1,200,000 tons per month (600,000 crushed ore tons and 600,000 ROM) placed on a 40-foot lift, the primary leach cycle is 101 days. Following that, secondary leaching can continue as solution percolates through subsequent ore lifts.
Pregnant solution (gold bearing) from the bottom of the pad reports to the pregnant solution pond and is then pumped to one of two trains of carbon columns where precious metals are adsorbed onto activated carbon. Each train is a 5-stage counter current CIC arrangement. The E1 column train can process 3,100 gpm and the E2 train processes 1,800 gpm. Average total flow rate to the carbon columns is 4,800 gpm. There is no intermediate or recycled pregnant solution back to the leach pad. Carbon column discharge (barren solution) is screened at 120 mesh to remove carbon fines and then reports to the barren pond where it is re-dosed with cyanide, to a target concentration of 250 ppm and recycled back to the pad at approximately 5,200 gpm.
| 11 July 2024 |
| Florida Canyon Gold Mine | Page 182 |
| Florida Canyon Gold Inc. | NI 43-101 Technical Report |
17.4 Carbon Processing
Loaded carbon is transported to the plant by truck where gold is eluted (stripped or redissolved) under pressure and high temperature in a 3-ton vessel. The desorbed gold and silver is recovered from solution electrolytically by two electrowinning cells in series. The sludge is retorted which removes any mercury and then recovered separately. Stripping solution is adjusted to pH 13 with sodium hydroxide and heated to 260 °F by a thermal fluid heater and a series of heat exchangers. Solution flow rate through the vessel is 60 gpm. The electrowinning barren solution is recycled back through the carbon until the batch process is complete. Before it is returned to service at the carbon columns, stripped carbon is screened to remove the fine carbon, thermally reactivated to remove organic contamination as required and then acid washed in hydrochloric acid to remove carbonate scale. The volume of carbon being stripped exceeds the capacity of the reactivation kiln so only about 25% of the carbon is thermally reactivated.
17.5 Refining
The plated material (sludge) from electrowinning is retorted for drying and mercury removal. Once retorted, the sludge is mixed with flux and smelted in a 150 KW induction furnace. Doré bars are the final product at FCM and are shipped to a third-party refiner at 90-95% Au/Ag purity.
17.6 Ventilation
FCM ores contain minor amounts of mercury that dissolve in cyanide solution and adsorb onto activated carbon similar to gold and silver. All thermal units (kiln, smelting furnace, retorts, the electro-winning cells and associated tankage) are each operated with their own mercury abatement system to capture mercury emissions in the exhaust air through beds containing sulfur-impregnated activated carbon before exiting the stack to atmosphere.
17.7 Planned Processing Expansion Project for 2024
FCM is currently constructing an expansion to the SHLP as the existing two Phases are nearing the 300-foot stack height limit above liner. Along with the new pad area, FCM will install additional CIC and solution pumping capacity to double the flow rate to the pad to 10,400 gpm. The advantage to the increased flow capacity will be that while new ore is being actively leached on Phase 3, barren solution can still be applied to Phases 1 and 2 to complete the leaching cycle and rinsing of remaining recoverable gold and silver ounces in inventory. A third carbon column train with capacity for 5,200 gpm will be constructed next to the existing columns. Construction of the pad expansion and CIC/pumping upgrade is expected to be complete in Q3-2024 with residual leaching of Phase 1 and 2 continuing for two to three years after those areas are stacked out.
17.8 Primary Process Equipment and Pond Capacities
Processing equipment used at FCM is summarized in Table 17-1.
| 11 July 2024 |
| Florida Canyon Gold Mine | Page 183 |
| Florida Canyon Gold Inc. | NI 43-101 Technical Report |
Table 17-1: Processing Equipment Used at FCM
Equipment | Existing | After 2024 Upgrade | ||||
Quantity | Power | Capacity/ Size | Quantity | Power | Capacity/ Size | |
Barren Solution Pumping System | ||||||
Vertical Turbine | 2 | 600 hp each | 5,200 gpm | 3 | 600 hp each | 10,400 gpm |
Carbon Columns | 5 |
| 4 ton or Carbon | 5 |
| 4 ton or Carbon |
5 |
| 7 tons of Carbon | 5 |
| 7 tons of Carbon | |
|
|
| 5 |
| 15 tons of Carbon | |
Carbon Column Feed Pumps | 2 | 100 hp each | 4,900 gpm | 2 | 200 hp each | 10,400 gpm |
Carbon Elution Vessel | 1 |
| 3 tons of Carbon | 1 |
| 3 tons of Carbon |
Carbon Reactive Kiln | 1 |
| 550 lb/hour | 1 |
| 550 lb/hour |
Electro-Winning Cells | 2 | 750 Amp each | 100 ft3 | 2 | 750 Amp each | 100 ft3 |
Refining Furnance | 1 | 150 KW | 300 lb brass melt | 1 | 150 KW | 300 lb brass melt |
Total Pond Volume (3' freeboard) | 3 ponds |
| 43.8M gallons | 4 ponds |
| 53.3M gallons |
All equipment used on-site is standard for the industry, commercially available and chosen for its beneficial properties that make it suitable for its required use.
17.9 Reagents
The primary reagents used at FCM are sodium cyanide, pebble lime, activated coconut shell carbon, agglomeration polymer and hydrochloric acid. Consumption rates are within industry norms and 2023 rates are in-line or less than historical FCM averages due to continuing optimization efforts. Consumption rates for the two most expensive reagents, sodium cyanide (NaCN) and lime (CaO) vary depending on ore type, barren solution flow rate and depth of leach pad surface to the liner. In the previous 03-years (2020 - 2022), the average consumption rates for cyanide and lime were 0.31 lb/ton and 2.35 lb/ton, respectively. Primary reagent consumptions and rates for 2023 are shown in Table 17-2.
Table 17-2: Primary Reagent Consumptions and Rate for 2023.
Reagent | 2023 | |
lbs | lb/t ore | |
Sodium Cyanide | 3,826,662 | 0.25 |
Lime | 33,748,300 | 2.25 |
Activated Carbon | 171,961 | 0.01 |
Agglomeration Polymer | 221,606 | 0.01 |
Hydrochloric Acid | 204,342 | 0.01 |
| 11 July 2024 |
| Florida Canyon Gold Mine | Page 184 |
| Florida Canyon Gold Inc. | NI 43-101 Technical Report |
17.10 Gold Recovery
Since start-up in Jan 2017, 331,011 ounces of gold have been recovered from the SHLP through the end of 2023. Cumulative gold recovery during this time is 55.1%. This recovery, from a mixture of crushed and ROM ores, was achieved with an overall solution to ore ratio of 1.0 and leach cycles ranging from 90-120 days. Overall, contained ore grade for this period was 0.0092 oz/ton. Table 17-3 shows the consolidated production data from the SHLP through Dec 2023.
Table 17-3: Consolidated Production Data for SHLP
2017 - 2023 Gold Production from SHLP | ||||
Ore tons | Placed ozs | Grade oz/t | Recovered ozs | Recovery % |
65,805,436 | 601,106 | 0.009 | 331,011 | 55.1 |
The gold recovery trend during this period is shown in Figure 17-1.
Figure 17-1: Gold Recovery Trend
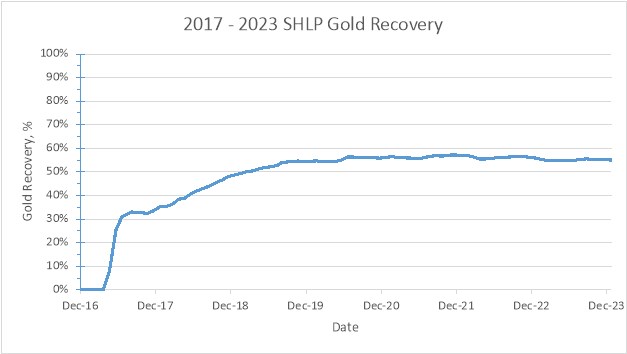
Source: FCM (2024)
| 11 July 2024 |
| Florida Canyon Gold Mine | Page 185 |
| Florida Canyon Gold Inc. | NI 43-101 Technical Report |
18.0 PROJECT INFRASTRUCTURE
FCM has been in production intermittently since 1986 and the infrastructure that is required to sustain planned production is in place, however, with some infrastructure needing to be expanded or modified to complete the mine plan as developed and extract the stated Mineral Reserve. This section summarizes the principal project infrastructure. Figure 18-1 is a recent, general site plan indicating site general arrangement and infrastructure.
18.1 Primary Access Road
The mine is located adjacent to I-80, approximately 40 miles southwest of Winnemucca, NV and 125 miles northeast of Reno, NV. The mine is accessed via Exit 138 onto Frontage Rd.
18.2 Mine Haul Roads
The mine haul roads provide connectivity of the various open pits to the overburden and WRSFs as well as ore stockpiles; connects the open pits to the crusher pad and pertinent mine facilities (truck shop, truck wash, fuel farm, etc.); and connects the post-crusher stockpile to the HLP.
18.3 Principal Mine and Maintenance Facilities
The principal mine and maintenance facilities include the truck shop, truck wash, fuel bay, explosives storage and mixing facilities and WRSFs.
18.3.1 Maintenance Facilities
Principal maintenance facilities are located west of the open pits and north heap leach pad (NHLP) and consists of a truck shop, truck wash and fuel tank farm.
18.3.2 Truck Shop and Truck Wash
The truck shop has three large maintenance bays that can accommodate the current CAT 777 haul trucks and CAT 992 FELs. Production drills and larger Cat 993 loaders cannot be accommodated in the truck shop and are maintained at designated laydown yards outside the truck shop for repairs. A separate shop is used for smaller auxiliary equipment and consists of two bays, one of which is equipped with a lift for light vehicle maintenance. A truck wash pad is located near the truck shop and is sized to accommodate all equipment that can enter the maintenance bays.
| 11 July 2024 |
| Florida Canyon Gold Mine | Page 186 |
| Florida Canyon Gold Inc. | NI 43-101 Technical Report |
Figure 18-1: Site General Arrangement

| 11 July 2024 |
| Florida Canyon Gold Mine | Page 187 |
| Florida Canyon Gold Inc. | NI 43-101 Technical Report |
18.3.3 Fuel Tank Farm
Two fuel tank farms exist on site: The Lower Tank Farm and the Pit Tank Farm.
The Lower Tank Farm is in the vicinity of the maintenance facilities and currently consists of three 10,000-gallon tanks of diesel, with the Pit Tank Farm consisting of a 10,000-gallon tank of dyed diesel. The Pit Tank Farm is currently being expanded to a 30,000-gallon tank of dyed diesel, which will allow the removal of the three tanks in the Lower Tank Farm. Resulting installed dyed diesel capacity for use in the primary mine equipment fleet is sufficient for approximately three days of mine operations. As required, dyed diesel will be supplied to maintain operation of emergency generators.
In addition to the above fuel tanks, there exists a 1,000-gallon clear diesel tank located at the Lower Tank Farm that is being upgraded to a 6,500-gallon tank to supply approximately eight days of fuel for used by diesel pick-up trucks. An 8,000-gallon gasoline tank is located near the process plant, sufficient to supply approximately 18 days of fuel for used by gasoline pick-up trucks.
18.3.4 Explosive Magazine
The explosive storage area is located near the mine operations area, approximately half-way distant between the primary crusher and the Main Pit. The explosive storage area consists of two ANFO prill silos (120,000 lb and 100,000 lb capacity, respectively) and one emulsion silo with a 177,000 lb capacity. This is accompanied by two high-explosive magazines (8 feet x 8 feet) for the storage of detonators, boosters, etc.
18.3.5 Waste Rock Storage Facilities
A series of WRSFs are located ex-pit as well as in-pit (see Figure 16-11), suitable for the required 47.3 million cubic yard (Myd3) of capacity required by the current mine plan for waste storage. All PAG waste excavated is transported to and encapsulated within the South WRSF. PAG waste represents only 3.0 Mtons (or 4.4%) of all waste excavated. Additional WRSF capacity is available for potential future expansion.
Limited amounts of overburden excavated are preferentially stockpiled in the vicinity of the HLPs for use in concurrent and future reclamation activities.
In-pit WRSFs are designed at angle-of-repose slopes below the pit crest. Above the pit crest, in-pit as well as all ex-pit WRSFs are designed with an inter-ramp angle of 3:1 (horizontal to vertical) utilizing 50-foot dumping bench heights.
18.4 Principal Process Facilities
The principal process facilities at the mine consist of a crushing plant, overland conveyor, leach pads, process ponds, CIC plant, gold recovery plant and assay laboratory.
18.4.1 Crushing Plant
The crushing plant is located just northeast of the SHLP and southwest of the Main Pit. The plant consists of a primary jaw crusher with two cone crushers in parallel, and two screens. Agglomeration of ore is achieved using a polymer added to the water used at the crusher and then mixed with the ore on the conveying system drop points. The crushing plant discharges to a stacker where the crushed material is stored in a stockpile until it can be loaded into trucks and/or overland conveyor and transported to the leach pad.
| 11 July 2024 |
| Florida Canyon Gold Mine | Page 188 |
| Florida Canyon Gold Inc. | NI 43-101 Technical Report |
18.4.2 Overland Conveyor
An after-market overland conveyor is installed that can transport crushed material from the crushing plant to the SHLP where the overland conveyor can be extended onto the pad through the use of a series of grasshopper conveyor sections. The overland conveyor has a capacity of approximately 800 to 900 tons per hour and is undersized for the crushing plant.
At present, the overland conveyor and grasshopper sections are not being used due to operational / maintenance issues with the system. These are being investigated to determine if the opportunity exists to resolve these issues and re-implement use of the system and thereby reduce overall costs through haulage savings.
18.4.3 Leach Pad Facility
The leach pad facility is divided principally into the NHLP and SHLP facilities. These are independent facilities, with the NHLP being planned for reclamation and closure, leaving the SHLP as the active facility.
The SHLP is being constructed and utilized in phases. Phase 1 and Phase 2 are nearing capacity, with Phase 3 currently under construction. Phase 3 is being constructed in two phases, with the first phase (Phase 3A) planned for completion mid-2024 and Phase 3B planned for construction in 2025. A Phase 4 expansion is planned for construction north of Phase 1 during 2027. Capacity of the SHLP is sufficient to contain the Mineral Reserves stated in Section 15.2. Additional expansion capacity exists if required in the future.
Final HLP slopes are designed with slopes of 3:1 (horizontal:vertical) on 25-foot to 60-foot stacking bench heights to provide required geotechnical stability, combined with the ability to manage leach cycles and undertake reclamation activities on the side-slopes. Maximum stacking height over liner is 300 feet.
18.4.4 Process Ponds
The active process ponds are located west of the SHLP. At present there are three ponds providing a total storage capacity of 43.8 M gallons (assuming a 3-foot freeboard). A fourth pond is being constructed in 2024 which will add 9.5 M gallons of additional capacity, bringing total storage capacity to 53.3 M gallons as part of the Processing Expansion Project.
18.4.5 Carbon in Column Plant
The CIC plant consists of two trains of five carbon columns each located west of the SHLP. An additional CIC train of five columns is being constructed and should be completed in Q3-2024 as part of the Processing Expansion Project.
Gold adsorption is completed using the CIC plant with loaded carbon transferred from the CIC plant to the gold recovery plant by truck.
18.4.6 Gold Recovery Plant
The gold recovery plant is located west of the NHLP.
| 11 July 2024 |
| Florida Canyon Gold Mine | Page 189 |
| Florida Canyon Gold Inc. | NI 43-101 Technical Report |
At the gold recovery plant, the carbon is stripped of gold in the elution and electrowinning circuits. Barren carbon is acid washed, regenerated, and returned to the CIC plant. Gold captured through the elution and electrowinning process is refined at the plant into doré bars.
18.4.7 Assay Laboratory
The assay laboratory is located west of the NHLP and in the vicinity of the gold recovery plant.
For analytical work, the laboratory is sized to undertake cyanide soluble assays on 6,000 blasthole samples and 500 metallurgical samples per month for ore control and process control, respectively. In addition, limited amounts of fire assays, LECO analysis (commencing Q3-2024), pH and cyanide concentration determinations can be performed. The laboratory does not perform typical environmental testing or water analyses, these being outsourced to 3rd-party laboratories.
The laboratory also has the capacity to perform column and bottle roll testwork. A total of five monthly small column tests can be performed (10-inch diameter x 5-foot-tall column) and a total of six yearly large column tests can be performed (24-inch diameter x 5-foot-tall column). The laboratory has the capability to perform 50 bottle roll tests per month.
18.5 Other Infrastructure
Other principal infrastructure on-site relates to office buildings, electric power, and water sources.
18.5.1 Office Buildings
The main administration building is located to the west of the NHLP, part-way between the truck shop and the gold recovery plant. This building houses site management, technical services, and administrative staff, including Health & Safety, Environmental, Finance, and Human Resources.
Maintenance offices are located within the truck shop with mine operations offices hosted in a new building expansion to the truck shop which consists of several offices and a large meeting space for crew shift change meetings.
Process offices are located within the gold recovery plant.
Exploration offices are located in a small office building to the west of the gold recovery plant.
18.5.2 Electric Power
Power is supplied to the mine by a 69-kiloVolt (kV) overhead transmission line owned and operated by NV Energy, the major power supplier in the state of Nevada. The power is delivered to an onsite substation. FCM owns, operates, and maintains the substation. Mine site 25-kV power lines feed distribution transformers at the crusher, process plant, and other facilities on site. There are backup generators located at the process facilities and barren pond area for power generation if line power is lost.
| 11 July 2024 |
| Florida Canyon Gold Mine | Page 190 |
| Florida Canyon Gold Inc. | NI 43-101 Technical Report |
18.5.3 Water Sources
Water requirements are met with a series of underground wells on site. FCM has 2,415 acre-feet of water per year right which are adequate to meet operational requirements. Some ground water is hot and is pumped to two cooling ponds before distribution via tanks and piping to the required locations on site.
| 11 July 2024 |
| Florida Canyon Gold Mine | Page 191 |
| Florida Canyon Gold Inc. | NI 43-101 Technical Report |
19.0 MARKET STUDIES AND CONTRACTS
19.1 Metal Prices
Mineral Resource and Mineral Reserve economics have been assessed using the following metal price provided by Argonaut: Gold price = $1,800.00/oz.
GRE has reviewed this metal price taking into consideration current market and recent historical prices, values used in other recent projects, and forecasts in the public domain.
According to the London Bullion Market Association (LBMA), the average daily AM Fix gold price for 2023 was $1,942 per troy ounce. The three-year and five-year rolling average gold price through the end of December 2023 are $1,847, and $1,741 per troy ounce, respectively. The volatility of the gold price over these periods can be seen illustrated in Figure 19-1, and shows the low of $1,270 and the high of $2,078 during the five-year period.
Figure 19-1: LBMA AM Fix gold price (daily)
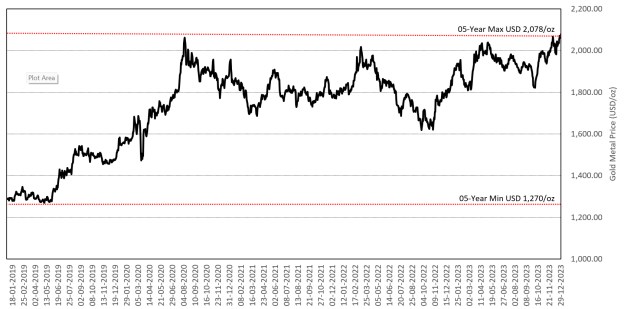
(Source: www.lbma.org.uk, 2024)
Historic metal prices were extracted from www.lbma.org.uk between 1 January 2019 and 31 December 2023.
Based on the undertaken review, GREs QP, Ms. Terre Lane, MMSA QP, considers the metal prices selected by Argonaut to be reasonable, particularly given the relative stability of prices over the past three years and the recent appreciation in the gold metal price during Q1-2024.
19.2 Market Studies
The gold market is a mature global market with reputable refiners located throughout the world. Gold output from the FCM operation is in the form of doré containing approximately 55% gold and 45% silver on average (note that silver is not included in the Mineral Resource or Mineral Reserves but is a historical by-product and mentioned here as doré is the product produced by FCM). Silver credits are received from the Refiner. The doré is shipped to the Asahi facility located in Salt Lake City. Transportation of the doré to the refinery is contracted by FCM to IBI Secure Transport. Responsibility for the doré changes hands at the mine gate upon signed acceptance by the Transport Provider.
| 11 July 2024 |
| Florida Canyon Gold Mine | Page 192 |
| Florida Canyon Gold Inc. | NI 43-101 Technical Report |
FCM is expected to produce an annual average of 71,000 ounces of gold and 40,000 ounces of silver in the form of doré over the mine life.
To date, no penalty element charges have been incurred in the refining of the doré and none are currently expected to be incurred in the future.
GREs QP, Ms. Terre Lane, MMSA QP, has reviewed the refining contract payment conditions and finds that the terms, rates, and charges are within industry norms and supports the assumptions presented in this Report.
19.3 Contracts
As of 31 December 2023, the main contracts involved with the mine were:
• Refining Asahi Refining USA Inc.
• MARC/JSS Caterpillar Global Services LLC
• Fuel supply Hunt & Sons, Inc.
• Anti-scalant ChemTreat, Inc
• Tire supply GCR Tires & Service
• Explosive supply Southwest Energy, LLC
• Agglomeration aid supply: Solenis, LLC
• Sodium cyanide supply Covoro Mining Solutions, LLC
• Lime supply Graymont Western US Inc.
• Dripline supply Netafim Irrigation Inc.
Argonaut and FCM have policies and procedures in place for the letting of contracts. These are awarded based on pricing, supplier competencies and their ability to address where applicable, Argonaut's and FCM's commitments with respect to local interests regarding business, employment, and other opportunities relating to the operation of FCM.
GREs QP, Ms. Terre Lane, MMSA QP, is of the opinion that the contracts for FCM are competitive and are within industry norms.
| 11 July 2024 |
| Florida Canyon Gold Mine | Page 193 |
| Florida Canyon Gold Inc. | NI 43-101 Technical Report |
20.0 ENVIRONMENTAL STUDIES, PERMITTING, AND SOCIAL OR COMMUNITY IMPACT
FCM has all permits in place to continue mine operations. Additional permits required for mine life extension are in progress to assure continuity of operation. Those are typically associated with the planned expansions of SHLP. Final permitting expected by the end of first quarter 2024.
Much of this text was originally published by SRK in the 2018 Technical Report. Since that publication the discussion has been edited and updated by Shane Johnson, and most recently by David Raynor, Environmental Superintendent at FCM who has been relied on as expert on the subject of environmental compliance at FCM.
20.1 Environmental Studies
FCM is partially located on public lands administered by the BLM, which necessitates approval of the mine Plan of Operations (PoO). Any amendment of the PoO, requires an assessment and disclosure of potential environmental and limited social impacts as part of the BLM's obligations under the National Environmental Policy Act (NEPA).
The FCM Amended Plan of Operations #20 (referred to herein as APO 20) Applied Soil Water Technologies, LLC. (ASW, 2013) proposed changes to the previously amended and approved PoO, referred to as APO 18. The proposed changes were analyzed under NEPA in the FCM South Expansion Project Environmental Assessment DOI-BLM-NV-W010-2013-0061-EA (FCM APO 20 EA) Bureau of Land Management (BLM, 2014). The FCM APO 20 EA included baseline data collection and impact assessment for a number of resources, including:
• Air quality
• Cultural resources
• Environmental justice
• Invasive, non-native species
• Migratory birds
• Native American Religious Concerns
• Water quality (surface water/groundwater)
• Economics and social values
• Historic trails
• Noise
• Paleontology
• Public access
• Rangeland management
• Soil
• Special status species
• Vegetation
• Visual resources
• Wildlife
| 11 July 2024 |
| Florida Canyon Gold Mine | Page 194 |
| Florida Canyon Gold Inc. | NI 43-101 Technical Report |
The FCM APO 20 EA also included an assessment of Cumulative Impacts, which is a standard requirement by the BLM and NEPA. The final EA was offered for public comment from August 19 through September 19, 2014. Four comment letters were received and the FCM APO 20 EA was revised accordingly. Subsequently, a Finding of No Significant Impact (FONSI) and Decision Record (DR) were issued on November 26, 2014. Additional environmental protection measures and BLM recommended mitigation were outlined in the DR for:
• Migratory birds, special-status species, and wildlife
• Cultural and paleontological resources
• Air emissions
• Nighttime lighting
• Native American religious concerns
• Erosion and sediment control
• Petroleum products/hazardous materials/solid and liquid waste
• Spill prevention, control and countermeasures
• Growth media storage and stockpile management
• Site-wide monitoring
• Vegetation and non-native invasive species
• Public safety, access and signage, etc.
The FCM APO 20 (2013) was approved and is the initial basis of operations at FCM.
The FCM APO 20 EA included an impact assessment of Special Status Species. No federally listed endangered or threatened species or their critical habitats are known to occur within the biological resources assessment area. However, based on field surveys and an evaluation of habitat features, BLM sensitive species are present or have the potential to occur within or near the Project Area. Field surveys conducted by AMEC (2014) recorded two sensitive plant species and 21 sensitive animal species utilizing habitats within the Assessment Area, including 4 raptors, 2 migratory birds, 2 small mammals, and 13 bats.
The FCM APO 20 EA concluded that APO 20 would result in loss of habitat and individuals of two species of sensitive plants present in the Project Area; the sand cholla and Lahontan beardtongue. In fact, the FCM APO 20 EA found that the implementation of APO 20 could extirpate the local population of Lahontan beardtongue (Penstemon palmeri var. macranthus), which may be at risk from hybridization with the Palmer penstemon (Penstemon palmeri var. palmeri) seeded on areas reclaimed after past mining activities at FCM. As such, the BLM recommended mitigation measures be implemented to protect this species.
Mitigation for the sensitive plant species was performed in 2015 and consisted of relocating populations.
20.2 Environmental Management Planning
Major management plans for FCM are described in the following sections. In addition, FCM holds a number of permits which also have various environmental management requirements.
| 11 July 2024 |
| Florida Canyon Gold Mine | Page 195 |
| Florida Canyon Gold Inc. | NI 43-101 Technical Report |
20.2.1 WPCP Management Plans
Environmental management plans are required under the State of Nevada Water Pollution Control regulations at NAC 445A.398 as part of a site's Water Pollution Control Permit (WPCP). The FCM WPCP was last renewed in March 2023. The July 2021 renewal application included an Operating Plan in Appendix F, which includes the following sections:
• Section 2 - Fluid Management Plan (as required by NAC 445A.398.2)
• Section 3 - Monitoring Plan (as required by NAC 445A.398.3)
• Section 4 - Sampling
• Section 5 - Emergency Response Plan (as required by NAC 445A.398.4)
• Section 6 - Temporary Closure Plan (as required by NAC 445A.398.5)
• Section 7 - Tentative Permanent Closure Plan (as required by NAC 445A.398.6)
A Seasonal Closure Plan was not included in the WPCP application, as per NAC 445A.399, because there are less than 30 consecutive days when the average daily temperature is below freezing at FCM.
20.2.2 Waste Rock Management
The WPCP sampling and reporting requirements include quarterly sampling of waste rock with static testing requirements, followed up by kinetic testing depending on results received. The APO 20 also describes special waste rock management practices for unoxidized sulfide rock. Geochemical evaluations have shown that that waste rock material generated at FCM to date generally has an overall net acid-neutralizing potential. However, a small portion of the waste rock to be produced (0.2%) is unoxidized sulfide rock. Waste rock management practices described in the following paragraphs, are included in APO 20 (ASW 2013). The APO 20 mine plan estimates the sulfide material tonnage to be approximately 376,470 tons. This material will be handled in accordance with special waste rock handling procedures that are outlined as follows:
Following blasting and as part of ore/waste control measures, sulfide rock types exposed are segregated in blocks and removed separately from the oxide ore or left in place. Sulfide waste has been historically segregated from oxide (non-reactive) waste and placed within the primary north waste rock storage facility though placement is also authorized for the south waste rock storage facility. The non-oxide cells within the waste rock storage facilities are designed to isolate potentially reactive waste rock from water, air, and the plant root zone, and to prevent unrestricted infiltration of surface water through potentially reactive waste. The cells are also positioned on topographic highs between existing drainage channels and drainage diversions to minimize accumulation of subsurface water within the cell.
Sulfide material cells are constructed by end-dumping sulfide material between 50-foot lifts of oxide material. Following the placement of a 50-foot lift of oxide material, growth medium is applied to the regraded waste rock storage facility surface to a minimum thickness of 1-foot to provide a suitable rooting medium for the reclaimed waste rock storage facility. Overall, waste rock storage facility surfaces are graded to a minimum slope of 3 percent away from the reclaimed crest towards the existing ground surface to promote runoff of direct precipitation. Diversion channels prevent run-on of storm water from the adjacent ground surface.
| 11 July 2024 |
| Florida Canyon Gold Mine | Page 196 |
| Florida Canyon Gold Inc. | NI 43-101 Technical Report |
20.2.3 Known Environmental Issues Nitrate Plume
First identified through groundwater monitoring in 2000, the migration of nitrate from beneath the FCM HLP has been an issue with the Nevada Division of Environmental Protection - Bureau of Regulation and Reclamation (NDEP-BMRR). Several Findings of Alleged Violation (FOAV) and Orders have been issued on this matter; the first, for the release itself and the second for failing to properly address the release (and source). The final FOAV, which was issued on February 18, 2015, effectively shut down the heap from further solution application. The FCM - Heap Leach Facility Final Permanent Closure Plan WPCP#NEV86001 (Piésold, 2013) was then developed and submitted to the agency for review and approval. The plan involves closure of the center portion of the FCM HLP, making sure that leach solution applied to the northern portion of the facility would not migrate to the area under closure. As part of the 2023 WPC permit Schedule of Compliance an updated Final Plan for Permanent Closure was requested. The updated plan was approved by the BMRR on April 25, 2023. The S-1 Pregnant process ponds was converted to an evaporation/transpiration test cell and drain-down from the closed portions of the FCM HLP would be managed per the plan (NDEP 2016). The Test Evap cell has yet to be commissioned as work continues on minor repairs to the piping prior to commissioning.
The 2016 WPCP renewal included the following permit limitations regarding fluid application on the FCM HLP:
Pursuant to the February 2015 Finding of Alleged Violation and Order, the limit of process solution or fresh water application, shall be no closer than 450 feet north of the northern extent of the Stage III separation berm between Stage III HLP expansion and the 1995 HLP expansion. This limit will be surveyed and marked with permanent signs indicating to operators and inspectors the limit, on the ground, at intervals at a maximum distance of 500 feet between each sign and shall be visible from the sign on either side. The South Heap Leach Pad Phase 1 through 3 is exempt from this restriction.
A report has been submitted to the NDEP-BMRR with quality assurance that the center portion of the FCM HLP has been closed in accordance with the closure plan. Ongoing monitoring and pump back well operation will continue until the site remediation is completed. Pump back system operations and reporting have been incorporated into the WPCP (NDEP, 2016).
20.2.4 Known Environmental Issues Leak Detection System
In Phase II of the SHLP there are four leak detection system (LDS) pipes installed within the composite lining system (see Figure 20-1). FCM is required to report flows in this system when they exceed a quarterly average of more than 20 US gallons per day (GPD). Following the initiation of stacking of ore on the pad and an early period of low to no flows, flow rates increased as stacking heights reached approximately 150 feet above liner. The LDS flows for the SHLP are now above the reporting limit, and as a result, FCM has been reporting results to the NDEP in their quarterly reports as per regulatory requirements. Several independent expert reviews have been conducted to evaluate the design of the LDS and to assess risks, including modeling potential leaks into the substrate. Due to the design of the LDS there is no indication of process solution leaving containment. Below the primary 80-millimeter high-density polyethylene (HDPE) liner, the LDS is composed of a collection pipe bedded in drainage gravel, with a secondary 80 mm HDPE liner below the LDS. Underlaying the entire heap leach pad, including the LDS, is one foot of engineered and compacted low hydraulic conductivity soil (i.e., clay).
| 11 July 2024 |
| Florida Canyon Gold Mine | Page 197 |
| Florida Canyon Gold Inc. | NI 43-101 Technical Report |
Figure 20-1: Phase 2 Heap Leach Leak Detection System
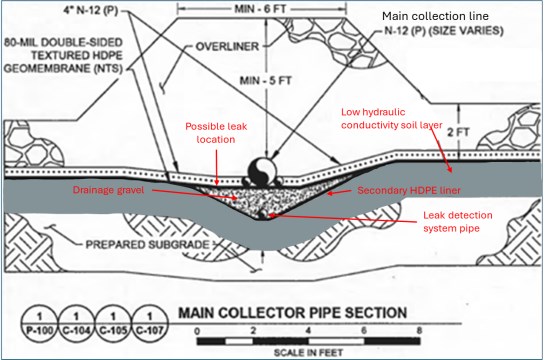
Since early 2024, FCM has been in consultation with the NDEP on instituting an advanced monitoring plan which also includes possible mitigation measures should evidence of process solution leaving containment be observed. This monitoring plan includes the drilling of two additional monitoring wells down-gradient of the areas where the LDS flows originate. In addition, FCM is working with independent heap leach experts to determine if a solution break lining system should be warranted between the material stacked on Phase II and the new Phase III heap leach area.
20.3 Required Permits and Status
A summary of the FCM permits is included in Table 20-1. In some cases, the FCM permits overlap with StdM, as indicated. Permit status is discussed in the following sections.
Table 20-1: Current Permits for Florida Canyon
Regulatory Agency | Permit Name/Description | Status | Company | Number |
Federal Permits | ||||
BLM | Approved Plan of Operations Amendment APO 20 | Approved Dec. 11, 2014 | FCM | APO 20 / BLM Case File Number N64628 |
BLM | FCM APO 20 EA and FONSI | Approved November 2014 | FCM | DOI-BLM-NV- W010-2013-0061- EA |
USGS | Production Report | Voluntary Survey | FCM | -- |
| 11 July 2024 |
| Florida Canyon Gold Mine | Page 198 |
| Florida Canyon Gold Inc. | NI 43-101 Technical Report |
Regulatory Agency | Permit Name/Description | Status | Company | Number |
USACE | Clean Water Act 404 Permit | Updating permit | FCM | SPK-1993-00562, SPK-1994-00672, SPK-1996-25191, SPK-1997-25143, SPK-1998-25164, SPK-2001-25091, SPK-2002-25128 |
U.S. EPA | Hazardous Waste | Conditionally Exempt Small Generator | FCM/ SGMI | NV0000441535 |
FCC | Radio Station Authorization | Expires 1/16/2026 | FCM | Registration No. 0014282289 |
U.S. DOJ/BATF | Federal Explosives License/Permit | Permit held by Southwest Energy | Southwest Energy (Contractor) | 9-NV-013-20-7L- 00248 |
State | ||||
NDEP-BMRR | Water Pollution Control Permit | Expires August 12, 2026 | FCM | NEV0086001 |
NDEP-BMRR (Reclamation Branch) | NAC 519A Reclamation Permit APO-20 | Effective January 19, 2024 | FCM | #0126 |
NDEP-BAPC | Class I Air Operating Permit | Issued March 8, 2021 | FCM | AP 1041-2968 |
NDEP-BAPC | Class II Air Quality Operating Permit | Issued November 16, 2019 | SGMI, FCM | AP 1041-0106.05 |
NDEP-BAQP | Mercury Operating Permit to Construct: Phase 2 | Issued January 22, 2020 | FCM | AP 1041-2256 |
NDEP-BWPC | Mining Stormwater General Permit | Annual renewal due June 30, 2024 | FCM | MSW-176 |
NDEP-BWPC | Mining Stormwater General Permit | Annual renewal due June 30, 2024 | SGMI | MSW-175 |
NDEP-BWPC | Stormwater Pollution Prevention Plan (SWPPP) | Updating permit to reflect leach pad expansion and new storm water channel. | FCM | -- |
BSDW | Permit to Operate a Public Water System | Annual renewal due October 31, 2024 | FCM | PE-0884-TPOU2 |
BSDW | Permit to Operate a Public Water System | Annual renewal due October 31, 2024 | FCM | PE-0884-NTNC |
NDOW | Industrial Artificial Pond Permit -SGM | Expires December 31, 2027 | SGMI | 40942 |
| 11 July 2024 |
| Florida Canyon Gold Mine | Page 199 |
| Florida Canyon Gold Inc. | NI 43-101 Technical Report |
Regulatory Agency | Permit Name/Description | Status | Company | Number |
NDOW | Industrial Artificial Pond Permit -FCM | Expires December 31, 2027 | FCM | 40943 |
NDOW | Industrial Artificial Pond Permit -FCM SHLP | Expires December 31, 2026 | FCM-SHLP | 40944 |
NDWR | Florida Canyon Expansion Pond (Application for Approval of the Plans and Specifications for the construction reconstruction or alteration of a Dam) | Issued. Permit fees paid annually | FCM | J-501 |
NDWR | Florida Canyon Utility Pond (Application for Approval of the Plans and Specifications for the Construction, Reconstruction or Alternation of a Dam) | Issued. Permit fees paid annually | FCM | J-468 |
NDWR | Multiple Pond Locations (Application for Approval of the Plans and Specifications for the Construction, Reconstruction or Alternation of a Dam) | Issued. Permit fees paid annually | FCM, SGMI | J-458 |
NDWR | South Process Ponds (Application for Approval of the Plans and Specifications for the Construction, Reconstruction or Alternation of a Dam) | Issued. Permit fees paid annually | FCM | J-727 |
Nevada Board for the Regulation of Liquified Petroleum Gas | Liquefied Petroleum Gas Storage | Annual renewal due January 2025 | FCM | 5-5450-01 & 5- 5450-02 |
TRI | Toxic Release Inventory State | Annual reporting due July 1, 2024 | FCM/SGMI | N/A |
NSFM | Nevada State Fire Marshal Hazardous Materials Permit | Expires February 28, 2025 | FCM | 14001 |
NDEP | Class III Waivered Landfill | Expires January 13, 2026 | FCM | SW342a |
NDEP-BWPC | On-site Sewage Disposal System - General Septic | Annual renewal due June 30, 2024 | FCM | GNEVOSDS09 L0095 |
| 11 July 2024 |
| Florida Canyon Gold Mine | Page 200 |
| Florida Canyon Gold Inc. | NI 43-101 Technical Report |
Regulatory Agency | Permit Name/Description | Status | Company | Number |
Pershing County | Nevada Business License - Florida Canyon Mining, Inc. | Expires February 28, 2025 | FCM | NV19991176060 |
Pershing County | County of Pershing Business License | Expires June 30, 2024 | FCM | License No. 007113 |
FCM also has water rights and appropriations, as well as monitor well waivers issued by the Nevada Division of Water Resources (NDWR) for 25 production and monitoring wells at both mines. Water rights issues are discussed in Section 20.3.2.5.
20.3.1 Federal Permitting
A mine PoO which describes the construction, operation, reclamation, and closure of each facility, along with a cost estimate for financial surety that presents the reclamation and closure costs if the federal agency is forced to reclaim the mine, is typically required for mining operations that are located on (or partially on) public lands administered by a federal agency. In Nevada, this is most often the BLM, as it is concerning FCM. This PoO also functions as the Reclamation Permit application for the NDEP-BMRR, who regulate mining on State and private lands (see below).
The "complete" PoO has to provide sufficient detail in order to identify and disclose potential environmental impacts during the mandatory NEPA review process, under which the potential impacts associated with project development are analyzed through the preparation of an Environmental Assessment (EA) and/or an Environmental Impact Statement (EIS). It is important to remember that EAs and EISs are public disclosure documents, not permit or approval documents. They are intended to disclose what, if any, environmental impacts may occur from the project and guide the decisions of the public land managers. The primary difference between the two types of NEPA documents is that an EA is prepared when no significant impacts are expected, or the potential impacts are unknown, and an EIS acknowledges the potential for significant impacts, and analyzes and discloses what those potential impacts are.
The BLM will generally look at several triggers to determine whether an EA or an EIS is the most appropriate document to disclose potential environmental impacts. These triggers include, but are not necessarily limited to:
- Number of acres that are proposed to be disturbed. The BLM will typically, but not always, consider 640 acres of proposed disturbance the threshold level for preparing an EIS. Depending on other factors, discussed below, projects less than 640 acres may still have to have an EIS prepared.
- If the proposed project is projected to have significant impacts to a critical element or resource, an EIS will have to be prepared.
- The BLM's perception of how defendable an EA would be to the public. If the BLM anticipates that there are factors that may not pass an appeal by Non-Governmental Organizations or public opposition is expected to be significant, they are likely to determine that an EIS is necessary from the beginning.
| 11 July 2024 |
| Florida Canyon Gold Mine | Page 201 |
| Florida Canyon Gold Inc. | NI 43-101 Technical Report |
The most recent FCM PoO is APO 20 (BLM Case File N64628). APO 20 was evaluated under NEPA under the FCM APO 20 EA (BLM 2014). A FONSI and Decision Record were issued for the FCM APO 20 EA in November 2014.
The other federal permits associated with topics in Table 20-1 which may be required can generally be acquired in much shorter timeframes than PoO authorization.
20.3.2 State Permitting
The State of Nevada requires a number of operational mining permits regardless of the land status of the project. The following are the principal state permits required for mining, regardless of land ownership.
20.3.2.1 Water Pollution Control Permit - NDEP-BMRR
A WPCP is issued by the Department of Conservation and Natural Resources, NDEP-BMRR, to an operator prior to the construction of any mining, milling, or other beneficiation process activity. The need for a WPCP is not dependent on whether a water discharge is intended, or the quantity of ore to be extracted or processed. Facilities utilizing chemicals for processing ores are generally required to meet zero discharge performance standards. A separate permit may be issued for certain activities at a specific facility, or a permit may be issued for all activities at a single facility. A WPCP is required for the extraction of ore or previously processed material for beneficiation at any site. The WPCP is intended to ensure that Nevada's waters are not degraded by mining operations.
FCM is currently permitted under WPCP NEV0086001 which is valid until August 12, 2026.
20.3.2.2 Reclamation Plan - NDEP-BMRR
The Reclamation Branch issues a Reclamation Permit to an operator prior to construction of any exploration, mining, milling or other beneficiation process activity that proposes to create disturbance over 5 acres or remove in excess of 36,500 tons of material from the earth. The Reclamation Permit, which is issued in conjunction with the BLM 43 CFR § 3809 PoO (when mixed land status is involved), is intended to ensure that the lands disturbed by mining operations are reclaimed to safe and stable conditions to ensure a productive post-mining land use. Both the BLM PoO and NDEP-BMRR Reclamation Permit must include a financial surety to ensure that reclamation will be completed.
FCM is currently permitted for reclamation under the state Reclamation Permit #0126, and by the BLM under approval of APO 20 and the FCM APO 20 EA.
20.3.2.3 Air Quality Operating Permit - NDEP-BAPC
Air quality permits are issued by the Bureau of Air Pollution Control (BAPC). While permitted separately in other regards, the Class II Air Quality Operating Permit covers both the FCM and StdM. FCM is covered under Class II permit AP1041-0106.05 and Mercury Operating Permit to Construct: Phase 2 (AP 1041-2256). In addition, a new Class I Air Quality Operating Permit APl041-2968 was issued on March, 8, 2021. This permit is in regards to the process plants thermal units, and is managed in conjunction with the Mercury Operating Permit to Construct.
| 11 July 2024 |
| Florida Canyon Gold Mine | Page 202 |
| Florida Canyon Gold Inc. | NI 43-101 Technical Report |
20.3.2.4 Water and Stormwater - NDEP-BWPC
Water-related issues (e.g., stormwater discharges, sanitary septic systems, and underground injection control) are generally regulated by the Bureau of Water Pollution Control (BWPC). Stormwater discharge permits are required for certain activities by U.S. EPA regulations at 40 CPR 122.26(b)(14). In compliance with this regulation, the BWPC will issue General Permit (NVR300000) for Stormwater Discharges Associated with Industrial Activity from Metals Mining Activities. The Stormwater Pollution Prevention Plan (SWPPP) is required under this permit.
20.3.2.5 Water Appropriations - NDWR
The NDWR is responsible for quantifying existing water rights; monitoring water use; distributing water in accordance with court decrees; reviewing water availability; and, reviewing the construction and operation of dams (among other regulatory activities).
FCM owns 2,415.22 acre-feet (ac-ft) of permitted and certificated underground water rights for FCM (see Table 20-2), this volume is an annual extraction amount. FCM's water rights are managed and maintained by TEC Civil Engineering Consultants and are currently in good-standing with the NDWR. An inventory of water rights for FCM and StdM is provided in Table 20-2.
Table 20-2: FCM Water Rights
Permit | Cert. No. | Well ID | Div. Rate (cfs) (1) | Duty (AFA) (2) | Remarks |
48997 | 13237 | PW-2 | 2.170 | 321.35 | Perfected - no further action |
57096 | 21760 | Perfected - no further action | |||
61203 | 21652 | Perfected - no further action | |||
87181 | 22764 | Perfected - no further action | |||
87182 | 22765 | Perfected - no further action | |||
61707 | 22860 | PW-5 | 0.100 | 72.395 | Perfected - no further action |
61643 |
| PW-6 | 1.080 | 780.98 | Filed 21 Extensions of Time3 |
61644 |
| PW-7 | 1.100 | 796.37 | Filed 21 Extensions of Time3 |
76621 | 21653 | WS-1 | 1.610 | 527.67 | Perfected - no further action |
84125 |
| Filed 31 Extensions of Time3 | |||
91616 |
| WS-1 | 0.590 | 89.22 | Proofs of Completion Filed |
91617 |
| Proofs of Completion Filed | |||
50061 | 13953 | Trailer 1 | 0.045 | 3.13 | Use resumed in 2021 |
50248 | 14448 | Trailer 2 | 0.190 | 4.32 | Possible Forfeiture for Non-Use4 |
79819-E |
| MW-16D | 0.020 | 20.50 | No Further Action Required |
MW-I | 0.030 | No Further Action Required | |||
79820-E |
| MW-16 | 0.010 | No Further Action Required | |
MW-16B | 0.020 | No Further Action Required | |||
MW-GA | 0.030 | No Further Action Required | |||
MW-K | 0.030 | No Further Action Required | |||
MW-M | 0.020 | No Further Action Required | |||
MW-N | 0.020 | No Further Action Required | |||
MW-O | 0.030 | No Further Action Required | |||
80098-E |
| MW-V | 0.010 | No Further Action Required |
| 11 July 2024 |
| Florida Canyon Gold Mine | Page 203 |
| Florida Canyon Gold Inc. | NI 43-101 Technical Report |
Permit | Cert. No. | Well ID | Div. Rate (cfs) (1) | Duty (AFA) (2) | Remarks |
82357-E |
| MW-29 | 0.300 |
| No Further Action Required |
82358-E |
| MW-31 | 0.150 | No Further Action Required | |
87426-E |
| MW-KA | 0.020 | No Further Action Required | |
89711-E |
| MW-P | 0.032 | No Further Action Required | |
90261-E |
| MW-C | 0.032 | No Further Action Required | |
93152 |
| MW-36 | 0.028 | 20.00 | No Further Action Required |
1054 | 27 | Humboldt Spring | 0.025 | 18.10 | Perfected - no further action |
1. Div. Rate (cfs) represents Diversion Rate (cubic feet per second).
2. Total combined duty (Acre-Feet Annually) under all Permits not to exceed 2,415.22 Ac. Ft. annually.
3. Total number of Extensions represents the number filed since the original permit was issued.
4. The water under Permit 50248 is subject to forfeiture for 5 consecutive years of non-use.
20.3.2.6 Other State Permits
Other state permits generally required for mining operations in Nevada include:
• Approval to Operate a Solid Waste System - NDEP, Bureau of Waste Management (BWM)
• Hazardous Waste Management Permit - NDEP, BWM
• Drinking Water Supply Facilities - NDEP, Bureau of Safe Drinking Water (BSDW)
• Industrial Artificial Pond Permit - Nevada Department of Wildlife (NDOW)
• Petroleum Contaminated Soils waiver - NDEP
• Liquified Petroleum Gas Storage - Nevada Board for the Regulation of Liquified
These permits can be acquired in much shorter timeframes. Their discussion henceforth is limited.
20.3.3 Local Permitting
A Special Use Permit is generally required by the county; usually a copy of the PoO is sufficient information for the county to review and issue this permit. In some cases, building permits are required as well.
20.3.4 FCM Permit Compliance
The permits required for operation of FCM appear to be in place. The major operating permits for the mine are the BLM Plan of Operations approval of subsequent amendments (APO 20) which authorize the use and disturbance of federal lands, the WPCP NEV86001 which authorizes the process facilities, and the Class II Air Quality Operating Permit (AP1041-0106.03) which essentially authorizes the mine to operate and control all air emissions.
The other major State permit, the Reclamation Permit #0126 was authorized as part of the approval process for APO 20 on November 4, 2014. The approved permit contains one Schedule of Compliance requirement, which requires FCM to "Complete installation of all permanent contact and non-contact storm water diversion structures consistent with approved engineering designs". Construction currently continues on the installation of the non-contact storm water diversion structures.
In addition, the 2023 WPCP renewal includes specific facility conditions and limitations including the following schedule of compliance items:
| 11 July 2024 |
| Florida Canyon Gold Mine | Page 204 |
| Florida Canyon Gold Inc. | NI 43-101 Technical Report |
1. Upon closure of the Barren Pond, when cessation of operation allows for removal of the piping and other infrastructure presently blocking access to the existing liner anchor trench, and prior to conversion of the pond to an evapotranspiration cell, the Permittee shall submit to the Division an application for Permit modification proposing replacement of the primary liner using a conventional anchor trench design. The secondary liner, welded to the existing, anchored liner, may remain after testing of the weld, according to a procedure approved by the Division, confirms that it is sound over the entire length. Permit modification fees shall apply.
2. By 01 July 2020, the Permittee shall submit for review and approval a revised design for the FCM and Wiley Gulch stormwater management structures. This design must incorporate pit boundary limits, topography, and any other mine activates (as reasonably predictable) to ensure that the management structure will not limit future mining activities. EDC submitted on 01 July 2020. Division comments sent 13 January 2021. Responses have not yet been received US of the 2022 renewal.
3. By Day Month 2023 (90-days after the effective date of the Permit) the Permittee shall submit, for review and approval, an updated Final Plan for Permanent Closure of the North Heap Leach Pad. The plan, along with including construction drawings, technical specifications, and quality assurance/quality control procedures, shall include a proposed schedule for implementation.
20.3.5 Future Permit Amendments
No NEPA-level Plan of Operations Amendments are currently under consideration.
20.3.5.1 Water Pollution Control Permit
Water Pollution Control Permit NEV86001 has been modified to include Phases I and II of the South Heap Leach Pad. Modification for the final Phase III was submitted in 2023, approval pending end of first quarter 2024.
20.3.5.2 Air Quality Permit
The permitting branches in the BAPC issue air quality operating permits to stationary and temporary mobile sources that emit regulated pollutants to ensure that these emissions do not harm public health or cause significant deterioration in areas that presently have clean air. A Class II permit, which has been issued to FCM and covers both FCM and StdM (AP1041-0106.05), is issued for facilities that emit less than 100 tons per year for any one regulated pollutant and emit less than 25 tons per year total Hazardous Air Pollutants (HAPs) and emit less than 10 tons per year of any one HAP. This permit essentially acts as the facility operating permit, as no mining or processing can occur without it.
The Class II permit currently limits crusher throughput to 1,600 tons per hour and 14-Mtons per year. In the event that FCM would consider increasing crusher throughput, this permit would need to be modified. The remaining permits activities would be limited to scheduled renewals and updates of older permits. No material permitting issues are anticipated.
New Class I Air Quality Operating Permit APl041-2968, - Typically for facilities that emit more than 100 tons per year for any one regulated pollutant or emit more than 25 tons per year total HAP or emit more than 10 tons per year of any one HAP or is a PSD source or major MACT source.
| 11 July 2024 |
| Florida Canyon Gold Mine | Page 205 |
| Florida Canyon Gold Inc. | NI 43-101 Technical Report |
The Class I Air permit is in conjunction with FCM Mercury Operating Permit to Construct: PHASE 2 Permit No. AP1041-2256
20.3.5.3 Radio Tower
FCM's proposed expansion of the Radio Tower pit is likely to result in the removal of the hill on which two radio towers and one access road are located; thus, necessitating the removal and/or relocation of those facilities. Notwithstanding the legal and financial costs of such an action, FCM will need to address the permitting consideration of this action. Typically, communication sites on federal public lands are granted under simple rights-of-way (ROW), which should be eclipsed by the underlying mineral rights, and is typically not a high-risk issue. There are three ROW grant authorizations associated with the Radio Tower pit, which include the following serial numbers:
• NVN-005656
• NVN-006407
• NVN-022262
Agreements for the relinquishment of the ROWs should be investigated more closely with FCM.
FCM is currently in the process of obtaining all necessary Agency approvals and coordinating the removal and replacement of the Radio Tower site with the appropriate stakeholders. Stakeholders have agreed to a proposed new location.
20.4 Social and Community Requirements
Employees for the operating work force of FCM generally come from Winnemucca or Lovelock, Nevada. The FCM APO 20 EA determined that the mine would result in a temporary positive effect on mine-related employment and income in terms of labor income and secondary employment. It was also concluded that net mineral proceeds, property and sales and use taxes would also increase during the life of the assessed action.
20.5 Mine Closure
20.5.1 Regulatory Requirements
FCM has a closure plan submitted to agencies per requirements for closure described in detail in the Water Pollution Control regulations (NAC 445A) in Nevada. Agency-approved closure plans for FCM reside in WPCP #NEV0086001 and a final permanent closure plan was submitted for the FCM HLP.
Relevant documents are the following:
• Water Pollution Control Permit #NEV0086001 Major Modification Florida Canyon Mine South Area Expansion, Section 7 - Tentative Permanent Closure Plan
• Final Plan for Permanent Closure - North Heap leach Pad Update (Haley Aldrich, 2023)
In addition, FCM is permitted under Reclamation Permit #0126. Under this reclamation permit, FCM is limited to 3099.6 acres of surface disturbance. Both the BLM's 43 CFR § 3809 and State of Nevada's mine reclamation regulations (NAC 519A) require closure and reclamation for mineral projects. Closure of process facilities is also regulated with the WPCP and the NAC 445A. The reclamation procedures currently used at the mine incorporate the following basic components, as described in APO 20 (ASW 2013):
| 11 July 2024 |
| Florida Canyon Gold Mine | Page 206 |
| Florida Canyon Gold Inc. | NI 43-101 Technical Report |
• Establishment of stable topographic surface and drainage conditions that would be compatible with the surrounding landscape and serve to control erosion.
• Establishment of soil conditions conducive to establishment of a stable plant community through stripping, stockpiling, and application of a suitable growth media.
• Revegetation of disturbed areas to establish a long-term, productive biotic community compatible with proposed post-mining land uses.
• Reduction or elimination of potential environmental impacts.
• Protection of public safety through stabilization, removal, and/or fencing of structures or landforms that could constitute a public hazard.
• Consideration of the long-term visual character of reclaimed areas.
Aside from concurrent reclamation, described below, it is proposed that reclamation activities will be performed in 2 separate timeframes, initial reclamation activities following the cessation of mining and reclamation activities following the proposed post-closure monitoring period.
Factors that could result in changes to the Mine include but are not limited to:
• Delineation drilling of the deposits continues in an effort to better define the precise limits of the ore body. Depending upon this work, the ultimate pit limits could shift.
• The quantity of overburden that can be economically removed to reach the reserves tends to change with time as costs and mining technology change.
• Gold price fluctuations affect economic pit limits.
20.5.2 Reclamation Bonding and Closure Cost Estimates
Pursuant to state and federal regulation, any operator who conducts mining operations under an approved PoO or reclamation permit must furnish a bond in an amount sufficient for stabilizing and reclaiming all areas disturbed by the operations. Conceptual reclamation and closure methods were used by FCM to evaluate the various components of the project to estimate the reclamation costs. Version 1.4.1 of the Nevada Standardized Reclamation Cost Estimator (SRCE) was used by FCM to prepare the FCM reclamation bond cost estimate as part of the Reclamation Permit application. The SRCE uses first principles methods to estimate quantities, productivities, and work hours required for various closure tasks based on inputs from the user. The physical layout, geometry, and dimensions of the proposed project components were based on the current understanding of the site plan and facilities layout. These included current designs for the main project components including the well field infrastructure, and process plant components. This current estimate includes the cost for the SHLP Ph III expansion, CIC installation and Closure Diversion Channel (CDC). Equipment and labor costs were conservatively estimated using state and BLM-approved costs for the 2023 calendar year. The regulatory-required, third-party conducted, reclamation bond cost estimate for FCM (as calculated for the 20231016-FCM-BLM BMRR SRCE-SHLP P3 (1).xlsm submittal) was approximately $61.1M (SRCE). The first-party (FCM-conducted) closure cost estimate, provided by FCM and used in the technical economic model, is $37.8M (2023 ARO), and considers the reduced labor and equipment rates of self-implementation over state/federal rates used for bonding, and has taken credit for partial, concurrent cash bond releases during the first few years of reclamation when the majority of the earthworks are customarily completed.
| 11 July 2024 |
| Florida Canyon Gold Mine | Page 207 |
| Florida Canyon Gold Inc. | NI 43-101 Technical Report |
20.5.3 Existing Bonding at FCM
FCM has two separate sureties as required by the NDEP and BLM, a trust fund for long-term management of groundwater fluids associated with the leach pad (Florida Canyon Long Term Trust Fund) and a reclamation surety to fund short-term closure and reclamation of the disturbance associated with mining operations. According to NAC 519A.350 these surety instruments can take several forms:
The surety may be one or combination of the following:
• A trust funds
• A bond
• An irrevocable letter of credit
• Insurance
• A corporate guarantee
• Any combination thereof
Although the total liability must be covered by any combination of the above surety types, the type and amount of bond type will vary by site. The financial strength of an operating company will dictate the amount of the bond that can be secured from a third party, and the remainder is usually posted as a cash equivalent financial surety (e.g., Certificate of Deposit). Currently, 10% of the FCM bond is backed with collateral and 10% of the StdM bond is backed with collateral. The remainder of these appear to be guaranteed by insurance companies.
| 11 July 2024 |
| Florida Canyon Gold Mine | Page 208 |
| Florida Canyon Gold Inc. | NI 43-101 Technical Report |
21.0 CAPITAL AND OPERATING COSTS
The mine capital and operating costs reported here have been estimated by FCM throughout their 2024 Budget and LOM planning process and have been reviewed by GRE and are considered to be appropriate for FCM. These cost estimates were determined using a combination of costs actually incurred at FCM and upon estimates of planned operating and capital expenditures for the remainder of the mine life. All costs presented in this section are presented in constant Q1-2024 US$, with no inflation nor escalation factors considered.
21.1 Capital Costs
Capital costs have been estimated based on existing work contracts, manufacturer / provider quotes or recent actual construction / installation costs. Where none of the proceeding were available, budgetary estimates were made by FCM based on experience.
Total LOM capital costs are estimated to total $144M as summarized in Table 21‑1. This includes $38M in reclamation / closure costs in addition to a salvage value credit of $10M.
Table 21-1: Capital Costs Summary
| Description | Unit | 2024 | 2025 | 2026 | 2027 | 2028 | 2029 | 2030 | 2031 | 2032 | 2033 | 2034+ | Total |
| Leach Pad | $M | 36.8 | 12.0 | - | 8.0 | - | - | - | - | - | - | - | 56.8 |
| RT Relocation | $M | - | - | 1.5 | 1.5 | - | - | - | - | - | - | - | 3.0 |
| Equip. Lease | $M | 13.4 | 4.8 | 2.6 | 0.4 | - | - | - | - | - | - | - | 21.2 |
| Salvage Value | $M | - | - | - | - | - | - | - | (5.0) | - | - | (5.0) | (10.0) |
| Reclamation | $M | 1.2 | 4.6 | 4.0 | 0.1 | 1.7 | 0.2 | 0.1 | 0.1 | 0.1 | 20.9 | 4.7 | 37.8 |
| Other | $M | 5.1 | 3.8 | 11.8 | 10.1 | 4.5 | 0.1 | - | - | - | - | - | 35.2 |
| Total | $M | 56.5 | 25.2 | 19.9 | 20.0 | 6.2 | 0.3 | 0.1 | (4.9) | 0.1 | 20.9 | (0.3) | 144.1 |
Notes: Numbers have been rounded and may not sum.
Principal capital costs include, but are not limited to the following items:
- Leach pad considers leak mitigation measures for Phase 2 as well as expansion costs for Phase 3A/3B and Phase 4. Includes CIC expansion costs.
- RT relocation considers the removal of a 3rd party owned and operated installation of radio towers to allow commencement of mining activities at the Radio Towers pit in 2028.
- Equipment lease represents lease payments regarding the lease and corresponding MARC contract encompassing a significant portion of the principal mining fleet (17 x 777G haul trucks and 04 x 992K FELs). As the equipment gradually comes off lease over the next 03-years, the equipment is planned to be purchased at a residual value cost and be owned and maintained by FCM.
- Salvage value represents a credit for estimated residual value related to related to mine, process and crushing and conveying equipment.
- Reclamation considers progressive and final closure costs related to both FCM and StdM.
- Other sustaining capex is comprised principally of production drill replacements (02 x drills) and parts and component repair capitalized items for the leased and owner equipment fleets. The remaining consists of miscellaneous capitalized items across all departments.
| 11 July 2024 |
| Florida Canyon Gold Mine | Page 209 |
| Florida Canyon Gold Inc. | NI 43-101 Technical Report |
21.2 Operating Costs
Operating costs have been estimated using average costs developed during the detailed 2024 Budget and LOM exercise undertaken by FCM. These costs were estimated using first principal estimates, where applicable, based upon the annual mine production schedule, equipment availability, utilization and equipment productivities. Principal reagent costs and contractor rates utilized have been based on current contract prices and agreements where available. Manpower requirements were estimated and included to provide the ability to execute the Budget and LOM plan. Although the mine plan developed for this Technical Report differs slightly from the 2024 Budget and LOM exercise, it is deemed adequate to use the developed average costs for this Report.
A summary of the estimated LOM operating costs is shown in Table 21-2. Estimated unit operating costs, plus the LOM average, are shown in Table 21-3.
Table 21-2: Operating Cost Summary
Description | Life-of-Mine ($M) | |||||||||||
2024 | 2025 | 2026 | 2027 | 2028 | 2029 | 2030 | 2031 | 2032 | 2033 | 2034+ | Total | |
Mining | 51.6 | 58.6 | 67.1 | 46.1 | 47.2 | 40.4 | 29.9 | - | - | - | - | 340.9 |
Crushing | 14.6 | 14.6 | 14.6 | 14.6 | 14.6 | 14.6 | 10.7 | - | - | - | - | 98.5 |
Processing | 21.4 | 19.6 | 22.5 | 20.1 | 18.5 | 16.0 | 17.2 | 3.0 | 1.5 | 0.2 | - | 139.9 |
G&A | 22.2 | 20.8 | 21.5 | 20.2 | 9.2 | 19.4 | 20.4 | 5.6 | 2.7 | 0.7 | - | 152.7 |
Refining | 0.5 | 0.5 | 0.5 | 0.5 | 0.4 | 0.4 | 0.5 | 0.1 | 0.0 | 0.0 | - | 3.5 |
Total | 110.3 | 114.1 | 126.2 | 101.5 | 100.0 | 90.9 | 78.7 | 8.7 | 4.2 | 0.9 | - | 735.5 |
1. Mining costs include capitalized stripping.
2. G&A costs include Nevada Gold & Silver Excise Tax, Nevada Net Proceeds Mining Tax as well as royalties.
3. Numbers have been rounded and may not sum.
Table 21-3: Unit Operating Cost Summary
Description | Life-of-Mine ($/ton processed) | |||||||||||
2024 | 2025 | 2026 | 2027 | 2028 | 2029 | 2030 | 2031 | 2032 | 2033 | 2034+ | Avg | |
Mining | 4.01 | 4.97 | 4.94 | 3.81 | 4.24 | 4.19 | 2.90 | - | - | - | - | 4.19 |
Crushing | 1.14 | 1.24 | 1.08 | 1.21 | 1.32 | 1.52 | 1.04 | - | - | - | - | 1.21 |
Processing | 1.66 | 1.66 | 1.66 | 1.66 | 1.66 | 1.66 | 1.66 | - | - | - | - | 1.72 |
G&A | 1.73 | 1.77 | 1.58 | 1.67 | 1.73 | 2.02 | 1.97 | - | - | - | - | 1.88 |
Refining | 0.04 | 0.04 | 0.04 | 0.04 | 0.04 | 0.05 | 0.04 | - | - | - | - | 0.04 |
Total | 8.57 | 9.68 | 9.29 | 8.39 | 8.99 | 9.43 | 7.61 | - | - | - | - | 9.03 |
1. Mining costs include capitalized stripping.
2. G&A costs include Nevada Gold & Silver Excise Tax, Nevada Net Proceeds Mining Tax as well as royalties.
3. Numbers have been rounded and may not sum.
21.3 QP Comments on Section 21 Capital and Operating Costs
GRE's QP, Ms. Terre Lane, MMSA QP, considers that the capital and operating costs developed upon the mine plan presented within this Technical Report are adequate and correctly represents the costs expected to be incurred by FCM.
| 11 July 2024 |
| Florida Canyon Gold Mine | Page 210 |
| Florida Canyon Gold Inc. | NI 43-101 Technical Report |
22.0 ECONOMIC ANALYSIS
22.1 Introduction
A financial analysis for FCM was developed by Argonaut and FCM using a discounted cash flow approach on a pre-tax and after-tax basis. The NPV was calculated from the cash flow generated by the project based on a discount rate of 5%. This has been undertaken for both a Base Case using expected metal prices and a Mineral Reserve Case at the Mineral Reserve gold price. A sensitivity analysis for the pre-tax Mineral Reserve Case to assess the impact of variations of the capital costs, operating costs, and the gold metal selling price was undertaken.
22.2 Methods, Assumptions, and Basis
The economic analysis was performed using the following assumptions and basis:
The financial analysis was performed on Proven and Probable Mineral Reserves as outlined in this report for the open pit mine.
The LOM NPV was determined on a pre-tax and after-tax basis with discounting to the start of 2024, which marks the first year in the current LOM.
Annual cash flows used for NPV calculations are assumed to be realized at year-end.
Base Case gold metal selling price is $2,200/oz for 2024, $2,150/oz for 2025/2026 and thereafter $1,900/oz for this economic analysis. Gold metal prices are elevated in the first 03-years to reflect current metal price trends with latter years reverting to slightly above the 03-year trailing average. Base case silver selling price is assumed as $20 per troy ounce. Note that silver is included in the financial model based on historical recovery of silver metal equivalent to 56% of gold production and does not form part of the Mineral Reserve declared in this report.
All costs and sales are presented in constant Q1-2024 US$, with no inflation or escalation factors considered.
All gold and silver sales are assumed to be in the same period as produced.
All related payments and disbursements incurred prior to year-end 2023 are considered as sunk costs.
Details of capital and operating costs are provided in Section 21 of this report.
Cash flows shown are post payment of royalty agreements (included in G&A).
G&A includes Nevada Gold and Silver Excise Tax as well as Nevada Net Proceeds of Mineral Tax.
A salvage value of $10.0 million has been included in the economic evaluation in relation to estimated remaining value for owner mine equipment, crushing and conveying infrastructure in addition to processing equipment.
Closure costs are included in the period incurred. A total of $37.8 million has been included for both progressive and final closure activities.
The financial analysis excludes working capital. An analysis of the current working capital was performed and the inclusion of the recovery of working capital at the end of LOM was insignificant and therefore not material in the analysis.
After-tax figures assume a combined income tax rate of 21% and an application of $61.3 million in carry forward losses.
After-tax results and royalty payments were provided by Argonaut. GRE has not verified this work.
| 11 July 2024 |
| Florida Canyon Gold Mine | Page 211 |
| Florida Canyon Gold Inc. | NI 43-101 Technical Report |
22.3 Base Case Financial Analysis Summary
A financial analysis for FCM was developed by Argonaut and FCM using a discounted cash flow approach on a pre-tax and after-tax basis. The NPV was calculated from the cash flow generated by the project based on a discount rate of 5%. The pre-tax base case financial model resulted in an undiscounted cash flow of $187M with an NPV 5% of $141M. On an after‑tax basis, the base case financial model resulted in an undiscounted cash flow of $169M with an NPV of $128M at a discount rate of 5%.
A summary of the base case financial analysis is presented in Table 22-1.
| 11 July 2024 |
| Florida Canyon Gold Mine | Page 212 |
| Florida Canyon Gold Inc. | NI 43-101 Technical Report |
Table 22-1: Financial Analysis Summary
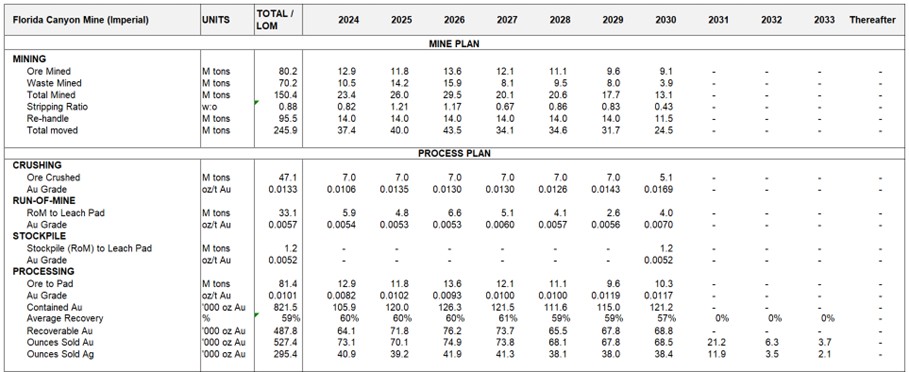
| 11 July 2024 |
| Florida Canyon Gold Mine | Page 213 |
| Florida Canyon Gold Inc. | NI 43-101 Technical Report |
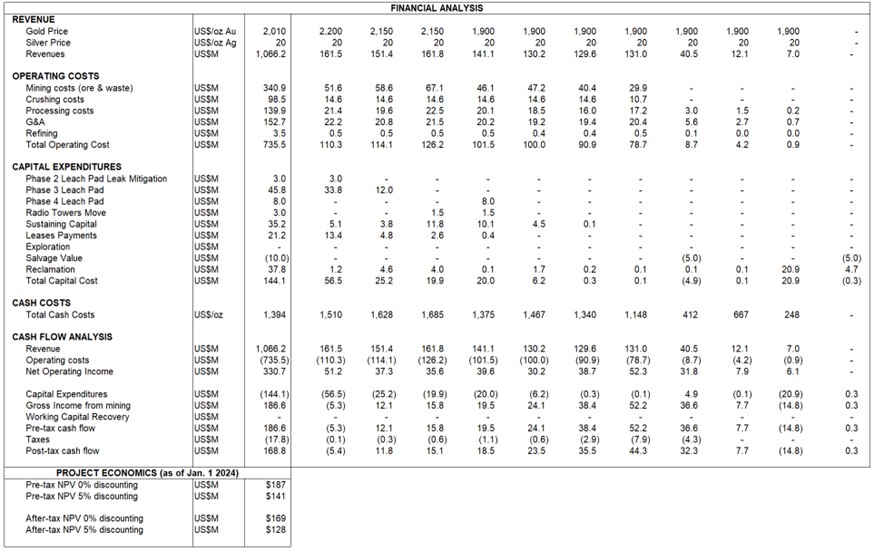
1. Mine operating costs for waste include capitalized stripping.
2. Ore tonnage, grade and ounces processed does not include those associated with leach pad inventory. Leach pad inventory declared in the Mineral Reserves is only represented as gold ounces sold within the financial analysis summary.
3. Numbers have been rounded and may not sum.
| 11 July 2024 |
| Florida Canyon Gold Mine | Page 214 |
| Florida Canyon Gold Inc. | NI 43-101 Technical Report |
22.4 Mineral Reserve Case Financial Analysis Summary
An economic analysis of FCM using the financial model adjusted for Mineral Reserve reporting gold metal prices declared in this report of $1,800 per ounce gold was undertaken (note that silver credits were removed as silver is not part of the declared Mineral Reserve). The pre-tax Mineral Reserve price financial model resulted in an undiscounted cash flow of $81M with an NPV of $50M at a discount rate of 5%. On an after-tax basis, the Mineral Reserve financial model resulted in an undiscounted cash flow of $78M with an NPV of $47M at a discount rate of 5%. The minimal change in value between pre-tax and aftertax cash flows is a result of the utilization of current and projected tax attributes.
22.4.1 Sensitivity Analysis
A financial sensitivity analysis was conducted on the pre-tax LOM Mineral Reserves Case cash flow NPV for variations in gold metal selling price and operational and capital expenditures. The results are presented in Table 22-2 and Figure 22-1.
Table 22-2: Sensitivity Analysis
Description | Sensitivities Pre-Tax NPV @5% | ||||||
| -30% | -20% | -10% | 0% | 10% | 20% | 30% |
Gold Price | (165) | (92) | (21) | 50 | 120 | 190 | 259 |
Mining Cost | 133 | 105 | 78 | 50 | 22 | (6) | (34) |
Process Cost | 108 | 89 | 70 | 50 | 31 | 11 | (8) |
G&A Cost | 69 | 63 | 56 | 50 | 44 | 38 | 32 |
Capex | 64 | 59 | 55 | 50 | 46 | 41 | 36 |
Figure 22-1: Sensitivity Analysis

| 11 July 2024 |
| Florida Canyon Gold Mine | Page 215 |
| Florida Canyon Gold Inc. | NI 43-101 Technical Report |
From the proceeding Table and Figure, it can be appreciated that although increases and / or decreases in operating and capital costs have material impacts on the resultant projected cash flow, the movement in gold price has the most significant impact on the economics of the project.
22.5 QP Comments on Section 22 Economic Analysis
GRE's QP, Terre Lane, MMSA QP, confirms that the outcome is a positive cash flow that supports the statement of Mineral Reserves.
| 11 July 2024 |
| Florida Canyon Gold Mine | Page 216 |
| Florida Canyon Gold Inc. | NI 43-101 Technical Report |
23.0 ADJACENT PROPERTIES
In 2021, Polar X acquired the Black Canyon property, located approximately 2 miles east of FCM. Mines located in the Black Canyon area were mined between 1865 and 1927 with ore being mined from high-grade epithermal quartz veins of various sizes, with associated epithermal alteration zones. The property is currently being explored.
The closest property to FCM, with modern mining, is the StdM located about 3 ½ miles south of FCM and part of the property position held by Argonaut. StdM started operation in 1939. It was operated intermittently as late as 2006. StdM is not in production and there are no current plans to re-open it.
The Rochester Mine is located about 25 miles south of FCM which has been producing silver by heap leaching since the early 1980s. Rochester is operated by Coeur Mining.
The Hycroft Mine is located about 50 miles west-northwest of FCM and produced gold by heap leaching for a number of years.
The Turquoise Ridge mine of Nevada Gold Mines is located 61 miles northeast and their Twin Creeks mine complex is located about 80 miles northeast of FCM.
Lone Tree of I-80 Gold Corp. is about 54 miles east-northeast of FCM.
The Marigold Mine of SSR Mining is about 55 miles east of FCM.
Information provided above has been obtained by FCM staff through the examination of BLM, State of Nevada, and Pershing County records.
| 11 July 2024 |
| Florida Canyon Gold Mine | Page 217 |
| Florida Canyon Gold Inc. | NI 43-101 Technical Report |
24.0 OTHER RELEVANT DATA AND INFORMATION
There is no additional information or explanation necessary to make the technical report understandable and not misleading.
| 11 July 2024 |
| Florida Canyon Gold Mine | Page 218 |
| Florida Canyon Gold Inc. | NI 43-101 Technical Report |
25.0 INTERPRETATION AND CONCLUSIONS
The QPs note the following interpretations and conclusions in their respective areas of expertise, based on the reviews and interpretations of data available for this Report.
25.1 Mineral Tenure, Royalties, Environmental Liabilities and Permitting
Mineral tenure held is valid and sufficient to support a declaration of Mineral Resources and Mineral Reserves.
To the extent known to the QPs, there are no other significant factors and risks that may affect access, title or right or ability to perform work on the Project that are not discussed in this Report.
25.2 Geology and Mineralization
The FCM mine and StdM are situated in northwestern Nevada within the Great Basin and Humboldt Range physiographic province. Rocks exposed in the region range in age from Cambrian to Holocene and comprise thick sequences of sedimentary, volcanic, intrusive, and metamorphic rocks in a complex structural environment. Rocks of the Rochester Rhyolite, Prida Formation, Natchez Pass Limestone, and Grass Valley Formation are exposed in the FCM area.
FCM is a large, relatively young epithermal gold deposit adjacent to an active geothermal system. The close spatial association with the geothermal system has led to a general belief that FCM is a hot spring-style, epithermal gold deposit.
Understanding the FCM deposit setting, lithologies, mineralization, and the geological, structural, and alteration controls on mineralization is sufficient to support the estimation of Mineral Resource and Mineral Reserves.
25.3 Exploration, Drilling and Analytical Data Collection in Support of Mineral Resource Estimation
The exploration programs completed to date are appropriate for the style of the deposits in the Project area.
FCMs drilling methods are acceptable for Mineral Resource and Mineral Reserve estimation.
The sample preparation, analysis, and security practices are acceptable, meet industry-standard practices at the time that they were undertaken, and are sufficient to support Mineral Resource and Mineral Reserve estimation.
FCM initiated QA/QC measures into their sample stream from 2020 to 2023. The QA/QC protocol became more comprehensive and detailed with progressive years. QA/QC submission rates meet industry-accepted standards during the Argonaut / FCM campaign. The QA/QC programs did not detect any material sample biases in the data reviewed that support Mineral Resource and Mineral Reserve estimation.
| 11 July 2024 |
| Florida Canyon Gold Mine | Page 219 |
| Florida Canyon Gold Inc. | NI 43-101 Technical Report |
The data verification programs concluded that the data collected from the Project adequately supported the geological interpretations and constituted a database of sufficient quality to support the use of the data in Mineral Resource and Mineral Reserve estimation.
25.4 Metallurgical Test Work
On site test work continues for production forecasting and includes existing ore types as well as potential future ore types. Additionally, test work has been undertaken at third-party laboratories for future ores with higher sulfide content.
Primary ores consisting of mainly oxide minerals have been shown to have gold recovery estimates of between 50% and 70%, while the ROM material recovers between 30% and 50%. The ROM recovery is sensitive to ore source and geological variation such as fault and silicification zones. Crushed ore is expected to yield 64% gold recovery after 3 years. ROM ore is expected to yield 53% recovery. The Radio Towers material has slightly lower expected recovery.
Good reconciliation between predicted gold recovery and actual recovery has been obtained.
Metallurgical test work on primary sulfide material in 2024 has shown that gold recovery in the high 80% range can be accomplished with standard flotation methods and a 10:1 concentration factor are seen with this result. This test work result is in line with previous historical tests performed by previous operators. Test work should continue to determine optimal flotation conditions and then a concentrate should be produced, and that concentrate should be tested for amenability to roasting and pressure oxidation, followed by leaching, to determine ultimate gold recovery from the concentrate.
25.5 Mineral Resource Estimations
The Mineral Resource estimation for the Project conforms to industry-accepted practices and is reported using the 2014 CIM Definition Standards.
Factors that may affect the estimate include: changes to long-term metal price assumptions; changes in local interpretations of oxide-sulfide boundary; changes to the density values applied to the mineralized zones; changes to geological shape and continuity assumptions; potential for unrecognized bias in the assay results from legacy drilling where there was limited documentation of the QA/QC procedures; changes to the input values used to generate the Au cut-off grade; changes to metallurgical recovery assumptions; changes in assumptions of marketability of final product; changes to the conceptual input assumptions for assumed open pit operations; variations in geotechnical, hydrogeological and mining assumptions; changes to environmental, permitting and social license assumptions.
25.6 Mineral Reserve Estimates
The Mineral Reserve estimation for the Project conforms to industry-accepted practices and is reported using the 2014 CIM Definition Standards.
Factors that may affect the estimate include: metal price assumptions; changes to the assumptions used to generate the gold cut-off grade; changes in local interpretations of mineralization geometry and continuity of mineralized zones; changes to geological and mineralization shapes, and oxide sulfide boundary assumptions; density and domain assignments; changes to geotechnical assumptions including pit slope angles; changes to hydrological and hydrogeological assumptions; changes to mining and metallurgical recovery assumptions; changes to the input and design parameter assumptions that pertain to the open pit shell constraining the estimates; assumptions as to the continued ability to access the site, retain mineral and surface rights titles, obtain and maintain environmental and other regulatory permits, and obtain the social license to operate.
| 11 July 2024 |
| Florida Canyon Gold Mine | Page 220 |
| Florida Canyon Gold Inc. | NI 43-101 Technical Report |
25.7 Mine Plan
Mining will be carried out using a conventional drill, blast, load, and haul surface mining method. Equipment is conventional for open pit operations.
A geotechnical model that characterizes the rock mass conditions, structural geology, and hydrogeology of the open pit area was developed. Recommended inter-ramp slope angles range from 36-42°. A total of 10 pit phases are planned, for an approximate seven-year mine life.
25.8 Metal Recovery Plan
Currently the main limitation impacting production is the lack of new pad space. The lower available area has limited the time under primary leaching, deferring some gold recovery to secondary cycle. Higher lift heights have been employed to help reduce this impact. A pad expansion is underway and is expected to improve the primary leach performance. Additionally, an expansion of the CIC circuit in conjunction with the pad expansion will allow more solution to be applied to the HLP and potentially increase the current overall gold recovery kinetics closer to design.
The potential treatment of transitional sulfides on the existing HLPs will require careful management specifically on the pH control side.
25.9 Infrastructure
FCM has been in production intermittently since 1986 and all of the infrastructure that is required to sustain production is in place. However, some infrastructure will need to be expanded or modified to complete the mine plan as scheduled in this Report.
25.10 Environmental, Permitting and Social Considerations
FCM has all permits in place to continue mine operations. Additional permits required for mine life extension are in progress to assure continuity of operation. Those are typically associated with the planned expansions of the SHLP. Final permitting is expected by the end of Q2-2024.
25.11 Markets and Contracts
Metal price provided by Argonaut for Mineral Resource and Mineral Reserve pricing was set at US$1,800/oz Au.
Gold output from the FCM operation is in the form of doré containing approximately 55% gold and 45% silver on average. Silver credits are received from the Refiner.
| 11 July 2024 |
| Florida Canyon Gold Mine | Page 221 |
| Florida Canyon Gold Inc. | NI 43-101 Technical Report |
To date, no penalty element charges have been incurred in the refining of the doré and none are currently expected to be incurred in the future.
25.12 Capital Cost Estimates
The capital cost estimate for the LOM is estimated as $144M and includes:
• Leach pad expansion costs, including CIC and pregnant solution pond expansions,
• Design development and quantity growth allowances, and
• Owner's costs
Total capital costs estimated are summarized in Table 25-1.
Table 25-1: Capital Cost Estimate
Description | Unit | Total |
Leach Pad | $M | 56.8 |
RT Relocation | $M | 3.0 |
Equipment Lease | $M | 21.2 |
Salvage Value | $M | (10.0) |
Reclamation | $M | 37.8 |
Other | $M | 35.2 |
Total | $M | 144.1 |
1. Numbers have been rounded and may not sum.
25.13 Operating Cost Estimates
The operating cost estimate for the LOM is estimated as $736M or $9.03/ton processed and is summarized in Table 25-2.
Table 25-2: Operating Cost Estimates
Description | Life-of-Mine ($M) | Life-of-Mine ($/ton processed) |
Mining | 340.9 | 4.19 |
Crushing | 98.5 | 1.21 |
Processing | 139.9 | 1.72 |
G&A | 152.7 | 1.88 |
Refining | 3.5 | 0.04 |
Total | 735.5 | 9.03 |
1. Mining costs include capitalized stripping costs.
2. G&A costs include Nevada Gold & Silver Excise Tax, Nevada Net Proceeds Mining Tax and royalties.
3. Numbers have been rounded and may not sum.
25.14 Economic Analysis
A financial analysis for FCM was developed by Argonaut and FCM personnel using a discounted cash flow approach on a pre-tax and after-tax basis. The NPV was calculated from the cash flow generated by FCM based on a discount rate of 5% utilizing gold metal selling prices of $2,200/oz for 2024, $2,150/oz for 2025/2026 and thereafter $1,900/oz. Gold metal prices are elevated in the first 03-years to reflect current metal price trends with latter years reverting to slightly above the 03-year trailing average. Silver metal selling price is assumed as $20/oz. Note that silver is included in the financial model based on historical recovery of silver metal equivalent to 56% of gold production and does not form part of the Mineral Reserve declared in this Report.
| 11 July 2024 |
| Florida Canyon Gold Mine | Page 222 |
| Florida Canyon Gold Inc. | NI 43-101 Technical Report |
The resultant pre-tax NPV 5% is $141 M, with an IRR of 257%, and a payback period is 1.44 years. On an after-tax basis, the NPV 5% is $128 M with an IRR of 246%, and the payback period is 1.46 years.
An economic analysis of FCM using the financial model adjusted for Mineral Reserve reporting metal prices declared in this report of $1,800 per ounce gold was undertaken (note that silver credits were removed as silver is not part of the declared Mineral Reserve).
The resultant pre-tax NPV 5% is $50 M, with an IRR of 22%. On an after-tax basis, the NPV 5% is $47 M with an IRR of 22%. The minimal change in value between pre-tax and after-tax cash flows is a result of the utilization of current and projected tax attributes.
Based on the Mineral Reserve financial analysis, on an NPV basis, FCM is most sensitive to changes in metal prices, and then to a lesser extent, to mining costs and processing costs. FCM is least sensitive to changes in the capital cost.
25.15 Conclusion
Under the assumptions in this Report, the Project shows a positive cash flow over the life-of-mine and supports the Mineral Resource and Mineral Reserve estimates. The projected mine plan is achievable under the set of assumptions and parameters used.
The sulfide component of Mineral Resources shows positive economic value. Historic and current metallurgical test work shows that an economic concentrate can be made from this material.
| 11 July 2024 |
| Florida Canyon Gold Mine | Page 223 |
| Florida Canyon Gold Inc. | NI 43-101 Technical Report |
26.0 RECOMMENDATIONS
26.1 Geology
Drilling campaigns reveal great potential across the Project area, but there is significant remaining exploration potential in the principal FCM deposit and environs. Exploration targets include feeder structures at depth and along strike. Due to limited legacy exploratory drilling along the Humboldt City Thrust between FCM and StdM, additional opportunities exist to discover and delineate along this structure. Still, deep drilling needs to test areas along feeder structures and fault terminals on the western side of FCM deposits, which are covered by alluvium.
Geological and structural data is to be collected during this drilling program (and future drilling programs) and should continue to be used to increase geological understanding of the spatial correlation between mineralization and geological structures and inform the resource modeling process.
Results of the exploration RC drilling program proposed will be used to identify potential future drilling targets which will lead to potential future exploration activities to expand knowledge of mineralization and potentially expand future Mineral Resources outside of known, exploited deposits. Estimated cost associated with the exploration RC drilling - $950,000.
Oxide mining operations at FCM in addition to a potential future sulfides project would benefit from better knowledge of the oxide-sulfide boundary. There could be more leach amenable material just below the currently interpreted oxide-sulfide boundary that are not actually sulfides. As a result, more drilling is recommended within the known FCM deposit area to improve definition of the oxide-sulfide boundary, and to collect samples for process metallurgical testing. A complete metallurgical testing program should be completed on the fresh oxide, transitional and sulphide material samples obtained during the program and be used to support improved understanding of relationships between cyanide assays and fire assays results in addition to the metallurgical response of sulphide material related to a potential future development of a sulfide project. Estimated cost associated with the drilling program and assaying and metallurgical testing work - $1,300,000.
26.2 Mining
FCM should review the re-implementation of the overland conveyor and grasshopper conveying system to minimize truck haulage hours and minimize ore re-handle. This review should result in a go, no-go decision regarding re-implementation of the system. Estimated cost associated with this review - $50,000.
Sulfide tonnage, grade, and process options should be evaluated in a timely manner such that if a sulfide operation is warranted. If results of options are positive, permit applications can be started in advance to assure a transition from oxide to sulfide operations without a major hiatus to production.
26.3 Metallurgy and Processing
Should transitional sulfide mineralization be treated on the existing HLPs, test work should be conducted to examine the gold recovery as well as the reagent consumption, specifically lime. It may also be important to understand the long-term stability of this material so that the heap does not become acid generating. This work could be conducted on site by the existing staff.
| 11 July 2024 |
| Florida Canyon Gold Mine | Page 224 |
| Florida Canyon Gold Inc. | NI 43-101 Technical Report |
Carbon testing and CIC modeling should be conducted to maximize gold recovery in the carbon circuit. This testing should also model carbon stripping and regeneration to determine if future bottlenecks will arise once the CIC expansion is completed. Estimated cost is $50,000.
Additional telemetry should be installed to allow operators to monitor remote equipment without traveling to the remote location. Some of the telemetry elements are still available onsite and need to be revived. A telemetry study would be necessary to determine what additional equipment is necessary to reestablish this network. This study, which would lead to a decision as to the feasibility and cost required to expand the telemetry system is estimated to cost $50,000. If a positive decision is made to expand the system, this cost may be absorbed by the vendor in exchange for providing the equipment and installation services for the upgraded / expanded telemetry system.
26.4 Environmental Studies
A new Environmental Management System (EMS) should be considered for implementation. Currently, FCM operates in compliance utilizing a system of plans and permitting requirements, with data collected to series of spreadsheets making both data and information difficult to query. However, a true EMS which includes training, data management and permit obligations charts would provide much clearer and quicker access to information. Field tablets should be incorporated to assist with data collection for the EMS. The estimated cost is $130,000.
A site weather station should be considered for implementation. Currently, FCM operates with several smaller portable weather reporting units that are cloud based and have no provision for downloading data. Being cloud based, this results in data loss occurring whenever internet service is lost. The estimated cost of installation of a fixed weather station at site is $20,000.
An auto sampling unit which would help with collecting the data during well sampling should be considered. The estimated cost is $2,000.
| 11 July 2024 |
| Florida Canyon Gold Mine | Page 225 |
| Florida Canyon Gold Inc. | NI 43-101 Technical Report |
27.0 REFERENCES
AMEC. 2014. Florida Canyon Gold Mine Expansion Amended Plan of Operations (APO-20). 2014.
ASW. 2013. The Florida Canyon Gold Mine PoO Amendment #20 (APO 20) Revision 5. April 9,. 2013.
Barr. 2021. Central Pit 1 and Main Pit 1B Kinematic Stability Analysis (21 July). 2021.
-. 2022. Radio Tower Pit Kinematic Stability Analysis (4 October). 2022.
BLM. 2014. Florida Canyon Mining, Inc. South Expansion Project Environmental Assessment DOIBLM-NV-W010-2013-0061-EA. August 2014. 2014.
Byington, C. B. 1996. A Structural Analysis and Identification of Ore Controls at the Florida Canyon Gold Mine. s.l. : FCMI Internal Report, 1996.
CIM. 2014. Canadian Institute of Mining, Metallurgy and Petroleum Standards on Mineral. 2014.
Fifarek, R. H., Samal, A. R. and Miggins, D. P. 2011. Genetic Implications of Mineralization and Alteration Ages at Florida Canyon Epithermal Au-Ag Deposit, Nevada. 2011. pp. 863-878.
Golder. 2018. Florida Canyon Mine 2018 Geotehnical Review of Additional Geotechnical Data for the South Wall of the Central Pit (22 January). 2018.
-. 2016. Review of Geotechnical Conditions of the Central Pit and Radio Tower Pits, Florida Canyon Mine, Pershing County, Nevada (02 September). 2016.
Hastings, J. S., Burkhart, T. H. and Richardson, R. E. 1987. Geology of the Florida Canyon Gold Deposit, Pershing County, Nevada. [ed.] E. Struhsacker. Gold and Silver Deposits of Western Nevada. 1993 Fall Field Trip Guidebook, 1987, Special Publication No. 18 (Geological Society of Nevada).
IMC. 2020. NI 43-101 Technical Report Mineral Resource and Mineral Reserves for the Florida Canyon Gold Mine, Pershing County, Nevada, USA. 2020.
Johnson, M. G. 1977. Geology and Mineral Deposits of Pershing County, Nevada, Nevada Bureau. 1977.
Keech, C. 2017. Mineral Resource Estimate for Florida Canyon Gold Project, Nevada, Internal Memorandum for Rye Patch Gold Corporation. 2017.
MDA. 2017. Amended Technical Report -Preliminary Economic Assessment for the Florida Canyon Mine, Pershing County, Nevada, USA. 2017.
NDEP. 2016. Florida Canyon Gold Mine WPC Permit NEV0086001 (Renewal 2016, Fact Sheet. 2016.
Piésold, Knight. 2013. The Florida Canyon Gold Mine - Heap Leach Facility Final Permanent. 2013.
Rowan, L. C. and Wetlaufer, P. H. 1981. Geologic Evaluation of Major Landsat Lineaments in Nevada and their Relationship to Ore Districts. s.l. : U.S. Geological Survey, Open File 79-544, 1981.
| 11 July 2024 |
| Florida Canyon Gold Mine | Page 226 |
| Florida Canyon Gold Inc. | NI 43-101 Technical Report |
SRK. 2019. NI 43-101 Technical Report Life of Mine Plan and Mineral Reserves for the Florida Canyon Gold Mine, Pershing County, Nevada, USA. 2019.
—. 2017. Overview of SRK's 2017 Life of Mine Plan for the Florida Canyon Mine. Internal Report. 2017.
Taylor, J. D. 2001. Apollo Gold Inc. Ore Reserves as of December 31, 2000, AGI International Report. 2001.
Taylor, J. D. et al. 2002. Florida Canyon Estimate of Oxide Reserves and Mineralization Using Statistical Grade Domains as of December 31, 2001, Apollo Gold Corporation internal report. 2002.
| 11 July 2024 |
| Florida Canyon Gold Mine | Page 227 |
| Florida Canyon Gold Inc. | NI 43-101 Technical Report |
CERTIFICATE OF QUALIFIED PERSON
| 11 July 2024 |
| Florida Canyon Gold Mine | Page 228 |
| Florida Canyon Gold Inc. | NI 43-101 Technical Report |
| 11 July 2024 |
| Florida Canyon Gold Mine | Page 229 |
| Florida Canyon Gold Inc. | NI 43-101 Technical Report |
CERTIFICATE OF QUALIFIED PERSON

| 11 July 2024 |
| Florida Canyon Gold Mine | Page 230 |
| Florida Canyon Gold Inc. | NI 43-101 Technical Report |
| 11 July 2024 |
| Florida Canyon Gold Mine | Page 231 |
| Florida Canyon Gold Inc. | NI 43-101 Technical Report |
CERTIFICATE OF QUALIFIED PERSON
| 11 July 2024 |
| Florida Canyon Gold Mine | Page 232 |
| Florida Canyon Gold Inc. | NI 43-101 Technical Report |

| 11 July 2024 |
| Florida Canyon Gold Mine | Page 233 |
| Florida Canyon Gold Inc. | NI 43-101 Technical Report |
CERTIFICATE OF QUALIFIED PERSON
| 11 July 2024 |