UNITED STATES
SECURITIES AND EXCHANGE COMMISSION
Washington, D.C. 20549
FORM N-CSR
CERTIFIED SHAREHOLDER REPORT OF REGISTERED
MANAGEMENT INVESTMENT COMPANIES
Investment Company Act File Number 811- 23312
Impact Shares Trust I
(Exact name of registrant as specified in charter)
2189 Broken Bend
Frisco, Texas 75034
(Address of principal executive offices)
Ethan Powell
2189 Broken Bend
Frisco, Texas 75034
(Name and address of agent for service)
COPY TO:
Brian McCabe
Ropes & Gray LLP
Prudential Tower
800 Boylston Street
Boston, Massachusetts 02199-3600
(Name and address of agent for service)
Registrant’s telephone number, including area code: 1-469-442-8424
Date of fiscal year end: June 30, 2020
Date of reporting period: June 30, 2020
| Item 1. | Reports to Stockholders. |
A copy of the report transmitted to stockholders pursuant to Rule 30e-1 under the Investment Company Act of 1940, as amended (the “1940 Act”) (17 CFR § 270.30e-1), is attached hereto.

IMPACT SHARES TRUST I
Impact Shares YWCA Women’s Empowerment ETF
Impact Shares NAACP Minority Empowerment ETF
Impact Shares Sustainable Development Goals Global Equity ETF
Annual Report
June 30, 2020
Beginning on January 1, 2021, as permitted by regulations adopted by the Securities and Exchange Commission, paper copies of the Funds’ shareholder reports like this one will no longer be sent by mail, unless you specifically request paper copies of the reports from your financial intermediary, such as a broker-dealer or bank. Instead, the reports will be made available on a website, and you will be notified by mail each time a report is posted and provided with a website link to access the report.
If you already elected to receive shareholder reports electronically, you will not be affected by this change and you need not take any action. You may elect to receive shareholder reports and other communications from your financial intermediary electronically by going to www.impactetfs.org.
You may elect to receive all future reports in paper free of charge. You can inform your financial intermediary that you wish to continue receiving paper copies of your shareholder reports by contacting your financial intermediary. Your election to receive reports in paper will apply to all funds held with Impact Shares, Corp.
Impact Shares Trust I
Table of Contents
Each Fund files its complete schedule of Fund holdings with the Securities and Exchange Commission (the “Commission”) for the first and third quarters of each fiscal year or as an exhibit to its reports on Form N-PORT. The Fund’s Form N-PORT is available on the Commission’s website at http://www.sec.gov.
A description of the policies and procedures that Impact Shares, Corp. uses to determine how to vote proxies relating to Fund securities, as well as information relating to how a Fund voted proxies relating to Fund securities during the most recent 12-month period ended June 30, is available (i) without charge, upon request, by calling 1-844-448-3383; and (ii) on the Commission’s website at http://www.sec.gov.
Impact Shares Trust I
Letter to Shareholders
June 30, 2020 (Unaudited)
Dear Impact Shares Funds Shareholder:
At Impact Shares we invest in change. We help social advocacy organizations, our Impact Partners, translate their social values into an index which our funds seek to track, each fund is an investable product that is traded on the NYSE ARCA. Investing in our ETFs means committing to an index that reflects a set of criteria, defined by our Impact Partners, to promote ongoing engagement with the private sector improving corporate behavior relative to our Impact Partners’ goals and expectations.
The indices which our ETFs seek to track are designed to exhibit risk and return characteristics similar to a broad equity market, while identifying specific large and mid- capitalization companies that display business practices and attributes reflective of social issues important to the respective Impact Partner. Generally, only the top scoring companies relative to the underlying index’s social criteria make it into the portfolio of approximately two hundred stocks. The Impact Partners work to educate and engage companies, investors and the general public on the effect and importance of the social metrics at issue. Thus, we strive to create improved social outcomes through our collaborations with these leading advocacy organizations. The rules-based strategies are intended to give corporations a road map to follow in order to be recognized as leaders in each respective cause and, at the same time, investors can feel confident that their capital will strive to allow a fund’s Impact Partner to actively advance its respective social issues.
By bringing together social advocacy organizations and the private sector, the funds intend to provide a vehicle for the Impact Partners to amplify and advance their respective missions in the private sector and help to advance society’s goals relative to specific social issues, using these social criteria as a common language.
Thank you for using your capital to make a difference and for choosing Impact Shares. We appreciate your support and are always here to answer your questions.
This letter contains the manager’s opinion. It should not be regarded as investment advice or recommendation of specific securities. Past performance is no guarantee of future results.
There are risks involved with investing, including possible loss of principal. There is no guarantee the Funds will achieve their objectives.
The performance data quoted represents past performance. Past performance does not guarantee future results. The investment return and principal value of an investment will fluctuate so that an investor’s shares when redeemed may be worth more or less than their original cost, and current performance may be lower or higher than the performance data quoted. For performance data current to the most recent month-end, please go to our website at www.impactetfs.org.
To determine if the Funds are appropriate investments for you, carefully consider the funds’ investment objectives, risk, and charges and expenses. This and other information can be found in the funds’ prospectuses, and if available, the summary prospectuses, which can be obtained by visiting www.impactetfs.org. Please read the prospectus, and if available, the summary prospectus, carefully before investing.
1
Impact Shares Trust I
Definition of the Comparative Indices
June 30, 2020 (Unaudited)
The Morningstar Large Cap Blend consists of stocks in the top 70% of the capitalization of the U.S. equity market that are defined as large-cap. The blend style is assigned to portfolios where neither growth nor value characteristics predominate.
The Morningstar Minority Empowerment Index is designed to measure the performance of large and mid-capitalization companies that are “empowering to minorities,” and to exhibit risk and return characteristics similar to those of the Morningstar US Large-Mid Cap Index.
The Morningstar US Large-Mid Cap® Index measures the performance of the U.S. equity market targeting the top 90% of stocks by market capitalization. One cannot invest directly in an index.
The Lipper Large-Cap Core Universe consists of funds that, by portfolio practice, invest at least 75% of their equity assets in companies with market capitalizations (on a three-year weighted basis) greater than 300% of the dollar-weighted median market capitalization of the middle 1,000 securities of the S&P SuperComposite 1500 Index. Large-cap growth funds typically have an above-average price-to-earnings ratio, price-to-book ratio, and three-year sales-per-share growth value, compared to the S&P 500 Index.
The Morningstar Women’s Empowerment Index is designed to measure the performance of U.S. large and mid- capitalization companies that are “empowering to women,” and to exhibit risk and return characteristics similar to those of the Morningstar US Large-Mid Cap Index.
The Morningstar Societal Development Index is designed to measure the performance of large and mid-capitalization companies globally that (i) display a commitment to the UN’s Sustainable Development Goals, (ii) adhere to the principles of the UN Global Compact, (iii) display a commitment to reducing poverty and supporting economic development globally and (iv) have exposure to countries with low levels of socioeconomic development.
The Morningstar® Global Markets Large-Mid Index is a free-float market-cap weighted index composed of the equity securities of publicly-traded companies encompassing the top 97% of stocks by market capitalization across 46 countries including both developed and emerging markets.
The Lipper Global Large-Cap Core Universe consists of funds that, by portfolio practice, invest at least 75% of their equity assets in companies both inside and outside of the U.S. with market capitalizations (on a three-year weighted basis) greater than 400% of the 75th market capitalization percentile of the S&P/Citigroup World Broad Market Index. Large-cap core funds typically have an average price-to-cash flow ratio, price-to-book ratio, and three-year sales-per-share growth value compared to the S&P/Citigroup World BMI.
2
Impact Shares Trust I
Management Discussion of Fund Performance
June 30, 2020 (Unaudited)
WOMN
The Impact Shares YWCA Women’s Empowerment ETF (the “Fund”) seeks to provide investment results that, before fees and expenses, track the performance of the Morningstar® Women’s Empowerment Index that is designed to measure the performance of U.S. large and mid-capitalization companies that are “empowering to women,” and to exhibit risk and return characteristics similar to those of the Morningstar US Large-Mid Cap® Index. The Fund’s benchmark is the Morningstar Women’s Empowerment Index (the “Index”). From June 30, 2019 through June 30, 2020 (the “Reporting Period”), the total return for the Fund was 11.92%, and the return for the Index was 8.71%. In comparison to the Fund’s performance, the Lipper Large-Cap Core Universe was 5.16%, the Morningstar US Large-Mid Cap® Index (the “Parent Index”) was 7.50% and the Morningstar Large Cap Blend was 3.74%.
The trailing twelve months ending 2020 was defined by the COVID-19 global pandemic and extreme rates of change, as central banks around the world moved rapidly to contain the fallout. We believe echoes of this pandemic will reverberate in our society, economies, and markets for years to come. The pandemic’s economic fallout disproportionately impacted women and communities of color, this along with stark public reminders of America’s racial divide provided an opportunity for the private sector to demonstrate their commitment to non-equity stakeholders. The Private sector including many of our holdings responded in various ways to demonstrate solidarity towards communities of color.
The Fund outperformed the broad Lipper Large-Cap Core Universe and Morningstar Large Cap Blend, with the removal of fossil fuel sectors and replacement with alternative energy being a top contributor. The Fund has a quality and large cap bias which positively contributed to performance over the Reporting Period. On an individual security level, the top positive contributors to the Fund’s performance during the Reporting Period were dominated by high growth technology companies Apple Inc., Microsoft Corp and Amazon. The top negative contributors to the Fund’s performance during the Reporting Period were Wells Fargo, Medtronic and media and theme park operator Walt Disney.
This letter contains the manager’s opinion. It should not be regarded as investment advice or recommendation of specific securities. Past performance is no guarantee of future results.
There are risks involved with investing, including possible loss of principal. There is no guarantee the Funds will achieve their objectives.
3
Impact Shares Trust I
Management Discussion of Fund Performance
June 30, 2020 (Unaudited)
Growth of a $10,000 Investment
(at Net Asset Value)
| | | | | | | | | | |
| | | AVERAGE TOTAL RETURN FOR THE YEAR
ENDED JUNE 30, 2020 |
| | ONE YEAR
RETURN | | ANNUALIZED
INCEPTION TO
DATE* |
| | Net Asset
Value | | Market
Price | | Net Asset
Value | | Market
Price | | |
Impact Shares YWCA Women’s Empowerment ETF | | 11.92% | | 11.78% | | 8.94% | | 8.84% | | |
Morningstar Women’s Empowerment Index | | 8.71% | | 8.71% | | 6.78% | | 6.78% | | |
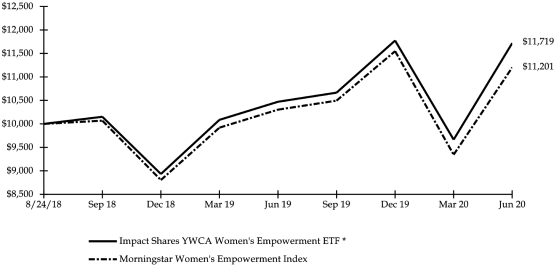
* Fund commenced operations on August 24, 2018.
The performance data quoted herein represents past performance and the return and value of an investment in the Fund will fluctuate so that shares, when redeemed or sold in the market, may be worth more or less than their original cost. Past performance is no guarantee of future performance and should not be considered as a representation of the future results of the Fund. The Fund’s performance assumes the reinvestment of all dividends and all capital gains. Index returns assume reinvestment of dividends and, unlike a Fund’s returns, do not reflect any fees or expenses. If such fees and expenses were included in the index returns, the performance would have been lower. Please note that one cannot invest directly in an unmanaged index.
Current performance may be lower or higher than the performance data shown above.
There are no assurances that the Fund will meet its stated objectives.
The Fund’s holdings and allocations are subject to change and should not be considered recommendations to buy individual securities.
Returns shown do not reflect the deduction of taxes that a shareholder would pay on Fund distributions or the redemption of Fund shares.
See definition of comparative index in Management Discussion of Fund Performance on page 2.
4
Impact Shares Trust I
Management Discussion of Fund Performance
June 30, 2020 (Unaudited)
NACP
The Impact Shares NAACP Minority Empowerment ETF (the “Fund”) seeks to provide investment results that, before fees and expenses, track the performance of the Morningstar Minority Empowerment Index that is designed to measure the performance of large and mid-capitalization companies that are “empowering to communities of color,” and to exhibit risk and return characteristics similar to those of the Morningstar US Large-Mid Cap® Index. The Fund’s benchmark is the Morningstar Minority Empowerment Index (the “Index”). From June 30, 2019 through June 30, 2020 (the “Reporting Period”), the total return for the Fund was 10.71%, and the return for the Index was 5.27%. In comparison to the Fund’s performance, the Lipper Large-Cap Core Universe was 5.16%, the Morningstar US Large-Mid Cap® Index (the “Parent Index”) was 7.50% and the Morningstar Large Cap Blend was 3.74%.
The trailing twelve months ending 2020 was defined by the COVID-19 global pandemic and extreme rates of change, as central banks around the world moved rapidly to contain the fallout. We believe echoes of this pandemic will reverberate in our society, economies, and markets for years to come. The pandemic’s economic fallout disproportionately impacted women and communities of color, this along with stark public reminders of America’s racial divide provided an opportunity for the private sector to demonstrate their commitment to non-equity stakeholders. The Private sector including many of our holdings responded in various ways to demonstrate solidarity towards communities of color.
The Fund outperformed the broad Lipper Large-Cap Core Universe and the Morningstar Large Cap Blend, with the removal of fossil fuel sectors and replacement with alternative energy being a top contributor. The Fund has a quality and large cap bias which positively contributed to performance over the Reporting Period. On an individual security level, the top positive contributors to the Fund’s performance during the Reporting Period were dominated by high growth technology companies Apple Inc., Microsoft Corp and Amazon. The top negative contributors to the Fund’s performance during the Reporting Period were large banks Wells Fargo and JP Morgan along with media and theme park operator Walt Disney.
This letter contains the manager’s opinion. It should not be regarded as investment advice or recommendation of specific securities. Past performance is no guarantee of future results.
There are risks involved with investing, including possible loss of principal. There is no guarantee the Funds will achieve their objectives.
5
Impact Shares Trust I
Management Discussion of Fund Performance
June 30, 2020 (Unaudited)
Growth of a $10,000 Investment
(at Net Asset Value)
| | | | | | | | |
| | | AVERAGE TOTAL RETURN FOR THE YEAR
ENDED JUNE 30, 2020 |
| | ONE YEAR
RETURN | | ANNUALIZED INCEPTION TO DATE* |
| | Net Asset Value | | Market Price | | Net Asset Value | | Market Price |
Impact Shares NAACP Minority Empowerment ETF | | 10.71% | | 11.26% | | 9.26% | | 9.41% |
Morningstar Minority Empowerment Index | | 5.27% | | 5.27% | | 6.50% | | 6.50% |

* Fund commenced operations on July 18, 2018.
The performance data quoted herein represents past performance and the return and value of an investment in the Fund will fluctuate so that shares, when redeemed or sold in the market, may be worth more or less than their original cost. Past performance is no guarantee of future performance and should not be considered as a representation of the future results of the Fund. The Fund’s performance assumes the reinvestment of all dividends and all capital gains. Index returns assume reinvestment of dividends and, unlike a Fund’s returns, do not reflect any fees or expenses. If such fees and expenses were included in the index returns, the performance would have been lower. Please note that one cannot invest directly in an unmanaged index.
Current performance may be lower or higher than the performance data shown above.
There are no assurances that the Fund will meet its stated objectives.
The Fund’s holdings and allocations are subject to change and should not be considered recommendations to buy individual securities.
Returns shown do not reflect the deduction of taxes that a shareholder would pay on Fund distributions or the redemption of Fund shares.
See definition of comparative index in Management Discussion of Fund Performance on page 2.
6
Impact Shares Trust I
Management Discussion of Fund Performance
June 30, 2020 (Unaudited)
SDGA
The Impact Shares Sustainable Development Goals Global Equity ETF (the “Fund”) seeks investment results that, before fees and expenses, track the performance of the Morningstar® Societal Development Index that is designed to measure the performance of large and mid-capitalization companies globally that (i) display a commitment to the UN’s Sustainable Development Goals, (ii) adhere to the principles of the UN Global Compact, (iii) display a commitment to reducing poverty and supporting economic development globally and (iv) have exposure to countries with low levels of socioeconomic development. The Fund’s benchmark is the Morningstar Societal Development Index (the “Index”). From June 30, 2019 through June 30, 2020 (the “Reporting Period”), the total return for the Fund was -1.75%, and the return for the Index was -6.23%. In comparison to the Fund’s performance, the Morningstar® Global Markets Large-Mid Index (the “Parent Index”) was 2.44%, and the Lipper Global Large-Cap Core Universe Classification was -6.30%.
The trailing twelve months ending 2020 was defined by the COVID-19 global pandemic and extreme rates of change, as central banks around the world moved rapidly to contain the fallout. We believe echoes of this pandemic will reverberate in our society, economies, and markets for years to come. The pandemic’s economic fallout disproportionately impacted emerging economies demonstrating the disparity between developed market health infrastructures. The Private sector including many of our holdings responded in various ways to demonstrate commitments to emerging economies including retrofitting manufacturing facilities to produce respiratory equipment and personal protective equipment.
The Fund outperformed the broad Lipper Global Large-Cap Core Universe, with security selection in the Consumer Cyclical and Consumer Defensive sectors being a top contributors. The Fund has a quality and large cap bias which positively contributed to performance over the Reporting Period. On an individual security level, the top positive contributors to the Fund’s performance during the Reporting Period were Roche, Newmont Corp and Microsoft. The top negative contributors to the Fund’s performance during the Reporting Period were large banks Wells Fargo and JP Morgan along with media and theme park operator Walt Disney.
This letter contains the manager’s opinion. It should not be regarded as investment advice or recommendation of specific securities. Past performance is no guarantee of future results.
There are risks involved with investing, including possible loss of principal. There is no guarantee the Funds will achieve their objectives.
7
Impact Shares Trust I
Management Discussion of Fund Performance
June 30, 2020 (Unaudited)
Growth of a $10,000 Investment
(at Net Asset Value)
| | | | | | | | |
| | | AVERAGE TOTAL RETURN FOR THE YEAR
ENDED JUNE 30, 2020 |
| | ONE YEAR
RETURN | | ANNUALIZED INCEPTION TO DATE* |
| | Net Asset Value | | Market Price | | Net Asset Value | | Market Price |
Impact Shares Sustainable Development Goals Global Equity ETF | | -1.75% | | -2.47% | | 1.59% | | 1.44% |
Morningstar Societal Development Index | | -6.23% | | -6.23% | | -1.09% | | -1.09% |
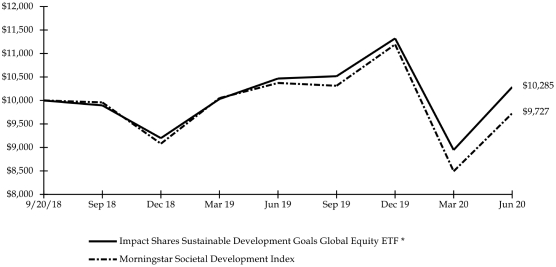
* Fund commenced operations on September 20, 2018.
The performance data quoted herein represents past performance and the return and value of an investment in the Fund will fluctuate so that shares, when redeemed or sold in the market, may be worth more or less than their original cost. Past performance is no guarantee of future performance and should not be considered as a representation of the future results of the Fund. The Fund’s performance assumes the reinvestment of all dividends and all capital gains. Index returns assume reinvestment of dividends and, unlike a Fund’s returns, do not reflect any fees or expenses. If such fees and expenses were included in the index returns, the performance would have been lower. Please note that one cannot invest directly in an unmanaged index.
Current performance may be lower or higher than the performance data shown above.
There are no assurances that the Fund will meet its stated objectives.
The Fund’s holdings and allocations are subject to change and should not be considered recommendations to buy individual securities.
Returns shown do not reflect the deduction of taxes that a shareholder would pay on Fund distributions or the redemption of Fund shares.
See definition of comparative index in Management Discussion of Fund Performance on page 2.
8
Impact Shares YWCA Women’s Empowerment ETF
Schedule of Investments
June 30, 2020
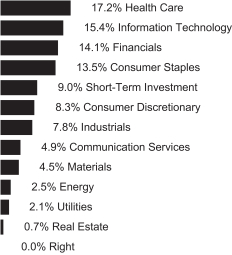
Sector Weightings (Unaudited)†:
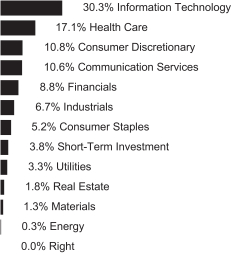
† Percentages based on total investments.
| | | | | | | | |
| Description | | Shares | | | Fair Value | |
| | |
COMMON STOCK†† — 96.2% | | | | | | | | |
| | |
Communication Services— 10.6% | | | | | | | | |
Alphabet, Cl A* | | | 108 | | | $ | 153,149 | |
Alphabet, Cl C* | | | 107 | | | | 151,256 | |
AT&T | | | 4,209 | | | | 127,238 | |
CenturyLink | | | 122 | | | | 1,224 | |
Comcast, Cl A | | | 2,507 | | | | 97,723 | |
Interpublic Group | | | 218 | | | | 3,741 | |
T-Mobile US* | | | 35 | | | | 3,645 | |
Verizon Communications | | | 2,425 | | | | 133,690 | |
Walt Disney* | | | 1,041 | | | | 116,082 | |
| | | | | | | | |
| | | | | | | 787,748 | |
| | | | | | | | |
| | |
Consumer Discretionary— 10.8% | | | | | | | | |
Amazon.com* | | | 141 | | | | 388,994 | |
Autoliv* | | | 49 | | | | 3,161 | |
Best Buy | | | 127 | | | | 11,083 | |
Dunkin’ Brands Group* | | | 44 | | | | 2,870 | |
eBay | | | 450 | | | | 23,602 | |
Expedia Group* | | | 78 | | | | 6,412 | |
Gap | | | 115 | | | | 1,451 | |
General Motors* | | | 770 | | | | 19,481 | |
Hasbro | | | 74 | | | | 5,546 | |
Hilton Worldwide Holdings* | | | 163 | | | | 11,973 | |
Kohl’s* | | | 97 | | | | 2,015 | |
Lululemon Athletica* | | | 60 | | | | 18,721 | |
Marriott International, Cl A* | | | 160 | | | | 13,717 | |
McDonald’s | | | 406 | | | | 74,895 | |
NIKE, Cl B | | | 705 | | | | 69,125 | |
Nordstrom* | | | 60 | | | | 929 | |
PVH* | | | 45 | | | | 2,162 | |
Royal Caribbean Cruises* | | | 94 | | | | 4,728 | |
Starbucks | | | 658 | | | | 48,422 | |
Tapestry* | | | 154 | | | | 2,045 | |
Target | | | 302 | | | | 36,219 | |
Tiffany | | | 62 | | | | 7,560 | |
TJX* | | | 669 | | | | 33,825 | |
VF | | | 192 | | | | 11,701 | |
| | | | | | | | |
| | | | | | | 800,637 | |
| | | | | | | | |
| | | | | | | | |
| Description | | Shares | | | Fair Value | |
| | |
Consumer Staples— 5.2% | | | | | | | | |
Brown-Forman, Cl A | | | 2 | | | $ | 115 | |
Brown-Forman, Cl B | | | 7 | | | | 446 | |
Campbell Soup | | | 97 | | | | 4,814 | |
Church & Dwight | | | 138 | | | | 10,667 | |
Clorox | | | 70 | | | | 15,356 | |
Coca-Cola | | | 190 | | | | 8,489 | |
Colgate-Palmolive | | | 475 | | | | 34,799 | |
Conagra Brands | | | 293 | | | | 10,305 | |
Estee Lauder, Cl A* | | | 122 | | | | 23,019 | |
Hershey | | | 83 | | | | 10,758 | |
JM Smucker | | | 65 | | | | 6,878 | |
Kellogg | | | 137 | | | | 9,050 | |
Kimberly-Clark | | | 190 | | | | 26,857 | |
Kroger | | | 463 | | | | 15,673 | |
Molson Coors Beverage, Cl B* | | | 9 | | | | 309 | |
PepsiCo | | | 70 | | | | 9,258 | |
Procter & Gamble | | | 1,425 | | | | 170,387 | |
Tyson Foods, Cl A | | | 166 | | | | 9,912 | |
Walgreens Boots Alliance | | | 383 | | | | 16,235 | |
| | | | | | | | |
| | | | | | | 383,327 | |
| | | | | | | | |
| | |
Energy— 0.3% | | | | | | | | |
Chevron | | | 104 | | | | 9,280 | |
ConocoPhillips | | | 58 | | | | 2,437 | |
Exxon Mobil | | | 231 | | | | 10,330 | |
Marathon Oil* | | | 39 | | | | 239 | |
| | | | | | | | |
| | | | | | | 22,286 | |
| | | | | | | | |
| | |
Financials— 8.8% | | | | | | | | |
Aflac | | | 381 | | | | 13,728 | |
Allstate | | | 181 | | | | 17,555 | |
Ally Financial | | | 223 | | | | 4,422 | |
American Express | | | 374 | | | | 35,605 | |
American International Group | | | 501 | | | | 15,621 | |
Ameriprise Financial | | | 73 | | | | 10,953 | |
Bank of New York Mellon | | | 484 | | | | 18,707 | |
BlackRock, Cl A | | | 67 | | | | 36,454 | |
Capital One Financial | | | 269 | | | | 16,837 | |
Citigroup | | | 1,229 | | | | 62,802 | |
Comerica | | | 86 | | | | 3,277 | |
Discover Financial Services | | | 185 | | | | 9,266 | |
Fifth Third Bancorp | | | 425 | | | | 8,194 | |
First Republic Bank | | | 91 | | | | 9,645 | |
Hannon Armstrong Sustainable Infrastructure Capital‡ | | | 1,608 | | | | 45,764 | |
Hartford Financial Services Group | | | 210 | | | | 8,096 | |
Huntington Bancshares | | | 622 | | | | 5,620 | |
KeyCorp | | | 585 | | | | 7,125 | |
M&T Bank | | | 75 | | | | 7,798 | |
MetLife | | | 402 | | | | 14,681 | |
Moody’s | | | 91 | | | | 25,000 | |
Northern Trust | | | 121 | | | | 9,600 | |
PNC Financial Services Group | | | 435 | | | | 45,766 | |
Primerica | | | 24 | | | | 2,798 | |
Principal Financial Group | | | 146 | | | | 6,065 | |
Progressive | | | 318 | | | | 25,475 | |
Prudential Financial | | | 229 | | | | 13,946 | |
S&P Global | | | 131 | | | | 43,162 | |
State Street | | | 353 | | | | 22,433 | |
T Rowe Price Group | | | 128 | | | | 15,808 | |
US Bancorp | | | 864 | | | | 31,812 | |
Voya Financial | | | 77 | | | | 3,592 | |
Wells Fargo | | | 2,265 | | | | 57,984 | |
| | | | | | | | |
| | | | | | | 655,591 | |
| | | | | | | | |
| | |
Health Care— 17.1% | | | | | | | | |
AbbVie | | | 993 | | | | 97,493 | |
Agilent Technologies | | | 170 | | | | 15,023 | |
AmerisourceBergen, Cl A | | | 77 | | | | 7,759 | |
Amgen | | | 344 | | | | 81,136 | |
The accompanying notes are an integral part of the financial statements.
9
Impact Shares YWCA Women’s Empowerment ETF
Schedule of Investments
June 30, 2020
| | | | | | | | |
| Description | | Shares | | | Fair Value | |
| | |
Anthem | | | 140 | | | $ | 36,817 | |
Baxter International | | | 277 | | | | 23,850 | |
Becton Dickinson | | | 151 | | | | 36,130 | |
Biogen* | | | 104 | | | | 27,825 | |
Bristol-Myers Squibb | | | 1,282 | | | | 75,382 | |
Cardinal Health | | | 170 | | | | 8,872 | |
Cigna | | | 202 | | | | 37,906 | |
CVS Caremark | | | 762 | | | | 49,507 | |
Edwards Lifesciences* | | | 357 | | | | 24,672 | |
Eli Lilly | | | 454 | | | | 74,538 | |
Gilead Sciences | | | 726 | | | | 55,858 | |
Johnson & Johnson | | | 1,499 | | | | 210,804 | |
McKesson | | | 96 | | | | 14,729 | |
Medtronic PLC | | | 759 | | | | 69,600 | |
Perrigo | | | 76 | | | | 4,201 | |
Pfizer | | | 3,092 | | | | 101,108 | |
Quest Diagnostics | | | 78 | | | | 8,889 | |
Regeneron Pharmaceuticals* | | | 45 | | | | 28,064 | |
ResMed | | | 81 | | | | 15,552 | |
UnitedHealth Group | | | 538 | | | | 158,683 | |
| | | | | | | | |
| | | | | | | 1,264,398 | |
| | | | | | | | |
| | |
Industrials— 6.7% | | | | | | | | |
3M | | | 288 | | | | 44,925 | |
Alaska Air Group* | | | 74 | | | | 2,683 | |
American Airlines Group* | | | 232 | | | | 3,032 | |
Carrier Global | | | 41 | | | | 911 | |
Caterpillar | | | 313 | | | | 39,594 | |
CSX | | | 437 | | | | 30,476 | |
Cummins | | | 91 | | | | 15,767 | |
Delta Air Lines* | | | 328 | | | | 9,201 | |
Eaton | | | 234 | | | | 20,470 | |
Emerson Electric | | | 346 | | | | 21,463 | |
FedEx | | | 93 | | | | 13,040 | |
Flowserve | | | 74 | | | | 2,110 | |
General Electric | | | 4,684 | | | | 31,992 | |
Hexcel* | | | 48 | | | | 2,171 | |
IHS Markit | | | 218 | | | | 16,459 | |
Illinois Tool Works | | | 167 | | | | 29,200 | |
Ingersoll Rand* | | | 122 | | | | 3,431 | |
Johnson Controls International | | | 437 | | | | 14,919 | |
ManpowerGroup | | | 30 | | | | 2,062 | |
Nielsen Holdings PLC | | | 202 | | | | 3,002 | |
Norfolk Southern | | | 144 | | | | 25,282 | |
Otis Worldwide | | | 21 | | | | 1,166 | |
Owens Corning | | | 63 | | | | 3,513 | |
Pentair | | | 96 | | | | 3,647 | |
Raytheon Technologies | | | 41 | | | | 2,526 | |
Rockwell Automation | | | 65 | | | | 13,845 | |
Southwest Airlines* | | | 268 | | | | 9,160 | |
Trane Technologies | | | 139 | | | | 12,368 | |
Union Pacific | | | 393 | | | | 66,445 | |
Verisk Analytics, Cl A | | | 88 | | | | 14,978 | |
Waste Management | | | 214 | | | | 22,665 | |
WW Grainger | | | 25 | | | | 7,854 | |
XPO Logistics* | | | 51 | | | | 3,940 | |
Xylem | | | 92 | | | | 5,976 | |
| | | | | | | | |
| | | | | | | 500,273 | |
| | | | | | | | |
| | |
Information Technology— 30.3% | | | | | | | | |
Accenture, Cl A | | | 363 | | | | 77,943 | |
Adobe* | | | 266 | | | | 115,792 | |
Apple | | | 1,248 | | | | 455,270 | |
Autodesk* | | | 119 | | | | 28,464 | |
Enphase Energy* | | | 2,974 | | | | 141,473 | |
First Solar* | | | 2,562 | | | | 126,819 | |
Hewlett Packard Enterprise | | | 659 | | | | 6,412 | |
HP | | | 801 | | | | 13,962 | |
International Business Machines | | | 299 | | | | 36,110 | |
Intuit | | | 142 | | | | 42,059 | |
Microsoft | | | 2,428 | | | | 494,122 | |
| | | | | | | | |
| Description | | Shares | | | Fair Value | |
| | |
NVIDIA | | | 336 | | | $ | 127,650 | |
PayPal Holdings* | | | 312 | | | | 54,360 | |
salesforce.com* | | | 457 | | | | 85,610 | |
SolarEdge Technologies* | | | 1,191 | | | | 165,287 | |
Texas Instruments | | | 517 | | | | 65,644 | |
Visa, Cl A | | | 954 | | | | 184,284 | |
VMware, Cl A* | | | 44 | | | | 6,814 | |
Workday, Cl A* | | | 83 | | | | 15,551 | |
Xerox Holdings | | | 108 | | | | 1,651 | |
| | | | | | | | |
| | | | | | | 2,245,277 | |
| | | | | | | | |
| | |
Materials— 1.3% | | | | | | | | |
Air Products & Chemicals | | | 125 | | | | 30,183 | |
Eastman Chemical | | | 83 | | | | 5,780 | |
Ecolab | | | 144 | | | | 28,649 | |
International Flavors & Fragrances | | | 58 | | | | 7,103 | |
International Paper | | | 233 | | | | 8,204 | |
Mosaic | | | 199 | | | | 2,489 | |
PPG Industries | | | 139 | | | | 14,742 | |
| | | | | | | | |
| | | | | | | 97,150 | |
| | | | | | | | |
| | |
Real Estate— 1.8% | | | | | | | | |
AvalonBay Communities‡ | | | 73 | | | | 11,289 | |
CBRE Group, Cl A* | | | 190 | | | | 8,592 | |
Equinix‡ | | | 48 | | | | 33,710 | |
Healthpeak Properties‡ | | | 264 | | | | 7,276 | |
Host Hotels & Resorts*‡ | | | 435 | | | | 4,694 | |
Iron Mountain‡ | | | 170 | | | | 4,437 | |
Jones Lang LaSalle* | | | 29 | | | | 3,000 | |
Kimco Realty*‡ | | | 253 | | | | 3,248 | |
Prologis‡ | | | 349 | | | | 32,572 | |
Ventas‡ | | | 157 | | | | 5,749 | |
Welltower‡ | | | 209 | | | | 10,816 | |
Weyerhaeuser*‡ | | | 426 | | | | 9,568 | |
| | | | | | | | |
| | | | | | | 134,951 | |
| | | | | | | | |
| | |
Utilities— 3.3% | | | | | | | | |
American Water Works | | | 101 | | | | 12,994 | |
Atlantica Sustainable Infrastructure | | | 2,425 | | | | 70,568 | |
CenterPoint Energy | | | 290 | | | | 5,414 | |
Consolidated Edison | | | 192 | | | | 13,811 | |
Edison International | | | 197 | | | | 10,699 | |
Eversource Energy | | | 15 | | | | 1,249 | |
Exelon | | | 41 | | | | 1,488 | |
NiSource | | | 195 | | | | 4,434 | |
Sempra Energy | | | 150 | | | | 17,585 | |
TerraForm Power, Cl A | | | 5,594 | | | | 103,153 | |
| | | | | | | | |
| | | | | | | 241,395 | |
| | | | | | | | |
Total Common Stock | | | | | | | | |
(Cost $6,565,170) | | | | | | | 7,133,033 | |
| | | | | | | | |
|
RIGHT — 0.0% | |
T-Mobile US, Expires 07/30/2020 * | | | 35 | | | | 6 | |
| | | | | | | | |
Total Right | | | | | | | | |
(Cost $—) | | | | | | | 6 | |
| | | | | | | | |
|
SHORT-TERM INVESTMENT — 3.8% | |
Invesco Government & Agency, Cl Institutional, 0.090%(A) | | | 281,280 | | | | 281,280 | |
| | | | | | | | |
| | |
Total Short-Term Investment | | | | | | | | |
(Cost $281,280) | | | | | | | 281,280 | |
| | | | | | | | |
| | |
Total Investments - 100.0% | | | | | | | | |
(Cost $6,846,450) | | | | | | $ | 7,414,319 | |
| | | | | | | | |
Percentages are based on Net Assets of $7,414,377.
The accompanying notes are an integral part of the financial statements.
10
Impact Shares YWCA Women’s Empowerment ETF
Schedule of Investments
June 30, 2020
| | |
| †† | | More narrow industries are utilized for compliance purposes whereas broad sectors are utilized for reporting purposes. |
| * | | Non-income producing security. |
| ‡ | | Real Estate Investment Trust |
| (A) | | Rate shown represents the 7-day effective yield as of June 30, 2020. |
|
Cl — Class |
PLC — Public Limited Company |
As of June 30, 2020, all of the Fund’s investments were considered Level 1 in accordance with the authoritative guidance under U.S. Generally Accepted Accounting Principles.
For the year ended June 30, 2020, there were no transfers in or out of Level 3.
For more information on valuation inputs, see Note 2 in Notes to Financial Statements.
The accompanying notes are an integral part of the financial statements.
11
Impact Shares NAACP Minority Empowerment ETF
Schedule of Investments
June 30, 2020
Sector Weightings (Unaudited)†:
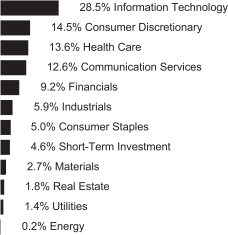
† Percentages based on total investments.
| | | | | | | | |
| Description | | Shares | | | Fair Value | |
| | |
COMMON STOCK†† — 95.4% | | | | | | | | |
| |
Communication Services— 12.6% | | | | | |
Alphabet, Cl A* | | | 109 | | | $ | 154,567 | |
Alphabet, Cl C* | | | 109 | | | | 154,084 | |
AT&T | | | 2,975 | | | | 89,934 | |
Comcast, Cl A | | | 1,785 | | | | 69,579 | |
Facebook, Cl A* | | | 371 | | | | 84,243 | |
Verizon Communications | | | 1,700 | | | | 93,721 | |
Walt Disney* | | | 746 | | | | 83,187 | |
| | | | | | | | |
| | | | | | | 729,315 | |
| | | | | | | | |
| | |
Consumer Discretionary— 14.5% | | | | | | | | |
Amazon.com* | | | 158 | | | | 435,893 | |
Aptiv* | | | 55 | | | | 4,285 | |
Autoliv* | | | 37 | | | | 2,387 | |
Best Buy | | | 89 | | | | 7,767 | |
Carnival* | | | 76 | | | | 1,248 | |
eBay | | | 317 | | | | 16,627 | |
Ford Motor* | | | 1,619 | | | | 9,844 | |
Gap | | | 87 | | | | 1,098 | |
General Motors* | | | 548 | | | | 13,864 | |
Hanesbrands | | | 150 | | | | 1,694 | |
Hasbro | | | 51 | | | | 3,822 | |
Hilton Worldwide Holdings* | | | 117 | | | | 8,594 | |
Home Depot | | | 422 | | | | 105,715 | |
Marriott International, Cl A* | | | 116 | | | | 9,945 | |
McDonald’s | | | 286 | | | | 52,758 | |
Nordstrom* | | | 46 | | | | 712 | |
Ross Stores* | | | 143 | | | | 12,190 | |
Royal Caribbean Cruises* | | | 32 | | | | 1,610 | |
Starbucks | | | 1,183 | | | | 87,057 | |
Target | | | 218 | | | | 26,145 | |
TJX* | | | 477 | | | | 24,117 | |
Whirlpool | | | 22 | | | | 2,850 | |
Yum! Brands | | | 119 | | | | 10,342 | |
| | | | | | | | |
| | | | | | | 840,564 | |
| | | | | | | | |
| | |
Consumer Staples— 5.0% | | | | | | | | |
Archer-Daniels-Midland | | | 235 | | | | 9,376 | |
Bunge | | | 28 | | | | 1,152 | |
Campbell Soup | | | 69 | | | | 3,424 | |
Church & Dwight | | | 98 | | | | 7,576 | |
Clorox | | | 49 | | | | 10,749 | |
| | | | | | | | |
| Description | | Shares | | | Fair Value | |
| | |
Colgate-Palmolive | | | 335 | | | $ | 24,542 | |
Estee Lauder, Cl A* | | | 87 | | | | 16,415 | |
General Mills | | | 246 | | | | 15,166 | |
Hormel Foods | | | 110 | | | | 5,310 | |
Kellogg | | | 97 | | | | 6,408 | |
Kimberly-Clark | | | 131 | | | | 18,517 | |
Kroger | | | 331 | | | | 11,204 | |
McCormick | | | 50 | | | | 8,970 | |
Procter & Gamble | | | 1,004 | | | | 120,048 | |
Sysco | | | 206 | | | | 11,260 | |
Tyson Foods, Cl A | | | 122 | | | | 7,285 | |
Walgreens Boots Alliance | | | 315 | | | | 13,353 | |
| | | | | | | | |
| | | | | | | 290,755 | |
| | | | | | | | |
| | |
Energy— 0.2% | | | | | | | | |
Kinder Morgan | | | 760 | | | | 11,529 | |
| | | | | | | | |
| | |
Financials— 9.2% | | | | | | | | |
Aflac | | | 298 | | | | 10,737 | |
Allstate | | | 123 | | | | 11,930 | |
Bank of America | | | 3,343 | | | | 79,396 | |
Bank of New York Mellon | | | 357 | | | | 13,798 | |
Citigroup | | | 875 | | | | 44,712 | |
Discover Financial Services | | | 140 | | | | 7,013 | |
Equitable Holdings | | | 88 | | | | 1,697 | |
Goldman Sachs Group | | | 120 | | | | 23,714 | |
Hannon Armstrong Sustainable Infrastructure Capital‡ | | | 687 | | | | 19,552 | |
Hartford Financial Services Group | | | 148 | | | | 5,705 | |
Huntington Bancshares | | | 444 | | | | 4,012 | |
JPMorgan Chase | | | 1,293 | | | | 121,620 | |
KeyCorp | | | 413 | | | | 5,030 | |
Moody’s | | | 61 | | | | 16,759 | |
Morgan Stanley | | | 473 | | | | 22,846 | |
Prudential Financial | | | 164 | | | | 9,988 | |
S&P Global | | | 186 | | | | 61,283 | |
State Street | | | 145 | | | | 9,215 | |
US Bancorp | | | 622 | | | | 22,902 | |
Wells Fargo | | | 1,658 | | | | 42,445 | |
| | | | | | | | |
| | | | | | | 534,354 | |
| | | | | | | | |
| | |
Health Care— 13.6% | | | | | | | | |
Abbott Laboratories | | | 709 | | | | 64,824 | |
AbbVie | | | 612 | | | | 60,086 | |
Agilent Technologies | | | 119 | | | | 10,516 | |
Baxter International | | | 192 | | | | 16,531 | |
Becton Dickinson | | | 107 | | | | 25,602 | |
Biogen* | | | 76 | | | | 20,334 | |
Bristol-Myers Squibb | | | 912 | | | | 53,626 | |
Cardinal Health | | | 114 | | | | 5,949 | |
CVS Caremark | | | 541 | | | | 35,149 | |
Eli Lilly | | | 323 | | | | 53,030 | |
Gilead Sciences | | | 521 | | | | 40,086 | |
Illumina* | | | 58 | | | | 21,480 | |
Jazz Pharmaceuticals* | | | 12 | | | | 1,324 | |
Johnson & Johnson | | | 1,053 | | | | 148,083 | |
Merck | | | 1,047 | | | | 80,965 | |
Mylan* | | | 96 | | | | 1,544 | |
Perrigo | | | 30 | | | | 1,658 | |
Pfizer | | | 2,179 | | | | 71,253 | |
ResMed | | | 58 | | | | 11,136 | |
Teleflex | | | 9 | | | | 3,276 | |
Thermo Fisher Scientific | | | 160 | | | | 57,975 | |
| | | | | | | | |
| | | | | | | 784,427 | |
| | | | | | | | |
| | |
Industrials— 5.9% | | | | | | | | |
3M | | | 224 | | | | 34,942 | |
AECOM* | | | 61 | | | | 2,292 | |
AGCO | | | 28 | | | | 1,553 | |
Cintas | | | 31 | | | | 8,257 | |
Cummins | | | 67 | | | | 11,609 | |
The accompanying notes are an integral part of the financial statements.
12
Impact Shares NAACP Minority Empowerment ETF
Schedule of Investments
June 30, 2020
| | | | | | | | |
| Description | | Shares | | | Fair Value | |
| | |
Deere | | | 127 | | | $ | 19,958 | |
Delta Air Lines* | | | 235 | | | | 6,592 | |
Eaton | | | 81 | | | | 7,086 | |
Emerson Electric | | | 244 | | | | 15,135 | |
FedEx | | | 90 | | | | 12,620 | |
General Electric | | | 3,315 | | | | 22,641 | |
Honeywell International | | | 284 | | | | 41,064 | |
IHS Markit | | | 76 | | | | 5,738 | |
Illinois Tool Works | | | 118 | | | | 20,632 | |
Ingersoll Rand* | | | 42 | | | | 1,181 | |
Johnson Controls International | | | 152 | | | | 5,189 | |
ManpowerGroup | | | 22 | | | | 1,513 | |
Masco | | | 111 | | | | 5,573 | |
Nielsen Holdings PLC | | | 71 | | | | 1,055 | |
Oshkosh | | | 57 | | | | 4,082 | |
Owens Corning | | | 42 | | | | 2,342 | |
Pentair | | | 33 | | | | 1,254 | |
Rockwell Automation | | | 48 | | | | 10,224 | |
Roper Technologies | | | 40 | | | | 15,531 | |
Stanley Black & Decker | | | 60 | | | | 8,363 | |
Trane Technologies | | | 48 | | | | 4,271 | |
United Parcel Service, Cl B | | | 287 | | | | 31,908 | |
Verisk Analytics, Cl A | | | 61 | | | | 10,382 | |
Waste Management | | | 150 | | | | 15,887 | |
WW Grainger | | | 18 | | | | 5,655 | |
Xylem | | | 70 | | | | 4,547 | |
| | | | | | | | |
| | | | | | | 339,076 | |
| | | | | | | | |
| | |
Information Technology— 28.5% | | | | | | | | |
Accenture, Cl A | | | 126 | | | | 27,055 | |
Advanced Micro Devices* | | | 392 | | | | 20,623 | |
Apple | | | 1,022 | | | | 372,826 | |
Cisco Systems | | | 1,714 | | | | 79,941 | |
Dell Technologies, Cl C* | | | 62 | | | | 3,406 | |
DXC Technology* | | | 113 | | | | 1,865 | |
Enphase Energy* | | | 1,271 | | | | 60,461 | |
First Solar* | | | 1,124 | | | | 55,638 | |
Hewlett Packard Enterprise | | | 546 | | | | 5,313 | |
HP | | | 559 | | | | 9,743 | |
Intel | | | 1,603 | | | | 95,907 | |
International Business Machines | | | 348 | | | | 42,028 | |
Mastercard, Cl A | | | 333 | | | | 98,468 | |
Microsoft | | | 1,972 | | | | 401,322 | |
Motorola Solutions | | | 63 | | | | 8,828 | |
NortonLifeLock | | | 235 | | | | 4,660 | |
Oracle | | | 861 | | | | 47,587 | |
QUALCOMM | | | 451 | | | | 41,136 | |
salesforce.com* | | | 324 | | | | 60,695 | |
SolarEdge Technologies* | | | 509 | | | | 70,639 | |
Texas Instruments | | | 50 | | | | 6,349 | |
Visa, Cl A | | | 648 | | | | 125,174 | |
Workday, Cl A* | | | 59 | | | | 11,054 | |
| | | | | | | | |
| | | | | | | 1,650,718 | |
| | | | | | | | |
| | |
Materials— 2.7% | | | | | | | | |
Air Products & Chemicals | | | 89 | | | | 21,490 | |
Amcor | | | 330 | | | | 3,369 | |
Avery Dennison | | | 32 | | | | 3,651 | |
Ball | | | 123 | | | | 8,547 | |
DuPont de Nemours | | | 316 | | | | 16,789 | |
Eastman Chemical | | | 59 | | | | 4,109 | |
Ecolab | | | 100 | | | | 19,895 | |
FMC | | | 51 | | | | 5,081 | |
Freeport-McMoRan, Cl B* | | | 614 | | | | 7,104 | |
International Flavors & Fragrances | | | 40 | | | | 4,898 | |
International Paper | | | 166 | | | | 5,845 | |
Mosaic | | | 143 | | | | 1,789 | |
Newmont | | | 373 | | | | 23,029 | |
PPG Industries | | | 98 | | | | 10,394 | |
| | | | | | | | |
| Description | | Shares | | | Fair Value | |
| | |
Sonoco Products | | | 431 | | | $ | 22,537 | |
| | | | | | | | |
| | | | | | | 158,527 | |
| | | | | | | | |
| | |
Real Estate— 1.8% | | | | | | | | |
AvalonBay Communities‡ | | | 53 | | | | 8,196 | |
CBRE Group, Cl A* | | | 136 | | | | 6,150 | |
Equinix‡ | | | 31 | | | | 21,771 | |
Equity Residential‡ | | | 138 | | | | 8,117 | |
Healthpeak Properties‡ | | | 183 | | | | 5,043 | |
Iron Mountain‡ | | | 119 | | | | 3,106 | |
Jones Lang LaSalle* | | | 20 | | | | 2,069 | |
Kilroy Realty‡ | | | 40 | | | | 2,348 | |
Prologis‡ | | | 243 | | | | 22,679 | |
SL Green Realty‡ | | | 31 | | | | 1,528 | |
Ventas‡ | | | 148 | | | | 5,420 | |
Welltower‡ | | | 152 | | | | 7,866 | |
Weyerhaeuser*‡ | | | 297 | | | | 6,671 | |
| | | | | | | | |
| | | | | | | 100,964 | |
| | | | | | | | |
| | |
Utilities— 1.4% | | | | | | | | |
American Water Works | | | 71 | | | | 9,135 | |
Atlantica Sustainable Infrastructure | | | 1,036 | | | | 30,148 | |
TerraForm Power, Cl A | | | 2,390 | | | | 44,071 | |
| | | | | | | | |
| | | | | | | 83,354 | |
| | | | | | | | |
| | |
Total Common Stock | | | | | | | | |
(Cost $5,280,167) | | | | | | | 5,523,583 | |
| | | | | | | | |
|
SHORT-TERM INVESTMENT — 4.6% | |
Invesco Government & Agency, Cl Institutional, 0.090%(A) | | | 267,460 | | | | 267,460 | |
| | | | | | | | |
| | |
Total Short-Term Investment (Cost $267,460) | | | | | | | 267,460 | |
| | | | | | | | |
| | |
Total Investments - 100.0%
(Cost $5,547,627) | | | | | | $ | 5,791,043 | |
| | | | | | | | |
Percentages are based on Net Assets of $5,791,510.
| †† | More narrow industries are utilized for compliance purposes whereas broad sectors are utilized for reporting purposes. |
| * | Non-income producing security. |
| ‡ | Real Estate Investment Trust |
| (A) | Rate shown represents the 7-day effective yield as of June 30, 2020. |
Cl — Class
PLC — Public Limited Company
As of June 30, 2020, all of the Fund’s investments were considered Level 1 in accordance with the authoritative guidance under U.S. Generally Accepted Accounting Principles.
For the year ended June 30, 2020, there were no transfers in or out of Level 3.
For more information on valuation inputs, see Note 2 in Notes to Financial Statements.
The accompanying notes are an integral part of the financial statements.
13
Impact Shares Sustainable Development Goals Global Equity ETF
Schedule of Investments
June 30, 2020
Sector Weightings (Unaudited)†:
† Percentages based on total investments.
| | | | | | | | |
| Description | | Shares | | | Fair Value | |
|
COMMON STOCK — 90.4% | |
| |
Australia — 4.5% | | | | | |
AGL Energy | | | 726 | | | $ | 8,542 | |
Australia & New Zealand Banking Group | | | 1,468 | | | | 18,884 | |
Brambles | | | 817 | | | | 6,129 | |
Dexus‡ | | | 548 | | | | 3,479 | |
Fortescue Metals Group | | | 2,048 | | | | 19,574 | |
GPT Group‡ | | | 994 | | | | 2,860 | |
Mirvac Group‡ | | | 1,983 | | | | 2,970 | |
National Australia Bank | | | 1,504 | | | | 18,911 | |
OZ Minerals | | | 160 | | | | 1,210 | |
Qantas Airways | | | 408 | | | | 1,065 | |
South32 | | | 2,768 | | | | 3,897 | |
Stockland‡ | | | 1,243 | | | | 2,839 | |
Sydney Airport | | | 576 | | | | 2,254 | |
Telstra | | | 2,060 | | | | 4,450 | |
Vicinity Centres‡ | | | 1,691 | | | | 1,669 | |
Westpac Banking | | | 1,744 | | | | 21,603 | |
Woodside Petroleum | | | 1,018 | | | | 15,209 | |
| | | | | | | | |
| | |
Total Australia | | | | | | | 135,545 | |
| | | | | | | | |
| |
Canada — 1.7% | | | | | |
B2Gold | | | 485 | | | | 2,758 | |
Bank of Montreal | | | 283 | | | | 15,063 | |
CAE* | | | 124 | | | | 2,011 | |
Gildan Activewear* | | | 110 | | | | 1,704 | |
Kinross Gold* | | | 621 | | | | 4,483 | |
Newmont | | | 55 | | | | 3,398 | |
Suncor Energy | | | 799 | | | | 13,472 | |
Teck Resources, Cl B | | | 291 | | | | 3,048 | |
Thomson Reuters | | | 85 | | | | 5,775 | |
| | | | | | | | |
| | |
Total Canada | | | | | | | 51,712 | |
| | | | | | | | |
| |
China — 0.8% | | | | | |
Baidu ADR* | | | 64 | | | | 7,673 | |
BYD, Cl H | | | 246 | | | | 1,900 | |
China Mobile | | | 2,091 | | | | 14,110 | |
Lenovo Group | | | 2,840 | | | | 1,572 | |
Towngas China | | | 437 | | | | 197 | |
| | | | | | | | |
| | |
Total China | | | | | | | 25,452 | |
| | | | | | | | |
| | | | | | | | |
| Description | | Shares | | | Fair Value | |
| |
Denmark — 1.6% | | | | | |
Coloplast, Cl B | | | 51 | | | $ | 7,905 | |
GN Store Nord | | | 55 | | | | 2,930 | |
ISS* | | | 63 | | | | 997 | |
Novo Nordisk, Cl B | | | 400 | | | | 25,897 | |
Vestas Wind Systems | | | 87 | | | | 8,859 | |
| | | | | | | | |
| | |
Total Denmark | | | | | | | 46,588 | |
| | | | | | | | |
| |
Finland — 0.3% | | | | | |
Neste | | | 238 | | | | 9,308 | |
| | | | | | | | |
| | |
Total Finland | | | | | | | 9,308 | |
| | | | | | | | |
| |
France — 3.0% | | | | | |
Air France-KLM* | | | 138 | | | | 625 | |
ALD | | | 48 | | | | 475 | |
AXA | | | 1,200 | | | | 25,093 | |
Gecina‡ | | | 31 | | | | 3,831 | |
JCDecaux* | | | 47 | | | | 874 | |
Kering | | | 45 | | | | 24,483 | |
Legrand | | | 252 | | | | 19,145 | |
Peugeot* | | | 377 | | | | 6,133 | |
Societe Generale* | | | 623 | | | | 10,359 | |
| | | | | | | | |
| | |
Total France | | | | | | | 91,018 | |
| | | | | | | | |
| |
Germany — 2.0% | | | | | |
adidas* | | | 105 | | | | 27,557 | |
Covestro | | | 105 | | | | 3,993 | |
Henkel & KGaA | | | 59 | | | | 4,915 | |
LANXESS | | | 52 | | | | 2,744 | |
Muenchener Rueckversicherungs-Gesellschaft in Muenchen | | | 86 | | | | 22,358 | |
| | | | | | | | |
| | |
Total Germany | | | | | | | 61,567 | |
| | | | | | | | |
| |
Hong Kong — 0.2% | | | | | |
China Everbright International | | | 1,499 | | | | 791 | |
COSCO SHIPPING Ports | | | 688 | | | | 369 | |
New World Development | | | 555 | | | | 2,635 | |
Swire Properties | | | 405 | | | | 1,029 | |
| | | | | | | | |
| | |
Total Hong Kong | | | | | | | 4,824 | |
| | | | | | | | |
| |
Israel — 0.0% | | | | | |
Teva Pharmaceutical Industries ADR* | | | 107 | | | | 1,319 | |
| | | | | | | | |
| | |
Total Israel | | | | | | | 1,319 | |
| | | | | | | | |
| |
Japan — 1.3% | | | | | |
Fast Retailing | | | 25 | | | | 14,285 | |
Nikon | | | 152 | | | | 1,270 | |
Takeda Pharmaceutical | | | 616 | | | | 21,953 | |
| | | | | | | | |
| | |
Total Japan | | | | | | | 37,508 | |
| | | | | | | | |
| |
Malaysia — 0.1% | | | | | |
IOI | | | 195 | | | | 197 | |
Malayan Banking | | | 861 | | | | 1,509 | |
Sime Darby | | | 502 | | | | 252 | |
Sime Darby Plantation | | | 200 | | | | 230 | |
| | | | | | | | |
| | |
Total Malaysia | | | | | | | 2,188 | |
| | | | | | | | |
| |
Mexico — 0.2% | | | | | |
Cemex* | | | 6,177 | | | | 1,741 | |
Grupo Financiero Banorte, Cl O | | | 949 | | | | 3,284 | |
Infraestructura Energetica Nova | | | 194 | | | | 558 | |
| | | | | | | | |
| | |
Total Mexico | | | | | | | 5,583 | |
| | | | | | | | |
| |
Netherlands — 0.5% | | | | | |
ABN AMRO Bank | | | 252 | | | | 2,170 | |
Akzo Nobel | | | 138 | | | | 12,363 | |
| | | | | | | | |
| | |
Total Netherlands | | | | | | | 14,533 | |
| | | | | | | | |
The accompanying notes are an integral part of the financial statements.
14
Impact Shares Sustainable Development Goals Global Equity ETF
Schedule of Investments
June 30, 2020
| | | | | | | | |
| Description | | Shares | | | Fair Value | |
| |
Norway — 0.2% | | | | | |
DNB | | | 346 | | | $ | 4,569 | |
| | | | | | | | |
| | |
Total Norway | | | | | | | 4,569 | |
| | | | | | | | |
| |
Philippines — 0.0% | | | | | |
Ayala | | | 93 | | | | 1,450 | |
| | | | | | | | |
| | |
Total Philippines | | | | | | | 1,450 | |
| | | | | | | | |
| |
Singapore — 0.1% | | | | | |
City Developments | | | 313 | | | | 1,891 | |
Olam International | | | 355 | | | | 354 | |
Sembcorp Industries | | | 479 | | | | 601 | |
| | | | | | | | |
| | |
Total Singapore | | | | | | | 2,846 | |
| | | | | | | | |
| |
South Africa — 0.4% | | | | | |
Gold Fields | | | 319 | | | | 2,982 | |
Investec | | | 448 | | | | 896 | |
Sasol* | | | 251 | | | | 1,912 | |
Standard Bank Group | | | 538 | | | | 3,240 | |
Vodacom Group | | | 282 | | | | 1,998 | |
| | | | | | | | |
| | |
Total South Africa | | | | | | | 11,028 | |
| | | | | | | | |
| |
Spain — 1.0% | | | | | |
Atlantica Sustainable Infrastructure | | | 689 | | | | 20,050 | |
Enagas | | | 132 | | | | 3,226 | |
Repsol | | | 918 | | | | 8,030 | |
| | | | | | | | |
| | |
Total Spain | | | | | | | 31,306 | |
| | | | | | | | |
| |
Sweden — 1.2% | | | | | |
Assa Abloy, Cl B | | | 402 | | | | 8,173 | |
Atlas Copco, Cl A | | | 258 | | | | 10,926 | |
Atlas Copco, Cl B | | | 153 | | | | 5,658 | |
BillerudKorsnas | | | 69 | | | | 988 | |
SKF, Cl B | | | 171 | | | | 3,177 | |
Telefonaktiebolaget LM Ericsson, Cl A | | | 24 | | | | 239 | |
Telefonaktiebolaget LM Ericsson, Cl B | | | 724 | | | | 6,694 | |
| | | | | | | | |
| | |
Total Sweden | | | | | | | 35,855 | |
| | | | | | | | |
| |
Switzerland — 10.3% | | | | | |
Nestle | | | 1,420 | | | | 156,980 | |
Roche Holding - BR | | | 16 | | | | 5,489 | |
Roche Holding - GENUS | | | 395 | | | | 136,892 | |
SGS | | | 4 | | | | 9,774 | |
| | | | | | | | |
| | |
Total Switzerland | | | | | | | 309,135 | |
| | | | | | | | |
| |
United Kingdom — 3.9% | | | | | |
Lloyds Banking Group | | | 50,178 | | | | 19,383 | |
Ninety One* | | | 224 | | | | 572 | |
RELX | | | 1,246 | | | | 28,871 | |
Standard Chartered | | | 1,836 | | | | 10,012 | |
Unilever | | | 980 | | | | 52,023 | |
WPP | | | 838 | | | | 6,550 | |
| | | | | | | | |
| | |
Total United Kingdom | | | | | | | 117,411 | |
| | | | | | | | |
| |
United States — 57.1% | | | | | |
Communication Services— 3.7% | | | | | | | | |
Walt Disney* | | | 999 | | | | 111,398 | |
| | | | | | | | |
| | |
Consumer Discretionary— 5.7% | | | | | | | | |
Ford Motor* | | | 2,341 | | | | 14,233 | |
Gap | | | 124 | | | | 1,565 | |
NIKE, Cl B | | | 727 | | | | 71,282 | |
Starbucks | | | 1,143 | | | | 84,113 | |
| | | | | | | | |
| | | | | | | 171,193 | |
| | | | | | | | |
| | |
Consumer Staples— 6.0% | | | | | | | | |
Colgate-Palmolive | | | 489 | | | | 35,824 | |
Procter & Gamble | | | 1,211 | | | | 144,800 | |
| | | | | | | | |
| | | | | | | 180,624 | |
| | | | | | | | |
| | | | | | | | |
| Description | | Shares | | | Fair Value | |
| | |
Energy— 1.0% | | | | | | | | |
ConocoPhillips | | | 230 | | | $ | 9,665 | |
Exxon Mobil | | | 296 | | | | 13,237 | |
Hess | | | 54 | | | | 2,798 | |
Occidental Petroleum | | | 170 | | | | 3,111 | |
| | | | | | | | |
| | | | | | | 28,811 | |
| | | | | | | | |
| | |
Financials— 8.8% | | | | | | | | |
Bank of America | | | 6,328 | | | | 150,290 | |
Hannon Armstrong Sustainable Infrastructure Capital‡ | | | 457 | | | | 13,006 | |
JPMorgan Chase | | | 719 | | | | 67,629 | |
Morgan Stanley | | | 689 | | | | 33,279 | |
| | | | | | | | |
| | | | | | | 264,204 | |
| | | | | | | | |
| | |
Health Care— 10.4% | | | | | | | | |
AbbVie | | | 882 | | | | 86,595 | |
Merck | | | 1,520 | | | | 117,542 | |
Mylan* | | | 267 | | | | 4,293 | |
Pfizer | | | 3,162 | | | | 103,397 | |
| | | | | | | | |
| | | | | | | 311,827 | |
| | | | | | | | |
| | |
Industrials— 3.0% | | | | | | | | |
3M | | | 323 | | | | 50,385 | |
Johnson Controls International | | | 447 | | | | 15,261 | |
ManpowerGroup | | | 34 | | | | 2,337 | |
Nielsen Holdings PLC | | | 203 | | | | 3,017 | |
Rockwell Automation | | | 67 | | | | 14,271 | |
Xylem | | | 102 | | | | 6,626 | |
| | | | | | | | |
| | | | | | | 91,897 | |
| | | | | | | | |
| | |
Information Technology— 15.1% | | | | | | | | |
Enphase Energy* | | | 846 | | | | 40,244 | |
First Solar* | | | 743 | | | | 36,779 | |
HP | | | 815 | | | | 14,205 | |
Microsoft | | | 1,554 | | | | 316,255 | |
SolarEdge Technologies* | | | 338 | | | | 46,908 | |
| | | | | | | | |
| | | | | | | 454,391 | |
| | | | | | | | |
| | |
Materials— 2.4% | | | | | | | | |
Avery Dennison | | | 50 | | | | 5,705 | |
Newmont | | | 1,070 | | | | 66,062 | |
| | | | | | | | |
| | | | | | | 71,767 | |
| | | | | | | | |
| | |
Utilities— 1.0% | | | | | | | | |
AES | | | 132 | | | | 1,913 | |
TerraForm Power, Cl A | | | 1,573 | | | | 29,006 | |
| | | | | | | | |
| | | | | | | 30,919 | |
| | | | | | | | |
| | |
Total United States | | | | | | | 1,717,031 | |
| | | | | | | | |
| | |
Total Common Stock | | | | | | | | |
(Cost $2,825,804) | | | | | | | 2,717,776 | |
| | | | | | | | |
|
PREFERRED STOCK — 0.3% | |
| |
Germany — 0.3% | | | | | |
Henkel & KGaA (A) | | | 105 | | | | 9,777 | |
| | | | | | | | |
Total Preferred Stock | | | | | | | | |
(Cost $11,223) | | | | | | | 9,777 | |
| | | | | | | | |
|
RIGHT — 0.0% | |
Repsol, Expires 07/07/2020* | | | 918 | | | | 447 | |
| | | | | | | | |
Total Right | | | | | | | | |
(Cost $—) | | | | | | | 447 | |
| | | | | | | | |
|
SHORT-TERM INVESTMENT — 9.0% | |
Invesco Government & Agency, Cl Institutional, 0.090%(B) | | | 271,285 | | | | 271,285 | |
| | | | | | | | |
| | |
Total Short-Term Investment | | | | | | | | |
(Cost $271,285) | | | | | | | 271,285 | |
| | | | | | | | |
| | |
Total Investments - 99.7% | | | | | | | | |
(Cost $3,108,312) | | | | | | $ | 2,999,285 | |
| | | | | | | | |
The accompanying notes are an integral part of the financial statements.
15
Impact Shares Sustainable Development Goals Global Equity ETF
Schedule of Investments
June 30, 2020
Percentages are based on Net Assets of $3,008,223.
| | |
| ‡ | | Real Estate Investment Trust |
| * | | Non-income producing security. |
| (A) | | There is currently no rate available. |
| (B) | | Rate shown represents the 7-day effective yield as of June 30, 2020. |
|
ADR — American Depositary Receipt |
Cl — Class |
PLC — Public Limited Company |
As of June 30, 2020, all of the Fund’s investments were considered Level 1 in accordance with the authoritative guidance under U.S. Generally Accepted Accounting Principles.
For the year ended June 30, 2020, there were no transfers in or out of Level 3.
For more information on valuation inputs, see Note 2 in the Notes to Financial Statements.
The accompanying notes are an integral part of the financial statements.
16
Impact Shares Trust I
Statements of Assets and Liabilities
June 30, 2020
| | | | | | | | | | | | | | | | | | | | | | | | |
| | | Impact Shares
YWCA
Women’s
Empowerment
ETF | | | | | | Impact Shares
NAACP
Minority
Empowerment
ETF | | | | | | Impact Shares
Sustainable
Development
Goals Global
Equity ETF | | | | |
| | | | | | |
| Assets: | | | | | | | | | | | | | | | | | | |
| | | | | | |
Investments, at Cost | �� | $ | 6,846,450 | | | | | | | $ | 5,547,627 | | | | | | | $ | 3,108,312 | | | | | |
| | | | | | |
Cost of Foreign Currency | | | — | | | | | | | | — | | | | | | | | 7,272 | | | | | |
| | | | | | | | | | | | | | | | | | | | | | | | |
| | | | | | |
Investments, at Fair Value | | $ | 7,414,319 | | | | | | | $ | 5,791,043 | | | | | | | $ | 2,999,285 | | | | | |
| | | | | | |
Cash and Cash Equivalents | | | 190 | | | | | | | | 595 | | | | | | | | 3,211 | | | | | |
| | | | | | |
Foreign Currency, at Value | | | — | | | | | | | | — | | | | | | | | 7,692 | | | | | |
| | | | | | |
Receivable for Expense Reimbursement | | | 22,419 | | | | | | | | 10,637 | | | | | | | | 9,980 | | | | | |
| | | | | | |
Interest Receivable | | | 4,023 | | | | | | | | 2,611 | | | | | | | | 1,853 | | | | | |
| | | | | | |
Reclaims Receivable | | | 124 | | | | | | | | 28 | | | | | | | | 3,472 | | | | | |
| | | | | | | | | | | | | | | | | | | | | | | | |
Total Assets | | | 7,441,075 | | | | | | | | 5,804,914 | | | | | | | | 3,025,493 | | | | | |
| | | | | | | | | | | | | | | | | | | | | | | | |
| | | | | | |
Liabilities: | | | | | | | | | | | | | | | | | | | | | | | | |
| | | | | | |
Payable for Trustees’ Fee | | | 22,419 | | | | | | | | 10,637 | | | | | | | | 6,944 | | | | | |
| | | | | | |
Advisory Fees Payable | | | 4,279 | | | | | | | | 2,767 | | | | | | | | 1,862 | | | | | |
| | | | | | |
Due to Custodian | | | — | | | | | | | | — | | | | | | | | 3,036 | | | | | |
| | | | | | |
Foreign Currency Payable, at value (Proceeds $ —,$ — and $5,366) | | | — | | | | | | | | — | | | | | | | | 5,428 | | | | | |
| | | | | | | | | | | | | | | | | | | | | | | | |
Total Liabilities | | | 26,698 | | | | | | | | 13,404 | | | | | | | | 17,270 | | | | | |
| | | | | | | | | | | | | | | | | | | | | | | | |
| | | | | | |
Net Assets | | $ | 7,414,377 | | | | | | | $ | 5,791,510 | | | | | | | $ | 3,008,223 | | | | | |
| | | | | | | | | | | | | | | | | | | | | | | | |
| | | | | | |
Net Assets Consist of: | | | | | | | | | | | | | | | | | | | | | | | | |
Paid-in Capital | | $ | 6,571,750 | | | | | | | $ | 5,516,816 | | | | | | | $ | 3,133,592 | | | | | |
Total Distributable Earnings/(Loss) | | | 842,627 | | | | | | | | 274,694 | | | | | | | | (125,369) | | | | | |
| | | | | | | | | | | | | | | | | | | | | | | | |
Net Assets | | $ | 7,414,377 | | | | | | | $ | 5,791,510 | | | | | | | $ | 3,008,223 | | | | | |
| | | | | | | | | | | | | | | | | | | | | | | | |
| | | | | | |
Outstanding Shares of Beneficial Interest (unlimited authorization — no par value) | | | 325,001 | | | | | | | | 250,000 | | | | | | | | 150,001 | | | | | |
Net Asset Value, Offering and Redemption Price Per Share | | $ | 22.81 | | | | | | | $ | 23.17 | | | | | | | $ | 20.05 | | | | | |
| | | | | | | | | | | | | | | | | | | | | | | | |
Amounts designated as “-“ are $0.
The accompanying notes are an integral part of the financial statements.
17
Impact Shares Trust I
Statements of Operations
June 30, 2020
| | | | | | | | | | | | |
| | | Impact Shares
YWCA
Women’s
Empowerment
ETF | | | Impact Shares
NAACP
Minority
Empowerment
ETF | | | Impact Shares
Sustainable
Development
Goals Global
Equity ETF | |
| | | |
| Investment Income: | | | | | | | | | |
Dividend Income | | $ | 127,904 | | | $ | 59,472 | | | $ | 49,957 | |
Less: Foreign Taxes Withheld | | | — | | | | — | | | | (2,319) | |
| | | | | | | | | | | | |
Total Investment Income | | | 127,904 | | | | 59,472 | | | | 47,638 | |
| | | | | | | | | | | | |
| | | |
Expenses: | | | | | | | | | | | | |
Advisory Fees | | | 46,784 | | | | 22,143 | | | | 14,472 | |
Trustee Fees | | | 22,419 | | | | 10,637 | | | | 6,944 | |
Custodian Fees | | | — | | | | — | | | | 3,036 | |
| | | | | | | | | | | | |
Total Expenses | | | 69,203 | | | | 32,780 | | | | 24,452 | |
| | | | | | | | | | | | |
Less: | | | | | | | | | | | | |
Voluntary Expense Reimbursement | | | (22,419) | | | | (10,637) | | | | (9,980) | |
| | | | | | | | | | | | |
Net Expenses | | | 46,784 | | | | 22,143 | | | | 14,472 | |
| | | | | | | | | | | | |
| | | |
Net Investment Income | | | 81,120 | | | | 37,329 | | | | 33,166 | |
| | | | | | | | | | | | |
| | | |
Net Realized Gain (Loss) on: | | | | | | | | | | | | |
| | | |
Investments | | | 299,440 | | | | 54,082 | | | | 3,529 | |
Foreign Currency Transactions | | | — | | | | — | | | | (35,572) | |
| | | | | | | | | | | | |
| | | |
Net Realized Gain (Loss) on Investments and Foreign Currency Transactions | | | 299,440 | | | | 54,082 | | | | (32,043) | |
| | | | | | | | | | | | |
| | | |
Net Change in Unrealized Appreciation (Depreciation) | | | | | | | | | | | | |
| | | |
Investments | | | 381,339 | | | | 162,392 | | | | (123,414) | |
Foreign Currency Translation | | | — | | | | — | | | | 461 | |
| | | | | | | | | | | | |
Net Change in Unrealized Appreciation (Depreciation) on Investments and Foreign Currency Translation | | | 381,339 | | | | 162,392 | | | | (122,953) | |
| | | | | | | | | | | | |
| | | |
Net Realized and Unrealized Gain (Loss) on Investments and Foreign Currency Transactions | | | 680,779 | | | | 216,474 | | | | (154,996) | |
| | | | | | | | | | | | |
| | | |
Net Increase (Decrease) in Net Assets Resulting from Operations | | $ | 761,899 | | | $ | 253,803 | | | $ | (121,830) | |
| | | | | | | | | | | | |
Amounts designated as “-“ are $0.
The accompanying notes are an integral part of the financial statements.
18
Impact Shares Trust I
Statements of Changes in Net Assets
| | | | | | | | |
| | | Impact Shares YWCA Women’s
Empowerment ETF | |
| | | Year ended
June 30, 2020 | | | Period Ended
June 30, 2019(1) | |
Operations: | | | | | | | | |
Net Investment Income | | $ | 81,120 | | | $ | 36,815 | |
Net Realized Gain (Loss) on Investments | | | 299,440 | | | | (23,918 | ) |
Net Change in Unrealized Appreciation on Investments | | | 381,339 | | | | 186,530 | |
| | | | | | | | |
| | |
Net Increase in Net Assets Resulting from Operations | | | 761,899 | | | | 199,427 | |
| | | | | | | | |
| | |
Distributions | | | (79,706 | ) | | | (38,993 | ) |
| | | | | | | | |
| | |
Capital Share Transactions: | | | | | | | | |
Issued | | | 2,606,001 | | | | 3,965,749 | |
| | | | | | | | |
| | |
Increase in Net Assets from Capital Share Transactions | | | 2,606,001 | | | | 3,965,749 | |
| | | | | | | | |
| | |
Total Increase in Net Assets | | | 3,288,194 | | | | 4,126,183 | |
| | | | | | | | |
| | |
Net Assets: | | | | | | | | |
Beginning of Year/Period | | | 4,126,183 | | | | — | |
| | | | | | | | |
End of Year/Period | | $ | 7,414,377 | | | $ | 4,126,183 | |
| | | | | | | | |
| | |
Share Transactions: | | | | | | | | |
Issued | | | 125,000 | | | | 200,001 | |
| | | | | | | | |
Net Increase in Shares Outstanding from Share Transactions | | | 125,000 | | | | 200,001 | |
| | | | | | | | |
Amounts designated as “-“ are $0.
(1) The Fund commenced operations on August 24, 2018.
The accompanying notes are an integral part of the financial statements.
19
Impact Shares Trust I
Statements of Changes in Net Assets
| | | | | | | | |
| | | Impact Shares NAACP Minority
Empowerment ETF | |
| | | Year ended
June 30, 2020 | | | Period Ended
June 30, 2019(1) | |
Operations: | | | | | | | | |
Net Investment Income | | $ | 37,329 | | | $ | 29,212 | |
Net Realized Gain on Investments | | | 54,082 | | | | 33,358 | |
Net Change in Unrealized Appreciation on Investments | | | 162,392 | | | | 81,024 | |
| | | | | | | | |
| | |
Net Increase in Net Assets Resulting from Operations | | | 253,803 | | | | 143,594 | |
| | | | | | | | |
| | |
Distributions | | | (36,817 | ) | | | (29,967 | ) |
| | | | | | | | |
| | |
Return of Capital | | | – | | | | (37 | ) |
| | | | | | | | |
| | |
Capital Share Transactions: | | | | | | | | |
Issued | | | 3,459,243 | | | | 3,113,767 | |
Redeemed | | | (106,253 | ) | | | (1,005,823 | ) |
| | | | | | | | |
| | |
Increase in Net Assets from Capital Share Transactions | | | 3,352,990 | | | | 2,107,944 | |
| | | | | | | | |
| | |
Total Increase in Net Assets | | | 3,569,976 | | | | 2,221,534 | |
| | | | | | | | |
| | |
Net Assets: | | | | | | | | |
Beginning of Year/Period | | | 2,221,534 | | | | — | |
| | | | | | | | |
End of Year/Period | | $ | 5,791,510 | | | $ | 2,221,534 | |
| | | | | | | | |
| | |
Share Transactions: | | | | | | | | |
Issued | | | 150,000 | | | | 155,000 | |
Redeemed | | | (5,000 | ) | | | (50,000 | ) |
| | | | | | | | |
Net Increase in Shares Outstanding from Share Transactions | | | 145,000 | | | | 105,000 | |
| | | | | | | | |
Amounts designated as “-“ are $0.
(1) The Fund commenced operations on July 18, 2018.
The accompanying notes are an integral part of the financial statements.
20
Impact Shares Trust I
Statements of Changes in Net Assets
| | | | | | | | |
| | | Impact Shares Sustainable
Development Goals Global Equity
ETF | |
| | | Year ended
June 30, 2020 | | | Period Ended
June 30, 2019(1) | |
Operations: | | | | | | | | |
Net Investment Income | | $ | 33,166 | | | $ | 28,019 | |
Net Realized Gain (Loss) on Investments and Foreign Currency Transactions | | | (32,043 | ) | | | 33,316 | |
Net Change in Unrealized Appreciation (Depreciation) on Investments and Foreign Currency Translation | | | (122,953 | ) | | | 14,423 | |
| | | | | | | | |
| | |
Net Increase (Decrease) in Net Assets Resulting from Operations | | | (121,830 | ) | | | 75,758 | |
| | | | | | | | |
| | |
Distributions | | | (9,427 | ) | | | (26,447 | ) |
| | | | | | | | |
| | |
Capital Share Transactions: | | | | | | | | |
Issued | | | 2,112,289 | | | | 2,000,020 | |
Redeemed | | | – | | | | (1,022,140 | ) |
| | | | | | | | |
| | |
Increase in Net Assets from Capital Share Transactions | | | 2,112,289 | | | | 977,880 | |
| | | | | | | | |
| | |
Total Increase in Net Assets | | | 1,981,032 | | | | 1,027,191 | |
| | | | | | | | |
Net Assets: | | | | | | | | |
Beginning of Year/Period | | | 1,027,191 | | | | — | |
| | | | | | | | |
End of Year/Period | | $ | 3,008,223 | | | $ | 1,027,191 | |
| | | | | | | | |
Share Transactions: | | | | | | | | |
Issued | | | 100,000 | | | | 100,001 | |
Redeemed | | | – | | | | (50,000 | ) |
| | | | | | | | |
Net Increase in Shares Outstanding from Share Transactions | | | 100,000 | | | | 50,001 | |
| | | | | | | | |
Amounts designated as “-“ are $0.
(1) The Fund commenced operations on September 20, 2018.
The accompanying notes are an integral part of the financial statements.
21
Impact Shares Trust I
Financial Highlights
Selected Per Share Data & Ratios
For the year or period ended June 30,
For a Share Outstanding Throughout the Period
| | | | | | | | | | | | | | | | | | | | | | | | | | | | | | | | | | | | | | | | | | | | | | | | | | | | | | | | |
| | | Net Asset
Value,
Beginning of
Period ($) | | | Net
Investment
Income ($)* | | | Net Realized
and
Unrealized
Gain (Loss) on
Investments ($) | | | Total from
Operations ($) | | | Distributions
from Net
Investment
Income ($) | | | Distributions
from Net
Realized
Capital
Gains ($) | | Return of
Capital ($) | | | Total
Distributions ($) | | | Net Asset
Value,
End of
Period ($) | | | Market
Price,
End of
Period ($) | | Total
Return (%)(1) | | | Net
Assets
End of
Period ($)
(000) | | | Ratio of
Expenses to
Average Net
Assets (%) | | | Ratio of Net
Investment
Income to
Average Net
Assets (%) | | | Portfolio
Turnover
(%)(2) | |
| Impact Shares YWCA Women’s Empowerment ETF | |
| 2020 | | | 20.63 | | | | 0.28 | | | | 2.16 | | | | 2.44 | | | | (0.26 | ) | | — | | | — | | | | (0.26 | ) | | | 22.81 | | | 22.77 | | | 11.92 | | | | 7,414 | | | | 0.75 | (10) | | | 1.30 | | | | 47 | |
| 2019(3) | | | 20.00 | | | | 0.27 | | | | 0.63 | | | | 0.90 | | | | (0.25 | ) | | (0.02) | | | —^ | | | | (0.27 | ) | | | 20.63 | | | 20.62 | | | 4.71 | | | | 4,126 | | | | 0.76 | (4)(5) | | | 1.60 | (4) | | | 7 | |
Impact Shares NAACP Minority Empowerment ETF | | | | | |
| 2020 | | | 21.16 | | | | 0.28 | | | | 1.97 | | | | 2.25 | | | | (0.24 | ) | | — | | | — | | | | (0.24 | ) | | | 23.17 | | | 23.23 | | | 10.71 | | | | 5,792 | | | | 0.75 | (10) | | | 1.27 | | | | 25 | |
| 2019(6) | | | 20.00 | | | | 0.28 | | | | 1.17 | | | | 1.45 | | | | (0.28 | ) | | (0.01) | | | — | | | | (0.29 | ) | | | 21.16 | | | 21.11 | | | 7.37 | | | | 2,222 | | | | 0.75 | (4)(7) | | | 1.46 | (4) | | | 19 | |
Impact Shares Sustainable Development Goals Global Equity ETF | | | | | |
| 2020 | | | 20.54 | | | | 0.35 | | | | (0.70 | ) | | | (0.35 | ) | | | (0.14 | ) | | — | | | — | | | | (0.14 | ) | | | 20.05 | | | 20.00 | | | (1.75 | ) | | | 3,008 | | | | 0.75 | (11) | | | 1.72 | | | | 41 | |
| 2019(8) | | | 20.00 | | | | 0.32 | | | | 0.60 | | | | 0.92 | | | | (0.38 | ) | | — | | | — | | | | (0.38 | ) | | | 20.54 | | | 20.66 | | | 4.67 | | | | 1,027 | | | | 0.75 | (4)(9) | | | 2.08 | (4) | | | 25 | |
Amounts designated as “-“ are $0.
| | |
| * | | Per share data calculated using average shares method. |
| ^ | | Amount is less than $0.005. |
| (1) | | Total return is based on the change in net asset value of a share during the year or period and assumes reinvestment of dividends and distributions at net asset value. Total return is for the period indicated and periods of less than one year have not been annualized. The return shown does not reflect the deduction of taxes that a shareholder would pay on Fund distributions or the redemption of Fund shares. |
| (2) | | Portfolio turnover rate is for the period indicated and has not been annualized. Excludes effect of in-kind transfers. |
| (3) | | Commenced operations on August 24, 2018. |
| (4) | | Annualized. |
| (5) | | The ratio of Expenses to Average Net Assets includes the voluntary expense reimbursements (See Note 3). If these reimbursements were excluded, the ratio would have been 2.24% for the period ended June 30, 2019. |
| (6) | | Commenced operations on July 18, 2018. |
| (7) | | The ratio of Expenses to Average Net Assets includes the voluntary expense reimbursements (See Note 3). If these reimbursements were excluded, the ratio would have been 1.66% for the period ended June 30, 2019. |
| (8) | | Commenced operations on September 20, 2018. |
| (9) | | The ratio of Expenses to Average Net Assets includes the voluntary expense reimbursements (See Note 3). If these reimbursements were excluded, the ratio would have been 1.38% for the period ended June 30, 2019. |
| (10) | | The ratio of Expenses to Average Net Assets includes the voluntary expense reimbursements (See Note 3). If these reimbursements were excluded, the ratio would have been 1.11% for the year ended June 30, 2020. |
| (11) | | The ratio of Expenses to Average Net Assets includes the voluntary expense reimbursements (See Note 3). If these reimbursements were excluded, the ratio would have been 1.27% for the year ended June 30, 2020. |
The accompanying notes are an integral part of the financial statements.
22
Impact Shares Trust I
Notes to Financial Statements
June 30, 2020
1. ORGANIZATION
Impact Shares Trust I (the “Trust”), is an open-end management investment company organized as a Delaware statutory trust pursuant to a Declaration of Trust dated May 19, 2016. The Trust is registered with the Securities and Exchange Commission (the “Commission”) under the Investment Company Act of 1940 (the “1940 Act”), as amended, as an open-end management investment company with three separate exchange-traded funds or series. The financial statements herein and the related notes are those of Impact Shares YWCA Women’s Empowerment ETF (the “Women’s ETF”), Impact Shares NAACP Minority Empowerment ETF (the “Minority ETF”) and Impact Shares Sustainable Development Goals Global Equity ETF (the “Sustainable Development ETF”) (each a “Fund” and collectively, the “Funds”). The Funds seek to provide investment results that, before fees and expenses, track the total return performance of the Morningstar® Women’s Empowerment Index, the Morningstar® Minority Empowerment Index and the Morningstar® Societal Development Index (the “Underlying Indices” or “Index”), respectively. The Funds are classified as “non-diversified” funds under the 1940 Act. Impact Shares, Corp. (the “Adviser”) serves as the investment adviser for the Funds and is subject to the supervision of the Board of Trustees (the “Board”). The Adviser is responsible for managing the investment activities of the Funds, the Funds’ business affairs and other administrative matters. The Adviser is a nonprofit corporation organized under the laws of Texas and is tax exempt under Section 501(c)(3) of the Internal Revenue Code.
The Women’s ETF commenced operations on August 24, 2018.
The NAACP Minority ETF commenced operations on July 18, 2018.
The Sustainable Development ETF commenced operations on September 20, 2018.
Shares of the Funds (“Shares”) are listed and traded on NYSE Arca, Inc. Market prices for the Shares may be different from their net asset value (“NAV”). The Funds will issue and redeem Shares on a continuous basis at NAV only in large blocks of Shares, each of which comprises 50,000 Shares, called “Creation Units”. Creation Units will be issued and redeemed principally in-kind for securities included in the Funds’ Underlying Indices. Once created, Shares will trade in a secondary market at market prices that change throughout the day in amounts less than a Creation Unit.
2. SIGNIFICANT ACCOUNTING POLICIES
The following is a summary of the significant accounting policies followed by the Funds:
Use of Estimates — The Funds are registered investment companies under Accounting Standard Codification in Topic 946 by the U.S. Financial Accounting Standards Board. The preparation of financial statements in conformity with U.S. generally accepted accounting principles (“U.S. GAAP”) requires management to make estimates and assumptions that affect the reported amounts of assets and liabilities and disclosure of contingent assets and liabilities at the date of the financial statements and the reported amounts of increases and decreases in net assets from operations during the reporting period. Actual results could materially differ from those estimates.
Security Valuation — Securities listed on a securities exchange, market or automated quotation system for which quotations are readily available (except for securities traded on the NASDAQ Stock Market (the “NASDAQ”)), including securities traded over the counter, are valued at the last quoted sale price on the primary exchange or market (foreign or domestic) on which they are traded (or at approximately 4:00 pm Eastern Time if a security’s primary exchange is normally open at that time), or, if there is no such reported sale, at the most recent quoted bid. For securities traded on NASDAQ, the NASDAQ Official Closing Price will be used. The prices for foreign securities are reported in local currency and converted to U.S. dollars using spot currency exchange rates. If available, debt securities are priced based upon valuations provided by independent, third-party pricing agents. Such values generally reflect the last reported sales price if the security is actively traded. The third-party pricing agents may also value debt securities at an evaluated bid price by employing methodologies that utilize actual market transactions, broker-supplied valuations, or other methodologies designed to identify the fair value for such securities. Debt obligations with remaining maturities of sixty days or less may be valued at their amortized cost, if the Funds’ Fair Value Committee concludes it approximates fair value after taking into account factors such as credit, liquidity and interest rate conditions as well as issuer specific factors. Foreign securities listed on foreign exchanges are valued based on quotations from the primary market in which they are traded and are translated from the local currency into U.S. dollars using current exchange rates. Foreign securities may trade on weekends or other days when the Fund does not calculate NAV. As a result, the fair value of these investments may change on days when you cannot buy or redeem shares of
23
Impact Shares Trust I
Notes to Financial Statements
June 30, 2020
the Fund. Prices for most securities held in the Funds are provided daily by recognized independent pricing agents. If a security price cannot be obtained from an independent, third-party pricing agent, the Funds seek to obtain a bid price from at least one independent broker. Securities for which market prices are not “readily available” are valued in accordance with fair value procedures established and implemented by the Board. Some of the more common reasons that may necessitate that a security be valued using Fair Value Procedures include: the security’s trading has been halted or suspended; the security has been de-listed from a national exchange; the security’s primary trading market is temporarily closed at a time when under normal conditions it would be open; the security has not been traded for an extended period of time; the security’s primary pricing source is not able or willing to provide a price; or trading of the security is subject to local government-imposed restrictions. In addition, the Funds may fair value their securities if an event that may materially affect the value of the Funds’ securities that traded outside of the United States (a “Significant Event”) has occurred between the time of the security’s last close and the time that the Funds calculate their net asset value. A Significant Event may relate to a single issuer or to an entire market sector. Events that may be Significant Events include: government actions, natural disasters, armed conflict, acts of terrorism and significant market fluctuations. If the Adviser becomes aware of a Significant Event that has occurred with respect to a security or group of securities after the closing of the exchange or market on which the security or securities principally trade, but before the time at which the Funds calculate their net asset value, it may request that a Committee meeting be called. When a security is valued in accordance with the fair value procedures, the Committee will determine the value after taking into consideration relevant information reasonably available to the Committee .In accordance with the authoritative guidance on fair value measurements and disclosure under U.S. GAAP, the Funds disclose fair value of their investments in a hierarchy that prioritizes the inputs to valuation techniques used to measure the fair value. The objective of a fair value measurement is to determine the price that would be received to sell an asset or paid to transfer a liability in an orderly transaction between market participants at the measurement date (an exit price). Accordingly, the fair value hierarchy gives the highest priority to quoted prices (unadjusted) in active markets for identical assets or liabilities (Level 1) and the lowest priority to unobservable inputs (Level 3). The three levels of the fair value hierarchy are described below:
| | • | | Level 1 – Unadjusted quoted prices in active markets for identical, unrestricted assets or liabilities that the Funds have the ability to access at the measurement date; |
| | • | | Level 2 – Quoted prices which are not active, or inputs that are observable (either directly or indirectly) for substantially the full term of the asset or liability; and |
| | • | | Level 3 – Prices, inputs or exotic modeling techniques which are both significant to the fair value measurement and unobservable (supported by little or no market activity). |
The valuation techniques used by the Funds to measure fair value during the year ended June 30, 2020 maximized the use of observable inputs and minimized the use of unobservable inputs.
For the year ended June 30, 2020, there have been no significant changes to the Funds’ fair valuation methodologies.
Federal Income Taxes — It is the Funds’ intention to qualify as a regulated investment company for Federal income tax purposes by complying with the appropriate provisions of Subchapter M of the Internal Revenue Code of 1986 (the “Code”), as amended. Accordingly, no provisions for federal income taxes have been made in the financial statements.
The Funds evaluate tax positions taken or expected to be taken in the course of preparing the Funds’ tax returns to determine whether it is “more-likely-than-not” (i.e., greater than 50-percent) that each tax position will be sustained upon examination by a taxing authority based on the technical merits of the position. Tax positions not deemed to meet the more-likely-than-not threshold are recorded as a tax benefit or expense in the current period. The Funds did not record any tax provision in the current period. However, management’s conclusions regarding tax positions taken may be subject to review and adjustment at a later date based on factors including, but not limited to, examination by tax authorities (i.e., the last 3 year ends, as applicable), on-going analysis of and changes to tax laws, regulations and interpretations thereof. As of and during the year ended June 30, 2020, the Funds did not have a liability for any unrecognized tax benefits. The Funds recognize interest and penalties, if any, related to unrecognized tax benefits as income tax expense in the Statement of Operations. For the year ended June 30, 2020, the Funds did not recognize any interest or penalties.
Security Transactions and Investment Income — Security transactions are accounted for on trade date. Costs used in determining realized gains and losses on the sale of investment securities are based on specific identification. Dividend
24
Impact Shares Trust I
Notes to Financial Statements
June 30, 2020
income is recorded on the ex-dividend date. Interest income is recognized on the accrual basis. Withholding taxes and reclaims on foreign dividends have been provided for in accordance with the Funds’ understanding of the applicable country’s tax rules and rates.
Dividends and Distributions to Shareholders — The Funds intend to declare and pay dividends of net investment income quarterly and to pay any capital gain distributions on an annual basis. All distributions are recorded on ex-dividend date.
Cash and Cash Equivalents — Idle cash may be swept into various time deposits and is classified as cash and cash equivalents on the Statement of Assets and Liabilities. The Funds maintain cash in bank deposit accounts which, at times, may exceed United States federally insured limits. Amounts swept overnight are available on the next business day.
Cash Overdraft Charges — Per the terms of an agreement with the Bank of New York Mellon, if a Fund has a cash overdraft on a given day, it will be assessed an overdraft charge. Cash overdraft charges are included in other fees on the Statement of Operations.
Creation Units — The Funds issue and redeem shares (“Shares”) at Net Asset Value (“NAV”) and only in large blocks of 50,000 Shares (each block of Shares for the Funds are called a “Creation Unit” or multiples thereof). Purchasers of Creation Units at NAV must pay a standard creation transaction fee of $500 per transaction. The fee is a single charge and will be the same regardless of the number of Creation Units purchased by an investor on the same day. An Authorized Participant who holds Creation Units (“Authorized Participants”) and wishes to redeem at NAV would also pay a standard redemption transaction fee of $500 per transaction to the custodian on the date of such redemption, regardless of the number of Creation Units redeemed that day. Creations and redemptions are also subject to an additional variable charge of up to 1% of the net asset value per Creation Unit, inclusive of the standard transaction fee, for (i) in-kind creations or redemptions effected outside the normal Clearing Process, (ii) in whole or partial cash creations, (iii) in whole or partial cash redemptions or (iv) non-standard orders. The variable component is primarily designed to cover non-standard charges, e.g., brokerage, taxes, foreign exchange, execution, market impact and other costs and expenses related to the execution of trades resulting from such transaction. In all cases, the Transaction Fee will be limited in accordance with the requirements of the SEC applicable to management investment companies offering redeemable securities. The Fund may determine not to charge the variable portion of a Transaction Fee on certain orders when Impact Shares has determined that doing so is in the best interests of Fund shareholders, e.g., for redemption orders that facilitate the rebalance of the Fund’s portfolio in a more tax efficient manner than could be achieved without such order. The variable portion of a Transaction Fee may be higher or lower than the trading expenses incurred by a Fund with respect to the transaction.
Except when aggregated in Creation Units, Shares are not redeemable securities of the Funds. Shares of the Funds may only be purchased or redeemed by certain financial institutions (“Authorized Participants”). An Authorized Participant is either (i) a broker-dealer or other participant in the clearing process through the Continuous Net Settlement System of the National Securities Clearing Corporation or (ii) a Depository Trust Company (“DTC”) participant and, in each case, must have executed an Authorized Participant Agreement with the Funds’ distributor. Most retail investors will not qualify as Authorized Participants or have the resources to buy and sell whole Creation Units. Therefore, they will be unable to purchase or redeem the Shares directly from the Funds. Rather, most retail investors will purchase Shares in the secondary market with the assistance of a broker and will be subject to customary brokerage commissions or fees.
On August 14, 2020, the Board of Trustees approved a temporary reduction in the size of a creation unit from 50,000 shares to 25,000 shares for the period from November 12, 2019 through December 31, 2019 for each Fund. The size of a creation unit for a Fund may be changed from time to time in the future if determined to be in the best interests of a Fund by the President of the Fund.
If a Creation Unit is purchased or redeemed in cash, a higher transaction fee will be charged. The following table discloses the Creation Unit breakdown based on the NAV as of June 30, 2020:
| | | | | | | | | | | | | | | | |
| | | Creation Unit
Shares | | | Creation
Transaction Fee | | | Value | | | Redemption
Transaction
Fee | |
Impact Shares YWCA Women’s Empowerment ETF | | | 50,000 | | | $ | 500 | | | $ | 1,140,500 | | | $ | 500 | |
Impact Shares NAACP Minority Empowerment ETF | | | 50,000 | | | | 500 | | | | 1,158,500 | | | | 500 | |
| Impact Shares Sustainable Development Goals Global Equity ETF | | | 50,000 | | | | 500 | | | | 1,002,500 | | | | 500 | |
25
Impact Shares Trust I
Notes to Financial Statements
June 30, 2020
Foreign Currency Translation — The books and records of the Funds are maintained in U.S. dollars. Investment securities and other asset and liabilities denominated in a foreign currency are translated into U.S. dollars on the date of valuation. Purchases and sales of investment securities, income and expenses are translated into U.S. dollars at the relevant rates of exchange prevailing on the respective dates of such transactions. The Funds do not isolate that portion of realized or unrealized gains and losses resulting from changes in the foreign exchange rate from fluctuations arising from changes in the market prices of the securities. These gains and losses are included in net realized and unrealized gains and losses on investments on the Statement of Operations. Net realized and unrealized gains and losses on foreign currency transactions represent net foreign exchange gains or losses from foreign currency exchange contracts, disposition of foreign currencies, currency gains or losses realized between trade and settle dates on securities transactions and the difference between the amount of the investment income and foreign withholding taxes recorded on the Funds’ books and the U.S. dollar equivalent amounts actually received or paid.
Indemnifications — In the normal course of business, the Funds enter into contracts that provide general indemnifications. The Funds’ maximum exposure under these arrangements is dependent on future claims that may be made against the Funds and, therefore, cannot be established; however, based on experience, the risk of loss from such claims is considered remote.
3. AGREEMENTS
Investment Advisory Agreement
The Adviser serves as investment adviser to the Funds, pursuant to an investment advisory agreement (“Advisory Agreement”). The Adviser arranges for transfer agency, custody, fund administration and accounting, and other non-distribution related services necessary for the Funds to operate. The Adviser administers the Funds’ business affairs, provides office facilities and equipment and certain clerical, bookkeeping and administrative services, and provides its officers and employees to serve as officers or Trustees of the Trust.
For the services it provides to the Funds, the Adviser receives a fee, which is calculated daily and paid monthly, at an annual rate of 0.75% of average daily net assets of the Funds. Under the Advisory Agreement, the Adviser is responsible for substantially all expenses of the Fund, including the cost of transfer agency, custody, fund administration, legal, audit and other services except for distribution and service fees payable pursuant to a Rule 12b-1 plan, if any; salaries and other compensation or expenses, including travel expenses, of any of the Funds’ executive officers and employees, if any, who are not officers, directors, shareholders, members, partners or employees of the Adviser or its subsidiaries or affiliates; taxes and governmental fees, if any, levied against the Funds; brokerage fees and commissions, and other portfolio transaction expenses incurred by or for the Funds; expenses of the Funds’ securities lending (if any), including any securities lending agent fees, as governed by a separate securities lending agreement; costs, including interest expenses, of borrowing money or engaging in other types of leverage financing; fees and expenses of any underlying funds or other pooled vehicles in which the Funds invest; dividend and interest expenses on short positions taken by the Funds; fees and expenses, including travel expenses, and fees and expenses of legal counsel retained for their benefit, of Trustees who are not officers, employees, partners, shareholders or members of the Adviser or its subsidiaries or affiliates; extraordinary expenses, including extraordinary legal expenses, as may arise, including, without limitation, expenses incurred in connection with litigation, proceedings, other claims, contractual arrangements with Partner Nonprofits and the legal obligations of the Funds to indemnify its Trustees, officers, employees, shareholders, distributors, and agents with respect thereto; fees and expenses, including legal, printing and mailing, solicitation and other fees and expenses associated with and incident to shareholder meetings and proxy solicitations involving shareholder proposals or other non-routine matters that are not initiated or proposed by the Funds’ management; organizational and offering expenses of the Funds, including registration (including Share registration fees), legal, marketing, printing, accounting and other expenses, associated with organizing the Funds in its state of jurisdiction and in connection with the initial registration of the Funds under the 1940 Act and the initial registration of its shares under the Securities Act (i.e., through the effectiveness of the Funds’ initial registration statement on Form N-1A); fees and expenses associated with seeking, applying for and obtaining formal exemptive, no-action and/or other relief from the SEC; and expenses of the Funds which are capitalized in accordance with generally accepted accounting principles (the “Excluded Expenses”).
Certain officers or interested trustees of the Trust are also officers or employees of the Advisor or its affiliates. They receive no fees for serving as officers of the Trust.
26
Impact Shares Trust I
Notes to Financial Statements
June 30, 2020
The expense limitation is set at an annual rate of 0.75%. The Advisor has contractually agreed to reimburse the Funds for any expenses in excess of the limit. This expense limitation will continue through at least October 28, 2020, and may not be terminated prior to this date without the action or consent of the Board.
Distribution Agreement
SEI Investments Distribution Co. (the “Distributor”) serves as the Funds’ underwriter and distributor of Shares pursuant to a Distribution Agreement. Under the Distribution Agreement, the Distributor, as agent, receives orders to purchase shares in Creation Units and transmits such orders to the Funds’ custodian and transfer agent. The Distributor has no obligation to sell any specific quantity of Fund shares. The Distributor bears the following costs and expenses relating to the distribution of shares: (i) the expenses of maintaining its registration or qualification as a dealer or broker under federal or state laws; (ii) filing fees; and (iii) all other expenses incurred in connection with the distribution services, that are not reimbursed by the Adviser, as contemplated in the Distribution Agreement. The Distributor does not maintain any secondary market in Fund Shares.
The Funds have adopted a Distribution and Service Plan (the “Plan”) pursuant to Rule 12b-1 under the 1940 Act. In accordance with the Plan, the Funds are authorized to pay an amount up to 0.25% of their average net assets each year for certain distribution-related activities. For the year ended June 30, 2020, no fees were charged by the Distributor under the Plan. No payments have yet been authorized by the Board, nor are any such expected to be made by a Fund under the Plan during the current fiscal year.
For the year ended June 30, 2020, the Funds incurred Trustee fees of $22,419, $10,637, and $6,944 for the Women’s ETF, Minority ETF, and Sustainable Development ETF, respectively, for which the Adviser voluntarily agreed to reimburse the Funds. Of these amounts, $22,419, $10,637, and $6,944 remain payable to the Trustees and are shown as a receivable from the Adviser on the Statements of Assets and Liabilities for the Women’s ETF, Minority ETF, and Sustainable Development ETF, respectively, as of June 30, 2020. Trustee fees are shown gross within expenses with a corresponding expense reimbursement on the Statement of Operations as such fees were voluntarily paid by the Adviser on behalf of the Funds. The Adviser does not have the ability to recoup these voluntary expense reimbursements in the future.
Administrator, Custodian and Transfer Agent
SEI Investments Global Funds Services (the “Administrator”) serves as the Funds’ Administrator pursuant to an Administration Agreement. The Bank of New York Mellon (the “Custodian” and “Transfer Agent”) serves as the Funds’ Custodian and Transfer Agent pursuant to a Custodian Agreement and Transfer Agency Services Agreement. The Adviser of the Funds pays these fees.
Certain officers of the Trust may also be officers of the Administrator or its affiliates. They receive no fees for serving as officers of the Trust.
4. INVESTMENT TRANSACTIONS
For the year ended June 30, 2020, the purchases and sales of investments in securities, excluding in-kind transactions, long-term U.S. Government and short-term securities were:
| | | | | | | | |
| | | Purchases | | | Sales | |
Impact Shares YWCA Women’s Empowerment ETF | | $ | 2,814,544 | | | $ | 2,931,843 | |
Impact Shares NAACP Minority Empowerment ETF | | | 763,115 | | | | 828,331 | |
Impact Shares Sustainable Development Goals Global Equity ETF | | | 816,773 | | | | 751,294 | |
There were no purchases or sales of long-term U.S. Government securities by the Funds.
27
Impact Shares Trust I
Notes to Financial Statements
June 30, 2020
For the year ended June 30, 2020, in-kind transactions associated with creations and redemptions were:
| | | | | | | | | | | | |
| | | Purchases | | | Sales | | | Realized
Gain/(Loss) | |
Impact Shares YWCA Women’s Empowerment ETF | | $ | 2,530,398 | | | $ | - | | | $ | - | |
Impact Shares NAACP Minority Empowerment ETF | | | 3,232,443 | | | | - | | | | - | |
Impact Shares Sustainable Development Goals Global Equity ETF | | | 1,793,690 | | | | - | | | | - | |
For the period ended June 30, 2019, in-kind transactions associated with creations and redemptions were:
| | | | | | | | | | | | |
| | | Purchases | | | Sales | | | Realized
Gain/(Loss) | |
Impact Shares YWCA Women’s Empowerment ETF | | $ | 4,211,993 | | | $ | - | | | $ | - | |
Impact Shares NAACP Minority Empowerment ETF | | | 3,132,519 | | | | 1,004,168 | | | | 55,919 | |
Impact Shares Sustainable Development Goals Global Equity ETF | | | - | | | | 818,854 | | | | 43,423 | |
5. TAX INFORMATION
The amount and character of income and capital gain distributions to be paid, if any, are determined in accordance with Federal income tax regulations, which may differ from U.S. GAAP. As a result, net investment income (loss) and net realized gain (loss) on investment transactions for a reporting period may differ significantly from distributions during such period. These book/tax differences may be temporary or permanent. To the extent these differences are permanent in nature, they are charged or credited to distributable earnings or paid-in capital, as appropriate, in the period that the differences arise.
The tax character of dividends and distributions paid during the year ended June 30, 2020 and period ended June 30, 2019 were as follows:
| | | | | | | | | | | | | | | | |
| | | Ordinary
Income | | | Long-Term
Capital Gain | | | Return of
Capital | | | Total | |
Impact Shares YWCA Women’s Empowerment ETF | | | | | | | | | | | | | | | | |
2020 | | $ | 79,706 | | | $ | — | | | $ | — | | | $ | 79,706 | |
2019 | | | 38,993 | | | | — | | | | — | | | | 38,993 | |
Impact Shares NAACP Minority Empowerment ETF | |
2020 | | | 36,817 | | | | — | | | | — | | | | 36,817 | |
2019 | | | 29,967 | | | | — | | | | 37 | | | | 30,004 | |
Impact Shares Sustainable Development Goals Global Equity ETF | |
2020 | | | 9,427 | | | | — | | | | — | | | | 9,427 | |
2019 | | | 26,447 | | | | — | | | | — | | | | 26,447 | |
As of June 30, 2020, the components of distributable earnings (accumulated losses) on a tax basis were as follows:
| | | | | | | | | | | | | | | | | | | | | | | | |
| | | Undistributed
Ordinary
Income | | | Undistributed
Long Term
Capital Gains | | | Late-Year
Loss
Deferral | | | Unrealized
Appreciation/
(Depreciation) | | | Other
Temporary
Differences | | | Total
Distributable
Earnings/(Loss) | |
Impact Shares YWCA Women’s Empowerment ETF | | $ | 216,873 | | | $ | 73,582 | | | $ | — | | | $ | 552,172 | | | $ | — | | | $ | 842,627 | |
Impact Shares NAACP Minority Empowerment ETF | | | 10,520 | | | | 26,990 | | | | — | | | | 237,184 | | | | — | | | | 274,694 | |
Impact Shares Sustainable Development Goals Global Equity ETF | | | 2,686 | | | | 4,489 | | | | (10,253 | ) | | | (122,293 | ) | | | 2 | | | | (125,369 | ) |
Late year loss deferral represents specified losses realized from foreign currency transactions from November 1 to June 30, 2020 that, in accordance with Federal income tax regulations, the Fund may elect to defer and treat as having arisen in the following fiscal year.
28
Impact Shares Trust I
Notes to Financial Statements
June 30, 2020
The Federal tax cost and aggregate gross unrealized appreciation and depreciation on investments and foreign currency transactions held by the Funds at June 30, 2020, were as follows:
| | | | | | | | | | | | | | | | |
| | | Federal Tax
Cost | | | Aggregate
Gross
Unrealized
Appreciation | | | Aggregate
Gross
Unrealized
Depreciation | | | Net
Unrealized
Appreciation/
(Depreciation) | |
Impact Shares YWCA Women’s Empowerment ETF | | $ | 6,862,147 | | | $ | 1,045,556 | | | $ | (493,384 | ) | | $ | 552,172 | |
Impact Shares NAACP Minority Empowerment ETF | | | 5,553,859 | | | | 506,355 | | | | (269,171 | ) | | | 237,184 | |
Impact Shares Sustainable Development Goals Global Equity ETF | | | 3,122,075 | | | | 217,220 | | | | (339,513 | ) | | | (122,293 | ) |
The book/tax difference on cost is primarily related to wash sale adjustment.
6. RISKS OF INVESTING IN THE FUNDS
As with all exchange traded funds (“ETFs”), a shareholder of the Fund is subject to the risk that his or her investment could lose money. The Funds are subject to the principal risks noted below, any of which may adversely affect the Fund’s NAV, trading price, yield, total return and ability to meet its investment objective. A more complete description of principal risks is included in the prospectus under the heading “Principal Risks”.
Under normal circumstances, the Funds will invest at least 80% of their total assets in securities of the Index, which reflects the performance of an investable universe of publicly-traded companies that directly or indirectly provide services or support to ETFs, including but not limited to the management, servicing, trading or sale of ETFs (“ETF Activities”).
An investment in the Fund is not a bank deposit and is not insured or guaranteed by the FDIC or any other government agency. As with any investment company, there is no guarantee that the Fund will achieve its goal.
Asset Class Risk (All Funds) - The securities in an Underlying Index or in a Fund’s portfolio may underperform the returns of other securities or indices that track other countries, regions, industries, groups of industries, markets, asset classes or sectors. Various types of securities or indices tend to experience cycles of outperformance and underperformance in comparison to general securities markets.
Brexit (Impact Shares Sustainable Development Goals Global Equity ETF only) - In June 2016, the United Kingdom approved a referendum to leave the European Union (commonly known as “Brexit”). On January 31, 2020, the United Kingdom left the European Union and entered a transition period that is scheduled to end on December 31, 2020. Negotiations to settle what form Brexit will take are due to be finalized during the transition period and, therefore, at present the political and economic consequences of Brexit are uncertain. Given the size and importance of the United Kingdom’s economy, uncertainty about its legal, political, and economic relationship with the remaining member states of the European Union may continue to be a source of instability. Moreover, other countries may seek to withdraw from the European Union and/or abandon the euro, the common currency of the European Union. The ultimate effects of these events and other socio-political or geopolitical issues are not known but could profoundly affect global economies and markets. Whether or not a Fund invests in securities of issuers located in Europe or with significant exposure to European issuers or countries, these events could negatively affect the value and liquidity of the Fund’s investments.
Cash Transaction Risk (All Funds) - The Funds can effect creations and redemptions principally for cash, rather than for in-kind securities. ETFs generally are able to make in-kind redemptions and avoid being taxed on gain on the distributed portfolio securities at the fund level. Because the Funds currently can effect redemptions for cash, rather than for in-kind securities, they may be required to sell portfolio securities in order to obtain the cash needed to distribute redemption proceeds. The Funds may recognize a capital gain on these sales that might not have been incurred if the Funds had made a redemption in-kind, and this may decrease the tax efficiency of the Funds compared to ETFs that utilize an in-kind redemption process.
Commodities Risk (All Funds) - Commodities markets historically have been extremely volatile, and the performance of securities and other instruments that provide exposure to those markets therefore also may be highly volatile. The commodities markets may fluctuate widely based on a variety of factors. These include changes in overall market movements, domestic and foreign political and economic events and policies, war, acts of terrorism, changes in domestic or foreign
29
Impact Shares Trust I
Notes to Financial Statements
June 30, 2020
interest rates and/or investor expectations concerning interest rates, domestic and foreign inflation rates and/or investor expectations concerning inflation rates and investment and trading activities of mutual funds, hedge funds and commodities funds. Commodity-linked derivative instruments have a high degree of price variability and are subject to rapid and substantial price changes. Commodity-linked derivative instruments may employ leverage, which creates the possibility for losses greater than the amount invested. A Fund’s investments in commodity-linked instruments may bear on or be limited by each Fund’s intention to qualify as a regulated investment company.
Counterparty Risk (All Funds) - The Funds may engage in transactions in securities and financial instruments that involve counterparties. Counterparty risk is the risk that a counterparty (the other party to a transaction or an agreement or the party with whom a Fund executes transactions) to a transaction with a Fund may be unable or unwilling to make timely principal, interest, settlement or margin payments, or otherwise honor its obligations. If a counterparty becomes bankrupt or otherwise fails to perform its obligations due to financial difficulties, the affected Fund’s income or the value of its assets may decrease. A Fund may experience significant delays in obtaining any recovery in a bankruptcy or other reorganization proceeding and a Fund may obtain only limited recovery or may obtain no recovery in such circumstances. In an attempt to limit the counterparty risk associated with such transactions, the Funds conduct business only with financial institutions judged by the Adviser to present acceptable credit risk.
Derivatives Risk (All Funds) - Derivatives Risk is a combination of several risks, including the risks that: (1) an investment in a derivative instrument may not correlate well with the performance of the securities or asset class to which the Fund seeks exposure, (2) derivative contracts, including options, may expire worthless and the use of derivatives may result in losses to the Fund, (3) a derivative instrument entailing leverage may result in a loss greater than the principal amount invested, (4) derivatives not traded on an exchange may be subject to credit risk, for example, if the counterparty does not meet its obligations (see also “Counterparty Risk”), and (5) derivatives not traded on an exchange may be subject to liquidity risk and the related risk that the instrument is difficult or impossible to value accurately. As a general matter, when the Fund establishes certain derivative instrument positions, such as certain futures and options contract positions, it will segregate liquid assets (such as cash, U.S. Treasury bonds or commercial paper) equivalent to the Fund’s outstanding obligations under the contract or in connection with the position. In addition, recent legislation has called for a new regulatory framework for the derivatives market. The impact of the new regulations are still unknown, but has the potential to increase the costs of using derivatives, may limit the availability of some forms of derivatives or the Fund’s ability to use derivatives, and may adversely affect the performance of some derivative instruments used by the Fund as well as the Fund’s ability to pursue its investment objective through the use of such instruments.
Emerging Markets Risk (Impact Shares Sustainable Development Goals Global Equity ETF only) - Investing in issuers located in or tied economically to emerging markets is subject to the same risks as foreign market investments, generally to a greater extent. The Fund will be subject to these risks to an even greater extent, to the extent the Fund invests in issuers exposed to countries defined as “low income” or “lower middle income” by the World Bank or as a “Least Developed Country” by the United Nations. These countries typically confront severe structural impediments to sustainable development and are highly vulnerable to economic and environmental shocks and have low levels of human assets. Emerging markets may have additional risks including greater fluctuations in market values and currency exchange rates; increased risk of default; greater social, economic, and political uncertainty and instability; increased risk of nationalization, expropriation, or other confiscation of assets of issuers to which the Fund may be exposed; increased risk of embargoes or economic sanctions on a country, sector, or issuer; greater governmental involvement in the economy; less governmental supervision and regulation of the securities markets and participants in those markets; controls on non-U.S. investment, capital controls and limitations on repatriation of invested capital, dividends, interest, and other income, and on the Fund’s ability to exchange local currencies for U.S. dollars; lower levels of liquidity; inability to purchase and sell investments or otherwise settle security or derivative transactions; greater risk of issues with share registration and safe custody; unavailability of currency hedging techniques; differences in, or lack of, auditing and financial reporting standards and resulting unavailability of material information about issuers; slower clearance and longer settlement; and difficulties in obtaining and/or enforcing legal judgments.
Additionally a foreign issuer is not generally subject to uniform accounting, auditing and financial reporting standards and practices comparable to those in the United States. The Public Company Accounting Oversight Board, which regulates auditors of U.S. public companies, is unable to inspect audit work papers in certain foreign countries. Investors in foreign
30
Impact Shares Trust I
Notes to Financial Statements
June 30, 2020
countries often have limited rights and few practical remedies to pursue shareholder claims, including class actions or fraud claims, and the ability of the U.S. Securities and Exchange Commission, the U.S. Department of Justice and other authorities to bring and enforce actions against foreign issuers or foreign persons is limited.
Exchange-Traded Funds Risk (All Funds) - The price movement of an exchange-traded fund may not exactly track the underlying index and may result in a loss. In addition, shareholders bear both their proportionate share of the Fund’s expenses and similar expenses of the underlying investment company when the Fund invests in shares of another investment company.
Equity Investing Risk (All Funds) - The market prices of equity securities owned by a Fund may go up or down, sometimes rapidly or unpredictably. The value of a security may decline for a number of reasons that may directly relate to the issuer, such as management performance, financial leverage, non-compliance with regulatory requirements, and reduced demand for the issuer’s goods or services. The values of equity securities also may decline due to general industry or market conditions that are not specifically related to a particular company, such as real or perceived adverse economic conditions, changes in the general outlook for corporate earnings, changes in interest or currency rates, or adverse investor sentiment generally. In addition, equity markets tend to move in cycles, which may cause stock prices to fall over short or extended periods of time.
Ethnic Diversity Risk (Impact Shares NAACP Minority Empowerment ETF only) - The returns on a portfolio of securities that excludes companies that are not ethnically diverse may trail the returns on a portfolio of securities that includes companies that are not ethnically diverse. Investing only in a portfolio of securities that are ethnically diverse may affect the Fund’s exposure to certain types of investments and may adversely impact the Fund’s performance depending on whether such investments are in or out of favor in the market.
Fee Risk (All Funds) - Because the fees paid by a Fund to Impact Shares are based on the average daily value of the total assets of such Fund, less all accrued liabilities of such Fund (other than the amount of any outstanding borrowings constituting financial leverage), Impact Shares has a financial incentive to cause the Funds to utilize leverage, which creates a conflict of interest between Impact Shares, on the one hand, and the shareholders of the Funds, on the other hand.
Foreign Securities Risk (Impact Shares Sustainable Development Goals Global Equity ETF only) - Investments in securities of non-U.S. issuers involve certain risks not involved in domestic investments (for example, fluctuations in foreign exchange rates (for non-U.S. securities not denominated in U.S. dollars); future foreign economic, financial, political and social developments; nationalization; exploration or confiscatory taxation; smaller markets; different trading and settlement practices; less governmental supervision; and different accounting, auditing and financial recordkeeping standards and requirements) that may result in the Fund experiencing more rapid and extreme changes in value than a fund that invests exclusively in securities of U.S. companies. These risks are magnified for investments in issuers tied economically to emerging markets, the economies of which tend to be more volatile than the economies of developed markets. In addition, investments by the Fund in non-U.S. securities may be subject to withholding and other taxes imposed by foreign countries on dividends, interest, capital gains, or other income or proceeds. Those taxes will reduce the Fund’s yield on any such securities.
Futures Contracts Risk (All Funds) - Futures contracts provide for the future sale by one party and purchase by another party of a specified amount of an underlying asset at a price, date and time specified when the contract is made. Funds, such as the Funds, that use futures contracts, which are a type of derivative, are subject to the risk of loss caused by unanticipated market movements. In addition, there may at times be an imperfect correlation between the movement in the prices of futures contracts and the value of their underlying instruments or indexes and there may at times not be a liquid secondary market for certain futures contracts.
Gender Diversity Risk (Impact Shares YWCA Women’s Empowerment ETF only) - The returns on a portfolio of securities that excludes companies that are not gender diverse may trail the returns on a portfolio of securities that includes companies that are not gender diverse. Investing only in a portfolio of securities that are gender diverse may affect the Fund’s exposure to certain types of investments and may adversely impact the Fund’s performance depending on whether such investments are in or out of favor in the market.
Geographic Risk (Impact Shares Sustainable Development Goals Global Equity ETF only) - To the extent the Fund’s investments in a single country or a limited number of countries represent a large percentage of the Fund’s assets, the Fund will be subject to the risk that economic, political and social conditions in those countries will have a significant impact on its investment performance and the Fund’s shares may be subject to increased price volatility.
31
Impact Shares Trust I
Notes to Financial Statements
June 30, 2020
Illiquid Securities Risk (All Funds) - Illiquid investments may be difficult to resell at approximately the price they are valued in the ordinary course of business within seven days. When investments cannot be sold readily at the desired time or price, a Fund may have to accept a much lower price, may not be able to sell the investment at all or may be forced to forego other investment opportunities, all of which may adversely impact a Fund’s returns. Illiquid investments also may be subject to valuation risk.
Index Performance Risk (All Funds) - Each Fund is linked to an index maintained by a third party provider unaffiliated with the Funds or the Adviser. There can be no guarantee or assurance that the methodology used by the third party provider to create the index will result in the Funds achieving high, or even positive, returns. Further, there can be no guarantee that the methodology underlying the index or the daily calculation of the index will be free from error. It is also possible that the value of the index may be subject to intentional manipulation by third-party market participants. The particular indices used by the Funds may underperform other asset classes and may underperform other similar indices. Each of these factors could have a negative impact on the performance of the Funds.
Industry Concentration Risk (All Funds) - Because each Fund may invest 25% or more of the value of its assets in an industry or group of industries to the extent that the Underlying Index concentrates in an industry or group of industries, the Fund’s performance largely depends on the overall condition of such industry or group of industries and the Fund is susceptible to economic, political and regulatory risks or other occurrences associated with that industry or group of industries.
Intellectual Property Risk (All Funds) - The Funds rely on licenses that permit the Adviser to use the Underlying Indices and associated trade names, trademarks and service marks, as well as the Partner Nonprofits’ names and logos (the “Intellectual Property”) in connection with the investment strategies of each respective Fund and/or in marketing and other materials for each Fund. Such licenses may be terminated, and, as a result, the relevant Fund may lose its ability to use the Intellectual Property. In the event a license is terminated or the license provider does not have rights to license the Intellectual Property, the operations of such Fund may be adversely affected.
Limited Operating History Risk (All Funds) - The Funds have limited operating history for investors to evaluate. The Funds may not attract sufficient assets to achieve or maximize investment and operational efficiencies and remain viable. If a Fund fails to achieve sufficient scale, it may be liquidated.
Management Risk (All Funds) - Management risk is the risk associated with the fact that the Fund relies on the Adviser’s ability to achieve its investment objective. The Adviser may be incorrect in its assessment of the intrinsic value of companies whose securities the Fund holds, which may result in a decline in the value of Fund shares and failure to achieve its investment objective. The Fund’s portfolio manager uses qualitative analyses and/or models. Any imperfections or limitations in such analyses and models could affect the ability of the portfolio manager to implement strategies. The Adviser has limited experience managing an ETF. The relative lack of experience of the Adviser may increase the Fund’s management risk.
Market Price Variance Risk (All Funds) - Fund shares are listed for trading on NYSE (the “Exchange”) and can be bought and sold in the secondary market at prevailing market prices. The market prices of shares will fluctuate in response to changes in the NAV and supply and demand for shares. As a result, the trading prices of Shares may deviate significantly from NAV during periods of market volatility. The Adviser cannot predict whether shares will trade above, below or at their NAV. Given the fact that shares can be created and redeemed in Creation Units, the Adviser believes that large discounts or premiums to the NAV of shares should not be sustained in the long-term. In addition, the securities held by the Fund may be traded in markets that close at a different time than NYSE. Liquidity in those securities may be reduced after the applicable closing times. Accordingly, during the time when NYSE is open but after the applicable market closing, fixing or settlement times, bid-ask spreads and the resulting premium or discount to the Shares’ NAV may widen. Further, secondary markets may be subject to irregular trading activity, wide bid/ask spreads and extended trade settlement periods, which could cause a material decline in the Fund’s NAV. In times of market stress, market makers and authorized participants may step away from their respective roles in making a market in Fund shares or in executing purchase and redemption orders, which could lead to variances between the market price of Fund shares and the underlying value of those shares. Also, in stressed market conditions, the market for Fund shares may become less liquid in response to deteriorating liquidity of the Fund’s portfolio holdings, which could lead to differences between the market price of the Fund’s shares and the underlying value of those shares. During periods of high market volatility, a Fund share may trade at a significant discount to its NAV, and in these
32
Impact Shares Trust I
Notes to Financial Statements
June 30, 2020
circumstances certain types of brokerage orders may expose an investor to an increased risk of loss. A “stop order,” sometimes called a “stop-loss order,” may cause a Fund share to be sold at the next prevailing market price once the “stop” level is reached, which during a period of high volatility can be at a price that is substantially below NAV. By including a “limit” criteria with your brokerage order, you may be able to limit the size of the loss resulting from the execution of an ill-timed stop order. The Fund’s shares may be listed or traded on U.S. and non-U.S. stock exchanges other than the U.S. stock exchange where the Fund’s primary listing is maintained, and may otherwise be made available to non-U.S. investors through funds or structured investment vehicles similar to depositary receipts. There can be no assurance that the Fund’s shares will continue to trade on any such stock exchange or in any market or that the Fund’s shares will continue to meet the requirements for listing or trading on any exchange or in any market. The Fund’s shares may be less actively traded in certain markets than in others, and investors are subject to the execution and settlement risks and market standards of the market where they or their broker direct their trades for execution. Certain information available to investors who trade Fund shares on a U.S. stock exchange during regular U.S. market hours may not be available to investors who trade in other markets, which may result in secondary market prices in such markets being less efficient.
The Fund’s investment results are measured based upon the daily NAV of the Fund. Investors purchasing and selling shares in the secondary market may not experience investment results consistent with those experienced by those purchasing and redeeming directly with the Fund.
Mid-Cap Company Risk (All Funds) - Investing in securities of mid-cap companies may entail greater risks than investments in larger, more established companies. Mid-cap companies tend to have more narrow product lines, more limited financial resources and a more limited trading market for their stocks, as compared with larger companies. As a result, their stock prices may decline significantly as market conditions change.
Non-Diversification Risk (All Funds) - Due to the nature of the Funds’ investment strategies and their non-diversified status (for purposes of the 1940 Act), the Funds may invest a greater percentage of their respective assets in the securities of fewer issuers than a “diversified” fund, and accordingly may be more vulnerable to changes in the value of those issuers’ securities. Since the Funds invest in the securities of a limited number of issuers, the Funds are particularly exposed to adverse developments affecting those issuers, and a decline in the market value of a particular security held by a Fund is likely to affect such Fund’s performance more than if such Fund invested in the securities of a larger number of issuers. Although the Funds will be “non-diversified” for purposes of the 1940 Act, the Funds intend to comply with the diversification requirements under Subchapter M of the Code in order to be eligible to qualify as a regulated investment company.
Operational and Technology Risk (All Funds) - Cyber-attacks, disruptions, or failures that affect the Fund’s service providers, index providers, Authorized Participants (as defined below), market makers, counterparties, market participants, or issuers of securities held by the Fund may adversely affect the Fund and its shareholders, including by causing losses for the Fund or impairing Fund operations.
Options Risk (All Funds) - Options, such as covered calls and covered puts, are subject to the risk that significant differences between the securities and options markets that could result in an imperfect correlation between these markets.
Passive Investment Risk (All Funds) - The Funds are not actively managed and may be affected by a general decline in market segments included in the applicable Underlying Indices. The Funds invest in securities included in, or representative of, each Fund’s respective Underlying Index regardless of such security’s investment merits. The Adviser does not attempt to take defensive positions under any market conditions, including during declining markets.
Securities Market Risk (All Funds) - The value of securities owned by the Fund may go up or down, sometimes rapidly or unpredictably, due to factors affecting particular companies or the securities markets generally. A general downturn in the securities market may cause multiple asset classes to decline in value simultaneously. Many factors, including terrorism, war, natural disasters and the spread of infectious disease including epidemics or pandemics such as the recent COVID-19 outbreak can affect this value and you may lose money by investing in the Fund. These conditions (and their aftermath) have led, and in the future may lead, to increased short-term market volatility and may have adverse long-term effects on U.S. and world economies and markets generally. Likewise, natural and environmental disasters, including earthquakes, fires, floods, hurricanes, tsunamis and weather-related phenomena generally, as well as the spread of infectious disease including epidemics or pandemics such as the recent COVID-19 outbreak, can be highly disruptive to economies and markets, adversely affecting
33
Impact Shares Trust I
Notes to Financial Statements
June 30, 2020
individual companies, sectors, industries, markets, currencies, interest and inflation rates, credit ratings, investor sentiment, and other factors affecting the value of the Fund’s investments. To the extent the Fund takes significant positions in one or more specific sectors, countries or regions, the Fund will be subject to the risks associated with such sector(s), country(ies) or region(s) to a greater extent than would be a more broadly diversified fund.
Small-Cap Company Risk (All Funds) - Investing in the securities of small-cap companies either directly or indirectly through investments in ETFs, closed-end funds or mutual funds may pose greater market and liquidity risks than larger, more established companies, because of limited product lines and/or operating history, limited financial resources, limited trading markets, and the potential lack of management depth. In addition, the securities of such companies are typically more volatile than securities of larger capitalization companies.
Swaps Risk (All Funds) - Investments in swaps involve both the risks associated with an investment in the underlying investments or instruments (including equity investments) and counterparty risk. In a standard over-the-counter (“OTC”) swap transaction, two parties agree to exchange the returns, differentials in rates of return or some other amount calculated based on the “notional amount” of predetermined investments or instruments, which may be adjusted for an interest factor. Swaps can involve greater risks than direct investments in securities, because swaps may be leveraged and OTC swaps are subject to counterparty risk (e.g., the risk of a counterparty’s defaulting on the obligation or bankruptcy), credit risk and pricing risk (i.e., swaps may be difficult to value). Swaps may also be considered illiquid. Certain swap transactions, including interest rate swaps and index credit default swaps, may be subject to mandatory clearing and exchange trading, although the swaps in which the Fund will invest are not currently subject to mandatory clearing and exchange trading. The use of swaps is a highly specialized activity which involves investment techniques, risk analyses and tax planning different from those associated with ordinary portfolio securities transactions. The value of swaps, like many other derivatives, may move in unexpected ways and may result in losses for the Fund.
Tracking Error Risk (All Funds) - The performance of the Fund may diverge from that of the Underlying Index. Because the Fund employs a representative sampling strategy, the Fund may experience tracking error to a greater extent than a fund that seeks to replicate an index. The Adviser may not be able to cause the Fund’s performance to correlate to that of the Fund’s benchmark, either on a daily or aggregate basis. Because the Underlying Index rebalances monthly but the Fund is not obligated to do the same, the risk of tracking error may increase following the rebalancing of the Underlying Index.
7. OTHER
At June 30, 2020, the records of the Trust reflected that 100% of the Funds’ total Shares outstanding were held by three Authorized Participants, in the form of Creation Units. However, the individual shares comprising such Creation Units are listed and traded on the NYSE Arca, Inc. and have been purchased and sold by persons other than Authorized Participants.
8. SUBSEQUENT EVENTS
The Funds have evaluated the need for additional disclosures and/or adjustments resulting from subsequent events through the date the financial statements were issued. Based on this evaluation, no adjustments or disclosures were required to be added to the financial statements except as follows:
On August 14, 2020, the Board of Trustees approved the lowering of the expense cap for the Impact Shares NAACP Minority Empowerment ETF from 0.75% to 0.49% of average daily net assets attributable to shares of the Fund effective as of August 17, 2020. The expense cap for the Impact Shares YWCA Women’s Empowerment ETF and the Impact Shares Sustainable Development Goals Global Equity ETFs remain at 0.75% of average daily net assets attributable to shares of each of these Funds. The expense cap for each Fund has been extended to at least October 28, 2021.
34
Impact Shares Trust I
Report of Independent Registered Public Accounting Firm
June 30, 2020
To the Shareholders and the Board of Trustees of Impact Shares Trust I
Opinion on the Financial Statements
We have audited the accompanying statements of assets and liabilities of Impact Shares Trust I (the “Trust”) (comprising Impact Shares NAACP Minority Empowerment ETF, Impact Shares Sustainable Development Goals Global Equity ETF, and Impact Shares YWCA Women’s Empowerment ETF (collectively referred to as the “Funds”)), including the schedules of investments, as of June 30, 2020, and the related statements of operations for the year then ended, the statement of changes in net assets and the financial highlights for each of the periods indicated in the table below and the related notes (collectively referred to as the “financial statements”). In our opinion, the financial statements present fairly, in all material respects, the financial position of each of the Funds comprising Impact Shares Trust I at June 30, 2020, the results of their operations for the year then ended, and changes in net assets and financial highlights for each of the periods indicated in the table below, in conformity with U.S. generally accepted accounting principles.
| | | | |
| Funds comprising the Impact Shares Trust I | | Statement of changes in
net assets | | Financial highlights |
| Impact Shares NAACP Minority Empowerment ETF | | For the year ended June 30, 2020 and the period from July 18, 2018 (commencement of operations) to June 30, 2019 |
| Impact Shares Sustainable Development Goals Global Equity ETF | | For the year ended June 30, 2020 and the period from September 20, 2018 (commencement of operations) to June 30, 2019 |
| Impact Shares YWCA Women’s Empowerment ETF | | For the year ended June 30, 2020 and the period from August 24, 2018 (commencement of operations) to June 30, 2019 |
Basis for Opinion
These financial statements are the responsibility of the Trust’s management. Our responsibility is to express an opinion on the Funds’ financial statements based on our audits. We are a public accounting firm registered with the Public Company Accounting Oversight Board (United States) (“PCAOB”) and are required to be independent with respect to the Trust in accordance with the U.S. federal securities laws and the applicable rules and regulations of the Securities and Exchange Commission and the PCAOB.
We conducted our audits in accordance with the standards of the PCAOB. Those standards require that we plan and perform the audit to obtain reasonable assurance about whether the financial statements are free of material misstatement, whether due to error or fraud. The Trust is not required to have, nor were we engaged to perform, an audit of the Trust’s internal control over financial reporting. As part of our audits we are required to obtain an understanding of internal control over financial reporting but not for the purpose of expressing an opinion on the effectiveness of the Trust’s internal control over financial reporting. Accordingly, we express no such opinion.
Our audits included performing procedures to assess the risks of material misstatement of the financial statements, whether due to error or fraud, and performing procedures that respond to those risks. Such procedures included examining, on a test basis, evidence regarding the amounts and disclosures in the financial statements. Our procedures included confirmation of securities owned as of June 30, 2020, by correspondence with the custodian. Our audits also included evaluating the accounting principles used and significant estimates made by management, as well as evaluating the overall presentation of the financial statements. We believe that our audits provide a reasonable basis for our opinion.

We have served as the auditor of one or more Impact Shares investment companies since 2019.
Dallas, Texas
August 28, 2020
35
Impact Shares Trust I
Board of Trustees and Officers of the Trust
June 30, 2020 (Unaudited)
Set forth below are the names, addresses, year of birth, position with the Trust, term of office and length of time served, the principal occupations for the last five years, number of funds in fund complex overseen by the Trustees, and other directorships outside the fund complex of each of the persons currently serving as Trustees and Officers of the Trust.
| | | | | | | | | | | | |
Name and
Date of Birth | | Position(s)
with the Funds | | Term of
Office 1 and
Length of
Time Served | | Principal
Occupation(s)
During the Past Five
Years | | Number of
Portfolios in
Impact Shares
Fund Complex 2
Overseen by
Trustees | | Other
Directorships/
Trusteeships
Held
During the
Past Five
Years | | Experience,
Qualifications,
Attributes,
Skills for Board
Membership |
|
INDEPENDENT TRUSTEES |
| | | | | | |
Winston I. Lowe (2/5/1951) | | Trustee | | Indefinite Term; Trustee since April 2018 | | Managing Partner, Lowe and Associates, LLC since March 2009 | | 3 | | None | | Significant business and legal experience as associate and managing partner at US- based law firm; significant leadership experience at law firm. |
| | | | | | |
Kathleen Legg (11/9/1982) | | Trustee | | Indefinite Term; Trustee since April 2018 | | Consultant, Global Ware Digital Company since November 2014; Consultant, Independent Consultant from 2012 until 2014. | | 3 | | None | | Significant experience running social media companies; Significant experience advising global nonprofits on social media engagement techniques and best practices. |
| | | | | | |
Ethan Powell 3 (6/20/1975) | | Trustee;
Chairman of the
Board | | Indefinite Term; Trustee since May 2016; Chairman of the Board since May 2016 | | President and Founder of Impact Shares LLC (“Impact Shares”) (a registered investment advisor dedicated to building a platform to create better socially responsible investment solutions) since December 2015; Trustee of the Highland Fund Complex from June 2012 until July 2013 and since December 2013; Chief Product Strategist of Highland Capital Management Fund Advisors, L.P. from 2012 until December 2015; Senior Retail Fund Analyst of HCM from 2007 until December 2015 and Impact Shares from its inception until December 2015; Secretary of NexPoint Credit Strategies Fund (“NHF”) from November 2010 until June 2012; President and Principal Executive Officer of NHF from June 2012 until May 2015; Secretary of NHF from May 2015 until December 2015; Executive Vice President and Principal Executive Officer of Impact Shares Trust I from May 2016 to January 2018; and Secretary of Impact Shares Trust I from May 2016 to January 2018; President and Treasurer of Impact Shares Trust I since January 2018. | | 3 | | Serves as Independent Chairman of the Board of the Highland Fund Complex and the NexPoint Credit Strategies Fund Complex (collectively, 25 funds) | | Significant experience in the financial industry; significant executive experience including past service as an officer of funds in the Highland Fund Complex; significant administrative and managerial experience. |
| 1 | Trustees serve until their successors are duly elected and qualified. |
| 2 | The “Impact Shares Fund Complex” consists of each series of Impact Shares Trust I. |
| 3 | Mr. Powell is deemed to be an “interested person” of the Trust, as defined in the 1940 Act, because of his current affiliation with Impact Shares, Corp., the Funds’ investment adviser. |
36
Impact Shares Trust I
Board of Trustees and Officers of the Trust
June 30, 2020 (Unaudited)
The Trust’s Statement of Additional Information (“SAI”) includes additional information about the Trustees and Officers. The SAI may be obtained without charge by calling 1-844-448-3383. The following chart lists Trustees and Officers as of June 30, 2020:
| | | | | | | | | | | | |
Name and Date of Birth | | Position(s)
with the Funds | | Term of Office and Length of
Time Served 1 | | Principal Occupation(s)
During the Past Five Years |
| | | |
OFFICERS | | | | | | |
| | | |
Ethan Powell (6/20/1975) | | President and Treasurer | | January 2018 – Present. | | See on previous page under “Interested Trustees”. |
| | | |
Donald J. Guiney (9/22/1956) | | Secretary, Chief Compliance Officer | | January 2018 – Present. | | Senior Counsel, Baker & McKenzie LLP (law firm) from 2013 to 2016); Partner, Freshfields Bruckhaus Deringer (law firm) from 1997 to 2013. |
| | | |
Eric Kleinschmidt (6/16/1968) | | Assistant Treasurer | | January 2018 – Present. | | Director of Fund Accounting, SEI Investments (2004- present). |
| 1 | The Officers hold office until the next annual meeting of the Board of Trustees and until their successors shall have been elected and qualified. |
37
Impact Shares Trust I
Disclosure of Fund Expenses
June 30, 2020 (Unaudited)
All ETFs have operating expenses. As a shareholder of the Fund you incur an Advisory fee. In addition to the Advisory fee, a shareholder may pay brokerage expenses, taxes, interest, litigation expenses and other extraordinary expenses (including acquired fund fees and expenses), if any. It is important for you to understand the impact of these ongoing costs of your investment returns. Shareholders may incur brokerage commissions on their purchases and sales of Fund shares, which are not reflected in these examples.
The following examples use the annualized expense ratio and are intended to help you understand the ongoing costs (in dollars) of investing in each Fund and to compare these costs with those of other funds. The examples are based on an investment of $1,000 made at the beginning of the period shown and held for the entire period (January 1, 2020 to June 30, 2020) (unless otherwise noted below).
The table below illustrates each Fund’s cost in two ways:
Actual Fund Return. This section helps you to estimate the actual expenses after fee waivers that your Fund incurred over the period. The “Expenses Paid During Period” column shows the actual dollar expense cost incurred by a $1,000 investment in the Fund, and the “Ending Account Value” number is derived from deducting that expense cost from the Fund’s gross investment return.
You can use this information, together with the actual amount you invested in the Fund, to estimate the expenses you paid over that period. Simply divide your actual account value by $1,000 to arrive at a ratio (for example, an $8,600 account value divided by $1,000 = 8.6), then multiply that ratio by the number shown for your Fund under “Expenses Paid During Period.”
Hypothetical 5% Return. This section helps you compare your Fund’s costs with those of other funds. It assumes that the Fund had an annual 5% return before expenses during the year, but that the expense ratio (Column 3) for the period is unchanged. This example is useful in making comparisons because the Commission requires all funds to make this 5% calculation. You can assess your Fund’s comparative cost by comparing the hypothetical result for your Fund in the “Expenses Paid During Period” column with those that appear in the same charts in the shareholder reports for other funds.
NOTE: Because the return is set at 5% for comparison purposes — NOT your Fund’s actual return — the account values shown may not apply to your specific investment.
| | | | | | | | | | | | | | | | |
| | | Beginning
Account
Value
1/1/20 | | | Ending
Account
Value
6/30/20 | | | Annualized
Expense
Ratios | | | Expenses
Paid During
Period(1) | |
|
Impact Shares YWCA Women’s Empowerment ETF | |
Actual Fund Return | | $ | 1,000.00 | | | $ | 995.40 | | | | 0.75 | % | | $ | 3.72 | |
Hypothetical 5% Return | | | 1,000.00 | | | | 1,021.13 | | | | 0.75 | | | | 3.77 | |
|
Impact Shares NAACP Minority Empowerment ETF | |
Actual Fund Return | | $ | 1,000.00 | | | $ | 1,000.40 | | | | 0.75 | % | | $ | 3.73 | |
Hypothetical 5% Return | | | 1,000.00 | | | | 1,021.13 | | | | 0.75 | | | | 3.77 | |
|
Impact Shares Sustainable Development Goals Global Equity ETF | |
Actual Fund Return | | $ | 1,000.00 | | | $ | 908.50 | | | | 0.75 | % | | $ | 3.56 | |
Hypothetical 5% Return | | | 1,000.00 | | | | 1,021.13 | | | | 0.75 | | | | 3.77 | |
| (1) | Expenses are equal to the Fund’s annualized expense ratio multiplied by the average account value over the period, multiplied 182/366 (to reflect the one-half year period shown). |
38
Impact Shares Trust I
Board Considerations in Approving the Continuation of the Investment Advisory Agreement
June 30, 2020 (Unaudited)
Board Considerations in Approving the Continuation of the Investment Advisory Agreement
At a meeting held on February 25, 2020 with respect to Minority ETF, Women’s ETF and Sustainable Development ETF, the trustees (collectively, the “Trustees” or the “Board”) of Impact Shares Trust I (the “Trust”), including the Trustees who are not “interested persons” (as such term is defined in Section 2(a)(19) of the 1940 Act) of the Trust (such trustees, the “Independent Trustees”), met in person to consider the proposed continuation of the investment advisory agreement (“Investment Advisory Agreement”) between the Trust and Impact Shares, Corp. (the “Adviser”) for an additional one-year term. The following summarizes the Trustees’ process of requesting and evaluating the information they believed to be reasonably necessary to determine whether to approve the continuation of the Investment Advisory Agreement. In their deliberations, the Trustees did not identify any particular information that was all-important or controlling, and each Trustee may have attributed different weights to the various factors.
In connection with their consideration of the Investment Advisory Agreement, the Independent Trustees considered the following factors. In their deliberations, the Trustees did not identify any particular information that was all-important or controlling, and each Trustee may have attributed different weights to the various factors.
The Nature, Extent, and Quality of the Services
In considering the Investment Advisory Agreement, the Independent Trustees evaluated the nature, extent and quality of the advisory services provided to each Fund by the Adviser. They considered the terms of the Investment Advisory Agreement and received and considered information provided by management that described, among other matters:
| • | | the nature and scope of the advisory services provided to each Fund and information regarding the experience, qualifications and adequacy of the personnel providing those services, |
| • | | the investment program used by the Adviser to manage each Fund, |
| • | | possible fall-out benefits and potential conflicts of interest, |
| • | | anticipated brokerage practices, |
| • | | the compliance functions of the Adviser, and |
| • | | the financial resources of the Adviser. |
In addition to considering each Fund’s investment performance (see below), the Independent Trustees considered, among other matters, the general oversight of the Trust by the Adviser. They also took into account information concerning the investment processes used by the Adviser in managing each Fund.
The Independent Trustees considered, among other matters, that the Adviser provides the Trust with office space and personnel, and, under the unitary fee structure set forth in the Investment Advisory Agreement, the Adviser is responsible for bearing all of each Fund’s expenses, including the costs of transfer agency, custody, fund administration, legal, audit and other services provided to each Fund, with the exceptions set forth below under “Fees and Other Expenses.” They also took into account the Adviser’s compliance and operational functions, as well as the resources being devoted by the Adviser to such functions.
The Independent Trustees noted that the Adviser had a relatively limited operating history and that its expenses exceeded its revenues from the Funds for the Fund’s most recent fiscal year. The Independent Trustees considered the Adviser’s statements as to its discussions with the Rockefeller foundation and others to subsidize the Adviser’s operating expenses.
The Independent Trustees concluded, within the context of their overall conclusions regarding the Investment Advisory Agreement, that the scope of the services provided to each Fund under the Investment Advisory Agreement was consistent with such Fund’s operational requirements; that the Adviser has the capabilities, resources and personnel necessary to provide the advisory services required by each Fund; and that, overall, the nature, extent and quality of the services provided by the Adviser to each Fund were sufficient to warrant approval of the Investment Advisory Agreement for an additional one-year term.
39
Impact Shares Trust I
Board Considerations in Approving the Continuation of the Investment Advisory Agreement
June 30, 2020 (Unaudited)
Performance
The Independent Trustees noted that each Fund was relatively new with a limited performance history. The Independent Trustees considered that each Fund seeks investment results that, before fees and expenses, track the performance of its respective underlying index and determined that each Fund’s performance was within an acceptable level of the its underlying index. The Independent Trustees also considered that each Fund experienced twelve-month performance ended October 31, 2019 above that of its Morningstar category universe for indexed ESG funds (“Morningstar Peer Group”) and its Morningstar category universe for actively managed ESG funds.
The Independent Trustees concluded, within the context of their overall conclusions regarding the Investment Advisory Agreement, that the limited performance history for each Fund was not inconsistent with approval of the Investment Advisory Agreement.
The Costs of the Services Provided by the Adviser and the Profits Realized by the Adviser
The Independent Trustees considered the cost of services provided by the Adviser and the profitability to the Adviser of its relationship with the Trust. The Independent Trustees recognized that the Adviser should, in the abstract, be entitled to earn a reasonable level of profit for the services provided to each Fund, and that it is difficult to make comparisons of profitability from ETF advisory contracts because comparative information is not generally available and is affected by numerous factors, including the structure of the particular adviser, the types and sizes of funds it manages, its business mix, numerous assumptions about cost allocations and the adviser’s capital structure and cost of capital.
The Independent Trustees also considered that the Adviser is a 501(c)(3) nonprofit and considered whether it might be appropriate to analyze some or all of the amounts the Adviser has committed to donate to each Fund’s partner nonprofit as analogous to the profits earned by for-profit investment advisers to investment companies. The Independent Trustees noted that for the Funds’ most recent fiscal year the Adviser’s expenses exceed its revenues from the Funds and that, based on the Adviser’s projections, it was unlikely that the fees paid to the Adviser by a Fund would significantly exceed the Adviser’s cost of providing services to that Fund in the near term. The Independent Trustees further concluded that, even if any such excess were to be analyzed as though it were profit to the Adviser, the expected “profitability” was not excessive and supported the approval of the Investment Advisory Agreement for an additional one-year term.
Fees and Other Expenses
The Independent Trustees considered the unitary fee paid by each Fund to the Adviser, as well as each Fund’s distribution and service (Rule 12b-1) plan, “other expenses” and total expenses. In doing so, the Independent Trustees reviewed information provided by Impact Shares comparing the expenses of each Fund relative to those of its Morningstar Peer Group and Morningstar category universe for active ESG funds. The Independent Trustees considered that each Fund’s gross expense ratio and net expense ratio was above that of its Morningstar Peer Group. The Trustees further considered that each Fund’s net expense ratio was below that of its Morningstar category universe for actively managed ESG funds.
The Independent Trustees noted that, under the unitary fee arrangement described in the Investment Advisory Agreement, the Adviser is responsible for substantially all expenses of each Fund, including the cost of transfer agency, custody, fund administration, legal, audit and other services except for (i) distribution and service fees payable pursuant to a Rule 12b-1 plan, if any; (ii) salaries and other compensation or expenses, including travel expenses, of any of a Fund’s executive officers and employees, if any, who are not officers, directors, shareholders, members, partners or employees of the Adviser or its subsidiaries or affiliates; (iii) taxes and governmental fees, if any, levied against a Fund; (iv) brokerage fees and commissions, and other portfolio transaction expenses incurred by or for a Fund; (v) expenses of a Fund’s securities lending (if any), including any securities lending agent fees, as governed by a separate securities lending agreement; costs, including interest expenses, of borrowing money or engaging in other types of leverage financing; (vi) fees and expenses of any underlying funds or other pooled vehicles in which a Fund invests; (vii) dividend and interest expenses on short positions taken by a Fund; (viii) fees and expenses, including travel expenses, and fees and expenses of legal counsel retained for their benefit, of
40
Impact Shares Trust I
Board Considerations in Approving the Continuation of the Investment Advisory Agreement
June 30, 2020 (Unaudited)
Trustees who are not officers, employees, partners, shareholders or members of the Adviser or its subsidiaries or affiliates; (ix) extraordinary expenses, including extraordinary legal expenses, as may arise, including, without limitation, expenses incurred in connection with litigation, proceedings, other claims, contractual arrangements with partner nonprofits and the legal obligations of a Fund to indemnify its Trustees, officers, employees, shareholders, distributors, and agents with respect thereto; (x) fees and expenses, including legal, printing and mailing, solicitation and other fees and expenses associated with and incident to shareholder meetings and proxy solicitations involving shareholder proposals or other non-routine matters that are not initiated or proposed by Fund management; (xi) organizational and offering expenses of a Fund, including registration (including Share registration fees), legal, marketing, printing, accounting and other expenses, associated with organizing a Fund in its state of jurisdiction and in connection with the initial registration of a Fund under the 1940 Act and the initial registration of its shares under the Securities Act (i.e., through the effectiveness of the Fund’s initial registration statement on Form N-1A); (xii) fees and expenses associated with seeking, applying for and obtaining formal exemptive, no-action and/or other relief from the SEC; and (xiii) expenses of a Fund which are capitalized in accordance with generally accepted accounting principles.
The Independent Trustees noted that the Adviser, at the time of the Meeting, did not advise any accounts other than the Funds.
Based on this and other information, the Independent Trustees concluded, within the context of their overall conclusions regarding the Investment Advisory Agreement, that the fees and expenses charged represented reasonable compensation to the Adviser in light of the services provided to each Fund.
Possible Fall-Out Benefits
The Independent Trustees considered information regarding the direct and indirect benefits to the Adviser from its relationship with each Fund, including reputational and other “fall out” benefits. The Independent Trustees considered the receipt of these benefits in light of the Adviser’s “profitability,” and concluded that such benefits were not excessive, even if the amounts the Adviser has committed to donate to the partner nonprofits were to be analyzed as though they were profits to the Adviser.
Possible Economies of Scale
The Independent Trustees considered the extent to which the Adviser may realize economies of scale or other efficiencies in managing and supporting each Fund. The Independent Trustees considered that no Fund has any breakpoints in its fee arrangement with the Adviser. The Independent Trustees concluded that each Fund’s overall fee arrangements represent an appropriate sharing at the present time between Fund shareholders and the Adviser of any economies of scale or other efficiencies in the management of each Fund at current asset levels.
Based on the factors described above, the Independent Trustees concluded that the approval of the Investment Advisory Agreement for an additional one-year term was in the best interests of the Funds and should be approved.
41
Impact Shares Trust I
Notice to Shareholders
June 30, 2020 (Unaudited)
For shareholders that do not have a June 30, 2020 tax year end, this notice is for informational purposes only. For shareholders with a June 30, 2020 tax year end, please consult your tax advisor as to the pertinence of this notice. For the fiscal period ended June 30, 2020, the Funds are designating the following items with regard to distributions paid during the period
| | | | | | | | | | | | | | | | | | |
| | | Return
of
Capital | | Long Term
Capital
Gain
Distribution | | Ordinary
Income
Distributions | | Total
Distributions | | Dividends
Qualifying
for
Corporate
Dividend
Receivable
Deduction (1) | | Qualifying
Dividend Income (2) | | U.S.
Government
Interest (3) | | Qualified
Interest
Income (4) | | Qualified
Short Term
Capital Gain (5) |
Impact Shares YWCA Women’s Empowerment ETF | | 0.00% | | 0.00% | | 100.00% | | 100.00% | | 100.00% | | 100.00% | | 0.00% | | 0.00% | | 0.00% |
Impact Shares NAACP Minority Empowerment ETF | | 0.00% | | 0.00% | | 100.00% | | 100.00% | | 100.00% | | 100.00% | | 0.00% | | 0.00% | | 0.00% |
Impact Shares Sustainable Development Goals Global Equity ETF | | 0.00% | | 0.00% | | 100.00% | | 100.00% | | 95.07% | | 100.00% | | 0.00% | | 0.00% | | 0.00% |
| (1) | Qualifying dividends represent dividends which qualify for the corporate dividends received deduction and is reflected as a percentage of ordinary income distributions (the total of short term capital gain and net investment income distributions). |
| (2) | The percentage in this column represents the amount of “Qualifying Dividend Income” as created by the Jobs and Growth Tax Relief Reconciliation Act of 2003 and is reflected as a percentage of ordinary income distributions (the total of short term capital gain and net investment income distributions). It is the intention of each of the aforementioned funds to designate the maximum amount permitted by law. |
| (3) | “U.S. Government Interest” represents the amount of interest that was derived from U.S. Government obligations and distributed during the fiscal year. This amount is reflected as a percentage of total ordinary income distributions (the total of short term capital gain and net investment income distributions). Generally, interest from direct U.S. Government obligations is exempt from state income tax. However, for shareholders who are residents of California, Connecticut and New York, the statutory threshold requirements were not satisfied to permit exemption of these amounts from state income. |
| (4) | The percentage in this column represents the amount of “Qualifying Interest Income” as created by the American Jobs Creation Act of 2004 and is a percentage of ordinary income distributions that are exempt from U.S. withholding tax when paid for foreign investors. |
| (5) | The percentage in this column represents the amount of “Qualifying Short-Term Capital Gain” as created by the American Jobs Creation Act of 2004 and is reflected as a percentage of short-term capital gain distributions that is exempt from U.S. withholding tax when paid to foreign investors. |
The information reported herein may differ from the information and distributions taxable to the shareholders for the tax year ending June 30, 2020. Complete information will be computed and reported in conjunction with your 2020 Form 1099-DIV.
42
Impact Shares Trust I
Supplemental Information (Unaudited)
Net asset value, or “NAV”, is the price per Share at which the Funds issue and redeem Shares. It is calculated in accordance with the standard formula for valuing mutual fund shares. The “Market Price” of the Funds generally is determined using the midpoint between the highest bid and the lowest offer on the stock exchange on which the Shares of the Funds are listed for trading, as of the time that the Fund’s NAV is calculated. The Funds’ Market Price may be at, above or below their NAV. The NAV of the Funds will fluctuate with changes in the market value of the Funds’ holdings. The Market Price of the Funds will fluctuate in accordance with changes in their NAV, as well as market supply and demand.
Premiums or discounts are the differences (expressed as a percentage) between the NAV and Market Price of the Funds on a given day, generally at the time NAV is calculated. A premium is the amount that the Funds are trading above the reported NAV, expressed as a percentage of the NAV. A discount is the amount that the Funds are trading below the reported NAV, expressed as a percentage of the NAV.
Further information regarding premiums and discounts is available on the Funds’ website at www.impactetfs.org.
43
[THIS PAGE INTENTIONALLY LEFT BLANK]
[THIS PAGE INTENTIONALLY LEFT BLANK]

2189 Broken Bend
Frisco, Texas 75034
844-448-3383
www.impactetfs.org
Investment Adviser:
Impact Shares, Corp.
2189 Broken Bend
Frisco, Texas 75034
Distributor:
SEI Investments Distribution Co.
One Freedom Valley Drive
Oaks, PA 19456
Administrator:
SEI Investments
Global Funds Services
One Freedom Valley Drive
Oaks, PA 19456
Transfer Agent:
Bank of New York Mellon
225 Liberty Street
New York, NY 10286
Custodian:
Bank of New York Mellon
225 Liberty Street
New York, NY 10286
Legal Counsel:
Ropes & Gray LLP
Prudential Tower, 800 Boylston Street
Boston, MA 02199-3600
This information must be preceded or accompanied by a current prospectus for the Funds.
IMP-AR-001-0200
The Registrant has adopted a code of ethics that applies to the Registrant’s principal executive officer, principal financial officer, controller, or principal accounting officer, and any person who performs a similar function. There have been no amendments to or waivers granted to this code of ethics during the past fiscal year.
| Item 3. | Audit Committee Financial Expert. |
(a)(1) The Fund’s Audit Committee currently does not have an Audit Committee Financial Expert.
(a)(2) Not applicable.
(a)(3) At this time, the Registrant believes that the collective experience provided by the members of the Audit Committee together offer the Registrant adequate oversight for the Registrant’s level of financial complexity.
| Item 4. | Principal Accountant Fees and Services. |
Fees billed by Ernst & Young (“EY”) Related to the Trust.
EY billed the Trust aggregate fees for services rendered to the Trust for the last two fiscal years as follows:
| | | | | | | | | | | | | | | | | | | | | | | | | | |
| | | 2020 | | | 2019 | |
| | | | | All fees and
services to
the Trust that
were pre-
approved | | | All fees and
services to
service
affiliates that
were pre-
approved | | | All other fees
and services
to service
affiliates that
did not
require pre-
approval | | | All fees and
services to
the Trust that
were pre-
approved | | | All fees and
services to
service
affiliates that
were
pre-approved | | | All other fees
and services
to service
affiliates that
did not
require
pre-approval | |
(a) | | Audit Fees(1) | | $ | 70,000 | | | | N/A | | | | N/A | | | $ | 70,000 | | | | N/A | | | | N/A | |
(b) | | Audit-Related Fees | | | N/A | | | | N/A | | | | N/A | | | | N/A | | | | N/A | | | | N/A | |
(c) | | Tax Fees | | $ | 15,000 | | | | N/A | | | | N/A | | | | N/A | | | | N/A | | | | N/A | |
(d) | | All Other Fees | | | N/A | | | | N/A | | | | N/A | | | | N/A | | | | N/A | | | | N/A | |
Notes:
| (1) | Audit fees include amounts related to the audit of the Registrant’s annual financial statements and services normally provided by the accountant in connection with statutory and regulatory filings. |
2
(e)(1) Not Applicable.
(e)(2) Percentage of fees billed applicable to non-audit services approved pursuant to the “de minimis” exception of Rule 2-01(c)(7)(i)(C) were as follows:
| | | | | | | | |
| | | 2020 | | | 2019 | |
Audit-Related Fees | | | N/A | | | | N/A | |
Tax Fees | | $ | 15,000 | | | | N/A | |
All Other Fees | | | N/A | | | | N/A | |
(f) Not applicable.
(g) The aggregate non-audit fees and services billed by EY for services rendered to the Registrant, and rendered to the Registrant’s investment adviser (not including any sub-adviser whose role is primarily portfolio management and is subcontracted with or overseen by another investment adviser), and any entity controlling, controlled by, or under common control with the adviser that provides ongoing services to the Registrant for the last two fiscal years were $15,000 and $0 for 2020 and 2019, respectively.
(h) During the past fiscal year, all non-audit services provided by the Registrant’s principal accountant either to the Registrant’s investment adviser or to any entity controlling, controlled by, or under common control with the Registrant’s investment adviser that provides ongoing services to the Registrant were pre-approved by the audit committee of the Registrant’s Board of Trustees. Included in the audit committee’s pre-approval was the review and consideration as to whether the provision of these non-audit services is compatible with maintaining the principal accountant’s independence.
| Item 5. | Audit Committee of Listed Registrants. |
Not applicable to open-end management investment companies.
| Item 6. | Schedule of Investments. |
The Schedule of Investments is included as part of the Report to Shareholders filed under Item 1 of this form.
| Item 7. | Disclosure of Proxy Voting Policies and Procedures for Closed-End Management Investment Companies. |
Not applicable to open-end management investment companies.
| Item 8. | Portfolio Managers of Closed-End Management Investment Companies. |
Not applicable to open-end management investment companies.
| Item 9. | Purchases of Equity Securities by Closed-End Management Company and Affiliated Purchasers. |
Not applicable to open-end management investment companies.
3
| Item 10. | Submission of Matters to a Vote of Security Holders. |
There have been no changes to the procedures by which shareholders may recommend nominees to the Registrant’s Board of Trustees during the period covered by this report.
| Item 11. | Controls and Procedures. |
(a) The Registrant’s principal executive and principal financial officers, or persons performing similar functions, have concluded that the Registrant’s disclosure controls and procedures (as defined in Rule 30a-3(c) under the Act (17 CFR § 270.30a-3(c))) as of a date within 90 days of the filing date of the report, are effective based on the evaluation of these controls and procedures required by Rule 30a-3(b) under the Act (17 CFR § 270.30a-3(b)) and Rules 13a-15(b) or 15d-15(b) under the Exchange Act (17 CFR § 240.13a-15(b) or § 240.15d-15(b)).
(b) There has been no change in the Registrant’s internal control over financial reporting (as defined in Rule 30a-3(d) under the Act (17 CFR § 270.30a-3(d)) that occurred during the period covered by this report that has materially affected, or is reasonably likely to materially affect, the Registrant’s internal control over financial reporting.
| Item 12. | Disclosure of Securities Lending Activities for the Closed-End Management Investment Companies. |
Not applicable to open-end management investment companies.
(a)(1) A copy of the Registrant’s Code of Ethics, as required by Item 2 of this Form, accompanies this filing as an exhibit.
(a)(2) A separate certification for the principal executive officer and the principal financial officer of the Registrant as required by Rule 30a-2(a) under the Investment Company Act of 1940, as amended (17 CFR § 270.30a-2(a)), are filed herewith.
(b) Officer certifications as required by Rule 30a-2(b) under the Investment Company Act of 1940, as amended (17 CFR § 270.30a-2(b)) also accompany this filing as an Exhibit.
4
SIGNATURES
Pursuant to the requirements of the Securities Exchange Act of 1934 and the Investment Company Act of 1940, the Registrant has duly caused this report to be signed on its behalf by the undersigned, thereunto duly authorized.
| | | | | | |
| (Registrant) | | | | Impact Shares Trust I |
| | | |
| By (Signature and Title) | | | | | | /s/ Ethan Powell |
| | | | | | Ethan Powell, President, Principal |
| | | | | | Executive Officer, Treasurer, and |
| | | | | | Principal Financial Officer |
Date: September 4, 2020
Pursuant to the requirements of the Securities Exchange Act of 1934 and the Investment Company Act of 1940, this report has been signed below by the following persons on behalf of the Registrant and in the capacities and on the dates indicated.
| | | | | | |
| By (Signature and Title) | | | | | | /s/ Ethan Powell |
| | | | | | Ethan Powell, President and Principal |
| | | | | | Executive Officer |
Date: September 4, 2020
| | | | | | |
| By (Signature and Title) | | | | | | /s/ Ethan Powell |
| | | | | | Ethan Powell, Treasurer and |
| | | | | | Principal Financial Officer |
Date: September 4, 2020
5