UNITED STATES
SECURITIES AND EXCHANGE COMMISSION
Washington, D.C. 20549
FORM N-CSR
CERTIFIED SHAREHOLDER REPORT OF REGISTERED MANAGEMENT
INVESTMENT COMPANIES
Investment Company Act File Number 811- 23312
Impact Shares Trust I
(Exact name of registrant as specified in charter)
2189 Broken Bend
Frisco, Texas 75034
(Address of principal executive offices)
Ethan Powell
2189 Broken Bend
Frisco, Texas 75034
(Name and address of agent for service)
COPY TO:
Brian McCabe
Ropes & Gray LLP
Prudential Tower
800 Boylston Street
Boston, Massachusetts 02199-3600
(Name and address of agent for service)
Registrant’s telephone number, including area code: 1-469-442-8424
Date of fiscal year end: June 30, 2023
Date of reporting period: June 30, 2023
Item 1. Reports to Stockholders.
| (a) | A copy of the report transmitted to stockholders pursuant to Rule 30e-1 under the Investment Company Act of 1940, as amended (the “1940 Act”) (17 CFR § 270.30e-1), is attached hereto. |

IMPACT SHARES TRUST I
Impact Shares YWCA Women’s Empowerment ETF
Impact Shares NAACP Minority Empowerment ETF
Impact Shares Affordable Housing MBS ETF
Annual Report
June 30, 2023
Impact Shares Trust I
Table of Contents
Each Fund files its complete schedule of Fund holdings with the Securities and Exchange Commission (the “Commission”) for the first and third quarters of each fiscal year or as an exhibit to its reports on Form N-PORT. The Fund’s Form N-PORT is available on the Commission’s website at http://www.sec.gov.
A description of the policies and procedures that Impact Shares, Corp. uses to determine how to vote proxies relating to Fund securities, as well as information relating to how a Fund voted proxies relating to Fund securities during the most recent 12-month period ended June 30, is available (i) without charge, upon request, by calling 1-844-448-3383; and (ii) on the Commission’s website at http://www.sec.gov.
Impact Shares Trust I
Letter to Shareholders
June 30, 2023 (Unaudited)
Dear Impact Shares Funds Shareholder:
At Impact Shares we invest in change. Our equity ETFs help social advocacy organizations, our Impact Partners, translate their social values into an index which our funds seek to track, each fund is an investable product that is traded on the NYSE ARCA. Investing in our equity ETFs means committing to an index that reflects a set of criteria, defined by our Impact Partners, to promote ongoing engagement with the private sector improving corporate behavior relative to our Impact Partners’ goals and expectations. During the year we proposed a reorganization of the funds including appointing a new Advisor, Impact Shares as subadvisor and a new slate of board members for the equity funds. The Impact Shares Affordable Housing MBS Fund is proposed to move to a new series trust and appoint the current subadvisor, Community Capital Management, as the new advisor.
The indices which our equity ETFs seek to track are designed to exhibit risk and return characteristics similar to a broad equity market, while identifying specific large and mid-capitalization companies that display business practices and attributes reflective of social issues important to the respective Impact Partner. Generally, only the top scoring companies relative to the underlying index’s social criteria make it into the portfolio of approximately two hundred stocks. The Impact Partners work to educate and engage companies, investors and the general public on the effect and importance of the social metrics at issue. Thus, we strive to create improved social outcomes through our collaborations with these leading advocacy organizations. The rules-based strategies are intended to give corporations a road map to follow in order to be recognized as leaders in each respective cause and, at the same time, investors can feel confident that their capital will strive to allow a fund’s Impact Partner to actively advance its respective social issues.
By bringing together social advocacy organizations and the private sector, the funds intend to provide a vehicle for the Impact Partners to amplify and advance their respective missions in the private sector and help to advance society’s goals relative to specific social issues, using these social criteria as a common language.
Thank you for using your capital to make a difference and for choosing Impact Shares. We appreciate your support and are always here to answer your questions.
This letter contains the manager’s opinion. It should not be regarded as investment advice or recommendation of specific securities. Past performance is no guarantee of future results.
There are risks involved with investing, including possible loss of principal. There is no guarantee the Funds will achieve their objectives.
The performance data quoted represents past performance. Past performance does not guarantee future results. The investment return and principal value of an investment will fluctuate so that an investor’s shares when redeemed may be worth more or less than their original cost, and current performance may be lower or higher than the performance data quoted. For performance data current to the most recent month-end, please go to our website at www.impactetfs.org.
To determine if the Funds are appropriate investments for you, carefully consider the funds’ investment objectives, risk, and charges and expenses. This and other information can be found in the funds’ prospectuses, and if available, the summary prospectuses, which can be obtained by visiting www.impactetfs.org. Please read the prospectus, and if available, the summary prospectus, carefully before investing.
1
Impact Shares Trust I
Definition of Comparative Indices
June 30, 2023 (Unaudited)
The Morningstar Minority Empowerment Index is designed to measure the performance of large and mid-capitalization companies that are “empowering to minorities,” and to exhibit risk and return characteristics similar to those of the Morningstar US Large-Mid Cap® Index.
The Morningstar U.S. Large-Mid Cap Index measures the performance of the U.S. equity market targeting the top 90% of stocks by market capitalization. One cannot invest directly in an index.
The Lipper Large-Cap Core Universe consists of funds that, by portfolio practice, invest at least 75% of their equity assets in companies with market capitalizations (on a three-year weighted basis) greater than 300% of the dollar-weighted median market capitalization of the middle 1,000 securities of the S&P SuperComposite 1500 Index. Large-cap growth funds typically have an above-average price-to-earnings ratio, price-to-book ratio, and three-year sales-per-share growth value, compared to the S&P 500 Index.
The Morningstar Women’s Empowerment Index is designed to measure the performance of U.S. large and mid- capitalization companies that are “empowering to women,” and to exhibit risk and return characteristics similar to those of the Morningstar US Large-Mid Cap Index.
The Bloomberg US Mortgage Backed Securities (MBS) index tracks fixed-rate agency mortgage backed pass-through securities guaranteed by Ginnie Mae (GNMA), Fannie Mae (FNMA), and Freddie Mac (FHLMC).
2
Impact Shares Trust I
Management Discussion of Fund Performance
June 30, 2023 (Unaudited)
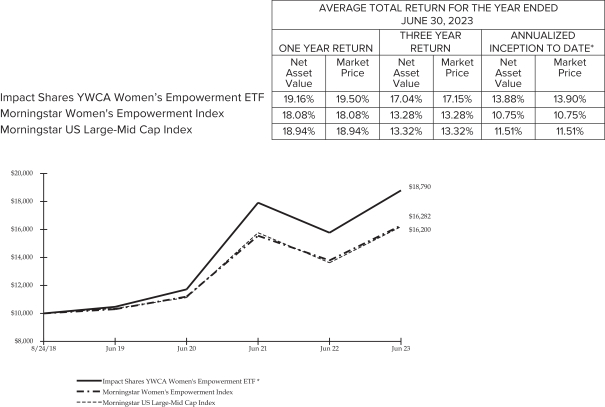
WOMN
The Impact Shares YWCA Women’s Empowerment ETF (the “Fund”) seeks to provide investment results that, before fees and expenses, track the performance of the Morningstar® Women’s Empowerment Index that is designed to measure the performance of U.S. large and mid-capitalization companies that are “empowering to women,” and to exhibit risk and return characteristics similar to those of the Morningstar US Large-Mid Cap® Index (the “Parent Index”). The Fund’s underlying benchmark is the Morningstar Women’s Empowerment Index (the “Underlying Index”). The Parent Index is our primary broad-market benchmark for the Fund’s performance. We also consider the Lipper Large-Cap Core Universe when evaluating the Fund’s performance. From July 1, 2022 through June 30, 2023 (the “Reporting Period”), the total return for the Fund was 19.16%, and the return for the Underlying Index was 18.08%. In comparison to the Fund’s performance, during the Reporting Period, the Parent Index’s total return was 18.94% and the total return of the Lipper Large-Cap Core Universe was 18.00%.
The trailing twelve months ending June 2023 was defined by the S&P 500 19.59% performance being driven by the FED and their continued rate increase. The market shrugged off the negative economic effects of FED tightening and a looming recession. Much of the optimism was reflected in the implications regenerative AI has on longer term earnings per share. Specifically, the bulk of the positive performance in the broader market was driven by large technology companies such as META, AMZN, AAP, MSFT, GOOGL and NVDA.
The Fund outperformed the broad parent index and the lipper category. On an individual security level, the top negative detractors to the Fund’s performance last year were the top positive contributors in the 12 months ending June 30, 2023 and were dominated by high growth technology companies Meta, Amazon and Nvidia. The top negative contributors to the Fund’s performance during the Reporting Period were Walt Disney, Pfizer and Bank of America.
This letter contains the manager’s opinion. It should not be regarded as investment advice or recommendation of specific securities. Past performance is no guarantee of future results.
There are risks involved with investing, including possible loss of principal. There is no guarantee the Funds will achieve their objectives.
3
Impact Shares Trust I
Management Discussion of Fund Performance
June 30, 2023 (Unaudited)
Growth of a $10,000 Investment
(at Net Asset Value)
* Fund commenced operations on August 24, 2018.
The performance data quoted herein represents past performance and the return and value of an investment in the Fund will fluctuate so that shares, when redeemed or sold in the market, may be worth more or less than their original cost. Past performance is no guarantee of future performance and should not be considered as a representation of the future results of the Fund. The Fund’s performance assumes the reinvestment of all dividends and all capital gains. Index returns assume reinvestment of dividends and, unlike a Fund’s returns, do not reflect any fees or expenses. If such fees and expenses were included in the index returns, the performance would have been lower. Please note that one cannot invest directly in an unmanaged index.
Current performance may be lower or higher than the performance data shown above.
There are no assurances that the Fund will meet its stated objectives.
The Fund’s holdings and allocations are subject to change and should not be considered recommendations to buy individual securities.
Returns shown do not reflect the deduction of taxes that a shareholder would pay on Fund distributions or the redemption of Fund shares.
See definition of comparative indices on page 2.
4
Impact Shares Trust I
Management Discussion of Fund Performance
June 30, 2023 (Unaudited)
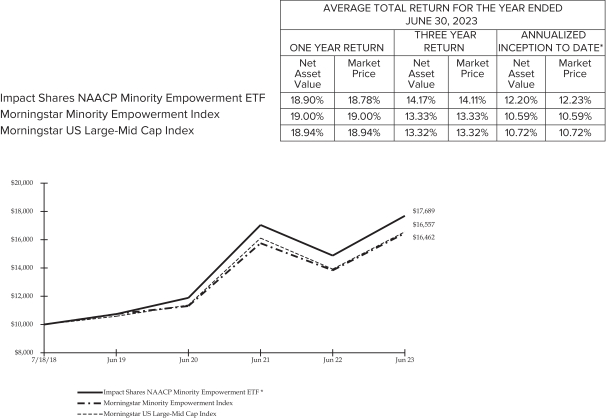
NACP
The Impact Shares NAACP Minority Empowerment ETF (the “Fund”) seeks to provide investment results that, before fees and expenses, track the performance of the Morningstar Minority Empowerment Index that is designed to measure the performance of large and mid-capitalization companies that are “empowering to communities of color,” and to exhibit risk and return characteristics similar to those of the Morningstar US Large-Mid Cap® Index (the “Parent Index”). The Fund’s underlying benchmark is the Morningstar Minority Empowerment Index (the “Underlying Index”). The Parent Index is our primary broad-market benchmark for the Fund’s performance. We also consider the Lipper Large-Cap Core Universe when evaluating the Fund’s performance. From July 1, 2022 through June 30, 2023 (the “Reporting Period”), the total return for the Fund was 18.90%, and the return for the Underlying Index was 19.00%. In comparison to the Fund’s performance, during the Reporting Period, the Parent Index’s total return was 18.94% and the total return of the Lipper Large-Cap Core Universe was 18.00%.
The trailing twelve months ending June 2023 was defined by the S&P 500 19.59% performance being driven by the FED and their continued rate increase. The market shrugged off the negative economic effects of FED tightening and a looming recession. Much of the optimism was reflected in the implications regenerative AI has on longer term earnings per share. Specifically, the bulk of the positive performance in the broader market was driven by large technology companies such as META, AMZN, AAP, MSFT, GOOGL and NVDA.
The Fund outperformed the lipper category and performed in line with its parent index. On an individual security level, the top negative detractors to the Fund’s performance last year were the top positive contributors in the 12 months ending June 30 2023 and were dominated by high growth technology companies Meta, Salesforce and Nvidia. The top negative contributors to the Fund’s performance during the Reporting Period were Tesla, Pfizer and Verizon Communications.
This letter contains the manager’s opinion. It should not be regarded as investment advice or recommendation of specific securities. Past performance is no guarantee of future results.
There are risks involved with investing, including possible loss of principal. There is no guarantee the Funds will achieve their objectives.
5
Impact Shares Trust I
Management Discussion of Fund Performance
June 30, 2023 (Unaudited)
Growth of a $10,000 Investment
(at Net Asset Value)
* Fund commenced operations on July 18, 2018.
The performance data quoted herein represents past performance and the return and value of an investment in the Fund will fluctuate so that shares, when redeemed or sold in the market, may be worth more or less than their original cost. Past performance is no guarantee of future performance and should not be considered as a representation of the future results of the Fund. The Fund’s performance assumes the reinvestment of all dividends and all capital gains. Index returns assume reinvestment of dividends and, unlike a Fund’s returns, do not reflect any fees or expenses. If such fees and expenses were included in the index returns, the performance would have been lower. Please note that one cannot invest directly in an unmanaged index.
Current performance may be lower or higher than the performance data shown above.
There are no assurances that the Fund will meet its stated objectives.
The Fund’s holdings and allocations are subject to change and should not be considered recommendations to buy individual securities.
Returns shown do not reflect the deduction of taxes that a shareholder would pay on Fund distributions or the redemption of Fund shares.
See definition of comparative indices on page 2.
6
Impact Shares Trust I
Management Discussion of Fund Performance
June 30, 2023 (Unaudited)
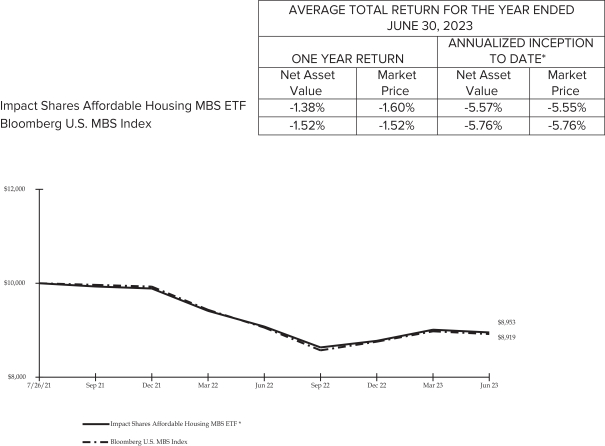
OWNS
The Impact Shares Affordable Housing MBS ETF (the “Fund” or “OWNS”) seeks to approximate the broader agency mortgage-backed securities (MBS) market by investing in MBS backed by pools of mortgage loans made to minority families, low- and moderate-income (LMI) families, and/or families that live in persistent poverty areas. OWNS seeks to invest in the dignity of homeownership for these traditionally underserved communities. Home loans include those in census tracts where more than 50% of the population is non-white and at least 40% of the population is living at or below the poverty line. Additionally, OWNS will include loans in counties where 20% or more of the population has lived in poverty for more than 20 years and loans to minority borrowers or loans originated in a census tract where more than 50% of the population is a minority. OWNS also looks to invest in MBS backed by pools of loans sourced from non-traditional originators including Community Development Financial Institutions (CDFIs) and minority-owned banks. From July 1, 2022 through June 30, 2023 (the “Reporting Period”), the total return for the Fund was -1.38%. In comparison to the Fund’s performance, during the Reporting Period, the total return for the Lipper US Mortgage Funds Category was -1.59% while the Fund’s benchmark, the Bloomberg U.S. MBS Index, generated a total return of -1.52%.
As of fiscal year end June 30, 2023, inflation was lower compared to prior fiscal year end, yet interest rates were higher particularly on the front end of the curve where rates rose over 400 basis points in 1-month T-Bills and 194 basis points in the two-year Treasury Note. Driving the decline in inflation has been a reduction in supply chain issues that the global economy faced post-Covid. Additionally, commodities prices have returned to more normalized levels after Russia’s invasion of Ukraine sent them soaring. However, inflation still remains higher than the Federal Reserve’s target and, combined with tight labor markets, has led to expectations for continued Fed rate tightening.
The Fund outperformed the benchmark for the 12-month period ending June 30, 2023. The Fund’s underweight allocation to lower coupon MBS was the main factor leading the Fund’s relative outperformance, as lower coupon MBS underperformed the rest of the cohort given the move in rates.
This letter contains the manager’s opinion. It should not be regarded as investment advice or recommendation of specific securities. Past performance is no guarantee of future results.
There are risks involved with investing, including possible loss of principal. There is no guarantee the Funds will achieve their objectives.
7
Impact Shares Trust I
Management Discussion of Fund Performance
June 30, 2023 (Unaudited)
Growth of a $10,000 Investment
(at Net Asset Value)
* Fund commenced operations on July 26, 2021.
The performance data quoted herein represents past performance and the return and value of an investment in the Fund will fluctuate so that shares, when redeemed or sold in the market, may be worth more or less than their original cost. Past performance is no guarantee of future performance and should not be considered as a representation of the future results of the Fund. The Fund’s performance assumes the reinvestment of all dividends and all capital gains. Index returns assume reinvestment of dividends and, unlike a Fund’s returns, do not reflect any fees or expenses. If such fees and expenses were included in the index returns, the performance would have been lower. Please note that one cannot invest directly in an unmanaged index.
Current performance may be lower or higher than the performance data shown above.
There are no assurances that the Fund will meet its stated objectives.
The Fund’s holdings and allocations are subject to change and should not be considered recommendations to buy individual securities.
Returns shown do not reflect the deduction of taxes that a shareholder would pay on Fund distributions or the redemption of Fund shares.
See definition of comparative indices on page 2.
8
Impact Shares YWCA Women’s Empowerment ETF
Schedule of Investments
June 30, 2023
Sector Weightings (Unaudited)†:
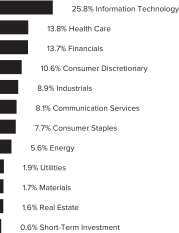
† Percentages based on total investments.
| | | | | | | | |
| Description | | Shares | | | Fair Value | |
| | |
COMMON STOCK — 99.4% | | | | | | | | |
|
Communication Services— 8.1% | |
AT&T | | | 15,954 | | | $ | 254,467 | |
Comcast, Cl A | | | 18,556 | | | | 771,002 | |
Interpublic Group | | | 868 | | | | 33,487 | |
Lumen Technologies | | | 2,128 | | | | 4,809 | |
Match Group* | | | 609 | | | | 25,487 | |
Meta Platforms, Cl A* | | | 5,032 | | | | 1,444,083 | |
Omnicom Group | | | 457 | | | | 43,484 | |
Verizon Communications | | | 9,395 | | | | 349,400 | |
Walt Disney* | | | 4,073 | | | | 363,637 | |
| | | | | | | | |
| | |
| | | | | | | 3,289,856 | |
| | | | | | | | |
|
Consumer Discretionary— 10.6% | |
Amazon.com* | | | 19,334 | | | | 2,520,380 | |
Aptiv PLC* | | | 623 | | | | 63,602 | |
Best Buy | | | 462 | | | | 37,861 | |
Deckers Outdoor* | | | 60 | | | | 31,660 | |
DoorDash, Cl A* | | | 575 | | | | 43,941 | |
eBay | | | 1,250 | | | | 55,863 | |
Etsy* | | | 288 | | | | 24,368 | |
Expedia Group* | | | 348 | | | | 38,068 | |
General Motors | | | 3,266 | | | | 125,937 | |
Hasbro | | | 300 | | | | 19,431 | |
Lululemon Athletica | | | 270 | | | | 102,195 | |
McDonald’s | | | 1,685 | | | | 502,821 | |
Starbucks | | | 2,639 | | | | 261,419 | |
Target | | | 1,030 | | | | 135,857 | |
| | | | | | | | |
| Description | | Shares | | | Fair Value | |
TJX | | | 2,670 | | | $ | 226,389 | |
VF | | | 758 | | | | 14,470 | |
Williams-Sonoma | | | 149 | | | | 18,646 | |
Yum! Brands | | | 647 | | | | 89,642 | |
| | | | | | | | |
| | |
| | | | | | | 4,312,550 | |
| | | | | | | | |
|
Consumer Staples— 7.7% | |
Archer-Daniels-Midland | | | 1,229 | | | | 92,863 | |
Brown-Forman, Cl A | | | 6 | | | | 408 | |
Brown-Forman, Cl B | | | 24 | | | | 1,603 | |
Campbell Soup | | | 451 | | | | 20,615 | |
Church & Dwight | | | 544 | | | | 54,525 | |
Clorox | | | 275 | | | | 43,736 | |
Coca-Cola | | | 8,707 | | | | 524,335 | |
Colgate-Palmolive | | | 1,870 | | | | 144,065 | |
Conagra Brands | | | 1,071 | | | | 36,114 | |
Estee Lauder, Cl A | | | 518 | | | | 101,725 | |
General Mills | | | 1,327 | | | | 101,781 | |
Hershey | | | 328 | | | | 81,902 | |
J M Smucker | | | 240 | | | | 35,441 | |
Kellogg | | | 573 | | | | 38,620 | |
Kimberly-Clark | | | 754 | | | | 104,097 | |
Kraft Heinz | | | 1,778 | | | | 63,119 | |
Kroger | | | 1,454 | | | | 68,338 | |
Molson Coors Beverage, Cl B | | | 419 | | | | 27,587 | |
Mondelez International, Cl A | | | 2,582 | | | | 188,331 | |
PepsiCo | | | 3,080 | | | | 570,478 | |
Procter & Gamble | | | 5,301 | | | | 804,374 | |
| | | | | | | | |
| | |
| | | | | | | 3,104,057 | |
| | | | | | | | |
|
Energy— 5.6% | |
Baker Hughes, Cl A | | | 2,387 | | | | 75,453 | |
Chevron | | | 3,988 | | | | 627,512 | |
ConocoPhillips | | | 2,791 | | | | 289,175 | |
Exxon Mobil | | | 9,219 | | | | 988,738 | |
Occidental Petroleum | | | 1,632 | | | | 95,962 | |
Phillips 66 | | | 1,060 | | | | 101,103 | |
Williams | | | 2,667 | | | | 87,024 | |
| | | | | | | | |
| | |
| | | | | | | 2,264,967 | |
| | | | | | | | |
|
Financials— 13.7% | |
Allstate | | | 594 | | | | 64,770 | |
American Express | | | 1,335 | | | | 232,557 | |
American International Group | | | 1,665 | | | | 95,804 | |
Ameriprise Financial | | | 237 | | | | 78,722 | |
Bank of America | | | 15,612 | | | | 447,908 | |
The accompanying notes are an integral part of the financial statements.
9
Impact Shares YWCA Women’s Empowerment ETF
Schedule of Investments
June 30, 2023
| | | | | | | | |
| Description | | Shares | | | Fair Value | |
Bank of New York Mellon | | | 1,643 | | | $ | 73,147 | |
BlackRock, Cl A | | | 334 | | | | 230,841 | |
Capital One Financial | | | 853 | | | | 93,292 | |
Citigroup | | | 4,322 | | | | 198,985 | |
Fifth Third Bancorp | | | 1,533 | | | | 40,180 | |
First Republic Bank | | | 410 | | | | 225 | |
Goldman Sachs Group | | | 756 | | | | 243,840 | |
Hartford Financial Services Group | | | 714 | | | | 51,422 | |
Huntington Bancshares | | | 3,224 | | | | 34,755 | |
JPMorgan Chase | | | 1,088 | | | | 158,239 | |
KeyCorp | | | 2,087 | | | | 19,284 | |
Lincoln National | | | 347 | | | | 8,939 | |
Mastercard, Cl A | | | 1,895 | | | | 745,303 | |
MetLife | | | 1,480 | | | | 83,664 | |
Moody’s | | | 353 | | | | 122,745 | |
Morgan Stanley | | | 2,947 | | | | 251,674 | |
Northern Trust | | | 466 | | | | 34,549 | |
PayPal Holdings* | | | 2,549 | | | | 170,095 | |
Principal Financial Group | | | 511 | | | | 38,754 | |
Progressive | | | 1,310 | | | | 173,405 | |
Prudential Financial | | | 825 | | | | 72,782 | |
Regions Financial | | | 2,091 | | | | 37,262 | |
S&P Global | | | 745 | | | | 298,663 | |
State Street | | | 818 | | | | 59,861 | |
T Rowe Price Group | | | 498 | | | | 55,786 | |
US Bancorp | | | 3,019 | | | | 99,748 | |
Visa, Cl A | | | 3,650 | | | | 866,802 | |
Wells Fargo | | | 8,467 | | | | 361,371 | |
| | | | | | | | |
| | |
| | | | | | | 5,545,374 | |
| | | | | | | | |
|
Health Care— 13.8% | |
AbbVie | | | 3,960 | | | | 533,531 | |
Agilent Technologies | | | 661 | | | | 79,485 | |
AmerisourceBergen, Cl A | | | 361 | | | | 69,467 | |
Amgen | | | 1,194 | | | | 265,092 | |
Baxter International | | | 1,132 | | | | 51,574 | |
Biogen* | | | 322 | | | | 91,721 | |
BioMarin Pharmaceutical* | | | 416 | | | | 36,059 | |
Bristol-Myers Squibb | | | 4,760 | | | | 304,402 | |
Cardinal Health | | | 586 | | | | 55,418 | |
Cigna Group | | | 684 | | | | 191,930 | |
Elevance Health | | | 533 | | | | 236,807 | |
Eli Lilly | | | 62 | | | | 29,077 | |
Gilead Sciences | | | 2,810 | | | | 216,567 | |
Johnson & Johnson | | | 5,853 | | | | 968,788 | |
Merck | | | 5,677 | | | | 655,069 | |
Pfizer | | | 12,588 | | | | 461,728 | |
Regeneron Pharmaceuticals* | | | 241 | | | | 173,168 | |
UnitedHealth Group | | | 2,057 | | | | 988,677 | |
Vertex Pharmaceuticals* | | | 574 | | | | 201,996 | |
| | | | | | | | |
| | |
| | | | | | | 5,610,556 | |
| | | | | | | | |
| | | | | | | | |
| Description | | Shares | | | Fair Value | |
|
Industrials— 8.9% | |
3M | | | 1,234 | | | $ | 123,511 | |
Automatic Data Processing | | | 926 | | | | 203,525 | |
Avis Budget Group* | | | 438 | | | | 100,157 | |
Booz Allen Hamilton Holding, Cl A | | | 295 | | | | 32,922 | |
Carrier Global | | | 1,831 | | | | 91,019 | |
Caterpillar | | | 1,165 | | | | 286,648 | |
Cummins | | | 24 | | | | 5,884 | |
Delta Air Lines | | | 1,430 | | | | 67,982 | |
Eaton PLC | | | 890 | | | | 178,979 | |
Emerson Electric | | | 1,323 | | | | 119,586 | |
Fortive | | | 1,161 | | | | 86,808 | |
General Electric | | | 2,439 | | | | 267,924 | |
Honeywell International | | | 62 | | | | 12,865 | |
Ingersoll Rand | | | 886 | | | | 57,909 | |
Johnson Controls International PLC | | | 1,539 | | | | 104,867 | |
Norfolk Southern | | | 518 | | | | 117,462 | |
Owens Corning | | | 209 | | | | 27,275 | |
Paychex | | | 703 | | | | 78,645 | |
Pentair PLC | | | 369 | | | | 23,837 | |
Republic Services, Cl A | | | 450 | | | | 68,927 | |
Robert Half International | | | 244 | | | | 18,354 | |
Rockwell Automation | | | 257 | | | | 84,669 | |
Southwest Airlines | | | 1,324 | | | | 47,942 | |
Stanley Black & Decker | | | 322 | | | | 30,175 | |
Trane Technologies PLC | | | 505 | | | | 96,586 | |
TransUnion | | | 430 | | | | 33,682 | |
Uber Technologies* | | | 6,537 | | | | 282,202 | |
Union Pacific | | | 1,375 | | | | 281,353 | |
United Parcel Service, Cl B | | | 1,630 | | | | 292,177 | |
Verisk Analytics, Cl A | | | 351 | | | | 79,336 | |
Waste Management | | | 836 | | | | 144,979 | |
WEX* | | | 143 | | | | 26,036 | |
WW Grainger | | | 101 | | | | 79,648 | |
Xylem | | | 404 | | | | 45,499 | |
| | | | | | | | |
| | |
| | | | | | | 3,599,370 | |
| | | | | | | | |
|
Information Technology— 25.8% | |
Accenture PLC, Cl A | | | 2,115 | | | | 652,647 | |
Adobe* | | | 1,558 | | | | 761,846 | |
ANSYS* | | | 284 | | | | 93,797 | |
Apple | | | 8,420 | | | | 1,633,228 | |
Autodesk* | | | 723 | | | | 147,933 | |
HP | | | 2,982 | | | | 91,577 | |
Intel | | | 13,833 | | | | 462,576 | |
International Business Machines | | | 3,035 | | | | 406,113 | |
The accompanying notes are an integral part of the financial statements.
10
Impact Shares YWCA Women’s Empowerment ETF
Schedule of Investments
June 30, 2023
| | | | | | | | |
| Description | | Shares | | | Fair Value | |
Intuit | | | 945 | | | $ | 432,989 | |
Keysight Technologies* | | | 600 | | | | 100,470 | |
Motorola Solutions | | | 563 | | | | 165,117 | |
NVIDIA | | | 8,338 | | | | 3,527,141 | |
Okta, Cl A* | | | 496 | | | | 34,397 | |
QUALCOMM | | | 3,760 | | | | 447,590 | |
Salesforce* | | | 3,351 | | | | 707,932 | |
ServiceNow* | | | 660 | | | | 370,900 | |
Splunk* | | | 490 | | | | 51,984 | |
TE Connectivity | | | 1,068 | | | | 149,691 | |
VMware, Cl A* | | | 682 | | | | 97,997 | |
Workday, Cl A* | | | 676 | | | | 152,702 | |
| | | | | | | | |
| | |
| | | | | | | 10,488,627 | |
| | | | | | | | |
|
Materials— 1.7% | |
Air Products and Chemicals | | | 495 | | | | 148,267 | |
Alcoa | | | 385 | | | | 13,063 | |
Avery Dennison | | | 179 | | | | 30,752 | |
Celanese, Cl A | | | 223 | | | | 25,823 | |
Dow | | | 1,573 | | | | 83,778 | |
DuPont de Nemours | | | 1,111 | | | | 79,370 | |
Ecolab | | | 553 | | | | 103,240 | |
International Flavors & Fragrances | | | 570 | | | | 45,366 | |
Newmont | | | 1,778 | | | | 75,850 | |
PPG Industries | | | 525 | | | | 77,858 | |
| | | | | | | | |
| | |
| | | | | | | 683,367 | |
| | | | | | | | |
|
Real Estate— 1.6% | |
Boston Properties‡ | | | 312 | | | | 17,968 | |
CBRE Group, Cl A* | | | 705 | | | | 56,900 | |
Equinix‡ | | | 207 | | | | 162,276 | |
Equity LifeStyle Properties‡ | | | 390 | | | | 26,087 | |
Essex Property Trust‡ | | | 146 | | | | 34,208 | |
Healthpeak Properties‡ | | | 1,203 | | | | 24,180 | |
Host Hotels & Resorts‡ | | | 1,598 | | | | 26,894 | |
Invitation Homes‡ | | | 1,270 | | | | 43,688 | |
Iron Mountain‡ | | | 650 | | | | 36,933 | |
Jones Lang LaSalle* | | | 106 | | | | 16,515 | |
Mid-America Apartment Communities‡ | | | 258 | | | | 39,180 | |
Ventas‡ | | | 894 | | | | 42,259 | |
Welltower‡ | | | 1,056 | | | | 85,420 | |
Zillow Group, Cl A* | | | 125 | | | | 6,150 | |
Zillow Group, Cl C* | | | 353 | | | | 17,742 | |
| | | | | | | | |
| | |
| | | | | | | 636,400 | |
| | | | | | | | |
| | | | | | | | |
| Description | | Shares | | | Fair Value | |
|
Utilities— 1.9% | |
American Water Works | | | 407 | | | $ | 58,099 | |
Avangrid | | | 167 | | | | 6,293 | |
CenterPoint Energy | | | 1,404 | | | | 40,927 | |
CMS Energy | | | 648 | | | | 38,070 | |
Consolidated Edison | | | 793 | | | | 71,687 | |
Dominion Energy | | | 1,862 | | | | 96,433 | |
Edison International | | | 854 | | | | 59,310 | |
Entergy | | | 33 | | | | 3,213 | |
Exelon | | | 2,214 | | | | 90,198 | |
NiSource | | | 907 | | | | 24,807 | |
PG&E* | | | 3,595 | | | | 62,122 | |
PPL | | | 1,644 | | | | 43,500 | |
Public Service Enterprise Group | | | 1,092 | | | | 68,370 | |
Sempra Energy | | | 702 | | | | 102,204 | |
Vistra | | | 839 | | | | 22,024 | |
| | | | | | | | |
| | |
| | | | | | | 787,257 | |
| | | | | | | | |
| | |
Total Common Stock
(Cost $36,812,359) | | | | | | | 40,322,381 | |
| | | | | | | | |
|
SHORT-TERM INVESTMENT — 0.6% | |
Invesco Government & Agency Portfolio, Cl Institutional, 5.050% (A) | | | 259,155 | | | | 259,155 | |
| | | | | | | | |
| | |
Total Short-Term Investment
(Cost $259,155) | | | | | | | 259,155 | |
| | | | | | | | |
Total Investments - 100.0%
(Cost $37,071,514) | | | | | | $ | 40,581,536 | |
| | | | | | | | |
Percentages are based on Net Assets of $40,587,592.
| * | Non-income producing security. |
| ‡ | Real Estate Investment Trust |
| (A) | Rate shown represents the 7-day effective yield as of June 30, 2023. |
Cl — Class
PLC — Public Limited Company
As of June 30, 2023, all of the Fund’s investments were considered Level 1 in accordance with the authoritative guidance under U.S. Generally Accepted Accounting Principles.
For more information on valuation inputs, see Note 2 in Notes to Financial Statements.
The accompanying notes are an integral part of the financial statements.
11
Impact Shares NAACP Minority Empowerment ETF
Schedule of Investments
June 30, 2023
Sector Weightings (Unaudited)†:
† Percentages based on total investments.
| | | | | | | | |
| Description | | Shares | | | Fair Value | |
| | |
COMMON STOCK — 94.7% | | | | | | | | |
|
Communication Services— 10.4% | |
Alphabet, Cl A* | | | 10,463 | | | $ | 1,252,421 | |
Alphabet, Cl C* | | | 9,275 | | | | 1,121,997 | |
AT&T | | | 17,087 | | | | 272,538 | |
Electronic Arts | | | 626 | | | | 81,192 | |
Interpublic Group | | | 946 | | | | 36,497 | |
Lumen Technologies | | | 2,283 | | | | 5,160 | |
Meta Platforms, Cl A* | | | 5,379 | | | | 1,543,665 | |
Verizon Communications | | | 10,065 | | | | 374,317 | |
| | | | | | | | |
| | |
| | | | | | | 4,687,787 | |
| | | | | | | | |
|
Consumer Discretionary— 9.3% | |
Amazon.com* | | | 11,598 | | | | 1,511,915 | |
Aptiv PLC* | | | 538 | | | | 54,924 | |
BorgWarner | | | 469 | | | | 22,939 | |
Dollar Tree* | | | 419 | | | | 60,126 | |
eBay | | | 1,077 | | | | 48,131 | |
Ford Motor | | | 7,803 | | | | 118,059 | |
General Motors | | | 2,809 | | | | 108,315 | |
Hasbro | | | 263 | | | | 17,035 | |
Hilton Worldwide Holdings | | | 50 | | | | 7,277 | |
Lear | | | 116 | | | | 16,652 | |
Lowe’s | | | 1,228 | | | | 277,160 | |
Marriott International, Cl A | | | 50 | | | | 9,185 | |
MercadoLibre* | | | 93 | | | | 110,168 | |
NIKE, Cl B | | | 2,489 | | | | 274,711 | |
Royal Caribbean Cruises* | | | 430 | | | | 44,608 | |
| | | | | | | | |
| Description | | Shares | | | Fair Value | |
Target | | | 914 | | | $ | 120,557 | |
Tesla* | | | 5,279 | | | | 1,381,884 | |
VF | | | 655 | | | | 12,504 | |
| | | | | | | | |
| | |
| | | | | | | 4,196,150 | |
| | | | | | | | |
|
Consumer Staples— 4.2% | |
Archer-Daniels-Midland | | | 1,089 | | | | 82,285 | |
Bunge | | | 295 | | | | 27,833 | |
Campbell Soup | | | 397 | | | | 18,147 | |
Clorox | | | 242 | | | | 38,488 | |
Coca-Cola | | | 7,704 | | | | 463,935 | |
Constellation Brands, Cl A | | | 322 | | | | 79,254 | |
Hormel Foods | | | 571 | | | | 22,966 | |
J M Smucker | | | 212 | | | | 31,306 | |
Kellogg | | | 506 | | | | 34,104 | |
Kimberly-Clark | | | 668 | | | | 92,224 | |
Kraft Heinz | | | 1,574 | | | | 55,877 | |
Kroger | | | 1,288 | | | | 60,536 | |
Molson Coors Beverage, Cl B | | | 374 | | | | 24,624 | |
Mondelez International, Cl A | | | 2,704 | | | | 197,230 | |
PepsiCo | | | 2,726 | | | | 504,909 | |
Sysco | | | 1,003 | | | | 74,423 | |
Tyson Foods, Cl A | | | 572 | | | | 29,195 | |
US Foods Holding* | | | 410 | | | | 18,040 | |
Walgreens Boots Alliance | | | 1,423 | | | | 40,541 | |
| | | | | | | | |
| | |
| | | | | | | 1,895,917 | |
| | | | | | | | |
|
Energy— 5.3% | |
Cheniere Energy | | | 493 | | | | 75,113 | |
Chevron | | | 3,519 | | | | 553,715 | |
ConocoPhillips | | | 2,464 | | | | 255,295 | |
Devon Energy | | | 1,292 | | | | 62,455 | |
Exxon Mobil | | | 8,157 | | | | 874,838 | |
Hess | | | 550 | | | | 74,773 | |
Kinder Morgan | | | 3,907 | | | | 67,279 | |
Marathon Petroleum | | | 929 | | | | 108,321 | |
ONEOK | | | 885 | | | | 54,622 | |
Phillips 66 | | | 936 | | | | 89,276 | |
Range Resources | | | 73 | | | | 2,146 | |
Valero Energy | | | 764 | | | | 89,617 | |
Williams | | | 2,408 | | | | 78,573 | |
| | | | | | | | |
| | |
| | | | | | | 2,386,023 | |
| | | | | | | | |
|
Financials— 10.4% | |
American Express | | | 1,182 | | | | 205,904 | |
Aon PLC, Cl A | | | 408 | | | | 140,841 | |
Bank of America | | | 13,819 | | | | 396,467 | |
Bank of New York Mellon | | | 1,455 | | | | 64,777 | |
The accompanying notes are an integral part of the financial statements.
12
Impact Shares NAACP Minority Empowerment ETF
Schedule of Investments
June 30, 2023
| | | | | | | | |
| Description | | Shares | | | Fair Value | |
Charles Schwab | | | 3,012 | | | $ | 170,720 | |
Citigroup | | | 3,828 | | | | 176,241 | |
Huntington Bancshares | | | 2,858 | | | | 30,809 | |
JPMorgan Chase | | | 5,802 | | | | 843,843 | |
Mastercard, Cl A | | | 1,679 | | | | 660,351 | |
MetLife | | | 1,307 | | | | 73,885 | |
Moody’s | | | 314 | | | | 109,184 | |
Morgan Stanley | | | 2,609 | | | | 222,809 | |
Nasdaq | | | 670 | | | | 33,400 | |
PayPal Holdings* | | | 2,253 | | | | 150,343 | |
PNC Financial Services Group | | | 796 | | | | 100,256 | |
Regions Financial | | | 1,848 | | | | 32,931 | |
S&P Global | | | 660 | | | | 264,587 | |
Synchrony Financial | | | 891 | | | | 30,223 | |
T Rowe Price Group | | | 442 | | | | 49,513 | |
Travelers | | | 462 | | | | 80,231 | |
Truist Financial | | | 2,624 | | | | 79,639 | |
Visa, Cl A | | | 3,234 | | | | 768,010 | |
| | | | | | | | |
| | |
| | | | | | | 4,684,964 | |
| | | | | | | | |
|
Health Care— 13.5% | |
Abbott Laboratories | | | 3,450 | | | | 376,119 | |
AbbVie | | | 3,505 | | | | 472,229 | |
Agilent Technologies | | | 583 | | | | 70,106 | |
Baxter International | | | 1,003 | | | | 45,697 | |
Becton Dickinson | | | 564 | | | | 148,902 | |
Biogen* | | | 284 | | | | 80,897 | |
Boston Scientific* | | | 2,834 | | | | 153,291 | |
Bristol-Myers Squibb | | | 4,214 | | | | 269,485 | |
Cigna Group | | | 606 | | | | 170,044 | |
CVS Health | | | 2,596 | | | | 179,461 | |
Edwards Lifesciences* | | | 1,223 | | | | 115,365 | |
Elevance Health | | | 483 | | | | 214,592 | |
Gilead Sciences | | | 2,489 | | | | 191,827 | |
Illumina* | | | 308 | | | | 57,747 | |
Johnson & Johnson | | | 5,183 | | | | 857,890 | |
Laboratory Corp of America Holdings | | | 175 | | | | 42,233 | |
Medtronic PLC | | | 2,639 | | | | 232,496 | |
Merck | | | 5,031 | | | | 580,527 | |
Pfizer | | | 11,154 | | | | 409,129 | |
Quest Diagnostics | | | 225 | | | | 31,626 | |
ResMed | | | 289 | | | | 63,146 | |
Teleflex | | | 94 | | | | 22,751 | |
Thermo Fisher Scientific | | | 776 | | | | 404,878 | |
UnitedHealth Group | | | 1,848 | | | | 888,223 | |
| | | | | | | | |
| | |
| | | | | | | 6,078,661 | |
| | | | | | | | |
| | | | | | | | |
| Description | | Shares | | | Fair Value | |
|
Industrials— 8.4% | |
3M | | | 1,095 | | | $ | 109,599 | |
AECOM | | | 281 | | | | 23,798 | |
American Airlines Group* | | | 1,280 | | | | 22,963 | |
AMETEK | | | 454 | | | | 73,493 | |
Automatic Data Processing | | | 822 | | | | 180,667 | |
Boeing* | | | 1,109 | | | | 234,176 | |
Booz Allen Hamilton Holding, Cl A | | | 263 | | | | 29,351 | |
CSX | | | 4,156 | | | | 141,720 | |
Cummins | | | 279 | | | | 68,400 | |
Deere | | | 545 | | | | 220,829 | |
Delta Air Lines | | | 1,265 | | | | 60,138 | |
Eaton PLC | | | 786 | | | | 158,065 | |
Emerson Electric | | | 1,170 | | | | 105,756 | |
Expeditors International of Washington | | | 317 | | | | 38,398 | |
FedEx | | | 471 | | | | 116,761 | |
General Electric | | | 2,158 | | | | 237,056 | |
Honeywell International | | | 1,332 | | | | 276,390 | |
Howmet Aerospace | | | 728 | | | | 36,080 | |
Illinois Tool Works | | | 553 | | | | 138,338 | |
Jacobs Solutions | | | 259 | | | | 30,792 | |
JB Hunt Transport Services | | | 164 | | | | 29,689 | |
Johnson Controls International PLC | | | 1,382 | | | | 94,170 | |
Lennox International | | | 64 | | | | 20,868 | |
Lincoln Electric Holdings | | | 116 | | | | 23,041 | |
Nordson | | | 107 | | | | 26,555 | |
Northrop Grumman | | | 286 | | | | 130,359 | |
Rockwell Automation | | | 227 | | | | 74,785 | |
Southwest Airlines | | | 1,174 | | | | 42,511 | |
Stanley Black & Decker | | | 291 | | | | 27,270 | |
Textron | | | 416 | | | | 28,134 | |
Uber Technologies* | | | 8,104 | | | | 349,850 | |
Union Pacific | | | 1,217 | | | | 249,022 | |
United Airlines Holdings* | | | 644 | | | | 35,336 | |
United Parcel Service, Cl B | | | 1,439 | | | | 257,941 | |
United Rentals | | | 135 | | | | 60,125 | |
Xylem | | | 355 | | | | 39,980 | |
| | | | | | | | |
| | |
| | | | | | | 3,792,406 | |
| | | | | | | | |
|
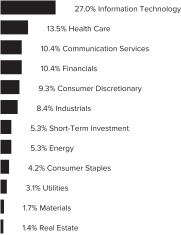
Information Technology— 27.0% | |
Accenture PLC, Cl A | | | 2,564 | | | | 791,199 | |
Apple | | | 13,467 | | | | 2,612,194 | |
Cisco Systems | | | 16,729 | | | | 865,558 | |
Dell Technologies, Cl C | | | 1,057 | | | | 57,195 | |
HP | | | 3,606 | | | | 110,740 | |
The accompanying notes are an integral part of the financial statements.
13
Impact Shares NAACP Minority Empowerment ETF
Schedule of Investments
June 30, 2023
| | | | | | | | |
| Description | | Shares | | | Fair Value | |
Intel | | | 16,797 | | | $ | 561,692 | |
International Business Machines | | | 3,687 | | | | 493,357 | |
Micron Technology | | | 4,436 | | | | 279,956 | |
Microsoft | | | 655 | | | | 223,054 | |
NVIDIA | | | 10,104 | | | | 4,274,194 | |
Palo Alto Networks* | | | 1,197 | | | | 305,846 | |
QUALCOMM | | | 4,572 | | | | 544,251 | |
Salesforce* | | | 4,063 | | | | 858,349 | |
Workday, Cl A* | | | 816 | | | | 184,326 | |
| | | | | | | | |
| | |
| | | | | | | 12,161,911 | |
| | | | | | | | |
|
Materials— 1.7% | |
Albemarle | | | 231 | | | | 51,534 | |
Alcoa | | | 349 | | | | 11,842 | |
CF Industries Holdings | | | 388 | | | | 26,935 | |
DuPont de Nemours | | | 980 | | | | 70,011 | |
Eastman Chemical | | | 236 | | | | 19,758 | |
Ecolab | | | 491 | | | | 91,665 | |
FMC | | | 247 | | | | 25,772 | |
Freeport-McMoRan, Cl B | | | 2,824 | | | | 112,960 | |
International Flavors & Fragrances | | | 504 | | | | 40,113 | |
Martin Marietta Materials | | | 122 | | | | 56,326 | |
Mosaic | | | 673 | | | | 23,555 | |
Newmont | | | 1,569 | | | | 66,933 | |
PPG Industries | | | 463 | | | | 68,663 | |
Southern Copper | | | 171 | | | | 12,268 | |
Vulcan Materials | | | 264 | | | | 59,516 | |
| | | | | | | | |
| | |
| | | | | | | 737,851 | |
| | | | | | | | |
|
Real Estate— 1.4% | |
American Homes 4 Rent, Cl A‡ | | | 608 | | | | 21,554 | |
AvalonBay Communities‡ | | | 277 | | | | 52,428 | |
Crown Castle‡ | | | 75 | | | | 8,545 | |
Equinix‡ | | | 182 | | | | 142,677 | |
Equity Residential‡ | | | 673 | | | | 44,398 | |
Healthpeak Properties‡ | | | 1,063 | | | | 21,366 | |
Jones Lang LaSalle* | | | 97 | | | | 15,113 | |
Prologis‡ | | | 1,827 | | | | 224,045 | |
Regency Centers‡ | | | 307 | | | | 18,963 | |
Welltower‡ | | | 936 | | | | 75,713 | |
| | | | | | | | |
| | |
| | | | | | | 624,802 | |
| | | | | | | | |
|
Utilities— 3.1% | |
AES | | | 1,318 | | | | 27,322 | |
Alliant Energy | | | 493 | | | | 25,873 | |
American Electric Power | | | 1,025 | | | | 86,305 | |
Avangrid | | | 135 | | | | 5,087 | |
CMS Energy | | | 573 | | | | 33,664 | |
Consolidated Edison | | | 704 | | | | 63,642 | |
| | | | | | | | |
| Description | | Shares | | | Fair Value | |
Dominion Energy | | | 1,651 | | | $ | 85,505 | |
DTE Energy | | | 384 | | | | 42,248 | |
Edison International | | | 753 | | | | 52,296 | |
Entergy | | | 35 | | | | 3,408 | |
Eversource Energy | | | 687 | | | | 48,722 | |
Exelon | | | 1,961 | | | | 79,891 | |
FirstEnergy | | | 1,073 | | | | 41,718 | |
NextEra Energy | | | 3,929 | | | | 291,532 | |
NiSource | | | 801 | | | | 21,907 | |
NRG Energy | | | 455 | | | | 17,012 | |
PPL | | | 1,456 | | | | 38,526 | |
Public Service Enterprise Group | | | 984 | | | | 61,608 | |
Sempra Energy | | | 621 | | | | 90,411 | |
Southern | | | 2,156 | | | | 151,459 | |
WEC Energy Group | | | 623 | | | | 54,973 | |
Xcel Energy | | | 1,081 | | | | 67,206 | |
| | | | | | | | |
| | |
| | | | | | | 1,390,315 | |
| | | | | | | | |
| |
Total Common Stock
(Cost $36,521,212) | | | 42,636,787 | |
| | | | | | | | |
|
SHORT-TERM INVESTMENT — 5.3% | |
Invesco Government & Agency Portfolio, Cl Institutional, 5.050% (A) | | | 2,397,518 | | | | 2,397,518 | |
| | | | | | | | |
| | |
Total Short-Term Investment
(Cost $2,397,518) | | | | | | | 2,397,518 | |
| | | | | | | | |
Total Investments - 100.0%
(Cost $38,918,730) | | | | | | $ | 45,034,305 | |
| | | | | | | | |
Percentages are based on Net Assets of $45,050,954.
| * | Non-income producing security. |
| ‡ | Real Estate Investment Trust |
| (A) | Rate shown represents the 7-day effective yield as of June 30, 2023. |
Cl — Class
PLC — Public Limited Company
As of June 30, 2023, all of the Fund’s investments were considered Level 1 in accordance with the authoritative guidance under U.S. Generally Accepted Accounting Principles.
For more information on valuation inputs, see Note 2 in Notes to Financial Statements.
The accompanying notes are an integral part of the financial statements.
14
Impact Shares Affordable Housing MBS ETF
Schedule of Investments
June 30, 2023
Sector Weightings (Unaudited)†:

| † | Percentages based on total investments. |
| | | | | | | | |
| | | |
| Description | | Face
Amount | | | Fair Value | |
|
MORTGAGE-BACKED SECURITIES — 98.9% | |
|
Agency Mortgage-Backed Obligations — 98.9% | |
FHLMC | | | | | | | | |
6.000%, 12/01/2023 to 06/01/2053 | | $ | 1,717,303 | | | $ | 1,736,397 | |
5.500%, 02/01/2029 to 06/01/2053 | | | 1,614,701 | | | | 1,612,330 | |
5.000%, 03/01/2050 to 05/01/2053 | | | 1,860,669 | | | | 1,827,546 | |
4.500%, 01/01/2049 to 05/01/2053 | | | 2,326,879 | | | | 2,245,365 | |
4.000%, 10/01/2037 to 04/01/2053 | | | 2,931,904 | | | | 2,786,146 | |
3.500%, 10/01/2051 to 08/01/2052 | | | 4,757,094 | | | | 4,341,680 | |
3.000%, 09/01/2034 to 08/01/2052 | | | 9,207,643 | | | | 8,193,096 | |
2.500%, 08/01/2051 to 03/01/2052 | | | 8,893,162 | | | | 7,564,381 | |
2.000%, 08/01/2035 to 01/01/2052 | | | 14,559,033 | | | | 12,153,160 | |
1.500%,08/01/2036 | | | 414,894 | | | | 358,064 | |
FNMA | | | | | | | | |
6.000%, 11/01/2052 to 06/01/2053 | | | 414,058 | | | | 419,320 | |
5.500%, 04/01/2031 to 06/01/2053 | | | 2,394,811 | | | | 2,389,884 | |
5.000%, 12/01/2048 to 06/01/2053 | | | 4,174,991 | | | | 4,098,187 | |
4.500%, 11/01/2048 to 07/01/2053 | | | 4,899,837 | | | | 4,724,531 | |
4.000%, 07/01/2048 to 07/01/2053 | | | 8,328,614 | | | | 7,836,943 | |
3.500%, 06/01/2028 to 06/01/2052 | | | 7,174,287 | | | | 6,628,058 | |
3.000%, 04/01/2025 to 08/01/2052 | | | 6,437,511 | | | | 5,743,649 | |
2.500%, 05/01/2026 to 04/01/2052 | | | 15,816,999 | | | | 13,683,469 | |
2.000%, 04/01/2036 to 02/01/2052 | | | 18,929,362 | | | | 15,664,405 | |
1.500%, 10/01/2036 | | | 492,026 | | | | 426,043 | |
| | | | | | | | |
| | | |
| Description | | Face
Amount/Shares | | | Fair Value | |
GNMA | | | | | | | | |
5.000%,03/20/2050 | | $ | 133,153 | | | $ | 132,954 | |
4.500%,02/20/2050 | | | 377,977 | | | | 369,240 | |
4.000%, 10/20/2050 to 01/20/2051 | | | 146,944 | | | | 140,312 | |
3.500%,12/20/2050 | | | 1,808,758 | | | | 1,684,290 | |
3.000%,03/20/2050 | | | 2,232,404 | | | | 2,013,110 | |
2.500%,08/20/2051 | | | 1,265,321 | | | | 1,091,597 | |
| | | | | | | | |
| |
Total Mortgage-Backed Securities
(Cost $122,544,506) | | | | 109,864,157 | |
| | | | | | | | |
| |
SHORT-TERM INVESTMENT — 0.9% | | | | | |
Morgan Stanley Institutional Liquidity Fund, Government Portfolio, Institutional Class, 5.030% (A) | | | 965,966 | | | | 965,966 | |
| | | | | | | | |
| | |
Total Short-Term Investment
(Cost $965,966) | | | | | | | 965,966 | |
| | | | | | | | |
| | |
Total Investments - 99.8%
(Cost $123,510,472) | | | | | | $ | 110,830,123 | |
| | | | | | | | |
Percentages are based on Net Assets of $111,067,134.
| (A) | Rate shown represents the 7-day effective yield as of June 30, 2023. |
FHLMC — Federal Home Loan Mortgage Corporation
FNMA — Federal National Mortgage Association
GNMA — Government National Mortgage Association
| | | | | | | | |
The following is a summary of the inputs used as of June 30, 2023 in valuing the Fund’s investments carried at value: |
| | | | | | | | | | | | | | | | |
Investments in
Securities | | Level 1 | | | Level 2 | | | Level 3 | | | Total | |
| | | | |
Mortgage-Backed Securities | | $ | — | | | $ | 109,864,157 | | | $ | — | | | $ | 109,864,157 | |
Short-Term Investment | | | 965,966 | | | | — | | | | — | | | | 965,966 | |
| | | | |
Total Investments in Securities | | $ | 965,966 | | | $ | 109,864,157 | | | $ | — | | | $ | 110,830,123 | |
| | | | |
For more information on valuation inputs, see Note 2 in Notes to Financial Statements.
The accompanying notes are an integral part of the financial statements.
15
Impact Shares Trust I
Statements of Assets and Liabilities
June 30, 2023
| | | | | | | | |
| | | Impact Shares
YWCA
Women’s
Empowerment
ETF | | | Impact Shares
NAACP
Minority
Empowerment
ETF | |
Assets: | | | | | | | | |
Investments, at Cost | | $ | 37,071,514 | | | $ | 38,918,730 | |
| | | | | | | | |
Investments, at Fair Value | | $ | 40,581,536 | | | $ | 45,034,305 | |
Cash and Cash Equivalents | | | 2,386 | | | | 781 | |
Dividend and Interest Receivable | | | 27,019 | | | | 33,016 | |
Reclaims Receivable | | | 942 | | | | 659 | |
| | | | | | | | |
Total Assets | | | 40,611,883 | | | | 45,068,761 | |
| | | | | | | | |
| | |
Liabilities: | | | | | | | | |
Advisory Fees Payable | | | 24,291 | | | | 17,807 | |
| | | | | | | | |
Total Liabilities | | | 24,291 | | | | 17,807 | |
| | | | | | | | |
| | |
Net Assets | | $ | 40,587,592 | | | $ | 45,050,954 | |
| | | | | | | | |
| | |
Net Assets Consist of: | | | | | | | | |
Paid-in Capital | | $ | 38,615,015 | | | $ | 40,480,894 | |
Total Distributable Earnings | | | 1,972,577 | | | | 4,570,060 | |
| | | | | | | | |
| | |
Net Assets | | $ | 40,587,592 | | | $ | 45,050,954 | |
| | | | | | | | |
| | |
Outstanding Shares of Beneficial Interest (unlimited authorization — no par value) | | | 1,325,001 | | | | 1,425,000 | |
Net Asset Value, Offering and Redemption Price Per Share | | $ | 30.63 | | | $ | 31.61 | |
| | | | | | | | |
The accompanying notes are an integral part of the financial statements.
16
Impact Shares Trust I
Statements of Assets and Liabilities
June 30, 2023
| | | | |
| | | Impact Shares
Affordable
Housing MBS
ETF | |
Assets: | | | | |
Investments, at Cost | | $ | 123,510,472 | |
| | | | |
Investments, at Fair Value | | $ | 110,830,123 | |
Cash and Cash Equivalents | | | 349,996 | |
Dividend and Interest Receivable | | | 326,360 | |
| | | | |
Total Assets | | | 111,506,479 | |
| | | | |
| |
Liabilities: | | | | |
Payable for Investment Securities Purchased | | | 343,581 | |
Payable for Audit Fees | | | 30,000 | |
Payable for Custodian | | | 17,542 | |
Advisory Fees Payable | | | 10,633 | |
Payable for Miscellaneous Fees | | | 10,260 | |
Payable for Exchange Listing Fees | | | 10,000 | |
Payable due to Administrator | | | 7,314 | |
Payable for Trustees’ Fee | | | 662 | |
Other Accrued Expenses | | | 9,353 | |
| | | | |
Total Liabilities | | | 439,345 | |
| | | | |
| |
Net Assets | | $ | 111,067,134 | |
| | | | |
| |
Net Assets Consist of: | | | | |
Paid-in Capital | | $ | 126,469,312 | |
Total Distributable Loss | | | (15,402,178) | |
| | | | |
| |
Net Assets | | $ | 111,067,134 | |
| | | | |
Outstanding Shares of Beneficial Interest (unlimited authorization — no par value) | | | 6,500,000 | |
Net Asset Value, Offering and Redemption Price Per Share | | $ | 17.09 | |
| | | | |
The accompanying notes are an integral part of the financial statements.
17
Impact Shares Trust I
Statements of Operations
Year ended June 30, 2023
| | | | | | | | |
| | | Impact Shares
YWCA
Women’s
Empowerment
ETF | | | Impact Shares
NAACP
Minority
Empowerment
ETF | |
| | |
Investment Income: | | | | | | | | |
Dividend Income | | $ | 668,668 | | | $ | 727,033 | |
| | | | | | | | |
Total Investment Income | | | 668,668 | | | | 727,033 | |
| | | | | | | | |
| | |
Expenses: | | | | | | | | |
Advisory Fees | | | 254,613 | | | | 187,355 | |
| | | | | | | | |
| | |
Total Expenses | | | 254,613 | | | | 187,355 | |
| | | | | | | | |
Net Investment Income | | | 414,055 | | | | 539,678 | |
| | | | | | | | |
Net Realized Gain (Loss) on: | | | | | | | | |
Investments(1) | | | (1,160,321) | | | | (1,276,038) | |
| | | | | | | | |
Net Realized Gain (Loss) | | | (1,160,321) | | | | (1,276,038) | |
| | | | | | | | |
Net Change in Unrealized Appreciation (Depreciation) on: | | | | | | | | |
Investments | | | 6,996,026 | | | | 7,600,128 | |
| | | | | | | | |
Net Change in Unrealized Appreciation (Depreciation) | | | 6,996,026 | | | | 7,600,128 | |
| | | | | | | | |
Net Realized and Unrealized Gain (Loss) | | | 5,835,705 | | | | 6,324,090 | |
| | | | | | | | |
| | |
Net Increase in Net Assets Resulting from Operations | | $ | 6,249,760 | | | $ | 6,863,768 | |
| | | | | | | | |
(1) Includes realized gain (loss) as a result on in-kind redemptions. (See Note 4 in Notes to Financial Statements.)
The accompanying notes are an integral part of the financial statements.
18
Impact Shares Trust I
Statements of Operations
Year ended June 30, 2023
| | | | |
| | | Impact Shares
Affordable
Housing MBS
ETF | |
Investment Income: | | | | |
Dividend Income | | $ | 105,138 | |
Interest Income | | | 2,747,629 | |
| | | | |
Total Investment Income | | | 2,852,767 | |
| | | | |
| |
Expenses: | | | | |
Advisory Fees | | | 303,324 | |
Administration fees | | | 79,308 | |
Audit fees | | | 35,000 | |
Legal fees | | | 25,000 | |
Custodian Fees | | | 40,579 | |
Pricing fees | | | 14,464 | |
Printing Fees | | | 2,354 | |
Registration fees | | | 2,499 | |
Exchange Listing Fees | | | 9,500 | |
Other Fees | | | 3,589 | |
| | | | |
| |
Total Expenses | | | 515,617 | |
| | | | |
| |
Less: | | | | |
Advisory Waiver | | | (212,229) | |
| | | | |
Net Expenses | | | 303,388 | |
| | | | |
Net Investment Income | | | 2,549,379 | |
| | | | |
| |
Net Realized Gain (Loss) on: | | | | |
Investments | | | (655,922) | |
| | | | |
Net Realized Gain (Loss) | | | (655,922) | |
| | | | |
| |
Net Change in Unrealized Appreciation (Depreciation) on: | | | | |
Investments | | | (3,257,788) | |
| | | | |
| |
Net Change in Unrealized Appreciation (Depreciation) | | | (3,257,788) | |
| | | | |
| |
Net Realized and Unrealized Gain (Loss) | | | (3,913,710) | |
| | | | |
Net Decrease in Net Assets Resulting from Operations | | $ | (1,364,331) | |
| | | | |
The accompanying notes are an integral part of the financial statements.
19
Impact Shares Trust I
Statements of Changes in Net Assets
| | | | | | | | |
| | | Impact Shares YWCA Women’s
Empowerment ETF | |
| | | Year ended
June 30, 2023 | | | Year ended
June 30, 2022 | |
Operations: | | | | | | | | |
Net Investment Income | | $ | 414,055 | | | $ | 279,485 | |
Net Realized Gain (Loss) | | | (1,160,321) | | | | 3,201,122 | |
Net Change in Unrealized Appreciation (Depreciation) | | | 6,996,026 | | | | (7,917,685) | |
| | | | | | | | |
| | |
Net Increase (Decrease) in Net Assets Resulting from Operations | | | 6,249,760 | | | | (4,437,078) | |
| | | | | | | | |
| | |
Distributions | | | (2,789,774) | | | | (1,236,425) | |
| | | | | | | | |
Capital Share Transactions: | | | | | | | | |
Issued | | | 7,770,799 | | | | 9,454,889 | |
Redeemed | | | (711,911) | | | | (3,274,454) | |
| | | | | | | | |
| | |
Increase in Net Assets from Capital Share Transactions | | | 7,058,888 | | | | 6,180,435 | |
| | | | | | | | |
| | |
Total Increase in Net Assets | | | 10,518,874 | | | | 506,932 | |
| | | | | | | | |
Net Assets: | | | | | | | | |
Beginning of Year | | | 30,068,718 | | | | 29,561,786 | |
| | | | | | | | |
End of Year | | $ | 40,587,592 | | | $ | 30,068,718 | |
| | | | | | | | |
Share Transactions: | | | | | | | | |
Issued | | | 275,000 | | | | 275,000 | |
Redeemed | | | (25,000) | | | | (100,000) | |
| | | | | | | | |
Net Increase in Shares Outstanding from Share Transactions | | | 250,000 | | | | 175,000 | |
| | | | | | | | |
The accompanying notes are an integral part of the financial statements.
20
Impact Shares Trust I
Statements of Changes in Net Assets
| | | | | | | | |
| | | Impact Shares NAACP Minority
Empowerment ETF | |
| | | Year ended
June 30, 2023 | | | Year ended
June 30, 2022 | |
Operations: | | | | | | | | |
Net Investment Income | | $ | 539,678 | | | $ | 371,757 | |
Net Realized Gain (Loss) | | | (1,276,038) | | | | 1,015,412 | |
Net Change in Unrealized Appreciation (Depreciation) | | | 7,600,128 | | | | (6,871,089) | |
| | | | | | | | |
| | |
Net Increase (Decrease) in Net Assets Resulting from Operations | | | 6,863,768 | | | | (5,483,920) | |
| | | | | | | | |
| | |
Distributions | | | (1,399,198) | | | | (1,258,151) | |
| | | | | | | | |
Capital Share Transactions: | | | | | | | | |
Issued | | | 4,349,942 | | | | 10,960,006 | |
Redeemed | | | – | | | | (856,098) | |
| | | | | | | | |
| | |
Increase in Net Assets from Capital Share Transactions | | | 4,349,942 | | | | 10,103,908 | |
| | | | | | | | |
| | |
Total Increase in Net Assets | | | 9,814,512 | | | | 3,361,837 | |
| | | | | | | | |
Net Assets: | | | | | | | | |
Beginning of Year | | | 35,236,442 | | | | 31,874,605 | |
| | | | | | | | |
End of Year | | $ | 45,050,954 | | | $ | 35,236,442 | |
| | | | | | | | |
Share Transactions: | | | | | | | | |
Issued | | | 150,000 | | | | 325,000 | |
Redeemed | | | – | | | | (25,000) | |
| | | | | | | | |
Net Increase in Shares Outstanding from Share Transactions | | | 150,000 | | | | 300,000 | |
| | | | | | | | |
Amounts designated as “-” are $0.
The accompanying notes are an integral part of the financial statements.
21
Impact Shares Trust I
Statements of Changes in Net Assets
| | | | | | | | |
| | | Impact Shares Affordable
Housing MBS ETF | |
| | | Year ended
June 30, 2023 | | | Period Ended
June 30, 2022(1) | |
Operations: | | | | | | | | |
Net Investment Income | | $ | 2,549,379 | | | $ | 718,198 | |
Net Realized Gain (Loss) | | | (655,922) | | | | (687,053) | |
Net Change in Unrealized Appreciation (Depreciation) | | | (3,257,788) | | | | (9,422,561) | |
| | | | | | | | |
| | |
Net Decrease in Net Assets Resulting from Operations | | | (1,364,331) | | | | (9,391,416) | |
| | | | | | | | |
| | |
Distributions | | | (2,915,245) | | | | (1,732,032) | |
| | | | | | | | |
Capital Share Transactions: | | | | | | | | |
Issued | | | 26,909,850 | | | | 107,781,233 | |
Redeemed | | | (3,375,453) | | | | (4,845,472) | |
| | | | | | | | |
| | |
Increase in Net Assets from Capital Share Transactions | | | 23,534,397 | | | | 102,935,761 | |
| | | | | | | | |
| | |
Total Increase in Net Assets | | | 19,254,821 | | | | 91,812,313 | |
| | | | | | | | |
Net Assets: | | | | | | | | |
Beginning of Year/Period | | | 91,812,313 | | | | — | |
| | | | | | | | |
End of Year/Period | | $ | 111,067,134 | | | $ | 91,812,313 | |
| | | | | | | | |
Share Transactions: | | | | | | | | |
Issued | | | 1,550,000 | | | | 5,400,000 | |
Redeemed | | | (200,000) | | | | (250,000) | |
| | | | | | | | |
Net Increase in Shares Outstanding from Share Transactions | | | 1,350,000 | | | | 5,150,000 | |
| | | | | | | | |
(1) Commenced operations on July 26, 2021.
Amount designated as “-” is $0.
The accompanying notes are an integral part of the financial statements.
22
Impact Shares Trust I
Financial Highlights
Selected Per Share Data & Ratios
For the year/period ended June 30,
For a Share Outstanding Throughout the Year/Period
| | | | | | | | | | | | | | | | | | | | | | | | | | | | | | | | | | | | | | | | | | | | | | | | | | | | | | | | | | | | |
| | | Net Asset
Value,
Beginning of
Period ($) | | | Net
Investment
Income ($)* | | | Net Realized
and Unrealized
Gain (Loss) on
Investments
($) | | | Total from
Operations ($) | | | Distributions
from Net
Investment
Income ($) | | | Distributions
from Net
Realized
Capital
Gains ($) | | | Return of
Capital ($) | | | Total
Distributions
($) | | | Net Asset
Value, End
of Period ($) | | | Market
Price, End
of Period
($)
(Unaudited) | | | Total
Return(%)(1) | | | Net
Assets
End of
Period ($)
(000) | | | Ratio of
Expenses to
Average Net
Assets (%) | | | Ratio of Net
Investment
Income to
Average Net
Assets (%) | | | Portfolio
Turnover
(%)(2) | |
Impact Shares YWCA Women’s Empowerment ETF | |
2023 | | | 27.97 | | | | 0.35 | | | | 4.63 | | | | 4.98 | | | | (0.34 | ) | | | (1.98 | ) | | | — | | | | (2.32 | ) | | | 30.63 | | | | 30.67 | | | | 19.16 | | | | 40,588 | | | | 0.75 | | | | 1.22 | | | | 17 | |
2022 | | | 32.85 | | | | 0.27 | | | | (3.99 | ) | | | (3.72 | ) | | | (0.27 | ) | | | (0.89 | ) | | | — | | | | (1.16 | ) | | | 27.97 | | | | 27.92 | | | | (11.98 | ) | | | 30,069 | | | | 0.75 | | | | 0.83 | | | | 36 | |
2021 | | | 22.81 | | | | 0.21 | | | | 11.59 | | | | 11.80 | | | | (0.47 | ) | | | (1.29 | ) | | | — | | | | (1.76 | ) | | | 32.85 | | | | 32.88 | | | | 52.85 | | | | 29,562 | | | | 0.75 | (3) | | | 0.73 | | | | 39 | |
2020 | | | 20.63 | | | | 0.28 | | | | 2.16 | | | | 2.44 | | | | (0.26 | ) | | | — | | | | — | | | | (0.26 | ) | | | 22.81 | | | | 22.77 | | | | 11.92 | | | | 7,414 | | | | 0.75 | (4) | | | 1.30 | | | | 47 | |
2019(5) | | | 20.00 | | | | 0.27 | | | | 0.63 | | | | 0.90 | | | | (0.25 | ) | | | (0.02 | ) | | | — | ^ | | | (0.27 | ) | | | 20.63 | | | | 20.62 | | | | 4.71 | | | | 4,126 | | | | 0.76 | (6)(7) | | | 1.60 | (7) | | | 7 | |
Impact Shares NAACP Minority Empowerment ETF | |
2023 | | | 27.64 | | | | 0.40 | | | | 4.63 | | | | 5.03 | | | | (0.40 | ) | | | (0.66 | ) | | | — | | | | (1.06 | ) | | | 31.61 | | | | 31.65 | | | | 18.90 | | | | 45,051 | | | | 0.49 | | | | 1.41 | | | | 9 | |
2022 | | | 32.69 | | | | 0.33 | | | | (4.25 | ) | | | (3.92 | ) | | | (0.32 | ) | | | (0.81 | ) | | | — | | | | (1.13 | ) | | | 27.64 | | | | 27.70 | | | | (12.70 | ) | | | 35,236 | | | | 0.49 | | | | 1.00 | | | | 35 | |
2021 | | | 23.17 | | | | 0.30 | | | | 9.68 | | | | 9.98 | | | | (0.35 | ) | | | (0.11 | ) | | | — | | | | (0.46 | ) | | | 32.69 | | | | 32.76 | | | | 43.35 | | | | 31,875 | | | | 0.50 | (8) | | | 1.03 | | | | 49 | |
2020 | | | 21.16 | | | | 0.28 | | | | 1.97 | | | | 2.25 | | | | (0.24 | ) | | | — | | | | — | | | | (0.24 | ) | | | 23.17 | | | | 23.23 | | | | 10.71 | | | | 5,792 | | | | 0.75 | (4) | | | 1.27 | | | | 25 | |
2019(9) | | | 20.00 | | | | 0.28 | | | | 1.17 | | | | 1.45 | | | | (0.28 | ) | | | (0.01 | ) | | | — | | | | (0.29 | ) | | | 21.16 | | | | 21.11 | | | | 7.37 | | | | 2,222 | | | | 0.75 | (7)(10) | | | 1.46 | (7) | | | 19 | |
| Amounts | designated as “-” are $0. |
| * | Per share data calculated using average shares method. |
| ^ | Amount is less than 0.005. |
| (1) | Total return is based on the change in net asset value of a share during the year or period and assumes reinvestment of dividends and distributions at net asset value. Total return is for the period indicated and periods of less than one year have not been annualized. The return shown does not reflect the deduction of taxes that a shareholder would pay on Fund distributions or the redemption of Fund shares. |
| (2) | Portfolio turnover rate is for the period indicated and has not been annualized. Excludes effect of in-kind transfers. |
| (3) | The ratio of Expenses to Average Net Assets includes the voluntary expense reimbursements. If these reimbursements were excluded, the ratio would have been 0.86% for the year ended June 30, 2021. |
| (4) | The ratio of Expenses to Average Net Assets includes the voluntary expense reimbursements. If these reimbursements were excluded, the ratio would have been 1.11% for the year ended June 30, 2020. |
| (5) | Commenced operations on August 24, 2018. |
| (6) | The ratio of Expenses to Average Net Assets includes the voluntary expense reimbursements. If these reimbursements were excluded, the ratio would have been 2.24% for the period ended June 30, 2019. |
| (8) | The ratio of Expenses to Average Net Assets includes the voluntary expense reimbursements. If these reimbursements were excluded, the ratio would have been 0.61% for the year ended June 30, 2021. |
| (9) | Commenced operations on July 18, 2018. |
| (10) | The ratio of Expenses to Average Net Assets includes the voluntary expense reimbursements. If these reimbursements were excluded, the ratio would have been 1.66% for the period ended June 30, 2019. |
The accompanying notes are an integral part of the financial statements.
23
Impact Shares Trust I
Financial Highlights
Selected Per Share Data & Ratios
For the year/period ended June 30,
For a Share Outstanding Throughout the Year/Period
| | | | | | | | | | | | | | | | | | | | | | | | | | | | | | | | | | | | | | | | | | | | | | | | | | | | | | | | |
| | | Net Asset
Value,
Beginning of
Period ($) | | | Net
Investment
Income ($)* | | | Net Realized
and Unrealized
Loss on
Investments ($) | | | Total from
Operations
($) | | | Distributions
from Net
Investment
Income ($) | | | Distributions
from Net
Realized
Capital
Gains ($) | | | Total
Distributions
($) | | | Net Asset
Value, End
of Period ($) | | | Market
Price, End
of Period
($)
(Unaudited) | | | Total
Return(%)(1) | | | Net
Assets
End of
Period ($)
(000) | | | Ratio of
Expenses to
Average Net
Assets (%) | | | Ratio of Net
Investment
Income to
Average Net
Assets (%) | | | Portfolio
Turnover
(%)(2) | |
Impact Shares Affordable Housing MBS ETF | |
2023 | | | 17.83 | | | | 0.44 | | | | (0.69 | ) | | | (0.25 | ) | | | (0.49 | ) | | | — | | | | (0.49 | ) | | | 17.09 | | | | 17.10 | | | | (1.38 | ) | | | 111,067 | | | | 0.30 | (3) | | | 2.52 | | | | 26 | |
2022(4) | | | 20.00 | | | | 0.14 | | | | (1.97 | ) | | | (1.83 | ) | | | (0.34 | ) | | | — | | | | (0.34 | ) | | | 17.83 | | | | 17.88 | | | | (9.22 | ) | | | 91,812 | | | | 0.30 | (5)(6) | | | 0.81 | (5) | | | 78 | |
Amounts designated as “-” are $0.
| * | Per share data calculated using average shares method. |
| (1) | Total return is based on the change in net asset value of a share during the year or period and assumes reinvestment of dividends and distributions at net asset value. Total return is for the period indicated and periods of less than one year have not been annualized. The return shown does not reflect the deduction of taxes that a shareholder would pay on Fund distributions or the redemption of Fund shares. |
| (2) | Portfolio turnover rate is for the period indicated and has not been annualized. Excludes effect of in-kind transfers. |
| (3) | The ratio of Expenses to Average Net Assets excluding waivers is 0.51% for the period ended June 30, 2023. |
| (4) | Commenced operations on July 26, 2021. |
| (6) | The ratio of Expense to Average Net Assets excluding waivers is 0.53% for the period ended June 30, 2022. |
The accompanying notes are an integral part of the financial statements.
24
Impact Shares Trust I
Notes to Financial Statements
June 30, 2023
1. ORGANIZATION
Impact Shares Trust I (the “Trust”), is an open-end management investment company organized as a Delaware statutory trust pursuant to a Declaration of Trust dated May 19, 2016. The Trust is registered with the Securities and Exchange Commission (the “Commission”) under the Investment Company Act of 1940 (the “1940 Act”), as amended, as an open-end management investment company with three separate exchange-traded funds or series. The financial statements herein and the related notes are those of Impact Shares YWCA Women’s Empowerment ETF (the “Women’s ETF”), Impact Shares NAACP Minority Empowerment ETF (the “Minority ETF”), and the Impact Shares Affordable Housing MBS ETF (the “Affordable Housing ETF”) (each a “Fund” and collectively, the “Funds”). The Women’s ETF and Minority ETF each seek to provide investment results that, before fees and expenses, track the total return performance of the Morningstar Women’s Empowerment Index and the Morningstar Minority Empowerment Index (the “Underlying Indices” or “Index”), respectively. The primary investment objective of the Affordable Housing ETF is to generate current income. The Funds are classified as “non-diversified” funds under the 1940 Act. Impact Shares, Corp. (the “Adviser”) serves as the investment adviser for the Funds and is subject to the supervision of the Board of Trustees (the “Board”). The Adviser is responsible for managing the investment activities of the Funds, the Funds’ business affairs and other administrative matters. The Adviser is a nonprofit corporation organized under the laws of Texas and is tax exempt under Section 501(c)(3) of the Internal Revenue Code.
The Women’s ETF commenced operations on August 24, 2018.
The Minority ETF commenced operations on July 18, 2018.
The Affordable Housing ETF commenced operations on July 26, 2021.
Shares of the Funds (“Shares”) are listed and traded on NYSE Arca, Inc. Market prices for the Shares may be different from their net asset value (“NAV”). The Funds will issue and redeem Shares on a continuous basis at NAV only in large blocks of Shares, each of which currently comprises 50,000 shares (“Creation Units”) or such other amount as may be from time to time determined to be in the best interests of a Fund by the President of the Fund (The President of the Funds has determined that it is in the best interests of the Women’s ETF and Minority ETF, that the size of a creation unit in each of these Funds remain at 25,000 shares indefinitely). Creation Units will be issued and redeemed principally in-kind for securities included in the Funds’ underlying indices (the “Underlying Indices” or “Index”) and/or for cash at the discretion of the Funds. Once created, Shares will trade in a secondary market at market prices that change throughout the day in amounts less than a Creation Unit.
On June 12, 2023, the Board approved, subject to shareholder approval, the appointment of Toroso Investments, LLC as the investment adviser to each of the Women’s ETF and the Minority ETF pursuant to a new investment advisory agreement (the “Toroso Advisory Agreement”). The Board has also approved, subject to shareholder approval, an amendment to Impact Shares, Corp.’s existing advisory agreement (the “ISC Advisory Amendment”). A proxy statement discussing the Board’s decision to approve the Toroso Advisory Agreement and the ISC Advisory Amendment, and the Board’s recommendation that shareholders of each of the Women’s ETF and the Minority ETF vote to approve the Toroso Advisory Agreement and the ISC Advisory Amendment was mailed to shareholders of the ETFs. The shareholder meeting to consider the proposals was scheduled for August 24, 2023 and has been adjourned to August 31, 2023.
On June 12, 2023, the Board also approved, subject to shareholder approval, an Agreement and Plan of Reorganization (the “Plan”) to reorganize the Affordable Housing ETF into a corresponding ETF with the
25
Impact Shares Trust I
Notes to Financial Statements
June 30, 2023
name CCM Affordable Housing MBS ETF, which is a newly-created series of Quaker Investment Trust. A proxy statement/ prospectus discussing the Board’s decision to approve the Plan was mailed to shareholders of the Affordable Housing ETF. The shareholder meeting to consider the reorganization is scheduled for September 15, 2023.
2. SIGNIFICANT ACCOUNTING POLICIES
The following is a summary of the significant accounting policies followed by the Funds:
Use of Estimates — The Funds are registered investment companies and follow the accounting reporting guidance under Accounting Standards Codification in Topic 946, Financial Services - Investment Companies by the Financial Accounting Standards Board. The preparation of financial statements in conformity with U.S. generally accepted accounting principles (“U.S. GAAP”) requires management to make estimates and assumptions that affect the reported amounts of assets and liabilities and disclosure of contingent assets and liabilities at the date of the financial statements and the reported amounts of increases and decreases in net assets from operations during the reporting period. Actual results could materially differ from those estimates.
Security Valuation — Equity securities including Real Estate Investment Trusts, listed on a securities exchange, market or automated quotation system for which quotations are readily available (except for securities traded on the NASDAQ Stock Market (the “NASDAQ”)), including securities traded over the counter, are valued at the last quoted sale price on the primary exchange or market (foreign or domestic) on which they are traded (or at approximately 4:00 pm Eastern Time if a security’s primary exchange is normally open at that time), or, if there is no such reported sale, at the most recent quoted bid. For securities traded on NASDAQ, the NASDAQ Official Closing Price will be used. If available, debt securities, including mortgage-backed obligations, are priced based upon valuations provided by independent, third-party pricing agents. The third-party pricing agents generally value debt securities at an evaluated bid price by employing methodologies that utilize actual market transactions, broker-supplied valuations, or other methodologies designed to identify the fair value for such securities. Such methodologies generally consider such factors as security prices, yields, maturities, call features, ratings and developments relating to specific securities in arriving at valuations. On the first day a new debt security purchase is recorded, if a price is not available on the automated pricing feeds from our primary and secondary pricing vendors nor is it available from an independent broker, the security may be valued at its purchase price. Each day thereafter, the debt security will be valued according to the Funds’ Fair Value Procedures until an independent source can be secured. Debt obligations with remaining maturities of sixty days or less may be valued at their amortized cost, if the Valuation Designee (discussed below) concludes it approximates fair value after taking into account factors such as credit, liquidity and interest rate conditions as well as issuer specific factors. Foreign securities listed on foreign exchanges are valued based on quotations from the primary market in which they are traded and are translated from the local currency into U.S. dollars using current exchange rates. Foreign securities may trade on weekends or other days when the Fund does not calculate NAV. As a result, the fair value of these investments may change on days when you cannot buy or redeem shares of the Fund. Prices for most securities held in the Funds are provided daily by recognized independent pricing agents. If a security price cannot be obtained from an independent, third-party pricing agent, the Funds seek to obtain a bid price from at least one independent broker. Portfolio securities for which market quotations are readily available are valued at their current market value. When market quotations are not readily available (or are deemed unreliable) for one or more portfolio securities, the 1940 Act requires the Funds to use the investment’s fair value, as determined in good faith. Effective
26
Impact Shares Trust I
Notes to Financial Statements
June 30, 2023
September 8, 2022, and pursuant to Rule 2a-5 under the 1940 Act, the Board has designated the Adviser as the valuation designee to perform fair value determinations, subject to Board oversight. Pursuant to the Valuation Designee’s fair value policies and procedures, securities for which market quotations are not readily available or for which the market price is determined to be unreliable, may include but are not limited to securities that are subject to legal or contractual restrictions on resale, securities for which no or limited trading activity has occurred for a period of time, or securities that are otherwise deemed to be illiquid (i.e., securities that cannot be disposed of within seven days at approximately the price at which the security is currently priced by the Fund which holds the security). Market quotations may also be not “readily available” if a significant event occurs after the close of the principal exchange on which a portfolio security trades (but before the time for calculation of such Fund’s NAV) if that event affects or is likely to affect (more than minimally) the NAV per share of such Fund. In determining the fair value price of a security, the Valuation Designee may use a number of other methodologies, including those based on discounted cash flows, multiples, recovery rates, yield to maturity or discounts to public comparables. The Valuation Designee may also employ independent pricing services. Fair value pricing involves judgments that are inherently subjective and inexact; as a result, there can be no assurance that fair value pricing will reflect actual market value, and it is possible that the fair value determined for a security will be materially different from the value that actually could be or is realized upon the sale of that asset. Valuing the Funds’ investments using fair value pricing will result in using prices for those investments that may differ from current market valuations. Use of fair value prices and certain current market valuations could result in a difference between the prices used to calculate each Fund’s NAV and the prices used by each applicable Underlying Index, which, in turn, could result in a difference between a Fund’s performance and the performance of its Underlying Index.
In accordance with the authoritative guidance on fair value measurements and disclosure under U.S. GAAP, the Funds disclose fair value of their investments in a hierarchy that prioritizes the inputs to valuation techniques used to measure the fair value. The objective of a fair value measurement is to determine the price that would be received to sell an asset or paid to transfer a liability in an orderly transaction between market participants at the measurement date (an exit price). Accordingly, the fair value hierarchy gives the highest priority to quoted prices (unadjusted) in active markets for identical assets or liabilities (Level 1) and the lowest priority to unobservable inputs (Level 3). The three levels of the fair value hierarchy are described below:
| | • | | Level 1 – Unadjusted quoted prices in active markets for identical, unrestricted assets or liabilities that the Funds have the ability to access at the measurement date; |
| | • | | Level 2 – Quoted prices which are not active, or inputs that are observable (either directly or indirectly) for substantially the full term of the asset or liability; and |
| | • | | Level 3 – Prices, inputs or exotic modeling techniques which are both significant to the fair value measurement and unobservable (supported by little or no market activity). |
The valuation techniques used by the Funds to measure fair value during the year ended June 30, 2023 maximized the use of observable inputs and minimized the use of unobservable inputs.
For the year ended June 30, 2023, there have been no significant changes to the Funds’ fair valuation methodologies.
For details of the investment classification, reference the Schedules of Investments.
Federal Income Taxes — It is each of the Funds’ intention to qualify as a regulated investment company for Federal income tax purposes by complying with the appropriate provisions of Subchapter M of the Internal Revenue Code of 1986 (the “Code”), as amended. Accordingly, no provisions for federal income taxes have been made in the financial statements.
27
Impact Shares Trust I
Notes to Financial Statements
June 30, 2023
The Funds evaluate tax positions taken or expected to be taken in the course of preparing the Funds’ tax returns to determine whether it is “more-likely-than not” (i.e., greater than 50-percent) that each tax position will be sustained upon examination by a taxing authority based on the technical merits of the position. Tax positions not deemed to meet the more-likely-than-not threshold are recorded as a tax benefit or expense in the current period. The Funds did not record any tax provision in the current period. However, management’s conclusions regarding tax positions taken may be subject to review and adjustment at a later date based on factors including, but not limited to, examination by tax authorities (i.e., the last 3 year ends, as applicable), on-going analysis of and changes to tax laws, regulations and interpretations thereof. As of and during the year ended June 30, 2023, the Funds did not have a liability for any unrecognized tax benefits. The Funds recognize interest and penalties, if any, related to unrecognized tax benefits as income tax expense in the Statements of Operations. For the year ended June 30, 2023, the Funds did not recognize any interest or penalties.
Security Transactions and Investment Income — Security transactions are accounted for on trade date. Costs used in determining realized gains and losses on the sale of investment securities are based on specific identification. Dividend income is recorded on the ex-dividend date. Interest income is recognized on the accrual basis. Withholding taxes and reclaims on foreign dividends have been provided for in accordance with the Funds’ understanding of the applicable country’s tax rules and rates. Discounts and premiums on securities purchased are accreted and amortized using the effective interest method. Realized gains (losses) on paydowns of mortgage-backed and asset backed securities are recorded as an adjustment to interest income.
Dividends and Distributions to Shareholders — The Funds intend to declare and pay dividends of net investment income quarterly and to pay any capital gain distributions on an annual basis. All distributions are recorded on ex-dividend date.
Cash and Cash Equivalents — Idle cash may be swept into various time deposits and is classified as cash and cash equivalents on the Statements of Assets and Liabilities. The Funds maintain cash in bank deposit accounts which, at times, may exceed United States federally insured limits (“FDIC”). Amounts swept overnight are available on the next business day.
Cash Overdraft Charges — Per the terms of an agreement with the Bank of New York Mellon, if a Fund has a cash overdraft on a given day, it will be assessed an overdraft charge. Cash overdraft charges are included in other fees on the Statements of Operations.
Creation Units — The Funds issue and redeem Shares at NAV and only in large blocks of Shares currently comprised of 25,000 shares for the Funds with the exception of the Affordable Housing ETF which is comprised of 50,000. Shares (each such block of Shares for the Funds are called a “Creation Unit” or multiples thereof). Purchasers of Creation Units at NAV must pay a standard creation transaction fee of $500 per transaction. The fee is a single charge and will be the same regardless of the number of Creation Units purchased by an investor on the same day. An Authorized Participant who holds Creation Units (“Authorized Participants”) and wishes to redeem at NAV would also pay a standard redemption transaction fee of $500 per transaction to the custodian on the date of such redemption, regardless of the number of Creation Units redeemed that day. Creations and redemptions are also subject to an additional variable charge of up to 1% of the net asset value per Creation Unit, inclusive of the standard transaction fee, for (i) in-kind creations or redemptions effected outside the normal Clearing Process, (ii) in whole or partial cash creations, (iii) in whole or partial cash redemptions or (iv) non-standard orders. The variable component is primarily designed to cover non-standard charges, e.g., brokerage, taxes, foreign exchange, execution, market impact and other costs and expenses related to the execution of
28
Impact Shares Trust I
Notes to Financial Statements
June 30, 2023
trades resulting from such transaction. In all cases, the Transaction Fee will be limited in accordance with the requirements of the SEC applicable to management investment companies offering redeemable securities. The Fund may determine not to charge the variable portion of a Transaction Fee on certain orders when the Adviser has determined that doing so is in the best interests of Fund shareholders, e.g., for redemption orders that facilitate the rebalance of the Fund’s portfolio in a more tax efficient manner than could be achieved without such order. The variable portion of a Transaction Fee may be higher or lower than the trading expenses incurred by a Fund with respect to the transaction.
Except when aggregated in Creation Units, Shares are not redeemable securities of the Funds. Shares of the Funds may only be purchased or redeemed by certain financial institutions (“Authorized Participants”). An Authorized Participant is either (i) a broker-dealer or other participant in the clearing process through the Continuous Net Settlement System of the National Securities Clearing Corporation or (ii) a Depository Trust Company (“DTC”) participant and, in each case, must have executed an Authorized Participant Agreement with the Funds’ distributor. Most retail investors will not qualify as Authorized Participants or have the resources to buy and sell whole Creation Units. Therefore, they will be unable to purchase or redeem the Shares directly from the Funds. Rather, most retail investors will purchase Shares in the secondary market with the assistance of a broker and will be subject to customary brokerage commissions or fees.
The size of a creation unit for a Fund may be changed from time to time in the future if determined to be in the best interests of a Fund by the President of the Fund.
If a Creation Unit is purchased or redeemed in cash, a higher transaction fee will be charged. The following table discloses the Creation Unit breakdown based on the NAV as of June 30, 2023:
| | | | | | | | | | | | | | | | |
| | | Creation Unit
Shares | | | Creation
Transaction Fee | | | Value | | | Redemption
Transaction Fee | |
Women’s ETF | | | 25,000 | | | $ | 500 | | | $ | 765,750 | | | $ | 500 | |
Minority ETF | | | 25,000 | | | | 500 | | | | 790,250 | | | | 500 | |
Affordable Housing ETF | | | 50,000 | | | | 500 | | | | 854,500 | | | | 500 | |
Foreign Currency Translation — The books and records of the Funds are maintained in U.S. dollars. Investment securities and other asset and liabilities denominated in a foreign currency are translated into U.S. dollars on the date of valuation. Purchases and sales of investment securities, income and expenses are translated into U.S. dollars at the relevant rates of exchange prevailing on the respective dates of such transactions. The Funds do not isolate that portion of realized or unrealized gains and losses resulting from changes in the foreign exchange rate from fluctuations arising from changes in the market prices of the securities. These gains and losses are included in net realized and unrealized gains and losses on investments on the Statements of Operations. Net realized and unrealized gains and losses on foreign currency transactions represent net foreign exchange gains or losses from foreign currency exchange contracts, disposition of foreign currencies, currency gains or losses realized between trade and settle dates on securities transactions and the difference between the amount of the investment income and foreign withholding taxes recorded on the Funds’ books and the U.S. dollar equivalent amounts actually received or paid.
Indemnifications — In the normal course of business, the Funds enter into contracts that provide general indemnifications. The Funds’ maximum exposure under these arrangements is dependent on future claims that may be made against the Funds and, therefore, cannot be established; however, based on experience, the risk of loss from such claims is considered remote.
29
Impact Shares Trust I
Notes to Financial Statements
June 30, 2023
3. AGREEMENTS
Investment Advisory Agreement
The Adviser serves as investment adviser to the Funds, pursuant to an investment advisory agreement (“Advisory Agreement”). The Adviser arranges for transfer agency, custody, fund administration and accounting, and other non-distribution related services necessary for the Funds to operate. The Adviser administers the Funds’ business affairs, provides office facilities and equipment and certain clerical, bookkeeping and administrative services, and provides its officers and employees to serve as officers or Trustees of the Trust.
The Adviser has entered into two separate agreements with the series of the Trust. For the services it provides to the Women’s ETF and the Minority ETF, the Adviser receives a fee, which is calculated daily and paid monthly, at an annual rate of 0.75% of average daily net assets of the Women’s ETF and 0.49% of average daily net assets with respect to Minority ETF. Under the Advisory Agreement, the Adviser is responsible for substantially all expenses of the Women’s ETF and Minority ETF including the cost of transfer agency, custody, fund administration, legal, audit and other services, except for: (i) distribution and service fees payable pursuant to a Rule 12b-1 plan, if any; (ii) taxes and governmental fees, if any, levied against a Fund; (iii) brokerage fees and commissions, and other portfolio transaction expenses incurred by or for a Fund; (iv) expenses of a Fund’s securities lending (if any), including any securities lending agent fees, as governed by a separate securities lending agreement; costs, including interest expenses, of borrowing money or engaging in other types of leverage financing; (v) extraordinary expenses, including extraordinary legal expenses, as may arise, including, without limitation, expenses incurred in connection with litigation, proceedings, other claims, contractual arrangements with Partner Charities and the legal obligations of a Fund to indemnify its Trustees, officers, employees, shareholders, distributors, and agents with respect thereto; and (vi) expenses of a Fund which are capitalized in accordance with generally accepted accounting principles (the “Excluded Expenses”).
Certain officers or interested trustees of the Trust are also officers or employees of the Adviser or its affiliates. They receive no fees for serving as officers of the Trust.
For the services it provides to the Affordable Housing ETF, the Fund pays the Adviser an annual fee, payable monthly, at the rate of 0.30% of the Fund’s Average Daily Managed Assets. Under the Investment Advisory Agreement, the Adviser, among other things: (i) continuously furnishes an investment program for the Fund; (ii) determines the investments to be purchased, held, sold or exchanged by the Fund and the portion, if any, of the assets of the Fund to be held uninvested; (iii) makes changes in the investments of the Fund; (iv) monitors the Fund’s performance and considers ways to improve the performance of the Fund and (v) votes, exercises consents and exercises all other rights pertaining to such securities on behalf of the Fund. The Affordable Housing ETF bears all remaining expenses. The Adviser has voluntarily agreed to waive all advisory fees payable by Affordable Housing ETF in excess of 0.25% of the average daily net assets of Affordable Housing ETF until Affordable Housing ETF’s net assets are greater than $100 million. During the fiscal year, the Adviser voluntarily waived $212,229 of advisory fees payable by Affordable Housing ETF; a portion of which was reimbursed to the Adviser from the the sub-advisor under it’s expense limitation agreement with Affordable Housing ETF, as disclosed below under Sub-Advisory Agreement. These waived fees are not recoupable by the Adviser or the sub-advisor in future periods.
Additionally, the Investment Advisory Agreements remain in force for an initial two-year period and from year to year thereafter, subject to annual approval by (a) the Board or (b) a “vote of a majority of the
30
Impact Shares Trust I
Notes to Financial Statements
June 30, 2023
outstanding voting securities” (as defined in the 1940 Act) of the Fund; provided that in either event continuance is also approved by a majority of the Independent Trustees, by a vote cast in person at a meeting called for the purpose of voting such approval. Each Investment Advisory Agreement may be terminated at any time, without payment of any penalty, by vote of the Trust’s Board, or by a “vote of a majority of the outstanding voting securities” (as defined in the 1940 Act) of the Fund, or by the Adviser, in each case on not more than 60 days’ nor less than 30 days’ prior written notice to the other party. Each Investment Advisory Agreement will automatically terminate in the event of its “assignment,” as defined by the 1940 Act and the rules thereunder, or upon the termination of the relevant Investment Advisory Agreement.
Sub-Advisory Agreement
The Adviser has entered into a Sub-advisory Agreement with Community Capital Management, Inc. (“CCM”) (the “Sub-Advisory Agreement”). Under the terms of the Sub-Advisory Agreement, CCM acts as Sub-Adviser to the Affordable Housing ETF. In such capacity, CCM, subject to the supervision of the Adviser and the Board, regularly shall provide the Fund with portfolio management, investment research, advice, and supervision and shall furnish continuously an investment program, consistent with the investment objective and policies of the Fund. The Sub-Adviser shall determine, from time to time, what securities shall be purchased for the Fund, what securities shall be held or sold by the Fund, and what portion of the Fund’s assets shall be held uninvested in cash, subject always to the investment objective, policies, and restrictions of the Fund, as each of the same from time to time shall be in effect. To carry out these obligations, the Sub-Adviser can exercise full discretion and act for the Adviser in the same manner and with the same force and effect as the Adviser itself might or could do with respect to purchases, sales, or other transactions.
The Adviser pays the Sub-Adviser, as compensation for the Sub-Adviser’s services, a fee equal to 0.25% of the Fund’s Average Daily Managed Assets. The Fund has no responsibility for any fee payable to the Sub-Adviser. The Sub-Adviser has agreed to assume the Fund’s organization and offering costs. The Fund does not have an obligation to reimburse the Sub-Adviser for organization and offering costs paid on its behalf. CCM has contractually agreed to limit the total annual operating expenses (exclusive of fees paid by the Fund pursuant to its distribution plan under Rule 12b-1 under the Investment Company Act of 1940, as amended, taxes, brokerage commissions and other transaction costs, interest payments, acquired fund fees and expenses, extraordinary expenses and dividend expenses on short sales) of the Fund to 0.30% through October 31, 2023. This contract may not be terminated without the action or consent of the Fund’s Board of Trustees.
The Fund is a party to contractual arrangements with various parties, including, among others, the Fund’s investment adviser, administrator, distributor, and shareholder servicing agent, who provide services to the Fund. Shareholders are not parties to, or intended (“third-party”) beneficiaries of, any such contractual arrangements, and such contractual arrangements are not intended to create in any individual shareholder or group of shareholders any right to enforce them against the service providers or to seek any remedy under them against the service providers, either directly or on behalf of the Fund.
Distribution Agreement
SEI Investments Distribution Co. (the “Distributor”) serves as the Funds’ underwriter and distributor of Shares pursuant to a Distribution Agreement. Under the Distribution Agreement, the Distributor, as agent, receives orders to purchase shares in Creation Units and transmits such orders to the Funds’ custodian and transfer agent. The Distributor has no obligation to sell any specific quantity of Fund shares. The Distributor bears the following costs and expenses relating to the distribution of shares:
31
Impact Shares Trust I
Notes to Financial Statements
June 30, 2023
(i) the expenses of maintaining its registration or qualification as a dealer or broker under federal or state laws; (ii) filing fees; and (iii) all other expenses incurred in connection with the distribution services, that are not reimbursed by the Adviser, as contemplated in the Distribution Agreement. The Distributor does not maintain any secondary market in Fund Shares.
The Funds have adopted a Distribution and Service Plan (the “Plan”) pursuant to Rule 12b-1 under the 1940 Act. In accordance with the Plan, the Funds are authorized to pay an amount up to 0.25% of their average net assets each year for certain distribution-related activities. For the year ended June 30, 2023, no fees were charged by the Distributor under the Plan. No payments have yet been authorized by the Board, nor are any such expected to be made by a Fund under the Plan during the current fiscal year.
Administrator, Custodian and Transfer Agent
SEI Investments Global Funds Services (the “Administrator”) serves as the Funds’ Administrator pursuant to an Administration Agreement. The Bank of New York Mellon (the “Custodian” and “Transfer Agent”) serves as the Funds’ Custodian and Transfer Agent pursuant to a Custodian Agreement and Transfer Agency Services Agreement. The Adviser of the Funds pays these fees for Women’s ETF and Minority ETF.
Certain officers of the Trust may also be officers of the Administrator or its affiliates. They receive no fees for serving as officers of the Trust.
4. INVESTMENT TRANSACTIONS
For the year ended June 30, 2023, the purchases and sales of investments in securities, excluding in-kind transactions and short-term securities were:
| | | | | | | | | | | | | | | | |
| | | Purchases | | | Purchases -
U.S. Govt. | | | Sales | | | Sales -
U.S. Govt. | |
Women’s | | $ | 5,786,659 | | | $ | - | | | $ | 8,361,214 | | | $ | - | |
Minority | | | 3,330,752 | | | | - | | | | 6,445,523 | | | | - | |
Affordable Housing | | | - | | | | 55,009,993 | | | | - | | | | 25,460,300 | |
For the year ended June 30, 2023, in-kind transactions associated with creations and redemptions were:
| | | | | | | | | | | | |
| | | Purchases | | | Sales and
Maturities | | | Realized
Gain/(Loss) | |
Women’s | | $ | 7,821,931 | | | $ | 713,377 | | | $ | 205,504 | |
Minority ETF | | | 4,333,425 | | | | - | | | | - | |
Affordable Housing | | | - | | | | - | | | | - | |
For the year or period ended June 30, 2022, in-kind transactions associated with creations and redemptions were:
| | | | | | | | | | | | |
| | | Purchases | | | Sales and
Maturities | | | Realized
Gain/(Loss) | |
Women’s | | $ | 9,404,223 | | | $ | 3,252,055 | | | $ | 922,508 | |
Minority ETF | | | 10,892,585 | | | | 847,046 | | | | 325,365 | |
Affordable Housing | | | - | | | | - | | | | - | |
32
Impact Shares Trust I
Notes to Financial Statements
June 30, 2023
5. TAX INFORMATION
The amount and character of income and capital gain distributions to be paid, if any, are determined in accordance with Federal income tax regulations, which may differ from U.S. GAAP. As a result, net investment income (loss) and net realized gain (loss) on investment transactions for a reporting period may differ significantly from distributions during such period. These book/tax differences may be temporary or permanent. To the extent these differences are permanent in nature, they are charged or credited to distributable earnings or paid-in capital, as appropriate, in the period that the differences arise.
The following permanent differences are credited or charged to distributable earnings or Paid in Capital as of June 30, 2023 and are primarily related to in-kind redemption gain/loss and taxable over-distributions:
| | | | | | | | |
| | | Distributable
Earnings/
(Loss) | | | Paid-in
Capital | |
| | $ | (199,667 | ) | | $ | 199,667 | |
Minority | | | 960 | | | | (960 | ) |
Affordable Housing ETF | | | 846 | | | | (846 | ) |
These reclassification had no impact on net assets or net asset value per share.
The tax character of dividends and distributions paid during the last two fiscal years ending June 30, 2023 and June 30, 2022 were as follows:
| | | | | | | | | | | | |
| | | Ordinary
Income | | | Long-Term
Capital Gain | | | Total | |
Women’s | |
2023 | | $ | 1,326,246 | | | $ | 1,463,528 | | | $ | 2,789,774 | |
2022 | | | 787,659 | | | | 448,766 | | | | 1,236,425 | |
Minority | |
2023 | | $ | 938,455 | | | $ | 460,743 | | | $ | 1,399,198 | |
2022 | | | 1,026,449 | | | | 231,702 | | | | 1,258,151 | |
Affordable Housing | |
2023 | | $ | 2,915,245 | | | $ | - | | | $ | 2,915,245 | |
2022* | | | 1,732,032 | | | | - | | | | 1,732,032 | |
*The period covered is from July 26, 2021 to June 30, 2022.
As of June 30, 2023, the components of distributable earnings (accumulated losses) on a tax basis were as follows:
| | | | | | | | | | | | | | | | | | | | | | | | | | | | |
| | | Undistributed
Ordinary
Income | | | Undistributed
Long Term
Capital Gains | | | Capital Loss
Carryforwards | | | Post
October
Losses | | | Unrealized
Appreciation/
(Depreciation) | | | Other
Temporary
Differences | | | Total
Distributable
Earnings/(Loss) | |
Women’s | | $ | – | | | $ | – | | | $ | (740,969 | ) | | $ | – | | | $ | 2,713,548 | | | $ | (2 | ) | | $ | 1,972,577 | |
Minority | | | – | | | | – | | | | (1,241,961 | ) | | | – | | | | 5,812,021 | | | | – | | | | 4,570,060 | |
Affordable Housing | | | 15,415 | | | | – | | | | (2,722,488 | ) | | | – | | | | (12,695,103 | ) | | | (2 | ) | | | (15,402,178 | ) |
For Federal income tax purposes, capital losses incurred may be carried forward and applied against future capital gains.
33
Impact Shares Trust I
Notes to Financial Statements
June 30, 2023
Funds are permitted to carry forward capital losses for an unlimited period. Additionally, capital losses that are carried forward will retain their character as either short-term or long-term capital. Capital loss carryforwards are as follows:
| | | | | | | | | | | | |
| | | Short-Term
Loss | | | Long-Term
Loss | | | Total | |
Women’s ETF | | $ | 369,005 | | | $ | 371,964 | | | $ | 740,969 | |
Minority ETF | | | 742,487 | | | | 499,474 | | | | 1,241,961 | |
Affordable Housing ETF | | | 2,106,357 | | | | 616,131 | | | | 2,722,488 | |
The Federal tax cost and aggregate gross unrealized appreciation and depreciation on investments and foreign currency transactions held by the Funds at June 30, 2023, were as follows:
| | | | | | | | | | | | | | | | |
| | | Federal Tax
Cost | | | Aggregate
Gross
Unrealized
Appreciation | | | Aggregate
Gross
Unrealized
Depreciation | | | Net
Unrealized
Appreciation/
(Depreciation) | |
Women’s | | $ | 37,867,988 | | | $ | 5,831,270 | | | $ | (3,117,722 | ) | | $ | 2,713,548 | |
Minority | | | 39,222,284 | | | | 8,044,630 | | | | (2,232,609 | ) | | | 5,812,021 | |
Affordable Housing | | | 123,525,226 | | | | 25,973 | | | | (12,721,076 | ) | | | (12,695,103 | ) |
The book/tax difference on cost is primarily related to wash sale adjustments.
6. RISKS OF INVESTING IN THE FUNDS
As with all exchange traded funds (“ETFs”), a shareholder of the Fund is subject to the risk that his or her investment could lose money. The Funds are subject to the principal risks noted below, any of which may adversely affect the Fund’s NAV, trading price, yield, total return and ability to meet its investment objective. A more complete description of principal risks is included in the prospectus under the heading “Principal Risks”.
Under normal circumstances, the Funds will invest at least 80% of their total assets in securities of the Index, which reflects the performance of an investable universe of publicly-traded companies that directly or indirectly provide services or support to ETFs, including but not limited to the management, servicing, trading or sale of ETFs (“ETF Activities”).
An investment in the Fund is not a bank deposit and is not insured or guaranteed by the FDIC or any other government agency. As with any investment company, there is no guarantee that the Fund will achieve its goal.
Active Investment Management Risk (Affordable Housing ETF only) - The Fund is actively managed. The Adviser’s judgments about the attractiveness, relative value, or potential appreciation of a particular sector, security or investment strategy.
Asset Class Risk (All Funds) - The securities in an Underlying Index or in a Fund’s portfolio may underperform the returns of other securities or indices that track other countries, regions, industries, groups of industries, markets, asset classes or sectors. Various types of securities or indices tend to experience cycles of outperformance and underperformance in comparison to general securities markets.
Call Risk (Affordable Housing ETF only) - Some debt securities may be redeemed, or “called,” at the option of the issuer before their stated maturity date. In general, an issuer will call its debt securities if they can be refinanced by issuing new debt securities which bear a lower interest rate. The Fund is
34
Impact Shares Trust I
Notes to Financial Statements
June 30, 2023
subject to the possibility that during periods of falling interest rates an issuer will call its high yielding debt securities. The Fund would then be forced to invest the proceeds at lower interest rates, likely resulting in a decline in the Fund’s income.
Cash Transaction Risk (All Funds) - The Funds can effect creations and redemptions principally for cash, rather than for in-kind securities. ETFs generally are able to make in-kind redemptions and avoid being taxed on gain on the distributed portfolio securities at the fund level. Because the Funds currently can effect redemptions for cash, rather than for in-kind securities, they may be required to sell portfolio securities in order to obtain the cash needed to distribute redemption proceeds. The Funds may recognize a capital gain on these sales that might not have been incurred if the Funds had made a redemption in-kind, and this may decrease the tax efficiency of the Funds compared to ETFs that utilize an in-kind redemption process.
Counterparty Risk (All Funds) - The Funds may engage in transactions in securities and financial instruments that involve counterparties. Counterparty risk is the risk that a counterparty (the other party to a transaction or an agreement or the party with whom a Fund executes transactions) to a transaction with a Fund may be unable or unwilling to make timely principal, interest, settlement or margin payments, or otherwise honor its obligations. If a counterparty becomes bankrupt or otherwise fails to perform its obligations due to financial difficulties, the affected Fund’s income or the value of its assets may decrease. A Fund may experience significant delays in obtaining any recovery in a bankruptcy or other reorganization proceeding and a Fund may obtain only limited recovery or may obtain no recovery in such circumstances. In an attempt to limit the counterparty risk associated with such transactions, the Funds conduct business only with financial institutions judged by the Adviser to present acceptable credit risk.
Credit Risk (Affordable Housing ETF only) - An issuer or other obligated party of a debt security may be unable or unwilling to make dividend, interest and/or principal payments when due. In addition, the value of a debt security may decline because of concerns about the issuer’s ability or unwillingness to make such payments. In certain cases, the issuer could be late in paying interest or principal, or could fail to pay its financial obligations altogether.
Derivatives Risk (All Funds) - Derivatives Risk is a combination of several risks, including the risks that: (1) an investment in a derivative instrument may not correlate well with the performance of the securities or asset class to which the Fund seeks exposure, (2) derivative contracts, including options, may expire worthless and the use of derivatives may result in losses to the Fund, (3) a derivative instrument entailing leverage may result in a loss greater than the principal amount invested, (4) derivatives not traded on an exchange may be subject to credit risk, for example, if the counterparty does not meet its obligations (see also “Counterparty Risk”), and (5) derivatives not traded on an exchange may be subject to liquidity risk and the related risk that the instrument is difficult or impossible to value accurately. As a general matter, when the Fund establishes certain derivative instrument positions, such as certain futures and options contract positions, it will segregate liquid assets (such as cash, U.S. Treasury bonds or commercial paper) equivalent to the Fund’s outstanding obligations under the contract or in connection with the position. In addition, recent legislation has called for a new regulatory framework for the derivatives market. The impact of the new regulations are still unknown, but has the potential to increase the costs of using derivatives, may limit the availability of some forms of derivatives or the Fund’s ability to use derivatives, and may adversely affect the performance of some derivative instruments used by the Fund as well as the Fund’s ability to pursue its investment objective through the use of such instruments. The Funds did not investment in derivatives as of and for the year ended June 30, 2023.
35
Impact Shares Trust I
Notes to Financial Statements
June 30, 2023
Exchange-Traded Funds Risk (All Funds) - The price movement of an exchange-traded fund may not exactly track the underlying index and may result in a loss. In addition, shareholders bear both their proportionate share of the Fund’s expenses and similar expenses of the underlying investment company when the Fund invests in shares of another investment company.
Equity Investing Risk (All Funds, except Affordable Housing ETF) - The market prices of equity securities owned by a Fund may go up or down, sometimes rapidly or unpredictably. The value of a security may decline for a number of reasons that may directly relate to the issuer, such as management performance, financial leverage, non-compliance with regulatory requirements, and reduced demand for the issuer’s goods or services. The values of equity securities also may decline due to general industry or market conditions that are not specifically related to a particular company, such as real or perceived adverse economic conditions, changes in the general outlook for corporate earnings, changes in interest or currency rates, or adverse investor sentiment generally. In addition, equity markets tend to move in cycles, which may cause stock prices to fall over short or extended periods of time.
Ethnic Diversity Risk (Minority ETF only) - The returns on a portfolio of securities that excludes companies that are not ethnically diverse may trail the returns on a portfolio of securities that includes companies that are not ethnically diverse. Investing only in a portfolio of securities that are ethnically diverse may affect the Fund’s exposure to certain types of investments and may adversely impact the Fund’s performance depending on whether such investments are in or out of favor in the market.
Extension Risk (Affordable Housing ETF only) - Extension risk is the risk that, when interest rates rise, certain obligations will be paid off by the issuer (or other obligated party) more slowly than anticipated, causing the value of these debt securities to fall. Rising interest rates tend to extend the duration of debt securities, making their market value more sensitive to changes in interest rates. The value of longer-term debt securities generally changes more in response to changes in interest rates than shorter-term debt securities. As a result, in a period of rising interest rates, securities may exhibit additional volatility and may lose value.
Fee Risk (All Funds) - Because the fees paid by a Fund to the Adviser are based on the average daily value of the total assets of such Fund, less all accrued liabilities of such Fund (other than the amount of any outstanding borrowings constituting financial leverage), the Adviser has a financial incentive to cause the Funds to utilize leverage, which creates a conflict of interest between the Adviser, on the one hand, and the shareholders of the Funds, on the other hand.
Futures Contracts Risk (All Funds) - Futures contracts provide for the future sale by one party and purchase by another party of a specified amount of an underlying asset at a price, date and time specified when the contract is made. Funds, such as the Funds, that use futures contracts, which are a type of derivative, are subject to the risk of loss caused by unanticipated market movements. In addition, there may at times be an imperfect correlation between the movement in the prices of futures contracts and the value of their underlying instruments or indexes and there may at times not be a liquid secondary market for certain futures contracts.
Gender Diversity Risk (Women’s ETF only) - The returns on a portfolio of securities that excludes companies that are not gender diverse may trail the returns on a portfolio of securities that includes companies that are not gender diverse. Investing only in a portfolio of securities that are gender diverse may affect the Fund’s exposure to certain types of investments and may adversely impact the Fund’s performance depending on whether such investments are in or out of favor in the market.
Income Risk (Affordable Housing ETF only) - The Fund’s income may decline when interest rates fall or if there are defaults in the mortgage loans underling the securities in its portfolio. This decline can occur
36
Impact Shares Trust I
Notes to Financial Statements
June 30, 2023
because the Fund may subsequently invest in lower-yielding securities as debt securities in its portfolio mature, are near maturity or are called, or the Fund otherwise needs to purchase additional debt securities.
Illiquid Securities Risk (All Funds) - Illiquid investments may be difficult to resell at approximately the price they are valued in the ordinary course of business within seven days. When investments cannot be sold readily at the desired time or price, a Fund may have to accept a much lower price, may not be able to sell the investment at all or may be forced to forego other investment opportunities, all of which may adversely impact a Fund’s returns. Illiquid investments also may be subject to valuation risk.
Index Performance Risk (All Funds, except Affordable Housing ETF) - Each Fund is linked to an index maintained by a third party provider unaffiliated with the Funds or the Adviser. There can be no guarantee or assurance that the methodology used by the third party provider to create the index will result in the Funds achieving high, or even positive, returns. Further, there can be no guarantee that the methodology underlying the index or the daily calculation of the index will be free from error. It is also possible that the value of the index may be subject to intentional manipulation by third-party market participants. The particular indices used by the Funds may underperform other asset classes and may underperform other similar indices. Each of these factors could have a negative impact on the performance of the Funds.
Industry Concentration Risk (All Funds, except Affordable Housing ETF) - Because each Fund may invest 25% or more of the value of its assets in an industry or group of industries to the extent that the Underlying Index concentrates in an industry or group of industries, the Fund’s performance largely depends on the overall condition of such industry or group of industries and the Fund is susceptible to economic, political and regulatory risks or other occurrences associated with that industry or group of industries.
Inflation Risk (All Funds) - Inflation risk is the risk that the value of assets or income from investments will be less in the future as inflation decreases the value of money. As inflation increases, the present value of the Fund’s assets and distributions may decline.
Intellectual Property Risk (All Funds, except Affordable Housing ETF) - The Funds rely on licenses that permit the Adviser to use the Underlying Indices and associated trade names, trademarks and service marks, as well as the partner nonprofits’ names and logos (the “Intellectual Property”) in connection with the investment strategies of each respective Fund and/or in marketing and other materials for each Fund. Such licenses may be terminated, and, as a result, the relevant Fund may lose its ability to use the Intellectual Property. In the event a license is terminated or the license provider does not have rights to license the Intellectual Property, the operations of such Fund may be adversely affected.
Interest Rate Risk (Affordable Housing ETF only) - Interest rate risk is the risk that the value of the debt securities in the Fund’s portfolio will decline because of rising market interest rates. Interest rate risk is generally lower for shorter term debt securities and higher for longer-term debt securities. The Fund may be subject to a greater risk of rising interest rates than would normally be the case due to the current period of historically low rates and the effect of potential government fiscal policy initiatives and resulting market reaction to those initiatives. Duration is a reasonably accurate measure of a debt security’s price sensitivity to changes in interest rates and a common measure of interest rate risk. Duration measures a debt security’s expected life on a present value basis, taking into account the debt security’s yield, interest payments and final maturity. In general, duration represents the expected percentage change in the value of a security for an immediate 1% change in interest rates. For example, the price of a debt security with a three-year duration would be expected to drop by approximately 3%
37
Impact Shares Trust I
Notes to Financial Statements
June 30, 2023
in response to a 1% increase in interest rates. Therefore, prices of debt securities with shorter durations tend to be less sensitive to interest rate changes than debt securities with longer durations. As the value of a debt security changes over time, so will its duration. As of the date of this Prospectus, the United States is experiencing a low interest rate environment, which may increase the Fund’s exposure to risks associated with rising market interest rates. Rising market interest rates could have unpredictable effects on the markets and may expose fixed-income and related markets to heightened volatility. To the extent that the Fund invests in fixed-income securities, an increase in market interest rates may lead to increased redemptions and increased portfolio turnover, which could reduce liquidity for certain investments, adversely affect values, and increase costs. Increased redemptions may cause the Fund to liquidate portfolio positions when it may not be advantageous to do so and may lower returns. If dealer capacity in fixed-income markets is insufficient for market conditions, it may further inhibit liquidity and increase volatility in the fixed-income markets. Further, recent and potential future changes in government policy may affect interest rates.
Limited Fund Size Risk (All Funds) - The Funds may not attract sufficient assets to achieve or maximize investment and operational efficiencies and remain viable. If a Fund fails to achieve sufficient scale, it may be liquidated.
Liquidity Risk (Affordable Housing ETF only) - The Fund may hold certain investments that may trade over-the-counter or in limited volume or lack an active trading market. Accordingly, the Fund may not be able to sell or close out of such investments at favorable times or prices (or at all), or at the prices approximating those at which the Fund currently values them. Illiquid securities may trade at a discount from comparable, more liquid investments and may be subject to wide fluctuations in market value. The prices of illiquid securities may be more volatile than more liquid investments. The risks associated with illiquid securities may be greater in times of financial stress.
Management Risk (All Funds) - Management risk is the risk associated with the fact that the Fund relies on the Adviser’s ability to achieve its investment objective. The Adviser is a non-profit organization with limited personnel and financial resources. The relative lack of resources may increase the Fund’s management risk.
Market Price Variance Risk (All Funds) - Fund shares are listed for trading on NYSE Arca, Inc. (the “Exchange”) and can be bought and sold in the secondary market at prevailing market prices. The market prices of shares will fluctuate in response to changes in the NAV and supply and demand for shares. As a result, the trading prices of Shares may deviate significantly from NAV during periods of market volatility. The Adviser cannot predict whether shares will trade above, below or at their NAV. Given the fact that shares can be created and redeemed in Creation Units, the Adviser believes that large discounts or premiums to the NAV of shares should not be sustained in the long-term. In addition, the securities held by the Fund may be traded in markets that close at a different time than NYSE. Liquidity in those securities may be reduced after the applicable closing times. Accordingly, during the time when NYSE is open but after the applicable market closing, fixing or settlement times, bid-ask spreads and the resulting premium or discount to the Shares’ NAV may widen. Further, secondary markets may be subject to irregular trading activity, wide bid/ask spreads and extended trade settlement periods, which could cause a material decline in the Fund’s NAV. In times of market stress, market makers and authorized participants may step away from their respective roles in making a market in Fund shares or in executing purchase and redemption orders, which could lead to variances between the market price of Fund shares and the underlying value of those shares. Also, in stressed market conditions, the market for Fund shares may become less liquid in response to deteriorating
38
Impact Shares Trust I
Notes to Financial Statements
June 30, 2023
liquidity of the Fund’s portfolio holdings, which could lead to differences between the market price of the Fund’s shares and the underlying value of those shares. During periods of high market volatility, a Fund share may trade at a significant discount to its NAV, and in these circumstances certain types of brokerage orders may expose an investor to an increased risk of loss. A “stop order,” sometimes called a “stop-loss order,” may cause a Fund share to be sold at the next prevailing market price once the “stop” level is reached, which during a period of high volatility can be at a price that is substantially below NAV. By including a “limit” criteria with your brokerage order, you may be able to limit the size of the loss resulting from the execution of an ill-timed stop order. The Fund’s shares may be listed or traded on U.S. and non-U.S. stock exchanges other than the U.S. stock exchange where the Fund’s primary listing is maintained, and may otherwise be made available to non-U.S. investors through funds or structured investment vehicles similar to depositary receipts. There can be no assurance that the Fund’s shares will continue to trade on any such stock exchange or in any market or that the Fund’s shares will continue to meet the requirements for listing or trading on any exchange or in any market. The Fund’s shares may be less actively traded in certain markets than in others, and investors are subject to the execution and settlement risks and market standards of the market where they or their broker direct their trades for execution. Certain information available to investors who trade Fund shares on a U.S. stock exchange during regular U.S. market hours may not be available to investors who trade in other markets, which may result in secondary market prices in such markets being less efficient.
The Fund’s investment results are measured based upon the daily NAV of the Fund. Investors purchasing and selling shares in the secondary market may not experience investment results consistent with those experienced by those purchasing and redeeming directly with the Fund.
Mid-Cap Company Risk (All Funds, except Affordable Housing ETF) - Investing in securities of mid-cap companies may entail greater risks than investments in larger, more established companies. Mid-cap companies tend to have more narrow product lines, more limited financial resources and a more limited trading market for their stocks, as compared with larger companies. As a result, their stock prices may decline significantly as market conditions change.
Mortgage-Related Securities Risk (Affordable Housing ETF only) - Mortgage-related securities are subject to the same risks as investments in other types of debt securities, including credit risk, interest rate risk, liquidity risk and valuation risk. However, these investments make the Fund more susceptible to adverse economic, political or regulatory events that affect the value of real estate. Mortgage-related securities are also significantly affected by the rate of prepayments and modifications of the mortgage loans underlying those securities, as well as by other factors such as borrower defaults, delinquencies, realized or liquidation losses and other shortfalls. Mortgage related securities are particularly sensitive to prepayment risk, given that the term to maturity for mortgage loans is generally substantially longer than the expected lives of those securities. As the timing and amount of prepayments cannot be accurately predicted, the timing of changes in the rate of prepayments of the mortgage loans may significantly affect the Fund’s actual yield to maturity on any mortgage-related securities. Along with prepayment risk, mortgage-related securities are significantly affected by interest rate risk.
Non-Diversification Risk (All Funds) - Due to the nature of the Funds’ investment strategies and their non-diversified status (for purposes of the 1940 Act), the Funds may invest a greater percentage of their respective assets in the securities of fewer issuers than a “diversified” fund, and accordingly may be more vulnerable to changes in the value of those issuers’ securities. Since the Funds invest in the securities of a limited number of issuers, the Funds are particularly exposed to adverse developments affecting those issuers, and a decline in the market value of a particular security held by a Fund is likely
39
Impact Shares Trust I
Notes to Financial Statements
June 30, 2023
to affect such Fund’s performance more than if such Fund invested in the securities of a larger number of issuers. Although the Funds will be “non-diversified” for purposes of the 1940 Act, the Funds intend to comply with the diversification requirements under Subchapter M of the Code in order to be eligible to qualify as a regulated investment company.
Operational and Technology Risk (All Funds) - Cyber-attacks, disruptions, or failures that affect the Fund’s service providers, index providers, Authorized Participants, market makers, counterparties, market participants, or issuers of securities held by the Fund may adversely affect the Fund and its shareholders, including by causing losses for the Fund or impairing Fund operations.
Options Risk (All Funds) - The use of options is a highly specialized activity which involves investment techniques and risks different from those associated with ordinary portfolio securities transactions. For example, there are significant differences between the securities and options markets that could result in an imperfect correlation between these markets, causing a given transaction not to achieve its objectives. A transaction in options or securities may be unsuccessful to some degree because of market behavior or unexpected events. When a Fund writes a covered call option, such Fund forgoes, during the option’s life, the opportunity to profit from increases in the market value of the security covering the call option above the sum of the premium and the strike price of the call, but retains the risk of loss should the price of the underlying security decline. The writer of an option has no control over the time when it may be required to fulfill its obligation and once an option writer has received an exercise notice, it must deliver the underlying security at the exercise price. When a Fund writes a covered put option, such Fund bears the risk of loss if the value of the underlying stock declines below the exercise price minus the put premium. If the option is exercised, such Fund could incur a loss if it is required to purchase the stock underlying the put option at a price greater than the market price of the stock at the time of exercise plus the put premium the Fund received when it wrote the option. While a Fund’s potential gain in writing a covered put option is limited to distributions earned on the liquid assets securing the put option plus the premium received from the purchaser of the put option, such Fund risks a loss equal to the entire exercise price of the option minus the put premium.
Passive Investment Risk (All Funds, except Affordable Housing ETF) - The Funds are not actively managed and may be affected by a general decline in market segments included in the applicable Underlying Indices. The Funds invest in securities included in, or representative of, each Fund’s respective Underlying Index regardless of such security’s investment merits. The Adviser does not attempt to take defensive positions under any market conditions, including during declining markets.
Prepayment Risk (Affordable Housing ETF only) - Prepayment risk is the risk that the issuer of a debt security will repay principal prior to the scheduled maturity date. Debt securities allowing prepayment may offer less potential for gains during a period of declining interest rates, as the Fund may be required to reinvest the proceeds of any prepayment at lower interest rates. These factors may cause the value of an investment in the Fund to change.
Securities Market Risk (All Funds) - Securities market risk is the risk that the value of securities owned by a Fund may go up or down, sometimes rapidly or unpredictably, due to factors affecting particular companies or the securities markets generally. The profitability of a Fund substantially depends upon the Adviser correctly assessing the future price movements of stocks, bonds, loans, options on stocks, and other securities and the movements of interest rates. The Adviser cannot guarantee that it will be successful in accurately predicting price movements. The market prices of equities may decline for reasons that directly relate to the issuing company (such as poor management performance or reduced demand for its goods or services), factors that affect a particular industry (such as a decline in demand,
40
Impact Shares Trust I
Notes to Financial Statements
June 30, 2023
labor or raw material shortages, or increased production costs) or general market conditions not specifically related to a company or industry (such as real or perceived adverse economic conditions, changes in the general outlook for corporate earnings, changes in interest or currency rates, or adverse investor sentiment generally, or natural and environmental disasters and systemic market dislocations). The spread of infectious disease including epidemics and pandemics such as the recent COVID-19 outbreak, the novel respiratory disease also known as “coronavirus,” also could affect the economies of many nations in ways that cannot necessarily be foreseen. The coronavirus has resulted in travel restrictions and disruptions, closed borders, enhanced health screenings at ports of entry and elsewhere, disruption of and delays in healthcare service preparation and delivery, quarantines, event cancellations and restrictions, service cancellations or reductions, disruptions to business operations, supply chains and customer activity, lower consumer demand for goods and services, as well as general concern and uncertainty that has negatively affected the economic environment. The impact of this outbreak and any other epidemic or pandemic that may arise in the future could adversely affect the economies of many nations or the entire global economy, the financial performance of individual issuers, borrowers and sectors and the health of capital markets and other markets generally in potentially significant and unforeseen ways. This crisis or other public health crises may also exacerbate other pre-existing political, social and economic risks in certain countries or globally. The duration of the COVID-19 outbreak and its effects cannot be determined with certainty. The foregoing could lead to a significant economic downturn or recession, increased market volatility, a greater number of market closures, higher default rates and adverse effects on the values and liquidity of securities or other assets. Such impacts, which may vary across asset classes, may adversely affect the performance of the Fund’s investments, the Fund and your investment in the Fund.
In addition, the increasing popularity of passive index-based investing may have the potential to increase security price correlations and volatility. As passive strategies generally buy or sell securities based simply on inclusion and representation in an index, securities prices will have an increasing tendency to rise or fall based on whether money is flowing into or out of passive strategies rather than based on an analysis of the prospects and valuation of individual securities. This may result in increased market volatility as more money is invested through passive strategies. As a result of the nature of a Fund’s investment activities, it is possible that such Fund’s financial performance may fluctuate substantially from period to period. Additionally, at any point in time an investment in a Fund may be worth less than the original investment, even after taking into account the reinvestment of dividends and distributions.
Significant Exposure Risk (All Funds) - To the extent that the Fund invests a large percentage of its assets in a single asset class or the securities of issuers within the same country, state, region, industry or sector, an adverse economic, business or political development may affect the value of the Fund’s investments more than if the Fund were more broadly diversified. A significant exposure makes the Fund more susceptible to any single occurrence and may subject the Fund to greater market risk than a fund that is more broadly diversified.
Small-Cap Company Risk (All Funds, except Affordable Housing ETF) - Investing in the securities of small-cap companies either directly or indirectly through investments in ETFs, closed-end funds or mutual funds may pose greater market and liquidity risks than larger, more established companies, because of limited product lines and/or operating history, limited financial resources, limited trading markets, and the potential lack of management depth. In addition, the securities of such companies are typically more volatile than securities of larger capitalization companies.
41
Impact Shares Trust I
Notes to Financial Statements
June 30, 2023
Specified Pools Risk (Affordable Housing ETF only) - The Fund is expected to primarily invest in specified pools of mortgage loans. This may cause the Fund to take longer to fully achieve its principal investment strategy.
Swaps Risk (All Funds) - Investments in swaps involve both the risks associated with an investment in the underlying investments or instruments (including equity investments) and counterparty risk. In a standard over-the-counter (“OTC”) swap transaction, two parties agree to exchange the returns, differentials in rates of return or some other amount calculated based on the “notional amount” of predetermined investments or instruments, which may be adjusted for an interest factor. Swaps can involve greater risks than direct investments in securities, because swaps may be leveraged and OTC swaps are subject to counterparty risk (e.g., the risk of a counterparty’s defaulting on the obligation or bankruptcy), credit risk and pricing risk (i.e., swaps may be difficult to value). Swaps may also be considered illiquid. Certain swap transactions, including interest rate swaps and index credit default swaps, may be subject to mandatory clearing and exchange trading, although the swaps in which the Fund will invest are not currently subject to mandatory clearing and exchange trading. The use of swaps is a highly specialized activity which involves investment techniques, risk analyses and tax planning different from those associated with ordinary portfolio securities transactions. The value of swaps, like many other derivatives, may move in unexpected ways and may result in losses for the Fund.
Tracking Error Risk (All Funds, except Affordable Housing ETF) - The performance of the Fund may diverge from that of the Underlying Index. Because the Fund employs a representative sampling strategy, the Fund may experience tracking error to a greater extent than a fund that seeks to replicate an index. The Adviser may not be able to cause the Fund’s performance to correlate to that of the Fund’s benchmark, either on a daily or aggregate basis. Because the Underlying Index rebalances monthly but the Fund is not obligated to do the same, the risk of tracking error may increase following the rebalancing of the Underlying Index.
Trading Issues Risk (All Funds) - Although the shares of the Fund are listed for trading on the Exchange, there can be no assurance that an active trading market for such shares will develop or be maintained. Trading in shares on the Exchange may be halted due to market conditions or for reasons that, in the view of the Exchange, make trading in shares inadvisable. In addition, trading in shares on the Exchange is subject to trading halts caused by extraordinary market volatility pursuant to the Exchange’s “circuit breaker” rules. Market makers are under no obligation to make a market in the Fund’s shares, and authorized participants are not obligated to submit purchase or redemption orders for Creation Units (as defined below). In the event market makers cease making a market in the Fund’s shares or authorized participants stop submitting purchase or redemption orders for Creation Units, Fund shares may trade at a larger premium or discount to their net asset value. There can be no assurance that the requirements of the Exchange necessary to maintain the listing of the Fund will continue to be met or will remain unchanged. The Fund may have difficulty maintaining its listing on the Exchange in the event the Fund’s assets are small or the Fund does not have enough shareholders.
Transactions Risk (Affordable Housing ETF only) - The Fund may purchase securities via to-be-announced transactions (“TBA Transactions”). In such a transaction, the purchase price of the securities is typically fixed at the time of the commitment, but delivery and payment can take place a month or more after the date of the commitment. At the time of delivery of the securities, the value may be more or less than the purchase or sale price. Purchasing securities in a TBA Transaction may give rise to investment leverage and may increase the Fund’s volatility. Default by, or bankruptcy of, a counterparty to a TBA Transaction would expose the Fund to possible losses because of an adverse market action, expenses or delays in connection with the purchase or sale of the pools specified in such transaction.
42
Impact Shares Trust I
Notes to Financial Statements
June 30, 2023
U.S. Government Securities Risk (Affordable Housing ETF only) - U.S. government securities are subject to interest rate risk but generally do not involve the credit risks associated with investments in other types of debt securities. As a result, the yields available from U.S. government securities are generally lower than the yields available from other debt securities. U.S. government securities are guaranteed only as to the timely payment of interest and the payment of principal when held to maturity. While securities issued or guaranteed by U.S. federal government agencies (such as Ginnie Mae) are backed by the full faith and credit of the U.S. Department of the Treasury, securities issued by government sponsored entities (such as Fannie Mae and Freddie Mac) are solely the obligation of the issuer and generally do not carry any guarantee from the U.S. government.
Obligations of U.S. government agencies, authorities, instrumentalities and sponsored enterprises (such as Fannie Mae and Freddie Mac) have historically involved little risk of loss of principal if held to maturity. However, the maximum potential liability of the issuers of some of these securities may greatly exceed their current resources and no assurance can be given that the U.S. government would provide financial support to any of these entities if it were not obligated to do so by law. Fannie Mae and Freddie Mac have been operating under conservatorship, with the Federal Housing Finance Administration (‘‘FHFA’’) acting as their conservator, since 2008. The entities are dependent upon the continued support of the U.S. Department of the Treasury and FHFA in order to continue their business operations. These factors, among others, could affect the future status and role of Fannie Mae or Freddie Mac and the value of their securities and the securities that they guarantee. Additionally, the U.S. government and its agencies and instrumentalities do not guarantee the market values of their securities, which may fluctuate.
Valuation Risk (All Funds) - The Funds are subject to the risk of mispricing or improper valuation of their investments, in particular to the extent that their securities are fair valued.
7. OTHER
At June 30, 2023, the records of the Trust reflected that 100% of the Funds’ total Shares outstanding were held by four Authorized Participants, in the form of Creation Units. However, the individual shares comprising such Creation Units are listed and traded on the NYSE Arca, Inc. and have been purchased and sold by persons other than Authorized Participants.
8. SUBSEQUENT EVENTS
The Funds have evaluated the need for additional disclosures and/or adjustments resulting from subsequent events through the date the financial statements were issued. Based on this evaluation, no additional disclosures and/or adjustments were required to the financial statements.
43
Impact Shares Trust I
Report of Independent Registered Public Accounting Firm
June 30, 2023
To the Shareholders and Board of Trustees of Impact Shares Trust I
Opinion on the Financial Statements
We have audited the accompanying statements of assets and liabilities, including the schedules of investments, of Impact Shares Trust I comprising Impact Shares YWCA Women’s Empowerment ETF, Impact Shares NAACP Minority Empowerment ETF, and Impact Shares Affordable Housing MBS ETF (the “Funds”) as of June 30, 2023, and the related statements of operations and changes in net assets, the related notes, and the financial highlights for the year then ended (collectively referred to as the “financial statements”). In our opinion, the financial statements present fairly, in all material respects, the financial position of the each of the Funds as of June 30, 2023, the results of their operations, the changes in net assets, and the financial highlights for the year then ended, in conformity with accounting principles generally accepted in the United States of America.
The Funds’ financial statements and financial highlights for the years ended June 30, 2022, and prior, were audited by other auditors whose report dated August 29, 2022, expressed an unqualified opinion on those financial statements and financial highlights.
Basis for Opinion
These financial statements are the responsibility of the Funds’ management. Our responsibility is to express an opinion on the Funds’ financial statements based on our audits. We are a public accounting firm registered with the Public Company Accounting Oversight Board (United States) (“PCAOB”) and are required to be independent with respect to the Funds in accordance with the U.S. federal securities laws and the applicable rules and regulations of the Securities and Exchange Commission and the PCAOB.
We conducted our audits in accordance with the standards of the PCAOB. Those standards require that we plan and perform the audit to obtain reasonable assurance about whether the financial statements are free of material misstatement whether due to error or fraud.
Our audits included performing procedures to assess the risks of material misstatement of the financial statements, whether due to error or fraud, and performing procedures that respond to those risks. Such procedures included examining, on a test basis, evidence regarding the amounts and disclosures in the financial statements. Our procedures included confirmation of securities owned as of June 30, 2023, by correspondence with the custodian and brokers. Our audits also included evaluating the accounting principles used and significant estimates made by management, as well as evaluating the overall presentation of the financial statements. We believe that our audits provide a reasonable basis for our opinion.
We have served as the Funds’ auditor since 2023.
COHEN & COMPANY, LTD.
Cleveland, Ohio
August 29, 2023
44
Impact Shares Trust I
Board of Trustees and Officers of the Trust
June 30, 2023 (Unaudited)
Set forth below are the names, addresses, year of birth, position with the Trust, term of office and length of time served, the principal occupations for the last five years, number of funds in fund complex overseen by the Trustees, and other directorships outside the fund complex of each of the persons currently serving as Trustees and Officers of the Trust. The Statement of Additional Information (“SAI”) includes additional information about fund directors and is available upon request without charge, at 1-844-448-3383.
| | | | | | | | | | | | |
Name and
Date of Birth | | Position(s)
with the Funds | | Term of Office 1 and Length of Time Served | | Principal
Occupation(s)
During the Past Five
Years | | Number of
Portfolios in
Impact Shares
Fund Complex 2
Overseen by
Trustees | | Other
Directorships/
Trusteeships
Held
During the
Past Five
Years | | Experience,
Qualifications,
Attributes,
Skills for Board
Membership |
|
| INDEPENDENT TRUSTEES |
| | | | | | |
Winston I. Lowe (2/5/1951) | | Trustee | | Indefinite Term; Trustee since April 2018 | | Managing Partner, Lowe and Associates, LLC since March 2009 | | 3 | | None | | Significant business and legal experience as associate and managing partner at US- based law firm; significant leadership experience at law firm. |
Kathleen Legg (11/9/1982) | | Trustee | | Indefinite
Term; Trustee
since April
2018 | | Consultant, Global Ware Digital Company since November 2014; Consultant, Independent Consultant from 2012 until 2014. | | 3 | | None | | Significant experience running social media companies; Significant experience advising global nonprofits on social media engagement techniques and best practices. |
| 1 | Trustees serve until their successors are duly elected and qualified. |
| 2 | The “Impact Shares Fund Complex” consists of each series of Impact Shares Trust I. |
45
Impact Shares Trust I
Board of Trustees and Officers of the Trust
June 30, 2023 (Unaudited)
| | | | | | | | | | | | |
Name and
Date of Birth | | Position(s)
with the Funds | | Term of
Office 1 and
Length of
Time Served | | Principal Occupation(s) During the Past Five Years | | Number of
Portfolios in
Impact Shares
Fund Complex 2
Overseen by
Trustees | | Other
Directorships/
Trusteeships
Held During the
Past Five
Years | | Experience,
Qualifications,
Attributes,
Skills for Board
Membership |
|
| INTERESTED TRUSTEES |
| | | | | | |
Ethan Powell 3 (6/20/1975) | | Trustee; Chairman of the Board | | Indefinite Term; Trustee since May 2016; Chairman of the Board since May 2016 | | President and Founder of Impact Shares LLC (“Impact Shares”) (a registered investment advisor dedicated to building a platform to create better socially responsible investment solutions) since December 2015; Trustee of the Highland Fund Complex from June 2012 until July 2013 and since December 2013; Chief Product Strategist of Highland Capital Management Fund Advisors, L.P. from 2012 until December 2015; Senior Retail Fund Analyst of HCM from 2007 until December 2015 and Impact Shares from its inception until December 2015; Secretary of NexPoint Credit Strategies Fund (“NHF”) from November 2010 until June 2012; President and Principal Executive Officer of NHF from June 2012 until May 2015; Secretary of NHF from May 2015 until December 2015; Executive Vice President and Principal Executive Officer of Impact Shares Trust I from May 2016 to January 2018; and Secretary of Impact Shares Trust I from May 2016 to January 2018; President and Treasurer of Impact Shares Trust I since January 2018. | | 3 | | Serves as Independent Chairman of the Board of the Highland Fund Complex and the NexPoint Credit Strategies Fund Complex (collectively, 25 funds) | | Significant experience in the financial industry; significant executive experience including past service as an officer of funds in the Highland Fund Complex; significant administrative and managerial experience. |
| 1 | Trustees serve until their successors are duly elected and qualified. |
| 2 | The “Impact Shares Fund Complex” consists of each series of Impact Shares Trust I. |
| 3 | Mr. Powell is deemed to be an “interested person” of the Trust, as defined in the 1940 Act, because of his current affiliation with Impact Shares, Corp., the Funds’ investment adviser. |
46
Impact Shares Trust I
Board of Trustees and Officers of the Trust
June 30, 2023 (Unaudited)
| | | | | | |
Name and Date of Birth | | Position(s) with the Funds | | Term of Office and Length of
Time Served 1 | | Principal Occupation(s) During the Past Five Years |
| | | |
| OFFICERS | | | | | | |
| | | |
Ethan Powell (6/20/1975) | | President and Treasurer | | January 2018 – Present. | | See above under “Interested Trustees”. |
| | | |
Donald J. Guiney (9/22/1956) | | Secretary, Chief Compliance Officer | | January 2018 – Present. | | Senior Counsel, Baker & McKenzie LLP (law firm) from 2013 to 2016); Partner, Freshfields Bruckhaus Deringer (law firm) from 1997 to 2013. |
| | | |
Marvin Owens (2/5/1963) | | Chief Engagement Officer | | November 2021 – Present. | | Senior Director, National Economic Programs at the NAACP from 2016 to 2020; Independent consultant and lecturer from 2007 to 2015; Vice President, Economic Empowerment at the national Urban League from 2002 to 2006. |
| 1 | The Officers hold office until the next annual meeting of the Board of Trustees and until their successors shall have been elected and qualified. |
47
Impact Shares Trust I
Board of Trustees and Officers of the Trust
June 30, 2023 (Unaudited)
A Special Meeting of the Shareholders of record of the Funds, as the close of business on June 23, 2023, was held, and subsequently adjourned, on August 24, 2023. This Special Meeting of the Funds’ Shareholders was called for the Shareholders to consider, among other proposals, the proposal to elect four new members to the Board of Trustees of the Trust. None of the proposals under consideration by the Shareholders of the Fund were voted upon at the August 24, 2023 Shareholder Meeting, and this Shareholder Meeting was adjourned to August 31, 2023. If these four proposed new members are elected to the Board by the Shareholders of the Funds at the August 31, 2023 Special Meeting of the Shareholders, then Ms. Legg and Mr. Lowe will cease serving as Trustees to the Trust, and it is expected that the following persons will serve as the Trustees and the Officers of the Trust:
| | | | | | | | | | | | |
Name and
Year of Birth | | Position(s)
with the Funds | | Term of Office 1 and Length of Time Served | | Principal
Occupation(s)
During the Past Five
Years | | Number of
Portfolios in
Impact Shares
Fund Complex 2
Overseen by
Trustees | | Other
Directorships/
Trusteeships
Held
During the
Past Five
Years | | Experience,
Qualifications,
Attributes,
Skills for Board
Membership |
|
| INDEPENDENT TRUSTEES |
| | | | | | |
Monica H. Byrd (1979) | | Independent Trustee | | Indefinite Term; August 2023 - Present | | Chief Financial Officer of LFO Management, LLC since 2019; Chief Financial Officer of Glencoe Capital/Stockwell Capital 2018-2019; Vice President Finance of Glencoe Capital/Stockwell Capital since 2016-2018. | | 3 | | N/A | | Significant experience in the financial industry; significant administrative and managerial experience. |
| 1 | Trustees serve until their successors are duly elected and qualified. |
| 2 | The “Impact Shares Fund Complex” consists of each series of Impact Shares Trust I. |
48
Impact Shares Trust I
Board of Trustees and Officers of the Trust
June 30, 2023 (Unaudited)
| | | | | | | | | | | | |
Name and
Year of Birth | | Position(s)
with the Funds | | Term of Office 1 and Length of Time Served | | Principal
Occupation(s)
During the Past Five
Years | | Number of
Portfolios in
Impact Shares
Fund Complex 2
Overseen by
Trustees | | Other
Directorships/
Trusteeships
Held
During the
Past Five
Years | | Experience,
Qualifications,
Attributes,
Skills for Board
Membership |
|
| INDEPENDENT TRUSTEES |
| | | | | | |
Pamela Cytron (1966) | | Independent Trustee | | Indefinite Term; August 2023 - Present | | CEO & Founder, Pendo Systems, Inc. (through July 2020). President - The Founder’s Arena (January 2023 – Present) RegAlytics (4/2021 – December 2022): Non-executive Board advisor. | | 3 | | Serves on the Boards of First Rate Inc. (1/2015-Present); First Rate Ventures (1/2022 – Present); Privacy Lock (October 2022 – Present) (nonexecutive Board role); and World Technology Partners (April 2022 – Present) (Vice President). Served on the Board of Global Recovery Initiatives Foundation (September 2011-April 2022) (Chairman). | | Significant experience in the financial industry; significant administrative and managerial experience. |
| | | | | | |
Lawrence Jules (1968) | | Independent Trustee | | Indefinite Term; August 2023 - Present | | Vice President and Head Trader at 3Edge Asset Management LLC since January 2022; and Director and Head Trader at Charles Schwab Investment Management since August 2008 – December 2022. | | 3 | | Serves as a director of the 600 Atlantic/Federal Reserve Bank of Boston Federal Credit Union | | Significant experience in the financial industry; significant administrative and managerial experience |
| 1 | Trustees serve until their successors are duly elected and qualified. |
| 2 | The “Impact Shares Fund Complex” consists of each series of Impact Shares Trust I. |
49
Impact Shares Trust I
Board of Trustees and Officers of the Trust
June 30, 2023 (Unaudited)
| | | | | | | | | | | | |
Name and
Year of Birth | | Position(s)
with the Funds | | Term of
Office 1 and
Length of
Time Served | | Principal Occupation(s) During the Past Five Years | | Number of
Portfolios in
Impact Shares
Fund Complex 2
Overseen by
Trustees | | Other
Directorships/
Trusteeships
Held During the
Past Five
Years | | Experience,
Qualifications,
Attributes,
Skills for Board
Membership |
|
| INTERESTED TRUSTEES |
| | | | | | |
Ethan Powell 3 (1975) | | Trustee; Chairman of the Board | | Indefinite Term; Trustee since May 2016; Chairman of the Board since May 2016 | | Principal and CIO of Brookmont Capital; President and Founder of Impact Shares LLC (“Impact Shares”) since December 2015; Trustee of the Highland and Nexpoint Fund Complex from June 2012; and Independent director of Kelly Strategic ETF Trust. | | 3 | | Serves as Independent Chairman of the Board of the Highland Fund Complex and the NexPoint Credit Strategies Fund Complex (collectively, 25 funds) and is a member of the Board of Kelly Strategic Management Fund | | Significant experience in the financial industry; significant executive experience including past service as an officer of funds in the Highland Fund Complex; significant administrative and managerial experience. |
| | | | | | |
Guillermo Trias (1976) | | Interested Trustee | | Indefinite Term; August 2023 - Present | | Co-Founder & CEO of the Tidal Financial Group of companies since 2016 | | 3 | | Manager (director) of Toroso Investments, LLC | | Significant experience in the financial industry; significant executive experience; significant administrative and managerial experience. |
| 1 | Trustees serve until their successors are duly elected and qualified. |
| 2 | The “Impact Shares Fund Complex” consists of each series of Impact Shares Trust I. |
| 3 | Mr. Powell is deemed to be an “interested person” of the Trust, as defined in the 1940 Act, because of his current affiliation with Impact Shares, Corp., the Equity ETFs’ investment sub-adviser and the Affordable Housing ETF’s investment adviser. Mr. Trias is deemed an “interested person” of the Trust, as defined in the 1940 Act, because of his current affiliation with Toroso Investments LLC, the Equity ETFs’ investment adviser. |
50
Impact Shares Trust I
Board of Trustees and Officers of the Trust
June 30, 2023 (Unaudited)
| | | | | | |
Name and Year of Birth | | Position(s) with the Funds | | Term of Office and Length of
Time Served 1 | | Principal Occupation(s) During Past Five Years |
| | | |
| OFFICERS | | | | | | |
| | | |
Ethan Powell (1975) | | President and Treasurer | | January 2018 – Present. | | See above under “Interested Trustees”. |
| | | |
Donald J. Guiney (1956) | | Secretary | | January 2018 – Present. | | Senior Counsel, Baker & McKenzie LLP (law firm) from 2013 to 2016); Partner, Freshfields Bruckhaus Deringer (law firm) from 1997 to 2013. |
| 1 | The Officers hold office until the next annual meeting of the Board of Trustees and until their successors shall have been elected and qualified. |
51
Impact Shares Trust I
Disclosure of Fund Expenses
June 30, 2023 (Unaudited)
All ETFs have operating expenses. As a shareholder of the Fund you incur an Advisory fee. In addition to the Advisory fee, a shareholder may pay brokerage expenses, taxes, interest, litigation expenses and other extraordinary expenses (including acquired fund fees and expenses), if any. It is important for you to understand the impact of these ongoing costs of your investment returns. Shareholders may incur brokerage commissions on their purchases and sales of Fund shares, which are not reflected in these examples.
The following examples use the annualized expense ratio and are intended to help you understand the ongoing costs (in dollars) of investing in each Fund and to compare these costs with those of other funds. The examples are based on an investment of $1,000 made at the beginning of the period shown and held for the entire period (January 1, 2023 to June 30, 2023) (unless otherwise noted below).
The table below illustrates each Fund’s cost in two ways:
Actual Fund Return. This section helps you to estimate the actual expenses after fee waivers that your Fund incurred over the period. The “Expenses Paid During Period” column shows the actual dollar expense cost incurred by a $1,000 investment in the Fund, and the “Ending Account Value” number is derived from deducting that expense cost from the Fund’s gross investment return.
You can use this information, together with the actual amount you invested in the Fund, to estimate the expenses you paid over that period. Simply divide your actual account value by $1,000 to arrive at a ratio (for example, an $8,600 account value divided by $1,000 = 8.6), then multiply that ratio by the number shown for your Fund under “Expenses Paid During Period.”
Hypothetical 5% Return. This section helps you compare your Fund’s costs with those of other funds. It assumes that the Fund had an annual 5% return before expenses during the year, but that the expense ratio (Column 3) for the period is unchanged. This example is useful in making comparisons because the Commission requires all funds to make this 5% calculation. You can assess your Fund’s comparative cost by comparing the hypothetical result for your Fund in the “Expenses Paid During Period” column with those that appear in the same charts in the shareholder reports for other funds.
NOTE: Because the return is set at 5% for comparison purposes — NOT your Fund’s actual return — the account values shown may not apply to your specific investment.
| | | | | | | | | | | | | | | | |
| | | | | |
| | | Beginning
Account
Value
1/1/23 | | | Ending
Account
Value
6/30/23 | | | Annualized
Expense
Ratios | | | Expenses
Paid During
Period(1) | |
|
Impact Shares YWCA Women’s Empowerment ETF | |
Actual Fund Return | | $ | 1,000.00 | | | $ | 1,164.40 | | | | 0.75 | % | | | $4.02 | |
Hypothetical 5% Return | | $ | 1,000.00 | | | $ | 1,021.08 | | | | 0.75 | % | | | $3.76 | |
|
Impact Shares NAACP Minority Empowerment ETF | |
Actual Fund Return | | $ | 1,000.00 | | | $ | 1,198.10 | | | | 0.49 | % | | | $2.67 | |
Hypothetical 5% Return | | $ | 1,000.00 | | | $ | 1,022.37 | | | | 0.49 | % | | | $2.46 | |
|
Impact Shares Affordable Housing MBS ETF | |
Actual Fund Return | | $ | 1,000.00 | | | $ | 1,020.40 | | | | 0.30 | % | | | $1.50 | |
Hypothetical 5% Return | | $ | 1,000.00 | | | $ | 1,023.31 | | | | 0.30 | % | | | $1.51 | |
| (1) | Expenses are equal to the Fund’s annualized expense ratio multiplied by the average account value over the period, multiplied 181/365 (to reflect the one-half year period shown). |
52
Impact Shares Trust I
Board Considerations in Approving the Continuation of the Investment
Advisory Agreement
June 30, 2023 (Unaudited)
Board Considerations in Approving the Continuation of the Investment Advisory Agreement
At a meeting held on February 21, 2023 with respect to Impact Shares NAACP Minority Empowerment ETF (“NACP”) and Impact Shares YWCA Women’s Empowerment ETF (“WOMN” and together with NACP, the “Equity Funds”), the trustees (collectively, the “Trustees” or the “Board”) of Impact Shares Trust I (the “Trust”), including the Trustees who are not “interested persons” (as such term is defined in Section 2(a)(19) of the 1940 Act) of the Trust (such Trustees, the “Independent Trustees”), met to consider the proposed continuation of the investment advisory agreement (“Investment Advisory Agreement”) between the Trust and Impact Shares, Corp. (the “Adviser”) for an additional one-year term. The following summarizes the Trustees’ process of requesting and evaluating the information they believed to be reasonably necessary to determine whether to approve the continuation of the Investment Advisory Agreement.
In considering the Investment Advisory Agreement, the Independent Trustees evaluated the nature, extent, and quality of the advisory services provided to each Equity Fund by the Adviser. The Independent Trustees considered the terms of the Investment Advisory Agreement and received and considered information provided by management that described, among other matters:
| • | | the nature and scope of the advisory services provided to each Equity Fund and information regarding the experience, qualifications, and adequacy of the personnel providing those services, |
| • | | the investment program used by the Adviser to manage each Equity Fund, |
| • | | possible fall-out benefits and potential conflicts of interest, |
| • | | the compliance functions of the Adviser, and |
| • | | the financial resources of the Adviser |
In addition to considering each Equity Fund’s investment performance, the Independent Trustees considered, among other matters, the general oversight of the Trust by the Adviser, and also took into account information concerning the investment processes used by the Adviser in managing each Equity Fund.
The Independent Trustees considered, among other matters, that the Adviser provides the Trust with office space and personnel, and, under the unitary-fee structure set forth in the Investment Advisory Agreement, the Adviser is responsible for bearing all of each Equity Fund’s expenses, including the costs of transfer agency, custody, fund administration, legal, audit, and other services provided to each Equity Fund, with certain noted exceptions. The Independent Trustees also took into account the Adviser’s compliance and operational functions, as well as the resources being devoted by the Adviser to these functions.
The Independent Trustees noted that the Adviser’s current cash flows and expenses had outpaced revenues during the reporting period. The Independent Trustees considered the Adviser’s statements that it has drawn down the full amount under its operating capital loan from the Rockefeller Foundation and the Adviser’s on-going discussions regarding potential partnerships to support the viability of the Equity Funds.
53
Impact Shares Trust I
Board Considerations in Approving the Continuation of the Investment
Advisory Agreement
June 30, 2023 (Unaudited)
The Independent Trustees concluded, within the context of the Independent Trustees’ overall conclusions regarding the Investment Advisory Agreement, that: (i) the scope of the services provided to each Equity Fund under the Investment Advisory Agreement was consistent with that Equity Fund’s operational requirements; (ii) the Adviser has the capabilities, resources, and personnel necessary to provide the advisory services required by each Equity Fund; and (iii) overall, the nature, extent, and quality of the services provided by the Adviser to each Equity Fund were sufficient to warrant approval of the Investment Advisory Agreement for an additional one-year term.
The Independent Trustees considered that each Equity Fund seeks investment results that, before fees and expenses, track the performance of that Equity Fund’s respective underlying index and each Equity Fund’s performance was within an acceptable level of that Equity Fund’s underlying index. The Independent Trustees also considered that each Equity Fund experienced three-year performance ended December 31, 2022, above the median of that Equity Fund’s Morningstar category, with WOMN ranking in the first quartile of its Morningstar category and ranking in the second quartile of its Morningstar category.
The Independent Trustees concluded, within the context of the Independent Trustees’ overall conclusions regarding the Investment Advisory Agreement, that the performance history for each Equity Fund was not inconsistent with approval of the Investment Advisory Agreement.
The Independent Trustees considered the cost of services provided by the Adviser and the profitability to the Adviser of the Adviser’s relationship with the Trust. The Independent Trustees recognized that the Adviser, in the abstract, should be entitled to earn a reasonable level of profit for the services provided to each Equity Fund, and that it is difficult to make comparisons of profitability from ETF advisory contracts because comparative information generally is not available and is affected by numerous factors, including the structure of the particular adviser, the types and sizes of funds that the adviser manages, the adviser’s business mix, numerous assumptions about cost allocations, and the adviser’s capital structure and cost of capital.
The Independent Trustees also considered that the Adviser is a Section 501(c)(3) nonprofit organization under the U.S. Internal Revenue Code of 1986, as amended, and considered whether it might be appropriate to analyze some or all of the amounts that the Adviser has committed to donate to each Equity Fund’s partner nonprofit as analogous to the profits earned by for-profit investment advisers to investment companies. The Independent Trustees noted that the Adviser’s expenses currently exceed revenues and that, based on the Adviser’s projections, it was unlikely that the fees paid to the Adviser by a Equity Fund would significantly exceed the Adviser’s cost of providing services to that Equity Fund in the near term. Further the Independent Trustees concluded that, even if any said excess were to be analyzed as though said excess were profit to the Adviser, the expected “profitability” was not excessive and supported the approval of the Investment Advisory Agreement for an additional one-year term.
The Independent Trustees considered the unitary fee paid by each Equity Fund to the Adviser, as well as each Equity Fund’s distribution and service (Rule 12b-1) plan, “other expenses,” and total expenses. In doing so, the Independent Trustees reviewed information provided by the Adviser comparing the
54
Impact Shares Trust I
Board Considerations in Approving the Continuation of the Investment
Advisory Agreement
June 30, 2023 (Unaudited)
expenses of each Equity Fund relative to those of a peer group of funds selected by Morningstar (“Peer Group”). The Independent Trustees considered that each Equity Fund’s net expense ratio was below the median of that Equity Fund’s Morningstar Peer Group (including both mutual funds and ETFs) and above the median of that Equity Fund’s Morningstar Peer Group (including index funds only).
The Independent Trustees noted that, under the unitary-fee arrangement described in the Investment Advisory Agreement, the Adviser is responsible for substantially all expenses of each Equity Fund, including the cost of transfer agency, custody, fund administration, legal, audit, and other services except for: (i) distribution and service fees payable pursuant to a Rule 12b-1 plan, if any; (ii) taxes and governmental fees, if any, levied against a Equity Fund; (iii) brokerage fees and commissions, and other portfolio transaction expenses incurred by or for a Equity Fund; (iv) expenses of a Equity Fund’s securities lending (if any), including any securities lending agent fees, as governed by a separate securities lending agreement; costs, including interest expenses, of borrowing money or engaging in other types of leverage financing; (v) extraordinary expenses, including extraordinary legal expenses, as may arise, including, without limitation, expenses incurred in connection with litigation, proceedings, other claims, contractual arrangements with partner charities and the legal obligations of a Equity Fund to indemnify its Trustees, officers, employees, shareholders, distributors, and agents with respect thereto; and (vi) expenses of a Equity Fund which are capitalized in accordance with generally accepted accounting principles.
The Independent Trustees noted that the Adviser, at the time of the Meeting, did not advise any accounts other than the Equity Funds.
Based on this and other information, the Independent Trustees concluded that, within the context of the Independent Trustees’ overall conclusions regarding the Investment Advisory Agreement, the fees and expenses charged represented reasonable compensation to the Adviser in light of the services provided to each Equity Fund.
The Independent Trustees considered information regarding the direct and indirect benefits to the Adviser from the Adviser’s relationship with each Equity Fund, including reputational and other “fall out” benefits. The Independent Trustees considered the receipt of these benefits in light of the Adviser’s “profitability,” and concluded that these benefits were not excessive, even if the amounts the Adviser has committed to donate to the partner nonprofits were to be analyzed as though these amounts were profits to the Adviser.
The Independent Trustees considered the extent to which the Adviser may realize economies of scale or other efficiencies in managing and supporting each Equity Fund. The Independent Trustees considered that no Equity Fund has any breakpoints in that Equity Fund’s fee arrangement with the Adviser. The Independent Trustees concluded that each Equity Fund’s overall fee arrangements represent an appropriate sharing at the present time between Equity Fund shareholders and the Adviser of any economies of scale or other efficiencies in the management of each Equity Fund at current asset levels.
55
Impact Shares Trust I
Board Considerations in Approving the Continuation of the Investment
Advisory Agreement
June 30, 2023 (Unaudited)
In the Trustees’ deliberations, the Trustees did not identify any particular information that was all-important or controlling, and each Trustee may have attributed different weights to the various factors.
Based on the factors described above, the Independent Trustees concluded that the approval of the Investment Advisory Agreement for an additional one-year term was in the best interests of the Equity Funds and should be approved.
Board Considerations in Approving the Continuation of the Investment Advisory Agreement and Sub-Advisory Agreement (Impact Shares Affordable Housing MBS ETF)
At a meeting held on May 24, 2023 with respect to Impact Shares Affordable Housing MBS ETF (“OWNS”), the trustees (collectively, the “Trustees” or the “Board”) of Impact Shares Trust I (the “Trust”), including the Trustees who are not “interested persons” (as such term is defined in Section 2(a)(19) of the 1940 Act) of the Trust (such Trustees, the “Independent Trustees”), met to consider the proposed continuation of the investment advisory agreement (“Investment Advisory Agreement”) between the Trust and Impact Shares, Corp. (the “Adviser”) and the Sub-Advisory Agreement with Community Capital Management, Inc. (together, the “Agreements”), (each for an additional one-year term. The following summarizes the Trustees’ process of requesting and evaluating the information they believed to be reasonably necessary to determine whether to approve the continuation of the Investment Advisory Agreement.
In considering the Agreements, the Independent Trustees evaluated the nature, extent, and quality of the advisory and sub-advisory services provided to OWNS by the Adviser and CCM, respectively. The Independent Trustees considered the terms of the Agreements and noted that, in connection with the Meeting and prior meetings, they had received and considered information provided by management that described, among other matters:
| | • | | the nature and scope of the advisory and sub-advisory services provided to OWNS and information regarding the experience, qualifications, and adequacy of the personnel providing those services, |
| | • | | the investment program used by CCM to manage OWNS, |
| | • | | the investment performance of OWNS, |
| | • | | possible fall-out benefits and potential conflicts of interest, |
| | • | | the compliance functions of the Adviser and CCM, and |
| | • | | the financial resources of the Adviser and CCM. |
In addition to considering OWNS’ investment performance, the Independent Trustees considered, among other matters, the general oversight of the Trust by the Adviser, and also took into account information provided at the meeting and prior meetings concerning the investment processes used by CCM in managing OWNS.
The Independent Trustees considered, among other matters, that the Adviser provides the Trust with office space and personnel. The Independent Trustees also took into account the Adviser’s and CCM’s compliance and operational functions, as well as the resources being devoted by each of the Adviser and CCM to such functions.
56
Impact Shares Trust I
Board Considerations in Approving the Continuation of the Investment
Advisory Agreement
June 30, 2023 (Unaudited)
The Independent Trustees noted that the Adviser’s current expenses had outpaced revenues during the reporting period. The Independent Trustees considered the Adviser’s statements that it has drawn down the full amount under its operating capital loan from the Rockefeller Foundation and the Adviser’s anticipated proposal to reorganize OWNS. The Independent Trustees also noted CCM’s financial resources and financial performance history.
The Independent Trustees concluded, within the context of the Independent Trustees’ overall conclusions regarding the Agreements, that: (i) the scope of the services provided to OWNS under the Agreements was consistent with OWNS’ operational requirements; (ii) that each of the Adviser and CCM has the capabilities, resources, and personnel necessary to provide the advisory services required by OWNS; and (iii) overall, the nature, extent, and quality of the services provided by the Adviser and CCM to OWNS were sufficient to warrant approval of the Agreements for an additional one-year term.
The Independent Trustees considered that OWNS has outperformed its benchmark, returning -9.89% compared to -10.23% since the inception in July 2021. The Independent Trustees also considered that OWNS has outperformed each of the Lipper US Mortgage Funds Classification and the Morningstar Intermediate Government Category for the one-year period ended February 28, 2023. The Independent Trustees concluded, within the context of their overall conclusions regarding the Agreements, that the performance history for OWNS supported the approval of the Agreements.
The Independent Trustees considered the cost of services provided by the Adviser and CCM. The Independent Trustees recognized that the Adviser should, in the abstract, be entitled to earn a reasonable level of profit for the services provided and to be provided to OWNS, and that it is difficult to make comparisons of profitability from advisory contracts because comparative information is not generally available and is affected by numerous factors, including the structure of the particular adviser, the types and sizes of funds it manages, its business mix, numerous assumptions about cost allocations and the adviser’s capital structure and cost of capital.
The Independent Trustees considered the compensation payable by the Adviser to CCM for sub-advisory services for OWNS, including the portion of the contractual fee rate retained by the Adviser. The Independent Trustees also considered information provided at a prior meeting regarding the fees charged by the Sub-Adviser relative to the fees charged by the Sub-Adviser to another client.
The Independent Trustees considered that the Adviser is a Section 501(c)(3) nonprofit organization under the U.S. Internal Revenue Code of 1986, as amended, and considered that the Adviser expected to utilize any net profits from OWNS to fund operating costs associated with the continued growth of OWNS. The Independent Trustees noted that the Adviser’s expenses currently exceed revenues and that, based on the Adviser’s projections, it was unlikely that the fees paid to the Adviser by OWNS would significantly exceed the Adviser’s cost of providing services to OWNS in the near term. Further the Independent Trustees concluded that, even if any said excess were to be analyzed as though said excess were profit to the Adviser, the expected “profitability” was not excessive and supported the approval of the Agreements for an additional one-year term.
The Independent Trustees considered the advisory fee paid by OWNS to the Adviser, as well as OWNS’ distribution and service (Rule 12b-1) plan, “other expenses” and total expenses. The Independent
57
Impact Shares Trust I
Board Considerations in Approving the Continuation of the Investment
Advisory Agreement
June 30, 2023 (Unaudited)
Trustees considered that CCM had entered into an expense limitation agreement with OWNS pursuant to which it will pay or reimburse OWNS for any expenses in excess of 0.30% of average net assets, subject to certain exceptions set forth in the expense limitation agreement. The Independent Trustees also considered information provided by the Adviser at a prior meeting comparing the projected expenses of OWNS relative to those of other exchange traded funds that invest in mortgage-backed securities and noted that there are no proposed changes to the advisory fee or expense limitation agreement.
Based on this and other information, the Independent Trustees concluded, within the context of their overall conclusions regarding the Agreements, that the fees charged represented reasonable compensation to the Adviser in light of the services provided and to be provided to OWNS.
The Independent Trustees considered information provided at a prior meeting regarding the direct and indirect benefits to each of the Adviser and CCM from its relationship with OWNS, including reputational and other “fall out” benefits. The Independent Trustees considered the receipt of these benefits in light of the Adviser’s “profitability,” and concluded that these benefits were not excessive.
The Independent Trustees considered the extent to which the Adviser or CCM may realize economies of scale or other efficiencies in managing and supporting OWNS. The Independent Trustees considered that OWNS did not have any breakpoints in its fee arrangement with the Adviser or the Adviser’s fee arrangement with CCM. The Independent Trustees concluded that OWNS’ overall fee arrangements represent an appropriate sharing at the present time between OWNS shareholders and the Adviser of any economies of scale or other efficiencies in the management of OWNS at current asset levels.
In the Trustees’ deliberations, the Trustees did not identify any particular information that was all-important or controlling, and each Trustee may have attributed different weights to the various factors. Based on the factors described above, the Independent Trustees concluded that the approval of the Agreements for an additional one-year term was in the best interests of OWNS and should be approved.
Board Considerations in Approving a New Investment Advisory Agreement and Amendment to the Current Investment Advisory Agreement (Impact Shares NAACP Minority Empowerment ETF and Impact Shares YWCA Women’s Empowerment ETF)
At a meeting held on June 12, 2023 with respect to Impact Shares NAACP Minority Empowerment ETF (“NACP”) and Impact Shares YWCA Women’s Empowerment ETF (“WOMN “) (each an “Equity Fund” and together the “Equity Funds”), the trustees (collectively, the “Trustees” or the “Board”) of Impact Shares Trust I (the “Trust”), including the Trustees who are not “interested persons” (as such term is defined in Section 2(a)(19) of the 1940 Act) of the Trust (such Trustees, the “Independent Trustees”), met to consider the approval of the Toroso Advisory Agreement between the Trust and Toroso Investments, LLC pursuant to which Toroso would be engaged to provide advisory services to WOMN and NACP (each an “Equity Fund” and together the “Equity Funds”) and the ISC Advisory Amendment pursuant to which ISC would serve as a sub-adviser to each Equity Fund and Toroso would be added as a party. The Toroso Advisory Agreement and the ISC Advisory Amendment (together, the “New Investment Advisory Arrangements”). The following summarizes the Trustees’ process of requesting and evaluating the information they believed to be reasonably necessary to determine whether to approve the continuation of the Investment Advisory Agreement.
58
Impact Shares Trust I
Board Considerations in Approving the Continuation of the Investment
Advisory Agreement
June 30, 2023 (Unaudited)
In considering the New Investment Advisory Arrangements, the Independent Trustees evaluated the nature, extent and quality of the advisory services to be provided to the Equity Funds by Toroso and ISC. They considered the terms of the New Investment Advisory Arrangements and received and considered information provided by management that described, among other matters:
| | • | | the nature and scope of the advisory and sub-advisory services to be provided to each Equity Fund and information regarding the number, experience, qualifications and adequacy of the personnel providing those services, |
| | • | | the investment program to be used by Toroso and ISC to manage the Equity Fund, |
| | • | | possible fall-out benefits and potential conflicts of interest, |
| | • | | anticipated brokerage practices, |
| | • | | the compliance functions of Toroso and ISC, and |
| | • | | the financial resources of Toroso and ISC. |
They also took into account information concerning the investment processes to be used by Toroso and ISC in managing the Equity Funds. The Independent Trustees considered, among other matters, that Toroso will provide the Trust with office space and personnel, and, under the unitary-fee structure set forth in the Toroso Advisory Agreement, Toroso is responsible for bearing all of each Equity Fund’s expenses, including the costs of transfer agency, custody, fund administration, legal, audit, and other services provided to each Equity Fund, with certain noted exceptions. They also took into account the compliance and operational functions of Toroso and ISC, as well as the resources being devoted by each to such functions.
The Independent Trustees considered Toroso’s financial resources. The Independent Trustees also noted that ISC had limited personnel and financial resources and considered that Toroso intended to financially support operating shortfalls for both Equity Funds, inclusive of marketing expenses, through at least April of 2024 assuming both moderate asset growth for the Equity Funds and approval by the Trustees and shareholders of the increase in the unitary management fee under the Toroso Advisory Agreement.
The Independent Trustees concluded, within the context of their overall conclusions regarding the New Investment Advisory Arrangements, that the scope of the services to be provided to the Equity Fund under the New Investment Advisory Arrangements was consistent with each Equity Fund’s operational requirements; that each of Toroso and ISC has the capabilities, resources and personnel necessary to provide the advisory services required by each Equity Fund; and that, overall, the nature, extent and quality of the services to be provided by Toroso and ISC to each Equity Fund were sufficient to warrant approval of the New Investment Advisory Arrangements.
The Independent Trustees considered that each Equity Fund seeks investment results that, before fees and expenses, track the performance of its respective underlying index and each Equity Fund’s performance was within an acceptable level of its underlying index. The Independent Trustees also considered that with ISC as adviser, each Equity Fund experienced performance for the three-year period ended March 31, 2023, that was above the median for that Equity Fund’s Morningstar category, with WOMN ranking in the first quartile of its Morningstar category and NAACP ranking in the second
59
Impact Shares Trust I
Board Considerations in Approving the Continuation of the Investment
Advisory Agreement
June 30, 2023 (Unaudited)
quartile of its Morningstar category. The Independent Trustees considered that under the New Investment Advisory Arrangements, ISC, as sub-adviser, would continue to provide the day-to-day portfolio management of each Equity Fund.
The Independent Trustees concluded, within the context of the Independent Trustees’ overall conclusions regarding New Investment Advisory Arrangements, that the performance history for each Equity Fund supported approval of the New Investment Advisory Arrangements.
The Independent Trustees considered the cost of services provided and to be provided by Toroso and ISC and the impact of the proposals on the anticipated profitability to Toroso and ISC of their arrangements with the Equity Funds.
The Independent Trustees recognized that Toroso should, in the abstract, be entitled to earn a reasonable level of profit for the services provided and to be provided to each Equity Fund, and that it is difficult to make comparisons of profitability from advisory contracts because comparative information is not generally available and is affected by numerous factors, including the structure of the particular adviser, the types and sizes of funds it manages, its business mix, numerous assumptions about cost allocations and Toroso’s capital structure and cost of capital.
The Independent Trustees also considered the compensation payable by Toroso to ISC for sub-advisory services with respect to each Equity Fund, including the portion of the contractual fee rate that is to be retained by Toroso.
The Independent Trustees also considered that ISC, unlike Toroso, is a 501(c)(3) nonprofit and that ISC expects to utilize any net profits from the Equity Funds to first to repay the outstanding accounts payable, second to pay any of its own operating expenses and finally, if there are sufficient funds available, to make a charitable contribution to its impact partners. The Independent Trustees considered it was unlikely that the fees paid to ISC with respect to an Equity Fund would significantly exceed the ISC’s cost of providing services to that Equity Fund in the near term, and concluded that, even if any such excess were to be analyzed as though it were profit to ISC, the expected “profitability” was not excessive and supported the approval of the New Investment Advisory Arrangements.
The Independent Trustees considered the unitary management fee paid by each Equity Fund to Toroso, as well as each Equity Fund’s distribution and service (Rule 12b-1) plan, “other expenses” and total expenses. In doing so, the Independent Trustees reviewed information provided by ISC comparing the unitary management fee of each Equity Fund (current and as proposed under the Toroso Advisory Agreement) to the advisory or unitary fee and expense ratio of those mission aligned comparable ETFs in a universe constructed by Morningstar Direct. Based on this and other information, the Independent Trustees concluded, within the context of their overall conclusions regarding the Investment Advisory Agreements, that the fees to be charged represented reasonable compensation to Toroso in light of the services provided and to be provided to the Equity Funds.
The Independent Trustees considered information regarding the direct and indirect benefits to each of Toroso and ISC from its relationship with the Equity Funds, including reputational and other “fall out”
60
Impact Shares Trust I
Board Considerations in Approving the Continuation of the Investment
Advisory Agreement
June 30, 2023 (Unaudited)
benefits. The Independent Trustees considered the receipt of these benefits in light of Toroso’s and ISC’s estimated profitability, and concluded that such benefits were not excessive.
The Independent Trustees considered the extent to which Toroso and ISC may realize economies of scale or other efficiencies in managing and supporting the Equity Fund. The Independent Trustees considered that the Equity Fund did not have any breakpoints in its fee arrangement with Toroso or Toroso’s fee arrangement with ISC. The Independent Trustees concluded that each Equity Fund’s overall fee arrangements represent an appropriate sharing at the present time between Equity Fund shareholders and Toroso of any economies of scale or other efficiencies in the management of the Equity Fund.
Based on the factors described above, the Independent Trustees concluded that the approval of the New Investment Advisory Arrangements was in the best interests of each Equity Fund.
61
Impact Shares Trust I
Review of Liquidity Risk Management Program
June 30, 2023 (Unaudited)
In compliance with Rule 22e-4 under the Investment Company Act of 1940, as amended (the “Liquidity Rule”), Impact Shares Trust I (the “Trust”) has adopted and implemented a liquidity risk management program (the “Program”) for the Impact Shares NAACP Minority Empowerment ETF, the Impact Shares YWCA Women’s Empowerment ETF, and the Impact Shares Affordable Housing MBS ETF (each a “Fund,” and, collectively, the “Funds”) , each a series of the Trust, which is reasonably designed to assess and manage each Fund’s liquidity risk.
The Board of Directors (the “Board”) of the Trust, on behalf of the Funds, met on November 10, 2022 (the “Meeting”) to review the Program. The Board previously appointed Impact Shares Corp (“Impact Shares”), the investment adviser to the Funds, as the program administrator for each Fund’s Program. Impact Shares also previously delegated oversight of the Program to the Liquidity Risk Management Committee (the “Committee”), whose members are Mr. Ethan Powell and Mr. Donald Guiney. The Committee, on behalf of Impact Shares, has provided the Board with a report that addressed the operation of the Program and assessed its adequacy and effectiveness of implementation, and any material changes to the Program (the “Report”).
The Report covered the period from the implementation of the Program on November 10, 2021 through November 10, 2022 (the “Program Reporting Period”).
The Report noted that all of the Funds’ investments consisted of highly liquid publicly-traded equities and, in the case of the Impact Shares Affordable Housing MBS ETF, liquid agency MBS. The Report also discussed notable events affecting liquidity over the Program Reporting Period.
The Committee summarized the relevant provisions of the Program applicable to the Funds and reported that during the Program Reporting Period, the Committee had not become aware of the existence of any liquidity events that impacted any of the Funds or their ability to timely meet redemptions without dilution to existing shareholders. The Committee further reported that there had been no material changes to the Program during the Program Reporting Period.
62
Impact Shares Trust I
Notice to Shareholders
June 30, 2023 (Unaudited)
For shareholders that do not have a June 30, 2023 tax year end, this notice is for informational purposes only. For shareholders with a June 30, 2023 tax year end, please consult your tax advisor as to the pertinence of this notice. For the fiscal year ended June 30, 2023, the Funds are designating the following items with regard to distributions paid during the year.
| | | | | | | | | | | | | | | | | | | | | | | | | | | | | | | | | | | | | | | | |
| | | Return of
Capital | | | Long Term
Capital Gain
Distributions | | | Ordinary
Income
Distributions | | | Total Distributions | | | Dividends.
Qualifying for
Corporate
Dividend
Receivable
Deduction (1) | | | Qualifying
Dividend
Income (2) | | | US.
Govemment
Interest (3) | | | Interest
Relsted
Dividends (4) | | | Qualified
Short
Term
Capital
Gain(5) | | | Qualifying
Business
Income (6) | |
Impact shares YWCA Women’s Empowerment ETF | | | 0.00 | % | | | 52.46 | % | | | 47.54 | % | | | 100.00 | % | | | 58.63 | % | | | 50.63 | % | | | 0.00 | % | | | 0.00 | % | | | 100.00 | % | | | 0.59 | % |
Impact Shares NAACP Minority Empowerment ETF | | | 0.00 | % | | | 32.95 | % | | | 67.05 | % | | | 100.00 | % | | | 85.60 | % | | | 86.28 | % | | | 0.00 | % | | | 0.00 | % | | | 100.00 | % | | | 1.18 | % |
Impact Shares Affordable Housing MBS ETF | | | 0.00 | % | | | 0.00 | % | | | 100.00 | % | | | 100.00 | % | | | 0.00 | % | | | 0.00 | % | | | 0.00 | % | | | 94.68 | % | | | 0.00 | % | | | 0.00 | % |
Impact Shares Sustainable Development Goals Global Equity ETF* | | | 0.00 | % | | | 63.38 | % | | | 36.62 | % | | | 100.00 | % | | | 38.18 | % | | | 88.28 | % | | | 0.00 | % | | | 0.00 | % | | | 100.00 | % | | | 0.06 | % |
| (1) | Qualifying dividends represent dividends which qualify for the corporate dividends received deduction and is reflected as a percentage of ordinary income distributions (the total of short term capital gain and net investment income distributions). |
| (2) | The percentage in this column represents the amount of “Qualifying Dividend Income” as created by the Jobs and Growth Tax Relief Reconciliation Act of 2003 and is reflected as a percentage of ordinary income distributions (the total of short term capital gain and net investment income distributions). It is the intention of each of the aforementioned funds to designate the maximum amount permitted by law. |
| (3) | “U.S. Government Interest” represents the amount of interest that was derived from U.S. Government obligations and distributed during the fiscal year. This amount is reflected as a percentage of total ordinary income distributions (the total of short term capital gain and net investment income distributions). Generally, interest from direct U.S. Government obligations is exempt from state income tax. However, for shareholders who are residents of California, Connecticut and New York, the statutory threshold requirements were not satisfied to permit exemption of these amounts from state income. |
| (4) | The percentage in this column represents the amount of “Interest Related Dividend” is reflected as a percentage of ordinary income distribution. Interest related dividends are exempted from U.S. withholding tax when paid to foreign investors. |
| (5) | The percentage in this column represents the amount of “Qualifying Short-Term Capital Gain” as created by the American Jobs Creation Act of 2004 and is reflected as a percentage of short-term capital gain distributions that is exempt from U.S. withholding tax when paid to foreign investors. |
| (6) | The percentage of this column represents that amount of ordinary dividend income that qualified for 20% Business Income Deduction. |
| * | Information presented through fund liquidation date. |
The information reported herein may differ from the information and distributions taxable to the shareholders for the tax year ending June 30, 2023. Complete information will be computed and reported in conjunction with your 2023 Form 1099-DIV.
63
Impact Shares Trust I
Supplemental Information (Unaudited)
Net asset value, or “NAV”, is the price per Share at which the Funds issue and redeem Shares. It is calculated in accordance with the standard formula for valuing mutual fund shares. The “Market Price” of the Funds generally is determined using the midpoint between the highest bid and the lowest offer on the stock exchange on which the Shares of the Funds are listed for trading, as of the time that the Fund’s NAV is calculated. The Funds’ Market Price may be at, above or below their NAV. The NAV of the Funds will fluctuate with changes in the market value of the Funds’ holdings. The Market Price of the Funds will fluctuate in accordance with changes in their NAV, as well as market supply and demand.
Premiums or discounts are the differences (expressed as a percentage) between the NAV and Market Price of the Funds on a given day, generally at the time NAV is calculated. A premium is the amount that the Funds are trading above the reported NAV, expressed as a percentage of the NAV. A discount is the amount that the Funds are trading below the reported NAV, expressed as a percentage of the NAV.
Further information regarding premiums and discounts is available on the Funds’ website at www.impactetfs.org.
64
Impact Shares Trust I
Additional Information (Unaudited)
Ernst & Young, LLP (“EY”) resigned as the independent registered public accounting firm on May 26, 2023. EY’s report on the financial statements of Impact Shares Trust I for the fiscal periods ended June 30, 2022, did not contain an adverse opinion or disclaimer of opinion, and was not qualified or modified as to uncertainty, audit scope or accounting principles. There have been no disagreements with EY on any matter of accounting principles or practices, financial statement disclosure, or auditing scope or procedure, which, if not resolved to the satisfaction of EY, would have caused EY to make reference to the subject matter of the disagreement in connection with its report on the financial statements. In addition, there have been no reportable events of the kind described in Item 304(a)(1)(v) of Regulation S-K under the Securities Exchange Act of 1934.
Cohen & Company, Ltd. (“Cohen”) serves as the Trust’s independent registered public accounting firm for the fiscal year ended June 30, 2023.
65
[THIS PAGE INTENTIONALLY LEFT BLANK]
[THIS PAGE INTENTIONALLY LEFT BLANK]
[THIS PAGE INTENTIONALLY LEFT BLANK]
[THIS PAGE INTENTIONALLY LEFT BLANK]

2189 Broken Bend
Frisco, Texas 75034
844-448-3383
www.impactetfs.org
Investment Adviser:
Impact Shares, Corp.
2189 Broken Bend
Frisco, Texas 75034
Distributor:
SEI Investments Distribution Co.
One Freedom Valley Drive
Oaks, PA 19456
Administrator:
SEI Investments
Global Funds Services
One Freedom Valley Drive
Oaks, PA 19456
Transfer Agent:
Bank of New York Mellon
225 Liberty Street
New York, NY 10286
Custodian:
Bank of New York Mellon
225 Liberty Street
New York, NY 10286
Legal Counsel:
Ropes & Gray LLP
Prudential Tower, 800 Boylston Street
Boston, MA 02199-3600
This information must be preceded or accompanied by a current prospectus for the Funds.
IMP-AR-001-0500
Item 2. Code of Ethics.
The Registrant has adopted a code of ethics that applies to the Registrant’s principal executive officer, principal financial officer, controller, or principal accounting officer, and any person who performs a similar function. There have been no amendments to or waivers granted to this code of ethics during the past fiscal year.
Item 3. Audit Committee Financial Expert.
(a)(1) The Fund’s Audit Committee currently does not have an Audit Committee Financial Expert.
(a)(2) Not applicable.
(a)(3) At this time, the Registrant believes that the collective experience provided by the members of the Audit Committee together offer the Registrant adequate oversight for the Registrant’s level of financial complexity.
Item 4. Principal Accountant Fees and Services.
Fees billed by Cohen & Company, Ltd (“Cohen”) Related to the Trust.
Cohen billed the Trust aggregate fees for services rendered to the Trust for the 2023 fiscal year as follows:
| | | | | | | | |
| | | | | 2023 |
| | | | | All fees and
services to the
Trust that were
pre-approved | | All fees and
services to
service
affiliates that
were pre-
approved | | All other fees
and services
to service
affiliates that
did not
require pre-
approval |
| (a) | | Audit
Fees(1) | | $43,000 | | N/A | | N/A |
| (b) | | Audit-
Related
Fees | | N/A | | N/A | | N/A |
| (c) | | Tax
Fees(2) | | $9,000 | | N/A | | N/A |
| (d) | | All
Other
Fees | | N/A | | N/A | | N/A |
2
Fees billed by Ernst & Young (“EY”) Related to the Trust.
EY billed the Trust aggregate fees for services rendered to the Trust for the 2022 fiscal year as follows:
| | | | | | | | |
| | | 2022 |
| | | | | All fees and
services to
the Trust that
were pre-
approved | | All fees and
services to
service
affiliates that
were pre-
approved | | All other fees
and services
to service
affiliates that
did not
require pre-
approval |
(a) | | Audit
Fees(1) | | $102,000 | | N/A | | N/A |
(b) | | Audit-
Related
Fees | | N/A | | N/A | | N/A |
(c) | | Tax
Fees(2) | | $26,000 | | N/A | | N/A |
(d) | | All
Other
Fees | | N/A | | N/A | | N/A |
Notes:
| | (1) | Audit fees include amounts related to the audit of the Registrant’s annual financial statements and services normally provided by the accountant in connection with statutory and regulatory filings. |
| | (2) | “Tax Fees” are the aggregate fees billed for professional services for tax advice, tax compliance, and tax planning. These fees include federal, state, and excise tax reviews. |
(e)(1) Not Applicable.
(e)(2) Percentage of fees billed by Cohen applicable to non-audit services approved pursuant to the “de minimis” exception of Rule 2-01(c)(7)(i)(C) were as follows:
| | | | |
| | | 2023 | | |
| Audit-Related Fees | | N/A | | |
| Tax Fees | | N/A | | |
| All Other Fees | | N/A | | |
3
(e)(2) Percentage of fees billed by EY applicable to non-audit services approved pursuant to the “de minimis” exception of Rule 2-01(c)(7)(i)(C) were as follows:
| | | | |
| | | 2022 | | |
| Audit-Related Fees | | N/A | | |
| Tax Fees | | N/A | | |
| All Other Fees | | N/A | | |
(f) Not applicable.
(g) The aggregate non-audit fees and services billed by Cohen for services rendered to the Registrant, and rendered to the Registrant’s investment adviser (not including any sub-adviser whose role is primarily portfolio management and is subcontracted with or overseen by another investment adviser), and any entity controlling, controlled by, or under common control with the adviser that provides ongoing services to the Registrant for the 2023 fiscal year was $9,000. The aggregate non-audit fees and services billed by EY for services rendered to the Registrant, and rendered to the Registrant’s investment adviser (not including any sub-adviser whose role is primarily portfolio management and is subcontracted with or overseen by another investment adviser), and any entity controlling, controlled by, or under common control with the adviser that provides ongoing services to the Registrant for the 2022 fiscal year was $26,000.
(h) During the past fiscal year, all non-audit services provided by the Registrant’s principal accountant either to the Registrant’s investment adviser or to any entity controlling, controlled by, or under common control with the Registrant’s investment adviser that provides ongoing services to the Registrant were pre-approved by the audit committee of the Registrant’s Board of Trustees. Included in the audit committee’s pre-approval was the review and consideration as to whether the provision of these non-audit services is compatible with maintaining the principal accountant’s independence.
(i) Not applicable.
(j) Not applicable.
Item 5. Audit Committee of Listed Registrants.
Not applicable to open-end management investment companies.
Item 6. Schedule of Investments.
The Schedule of Investments is included as part of the Report to Shareholders filed under Item 1 of this form.
Item 7. Disclosure of Proxy Voting Policies and Procedures for Closed-End Management Investment Companies.
Not applicable to open-end management investment companies.
Item 8. Portfolio Managers of Closed-End Management Investment Companies.
Not applicable to open-end management investment companies.
4
Item 9. Purchases of Equity Securities by Closed-End Management Company and Affiliated Purchasers.
Not applicable to open-end management investment companies.
Item 10. Submission of Matters to a Vote of Security Holders.
There have been no changes to the procedures by which shareholders may recommend nominees to the Registrant’s Board of Trustees during the period covered by this report.
Item 11. Controls and Procedures.
(a) The Registrant’s principal executive and principal financial officers, or persons performing similar functions, have concluded that the Registrant’s disclosure controls and procedures (as defined in Rule 30a-3(c) under the Act (17 CFR § 270.30a-3(c)) as of a date within 90 days of the filing date of the report, are effective based on the evaluation of these controls and procedures required by Rule 30a-3(b) under the Act (17 CFR § 270.30a-3(b)) and Rules 13a-15(b) or 15d-15(b) under the Exchange Act (17 CFR § 240.13a-15(b) or § 240.15d-15(b)).
(b) There has been no change in the Registrant’s internal control over financial reporting (as defined in Rule 30a-3(d) under the Act (17 CFR § 270.30a-3(d)) that occurred during the period covered by this report that has materially affected, or is reasonably likely to materially affect, the Registrant’s internal control over financial reporting.
Item 12. Disclosure of Securities Lending Activities for the Closed-End Management Investment Companies.
Not applicable to open-end management investment companies.
Item 13. Exhibits.
(a)(1) A copy of the Registrant’s Code of Ethics, as required by Item 2 of this Form, accompanies this filing as an exhibit.
(a)(2) A separate certification for the principal executive officer and the principal financial officer of the Registrant as required by Rule 30a-2(a) under the Investment Company Act of 1940, as amended (17 CFR § 270.30a-2(a)), are filed herewith.
(a)(3) Not applicable to open-end investment companies.
(a)(4) There was a change in the registrant’s independent public accountant (Exhibit attached).
(b) Officer certifications as required by Rule 30a-2(b) under the Investment Company Act of 1940, as amended (17 CFR § 270.30a-2(b)) also accompany this filing as an exhibit.
5
SIGNATURES
Pursuant to the requirements of the Securities Exchange Act of 1934 and the Investment Company Act of 1940, the Registrant has duly caused this report to be signed on its behalf by the undersigned, thereunto duly authorized.
| | | | | | | | |
| (Registrant) | | | | Impact Shares Trust I |
| | | |
| By | | (Signature and Title) | | | | /s/ Ethan Powell |
| | | | | | Ethan Powell, President, Principal |
| | | | | | Executive Officer, Treasurer, and |
| | | | | | Principal Financial Officer |
Date: September 8, 2023
Pursuant to the requirements of the Securities Exchange Act of 1934 and the Investment Company Act of 1940, this report has been signed below by the following persons on behalf of the Registrant and in the capacities and on the dates indicated.
| | | | | | | | |
| | | |
| By | | (Signature and Title) | | | | /s/ Ethan Powell |
| | | | | | Ethan Powell, President and Principal |
| | | | | | Executive Officer |
Date: September 8, 2023
| | | | | | | | |
| By | | (Signature and Title) | | | | /s/ Ethan Powell |
| | | | | | Ethan Powell, Treasurer and |
| | | | | | Principal Financial Officer |
Date: September 8, 2023
6