UNITED STATES
SECURITIES AND EXCHANGE COMMISSION
Washington, D.C. 20549
FORM N-CSR
CERTIFIED SHAREHOLDER REPORT OF REGISTERED
MANAGEMENT INVESTMENT COMPANIES
Investment Company Act file number: 811-23308
PPM Funds
(Exact name of registrant as specified in charter)
225 West Wacker Drive, Suite 1200, Chicago, Illinois 60606
(Address of principal executive offices)
225 West Wacker Drive, Suite 1200, Chicago, Illinois 60606
(Mailing address)
Andrew Tedeschi
PPM Funds
225 West Wacker Drive, Suite 1200
Chicago, Illinois 60606
(Name and address of agent for service)
Registrant’s telephone number, including area code: (312) 338-5800
Date of Fiscal Year End: December 31
Date of Reporting Period: December 31, 2020
Form N-CSR is to be used by management investment companies to file reports with the Commission not later than 10 days after the transmission to stockholders of any report that is required to be transmitted to stockholders under Rule 30e-1 under the Investment Company Act of 1940 (17 CFR 270.30e-1). The Commission may use the information provided on Form N-CSR in its regulatory, disclosure review, inspection, and policymaking roles.
A registrant is required to disclose the information specified by Form N-CSR, and the Commission will make this information public. A registrant is not required to respond to the collection of information contained in Form N-CSR unless the Form displays a currently valid Office of Management and Budget (“OMB”) control number. Please direct comments concerning the accuracy of the information collection burden estimate and any suggestions for reducing the burden to Secretary, Securities and Exchange Commission, 450 Fifth Street, NW, Washington, DC 20549-0609. The OMB has reviewed this collection of information under the clearance requirements of 44 U.S.C. §3507.
Item 1. | Report to Shareholders. |
PPMFunds
December 31, 2020
PPM Funds including: PPM Core Plus Fixed Income Fund (PKPIX), PPM High Yield Core Fund (PKHIX) and PPM Small Cap Value Fund (PZSIX)
PPM Funds Approval of the Trust’s Investment Advisory and Sub-Advisory Agreements |
PPM Funds Supplements to Prospectus
PPMFunds | PPM Core Plus Fixed Income Fund (Unaudited) |
PPM Core Plus Fixed Income Fund
Total Return* |
| |||||
Institutional Class† |
|
|
|
| ||
1 Year | 9.98 | % | ||||
Since Inception | 8.27 | % |
| |||
†Inception date July 16, 2018 |
| |||||
*The Fund's investment adviser waived/reimbursed certain expenses of the Fund. Performance results shown reflect the waiver, without which performance results would have been lower. |
|
The graph shows the change in value of an assumed $10,000 investment in the Fund's Institutional Class shares over 10 years, or since inception if the inception is less than 10 years, as well as the Fund's benchmark(s) performance for the same period.
Past performance is not predictive of future performance. Investment return and principal value will fluctuate so that an investor’s shares, when redeemed, may be worth more or less than their original cost. Performance numbers are net of all Fund operating expenses.
Composition as of December 31, 2020: | ||
Corporate Bonds and Notes | 48.5 | % |
Government and Agency Obligations | 36.9 | |
Non-US Government Agency ABS | 7.2 | |
Senior Loan Interests | 1.1 | |
Common Stocks | 0.0 | |
Short Term Investments | 6.3 | |
Total Investments | 100.0 | % |
For the year ended December 31, 2020, PPM Core Plus Fixed Income Fund outperformed its primary benchmark by posting a return of 9.98% for Institutional Class shares compared to 7.51% for the Bloomberg Barclays U.S. Aggregate Bond Index.
The Fund’s security selection and positioning in US corporate bonds, both investment grade and high yield, as well as mortgage backed securities (“MBS”), drove the outperformance. Positioning in commercial mortgage backed securities (“CMBS”) modestly detracted as CMBS underperformed other asset classes. Cash holdings also modestly detracted, as risk assets gained over the year. Within corporate bonds, security selection and the resulting overweight positions in consumer cyclical and banking positively contributed to performance, while holdings in real estate investment trust and in a subcategory of financials (the “financial – other”) modestly detracted.
The investment objective of the Fund is to seek to realize maximum total return, consistent with the preservation of capital and prudent investment management. The Fund invests at least 80% of its assets in a diversified portfolio of debt securities of US and foreign issuers. We seek to consistently add value by making investment decisions based on our view of longer term trends and non-economic factors that may affect interest rates. We also consider quantitative and qualitative factors, such as economic and market factors, in terms of how they could impact an individual company or a specific sector.
Relative to the benchmark on December 31, 2020, the Fund held an underweight position in US Treasuries and overweight positions in investment grade corporate bonds, asset backed securities (“ABS”), CMBS and MBS, as well as an out of index position in high yield bonds. The Fund entered 2020 with a smaller investment grade corporate bond position but increased that position as corporate sector valuations widened early in the year.
It is important to remember the market is likely to enter 2021 with many risks. Our largest exposure at year end was in investment grade corporate bonds, but investment grade valuations have already tightened and peer analysis shows investors are already long, reducing the pool of marginal buyers. COVID-19 is still rampant, and we believe the market has become complacent in relying on current vaccine efforts to work in the timeframe the market expects.
2
PPMFunds | PPM High Yield Core Fund (Unaudited) |
PPM High Yield Core Fund
Total Return* |
| |||||
Institutional Class† |
|
|
|
| ||
1 Year | 5.34 | % | ||||
Since Inception | 5.99 | % |
| |||
†Inception date July 16, 2018 |
| |||||
*The Fund's investment adviser waived/reimbursed certain expenses of the Fund. Performance results shown reflect the waiver, without which performance results would have been lower. |
|
The graph shows the change in value of an assumed $10,000 investment in the Fund's Institutional Class shares over 10 years, or since inception if the inception is less than 10 years, as well as the Fund's benchmark(s) performance for the same period.
Past performance is not predictive of future performance. Investment return and principal value will fluctuate so that an investor’s shares, when redeemed, may be worth more or less than their original cost. Performance numbers are net of all Fund operating expenses.
Composition as of December 31, 2020: | ||
Corporate Bonds and Notes | 93.0 | % |
Senior Loan Interests | 2.3 | |
Investment Companies | 1.1 | |
Preferred Stocks | 0.2 | |
Common Stocks | 0.1 | |
Warrants | 0.1 | |
Non-US Government Agency ABS | 0.0 | |
Short Term Investments | 3.2 | |
Total Investments | 100.0 | % |
For the year ended December 31, 2020, PPM High Yield Core Fund underperformed its primary benchmark by posting a return of 5.34% for Institutional Class shares compared to 6.07% for the ICE BofA US High Yield Constrained Index.
Allocations to and positioning in high yield and investment grade corporate bonds positively contributed to performance, while allocations to floating rate bank loans and US Treasury interest rate futures used to manage duration detracted. The US Treasury hedges detracted as Treasuries rallied during 2020 due to the pandemic, economic shutdown and US Federal Reserve rate cuts. Within high yield corporate bonds, security selection in communications and an underweight to energy positively contributed, the latter benefitting from the sharp selloff in oil and natural gas prices during the first quarter of 2020 due to significantly reduced demand. Security selection in leisure and capital goods detracted from performance.
The investment objective of the Fund is to maximize current income. As a secondary objective, the Fund seeks capital appreciation. The Fund seeks to identify the best relative value investment opportunities across various debt sectors by analyzing overall economic conditions and identifying companies we believe have the highest potential for improving credit fundamentals. The Fund primarily invests in high yield, high risk debt securities. The Fund has flexibility to invest in bank loans, equities and foreign issuers.
Relative to the benchmark on December 31, 2020, the Fund’s largest overweight positions within high yield bonds were in media, energy and financial services. PPM believes investments in both media and energy allow the Fund to participate in a cyclical recovery. Energy, which moved from an underweight to an overweight position during the year, also could benefit from mergers and acquisitions and has a high proportion of fallen angels, which we feel offers attractive relative value. We believe a steeper interest rate curve and economic recovery will be positive for financial services. The largest underweight positions on December 31, 2020, were in real estate and utilities, two noncyclical sectors, as well as information technology and electronics.
The risks to the high yield bond market in 2021 center on the speed of delivering and efficacy of COVID-19 vaccines and by extension the pace of economic recovery. Credit market valuations are a risk due to lower starting spread levels and overall modest absolute yields. In our opinion, the economic recovery could be choppy with periodic setbacks.
3
PPMFunds | PPM Small Cap Value Fund (Unaudited) |
PPM Small Cap Value Fund
Total Return* |
| |||||
Institutional Class† |
|
|
|
| ||
1 Year | -2.26 | % | ||||
Since Inception | -0.35 | % |
| |||
†Inception date May 01, 2018 |
| |||||
*The Fund's investment adviser waived/reimbursed certain expenses of the Fund. Performance results shown reflect the waiver, without which performance results would have been lower. |
|
The graph shows the change in value of an assumed $10,000 investment in the Fund's Institutional Class shares over 10 years, or since inception if the inception is less than 10 years, as well as the Fund's benchmark(s) performance for the same period.
Past performance is not predictive of future performance. Investment return and principal value will fluctuate so that an investor’s shares, when redeemed, may be worth more or less than their original cost. Performance numbers are net of all Fund operating expenses.
Composition as of December 31, 2020: | ||
Financials | 28.5 | % |
Industrials | 17.2 | |
Consumer Discretionary | 11.8 | |
Information Technology | 10.6 | |
Real Estate | 7.9 | |
Health Care | 7.9 | |
Materials | 5.2 | |
Energy | 3.7 | |
Consumer Staples | 2.2 | |
Communication Services | 2.2 | |
Utilities | 1.5 | |
Other Short Term Investments | 1.3 | |
Total Investments | 100.0 | % |
For the year ended December 31, 2020, PPM Small Cap Value Fund underperformed its primary benchmark by posting a return of -2.26% for Institutional Class shares compared to 4.63% for the Russell 2000 Value Index.
Bottom-up security selection drives the Fund’s sector allocations and performance. Holdings in Helix Energy Solutions Group, Inc. (-86.9%), PBF Energy, Inc. (-77.1%) and Triumph Group, Inc. (-66.7%) detracted from the Fund’s relative performance. Holdings in National General Holdings Corp. (54.5%), Semtech Corp. (36.3%) and Avaya Holdings Corp. (97.6%) positively contributed to the Fund’s relative performance to the benchmark.
The investment objective of the Fund is to seek to achieve long term growth of capital. The Fund employs a value investing style that seeks to uncover investment opportunities that can be purchased at a significant discount relative to the market. The Fund invests at least 80% of its assets in a diversified portfolio of equity securities of U.S. companies with market capitalizations within the range of the S&P SmallCap 600 Index. Quantitative and qualitative factors, such as economic and market factors, are considered in terms of how they could impact an individual company or a specific sector.
The Fund’s largest overweight sectors relative to the benchmark on December 31, 2020, were information technology, health care and financials. Over the year, the position in financials moved from the Fund’s largest underweight to the current overweight position, reflecting the Fund managers’ view that cyclical sectors could outperform in 2021. The largest underweight sectors on December 31, 2020, were utilities, consumer staples and real estate, non-cyclical sectors that the Fund managers believe could underperform in 2021.
Despite a more optimistic outlook, we still see risks facing equity markets. There remains a chance for political induced volatility, as more concrete plans from the Biden Administration could unsettle investors. Additionally, a continued rotation into cyclicals, small caps and value stocks could make individual stocks and industries with excessive valuations more susceptible to selloffs. Lastly, a move higher in rates could pressure equity valuations as it would narrow the excess yield that equities currently provide over US Treasuries.
4
PPMFunds
December 31, 2020
Important Disclosures and Glossary
Before investing, investors should carefully read the prospectus and/or summary prospectus and consider the investment objectives, risk, charges and expenses. For this and more complete information about the Funds, investors may obtain a prospectus or summary prospectus by calling 1-844-446-4PPM (1-844-446-4776), by writing PPM Funds, P.O. Box 2175, Milwaukee, Wisconsin 53201-2175, or by visiting https://www.ppmamerica.com/ppmfunds/.
Mutual funds are issued by PPM America, Inc. PPM Funds are distributed by Jackson National Life Distributors LLC, member FINRA.
Certain comments in this annual report are based on current management expectations and are considered “forward-looking statements.” Actual future results, however, may prove to be different from our expectations. You can identify forward-looking statements by words such as “believe,” “may,” “will,” “anticipate” and other similar terms. We cannot promise future returns. Our opinions reflect our best judgment at the time this report is compiled, and we disclaim any obligation to update or revise forward-looking statements. Our opinions may not be relied upon as investment advice and because the investment decisions we make are based on many factors, may not be relied upon as an indication of any intent to trade. Security examples are used for representational purposes only and are not recommendations to purchase or sell securities.
The discussion of the Funds’ investments and investment strategy (including current investment themes, the portfolio managers’ research and investment process, and portfolio characteristics) represents the Funds’ investments and the views of the portfolio managers and PPM America, Inc., the Funds’ investment adviser, at the time of this report, and are subject to change without notice.
Past performance is no guarantee of future results. Current performance may be lower or higher than the performance shown. All returns reflect the reinvestment of income dividends and capital gains. You cannot invest directly in an index.
Mutual fund investing involves risk. Please see the Notes to the Financial Statements of this annual report, as well as the prospectus for more information on risks.
The Bloomberg Barclays US Aggregate Bond Index provides a broad measure of US investment grade, USD-denominated fixed rate bonds. It includes Treasuries, government-rated issues, corporate bonds, MBS, CMBS and ABS securities.
The ICE BofA US High Yield Constrained Index provides a measure of below investment grade bonds, is constructed based on the ICE BofAML US High Yield Index and imposes a 2% issuer cap. The ICE BofAML US High Yield Index provides a broad measure of below investment grade, USD-denominated fixed rate corporate debt. It includes corporate bonds with risk exposures to countries that are members of the FX-G10, Western Europe or territories of the US and Western Europe.
The Russell 2000 Value Index provides a broad, market capitalization-weighted measure of value oriented US small cap stocks. It measures the performance of companies within the Russell 2000 Index which have lower price-to-book ratios and lower forecasted growth values. The Russell 2000 Index includes the 2000 firms from the Russell 3000 Index with the smallest market capitalizations
5
PPMFunds
Schedules of Investments
December 31, 2020
Shares/Par1 | Value ($) | ||||||
PPM Core Plus Fixed Income Fund | |||||||
CORPORATE BONDS AND NOTES 51.1% | |||||||
Financials 15.5% | |||||||
AerCap Ireland Capital Designated Activity Company | |||||||
4.50%, 09/15/23 | 150,000 | 162,648 | |||||
6.50%, 07/15/25 | 50,000 | 59,771 | |||||
AIA Group Limited | |||||||
3.60%, 04/09/29 (a) | 200,000 | 225,780 | |||||
Avolon Holdings Funding Limited | |||||||
5.25%, 05/15/24 (a) | 158,000 | 171,593 | |||||
Bank of America Corporation | |||||||
6.25%, (100, 09/05/24) (b) | 75,000 | 83,217 | |||||
6.30%, (100, 03/10/26) (b) | 45,000 | 52,313 | |||||
4.00%, 01/22/25 | 46,000 | 51,371 | |||||
4.25%, 10/22/26 | 215,000 | 251,711 | |||||
3.56%, 04/23/27 | 115,000 | 129,839 | |||||
3.25%, 10/21/27 | 27,000 | 30,221 | |||||
3.59%, 07/21/28 | 150,000 | 170,261 | |||||
4.27%, 07/23/29 | 322,000 | 383,357 | |||||
2.68%, 06/19/41 | 135,000 | 140,157 | |||||
Barclays PLC | |||||||
3.56%, 09/23/35 (c) | 150,000 | 161,541 | |||||
Berkshire Hathaway Finance Corporation | |||||||
2.85%, 10/15/50 | 83,000 | 89,084 | |||||
BNP Paribas | |||||||
2.59%, 08/12/35 (a) (c) | 200,000 | 203,779 | |||||
Capital One Financial Corporation | |||||||
3.75%, 03/09/27 | 75,000 | 85,596 | |||||
Citigroup Inc. | |||||||
5.00%, (100, 09/12/24) (b) | 108,000 | 112,146 | |||||
4.45%, 09/29/27 | 76,000 | 89,485 | |||||
3.52%, 10/27/28 | 131,000 | 147,917 | |||||
Credit Suisse Group AG | |||||||
5.25%, (100, 02/11/27) (a) (b) | 200,000 | 211,943 | |||||
7.50%, (100, 12/11/23) (a) (b) (c) | 150,000 | 166,500 | |||||
6.50%, 08/08/23 (a) (c) | 250,000 | 281,494 | |||||
Deutsche Bank Aktiengesellschaft | |||||||
2.13%, 11/24/26 | 150,000 | 153,248 | |||||
Diamond Finance International Limited | |||||||
6.02%, 06/15/26 (a) (d) | 67,000 | 81,732 | |||||
8.35%, 07/15/46 (a) (d) | 100,000 | 150,494 | |||||
FS KKR Capital Corp. | |||||||
3.40%, 01/15/26 | 164,000 | 162,985 | |||||
Glencore Funding LLC | |||||||
4.88%, 03/12/29 (a) | 115,000 | 138,251 | |||||
HSBC Holdings PLC | |||||||
6.88%, (100, 06/01/21) (b) (c) | 200,000 | 203,000 | |||||
Icahn Enterprises L.P. | |||||||
4.75%, 09/15/24 | 50,000 | 52,098 | |||||
6.25%, 05/15/26 | 69,000 | 73,151 | |||||
Intercontinental Exchange, Inc. | |||||||
2.10%, 06/15/30 | 127,000 | 132,196 | |||||
JPMorgan Chase & Co. | |||||||
4.01%, (3 Month USD LIBOR + 3.80%), (100, 02/01/21) (b) (e) | 60,000 | 59,744 | |||||
5.00%, (100, 08/01/24) (b) | 80,000 | 84,070 | |||||
3.22%, 03/01/25 | 89,000 | 95,987 | |||||
2.01%, 03/13/26 | 132,000 | 138,652 | |||||
3.78%, 02/01/28 | 55,000 | 63,167 | |||||
3.51%, 01/23/29 | 101,000 | 115,150 | |||||
4.01%, 04/23/29 | 28,000 | 32,845 | |||||
2.74%, 10/15/30 | 110,000 | 119,529 | |||||
2.96%, 05/13/31 | 107,000 | 117,114 | |||||
Lloyds Banking Group PLC | |||||||
7.50%, (100, 09/27/25) (b) (c) | 109,000 | 125,895 | |||||
3.87%, 07/09/25 (c) | 200,000 | 220,507 | |||||
Markel Corporation | |||||||
6.00%, (100, 06/01/25) (b) | 78,000 | 86,182 | |||||
Metropolitan Life Global Funding I | |||||||
3.60%, 01/11/24 (a) | 210,000 | 228,984 | |||||
Morgan Stanley | |||||||
4.05%, (3 Month USD LIBOR + 3.81%), (100, 01/15/21) (b) (e) (f) | 82,000 | 81,813 | |||||
4.88%, 11/01/22 | 100,000 | 107,784 | |||||
3.62%, 04/01/31 | 206,000 | 238,949 | |||||
NatWest Group PLC | |||||||
3.07%, 05/22/28 (c) | 200,000 | 217,002 | |||||
NatWest Markets PLC | |||||||
2.38%, 05/21/23 (a) | 200,000 | 208,213 | |||||
Nordic Aviation Capital | |||||||
6.83%, 03/14/25 (g) (h) (i) | 139,295 | 109,765 | |||||
Owl Rock Capital Corporation | |||||||
3.40%, 07/15/26 | 65,000 | 65,898 | |||||
Rassman, Joel H. | |||||||
3.80%, 11/01/29 | 140,000 | 151,705 | |||||
The Goldman Sachs Group, Inc. | |||||||
3.50%, 04/01/25 | 82,000 | 91,108 | |||||
3.80%, 03/15/30 | 241,000 | 282,935 | |||||
6.75%, 10/01/37 | 70,000 | 106,447 | |||||
The Guardian Life Insurance Company of America | |||||||
3.70%, 01/22/70 (a) | 57,000 | 64,099 | |||||
The PNC Financial Services Group, Inc. | |||||||
3.45%, 04/23/29 | 115,000 | 132,578 | |||||
The Travelers Companies, Inc. | |||||||
2.55%, 04/27/50 | 26,000 | 27,388 | |||||
Truist Financial Corporation | |||||||
4.95%, (100, 09/01/25) (b) | 107,000 | 117,701 | |||||
U.S. Bancorp | |||||||
3.00%, 07/30/29 | 31,000 | 34,782 | |||||
Wells Fargo & Company | |||||||
2.41%, 10/30/25 | 143,000 | 151,157 | |||||
3.20%, 06/17/27 | 173,000 | 191,663 | |||||
3.58%, 05/22/28 | 24,000 | 27,204 | |||||
2.88%, 10/30/30 | 95,000 | 103,497 | |||||
Westpac Banking Corporation | |||||||
2.67%, 11/15/35 (c) | 71,000 | 73,174 | |||||
ZF North America Capital, Inc. | |||||||
4.75%, 04/29/25 (a) | 65,000 | 69,983 | |||||
8,751,550 | |||||||
Energy 6.6% | |||||||
Aker BP ASA | |||||||
3.75%, 01/15/30 (a) | 255,000 | 268,546 | |||||
Baker Hughes Holdings LLC | |||||||
4.49%, 05/01/30 | 76,000 | 91,123 | |||||
Cheniere Corpus Christi Holdings, LLC | |||||||
7.00%, 06/30/24 | 110,000 | 128,357 | |||||
5.88%, 03/31/25 | 54,000 | 62,824 | |||||
Cheniere Energy, Inc. | |||||||
4.63%, 10/15/28 (a) | 85,000 | 89,534 | |||||
4.50%, 10/01/29 | 125,000 | 132,107 | |||||
Chevron Corporation | |||||||
2.00%, 05/11/27 | 133,000 | 141,003 | |||||
Diamondback Energy, Inc. | |||||||
4.75%, 05/31/25 | 46,000 | 51,722 | |||||
Endeavor Energy Resources, L.P. | |||||||
5.50%, 01/30/26 (a) | 14,000 | 14,357 | |||||
5.75%, 01/30/28 (a) | 14,000 | 15,057 | |||||
Energy Transfer LP | |||||||
6.75%, (100, 05/15/25) (b) | 102,000 | 94,368 | |||||
7.13%, (100, 05/15/30) (b) | 119,000 | 113,772 | |||||
4.25%, 03/15/23 | 173,000 | 183,744 | |||||
5.25%, 04/15/29 | 42,000 | 49,004 | |||||
3.75%, 05/15/30 | 67,000 | 72,126 | |||||
5.80%, 06/15/38 | 45,000 | 51,509 | |||||
6.13%, 12/15/45 | 20,000 | 23,650 | |||||
6.25%, 04/15/49 | 40,000 | 48,588 | |||||
Enlink Midstream, LLC | |||||||
4.15%, 06/01/25 | 71,000 | 69,288 | |||||
Enterprise Products Operating LLC | |||||||
3.13%, 07/31/29 | 109,000 | 121,027 | |||||
4.20%, 01/31/50 | 84,000 | 98,066 | |||||
EQM Midstream Partners, LP | |||||||
4.13%, 12/01/26 | 113,000 | 114,577 | |||||
Exxon Mobil Corporation | |||||||
3.48%, 03/19/30 | 195,000 | 226,127 | |||||
2.61%, 10/15/30 (c) | 40,000 | 43,668 |
See accompanying Notes to Financial Statements.
Abbreviations, counterparties and additional footnotes are defined on page 20
6
PPMFunds
Schedules of Investments
December 31, 2020
Shares/Par1 | Value ($) | ||||||
MPLX LP | |||||||
4.00%, 03/15/28 | 120,000 | 137,203 | |||||
5.20%, 12/01/47 | 45,000 | 54,407 | |||||
Occidental Petroleum Corporation | |||||||
3.50%, 08/15/29 | 140,000 | 127,686 | |||||
4.30%, 08/15/39 | 20,000 | 16,860 | |||||
4.40%, 08/15/49 | 22,000 | 18,542 | |||||
Parsley Energy, LLC | |||||||
5.63%, 10/15/27 (a) | 125,000 | 136,863 | |||||
Pioneer Natural Resources Company | |||||||
1.90%, 08/15/30 | 40,000 | 39,586 | |||||
Rattler Midstream LP | |||||||
5.63%, 07/15/25 (a) | 15,000 | 15,844 | |||||
Sabine Pass Liquefaction, LLC | |||||||
4.20%, 03/15/28 | 250,000 | 286,895 | |||||
4.50%, 05/15/30 (a) (c) | 80,000 | 94,771 | |||||
Targa Resource Corporation | |||||||
5.50%, 03/01/30 | 140,000 | 151,872 | |||||
4.88%, 02/01/31 (a) | 56,000 | 60,943 | |||||
Transocean Pontus Limited | |||||||
6.13%, 08/01/25 (a) | 15,600 | 14,807 | |||||
Transocean Poseidon Limited | |||||||
6.88%, 02/01/27 (a) | 49,000 | 44,558 | |||||
Transocean Proteus Limited | |||||||
6.25%, 12/01/24 (a) | 105,000 | 98,568 | |||||
WPX Energy, Inc. | |||||||
5.88%, 06/15/28 | 60,000 | 65,390 | |||||
4.50%, 01/15/30 | 53,000 | 56,211 | |||||
3,725,150 | |||||||
Consumer Staples 5.2% | |||||||
Altria Group, Inc. | |||||||
2.35%, 05/06/25 | 85,000 | 90,174 | |||||
4.80%, 02/14/29 | 54,000 | 64,701 | |||||
Anheuser-Busch Companies, LLC | |||||||
4.90%, 02/01/46 | 146,000 | 189,887 | |||||
Archer-Daniels-Midland Company | |||||||
3.25%, 03/27/30 | 70,000 | 80,889 | |||||
Ashtead Capital, Inc. | |||||||
5.25%, 08/01/26 (a) | 128,000 | 135,482 | |||||
BAT Capital Corp. | |||||||
2.26%, 03/25/28 | 126,000 | 130,238 | |||||
4.91%, 04/02/30 | 151,000 | 182,362 | |||||
4.39%, 08/15/37 | 74,000 | 82,650 | |||||
Cargill, Incorporated | |||||||
2.13%, 04/23/30 (a) | 35,000 | 36,815 | |||||
Jaguar Holding Company II | |||||||
4.63%, 06/15/25 (a) | 17,000 | 17,933 | |||||
5.00%, 06/15/28 (a) | 17,000 | 18,320 | |||||
JBS Investments II GmbH | |||||||
7.00%, 01/15/26 (a) | 200,000 | 215,832 | |||||
JBS USA Food Company | |||||||
6.50%, 04/15/29 (a) | 84,000 | 97,766 | |||||
Kraft Heinz Foods Company | |||||||
4.25%, 03/01/31 (a) | 68,000 | 75,602 | |||||
4.63%, 10/01/39 (a) | 20,000 | 22,233 | |||||
Mars, Incorporated | |||||||
2.38%, 07/16/40 (a) | 60,000 | 61,251 | |||||
3.95%, 04/01/49 (a) | 143,000 | 182,796 | |||||
Northwestern University | |||||||
2.64%, 12/01/50 | 38,000 | 40,304 | |||||
PepsiCo, Inc. | |||||||
3.38%, 07/29/49 | 110,000 | 133,283 | |||||
Prime Security Services Borrower, LLC | |||||||
3.38%, 08/31/27 (a) | 57,000 | 56,761 | |||||
Reynolds American Inc. | |||||||
5.70%, 08/15/35 | 46,000 | 58,024 | |||||
7.00%, 08/04/41 | 45,000 | 60,338 | |||||
Safeway Inc. | |||||||
3.50%, 02/15/23 (a) | 100,000 | 102,430 | |||||
Sysco Corporation | |||||||
5.65%, 04/01/25 (d) | 47,000 | 56,049 | |||||
5.95%, 04/01/30 (d) | 33,000 | 43,367 | |||||
Upjohn Inc. | |||||||
3.85%, 06/22/40 (a) | 119,000 | 133,591 | |||||
4.00%, 06/22/50 (a) | 71,000 | 80,880 | |||||
Walmart Inc. | |||||||
2.85%, 07/08/24 | 174,000 | 187,996 | |||||
3.25%, 07/08/29 | 234,000 | 271,805 | |||||
2,909,759 | |||||||
Health Care 5.0% | |||||||
AbbVie Inc. | |||||||
3.20%, 11/21/29 | 75,000 | 84,384 | |||||
4.05%, 11/21/39 | 45,000 | 54,583 | |||||
Amgen Inc. | |||||||
2.20%, 02/21/27 | 133,000 | 142,375 | |||||
2.45%, 02/21/30 | 48,000 | 51,444 | |||||
3.15%, 02/21/40 | 164,000 | 179,059 | |||||
Ascension Health | |||||||
2.53%, 11/15/29 | 28,000 | 30,509 | |||||
Bausch Health Companies Inc. | |||||||
5.50%, 11/01/25 (a) | 22,000 | 22,747 | |||||
8.50%, 01/31/27 (a) | 21,000 | 23,366 | |||||
5.75%, 08/15/27 (a) | 60,000 | 64,515 | |||||
Bristol-Myers Squibb Company | |||||||
3.40%, 07/26/29 | 205,000 | 238,267 | |||||
4.13%, 06/15/39 | 100,000 | 127,958 | |||||
Centene Corporation | |||||||
5.38%, 08/15/26 (a) | 59,000 | 62,298 | |||||
4.25%, 12/15/27 | 77,000 | 81,676 | |||||
4.63%, 12/15/29 | 120,000 | 132,791 | |||||
3.38%, 02/15/30 | 101,000 | 106,277 | |||||
3.00%, 10/15/30 | 123,000 | 130,126 | |||||
Cigna Holding Company | |||||||
3.40%, 03/01/27 | 114,000 | 128,669 | |||||
2.40%, 03/15/30 | 59,000 | 62,679 | |||||
CVS Health Corporation | |||||||
4.30%, 03/25/28 | 53,000 | 62,931 | |||||
4.78%, 03/25/38 | 100,000 | 126,133 | |||||
5.05%, 03/25/48 | 100,000 | 135,347 | |||||
HCA Inc. | |||||||
5.38%, 09/01/26 | 75,000 | 86,073 | |||||
Molina Healthcare, Inc. | |||||||
4.38%, 06/15/28 (a) | 17,000 | 17,888 | |||||
3.88%, 11/15/30 (a) | 19,000 | 20,379 | |||||
Mylan Inc | |||||||
5.20%, 04/15/48 | 23,000 | 30,258 | |||||
Providence St. Joseph Health | |||||||
2.53%, 10/01/29 | 67,000 | 71,013 | |||||
Regeneron Pharmaceuticals, Inc. | |||||||
1.75%, 09/15/30 | 93,000 | 91,464 | |||||
Royalty Pharma PLC | |||||||
3.30%, 09/02/40 (a) | 91,000 | 95,733 | |||||
Smith & Nephew PLC | |||||||
2.03%, 10/14/30 | 125,000 | 127,122 | |||||
Tenet Healthcare Corporation | |||||||
4.88%, 01/01/26 (a) | 140,000 | 146,301 | |||||
Universal Health Services, Inc. | |||||||
2.65%, 10/15/30 (a) | 50,000 | 52,006 | |||||
2,786,371 | |||||||
Communication Services 4.5% | |||||||
AT&T Inc. | |||||||
5.25%, 03/01/37 | 116,000 | 150,698 | |||||
4.90%, 08/15/37 | 16,000 | 19,985 | |||||
4.30%, 12/15/42 | 105,000 | 122,134 | |||||
3.10%, 02/01/43 | 131,000 | 132,822 | |||||
CCO Holdings, LLC | |||||||
4.75%, 03/01/30 (a) | 195,000 | 210,426 | |||||
Charter Communications Operating, LLC | |||||||
4.91%, 07/23/25 | 140,000 | 162,541 | |||||
5.38%, 04/01/38 | 45,000 | 56,536 | |||||
6.83%, 10/23/55 | 51,000 | 76,735 | |||||
Comcast Corporation | |||||||
2.35%, 01/15/27 | 200,000 | 215,129 | |||||
4.60%, 10/15/38 | 51,000 | 67,082 | |||||
3.75%, 04/01/40 | 35,000 | 42,055 | |||||
3.40%, 07/15/46 | 50,000 | 57,725 | |||||
CSC Holdings, LLC | |||||||
6.50%, 02/01/29 (a) | 100,000 | 112,783 |
See accompanying Notes to Financial Statements.
Abbreviations, counterparties and additional footnotes are defined on page 20
7
PPMFunds
Schedules of Investments
December 31, 2020
Shares/Par1 | Value ($) | ||||||
Hughes Satellite Systems Corporation | |||||||
5.25%, 08/01/26 | 71,000 | 78,326 | |||||
Live Nation Entertainment, Inc. | |||||||
6.50%, 05/15/27 (a) | 60,000 | 67,127 | |||||
Sirius XM Radio Inc. | |||||||
5.50%, 07/01/29 (a) | 47,000 | 51,818 | |||||
TEGNA Inc. | |||||||
5.00%, 09/15/29 | 70,000 | 73,956 | |||||
The Walt Disney Company | |||||||
2.65%, 01/13/31 | 131,000 | 143,343 | |||||
T-Mobile USA, Inc. | |||||||
3.50%, 04/15/25 (a) | 65,000 | 71,908 | |||||
Verizon Communications Inc. | |||||||
4.33%, 09/21/28 | 105,000 | 126,382 | |||||
1.75%, 01/20/31 | 156,000 | 155,327 | |||||
4.50%, 08/10/33 | 47,000 | 59,212 | |||||
2.65%, 11/20/40 | 91,000 | 91,973 | |||||
Vodafone Group Public Limited Company | |||||||
5.00%, 05/30/38 | 120,000 | 156,423 | |||||
2,502,446 | |||||||
Consumer Discretionary 4.4% | |||||||
Adient US LLC | |||||||
9.00%, 04/15/25 (a) | 38,000 | 42,501 | |||||
Amazon.com, Inc. | |||||||
2.50%, 06/03/50 | 50,000 | 51,749 | |||||
Booking Holdings Inc. | |||||||
4.10%, 04/13/25 | 124,000 | 140,775 | |||||
4.63%, 04/13/30 | 130,000 | 161,185 | |||||
Carnival Corporation | |||||||
11.50%, 04/01/23 (a) | 146,000 | 168,780 | |||||
Cedar Fair, L.P. | |||||||
5.50%, 05/01/25 (a) | 83,000 | 86,706 | |||||
Fiat Chrysler Automobiles N.V. | |||||||
5.25%, 04/15/23 | 103,000 | 110,482 | |||||
Ford Motor Company | |||||||
8.50%, 04/21/23 | 33,000 | 37,107 | |||||
9.00%, 04/22/25 | 67,000 | 82,160 | |||||
General Motors Company | |||||||
6.13%, 10/01/25 | 51,000 | 61,917 | |||||
6.80%, 10/01/27 | 39,000 | 50,149 | |||||
GLP Financing, LLC | |||||||
5.75%, 06/01/28 | 15,000 | 17,711 | |||||
5.30%, 01/15/29 | 100,000 | 116,331 | |||||
Hanesbrands Inc. | |||||||
5.38%, 05/15/25 (a) | 152,000 | 161,103 | |||||
Hilton Domestic Operating Company Inc. | |||||||
5.38%, 05/01/25 (a) | 33,000 | 35,258 | |||||
5.75%, 05/01/28 (a) | 33,000 | 36,029 | |||||
Hyatt Hotels Corporation | |||||||
5.38%, 04/23/25 (d) | 45,000 | 51,027 | |||||
Hyundai Capital America | |||||||
1.80%, 10/15/25 (a) | 66,000 | 67,461 | |||||
Lowe`s Companies, Inc. | |||||||
3.00%, 10/15/50 | 36,000 | 38,551 | |||||
M.D.C. Holdings, Inc. | |||||||
6.00%, 01/15/43 (d) | 11,000 | 14,742 | |||||
Macy's, Inc. | |||||||
8.38%, 06/15/25 (a) | 85,000 | 94,300 | |||||
Marriott International, Inc. | |||||||
5.75%, 05/01/25 (d) | 115,000 | 134,518 | |||||
Mileage Plus Holdings, LLC | |||||||
6.50%, 06/20/27 (a) | 35,026 | 37,817 | |||||
Newell Brands Inc. | |||||||
4.88%, 06/01/25 | 46,000 | 50,583 | |||||
NIKE, Inc. | |||||||
3.25%, 03/27/40 | 74,000 | 86,267 | |||||
NVR, Inc. | |||||||
3.00%, 05/15/30 | 134,000 | 145,890 | |||||
Restaurant Brands International Limited Partnership | |||||||
3.50%, 02/15/29 (a) | 35,000 | 35,082 | |||||
Ross Stores, Inc. | |||||||
4.60%, 04/15/25 | 169,000 | 195,015 | |||||
1.88%, 04/15/31 | 74,000 | 74,135 | |||||
Royal Caribbean Cruises Ltd. | |||||||
11.50%, 06/01/25 (a) | 22,000 | 25,664 | |||||
The Home Depot, Inc. | |||||||
3.35%, 04/15/50 | 74,000 | 88,205 | |||||
2,499,200 | |||||||
Utilities 3.9% | |||||||
Ameren Illinois Company | |||||||
4.50%, 03/15/49 | 65,000 | 88,309 | |||||
Commonwealth Edison Company | |||||||
3.75%, 08/15/47 | 79,000 | 95,583 | |||||
Consolidated Edison Company of New York, Inc. | |||||||
3.95%, 04/01/50 | 57,000 | 69,298 | |||||
DPL Inc. | |||||||
4.13%, 07/01/25 (a) | 102,000 | 110,288 | |||||
Duquesne Light Holdings, Inc. | |||||||
2.53%, 10/01/30 (a) | 61,000 | 63,022 | |||||
Edison International | |||||||
4.95%, 04/15/25 | 70,000 | 79,784 | |||||
Exelon Corporation | |||||||
5.10%, 06/15/45 | 75,000 | 100,941 | |||||
FirstEnergy Corp. | |||||||
3.90%, 07/15/27 (d) (j) | 69,000 | 75,835 | |||||
Nevada Power Company | |||||||
3.70%, 05/01/29 | 140,000 | 163,871 | |||||
Oncor Electric Delivery Company LLC | |||||||
2.95%, 04/01/25 | 80,000 | 87,115 | |||||
Pacific Gas And Electric Company | |||||||
2.50%, 02/01/31 | 234,000 | 234,611 | |||||
3.30%, 12/01/27 - 08/01/40 | 132,000 | 135,254 | |||||
San Diego Gas & Electric Company | |||||||
1.70%, 10/01/30 | 168,000 | 169,834 | |||||
Southern California Edison Company | |||||||
4.13%, 03/01/48 | 46,000 | 54,912 | |||||
3.65%, 02/01/50 | 62,000 | 70,200 | |||||
The AES Corporation | |||||||
3.30%, 07/15/25 (a) | 133,000 | 144,863 | |||||
2.45%, 01/15/31 (a) | 114,000 | 115,429 | |||||
The Narragansett Electric Company | |||||||
3.40%, 04/09/30 (a) | 37,000 | 42,062 | |||||
Vistra Operations Company LLC | |||||||
3.55%, 07/15/24 (a) | 71,000 | 76,811 | |||||
3.70%, 01/30/27 (a) | 220,000 | 241,428 | |||||
2,219,450 | |||||||
Materials 2.7% | |||||||
Anglo American Capital PLC | |||||||
5.38%, 04/01/25 (a) | 200,000 | 234,007 | |||||
4.88%, 05/14/25 (a) | 121,000 | 140,063 | |||||
4.75%, 04/10/27 (a) | 180,000 | 212,791 | |||||
CEMEX S.A.B. de C.V. | |||||||
5.45%, 11/19/29 (a) | 130,000 | 142,714 | |||||
CF Industries, Inc. | |||||||
4.50%, 12/01/26 (a) | 314,000 | 369,890 | |||||
FMG Resources (August 2006) Pty Ltd | |||||||
4.75%, 05/15/22 (a) | 81,000 | 83,497 | |||||
Freeport-McMoRan Inc. | |||||||
5.00%, 09/01/27 | 61,000 | 64,821 | |||||
5.40%, 11/14/34 | 35,000 | 43,756 | |||||
NOVA Chemicals Corporation | |||||||
4.88%, 06/01/24 (a) | 130,000 | 135,727 | |||||
Teck Resources Limited | |||||||
3.90%, 07/15/30 | 105,000 | 116,976 | |||||
1,544,242 | |||||||
Industrials 2.3% | |||||||
Aircastle Limited | |||||||
5.25%, 08/11/25 (a) | 108,000 | 118,614 | |||||
Delta Air Lines, Inc. | |||||||
7.00%, 05/01/25 (a) | 134,000 | 155,215 | |||||
General Dynamics Corporation | |||||||
4.25%, 04/01/40 | 100,000 | 129,990 | |||||
General Electric Company | |||||||
5.00%, (100, 01/21/21) (b) | 419,000 | 388,522 | |||||
3.45%, 05/01/27 | 31,000 | 34,912 | |||||
3.63%, 05/01/30 | 73,000 | 83,349 |
See accompanying Notes to Financial Statements.
Abbreviations, counterparties and additional footnotes are defined on page 20
8
PPMFunds
Schedules of Investments
December 31, 2020
Shares/Par1 | Value ($) | ||||||
Hillenbrand, Inc. | |||||||
5.00%, 09/15/26 (d) (j) | 20,000 | 22,408 | |||||
Howmet Aerospace Inc. | |||||||
6.88%, 05/01/25 | 36,000 | 42,341 | |||||
Lockheed Martin Corporation | |||||||
2.80%, 06/15/50 | 32,000 | 34,574 | |||||
Moog Inc. | |||||||
4.25%, 12/15/27 (a) | 44,000 | 46,011 | |||||
Northrop Grumman Corporation | |||||||
4.40%, 05/01/30 | 46,000 | 56,688 | |||||
Otis Worldwide Corporation | |||||||
2.57%, 02/15/30 | 55,000 | 59,041 | |||||
Park Aerospace Holdings Limited | |||||||
5.25%, 08/15/22 (a) | 13,000 | 13,624 | |||||
SkyMiles IP Ltd. | |||||||
4.50%, 10/20/25 (a) | 10,000 | 10,705 | |||||
4.75%, 10/20/28 (a) | 16,000 | 17,450 | |||||
United Rentals (North America), Inc. | |||||||
3.88%, 11/15/27 | 55,000 | 57,681 | |||||
1,271,125 | |||||||
Information Technology 0.7% | |||||||
Broadcom Inc. | |||||||
4.25%, 04/15/26 | 130,000 | 148,966 | |||||
3.88%, 01/15/27 | 57,000 | 64,054 | |||||
Dell International L.L.C. | |||||||
5.85%, 07/15/25 (a) | 6,000 | 7,182 | |||||
4.90%, 10/01/26 (a) (d) | 50,000 | 59,042 | |||||
Microsoft Corporation | |||||||
3.95%, 08/08/56 | 72,000 | 98,208 | |||||
2.68%, 06/01/60 | 15,000 | 16,184 | |||||
393,636 | |||||||
Real Estate 0.3% | |||||||
Simon Property Group, L.P. | |||||||
2.45%, 09/13/29 | 99,000 | 103,692 | |||||
VICI Properties Inc. | |||||||
4.25%, 12/01/26 (a) | 55,000 | 57,094 | |||||
160,786 | |||||||
Total Corporate Bonds And Notes (cost $26,301,200) | 28,763,715 | ||||||
GOVERNMENT AND AGENCY OBLIGATIONS 38.9% | |||||||
Mortgage-Backed Securities 26.9% | |||||||
Federal Home Loan Mortgage Corporation | |||||||
2.00%, 02/01/35 - 06/01/35 | 220,383 | 230,573 | |||||
1.50%, 01/01/36 | 120,012 | 123,590 | |||||
4.00%, 10/01/45 - 06/01/48 | 169,570 | 182,230 | |||||
3.50%, 01/01/46 - 08/01/49 | 1,411,380 | 1,498,714 | |||||
4.50%, 11/01/48 | 29,347 | 31,800 | |||||
3.00%, 07/01/32 - 12/01/49 | 334,219 | 352,962 | |||||
2.50%, 05/01/50 - 07/01/50 | 281,332 | 296,257 | |||||
Federal National Mortgage Association, Inc. | |||||||
2.00%, 03/01/35 - 07/01/35 | 165,396 | 172,976 | |||||
2.50%, 01/01/33 - 11/01/50 | 1,165,671 | 1,223,961 | |||||
1.50%, 11/01/35 | 124,388 | 128,097 | |||||
4.00%, 01/01/47 - 09/01/49 | 901,598 | 966,086 | |||||
3.50%, 10/01/46 - 01/01/48 | 432,665 | 462,400 | |||||
4.50%, 05/01/47 - 12/01/48 | 673,252 | 733,490 | |||||
3.00%, 09/01/32 - 09/01/50 | 2,583,922 | 2,724,328 | |||||
2.00%, 02/15/36 - 02/15/51 (k) | 1,693,000 | 1,760,382 | |||||
TBA, 1.50%, 02/15/36 - 02/15/51 (k) | 265,000 | 269,749 | |||||
TBA, 2.50%, 02/15/51 (k) | 515,000 | 542,118 | |||||
Government National Mortgage Association | |||||||
3.00%, 10/20/46 - 04/20/50 | 420,323 | 438,591 | |||||
3.50%, 05/20/47 - 03/20/50 | 937,887 | 1,005,221 | |||||
4.00%, 07/20/47 | 344,641 | 371,220 | |||||
4.50%, 12/20/48 - 02/20/49 | 171,295 | 184,957 | |||||
TBA, 2.00%, 02/15/51 (k) | 240,000 | 250,656 | |||||
TBA, 2.50%, 02/15/51 (k) | 1,100,000 | 1,162,289 | |||||
15,112,647 | |||||||
U.S. Treasury Note 7.0% | |||||||
Treasury, United States Department of | |||||||
0.13%, 12/15/23 | 380,000 | 379,525 | |||||
2.25%, 11/15/25 | 980,000 | 1,070,344 | |||||
0.38%, 12/31/25 | 560,000 | 560,350 | |||||
1.50%, 10/31/24 - 08/15/26 | 943,000 | 994,338 | |||||
0.63%, 03/31/27 | 345,000 | 346,941 | |||||
2.88%, 08/15/28 | 375,000 | 435,410 | |||||
0.88%, 11/15/30 | 150,000 | 149,414 | |||||
3,936,322 | |||||||
U.S. Treasury Bond 4.1% | |||||||
Treasury, United States Department of | |||||||
3.75%, 08/15/41 | 461,000 | 654,476 | |||||
3.13%, 11/15/41 | 292,000 | 381,471 | |||||
2.50%, 02/15/45 - 02/15/46 | 772,000 | 920,873 | |||||
3.00%, 02/15/48 | 277,000 | 363,389 | |||||
2,320,209 | |||||||
U.S. Government Agency Obligations 0.4% | |||||||
Federal National Mortgage Association, Inc. | |||||||
0.88%, 08/05/30 (l) | 229,000 | 224,169 | |||||
Municipal 0.3% | |||||||
Dormitory Authority State of New York | |||||||
3.19%, 02/15/43 | 100,000 | 109,048 | |||||
The Port Authority of New York and New Jersey | |||||||
1.09%, 07/01/23 | 75,000 | 76,117 | |||||
185,165 | |||||||
Sovereign 0.2% | |||||||
Abu Dhabi, Government of | |||||||
3.13%, 04/16/30 (a) | 100,000 | 112,950 | |||||
Total Government And Agency Obligations (cost $20,802,636) | 21,891,462 | ||||||
NON-U.S. GOVERNMENT AGENCY ASSET-BACKED SECURITIES 7.6% | |||||||
Air Canada 2020-2 Class A Pass Through Trust | |||||||
Series 2020-A-2, 5.25%, 04/01/29 | 27,000 | 28,756 | |||||
Alaska Airlines 2020-1 Class A Pass Through Trust | |||||||
Series 2020-A-1, 4.80%, 08/15/27 | 94,000 | 103,251 | |||||
American Airlines, Inc. | |||||||
Series 2016-AA-2, 3.20%, 06/15/28 | 161,900 | 156,400 | |||||
American Tower Trust #1 | |||||||
Series 2013-A-2, 3.07%, 03/15/23 | 265,000 | 269,838 | |||||
AmeriCredit Automobile Receivables Trust | |||||||
Series 2018-A3-1, 3.07%, 01/19/21 | 89,206 | 89,601 | |||||
Ascentium Equipment Receivables Trust | |||||||
Series 2017-A3-2A, 2.31%, 12/10/21 | 38,982 | 39,159 | |||||
Capital One Prime Auto Receivables Trust | |||||||
Series 2019-A2-2, 2.06%, 06/15/21 | 185,183 | 185,761 | |||||
Series 2020-A2-1, 1.64%, 06/15/23 | 155,180 | 155,982 | |||||
CarMax Auto Owner Trust 2019-2 | |||||||
Series 2019-A3-2, 2.68%, 12/15/22 | 300,000 | 307,037 | |||||
CCG Receivables Trust | |||||||
Series 2018-A2-1, 2.50%, 02/14/21 | 5,437 | 5,442 | |||||
Series 2019-A2-2, 2.11%, 03/14/23 | 72,725 | 73,727 | |||||
Citigroup Commercial Mortgage Trust | |||||||
Series 2019-A4-C7, REMIC, 3.10%, 12/17/29 | 275,000 | 309,601 | |||||
COMM Mortgage Trust | |||||||
Series 2014-A4-UBS3, REMIC, 3.82%, 05/10/24 | 49,000 | 53,644 | |||||
CSMC Trust | |||||||
Series 2017-A3-HL2, REMIC, 3.50%, 09/25/24 (e) | 12,646 | 12,708 | |||||
DLL LLC | |||||||
Series 2018-A3-ST2, 3.46%, 04/20/21 | 32,310 | 32,471 | |||||
Series 2019-A2-MT3, 2.13%, 01/20/22 | 77,302 | 77,567 | |||||
Foundation Finance Trust | |||||||
Series 2017-A-1A, 3.30%, 08/15/22 | 24,713 | 25,166 | |||||
GLS Auto Receivables Trust | |||||||
Series 2019-A-1A, 3.37%, 03/15/21 | 14,205 | 14,254 | |||||
GM Financial Automobile Leasing Trust 2020-1 | |||||||
Series 2020-A3-1, 1.67%, 12/20/22 | 300,000 | 304,064 | |||||
GM Financial Automobile Leasing Trust 2020-3 | |||||||
Series 2020-A2A-3, 0.35%, 02/20/22 | 179,000 | 179,173 | |||||
Grace Trust | |||||||
Series 2020-A-GRCE, REMIC, 2.35%, 12/12/30 | 177,000 | 187,535 | |||||
HPEFS Equipment Trust | |||||||
Series 2019-A2-1A, 2.19%, 09/20/29 | 69,959 | 70,190 | |||||
Series 2019-A3-1A, 2.21%, 09/20/29 | 100,000 | 101,080 | |||||
Hudson Yards Mortgage Trust | |||||||
Series 2019-A-30HY, REMIC, 3.23%, 07/12/29 | 150,000 | 169,967 |
See accompanying Notes to Financial Statements.
Abbreviations, counterparties and additional footnotes are defined on page 20
9
PPMFunds
Schedules of Investments
December 31, 2020
Shares/Par1 | Value ($) | ||||||
J.P. Morgan Mortgage Trust | |||||||
Series 2017-A6-6, REMIC, 3.00%, 03/25/25 (e) | 18,406 | 18,536 | |||||
John Deere Owner Trust | |||||||
Series 2019-A2-B, 2.28%, 04/15/21 | 114,065 | 114,276 | |||||
Manhattan West 2020-1MW Mortgage Trust | |||||||
Series 2020-A-OMW, REMIC, 2.13%, 09/10/27 | 201,074 | 210,243 | |||||
Prestige Auto Receivables Trust | |||||||
Series 2019-A2-1A, 2.44%, 07/15/22 | 12,501 | 12,503 | |||||
PSMC Trust | |||||||
Series 2018-A1-3, REMIC, 4.00%, 02/25/41 (e) | 15,325 | 15,616 | |||||
Sequoia Mortgage Trust 2020-4 | |||||||
Series 2020-A2-4, REMIC, 2.50%, 10/25/43 (e) | 134,644 | 140,214 | |||||
Sprint Spectrum Co LLC | |||||||
Series 2016-A1-1, 3.36%, 09/20/21 (a) | 37,500 | 37,781 | |||||
Toyota Auto Receivables Owner Trust | |||||||
Series 2018-A3-B, 2.96%, 07/15/21 | 116,566 | 117,673 | |||||
United Airlines, Inc. | |||||||
Series 2012-A-1, 4.15%, 04/11/24 | 47,314 | 47,124 | |||||
Series 2012-A-2, 4.00%, 10/29/24 | 42,271 | 41,887 | |||||
Verizon Owner Trust 2019-C | |||||||
Series 2019-A1A-C, 1.94%, 11/21/22 | 275,000 | 280,824 | |||||
Verizon Owner Trust 2020-B | |||||||
Series 2020-A-B, 0.47%, 02/20/25 | 149,000 | 149,452 | |||||
Volvo Financial Equipment LLC | |||||||
Series 2019-A2-1A, 2.90%, 11/15/21 | 8 | 8 | |||||
Wells Fargo Commercial Mortgage Trust | |||||||
Series 2017-B-C38, REMIC, 3.92%, 06/17/27 (e) | 57,000 | 63,381 | |||||
Wells Fargo Mortgage Backed Securities Trust | |||||||
Series 2020-A1-3, REMIC, 3.00%, 12/25/42 (e) | 94,829 | 97,696 | |||||
Total Non-U.S. Government Agency Asset-Backed Securities (cost $4,213,118) | 4,299,588 | ||||||
SENIOR FLOATING RATE INSTRUMENTS 1.2% | |||||||
Consumer Discretionary 0.5% | |||||||
Caesars Resort Collection, LLC | |||||||
2020 Term Loan B1, 4.65%, (1 Month USD LIBOR + 4.50%), 06/19/25 (e) | 27,333 | 27,342 | |||||
2020 Term Loan B1, 4.65%, (1 Month USD LIBOR + 4.50%), 06/19/25 (e) | 54,462 | 54,479 | |||||
PCI Gaming Authority | |||||||
Term Loan, 2.65%, (1 Month USD LIBOR + 2.50%), 05/15/26 (e) | 119,036 | 117,589 | |||||
UFC Holdings, LLC | |||||||
2019 Term Loan, 4.25%, (6 Month USD LIBOR + 3.25%), 04/25/26 (e) | 58,030 | 57,785 | |||||
257,195 | |||||||
Communication Services 0.4% | |||||||
CenturyLink, Inc. | |||||||
2020 Term Loan B, 2.40%, (1 Month USD LIBOR + 2.25%), 03/15/27 (e) | 99,000 | 97,861 | |||||
CSC Holdings, LLC | |||||||
2017 Term Loan B1, 2.41%, (1 Month USD LIBOR + 2.25%), 07/15/25 (e) | 43,534 | 42,819 | |||||
Diamond Sports Group, LLC | |||||||
Term Loan, 3.40%, (1 Month USD LIBOR + 3.25%), 08/24/26 (e) | 33,575 | 29,581 | |||||
Nexstar Broadcasting, Inc. | |||||||
2019 Term Loan B4, 2.89%, (3 Month USD LIBOR + 2.75%), 06/13/26 (e) | 67,769 | 67,236 | |||||
237,497 | |||||||
Consumer Staples 0.2% | |||||||
JBS USA Lux S.A. | |||||||
2019 Term Loan B, 2.15%, (1 Month USD LIBOR + 2.00%), 04/27/26 (e) | 94,114 | 93,290 | |||||
Industrials 0.1% | |||||||
Genesee & Wyoming Inc. | |||||||
Term Loan, 2.25%, (3 Month USD LIBOR + 2.00%), 10/29/26 (e) | 50,618 | 50,467 | |||||
Energy 0.0% | |||||||
Traverse Midstream Partners LLC | |||||||
2017 Term Loan, 6.50%, (1 Month USD LIBOR + 5.50%), 09/22/24 (e) | 31,027 | 30,368 | |||||
Utilities 0.0% | |||||||
Vistra Operations Company LLC | |||||||
1st Lien Term Loan B3, 1.90%, (1 Month USD LIBOR + 1.75%), 12/11/25 (e) | 8,228 | 8,191 | |||||
1st Lien Term Loan B3, 1.90%, (1 Month USD LIBOR + 1.75%), 12/11/25 (e) | 1,990 | 1,981 | |||||
10,172 | |||||||
Total Senior Floating Rate Instruments (cost $685,059) | 678,989 | ||||||
COMMON STOCKS 0.0% | |||||||
Energy 0.0% | |||||||
EP Energy Corporation (m) | 385 | 13,475 | |||||
Total Common Stocks (cost $35,587) | 13,475 | ||||||
SHORT TERM INVESTMENTS 6.6% | |||||||
Investment Companies 6.5% | |||||||
State Street Institutional U.S. Government Money Market Fund - Premier Class, 0.01% (n) | 3,640,217 | 3,640,217 | |||||
Securities Lending Collateral 0.1% | |||||||
State Street Navigator Securities Lending Government Money Market Portfolio, 0.08% (n) | 83,640 | 83,640 | |||||
Total Short Term Investments (cost $3,723,857) | 3,723,857 | ||||||
Total Investments 105.4% (cost $55,761,457) | 59,371,086 | ||||||
Other Derivative Instruments 0.0% | 2,171 | ||||||
Other Assets and Liabilities, Net (5.4)% | (3,048,529) | ||||||
Total Net Assets 100.0% | 56,324,728 |
(a) Security is exempt from registration under the Securities Act of 1933, as amended. As of December 31, 2020, the value and the percentage of net assets of these securities was $8,852,641 and 15.7% of the Fund.
(b) Perpetual security. Next contractual call price and date are presented in parentheses, if applicable.
(c) Convertible security.
(d) The interest rate for this security is inversely affected by upgrades or downgrades to the credit rating of the issuer. Rate stated was the coupon as of December 31, 2020.
(e) Security has a variable rate. Interest rates reset periodically. Rate stated was in effect as of December 31, 2020. For securities based on a published reference rate and spread, the reference rate and spread are presented. Certain variable rate securities do not indicate a reference rate and spread because they are determined by the issuer, remarketing agent, or offering documents and are based on current market conditions. The coupon rate for securities with certain features outlined in the offering documents may vary from the stated reference rate and spread. This includes, but is not limited to, securities with deferred rates, contingent distributions, caps, floors, and fixed-rate to float-rate features. In addition, variable rates for government and agency collateralized mortgage obligations (“CMO”) and mortgage-backed securities (“MBS”) are determined by tranches of underlying mortgage-backed security pools’ cash flows into securities and pass-through rates which reflect the rate earned on the asset pool after management and guarantee fees are paid to the securitizing corporation. CMO and MBS variable rates are determined by a formula set forth in the security’s offering documents.
(f) All or a portion of the security was on loan as of December 31, 2020.
(g) Security fair valued in good faith as a Level 3 security in accordance with the procedures approved by the Board of Trustees. Good faith fair valued securities are classified for Financial Accounting Standards Board ("FASB") Accounting Standards Codification ("ASC") Topic 820 "Fair Value Measurement" based on the applicable valuation inputs. See FASB ASC Topic 820 in the Notes to Financial Statements.
(h) Pay-in-kind security. Stated coupon is the pay-in-kind rate. The interest earned by the security may be paid in cash or additional par.
(i) Security is restricted to resale to institutional investors. See Restricted Securities table following the Schedules of Investments.
(j) Security is a step-up bond where the coupon may increase or step up at a future date or as the result of an upgrade or downgrade to the credit rating of the issuer. Rate stated was the coupon as of December 31, 2020.
(k) All or a portion of the security was purchased on a delayed delivery basis. As of December 31, 2020, the total payable for investments purchased on a delayed delivery basis was $3,966,982.
(l) The security is a direct debt of the agency and not collateralized by mortgages.
(m) Non-income producing security.
(n) Yield changes daily to reflect current market conditions. Rate was the quoted yield as of December 31, 2020.
See accompanying Notes to Financial Statements.
Abbreviations, counterparties and additional footnotes are defined on page 20
10
PPMFunds
Schedules of Investments
December 31, 2020
PPM Core Plus Fixed Income Fund — Restricted Securities | ||||||||||||||||
Initial Acquisition | Cost ($) | Value ($) | Percent of Net Assets (%) | |||||||||||||
Nordic Aviation Capital, 6.83%, 03/14/25 | 10/01/19 | 139,295 | 109,765 | 0.2 | ||||||||||||
PPM Core Plus Fixed Income Fund — Futures Contracts | |||||||||||||||
Reference Entity | Contracts1 | Expiration | Notional1 | Variation Margin Receivable (Payable) ($) | Unrealized Appreciation (Depreciation) ($) | ||||||||||
Long Contracts | |||||||||||||||
United States 10 Year Note | 7 | March 2021 | 965,653 | 766 | 894 | ||||||||||
United States 2 Year Note | 15 | April 2021 | 3,311,879 | 351 | 2,769 | ||||||||||
United States 5 Year Note | 42 | April 2021 | 5,286,906 | 1,969 | 11,985 | ||||||||||
United States Long Bond | 9 | March 2021 | 1,573,611 | 3,094 | (14,923) | ||||||||||
United States Ultra Bond | 2 | March 2021 | 433,566 | 1,500 | (6,441) | ||||||||||
7,680 | (5,716) | ||||||||||||||
Short Contracts | |||||||||||||||
United States 10 Year Ultra Bond | (24) | March 2021 | (3,767,205) | (5,250) | 14,580 | ||||||||||
PPM Core Plus Fixed Income Fund — Centrally Cleared Credit Default Swap Agreements | ||||||||||||||||||
Reference Entity2 | Fixed Receive/ Pay Rate (%) | Expiration | Notional1 | Value ($) | Variation Margin Receivable (Payable) ($) | Unrealized Appreciation (Depreciation) ($) | ||||||||||||
Credit default swap agreements - purchase protection | ||||||||||||||||||
CDX.NA.IG.35 (Q) | 1.00 | 12/20/25 | 500,000 | (12,251) | (259) | (689) | ||||||||||||
See accompanying Notes to Financial Statements.
Abbreviations, counterparties and additional footnotes are defined on page 20
11
PPMFunds
Schedules of Investments
December 31, 2020
Shares/Par1 | Value ($) | ||||||
PPM High Yield Core Fund | |||||||
CORPORATE BONDS AND NOTES 93.2% | |||||||
Communication Services 17.2% | |||||||
Advantage Sales & Marketing Inc. | |||||||
6.50%, 11/15/28 (a) | 220,000 | 232,499 | |||||
Altice Financing S.A. | |||||||
5.00%, 01/15/28 (a) | 102,000 | 104,402 | |||||
Altice France S.A. | |||||||
7.38%, 05/01/26 (a) | 460,000 | 483,828 | |||||
6.00%, 02/15/28 (a) | 84,000 | 85,453 | |||||
Arches Buyer Inc | |||||||
4.25%, 06/01/28 (a) | 71,000 | 71,919 | |||||
6.13%, 12/01/28 (a) | 19,000 | 19,615 | |||||
CB Escrow Corp. | |||||||
8.00%, 10/15/25 (a) | 194,000 | 207,179 | |||||
CBS Radio Inc. | |||||||
7.25%, 11/01/24 (a) (b) | 85,000 | 85,139 | |||||
CCO Holdings, LLC | |||||||
5.13%, 05/01/27 (a) | 108,000 | 114,519 | |||||
5.88%, 05/01/27 (a) | 379,000 | 394,638 | |||||
5.00%, 02/01/28 (a) | 203,000 | 214,353 | |||||
5.38%, 06/01/29 (a) | 351,000 | 385,049 | |||||
4.50%, 05/01/32 (a) | 111,000 | 118,499 | |||||
CenturyLink, Inc. | |||||||
5.13%, 12/15/26 (a) | 112,000 | 118,213 | |||||
7.60%, 09/15/39 | 24,000 | 29,340 | |||||
Clear Channel International B.V. | |||||||
6.63%, 08/01/25 (a) | 30,000 | 31,595 | |||||
Clear Channel Worldwide Holdings, Inc. | |||||||
9.25%, 02/15/24 | 78,000 | 79,064 | |||||
Commscope, Inc. | |||||||
7.13%, 07/01/28 (a) | 135,000 | 143,688 | |||||
Connect Finco SARL | |||||||
6.75%, 10/01/26 (a) | 136,000 | 146,293 | |||||
Consolidated Communications, Inc. | |||||||
6.50%, 10/01/28 (a) | 288,000 | 308,897 | |||||
CSC Holdings, LLC | |||||||
5.50%, 04/15/27 (a) | 308,000 | 326,590 | |||||
7.50%, 04/01/28 (a) | 300,000 | 339,096 | |||||
Cumulus Media New Holdings Inc. | |||||||
6.75%, 07/01/26 (a) | 190,000 | 193,834 | |||||
Diamond Sports Group, LLC | |||||||
5.38%, 08/15/26 (a) | 93,000 | 75,576 | |||||
6.63%, 08/15/27 (a) | 113,000 | 68,356 | |||||
DISH DBS Corporation | |||||||
5.88%, 11/15/24 | 290,000 | 303,924 | |||||
7.75%, 07/01/26 | 15,000 | 16,792 | |||||
Embarq Corporation | |||||||
8.00%, 06/01/36 | 77,000 | 94,932 | |||||
Frontier Communications Corporation | |||||||
5.88%, 10/15/27 (a) | 13,000 | 14,001 | |||||
5.00%, 05/01/28 (a) | 93,000 | 96,871 | |||||
6.75%, 05/01/29 (a) | 139,000 | 148,698 | |||||
Hughes Satellite Systems Corporation | |||||||
6.63%, 08/01/26 | 274,000 | 309,838 | |||||
iHeartCommunications, Inc. | |||||||
6.38%, 05/01/26 | 38,565 | 41,191 | |||||
8.38%, 05/01/27 | 326,651 | 348,391 | |||||
5.25%, 08/15/27 (a) | 25,000 | 26,345 | |||||
4.75%, 01/15/28 (a) | 25,000 | 25,647 | |||||
Intelsat Jackson Holdings S.A. | |||||||
8.00%, 02/15/24 (a) | 125,000 | 127,485 | |||||
LCPR Senior Secured Financing Designated Activity Company | |||||||
6.75%, 10/15/27 (a) | 164,000 | 176,641 | |||||
Level 3 Financing, Inc. | |||||||
4.63%, 09/15/27 (a) | 194,000 | 201,995 | |||||
3.63%, 01/15/29 (a) | 140,000 | 139,939 | |||||
Liberty Media Corporation | |||||||
8.25%, 02/01/30 | 155,000 | 173,369 | |||||
Live Nation Entertainment, Inc. | |||||||
4.88%, 11/01/24 (a) | 86,000 | 87,130 | |||||
6.50%, 05/15/27 (a) | 34,000 | 38,039 | |||||
3.75%, 01/15/28 (a) | 40,000 | 40,426 | |||||
MDC Partners Inc. | |||||||
6.50%, 05/01/24 (a) | 287,000 | 290,877 | |||||
Netflix, Inc. | |||||||
4.38%, 11/15/26 | 169,000 | 187,174 | |||||
4.88%, 04/15/28 | 125,000 | 140,993 | |||||
5.88%, 11/15/28 | 137,000 | 164,137 | |||||
Nexstar Escrow Inc. | |||||||
5.63%, 07/15/27 (a) | 110,000 | 118,280 | |||||
Radiate HoldCo, LLC | |||||||
6.50%, 09/15/28 (a) | 289,000 | 303,642 | |||||
Sirius XM Radio Inc. | |||||||
5.00%, 08/01/27 (a) | 77,000 | 81,704 | |||||
Sprint Corporation | |||||||
6.00%, 11/15/22 | 101,000 | 109,250 | |||||
7.88%, 09/15/23 | 25,000 | 28,929 | |||||
7.13%, 06/15/24 | 331,000 | 386,693 | |||||
7.63%, 03/01/26 | 25,000 | 31,030 | |||||
6.88%, 11/15/28 | 94,000 | 123,988 | |||||
SSL Robotics LLC | |||||||
9.75%, 12/31/23 (a) | 55,000 | 62,138 | |||||
TEGNA Inc. | |||||||
5.00%, 09/15/29 | 186,000 | 196,511 | |||||
Telecom Italia SpA | |||||||
6.00%, 09/30/34 | 166,000 | 202,081 | |||||
Telesat Canada | |||||||
6.50%, 10/15/27 (a) | 152,000 | 158,943 | |||||
Terrier Media Buyer, Inc. | |||||||
8.88%, 12/15/27 (a) | 263,000 | 291,241 | |||||
Townsquare Media, Inc. | |||||||
6.88%, 02/01/26 (a) | 54,000 | 56,441 | |||||
Virgin Media Finance PLC | |||||||
5.00%, 07/15/30 (a) | 110,000 | 114,523 | |||||
Windstream Escrow, LLC | |||||||
7.75%, 08/15/28 (a) | 70,000 | 70,248 | |||||
9,908,111 | |||||||
Energy 14.3% | |||||||
Antero Midstream Partners LP | |||||||
5.38%, 09/15/24 | 65,000 | 63,531 | |||||
7.88%, 05/15/26 (a) | 90,000 | 93,530 | |||||
5.75%, 03/01/27 - 01/15/28 (a) | 127,000 | 122,889 | |||||
Apache Corporation | |||||||
4.88%, 11/15/27 | 69,000 | 73,144 | |||||
Archrock Partners, L.P. | |||||||
6.25%, 04/01/28 (a) | 325,000 | 338,311 | |||||
Ascent Resources - Utica, LLC | |||||||
7.00%, 11/01/26 (a) | 70,000 | 66,577 | |||||
8.25%, 12/31/28 (a) | 56,000 | 55,763 | |||||
Baytex Energy Corp. | |||||||
8.75%, 04/01/27 (a) | 62,000 | 39,418 | |||||
Blue Racer Midstream, LLC | |||||||
7.63%, 12/15/25 (a) | 35,000 | 37,254 | |||||
Buckeye Partners, L.P. | |||||||
4.50%, 03/01/28 (a) | 97,000 | 100,084 | |||||
5.85%, 11/15/43 | 24,000 | 23,598 | |||||
5.60%, 10/15/44 | 19,000 | 18,273 | |||||
Callon Petroleum Company | |||||||
6.38%, 07/01/26 | 162,000 | 83,821 | |||||
Cenovus Energy Inc. | |||||||
5.40%, 06/15/47 | 76,000 | 88,880 | |||||
Cheniere Energy, Inc. | |||||||
5.25%, 10/01/25 | 119,000 | 122,308 | |||||
5.63%, 10/01/26 | 248,000 | 258,653 | |||||
4.63%, 10/15/28 (a) | 140,000 | 147,468 | |||||
Citgo Petroleum Corporation | |||||||
7.00%, 06/15/25 (a) | 135,000 | 135,699 | |||||
Comstock Resources, Inc. | |||||||
9.75%, 08/15/26 | 173,000 | 184,428 | |||||
Continental Resources, Inc. | |||||||
4.50%, 04/15/23 | 25,000 | 25,709 | |||||
3.80%, 06/01/24 | 97,000 | 99,949 | |||||
5.75%, 01/15/31 (a) | 101,000 | 112,143 | |||||
Endeavor Energy Resources, L.P. | |||||||
6.63%, 07/15/25 (a) | 5,000 | 5,358 | |||||
5.50%, 01/30/26 (a) | 81,000 | 83,068 |
See accompanying Notes to Financial Statements.
Abbreviations, counterparties and additional footnotes are defined on page 20
12
PPMFunds
Schedules of Investments
December 31, 2020
Shares/Par1 | Value ($) | ||||||
5.75%, 01/30/28 (a) | 93,000 | 100,024 | |||||
Energy Transfer LP | |||||||
6.63%, (100, 02/15/28) (c) | 42,000 | 35,557 | |||||
6.75%, (100, 05/15/25) (c) | 139,000 | 128,600 | |||||
7.13%, (100, 05/15/30) (c) | 62,000 | 59,276 | |||||
5.25%, 04/15/29 | 94,000 | 109,676 | |||||
EQM Midstream Partners, LP | |||||||
4.13%, 12/01/26 | 163,000 | 165,275 | |||||
6.50%, 07/01/27 (a) | 77,000 | 86,638 | |||||
6.50%, 07/15/48 | 82,000 | 85,009 | |||||
EQT Corporation | |||||||
3.90%, 10/01/27 | 77,000 | 76,347 | |||||
5.00%, 01/15/29 | 33,000 | 34,782 | |||||
8.75%, 02/01/30 (d) (e) | 55,000 | 67,490 | |||||
Hess Midstream Operations LP | |||||||
5.13%, 06/15/28 (a) | 46,000 | 48,036 | |||||
Husky Energy Inc. | |||||||
13.00%, 02/15/25 (a) (f) | 160,000 | 174,087 | |||||
MEG Energy Corp. | |||||||
6.50%, 01/15/25 (a) | 163,000 | 167,887 | |||||
7.13%, 02/01/27 (a) | 143,000 | 147,780 | |||||
Murphy Oil Corporation | |||||||
5.75%, 08/15/25 | 90,000 | 88,938 | |||||
5.88%, 12/01/27 | 170,000 | 167,274 | |||||
Newfield Exploration Co. | |||||||
5.63%, 07/01/24 | 149,000 | 159,433 | |||||
Noble Corporation | |||||||
0.00%, 02/01/26 (a) (g) (h) | 106,000 | 42,319 | |||||
NuStar Logistics, L.P. | |||||||
6.00%, 06/01/26 | 134,000 | 144,758 | |||||
5.63%, 04/28/27 | 93,000 | 99,238 | |||||
6.38%, 10/01/30 | 139,000 | 157,227 | |||||
Occidental Petroleum Corporation | |||||||
2.70%, 02/15/23 | 42,000 | 41,960 | |||||
6.95%, 07/01/24 | 198,000 | 215,328 | |||||
2.90%, 08/15/24 | 49,000 | 47,163 | |||||
3.50%, 06/15/25 | 95,000 | 91,722 | |||||
3.20%, 08/15/26 | 139,000 | 129,965 | |||||
8.88%, 07/15/30 | 80,000 | 94,287 | |||||
6.13%, 01/01/31 | 90,000 | 96,344 | |||||
7.50%, 05/01/31 | 100,000 | 112,827 | |||||
6.45%, 09/15/36 | 234,000 | 243,907 | |||||
7.95%, 06/15/39 | 55,000 | 60,052 | |||||
4.30%, 08/15/39 | 168,000 | 141,627 | |||||
Ovintiv Exploration Inc. | |||||||
5.38%, 01/01/26 | 84,000 | 90,150 | |||||
Parsley Energy, LLC | |||||||
5.25%, 08/15/25 (a) | 74,000 | 76,992 | |||||
5.63%, 10/15/27 (a) | 131,000 | 143,433 | |||||
PBF Holding Company LLC | |||||||
9.25%, 05/15/25 (a) | 85,000 | 83,406 | |||||
6.00%, 02/15/28 | 85,000 | 48,615 | |||||
SM Energy Company | |||||||
6.63%, 01/15/27 | 246,000 | 194,937 | |||||
Southwestern Energy Company | |||||||
7.50%, 04/01/26 | 98,000 | 102,872 | |||||
7.75%, 10/01/27 (b) | 90,000 | 96,649 | |||||
8.38%, 09/15/28 | 69,000 | 74,975 | |||||
Targa Resource Corporation | |||||||
5.13%, 02/01/25 | 94,000 | 96,386 | |||||
5.00%, 01/15/28 | 107,000 | 112,877 | |||||
5.50%, 03/01/30 | 228,000 | 247,335 | |||||
Transocean Inc | |||||||
11.50%, 01/30/27 (a) | 94,000 | 68,069 | |||||
Transocean Poseidon Limited | |||||||
6.88%, 02/01/27 (a) | 126,000 | 114,579 | |||||
Transocean Proteus Limited | |||||||
6.25%, 12/01/24 (a) | 150,000 | 140,811 | |||||
Viper Energy Partners LP | |||||||
5.38%, 11/01/27 (a) | 44,000 | 45,982 | |||||
Western Midstream Operating, LP | |||||||
6.25%, 02/01/50 (d) (e) | 168,000 | 184,521 | |||||
WPX Energy, Inc. | |||||||
5.25%, 09/15/24 | 122,000 | 132,819 | |||||
5.88%, 06/15/28 | 57,000 | 62,121 | |||||
4.50%, 01/15/30 | 101,000 | 107,119 | |||||
8,225,337 | |||||||
Consumer Discretionary 13.9% | |||||||
Adient Global Holdings Ltd | |||||||
4.88%, 08/15/26 (a) (b) | 144,000 | 147,755 | |||||
Beazer Homes USA, Inc. | |||||||
6.75%, 03/15/25 | 75,000 | 78,052 | |||||
5.88%, 10/15/27 | 43,000 | 45,189 | |||||
7.25%, 10/15/29 | 47,000 | 52,996 | |||||
Boyd Gaming Corporation | |||||||
8.63%, 06/01/25 (a) | 70,000 | 77,781 | |||||
6.38%, 04/01/26 | 145,000 | 150,448 | |||||
Carnival Corporation | |||||||
11.50%, 04/01/23 (a) | 200,000 | 231,206 | |||||
7.63%, 03/01/26 (a) | 93,000 | 101,288 | |||||
Churchill Downs Incorporated | |||||||
4.75%, 01/15/28 (a) | 45,000 | 47,486 | |||||
Dana Corporation | |||||||
5.38%, 11/15/27 | 35,000 | 37,134 | |||||
Eldorado Resorts, Inc. | |||||||
8.13%, 07/01/27 (a) | 336,000 | 371,893 | |||||
Ford Motor Company | |||||||
8.50%, 04/21/23 | 64,000 | 71,966 | |||||
9.00%, 04/22/25 | 64,000 | 78,481 | |||||
4.35%, 12/08/26 | 72,000 | 76,744 | |||||
6.63%, 10/01/28 | 83,000 | 97,317 | |||||
9.63%, 04/22/30 | 64,000 | 90,517 | |||||
7.45%, 07/16/31 | 79,000 | 101,178 | |||||
Guitar Center Escrow Issuer II, Inc. | |||||||
8.50%, 01/15/26 (a) | 139,000 | 144,560 | |||||
Hilton Domestic Operating Company Inc. | |||||||
5.75%, 05/01/28 (a) | 32,000 | 34,937 | |||||
IHOL Verwaltungs GmbH | |||||||
6.38%, 05/15/29 (a) (f) | 41,000 | 45,046 | |||||
IHS Luxembourg S.A R.L. | |||||||
6.50%, 06/01/26 (a) | 125,000 | 130,937 | |||||
IRB Holding Corp. | |||||||
7.00%, 06/15/25 (a) | 90,000 | 98,192 | |||||
6.75%, 02/15/26 (a) | 166,000 | 171,810 | |||||
Jaguar Land Rover Automotive PLC | |||||||
5.63%, 02/01/23 (a) | 83,000 | 83,025 | |||||
KB Home | |||||||
7.63%, 05/15/23 | 201,000 | 222,115 | |||||
4.80%, 11/15/29 | 66,000 | 72,569 | |||||
L Brands, Inc. | |||||||
7.50%, 06/15/29 | 266,000 | 295,442 | |||||
6.63%, 10/01/30 (a) | 128,000 | 141,427 | |||||
6.88%, 11/01/35 | 165,000 | 185,095 | |||||
M.D.C. Holdings, Inc. | |||||||
3.85%, 01/15/30 | 198,000 | 220,212 | |||||
6.00%, 01/15/43 (e) | 80,000 | 107,213 | |||||
Macy's, Inc. | |||||||
8.38%, 06/15/25 (a) | 200,000 | 221,882 | |||||
Marriott Ownership Resorts, Inc. | |||||||
6.13%, 09/15/25 (a) | 51,000 | 54,398 | |||||
6.50%, 09/15/26 | 90,000 | 94,051 | |||||
4.75%, 01/15/28 | 64,000 | 65,005 | |||||
Mattel, Inc. | |||||||
6.75%, 12/31/25 (a) | 52,000 | 54,876 | |||||
5.88%, 12/15/27 (a) | 55,000 | 61,065 | |||||
MGM Resorts International | |||||||
5.50%, 04/15/27 | 82,000 | 91,364 | |||||
Michaels Stores, Inc. | |||||||
8.00%, 07/15/27 (a) (b) | 226,000 | 244,520 | |||||
Mileage Plus Holdings, LLC | |||||||
6.50%, 06/20/27 (a) | 88,053 | 95,069 | |||||
New Golden Nugget Inc. | |||||||
6.75%, 10/15/24 (a) | 70,000 | 69,405 | |||||
Newell Brands Inc. | |||||||
4.88%, 06/01/25 | 44,000 | 48,383 | |||||
4.70%, 04/01/26 (d) (e) | 131,000 | 144,296 | |||||
Panther BF Aggregator 2 LP | |||||||
8.50%, 05/15/27 (a) | 130,000 | 141,042 |
See accompanying Notes to Financial Statements.
Abbreviations, counterparties and additional footnotes are defined on page 20
13
PPMFunds
Schedules of Investments
December 31, 2020
Shares/Par1 | Value ($) | ||||||
PM General Purchaser LLC | |||||||
9.50%, 10/01/28 (a) | 140,000 | 154,816 | |||||
QVC, Inc. | |||||||
5.45%, 08/15/34 | 185,000 | 192,400 | |||||
Royal Caribbean Cruises Ltd. | |||||||
10.88%, 06/01/23 (a) | 127,000 | 144,058 | |||||
9.13%, 06/15/23 (a) | 80,000 | 86,997 | |||||
11.50%, 06/01/25 (a) | 50,000 | 58,328 | |||||
Sally Holdings, LLC | |||||||
5.63%, 12/01/25 | 77,000 | 79,452 | |||||
Scientific Games International, Inc. | |||||||
5.00%, 10/15/25 (a) | 107,000 | 110,352 | |||||
8.25%, 03/15/26 (a) | 246,000 | 264,930 | |||||
7.00%, 05/15/28 (a) | 91,000 | 97,694 | |||||
Shea Homes Limited Partnership, A California Limited Partnership | |||||||
4.75%, 02/15/28 - 04/01/29 (a) | 232,000 | 239,601 | |||||
Staples, Inc. | |||||||
7.50%, 04/15/26 (a) | 122,000 | 127,279 | |||||
10.75%, 04/15/27 (a) | 209,000 | 207,725 | |||||
Station Casinos LLC | |||||||
4.50%, 02/15/28 (a) | 108,000 | 108,725 | |||||
Stena International S.A R.L. | |||||||
6.13%, 02/01/25 (a) | 142,000 | 140,370 | |||||
Studio City Finance Limited | |||||||
6.50%, 01/15/28 (a) | 135,000 | 145,072 | |||||
Tenneco Inc. | |||||||
7.88%, 01/15/29 (a) | 23,000 | 25,824 | |||||
Univision Communications Inc. | |||||||
6.63%, 06/01/27 (a) | 184,000 | 197,563 | |||||
VOC Escrow Ltd. | |||||||
5.00%, 02/15/28 (a) | 187,000 | 184,672 | |||||
Wyndham Destinations, Inc. | |||||||
5.65%, 04/01/24 (d) (e) | 100,000 | 107,685 | |||||
6.63%, 07/31/26 (a) | 22,000 | 25,204 | |||||
6.00%, 04/01/27 (d) (e) | 65,000 | 73,039 | |||||
7,967,153 | |||||||
Financials 11.1% | |||||||
Advisor Group Holdings, Inc. | |||||||
10.75%, 08/01/27 (a) | 188,000 | 206,983 | |||||
AerCap Ireland Capital Designated Activity Company | |||||||
2.88%, 08/14/24 | 76,000 | 78,912 | |||||
Avolon Holdings Funding Limited | |||||||
3.25%, 02/15/27 (a) | 138,000 | 140,369 | |||||
Citigroup Inc. | |||||||
5.00%, (100, 09/12/24) (c) | 166,000 | 172,372 | |||||
Credit Suisse Group AG | |||||||
5.25%, (100, 02/11/27) (a) (c) | 200,000 | 211,943 | |||||
6.25%, (100, 12/18/24) (a) (c) (i) | 115,000 | 125,637 | |||||
Diamond Finance International Limited | |||||||
5.88%, 06/15/21 (a) | 94,000 | 94,162 | |||||
EG Global Finance PLC | |||||||
6.75%, 02/07/25 (a) | 180,000 | 185,400 | |||||
8.50%, 10/30/25 (a) | 150,000 | 159,517 | |||||
FirstCash, Inc. | |||||||
4.63%, 09/01/28 (a) | 91,000 | 93,902 | |||||
Ford Motor Credit Company LLC | |||||||
3.20%, 01/15/21 | 66,000 | 66,033 | |||||
5.60%, 01/07/22 | 63,000 | 64,983 | |||||
3.09%, 01/09/23 | 200,000 | 203,114 | |||||
3.10%, 05/04/23 | 136,000 | 137,402 | |||||
3.66%, 09/08/24 | 66,000 | 67,905 | |||||
4.06%, 11/01/24 | 68,000 | 71,316 | |||||
5.13%, 06/16/25 | 132,000 | 143,421 | |||||
4.00%, 11/13/30 | 140,000 | 147,090 | |||||
Freedom Mortgage Corporation | |||||||
7.63%, 05/01/26 (a) | 93,000 | 98,282 | |||||
HUB International Limited | |||||||
7.00%, 05/01/26 (a) | 129,000 | 134,857 | |||||
Icahn Enterprises L.P. | |||||||
4.75%, 09/15/24 | 161,000 | 167,756 | |||||
6.25%, 05/15/26 | 259,000 | 274,581 | |||||
5.25%, 05/15/27 | 35,000 | 37,480 | |||||
IHS Luxembourg S.A R.L. | |||||||
5.75%, 04/15/25 (a) | 35,000 | 36,310 | |||||
Intelligent Packaging Holdco Issuer Ltd Partnership | |||||||
9.00%, 01/15/26 (a) (f) | 39,000 | 39,459 | |||||
James Hardie International Finance Designated Activity Company | |||||||
5.00%, 01/15/28 (a) | 78,000 | 83,018 | |||||
JPMorgan Chase & Co. | |||||||
5.00%, (100, 08/01/24) (c) | 80,000 | 84,070 | |||||
Lions Gate Capital Holdings LLC | |||||||
6.38%, 02/01/24 (a) | 128,000 | 131,556 | |||||
5.88%, 11/01/24 (a) | 166,000 | 168,602 | |||||
LPL Holdings, Inc. | |||||||
4.63%, 11/15/27 (a) | 93,000 | 96,188 | |||||
Markel Corporation | |||||||
6.00%, (100, 06/01/25) (c) | 129,000 | 142,532 | |||||
Morgan Stanley | |||||||
4.05%, (3 Month USD LIBOR + 3.81%), (100, 01/15/21) (b) (c) (j) | 88,000 | 87,799 | |||||
Navient Corporation | |||||||
7.25%, 09/25/23 | 140,000 | 153,593 | |||||
5.88%, 10/25/24 | 82,000 | 87,132 | |||||
6.75%, 06/25/25 - 06/15/26 | 282,000 | 307,335 | |||||
NFP Corp. | |||||||
6.88%, 08/15/28 (a) | 283,000 | 302,222 | |||||
Nordic Aviation Capital | |||||||
5.04%, 02/27/24 (f) (k) (l) | 81,782 | 63,626 | |||||
7.08%, 03/14/27 (f) (k) (l) | 129,133 | 101,370 | |||||
Rassman, Joel H. | |||||||
3.80%, 11/01/29 | 87,000 | 94,274 | |||||
SLM Corporation | |||||||
5.63%, 08/01/33 | 90,000 | 86,354 | |||||
Springleaf Finance Corporation | |||||||
6.13%, 03/15/24 | 73,000 | 80,048 | |||||
8.88%, 06/01/25 | 51,000 | 57,660 | |||||
7.13%, 03/15/26 | 105,000 | 123,297 | |||||
6.63%, 01/15/28 | 63,000 | 75,035 | |||||
Telenet Finance Luxembourg Notes S.A R.L. | |||||||
5.50%, 03/01/28 (a) | 200,000 | 212,500 | |||||
USA Compression Finance Corp. | |||||||
6.88%, 04/01/26 - 09/01/27 | 231,000 | 245,212 | |||||
ZF North America Capital, Inc. | |||||||
4.50%, 04/29/22 (a) | 125,000 | 128,745 | |||||
Ziggo B.V. | |||||||
4.88%, 01/15/30 (a) | 200,000 | 210,174 | |||||
Ziggo Bond Finance B.V. | |||||||
6.00%, 01/15/27 (a) | 103,000 | 108,294 | |||||
6,389,822 | |||||||
Industrials 10.0% | |||||||
Aircastle Limited | |||||||
5.25%, 08/11/25 (a) | 53,000 | 58,209 | |||||
4.25%, 06/15/26 | 313,000 | 329,226 | |||||
American Airlines, Inc. | |||||||
11.75%, 07/15/25 (a) | 135,000 | 155,738 | |||||
ARD Finance S.A. | |||||||
6.50%, 06/30/27 (a) (f) | 137,000 | 145,798 | |||||
Aviation Capital Group LLC | |||||||
5.50%, 12/15/24 (a) | 80,000 | 88,328 | |||||
Bombardier Inc. | |||||||
6.00%, 10/15/22 (a) | 207,000 | 203,068 | |||||
7.50%, 03/15/25 (a) | 182,000 | 169,658 | |||||
Builders FirstSource, Inc. | |||||||
6.75%, 06/01/27 (a) | 53,000 | 57,503 | |||||
Cargo Aircraft Management, Inc. | |||||||
4.75%, 02/01/28 (a) | 166,000 | 170,798 | |||||
Cornerstone Building Brands, Inc. | |||||||
6.13%, 01/15/29 (a) | 147,000 | 156,312 | |||||
CP Atlas Buyer Inc | |||||||
7.00%, 12/01/28 (a) | 137,000 | 142,480 | |||||
Delta Air Lines, Inc. | |||||||
7.00%, 05/01/25 (a) | 164,000 | 189,964 | |||||
Fortress Transportation And Infrastructure Investors LLC | |||||||
6.50%, 10/01/25 (a) | 100,000 | 104,445 |
See accompanying Notes to Financial Statements.
Abbreviations, counterparties and additional footnotes are defined on page 20
14
PPMFunds
Schedules of Investments
December 31, 2020
Shares/Par1 | Value ($) | ||||||
Foxtrot Escrow Issuer LLC | |||||||
12.25%, 11/15/26 (a) | 148,000 | 168,594 | |||||
General Electric Company | |||||||
5.00%, (100, 01/21/21) (c) | 53,000 | 49,145 | |||||
GFL Environmental Inc. | |||||||
4.00%, 08/01/28 (a) | 91,000 | 91,742 | |||||
Graham Packaging Company Europe LLC | |||||||
7.13%, 08/15/28 (a) | 138,000 | 151,805 | |||||
Howmet Aerospace Inc. | |||||||
6.88%, 05/01/25 | 108,000 | 127,024 | |||||
Intelligent Packaging Limited Purchaser Inc. | |||||||
6.00%, 09/15/28 (a) | 131,000 | 134,642 | |||||
Masonite International Corporation | |||||||
5.38%, 02/01/28 (a) | 60,000 | 64,202 | |||||
Navistar International Corporation | |||||||
6.63%, 11/01/25 (a) | 268,000 | 280,867 | |||||
Park Aerospace Holdings Limited | |||||||
5.25%, 08/15/22 (a) | 4,000 | 4,192 | |||||
4.50%, 03/15/23 (a) | 45,000 | 47,240 | |||||
Prime Security Services Borrower, LLC | |||||||
5.25%, 04/15/24 (a) | 52,000 | 55,536 | |||||
5.75%, 04/15/26 (a) | 81,000 | 88,845 | |||||
6.25%, 01/15/28 (a) | 136,000 | 145,897 | |||||
Rolls-Royce Plc | |||||||
5.75%, 10/15/27 (a) | 182,000 | 201,911 | |||||
SkyMiles IP Ltd. | |||||||
4.50%, 10/20/25 (a) | 9,000 | 9,635 | |||||
4.75%, 10/20/28 (a) | 42,000 | 45,808 | |||||
Spirit Airlines, Inc. | |||||||
8.00%, 09/20/25 (a) | 140,462 | 158,113 | |||||
Standard Industries Inc. | |||||||
4.75%, 01/15/28 (a) | 65,000 | 68,463 | |||||
Stericycle, Inc. | |||||||
3.88%, 01/15/29 (a) | 27,000 | 27,706 | |||||
Tempo Acquisition, LLC | |||||||
6.75%, 06/01/25 (a) | 119,000 | 122,782 | |||||
TransDigm Inc. | |||||||
6.50%, 05/15/25 | 155,000 | 159,748 | |||||
8.00%, 12/15/25 (a) | 34,000 | 37,536 | |||||
6.25%, 03/15/26 (a) | 296,000 | 315,429 | |||||
5.50%, 11/15/27 | 110,000 | 115,706 | |||||
Transdigm UK Holdings PLC | |||||||
6.88%, 05/15/26 | 51,000 | 54,004 | |||||
Triumph Group, Inc. | |||||||
8.88%, 06/01/24 (a) | 56,000 | 61,452 | |||||
Uber Technologies, Inc. | |||||||
7.50%, 05/15/25 - 09/15/27 (a) | 278,000 | 304,484 | |||||
United Rentals (North America), Inc. | |||||||
3.88%, 11/15/27 | 239,000 | 250,651 | |||||
Univar Solutions USA Inc. | |||||||
5.13%, 12/01/27 (a) | 35,000 | 37,002 | |||||
Vertical Holdco GmbH | |||||||
7.63%, 07/15/28 (a) | 258,000 | 281,557 | |||||
Watco Companies, L.L.C. | |||||||
6.50%, 06/15/27 (a) | 128,000 | 138,889 | |||||
5,772,134 | |||||||
Health Care 7.2% | |||||||
AdaptHealth, LLC | |||||||
6.13%, 08/01/28 (a) | 45,000 | 48,388 | |||||
4.63%, 08/01/29 (a) | 54,000 | 55,429 | |||||
Bausch Health Companies Inc. | |||||||
6.13%, 04/15/25 (a) | 255,000 | 262,733 | |||||
5.50%, 11/01/25 (a) | 69,000 | 71,342 | |||||
8.50%, 01/31/27 (a) | 446,000 | 496,243 | |||||
7.00%, 01/15/28 (a) | 51,000 | 55,960 | |||||
5.00%, 01/30/28 (a) | 40,000 | 41,194 | |||||
6.25%, 02/15/29 (a) | 50,000 | 54,271 | |||||
5.25%, 02/15/31 (a) | 88,000 | 91,920 | |||||
Catalent Pharma Solutions, Inc. | |||||||
5.00%, 07/15/27 (a) | 15,000 | 15,834 | |||||
Centene Corporation | |||||||
5.38%, 08/15/26 (a) | 48,000 | 50,683 | |||||
4.25%, 12/15/27 | 95,000 | 100,769 | |||||
4.63%, 12/15/29 | 53,000 | 58,649 | |||||
3.38%, 02/15/30 | 35,000 | 36,829 | |||||
3.00%, 10/15/30 | 72,000 | 76,171 | |||||
Centene Escrow I Corporation | |||||||
5.38%, 06/01/26 (a) | 181,000 | 190,703 | |||||
Community Health Systems, Inc. | |||||||
8.63%, 01/15/24 (a) | 100,000 | 104,316 | |||||
6.63%, 02/15/25 (a) | 130,000 | 136,838 | |||||
8.00%, 03/15/26 (a) | 212,000 | 229,129 | |||||
5.63%, 03/15/27 (a) | 38,000 | 40,826 | |||||
6.00%, 01/15/29 (a) | 22,000 | 23,746 | |||||
Endo Designated Activity Company | |||||||
9.50%, 07/31/27 (a) | 258,000 | 287,480 | |||||
6.00%, 06/30/28 (a) | 118,000 | 98,180 | |||||
HCA Inc. | |||||||
5.38%, 09/01/26 | 47,000 | 53,939 | |||||
3.50%, 09/01/30 | 142,000 | 150,152 | |||||
IQVIA Inc. | |||||||
5.00%, 05/15/27 (a) | 125,000 | 132,998 | |||||
Mednax, Inc. | |||||||
6.25%, 01/15/27 (a) | 117,000 | 125,482 | |||||
Ortho-Clinical Diagnostics, Inc. | |||||||
7.38%, 06/01/25 (a) | 58,000 | 61,586 | |||||
7.25%, 02/01/28 (a) | 45,000 | 47,470 | |||||
Par Pharmaceutical, Inc. | |||||||
7.50%, 04/01/27 (a) | 89,000 | 96,110 | |||||
Syneos Health, Inc. | |||||||
3.63%, 01/15/29 (a) | 51,000 | 51,125 | |||||
Tenet Healthcare Corporation | |||||||
6.75%, 06/15/23 | 131,000 | 140,754 | |||||
7.50%, 04/01/25 (a) | 118,000 | 129,137 | |||||
7.00%, 08/01/25 (b) | 53,000 | 54,783 | |||||
4.88%, 01/01/26 (a) | 93,000 | 97,186 | |||||
5.13%, 11/01/27 (a) | 183,000 | 193,994 | |||||
6.13%, 10/01/28 (a) | 140,000 | 145,771 | |||||
4,108,120 | |||||||
Materials 7.0% | |||||||
Ardagh Packaging Finance Public Limited Company | |||||||
5.25%, 08/15/27 (a) | 217,000 | 227,039 | |||||
Carpenter Technology Corporation | |||||||
6.38%, 07/15/28 | 63,000 | 69,103 | |||||
Cascades Inc. | |||||||
5.13%, 01/15/26 (a) | 23,000 | 24,331 | |||||
5.38%, 01/15/28 (a) | 61,000 | 64,857 | |||||
CEMEX S.A.B. de C.V. | |||||||
5.70%, 01/11/25 (a) | 30,000 | 30,608 | |||||
5.45%, 11/19/29 (a) | 205,000 | 225,049 | |||||
CF Industries, Inc. | |||||||
5.38%, 03/15/44 | 50,000 | 63,305 | |||||
Cleveland-Cliffs Inc. | |||||||
6.75%, 03/15/26 (a) | 161,000 | 173,586 | |||||
5.88%, 06/01/27 | 69,000 | 70,284 | |||||
CVR Partners, LP | |||||||
9.25%, 06/15/23 (a) | 279,000 | 280,457 | |||||
First Quantum Minerals Ltd | |||||||
6.88%, 10/15/27 (a) | 140,000 | 151,733 | |||||
Flex Acquisition Company, Inc. | |||||||
6.88%, 01/15/25 (a) | 95,000 | 96,592 | |||||
7.88%, 07/15/26 (a) | 80,000 | 84,533 | |||||
FMG Resources (August 2006) Pty Ltd | |||||||
5.13%, 03/15/23 (a) | 95,000 | 100,150 | |||||
5.13%, 05/15/24 (a) (b) | 65,000 | 70,499 | |||||
Freeport-McMoRan Inc. | |||||||
4.55%, 11/14/24 | 74,000 | 80,949 | |||||
5.00%, 09/01/27 | 117,000 | 124,329 | |||||
5.40%, 11/14/34 | 217,000 | 271,284 | |||||
5.45%, 03/15/43 | 44,000 | 54,801 | |||||
FXI Holdings, Inc. | |||||||
7.88%, 11/01/24 (a) | 108,000 | 109,620 | |||||
Hexion Inc. | |||||||
7.88%, 07/15/27 (a) | 163,000 | 174,704 | |||||
Hudbay Minerals Inc. | |||||||
6.13%, 04/01/29 (a) | 259,000 | 280,092 | |||||
Mercer International Inc. | |||||||
7.38%, 01/15/25 | 192,000 | 199,726 |
See accompanying Notes to Financial Statements.
Abbreviations, counterparties and additional footnotes are defined on page 20
15
PPMFunds
Schedules of Investments
December 31, 2020
Shares/Par1 | Value ($) | ||||||
5.50%, 01/15/26 | 36,000 | 36,674 | |||||
NOVA Chemicals Corporation | |||||||
4.88%, 06/01/24 (a) | 128,000 | 133,639 | |||||
5.25%, 08/01/23 - 06/01/27 (a) | 355,000 | 375,308 | |||||
Novelis Corporation | |||||||
4.75%, 01/30/30 (a) | 85,000 | 91,602 | |||||
Rayonier Advanced Materials Inc. | |||||||
7.63%, 01/15/26 (a) | 141,384 | 147,336 | |||||
Reynolds Group Holdings Inc. | |||||||
5.13%, 07/15/23 (a) | 10,000 | 10,123 | |||||
The Chemours Company | |||||||
5.75%, 11/15/28 (a) | 115,000 | 117,400 | |||||
United States Steel Corporation | |||||||
12.00%, 06/01/25 (a) | 60,000 | 69,448 | |||||
4,009,161 | |||||||
Consumer Staples 6.1% | |||||||
Albertsons Companies, Inc. | |||||||
5.75%, 03/15/25 | 40,000 | 41,257 | |||||
Allied Universal Holdco LLC | |||||||
6.63%, 07/15/26 (a) | 137,000 | 146,015 | |||||
9.75%, 07/15/27 (a) | 79,000 | 85,821 | |||||
Ashtead Capital, Inc. | |||||||
4.13%, 08/15/25 (a) | 33,000 | 33,916 | |||||
5.25%, 08/01/26 (a) | 139,000 | 147,125 | |||||
Edgewell Personal Care Colombia S A S | |||||||
5.50%, 06/01/28 (a) | 47,000 | 50,472 | |||||
JBS Investments II GmbH | |||||||
5.75%, 01/15/28 (a) | 208,000 | 223,201 | |||||
JBS USA Food Company | |||||||
6.50%, 04/15/29 (a) | 48,000 | 55,866 | |||||
Kraft Foods Group, Inc. | |||||||
5.00%, 06/04/42 | 122,000 | 142,892 | |||||
Kraft Heinz Foods Company | |||||||
3.88%, 05/15/27 (a) | 37,000 | 39,898 | |||||
4.25%, 03/01/31 (a) | 89,000 | 98,950 | |||||
4.63%, 10/01/39 (a) | 218,000 | 242,342 | |||||
4.88%, 10/01/49 (a) | 153,000 | 177,097 | |||||
Matterhorn Merger Sub, LLC | |||||||
8.50%, 06/01/26 (a) | 142,000 | 148,354 | |||||
MPH Acquisition Holdings LLC | |||||||
5.75%, 11/01/28 (a) (b) | 232,000 | 227,732 | |||||
Nielsen Finance LLC | |||||||
5.88%, 10/01/30 (a) | 140,000 | 158,407 | |||||
Performance Food Group, Inc. | |||||||
6.88%, 05/01/25 (a) (b) | 12,000 | 12,852 | |||||
Pilgrim's Pride Corporation | |||||||
5.75%, 03/15/25 (a) | 159,000 | 163,139 | |||||
5.88%, 09/30/27 (a) | 104,000 | 112,751 | |||||
Post Holdings, Inc. | |||||||
5.63%, 01/15/28 (a) | 142,000 | 151,684 | |||||
4.63%, 04/15/30 (a) | 77,000 | 80,988 | |||||
Prime Security Services Borrower, LLC | |||||||
3.38%, 08/31/27 (a) | 55,000 | 54,769 | |||||
Sabre GLBL Inc. | |||||||
7.38%, 09/01/25 (a) | 74,000 | 80,500 | |||||
Safeway Inc. | |||||||
5.88%, 02/15/28 (a) | 157,000 | 170,860 | |||||
Sigma Holdco B.V. | |||||||
7.88%, 05/15/26 (a) | 181,000 | 186,539 | |||||
United Natural Foods, Inc. | |||||||
6.75%, 10/15/28 (a) | 270,000 | 282,219 | |||||
Verscend Holding Corp. | |||||||
9.75%, 08/15/26 (a) | 147,000 | 159,773 | |||||
3,475,419 | |||||||
Information Technology 3.8% | |||||||
ams AG | |||||||
7.00%, 07/31/25 (a) | 314,000 | 339,503 | |||||
Banff Merger Sub Inc. | |||||||
9.75%, 09/01/26 (a) | 236,000 | 254,846 | |||||
Boxer Parent Company Inc. | |||||||
7.13%, 10/02/25 (a) | 46,000 | 49,912 | |||||
Commscope Finance LLC | |||||||
6.00%, 03/01/26 (a) | 95,000 | 99,998 | |||||
8.25%, 03/01/27 (a) | 93,000 | 99,507 | |||||
CommScope Holding Company, Inc. | |||||||
6.00%, 06/15/25 (a) | 30,000 | 30,672 | |||||
Dell Inc. | |||||||
6.50%, 04/15/38 | 51,000 | 63,243 | |||||
Entegris, Inc. | |||||||
4.38%, 04/15/28 (a) | 82,000 | 87,788 | |||||
LogMeIn, Inc. | |||||||
5.50%, 09/01/27 (a) | 67,000 | 70,148 | |||||
NCR Corporation | |||||||
8.13%, 04/15/25 (a) | 65,000 | 72,278 | |||||
5.75%, 09/01/27 (a) | 79,000 | 83,840 | |||||
5.25%, 10/01/30 (a) | 80,000 | 85,940 | |||||
Open Text Corporation | |||||||
3.88%, 02/15/28 (a) | 112,000 | 116,478 | |||||
Presidio Holdings, Inc. | |||||||
8.25%, 02/01/28 (a) | 72,000 | 79,379 | |||||
SS&C Technologies, Inc. | |||||||
5.50%, 09/30/27 (a) | 126,000 | 134,532 | |||||
Tempo Acquisition, LLC | |||||||
5.75%, 06/01/25 (a) | 75,000 | 79,638 | |||||
Unisys Corporation | |||||||
6.88%, 11/01/27 (a) | 106,000 | 116,188 | |||||
ViaSat, Inc. | |||||||
5.63%, 09/15/25 - 04/15/27 (a) | 230,000 | 237,657 | �� | ||||
6.50%, 07/15/28 (a) (b) | 91,000 | 98,377 | |||||
2,199,924 | |||||||
Real Estate 1.5% | |||||||
CSL Capital, LLC | |||||||
6.00%, 04/15/23 (a) | 60,000 | 61,200 | |||||
Cushman & Wakefield PLC | |||||||
6.75%, 05/15/28 (a) | 93,000 | 102,513 | |||||
ESH Hospitality, Inc. | |||||||
5.25%, 05/01/25 (a) | 106,000 | 108,614 | |||||
MGM Growth Properties Operating Partnership LP | |||||||
5.75%, 02/01/27 | 76,000 | 85,352 | |||||
4.50%, 01/15/28 | 6,000 | 6,390 | |||||
Retail Opportunity Investments Partnership, LP | |||||||
4.00%, 12/15/24 | 140,000 | 146,632 | |||||
Service Properties Trust | |||||||
5.25%, 02/15/26 | 147,000 | 148,240 | |||||
Uniti Group Inc. | |||||||
7.88%, 02/15/25 (a) | 55,000 | 59,061 | |||||
VICI Properties Inc. | |||||||
4.25%, 12/01/26 (a) | 51,000 | 52,942 | |||||
3.75%, 02/15/27 (a) | 59,000 | 60,305 | |||||
4.63%, 12/01/29 (a) | 15,000 | 16,121 | |||||
847,370 | |||||||
Utilities 1.1% | |||||||
Calpine Corporation | |||||||
5.25%, 06/01/26 (a) | 143,000 | 148,006 | |||||
4.50%, 02/15/28 (a) | 67,000 | 69,977 | |||||
3.75%, 03/01/31 (a) | 115,000 | 113,838 | |||||
Pacific Gas And Electric Company | |||||||
5.00%, 07/01/28 | 39,000 | 41,664 | |||||
5.25%, 07/01/30 | 205,000 | 225,910 | |||||
The AES Corporation | |||||||
3.95%, 07/15/30 (a) | 25,000 | 28,244 | |||||
627,639 | |||||||
Total Corporate Bonds And Notes (cost $50,104,577) | 53,530,190 | ||||||
SENIOR FLOATING RATE INSTRUMENTS 2.3% | |||||||
Consumer Discretionary 0.7% | |||||||
Adient US LLC | |||||||
Term Loan B, 4.40%, (1 Month USD LIBOR + 4.25%), 04/25/24 (j) | 55,263 | 55,171 | |||||
Term Loan B, 4.46%, (3 Month USD LIBOR + 4.25%), 04/25/24 (j) | 18,797 | 18,766 | |||||
Bass Pro Group, LLC | |||||||
Term Loan B, 5.75%, (3 Month USD LIBOR + 5.00%), 11/15/23 (j) | 170,669 | 170,975 | |||||
Caesars Resort Collection, LLC | |||||||
2020 Term Loan B1, 4.65%, (1 Month USD LIBOR + 4.50%), 06/19/25 (j) | 16,667 | 16,672 | |||||
2020 Term Loan B1, 4.65%, (1 Month USD LIBOR + 4.50%), 06/19/25 (j) | 33,208 | 33,219 |
See accompanying Notes to Financial Statements.
Abbreviations, counterparties and additional footnotes are defined on page 20
16
PPMFunds
Schedules of Investments
December 31, 2020
Shares/Par1 | Value ($) | ||||||
Mileage Plus Holdings LLC | |||||||
2020 Term Loan B, 6.25%, (3 Month USD LIBOR + 5.25%), 12/31/23 (j) | 49,200 | 51,138 | |||||
Mohegan Tribal Gaming Authority | |||||||
2016 Term Loan B, 6.37%, (3 Month USD LIBOR + 5.38%), 10/30/23 (j) | 39,263 | 37,433 | |||||
SkyMiles IP Ltd. | |||||||
2020 Skymiles Term Loan B, 4.75%, (3 Month USD LIBOR + 3.75%), 09/16/27 (j) | 14,000 | 14,495 | |||||
397,869 | |||||||
Information Technology 0.6% | |||||||
Almonde, Inc. | |||||||
USD 1st Lien Term Loan, 4.50%, (6 Month USD LIBOR + 3.50%), 04/26/24 (j) | 66,153 | 64,727 | |||||
Banff Merger Sub Inc. | |||||||
2018 USD Term Loan B, 4.40%, (1 Month USD LIBOR + 4.25%), 06/30/25 (j) | 78,794 | 78,377 | |||||
Cornerstone OnDemand, Inc. | |||||||
Term Loan B, 4.39%, (1 Month USD LIBOR + 4.25%), 04/22/27 (j) | 71,268 | 71,509 | |||||
LogMeIn, Inc. | |||||||
Term Loan B, 4.90%, (1 Month USD LIBOR + 4.75%), 08/31/27 (j) | 68,000 | 67,703 | |||||
Verifone Systems, Inc. | |||||||
2018 1st Lien Term Loan, 4.22%, (3 Month USD LIBOR + 4.00%), 08/09/25 (j) | 63,123 | 60,879 | |||||
343,195 | |||||||
Communication Services 0.3% | |||||||
Consolidated Communications, Inc. | |||||||
2020 Term Loan B, 5.75%, (3 Month USD LIBOR + 4.75%), 09/15/27 (j) | 57,000 | 57,181 | |||||
iHeartCommunications, Inc. | |||||||
2020 Term Loan, 3.15%, (1 Month USD LIBOR + 3.00%), 05/01/26 (j) | 52,470 | 51,552 | |||||
Intelsat Jackson Holdings S.A. | |||||||
2020 DIP Term Loan, 6.50%, (3 Month USD LIBOR + 5.50%), 07/28/21 (j) | 18,796 | 19,144 | |||||
Zayo Group Holdings, Inc. | |||||||
USD Term Loan , 3.15%, (1 Month USD LIBOR + 3.00%), 02/18/27 (j) | 60,574 | 60,119 | |||||
187,996 | |||||||
Financials 0.3% | |||||||
Acrisure, LLC | |||||||
2020 Term Loan B, 3.65%, (1 Month USD LIBOR + 3.50%), 01/30/27 (j) | 97,017 | 94,976 | |||||
Advisor Group, Inc. | |||||||
2019 Term Loan B, 5.15%, (1 Month USD LIBOR + 5.00%), 07/31/26 (j) | 84,573 | 83,657 | |||||
178,633 | |||||||
Health Care 0.2% | |||||||
Alphabet Holding Company, Inc. | |||||||
2017 1st Lien Term Loan, 3.65%, (1 Month USD LIBOR + 3.50%), 08/15/24 (j) | 84,687 | 83,817 | |||||
Industrials 0.1% | |||||||
Dynasty Acquisition Co., Inc. | |||||||
2020 CAD Term Loan B2, 3.75%, (3 Month USD LIBOR + 3.50%), 04/06/26 (j) | 23,824 | 22,633 | |||||
2020 Term Loan B1, 3.75%, (3 Month USD LIBOR + 3.50%), 04/06/26 (j) | 44,313 | 42,098 | |||||
64,731 | |||||||
Energy 0.1% | |||||||
Lower Cadence Holdings LLC | |||||||
Term Loan B, 4.15%, (1 Month USD LIBOR + 4.00%), 05/10/26 (j) | 63,992 | 62,352 | |||||
Total Senior Floating Rate Instruments (cost $1,312,846) | 1,318,593 | ||||||
INVESTMENT COMPANIES 1.1% | |||||||
Eaton Vance Senior Floating-Rate Trust | 3,750 | 47,738 | |||||
SPDR Bloomberg Barclays High Yield Bond ETF | 5,329 | 580,540 | |||||
Total Investment Companies (cost $580,655) | 628,278 | ||||||
PREFERRED STOCKS 0.2% | |||||||
Consumer Discretionary 0.2% | |||||||
Qurate Retail, Inc., 8.00%, 03/15/31 | 1,409 | 139,491 | |||||
Total Preferred Stocks (cost $140,393) | 139,491 | ||||||
COMMON STOCKS 0.1% | |||||||
Energy 0.1% | |||||||
MPLX LP | 2,200 | 47,630 | |||||
Communication Services 0.0% | |||||||
Clear Channel Outdoor Holdings, Inc. (g) | 8,143 | 13,436 | |||||
iHeartMedia, Inc. - Class A (b) (g) | 386 | 5,010 | |||||
18,446 | |||||||
Total Common Stocks (cost $121,632) | 66,076 | ||||||
WARRANTS 0.1% | |||||||
iHeartMedia, Inc. - Class A (g) (m) | 2,897 | 33,843 | |||||
Total Warrants (cost $53,585) | 33,843 | ||||||
NON-U.S. GOVERNMENT AGENCY ASSET-BACKED SECURITIES 0.0% | |||||||
Air Canada 2020-2 Class A Pass Through Trust | |||||||
Series 2020-A-2, 5.25%, 04/01/29 | 20,000 | 21,301 | |||||
Total Non-U.S. Government Agency Asset-Backed Securities (cost $20,000) | 21,301 | ||||||
SHORT TERM INVESTMENTS 3.2% | |||||||
Investment Companies 1.7% | |||||||
State Street Institutional U.S. Government Money Market Fund - Premier Class, 0.01% (n) | 965,109 | 965,109 | |||||
Securities Lending Collateral 1.5% | |||||||
State Street Navigator Securities Lending Government Money Market Portfolio, 0.08% (n) | 882,100 | 882,100 | |||||
Total Short Term Investments (cost $1,847,209) | 1,847,209 | ||||||
Total Investments 100.2% (cost $54,180,897) | 57,584,981 | ||||||
Other Assets and Liabilities, Net (0.2)% | (123,943) | ||||||
Total Net Assets 100.0% | 57,461,038 |
(a) Security is exempt from registration under the Securities Act of 1933, as amended. As of December 31, 2020, the value and the percentage of net assets of these securities was $35,185,201 and 61.2% of the Fund.
(b) All or a portion of the security was on loan as of December 31, 2020.
(c) Perpetual security. Next contractual call price and date are presented in parentheses, if applicable.
(d) Security is a step-up bond where the coupon may increase or step up at a future date or as the result of an upgrade or downgrade to the credit rating of the issuer. Rate stated was the coupon as of December 31, 2020.
(e) The interest rate for this security is inversely affected by upgrades or downgrades to the credit rating of the issuer. Rate stated was the coupon as of December 31, 2020.
(f) Pay-in-kind security. Stated coupon is the pay-in-kind rate. The interest earned by the security may be paid in cash or additional par.
(g) Non-income producing security.
(h) As of December 31, 2020, issuer was in bankruptcy and/or was in default relating to principal and/or interest. Partial or no payments were paid on the last interest or dividend date.
(i) Convertible security.
(j) Security has a variable rate. Interest rates reset periodically. Rate stated was in effect as of December 31, 2020. For securities based on a published reference rate and spread, the reference rate and spread are presented. Certain variable rate securities do not indicate a reference rate and spread because they are determined by the issuer, remarketing agent, or offering documents and are based on current market conditions. The coupon rate for securities with certain features outlined in the offering documents may vary from the stated reference rate and spread. This includes, but is not limited to, securities with deferred rates, contingent distributions, caps, floors, and fixed-rate to float-rate features. In addition, variable rates for government and agency collateralized mortgage obligations (“CMO”) and mortgage-backed securities (“MBS”) are determined by tranches of underlying mortgage-backed security pools’ cash flows into securities and pass-through rates which reflect the rate earned on the asset pool after management and guarantee fees are paid to the securitizing corporation. CMO and MBS variable rates are determined by a formula set forth in the security’s offering documents.
(k) Security fair valued in good faith as a Level 3 security in accordance with the procedures approved by the Board of Trustees. Good faith fair valued securities are classified for Financial Accounting Standards Board ("FASB") Accounting Standards Codification ("ASC") Topic 820 "Fair Value Measurement" based on the applicable valuation inputs. See FASB ASC Topic 820 in the Notes to Financial Statements.
(l) Security is restricted to resale to institutional investors. See Restricted Securities table following the Schedules of Investments.
(m) Security fair valued in good faith as a Level 2 security in accordance with the
See accompanying Notes to Financial Statements.
Abbreviations, counterparties and additional footnotes are defined on page 20
17
PPMFunds
Schedules of Investments
December 31, 2020
procedures approved by the Board of Trustees. Good faith fair valued securities are classified for Financial Accounting Standards Board ("FASB") Accounting Standards Codification ("ASC") Topic 820 "Fair Value Measurement" based on the applicable valuation inputs. See FASB ASC Topic 820 in the Notes to Financial Statements.
(n) Yield changes daily to reflect current market conditions. Rate was the quoted yield as of December 31, 2020.
PPM High Yield Core Fund — Restricted Securities | |||||||||
Initial Acquisition | Cost ($) | Value ($) | Percent of Net Assets (%) | ||||||
Nordic Aviation Capital, 5.04%, 02/27/24 | 02/06/20 | 81,782 | 63,626 | 0.1 | |||||
Nordic Aviation Capital, 7.08%, 03/14/27 | 10/01/19 | 129,133 | 101,370 | 0.2 | |||||
210,915 | 164,996 | 0.3 |
See accompanying Notes to Financial Statements.
Abbreviations, counterparties and additional footnotes are defined on page 20
18
PPMFunds
Schedules of Investments
December 31, 2020
Shares/Par1 | Value ($) | |||||
PPM Small Cap Value Fund | ||||||
COMMON STOCKS 98.8% | ||||||
Financials 28.5% | ||||||
Ameris Bancorp | 5,950 | 226,517 | ||||
Axos Financial, Inc. (a) | 10,000 | 375,300 | ||||
Banc of California, Inc. | 13,400 | 197,114 | ||||
Evercore Inc. - Class A | 2,550 | 279,582 | ||||
First Horizon National Corporation | 15,100 | 192,676 | ||||
Home BancShares, Inc. | 15,600 | 303,888 | ||||
Houlihan Lokey Inc. - Class A | 4,150 | 279,004 | ||||
Independent Bank Corp. | 4,700 | 343,288 | ||||
Janus Henderson Group PLC | 7,650 | 248,701 | ||||
PacWest Bancorp | 8,300 | 210,820 | ||||
Renasant Corporation | 7,725 | 260,178 | ||||
Sterling Bancorp | 17,150 | 308,357 | ||||
TCF Financial Corporation | 7,250 | 268,395 | ||||
Western Alliance Bancorp | 4,800 | 287,760 | ||||
3,781,580 | ||||||
Industrials 17.2% | ||||||
Aerojet Rocketdyne Holdings, Inc. (a) | 4,450 | 235,182 | ||||
Apogee Enterprises, Inc. | 9,350 | 296,208 | ||||
GATX Corporation | 3,000 | 249,540 | ||||
Kennametal Inc. | 7,850 | 284,484 | ||||
MasTec Inc. (a) | 4,900 | 334,082 | ||||
SkyWest Inc. (a) | 8,500 | 342,635 | ||||
Spirit Aerosystems Holdings Inc. - Class A | 5,650 | 220,859 | ||||
Terex Corp. (a) | 9,350 | 326,221 | ||||
2,289,211 | ||||||
Consumer Discretionary 11.8% | ||||||
American Axle & Manufacturing Holdings, Inc. (a) | 34,750 | 289,815 | ||||
Foot Locker, Inc. | 4,150 | 167,826 | ||||
Helen of Troy Ltd (a) | 1,350 | 299,956 | ||||
KB Home | 6,800 | 227,936 | ||||
Penske Automotive Group, Inc. | 5,000 | 296,950 | ||||
Skechers U.S.A. Inc. - Class A (a) | 7,950 | 285,723 | ||||
1,568,206 | ||||||
Information Technology 10.6% | ||||||
Avaya Holdings Corp. (a) | 6,525 | 124,954 | ||||
Belden Inc. | 3,400 | 142,460 | ||||
Benchmark Electronics, Inc. | 5,200 | 140,452 | ||||
CACI International Inc. - Class A (a) | 450 | 112,199 | ||||
Concentrix Solutions Corporation (a) | 1,300 | 128,310 | ||||
CSG Systems International, Inc. | 2,450 | 110,422 | ||||
KBR, Inc. | 4,700 | 145,371 | ||||
Photronics Inc. (a) | 13,600 | 151,776 | ||||
Semtech Corp. (a) | 2,950 | 212,666 | ||||
Verint Systems Inc. (a) | 2,150 | 144,437 | ||||
1,413,047 | ||||||
Real Estate 7.9% | ||||||
Brandywine Realty Trust | 17,600 | 209,616 | ||||
DiamondRock Hospitality Co. (a) | 36,950 | 304,837 | ||||
Kite Realty Naperville, LLC | 20,000 | 299,200 | ||||
Physicians Realty Trust | 13,050 | 232,290 | ||||
1,045,943 | ||||||
Health Care 7.9% | ||||||
Integer Holdings Corporation (a) | 3,950 | 320,700 | ||||
Lantheus Holdings Inc. (a) | 13,600 | 183,464 | ||||
Magellan Health Services Inc. (a) | 3,600 | 298,224 | ||||
Premier Healthcare Solutions, Inc. - Class A | 6,900 | 242,190 | ||||
1,044,578 | ||||||
Materials 5.2% | ||||||
Allegheny Technologies Incorporated (a) | 13,150 | 220,526 | ||||
Huntsman Corp. | 10,850 | 272,769 | ||||
Reliance Steel & Aluminum Co. | 1,700 | 203,575 | ||||
696,870 | ||||||
Energy 3.8% | ||||||
Cimarex Energy Co. | 8,200 | 307,582 | ||||
PBF Energy Inc. - Class A (a) | 26,800 | 190,280 | ||||
497,862 | ||||||
Consumer Staples 2.2% | ||||||
Primo Water Holdings LLC | 11,450 | 179,536 | ||||
Sanderson Farms Inc. | 850 | 112,370 | ||||
291,906 | ||||||
Communication Services 2.2% | ||||||
Meredith Corporation (a) | 15,100 | 289,920 | ||||
Utilities 1.5% | ||||||
IDACORP Inc. | 2,100 | 201,663 | ||||
Total Common Stocks (cost $9,969,513) | 13,120,786 | |||||
SHORT TERM INVESTMENTS 1.3% | ||||||
Investment Companies 1.3% | ||||||
State Street Institutional U.S. Government Money Market Fund - Premier Class, 0.01% (b) | 173,527 | 173,527 | ||||
Total Short Term Investments (cost $173,527) | 173,527 | |||||
Total Investments 100.1% (cost $10,143,040) | 13,294,313 | |||||
Other Assets and Liabilities, Net (0.1)% | (8,494) | |||||
Total Net Assets 100.0% | 13,285,819 |
(a) Non-income producing security.
(b) Yield changes daily to reflect current market conditions. Rate was the quoted yield as of December 31, 2020.
See accompanying Notes to Financial Statements.
Abbreviations, counterparties and additional footnotes are defined on page 20
19
PPMFunds
Schedules of Investments
December 31, 2020
Currency Abbreviations:
USD - United States Dollar |
Abbreviations:
CDX.NA.IG - Credit Derivatives Index - North American - Investment Grade | |
DIP - Debtor-in-Possession | |
ETF - Exchange Traded Fund | |
LIBOR – London Interbank Offered Rate | |
REMIC - Real Estate Mortgage Investment Conduit | |
SPDR - Standard & Poor Depositary Receipt | |
TBA - To Be Announced (Securities purchased on a delayed delivery basis) | |
U.S. or US - United States | |
Counterparty Abbreviations:
MLP – Merrill Lynch Professional Clearing Corp. |
1Par and notional amounts are listed in USD unless otherwise noted. Futures are quoted in contracts.
2For Funds with derivatives that received or paid periodic payments, the frequency of periodic payments are defined as follows: (A) - Annually; (E) - Expiration Date; (M) - Monthly; (Q) - Quarterly; (S) - Semi-Annually.
See accompanying Notes to Financial Statements.
20
PPMFunds
Statements of Assets and Liabilities
December 31, 2020
|
| PPM Core Plus Fixed Income Fund |
| PPM High Yield Core Fund |
| PPM Small Cap Value Fund |
|
| |||
Assets |
|
|
|
|
|
|
|
|
|
| |
Investments, at value | $ | 59,371,086 |
| $ | 57,584,981 |
| $ | 13,294,313 |
|
| |
Variation margin on futures |
| 7,680 |
|
| — |
|
| — |
|
| |
Cash |
| 3,415 |
|
| 5,154 |
|
| 2 |
|
| |
Receivable from: |
|
|
|
|
|
|
|
|
|
| |
| Investment securities sold |
| 4,599,333 |
|
| 86,066 |
|
| 121,634 |
|
|
| Dividends and interest |
| 356,202 |
|
| 846,021 |
|
| 9,310 |
|
|
| Adviser |
| 40,239 |
|
| 33,233 |
|
| 13,628 |
|
|
| Deposits with brokers and counterparties |
| 69,056 |
|
| — |
|
| — |
|
|
Other assets |
| — |
|
| 8,588 |
|
| — |
|
| |
Total assets |
| 64,447,011 |
|
| 58,564,043 |
|
| 13,438,887 |
|
| |
Liabilities |
|
|
|
|
|
|
|
|
|
| |
Variation margin on futures |
| 5,250 |
|
| — |
|
| — |
|
| |
Variation margin on swap agreements |
| 259 |
|
| — |
|
| — |
|
| |
Payable for: |
|
|
|
|
|
|
|
|
|
| |
| Investment securities purchased |
| 7,960,118 |
|
| 148,990 |
|
| 123,778 |
|
|
| Return of securities loaned |
| 83,640 |
|
| 882,100 |
|
| — |
|
|
| Advisory fees |
| 18,940 |
|
| 26,511 |
|
| 9,207 |
|
|
| Administrative fees |
| 4,735 |
|
| 4,820 |
|
| 1,151 |
|
|
| Board of Trustees fees |
| 1,772 |
|
| 1,806 |
|
| 422 |
|
|
| Chief Compliance Officer fees |
| 2,956 |
|
| 3,012 |
|
| 705 |
|
|
| Other expenses |
| 44,613 |
|
| 35,766 |
|
| 17,805 |
|
|
Total liabilities |
| 8,122,283 |
|
| 1,103,005 |
|
| 153,068 |
|
| |
Net assets | $ | 56,324,728 |
| $ | 57,461,038 |
| $ | 13,285,819 |
|
| |
Net assets consist of: |
|
|
|
|
|
|
|
|
|
| |
Paid-in capital | $ | 52,496,137 |
| $ | 56,768,326 |
| $ | 12,253,401 |
|
| |
Total distributable earnings (loss) |
| 3,828,591 |
|
| 692,712 |
|
| 1,032,418 |
|
| |
Net assets | $ | 56,324,728 |
| $ | 57,461,038 |
| $ | 13,285,819 |
|
| |
Net assets - Institutional Class | $ | 56,324,728 |
| $ | 57,461,038 |
| $ | 13,285,819 |
|
| |
Shares outstanding - Institutional Class |
| 5,246,033 |
|
| 5,701,363 |
|
| 1,399,332 |
|
| |
Net asset value per share - Institutional Class | $ | 10.74 |
| $ | 10.08 |
| $ | 9.49 |
|
| |
Investments, at cost | $ | 55,761,457 |
| $ | 54,180,897 |
| $ | 10,143,040 |
|
| |
Securities on loan included in |
|
|
|
|
|
|
|
|
|
| |
| Investments, at value |
| 81,871 |
|
| 868,074 |
|
| — |
|
|
See accompanying Notes to Financial Statements.
21
PPMFunds
Statements of Operations
For the Year Ended December 31, 2020
|
|
| PPM Core Plus Fixed Income Fund |
| PPM High Yield Core Fund |
| PPM Small Cap Value Fund |
|
| |||
Investment income |
|
|
|
|
|
|
|
|
|
| ||
Dividends | $ | 4,325 |
| $ | 64,919 |
| $ | 188,615 |
|
| ||
Interest |
| 1,639,000 |
|
| 3,154,952 |
|
| — |
|
| ||
Securities lending |
| 1,107 |
|
| 11,376 |
|
| 115 |
|
| ||
Total investment income |
| 1,644,432 |
|
| 3,231,247 |
|
| 188,730 |
|
| ||
|
|
|
|
|
|
|
|
|
|
|
|
|
Expenses |
|
|
|
|
|
|
|
|
|
| ||
Advisory fees |
| 216,942 |
|
| 297,968 |
|
| 87,273 |
|
| ||
Administrative fees |
| 54,234 |
|
| 54,175 |
|
| 10,909 |
|
| ||
Legal fees |
| 56,062 |
|
| 57,824 |
|
| 13,282 |
|
| ||
Transfer agent fees |
| 32,072 |
|
| 31,933 |
|
| 12,585 |
|
| ||
Board of Trustees fees |
| 47,328 |
|
| 48,522 |
|
| 10,659 |
|
| ||
Chief Compliance Officer fees |
| 25,671 |
|
| 26,525 |
|
| 5,514 |
|
| ||
Registration and filing fees |
| 21,924 |
|
| 20,660 |
|
| 23,237 |
|
| ||
Other expenses |
| 8,416 |
|
| 9,098 |
|
| 2,277 |
|
| ||
Total expenses |
| 462,649 |
|
| 546,705 |
|
| 165,736 |
|
| ||
Expense waiver |
| (198,889 | ) |
| (174,838 | ) |
| (56,826 | ) |
| ||
Net expenses |
| 263,760 |
|
| 371,867 |
|
| 108,910 |
|
| ||
Net investment income (loss) |
| 1,380,672 |
|
| 2,859,380 |
|
| 79,820 |
|
| ||
|
|
|
|
|
|
|
|
|
|
|
|
|
Realized and unrealized gain (loss) |
|
|
|
|
|
|
|
|
|
| ||
Net realized gain (loss) on: |
|
|
|
|
|
|
|
|
|
| ||
| Investments |
| 1,579,157 |
|
| (1,302,385 | ) |
| (1,435,440 | ) |
| |
| Futures contracts |
| 338,417 |
|
| (195,607 | ) |
| — |
|
| |
| Swap agreements |
| (2,358 | ) |
| — |
|
| — |
|
| |
Net change in unrealized appreciation |
|
|
|
|
|
|
|
|
|
| ||
| (depreciation) on: |
|
|
|
|
|
|
|
|
|
| |
| Investments |
| 1,788,116 |
|
| 1,640,789 |
|
| 2,861,246 |
|
| |
| Futures contracts |
| 53,705 |
|
| (16,474 | ) |
| — |
|
| |
| Swap agreements |
| 2,265 |
|
| — |
|
| — |
|
| |
Net realized and unrealized gain (loss) |
| 3,759,302 |
|
| 126,323 |
|
| 1,425,806 |
|
| ||
Change in net assets from operations | $ | 5,139,974 |
| $ | 2,985,703 |
| $ | 1,505,626 |
|
|
See accompanying Notes to Financial Statements.
22
PPMFunds
Statements of Changes in Net Assets
For the Year Ended December 31, 2020
|
| PPM Core Plus Fixed Income Fund |
| PPM High Yield Core Fund |
| PPM Small Cap Value Fund |
|
| |||
Operations |
|
|
|
|
|
|
|
|
|
| |
Net investment income (loss) | $ | 1,380,672 |
| $ | 2,859,380 |
| $ | 79,820 |
|
| |
Net realized gain (loss) |
| 1,915,216 |
|
| (1,497,992 | ) |
| (1,435,440 | ) |
| |
Net change in unrealized appreciation |
|
|
|
|
|
|
|
|
|
| |
| (depreciation) |
| 1,844,086 |
|
| 1,624,315 |
|
| 2,861,246 |
|
|
Change in net assets from operations |
| 5,139,974 |
|
| 2,985,703 |
|
| 1,505,626 |
|
| |
Distributions to shareholders |
|
|
|
|
|
|
|
|
|
| |
From distributable earnings |
|
|
|
|
|
|
|
|
|
| |
| Institutional Class |
| (3,454,821 | ) |
| (2,859,255 | ) |
| (69,213 | ) |
|
Total distributions to shareholders |
| (3,454,821 | ) |
| (2,859,255 | ) |
| (69,213 | ) |
| |
Share transactions1 |
|
|
|
|
|
|
|
|
|
| |
Proceeds from the sale of shares |
|
|
|
|
|
|
|
|
|
| |
| Institutional Class |
| 3,421,463 |
|
| 53,952,373 |
|
| 11,835,608 |
|
|
Reinvestment of distributions |
|
|
|
|
|
|
|
|
|
| |
| Institutional Class |
| 3,450,515 |
|
| 2,518,652 |
|
| 69,213 |
|
|
Cost of shares redeemed |
|
|
|
|
|
|
|
|
|
| |
| Institutional Class |
| (3,565,000 | ) |
| (54,751,256 | ) |
| (11,084,320 | ) |
|
Change in net assets from |
|
|
|
|
|
|
|
|
|
| |
| share transactions |
| 3,306,978 |
|
| 1,719,769 |
|
| 820,501 |
|
|
Change in net assets |
| 4,992,131 |
|
| 1,846,217 |
|
| 2,256,914 |
|
| |
Net assets beginning of year |
| 51,332,597 |
|
| 55,614,821 |
|
| 11,028,905 |
|
| |
Net assets end of year | $ | 56,324,728 |
| $ | 57,461,038 |
| $ | 13,285,819 |
|
| |
|
|
|
|
|
|
|
|
|
|
|
|
1Share transactions |
|
|
|
|
|
|
|
|
|
| |
Shares sold |
|
|
|
|
|
|
|
|
|
| |
| Institutional Class |
| 313,605 |
|
| 5,524,907 |
|
| 1,642,250 |
|
|
Reinvestment of distributions |
|
|
|
|
|
|
|
|
|
| |
| Institutional Class |
| 320,644 |
|
| 263,928 |
|
| 7,301 |
|
|
Shares redeemed |
|
|
|
|
|
|
|
|
|
| |
| Institutional Class |
| (325,011 | ) |
| (5,601,815 | ) |
| (1,380,662 | ) |
|
Change in shares |
|
|
|
|
|
|
|
|
|
| |
| Institutional Class |
| 309,238 |
|
| 187,020 |
|
| 268,889 |
|
|
Purchases and sales of long term |
|
|
|
|
|
|
|
|
|
| |
| investments |
|
|
|
|
|
|
|
|
|
|
Purchase of securities | $ | 32,965,654 |
| $ | 43,139,423 |
| $ | 8,388,415 |
|
| |
Purchase of U.S. government securities |
| 9,607,420 | (a) |
| — |
|
| — |
|
| |
Total purchases | $ | 42,573,074 |
| $ | 43,139,423 |
| $ | 8,388,415 |
|
| |
Proceeds from sales of securities | $ | 30,355,639 |
| $ | 43,107,179 |
| $ | 7,642,789 |
|
| |
Proceeds from sales of U.S. government |
|
|
|
|
|
|
|
|
|
| |
| securities |
| 14,606,667 | (a) |
| — |
|
| — |
|
|
Total proceeds from sales | $ | 44,962,306 |
| $ | 43,107,179 |
| $ | 7,642,789 |
|
|
(a) | Amounts exclude $21,927,403 and $18,247,532 of purchases and sales, respectively, of dollar roll transaction securities. |
See accompanying Notes to Financial Statements.
23
PPMFunds
Statements of Changes in Net Assets
For the Year Ended December 31, 2019
|
| PPM Core Plus Fixed Income Fund |
| PPM High Yield Core Fund |
| PPM Small Cap Value Fund |
| |||
Operations |
|
|
|
|
|
|
|
|
| |
Net investment income (loss) | $ | 1,624,298 |
| $ | 2,901,012 |
| $ | 60,570 |
| |
Net realized gain (loss) |
| 1,354,692 |
|
| (1,171,922 | ) |
| (651,372 | ) | |
Net change in unrealized appreciation |
|
|
|
|
|
|
|
|
| |
| (depreciation) |
| 2,334,045 |
|
| 5,506,839 |
|
| 2,507,193 |
|
Change in net assets from operations |
| 5,313,035 |
|
| 7,235,929 |
|
| 1,916,391 |
| |
Distributions to shareholders |
|
|
|
|
|
|
|
|
| |
From distributable earnings |
|
|
|
|
|
|
|
|
| |
| Institutional Class |
| (2,415,331 | ) |
| (2,870,699 | ) |
| (47,781 | ) |
Total distributions to shareholders |
| (2,415,331 | ) |
| (2,870,699 | ) |
| (47,781 | ) | |
Share transactions1 |
|
|
|
|
|
|
|
|
| |
Proceeds from the sale of shares |
|
|
|
|
|
|
|
|
| |
| Institutional Class |
| 54,782,875 |
|
| 748,325 |
|
| 989,377 |
|
Reinvestment of distributions |
|
|
|
|
|
|
|
|
| |
| Institutional Class |
| 2,286,024 |
|
| 2,446,852 |
|
| 41,505 |
|
Cost of shares redeemed |
|
|
|
|
|
|
|
|
| |
| Institutional Class |
| (58,832,116 | ) |
| (66,235 | ) |
| (73,796 | ) |
Change in net assets from |
|
|
|
|
|
|
|
|
| |
| share transactions |
| (1,763,217 | ) |
| 3,128,942 |
|
| 957,086 |
|
Change in net assets |
| 1,134,487 |
|
| 7,494,172 |
|
| 2,825,696 |
| |
Net assets beginning of year |
| 50,198,110 |
|
| 48,120,649 |
|
| 8,203,209 |
| |
Net assets end of year | $ | 51,332,597 |
| $ | 55,614,821 |
| $ | 11,028,905 |
| |
|
|
|
|
|
|
|
|
|
|
|
1Share transactions |
|
|
|
|
|
|
|
|
| |
Shares sold |
|
|
|
|
|
|
|
|
| |
| Institutional Class |
| 5,263,340 |
|
| 75,573 |
|
| 108,498 |
|
Reinvestment of distributions |
|
|
|
|
|
|
|
|
| |
| Institutional Class |
| 220,167 |
|
| 247,208 |
|
| 4,266 |
|
Shares redeemed |
|
|
|
|
|
|
|
|
| |
| Institutional Class |
| (5,644,279 | ) |
| (6,712 | ) |
| (7,890 | ) |
Change in shares |
|
|
|
|
|
|
|
|
| |
| Institutional Class |
| (160,772 | ) |
| 316,069 |
|
| 104,874 |
|
See accompanying Notes to Financial Statements.
24
PPMFunds
Financial Highlights
For a Share Outstanding
Net Investment Income (Loss). The net investment income (loss) per share is calculated using the average shares method.
Total Return. Total return assumes reinvestment of all distributions for the period. Total return is not annualized for periods less than one year.
Portfolio Turnover. Portfolio turnover is not annualized for periods of less than one year. Dollar roll and in-kind transactions are excluded for purposes of calculating portfolio turnover. Fixed income securities with maturities greater than one year that are purchased for short term investment are excluded from the portfolio turnover calculation.
Ratios. Ratios are annualized for periods less than one year.
|
|
|
| Increase (decrease) from |
| Distributions from |
|
|
|
| Supplemental data |
|
|
| Ratios |
|
| ||||||||||||
Period ended | Net asset value, beginning of period($) | Net investment income (loss)($) | Net realized & unrealized gains (losses)($) | Total from investment operations($) |
| Net investment income($) | Net realized gains on investment transactions($) | Net asset value, end of period($) | Total return(%) | Net assets,end of period (in thousands)($) | Portfolio turnover (%) |
| Net expenses to average net assets(%) | Total expenses to average net assets(%) | Net investment income (loss) to average net assets(%) | ||||||||||||||
| |||||||||||||||||||||||||||||
PPM Core Plus Fixed Income Fund |
|
|
|
|
|
|
|
|
|
|
|
|
|
| |||||||||||||||
|
|
|
|
|
|
|
|
|
|
|
|
|
|
|
|
|
|
|
|
|
|
|
|
|
|
|
|
|
|
Institutional Class |
|
|
|
|
|
|
|
|
|
|
|
|
|
|
|
|
|
|
|
|
| ||||||||
12/31/20 |
| 10.40 |
| 0.27 |
| 0.76 |
| 1.03 |
|
| (0.30) |
| (0.39) |
| 10.74 |
| 9.98 |
| 56,325 |
| 80 | (b) |
| 0.49 |
| 0.85 |
| 2.55 |
|
12/31/19 |
| 9.85 |
| 0.31 |
| 0.71 |
| 1.02 |
|
| (0.31) |
| (0.16) |
| 10.40 |
| 10.51 |
| 51,333 |
| 108 | (b) |
| 0.50 |
| 0.70 |
| 3.02 |
|
12/31/18 | (a) | 10.00 |
| 0.15 |
| (0.14) |
| 0.01 |
|
| (0.16) |
| — |
| 9.85 |
| 0.07 |
| 50,198 |
| 25 | (b) |
| 0.50 |
| 0.78 |
| 3.30 |
|
| |||||||||||||||||||||||||||||
PPM High Yield Core Fund |
|
|
|
|
|
|
|
|
|
|
|
|
|
| |||||||||||||||
|
|
|
|
|
|
|
|
|
|
|
|
|
|
|
|
|
|
|
|
|
|
|
|
|
|
|
|
|
|
Institutional Class |
|
|
|
|
|
|
|
|
|
|
|
|
|
|
|
|
|
|
|
|
| ||||||||
12/31/20 |
| 10.09 |
| 0.51 |
| (0.01) |
| 0.50 |
|
| (0.51) |
| — |
| 10.08 |
| 5.34 |
| 57,461 |
| 82 |
|
| 0.69 |
| 1.01 |
| 5.30 |
|
12/31/19 |
| 9.26 |
| 0.54 |
| 0.83 |
| 1.37 |
|
| (0.54) |
| — |
| 10.09 |
| 15.02 |
| 55,615 |
| 78 |
|
| 0.70 |
| 0.85 |
| 5.50 |
|
12/31/18 | (a) | 10.00 |
| 0.25 |
| (0.71) |
| (0.46) |
|
| (0.26) |
| (0.02) |
| 9.26 |
| (4.74) |
| 48,121 |
| 18 |
|
| 0.70 |
| 0.92 |
| 5.53 |
|
| |||||||||||||||||||||||||||||
PPM Small Cap Value Fund |
|
|
|
|
|
|
|
|
|
|
|
|
|
| |||||||||||||||
|
|
|
|
|
|
|
|
|
|
|
|
|
|
|
|
|
|
|
|
|
|
|
|
|
|
|
|
|
|
Institutional Class |
|
|
|
|
|
|
|
|
|
|
|
|
|
|
|
|
|
|
|
|
| ||||||||
12/31/20 |
| 9.76 |
| 0.06 |
| (0.28) |
| (0.22) |
|
| (0.05) |
| — |
| 9.49 |
| (2.26) |
| 13,286 |
| 70 |
|
| 1.00 |
| 1.52 |
| 0.73 |
|
12/31/19 |
| 8.00 |
| 0.06 |
| 1.74 |
| 1.80 |
|
| (0.04) |
| — |
| 9.76 |
| 22.53 |
| 11,029 |
| 40 |
|
| 1.00 |
| 1.14 |
| 0.62 |
|
12/31/18 | (c) | 10.00 |
| 0.04 |
| (1.77) |
| (1.73) |
|
| (0.04) |
| (0.23) |
| 8.00 |
| (17.29) |
| 8,203 |
| 22 |
|
| 1.00 |
| 1.21 |
| 0.64 |
|
(a) | The Fund commenced operations on July 16, 2018. |
(b) | Portfolio turnover including dollar roll transactions for PPM Core Plus Fixed Income Fund was 31%, 113%, and 118% for 2018, 2019 and 2020, respectively. |
(c) | The Fund commenced operations on May 1, 2018. |
See accompanying Notes to Financial Statements.
25
PPMFunds
Notes to Financial Statements
December 31, 2020
NOTE 1. ORGANIZATION
PPM Funds (the “Trust”) is an open-ended management investment company, organized under the laws of the Commonwealth of Massachusetts, by a Declaration of Trust, dated November 9, 2017, as amended and restated March 12, 2018. The Trust is registered with the Securities and Exchange Commission (“SEC”) under the Investment Company Act of 1940, as amended ("the 1940 Act"), and its shares are registered under the Securities Act of 1933, as amended ("the 1933 Act"). The Trust currently consists of five series, three of which are available for purchase by investors (collectively, the “Funds” and each individually a “Fund”): PPM Core Plus Fixed Income Fund, PPM High Yield Core Fund and PPM Small Cap Value Fund. PPM Core Fixed Income Fund and PPM Investment Grade Credit Fund have not yet commenced operations. The Funds offer only Institutional Class shares. Each Fund represents shares of beneficial interest in a separate portfolio of securities and other assets, each with its own investment objective, policies and strategies. The Funds are classified as diversified under the 1940 Act.
PPM America, Inc. (“PPM” or “Adviser”) serves as the investment adviser of the Funds, with responsibility for the professional investment supervision and management of the Funds. The Adviser is an indirect, wholly-owned subsidiary of Jackson Financial, Inc., which is a subsidiary of Prudential plc (the “UK Parent”), a publicly traded company incorporated in the United Kingdom. Jackson National Asset Management LLC (“JNAM” or “Administrator”), an affiliate of PPM, serves as the administrator. JNAM is a wholly owned subsidiary of Jackson National Life Insurance Company® (“Jackson”). Jackson is a wholly owned subsidiary of Jackson Financial Inc. The UK Parent is not affiliated in any manner with Prudential Financial, Inc., a company whose principal place of business is in the United States of America, or with The Prudential Assurance Company Ltd., a subsidiary of M&G plc, a company incorporated in the United Kingdom. Effective July 17, 2020, Athene Co-Invest Reinsurance Affiliate 1A Ltd., a Bermuda Class C insurer under the Bermuda Insurance Act 1978, owns a minority interest in Jackson Financial Inc.
On October 6, 2020, the Board approved Plans of Liquidation and Termination of the PPM Floating Rate Income Fund, PPM Long Short Credit Fund, PPM Large Cap Value Fund and PPM Mid Cap Value Fund.
NOTE 2. SIGNIFICANT ACCOUNTING POLICIES
The Funds are investment companies and follow accounting and reporting guidance under Financial Accounting Standards Board (“FASB”) Accounting Standards Codification (“ASC”) Topic 946, “Financial Services-Investment Companies.” The following is a summary of significant accounting policies consistently followed by the Funds in the preparation of their financial statements in conformity with US generally accepted accounting principles (“GAAP”).
Security Valuation. Under the Trust’s valuation policy and procedures, the Board of Trustees (“Board” or “Trustees”) has delegated the daily operational oversight of the securities valuation function to the JNAM Valuation Committee (“Valuation Committee”), which consists of certain officers of the Trust and certain members of JNAM management. The Valuation Committee is responsible for determining fair valuations for any security for which market quotations are not readily available or are determined to be not reflective of market value. For those securities fair valued under procedures adopted by the Board, the Valuation Committee reviews and affirms the reasonableness of the fair valuation determinations after considering all relevant information that is reasonably available. The Valuation Committee’s fair valuation determinations are subject to review by the Board at its next regularly scheduled meeting covering the calendar quarter in which the fair valuation was determined. For fair valuation determinations that are deemed material, the Board is promptly notified of the fair valuation.
The net asset value ("NAV") of a Fund's shares is generally determined once each day on which the New York Stock Exchange (“NYSE”) is open, at the close of the regular trading session of the NYSE (normally, 4:00 PM Eastern Time, Monday through Friday). However, consistent with legal requirements, calculation of the Fund’s NAV may be suspended on days determined by the Board during times of NYSE market closure, which may include times during which the SEC issues policies or protocols associated with such closure pursuant to Section 22(e) of the 1940 Act. To the extent an NYSE closure is determined to not have resulted in a disruption of normal market activity, the Valuation Committee may utilize the time the NYSE was scheduled to close for purposes of measuring and calculating the Funds’ NAVs. Equity securities are generally valued at the official closing price of the exchange where the security is principally traded. If there is no official closing price for the security on the valuation date, the security may be valued at the most recent sale or quoted bid price prior to close. Stocks not listed on a national or foreign stock exchange may be valued at the closing bid price on the over the counter (“OTC”) market. Investments in mutual funds are valued at the NAV per share determined as of the close of the NYSE on each valuation date. Debt and derivative securities are generally valued by independent pricing services approved by the Board. If a valuation from a third-party pricing service is unavailable or it is determined that such valuation does not approximate fair market value, debt obligations with remaining maturities of sixty (60) days or less may be valued at their amortized cost, unless it is determined that such practice also does not approximate fair market value. Pricing services utilized to value debt and derivative instruments may use various pricing techniques which take into account appropriate factors such as: yield; credit quality; coupon rate; maturity; type of issue; trading characteristics; call features; credit ratings; broker quotes; and other relevant data. Term loans are generally valued at the composite bid prices provided by approved pricing services. Futures contracts traded on an exchange are generally valued at the exchange’s settlement price. If the settlement price is not available, exchange traded futures are valued at the last sales price as of the close of business on the primary exchange. If the last trade is determined to not be representative of fair value, exchange traded options are valued at the current day’s mid-price.
Market quotations may not be readily available for certain investments or it may be determined that a quotation of an investment does not represent fair value. In such instances, the investment is valued as determined in good faith using procedures approved by the Board. Situations that may require an investment to be fair valued may include instances where a security is thinly traded, halted or restricted as to resale. In addition, investments may be fair valued based on the occurrence of a significant event. Significant events may be specific to a particular issuer, such as mergers, restructurings or defaults. Alternatively, significant events may affect an entire market, such as natural disasters, government actions, and significant changes in the value of US securities markets. Securities are fair valued based on observable and unobservable inputs, including the Administrator's or Valuation Committee’s own
26
PPMFunds
Notes to Financial Statements
December 31, 2020
assumptions in determining the fair value of an investment. Under the procedures approved by the Board, the Administrator may utilize pricing services or other sources in determining the fair value of an investment. Factors considered to determine fair value may include fundamental analytical data relating to the security; the nature and duration of restrictions, if any, on the disposition of the security; trading volume on markets, exchanges, or among dealers; evaluation of the forces which influence the market in which the security is traded; the type of security; the financial statements of the issuer, or other financial information about the issuer; the cost of the security at its date of purchase; the size of the Fund’s holding; the discount from market value of unrestricted securities of the same class, if applicable, at the time of purchase or at a later date; reports prepared by analysts; information as to any transactions in or offers for the security; the existence of any merger proposal, tender offer or other extraordinary event relating to the security; the price and extent of public or dealer trading in similar securities or derivatives of the issuer or of comparable companies; trading in depositary receipts; foreign currency exchange activity; changes in the interest rate environment; trading prices of financial products that are tied to baskets of foreign securities; and any other matters considered relevant.
If an investment is valued at a fair value for purposes of calculating a Fund’s NAV, the value may be different from the last quoted price for the investment depending on the source and method used to determine the value. Although there can be no assurance, in general, the fair value of the investment is the amount the owner of such investment might reasonably expect to receive in an orderly transaction between market participants upon its current sale.
Distributions to Shareholders. The amount and timing of distributions are determined in accordance with federal income tax regulations which may differ from GAAP. Dividends from net investment income are declared daily and paid monthly for PPM Core Plus Fixed Income Fund and PPM High Yield Core Fund. PPM Small Cap Value Fund declares and pays dividends from net investment income, if any, annually. Distributions of net realized capital gains, if any, are declared and distributed at least annually for all the Funds only to the extent they exceeded available capital loss carryovers.
Other Service Providers. State Street Bank and Trust Company (“State Street” or "Custodian") acts as custodian and securities lending agent for the Funds. The Custodian has custody of all securities and cash of the Trust maintained in the United States and attends to the collection of principal and income and payment for and collection of proceeds of securities bought and sold by the Trust.
The Trust has entered into a Transfer Agency Agreement with UMB Fund Services, Inc. UMB Fund Services, Inc. is the transfer agent and dividend disbursing agent of all shares.
Security Transactions and Investment Income. Security transactions are recorded on the trade date for financial reporting purposes. Realized gains and losses are determined on the specific identification basis. Dividend income, net of applicable withholding taxes, is recorded on the ex-dividend date. Corporate actions involving foreign securities, including dividends, are recorded when the information becomes available. Income received in lieu of dividends for securities loaned is included in Dividends in the Statements of Operations. Interest income, including level-yield amortization of discounts and premiums on debt securities and convertible bonds, is accrued daily. A Fund may place a debt obligation on non-accrual status and reduce related interest income by ceasing current accruals and writing off interest receivable when the collection of all or a portion of interest has become doubtful. A debt obligation is removed from non-accrual status when the issuer resumes interest payments or when collectability of interest is reasonably assured.
Expenses. Expenses are recorded on an accrual basis. Expenses of the Trust that are directly attributable to a specific Fund are charged to that Fund. Other Trust level expenses are allocated to the Funds based on the average daily net assets of each Fund.
Foreign Taxes. The Funds may be subject to foreign taxes on income, gains on investments or foreign currency purchases and repatriation, a portion of which may be recoverable. The Funds will accrue such taxes and recoveries as applicable, based upon the current interpretations of tax rules and regulations that exist in the markets in which the Funds invest.
Guarantees and Indemnifications. In the normal course of business, the Trust may enter into contracts that contain a variety of representations which provide general indemnifications for certain liabilities. Under the Trust’s organizational documents, its officers and Trustees are indemnified against certain liabilities arising out of the performance of their duties to the Funds. However, since their commencement of operations, the Funds have not had claims or losses pursuant to their contracts and expect the risk of loss to be remote. The Funds’ maximum exposure under these arrangements is unknown since the amount of any future claims that may be made against the Funds cannot be determined and the Funds have no historical basis for predicting the likelihood of any such claims.
Use of Estimates. The preparation of financial statements in conformity with GAAP requires management to make estimates and assumptions that affect the reported amounts of assets and liabilities and disclosure of contingent assets and liabilities at the date of the financial statements and the reported amounts of increases and decreases in net assets from operations during the reporting period. Actual results could differ from those estimates.
Recent Accounting Pronouncements. In August 2018, FASB issued ASU 2018-13, Fair Value Measurement (Topic 820) – Disclosure Framework – Changes to the Disclosure Requirements for Fair Value Measurement. The amendments in this ASU modify the disclosure requirements on fair value measurements. Among the requirements, entities are required to make additional disclosures about significant unobservable inputs in developing Level 3 fair value measurements and are permitted to remove disclosure of the amount and reason for transfers between Level 1 and Level 2. This ASU became effective for annual periods beginning after December 15, 2019, and interim periods within those annual periods. The Funds have fully adopted the amendments and the Topic 820 disclosures have been modified to conform to the amendments.
In March 2020, FASB issued ASU 2020-04, Reference Rate Reform (Topic 848): Facilitation of the Effects of Reference Rate Reform on Financial Reporting. The new guidance provides optional expedients and exceptions for applying GAAP to contract modifications and hedging relationships, subject to meeting certain criteria, that reference the London Interbank Offered Rate (LIBOR) or another reference rate expected to be discontinued due to
27
PPMFunds
Notes to Financial Statements
December 31, 2020
reference rate reform. The amendments in this update are elective and may be applied through December 31, 2022. Management is currently evaluating the potential impacts of reference rate reform and the adoption of this ASU on the Funds’ financial statements.
NOTE 3. FASB ASC TOPIC 820, “FAIR VALUE MEASUREMENT”
Financial Accounting Standards Board ("FASB") Accounting Standards Codification ("ASC") Topic 820, "Fair Value Measurement". This standard establishes a single authoritative definition of fair value, sets out a framework for measuring fair value and requires additional disclosures about fair value measurements. Various inputs are used in determining the value of a Fund’s investments under FASB ASC Topic 820 guidance. The inputs are summarized into three broad categories:
Level 1 includes valuations based on quoted prices of identical securities in active markets, including valuations for securities listed on a national or foreign stock exchange or investments in mutual funds.
Level 2 includes valuations determined from significant direct or indirect observable inputs. Direct observable inputs include broker quotes, third-party prices, closing prices of similar securities in active markets, closing prices for identical or similar securities in non-active markets or corporate action or reorganization entitlement values. Indirect significant observable inputs include factors such as interest rates, yield curves, prepayment speeds or credit ratings. Level 2 includes valuations for fixed income securities, including certain term loans, OTC derivatives, centrally cleared swap agreements, broker quotes in active markets, securities subject to corporate actions, securities valued at amortized cost, swap agreements valued by pricing services, American Depositary Receipts and Global Depositary Receipts for which quoted prices in active markets are not available or securities limited by foreign ownership.
Level 3 includes valuations determined from significant unobservable inputs including the Administrator's own assumptions in determining the fair value of the investment. Inputs used to determine the fair value of Level 3 securities include security specific inputs such as: credit quality, credit rating spreads, issuer news, trading characteristics, call features, maturity or anticipated cash flows; or industry specific inputs such as: trading activity of similar markets or securities, changes in the security’s underlying index or changes in comparable securities’ models. Level 3 valuations include securities; term loans that do not meet certain liquidity thresholds; securities where prices may be unavailable due to halted trading, restricted to resale due to market events, or newly issued; private placements; or investments for which reliable quotes are otherwise not available.
The inputs or methodology used for valuing securities are not necessarily an indication of the risk associated with investing in those securities.
The following table summarizes each Fund’s investments in securities and other financial instruments as of December 31, 2020, by valuation level.
. Level 1 ($) . | . Level 2 ($) . | . Level 3 ($) . | . Total ($) . | |||||
PPM Core Plus Fixed Income Fund | ||||||||
Assets - Securities | ||||||||
Corporate Bonds And Notes | — | 28,653,950 | 109,765 | 28,763,715 | ||||
Government And Agency Obligations | — | 21,891,462 | — | 21,891,462 | ||||
Non-U.S. Government Agency Asset-Backed Securities | — | 4,299,588 | — | 4,299,588 | ||||
Senior Floating Rate Instruments | — | 678,989 | — | 678,989 | ||||
Common Stocks | 13,475 | — | — | 13,475 | ||||
Short Term Investments | 3,723,857 | — | — | 3,723,857 | ||||
3,737,332 | 55,523,989 | 109,765 | 59,371,086 | |||||
Assets - Investments in Other Financial Instruments1 | ||||||||
Futures Contracts | 30,228 | — | — | 30,228 | ||||
30,228 | — | — | 30,228 | |||||
Liabilities - Investments in Other Financial Instruments1 | ||||||||
Futures Contracts | (21,364 | ) | — | — | (21,364 | ) | ||
Centrally Cleared Credit Default Swap Agreements | — | (689 | ) | — | (689 | ) | ||
(21,364 | ) | (689 | ) | — | (22,053 | ) | ||
PPM High Yield Core Fund | ||||||||
Assets - Securities | ||||||||
Corporate Bonds And Notes | — | 53,365,194 | 164,996 | 53,530,190 | ||||
Senior Floating Rate Instruments | — | 1,318,593 | — | 1,318,593 | ||||
Investment Companies | 628,278 | — | — | 628,278 | ||||
Preferred Stocks | 139,491 | — | — | 139,491 | ||||
Common Stocks | 66,076 | — | — | 66,076 | ||||
Warrants | — | 33,843 | — | 33,843 | ||||
Non-U.S. Government Agency Asset-Backed Securities | — | 21,301 | — | 21,301 | ||||
Short Term Investments | 1,847,209 | — | — | 1,847,209 | ||||
2,681,054 | 54,738,931 | 164,996 | 57,584,981 | |||||
PPM Small Cap Value Fund | ||||||||
Assets - Securities | ||||||||
Common Stocks | 13,120,786 | — | — | 13,120,786 | ||||
Short Term Investments | 173,527 | — | — | 173,527 | ||||
13,294,313 | — | — | 13,294,313 |
1 Derivatives are reflected at the unrealized appreciation (depreciation) on the instrument.
28
PPMFunds
Notes to Financial Statements
December 31, 2020
Significant changes in unobservable valuation inputs to a different amount might result in a significantly higher or lower fair value measurement than the one used in a security’s valuation. There were no significant transfers into or out of Level 3 for the year. There were no significant Level 3 valuations for which unobservable valuation inputs were developed at December 31, 2020.
NOTE 4. SECURITIES AND OTHER INVESTMENTS
Securities Lending and Securities Lending Collateral. All Funds are approved to participate in agency based securities lending with State Street. Per the securities lending agreements, State Street is authorized to loan securities on behalf of the Funds to approved borrowers and is required to maintain collateral. Each Fund receives either cash or non-cash collateral against the loaned securities in an amount equal to at least 100% of the market value of the loaned securities. Generally, cash and non-cash collateral received for the following types of securities on loan are as follows: US equities – 102%; US corporate fixed income – 102%; US government fixed income – 102%; international equities – 105%; international corporate fixed income – 105%; sovereign fixed income – 102%; and asset backed investments – 102%. Collateral requirements are evaluated at the close of each business day; any additional collateral required is typically delivered to the Fund on the next business day. The duration of each loan is determined by the agent and borrower and generally may be terminated at any time. Certain loans may be negotiated to mature on a specified date. State Street has agreed to indemnify the Funds in the event of default by a third-party borrower. A Fund may experience a delay in the recovery of its securities or incur a loss if the borrower breaches its agreement with the Fund or becomes insolvent. For cash collateral, the Fund receives income from the investment of cash collateral, in addition to lending fees and rebates negotiated with the borrower. The Funds bear the market risk with respect to the collateral investment and securities loaned. The Funds also bear the risk that State Street may default on its obligations to the Funds. Non-cash collateral may include US government securities; US government agencies’ debt securities; and US government-sponsored agencies’ debt securities and mortgage-backed securities. Certain Funds receive non-cash collateral in the form of securities received, which the Funds may not sell or re-pledge and accordingly are not reflected in the Statements of Assets and Liabilities. For non-cash collateral, the Funds receive lending fees negotiated with the borrower. State Street has agreed to indemnify the Funds with respect to the market risk related to the non-cash collateral investments.
The cash collateral is invested in the State Street Navigator Securities Lending Government Money Market Portfolio, a money market fund and a series of State Street Navigator Securities Lending Trust, which is an open-end management company registered under the 1940 Act. The Funds also bear the risk of any deficiency in the amount of collateral available for return to a borrower due to a decline in value of the State Street Navigator Securities Lending Government Money Market Portfolio.
Cash collateral received from the borrower is recorded in the Statements of Assets and Liabilities as Payable for Return of securities loaned. Investments acquired with such cash collateral are included in Investments, at value on the Statements of Assets and Liabilities. The value of securities on loan is included in Investments, at value on the Statements of Assets and Liabilities. Each Fund’s net exposure to a borrower is determined by the amount of any excess or shortfall in cash collateral received compared to the value of securities on loan.
US Government Securities. Certain Funds may invest in securities issued or guaranteed by the US Government or its agents or instrumentalities. Some US government securities, such as Treasury bills, notes and bonds, and securities guaranteed by the Government National Mortgage Association, are supported by the full faith and credit of the US government; others, such as those of the Federal Home Loan Bank, are supported by the right of the issuer to borrow from the US Department of the Treasury (“US Treasury”); others, such as those of the Federal National Mortgage Association (“FNMA” or “Fannie Mae”), are supported by the discretionary authority of the US government to purchase the agency’s obligations; and still others, such as those of the Student Loan Marketing Association, are supported only by the credit of the instrumentality. US government securities may include zero coupon securities, which do not distribute interest on a current basis and tend to be subject to greater risk than interest paying securities of similar maturities.
Government-related guarantors (i.e., guarantors that are not backed by the full faith and credit of the US government) include FNMA and the Federal Home Loan Mortgage Corporation (“FHLMC” or “Freddie Mac”). FNMA purchases conventional (i.e., not insured or guaranteed by any government agency) residential mortgages from a list of approved seller/servicers, which include state and federally chartered savings and loan associations, mutual savings banks, commercial banks and credit unions and mortgage bankers. Pass-through securities issued by FNMA are guaranteed as to timely payment of principal and interest by FNMA, but are not backed by the full faith and credit of the US government. FHLMC issues Participation Certificates (“PCs”), which are pass-through securities, each representing an undivided interest in a pool of residential mortgages. FHLMC guarantees the timely payment of interest and ultimate collection of principal, but PCs are not backed by the full faith and credit of the US government.
FNMA and FHMLC were placed into conservatorship by the Federal Housing Finance Agency (“FHFA”). As the conservator, FHFA succeeded to all rights, titles, powers and privileges of FNMA and FHLMC and of any stockholder, officer or director of FNMA and FHLMC with respect to FNMA and FHLMC and each enterprise’s assets. In connection with the conservatorship, the US Treasury entered into a Senior Preferred Stock Purchase Agreement with FNMA and FHLMC. This agreement contains various covenants that severely limit each enterprise’s operations. In exchange for entering into these agreements, the US Treasury received senior preferred stock in each enterprise and warrants to purchase each enterprise’s common stock. The US Treasury created a new secured lending facility, which is available to FNMA and FHLMC as a liquidity backstop and created a temporary program to purchase mortgage-backed securities issued by FNMA and FHLMC. FNMA and FHLMC are continuing to operate as going concerns while in conservatorship and each remains liable for all of its obligations, including its guaranty obligations, associated with its mortgage-backed securities.
Unregistered Securities. The Funds may own certain investment securities that are unregistered and thus restricted as to resale. These securities may also be referred to as “private placements”. Unregistered securities may be classified as “illiquid” because there is no readily available market for sale of the securities. Where future dispositions of the securities require registration under the 1933 Act, the Funds have the right to include those securities in such registration generally without cost to the Funds. The Funds have no right to require registration of unregistered securities.
Senior and Junior Loans. Certain Funds may invest in Senior loans or secured and unsecured subordinated loans, second lien loans and subordinated bridge loans (Junior loans) which are purchased or sold on a when-issued or delayed-delivery basis and may be settled a month or more after the trade
29
PPMFunds
Notes to Financial Statements
December 31, 2020
date. Interest income on these loans is accrued based on the terms of the securities. Senior and Junior loans can be acquired through an agent, by assignment from another holder of the loan, or as a participation interest in another holder’s portion of the loan.
NOTE 5. INVESTMENT TRANSACTION AGREEMENTS AND COLLATERAL
Under various agreements, certain investment transactions require collateral to be pledged to or from a Fund and a counterparty or segregated at the Custodian and is managed pursuant to the terms of the agreement. US Treasury Bills and US dollars are generally the preferred forms of collateral, although other forms of high quality or sovereign securities may be used. Securities held by a Fund that are used as collateral are identified as such within the Schedules of Investments. Collateral for OTC financial derivative transactions paid to or received from brokers and counterparties is included in Receivable for Deposits with brokers and counterparties or Payable for Deposits from counterparties in the Statements of Assets and Liabilities.
Counterparty Agreements. Certain Funds enter into various types of agreements with counterparties, which govern the terms of certain transactions and mitigate the counterparty risk associated with relevant transactions by specifying credit protection mechanisms and providing standardization that improves legal certainty. A Fund may net exposure and collateralize multiple transaction types governed by the same agreement with the same counterparty and may close out and net its total exposure to a counterparty in the event of a default and/or termination event with respect to all the transactions governed under a single agreement with a counterparty. Each agreement defines whether the Fund is contractually able to net settle daily payments. Additionally, certain circumstances, such as laws of a particular jurisdiction or settlement of amounts due in different currencies, may prohibit or restrict the right of offset as defined in the agreements.
These agreements also help limit credit and counterparty risk by specifying collateral posting arrangements at pre-arranged exposure levels. Under the agreements, collateral is routinely transferred if the total net exposure to certain transactions (net of existing collateral) governed under the relevant agreement with a counterparty in a given account exceeds a specified threshold depending on the counterparty and the type of agreement. A Fund’s overall exposure to counterparty risk can change substantially within a short period, as it is affected by each transaction subject to the relevant agreement. To the extent amounts due to a Fund from its counterparties are not fully collateralized, contractually or otherwise, the Fund bears the risk of loss from counterparty non-performance. The Funds’ Adviser attempts to limit counterparty risk by only entering into agreements with counterparties that the Adviser believes to have the financial resources to honor their obligations and by monitoring the financial stability of those counterparties. For swap agreements executed with a Derivatives Clearing Organization (“DCO”) in a multilateral or other trade facility platform (“centrally cleared swaps”), counterparty risk is reduced by shifting exposure from the counterparty to the DCO. Additionally, the DCO has broad powers to provide an orderly liquidation in the event of a default.
Customer Account Agreements. Customer Account Agreements and related addendums govern exchange traded or centrally cleared derivative transactions such as futures, options on futures and centrally cleared derivatives. If a Fund transacts in exchange traded or centrally cleared derivatives, the Adviser is a party to agreements with (1) a Futures Commissions Merchant (“FCM”) in which the FCM facilitates the execution of the exchange traded and centrally cleared derivative with the DCO and (2) with an executing broker/swap dealer to agree to the terms of the swap and resolution process in the event the centrally cleared swap is not accepted for clearing by the designated DCO. Exchange traded and centrally cleared derivatives transactions require posting an amount of cash or cash equivalents equal to a certain percentage of the contract amount known as the “initial margin” as determined by each relevant clearing agency and is segregated at an FCM which is registered with the Commodity Futures Trading Commission (“CFTC”) or the applicable regulator. The Fund receives from, or pays to, the counterparty an amount of cash equal to the daily fluctuation in the value of the contracts. Such receipts or payments are known as the “variation margin”. Variation margin on the Statements of Assets and Liabilities may include variation margin on closed unsettled derivative transactions. Variation margin received may not be netted between exchange traded and centrally cleared derivatives. In the event of default, counterparty risk is significantly reduced as creditors to the FCM do not have claim to the Fund’s assets in the segregated account. Additionally, portability of exposure in the event of default further reduces risk.
International Swaps and Derivatives Association Inc. Master Agreements and Credit Support Annexes (“ISDA Master Agreements”). ISDA Master Agreements govern OTC financial derivative transactions entered into by PPM and select counterparties. The ISDA Master Agreements maintain provisions for general obligations, representations, agreements, events of default, termination and maintenance of collateral. Termination includes conditions that may entitle counterparties to elect to terminate early and cause settlement of all outstanding transactions under the applicable ISDA Master Agreement. Any election of early termination could be material to the financial statements. In the event of default, the total financial derivative value exposure will be offset against collateral exchanged to date, which would result in a net receivable/(payable) that would be due from/to the counterparty. The amount of collateral exchanged is based on provisions within the ISDA Master Agreements and is determined by the net exposure with the counterparty and is not identified for a specific OTC derivative instrument.
NOTE 6. FINANCIAL DERIVATIVE INSTRUMENTS
Futures Contracts. A Fund may buy and sell futures on, among other things, financial instruments, individual equity securities, securities indices, interest rates, currencies and inflation indices. A futures contract is a standardized contract obligating two parties to exchange a specified asset at an agreed upon price and date. Variation margin is recorded by the Fund until the contracts are terminated at which time realized gains and losses are recognized. Futures contracts involve to varying degrees, risk of loss in excess of the variation margin recorded by the Fund. The primary risks associated with the use of futures contracts are the imperfect correlation between the change in value of the securities held by the Fund or the change in the value of an underlying entity and the prices of the futures contracts and the possibility the Fund may not be able to enter into a closing transaction because of an illiquid market. With futures, counterparty risk to the Fund is reduced because futures contracts are exchange traded and the exchange’s clearinghouse, acting as counterparty to all exchange traded futures, guarantees the futures contracts against default.
Swap Agreements. Swap agreements are bilaterally negotiated agreements between a Fund and a counterparty to exchange or swap investment cash flows, assets, foreign currencies or market-linked returns at specified, future intervals. Swap agreements may be privately negotiated in the OTC market or executed and centrally cleared with a DCO.
30
PPMFunds
Notes to Financial Statements
December 31, 2020
A Fund enters into a swap agreement in an attempt to obtain a particular return when it is considered desirable to do so, possibly at a lower cost to the Fund than if the Fund had invested directly in an instrument that yield the desired return. In addition, the Fund may enter into swap agreements to manage certain risks and to implement investment strategies in a more efficient manner.
Entering into swap agreements involves, to varying degrees, elements of interest, credit, market and documentation risk in excess of the unrealized gain or loss recorded by a Fund. Such risks include that there is no liquid market for OTC swaps, that the counterparty to the agreements may default on its obligation to perform or disagree as to the meaning of contractual terms in the agreement and that there may be unfavorable changes in interest rates or value of underlying securities. Centrally cleared swaps involve to varying degrees, risk of loss in excess of the variation margin recorded by the Fund.
Credit Default Swap Agreements. Credit default swap agreements involve one party making a stream of payments (referred to as the buyer of protection) to another party (the seller of protection) in exchange for the right to receive a specified return if a credit event occurs for the referenced entity, obligation or index. If an event of default occurs, the seller must pay the buyer the full notional value of the reference obligation in exchange for the reference obligation. A Fund may be either the buyer or the seller in a credit default swap transaction. If a Fund is a buyer and no event of default occurs, the Fund will lose its investment and recover nothing. However, if an event of default occurs and the counterparty fulfills its payment obligation under the swap agreement, the Fund will receive the full notional value of the reference obligation that may have little or no value. As a seller, a Fund receives a fixed rate of income throughout the term of the contract, which typically is between six months and three years. If an event of default occurs, the Fund (if the seller) must pay the buyer the full notional value of the reference obligation as disclosed in the Schedules of Investments. Credit default swap transactions involve greater risks than if a Fund had invested in the reference obligation directly.
The maximum potential amount the Fund could be required to pay as a seller of credit protection or receive as a buyer of credit protection if a credit event occurs is limited to the total notional amount which is defined under the terms of each swap agreement. If the Fund is a buyer of protection, the Fund pays the fixed rate. If the Fund is a seller of protection, the Fund receives the fixed rate.
FASB ASC Topic 815, “Derivatives and Hedging” and Financial Instruments Eligible for Offset. FASB ASC Topic 815 includes the requirement for enhanced qualitative disclosures about objectives and strategies for using derivative instruments and disclosures regarding credit related contingent features in derivative instruments, as well as quantitative disclosures in the semi-annual and annual financial statements about fair value, gains and losses, and volume of activity for derivative instruments. Information about these instruments is disclosed in the context of each instrument’s primary underlying risk exposure which is categorized as credit, commodity, equity price, interest rate and foreign currency exchange rate risk. The following disclosures include: (1) Objectives and strategies for each Fund’s derivative investments during the year; (2) A summary table of the fair valuations of each Fund’s derivative instruments categorized by risk exposure, which references the location on the Statements of Assets and Liabilities and the realized and unrealized gain or loss on the Statements of Operations for each derivative instrument as of December 31, 2020. Funds which held only one type of derivative during the year are not included in the tables as the location on the Statements of Assets and Liabilities and the realized and unrealized gain loss on the Statements of Operations can be referenced directly on each Fund’s respective statements; (3) A summary table of derivative instruments and certain investments of each Fund, which are subject to master netting agreements or a similar agreement and are eligible for offset in the Statements of Assets and Liabilities as of December 31, 2020. For Funds which held only one type of derivative during the year, amounts eligible for offset are presented gross in the Statements of Assets and Liabilities. Net exposure can be referenced in the assets and liabilities on the Statements of Assets and Liabilities and, if collateral exists, the net exposure is offset by collateral identified in the segregated or pledged collateral table; and (4) A table reflecting each Fund’s average monthly derivative volume for the year ended December 31, 2020.
31
PPMFunds
Notes to Financial Statements
December 31, 2020
PPM Core Plus Fixed Income Fund Derivative Strategies - The Fund entered into futures contracts to hedge duration and to increase the Fund’s exposure to interest rate or yield curve risk. The Fund entered into credit default swap agreements to increase or decrease the Fund’s exposure to credit risk or hedge credit risk in a particular name, industry or sector.
PPM Core Plus Fixed Income Fund - Derivative Instruments Categorized by Risk Exposure |
| ||||||||||||
|
| Commodity($) |
| Credit($) |
| Equity($) |
| Foreign Exchange($) |
| Interest Rate($) |
| Total($) |
|
Fair values of derivative instruments on the Statement of Assets and Liabilities as of December 31, 2020 |
| ||||||||||||
Derivative instruments assets: |
|
|
|
|
|
|
|
|
|
|
|
| |
2 | Variation margin on futures | — |
| — |
| — |
| — |
| 7,680 |
| 7,680 |
|
Total derivative instruments assets | — |
| — |
| — |
| — |
| 7,680 |
| 7,680 |
| |
Derivative instruments liabilities: |
|
|
|
|
|
|
|
|
|
|
|
| |
2 | Variation margin on futures | — |
| — |
| — |
| — |
| 5,250 |
| 5,250 |
|
2 | Variation margin on swap agreements | — |
| 259 |
| — |
| — |
| — |
| 259 |
|
Total derivative instruments liabilities | — |
| 259 |
| — |
| — |
| 5,250 |
| 5,509 |
| |
The effect of derivative instruments on the Statement of Operations for the year ended December 31, 2020 |
| ||||||||||||
Net realized gain (loss) on: |
|
|
|
|
|
|
|
|
|
|
|
| |
| Futures | — |
| — |
| — |
| — |
| 338,417 |
| 338,417 |
|
| Swap agreements | — |
| (2,358 | ) | — |
| — |
| — |
| (2,358 | ) |
Net change in unrealized appreciation (depreciation) on: |
|
|
|
|
|
|
|
|
|
|
|
| |
| Futures | — |
| — |
| — |
| — |
| 53,705 |
| 53,705 |
|
| Swap agreements | — |
| 2,265 |
| — |
| — |
| — |
| 2,265 |
|
PPM Core Plus Fixed Income Fund – Average Derivative Volume1
|
| Cost of Options Purchased and Written ($) |
| Notional Value at Purchase of Futures Contracts ($) |
| Cost of Forward Foreign Currency Contracts ($) |
| Notional Amount of Interest Rate Swap Agreements ($) |
| Notional Amount of Cross-Currency Swap Agreements ($) |
| Notional Amount of Credit Default Swap Agreements ($) |
| Notional Amount of Total Return Swap Agreements ($) |
|
Average monthly volume | — |
| 15,313,912 |
| — |
| — |
| — |
| 500,000 |
| — |
|
1 The derivative instruments outstanding as of December 31, 2020, as disclosed in the Schedules of Investments, and the amounts of realized gains and losses and changes in unrealized gains and losses on derivative instruments during the year ended December 31, 2020, as disclosed in the Statements of Operations, also serve as indicators of the derivative volume for the Funds.
2 Derivative asset or liability is not eligible for offset, and a Derivative and Financial Instruments Eligible for Offset table is not presented for the asset or liability, as applicable.
Pledged Collateral. The following table summarizes cash and securities collateral pledged for the Funds at December 31, 2020:
|
|
|
|
|
|
|
|
|
|
| Futures Contracts | Swap Agreements |
| ||
| Counterparties |
| Pledged or Segregated Cash($) |
| Pledged or Segregated Cash($) |
|
|
PPM Core Plus Fixed Income Fund | MLP |
| 61,725 |
| 7,331 |
|
|
None of the futures contracts held by the Funds are subject to master netting agreements or a similar agreement and are not eligible for offset in the Statements of Assets and Liabilities as of December 31, 2020. Net exposure to the Funds for futures contracts is the variation margin in addition to any collateral pledged for the initial margin on the futures contracts.
NOTE 7. INVESTMENT RISKS AND REGULATORY MATTERS
The Funds' risks include, but are not limited to, the following:
Credit Risk. Credit risk is the actual or perceived risk that the issuer of a bond, borrower, guarantor, counterparty, or other entity responsible for payment will not pay interest and principal payments when due. The price of a debt instrument can decline in response to changes in the financial condition of the issuer, borrower, guarantor, counterparty, or other entity responsible for payment. A Fund could lose money if the issuer or guarantor of a fixed-income security, or the counterparty to a derivatives contract, repurchase agreement or a loan of portfolio securities, is unable or unwilling to make timely principal and/or interest payments, or to otherwise honor its obligations.
Corporate, Sovereign Entity, and Bank Loan Risk. Commercial banks, sovereign entities, and other financial institutions or institutional investors make corporate loans to companies or sovereign entities that need capital to grow, restructure, or for infrastructure projects. These instruments are commonly referred to as loans or bank loans. Borrowers generally pay interest on corporate loans at floating rates that change in response to changes in market
32
PPMFunds
Notes to Financial Statements
December 31, 2020
interest rates such as the LIBOR, the prime rates of US banks or another relevant index. As a result, the value of such loan investments is generally less exposed to the adverse effects of interest rate fluctuations than investments that pay a fixed rate of interest. However, the market for certain loans may not be sufficiently liquid, and a Fund may have difficulty selling them. It may take longer than seven days for transactions in loans to settle. Certain loans may be classified as illiquid securities. Additionally, because a loan may not be considered a security, a Fund may not be afforded the same legal protections afforded securities under federal securities laws. Thus, a Fund generally must rely on contractual provisions in the loan agreement and common-law fraud protections under applicable state law.
Equity Securities Risk. Common and preferred stocks represent equity ownership in a company. Stock markets are volatile, and equity securities generally have greater price volatility than fixed-income securities. As a result of such factors as a company’s business performance, investor perceptions, stock market trends and general economic conditions, the price of equity or equity-related securities will fluctuate and can decline and reduce the value of a portfolio investing in equity or equity-related securities. A Fund could lose money if a company in which it invests becomes financially distressed. Generally preferred stocks rank before common stocks in their claim on income for dividend payments and on assets should the company be liquidated. The rights of common stockholders are subordinate to all other claims on a company’s assets including, debt holders and preferred stockholders.
High Yield Bonds, Lower-Rated Bonds, and Unrated Securities Risk. High yield bonds, lower-rated bonds, and certain unrated securities are broadly referred to as junk bonds, and are considered below investment-grade by a nationally recognized statistical rating organization (“NRSRO”). Junk bonds are subject to the increased risk of an issuer’s inability to meet principal and interest payment obligations. As a result, an investment in junk bonds is considered speculative. High yield bonds may be subject to liquidity risk, and a Fund may not be able to sell a high yield bond at the price at which it is currently valued.
Issuer Risk. The value of an individual security or particular type of security can be more volatile than the market as a whole and can perform differently from the market as a whole. A security’s value may decline for reasons that directly relate to the issuer, such as management performance, corporate governance, financial leverage and reduced demand for the issuer’s goods or services.
Interest Rate Risk. When interest rates increase, fixed-income securities generally will decline in value. Long-term fixed-income securities normally have more price volatility than short-term fixed-income securities.
Investment Style Risk. The returns from a certain investment style may be lower than the returns from the overall stock market. Value stocks may not increase in price if other investors fail to recognize the company’s value or the factors that are expected to increase the price of the security do not occur. Over market cycles, different investment styles may sometimes outperform other investment styles (for example, growth investing may outperform value investing).
Senior Loans Risk. The senior loans in which a Fund invests are usually rated below investment grade. The amount of public information with respect to loans may be less extensive than that available for registered or exchange listed securities. An economic downturn generally leads to a higher non-payment rate, and a senior loan may lose significant value before a default occurs. A secured senior loan may not be adequately collateralized. Moreover, any specific collateral used to secure a senior loan may decline in value or become illiquid, which would adversely affect the senior loan’s value.
Market Risk. Portfolio securities may decline in value due to factors affecting securities markets generally, such as real or perceived adverse economic, political, or regulatory conditions, inflation, changes in interest or currency rates, adverse investor sentiment, regional and global health epidemics, war, terrorism or natural disasters, among others. Adverse market conditions may be prolonged and may not have the same impact on all types of securities. The values of securities may fall due to factors affecting a particular issuer, industry or the securities market as a whole.
Liquidity Risk. Investments in securities that are difficult to purchase or sell (illiquid or thinly-traded securities) may reduce returns if a Fund is unable to sell the securities at an advantageous time or price or achieve its desired level of exposure to a certain sector. Liquidity risk arises, for example, from small average trading volumes, trading restrictions, or temporary suspensions of trading. To meet redemption requests, a Fund may be forced to sell securities at an unfavorable time and/or under unfavorable conditions.
Leverage Risk. Certain transactions, such as reverse repurchase agreements, futures, forwards, swaps, or other derivative instruments, include the use of leverage and may cause a Fund to liquidate portfolio positions at disadvantageous times to satisfy its obligations or to meet asset segregation requirements. The effect of using leverage is to increase a Fund’s potential gains and losses in comparison to the amount of a Fund’s assets (that is, assets other than borrowed assets) at risk, which may cause a Fund’s portfolio to be more volatile. If a Fund uses leverage, the Fund has the risk of capital losses that exceed the net assets of the Fund.
NOTE 8. INVESTMENT ADVISORY FEES AND TRANSACTIONS WITH AFFILIATES
Advisory and Administrative Fees. The Trust has entered into an Investment Advisory and Management Agreement (the "Investment Advisory Agreement") with PPM. Subject to the oversight of the Trust’s Board of Trustees, PPM is responsible for managing the affairs of the Trust including, but not limited to, continuously providing the Trust with investment advice and business management to the Funds. Pursuant to the Investment Advisory Agreement, PPM receives an annual fee accrued daily and payable monthly, at an annual rate of 0.40% of the average daily net assets of PPM Core Plus Fixed Income Fund, 0.55% of the average daily net assets of PPM High Yield Core Fund and 0.80% of the average daily net assets of PPM Small Cap Value Fund.
The Trust has entered into an Administration Agreement with JNAM, an affiliate of PPM. Pursuant to the Administration Agreement, JNAM receives an annual fee accrued daily and payable monthly, at an annual rate of 0.10% of the average daily net assets of each Fund. In return for the fees paid under the Administration Agreement, JNAM provides or procures all necessary administrative functions and services for the operation of the Funds. This includes, among other things, fund accounting; calculation of the daily NAV of each Fund; monitoring the Funds’ expense accruals; calculating monthly
33
PPMFunds
Notes to Financial Statements
December 31, 2020
total return; prospectus and statement of additional information compliance monitoring; preparing certain financial statements of the Trust; and preparing the Trust’s regulatory filings. In addition, JNAM, at its own expense, arranges for legal, audit, custody (except overdraft and interest expense), printing and mailing of financial statements and prospectuses, a portion of the Chief Compliance Officer costs, and other services necessary for the operation of the Funds. Each Fund is responsible for investment advisory services; transfer agency services; trading expenses including brokerage commissions; interest expenses; taxes; costs and expenses associated with short sales; nonrecurring and extraordinary expenses; registration fees; license fees; directors’ and officers’ insurance; the fees and expenses of the independent Trustees; independent legal counsel to the independent Trustees; and a portion of the costs associated with the Chief Compliance Officer.
Advisory Fee Waivers. The Trust and the Adviser have entered into an Expense Limitation Agreement whereby PPM has contractually agreed to waive a portion of its management fee and/or reimburse expenses for each of the Funds to the extent necessary to limit the annualized ordinary operating expenses (excluding taxes, interest, all commissions and other normal charges incident to the purchase and sale of portfolio securities, dividend and interest expenses related to short sales, indirect expenses of investing in other investment companies, and extraordinary expenses) to 0.45% for PPM Core Plus Fixed Income Fund, 0.70% for PPM High Yield Core Fund and 1.00% for PPM Small Cap Value Fund through April 30, 2021. Prior to November 30, 2020, the limit for PPM Core Plus Fixed Income Fund was 0.50%. Any waived amounts are not subject to future recoupment by the Adviser.
Security Transactions. Security transactions can occur in the Funds where both the buyer and seller of the security are portfolios or accounts for which PPM serves as the Adviser. Such transactions occur to eliminate transaction costs normally associated with security trading activity. Such transactions are subject to compliance with Rule 17a-7 under the 1940 Act (“Rule 17a-7 transactions”) and are reviewed by the Chief Compliance Officer. Rule 17a-7 trades are executed at current market price at the time of the transaction. There were no 17a-7 transactions that were deemed significant by the Administrator during the year ended December 31, 2020.
NOTE 9. INCOME TAX MATTERS
Each Fund is treated as a separate tax payer for federal income tax purposes. Each Fund intends to continue to qualify as a regulated investment company ("RIC") and to distribute substantially all net investment income and net capital gains, if any, to its shareholders and otherwise comply with Subchapter M of the Internal Revenue Code of 1986, as amended, applicable to RICs. Therefore, no federal income tax provision is required.
The following information for the Funds is presented on an income tax basis. Differences between amounts for financial statements and federal income tax purposes are primarily due to timing and character differences in recognizing certain gains and losses on investment transactions. Permanent differences between financial statement and federal income tax reporting are reclassified within the capital accounts based on their federal income tax treatment. Temporary differences do not require reclassification. Permanent differences may include but are not limited to the following: expired capital loss carryforwards, foreign currency reclassifications, premium amortization or paydown reclassifications, reclassifications on the sale of passive foreign investment company ("PFIC") or Real Estate Investment Trust ("REIT") securities, net operating losses, accounting treatment of notional principal contracts and partnerships, equalization and other distribution adjustments. These reclassifications have no impact on net assets.
| Net Increase(Decrease) |
| ||
| Total Distributable Earnings (Loss)($) |
| Paid-in Capital($) |
|
PPM High Yield Core Fund | 57 |
| (57 | ) |
PPM Small Cap Value Fund | 324 |
| (324 | ) |
At December 31, 2020, the following Funds had capital loss carryforwards available for US federal income tax purposes to offset future net realized capital gains. The amount and character of the capital loss carryforwards are listed in the table below.
|
|
|
| Capital Loss Carryforwards with No Expiration |
|
|
| ||||
|
|
|
|
|
| Short Term ($) |
| Long Term ($) |
| Total ($) |
|
PPM High Yield Core Fund |
|
|
|
|
| 1,664,757 |
| 882,659 |
| 2,547,416 |
|
PPM Small Cap Value Fund |
|
|
|
|
| 149,964 |
| 1,198,664 |
| 1,348,628 |
|
At December 31, 2020, the Funds’ last fiscal year end, the following Funds had capital, currency and/or PFIC mark-to-market losses realized after October 31, 2020 (“Post-October losses”), which were deferred for tax purposes to the first day of the following fiscal year, January 1, 2021:
| Amount($) |
|
PPM Small Cap Value Fund | 170,045 |
|
As of December 31, 2020, the cost of investments and the components of net unrealized appreciation (depreciation) for the Funds were as follows:
|
| Tax Cost of Investments($) |
| Gross Unrealized Appreciation($) |
| Gross Unrealized Depreciation($) |
| Net Unrealized Appreciation (Depreciation)($) |
|
PPM Core Plus Fixed Income Fund | 55,783,771 |
| 3,735,743 |
| (148,428 | ) | 3,587,315 |
| |
PPM High Yield Core Fund | 54,361,673 |
| 3,661,674 |
| (438,366 | ) | 3,223,308 |
| |
PPM Small Cap Value Fund | 10,764,791 |
| 2,784,157 |
| (254,635 | ) | 2,529,522 |
|
34
PPMFunds
Notes to Financial Statements
December 31, 2020
As of December 31, 2020, the components of net unrealized appreciation (depreciation) for derivatives were as follows:
|
| Tax Cost/Premiums/Adjustment($) |
| Gross Unrealized Appreciation($) |
| Gross Unrealized Depreciation($) |
| Net Unrealized Appreciation (Depreciation)($) |
|
PPM Core Plus Fixed Income Fund |
|
|
|
|
|
|
|
| |
| Futures Contracts | 8,864 |
| — |
| — |
| — |
|
| Swap Agreements | (11,049 | ) | — | (1,201 | ) | (1,201 | ) |
As of December 31, 2020, the components of distributable taxable earnings for US federal income tax purposes were as follows:
| Undistributed Net Ordinary Income*($) |
| Undistributed Net Long-Term Capital Gain($) |
| Unrealized Gains (Losses)**($) |
| Capital Loss Carryforward($) |
|
PPM Core Plus Fixed Income Fund | 193,941 |
| 52,082 |
| 3,582,568 |
| — |
|
PPM High Yield Core Fund | 16,820 |
| — |
| 3,223,308 |
| (2,547,416 | ) |
PPM Small Cap Value Fund | 23,720 |
| — |
| 2,357,326 |
| (1,348,628 | ) |
* Undistributed net ordinary income consists of net taxable income derived from dividends, interest and net short-term capital gains, if any.
** Unrealized gains (losses) are adjusted for certain tax basis adjustments.
The tax character of distributions paid during the Funds’ fiscal year ended December 31, 2020 was as follows:
| Net Ordinary Income*($) |
| Long-term Capital Gain**($) |
| Return of Capital($) |
PPM Core Plus Fixed Income Fund | 2,452,344 |
| 1,002,477 |
| — |
PPM High Yield Core Fund | 2,859,255 |
| — |
| — |
PPM Small Cap Value Fund | 69,213 |
| — |
| — |
* Net ordinary income consists of net taxable income derived from dividends, interest and net short-term capital gains, if any.
** The Funds designated as a long-term capital gain dividend, pursuant to the Internal Revenue Code section 852(b)(3), the amount necessary to reduce earnings and profits of the
Funds related to net capital gains to zero for the year ended December 31, 2020.
The tax character of distributions paid during the Funds’ fiscal year ended December 31, 2019 was as follows:
| Net Ordinary Income*($) |
| Long-term Capital Gain($) |
| Return of Capital($) |
PPM Core Plus Fixed Income Fund | 2,167,704 |
| 247,627 |
| — |
PPM High Yield Core Fund | 2,870,699 |
| — |
| — |
PPM Small Cap Value Fund | 47,781 |
| — |
| — |
* Net ordinary income consists of net taxable income derived from dividends, interest and net short-term capital gains, if any.
FASB ASC Topic 740 “Income Taxes” provides guidance for how uncertain tax positions should be recognized, measured, presented and disclosed in the financial statements. FASB ASC Topic 740 requires the evaluation of tax positions taken or expected to be taken in the course of preparing each Fund’s tax return to determine whether the tax positions are “more-likely-than-not” of being sustained by the applicable tax authority. Tax positions not deemed to meet the “more-likely-than-not” threshold would result in the Funds recording a tax expense in the current year. FASB ASC Topic 740 requires that management evaluate the tax positions taken in returns for 2018, 2019 and 2020, which remain subject to examination by the Internal Revenue Service and certain other jurisdictions. Management completed an evaluation of the Funds’ tax positions and based on that evaluation, determined that no provision for federal income tax was required in the Funds’ financial statements during the year ended December 31, 2020.
NOTE 10. SUBSEQUENT EVENTS
Management has evaluated subsequent events for the Funds through the date the financial statements are issued and has concluded there are no events that require adjustments to the financial statements or disclosure in the notes to financial statements.
35
Report of Independent Registered Public Accounting Firm
To the Shareholders of the Funds and Board of Trustees
PPM Funds:
Opinion on the Financial Statements
We have audited the accompanying statements of assets and liabilities of each of the Funds listed in the Appendix (the Funds), each a series within PPM Funds, including the schedules of investments, as of December 31, 2020, the related statements of operations for the year then ended, the statements of changes in net assets for each of the years in the two-year period then ended, and the related notes (collectively, the financial statements) and the financial highlights for each of the years or periods in the three-year period then ended. In our opinion, the financial statements and financial highlights present fairly, in all material respects, the financial position of the Funds as of December 31, 2020, the results of their operations for the year then ended, the changes in their net assets for each of the years in the two-year period then ended, and the financial highlights, for each of the years or periods in the three-year period then ended, in conformity with U.S. generally accepted accounting principles.
Basis for Opinion
These financial statements and financial highlights are the responsibility of the Funds’ management. Our responsibility is to express an opinion on these financial statements and financial highlights based on our audits. We are a public accounting firm registered with the Public Company Accounting Oversight Board (United States) (PCAOB) and are required to be independent with respect to the Funds in accordance with the U.S. federal securities laws and the applicable rules and regulations of the Securities and Exchange Commission and the PCAOB.
We conducted our audits in accordance with the standards of the PCAOB. Those standards require that we plan and perform the audit to obtain reasonable assurance about whether the financial statements and financial highlights are free of material misstatement, whether due to error or fraud. Our audits included performing procedures to assess the risks of material misstatement of the financial statements and financial highlights, whether due to error or fraud, and performing procedures that respond to those risks. Such procedures included examining, on a test basis, evidence regarding the amounts and disclosures in the financial statements and financial highlights. Such procedures also included confirmation of securities owned as of December 31, 2020, by correspondence with custodians, transfer agents, agent banks and brokers or by other appropriate auditing procedures. Our audits also included evaluating the accounting principles used and significant estimates made by management, as well as evaluating the overall presentation of the financial statements and financial highlights. We believe that our audits provide a reasonable basis for our opinion.
/s/ KPMG LLP
We have served as the auditor of one or more PPM investment companies since 2018.
Chicago, IL
February 24, 2021
36
Appendix
PPM Core Plus Fixed Income Fund |
PPM High Yield Core Fund |
PPM Small Cap Value Fund |
37
PPMFunds
Additional Disclosures (Unaudited)
December 31, 2020
Expense Example. As a shareholder of a Fund or Funds, you incur two types of costs: (1) transaction costs, including reinvested dividends or other distributions; and (2) ongoing costs, including management fees and other Fund expenses. This Example is intended to help you understand your ongoing costs (in dollars) of investing in Funds and to compare these costs with the ongoing costs of investing in other mutual funds.
The Example is based on an investment of $1,000 invested at the beginning of the period and held for the entire period July 1, 2020 through December 31, 2020.
Expenses Using Actual Fund Return. This section of the table below provides information about actual account values and actual expenses. You may use the information in this line, together with the amount you invested, to estimate the expenses that you paid over the period. Simply divide your account value by $1,000 (e.g., an $8,600 account value divided by $1,000 = 8.6), then multiply the result by the number in the first line under the heading entitled “Expenses Paid During Period” to estimate the expenses you paid on your account during this period.
Expenses Using Hypothetical 5% Return. The section of the table below provides information about hypothetical account values and hypothetical expenses based on each Fund’s actual expense ratio and an assumed rate of return of 5% per year before expenses, which is not the Fund’s actual return. The hypothetical account values and expenses may not be used to estimate the actual ending account balance or expenses you paid for the period. You may use this information to compare the ongoing costs of investing in a Fund and other funds. To do so, compare this 5% hypothetical example with the 5% hypothetical examples that appear in the shareholder reports of the other funds.
Please note that the expenses shown in the table are meant to highlight your ongoing costs only and do not reflect any transactional costs, such as sales charges (loads), redemption fees, or exchange fees. Therefore, the “Expenses Using Hypothetical 5% Return” section of the table is useful in comparing ongoing costs only, and will not help you determine the relative total costs of owning different funds. In addition, if these transactional costs were included, your costs would have been higher.
|
|
|
| Expenses Using Actual Fund Return |
| Expenses Using Hypothetical 5% Return | ||||||||
|
| Annualized Expense Ratios(%) |
| Beginning Account Value 07/01/20($) |
| Ending Account Value 12/31/20($) |
| Expenses Paid During Period($)† |
| Beginning Account Value 07/01/20($) |
| Ending Account Value 12/31/20($) |
| Expenses Paid During Period($)† |
PPM Core Plus Fixed Income Fund |
|
|
|
|
|
|
|
|
|
| ||||
| Institutional Class | 0.47 |
| 1,000.00 |
| 1,036.60 |
| 2.41 |
| 1,000.00 |
| 1,022.77 |
| 2.39 |
PPM High Yield Core Fund |
|
|
|
|
|
|
|
|
|
| ||||
| Institutional Class | 0.68 |
| 1,000.00 |
| 1,118.90 |
| 3.62 |
| 1,000.00 |
| 1,021.72 |
| 3.46 |
PPM Small Cap Value Fund |
|
|
|
|
|
|
|
|
|
| ||||
| Institutional Class | 1.00 |
| 1,000.00 |
| 1,351.20 |
| 5.91 |
| 1,000.00 |
| 1,020.11 |
| 5.08 |
† Expenses paid during the period are equal to the annualized net expense ratio, multiplied by the average account value over the period, then multiplied by 184/366 (to reflect the most recent 6-month period).
Other Federal Income Tax Information. The information reported below is for the year ended December 31, 2020. Qualified dividend information will be provided on each shareholder’s 2020 Form 1099-DIV.
For the year ended December 31, 2020, the following Funds hereby designate the following percentages, or the maximum amount allowable under the Internal Revenue Code ("Code"), as qualified dividends:
PPM Core Plus Fixed Income Fund | 0.00% |
PPM High Yield Core Fund | 0.10% |
PPM Small Cap Value Fund | 100.00% |
For the year ended December 31, 2020, the following Funds hereby designate the following percentages, or the maximum amount allowable under the Code, as distributions eligible for the dividends received deduction for corporations:
PPM Core Plus Fixed Income Fund | 0.00% |
PPM High Yield Core Fund | 0.10% |
PPM Small Cap Value Fund | 100.00% |
Quarterly Portfolio Holdings. The Funds file a complete schedule of portfolio holdings with the SEC for the first and third quarters of each fiscal year as an exhibit to their reports on Form N-PORT. The Funds' Form N-PORT reports are available on the SEC’s website at www.sec.gov. The information on Form N-PORT is also available upon request by calling the Funds toll-free at 1-844-446-4PPM (1-844-446-4776).
Proxy Voting Policies and Procedures and Proxy Voting Record. A description of the Policy that the Funds’ Adviser used to vote proxies relating to portfolio securities and additional information on how the Funds voted any proxies relating to portfolio securities during the 12-month period ended June 30, 2020, are available without charge (1) by calling 1-844-446-4PPM (1-844-446-4776), (2) by writing PPM Funds, P.O. Box 2175, Milwaukee, Wisconsin 53201-2175, (3) online at www.ppmamerica.com/ppmfunds, and (4) by visiting the SEC’s website at www.sec.gov.
The Statement of Additional Information includes additional information about the Funds’ Trustees and is available without charge (1) by calling 1-844-446-4PPM, (2) by writing PPM Funds, P.O. Box 2175, Milwaukee, Wisconsin 53201-2175, and (3) online at www.ppmamerica.com/ppmfunds.
38
Trustees and Officers of PPM Funds (“Trust”)
Name and (Year of Birth) | Position(s) Held with Trust | Length of Time Served | Principal Occupation(s) | Other Directorships Held During Past 5 Years | |
Interested Trustee | |||||
Mary Capasso1 (1971) | Trustee 2 Chief Executive Officer, Chief Legal Officer and President Vice President, Chief Legal Officer and Assistant Secretary | Since 1/1/2021 Since 1/1/2021 Inception to 12/31/2020 | Executive Vice President, Chief Operating Officer and General Counsel to PPM (1/1/2021 to Present); Senior Vice President and General Counsel of PPM (6/2018 to 12/31/20); Vice President and Deputy General Counsel of PPM (8/2015 to 6/2018); previously Assistant General Counsel of Harris Associates LP (until 8/2015) | None. | |
Independent Trustees | |||||
Kevin Callahan (1965) | Trustee 2 | Since inception | Founder, Fairway Capital (1/2017 to present), previously Chief Operating Officer, Adams Street Partners (7/1994 to 12/2016) | None. | |
Ronald A. Nyberg (1953) | Trustee 2 and Independent Chair of the Board of Trustees3 | Since inception | Of Counsel, Momkus LLP (1/2021 to present); previously, Partner, Momkus LLC (7/2016 to 12/2020), Partner, Nyberg & Cassioppi, LLC (10/2000 to 6/2016) | Trustee, Guggenheim Funds Trust, Guggenheim Variable Funds Trust, Guggenheim Strategy Funds Trust, Transparent Value Trust, Advent Convertible and Income Fund, Guggenheim Taxable Municipal Managed Duration Trust, Guggenheim Strategic Opportunities Fund, Guggenheim Credit Allocation Fund, Guggenheim Energy & Income Fund, Fiduciary/Claymore Energy Infrastructure Fund and Guggenheim Enhanced Equity Income Fund. | |
Janet D. Olsen (1956) | Trustee 2 | Since inception | Retired (1/2014 to present) | Trustee, ETF Series Solutions (47 series). | |
1 Ms. Capasso is an “interested person” of the Trust due to her position with PPM, the Adviser. | |||||
2 The Interested Trustee and the Independent Trustees are elected to serve for an indefinite term. | |||||
3 The Board Chairperson may be reelected for a second three-year term. If the Board Chairperson has served two consecutive terms, he or she may not serve again as the Board Chairperson, unless at least one year has elapsed since the end of his or her second consecutive term as Board Chairperson. |
39
Trustees and Officers of PPM Funds (“Trust”)
Name and (Year of Birth) | Position(s) Held with Trust | Length of Time Served | Principal Occupation(s) |
Officers | |||
Emily J. Bennett (1983) | Vice President and Assistant Secretary Vice President and Secretary | Since 1/1/2021 Inception to 12/31/2020 | Assistant Vice President of JNAM (2/2018 to present) and Associate General Counsel of JNAM (3/2016 to present); Senior Attorney of JNAM (10/2013 to 3/2016); Assistant Secretary of other investment companies advised by JNAM (3/2016 to present, 5/2012 to 12/2020, 3/2016 to 12/2020, and 3/2016 to 7/2018); Assistant Secretary of Curian Series Trust (5/2012 to 2/2016) |
Daniel W. Koors (1970) | Vice President Principal Financial Officer and Treasurer | Since inception Inception to 12/31/2020 | Senior Vice President of JNAM (1/2009 to present) and Chief Operating Officer of JNAM (4/2011 to present); Treasurer and Chief Financial Officer of Curian Series Trust (11/2010 to 2/2016); Vice President of other Investment Companies advised by JNAM (12/2006 to present, 12/2006 to 12/2020, 1/2018 to 12/2020, 8/2012 to 7/2018); Treasurer & Chief Financial Officer of other Investment Companies advised by JNAM (9/2016 to 6/2020, 9/2016 to 12/2020, 10/2011 to 12/2020, and 9/2016 to 7/2018) |
Colleen P. McDermott (1960) | Vice President | Since inception | Senior Managing Director, Project Management Office of PPM (8/2017 to present); previously Managing Director, Senior Product Manager, Guggenheim Investments (5/2011 to 6/2017) |
Mark D. Nerud (1966) | Principal Executive Officer | Since inception | Chief Executive Officer of JNAM (1/2010 to present); President of JNAM (1/2007 to present); Managing Board Member of JNAM (5/2015 to present); President and Chief Executive Officer of Curian Series Trust (8/2014 to 2/2016); President and Chief Executive Officer (Principal Executive Officer) of other investment companies advised by JNAM (12/2006 to present, 12/2006 to 12/2020, 8/2014 to 12/2020, and 8/2012 to 7/2018) |
Joseph O’Boyle (1962) | Chief Compliance Officer and Anti-Money Laundering Officer | Since inception | Vice President of JNAM (8/2015 to present); Acting Chief Compliance Officer of JNAM (5/2018 to 8/2018); Vice President of other investment companies advised by JNAM (1/2018 to present, 1/2018 to 12/2020, and 1/2018 to 7/2018); Acting Chief Compliance Officer and Acting Anti-Money Laundering Officer of other investment companies advised by JNAM (5/2018 to 8/2018), Anti-Money Laundering Officer of another investment company advised by JNAM (12/2015 to 1/2018); Chief Compliance Officer of another investment company advised by JNAM (5/2012 to 1/2018); Chief Compliance Officer of Curian Series Trust (5/2012 to 2/2016) |
Rebecca A. Paulzine (1979) | Vice President and Secretary Vice President and Assistant Secretary | Since 1/1/2021 11/2018 to 12/31/2020 | Vice President and Senior Counsel of PPM (9/2018 to present); Associate General Counsel, Edward Jones (9/2014 to 9/2018) |
40
Trustees and Officers of PPM Funds (“Trust”)
Name and (Year of Birth) | Position(s) Held with Trust | Length of Time Served | Principal Occupation(s) |
Susan S. Rhee (1971) | Vice President and Assistant Secretary | Since inception | Senior Vice President and General Counsel of JNAM (1/2010 to present); Secretary of JNAM (11/2000 to present); Vice President, Chief Legal Officer, and Secretary of other investment companies advised by JNAM (2/2004 to present, 2/2004 to 12/2020, 10/2011 to 12/2020, and 8/2012 to 7/2018); Vice President, Chief Legal Officer, and Secretary of Curian Series Trust (11/2010 to 2/2016) |
Andrew Tedeschi (1965) | Vice President, Treasurer and Principal Financial Officer | Since 1/1/2021 | Vice President, JNAM (1/2019 to present); Treasurer and Principal Financial Officer of other investment companies advised by JNAM (6/2020 to present); Controller, Fund Administration, Harris Associates L.P. (12/2007 to 12/2018); and Vice President (2/2008 to 12/2018), Treasurer (10/2018 to 12/2018), and Assistant Treasurer (2/2008 to 10/2018) of the Oakmark Funds |
41
Trustees and Officers of PPM Funds (“Trust”)
The interested Trustee and the Officers of the Trust or the Adviser do not receive any compensation from the Trust for their services as Trustees or Officers. The Independent Trustees received the following compensation for their services for the twelve-month period ended December 31, 2020.
Independent Trustee | Aggregate Compensation from the Trust For the Fiscal Year Ended December 31, 2020 | Pension or Retirement Benefits Accrued As Part of Fund Expenses | Estimated Annual Benefits Upon Retirement | Total Compensation from the Trust |
Kevin Callahan | $57,000 | None | None | $57,000 |
Ronald A. Nyberg | $57,000 | None | None | $57,000 |
Janet D. Olsen | $57,000 | None | None | $57,000 |
42
(the “Trust”)
CONSIDERATION AND APPROVAL OF THE ADVISORY AGREEMENT
The Board of Trustees of the Trust (“Board”) oversees the management of the Trust and its separate series (each a “Fund” and collectively the “Funds”) and, as required by law, determines annually whether to approve the continuation of the Trust’s advisory agreement (“Advisory Agreement”) with PPM America, Inc. (“PPM” or the “Adviser”) with respect to each Fund.
At meetings held on July 13, 2020 and August 11, 20201, the Board, including all of the trustees who are not interested persons of the Funds (as defined in the Investment Company Act of 1940, as amended) (the “Independent Trustees”), considered information relating to the continuation of the Advisory Agreement for each Fund.
In advance of the meetings, independent legal counsel for the Independent Trustees requested that certain information be provided to the Board relating to the Advisory Agreement. The Board received, and had the opportunity to review, this and other materials, ask questions and request further information in connection with its consideration of the Advisory Agreement. At the conclusion of the Board’s discussions, the Board approved the continuation of the Advisory Agreement through September 30, 2021.
In reviewing the Advisory Agreement and considering the information, the Board was advised by independent legal counsel. The Board considered the factors it deemed relevant, as applicable, including: (1) the nature, quality and extent of the services provided; (2) the investment performance of each Fund; (3) the fees paid for services by each Fund; (4) profitability data related to its services for each Fund; (5) whether economies of scale may be realized and shared, in some measure, with investors as each Fund grows; and (6) other benefits that may accrue to PPM through its relationship with the Trust.
Before approving the Advisory Agreement, the Independent Trustees met in multiple executive sessions over the course of several weeks with their independent legal counsel to consider the materials provided by PPM and to consider the terms of the Advisory Agreement. Based on its evaluation of those materials and the information the Board received throughout the year at its regular meetings, the Board, including the interested and Independent Trustees, concluded that the Advisory Agreement is in the best interests of the shareholders of each Fund. In reaching its conclusions and exercising its business judgment, the Board considered numerous factors, including those noted above and described further below. The Board’s conclusions as to the approval of the Advisory Agreement were based on a comprehensive consideration of all information provided to the Board, and were not based on any single factor alone. Some of the factors that figured particularly in the Board’s deliberations are described below, although individual Trustees may have evaluated the information presented differently from one another, attributing different weights to various factors.
43
Nature, Quality and Extent of Services
The Board examined the nature, quality, and extent of the services provided by PPM.
The Board considered the services provided by PPM as adviser to the Funds. The Board noted that PPM furnishes the Funds with investment advisory services, subject to the supervision of the Board, and in conformity with the stated policies of each Fund. The Board also considered information provided by PPM regarding the firm’s track record and experience managing accounts and strategies similar to the Funds. The Board also considered the various business-related risks PPM faces as a result of advising the Funds, including entrepreneurial, legal and litigation risks, some of which may be significant. The Board also took into account that PPM monitors the performance of the various organizations that provide services to the Funds, including the Funds’ administrator, distributor, transfer agent and custodian. In this regard, the Board considered that PPM negotiates certain service providers’ fees and evaluates service providers’ infrastructure, cybersecurity programs, compliance programs, and business continuity programs, among other matters. The Board also considered PPM’s ongoing development of its own infrastructure and information technology to support the Funds through, among other things, cybersecurity, business continuity planning, risk management, and support and reporting provided to the Board in connection with its Board and Committee meetings.
The Board reviewed the qualifications, backgrounds and responsibilities of PPM’s senior management, including the individuals responsible for managing the Funds. The Board also reviewed information pertaining to PPM’s organizational structure, financial condition, investment operations, and other relevant information pertaining to PPM. The Board considered compliance reports regarding PPM, both from PPM’s Chief Compliance Officer and the Funds’ Chief Compliance Officer.
Based on the foregoing, the Board concluded that each Fund is likely to continue to benefit from the nature, extent and quality of the services provided by PPM under the Advisory Agreement.
Investment Performance of the Funds
Existing Funds
The Board considered the investment performance of PPM Core Plus Fixed Income Fund, PPM Floating Rate Income Fund, PPM High Yield Core Fund, PPM Long Short Credit Fund, PPM Large Cap Value Fund, PPM Mid Cap Value Fund and PPM Small Cap Value Fund (the “Existing Funds”) as described in quarterly reports prepared by PPM. The Board noted that PPM reviews with the Board on a quarterly basis detailed information about each Existing Fund’s performance results and investment strategies. The Board also considered the performance of each Existing Fund, including how the Fund’s performance on a gross basis (unless otherwise noted) compared to the performance of a group of comparable funds (“peer group”) identified by an independent data service and how the Fund performed versus its primary benchmark index (“benchmark”). The Board noted that comparisons to peer groups provide a helpful way to evaluate the Funds’ performance, but took into account that peer group universes are constantly evolving, and as such, the universe of comparable funds in the Funds’ peer groups may change from time to time. The Board also considered information furnished by PPM at the Board’s request, comparing the performance of each Existing Fund relative to a peer group identified by PPM as representative of peer funds that are similarly positioned to the Funds in the marketplace.
In considering performance, the Board noted that each Existing Fund commenced operations in 2018 and therefore had a limited performance record against which to evaluate PPM. In this regard, the Board also considered that PPM manages other advisory accounts that have substantially similar investment objectives, policies and investment strategies as each Existing Fund. Accordingly, the Board also considered information provided by PPM regarding the composite performance of accounts managed by PPM with similar investment strategies to the Funds.
Certain performance data considered by the Board is summarized below. Unless otherwise noted, the performance data summarized below is for periods ended on March 31, 2020.
PPM Core Plus Fixed Income Fund. The Board considered that the Fund outperformed its peer group median but underperformed it benchmark for the one-year and since-inception periods ended March 31, 2020. The Board also considered that the Fund outperformed its benchmark and peer group median over the one-year and since-inception periods ended June 30, 2020. The Board also noted that the Fund commenced operations in July 2018 and had only one complete year of performance history as of March 31, 2020. The Board noted, therefore, that it would be prudent to allow the Adviser more time to develop its performance record with the Fund.
PPM Floating Rate Income Fund. The Board considered that the Fund outperformed its benchmark and underperformed its peer group median for the one-year period ended March 31, 2020. The Board also considered that the Fund underperformed its benchmark and peer group median for the since-inception period ended March 31, 2020. The Board also considered that the Fund outperformed its benchmark and peer group median over the one-year period ended June 30, 2020. The Board also considered that the Fund commenced operations in May 2018 and had only one complete year of performance history as of March 31, 2020. The Board noted, therefore, that it would be prudent to allow the Adviser more time to develop its performance record with the Fund.
44
PPM High Yield Core Fund. The Board considered that the Fund outperformed its benchmark and peer group median for the one-year period ended March 31, 2020. The Board also considered that the Fund underperformed its benchmark and peer group median for the since-inception period ended March 31, 2020. The Board also considered that the Fund commenced operations in July 2018 and had only one complete year of performance history as of March 31, 2020. The Board noted, therefore, that it would be prudent to allow the Adviser more time to develop its performance record with the Fund.
PPM Long Short Credit Fund. The Board considered that the Fund underperformed its benchmark and peer group median for the one-year and since-inception periods ended March 31, 2020. The Board considered further that, during the first quarter of 2020, the Fund’s long credit exposure and short duration contributed to the Fund’s underperformance versus its market-neutral benchmark. The Board also considered that the Fund commenced operations in July 2018 and had only one year of performance history as of March 31, 2020. The Board noted, therefore, that it would be prudent to allow the Adviser more time to develop its performance record with the Fund.
PPM Large Cap Value Fund. The Board considered that the Fund underperformed its benchmark and peer group median for the one-year and since-inception periods ended March 31, 2020. The Board also considered that the Fund outperformed its benchmark and ranked in the 20th percentile of its peer group during the quarter ended June 30, 2020. The Board considered further that, at the end of 2019, PPM’s equity team began implementing various process enhancements, including those related to investment recommendation discussions, initial position sizing, and sell discipline, intended to address the Fund’s underperformance. The Board also noted information from PPM indicating that the recent market environment has been challenging to the Fund’s deep value style as the growth style factor has consistently outperformed the value style factor over recent periods. The Board further considered that the Fund has a deeper value orientation than its benchmark, the S&P 500 Value Index. The Board considered that the Fund commenced operations in May 2018 and had only one complete year of performance history as of March 31, 2020. The Board noted, therefore, that it would be prudent to allow the Adviser more time to develop its performance record with the Fund.
PPM Mid Cap Value Fund. The Board considered that the Fund underperformed its benchmark and peer group median for the one-year and since-inception periods ended March 31, 2020. The Board also considered that the Fund outperformed its benchmark and ranked in the 27th percentile of its peer group during the quarter ended June 30, 2020. The Board considered further that, at the end of 2019, PPM’s equity team began implementing various process enhancements, including those related to investment recommendation discussions, initial position sizing, and sell discipline, intended to address the Fund’s underperformance. The Board also noted information from PPM indicating that the recent market environment has been challenging to the Fund’s deep value style as the growth style factor has consistently outperformed the value style factor over recent periods. The Board further considered that the Fund has a deeper value orientation than its benchmark, the S&P 500 Value Index. The Board considered that the Fund commenced operations in May 2018 and had only one complete year of performance history as of March 31, 2020. The Board noted, therefore, that it would be prudent to allow the Adviser more time to develop its performance record with the Fund.
PPM Small Cap Value Fund. The Board considered that the Fund underperformed its benchmark and performed equal to its peer group median for the one-year period ended March 31, 2020. The Board also considered that the Fund underperformed its benchmark and peer group median for the since-inception period ended March 31, 2020. The Board also considered that the Fund outperformed its benchmark and ranked in the 41st percentile of its peer group during the quarter ended June 30, 2020. The Board considered further that, at the end of 2019, PPM’s equity team began implementing various process enhancements, including those related to investment recommendation discussions, initial position sizing, and sell discipline, intended to address the Fund’s underperformance. The Board also noted information from PPM indicating that the recent market environment has been challenging to the Fund’s deep value style as the growth style factor has consistently outperformed the value style factor over recent periods. The Board further considered that the Fund has a deeper value orientation than its benchmark, the S&P 500 Value Index. The Board also considered that the Fund commenced operations in May 2018 and had only one complete year of performance history as of March 31, 2020. The Board noted, therefore, that it would be prudent to allow the Adviser more time to develop its performance record with the Fund.
New Funds:
The Board took into account that PPM Core Fixed Income Fund and PPM Investment Grade Credit Fund (the “New Funds”) had not commenced investment operations and that there was no performance data to review. The Board considered, however, that PPM manages other advisory accounts that have substantially similar investment objectives, policies and investment strategies as the New Funds. Accordingly, the Board considered information provided by PPM regarding the composite performance of accounts managed by PPM with similar investment strategies to the New Funds.
Costs of Services
The Board reviewed the advisory fee rates paid to PPM by each Fund as well as the total expense ratio of each Fund. The Board reviewed such fee and expense information as compared to that of comparable funds managed by other advisers. Using information provided by an independent data service, the Board evaluated each Fund’s contractual advisory fees and total expense ratios (net of waivers) in comparison to the contractual advisory fees and total expense ratios of each Fund’s peer group. The Board noted that comparisons to peer groups provide a helpful way to evaluate the Funds’ fees, but took into account that peer group universes are constantly evolving, and as such, the universe of comparable funds in the Funds’ peer groups may change from time to time. The Board also considered the contractual management fees and total expenses of each Fund relative to a peer group identified by PPM at the Board’s request, which represented funds that the Adviser believed to be similarly positioned to the Funds in the marketplace.
45
In considering the Funds’ fees and expenses, the Board also considered that PPM manages other advisory accounts that have substantially similar investment objectives, policies and investment strategies as each Fund. Accordingly, the Board also considered information provided by PPM regarding the fees charged by PPM to accounts with similar investment strategies to the Funds.
The Board also considered that PPM has entered into an Expense Limitation Agreement with each Fund through April 30, 2021, whereby PPM contractually agreed to waive a portion of its management fee and/or reimburse expenses for each of the Funds to the extent necessary to limit the annualized ordinary operating expenses (excluding taxes, interest, all commissions and other normal charges incident to the purchase and sale of portfolio securities, dividend and interest expenses related to short sales, indirect expenses of investing in other investment companies, and extraordinary expenses) to 0.45% for the PPM Core Fixed Income Fund, 0.50% for the PPM Core Plus Fixed Income Fund, 0.70% for the PPM Floating Rate Income Fund, 0.70% for the PPM High Yield Core Fund, 0.50% for the PPM Investment Grade Credit Fund, 0.70% for the PPM Long Short Credit Fund, 0.75% for the PPM Large Cap Value Fund, 0.90% for the PPM Mid Cap Value Fund and 1.00% for the PPM Small Cap Value Fund. The Board also considered that the Expense Limitation Agreement renews automatically for successive one-year terms unless the Board approves the termination of the agreement.
Further detail considered by the Board regarding the advisory fees and expense ratios of each Fund is set forth below:
PPM Core Fixed Income Fund. The Board considered that the Fund’s contractual advisory fee is in the second quintile and its total expense ratio is in the first quintile of its peer group.
PPM Core Plus Fixed Income Fund. The Board considered that the Fund’s contractual advisory fee is in the third quintile and its total expense ratio is in the fourth quintile of its peer group. The Board further considered that the Fund’s net total expenses are within 0.003% and 0.019% of its peer group average and median, respectively, and equal to and within 0.01% of the average and median, respectively, of its peer group identified by PPM. The Board also noted information from PPM indicating that it continues to believe the Fund is positioned well relative to its peers.
PPM Floating Rate Income Fund. The Board considered that the Fund’s contractual advisory fee and total expense ratio are in the second quintile of its peer group.
PPM High Yield Core Fund. The Board considered that the Fund’s contractual advisory fee is in the first quintile and its total expense ratio is in the second quintile of its peer group.
PPM Investment Grade Credit Fund. The Board considered that the Fund’s contractual advisory fee and estimated total expense ratio are in the first quintile of its peer group.
PPM Long Short Credit Fund. The Board considered that the Fund’s contractual advisory fee ranks first out of five funds in its peer group and its total expense ratio ranks second out of five funds in its peer group.
PPM Large Cap Value Fund. The Board considered that the Fund’s contractual advisory fee is in the first quintile and its total expense ratio is in the second quintile of its peer group.
PPM Mid Cap Value Fund. The Board considered that the Fund’s contractual advisory fee is in the second quintile and its total expense ratio is in the third quintile of its peer group.
PPM Small Cap Value Fund. The Board considered that the Fund’s contractual advisory fee and total expense ratio are in the first quintile of its peer group.
Economies of Scale
The Board considered whether each Fund’s advisory fee reflects the potential for economies of scale for the benefit of the Funds’ shareholders. Based on information provided by PPM, the Board noted that, while PPM did not propose breakpoints in its advisory fee schedule for the Funds, the Board would continue to review the Adviser’s fees on an ongoing basis. The Board further noted that the Adviser had agreed to waive certain fees for each Fund, which limits the expenses borne by shareholders as the Funds raise assets. The Board also considered that economies of scale can be shared with the Funds in other ways, including pricing Funds at scale from inception, additional technological and personnel investments to enhance shareholder services, and maintaining existing expense structures in the face of a rising cost environment.
Profitability
The Board considered information concerning the costs incurred and profits or losses realized by PPM with respect to the Existing Funds. The Board considered that, based on the profitability analyses provided by PPM, PPM had not realized profits with respect to the Funds. The Board also considered information from PPM indicating that as the Funds begin to receive more inflows from external shareholders, PPM expects profitability to increase accordingly.
46
Other Benefits to Affiliates of PPM
In evaluating the benefits that accrue to PPM through its relationship with the Funds, the Board noted that PPM and certain of its affiliates serve the Funds in various capacities, including as adviser, administrator, and distributor, and receive compensation from the Funds in connection with providing certain of these services. In particular, the Board considered that Jackson National Asset Management, LLC (“JNAM”) serves as Administrator to the Funds, and that JNAM charges administration fees based on average daily net assets for the Funds. To the extent the fees exceed 0.10% of average daily net assets, PPM has agreed to reimburse JNAM. The Board considered that, in providing administration services to the Funds, JNAM also provides compliance services to the Funds. The Board noted that each service provided to the Funds by JNAM or one of its affiliates is pursuant to a written agreement, which the Board evaluates periodically as required by law.
After full consideration of the foregoing factors, the Board concluded that the approval of the Advisory Agreement was in the best interests of each Fund and its shareholders.
1 The meetings were held via videoconference in reliance on an exemptive order issued by the Securities and Exchange Commission on June 19, 2020.
47
BOARD CONSIDERATION AND APPROVAL OF NEW INVESTMENT ADVISORY AGREEMENT AND NEW DISTRIBUTION AGREEMENT IN CONNECTION WITH THE CHANGE OF CONTROL OF PPM AMERICA INC. FOR PPM CORE FIXED INCOME FUND, PPM CORE PLUS FIXED INCOME FUND, PPM HIGH YIELD CORE FUND, PPM INVESTMENT GRADE CREDIT FUND AND PPM SMALL CAP VALUE FUND (EACH A "FUND" AND, COLLECTIVELY THE "FUNDS")
Section 15(c) of the Investment Company Act of 1940, as amended (the "1940 Act"), provides that, when the Funds, each a series of PPM Funds (the "Trust"), enter into a new investment advisory agreement ("Advisory Agreement") with PPM America, Inc. ("PPM" or the
“Adviser”) and a new distribution agreement (“Distribution Agreement”) with Jackson National Life Distributors LLC (“JNLD” or the “Distributor”), the Board of Trustees (the "Board") of the Trust, including a majority of the Board members who have no direct or indirect interest in the Advisory Agreement or Distribution Agreement, and who are not "interested persons" of the Trust , as such term is defined under the 1940 Act (the "Independent Trustees"), must approve the new arrangements. Discussed below are certain factors that the Board considered at a meeting held on November 10, 2020 in determining whether to approve a new advisory agreement and a new distribution agreement for the Funds in connection with the Separation Plan, as defined and discussed below.
The Board noted that Prudential plc has announced its intention to pursue a full separation of Jackson National Insurance Company (“Jackson National”), an indirect subsidiary of Prudential plc and a parent company of PPM and JNLD (such divestment, the “Separation Plan”). Prudential plc has announced its intention to divest Jackson National over time through an initial public offering of the common stock of Jackson Financial Inc. (“JFI”), the indirect parent of Jackson National (the “IPO”), followed by full divestment over two and a half years. Divestment options remain open. Prudential plc’s divestment of Jackson National may take place by means of a full or partial demerger or spinoff of the common stock of JFI held by Prudential (the “Demerger”) to Prudential plc’s existing shareholders which would result in the divestment of JFI immediately or over time, as the case may be.
The Board recognized that the Separation Plan contemplates an IPO or Demerger and each may be deemed to be a change of control. If a change of control is deemed to take place, the investment advisory agreement and distribution agreement for the Funds would terminate and trigger the necessity for new agreements, which would require the approval of the Board and the shareholders of each Fund. The Board also recognized that there can be no assurance that the Separation Plan will be carried out.
The Board considered the potential effects of the Separation Plan on the Funds, the Adviser and its affiliates, including the Distributor, including the Adviser's and Distributor’s expected ability prior to, during and after the separation to perform the same level of service to the Funds as they currently provide. In this regard, the Board noted that the Adviser and its affiliates do not currently anticipate that the Separation Plan would have a material adverse impact on the Adviser and its affiliates, the Funds or their operations and administration.
Each of the Funds is subject to the 1940 Act, which provides that any investment advisory agreement and any distribution agreement must terminate automatically upon its "assignment." As used in the 1940 Act, the term assignment includes any transfer of a controlling block of outstanding voting securities of an adviser or the parent company of an adviser. Such a transfer is often referred to as a "Change of Control Event." It is anticipated that one or more of the transactions contemplated by the Separation Plan would be deemed a Change of Control Event.
As described above, the Separation Plan contemplates an IPO or Demerger, which are expected to result ultimately in a direct or indirect Change of Control Event for the Adviser and for the Distributor, which in turn would result in the automatic termination of the current advisory agreement and current distribution agreement (together, the "Current Agreements"). The decisions by the Board, including a majority of the Independent Trustees, to approve the proposed advisory agreement and the proposed distribution agreement for the Funds (together, the "Proposed Agreements") were based on a determination by the Board that it would be in the best interests of the shareholders of the Funds for the Adviser and Distributor to continue providing investment advisory and distribution services to the Funds, as applicable and without interruption, as consummation of the Separation Plan proceeds.
The Board was aware that the IPO or the Demerger may not result immediately in a Change of Control Event, but also recognized that the Separation Plan contemplates a series of transactions that are expected to result in one or more Change of Control Events in the future. The Board concluded that approval by shareholders at this time of both the Proposed Agreements and any future agreements that may become effective upon certain Change of Control Events in the future will permit the Funds to benefit from the continuation of services by the Adviser and the Distributor throughout the Separation Plan without the need for multiple shareholder meetings. The Board determined, based on the advice of counsel to Jackson National, that the staff of the U.S. Securities and Exchange Commission should not object to approval of future agreements by shareholders at this time.
Prior to its approval of the Proposed Agreements, the Board reviewed, among other things, the quality, extent and nature of the services currently being provided by the Adviser and the Distributor under the Current Agreements and to be provided under the Proposed Agreements. A substantial portion of this review was conducted as part of, and in conjunction with, the Board's annual review of the Current Agreements, which were most recently approved for continuation at a meeting of the Board held on August 11, 2020.1
The Independent Trustees were advised by independent legal counsel in connection with their review of the Current Agreements and approval of the Proposed Agreements. Based on its review of the Current Agreements, the Board concluded, in light of all factors it deemed relevant, that the approval of the Current Agreements was in the best interests of the Funds and their shareholders and that the fee rates set forth in the Current Agreements were fair. Among other factors, the Board considered: (1) the nature, quality and extent of the services provided, (2) the investment performance of each Fund, (3)
48
cost of services for each Fund, (4) profitability data, (5) whether economies of scale may be realized and shared, in some measure, with investors as each Fund grows, and (6) other benefits that may accrue to PPM and JNLD through their relationship with the Trust.
In connection with its approval of the Proposed Agreements, on November 10, 2020, the Board considered its conclusions in connection with its August 11, 2020 approvals of those Current Agreements that were in effect on that date, including the Board's general satisfaction with the nature, extent and quality of services being provided and, as applicable, actions taken or to be taken in certain instances to improve the relationship between the costs and the quality of services being provided. Also on November 10, 2020, the Board considered a representation made to it on that date by the Adviser and Distributor that, other than certain updates provided for the Board’s consideration, there were no additional developments not already disclosed to the Board since August 11, 2020 that it deemed material and significant to the Board in connection with its consideration of the Proposed Agreements.
As a result, in addition to the information identified above, in considering the Proposed Agreements, the Board focused its review on, and requested and evaluated other information relating to, the potential impact of implementing the Separation Plan on the operations, personnel, organizational structure, capitalization, and financial and other resources of the Adviser, Distributor and their affiliates that render other services to the Funds. When making its decision on November 10, 2020, the Board took into account that it had posed ongoing inquiries to, and received regular updates from, the Adviser and from Jackson National relating to the Separation Plan.
The Independent Trustees’ due diligence process included an extensive review and analysis of additional information regarding the anticipated Separation Plan and related matters. This analysis focused on, among other matters, the expectations for continuity and stability of Jackson National and its affiliates, including PPM and JNLD, throughout implementation of the Separation Plan and thereafter. In this connection, the Trustees considered that the Board generally has been satisfied with the nature, extent and quality of the services provided to the Funds, including investment advisory, distribution, administrative and support services, and that it would be in the Funds' best interests to maintain continuity and stability of the services currently being provided. The Board carefully considered Jackson National’s, PPM’s and JNLD’s anticipated future plans related to capitalization, operational matters, the retention of staffing and related compensation structures, as well as the importance of the investment management operations within the Jackson National business structure going forward.
Among other steps in its due diligence process, the following actions were taken and considered by or on behalf of the Board:
1. The Independent Trustees solicited and received ongoing advice regarding the Board's legal duties from independent legal counsel for the Independent Trustees, which law firm has extensive experience regarding such matters.
2. The Independent Trustees, with assistance from independent legal counsel, prepared written inquiries to Jackson National, the Adviser, the Distributor and their affiliates regarding the IPO, Separation Plan, and the potential impact of the IPO and the Separation Plan on the Funds, if any, and on the business and operations of Jackson National and its affiliated entities, including PPM and JNLD.
3. The Board received written responses from Jackson National, the Adviser, the Distributor and their affiliates pursuant to inquiries made on the Board's behalf. The Board had the opportunity to review these and other materials, ask questions and request further information in connection with its consideration of the Proposed Agreements.
4. The Board requested and participated in meetings involving presentations from the Executive Vice President and General Counsel of Jackson National, as well as from senior management of the Adviser. The Board also requested and had such meetings with the Trust’s Chief Compliance Officer and Deputy Chief Risk Officer who, as a matter of course, report directly to the Board.
5. The Board received and reviewed the preliminary registration statement of JFI relating to the IPO (“Registration Statement”). In this connection, the Board considered, among other matters: the anticipated arrangements between Prudential plc and JFI over the course of the Separation Plan; the anticipated use of potential proceeds of the capital that would be raised through the IPO (including that portion of potential proceeds that may be realized from the IPO); and other information provided by the Adviser and its affiliates.
6. At a meeting held on November 10, 2020,1 the Board, among other actions, evaluated the responsive due diligence information provided to date by Jackson National, the Adviser, the Distributor and their affiliates, and considered input from independent legal counsel to the Independent Trustees of the Trust, counsel to Jackson National, and others regarding the Registration Statement and Separation Plan.
7. Among the information provided by Jackson National to the Board in response to the written inquiries prepared on behalf of the Independent Trustees were assurances that Jackson and its affiliates: are committed to maintaining appropriate levels of overall staffing, ongoing resources and service quality; and throughout the time period during which the Separation Plan is implemented, will notify and consult with the Board in advance if management proposes to take certain actions with respect to these matters. The Board considered that such services provided by JNAM, the Adviser and the Distributor include, but are not limited to, portfolio management services, administrative services, and distribution services. In this regard, the Board considered representations by the Adviser and the Distributor that their separation from Prudential plc as contemplated by the Separation Plan will not lead to a reduction in the quality or scope of these and other services provided by those firms to the Funds. The Board also considered that the Jackson National’s assertion that JNAM, the Adviser and the Distributor are core businesses to Jackson National and are critical to Jackson National’s future business plans, and note that this could provide a strong incentive to Jackson to provide appropriate resource allocations to support those businesses.
49
8. The Board considered representations by the Adviser and the Distributor that approval of the Proposed Agreements would be necessary for the Funds to continue receiving investment advisory and distribution services from the Adviser and Distributor, respectively, following the Change of Control Events contemplated by the Separation Plan.
9. The Board considered representations by the Adviser and Distributor, as well as related supporting documentation, indicating that the Proposed Agreements, including the fees payable thereunder, are substantively identical to and, in any event, are no less favorable to the Funds than, the terms of the corresponding Current Agreements.
10. The Board considered that, to the extent that the Proposed Agreements do have changes, those changes are designed to benefit shareholders and/or to provide management, subject to Board supervision, with greater flexibility to manage the Funds in a manner consistent with stated investment objectives. In this connection, the Board considered, among other matters, the Adviser’s and Distributor’s representation that no material changes would be made to the Proposed Agreements, as compared to the Current Agreements, with respect to the material contractual terms that were previously negotiated under which the Funds and their Adviser and Distributor currently operate, including contractual provisions relating to fees and expenses.
11. The Board considered representations by the Adviser, the Distributor and their affiliates, including senior investment management personnel, as well as related supporting documentation, indicating that: (a) the Adviser and Distributor can be expected to provide services of the same nature, extent and quality under the Proposed Agreements as are provided thereby under the Current Agreements; and (b) the Separation Plan is not expected to result in any changes to: (i) the management of the Funds, including the continuity of the Funds’ portfolio managers and other personnel responsible for the management operations of the Funds; or (ii) the investment objective of or the principal investment strategies used to manage any of the Funds. The Board considered that, while Jackson National has indicated that the Separation Plan will not result in changes to personnel responsible for the management operations of the Funds, certain changes in senior personnel have recently been announced.
12. The Board received assurances from Jackson National that it is committed to maintaining appropriate levels of overall staffing and ongoing resources and service quality for PPM and JNLD and that Jackson National will not take any action during implementation of the Separation Plan to materially reduce the levels of these resources (including reductions to the number of people assigned to various functional units) prior to reviewing the anticipated action with the Board. In addition, the Board noted that Jackson National will have an incentive to allocate appropriate resources to support these businesses in light of the importance of the asset management operations to the overall success of Jackson National.
13. The Board considered that Jackson National has agreed to bear all expenses associated with obtaining shareholder approval of the Proposed Agreements.
14. The Board considered the advice provided by independent legal counsel to the Funds and the Independent Trustees, and provided by the Adviser with respect to the Proposed Agreements (including advice relating to the process and timing of seeking shareholder approval of the Proposed Agreements, and whether shareholder approvals would be required in connection with any future aspects of the Separation Plan following the IPO) and regarding the Board's role and responsibilities with respect to Prudential plc's divestment of Jackson National.
15. The Board considered certain potential benefits to shareholders of the Funds of the transactions contemplated by the Separation Plan.
16. The Board considered the potential benefits to be realized by JNAM, the Adviser, the Distributor and their affiliates as a result of the Proposed Agreements.
17. The Board considered that, under the Proposed Agreements, it will continue to have the authority, should the need arise in its view, to terminate any of the Proposed Agreements without penalty upon 60 days' written notice.
Based on the foregoing and other relevant considerations, the Board, including a majority of the Independent Trustees, voted to approve the Proposed Agreements and, as applicable, to recommend approval of the Proposed Agreements by shareholders of the Funds. In this connection, the Board concluded that, in light of all factors considered, the terms of the Proposed Agreements, including fee rates, were fair, and that it would be in the best interests of shareholders of the Funds to approve the Proposed Agreements so as to enable there to be a continuation without interruption of the current services being provided by the current service providers pursuant to the Current Agreements. In this connection, the Board noted that no one factor was determinative of its decisions which, instead, were premised upon the totality of factors considered. In this connection, the Board also noted that different Board members may have placed emphasis on different factors in reaching their individual conclusions to vote in favor of the Proposed Agreements and to recommend approval of the Proposed Agreements to shareholders.
1 The meeting was held via videoconference in reliance on an exemptive order issued by the Securities and Exchange Commission SEC Release No. IC-33897 (June 19, 2020).
50
PPM FUNDS
SUPPLEMENT DATED AUGUST 24, 2020 TO
THE PROSPECTUS
DATED APRIL 29, 2020,
AS SUPPLEMENTED MAY 14, 2020
PPM Core Fixed Income Fund PPM Core Plus Fixed Income Fund PPM Floating Rate Income Fund PPM High Yield Core Fund PPM Investment Grade Credit Fund PPM Long Short Credit Fund PPM Large Cap Value Fund PPM Mid Cap Value Fund PPM Small Cap Value Fund (each, a “Fund,” and collectively, the “Funds”) | PKOIX PKPIX PKFIX PKHIX PKIIX PKLIX PZLIX PZMIX PZSIX |
This supplement provides new and additional information pertaining to the Funds that affects information contained in the Funds’ Prospectus and should be read in conjunction with the Prospectus.
The following changes are being made to the Prospectus, effective August 24, 2020:
In the section entitled “Glossary of Risks,” the first sentence in the description of Foreign Regulatory Risk is deleted and replaced with the following:
Foreign regulatory risk – PPM is an indirect wholly-owned subsidiary of Jackson Financial, Inc., which is a subsidiary of Prudential plc (“UK Parent”), a publicly-traded company incorporated in the United Kingdom. The UK Parent is not affiliated in any manner with Prudential Financial Inc., a company whose principal place of business is in the US, or with Prudential Assurance Company, a subsidiary of M&G plc, a company incorporated in the United Kingdom. Athene Co-Invest Reinsurance Affiliate 1A Ltd., a Bermuda Class C insurer under the Bermuda Insurance Act 1978, owns a minority interest in Jackson Financial Inc.
The sub-section “Investment Adviser” in the section “Management of The Funds” is deleted in its entirety and replaced with the following:
Investment Adviser
PPM America, Inc. (“PPM” or the “Adviser”), located at 225 W. Wacker Dr., Suite 1200, Chicago, IL, serves as the investment adviser to the Funds and provides professional investment supervision and management under an Investment Management Agreement between the Funds and the Adviser. The Adviser is registered with the SEC under the Investment Advisers Act of 1940, as amended (the “Advisers Act”). As of June 30, 2020, PPM managed approximately $105.4 billion of assets for internal, institutional and retail mandates worldwide.
PPM is an indirect, wholly-owned subsidiary of Jackson Financial Inc., which is a subsidiary of Prudential plc (“UK Parent”), a publicly-traded company incorporated in the United Kingdom. PPM was founded in 1990 to provide investment management services primarily to affiliates of the UK Parent. The UK Parent and its affiliated companies constitute one of the world’s leading financial services groups. The UK Parent is not affiliated in any manner with Prudential Financial Inc., a company whose principal place of business is in the US, or with Prudential Assurance Company, a subsidiary of M&G plc, a company incorporated in the United Kingdom. Athene Co-Invest Reinsurance Affiliate 1A Ltd., a Bermuda Class C insurer under the Bermuda Insurance Act 1978, owns a minority interest in Jackson Financial Inc.
The second and third paragraphs of the sub-section “Additional Service Providers” in the section “Management of the Funds” are deleted and replaced with the following:
Jackson National Asset Management, LLC (“JNAM”) serves as the administrator to the Funds. In its capacity as administrator, JNAM provides or procures, at its own expense, certain legal, audit, fund accounting, custody (except overdraft and interest expense), printing and mailing, and other administrative services necessary for the operation of the Funds. In return for these services, each Fund pays JNAM an administrative fee equal to a certain percentage of the Fund’s average daily net assets, accrued daily and paid monthly. JNAM is a subsidiary of Jackson National Life Insurance Company, a US-based financial services company. Jackson National Life Insurance Company is a wholly owned subsidiary of Jackson Financial Inc., which is a subsidiary of the UK Parent. Athene Co-Invest Reinsurance Affiliate 1A Ltd., a Bermuda Class C insurer under the Bermuda Insurance Act 1978, owns a minority interest in Jackson Financial Inc.
PPM FUNDS
SUPPLEMENT DATED NOVEMBER 30, 2020 TO
THE PROSPECTUS
DATED APRIL 29, 2020,
AS SUPPLEMENTED MAY 14, 2020, AUGUST 24, 2020,
AND OCTOBER 6, 2020
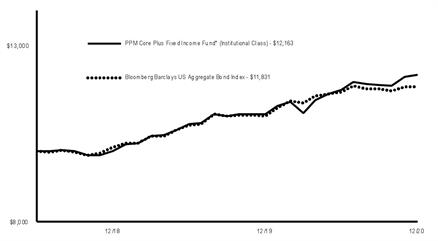
PPM Core Plus Fixed Income Fund (the “Fund”) | PKPIX |
This supplement provides new and additional information pertaining to the Fund that affects information contained in the Fund’ Prospectus and should be read in conjunction with the Prospectus.
The following changes are being made to the Prospectus, effective November 30, 2020:
Item 2. Code of Ethics.
As of the end of the period covered by this report, the registrant had adopted a code of ethics, as defined in Item 2 of Form N-CSR, applicable to its principal executive officer, principal financial officer, principal accounting officer or controller, or persons performing similar functions. There were no substantive amendments or any waivers to this code of ethics during the period covered by this report. A copy of this code of ethics is filed as Exhibit 13(a)(1) to this Form N-CSR.
Item 3. Audit Committee Financial Expert.
The registrant has named Kevin Callahan as an Audit Committee financial expert serving on its Audit Committee. Kevin Callahan is not an “interested person” of the Trust, as that term is defined by Section 2(a)(19) of the Investment Company Act of 1940, as amended, and is considered “independent” for purposes of this Item.
An “audit committee financial expert” is not an “expert” for any purpose, including for purposes of Section 11 of the Securities Act of 1933, as amended, as a result of being designated as an “audit committee financial expert.” Further, the designation of a person as an “audit committee financial expert” does not mean that the person has any greater duties, obligations, or liability than those imposed on the person without the “audit committee financial expert” designation. Similarly, the designation of a person as an “audit committee financial expert” does not affect the duties, obligations, or liability of any other member of the Audit Committee or Board of Trustees.
Item 4. Principal Accountant Fees and Services.
(a)-(d)
The administrator of the registrant is responsible for payment of all expenses associated with the annual audit and other required services of the independent registered accounting firm, and all expenses associated with the preparation and filing of the tax returns.
KPMG LLP (“KPMG”) was appointed by the Board of Managers as the independent registered public accounting firm of the registrant for the fiscal years ended December 31, 2019 and December 31, 2020. The following table sets forth aggregate fees billed by KPMG for the respective period for professional services rendered to the registrant.
Fees for Services Rendered to the Registrant by KPMG
Fiscal Year | Audit Fees | Audit-Related Fees | Tax Fees | All Other Fees | ||||
2019 | $144,828 | $0 | $0 | $0 | ||||
2020 | $67,129 | $0 | $0 | $0 |
The above Audit-Related Fees for 2019 and 2020, respectively, are the aggregate fees billed for professional services rendered by KPMG to the registrant for the services provided in connection with the registrant’s registration statement filings.
Fees for Services Rendered to Adviser Entities by KPMG
The following table sets forth the amount of fees that were billed by KPMG for the respective period to any entity controlling, controlled by, or under common control with the investment adviser that provided ongoing services to the registrant (“Adviser Entities”) that were directly related to the registrant’s operations and financial reporting.
Fiscal Year | Audit-Related Fees | Tax Fees | All Other Fees | |||
2019 | $0 | $0 | $0 | |||
2020 | $0 | $0 | $0 |
(e)(1) The Audit Committee is authorized to pre-approve non-audit services provided by the registrant’s auditors, if they find it appropriate in light of their fiduciary duties and in the exercise of their good faith business judgment and compatible with the auditors’ independence. The Chairman of the Audit Committee is authorized to approve audit and non-audit services for newly established Funds of the registrant on the same terms as the full Audit Committee previously had approved for the then existing Funds.
(e)(2) 0%
(f) Not applicable.
(g) The aggregate fees billed for all non-audit fees to the registrant and Adviser Entities for the fiscal year ended December 31, 2019 was $0. The aggregate fees billed for all non-audit fees to the registrant and Adviser Entities for the fiscal year ended December 31, 2020 was $0.
(h) For the fiscal years ended December 31, 2019 and December 31, 2020, the Audit Committee of the registrant’s Board of Trustees considered the provision of non-audit services that were rendered to the Adviser Entities that were not pre-approved pursuant to paragraph (c)(7)(ii) of Rule 2-01 of Regulation S-X and concluded that such services were compatible with maintaining KPMG’s independence.
Item 5. Audit Committee of Listed Registrants.
Not applicable.
Item 6. Schedule of Investments.
(a) Included as a part of the report to shareholders filed under Item 1.
(b) Not applicable.
Item 7. Disclosure of Proxy Voting Policies and Procedures for Closed-End Management Investment Companies.
Not applicable.
Item 8. Portfolio Managers of Closed-End Management Investment Companies.
Not applicable.
Item 9. Purchases of Equity Securities by Closed-End Management Investment Company and Affiliated Purchasers.
Not applicable.
Item 10. Submission of Matters to a Vote of Security Holders.
No material changes have been made.
Item 11. Controls and Procedures.
(a) The registrant maintains disclosure controls and procedures that are designed to ensure that information required to be disclosed in the registrant’s filings under the Securities Exchange Act of 1934, as amended, and the Investment Company Act of 1940, as amended, is recorded, processed, summarized, and reported within the periods specified in the rules and forms of the U.S. Securities and Exchange Commission. Such information is accumulated and communicated to the registrant’s management, including its principal executive officer and principal financial officer, as appropriate, to allow timely decisions regarding required disclosure. The registrant’s management, including the principal executive officer and the principal financial officer, recognizes that any set of controls and procedures, no matter how well designed and operated, can provide only reasonable assurance of achieving the desired control objectives.
Within ninety (90) days prior to the filing date of this report on Form N-CSR, the registrant had carried out an evaluation, under the supervision and with the participation of the registrant’s management, including the registrant’s principal executive officer and the registrant’s principal financial officer, of the effectiveness of the design and operation of the registrant’s disclosure controls and procedures. Based on such evaluation, the registrant’s principal executive officer and principal financial officer concluded that the registrant’s disclosure controls and procedures are effective.
(b) There have been no significant changes in the registrant’s internal controls over financial reporting (as defined in Rule 30a-3(d) under the Investment Company Act pf 1940) during the period covered by this report that have materially affected, or are reasonably likely to materially affect, the registrant’s internal controls over financial reporting. There have been no significant changes in the registrant’s internal controls or in other factors that could significantly affect the internal controls subsequent to the date of their evaluation in connection with the preparation of this report on Form N-CSR.
Item 12. Disclosure of Securities Lending Activities for Closed-End Management Investment Companies.
Not applicable.
Item 13. Exhibits.
(a) |
(3) Not applicable.
(b) |
SIGNATURES
Pursuant to the requirements of the Securities Exchange Act of 1934, as amended, and the Investment Company Act of 1940, as amended, the registrant has duly caused this report to be signed on its behalf by the undersigned, thereunto duly authorized.
PPM Funds | ||
By: | /s/ Mark D. Nerud | |
Mark D. Nerud | ||
Principal Executive Officer | ||
Date: | March 4, 2021 |
Pursuant to the requirements of the Securities Exchange Act of 1934, as amended, and the Investment Company Act of 1940, as amended, this report has been signed below by the following persons on behalf of the registrant and in the capacities and on the dates indicated.
By: | /s/ Mark D. Nerud | |
Mark D. Nerud | ||
Principal Executive Officer | ||
Date: | March 4, 2021 | |
By: | /s/ Andrew Tedeschi | |
Andrew Tedeschi | ||
Principal Financial Officer | ||
Date: | March 4, 2021 |
EXHIBIT LIST
Exhibit 13(a)(1) | Registrant’s Code of Ethics pursuant to Section 406 of the Sarbanes-Oxley Act of 2002. | |
Exhibit 13(a)(2) | Certification of the Principal Executive Officer required by Rule 30a-2(a) under the Investment Company Act of 1940, as amended. | |
Certification of the Principal Financial Officer required by Rule 30a-2(a) under the Investment Company Act of 1940, as amended. | ||
Exhibit 13(b) | Certification required by Rule 30a-2(b) under the Investment Company Act of 1940, as amended. |