
METALLA ROYALTY & STREAMING LTD.
MANAGEMENT’S DISCUSSION & ANALYSIS
For the three months ended August 31, 2019
| METALLA ROYALTY & STREAMING LTD. |
| MANAGEMENT’S DISCUSSION AND ANALYSIS |
| (Expressed in Canadian dollars, unless otherwise indicated) |
| FOR THE THREE MONTHS ENDED AUGUST 31, 2019 |
GENERAL
This management’s discussion and analysis (“MD&A”) for Metalla Royalty & Streaming Ltd. (the “Company” or “Metalla”) is intended to help the reader understand the significant factors that have affected Metalla and its subsidiaries performance and such factors that may affect its future performance. This MD&A, which has been prepared as of October 24, 2019, should be read in conjunction with the Company’s condensed interim consolidated financial statements for the three months ended August 31, 2019 and the related notes contained therewith. The Company reports its financial position, financial performance and cash flows in accordance with International Financial Reporting Standards (“IFRS”) as issued by the International Accounting Standards Board (“IASB”). All dollar amounts included in the following MD&A are in Canadian dollars (“C$”) except where noted. These documents and other information relevant to the Company’s activities are available for viewing on SEDAR at www.sedar.com.
INDEX
| Management’s Discussion and Analysis - Page 1 |
| METALLA ROYALTY & STREAMING LTD. |
| MANAGEMENT’S DISCUSSION AND ANALYSIS |
| (Expressed in Canadian dollars, unless otherwise indicated) |
| FOR THE THREE MONTHS ENDED AUGUST 31, 2019 |
COMPANY OVERVIEW
Metalla Royalty & Streaming Ltd. ("Metalla" or the "Company") is a precious metals royalty and streaming company that is focused on acquiring gold and silver metal purchase agreements, net smelter return royalties (“NSRs”), gross value return royalties (“GVRs”), net profit interests (“NPIs), gross proceeds royalties (“GPRs”), and non-operating interests in mining projects that provide the right to the holder of a percentage of the gross revenue from metals produced from the project or a percentage of the gross revenue from metals produced from the project after deducting specified costs, if any, respectively. For purposes of reporting, the Company calculates attributable silver equivalent production by applying its interest (i.e. royalty or stream percentage) to the total production reported by the counterparty and silver equivalency of non-silver products is based on average realized prices of all metals for the period. The Company’s common shares are listed on the TSX Venture Exchange (“TSX-V”) under the symbol “MTA”. The head office and principal address is 501 - 543 Granville Street, Vancouver, British Columbia, Canada.
COMPANY HIGHLIGHTS
During the three months ended August 31, 2019, the Company:
consolidated its ownership on St. Barbara Ltd.’s (“St. Barbara”) FMS deposit through the acquisition of a 3.0% net smelter royalty on the Plenty deposit and Seloam Brook prospect for $2,000,000, of which $500,000 was paid upfront;
drew down the initial advance of $7,000,000 on its convertible loan facility with Beedie Capital (“Beedie”);
repaid loans payable with an aggregate principal balance of US$2,000,000;
had 116,359 (May 31, 2019 - 59,515) attributable silver oz. remaining at end of Q1-2020, an increase of 56,844 oz. over the quarter (due to a planned bulk shipment of concentrate scheduled for October 2019 from the Endeavor mine, which resulted in no shipments during Q1-2020);
shipped an estimated 5,366 tonnes of concentrate at 621 g/t of silver (approximately 107,221 attributable silver oz.) from the Endeavor mine subsequently;
revenue at Endeavor for Q1 will be recognized in Q2 due to a planned bulk shipment of concentrate (see above) which resulted in recognized revenue from stream interest in Q1 of $160,298 (2018 - $3,900,301), loss from operations of $1,199,419 (2018 - income of $1,121,445), net loss of $1,215,163 (2018 - $312,031), and adjusted EBITDA of negative $590,666 (2018 - positive $1,731,581) (see non-IFRS Financial Measures); and
recorded cash flow from operating activities, before net change in non-cash working capital items, of $113,079 (2018 - $1,322,771), offset by $542,698 spent on acquisitions of net smelter royalty interests, resulting in positive working capital of $7,082,614 (May 31, 2019 - $862,799).
OVERVIEW OF ROYALTIES AND STREAMS
| Property | Operator | Location | Stage | Metal | Terms |
| Endeavor Mine | CBH Resources | NSW, Australia | Production | Zn, Pb, Ag | 100% Ag Stream |
| Joaquin Mine | Pan American Silver | Santa Cruz, Argentina | Development | Ag, Au | 2.0% NSR |
| Santa Gertrudis | Agnico Eagle | Sonora, Mexico | Development | Au | 2.0% NSR(3) |
| FMS | St. Barbara | Halifax, Nova Scotia | Development | Au | 1.0% NSR |
| FMS (Plenty) | St. Barbara | Halifax, Nova Scotia | Development | Au | 3.0% NSR |
| COSE Mine | Pan American Silver | Santa Cruz, Argentina | Development | Ag, Au | 1.5% NSR |
| Garrsion Mine | O3 Mining | Kirkland Lake, Ontario | Development | Au | 2.0% NSR |
| El Realito | Agnico Eagle | Sonora, Mexico | Development | Ag, Au | 2.0% NSR |
| Hoyle Pond Ext. | Newmont Goldcorp | Timmins, Ontario | Development | Au | 2.0% NSR(3) |
| La Fortuna | Minera Alamos | Durango, Mexico | Development | Au, Ag, Cu | 1.0% NSR(4) |
| New Luika | Shanta Gold | Tanzania | Production | Au | 15% Ag Stream |
| Wasamac | Monarch Gold | Val d'Or, Quebec | Development | Au | 1.5% NSR |
| Timmins West Ext. | Pan American Silver | Timmins, Ontario | Development | Au | 1.5% NSR(3) |
| Beaufor Mine | Monarch Gold | Val d'Or, Quebec | Development | Au | 1.0% NSR |
| San Luis | SSR Mining | Peru | Development | Ag, Au | 1.0% NSR |
| Akasaba West | Agnico Eagle | Val d'Or, Quebec | Development | Au, Cu | 2.0% NSR(3) |
| Management’s Discussion and Analysis - Page 2 |
| METALLA ROYALTY & STREAMING LTD. |
| MANAGEMENT’S DISCUSSION AND ANALYSIS |
| (Expressed in Canadian dollars, unless otherwise indicated) |
| FOR THE THREE MONTHS ENDED AUGUST 31, 2019 |
| TVZ Zone | Newmont Goldcorp | Timmins, Ontario | Development | Au | 2.0% NSR |
| Dufferin East | Resource Capital | Halifax, Nova Scotia | Development | Au | 1.0% NSR |
| Zaruma | Core Gold | Ecuador | Development | Au | 1.5% NSR |
| Kirkland-Hudson | Kirkland Lake Gold | Kirkland Lake, Ontario | Exploration | Au | 2.0% NSR |
| Orion | Minera Frisco | Nayarit, Mexico | Exploration | Au, Ag | 2.75% NSR(6) |
| Big Island | Copper Reef Mining | Flin Flon, Manitoba | Exploration | Au | 2.0% NSR |
| Biricu | Guerrero Ventures | Guerrero, Mexico | Exploration | Au, Ag | 2.0% NSR |
| Boulevard | Independence Gold | Yukon | Exploration | Au | 1.0% NSR |
| Camflo Northwest | Monarch Gold | Val d'Or, Quebec | Exploration | Au | 1.0% NSR |
| Edwards Mine | Wateron | Wawa, Ontario | Exploration | Au | 1.25% NSR |
| Pucarana | Buenaventura | Peru | Exploration | Au, Ag | 1.8% NSR(4) |
| Capricho | Pucara | Peru | Exploration | Au, Ag | 1.0% NSR |
| Lourdes | Pucara | Peru | Exploration | Au | 1.0% NSR |
| Santo Tomas | Pucara | Peru | Exploration | Au | 1.0% NSR |
| Guadalupe/Pararin | Pucara | Peru | Exploration | Au | 1.0% NSR |
| DNA | Detour Gold | Cochrane, Canada | Exploration | Au | 2.0% NSR |
| Puchildiza | Metalla | Chile | Exploration | Au | 1.5% NSR(5) |
| DeSantis Mine | Canadian Gold Miner | Timmins, Ontario | Exploration | Au | 1.5% NSR |
| Bint Property | Glencore | Timmins, Ontario | Exploration | Au | 2.0% NSR |
| Colbert/Anglo | Goldcorp | Timmins, Ontario | Exploration | Au | 2.0% NSR |
| Montclerg | IEP | Timmins, Ontario | Exploration | Au | 1.0% NSR |
| Pelangio Poirier | Pelangio Exp. | Timmins, Ontario | Exploration | Au | 1.0% NSR |
| Beaudoin | Explor Resources | Timmins, Ontario | Exploration | Au, Ag | 0.4% NSR |
| Sirola Grenfell | Golden Peak Res. | Kirkland Lake, Ontario | Exploration | Au | 0.25% NSR |
| Mirado Mine | Orefinders | Kirkland Lake, Ontario | Exploration | Au | 1.0% NSR(4) |
| Solomon's Pillar | Sage Gold | Greenstone, Ontario | Exploration | Au | 1.0% NSR |
| Los Patos | Private | Venezuela | Exploration | Au | 1.5% NSR |
| Tower Mountain | Private | Thunder Bay, Ontario | Exploration | Au | 2.0% NSR(6) |
| Goodfish Kirana | Warrior Gold | Kirkland Lake, Ontario | Exploration | Au | 1.0% NSR |
| (1) | Zn: zinc, Pb: lead, Ag: silver, and Au: gold |
| (2) | See the Company’s website at https://www.metallaroyalty.com/ for the complete list and further details |
| (3) | Subject to partial buy-back and/or exemption |
| (4) | Option to acquire the underlying and/or additional royalty |
| (5) | Option available |
| (6) | Subject to closing conditions |
| Management’s Discussion and Analysis - Page 3 |
| METALLA ROYALTY & STREAMING LTD. |
| MANAGEMENT’S DISCUSSION AND ANALYSIS |
| (Expressed in Canadian dollars, unless otherwise indicated) |
| FOR THE THREE MONTHS ENDED AUGUST 31, 2019 |
QUARTERLY UPDATES ON ROYALTIES AND STREAMS
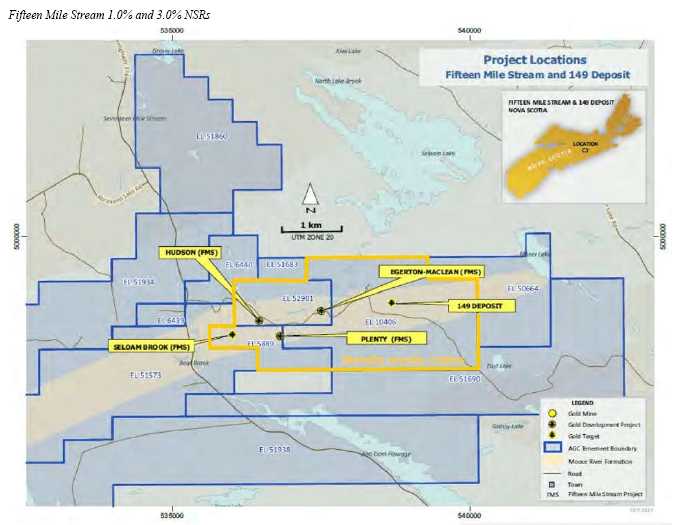
St. Barbara disclosed by news release on October 21, 2019 that it continued drilling at FMS, which was focused on expanding the resource base to the east and west. Mineralization was extended west of the resource base within the Seloam Brook prospect. Significant intercepts from five holes included 6 m at 2.22 g/t gold and 4 m at 9.73 g/t gold, assays are pending for the remaining eight holes.
| Management’s Discussion and Analysis - Page 4 |
| METALLA ROYALTY & STREAMING LTD. |
| MANAGEMENT’S DISCUSSION AND ANALYSIS |
| (Expressed in Canadian dollars, unless otherwise indicated) |
| FOR THE THREE MONTHS ENDED AUGUST 31, 2019 |
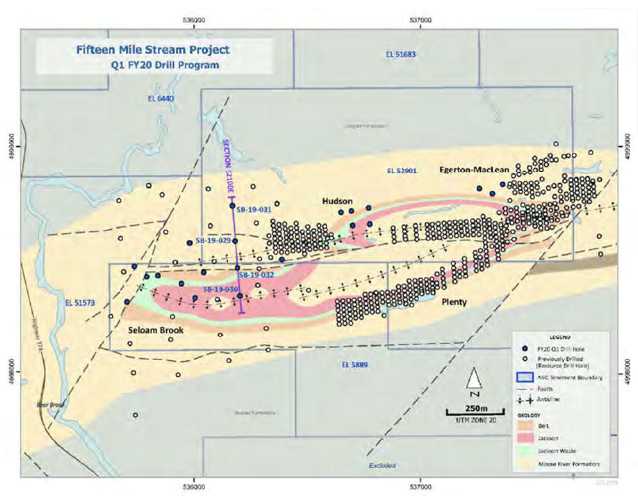
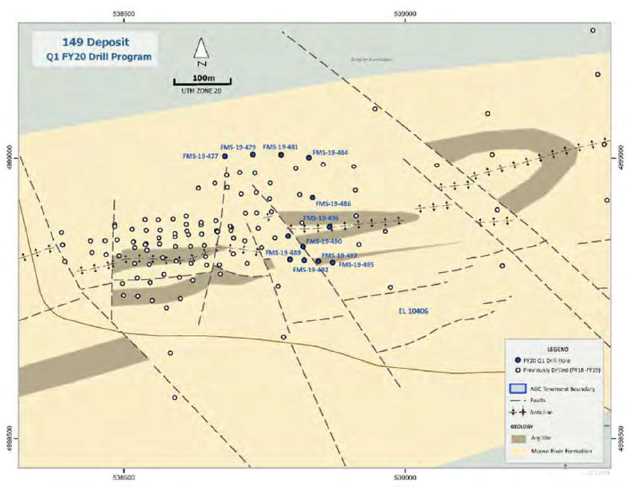
Drilling at the 149 deposit to the east of the resource base is ongoing, with a plan of twelve diamond drill holes focused on resource expansion. To date, assays are pending for drill holes on the 149 deposit, but core logging has visually indicated that the target zones have been intercepted. At the main resource base, eight exploration holes focused on the resource expansion between the planned Hudson and Egerton-Maclean open pits. Assays are pending however; initial visual inspection and core logging supports the potential extension of gold mineralization approximately 100m northwest of the Egerton-Maclean pit and 200 m east of the Hudson pit.
| Management’s Discussion and Analysis - Page 5 |
| METALLA ROYALTY & STREAMING LTD. |
| MANAGEMENT’S DISCUSSION AND ANALYSIS |
| (Expressed in Canadian dollars, unless otherwise indicated) |
| FOR THE THREE MONTHS ENDED AUGUST 31, 2019 |
For more information please see St Barbara Limited press release dated October 21, 2019 and Q1 Report.
El Realito 2.0% NSR
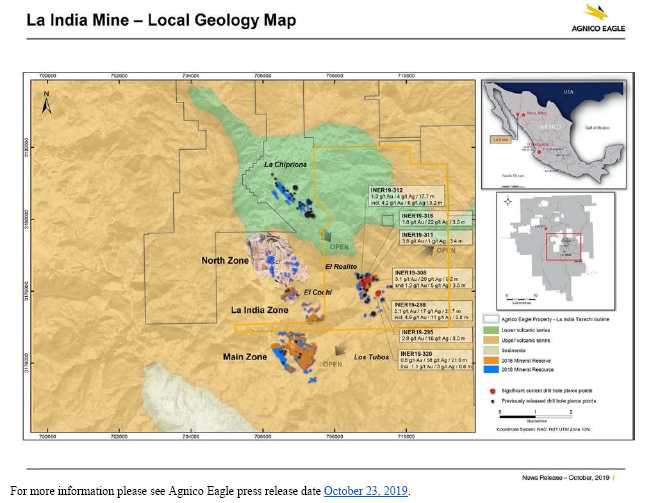
On October 23, 2019, Agnico Eagle Mines Limited (“Agnico Eagle”) reported by news release they continued to have exploration success at El Realito which is part of operating La India mine. Drilling within the main corridor confirmed that the mineralized structures are steeply dipping to the northwest, suggesting the possibility of a lower strip ratio with increased resources within the current pit design. Drilling within the main corridor indicated the possibility of increasing mineral reserves below the current pit plan with intercepts of 1.3 g/t gold and 4 g/t silver over 17.7 m and 3.1 g/t gold and 20 g/t silver over 9.2 m.
To the southeast at the El Realito east corridor, the structural continuity of the mineralization has been extended with significant intercepts of 2.1 g/t gold and 17 g/t silver over 22.7 m and 2.8 g/t gold and 16 g/t silver over 8 m.
Agnico Eagle is currently undergoing an exploration program to further test the extension of the mineralized system in order to expand the mineral resources, which they expect will increase in the annual updated resource estimate scheduled for February 2020. Located 1.5km east of the operating North and La India zones, El Realito continues to have the potential to extend the current mine life at La India.
| Management’s Discussion and Analysis - Page 6 |
| METALLA ROYALTY & STREAMING LTD. |
| MANAGEMENT’S DISCUSSION AND ANALYSIS |
| (Expressed in Canadian dollars, unless otherwise indicated) |
| FOR THE THREE MONTHS ENDED AUGUST 31, 2019 |
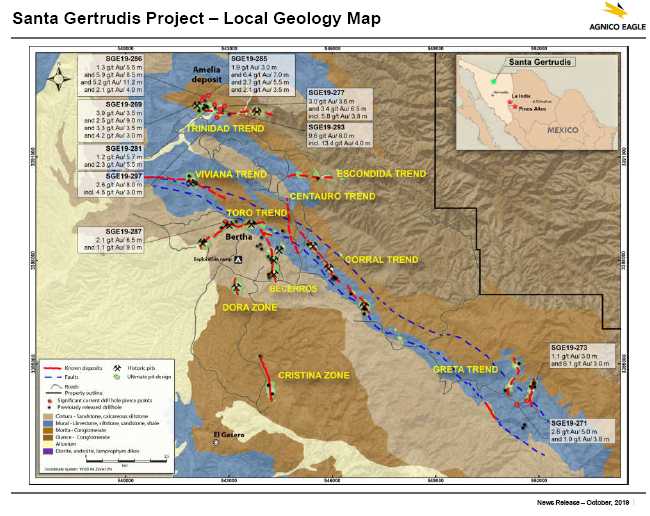
Santa Gertrudis 2.0% NSR
On October 23, 2019, Agnico Eagle reported by news release continued exploration success at its Santa Gertrudis project, particularly at Amelia where over 15,000 m have been drilled at the end of the third quarter. Drilling at the Amelia discovery continued to extend the deposit to the east. Significant intercepts to the north of Amelia include 3.9 g/t gold over 3.5 m and 5.9 g/t gold over 8.5 m, 70 metres to the northeast. The deepest hole to date at Santa Gertrudis, intercepted 2.1g/t gold over 4 m at 439 m depth and 150 m to the northeast a hole intersected 6.4 g/t gold over 7m. In the eastern extension of the Amelia deposit, drilling continued to expand the resource envelope with intercepts such as 9.6 g/t gold over 6 m, 5.8 g/t gold over 3.8 m and 2.6 g/t gold over 8 m.
Further south of the Trinidad zone, the Toro zone was extended to the northwest with holes intersecting 2.1 g/t gold over 6.5 m and 1.1 g/t gold over 9 m. Agnico Eagle disclosed by news release that it believes that Santa Gertrudis has the potential to eventually be a similar size operation to La India.
| Management’s Discussion and Analysis - Page 7 |
| METALLA ROYALTY & STREAMING LTD. |
| MANAGEMENT’S DISCUSSION AND ANALYSIS |
| (Expressed in Canadian dollars, unless otherwise indicated) |
| FOR THE THREE MONTHS ENDED AUGUST 31, 2019 |
For more information please see Agnico Eagle press release date October 23, 2019.
Endeavor 100% Silver Stream
Production at Endeavor for the quarter of 56,844 oz Ag was in line with the revised schedule from CBH Resources (“CBH”), but concentrate shipments were pushed into Q2 due to a planned bulk shipment in October of an estimated 107,221 oz Ag which resulted in Q1 revenue from the mine to be realized in Q2. CBH announced on July 17, 2019 that it will scale back production from 25,000 to 17,000 tonnes per month and staff for the remainder of calendar year 2019 while focusing on infill drilling of the new Deep Zinc Lode Resource to better appraise its future viability. A production decision on the Deep Zinc Lode is expected by the end of calendar year 2019 with the potential to add 3 to 5 years of production. Metalla will continue to monitor production at the Endeavor mine.
Metalla has the right to buy 100% of the silver production up to 20.0 million ounces (7.2 million ounces have been delivered to date) from the Endeavor Mine for an operating cost contribution of US$1.00 per ounce of payable silver, indexed annually for inflation, and a further increment of 50% of the amount by which silver price exceeds US$7.00 per ounce.
| Management’s Discussion and Analysis - Page 8 |
| METALLA ROYALTY & STREAMING LTD. |
| MANAGEMENT’S DISCUSSION AND ANALYSIS |
| (Expressed in Canadian dollars, unless otherwise indicated) |
| FOR THE THREE MONTHS ENDED AUGUST 31, 2019 |
Joaquin 2% and COSE 1.5% NSRs
Pan American Silver Corp. has disclosed they will report its third quarter results on November 6, 2019. Metalla expects a production update on both of its COSE and Joaquin royalties at that time.
Production and sales from royalties and streams
| Q1 | Q1 | |||||
| 2020 | 2019 | |||||
| Attributable silver oz. from prior period | 59,515 | 90,476 | ||||
| Production during the period | ||||||
| Endeavor Silver Stream | 63,760 | 167,981 | ||||
| NLGM(1) | 4,389 | 4,391 | ||||
| Total attributable silver oz. produced | 127,664 | 262,848 | ||||
| Total attributable silver oz. sold(3) | (11,305 | ) | (221,433 | ) | ||
| Remaining attributable silver oz.(2) | 116,359 | 41,415 |
| (1) | Adjusted for the Company’s proportionate share of NLGM held by Silverback. |
| (2) | Represents attributable silver oz. that were produced and to be realized by the operator(s) in subsequent periods after the reporting date. |
| (3) | Delivery delayed during Q1-2020 due to a bulk shipment planned for October 2019. |
OUTLOOK
The Company will provide guidance for fiscal 2020 upon commercial production for Joaquin and COSE and CBH Resources production decision on the new discovery of the Deep Zinc Lode at Endeavor expected in fiscal Q2-2020.
SUMMARY OF QUARTERLY RESULTS
The following table provides selected financial information for the eight quarters up to August 31, 2019 and should be read in conjunction with the Company’s condensed interim consolidated financial statements for the three months ended August 31, 2019 and 2018.
| Q1-2020 | Q4-2019 | Q3-2019 | Q2-2019 | |||||||||
| Revenue from stream interest | $ | 160,298 | $ | 887,214 | $ | 1,442,006 | $ | 1,623,140 | ||||
| Share-based payments | (536,904 | ) | (228,411 | ) | (362,547 | ) | (214,056 | ) | ||||
| Net loss for the period | (1,215,152 | ) | (1,188,405 | ) | (446,105 | ) | (496,948 | ) | ||||
| Dividends declared and paid | 399,094 | 565,603 | 492,648 | 401,314 | ||||||||
| Earnings (loss) per share - basic and diluted | (0.01 | ) | (0.01 | ) | (0.00 | ) | (0.01 | ) | ||||
| Weighted average shares outstanding - basic | 133,290,007 | 127,427,085 | 111,928,822 | 92,698,885 |
| Q1-2019 | Q4-2018 | Q3-2018 | Q2-2018 | |||||||||
| Revenue from stream interest | $ | 3,900,301 | $ | 1,868,092 | $ | 1,761,491 | $ | 3,066,670 | ||||
| Share-based payments | (279,457 | ) | (179,517 | ) | (28,800 | ) | - | |||||
| Net loss for the period | (312,031 | ) | (797,120 | ) | (310,845 | ) | (440,105 | ) | ||||
| Dividends declared and paid | 354,174 | 225,519 | 148,759 | - | ||||||||
| Earnings (loss) per share - basic and diluted | (0.00 | ) | (0.01 | ) | (0.00 | ) | (0.01 | ) | ||||
| Weighted average shares outstanding - basic | 79,311,399 | 75,236,522 | 74,407,325 | 73,168,849 |
RESULTS OF OPERATIONS
Three months ended August 31, 2019
The Company’s net loss totaled $1,215,152 (2018 - $312,031) for the three months ended August 31, 2019. Overall, net loss for the current quarter was significantly affected by shipment delays at the Endeavor Mine, where the mine operator held concentrate inventory containing 116,359 oz. of silver attributable to the Company as at the reporting date. General and administrative expenses remained comparative, while the Company recognized finance charges of $336,098 related to the convertible facility with Beedie.
| Management’s Discussion and Analysis - Page 9 |
| METALLA ROYALTY & STREAMING LTD. |
| MANAGEMENT’S DISCUSSION AND ANALYSIS |
| (Expressed in Canadian dollars, unless otherwise indicated) |
| FOR THE THREE MONTHS ENDED AUGUST 31, 2019 |
LIQUIDITY AND CAPITAL RESOURCES
The Company considers items included in shareholders’ equity as capital. The Company’s objective when managing capital is to safeguard the Company’s ability to continue as a going concern, so that it can continue to provide returns for shareholders and benefits for other stakeholders.
The Company’s cash as at August 31, 2019 totaled $7,211,357 (May 31, 2019 - $4,603,062) and its working capital was $7,084,438 (May 31, 2019 - $862,799). The Company manages the capital structure and makes adjustments in light of changes in economic conditions and the risk characteristics of the underlying assets.
The Company believes it has sufficient working capital to undertake its current business plan. However, should the Company undertake anything over and above these plans, management will need additional sources of working capital. In order to maintain or adjust the capital structure, the Company may issue new shares through public and/or private placements, sell assets, or return capital to shareholders.
During the three months ended August 31, 2019, cash increased by $2,608,295. The increase was due to net cash provided by financing activities of $3,938,593, partially offset by net cash used in operating and investing activities of $757,647 and $542,698, respectively. Exchange rate changes had a negative impact on cash of $29,953.
Operating activities
During the three months ended August 31, 2019, net cash used in operating activities amounted to $757,647, which included an increase in trade receivables of $35,896 and a decrease in trade and other payable of $834,830 during the normal course of business.
Investing activities
Cash used in the Company’s investing activities during the three months ended August 31, 2019 totaled $542,698, which were related to the acquisition of NSR royalties.
Financing activities
Cash provided by the Company’s financing activities during the three months ended August 31, 2019 totaled $3,938,593, which were primarily comprised of $7,000,000 from the Beedie convertible facility and $520,015 from the exercise of share purchase warrants and stock options, partially offset by $2,666,250 of principal loan repayments, $399,094 of dividend, $336,098 of finance charges, and $179,980 of interest.
| Management’s Discussion and Analysis - Page 10 |
| METALLA ROYALTY & STREAMING LTD. |
| MANAGEMENT’S DISCUSSION AND ANALYSIS |
| (Expressed in Canadian dollars, unless otherwise indicated) |
| FOR THE THREE MONTHS ENDED AUGUST 31, 2019 |
Requirement of additional financing
Management believes that the Company’s current operational requirements and capital projects can be funded from existing cash and cash generated from operations. If future circumstances dictate an increased cash requirement and we elect not to delay, limit, or eliminate some of our plans, we may raise additional funds through debt financing, the issuance of hybrid debt-equity securities, or additional equity securities. The Company has relied entirely on equity financings and loans for all funds raised to date for its acquisitions, capital expansions, and operations. Capital markets may not be receptive to offerings of new equity from treasury or debt, whether by way of private placements or public offerings. The Company’s growth and success may be dependent on external sources of financing which may not be available on acceptable terms.
TRANSACTIONS WITH RELATED PARTIES
The aggregate value of transactions and outstanding balances relating to key management personnel were as follows:
| Salary | Share-based | ||||||||
| For the three months ended August 31, 2019 | or fees | Payments | Total | ||||||
| Management | $ | 96,728 | $ | 144,993 | $ | 241,721 | |||
| Directors | 49,836 | 323,528 | 373,364 | ||||||
| $ | 146,564 | $ | 468,521 | $ | 615,085 |
As at August 31, 2019, the Company had $Nil (May 31, 2019 - $407,284) due to directors and management related to remuneration and expense reimbursements, which have been included in accounts payable and accrued liabilities.
OFF-BALANCE SHEET ARRANGEMENTS
As of the date of this MD&A, the Company does not have any off-balance sheet arrangements that have, or are reasonably likely to have, a current or future effect on the results of operations or financial condition of the Company, including, and without limitation, such considerations as liquidity and capital resources.
PROPOSED TRANSACTIONS
While the Company continues to pursue further transactions, there are no binding transactions of a material nature that have not already been disclosed publicly.
COMMITMENTS
The Company had certain payments in cash and common shares related to its royalty interests, see Note 13 of the condensed interim consolidated financial statements for the three months ended August 31, 2019.
FINANCIAL INSTRUMENTS
Fair value
Financial instruments recorded at fair value on the statement of financial position are classified using a fair value hierarchy that reflects the significance of the inputs used in making the measurements. The fair value hierarchy has the following levels:
- Level 1 - Unadjusted quoted prices in active markets for identical assets or liabilities;
- Level 2 - Inputs other than quoted prices that are observable for assets or liabilities, either directly or indirectly; and
- Level 3 - Inputs for assets and liabilities that are not based on observable market data.
The fair value hierarchy requires the use of observable market inputs whenever such inputs exist. A financial instrument is classified to the lowest level of the hierarchy for which a significant input has been considered in measuring fair value. As at August 31, 2019, the Company did not have any financial instruments measured at fair value.
The carrying value of cash, receivables, and accounts payable and accrued liabilities approximated their fair value because of the short-term nature of these instruments. Receivable from provisional sales (if any) includes provisional pricing, and final price and assay adjustments and is valued using observable market commodity forward prices and thereby classified within Level 2 of the fair value hierarchy. The fair value of the Company’s loan payable is approximated by its carrying value as its interest rates are comparable to market interest rates.
| Management’s Discussion and Analysis - Page 11 |
| METALLA ROYALTY & STREAMING LTD. |
| MANAGEMENT’S DISCUSSION AND ANALYSIS |
| (Expressed in Canadian dollars, unless otherwise indicated) |
| FOR THE THREE MONTHS ENDED AUGUST 31, 2019 |
The Company’s activities expose it to financial risks of varying degrees of significance which could affect its ability to achieve its strategic objectives for growth and shareholder returns. The principal financial risks to which the Company is exposed are credit risk and liquidity risk. The Board of Directors has overall responsibility for the establishment and oversight of the Company’s risk management framework and reviews the Company’s policies on an ongoing basis.
Credit risk
Credit risk arises from cash deposits, as well as credit exposures to counterparties of outstanding receivables and committed transactions. There is no significant concentration of credit risk other than cash deposits. The Company’s cash deposits are primarily held with a Canadian chartered bank. Receivables include value added tax due from the Canadian government. The carrying amount of financial assets recorded in the financial statements represents the Company’s maximum exposure to credit risk. The Company believes it is not exposed to significant credit risk and overall, the Company’s credit risk has not declined significantly from the prior year.
Liquidity risk
Liquidity risk is the risk that the Company will not be able to meet its financial obligations as they fall due. The Company manages liquidity risk by continuing to monitor forecasted and actual cash flows. The Company has in place a planning and budgeting process to help determine the funds required to support the Company’s normal operating requirements on an ongoing basis and its development plans. The Company strives to maintain sufficient liquidity to meet its short-term business requirements, taking into account its anticipated cash flows from royalty interests, its holdings of cash, and its committed liabilities. The maturities of the Company’s non-current liability are disclosed in Note 7 in the condensed interim consolidated financial statements. All current liabilities are settled within one year.
Currency risk
The Company is exposed to the financial risk related to the fluctuation of foreign exchange rates. The Company primarily operates in Canada and Australia and incurs expenditures in currencies other than the Canadian dollars. Thereby, the Company is exposed to foreign exchange risk arising from currency exposure. The Company has not hedged its exposure to currency fluctuations. Based on the above net exposure, as at August 31, 2019, and assuming that all other variables remain constant, a 1% depreciation or appreciation of the Canadian dollar against the US dollar would result in an increase/decrease of approximately $20,000 in the Company’s pre-tax income or loss.
NEW ACCOUNTING STANDARDS
Accounting standards adopted during the period
Adoption of IFRS 16
The Company adopted IFRS 16 Leases (“IFRS 16”) on June 1, 2019, in accordance with the transitional provisions of the standard, applying the modified retrospective approach.
At the inception of a contract, the new leasing standard requires the lessee to assess whether a contract is, or contains, a lease. A contract is, or contains, a lease if the lessee has the right to obtain substantially all of the economic benefits during the term of the arrangement and has the right to direct the use of the asset. If a lease is identified, the new standard eliminates the classification of leases as either operating or finance leases, and all leases that have a term of at least 12 months and are not of a low value will be recorded on the Company’s consolidated statement of financial position.
The Company has completed its assessment of the new standard. The process included a review of all lease and service contracts, to determine if we have the right to control the use of an identified asset for a period of time in exchange for consideration. Based on the Company’s analysis, the only contract to which the Company will apply the new standard relates to the lease for the use of the Company’s office premise. As a result of adopting the new standard, the Company recognized a right-of-use asset of $26,029. The right-of-use asset was measured at an amount equal to the lease liability on adoption.
New accounting policy for leases under IFRS 16
At inception of a contract, an assessment is made as to whether a contract is, or contains, a lease. A contract is, or contains, a lease if the contract conveys the right to control the use of an identified asset for a period of time in exchange for consideration. At the commencement date of a lease, a right-of-use asset and a lease liability are recognized. The right-of-use asset is initially measured at cost, which is comprised of the initial amount of the lease liability adjusted for any lease payments made at or before the commencement date, less any lease incentives received. A lease liability is initially measured at the present value of the lease payments that are not paid at the commencement date, discounted by the interest rate implicit in the lease, or if that rate cannot be readily determined, the incremental borrowing rate. The lease obligation is measured at amortized cost using the effective interest method and remeasured if there is a change in future lease payments.
| Management’s Discussion and Analysis - Page 12 |
| METALLA ROYALTY & STREAMING LTD. |
| MANAGEMENT’S DISCUSSION AND ANALYSIS |
| (Expressed in Canadian dollars, unless otherwise indicated) |
| FOR THE THREE MONTHS ENDED AUGUST 31, 2019 |
The right-of-use asset is subsequently depreciated from the commencement date to the earlier of the end of the lease term, or the end of the useful life of the asset. An assessment is made at the end of each reporting period if there is an indication the carrying value of the right-of-use asset is not recoverable.
Adoption of IFRIC 23
The Company adopted IFRIC 23 Uncertainty over Income Tax Treatments (“IFRIC 23”) on June 1, 2019, with retrospective application in accordance with the standard. IFRIC 23 clarifies the recognition and measurement requirements when there is uncertainty over income tax treatments. The adoption of IFRIC 23 did not result in any adjustments to the Company’s financial results or disclosures.
CRITICAL ACCOUNTING ESTIMATES AND JUDGMENTS
The preparation of consolidated financial statements in conformance with IFRS requires management to make estimates, judgments and assumptions that affect the application of accounting policies and the reported amounts of assets, liabilities, income and expenses. Actual results may differ from these estimates. Estimates and underlying assumptions are reviewed on an ongoing basis. Revisions to accounting estimates are recognized in the period in which the estimates are revised and in any future periods affected. The Company’s significant accounting policies and estimates are disclosed in the annual consolidated financial statements for the year ended May 31, 2019.
| Management’s Discussion and Analysis - Page 13 |
| METALLA ROYALTY & STREAMING LTD. |
| MANAGEMENT’S DISCUSSION AND ANALYSIS |
| (Expressed in Canadian dollars, unless otherwise indicated) |
| FOR THE THREE MONTHS ENDED AUGUST 31, 2019 |
NON-IFRS FINANCIAL MEASURES
The Company has included, throughout this document, certain performance measures, including (a) average cash cost of silver per attributable ounce, (b) average realized silver price per attributable ounce, and (c) adjusted EBITDA. The presentation of these non-IFRS measures is intended to provide additional information and should not be considered in isolation or as a substitute for measures of performance prepared in accordance with IFRS. These non-IFRS measures do not have any standardized meaning prescribed by IFRS, and other companies may calculate these measures differently.
Average cash cost per attributable ounce
Average cash cost per attributable ounce is calculated by dividing the Company’s total cash cost of sales, excluding depletion by the number of attributable silver ounces sold. The Company presents average cash cost per ounce as it believes that certain investors use this information to evaluate the Company’s performance in comparison to other streaming companies in the precious metals mining industry who present results on a similar basis.
| Q1 | Q1 | |||||
| Presented in US$ | 2020 | 2019 | ||||
| Cost of sales, excluding depletion | $ | 35,273 | $ | 1,215,560 | ||
| Cost of sales for NLGM(1) | 6,443 | 6,340 | ||||
| Adjust for: | ||||||
| Refining charge | (4,370 | ) | 222,881 | |||
| Total cash cost of sales | 37,346 | 1,444,781 | ||||
| Total attributable silver oz. sold(2) | 11,305 | 221,433 | ||||
| Average cash cost of silver per attributable oz. | $ | 3.30 | $ | 6.52 |
| (1) | Adjusted for the Company’s proportionate share of NLGM held by Silverback. |
| (2) | Payable silver ounces attributable to the Company that were shipped and provisionally invoiced during the period; as at the reporting date, 116,359 oz. of attributable silver produced were to be sold in the subsequent quarter. |
Average realized silver price per attributable ounce
Average realized silver price per attributable ounce is calculated by dividing the Company’s sales by the number of attributable silver ounces sold. The Company presents average realized silver price per attributable ounce as it believes that certain investors use this information to evaluate the Company’s performance in comparison to other streaming companies in the precious metals mining industry that present results on a similar basis.
| Q1 | Q1 | |||||
| Presented in US$ | 2020 | 2019 | ||||
| Sales from stream interest | $ | 104,110 | $ | 3,141,520 | ||
| Revenue from NLGM(1) | 64,430 | 63,397 | ||||
| Adjust for: | ||||||
| Refining charge | (4,370 | ) | 222,881 | |||
| Sales from stream and other interests | 164,171 | 3,427,798 | ||||
| Total attributable silver oz. sold | 11,305 | 221,433 | ||||
| Average realized silver price per attributable oz. | $ | 14.52 | $ | 15.48 | ||
| Operating cash margin per attributable oz.(2) | $ | 11.22 | $ | 8.96 |
| (1) | Adjusted for the Company’s proportionate share of NLGM held by Silverback. |
| (2) | Operating cash margin is calculated based on average realized price and average cash cost. |
Adjusted EBITDA
Management uses adjusted EBITDA to evaluate the Company’s operating performance, to plan and forecast its operations, and assess leverage levels and liquidity measures. The Company presents adjusted EBITDA as it believes that certain investors use this information to evaluate the Company’s performance in comparison to other streaming companies in the precious metals mining industry who present results on a similar basis. However, adjusted EBITDA does not represent, and should not be considered an alternative to, net income (loss) or cash flow provided by operating activities as determined under IFRS.
| Management’s Discussion and Analysis - Page 14 |
| METALLA ROYALTY & STREAMING LTD. |
| MANAGEMENT’S DISCUSSION AND ANALYSIS |
| (Expressed in Canadian dollars, unless otherwise indicated) |
| FOR THE THREE MONTHS ENDED AUGUST 31, 2019 |
| Q1 | Q1 | |||||
| Presented in C$ | 2020 | 2019 | ||||
| Net loss | $ | (1,215,152 | ) | $ | (312,031 | ) |
| Interest expense | 137,858 | 104,330 | ||||
| Finance charges | 336,098 | |||||
| Income tax provision (recovery) | (364,993 | ) | 391,260 | |||
| Depletion and amortization | 41,233 | 1,186,673 | ||||
| Foreign exchange (gain) loss | (62,614 | ) | 81,892 | |||
| Share-based payments(1) | 536,904 | 279,457 | ||||
| Adjusted EBITDA | $ | (590,666 | ) | $ | 1,731,581 |
| (1) | Includes stock options, restricted share units, and performance-based payments. |
RISK FACTORS
For further information regarding the Company’s operational risks, please refer to the detailed disclosure concerning the material risks and uncertainties associated with the Company’s business set out in its annual MD&A, dated September 26, 2019, which is available on SEDAR under the Company’s filer profile.
SHARE POSITION AND OUTSTANDING WARRANTS AND OPTIONS
As at the date of this MD&A, the Company had 134,997,667 common shares issued and outstanding. There were also 7,490,834 stock options and 5,565,009 share purchase warrants outstanding with expiry dates ranging from November 8, 2020 to January 4, 2024. In addition, there were 600,000 restricted share units with vesting dates ranging from January 5 to July 5, 2020.
CAUTIONARY STATEMENT REGARDING MINERAL RESERVE AND RESOURCE ESTIMATES
The disclosure in this MD&A was prepared in accordance with Canadian National Instrument 43-101 (“NI 43-101”), which differs significantly from the current requirements of the U.S. Securities and Exchange Commission (the “SEC”) set out in Industry Guide 7. Accordingly, such disclosure may not be comparable to similar information made public by companies that report in accordance with Industry Guide 7. In particular, this MD&A may refer to “mineral resources”, “measured mineral resources”, or “inferred mineral resources”. While these categories of mineralization are recognized and required by Canadian securities laws, they are not recognized by Industry Guide 7 and are not normally permitted to be disclosed in SEC filings by U.S. companies. U.S. investors are cautioned not to assume that any part of a “mineral resource”, “measured mineral resources”, “indicated mineral resources”, or “inferred mineral resource” will ever be converted into a “reserve.” In addition, “reserves” reported by the Company under Canadian standards may not qualify as reserves under Industry Guide 7. Under Industry Guide 7, mineralization may not be classified as a “reserve” unless the mineralization can be economically and legally extracted or produced at the time the “reserve” determination is made. Accordingly, information contained or referenced in this MD&A containing descriptions of mineral deposits may not be comparable to similar information made public by U.S. companies subject to the reporting and disclosure requirements of Industry Guide 7.
“Inferred mineral resources” have a great amount of uncertainty as to their existence and great uncertainty as to their economic and legal feasibility. It cannot be assumed that all or any part of an inferred mineral resource will ever be upgraded to a higher category. Further, while NI 43-101 permits companies to disclose economic projections contained in preliminary economic assessments and pre-feasibility studies, which are not based on "reserves", U.S. companies have not generally been permitted to disclose economic projections for a mineral property in their SEC filings prior to the establishment of "reserves. "Disclosure of “contained ounces” in a resource is permitted disclosure under Canadian reporting standards; however, Industry Guide 7 normally only permits issuers to report mineralization that does not constitute “reserves” by Industry Guide 7 standards as in-place tonnage and grade without reference to unit measures. Historical results or feasibility models presented herein are not guarantees or expectations of future performance.
QUALIFIED PERSONS
The technical information contained in this MD&A has been reviewed and approved by Charles Beaudry, geologist M.Sc., member of the Association of Professional Geoscientists of Ontario and of the Ordre des Géologues du Québec and a director of Metalla. Mr. Beaudry is a Qualified Person as defined in “National Instrument 43-101 Standards of disclosure for mineral projects”.
CAUTIONARY STATEMENT ON FORWARD-LOOKING STATEMENTS
This MD&A contains “forward-looking information” and “forward-looking statements” within the meaning of applicable Canadian and U.S. securities legislation. The forward-looking statements herein are made as of the date of this MD&A only and the Company does not assume any obligation to update or revise them to reflect new information, estimates or opinions, future events or results or otherwise, except as required by applicable law.
| Management’s Discussion and Analysis - Page 15 |
| METALLA ROYALTY & STREAMING LTD. |
| MANAGEMENT’S DISCUSSION AND ANALYSIS |
| (Expressed in Canadian dollars, unless otherwise indicated) |
| FOR THE THREE MONTHS ENDED AUGUST 31, 2019 |
Often, but not always, forward-looking statements can be identified by the use of words such as “plans”, “expects”, “is expected”, “budgets”, “scheduled”, “estimates”, “forecasts”, “predicts”, “projects”, “intends”, “targets”, “aims”, “anticipates” or “believes” or variations (including negative variations) of such words and phrases or may be identified by statements to the effect that certain actions “may”, “could”, “should”, “would”, “might” or “will” be taken, occur or be achieved. Forward-looking information in this MD&A includes, but is not limited to, statements with respect to future events or future performance of Metalla, disclosure regarding the precious metal purchase agreements and royalty payments to be paid to Metalla by property owners or operators of mining projects pursuant to net smelter returns and other royalty agreements of Metalla, management’s expectations regarding Metalla’s growth, results of operations, estimated future revenues, carrying value of assets, future dividends, and requirements for additional capital, production estimates, production costs and revenue, future demand for and prices of commodities, expected mining sequences, business prospects and opportunities. Such forward-looking statements reflect management’s current beliefs and are based on information currently available to management. \
Forward-looking statements involve known and unknown risks, uncertainties and other factors, which may cause the actual results, performance or achievements of the Company to be materially different from any future results, performance, or achievements expressed or implied by the forward-looking statements. A number of factors could cause actual events or results to differ materially from any forward-looking statements, including, without limitation: fluctuations in the prices of the primary commodities that drive royalty and stream revenue (gold and silver); fluctuations in the value of the U.S. dollar and any other currency in which revenue is generated, relative to the Canadian dollar; changes in national and local government legislation, including permitting and licensing regimes and taxation policies and the enforcement thereof; regulatory, political or economic developments in any of the countries where properties in which the Company holds a royalty, stream, or other production-base interest are located or through which they are held; risks related to the operators of the properties in which the Company holds a royalty, stream, or other production-base interest, including changes in the ownership and control of such operators; influence of macroeconomic developments; business opportunities that become available to, or are pursued by the Company; reduced access to debt and equity capital; litigation; title, permit or license disputes related to interests on any of the properties in which the Company holds a royalty, stream, or non-operating interest; whether or not the Company is determined to have “passive foreign investment company” (“PFIC”) status as defined in Section 1297 of the United States Internal Revenue Code of 1986, as amended; the ability to maintain adequate controls as required by law; potential changes in Canadian tax treatment of offshore streams; excessive cost escalation as well as development, permitting, infrastructure, operating or technical difficulties on any of the properties in which the Company holds a royalty, stream, or other production-based interest; the possibility that actual mineral content may differ from the reserves and resources contained in technical reports; rate and timing of production differences from resource estimates, other technical reports and mine plans; risks and hazards associated with the business of development and mining on any of the properties in which the Company holds a royalty, stream, or other production-based interest, including, but not limited to unusual or unexpected geological and metallurgical conditions, slope failures or cave-ins, flooding and other natural disasters, terrorism, civil unrest or an outbreak of contagious diseases; the integration of acquired assets; as well as other factors identified and as described in more detail under the heading “Risk Factors” in this MD&A and in the Company’s Annual Information Form and Form 40-F Annual Report filed with regulators in Canada at www.sedar.com and the SEC at www.sec.gov.
The forward-looking statements contained in this MD&A are based on reasonable assumptions that have been made by management as at the date of such information and is subject to unknown risks, uncertainties and other factors that may cause the actual actions, events or results to be materially different from those expressed or implied by such forward-looking information, including, without limitation: the impact of general business and economic conditions; the ongoing operation of the properties in which the Company holds a royalty, stream, or other production-base interest by the owners or operators of such properties in a manner consistent with past practice; the accuracy of public statements and disclosures made by the owners or operators of such underlying properties; no material adverse change in the market price of the commodities that underlie the asset portfolio; the Company’s ongoing income and assets relating to determination of its PFIC status; no material changes to existing tax treatment; no adverse development in respect of any significant property in which the Company holds a royalty, stream, or other production-base interest; the accuracy of publicly disclosed expectations for the development of underlying properties that are not yet in production; integration of acquired assets; actual results of mining and current exploration activities; conclusions of economic evaluations and changes in project parameters as plans continue to be refined; problems inherent to the marketability of precious metals; stock market volatility; competition; and the absence of any other factors that could cause actions, events or results to differ from those anticipated, estimated or intended.
Although Metalla has attempted to identify important factors that could cause actual actions, events or results to differ materially from those contained in forward-looking information, there may be other factors that cause actions, events or results not to be as anticipated, estimated or intended. There can be no assurance that such information will prove to be accurate, as actual results and future events could differ materially from those anticipated in such information. Investors are cautioned that forward-looking statements are not guarantees of future performance. The Company cannot assure investors that actual results will be consistent with these forward-looking statements. Accordingly, investors should not place undue reliance on forward-looking statements or information.
| Management’s Discussion and Analysis - Page 16 |
| METALLA ROYALTY & STREAMING LTD. |
| MANAGEMENT’S DISCUSSION AND ANALYSIS |
| (Expressed in Canadian dollars, unless otherwise indicated) |
| FOR THE THREE MONTHS ENDED AUGUST 31, 2019 |
This MD&A contains future-orientated information and financial outlook information (collectively, “FOFI”) about the Company’s revenues from royalties, streams and other projects which are subject to the same assumptions, risk factors, limitations and qualifications set forth in the above paragraphs. FOFI contained in this MD&A was made as of the date of this MD&A and was provided for the purpose of providing further information about the Company’s anticipated business operations. Metalla disclaims any intention or obligation to update or revise any FOFI contained in this MD&A, whether as a result of new information, future events or otherwise, unless required pursuant to applicable law. FOFI contained in this MD&A should not be used for the purposes other than for which it is disclosed herein.
| Management’s Discussion and Analysis - Page 17 |