- CHX Dashboard
- Financials
- Filings
-
Holdings
- Transcripts
- ETFs
- Insider
- Institutional
- Shorts
-
425 Filing
ChampionX (CHX) 425Business combination disclosure
Filed: 25 Feb 20, 6:07am

Earnings Conference Call Full Year & Fourth Quarter 2019 February 25, 2020 9:00am Central Time Filed by Apergy Corporation Pursuant to Rule 425 under the Securities Act of 1933, as amended, and deemed filed pursuant to Rule 14a-12 under the Securities Exchange Act of 1934, as amended Subject Company: Apergy Corporation Commission File No.: 001-38441 This filing relates to a proposed business combination involving Apergy Corporation, Ecolab Inc. and ChampionX Holding Inc.
Notices & Disclaimers Forward-Looking Statements This investor presentation, and the related discussion, contains forward-looking statements within the meaning of Section 27A of the Securities Exchange Act of 1934 and Section 21E of the Securities Exchange Act of 1934, that are based on the beliefs and assumptions of management of Apergy Corporation (“Apergy”) and on information currently available to Apergy’s management. Forward-looking statements include, but are not limited to, statements related to Apergy’s expectations regarding the performance of the business, financial results, liquidity and capital resources of Apergy, the benefits resulting from Apergy’s planned merger with ChampionX, the effects of competition and the effects of future legislation or regulations and other non-historical statements. Forward-looking statements include all statements that are not historical facts and can be identified by the use of forward-looking terminology such as the words “outlook,” “believes,” “expects,” “potential,” “continues,” “may,” “will,” “should,” “could,” “seeks,” “approximately,” “projects,” “predicts,” “intends,” “plans,” “estimates,” “anticipates” or the negative version of these words or other comparable words. Forward-looking statements involve risks, uncertainties and assumptions. Actual results may differ materially from those expressed in these forward-looking statements. You should not put undue reliance on any forward-looking statements in this presentation. Forward-looking statements speak only as of the day they are made and Apergy does not have any intention or obligation to update forward-looking statements after Apergy distributes this presentation, except as required by applicable law. Apergy’s outlook is provided for the purpose of providing information about our current expectations for 2019 and the general outlook for the business in the longer term. This information may not be appropriate for other purposes. Factors that could cause Apergy’s results to differ materially from those expressed in forward-looking statements are included in the section entitled “Risk Factors” Apergy’s Annual Report on Form 10-K for the year ended December 31, 2018, and in Apergy’s other filings with the Securities and Exchange Commission (“SEC”). There may be other risks and uncertainties that Apergy is unable to predict at this time or that Apergy currently does not expect to have a material adverse effect on Apergy’s business. Any such risks could cause Apergy’s results to differ materially from those expressed in forward-looking statements. Non-GAAP Measures This investor presentation, and the related discussions, contains certain non-GAAP financial measures, which should be considered only as supplemental to, and not as superior to financial measures prepared in accordance with generally accepted accounting principles (“GAAP”). Please refer to the Appendix of this investor presentation for a reconciliation of these non-GAAP financial measures to the most directly comparable financial measures prepared in accordance with GAAP and definitions and calculation methodologies of defined terms used in this investor presentation. For additional information about our non-GAAP financial measures, see our filings with the SEC.
Important Additional Information and No Offer of Solicitation Important Information About the Transaction between Apergy, ChampionX, and Ecolab Inc. and Where to Find It In connection with our proposed merger with ChampionX, the upstream energy business of Ecolab Inc. (“Ecolab”), Apergy has filed a preliminary proxy statement on Schedule 14A and a registration statement on Form S-4 containing a prospectus with the SEC and ChampionX Holding Inc. has filed a registration statement on Form S-4 and Form S-1 containing a prospectus. Both Apergy and ChampionX expect to file amendments to these filings before they become effective. Investors and securityholders are urged to read the registrations statements/prospectuses and preliminary proxy statement and any further amendments when they become available as well as any other relevant documents when they become available, because they will contain important information about Apergy, ChampionX, Ecolab and the proposed transactions. The registration statements/prospectuses and preliminary proxy statement and any further amendments (when available) and other documents can also be obtained free of charge from the SEC’s website at www.sec.gov. The registration statements/prospectuses and preliminary proxy statement and other documents (when they are available) can also be obtained free of charge from Ecolab upon written request to Ecolab, Inc., Attn: Investor Relations, 1 Ecolab Place, St. Paul, MN 55102, or by e-mailing investor.info@ecolab.com or upon written request to Apergy, Investor Relations, 2445 Technology Forest Boulevard, The Woodlands, Texas 77381 or by e-mailing david.skipper@apergy.com. Participants in the Solicitation This communication is not a solicitation of a proxy from any security holder of Apergy. However, Apergy, Ecolab and certain of their respective directors and executive officers may be deemed to be participants in the solicitation of proxies from shareholders of Apergy in connection with the proposed transaction under the rules of the SEC. Information regarding the persons who are, under the rules of the SEC, participants in the solicitation of the stockholders of Apergy in connection with the proposed transactions, including a description of their direct or indirect interests, by security holdings or otherwise, will be set forth in the proxy statement/prospectus when it is filed with the SEC. Information about the directors and executive officers of Ecolab may be found in its Annual Report on Form 10-K filed with the SEC on March 1, 2019, and its definitive proxy statement relating to its 2019 Annual Meeting of Shareholders filed with the SEC on March 15, 2019. Information about the directors and executive officers of Apergy may be found in its Annual Report on Form 10-K filed with the SEC on February 27, 2019, and its definitive proxy statement relating to its 2019 Annual Meeting of Stockholders filed with the SEC on March 25, 2019. No Offer or Solicitation This communication is not intended to and shall not constitute an offer to sell or the solicitation of an offer to sell or the solicitation of an offer to buy any securities or a solicitation of any vote of approval, nor shall there be any sale of securities in any jurisdiction in which such offer, solicitation or sale would be unlawful prior to registration or qualification under the securities laws of any such jurisdiction. No offer of securities shall be made except by means of a prospectus meeting the requirements of Section 10 of the Securities Act of 1933, as amended.
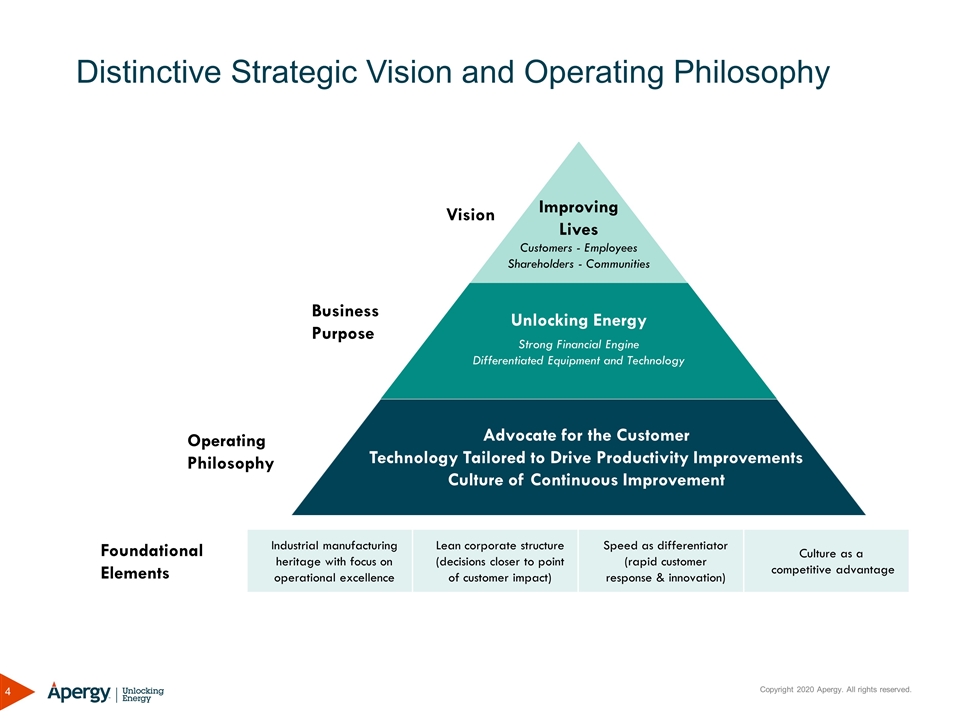
Distinctive Strategic Vision and Operating Philosophy Operating Philosophy Business Purpose Vision Improving Lives Customers - Employees Shareholders - Communities Unlocking Energy Advocate for the Customer Technology Tailored to Drive Productivity Improvements Culture of Continuous Improvement Strong Financial Engine Differentiated Equipment and Technology Foundational Elements Industrial manufacturing heritage with focus on operational excellence Lean corporate structure (decisions closer to point of customer impact) Speed as differentiator (rapid customer response & innovation) Culture as a competitive advantage
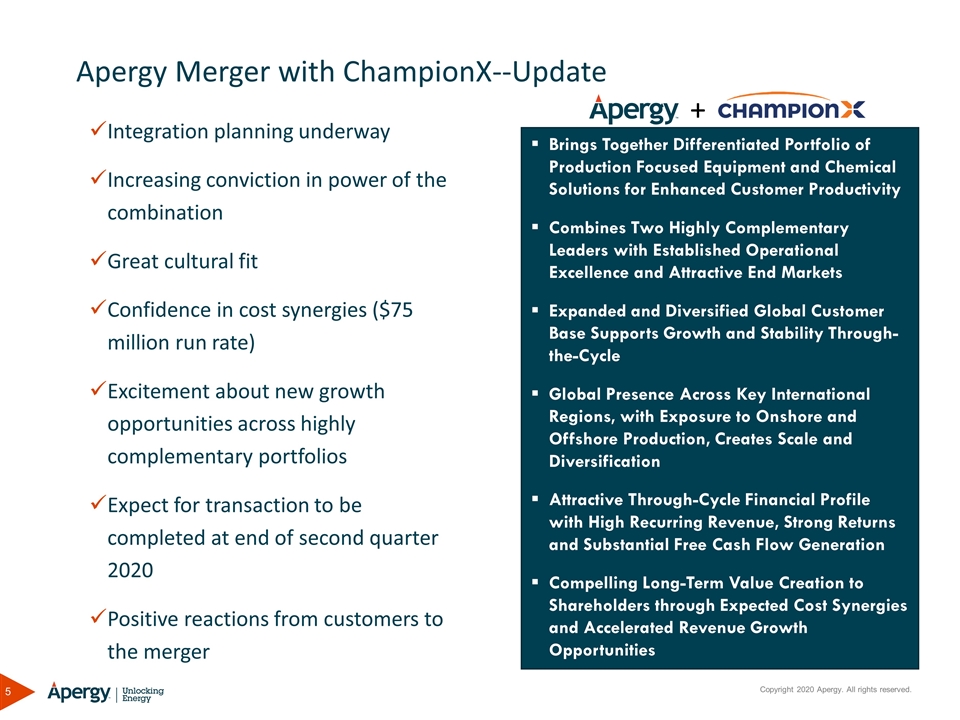
Integration planning underway Increasing conviction in power of the combination Great cultural fit Confidence in cost synergies ($75 million run rate) Excitement about new growth opportunities across highly complementary portfolios Expect for transaction to be completed at end of second quarter 2020 Positive reactions from customers to the merger Apergy Merger with ChampionX--Update Brings Together Differentiated Portfolio of Production Focused Equipment and Chemical Solutions for Enhanced Customer Productivity Combines Two Highly Complementary Leaders with Established Operational Excellence and Attractive End Markets Expanded and Diversified Global Customer Base Supports Growth and Stability Through-the-Cycle Global Presence Across Key International Regions, with Exposure to Onshore and Offshore Production, Creates Scale and Diversification Attractive Through-Cycle Financial Profile with High Recurring Revenue, Strong Returns and Substantial Free Cash Flow Generation Compelling Long-Term Value Creation to Shareholders through Expected Cost Synergies and Accelerated Revenue Growth Opportunities +
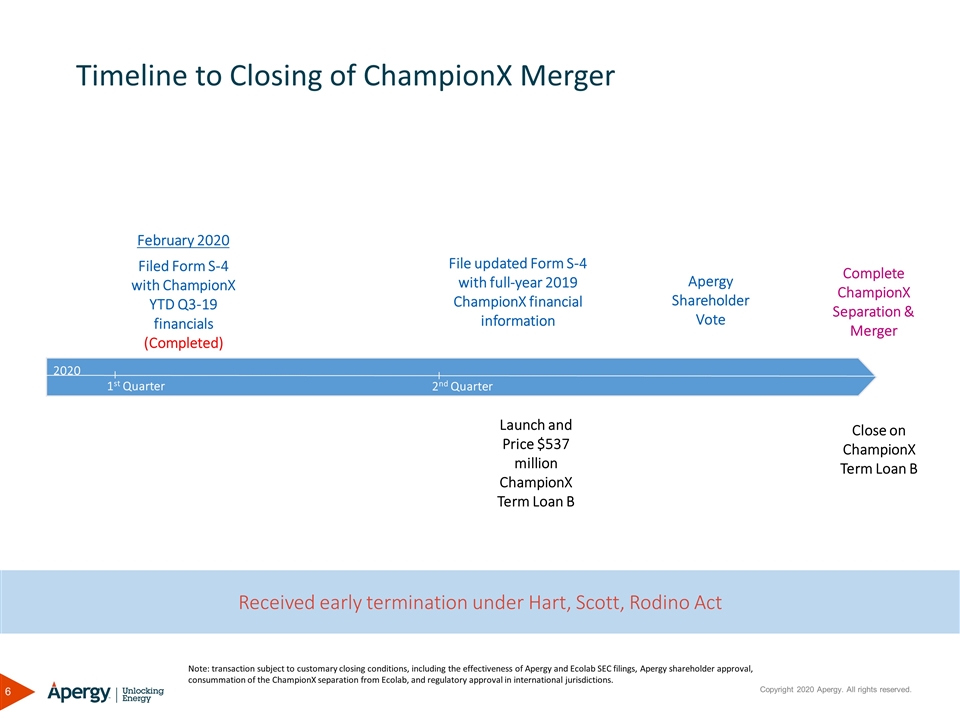
February 2020 Filed Form S-4 with ChampionX YTD Q3-19 financials (Completed) Timeline to Closing of ChampionX Merger 1st Quarter 2nd Quarter 2020 Complete ChampionX Separation & Merger File updated Form S-4 with full-year 2019 ChampionX financial information Apergy Shareholder Vote Launch and Price $537 million ChampionX Term Loan B Close on ChampionX Term Loan B Received early termination under Hart, Scott, Rodino Act Note: transaction subject to customary closing conditions, including the effectiveness of Apergy and Ecolab SEC filings, Apergy shareholder approval, consummation of the ChampionX separation from Ecolab, and regulatory approval in international jurisdictions.
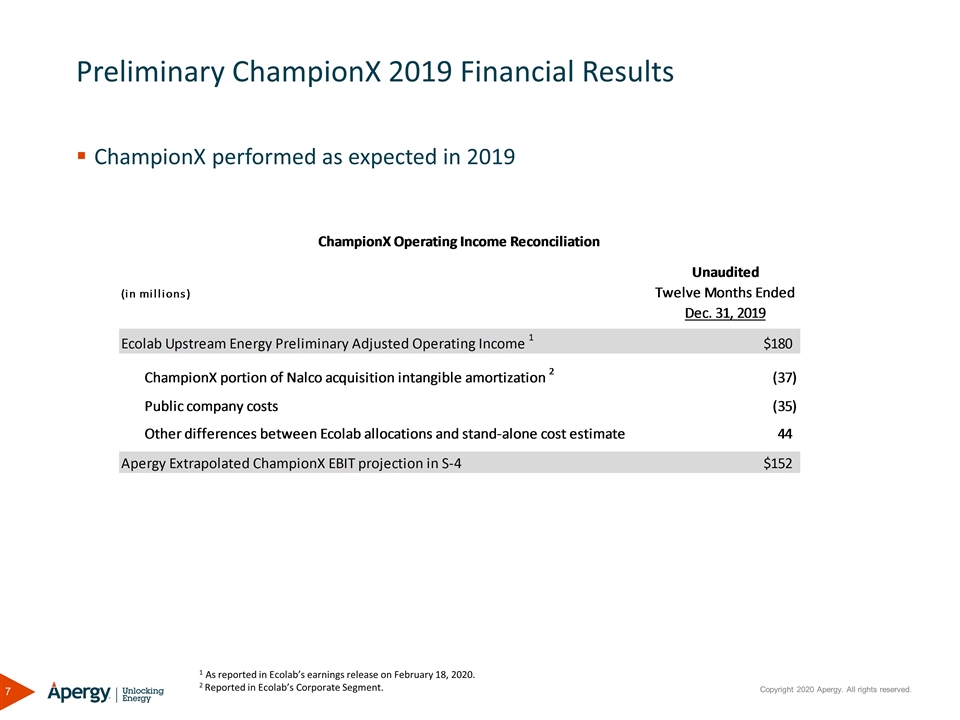
Preliminary ChampionX 2019 Financial Results ChampionX performed as expected in 2019 1 As reported in Ecolab’s earnings release on February 18, 2020. 2 Reported in Ecolab’s Corporate Segment.
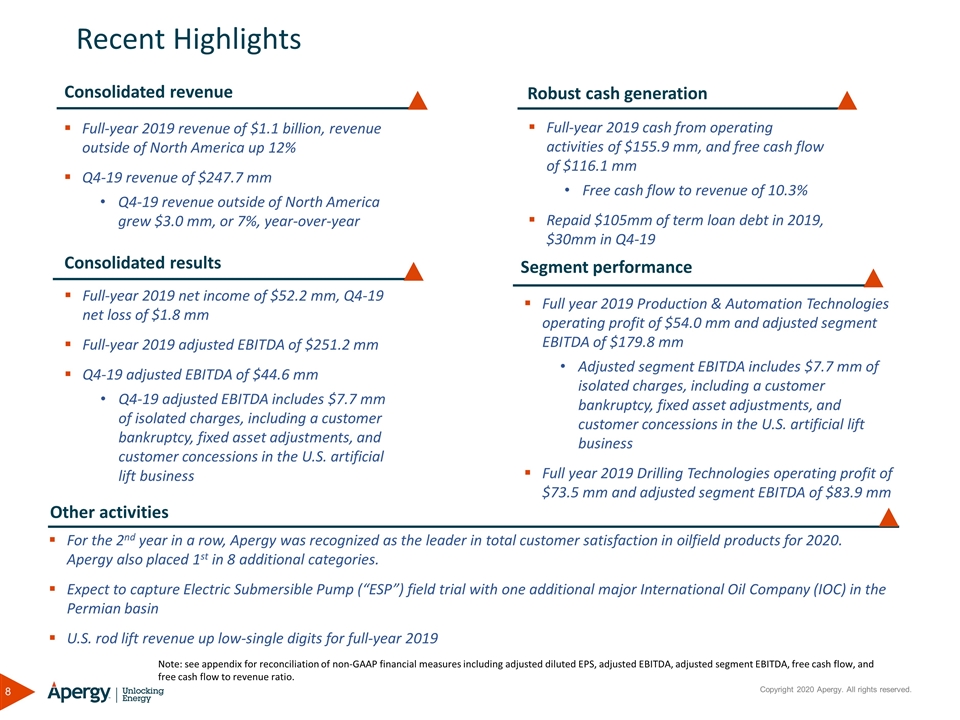
Consolidated revenue Recent Highlights Full-year 2019 revenue of $1.1 billion, revenue outside of North America up 12% Q4-19 revenue of $247.7 mm Q4-19 revenue outside of North America grew $3.0 mm, or 7%, year-over-year Consolidated results Full-year 2019 net income of $52.2 mm, Q4-19 net loss of $1.8 mm Full-year 2019 adjusted EBITDA of $251.2 mm Q4-19 adjusted EBITDA of $44.6 mm Q4-19 adjusted EBITDA includes $7.7 mm of isolated charges, including a customer bankruptcy, fixed asset adjustments, and customer concessions in the U.S. artificial lift business Segment performance Full year 2019 Production & Automation Technologies operating profit of $54.0 mm and adjusted segment EBITDA of $179.8 mm Adjusted segment EBITDA includes $7.7 mm of isolated charges, including a customer bankruptcy, fixed asset adjustments, and customer concessions in the U.S. artificial lift business Full year 2019 Drilling Technologies operating profit of $73.5 mm and adjusted segment EBITDA of $83.9 mm Note: see appendix for reconciliation of non-GAAP financial measures including adjusted diluted EPS, adjusted EBITDA, adjusted segment EBITDA, free cash flow, and free cash flow to revenue ratio. Other activities For the 2nd year in a row, Apergy was recognized as the leader in total customer satisfaction in oilfield products for 2020. Apergy also placed 1st in 8 additional categories. Expect to capture Electric Submersible Pump (“ESP”) field trial with one additional major International Oil Company (IOC) in the Permian basin U.S. rod lift revenue up low-single digits for full-year 2019 Robust cash generation Full-year 2019 cash from operating activities of $155.9 mm, and free cash flow of $116.1 mm Free cash flow to revenue of 10.3% Repaid $105mm of term loan debt in 2019, $30mm in Q4-19
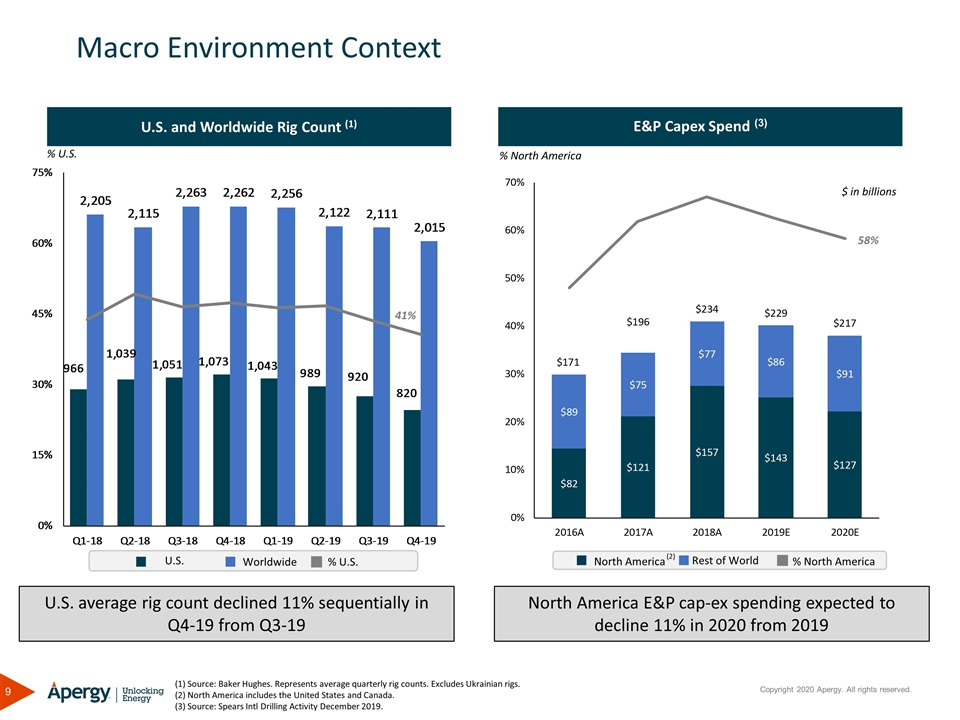
Macro Environment Context U.S. and Worldwide Rig Count (1) E&P Capex Spend (3) (1) Source: Baker Hughes. Represents average quarterly rig counts. Excludes Ukrainian rigs. (2) North America includes the United States and Canada. (3) Source: Spears Intl Drilling Activity December 2019. North America Rest of World % North America U.S. Worldwide % U.S. % U.S. % North America (2) 41% $ in billions 58% U.S. average rig count declined 11% sequentially in Q4-19 from Q3-19 North America E&P cap-ex spending expected to decline 11% in 2020 from 2019
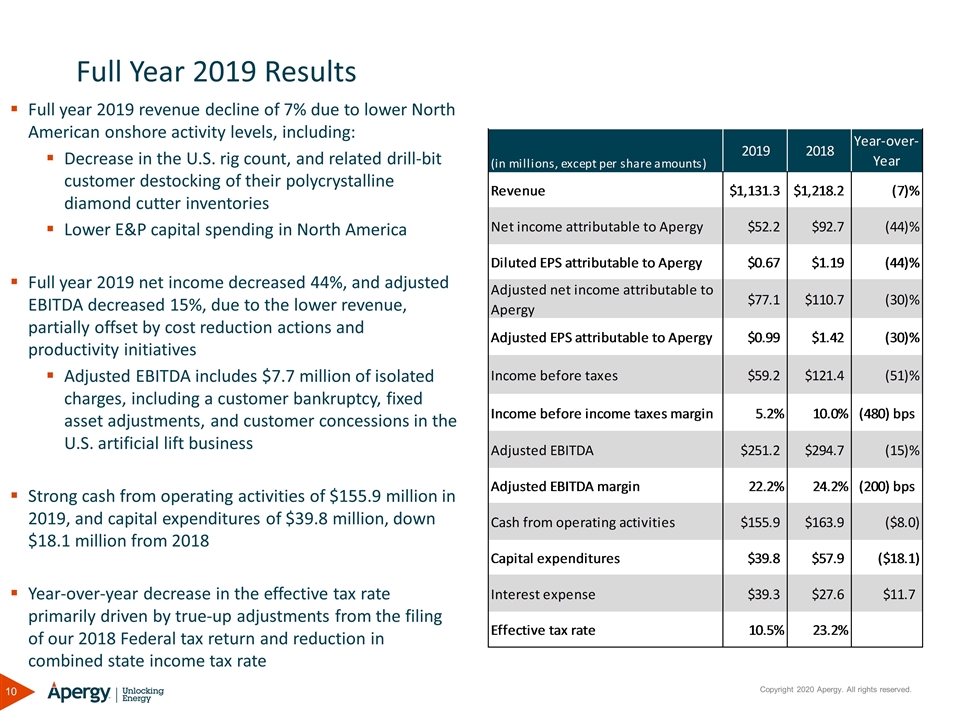
Full Year 2019 Results Full year 2019 revenue decline of 7% due to lower North American onshore activity levels, including: Decrease in the U.S. rig count, and related drill-bit customer destocking of their polycrystalline diamond cutter inventories Lower E&P capital spending in North America Full year 2019 net income decreased 44%, and adjusted EBITDA decreased 15%, due to the lower revenue, partially offset by cost reduction actions and productivity initiatives Adjusted EBITDA includes $7.7 million of isolated charges, including a customer bankruptcy, fixed asset adjustments, and customer concessions in the U.S. artificial lift business Strong cash from operating activities of $155.9 million in 2019, and capital expenditures of $39.8 million, down $18.1 million from 2018 Year-over-year decrease in the effective tax rate primarily driven by true-up adjustments from the filing of our 2018 Federal tax return and reduction in combined state income tax rate
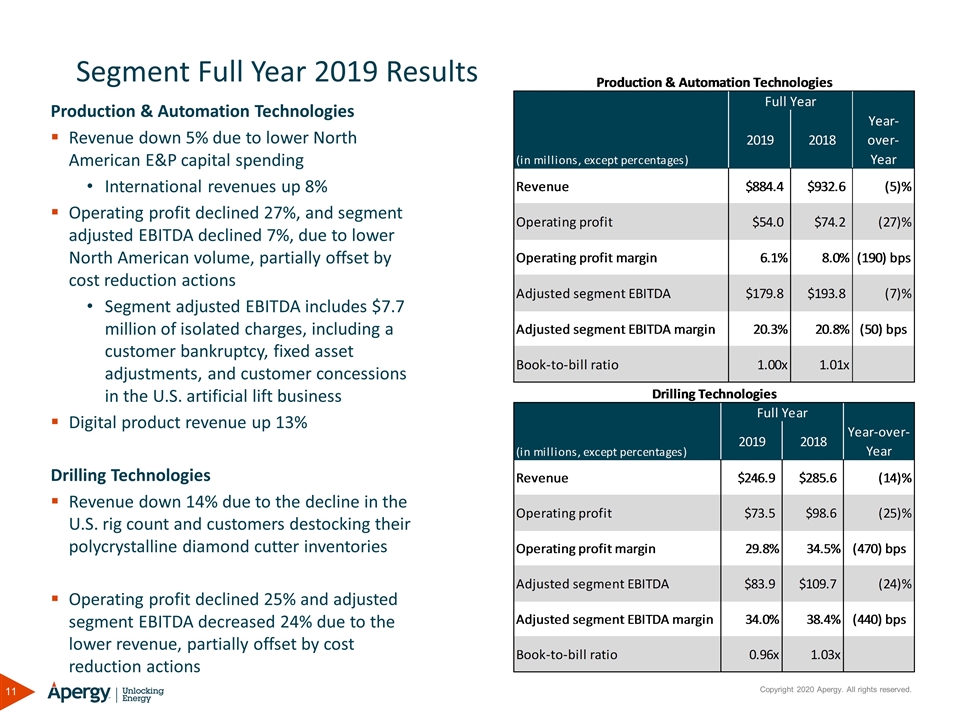
Segment Full Year 2019 Results Production & Automation Technologies Revenue down 5% due to lower North American E&P capital spending International revenues up 8% Operating profit declined 27%, and segment adjusted EBITDA declined 7%, due to lower North American volume, partially offset by cost reduction actions Segment adjusted EBITDA includes $7.7 million of isolated charges, including a customer bankruptcy, fixed asset adjustments, and customer concessions in the U.S. artificial lift business Digital product revenue up 13% Drilling Technologies Revenue down 14% due to the decline in the U.S. rig count and customers destocking their polycrystalline diamond cutter inventories Operating profit declined 25% and adjusted segment EBITDA decreased 24% due to the lower revenue, partially offset by cost reduction actions
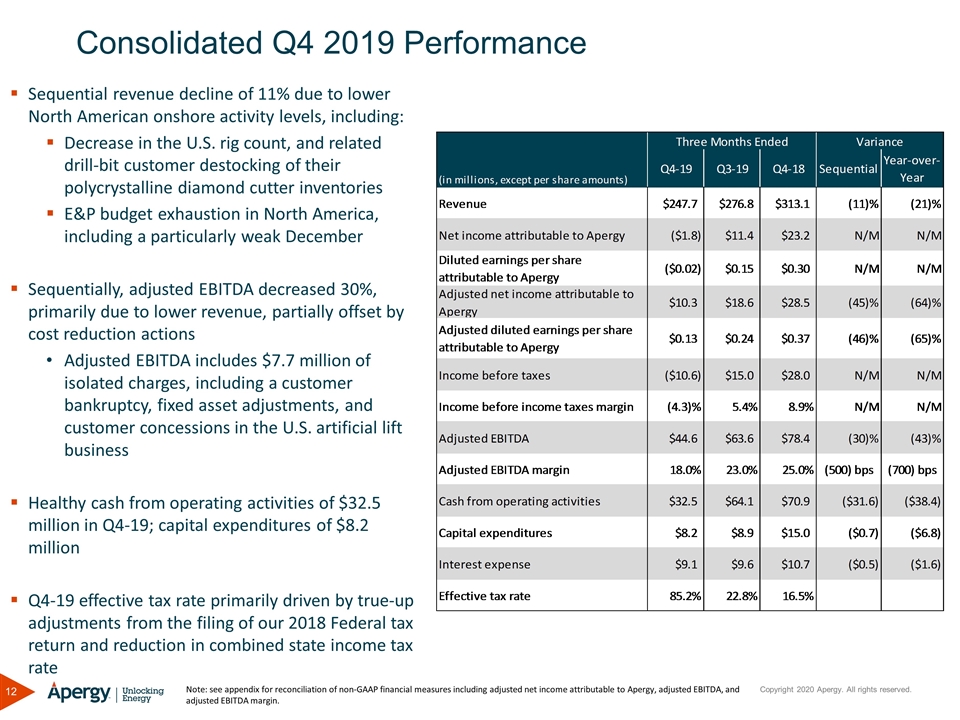
Consolidated Q4 2019 Performance Sequential revenue decline of 11% due to lower North American onshore activity levels, including: Decrease in the U.S. rig count, and related drill-bit customer destocking of their polycrystalline diamond cutter inventories E&P budget exhaustion in North America, including a particularly weak December Sequentially, adjusted EBITDA decreased 30%, primarily due to lower revenue, partially offset by cost reduction actions Adjusted EBITDA includes $7.7 million of isolated charges, including a customer bankruptcy, fixed asset adjustments, and customer concessions in the U.S. artificial lift business Healthy cash from operating activities of $32.5 million in Q4-19; capital expenditures of $8.2 million Q4-19 effective tax rate primarily driven by true-up adjustments from the filing of our 2018 Federal tax return and reduction in combined state income tax rate Note: see appendix for reconciliation of non-GAAP financial measures including adjusted net income attributable to Apergy, adjusted EBITDA, and adjusted EBITDA margin.
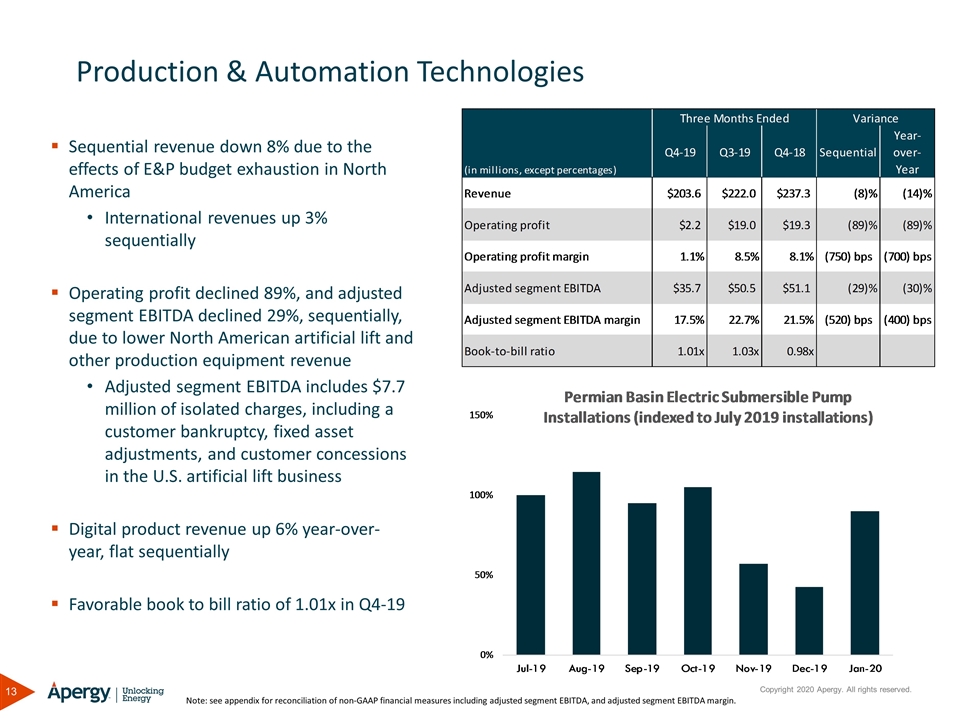
Production & Automation Technologies Sequential revenue down 8% due to the effects of E&P budget exhaustion in North America International revenues up 3% sequentially Operating profit declined 89%, and adjusted segment EBITDA declined 29%, sequentially, due to lower North American artificial lift and other production equipment revenue Adjusted segment EBITDA includes $7.7 million of isolated charges, including a customer bankruptcy, fixed asset adjustments, and customer concessions in the U.S. artificial lift business Digital product revenue up 6% year-over-year, flat sequentially Favorable book to bill ratio of 1.01x in Q4-19 Note: see appendix for reconciliation of non-GAAP financial measures including adjusted segment EBITDA, and adjusted segment EBITDA margin.
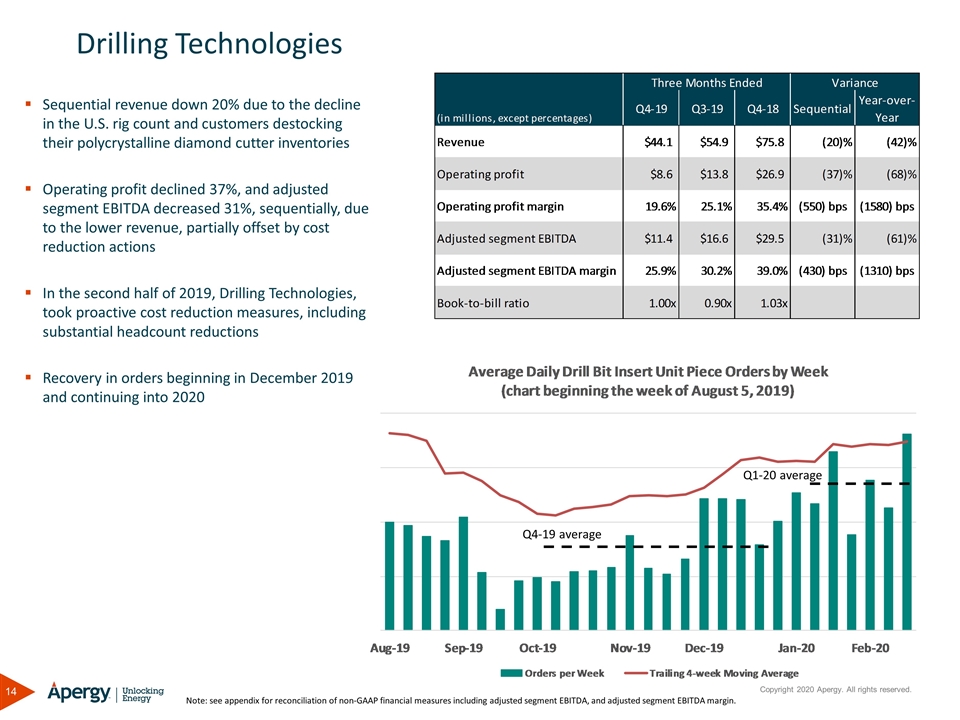
Sequential revenue down 20% due to the decline in the U.S. rig count and customers destocking their polycrystalline diamond cutter inventories Operating profit declined 37%, and adjusted segment EBITDA decreased 31%, sequentially, due to the lower revenue, partially offset by cost reduction actions In the second half of 2019, Drilling Technologies, took proactive cost reduction measures, including substantial headcount reductions Recovery in orders beginning in December 2019 and continuing into 2020 Drilling Technologies Note: see appendix for reconciliation of non-GAAP financial measures including adjusted segment EBITDA, and adjusted segment EBITDA margin. Q4-19 average Q1-20 average
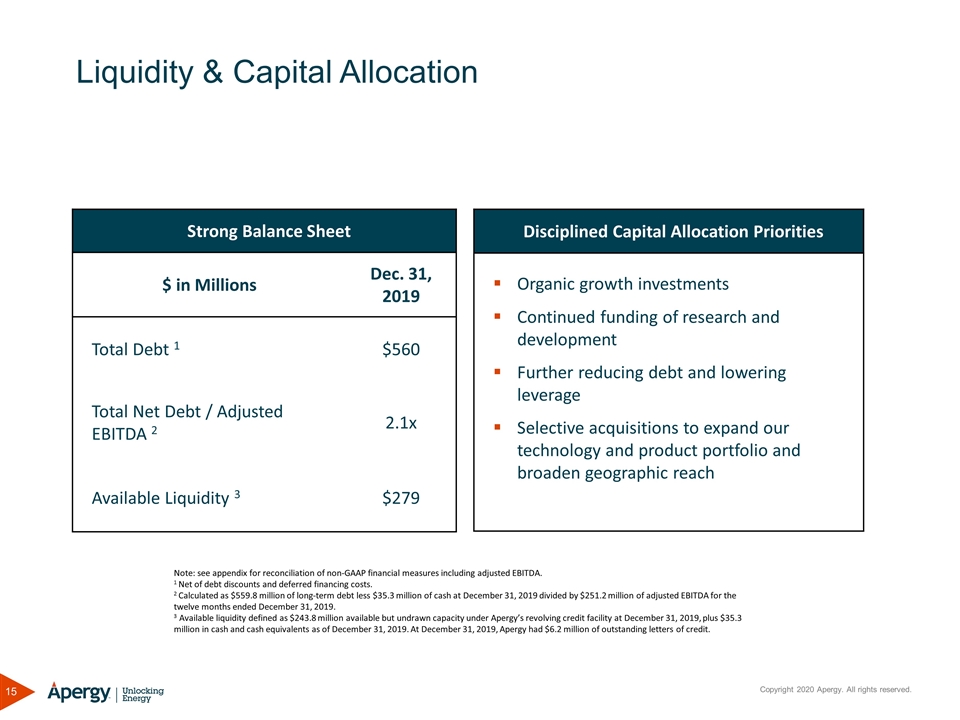
Liquidity & Capital Allocation Strong Balance Sheet $ in Millions Dec. 31, 2019 Total Debt 1 $560 Total Net Debt / Adjusted EBITDA 2 2.1x Available Liquidity 3 $279 Disciplined Capital Allocation Priorities Organic growth investments Continued funding of research and development Further reducing debt and lowering leverage Selective acquisitions to expand our technology and product portfolio and broaden geographic reach Note: see appendix for reconciliation of non-GAAP financial measures including adjusted EBITDA. 1 Net of debt discounts and deferred financing costs. 2 Calculated as $559.8 million of long-term debt less $35.3 million of cash at December 31, 2019 divided by $251.2 million of adjusted EBITDA for the twelve months ended December 31, 2019. 3 Available liquidity defined as $243.8 million available but undrawn capacity under Apergy’s revolving credit facility at December 31, 2019, plus $35.3 million in cash and cash equivalents as of December 31, 2019. At December 31, 2019, Apergy had $6.2 million of outstanding letters of credit.
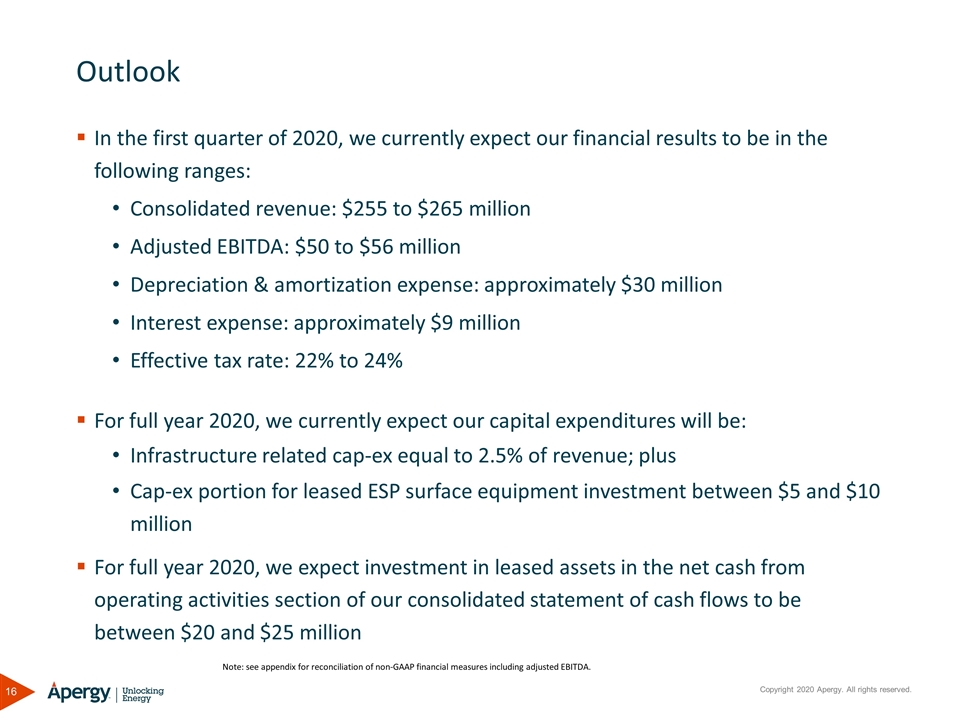
In the first quarter of 2020, we currently expect our financial results to be in the following ranges: Consolidated revenue: $255 to $265 million Adjusted EBITDA: $50 to $56 million Depreciation & amortization expense: approximately $30 million Interest expense: approximately $9 million Effective tax rate: 22% to 24% For full year 2020, we currently expect our capital expenditures will be: Infrastructure related cap-ex equal to 2.5% of revenue; plus Cap-ex portion for leased ESP surface equipment investment between $5 and $10 million For full year 2020, we expect investment in leased assets in the net cash from operating activities section of our consolidated statement of cash flows to be between $20 and $25 million Outlook Note: see appendix for reconciliation of non-GAAP financial measures including adjusted EBITDA.

Appendix
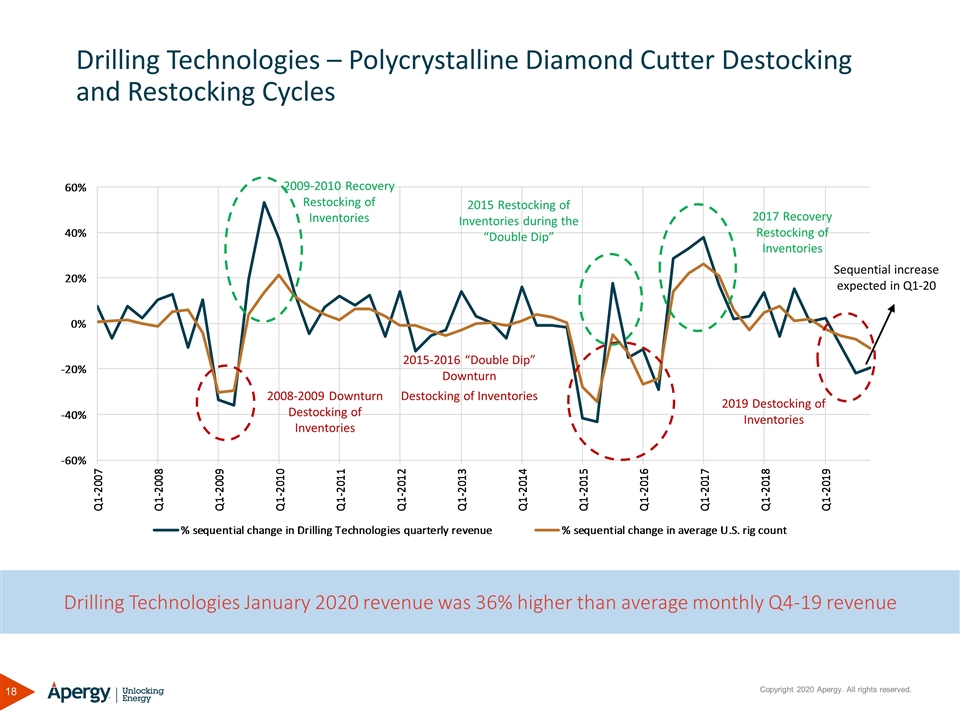
Drilling Technologies – Polycrystalline Diamond Cutter Destocking and Restocking Cycles 2008-2009 Downturn Destocking of Inventories 2009-2010 Recovery Restocking of Inventories 2015-2016 “Double Dip” Downturn Destocking of Inventories 2017 Recovery Restocking of Inventories 2019 Destocking of Inventories 2015 Restocking of Inventories during the “Double Dip” Drilling Technologies January 2020 revenue was 36% higher than average monthly Q4-19 revenue Sequential increase expected in Q1-20
Reconciliations of Non-GAAP Measures
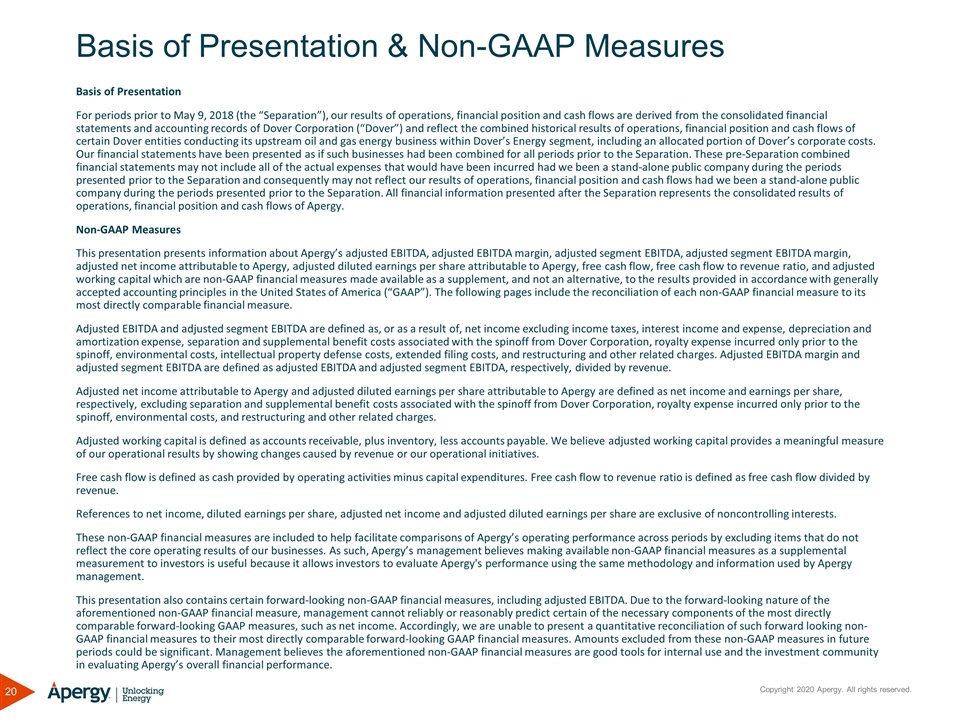
Basis of Presentation & Non-GAAP Measures Basis of Presentation For periods prior to May 9, 2018 (the “Separation”), our results of operations, financial position and cash flows are derived from the consolidated financial statements and accounting records of Dover Corporation (“Dover”) and reflect the combined historical results of operations, financial position and cash flows of certain Dover entities conducting its upstream oil and gas energy business within Dover’s Energy segment, including an allocated portion of Dover’s corporate costs. Our financial statements have been presented as if such businesses had been combined for all periods prior to the Separation. These pre-Separation combined financial statements may not include all of the actual expenses that would have been incurred had we been a stand-alone public company during the periods presented prior to the Separation and consequently may not reflect our results of operations, financial position and cash flows had we been a stand-alone public company during the periods presented prior to the Separation. All financial information presented after the Separation represents the consolidated results of operations, financial position and cash flows of Apergy. Non-GAAP Measures This presentation presents information about Apergy’s adjusted EBITDA, adjusted EBITDA margin, adjusted segment EBITDA, adjusted segment EBITDA margin, adjusted net income attributable to Apergy, adjusted diluted earnings per share attributable to Apergy, free cash flow, free cash flow to revenue ratio, and adjusted working capital which are non-GAAP financial measures made available as a supplement, and not an alternative, to the results provided in accordance with generally accepted accounting principles in the United States of America (“GAAP”). The following pages include the reconciliation of each non-GAAP financial measure to its most directly comparable financial measure. Adjusted EBITDA and adjusted segment EBITDA are defined as, or as a result of, net income excluding income taxes, interest income and expense, depreciation and amortization expense, separation and supplemental benefit costs associated with the spinoff from Dover Corporation, royalty expense incurred only prior to the spinoff, environmental costs, intellectual property defense costs, extended filing costs, and restructuring and other related charges. Adjusted EBITDA margin and adjusted segment EBITDA are defined as adjusted EBITDA and adjusted segment EBITDA, respectively, divided by revenue. Adjusted net income attributable to Apergy and adjusted diluted earnings per share attributable to Apergy are defined as net income and earnings per share, respectively, excluding separation and supplemental benefit costs associated with the spinoff from Dover Corporation, royalty expense incurred only prior to the spinoff, environmental costs, and restructuring and other related charges. Adjusted working capital is defined as accounts receivable, plus inventory, less accounts payable. We believe adjusted working capital provides a meaningful measure of our operational results by showing changes caused by revenue or our operational initiatives. Free cash flow is defined as cash provided by operating activities minus capital expenditures. Free cash flow to revenue ratio is defined as free cash flow divided by revenue. References to net income, diluted earnings per share, adjusted net income and adjusted diluted earnings per share are exclusive of noncontrolling interests. These non-GAAP financial measures are included to help facilitate comparisons of Apergy’s operating performance across periods by excluding items that do not reflect the core operating results of our businesses. As such, Apergy’s management believes making available non-GAAP financial measures as a supplemental measurement to investors is useful because it allows investors to evaluate Apergy's performance using the same methodology and information used by Apergy management. This presentation also contains certain forward-looking non-GAAP financial measures, including adjusted EBITDA. Due to the forward-looking nature of the aforementioned non-GAAP financial measure, management cannot reliably or reasonably predict certain of the necessary components of the most directly comparable forward-looking GAAP measures, such as net income. Accordingly, we are unable to present a quantitative reconciliation of such forward looking non-GAAP financial measures to their most directly comparable forward-looking GAAP financial measures. Amounts excluded from these non-GAAP measures in future periods could be significant. Management believes the aforementioned non-GAAP financial measures are good tools for internal use and the investment community in evaluating Apergy’s overall financial performance.
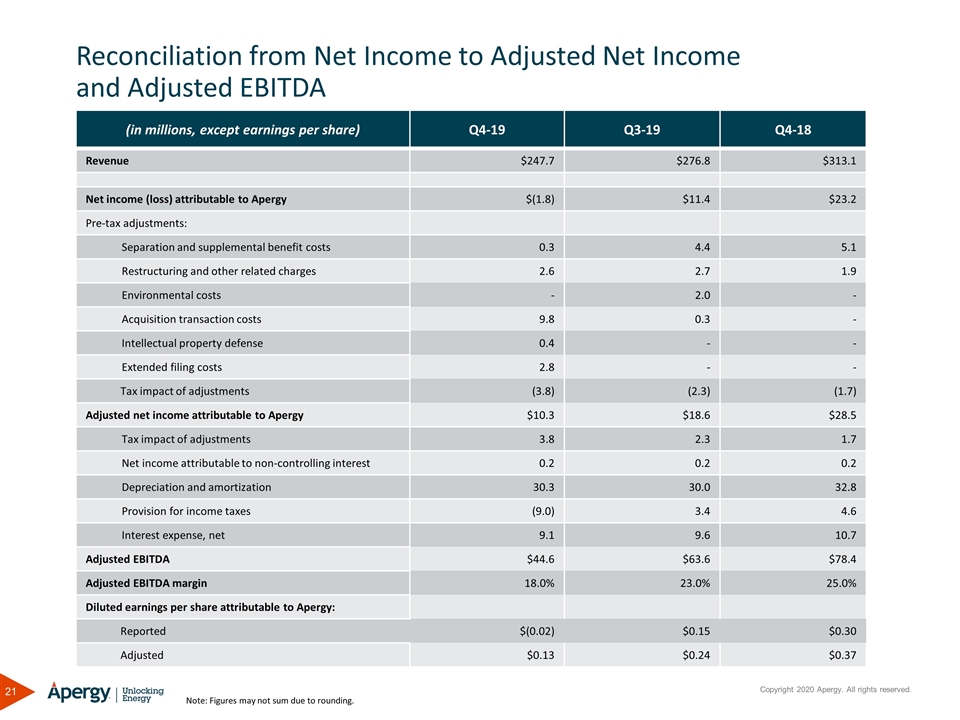
Reconciliation from Net Income to Adjusted Net Income and Adjusted EBITDA (in millions, except earnings per share) Q4-19 Q3-19 Q4-18 Revenue $247.7 $276.8 $313.1 Net income (loss) attributable to Apergy $(1.8) $11.4 $23.2 Pre-tax adjustments: Separation and supplemental benefit costs 0.3 4.4 5.1 Restructuring and other related charges 2.6 2.7 1.9 Environmental costs - 2.0 - Acquisition transaction costs 9.8 0.3 - Intellectual property defense 0.4 - - Extended filing costs 2.8 - - Tax impact of adjustments (3.8) (2.3) (1.7) Adjusted net income attributable to Apergy $10.3 $18.6 $28.5 Tax impact of adjustments 3.8 2.3 1.7 Net income attributable to non-controlling interest 0.2 0.2 0.2 Depreciation and amortization 30.3 30.0 32.8 Provision for income taxes (9.0) 3.4 4.6 Interest expense, net 9.1 9.6 10.7 Adjusted EBITDA $44.6 $63.6 $78.4 Adjusted EBITDA margin 18.0% 23.0% 25.0% Diluted earnings per share attributable to Apergy: Reported $(0.02) $0.15 $0.30 Adjusted $0.13 $0.24 $0.37 Note: Figures may not sum due to rounding.
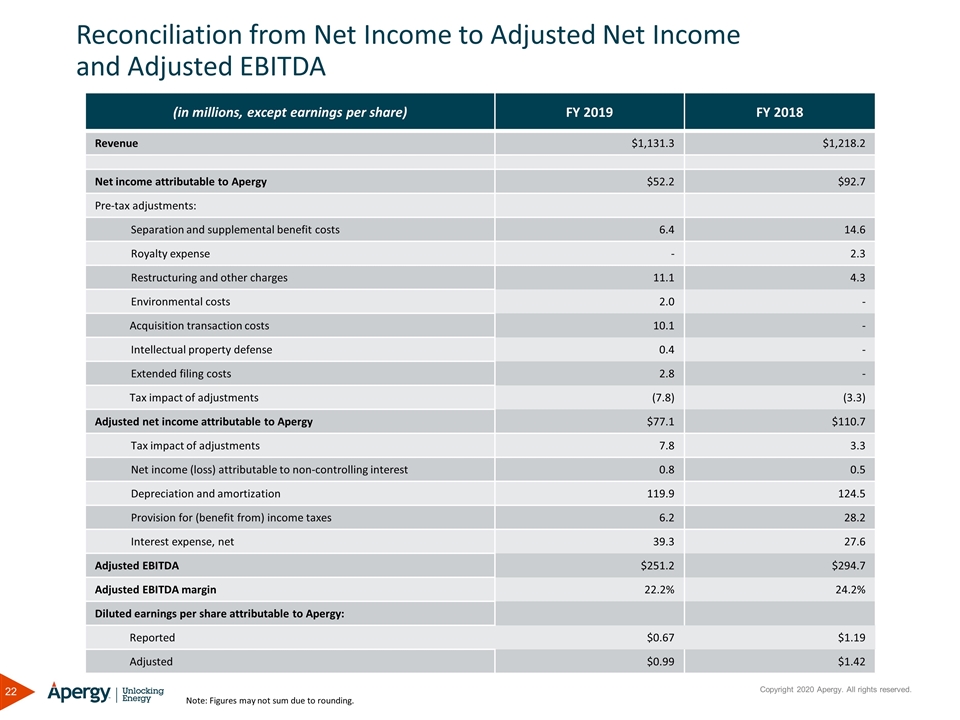
Reconciliation from Net Income to Adjusted Net Income and Adjusted EBITDA (in millions, except earnings per share) FY 2019 FY 2018 Revenue $1,131.3 $1,218.2 Net income attributable to Apergy $52.2 $92.7 Pre-tax adjustments: Separation and supplemental benefit costs 6.4 14.6 Royalty expense - 2.3 Restructuring and other charges 11.1 4.3 Environmental costs 2.0 - Acquisition transaction costs 10.1 - Intellectual property defense 0.4 - Extended filing costs 2.8 - Tax impact of adjustments (7.8) (3.3) Adjusted net income attributable to Apergy $77.1 $110.7 Tax impact of adjustments 7.8 3.3 Net income (loss) attributable to non-controlling interest 0.8 0.5 Depreciation and amortization 119.9 124.5 Provision for (benefit from) income taxes 6.2 28.2 Interest expense, net 39.3 27.6 Adjusted EBITDA $251.2 $294.7 Adjusted EBITDA margin 22.2% 24.2% Diluted earnings per share attributable to Apergy: Reported $0.67 $1.19 Adjusted $0.99 $1.42 Note: Figures may not sum due to rounding.
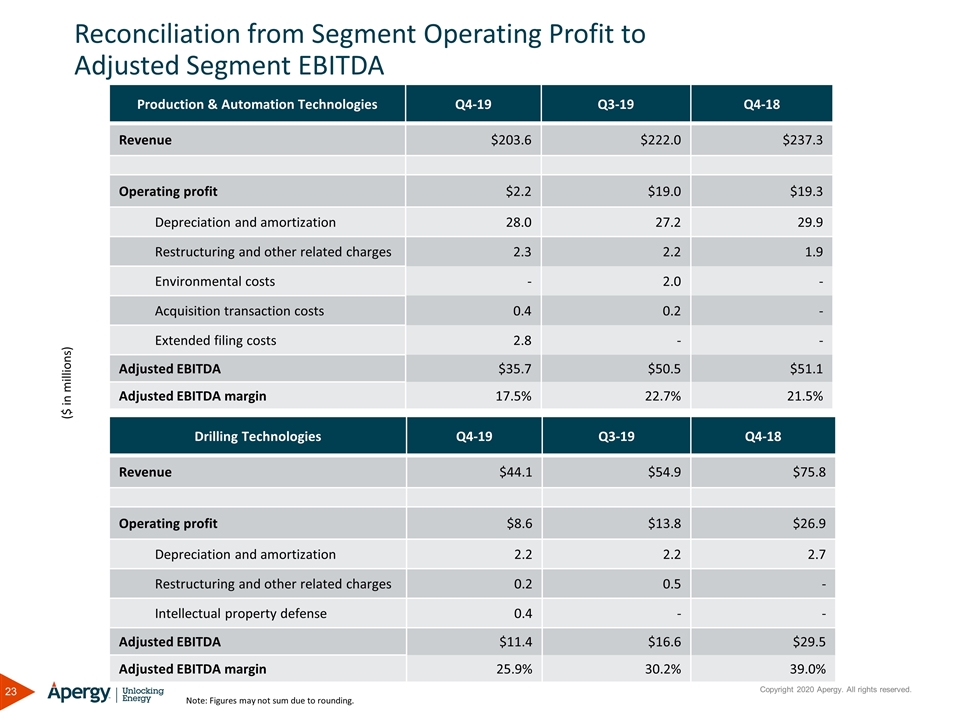
Reconciliation from Segment Operating Profit to Adjusted Segment EBITDA Production & Automation Technologies Q4-19 Q3-19 Q4-18 Revenue $203.6 $222.0 $237.3 Operating profit $2.2 $19.0 $19.3 Depreciation and amortization 28.0 27.2 29.9 Restructuring and other related charges 2.3 2.2 1.9 Environmental costs - 2.0 - Acquisition transaction costs 0.4 0.2 - Extended filing costs 2.8 - - Adjusted EBITDA $35.7 $50.5 $51.1 Adjusted EBITDA margin 17.5% 22.7% 21.5% Drilling Technologies Q4-19 Q3-19 Q4-18 Revenue $44.1 $54.9 $75.8 Operating profit $8.6 $13.8 $26.9 Depreciation and amortization 2.2 2.2 2.7 Restructuring and other related charges 0.2 0.5 - Intellectual property defense 0.4 - - Adjusted EBITDA $11.4 $16.6 $29.5 Adjusted EBITDA margin 25.9% 30.2% 39.0% ($ in millions) Note: Figures may not sum due to rounding.
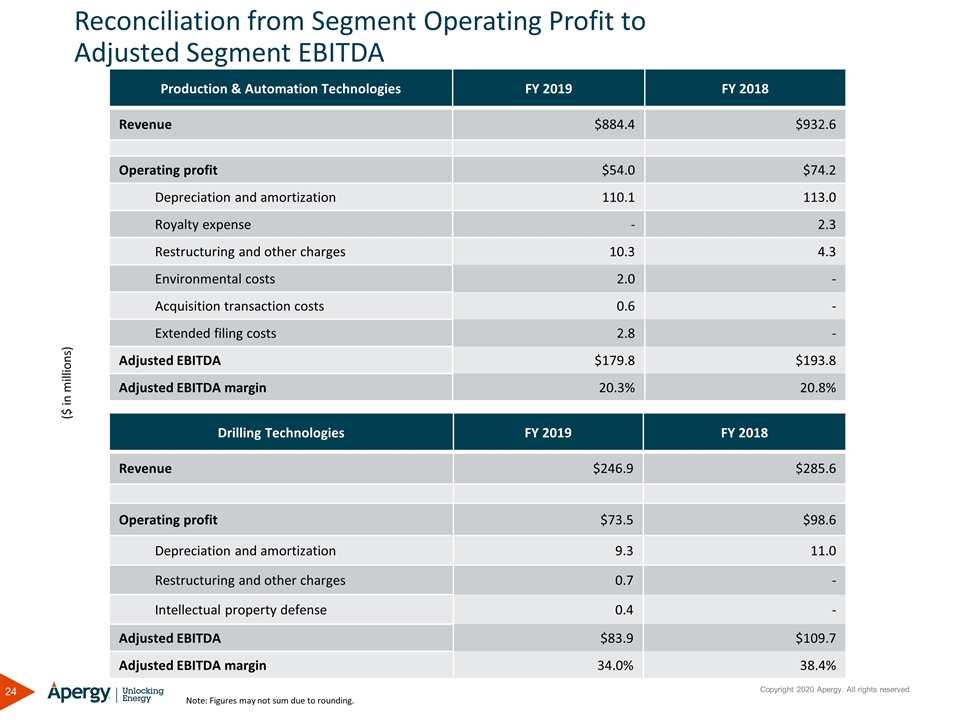
Reconciliation from Segment Operating Profit to Adjusted Segment EBITDA Production & Automation Technologies FY 2019 FY 2018 Revenue $884.4 $932.6 Operating profit $54.0 $74.2 Depreciation and amortization 110.1 113.0 Royalty expense - 2.3 Restructuring and other charges 10.3 4.3 Environmental costs 2.0 - Acquisition transaction costs 0.6 - Extended filing costs 2.8 - Adjusted EBITDA $179.8 $193.8 Adjusted EBITDA margin 20.3% 20.8% Drilling Technologies FY 2019 FY 2018 Revenue $246.9 $285.6 Operating profit $73.5 $98.6 Depreciation and amortization 9.3 11.0 Restructuring and other charges 0.7 - Intellectual property defense 0.4 - Adjusted EBITDA $83.9 $109.7 Adjusted EBITDA margin 34.0% 38.4% ($ in millions) Note: Figures may not sum due to rounding.
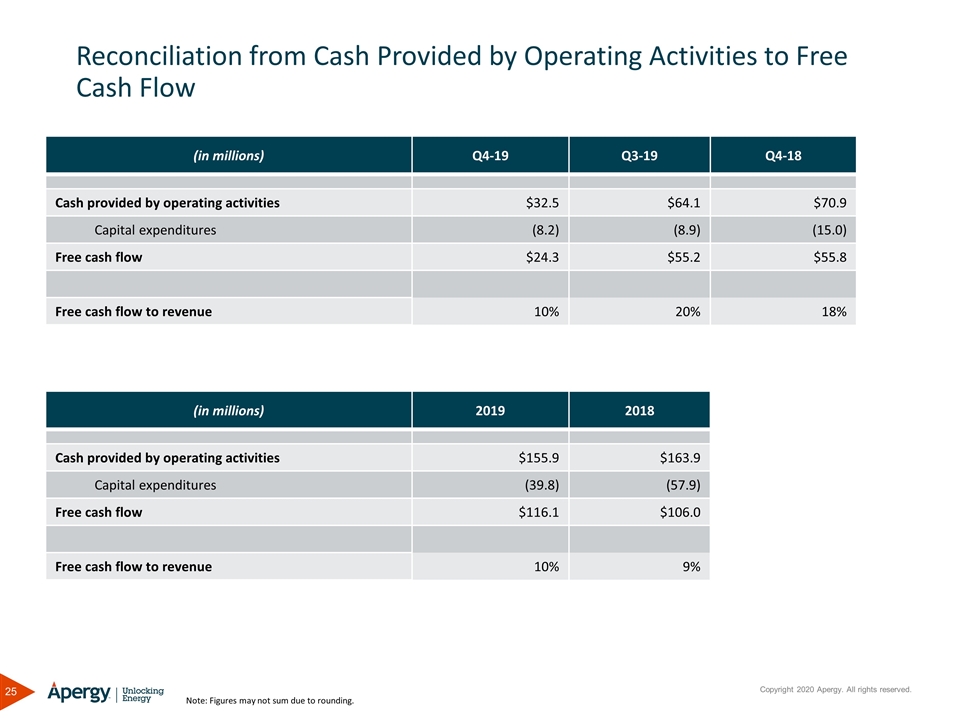
Reconciliation from Cash Provided by Operating Activities to Free Cash Flow (in millions) Q4-19 Q3-19 Q4-18 Cash provided by operating activities $32.5 $64.1 $70.9 Capital expenditures (8.2) (8.9) (15.0) Free cash flow $24.3 $55.2 $55.8 Free cash flow to revenue 10% 20% 18% Note: Figures may not sum due to rounding. (in millions) 2019 2018 Cash provided by operating activities $155.9 $163.9 Capital expenditures (39.8) (57.9) Free cash flow $116.1 $106.0 Free cash flow to revenue 10% 9%
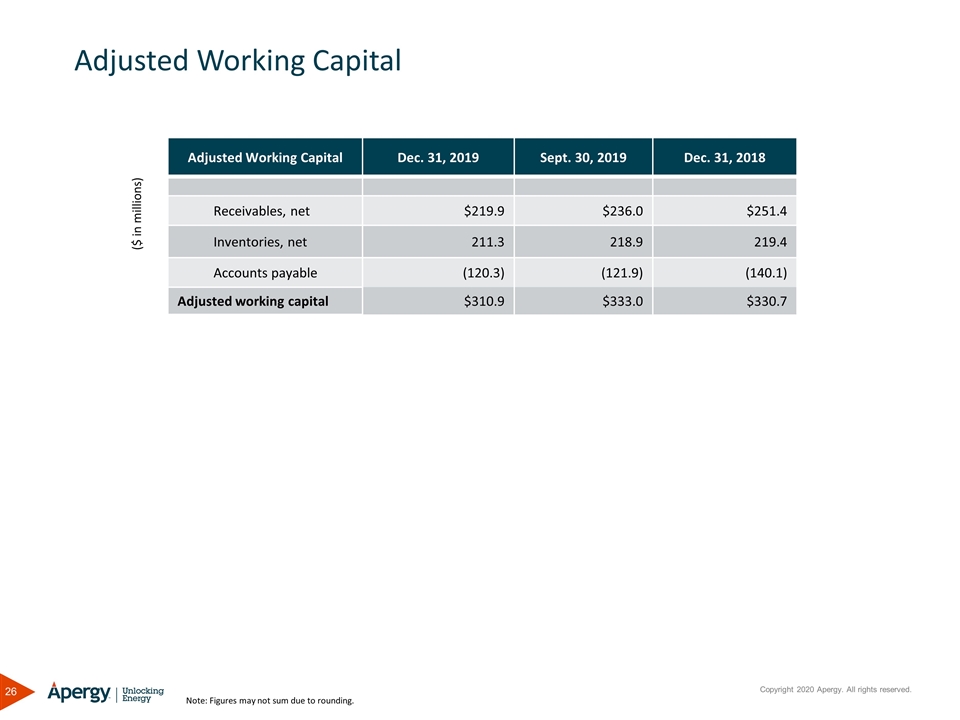
Adjusted Working Capital Adjusted Working Capital Dec. 31, 2019 Sept. 30, 2019 Dec. 31, 2018 Receivables, net $219.9 $236.0 $251.4 Inventories, net 211.3 218.9 219.4 Accounts payable (120.3) (121.9) (140.1) Adjusted working capital $310.9 $333.0 $330.7 ($ in millions) Note: Figures may not sum due to rounding.