
Exhibit 99.1 1Exhibit 99.1 1
NEITHER THE SECURITIES AND EXCHANGE COMMISSION (THE “SEC”) NOR ANY STATE SECURITIES COMMISSION HAS APPROVED OR DISAPPROVED OF THE SECURITIES OR DETERMINED IF THIS PRESENTATION IS TRUTHFUL OR COMPLETE. This Presentation contains financial forecasts with respect to F45’s projected Revenues, EBITDA, Adjusted EBITDA and Net Income. Neither CAC’s nor F45’s independent auditors audited, reviewed, compiled, or performed any procedures with respect to the projections for the purpose of their inclusion in this Presentation and accordingly, neither of them expressed an opinion or provided any other form of assurance with respect thereto for the purpose of this Presentation. These projections should not be relied upon as being necessarily indicative of future results. The assumptions and estimates underlying the prospective financial information are inherently uncertain and are subject to a wide variety of significant business, economic and competitive risks and uncertainties that could cause actual results to differ materially from those contained in the prospective financial information. Accordingly, there can be no assurance that the prospective results are indicative of the future performance of CAC, F45 or the combined company after completion of the contemplated business combination, or that actual results will not differ materially from those presented in the prospective financial information. Inclusion of the prospective financial information in this Presentation should not be regarded as a representation by any person that the results contained in the prospective financial information will be achieved. Neither F45, CAC, nor any of their respective affiliates have any obligation to update this Presentation. Although all information and opinions expressed in this Presentation were obtained from sources believed to be reliable and in good faith, no representation or warranty, express or implied, is made as to its accuracy or completeness. This Presentation contains preliminary information only, is subject to change at any time and is not, and should not be assumed to be, complete or to constitute all the information necessary to adequately make an informed decision regarding your engagement with F45 and CAC. Forward-looking Statements and Industry, Market and Other Data This Presentation contains “forward-looking statements” within the meaning of Section 21E of the Securities Exchange Act of 1934, as amended, and the Private Securities Litigation Reform Act of 1995. Forward-looking statements may relate to the business combination and any other statements relating to future results, strategy and plans of CAC and F45 (including certain projections and business trends, and statements which may be identified by the use of the words “plans”, “expects” or “does not expect”, “estimated”, “is expected”, “budget”, “scheduled”, “estimates”, “forecasts”, “intends”, “anticipates” or “does not anticipate”, or “believes”, or variations of such words and phrases or state that certain actions, events or results “may”, “could”, “would”, “might”, “projects”, “will” or “will be taken”, “occur” or “be achieved”). Forward-looking statements are based on the opinions and estimates of management of CAC or F45, as the case may be, as of the date such statements are made, and they are subject to known and unknown risks, uncertainties, assumptions and other factors that may cause the actual results, level of activity, performance or achievements to be materially different from those expressed or implied by such forward-looking statements. These risks and uncertainties include, but are not limited to, the occurrence of any event, change or other circumstances that could give rise to a delay in or the failure to close the business combination, the amount of redemptions, the ability to retain key personnel and the ability to achieve stockholder and regulatory approvals, industry trends, legislation or regulatory requirements and developments in the global economy as well as the public health crisis related to the coronavirus (COVID-19) pandemic and resulting significant negative effects to the global economy, disrupted global supply chains and significant volatility and disruption of financial markets, increased operating costs, decreased ability to operate gyms and the impact of government shutdowns. Additional information on these and other factors that may cause actual results and CAC’s performance to differ materially is included in CAC’s periodic reports filed with the Securities and Exchange Commission (the “SEC”), including but not limited to CAC’s annual report on Form 10-K for the year ended December 31, 2019 and subsequent quarterly reports on Form 10-Q. Copies of CAC’s filings with the SEC are available publicly on the SEC’s website at www.sec.gov or may be obtained by contacting CAC. Readers are cautioned not to place undue reliance upon any forward-looking statements, which speak only as of the date made. These forward-looking statements are made only as of the date hereof, and CAC undertakes no obligations to update or revise the forward-looking statements, whether as a result of new information, future events or otherwise, except as required by law. This Presentation also contains estimates, projections and other information concerning our industry, our business, our franchises and the markets for our products and services. Some data and statistical information are based on independent reports from third parties and reports that we commissioned from third parties. Some data and other information related to our franchisees are based on internal estimates and calculations that are derived from research we conducted, including surveys of our franchisees in July 2019 and April 2020. In generating the data, estimates and calculations derived from the information provided by these respondents, we excluded certain responses that were incomplete or that we determined to be significant outliers. Data and other information resulting from this survey are based on responses provided by a limited respondent pool and that have not been independently verified by us or any independent sources. You are cautioned not to give undue weight to any such estimates, projections and other information. 2NEITHER THE SECURITIES AND EXCHANGE COMMISSION (THE “SEC”) NOR ANY STATE SECURITIES COMMISSION HAS APPROVED OR DISAPPROVED OF THE SECURITIES OR DETERMINED IF THIS PRESENTATION IS TRUTHFUL OR COMPLETE. This Presentation contains financial forecasts with respect to F45’s projected Revenues, EBITDA, Adjusted EBITDA and Net Income. Neither CAC’s nor F45’s independent auditors audited, reviewed, compiled, or performed any procedures with respect to the projections for the purpose of their inclusion in this Presentation and accordingly, neither of them expressed an opinion or provided any other form of assurance with respect thereto for the purpose of this Presentation. These projections should not be relied upon as being necessarily indicative of future results. The assumptions and estimates underlying the prospective financial information are inherently uncertain and are subject to a wide variety of significant business, economic and competitive risks and uncertainties that could cause actual results to differ materially from those contained in the prospective financial information. Accordingly, there can be no assurance that the prospective results are indicative of the future performance of CAC, F45 or the combined company after completion of the contemplated business combination, or that actual results will not differ materially from those presented in the prospective financial information. Inclusion of the prospective financial information in this Presentation should not be regarded as a representation by any person that the results contained in the prospective financial information will be achieved. Neither F45, CAC, nor any of their respective affiliates have any obligation to update this Presentation. Although all information and opinions expressed in this Presentation were obtained from sources believed to be reliable and in good faith, no representation or warranty, express or implied, is made as to its accuracy or completeness. This Presentation contains preliminary information only, is subject to change at any time and is not, and should not be assumed to be, complete or to constitute all the information necessary to adequately make an informed decision regarding your engagement with F45 and CAC. Forward-looking Statements and Industry, Market and Other Data This Presentation contains “forward-looking statements” within the meaning of Section 21E of the Securities Exchange Act of 1934, as amended, and the Private Securities Litigation Reform Act of 1995. Forward-looking statements may relate to the business combination and any other statements relating to future results, strategy and plans of CAC and F45 (including certain projections and business trends, and statements which may be identified by the use of the words “plans”, “expects” or “does not expect”, “estimated”, “is expected”, “budget”, “scheduled”, “estimates”, “forecasts”, “intends”, “anticipates” or “does not anticipate”, or “believes”, or variations of such words and phrases or state that certain actions, events or results “may”, “could”, “would”, “might”, “projects”, “will” or “will be taken”, “occur” or “be achieved”). Forward-looking statements are based on the opinions and estimates of management of CAC or F45, as the case may be, as of the date such statements are made, and they are subject to known and unknown risks, uncertainties, assumptions and other factors that may cause the actual results, level of activity, performance or achievements to be materially different from those expressed or implied by such forward-looking statements. These risks and uncertainties include, but are not limited to, the occurrence of any event, change or other circumstances that could give rise to a delay in or the failure to close the business combination, the amount of redemptions, the ability to retain key personnel and the ability to achieve stockholder and regulatory approvals, industry trends, legislation or regulatory requirements and developments in the global economy as well as the public health crisis related to the coronavirus (COVID-19) pandemic and resulting significant negative effects to the global economy, disrupted global supply chains and significant volatility and disruption of financial markets, increased operating costs, decreased ability to operate gyms and the impact of government shutdowns. Additional information on these and other factors that may cause actual results and CAC’s performance to differ materially is included in CAC’s periodic reports filed with the Securities and Exchange Commission (the “SEC”), including but not limited to CAC’s annual report on Form 10-K for the year ended December 31, 2019 and subsequent quarterly reports on Form 10-Q. Copies of CAC’s filings with the SEC are available publicly on the SEC’s website at www.sec.gov or may be obtained by contacting CAC. Readers are cautioned not to place undue reliance upon any forward-looking statements, which speak only as of the date made. These forward-looking statements are made only as of the date hereof, and CAC undertakes no obligations to update or revise the forward-looking statements, whether as a result of new information, future events or otherwise, except as required by law. This Presentation also contains estimates, projections and other information concerning our industry, our business, our franchises and the markets for our products and services. Some data and statistical information are based on independent reports from third parties and reports that we commissioned from third parties. Some data and other information related to our franchisees are based on internal estimates and calculations that are derived from research we conducted, including surveys of our franchisees in July 2019 and April 2020. In generating the data, estimates and calculations derived from the information provided by these respondents, we excluded certain responses that were incomplete or that we determined to be significant outliers. Data and other information resulting from this survey are based on responses provided by a limited respondent pool and that have not been independently verified by us or any independent sources. You are cautioned not to give undue weight to any such estimates, projections and other information. 2
This Presentation presents Adjusted EBITDA and Adjusted EBITDA margin, which are measurements that are not calculated in accordance with US general accepted accounting principles (“GAAP”). Management believes that Adjusted EBITDA and Adjusted EBITDA margin are useful to investors as they eliminate certain items identified as affecting the period-over-period comparability of our operating results. Adjusted EBITDA, and Adjusted EBITDA margin eliminate non-cash depreciation and amortization expense that results from our capital investments and intangible assets, as well as income taxes, which may not be comparable with other companies based on our tax structure. Adjusted EBITDA, and Adjusted EBITDA margin should be considered in addition to, and not as a substitute for, net income in accordance with GAAP as a measure of performance. Other companies may define Adjusted EBITDA, and Adjusted EBITDA margin differently, and as a result the Company’s measures of Adjusted EBITDA, and Adjusted EBITDA margin may not be directly comparable to those of other companies. A reconciliation of non-GAAP financial measures used in this Presentation to their nearest comparable GAAP financial measures is included at the end of this Presentation. “Average Unit Volume,” or AUV, means aggregate studio-level revenue generated by open studios divided by the average number of open studios during a specific period. Due to the relatively young age of our studio base, we believe it is appropriate to assess AUV on a cohort-level basis. We define a cohort as a group of studios that opened during the same year and have been opened for at least 12 months. We believe AUV to be a useful measure because it allows us to assess changes in studio traffic and general levels of demand across our global network of studios. “Cash-on-cash returns” means studio-level EBITDA over initial investment. “Franchises sold” represents, as of any specified date, the total number of signed franchise agreements in place as of such date that have not been terminated. Each new franchise is included in the number of franchises sold from the date on which we enter into a signed franchise agreement related to each such new franchise and receive establishment fee. Franchises sold includes franchise arrangements in all stages of development after signing a franchise agreement, and includes franchises with open studios. Franchises are removed from franchises sold upon termination of the franchise agreement. “Open studios” means, as of any specified date, the total number of studios that we have determined to be open as of such date. We classify a studio as open as of the month in which the studio first generates monthly revenue of at least $4,500. CAC and F45 own or have rights to various trademarks, service marks and trade names that they use in connection with the operation of their respective businesses. This Presentation also contains trademarks, service marks and trade names of third parties, which are the property of their respective owners. The use or display of third parties’ trademarks, service marks, trade names or products in this Presentation is not intended to, and does not imply, a relationship with CAC or F45, or an endorsement or sponsorship by or of CAC or F45. Solely for convenience, the trademarks, service marks and trade names referred to in this Presentation may appear without the ®, TM or SM symbols, but such references are not intended to indicate, in any way, that CAC or F45 will not assert, to the fullest extent under applicable law, their rights or the right of the applicable licensor to these trademarks, service marks and trade names. Nothing herein should be construed as legal, financial, tax or other advice. You should consult your own advisers concerning any legal, financial, tax or other considerations concerning the opportunity described herein. The general explanations included in this Presentation cannot address, and are not intended to address, your specific investment objectives, financial situations or financial needs. This Presentation relates to the business combination between F45 and CAC and may be deemed to be solicitation material in respect of the business combination. The business combination will be submitted to the stockholders of CAC and F45 for their approval. In connection with CAC’s stockholder vote on the business combination, CAC will file a proxy statement on Schedule 14A with the SEC. This Presentation is not a substitute for the proxy statement that CAC will file with the SEC or any other documents that CAC may file with the SEC or send to its stockholders in connection with the business combination. When completed, CAC will mail a definitive proxy statement to its stockholders in connection with CAC’s solicitation of proxies for the special meeting of CAC’s stockholders to be held to approve the business combination. This presentation does not contain all the information that should be considered concerning the business combination, including relevant risk factors that may be included in the proxy statement. It is not intended to provide the basis for any investment decision or any other decision in respect to the business combination. CAC’s stockholders and other interested persons are urged to read, when available, CAC’s preliminary proxy statement, the definitive proxy statement and any other relevant documents that are filed or furnished or will be filed or will be furnished with the SEC, as well as any amendments or supplements to these documents, carefully and in their entirety before making any voting or investment decision with respect to the business combination, as these materials will contain important information about CAC, related matters and the parties to CAC. A copy of the definitive proxy statement will be sent when available to all stockholders of record of CAC seeking the required stockholder approvals. Investors and stockholders can obtain free copies of the preliminary proxy statement once it is available and other documents filed with the SEC by CAC through the web site maintained by the SEC at www.sec.gov. In addition, investors and stockholders can obtain free copies of the preliminary proxy statement once it is available from CAC by accessing CAC’s website at https://www.crescentspac.com. This Presentation is for informational purposes only and is neither an offer to sell or purchase, nor the solicitation of an offer to buy or sell any securities, nor is it a solicitation of any vote, consent, or approval in any jurisdiction pursuant to or in connection with the business combination or otherwise, nor shall there be any sale, issuance or transfer of securities in any jurisdiction in contravention of applicable law. CAC and F45, and their respective directors and executive officers, may be deemed participants in the solicitation of proxies of CAC’s stockholders in respect of the business combination. Information about the directors and executive officers of CAC is set forth in CAC’s Form 10-K for the year ended December 31, 2019. Information about the directors and executive officers of F45 and more detailed information regarding the identity of all potential participants, and their direct and indirect interests, by security holdings or otherwise, will be set forth in CAC’s proxy statement, when available. Investors may obtain additional information about the interests 3 of such participants by reading such proxy statement when it becomes available.This Presentation presents Adjusted EBITDA and Adjusted EBITDA margin, which are measurements that are not calculated in accordance with US general accepted accounting principles (“GAAP”). Management believes that Adjusted EBITDA and Adjusted EBITDA margin are useful to investors as they eliminate certain items identified as affecting the period-over-period comparability of our operating results. Adjusted EBITDA, and Adjusted EBITDA margin eliminate non-cash depreciation and amortization expense that results from our capital investments and intangible assets, as well as income taxes, which may not be comparable with other companies based on our tax structure. Adjusted EBITDA, and Adjusted EBITDA margin should be considered in addition to, and not as a substitute for, net income in accordance with GAAP as a measure of performance. Other companies may define Adjusted EBITDA, and Adjusted EBITDA margin differently, and as a result the Company’s measures of Adjusted EBITDA, and Adjusted EBITDA margin may not be directly comparable to those of other companies. A reconciliation of non-GAAP financial measures used in this Presentation to their nearest comparable GAAP financial measures is included at the end of this Presentation. “Average Unit Volume,” or AUV, means aggregate studio-level revenue generated by open studios divided by the average number of open studios during a specific period. Due to the relatively young age of our studio base, we believe it is appropriate to assess AUV on a cohort-level basis. We define a cohort as a group of studios that opened during the same year and have been opened for at least 12 months. We believe AUV to be a useful measure because it allows us to assess changes in studio traffic and general levels of demand across our global network of studios. “Cash-on-cash returns” means studio-level EBITDA over initial investment. “Franchises sold” represents, as of any specified date, the total number of signed franchise agreements in place as of such date that have not been terminated. Each new franchise is included in the number of franchises sold from the date on which we enter into a signed franchise agreement related to each such new franchise and receive establishment fee. Franchises sold includes franchise arrangements in all stages of development after signing a franchise agreement, and includes franchises with open studios. Franchises are removed from franchises sold upon termination of the franchise agreement. “Open studios” means, as of any specified date, the total number of studios that we have determined to be open as of such date. We classify a studio as open as of the month in which the studio first generates monthly revenue of at least $4,500. CAC and F45 own or have rights to various trademarks, service marks and trade names that they use in connection with the operation of their respective businesses. This Presentation also contains trademarks, service marks and trade names of third parties, which are the property of their respective owners. The use or display of third parties’ trademarks, service marks, trade names or products in this Presentation is not intended to, and does not imply, a relationship with CAC or F45, or an endorsement or sponsorship by or of CAC or F45. Solely for convenience, the trademarks, service marks and trade names referred to in this Presentation may appear without the ®, TM or SM symbols, but such references are not intended to indicate, in any way, that CAC or F45 will not assert, to the fullest extent under applicable law, their rights or the right of the applicable licensor to these trademarks, service marks and trade names. Nothing herein should be construed as legal, financial, tax or other advice. You should consult your own advisers concerning any legal, financial, tax or other considerations concerning the opportunity described herein. The general explanations included in this Presentation cannot address, and are not intended to address, your specific investment objectives, financial situations or financial needs. This Presentation relates to the business combination between F45 and CAC and may be deemed to be solicitation material in respect of the business combination. The business combination will be submitted to the stockholders of CAC and F45 for their approval. In connection with CAC’s stockholder vote on the business combination, CAC will file a proxy statement on Schedule 14A with the SEC. This Presentation is not a substitute for the proxy statement that CAC will file with the SEC or any other documents that CAC may file with the SEC or send to its stockholders in connection with the business combination. When completed, CAC will mail a definitive proxy statement to its stockholders in connection with CAC’s solicitation of proxies for the special meeting of CAC’s stockholders to be held to approve the business combination. This presentation does not contain all the information that should be considered concerning the business combination, including relevant risk factors that may be included in the proxy statement. It is not intended to provide the basis for any investment decision or any other decision in respect to the business combination. CAC’s stockholders and other interested persons are urged to read, when available, CAC’s preliminary proxy statement, the definitive proxy statement and any other relevant documents that are filed or furnished or will be filed or will be furnished with the SEC, as well as any amendments or supplements to these documents, carefully and in their entirety before making any voting or investment decision with respect to the business combination, as these materials will contain important information about CAC, related matters and the parties to CAC. A copy of the definitive proxy statement will be sent when available to all stockholders of record of CAC seeking the required stockholder approvals. Investors and stockholders can obtain free copies of the preliminary proxy statement once it is available and other documents filed with the SEC by CAC through the web site maintained by the SEC at www.sec.gov. In addition, investors and stockholders can obtain free copies of the preliminary proxy statement once it is available from CAC by accessing CAC’s website at https://www.crescentspac.com. This Presentation is for informational purposes only and is neither an offer to sell or purchase, nor the solicitation of an offer to buy or sell any securities, nor is it a solicitation of any vote, consent, or approval in any jurisdiction pursuant to or in connection with the business combination or otherwise, nor shall there be any sale, issuance or transfer of securities in any jurisdiction in contravention of applicable law. CAC and F45, and their respective directors and executive officers, may be deemed participants in the solicitation of proxies of CAC’s stockholders in respect of the business combination. Information about the directors and executive officers of CAC is set forth in CAC’s Form 10-K for the year ended December 31, 2019. Information about the directors and executive officers of F45 and more detailed information regarding the identity of all potential participants, and their direct and indirect interests, by security holdings or otherwise, will be set forth in CAC’s proxy statement, when available. Investors may obtain additional information about the interests 3 of such participants by reading such proxy statement when it becomes available.

F45 Team Crescent Team CHRIS PAYNE ADAM GILCHRIST MITCHELL RAISCH ROBERT BEYER TODD PURDY Co-Founder & CEO Chief Financial Officer Chief Marketing Officer Executive Chairman Chief Executive Officer F45 Strategic Investor 4 LUKE ARMSTRONG MARK WAHLBERG HEATHER CHRISTIE Chief Operating Officer F45 Strategic Investor Chief Revenue OfficerF45 Team Crescent Team CHRIS PAYNE ADAM GILCHRIST MITCHELL RAISCH ROBERT BEYER TODD PURDY Co-Founder & CEO Chief Financial Officer Chief Marketing Officer Executive Chairman Chief Executive Officer F45 Strategic Investor 4 LUKE ARMSTRONG MARK WAHLBERG HEATHER CHRISTIE Chief Operating Officer F45 Strategic Investor Chief Revenue Officer

2 SUMMARY OVERVIEW PRO FORMA OWNERSHIP AT CLOSE • F45 Training to be acquired by Crescent Acquisition Corp, a publicly listed special SHARES OUTSTANDING purpose acquisition company with over $250mm in cash FPA • Led by Robert Beyer and Todd Purdy in partnership with Crescent Capital, an 6% SPAC Sponsor SPAC shareholders 25.0 alternative asset manager with approximately $28bn of institutional and retail 6% assets under management • Crescent Capital committing to provide incremental $50 million pursuant to SPAC sponsor 5.0 forward purchase agreement (“FPA”) F45 • Long-term track record of partnering with growth-oriented, market-leading 60% FPA 5.0 businesses to accelerate growth • Significant experience in multi-location consumer businesses F45 52.7 • Transaction enterprise value of $845 million SPAC 3 • Expected to provide $55 million of incremental cash to F45’s balance sheet after Shareholders paying down revolving credit facility 28% Total 87.7 1 • Existing F45 shareholders to be paid up to $202 million cash consideration and issued approximately 52.7 million roll-over shares at close 2 CASH SOURCES & USES ($mm) PRO FORMA ENTERPRISE VALUATION AT CLOSE ($mm) SOURCES USES Crescent illustrative share price $10.00 1 3 Cash to seller $202 Parent Cash $302 Pro forma shares outstanding 87.7 3 Pro forma equity value $877 Cash to balance $75 sheet / revolver Less: pro forma net cash $(32) Deal expenses $25 Pro forma enterprise value $845 Total sources $302 Total uses $302 2021E EV / EBITDA $71 11.9x 2 2021E P / E $52 16.9x 5 1 Note: Transaction overview assumes no redemption by SPAC shareholders. Up to $202mm, net of taxes owed and excluding shareholder representative holdback and escrow amount, to be provided in part to co-founder no 2 longer working with the company ($140mm), with 30% of cash going to other shareholders. Reflects ownership at close; does not include 10 million earnout shares granted to seller, converting to class A stock ratably at weighted average share price of $12.50 and $15.00. SPAC sponsor to convert 1.25 million founder shares into earnout shares, converting to class A stock ratably at $12.50 and $15.00. Does not reflect F45 shareholders employee 3 option pool and warrants. Cash in trust account, net of taxes on trust interest, inclusive of cash held by Crescent Acquisition Corp outside of trust account, net of adjustment escrow and stockholder representative expense holdback amount, inclusive of $50mm forward purchase investment amount.2 SUMMARY OVERVIEW PRO FORMA OWNERSHIP AT CLOSE • F45 Training to be acquired by Crescent Acquisition Corp, a publicly listed special SHARES OUTSTANDING purpose acquisition company with over $250mm in cash FPA • Led by Robert Beyer and Todd Purdy in partnership with Crescent Capital, an 6% SPAC Sponsor SPAC shareholders 25.0 alternative asset manager with approximately $28bn of institutional and retail 6% assets under management • Crescent Capital committing to provide incremental $50 million pursuant to SPAC sponsor 5.0 forward purchase agreement (“FPA”) F45 • Long-term track record of partnering with growth-oriented, market-leading 60% FPA 5.0 businesses to accelerate growth • Significant experience in multi-location consumer businesses F45 52.7 • Transaction enterprise value of $845 million SPAC 3 • Expected to provide $55 million of incremental cash to F45’s balance sheet after Shareholders paying down revolving credit facility 28% Total 87.7 1 • Existing F45 shareholders to be paid up to $202 million cash consideration and issued approximately 52.7 million roll-over shares at close 2 CASH SOURCES & USES ($mm) PRO FORMA ENTERPRISE VALUATION AT CLOSE ($mm) SOURCES USES Crescent illustrative share price $10.00 1 3 Cash to seller $202 Parent Cash $302 Pro forma shares outstanding 87.7 3 Pro forma equity value $877 Cash to balance $75 sheet / revolver Less: pro forma net cash $(32) Deal expenses $25 Pro forma enterprise value $845 Total sources $302 Total uses $302 2021E EV / EBITDA $71 11.9x 2 2021E P / E $52 16.9x 5 1 Note: Transaction overview assumes no redemption by SPAC shareholders. Up to $202mm, net of taxes owed and excluding shareholder representative holdback and escrow amount, to be provided in part to co-founder no 2 longer working with the company ($140mm), with 30% of cash going to other shareholders. Reflects ownership at close; does not include 10 million earnout shares granted to seller, converting to class A stock ratably at weighted average share price of $12.50 and $15.00. SPAC sponsor to convert 1.25 million founder shares into earnout shares, converting to class A stock ratably at $12.50 and $15.00. Does not reflect F45 shareholders employee 3 option pool and warrants. Cash in trust account, net of taxes on trust interest, inclusive of cash held by Crescent Acquisition Corp outside of trust account, net of adjustment escrow and stockholder representative expense holdback amount, inclusive of $50mm forward purchase investment amount.

POD 04: WARMUP: COVID-19 IMPACT EXECUTIVE SUMMARY :00 :04 & RESPONSE POD 01: POD 05: OUR STRENGTHS & :01 :05 FINANCIAL OVERVIEW BUSINESS OVERVIEW POD 02: POD 06: OUR FRANCHISE GROWTH STRATEGY :02 :06 MODEL POD 03: OUR MEMBERS & :03 6 MARKETING STRATEGYPOD 04: WARMUP: COVID-19 IMPACT EXECUTIVE SUMMARY :00 :04 & RESPONSE POD 01: POD 05: OUR STRENGTHS & :01 :05 FINANCIAL OVERVIEW BUSINESS OVERVIEW POD 02: POD 06: OUR FRANCHISE GROWTH STRATEGY :02 :06 MODEL POD 03: OUR MEMBERS & :03 6 MARKETING STRATEGY
7777
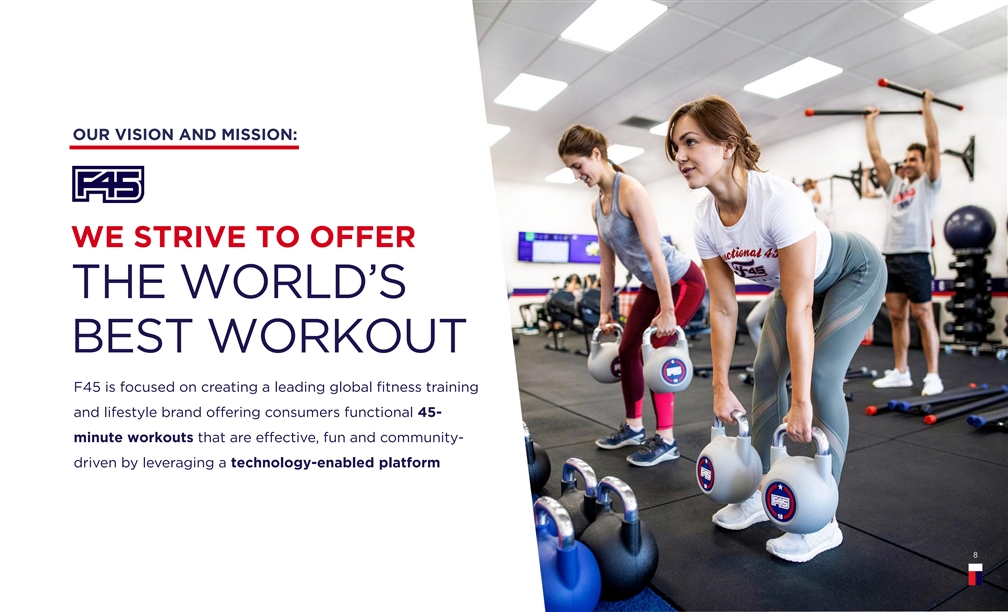
OUR VISION AND MISSION: WE STRIVE TO OFFER THE WORLD’S BEST WORKOUT F45 is focused on creating a leading global fitness training and lifestyle brand offering consumers functional 45- minute workouts that are effective, fun and community- driven by leveraging a technology-enabled platform 88OUR VISION AND MISSION: WE STRIVE TO OFFER THE WORLD’S BEST WORKOUT F45 is focused on creating a leading global fitness training and lifestyle brand offering consumers functional 45- minute workouts that are effective, fun and community- driven by leveraging a technology-enabled platform 88
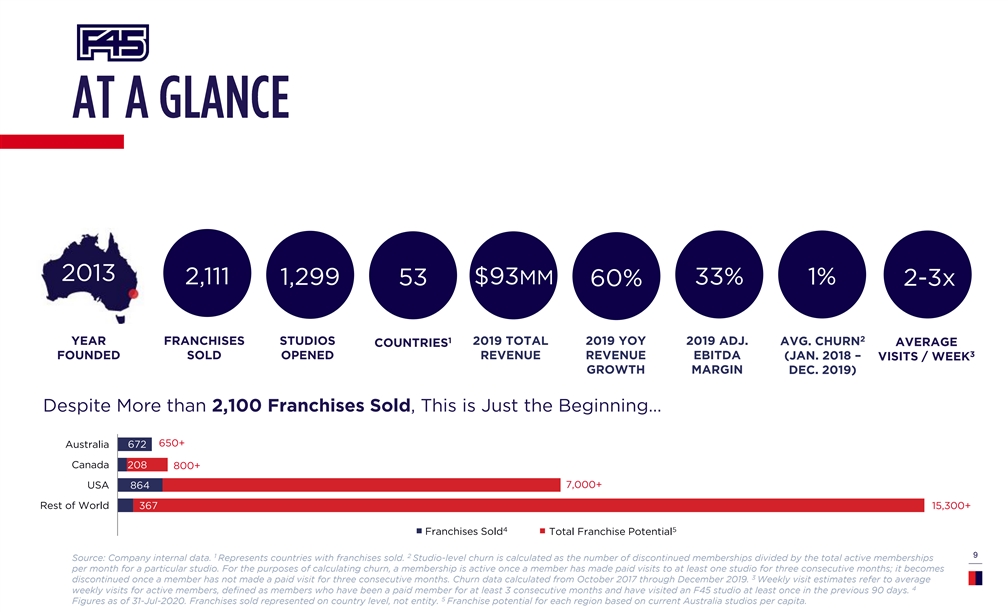
2013 2,111 $93MM 1,299 53 33% 1% 60% 2-3x 2 1 YEAR FRANCHISES STUDIOS 2019 TOTAL 2019 YOY 2019 ADJ. AVG. CHURN AVERAGE COUNTRIES 3 FOUNDED SOLD OPENED REVENUE REVENUE EBITDA (JAN. 2018 – VISITS / WEEK GROWTH MARGIN DEC. 2019) Despite More than 2,100 Franchises Sold, This is Just the Beginning… 650+ Australia 672 Canada 208 800+ 7,000+ USA 864 Rest of World 367 15,300+ 4 5 F Fr ranc anchise hises Sold s Sold Tot Total al Fran Franc chise hise P Po oten tentti ia all 1 2 9 Source: Company internal data. Represents countries with franchises sold. Studio-level churn is calculated as the number of discontinued memberships divided by the total active memberships per month for a particular studio. For the purposes of calculating churn, a membership is active once a member has made paid visits to at least one studio for three consecutive months; it becomes 3 discontinued once a member has not made a paid visit for three consecutive months. Churn data calculated from October 2017 through December 2019. Weekly visit estimates refer to average 4 weekly visits for active members, defined as members who have been a paid member for at least 3 consecutive months and have visited an F45 studio at least once in the previous 90 days. 5 Figures as of 31-Jul-2020. Franchises sold represented on country level, not entity. Franchise potential for each region based on current Australia studios per capita. 2013 2,111 $93MM 1,299 53 33% 1% 60% 2-3x 2 1 YEAR FRANCHISES STUDIOS 2019 TOTAL 2019 YOY 2019 ADJ. AVG. CHURN AVERAGE COUNTRIES 3 FOUNDED SOLD OPENED REVENUE REVENUE EBITDA (JAN. 2018 – VISITS / WEEK GROWTH MARGIN DEC. 2019) Despite More than 2,100 Franchises Sold, This is Just the Beginning… 650+ Australia 672 Canada 208 800+ 7,000+ USA 864 Rest of World 367 15,300+ 4 5 F Fr ranc anchise hises Sold s Sold Tot Total al Fran Franc chise hise P Po oten tentti ia all 1 2 9 Source: Company internal data. Represents countries with franchises sold. Studio-level churn is calculated as the number of discontinued memberships divided by the total active memberships per month for a particular studio. For the purposes of calculating churn, a membership is active once a member has made paid visits to at least one studio for three consecutive months; it becomes 3 discontinued once a member has not made a paid visit for three consecutive months. Churn data calculated from October 2017 through December 2019. Weekly visit estimates refer to average 4 weekly visits for active members, defined as members who have been a paid member for at least 3 consecutive months and have visited an F45 studio at least once in the previous 90 days. 5 Figures as of 31-Jul-2020. Franchises sold represented on country level, not entity. Franchise potential for each region based on current Australia studios per capita.
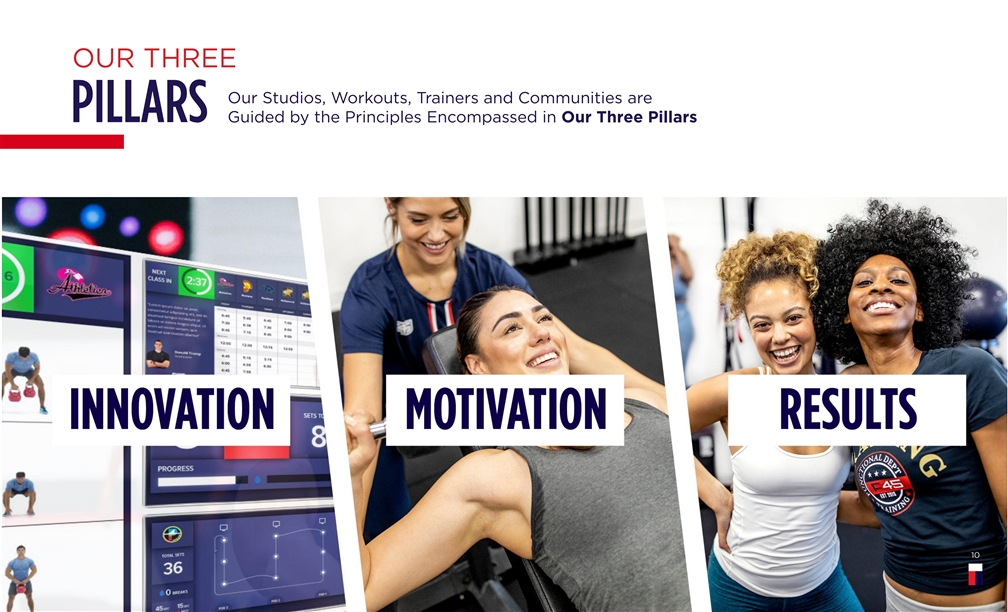
OUR THREE Our Studios, Workouts, Trainers and Communities are Guided by the Principles Encompassed in Our Three Pillars 10 10OUR THREE Our Studios, Workouts, Trainers and Communities are Guided by the Principles Encompassed in Our Three Pillars 10 10
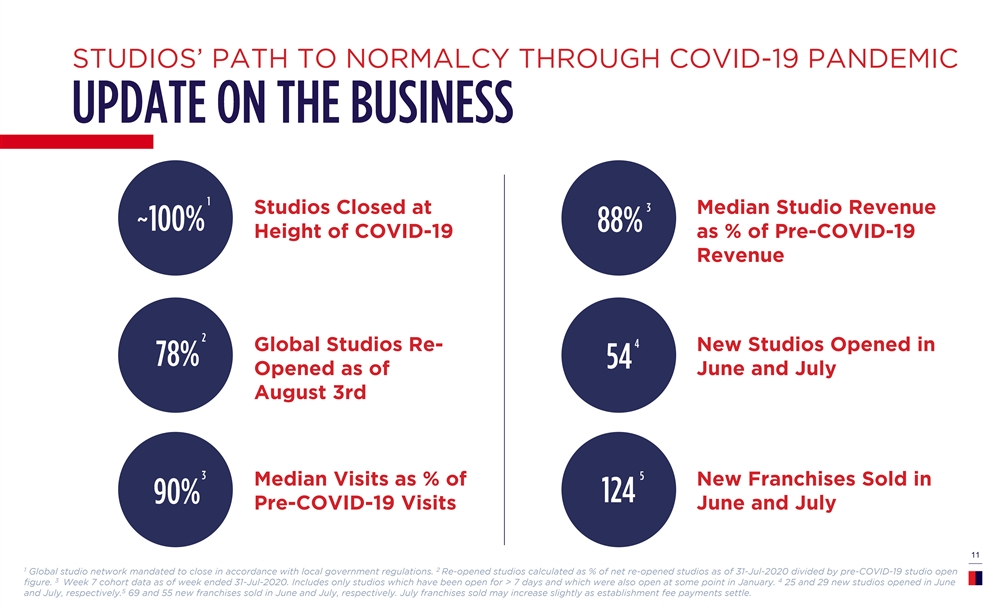
STUDIOS’ PATH TO NORMALCY THROUGH COVID-19 PANDEMIC Studios Closed at Median Studio Revenue 1 Height of COVID-19 as % of Pre-COVID-19 Revenue Global Studios Re- New Studios Opened in Opened as of June and July August 3rd Median Visits as % of New Franchises Sold in Pre-COVID-19 Visits June and July 2 11 1 2 Global studio network mandated to close in accordance with local government regulations. Re-opened studios calculated as % of net re-opened studios as of 31-Jul-2020 divided by pre-COVID-19 studio open 3 4 figure. Week 7 cohort data as of week ended 31-Jul-2020. Includes only studios which have been open for > 7 days and which were also open at some point in January. 25 and 29 new studios opened in June 5 and July, respectively. 69 and 55 new franchises sold in June and July, respectively. July franchises sold may increase slightly as establishment fee payments settle.STUDIOS’ PATH TO NORMALCY THROUGH COVID-19 PANDEMIC Studios Closed at Median Studio Revenue 1 Height of COVID-19 as % of Pre-COVID-19 Revenue Global Studios Re- New Studios Opened in Opened as of June and July August 3rd Median Visits as % of New Franchises Sold in Pre-COVID-19 Visits June and July 2 11 1 2 Global studio network mandated to close in accordance with local government regulations. Re-opened studios calculated as % of net re-opened studios as of 31-Jul-2020 divided by pre-COVID-19 studio open 3 4 figure. Week 7 cohort data as of week ended 31-Jul-2020. Includes only studios which have been open for > 7 days and which were also open at some point in January. 25 and 29 new studios opened in June 5 and July, respectively. 69 and 55 new franchises sold in June and July, respectively. July franchises sold may increase slightly as establishment fee payments settle.
1212

INNOVATIVE & Discounted Private Training F45’s technology–enabled platform drives quality & consistency within each studio Centralized Media & Technology Platform Seamless Content Delivery Consistent Experience Worldwide Promotes connectivity and efficient workouts 13 13INNOVATIVE & Discounted Private Training F45’s technology–enabled platform drives quality & consistency within each studio Centralized Media & Technology Platform Seamless Content Delivery Consistent Experience Worldwide Promotes connectivity and efficient workouts 13 13

HIGHLY SCALABLE EQUIPMENT: Standardized Franchisee “World Pack” SETUP & BUILD OUT: Simple Studio Design OPERATIONS: Standardized and Centrally Managed Fitness Programming Delivery Platform F45 has created a centralized platform to promote successful opening and ongoing purchases of franchises at a relatively low cost 14 14HIGHLY SCALABLE EQUIPMENT: Standardized Franchisee “World Pack” SETUP & BUILD OUT: Simple Studio Design OPERATIONS: Standardized and Centrally Managed Fitness Programming Delivery Platform F45 has created a centralized platform to promote successful opening and ongoing purchases of franchises at a relatively low cost 14 14

OUR WORKOUT ILLUSTRATIVE EXERCISES IN DATABASE Database • Our extensive and growing database of ~2,900 unique movements based on specific criteria • Criteria include movement and exercise type, muscle groups, type of equipment, exercise frequency (to avoid repeating exercises), number of stations and sequencing Plate Battle Rope Ab Crunch Ladder & Twist Scissors Squat Hold • Adaptability of workout to capitalize on latest fitness trends (e.g., boxing) Programming Algorithm • Exercises are selected based on each branded workout’s key characteristics (movement and exercise type, target muscle group, equipment type, etc.) Jump Squats Barbell Dumbbell Balance Trainer Bench Fly Upright Row Push Up • Algorithm removes exercises completed too recently to avoid repetition and minimize injury risk Workout Testing • Head trainers and our Athletics Department vet workouts to improve quality, avoid duplications of muscle groups or movements, and aid in efficient transitions Seated Dumbbell Sled Push Wall Squat Shoulder Press • We finalize our 10-week programming three-weeks ahead of a Row system-wide release and beta test the new programs across 15 several test studios to improve quality and ease of use by trainers and members OUR WORKOUT ILLUSTRATIVE EXERCISES IN DATABASE Database • Our extensive and growing database of ~2,900 unique movements based on specific criteria • Criteria include movement and exercise type, muscle groups, type of equipment, exercise frequency (to avoid repeating exercises), number of stations and sequencing Plate Battle Rope Ab Crunch Ladder & Twist Scissors Squat Hold • Adaptability of workout to capitalize on latest fitness trends (e.g., boxing) Programming Algorithm • Exercises are selected based on each branded workout’s key characteristics (movement and exercise type, target muscle group, equipment type, etc.) Jump Squats Barbell Dumbbell Balance Trainer Bench Fly Upright Row Push Up • Algorithm removes exercises completed too recently to avoid repetition and minimize injury risk Workout Testing • Head trainers and our Athletics Department vet workouts to improve quality, avoid duplications of muscle groups or movements, and aid in efficient transitions Seated Dumbbell Sled Push Wall Squat Shoulder Press • We finalize our 10-week programming three-weeks ahead of a Row system-wide release and beta test the new programs across 15 several test studios to improve quality and ease of use by trainers and members
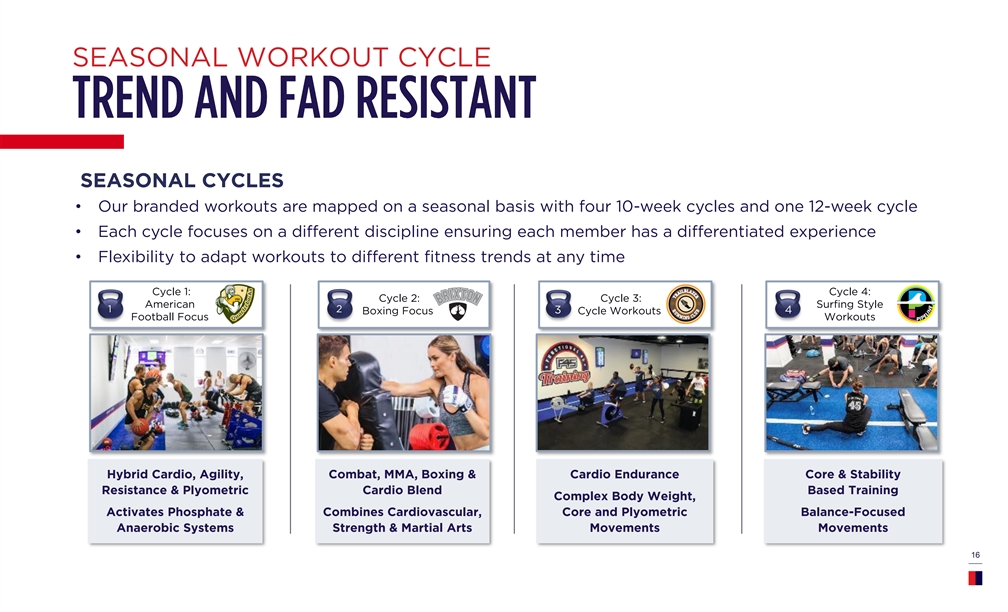
SEASONAL WORKOUT CYCLE SEASONAL CYCLES • Our branded workouts are mapped on a seasonal basis with four 10-week cycles and one 12-week cycle • Each cycle focuses on a different discipline ensuring each member has a differentiated experience • Flexibility to adapt workouts to different fitness trends at any time Cycle 1: Cycle 4: Cycle 2: Cycle 3: American Surfing Style 1 2 Boxing Focus 3 Cycle Workouts 4 Football Focus Workouts Hybrid Cardio, Agility, Combat, MMA, Boxing & Cardio Endurance Core & Stability Resistance & Plyometric Cardio Blend Based Training Complex Body Weight, Activates Phosphate & Combines Cardiovascular, Core and Plyometric Balance-Focused Anaerobic Systems Strength & Martial Arts Movements Movements 16SEASONAL WORKOUT CYCLE SEASONAL CYCLES • Our branded workouts are mapped on a seasonal basis with four 10-week cycles and one 12-week cycle • Each cycle focuses on a different discipline ensuring each member has a differentiated experience • Flexibility to adapt workouts to different fitness trends at any time Cycle 1: Cycle 4: Cycle 2: Cycle 3: American Surfing Style 1 2 Boxing Focus 3 Cycle Workouts 4 Football Focus Workouts Hybrid Cardio, Agility, Combat, MMA, Boxing & Cardio Endurance Core & Stability Resistance & Plyometric Cardio Blend Based Training Complex Body Weight, Activates Phosphate & Combines Cardiovascular, Core and Plyometric Balance-Focused Anaerobic Systems Strength & Martial Arts Movements Movements 16

HEALTHY GROWING NETWORK OF STUDIOS WITH ($ in thousands) $500 $315K $364K $478 $429 $404 $388 $391 $390 $379 $365 LOW INITIAL INVESTMENT YEAR 3 AUV $361 $345 Estimated Aggregate Initial Investment $342 $325 $290 $284 $283 $274 $242 $218 $188 >30% >35% $176 STRONG PROFITABILITY ROBUST RETURNS Average EBITDA Margins Average Cash-on-Cash Returns 2014 2015 2016 2017 2018 2019 2 2 (n=23) (n=92) (n=171) (n=225) (n=270) (n=225) ~6 ~75 Year 1 Year 2 Year 3 Year 4 Year 5 Year 6 17 MONTHS TO PROFITABILITY MEMBERS TO BREAKEVEN 1 2 Source: Estimates based on 2019 Franchisee Survey and internal data as of 30-Jun-2020. AUV data as of 29-Feb-2020. Represents estimates and varies by geography due to localized class pricing and varying OpEx.HEALTHY GROWING NETWORK OF STUDIOS WITH ($ in thousands) $500 $315K $364K $478 $429 $404 $388 $391 $390 $379 $365 LOW INITIAL INVESTMENT YEAR 3 AUV $361 $345 Estimated Aggregate Initial Investment $342 $325 $290 $284 $283 $274 $242 $218 $188 >30% >35% $176 STRONG PROFITABILITY ROBUST RETURNS Average EBITDA Margins Average Cash-on-Cash Returns 2014 2015 2016 2017 2018 2019 2 2 (n=23) (n=92) (n=171) (n=225) (n=270) (n=225) ~6 ~75 Year 1 Year 2 Year 3 Year 4 Year 5 Year 6 17 MONTHS TO PROFITABILITY MEMBERS TO BREAKEVEN 1 2 Source: Estimates based on 2019 Franchisee Survey and internal data as of 30-Jun-2020. AUV data as of 29-Feb-2020. Represents estimates and varies by geography due to localized class pricing and varying OpEx.

ASSET-LIGHT MODEL DRIVING ASSET–LIGHT RAPID GROWTH STRONG PROFITABILITY Revenue/EBITDA 2019 Adj. 2019 FCF 2019 YoY Growth EBITDA Margin Margin¹ 60% / 32% 33% 44% Franchisees pay Minimal requirements for Strong margins driven by steady, 100% of studio CapEx enable rapidly recurring monthly franchise fees 2 buildout expanding footprint and other monthlies 18 1 2 (Adj. EBITDA – Capex)/Revenue used as a proxy for FCF Margin. Capex includes purchases of property and equipment, and intangible assets. Includes intranet, email and website costs.ASSET-LIGHT MODEL DRIVING ASSET–LIGHT RAPID GROWTH STRONG PROFITABILITY Revenue/EBITDA 2019 Adj. 2019 FCF 2019 YoY Growth EBITDA Margin Margin¹ 60% / 32% 33% 44% Franchisees pay Minimal requirements for Strong margins driven by steady, 100% of studio CapEx enable rapidly recurring monthly franchise fees 2 buildout expanding footprint and other monthlies 18 1 2 (Adj. EBITDA – Capex)/Revenue used as a proxy for FCF Margin. Capex includes purchases of property and equipment, and intangible assets. Includes intranet, email and website costs.

OUR Multiple Levers to Drive Long-Term Growth 1. 2. 3. 4. 5. 6. 7. Expand US Expand rest of Grow same store Explore new Create new Develop ancillary Support franchise studio footprint world studio sales & transition channels workout plans to product offerings network footprint to revenue-based access new franchise fee demographics model Providing support 7,000+ 16,100+ Opportunity to Outdoor boot camp Kid and Senior Meals, to manage through participate in training, major Programs Supplements, Total US Studio Total Global Studio 1 challenging times system-wide universities, hospitality Apparel, LionHeart Opportunity Opportunity (ex-US 1 and continue sales growth operators, corporations Heart Rate Monitor and AUS) member engagement and military facilities 19 1 Source: Company. Franchise potentials based on current Australia studios per capita. OUR Multiple Levers to Drive Long-Term Growth 1. 2. 3. 4. 5. 6. 7. Expand US Expand rest of Grow same store Explore new Create new Develop ancillary Support franchise studio footprint world studio sales & transition channels workout plans to product offerings network footprint to revenue-based access new franchise fee demographics model Providing support 7,000+ 16,100+ Opportunity to Outdoor boot camp Kid and Senior Meals, to manage through participate in training, major Programs Supplements, Total US Studio Total Global Studio 1 challenging times system-wide universities, hospitality Apparel, LionHeart Opportunity Opportunity (ex-US 1 and continue sales growth operators, corporations Heart Rate Monitor and AUS) member engagement and military facilities 19 1 Source: Company. Franchise potentials based on current Australia studios per capita.

20 2020 20
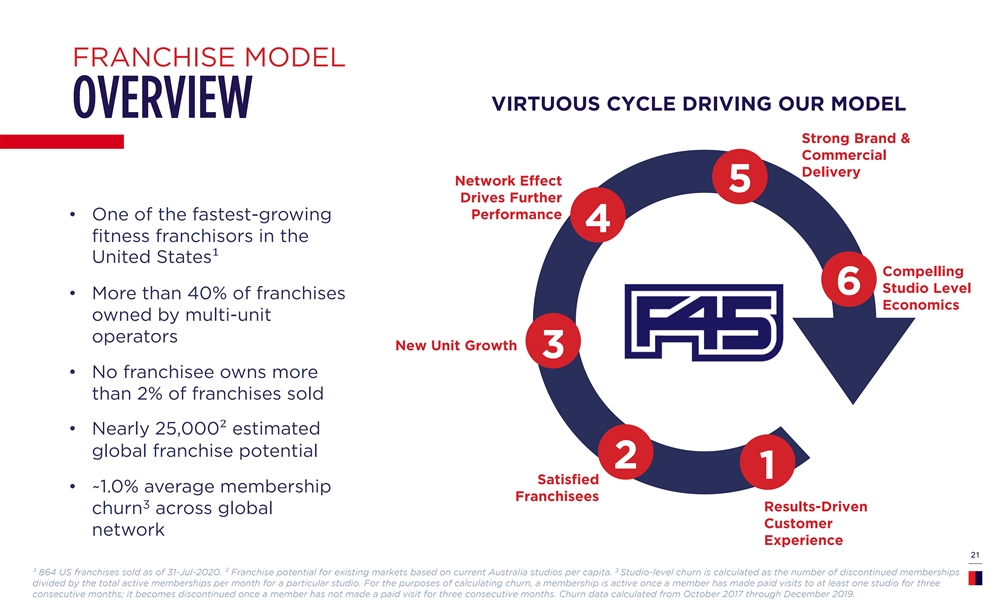
FRANCHISE MODEL VIRTUOUS CYCLE DRIVING OUR MODEL Strong Brand & Commercial Delivery Network Effect 5 Drives Further Performance • One of the fastest-growing 4 fitness franchisors in the United States¹ Compelling Studio Level 6 • More than 40% of franchises Economics owned by multi-unit operators New Unit Growth 3 • No franchisee owns more than 2% of franchises sold • Nearly 25,000² estimated global franchise potential 2 1 Satisfied • ~1.0% average membership Franchisees 3 Results-Driven churn across global Customer network Experience 21 3 ¹ 864 US franchises sold as of 31-Jul-2020. ² Franchise potential for existing markets based on current Australia studios per capita. Studio-level churn is calculated as the number of discontinued memberships divided by the total active memberships per month for a particular studio. For the purposes of calculating churn, a membership is active once a member has made paid visits to at least one studio for three consecutive months; it becomes discontinued once a member has not made a paid visit for three consecutive months. Churn data calculated from October 2017 through December 2019.FRANCHISE MODEL VIRTUOUS CYCLE DRIVING OUR MODEL Strong Brand & Commercial Delivery Network Effect 5 Drives Further Performance • One of the fastest-growing 4 fitness franchisors in the United States¹ Compelling Studio Level 6 • More than 40% of franchises Economics owned by multi-unit operators New Unit Growth 3 • No franchisee owns more than 2% of franchises sold • Nearly 25,000² estimated global franchise potential 2 1 Satisfied • ~1.0% average membership Franchisees 3 Results-Driven churn across global Customer network Experience 21 3 ¹ 864 US franchises sold as of 31-Jul-2020. ² Franchise potential for existing markets based on current Australia studios per capita. Studio-level churn is calculated as the number of discontinued memberships divided by the total active memberships per month for a particular studio. For the purposes of calculating churn, a membership is active once a member has made paid visits to at least one studio for three consecutive months; it becomes discontinued once a member has not made a paid visit for three consecutive months. Churn data calculated from October 2017 through December 2019.
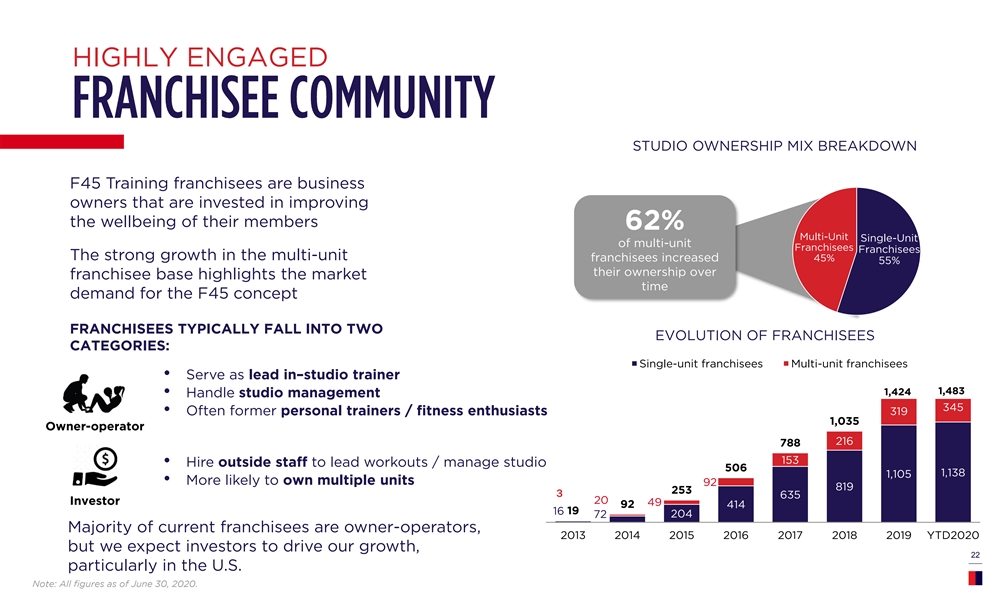
HIGHLY ENGAGED STUDIO OWNERSHIP MIX BREAKDOWN F45 Training franchisees are business owners that are invested in improving the wellbeing of their members 62% Multi-Unit Single-Unit of multi-unit Franchisees Franchisees The strong growth in the multi-unit 45% franchisees increased 55% their ownership over franchisee base highlights the market time demand for the F45 concept FRANCHISEES TYPICALLY FALL INTO TWO EVOLUTION OF FRANCHISEES CATEGORIES: Single-unit franchisees Multi-unit franchisees • Serve as lead in–studio trainer 1,483 1,424 • Handle studio management 345 • Often former personal trainers / fitness enthusiasts 319 1,035 Owner-operator 216 788 153 • Hire outside staff to lead workouts / manage studio 506 1,138 1,105 • More likely to own multiple units 92 819 253 3 635 20 Investor 49 92 414 19 16 72 204 Majority of current franchisees are owner-operators, 2013 2014 2015 2016 2017 2018 2019 YTD2020 but we expect investors to drive our growth, 22 particularly in the U.S. Note: All figures as of June 30, 2020.HIGHLY ENGAGED STUDIO OWNERSHIP MIX BREAKDOWN F45 Training franchisees are business owners that are invested in improving the wellbeing of their members 62% Multi-Unit Single-Unit of multi-unit Franchisees Franchisees The strong growth in the multi-unit 45% franchisees increased 55% their ownership over franchisee base highlights the market time demand for the F45 concept FRANCHISEES TYPICALLY FALL INTO TWO EVOLUTION OF FRANCHISEES CATEGORIES: Single-unit franchisees Multi-unit franchisees • Serve as lead in–studio trainer 1,483 1,424 • Handle studio management 345 • Often former personal trainers / fitness enthusiasts 319 1,035 Owner-operator 216 788 153 • Hire outside staff to lead workouts / manage studio 506 1,138 1,105 • More likely to own multiple units 92 819 253 3 635 20 Investor 49 92 414 19 16 72 204 Majority of current franchisees are owner-operators, 2013 2014 2015 2016 2017 2018 2019 YTD2020 but we expect investors to drive our growth, 22 particularly in the U.S. Note: All figures as of June 30, 2020.

PREDICTIVE DEVELOPMENT MODEL DRIVEN BY F45 manages a sophisticated, repeatable sales process that has resulted in average monthly global sales of 45 franchises per month LARGE MARKET OPPORTUNITY PREDICTABLE FRANCHISE SALES PROCESS PREDICTABLE ON-TIME REVENUE PROSPECTING QUALIFICATION STAGE Leads are generated using predictable inbound and outbound 1,605 “Marketing Qualified Leads” per methodology. Leads qualified before moving the prospect into the month or 19,255 in the last 12 months discovery stage of the sales process. DISCOVERY STAGE 260 “Sales Qualified Leads” Potential franchisee learns more about F45 through a robust discovery process per month or 3,119 prior to completing the application and interview process. If the prospect is the in the last 12 months right fit, due diligence takes place including review of business model, disclosure documents and then franchise agreements are executed. 41 Franchises Sold / Month CONTRACT SOLD PHASE (LTM) Approximately 2-4% of “Marketing Qualified Leads” become F45 franchisees. Closing typically occurs 3-4 months after first contact Jan-19 Feb-19 Mar-19 Apr-19 May-19 Jun-19 Jul-19 Aug-19 Sep-19 Oct-19 Nov-19 Dec-19 Jan-20 Feb-20 Mar-20 Apr-20 May-20 Jun-20 Jul-20 AVG New 23 1 30 32 15 4 39 69 55 45 Franchise 32 34 43 53 74 81 57 47 65 44 41 47 Sales 1 Figures as of 31-Jul-2020. July franchises sold may increase slightly as establishment fee payments settle.PREDICTIVE DEVELOPMENT MODEL DRIVEN BY F45 manages a sophisticated, repeatable sales process that has resulted in average monthly global sales of 45 franchises per month LARGE MARKET OPPORTUNITY PREDICTABLE FRANCHISE SALES PROCESS PREDICTABLE ON-TIME REVENUE PROSPECTING QUALIFICATION STAGE Leads are generated using predictable inbound and outbound 1,605 “Marketing Qualified Leads” per methodology. Leads qualified before moving the prospect into the month or 19,255 in the last 12 months discovery stage of the sales process. DISCOVERY STAGE 260 “Sales Qualified Leads” Potential franchisee learns more about F45 through a robust discovery process per month or 3,119 prior to completing the application and interview process. If the prospect is the in the last 12 months right fit, due diligence takes place including review of business model, disclosure documents and then franchise agreements are executed. 41 Franchises Sold / Month CONTRACT SOLD PHASE (LTM) Approximately 2-4% of “Marketing Qualified Leads” become F45 franchisees. Closing typically occurs 3-4 months after first contact Jan-19 Feb-19 Mar-19 Apr-19 May-19 Jun-19 Jul-19 Aug-19 Sep-19 Oct-19 Nov-19 Dec-19 Jan-20 Feb-20 Mar-20 Apr-20 May-20 Jun-20 Jul-20 AVG New 23 1 30 32 15 4 39 69 55 45 Franchise 32 34 43 53 74 81 57 47 65 44 41 47 Sales 1 Figures as of 31-Jul-2020. July franchises sold may increase slightly as establishment fee payments settle.

OUR DEDICATED HEADCOUNT BY REGION 3 SALES Europe TEAM HAS 18 5 GROWN Americas 3 Asia FROM 6 Middle East & TO 34 Africa GLOBAL MEMBERS SINCE 5 2019 College, Corporate, & Military 24OUR DEDICATED HEADCOUNT BY REGION 3 SALES Europe TEAM HAS 18 5 GROWN Americas 3 Asia FROM 6 Middle East & TO 34 Africa GLOBAL MEMBERS SINCE 5 2019 College, Corporate, & Military 24
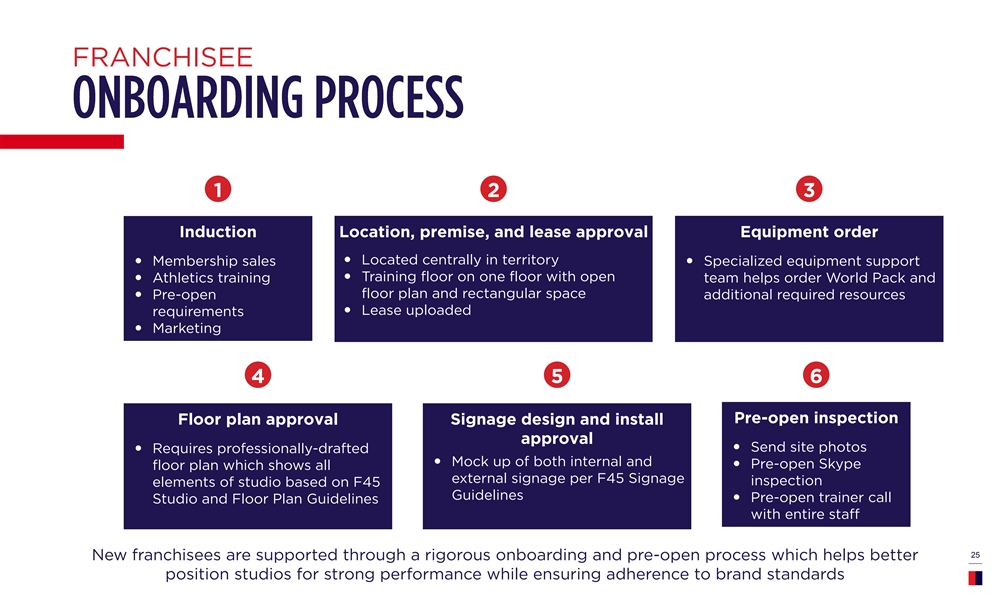
FRANCHISEE 1 2 3 Induction Location, premise, and lease approval Equipment order — Located centrally in territory — Membership sales— Specialized equipment support — Training floor on one floor with open — Athletics training team helps order World Pack and floor plan and rectangular space — Pre-open additional required resources — Lease uploaded requirements — Marketing 4 5 6 Pre-open inspection Floor plan approval Signage design and install approval — Send site photos — Requires professionally-drafted — Mock up of both internal and — Pre-open Skype floor plan which shows all external signage per F45 Signage inspection elements of studio based on F45 Guidelines — Pre-open trainer call Studio and Floor Plan Guidelines with entire staff 25 New franchisees are supported through a rigorous onboarding and pre-open process which helps better position studios for strong performance while ensuring adherence to brand standardsFRANCHISEE 1 2 3 Induction Location, premise, and lease approval Equipment order — Located centrally in territory — Membership sales— Specialized equipment support — Training floor on one floor with open — Athletics training team helps order World Pack and floor plan and rectangular space — Pre-open additional required resources — Lease uploaded requirements — Marketing 4 5 6 Pre-open inspection Floor plan approval Signage design and install approval — Send site photos — Requires professionally-drafted — Mock up of both internal and — Pre-open Skype floor plan which shows all external signage per F45 Signage inspection elements of studio based on F45 Guidelines — Pre-open trainer call Studio and Floor Plan Guidelines with entire staff 25 New franchisees are supported through a rigorous onboarding and pre-open process which helps better position studios for strong performance while ensuring adherence to brand standards

PRE-OPENING & ONGOING SUPPORT Ongoing Franchisee Support Pre-Opening Franchisee Support Property Network HQ Marketing Support • Upon joining the F45 Network, US studios are introduced to the • Connect studios with our Marketing Support function 3 option of working with F45’s preferred broker network months from projected opening • The brokers are up-to-speed with F45’s requirements, have already • Marketing onboards and supports all pre-open studios educated local landlords about F45, and have F45’s studio through the membership marketing program specifications Permit Expeditors HQ Performance Managers • Permits expeditors ensure franchisee’s studios comply with all local • Coach franchisees through pre-open strategy and how to build a regulations successful F45 studio • F45’s preferred GCs are also licensed to work in every state, and • Team provides operations advice to F45 studios in their regions, have good relationships with local permit expeditors including setting performance meetings to train staff on best practices and member retention Signage Providers • Preferred vendors have standard and custom solutions for F45 studios depending on the building requirements, know the F45 compliant colors and sizing, and can handle all city permits needed for the external signage (signage permits are different to building permits) Construction Network • F45’s preferred architects have worked with HQ and know how to 26 prepare plans that general contractors can use effectively, whether the franchisee chooses to work with F45’s GC or their ownPRE-OPENING & ONGOING SUPPORT Ongoing Franchisee Support Pre-Opening Franchisee Support Property Network HQ Marketing Support • Upon joining the F45 Network, US studios are introduced to the • Connect studios with our Marketing Support function 3 option of working with F45’s preferred broker network months from projected opening • The brokers are up-to-speed with F45’s requirements, have already • Marketing onboards and supports all pre-open studios educated local landlords about F45, and have F45’s studio through the membership marketing program specifications Permit Expeditors HQ Performance Managers • Permits expeditors ensure franchisee’s studios comply with all local • Coach franchisees through pre-open strategy and how to build a regulations successful F45 studio • F45’s preferred GCs are also licensed to work in every state, and • Team provides operations advice to F45 studios in their regions, have good relationships with local permit expeditors including setting performance meetings to train staff on best practices and member retention Signage Providers • Preferred vendors have standard and custom solutions for F45 studios depending on the building requirements, know the F45 compliant colors and sizing, and can handle all city permits needed for the external signage (signage permits are different to building permits) Construction Network • F45’s preferred architects have worked with HQ and know how to 26 prepare plans that general contractors can use effectively, whether the franchisee chooses to work with F45’s GC or their own
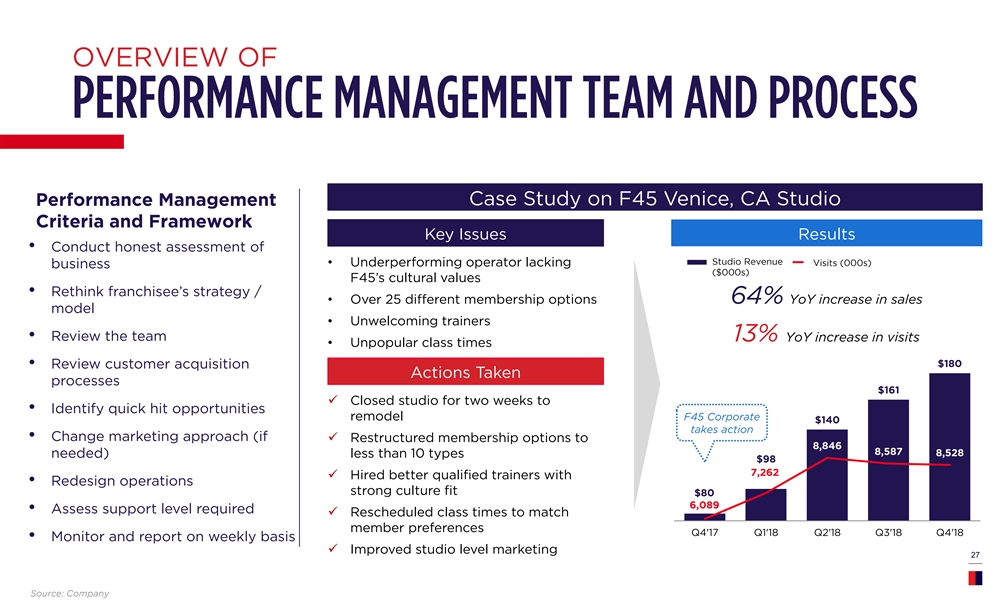
OVERVIEW OF Case Study on F45 Venice, CA Studio Performance Management Criteria and Framework Key Issues Results • Conduct honest assessment of Studio Revenue AUV ($000s) Vi Vsit isitss ( (00000 0s)s) • Underperforming operator lacking business ($000s) F45’s cultural values • Rethink franchisee’s strategy / • Over 25 different membership options 64% YoY increase in sales model • Unwelcoming trainers • Review the team 13% YoY increase in visits • Unpopular class times $180 • Review customer acquisition Actions Taken processes $161 ü Closed studio for two weeks to • Identify quick hit opportunities F45 Corporate remodel $140 takes action • Change marketing approach (if ü Restructured membership options to 8,846 8,587 8,528 needed) less than 10 types $98 7,262 ü Hired better qualified trainers with • Redesign operations strong culture fit $80 6,089 • Assess support level required ü Rescheduled class times to match member preferences Q4'17 Q1'18 Q2'18 Q3'18 Q4'18 • Monitor and report on weekly basis ü Improved studio level marketing 27 Source: CompanyOVERVIEW OF Case Study on F45 Venice, CA Studio Performance Management Criteria and Framework Key Issues Results • Conduct honest assessment of Studio Revenue AUV ($000s) Vi Vsit isitss ( (00000 0s)s) • Underperforming operator lacking business ($000s) F45’s cultural values • Rethink franchisee’s strategy / • Over 25 different membership options 64% YoY increase in sales model • Unwelcoming trainers • Review the team 13% YoY increase in visits • Unpopular class times $180 • Review customer acquisition Actions Taken processes $161 ü Closed studio for two weeks to • Identify quick hit opportunities F45 Corporate remodel $140 takes action • Change marketing approach (if ü Restructured membership options to 8,846 8,587 8,528 needed) less than 10 types $98 7,262 ü Hired better qualified trainers with • Redesign operations strong culture fit $80 6,089 • Assess support level required ü Rescheduled class times to match member preferences Q4'17 Q1'18 Q2'18 Q3'18 Q4'18 • Monitor and report on weekly basis ü Improved studio level marketing 27 Source: Company

28 28 2828 28 28

INTELLIGENT MARKETING We use a wide variety of tools from Google Analytics to Sales CRM Data and Attribution Modeling across all of our marketing tactics (Email, Social, Search and Display) to do the following: Better understand who our target audience is and how to target them Build personas of our highest, fastest converting audiences to target “look-a-like” audiences for future growth Optimize campaigns to serve relevant ads and responsive website content to audiences Target audiences where they are searching and vary content based on that audience Determine budget allocation based on audience interaction and lead funnel attribution 29 29INTELLIGENT MARKETING We use a wide variety of tools from Google Analytics to Sales CRM Data and Attribution Modeling across all of our marketing tactics (Email, Social, Search and Display) to do the following: Better understand who our target audience is and how to target them Build personas of our highest, fastest converting audiences to target “look-a-like” audiences for future growth Optimize campaigns to serve relevant ads and responsive website content to audiences Target audiences where they are searching and vary content based on that audience Determine budget allocation based on audience interaction and lead funnel attribution 29 29

WE INVEST 1 2 3 MEMBERSHIP MARKETING BRAND MARKETING FRANCHISE SALES MARKETING PRE-OPENING TBU to discuss on Social Social Influencer Search • Membership Marketing Monday; Add words to Media Media Marketing Marketing Marketing Campaigns Marketing describe franchisee sales marketing ONGOING • Membership Marketing Sales Earned F45 Earned Programming “showcases” – sales guys Showcases Media Challenge Media doing social and digital ONE-ON-ONE advertising; in – person • Marketing Support sales seminary; majority Marketing Email Local Marketing advertising is social and Partnerships Marketing Partnerships Events digital for franchises 30WE INVEST 1 2 3 MEMBERSHIP MARKETING BRAND MARKETING FRANCHISE SALES MARKETING PRE-OPENING TBU to discuss on Social Social Influencer Search • Membership Marketing Monday; Add words to Media Media Marketing Marketing Marketing Campaigns Marketing describe franchisee sales marketing ONGOING • Membership Marketing Sales Earned F45 Earned Programming “showcases” – sales guys Showcases Media Challenge Media doing social and digital ONE-ON-ONE advertising; in – person • Marketing Support sales seminary; majority Marketing Email Local Marketing advertising is social and Partnerships Marketing Partnerships Events digital for franchises 30

BRAND MARKETING We’ve created a curated training experience driven by technology and supported by community, which drives a powerful brand with broad demographic appeal and a highly passionate member base 31BRAND MARKETING We’ve created a curated training experience driven by technology and supported by community, which drives a powerful brand with broad demographic appeal and a highly passionate member base 31

F45 TRAINING MEDIA OUTLETS ARE ENTHUSIASTIC ABOUT OUR APPROACH TO CHANGING LIVES THROUGH INNOVATION, MOTIVATION AND RESULTS In 2019, we delivered… EARNED MEDIA IMPRESSIONS PRESS PIECES LANDED ADVERTISING VALUE EQUIVALENCY 32F45 TRAINING MEDIA OUTLETS ARE ENTHUSIASTIC ABOUT OUR APPROACH TO CHANGING LIVES THROUGH INNOVATION, MOTIVATION AND RESULTS In 2019, we delivered… EARNED MEDIA IMPRESSIONS PRESS PIECES LANDED ADVERTISING VALUE EQUIVALENCY 32

BRAND MARKETING 33 33BRAND MARKETING 33 33

BRAND MARKETING 34 34BRAND MARKETING 34 34

F45 TRAINING OUR PHYSICAL STUDIOS ARE COMPLEMENTED BY THEIR EVER-EXPANDING SOCIAL COMMUNITIES, WHICH INCLUDE F45 TRAINING MEMBERS, TRAINERS, INFLUENCERS, OWNERS, AND THOSE WHO SIMPLY CONNECT WITH THE F45 TRAINING LIFESTYLE 2019 TOTAL IMPRESSIONS TOTAL FOLLOWERS TOTAL REACH 35F45 TRAINING OUR PHYSICAL STUDIOS ARE COMPLEMENTED BY THEIR EVER-EXPANDING SOCIAL COMMUNITIES, WHICH INCLUDE F45 TRAINING MEMBERS, TRAINERS, INFLUENCERS, OWNERS, AND THOSE WHO SIMPLY CONNECT WITH THE F45 TRAINING LIFESTYLE 2019 TOTAL IMPRESSIONS TOTAL FOLLOWERS TOTAL REACH 35
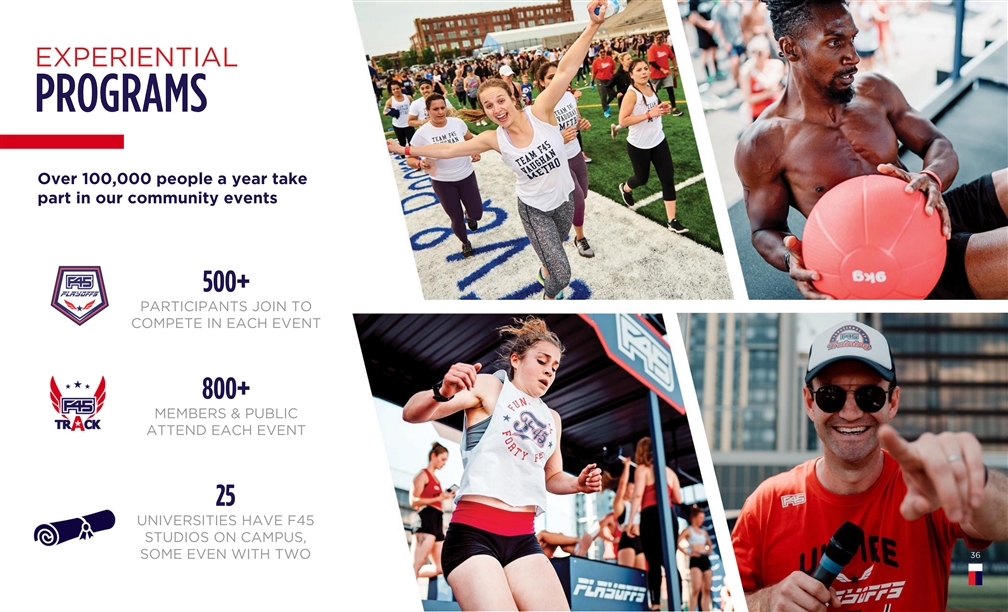
EXPERIENTIAL Over 100,000 people a year take part in our community events PARTICIPANTS JOIN TO COMPETE IN EACH EVENT MEMBERS & PUBLIC ATTEND EACH EVENT UNIVERSITIES HAVE F45 STUDIOS ON CAMPUS, 36 36 SOME EVEN WITH TWO 36EXPERIENTIAL Over 100,000 people a year take part in our community events PARTICIPANTS JOIN TO COMPETE IN EACH EVENT MEMBERS & PUBLIC ATTEND EACH EVENT UNIVERSITIES HAVE F45 STUDIOS ON CAMPUS, 36 36 SOME EVEN WITH TWO 36

PROGRAMS DESIGNED FOR RESULTS The F45 Challenge is a nutrition and training program focused on holistic well- being. The combination of F45’s style of training and the Challenge meal plans is designed to help members transform their lives. 37 37PROGRAMS DESIGNED FOR RESULTS The F45 Challenge is a nutrition and training program focused on holistic well- being. The combination of F45’s style of training and the Challenge meal plans is designed to help members transform their lives. 37 37

PROGRAMS CONT’D. • Global fitness studios• F45 Challenge dashboard• Achieve your goals • Group workouts• Thousands of recipes• Challenge Portal • 45-Day Challenge• Challenge Meals• Challenge App • At-Home workouts• Delivered to your door• Goal tracking 38PROGRAMS CONT’D. • Global fitness studios• F45 Challenge dashboard• Achieve your goals • Group workouts• Thousands of recipes• Challenge Portal • 45-Day Challenge• Challenge Meals• Challenge App • At-Home workouts• Delivered to your door• Goal tracking 38

PROGRAMS CONT’D. DESIGNED FOR RESULTS The F45 Challenge App offers daily workouts, nutritional advice, healthy recipes, goal tracking and the opportunity to participate in our results- delivering, global 45-day Challenge Our on-demand workouts are updated daily, giving your community access to our at-home training – at their convenience. The workouts don’t require equipment, but are fun, seat-inducing and guaranteed to deliver results. • Used by over 800,000 people globally • Nutrition and recipes • Meditation and mindfulness • Wide variety of workouts • Easy to use and accessible • No equipment required 39 39PROGRAMS CONT’D. DESIGNED FOR RESULTS The F45 Challenge App offers daily workouts, nutritional advice, healthy recipes, goal tracking and the opportunity to participate in our results- delivering, global 45-day Challenge Our on-demand workouts are updated daily, giving your community access to our at-home training – at their convenience. The workouts don’t require equipment, but are fun, seat-inducing and guaranteed to deliver results. • Used by over 800,000 people globally • Nutrition and recipes • Meditation and mindfulness • Wide variety of workouts • Easy to use and accessible • No equipment required 39 39

FRANCHISE SALES & MEMBER A Multi-Channel Approach FRANCHISE SALES MARKETING MEMBERSHIP MARKETING We’ve created a performance marketing program focused on targeting and engaging our core audience through a….. strategic marketing strategic pre-open mix to deliver top and open-marketing funnel leads for the mix to deliver top sales team funnel leads for the studio 40FRANCHISE SALES & MEMBER A Multi-Channel Approach FRANCHISE SALES MARKETING MEMBERSHIP MARKETING We’ve created a performance marketing program focused on targeting and engaging our core audience through a….. strategic marketing strategic pre-open mix to deliver top and open-marketing funnel leads for the mix to deliver top sales team funnel leads for the studio 40

41 41 4141 41 41

COVID-19 IMPACT & RESPONSE KEY METRICS (2020 YTD) OVERVIEW JAN FEB MAR APR MAY JUNE JULY • Prior to the global spread of COVID-19, 2020 YTD business performance remained strong and ahead of plan with % of anticipation of a record year Studios 100% 100% 0% 0% 27% 75% 78% 1 • In accordance with local government regulations, ~100% of Open our global studio network closed at the height of COVID-19 Total Visits • In response to studio closures, F45 employed various (YoY 43% 44% (12)% (91)% (83)% (43)% (25)% measures to provide immediate support to our franchisee Growth) base as well as prudently manage cash flow at the corporate level System- — Provided temporary franchise fee relief for franchisees wide Sales 52% 53% 13% (69)% (64)% (30)% (26)% (YoY — Cut operating expenses and reduced monthly cash burn Growth) to ~$1mm New — Furloughed ~25% of corporate staff, reduced 2 Franchises 30 32 15 4 39 69 55 salaries of remaining employees, and cut executive Sold pay by 25-75% — Reduced franchise sales lead-generation spend New Studios 46 37 17 2 8 25 29 rd • As of August 3 , 960 studios (78% of our Pre-COVID-19 Opened franchise network) have since re-opened in accordance with local regulations; these studios are demonstrating 42 positive momentum in weekly visits 1 2 Re-opened studios calculated as % of net re-opened studios as of 31-Jul-2020 divided by pre-COVID-19 studio open figure. Figures as of 31-Jul-2020. July franchises sold may increase slightly as establishment fee payments settle.COVID-19 IMPACT & RESPONSE KEY METRICS (2020 YTD) OVERVIEW JAN FEB MAR APR MAY JUNE JULY • Prior to the global spread of COVID-19, 2020 YTD business performance remained strong and ahead of plan with % of anticipation of a record year Studios 100% 100% 0% 0% 27% 75% 78% 1 • In accordance with local government regulations, ~100% of Open our global studio network closed at the height of COVID-19 Total Visits • In response to studio closures, F45 employed various (YoY 43% 44% (12)% (91)% (83)% (43)% (25)% measures to provide immediate support to our franchisee Growth) base as well as prudently manage cash flow at the corporate level System- — Provided temporary franchise fee relief for franchisees wide Sales 52% 53% 13% (69)% (64)% (30)% (26)% (YoY — Cut operating expenses and reduced monthly cash burn Growth) to ~$1mm New — Furloughed ~25% of corporate staff, reduced 2 Franchises 30 32 15 4 39 69 55 salaries of remaining employees, and cut executive Sold pay by 25-75% — Reduced franchise sales lead-generation spend New Studios 46 37 17 2 8 25 29 rd • As of August 3 , 960 studios (78% of our Pre-COVID-19 Opened franchise network) have since re-opened in accordance with local regulations; these studios are demonstrating 42 positive momentum in weekly visits 1 2 Re-opened studios calculated as % of net re-opened studios as of 31-Jul-2020 divided by pre-COVID-19 studio open figure. Figures as of 31-Jul-2020. July franchises sold may increase slightly as establishment fee payments settle.

ROBUST PROCEDURES F45 has taken a proactive response to COVID-19 to improve safety while bringing the member community back together • Contactless check-in at studios via app • At least two disinfection stations for member and staff use • Rigorous cleaning protocols during and in-between classes as well as nightly cleaning and disinfection • Flexible class formats allow for proper social distancing • Classes that allow for members to complete all workouts in a single station • No heavy fixed equipment / easier to clean and adjust format as needed • Increased time between classes for thorough cleaning • Live events • Track events 43 • Outdoor Boot campsROBUST PROCEDURES F45 has taken a proactive response to COVID-19 to improve safety while bringing the member community back together • Contactless check-in at studios via app • At least two disinfection stations for member and staff use • Rigorous cleaning protocols during and in-between classes as well as nightly cleaning and disinfection • Flexible class formats allow for proper social distancing • Classes that allow for members to complete all workouts in a single station • No heavy fixed equipment / easier to clean and adjust format as needed • Increased time between classes for thorough cleaning • Live events • Track events 43 • Outdoor Boot camps
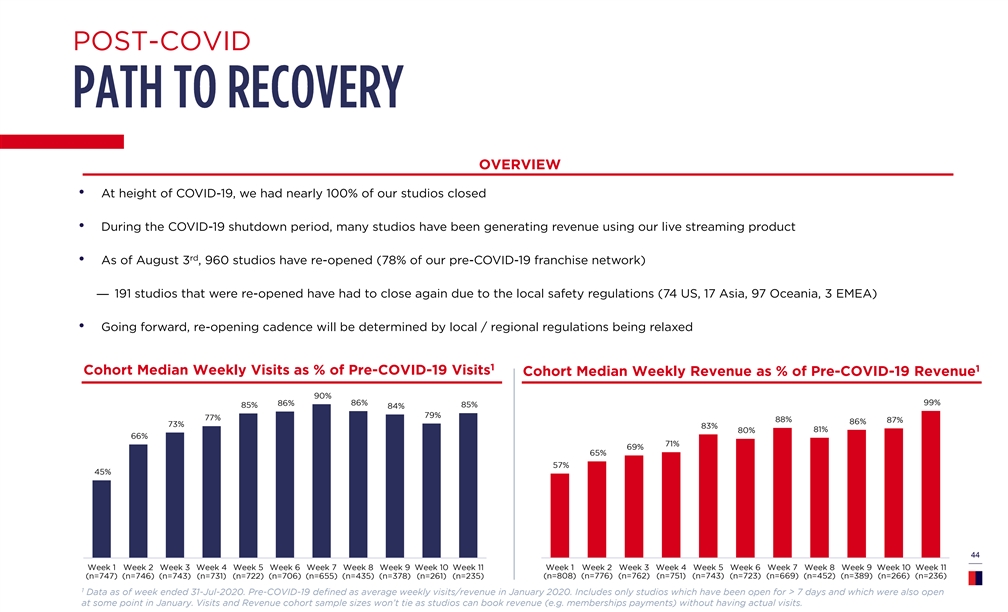
POST-COVID OVERVIEW • At height of COVID-19, we had nearly 100% of our studios closed • During the COVID-19 shutdown period, many studios have been generating revenue using our live streaming product rd • As of August 3 , 960 studios have re-opened (78% of our pre-COVID-19 franchise network) — 191 studios that were re-opened have had to close again due to the local safety regulations (74 US, 17 Asia, 97 Oceania, 3 EMEA) • Going forward, re-opening cadence will be determined by local / regional regulations being relaxed 1 1 Cohort Median Weekly Visits as % of Pre-COVID-19 Visits Cohort Median Weekly Revenue as % of Pre-COVID-19 Revenue 90% 86% 99% 86% 85% 85% 84% 79% 77% 88% 87% 86% 73% 83% 81% 80% 66% 71% 69% 65% 57% 45% 44 Week 1 Week 2 Week 3 Week 4 Week 5 Week 6 Week 7 Week 8 Week 9 Week 10 Week 11 Week 1 Week 2 Week 3 Week 4 Week 5 Week 6 Week 7 Week 8 Week 9 Week 10 Week 11 (n=747) (n=746) (n=743) (n=731) (n=722) (n=706) (n=655) (n=435) (n=378) (n=261) (n=235) (n=808) (n=776) (n=762) (n=751) (n=743) (n=723) (n=669) (n=452) (n=389) (n=266) (n=236) 1 Data as of week ended 31-Jul-2020. Pre-COVID-19 defined as average weekly visits/revenue in January 2020. Includes only studios which have been open for > 7 days and which were also open at some point in January. Visits and Revenue cohort sample sizes won’t tie as studios can book revenue (e.g. memberships payments) without having actual visits.POST-COVID OVERVIEW • At height of COVID-19, we had nearly 100% of our studios closed • During the COVID-19 shutdown period, many studios have been generating revenue using our live streaming product rd • As of August 3 , 960 studios have re-opened (78% of our pre-COVID-19 franchise network) — 191 studios that were re-opened have had to close again due to the local safety regulations (74 US, 17 Asia, 97 Oceania, 3 EMEA) • Going forward, re-opening cadence will be determined by local / regional regulations being relaxed 1 1 Cohort Median Weekly Visits as % of Pre-COVID-19 Visits Cohort Median Weekly Revenue as % of Pre-COVID-19 Revenue 90% 86% 99% 86% 85% 85% 84% 79% 77% 88% 87% 86% 73% 83% 81% 80% 66% 71% 69% 65% 57% 45% 44 Week 1 Week 2 Week 3 Week 4 Week 5 Week 6 Week 7 Week 8 Week 9 Week 10 Week 11 Week 1 Week 2 Week 3 Week 4 Week 5 Week 6 Week 7 Week 8 Week 9 Week 10 Week 11 (n=747) (n=746) (n=743) (n=731) (n=722) (n=706) (n=655) (n=435) (n=378) (n=261) (n=235) (n=808) (n=776) (n=762) (n=751) (n=743) (n=723) (n=669) (n=452) (n=389) (n=266) (n=236) 1 Data as of week ended 31-Jul-2020. Pre-COVID-19 defined as average weekly visits/revenue in January 2020. Includes only studios which have been open for > 7 days and which were also open at some point in January. Visits and Revenue cohort sample sizes won’t tie as studios can book revenue (e.g. memberships payments) without having actual visits.

STUDIO-LEVEL P&L ILLUSTRATIVE STUDIO-LEVEL RESILIENT MODEL OFFERING SUSTAINED PROFITABILITY OPERATING INCOME BREAKDOWN PRE-COVID-19 ($000s) Operating Income Sensitivity $117 OPERATING INCOME $ 364 0% 10% 20% 30% 40% $ 247 Other Franchise Fees ($247) $ 117 $ 81 $ 45 $ 9 $(27) Wages • Assumes wages (which are variable) remain static Rent 2 1 2 • Historically, studios only needed ~75 members to break-even AUV OpEx 78% of Studios have re-opened, and by week 5, reaching 85% of their pre-COVID-19 AUVs 45 1 2 Represents average year 3 AUV as of Jun-2020. Illustrative OpEx values based on Franchisee Survey Data. Franchise Fees based on blended average of franchise fees by region based on total studios open FY2019 (Asia – 9%, Australia – 51%, Ireland – 5%, Canada – 7% and United States – 28%). “Other” operating expenses include, but are not limited to internet, email, website fees as well as other normal business expenses not payable to F45 2 corporate. Varies by geography due to localized class pricing and varying OpEx.STUDIO-LEVEL P&L ILLUSTRATIVE STUDIO-LEVEL RESILIENT MODEL OFFERING SUSTAINED PROFITABILITY OPERATING INCOME BREAKDOWN PRE-COVID-19 ($000s) Operating Income Sensitivity $117 OPERATING INCOME $ 364 0% 10% 20% 30% 40% $ 247 Other Franchise Fees ($247) $ 117 $ 81 $ 45 $ 9 $(27) Wages • Assumes wages (which are variable) remain static Rent 2 1 2 • Historically, studios only needed ~75 members to break-even AUV OpEx 78% of Studios have re-opened, and by week 5, reaching 85% of their pre-COVID-19 AUVs 45 1 2 Represents average year 3 AUV as of Jun-2020. Illustrative OpEx values based on Franchisee Survey Data. Franchise Fees based on blended average of franchise fees by region based on total studios open FY2019 (Asia – 9%, Australia – 51%, Ireland – 5%, Canada – 7% and United States – 28%). “Other” operating expenses include, but are not limited to internet, email, website fees as well as other normal business expenses not payable to F45 2 corporate. Varies by geography due to localized class pricing and varying OpEx.

46 4646 46

SUMMARY OF OUR 47SUMMARY OF OUR 47
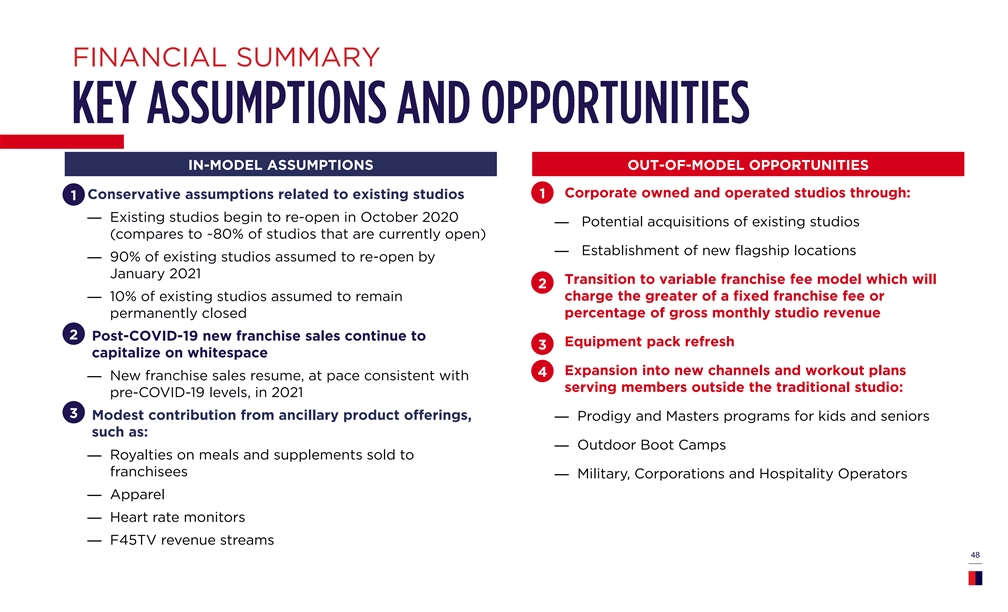
FINANCIAL SUMMARY IN-MODEL ASSUMPTIONS OUT-OF-MODEL OPPORTUNITIES 1 Corporate owned and operated studios through: Conservative assumptions related to existing studios 1 — Existing studios begin to re-open in October 2020 — Potential acquisitions of existing studios (compares to ~80% of studios that are currently open) — Establishment of new flagship locations — 90% of existing studios assumed to re-open by January 2021 Transition to variable franchise fee model which will 2 — 10% of existing studios assumed to remain charge the greater of a fixed franchise fee or permanently closed percentage of gross monthly studio revenue 2 • Post-COVID-19 new franchise sales continue to Equipment pack refresh 3 capitalize on whitespace Expansion into new channels and workout plans 4 — New franchise sales resume, at pace consistent with serving members outside the traditional studio: pre-COVID-19 levels, in 2021 3 • Modest contribution from ancillary product offerings, — Prodigy and Masters programs for kids and seniors such as: — Outdoor Boot Camps — Royalties on meals and supplements sold to franchisees — Military, Corporations and Hospitality Operators — Apparel — Heart rate monitors — F45TV revenue streams 48FINANCIAL SUMMARY IN-MODEL ASSUMPTIONS OUT-OF-MODEL OPPORTUNITIES 1 Corporate owned and operated studios through: Conservative assumptions related to existing studios 1 — Existing studios begin to re-open in October 2020 — Potential acquisitions of existing studios (compares to ~80% of studios that are currently open) — Establishment of new flagship locations — 90% of existing studios assumed to re-open by January 2021 Transition to variable franchise fee model which will 2 — 10% of existing studios assumed to remain charge the greater of a fixed franchise fee or permanently closed percentage of gross monthly studio revenue 2 • Post-COVID-19 new franchise sales continue to Equipment pack refresh 3 capitalize on whitespace Expansion into new channels and workout plans 4 — New franchise sales resume, at pace consistent with serving members outside the traditional studio: pre-COVID-19 levels, in 2021 3 • Modest contribution from ancillary product offerings, — Prodigy and Masters programs for kids and seniors such as: — Outdoor Boot Camps — Royalties on meals and supplements sold to franchisees — Military, Corporations and Hospitality Operators — Apparel — Heart rate monitors — F45TV revenue streams 48

OVERVIEW OF Up to $50k Upfront Amortized Over 10 Establishment Fee Upon Contract Execution Franchise Fee years ~$30k Annual Fee Monthly Franchise Fee Monthly Recognized Monthly $25k Franchise Fee at Renewal Fee Upon Contract Renewal Franchisee Renewal Amortized Over 10 years ~$20k Yearly Monthly Other Franchise-Related Marketing, Intranet, Recognized Monthly Fees Email & Website $120k Studio World Pack Upon Delivery, Typically 8 Recognized Upon Equipment and Months After Contract Delivery Technology Execution Variable Sales of Recognized Upon Equipment Refresh & Annually & Ad Hoc as Equipment & Ad Hoc Delivery Replacement Ordered Replacement Sales Variable Sales of F45 Recognized Upon Merchandise, Meals & Upon Delivery Branded Apparel, Delivery Supplements Footwear, Nutrition 49 Note: Impacts of 606 Accounting reflected in recognition column.OVERVIEW OF Up to $50k Upfront Amortized Over 10 Establishment Fee Upon Contract Execution Franchise Fee years ~$30k Annual Fee Monthly Franchise Fee Monthly Recognized Monthly $25k Franchise Fee at Renewal Fee Upon Contract Renewal Franchisee Renewal Amortized Over 10 years ~$20k Yearly Monthly Other Franchise-Related Marketing, Intranet, Recognized Monthly Fees Email & Website $120k Studio World Pack Upon Delivery, Typically 8 Recognized Upon Equipment and Months After Contract Delivery Technology Execution Variable Sales of Recognized Upon Equipment Refresh & Annually & Ad Hoc as Equipment & Ad Hoc Delivery Replacement Ordered Replacement Sales Variable Sales of F45 Recognized Upon Merchandise, Meals & Upon Delivery Branded Apparel, Delivery Supplements Footwear, Nutrition 49 Note: Impacts of 606 Accounting reflected in recognition column.

THE SUCCESS OF OUR MODEL AS DEMONSTRATED BY TOTAL FRANCHISES SOLD TOTAL STUDIOS OPEN 1,997 2,757 2 1,321 1 2,066 1,140 1,892 800 1,274 522 907 2017A 2018A 2019A 2020E 2021E 2017A 2018A 2019A 2020E 2021E REVENUE ($MM) ADJUSTED EBITDA ($MM) $182 $71 $91 $93 3 $31 $60 $58 $50 $21 $24 $91 $33 $25 4 $8 $43 $13 $36 $2 $24 $12 2017A 2018A 2019A 2020E 2021E 2017A 2018A 2019A 2020E 2021E 50 EBITDA Margin 10% 37% 33% 13% 39% Franchise Equipment Source: Company COVID-19 year 1 2 3 4 Pre-COVID-19 forecast total franchises sold: 2,581. Pre-COVID-19 forecast total studios open: 1,800. Pre-COVID-19 forecast revenue: $160mm. Pre-COVID-19 forecast Adj. EBITDA: $67mm.THE SUCCESS OF OUR MODEL AS DEMONSTRATED BY TOTAL FRANCHISES SOLD TOTAL STUDIOS OPEN 1,997 2,757 2 1,321 1 2,066 1,140 1,892 800 1,274 522 907 2017A 2018A 2019A 2020E 2021E 2017A 2018A 2019A 2020E 2021E REVENUE ($MM) ADJUSTED EBITDA ($MM) $182 $71 $91 $93 3 $31 $60 $58 $50 $21 $24 $91 $33 $25 4 $8 $43 $13 $36 $2 $24 $12 2017A 2018A 2019A 2020E 2021E 2017A 2018A 2019A 2020E 2021E 50 EBITDA Margin 10% 37% 33% 13% 39% Franchise Equipment Source: Company COVID-19 year 1 2 3 4 Pre-COVID-19 forecast total franchises sold: 2,581. Pre-COVID-19 forecast total studios open: 1,800. Pre-COVID-19 forecast revenue: $160mm. Pre-COVID-19 forecast Adj. EBITDA: $67mm.

Over 75% of 2021 projected revenue expected to be generated from existing studios and/or previously sold franchises $182 $182 $24 75% of 2021 Revenue $45 $21 (2021 Sold Studios) $91 $67 $137 Franchise Revenue $137 $70 (Studios Sold Prior to 2021) $91 Equipment Revenue 51 Franchise Revenue Equipment Revenue 2021 Revenue Franchise Revenue Equipment Revenue 2021 Revenue 2021 Revenue (Studios Sold Prior (Studios Sold Prior (Studios Sold Prior (2021 Sold Studios) (2021 Sold Studios) to 2021) to 2021) to 2021)Over 75% of 2021 projected revenue expected to be generated from existing studios and/or previously sold franchises $182 $182 $24 75% of 2021 Revenue $45 $21 (2021 Sold Studios) $91 $67 $137 Franchise Revenue $137 $70 (Studios Sold Prior to 2021) $91 Equipment Revenue 51 Franchise Revenue Equipment Revenue 2021 Revenue Franchise Revenue Equipment Revenue 2021 Revenue 2021 Revenue (Studios Sold Prior (Studios Sold Prior (Studios Sold Prior (2021 Sold Studios) (2021 Sold Studios) to 2021) to 2021) to 2021)
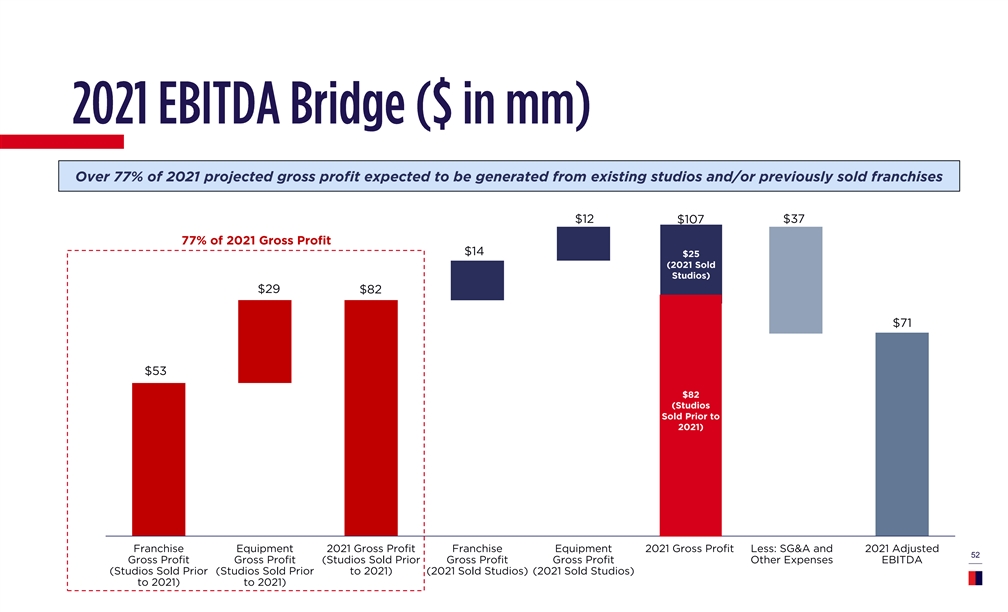
Over 77% of 2021 projected gross profit expected to be generated from existing studios and/or previously sold franchises $12 $107 $37 77% of 2021 Gross Profit $14 $25 (2021 Sold Studios) $29 $82 $71 $53 $82 (Studios Sold Prior to 2021) Franchise Equipment 2021 Gross Profit Franchise Equipment 2021 Gross Profit Less: SG&A and 2021 Adjusted 52 Gross Profit Gross Profit (Studios Sold Prior Gross Profit Gross Profit Other Expenses EBITDA (Studios Sold Prior (Studios Sold Prior to 2021) (2021 Sold Studios) (2021 Sold Studios) to 2021) to 2021)Over 77% of 2021 projected gross profit expected to be generated from existing studios and/or previously sold franchises $12 $107 $37 77% of 2021 Gross Profit $14 $25 (2021 Sold Studios) $29 $82 $71 $53 $82 (Studios Sold Prior to 2021) Franchise Equipment 2021 Gross Profit Franchise Equipment 2021 Gross Profit Less: SG&A and 2021 Adjusted 52 Gross Profit Gross Profit (Studios Sold Prior Gross Profit Gross Profit Other Expenses EBITDA (Studios Sold Prior (Studios Sold Prior to 2021) (2021 Sold Studios) (2021 Sold Studios) to 2021) to 2021)

53 53 5353 53 53

OUR US FOOTPRINT HAS GROWN FASTER +7% $381 +2% 7,000+ $355 544 US MARKET $336 $328 POTENTIAL 492 EXTRAPOLATED +2% BASED ON AUSTRALIA $240 $236 325 STUDIOS PER 5 CAPITA AS 280 PROXY 144 97 1 28 650+ 1 25 853 648 Month 1 Year 1 Year 2 Year 3 Year 4 Studios Open 1 Year: Studios Open 2 Years: Studios Open 3 Years: Australia United States Year 1 AUV Year 2 AUV Year 3 AUV 1 2 4 3 Australia United States Australia United States 54 1 2 Note: AUV Data as of 31-Mar-2020. Represents year over year studio count for Australian geographic entity as of first Australian studio sold May-2013. Represents year over year studio count for US 3 geographic entity as of first US studio sold April-2015. Represents Australia entity’s average Year 1 AUV for studios open 1 year, n = 527; represents average Year 2 AUV for studios open 2 years, n = 462; 4 represents average Year 3 AUV for studio open 3 years, n = 335. Represents United States entity’s average Year 1 AUV for studios open 1 year, n = 194; represents average Year 2 AUV for studios open 2 5 6 years, n = 88; represents average Year 3 AUV for studio open 3 years, n = 25 Based on Australia population estimate of 26mm and US population estimate of 336mm. Represents countries of Australia and the US as of 30-June-2020. OUR US FOOTPRINT HAS GROWN FASTER +7% $381 +2% 7,000+ $355 544 US MARKET $336 $328 POTENTIAL 492 EXTRAPOLATED +2% BASED ON AUSTRALIA $240 $236 325 STUDIOS PER 5 CAPITA AS 280 PROXY 144 97 1 28 650+ 1 25 853 648 Month 1 Year 1 Year 2 Year 3 Year 4 Studios Open 1 Year: Studios Open 2 Years: Studios Open 3 Years: Australia United States Year 1 AUV Year 2 AUV Year 3 AUV 1 2 4 3 Australia United States Australia United States 54 1 2 Note: AUV Data as of 31-Mar-2020. Represents year over year studio count for Australian geographic entity as of first Australian studio sold May-2013. Represents year over year studio count for US 3 geographic entity as of first US studio sold April-2015. Represents Australia entity’s average Year 1 AUV for studios open 1 year, n = 527; represents average Year 2 AUV for studios open 2 years, n = 462; 4 represents average Year 3 AUV for studio open 3 years, n = 335. Represents United States entity’s average Year 1 AUV for studios open 1 year, n = 194; represents average Year 2 AUV for studios open 2 5 6 years, n = 88; represents average Year 3 AUV for studio open 3 years, n = 25 Based on Australia population estimate of 26mm and US population estimate of 336mm. Represents countries of Australia and the US as of 30-June-2020.
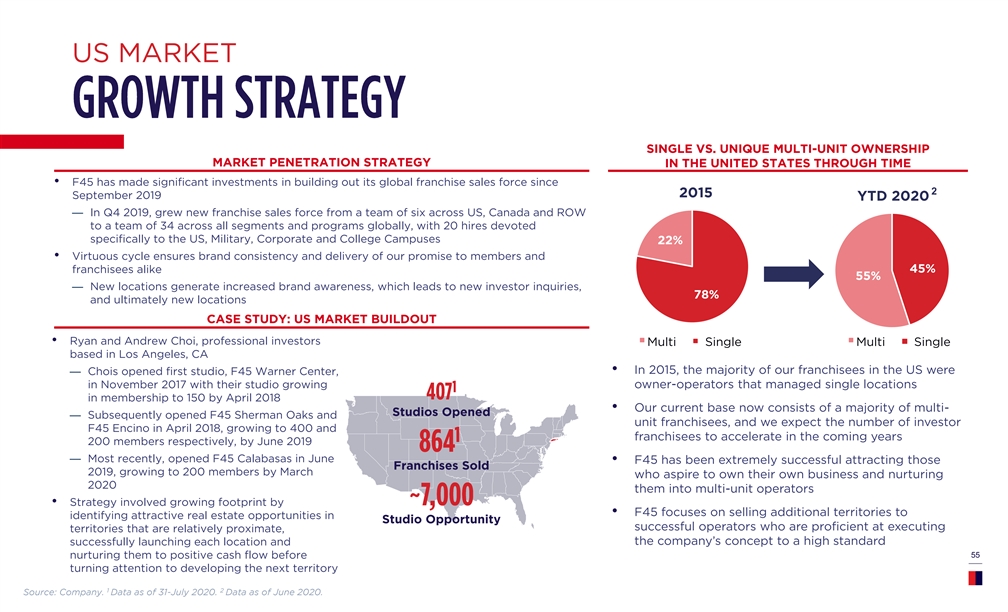
US MARKET SINGLE VS. UNIQUE MULTI-UNIT OWNERSHIP MARKET PENETRATION STRATEGY IN THE UNITED STATES THROUGH TIME • F45 has made significant investments in building out its global franchise sales force since 2 2015 September 2019 YTD 2020 — In Q4 2019, grew new franchise sales force from a team of six across US, Canada and ROW to a team of 34 across all segments and programs globally, with 20 hires devoted specifically to the US, Military, Corporate and College Campuses 22% • Virtuous cycle ensures brand consistency and delivery of our promise to members and franchisees alike 45% 55% — New locations generate increased brand awareness, which leads to new investor inquiries, 78% and ultimately new locations CASE STUDY: US MARKET BUILDOUT • Ryan and Andrew Choi, professional investors Multi Single Multi Single Single Multi Single Multi based in Los Angeles, CA • In 2015, the majority of our franchisees in the US were — Chois opened first studio, F45 Warner Center, in November 2017 with their studio growing owner-operators that managed single locations in membership to 150 by April 2018 • Our current base now consists of a majority of multi- Studios Opened — Subsequently opened F45 Sherman Oaks and unit franchisees, and we expect the number of investor F45 Encino in April 2018, growing to 400 and franchisees to accelerate in the coming years 200 members respectively, by June 2019 — Most recently, opened F45 Calabasas in June • F45 has been extremely successful attracting those Franchises Sold 2019, growing to 200 members by March who aspire to own their own business and nurturing 2020 them into multi-unit operators • Strategy involved growing footprint by • F45 focuses on selling additional territories to identifying attractive real estate opportunities in Studio Opportunity successful operators who are proficient at executing territories that are relatively proximate, the company’s concept to a high standard successfully launching each location and 55 nurturing them to positive cash flow before turning attention to developing the next territory 1 2 Source: Company. Data as of 31-July 2020. Data as of June 2020.US MARKET SINGLE VS. UNIQUE MULTI-UNIT OWNERSHIP MARKET PENETRATION STRATEGY IN THE UNITED STATES THROUGH TIME • F45 has made significant investments in building out its global franchise sales force since 2 2015 September 2019 YTD 2020 — In Q4 2019, grew new franchise sales force from a team of six across US, Canada and ROW to a team of 34 across all segments and programs globally, with 20 hires devoted specifically to the US, Military, Corporate and College Campuses 22% • Virtuous cycle ensures brand consistency and delivery of our promise to members and franchisees alike 45% 55% — New locations generate increased brand awareness, which leads to new investor inquiries, 78% and ultimately new locations CASE STUDY: US MARKET BUILDOUT • Ryan and Andrew Choi, professional investors Multi Single Multi Single Single Multi Single Multi based in Los Angeles, CA • In 2015, the majority of our franchisees in the US were — Chois opened first studio, F45 Warner Center, in November 2017 with their studio growing owner-operators that managed single locations in membership to 150 by April 2018 • Our current base now consists of a majority of multi- Studios Opened — Subsequently opened F45 Sherman Oaks and unit franchisees, and we expect the number of investor F45 Encino in April 2018, growing to 400 and franchisees to accelerate in the coming years 200 members respectively, by June 2019 — Most recently, opened F45 Calabasas in June • F45 has been extremely successful attracting those Franchises Sold 2019, growing to 200 members by March who aspire to own their own business and nurturing 2020 them into multi-unit operators • Strategy involved growing footprint by • F45 focuses on selling additional territories to identifying attractive real estate opportunities in Studio Opportunity successful operators who are proficient at executing territories that are relatively proximate, the company’s concept to a high standard successfully launching each location and 55 nurturing them to positive cash flow before turning attention to developing the next territory 1 2 Source: Company. Data as of 31-July 2020. Data as of June 2020.
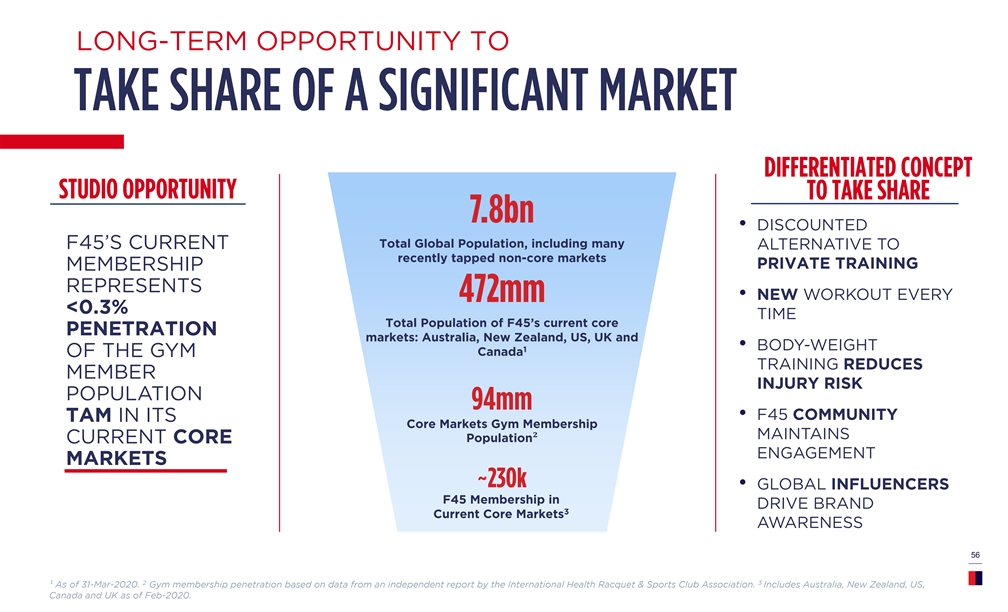
LONG-TERM OPPORTUNITY TO • DISCOUNTED Total Global Population, including many F45’S CURRENT ALTERNATIVE TO recently tapped non-core markets PRIVATE TRAINING MEMBERSHIP REPRESENTS • NEW WORKOUT EVERY <0.3% TIME Total Population of F45’s current core PENETRATION markets: Australia, New Zealand, US, UK and • BODY-WEIGHT 1 Canada OF THE GYM TRAINING REDUCES MEMBER INJURY RISK POPULATION • F45 COMMUNITY TAM IN ITS Core Markets Gym Membership MAINTAINS Population² CURRENT CORE ENGAGEMENT MARKETS • GLOBAL INFLUENCERS F45 Membership in DRIVE BRAND 3 Current Core Markets AWARENESS 56 2 3 ¹ As of 31-Mar-2020. Gym membership penetration based on data from an independent report by the International Health Racquet & Sports Club Association. Includes Australia, New Zealand, US, Canada and UK as of Feb-2020.LONG-TERM OPPORTUNITY TO • DISCOUNTED Total Global Population, including many F45’S CURRENT ALTERNATIVE TO recently tapped non-core markets PRIVATE TRAINING MEMBERSHIP REPRESENTS • NEW WORKOUT EVERY <0.3% TIME Total Population of F45’s current core PENETRATION markets: Australia, New Zealand, US, UK and • BODY-WEIGHT 1 Canada OF THE GYM TRAINING REDUCES MEMBER INJURY RISK POPULATION • F45 COMMUNITY TAM IN ITS Core Markets Gym Membership MAINTAINS Population² CURRENT CORE ENGAGEMENT MARKETS • GLOBAL INFLUENCERS F45 Membership in DRIVE BRAND 3 Current Core Markets AWARENESS 56 2 3 ¹ As of 31-Mar-2020. Gym membership penetration based on data from an independent report by the International Health Racquet & Sports Club Association. Includes Australia, New Zealand, US, Canada and UK as of Feb-2020.

CONTINUE TO GROW SSS AND TRANSITION TO GREATER OF: ILLUSTRATIVE ANNUAL FRANCHISE REVENUE PER FIXED VARIABLE STUDIO ($000) Assuming $500k AUV ~$2,500 ~7.0% $35k Illustrative $5k additional Per month Monthly AUVs revenue Fixed $30k monthly fee Opportunity to expand franchise fees by ~$10mm+ as the franchise base matures 57CONTINUE TO GROW SSS AND TRANSITION TO GREATER OF: ILLUSTRATIVE ANNUAL FRANCHISE REVENUE PER FIXED VARIABLE STUDIO ($000) Assuming $500k AUV ~$2,500 ~7.0% $35k Illustrative $5k additional Per month Monthly AUVs revenue Fixed $30k monthly fee Opportunity to expand franchise fees by ~$10mm+ as the franchise base matures 57
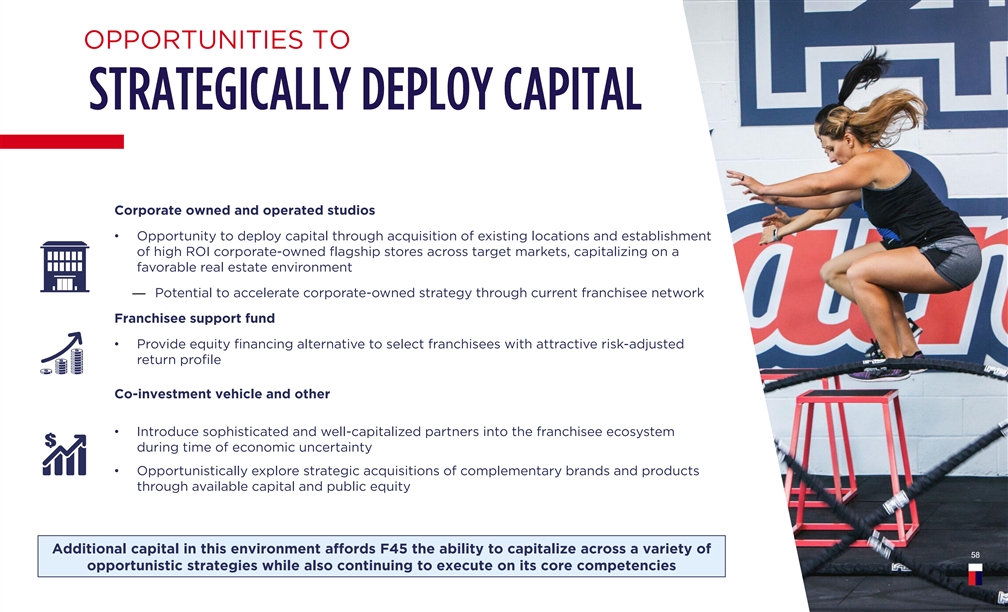
OPPORTUNITIES TO Corporate owned and operated studios • Opportunity to deploy capital through acquisition of existing locations and establishment of high ROI corporate-owned flagship stores across target markets, capitalizing on a favorable real estate environment — Potential to accelerate corporate-owned strategy through current franchisee network Franchisee support fund • Provide equity financing alternative to select franchisees with attractive risk-adjusted return profile Co-investment vehicle and other • Introduce sophisticated and well-capitalized partners into the franchisee ecosystem during time of economic uncertainty • Opportunistically explore strategic acquisitions of complementary brands and products through available capital and public equity Additional capital in this environment affords F45 the ability to capitalize across a variety of 58 58 opportunistic strategies while also continuing to execute on its core competenciesOPPORTUNITIES TO Corporate owned and operated studios • Opportunity to deploy capital through acquisition of existing locations and establishment of high ROI corporate-owned flagship stores across target markets, capitalizing on a favorable real estate environment — Potential to accelerate corporate-owned strategy through current franchisee network Franchisee support fund • Provide equity financing alternative to select franchisees with attractive risk-adjusted return profile Co-investment vehicle and other • Introduce sophisticated and well-capitalized partners into the franchisee ecosystem during time of economic uncertainty • Opportunistically explore strategic acquisitions of complementary brands and products through available capital and public equity Additional capital in this environment affords F45 the ability to capitalize across a variety of 58 58 opportunistic strategies while also continuing to execute on its core competencies

KEY INVESTMENT 1 • F45 has exhibited a steep growth trajectory and predictable, high margin cash flow 2 • F45 has created a low cost, repeatable model that has proven to be one of the best-in-class for franchisees, customers and the Company 3• Post COVID-19 recovery is evolving quicker than projected with strong re-engagement and same- unit growth week-over-week 4• New franchisee sales backlog is building at an increasing pace, giving visibility to sustained growth into next year and beyond 5• F45 should benefit from increased brand awareness, access to equity capital and the 1 private-to-public transition at a 30%-50% discount to its peer group 59 59 1 Based on fully diluted trading multiples as of 31-July-2020 for the following peer set: PLNT, PTON, QSR, DNKN, YUM, DPZ, WEN, MCD, WING, NKE, LULU, OLLI, SBUX, FIVE, FND and SHAK.KEY INVESTMENT 1 • F45 has exhibited a steep growth trajectory and predictable, high margin cash flow 2 • F45 has created a low cost, repeatable model that has proven to be one of the best-in-class for franchisees, customers and the Company 3• Post COVID-19 recovery is evolving quicker than projected with strong re-engagement and same- unit growth week-over-week 4• New franchisee sales backlog is building at an increasing pace, giving visibility to sustained growth into next year and beyond 5• F45 should benefit from increased brand awareness, access to equity capital and the 1 private-to-public transition at a 30%-50% discount to its peer group 59 59 1 Based on fully diluted trading multiples as of 31-July-2020 for the following peer set: PLNT, PTON, QSR, DNKN, YUM, DPZ, WEN, MCD, WING, NKE, LULU, OLLI, SBUX, FIVE, FND and SHAK.
THANK 60 60 60THANK 60 60 60

Appendix : SUPPLEMENTAL MATERIALS 61Appendix : SUPPLEMENTAL MATERIALS 61

KEY FRANCHISEE AGREEMENT KEY TERMS & CONDITIONS OF F45 FRANCHISE LICENSE Only within the Territory as determined by F45 5 years F45 may refuse to extend if 1) in default or 2) has failed to achieve minimum performance targets Within first 12 months, the Franchisee must achieve annual gross revenues of at least 70% of the average gross revenues of all F45 franchisees who have been operating for at least 12 months The proposed premise must be approved by F45 Franchisee is responsible to acquire / lease the premise to operate the business Equipment pack to be purchased solely from F45 Franchisee must only supply products, goods, material as approved by F45 Franchisee is responsible for actively marketing and promoting the business within the Territory Franchisee agrees to spend no less than $10k for the grand opening of the business Provide access to training programs, marketing plans, promotional materials, and business systems F45 may terminate upon an event of default by the Franchisee Franchisee may only terminate by mutual consent with F45 62KEY FRANCHISEE AGREEMENT KEY TERMS & CONDITIONS OF F45 FRANCHISE LICENSE Only within the Territory as determined by F45 5 years F45 may refuse to extend if 1) in default or 2) has failed to achieve minimum performance targets Within first 12 months, the Franchisee must achieve annual gross revenues of at least 70% of the average gross revenues of all F45 franchisees who have been operating for at least 12 months The proposed premise must be approved by F45 Franchisee is responsible to acquire / lease the premise to operate the business Equipment pack to be purchased solely from F45 Franchisee must only supply products, goods, material as approved by F45 Franchisee is responsible for actively marketing and promoting the business within the Territory Franchisee agrees to spend no less than $10k for the grand opening of the business Provide access to training programs, marketing plans, promotional materials, and business systems F45 may terminate upon an event of default by the Franchisee Franchisee may only terminate by mutual consent with F45 62

OUR MODEL WORKS Flatiron, NYC Greatwood, TX Islington, UK Quarry Bay, Hong Kong Albury, Australia Urban Metropolitan Urban Metropolitan Suburban Opened in January 2018 Opened in November 2016 Opened in March 2017 Opened in January 2018 Opened in December 2016 LTM AUV $1,036 $524 $638 $766 $399 Cumulative CoC 80% 53% 61% 119% 339% Returns Total Visits 104,600+ 62,600+ 66,700+ 80,700+ 91,400+ Avg. Monthly ~3,400 ~2,700 ~2,800 ~2,200 ~2,700 Visits (LTM) 1 $36 $20 $31 $35 One Classû 1 2 One Week $99 $65 $96 $71 $70 Unlimited 63 1 Note: Visitation figures as of May 31, 2020. Annual AUV and Cumulative CoC figures calculated as last 12 months open (pre-COVID-19) as of February 2020. Converted at 1 GBP: 1.26163 USD as of 8-July- 2 2020. Converted a 1 HKD: 0.129028 USD as of 8-July-2020.OUR MODEL WORKS Flatiron, NYC Greatwood, TX Islington, UK Quarry Bay, Hong Kong Albury, Australia Urban Metropolitan Urban Metropolitan Suburban Opened in January 2018 Opened in November 2016 Opened in March 2017 Opened in January 2018 Opened in December 2016 LTM AUV $1,036 $524 $638 $766 $399 Cumulative CoC 80% 53% 61% 119% 339% Returns Total Visits 104,600+ 62,600+ 66,700+ 80,700+ 91,400+ Avg. Monthly ~3,400 ~2,700 ~2,800 ~2,200 ~2,700 Visits (LTM) 1 $36 $20 $31 $35 One Classû 1 2 One Week $99 $65 $96 $71 $70 Unlimited 63 1 Note: Visitation figures as of May 31, 2020. Annual AUV and Cumulative CoC figures calculated as last 12 months open (pre-COVID-19) as of February 2020. Converted at 1 GBP: 1.26163 USD as of 8-July- 2 2020. Converted a 1 HKD: 0.129028 USD as of 8-July-2020.
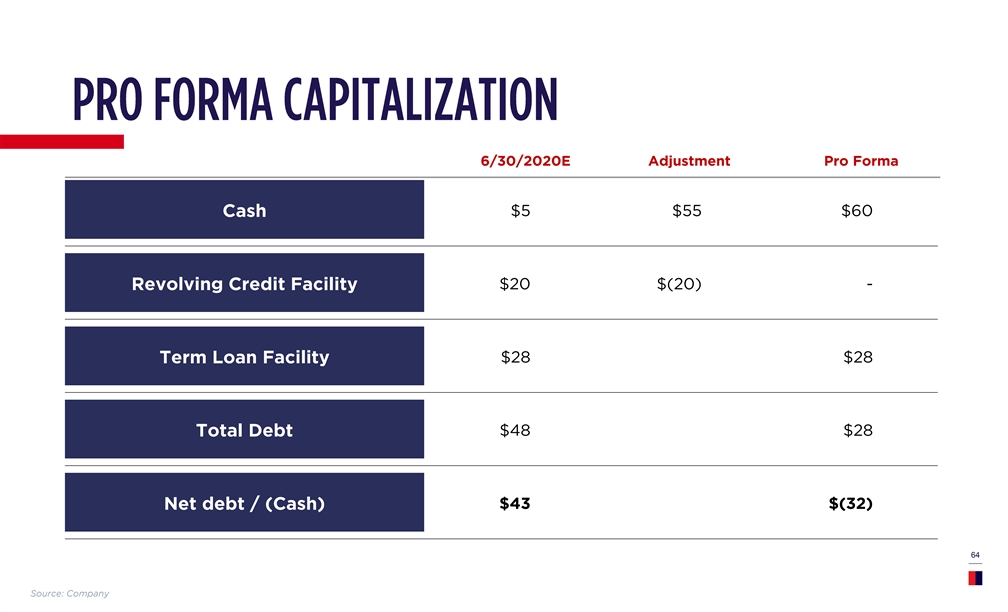
6/30/2020E Adjustment Pro Forma $5 $55 $60 Cash $20 $(20) - Revolving Credit Facility Term Loan Facility $28 $28 $48 $28 Total Debt $43 $(32) Net debt / (Cash) 64 Source: Company6/30/2020E Adjustment Pro Forma $5 $55 $60 Cash $20 $(20) - Revolving Credit Facility Term Loan Facility $28 $28 $48 $28 Total Debt $43 $(32) Net debt / (Cash) 64 Source: Company
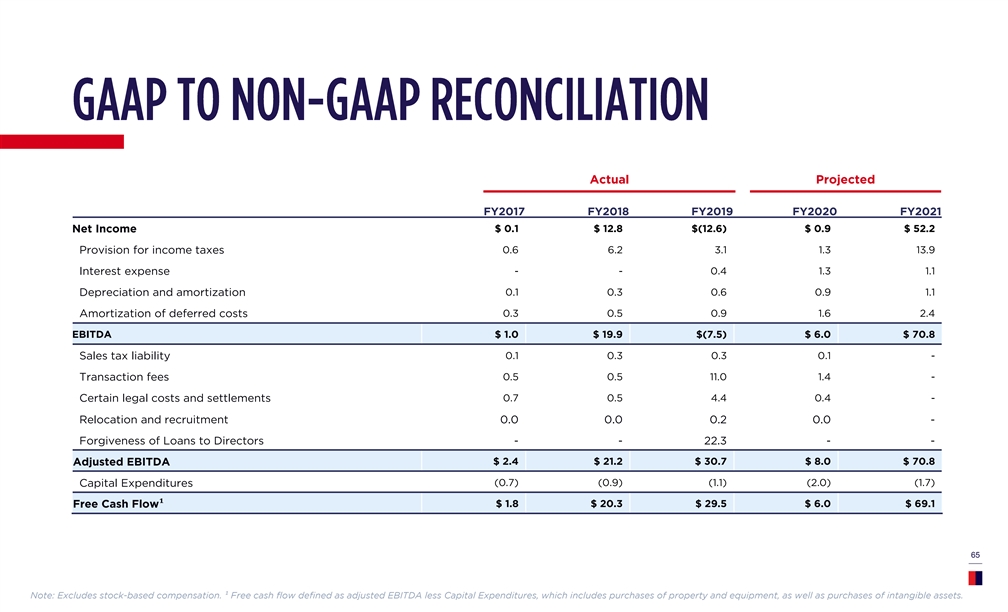
Actual Projected FY2017 FY2018 FY2019 FY2020 FY2021 $ 0.1 $ 12.8 $(12.6) $ 0.9 $ 52.2 Net Income 0.6 6.2 3.1 1.3 13.9 Provision for income taxes Interest expense - - 0.4 1.3 1.1 Depreciation and amortization 0.1 0.3 0.6 0.9 1.1 Amortization of deferred costs 0.3 0.5 0.9 1.6 2.4 EBITDA $ 1.0 $ 19.9 $(7.5) $ 6.0 $ 70.8 0.1 0.3 0.3 0.1 - Sales tax liability 0.5 0.5 11.0 1.4 - Transaction fees 0.7 0.5 4.4 0.4 - Certain legal costs and settlements Relocation and recruitment 0.0 0.0 0.2 0.0 - Forgiveness of Loans to Directors - - 22.3 - - $ 2.4 $ 21.2 $ 30.7 $ 8.0 $ 70.8 Adjusted EBITDA (0.7) (0.9) (1.1) (2.0) (1.7) Capital Expenditures ¹ $ 1.8 $ 20.3 $ 29.5 $ 6.0 $ 69.1 Free Cash Flow 65 Note: Excludes stock-based compensation. ¹ Free cash flow defined as adjusted EBITDA less Capital Expenditures, which includes purchases of property and equipment, as well as purchases of intangible assets.Actual Projected FY2017 FY2018 FY2019 FY2020 FY2021 $ 0.1 $ 12.8 $(12.6) $ 0.9 $ 52.2 Net Income 0.6 6.2 3.1 1.3 13.9 Provision for income taxes Interest expense - - 0.4 1.3 1.1 Depreciation and amortization 0.1 0.3 0.6 0.9 1.1 Amortization of deferred costs 0.3 0.5 0.9 1.6 2.4 EBITDA $ 1.0 $ 19.9 $(7.5) $ 6.0 $ 70.8 0.1 0.3 0.3 0.1 - Sales tax liability 0.5 0.5 11.0 1.4 - Transaction fees 0.7 0.5 4.4 0.4 - Certain legal costs and settlements Relocation and recruitment 0.0 0.0 0.2 0.0 - Forgiveness of Loans to Directors - - 22.3 - - $ 2.4 $ 21.2 $ 30.7 $ 8.0 $ 70.8 Adjusted EBITDA (0.7) (0.9) (1.1) (2.0) (1.7) Capital Expenditures ¹ $ 1.8 $ 20.3 $ 29.5 $ 6.0 $ 69.1 Free Cash Flow 65 Note: Excludes stock-based compensation. ¹ Free cash flow defined as adjusted EBITDA less Capital Expenditures, which includes purchases of property and equipment, as well as purchases of intangible assets.
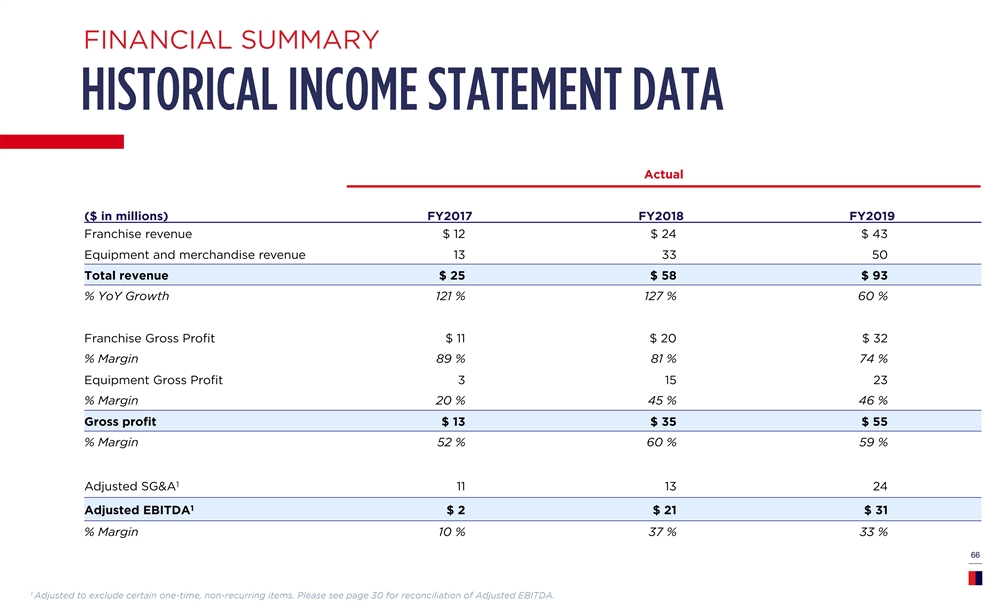
FINANCIAL SUMMARY Actual ($ in millions) FY2017 FY2018 FY2019 Franchise revenue $ 12 $ 24 $ 43 Equipment and merchandise revenue 13 33 50 Total revenue $ 25 $ 58 $ 93 % YoY Growth 121 % 127 % 60 % Franchise Gross Profit $ 11 $ 20 $ 32 % Margin 89 % 81 % 74 % Equipment Gross Profit 3 15 23 % Margin 20 % 45 % 46 % Gross profit $ 13 $ 35 $ 55 % Margin 52 % 60 % 59 % 1 Adjusted SG&A 11 13 24 1 Adjusted EBITDA $ 2 $ 21 $ 31 % Margin 10 % 37 % 33 % 66 1 Adjusted to exclude certain one-time, non-recurring items. Please see page 30 for reconciliation of Adjusted EBITDA.FINANCIAL SUMMARY Actual ($ in millions) FY2017 FY2018 FY2019 Franchise revenue $ 12 $ 24 $ 43 Equipment and merchandise revenue 13 33 50 Total revenue $ 25 $ 58 $ 93 % YoY Growth 121 % 127 % 60 % Franchise Gross Profit $ 11 $ 20 $ 32 % Margin 89 % 81 % 74 % Equipment Gross Profit 3 15 23 % Margin 20 % 45 % 46 % Gross profit $ 13 $ 35 $ 55 % Margin 52 % 60 % 59 % 1 Adjusted SG&A 11 13 24 1 Adjusted EBITDA $ 2 $ 21 $ 31 % Margin 10 % 37 % 33 % 66 1 Adjusted to exclude certain one-time, non-recurring items. Please see page 30 for reconciliation of Adjusted EBITDA.
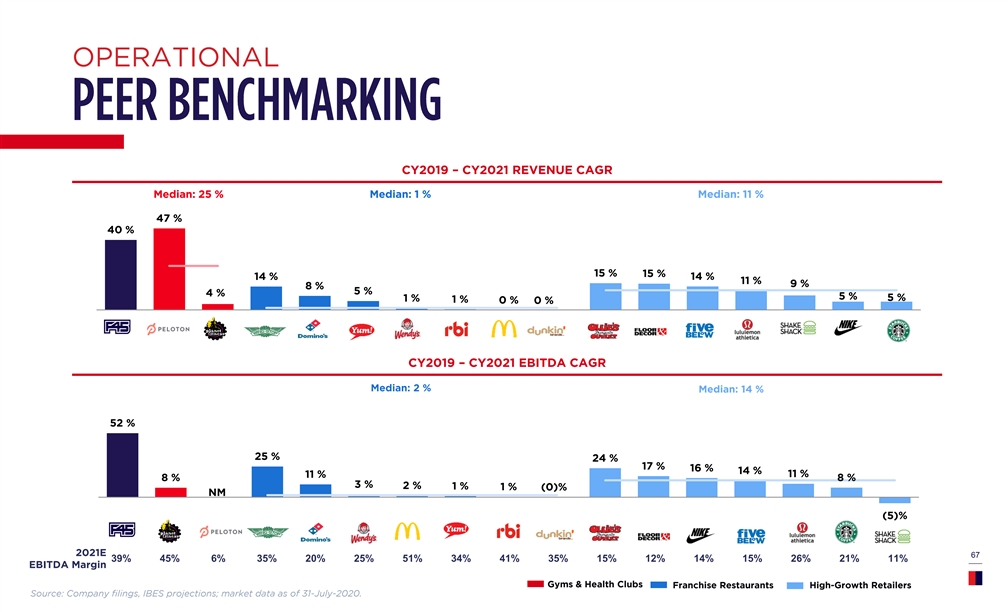
OPERATIONAL CY2019 – CY2021 REVENUE CAGR M Med edi ian: an: 25 25 % % M Med edi ian: an: 1 1 % % M Med edi ian: an: 11 11 % % 47 % 40 % 15 % 15 % 14 % 14 % 11 % 9 % 8 % 5 % 4 % 5 % 5 % 1 % 1 % 0 % 0 % CY2019 – CY2021 EBITDA CAGR Median: 2 % Median: 14 % 52 % 25 % 24 % 17 % 16 % 14 % 11 % 11 % 8 % 8 % 3 % 2 % 1 % 1 % (0)% NM F45 PLNT PTON WING DPZ WEN MCD YUM QSR DNKN OLLI FND NKE FIVE LULU SBUX SHAK (5)% 2021E 67 39% 45% 6% 35% 20% 25% 51% 34% 41% 35% 15% 12% 14% 15% 26% 21% 11% EBITDA Margin Gyms & Health Clubs Franchise Restaurants High-Growth Retailers Source: Company filings, IBES projections; market data as of 31-July-2020.OPERATIONAL CY2019 – CY2021 REVENUE CAGR M Med edi ian: an: 25 25 % % M Med edi ian: an: 1 1 % % M Med edi ian: an: 11 11 % % 47 % 40 % 15 % 15 % 14 % 14 % 11 % 9 % 8 % 5 % 4 % 5 % 5 % 1 % 1 % 0 % 0 % CY2019 – CY2021 EBITDA CAGR Median: 2 % Median: 14 % 52 % 25 % 24 % 17 % 16 % 14 % 11 % 11 % 8 % 8 % 3 % 2 % 1 % 1 % (0)% NM F45 PLNT PTON WING DPZ WEN MCD YUM QSR DNKN OLLI FND NKE FIVE LULU SBUX SHAK (5)% 2021E 67 39% 45% 6% 35% 20% 25% 51% 34% 41% 35% 15% 12% 14% 15% 26% 21% 11% EBITDA Margin Gyms & Health Clubs Franchise Restaurants High-Growth Retailers Source: Company filings, IBES projections; market data as of 31-July-2020.
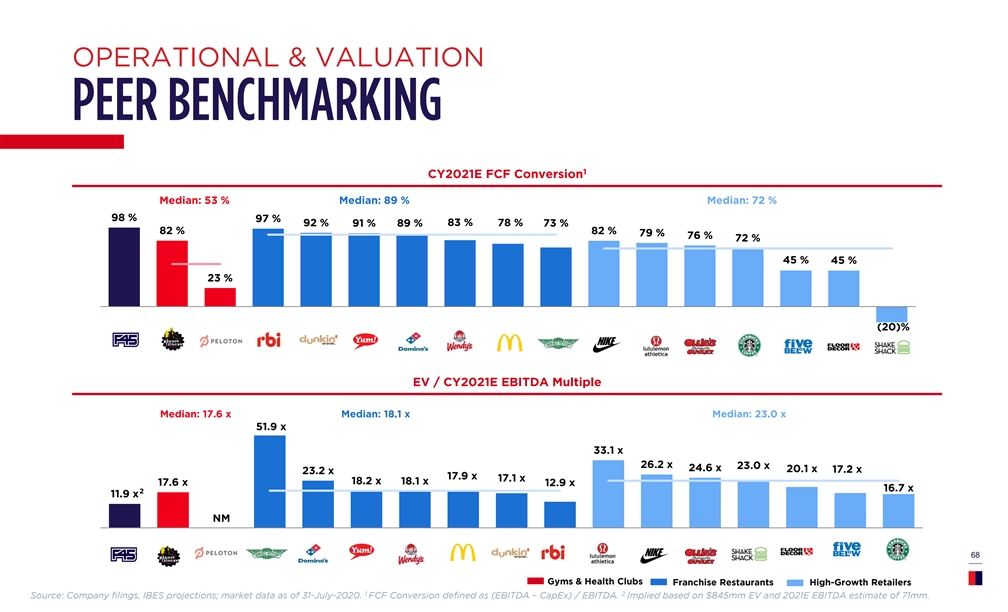
OPERATIONAL & VALUATION 1 CY2021E FCF Conversion Median: 53 % Median: 89 % Median: 72 % 98 % 97 % 92 % 83 % 78 % 91 % 89 % 73 % 82 % 82 % 79 % 76 % 72 % 45 % 45 % 23 % PLNT PTON QSR DNKN YUM DPZ WEN MCD WING NKE LULU OLLI SBUX FIVE FND SHAK (20)% EV / CY2021E EBITDA Multiple Median: 17.6 x Median: 18.1 x Median: 23.0 x 51.9 x 33.1 x 26.2 x 23.0 x 24.6 x 20.1 x 17.2 x 23.2 x 17.9 x 17.1 x 18.2 x 18.1 x 17.6 x 12.9 x 16.7 x 2 11.9 x NM PLNT PTON WING DPZ YUM WEN MCD DNKN QSR LULU NKE OLLI SHAK FND FIVE SBUX 68 Gyms & Health Clubs Franchise Restaurants High-Growth Retailers 1 2 Source: Company filings, IBES projections; market data as of 31-July-2020. FCF Conversion defined as (EBITDA – CapEx) / EBITDA. Implied based on $845mm EV and 2021E EBITDA estimate of 71mm.OPERATIONAL & VALUATION 1 CY2021E FCF Conversion Median: 53 % Median: 89 % Median: 72 % 98 % 97 % 92 % 83 % 78 % 91 % 89 % 73 % 82 % 82 % 79 % 76 % 72 % 45 % 45 % 23 % PLNT PTON QSR DNKN YUM DPZ WEN MCD WING NKE LULU OLLI SBUX FIVE FND SHAK (20)% EV / CY2021E EBITDA Multiple Median: 17.6 x Median: 18.1 x Median: 23.0 x 51.9 x 33.1 x 26.2 x 23.0 x 24.6 x 20.1 x 17.2 x 23.2 x 17.9 x 17.1 x 18.2 x 18.1 x 17.6 x 12.9 x 16.7 x 2 11.9 x NM PLNT PTON WING DPZ YUM WEN MCD DNKN QSR LULU NKE OLLI SHAK FND FIVE SBUX 68 Gyms & Health Clubs Franchise Restaurants High-Growth Retailers 1 2 Source: Company filings, IBES projections; market data as of 31-July-2020. FCF Conversion defined as (EBITDA – CapEx) / EBITDA. Implied based on $845mm EV and 2021E EBITDA estimate of 71mm.