Exhibit 99.2 INVESTOR PRESENTATION January 2021 1Exhibit 99.2 INVESTOR PRESENTATION January 2021 1

Disclaimer This Management Presentation (this “Presentation”) has been prepared by LiveVox, Inc. and its affiliates (collectively, “LiveVox” or “Company”) and Crescent Acquisition Corp (“Crescent”) in connection with a proposed business combination involving Crescent and LiveVox as further described herein (the “Transaction”). This Presentation is for informational purposes only and does not constitute an offer or invitation for the sale or purchase of securities, assets or the business described herein or a commitment to Crescent or LiveVox with respect to any of the foregoing, and this Presentation shall not form the basis of any contract, nor is it a solicitation of any vote, consent, or approval in any jurisdiction pursuant to or in connection with the Transaction or otherwise, nor shall there be any sale, issuance or transfer of securities in any jurisdiction in contravention of applicable law. This Presentation contains certain forward-looking statements within the meaning of Section 27A of the Securities Act and Section 21E of the Exchange Act. These statements may be made directly in this Presentation. Some of the forward-looking statements can be identified by the use of forward-looking words. Statements that are not historical in nature, including the words “anticipate,” “expect,” “suggests,” “plan,” “believe,” “intend,” “estimates,” “targets,” “projects,” “should,” “could,” “would,” “may,” “will,” “forecast” and other similar expressions are intended to identify forward-looking statements. All forward-looking statements are based upon management estimates and forecasts and reflect the views, assumptions, expectations, and opinions of Crescent or LiveVox, as the case may be, as of the date of this Presentation, and may include, without limitation, changes in general economic conditions, including as a result of COVID-19, all of which are accordingly subject to change. Any such estimates, assumptions, expectations, forecasts, views or opinions set forth in this Presentation constitute Crescent’s or LiveVox’s, as the case may be, judgments and should be regarded as indicative, preliminary and for illustrative purposes only. The forward-looking statements and projections contained in this Presentation are subject to a number of factors, risks and uncertainties, some of which are not currently known to Crescent or LiveVox, that may cause Crescent’s or LiveVox’s actual results, performance or financial condition to be materially different from the expectations of future results, performance of financial condition. Although such forward-looking statements have been made in good faith and are based on assumptions that Crescent or LiveVox, as the case may be, believe to be reasonable, there is no assurance that the expected results will be achieved. Crescent’s and LiveVox’s actual results may differ materially from the results discussed in forward-looking statements. Additional information on factors that may cause actual results and Crescent’s performance to differ materially is included in Crescent’s periodic reports filed with the Securities and Exchange Commission (“SEC”), including but not limited to Crescent’s annual report on Form 10-K for the year ended December 31, 2019 and subsequent quarterly reports on Form 10-Q. Copies of Crescent’s filings with the SEC are available publicly on the SEC’s website at www.sec.gov or may be obtained by contacting Crescent. Readers are cautioned not to place undue reliance upon any forward-looking statements, which speak only as of the date made. These forward-looking statements are made only as of the date hereof, and neither Crescent nor LiveVox undertake any obligations to update or revise the forward-looking statements, whether as a result of new information, future events or otherwise, except as required by law. The historical financial data included in this Presentation is subject to audit completion and certain metrics are presented on a pro forma basis to include results of acquired businesses as if such acquisitions had been completed as of January 1 of the applicable year of the acquisition. In addition, this presentation includes references to non-GAAP financial measures, including but not limited to Gross Margin and EBITDA, please see slide 41 for a reconciliation of non-GAAP financial measures. Such non-GAAP measures should be considered only as supplemental to, and not as superior to, financial measures prepared in accordance with GAAP. Additionally, to the extent that forward-looking non-GAAP financial measures are provided, they are presented on a non-GAAP basis without reconciliations of such forward-looking non-GAAP measures due to the inherent difficulty in forecasting and quantifying certain amounts that are necessary for such reconciliation. Certain financial information and projections contained in this Presentation are in draft form and based on internal financial reports as of December 31, 2020. These figures may not include all adjustments required by GAAP under PCAOB standard. Neither Crescent nor LiveVox nor any of their respective directors, officers, employees, advisors, representatives or agents makes any representation or warranty of any kind, express or implied, as to the value that may be realized in connection with the Transaction, the legal, regulatory, tax, financial, accounting or other effects of a Transaction or the accuracy or completeness of the information contained in this Presentation, and none of them shall have any liability based on or arising from, in whole or in part, any information contained in, or omitted from, this Presentation or for any other written or oral communication transmitted to any person or entity in the course of its evaluation of the Transaction. Only those representations and warranties that are expressly made in a definitive written agreement with respect to the Transaction, if executed, and subject to the limitations and restrictions specified therein, shall have any legal effect. This Presentation contains information derived from third party sources, including research, surveys or studies conducted by third parties, information provided by customers and/or industry or general publications. While we believe that such third party information is reliable, we have not independently verified, and make no representation as to the accuracy of, such third party information. This Presentation contains financial forecasts. These projections are for illustrative purposes only and should not be relied upon as being necessarily indicative of future results. Inclusion of the prospective financial information in this presentation should not be regarded as a representation by any person that the results contained in the prospective financial information will be achieved. LTV is calculated as subscription gross margin divided by gross churn. CAC is calculated as trailing twelve months S&M expense divided by quarter 0 subscription revenue annualized less quarter 4 subscription revenue annualized. This Presentation contains references to trademarks and service marks belonging to other entities. Solely for convenience, trademarks and trade names referred to in this presentation may appear without the ® or ™ symbols, but such references are not intended to indicate, in any way, that the applicable licensor will not assert, to the fullest extent under applicable law, its rights to these trademarks and trade names. We do not intend our use or display of other companies’ trade names, trademarks or service marks to imply a relationship with, or endorsement or sponsorship of us by, any other companies. 2Disclaimer This Management Presentation (this “Presentation”) has been prepared by LiveVox, Inc. and its affiliates (collectively, “LiveVox” or “Company”) and Crescent Acquisition Corp (“Crescent”) in connection with a proposed business combination involving Crescent and LiveVox as further described herein (the “Transaction”). This Presentation is for informational purposes only and does not constitute an offer or invitation for the sale or purchase of securities, assets or the business described herein or a commitment to Crescent or LiveVox with respect to any of the foregoing, and this Presentation shall not form the basis of any contract, nor is it a solicitation of any vote, consent, or approval in any jurisdiction pursuant to or in connection with the Transaction or otherwise, nor shall there be any sale, issuance or transfer of securities in any jurisdiction in contravention of applicable law. This Presentation contains certain forward-looking statements within the meaning of Section 27A of the Securities Act and Section 21E of the Exchange Act. These statements may be made directly in this Presentation. Some of the forward-looking statements can be identified by the use of forward-looking words. Statements that are not historical in nature, including the words “anticipate,” “expect,” “suggests,” “plan,” “believe,” “intend,” “estimates,” “targets,” “projects,” “should,” “could,” “would,” “may,” “will,” “forecast” and other similar expressions are intended to identify forward-looking statements. All forward-looking statements are based upon management estimates and forecasts and reflect the views, assumptions, expectations, and opinions of Crescent or LiveVox, as the case may be, as of the date of this Presentation, and may include, without limitation, changes in general economic conditions, including as a result of COVID-19, all of which are accordingly subject to change. Any such estimates, assumptions, expectations, forecasts, views or opinions set forth in this Presentation constitute Crescent’s or LiveVox’s, as the case may be, judgments and should be regarded as indicative, preliminary and for illustrative purposes only. The forward-looking statements and projections contained in this Presentation are subject to a number of factors, risks and uncertainties, some of which are not currently known to Crescent or LiveVox, that may cause Crescent’s or LiveVox’s actual results, performance or financial condition to be materially different from the expectations of future results, performance of financial condition. Although such forward-looking statements have been made in good faith and are based on assumptions that Crescent or LiveVox, as the case may be, believe to be reasonable, there is no assurance that the expected results will be achieved. Crescent’s and LiveVox’s actual results may differ materially from the results discussed in forward-looking statements. Additional information on factors that may cause actual results and Crescent’s performance to differ materially is included in Crescent’s periodic reports filed with the Securities and Exchange Commission (“SEC”), including but not limited to Crescent’s annual report on Form 10-K for the year ended December 31, 2019 and subsequent quarterly reports on Form 10-Q. Copies of Crescent’s filings with the SEC are available publicly on the SEC’s website at www.sec.gov or may be obtained by contacting Crescent. Readers are cautioned not to place undue reliance upon any forward-looking statements, which speak only as of the date made. These forward-looking statements are made only as of the date hereof, and neither Crescent nor LiveVox undertake any obligations to update or revise the forward-looking statements, whether as a result of new information, future events or otherwise, except as required by law. The historical financial data included in this Presentation is subject to audit completion and certain metrics are presented on a pro forma basis to include results of acquired businesses as if such acquisitions had been completed as of January 1 of the applicable year of the acquisition. In addition, this presentation includes references to non-GAAP financial measures, including but not limited to Gross Margin and EBITDA, please see slide 41 for a reconciliation of non-GAAP financial measures. Such non-GAAP measures should be considered only as supplemental to, and not as superior to, financial measures prepared in accordance with GAAP. Additionally, to the extent that forward-looking non-GAAP financial measures are provided, they are presented on a non-GAAP basis without reconciliations of such forward-looking non-GAAP measures due to the inherent difficulty in forecasting and quantifying certain amounts that are necessary for such reconciliation. Certain financial information and projections contained in this Presentation are in draft form and based on internal financial reports as of December 31, 2020. These figures may not include all adjustments required by GAAP under PCAOB standard. Neither Crescent nor LiveVox nor any of their respective directors, officers, employees, advisors, representatives or agents makes any representation or warranty of any kind, express or implied, as to the value that may be realized in connection with the Transaction, the legal, regulatory, tax, financial, accounting or other effects of a Transaction or the accuracy or completeness of the information contained in this Presentation, and none of them shall have any liability based on or arising from, in whole or in part, any information contained in, or omitted from, this Presentation or for any other written or oral communication transmitted to any person or entity in the course of its evaluation of the Transaction. Only those representations and warranties that are expressly made in a definitive written agreement with respect to the Transaction, if executed, and subject to the limitations and restrictions specified therein, shall have any legal effect. This Presentation contains information derived from third party sources, including research, surveys or studies conducted by third parties, information provided by customers and/or industry or general publications. While we believe that such third party information is reliable, we have not independently verified, and make no representation as to the accuracy of, such third party information. This Presentation contains financial forecasts. These projections are for illustrative purposes only and should not be relied upon as being necessarily indicative of future results. Inclusion of the prospective financial information in this presentation should not be regarded as a representation by any person that the results contained in the prospective financial information will be achieved. LTV is calculated as subscription gross margin divided by gross churn. CAC is calculated as trailing twelve months S&M expense divided by quarter 0 subscription revenue annualized less quarter 4 subscription revenue annualized. This Presentation contains references to trademarks and service marks belonging to other entities. Solely for convenience, trademarks and trade names referred to in this presentation may appear without the ® or ™ symbols, but such references are not intended to indicate, in any way, that the applicable licensor will not assert, to the fullest extent under applicable law, its rights to these trademarks and trade names. We do not intend our use or display of other companies’ trade names, trademarks or service marks to imply a relationship with, or endorsement or sponsorship of us by, any other companies. 2
Disclaimer (Cont’d) Important Information about the Transaction and Where to Find It This Presentation may be deemed solicitation material in respect of the Transaction. The Transaction will be submitted to the stockholders of Crescent for their approval. In connection with such stockholder vote, Crescent intends to file with the SEC a preliminary proxy statement on Schedule 14A and, when completed, will mail a definitive proxy statement to its stockholders in connection with Crescent’s solicitation of proxies for the special meeting of the stockholders of Crescent to be held to approve the Transaction. This Presentation does not contain all the information that should be considered concerning the proposed Transaction and the other matters to be voted upon at the annual meeting and is not intended to provide the basis for any investment decision or any other decision in respect of such matters. Crescent’s stockholders and other interested parties are urged to read, when available, the preliminary proxy statement, the amendments thereto, the definitive proxy statement and any other relevant documents that are filed or furnished or will be filed or will be furnished with the SEC carefully and in their entirety in connection with Crescent’s solicitation of proxies for the annual meeting to be held to approve the Transaction and other related matters, as these materials will contain important information about LiveVox and Crescent and the proposed Transaction. The definitive proxy statement will be mailed to the stockholders of Crescent as of the record date to be established for voting on the proposed Transaction and the other matters to be voted upon at the special meeting. Such stockholders will also be able to obtain copies of the proxy statement, without charge, once available, at the SEC’s website at http://ww.sec.gov, at Crescent’s website at http://www.crescentspac.com or by directing a request to Crescent Acquisition Corp, 11100 Santa Monica Blvd., Suite 2000, Los Angeles, CA 90025. Participants in the Solicitation Crescent and LiveVox, and their respective directors and executive officers, may be deemed participants in the solicitation of proxies of Crescent’s stockholders in respect of the Transaction. Information about the directors and executive officers of Crescent is set forth in the Crescent’s Form 10-K for the year ended December 31, 2019. Information about the directors and executive officers of LiveVox and more detailed information regarding the identity of all potential participants, and their direct and indirect interests, by security holdings or otherwise, will be set forth in the proxy statement for the Transaction when available. Additional information regarding the identity of all potential participants in the solicitation of proxies to Crescent stockholders in connection with the proposed Transaction and other matters to be voted upon at the special meeting, and their direct and indirect interests, by security holdings or otherwise, will be included in the proxy statement that Crescent intends to file with the SEC. Investors may obtain such information by ready such proxy statement when it becomes available. 3Disclaimer (Cont’d) Important Information about the Transaction and Where to Find It This Presentation may be deemed solicitation material in respect of the Transaction. The Transaction will be submitted to the stockholders of Crescent for their approval. In connection with such stockholder vote, Crescent intends to file with the SEC a preliminary proxy statement on Schedule 14A and, when completed, will mail a definitive proxy statement to its stockholders in connection with Crescent’s solicitation of proxies for the special meeting of the stockholders of Crescent to be held to approve the Transaction. This Presentation does not contain all the information that should be considered concerning the proposed Transaction and the other matters to be voted upon at the annual meeting and is not intended to provide the basis for any investment decision or any other decision in respect of such matters. Crescent’s stockholders and other interested parties are urged to read, when available, the preliminary proxy statement, the amendments thereto, the definitive proxy statement and any other relevant documents that are filed or furnished or will be filed or will be furnished with the SEC carefully and in their entirety in connection with Crescent’s solicitation of proxies for the annual meeting to be held to approve the Transaction and other related matters, as these materials will contain important information about LiveVox and Crescent and the proposed Transaction. The definitive proxy statement will be mailed to the stockholders of Crescent as of the record date to be established for voting on the proposed Transaction and the other matters to be voted upon at the special meeting. Such stockholders will also be able to obtain copies of the proxy statement, without charge, once available, at the SEC’s website at http://ww.sec.gov, at Crescent’s website at http://www.crescentspac.com or by directing a request to Crescent Acquisition Corp, 11100 Santa Monica Blvd., Suite 2000, Los Angeles, CA 90025. Participants in the Solicitation Crescent and LiveVox, and their respective directors and executive officers, may be deemed participants in the solicitation of proxies of Crescent’s stockholders in respect of the Transaction. Information about the directors and executive officers of Crescent is set forth in the Crescent’s Form 10-K for the year ended December 31, 2019. Information about the directors and executive officers of LiveVox and more detailed information regarding the identity of all potential participants, and their direct and indirect interests, by security holdings or otherwise, will be set forth in the proxy statement for the Transaction when available. Additional information regarding the identity of all potential participants in the solicitation of proxies to Crescent stockholders in connection with the proposed Transaction and other matters to be voted upon at the special meeting, and their direct and indirect interests, by security holdings or otherwise, will be included in the proxy statement that Crescent intends to file with the SEC. Investors may obtain such information by ready such proxy statement when it becomes available. 3
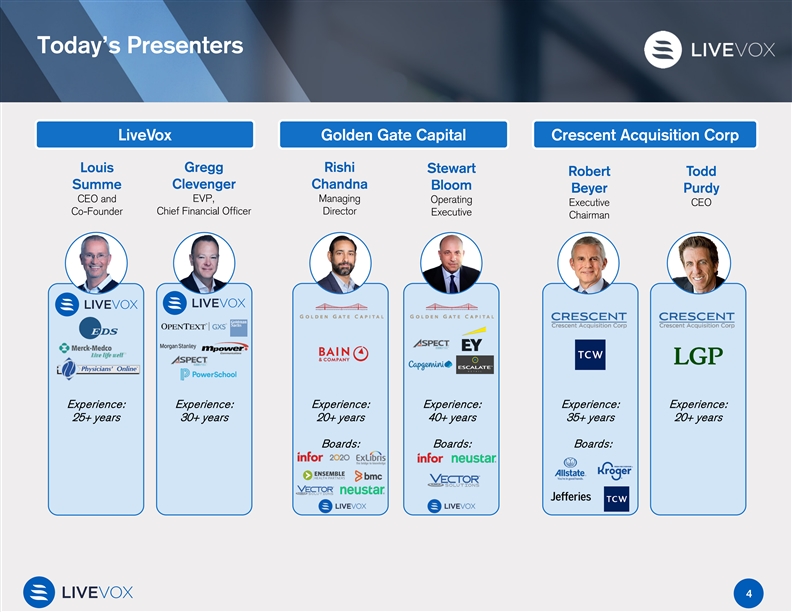
Today’s Presenters LiveVox Golden Gate Capital Crescent Acquisition Corp Louis Gregg Rishi Stewart Robert Todd Summe Clevenger Chandna Bloom Beyer Purdy CEO and EVP, Managing Operating Executive CEO Co-Founder Chief Financial Officer Director Executive Chairman Experience: Experience: Experience: Experience: Experience: Experience: 25+ years 30+ years 20+ years 40+ years 35+ years 20+ years Boards: Boards: Boards: 4Today’s Presenters LiveVox Golden Gate Capital Crescent Acquisition Corp Louis Gregg Rishi Stewart Robert Todd Summe Clevenger Chandna Bloom Beyer Purdy CEO and EVP, Managing Operating Executive CEO Co-Founder Chief Financial Officer Director Executive Chairman Experience: Experience: Experience: Experience: Experience: Experience: 25+ years 30+ years 20+ years 40+ years 35+ years 20+ years Boards: Boards: Boards: 4
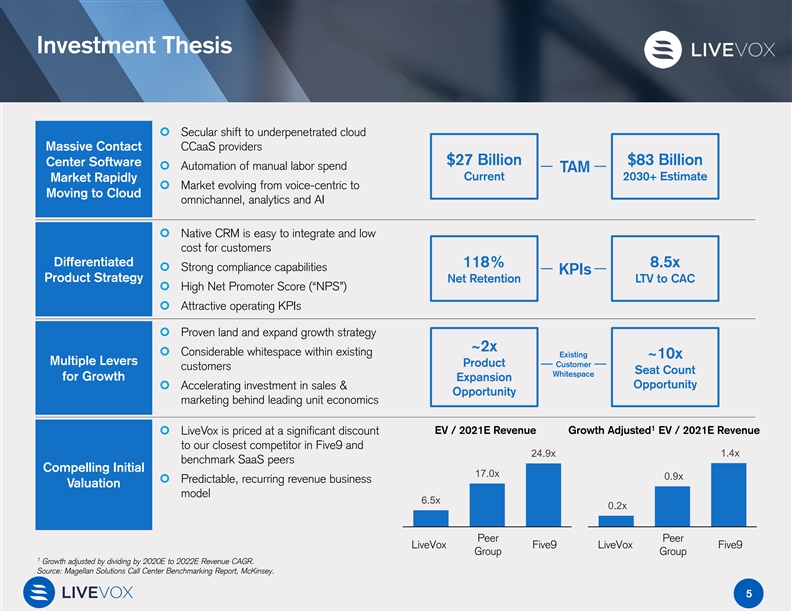
Investment Thesis ¢ Secular shift to underpenetrated cloud CCaaS providers Massive Contact $27 Billion $83 Billion Center Software ¢ Automation of manual labor spend TAM Current 2030+ Estimate Market Rapidly ¢ Market evolving from voice-centric to Moving to Cloud omnichannel, analytics and AI ¢ Native CRM is easy to integrate and low cost for customers Differentiated 118% 8.5x ¢ Strong compliance capabilities KPIs Product Strategy Net Retention LTV to CAC ¢ High Net Promoter Score (“NPS”) ¢ Attractive operating KPIs ¢ Proven land and expand growth strategy ~2x ¢ Considerable whitespace within existing Existing ~10x Multiple Levers Product Customer customers Seat Count Whitespace for Growth Expansion Opportunity ¢ Accelerating investment in sales & Opportunity marketing behind leading unit economics 1 EV / 2021E Revenue Growth Adjusted EV / 2021E Revenue ¢ LiveVox is priced at a significant discount to our closest competitor in Five9 and 24.9x 1.4x benchmark SaaS peers Compelling Initial 17.0x 0.9x ¢ Predictable, recurring revenue business Valuation model 6.5x 0.2x Peer Peer LiveVox Five9 LiveVox Five9 Group Group 1 Growth adjusted by dividing by 2020E to 2022E Revenue CAGR. Source: Magellan Solutions Call Center Benchmarking Report, McKinsey. 5Investment Thesis ¢ Secular shift to underpenetrated cloud CCaaS providers Massive Contact $27 Billion $83 Billion Center Software ¢ Automation of manual labor spend TAM Current 2030+ Estimate Market Rapidly ¢ Market evolving from voice-centric to Moving to Cloud omnichannel, analytics and AI ¢ Native CRM is easy to integrate and low cost for customers Differentiated 118% 8.5x ¢ Strong compliance capabilities KPIs Product Strategy Net Retention LTV to CAC ¢ High Net Promoter Score (“NPS”) ¢ Attractive operating KPIs ¢ Proven land and expand growth strategy ~2x ¢ Considerable whitespace within existing Existing ~10x Multiple Levers Product Customer customers Seat Count Whitespace for Growth Expansion Opportunity ¢ Accelerating investment in sales & Opportunity marketing behind leading unit economics 1 EV / 2021E Revenue Growth Adjusted EV / 2021E Revenue ¢ LiveVox is priced at a significant discount to our closest competitor in Five9 and 24.9x 1.4x benchmark SaaS peers Compelling Initial 17.0x 0.9x ¢ Predictable, recurring revenue business Valuation model 6.5x 0.2x Peer Peer LiveVox Five9 LiveVox Five9 Group Group 1 Growth adjusted by dividing by 2020E to 2022E Revenue CAGR. Source: Magellan Solutions Call Center Benchmarking Report, McKinsey. 5
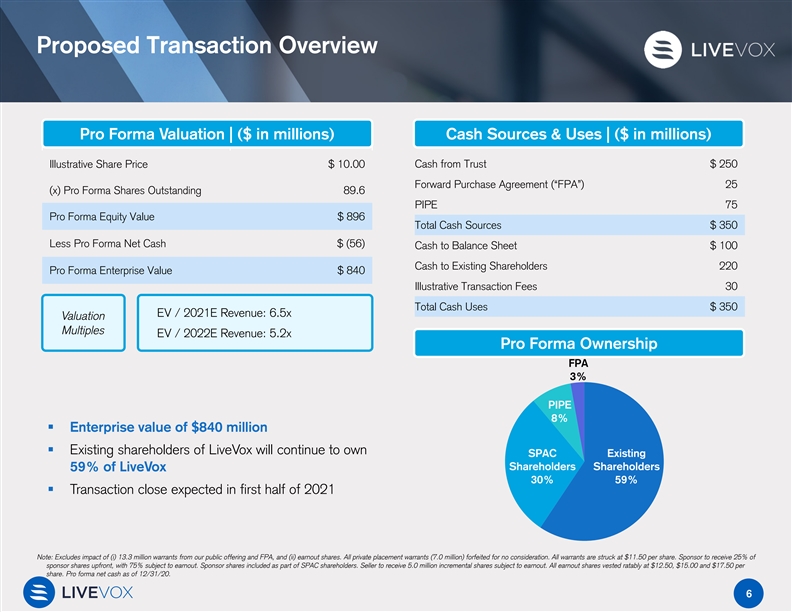
Proposed Transaction Overview Pro Forma Valuation | ($ in millions) Cash Sources & Uses | ($ in millions) Illustrative Share Price $ 10.00 Cash from Trust $ 250 Forward Purchase Agreement (“FPA”) 25 (x) Pro Forma Shares Outstanding 89.6 PIPE 75 Pro Forma Equity Value $ 896 Total Cash Sources $ 350 Less Pro Forma Net Cash $ (56) Cash to Balance Sheet $ 100 Cash to Existing Shareholders 220 Pro Forma Enterprise Value $ 840 Illustrative Transaction Fees 30 Total Cash Uses $ 350 EV / 2021E Revenue: 6.5x Valuation Multiples EV / 2022E Revenue: 5.2x Pro Forma Ownership FPA 3% PIPE 8% § Enterprise value of $840 million § Existing shareholders of LiveVox will continue to own SPAC Existing Shareholders Shareholders 59% of LiveVox 30% 59% § Transaction close expected in first half of 2021 Note: Excludes impact of (i) 13.3 million warrants from our public offering and FPA, and (ii) earnout shares. All private placement warrants (7.0 million) forfeited for no consideration. All warrants are struck at $11.50 per share. Sponsor to receive 25% of sponsor shares upfront, with 75% subject to earnout. Sponsor shares included as part of SPAC shareholders. Seller to receive 5.0 million incremental shares subject to earnout. All earnout shares vested ratably at $12.50, $15.00 and $17.50 per share. Pro forma net cash as of 12/31/20. 6Proposed Transaction Overview Pro Forma Valuation | ($ in millions) Cash Sources & Uses | ($ in millions) Illustrative Share Price $ 10.00 Cash from Trust $ 250 Forward Purchase Agreement (“FPA”) 25 (x) Pro Forma Shares Outstanding 89.6 PIPE 75 Pro Forma Equity Value $ 896 Total Cash Sources $ 350 Less Pro Forma Net Cash $ (56) Cash to Balance Sheet $ 100 Cash to Existing Shareholders 220 Pro Forma Enterprise Value $ 840 Illustrative Transaction Fees 30 Total Cash Uses $ 350 EV / 2021E Revenue: 6.5x Valuation Multiples EV / 2022E Revenue: 5.2x Pro Forma Ownership FPA 3% PIPE 8% § Enterprise value of $840 million § Existing shareholders of LiveVox will continue to own SPAC Existing Shareholders Shareholders 59% of LiveVox 30% 59% § Transaction close expected in first half of 2021 Note: Excludes impact of (i) 13.3 million warrants from our public offering and FPA, and (ii) earnout shares. All private placement warrants (7.0 million) forfeited for no consideration. All warrants are struck at $11.50 per share. Sponsor to receive 25% of sponsor shares upfront, with 75% subject to earnout. Sponsor shares included as part of SPAC shareholders. Seller to receive 5.0 million incremental shares subject to earnout. All earnout shares vested ratably at $12.50, $15.00 and $17.50 per share. Pro forma net cash as of 12/31/20. 6
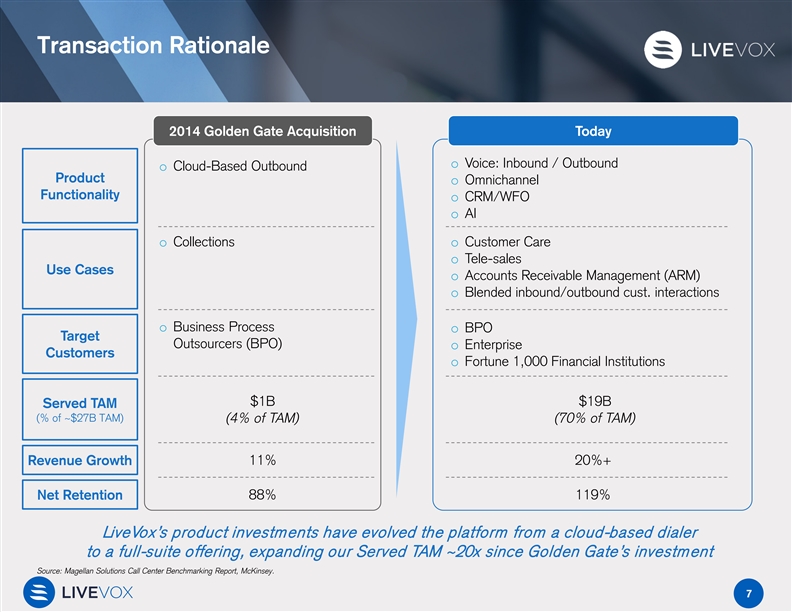
Transaction Rationale 2014 Golden Gate Acquisition Today o Voice: Inbound / Outbound o Cloud-Based Outbound Product o Omnichannel Functionality o CRM/WFO o AI o Collections o Customer Care o Tele-sales Use Cases o Accounts Receivable Management (ARM) o Blended inbound/outbound cust. interactions o Business Process o BPO Target Outsourcers (BPO) o Enterprise Customers o Fortune 1,000 Financial Institutions $1B $19B Served TAM (% of ~$27B TAM) (4% of TAM) (70% of TAM) Revenue Growth 11% 20%+ 88% 119% Net Retention LiveVox’s product investments have evolved the platform from a cloud-based dialer to a full-suite offering, expanding our Served TAM ~20x since Golden Gate’s investment Source: Magellan Solutions Call Center Benchmarking Report, McKinsey. 7Transaction Rationale 2014 Golden Gate Acquisition Today o Voice: Inbound / Outbound o Cloud-Based Outbound Product o Omnichannel Functionality o CRM/WFO o AI o Collections o Customer Care o Tele-sales Use Cases o Accounts Receivable Management (ARM) o Blended inbound/outbound cust. interactions o Business Process o BPO Target Outsourcers (BPO) o Enterprise Customers o Fortune 1,000 Financial Institutions $1B $19B Served TAM (% of ~$27B TAM) (4% of TAM) (70% of TAM) Revenue Growth 11% 20%+ 88% 119% Net Retention LiveVox’s product investments have evolved the platform from a cloud-based dialer to a full-suite offering, expanding our Served TAM ~20x since Golden Gate’s investment Source: Magellan Solutions Call Center Benchmarking Report, McKinsey. 7
LiveVox OverviewLiveVox Overview
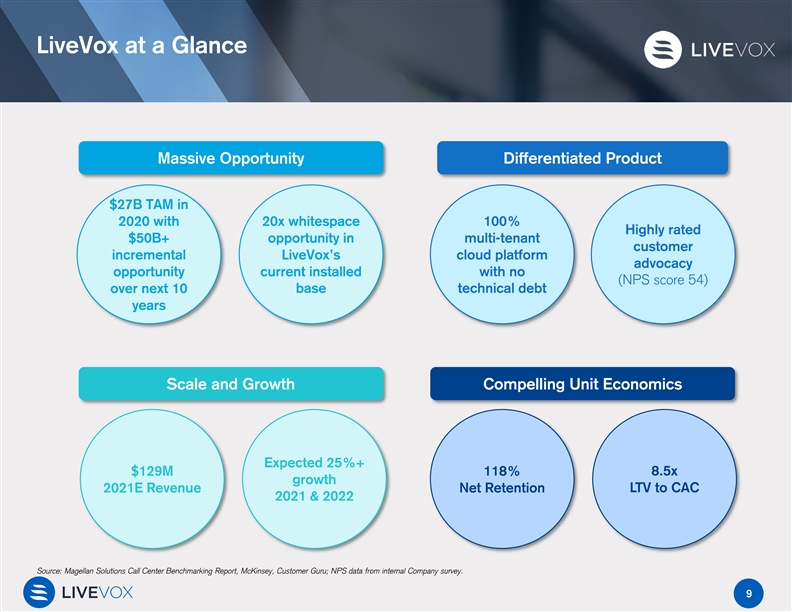
LiveVox at a Glance Massive Opportunity Differentiated Product $27B TAM in 2020 with 20x whitespace 100% Highly rated $50B+ opportunity in multi-tenant customer incremental LiveVox’s cloud platform advocacy opportunity current installed with no (NPS score 54) over next 10 base technical debt years Scale and Growth Compelling Unit Economics Expected 25%+ $129M 118% 8.5x growth LTV to CAC 2021E Revenue Net Retention 2021 & 2022 Source: Magellan Solutions Call Center Benchmarking Report, McKinsey, Customer Guru; NPS data from internal Company survey. 9LiveVox at a Glance Massive Opportunity Differentiated Product $27B TAM in 2020 with 20x whitespace 100% Highly rated $50B+ opportunity in multi-tenant customer incremental LiveVox’s cloud platform advocacy opportunity current installed with no (NPS score 54) over next 10 base technical debt years Scale and Growth Compelling Unit Economics Expected 25%+ $129M 118% 8.5x growth LTV to CAC 2021E Revenue Net Retention 2021 & 2022 Source: Magellan Solutions Call Center Benchmarking Report, McKinsey, Customer Guru; NPS data from internal Company survey. 9

$80+ Billion Opportunity That Is in the Early Innings of a Shift to the Cloud Current TAM is a Fraction of Cloud Drivers the Long-Term Opportunity Contact Center Software TAM $250 Billion Digital transformation of the Total CC Labor Enterprise Spend AI driven analytics increasingly used to support workflow and agents McKinsey believes Automation of manual labor that 22% of $250B Contact Center labor market will be automated by 2030 Friction Points to Cloud Adoption Risk Mitigation: Security and ! compliance 19% Cloud $83 Billion+ Penetration Data Integration: Many siloed $27 Billion channels, applications, and data $5 Billion Cloud Investments in Legacy 2030+ 2020 Infrastructure: 5+ year upgrade Source: Magellan Solutions Call Center Benchmarking Report, McKinsey. cycles 10$80+ Billion Opportunity That Is in the Early Innings of a Shift to the Cloud Current TAM is a Fraction of Cloud Drivers the Long-Term Opportunity Contact Center Software TAM $250 Billion Digital transformation of the Total CC Labor Enterprise Spend AI driven analytics increasingly used to support workflow and agents McKinsey believes Automation of manual labor that 22% of $250B Contact Center labor market will be automated by 2030 Friction Points to Cloud Adoption Risk Mitigation: Security and ! compliance 19% Cloud $83 Billion+ Penetration Data Integration: Many siloed $27 Billion channels, applications, and data $5 Billion Cloud Investments in Legacy 2030+ 2020 Infrastructure: 5+ year upgrade Source: Magellan Solutions Call Center Benchmarking Report, McKinsey. cycles 10

Easy to Deploy, Out-of-the-Box Solution Translates into Lower Total Cost of Ownership Existing LiveVox solutions LiveVox’s platform integrates Pre-configured omnichannel communications, CRM, integrations and WFO in a single pane of glass ü 100% Multi-Tenant platform with a modern user experience ü Scalable architecture to support Omnichannel/AI enterprise-grade deployments ü Voice, omnichannel and AI are integrated and enable consistent platform-wide reporting and analysis Modern Modern ü Differentiated approach to CRM and WFO CRM data management ü Pre-configured features and functionality reduce cost and time to value for customers 11Easy to Deploy, Out-of-the-Box Solution Translates into Lower Total Cost of Ownership Existing LiveVox solutions LiveVox’s platform integrates Pre-configured omnichannel communications, CRM, integrations and WFO in a single pane of glass ü 100% Multi-Tenant platform with a modern user experience ü Scalable architecture to support Omnichannel/AI enterprise-grade deployments ü Voice, omnichannel and AI are integrated and enable consistent platform-wide reporting and analysis Modern Modern ü Differentiated approach to CRM and WFO CRM data management ü Pre-configured features and functionality reduce cost and time to value for customers 11

LiveVox’s Omnichannel Capabilities Enable Enterprises to Engage with Customers on Their Channel of Choice VOICE IVR AI VIRTUAL AGENT EMAIL TEXT or WEB CHAT OUTBOUND CALL Inbound / Easy to incorporate Easy to configure HTML Customers or agents Inbound / Outbound Virtual Agents with a no- templates enable a initiate chat sessions Outbound IVR code AI bot unified look and feel proactively and IVR immediately when the need arises 1-Billing 2-Claim Status 3-Speak to an Agent LiveVox system has Agent researches Customer dials the Customer receives Customer texts and permission to call status of a claim and 800# and uses the an automated email receives an best and preferred verifies email interactive voice confirming the call automated response number, to verify address and response (“IVR”) to with an option to confirming claim has closure and offer to permission to follow speak with an Agent Text/SMS for status been processed assist with anything up else 12LiveVox’s Omnichannel Capabilities Enable Enterprises to Engage with Customers on Their Channel of Choice VOICE IVR AI VIRTUAL AGENT EMAIL TEXT or WEB CHAT OUTBOUND CALL Inbound / Easy to incorporate Easy to configure HTML Customers or agents Inbound / Outbound Virtual Agents with a no- templates enable a initiate chat sessions Outbound IVR code AI bot unified look and feel proactively and IVR immediately when the need arises 1-Billing 2-Claim Status 3-Speak to an Agent LiveVox system has Agent researches Customer dials the Customer receives Customer texts and permission to call status of a claim and 800# and uses the an automated email receives an best and preferred verifies email interactive voice confirming the call automated response number, to verify address and response (“IVR”) to with an option to confirming claim has closure and offer to permission to follow speak with an Agent Text/SMS for status been processed assist with anything up else 12
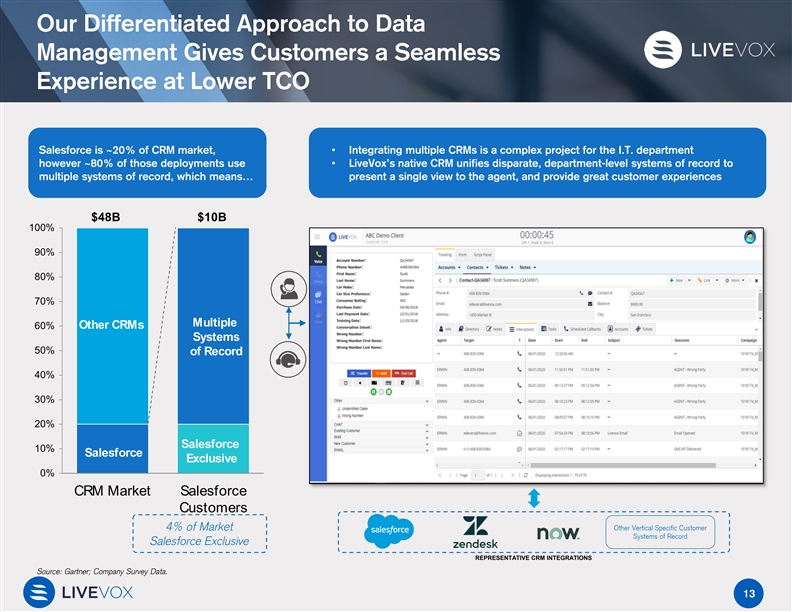
Our Differentiated Approach to Data Management Gives Customers a Seamless Experience at Lower TCO Salesforce is ~20% of CRM market, • Integrating multiple CRMs is a complex project for the I.T. department however ~80% of those deployments use • LiveVox’s native CRM unifies disparate, department-level systems of record to multiple systems of record, which means… present a single view to the agent, and provide great customer experiences $48B $10B 100% 90% 80% 70% Multiple 60% Other CRMs Systems 50% of Record 40% 30% 20% Salesforce 10% Salesforce Exclusive 0% CRM Market Salesforce Customers Other Vertical Specific Customer 4% of Market Systems of Record Salesforce Exclusive REPRESENTATIVE CRM INTEGRATIONS Source: Gartner; Company Survey Data. 13Our Differentiated Approach to Data Management Gives Customers a Seamless Experience at Lower TCO Salesforce is ~20% of CRM market, • Integrating multiple CRMs is a complex project for the I.T. department however ~80% of those deployments use • LiveVox’s native CRM unifies disparate, department-level systems of record to multiple systems of record, which means… present a single view to the agent, and provide great customer experiences $48B $10B 100% 90% 80% 70% Multiple 60% Other CRMs Systems 50% of Record 40% 30% 20% Salesforce 10% Salesforce Exclusive 0% CRM Market Salesforce Customers Other Vertical Specific Customer 4% of Market Systems of Record Salesforce Exclusive REPRESENTATIVE CRM INTEGRATIONS Source: Gartner; Company Survey Data. 13
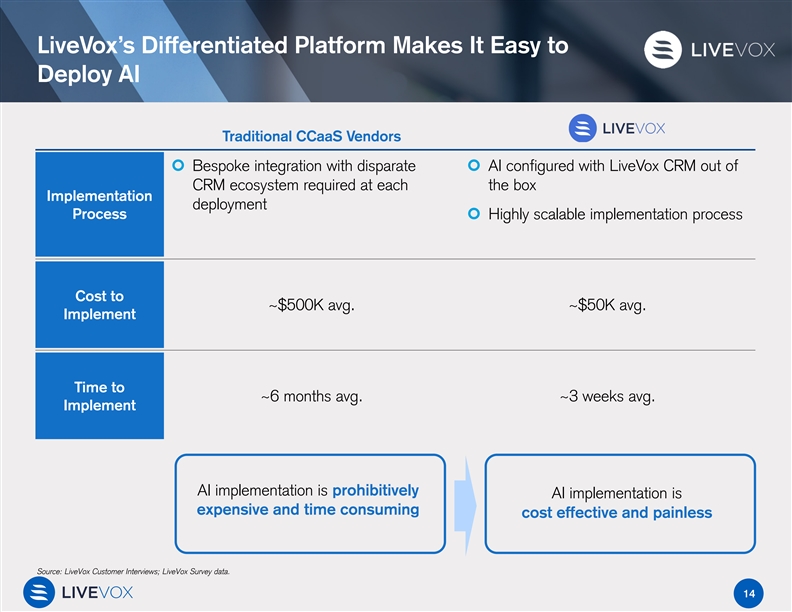
LiveVox’s Differentiated Platform Makes It Easy to Deploy AI Traditional CCaaS Vendors ¢ Bespoke integration with disparate ¢ AI configured with LiveVox CRM out of CRM ecosystem required at each the box Implementation deployment Process¢ Highly scalable implementation process Cost to ~$500K avg. ~$50K avg. Implement Time to ~6 months avg. ~3 weeks avg. Implement AI implementation is prohibitively AI implementation is expensive and time consuming cost effective and painless Source: LiveVox Customer Interviews; LiveVox Survey data. 14LiveVox’s Differentiated Platform Makes It Easy to Deploy AI Traditional CCaaS Vendors ¢ Bespoke integration with disparate ¢ AI configured with LiveVox CRM out of CRM ecosystem required at each the box Implementation deployment Process¢ Highly scalable implementation process Cost to ~$500K avg. ~$50K avg. Implement Time to ~6 months avg. ~3 weeks avg. Implement AI implementation is prohibitively AI implementation is expensive and time consuming cost effective and painless Source: LiveVox Customer Interviews; LiveVox Survey data. 14
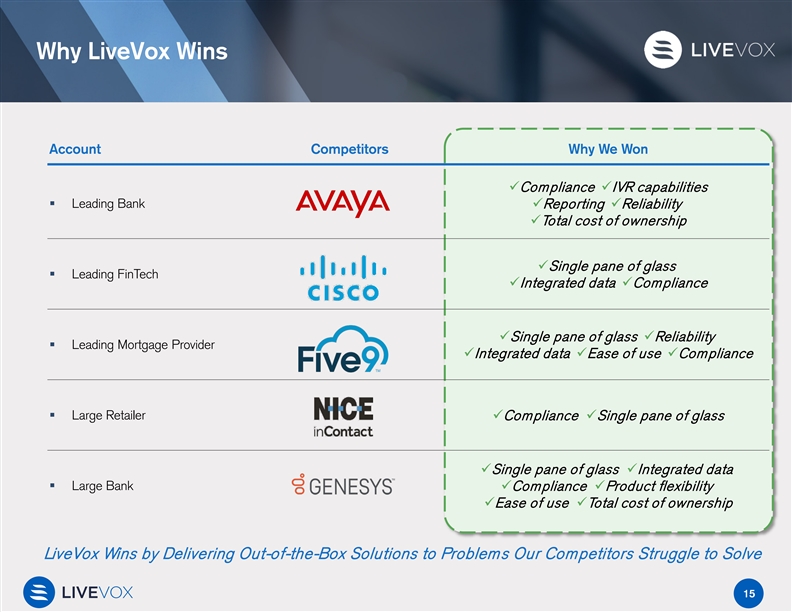
Why LiveVox Wins Account Competitors Why We Won üComplianceüIVR capabilities § Leading Bank üReportingüReliability üTotal cost of ownership üSingle pane of glass § Leading FinTech üIntegrated dataüCompliance üSingle pane of glassüReliability § Leading Mortgage Provider üIntegrated dataüEase of useüCompliance § Large RetailerüCompliance üSingle pane of glass üSingle pane of glass üIntegrated data § Large Bank üCompliance üProduct flexibility üEase of useüTotal cost of ownership LiveVox Wins by Delivering Out-of-the-Box Solutions to Problems Our Competitors Struggle to Solve 15Why LiveVox Wins Account Competitors Why We Won üComplianceüIVR capabilities § Leading Bank üReportingüReliability üTotal cost of ownership üSingle pane of glass § Leading FinTech üIntegrated dataüCompliance üSingle pane of glassüReliability § Leading Mortgage Provider üIntegrated dataüEase of useüCompliance § Large RetailerüCompliance üSingle pane of glass üSingle pane of glass üIntegrated data § Large Bank üCompliance üProduct flexibility üEase of useüTotal cost of ownership LiveVox Wins by Delivering Out-of-the-Box Solutions to Problems Our Competitors Struggle to Solve 15

Winning Larger Enterprises over Time 2016 2017 2018 2019 1H ’20 2H ’20 Top 5 BPO Top 3 Cruise Line Top 20 Bank Top 35 Bank Top 25 Bank Top 5 Bank Top 10 BPO Top 10 Retailer Top 100 Bank Top 5 Bank Top 75 Bank Top 35 Bank Top 3 Media Top 10 Fintech Top 25 BPO Top 25 Retailer Top 10 BPO Top 10 Bank Company Company Top 65 BPO Top 5 Retailer Top 10 Bank Top 5 Bank BPO Bank Media Cruise Line Fintech Retail Note: Client ranking based on publicly available data. 16Winning Larger Enterprises over Time 2016 2017 2018 2019 1H ’20 2H ’20 Top 5 BPO Top 3 Cruise Line Top 20 Bank Top 35 Bank Top 25 Bank Top 5 Bank Top 10 BPO Top 10 Retailer Top 100 Bank Top 5 Bank Top 75 Bank Top 35 Bank Top 3 Media Top 10 Fintech Top 25 BPO Top 25 Retailer Top 10 BPO Top 10 Bank Company Company Top 65 BPO Top 5 Retailer Top 10 Bank Top 5 Bank BPO Bank Media Cruise Line Fintech Retail Note: Client ranking based on publicly available data. 16

Growth and Go-to-Market OverviewGrowth and Go-to-Market Overview
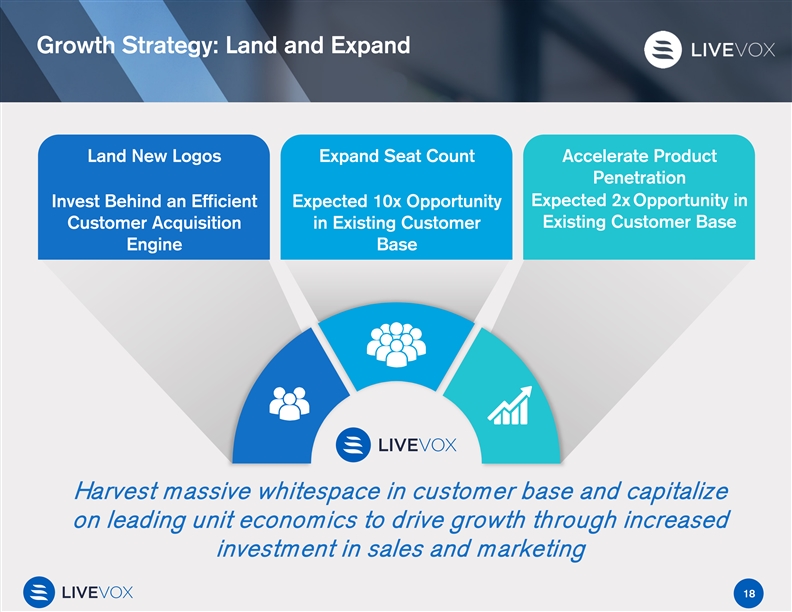
Growth Strategy: Land and Expand Land New Logos Expand Seat Count Accelerate Product Penetration Expected 2x Opportunity in Invest Behind an Efficient Expected 10x Opportunity Existing Customer Base Customer Acquisition in Existing Customer Engine Base Harvest massive whitespace in customer base and capitalize on leading unit economics to drive growth through increased investment in sales and marketing 18Growth Strategy: Land and Expand Land New Logos Expand Seat Count Accelerate Product Penetration Expected 2x Opportunity in Invest Behind an Efficient Expected 10x Opportunity Existing Customer Base Customer Acquisition in Existing Customer Engine Base Harvest massive whitespace in customer base and capitalize on leading unit economics to drive growth through increased investment in sales and marketing 18
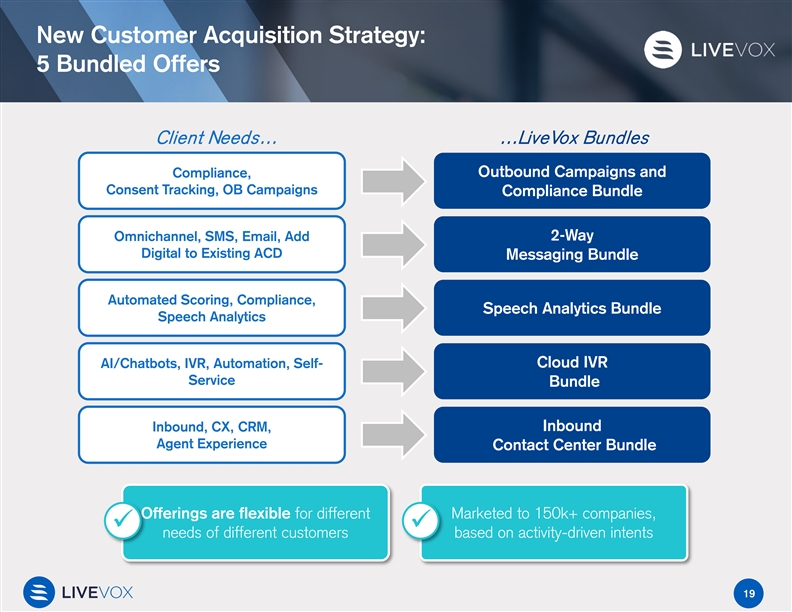
New Customer Acquisition Strategy: 5 Bundled Offers Client Needs… …LiveVox Bundles Outbound Campaigns and Compliance, Consent Tracking, OB Campaigns Compliance Bundle Omnichannel, SMS, Email, Add 2-Way Digital to Existing ACD Messaging Bundle Automated Scoring, Compliance, Speech Analytics Bundle Speech Analytics AI/Chatbots, IVR, Automation, Self- Cloud IVR Service Bundle Inbound Inbound, CX, CRM, Agent Experience Contact Center Bundle Offerings are flexible for different Marketed to 150k+ companies, üü needs of different customers based on activity-driven intents 19New Customer Acquisition Strategy: 5 Bundled Offers Client Needs… …LiveVox Bundles Outbound Campaigns and Compliance, Consent Tracking, OB Campaigns Compliance Bundle Omnichannel, SMS, Email, Add 2-Way Digital to Existing ACD Messaging Bundle Automated Scoring, Compliance, Speech Analytics Bundle Speech Analytics AI/Chatbots, IVR, Automation, Self- Cloud IVR Service Bundle Inbound Inbound, CX, CRM, Agent Experience Contact Center Bundle Offerings are flexible for different Marketed to 150k+ companies, üü needs of different customers based on activity-driven intents 19
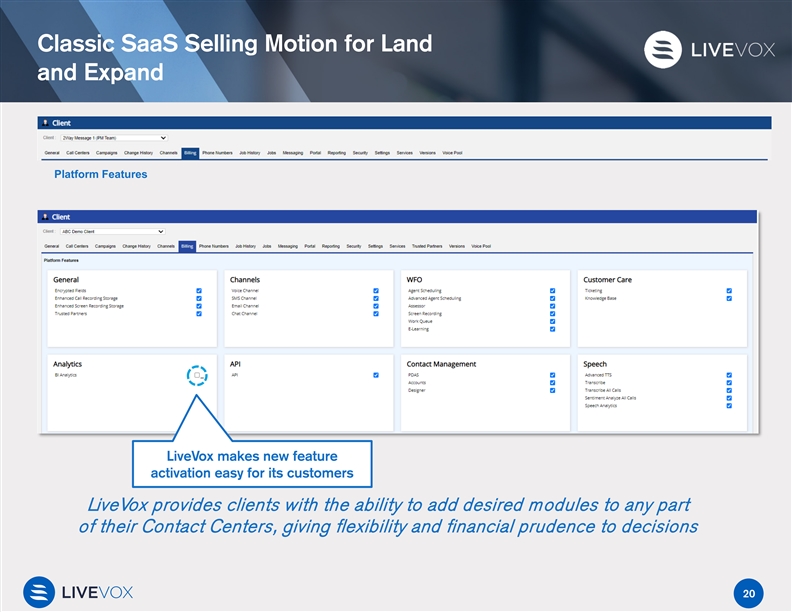
Classic SaaS Selling Motion for Land and Expand Platform Features LiveVox makes new feature activation easy for its customers LiveVox provides clients with the ability to add desired modules to any part of their Contact Centers, giving flexibility and financial prudence to decisions 20Classic SaaS Selling Motion for Land and Expand Platform Features LiveVox makes new feature activation easy for its customers LiveVox provides clients with the ability to add desired modules to any part of their Contact Centers, giving flexibility and financial prudence to decisions 20

20x+ Whitespace Opportunity inside LiveVox’s Installed Base Within Existing Customer Base There is a Large Opportunity For…. Seat Expansion: 10x Opportunity Product Expansion: Estimated >2x Opportunity >2x ~500k 60% of customers use two or more products As of September 2020, ~40% of 10x customers still only 40% of customers use use one of our one product products Average Number of Products per Customer ~50k 3.9 2.8 Existing Total Seats within Customer Seats Existing Customers Nov-17 Nov-20 $ 1 Billion + Whitespace Opportunity Source: Company estimates. 21 Customers20x+ Whitespace Opportunity inside LiveVox’s Installed Base Within Existing Customer Base There is a Large Opportunity For…. Seat Expansion: 10x Opportunity Product Expansion: Estimated >2x Opportunity >2x ~500k 60% of customers use two or more products As of September 2020, ~40% of 10x customers still only 40% of customers use use one of our one product products Average Number of Products per Customer ~50k 3.9 2.8 Existing Total Seats within Customer Seats Existing Customers Nov-17 Nov-20 $ 1 Billion + Whitespace Opportunity Source: Company estimates. 21 Customers
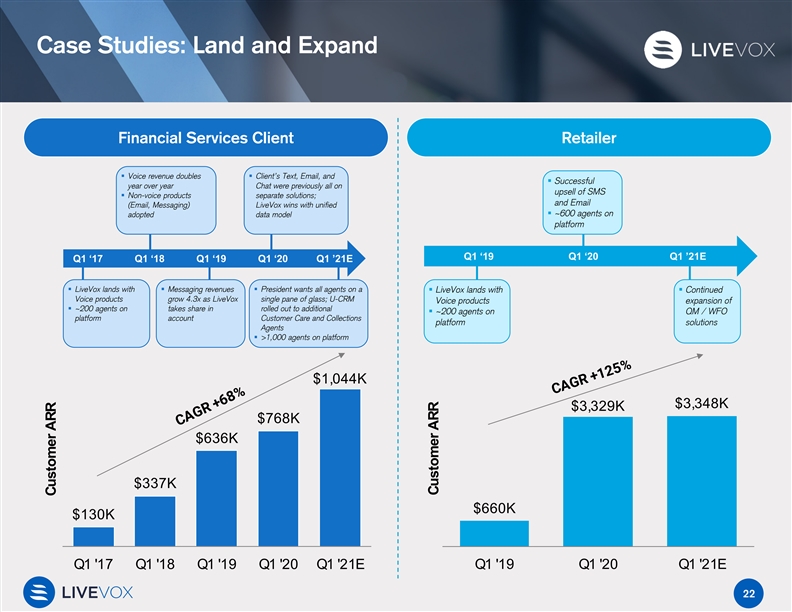
Case Studies: Land and Expand Financial Services Client Retailer § Voice revenue doubles § Client’s Text, Email, and § Successful year over year Chat were previously all on upsell of SMS § Non-voice products separate solutions; and Email (Email, Messaging) LiveVox wins with unified § ~600 agents on adopted data model platform Q1 ‘19 Q1 ‘20 Q1 ’21E Q1 ‘17 Q1 ‘18 Q1 ‘19 Q1 ‘20 Q1 ’21E § LiveVox lands with § Messaging revenues § President wants all agents on a § LiveVox lands with § Continued Voice products grow 4.3x as LiveVox single pane of glass; U-CRM Voice products expansion of § ~200 agents on takes share in rolled out to additional § ~200 agents on QM / WFO platform account Customer Care and Collections platform solutions Agents § >1,000 agents on platform $1,044K $3,348K $3,329K $768K $636K $337K $660K $130K Q1 '17 Q1 '18 Q1 '19 Q1 '20 Q1 '21E Q1 '19 Q1 '20 Q1 '21E 22 Customer ARR Customer ARRCase Studies: Land and Expand Financial Services Client Retailer § Voice revenue doubles § Client’s Text, Email, and § Successful year over year Chat were previously all on upsell of SMS § Non-voice products separate solutions; and Email (Email, Messaging) LiveVox wins with unified § ~600 agents on adopted data model platform Q1 ‘19 Q1 ‘20 Q1 ’21E Q1 ‘17 Q1 ‘18 Q1 ‘19 Q1 ‘20 Q1 ’21E § LiveVox lands with § Messaging revenues § President wants all agents on a § LiveVox lands with § Continued Voice products grow 4.3x as LiveVox single pane of glass; U-CRM Voice products expansion of § ~200 agents on takes share in rolled out to additional § ~200 agents on QM / WFO platform account Customer Care and Collections platform solutions Agents § >1,000 agents on platform $1,044K $3,348K $3,329K $768K $636K $337K $660K $130K Q1 '17 Q1 '18 Q1 '19 Q1 '20 Q1 '21E Q1 '19 Q1 '20 Q1 '21E 22 Customer ARR Customer ARR
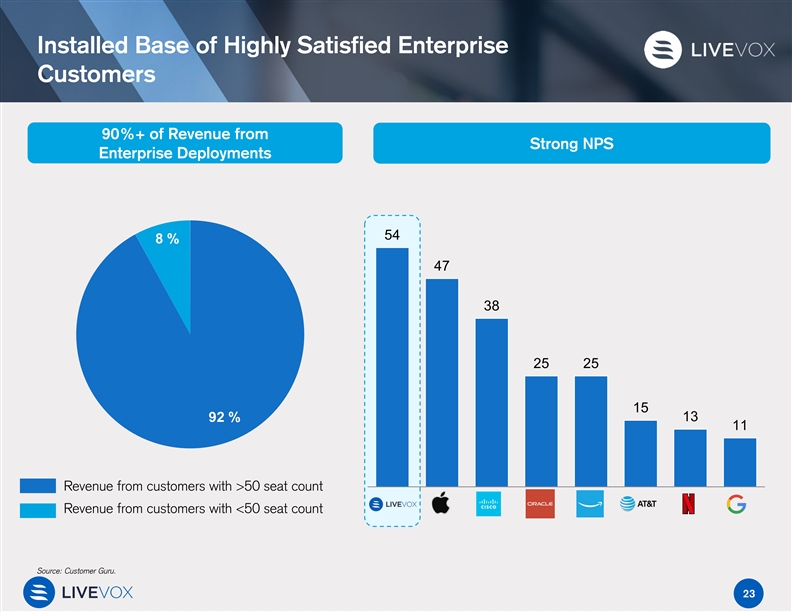
Installed Base of Highly Satisfied Enterprise Customers 90%+ of Revenue from Strong NPS Enterprise Deployments 54 8 % 47 38 25 25 15 13 92 % 11 Revenue from customers with >50 seat count Revenue from customers with <50 seat count Source: Customer Guru. 23Installed Base of Highly Satisfied Enterprise Customers 90%+ of Revenue from Strong NPS Enterprise Deployments 54 8 % 47 38 25 25 15 13 92 % 11 Revenue from customers with >50 seat count Revenue from customers with <50 seat count Source: Customer Guru. 23

Strong Unit Economics Net Retention CAC ($ in millions) LTV to CAC New Revenue Added $1mm+ customers 120% 119% 118% 114% represent 49% of ARR Sales and Marketing $ 22 CAC 13.1x $ 17 $ 17 $ 16 $ 16 8.5 x $ 11 1.3x 1.5x 0.9x FY 17A FY 18A FY 19A L3Y All $1mm+ FY17A FY18A FY19A Avg. Customers Customers 24Strong Unit Economics Net Retention CAC ($ in millions) LTV to CAC New Revenue Added $1mm+ customers 120% 119% 118% 114% represent 49% of ARR Sales and Marketing $ 22 CAC 13.1x $ 17 $ 17 $ 16 $ 16 8.5 x $ 11 1.3x 1.5x 0.9x FY 17A FY 18A FY 19A L3Y All $1mm+ FY17A FY18A FY19A Avg. Customers Customers 24

Accelerating Sales and Marketing Investment to Capture the Opportunity Ahead of LiveVox S&M Investment over Time Areas of Investment § Net new hunters and farmers § Challenger methodology § AE productivity software FY18A FY19A FY20E FY21E FY22E § Lead generating rep capacity and skill upgrade Quota Carrying Reps § Increased pay-per-click and social advertising § Incremental investment in branding § Channel and geographic FY18A FY19A FY20E FY21E FY22E expansion Hunter vs. Farmer Bookings§ Full suite of product offerings to address TAM FY18A FY19A FY20E FY21E FY22E Hunter Bookings Farmer Bookings Note: In general, hunters cover “land” bookings and the first year of “expand” bookings, and farmers cover “expand” bookings beyond that point. 25Accelerating Sales and Marketing Investment to Capture the Opportunity Ahead of LiveVox S&M Investment over Time Areas of Investment § Net new hunters and farmers § Challenger methodology § AE productivity software FY18A FY19A FY20E FY21E FY22E § Lead generating rep capacity and skill upgrade Quota Carrying Reps § Increased pay-per-click and social advertising § Incremental investment in branding § Channel and geographic FY18A FY19A FY20E FY21E FY22E expansion Hunter vs. Farmer Bookings§ Full suite of product offerings to address TAM FY18A FY19A FY20E FY21E FY22E Hunter Bookings Farmer Bookings Note: In general, hunters cover “land” bookings and the first year of “expand” bookings, and farmers cover “expand” bookings beyond that point. 25

Financial OverviewFinancial Overview
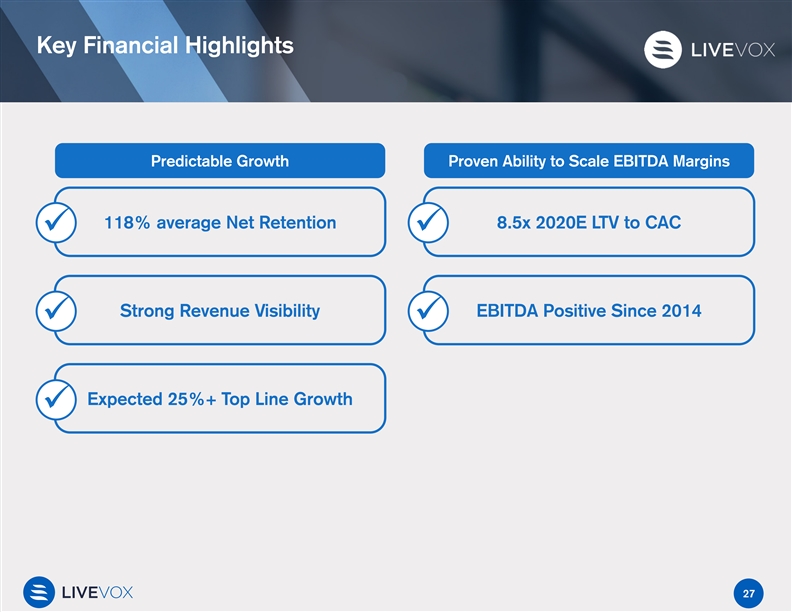
Key Financial Highlights Predictable Growth Proven Ability to Scale EBITDA Margins 118% average Net Retention 8.5x 2020E LTV to CAC üü Strong Revenue Visibility EBITDA Positive Since 2014 üü Expected 25%+ Top Line Growth ü 27Key Financial Highlights Predictable Growth Proven Ability to Scale EBITDA Margins 118% average Net Retention 8.5x 2020E LTV to CAC üü Strong Revenue Visibility EBITDA Positive Since 2014 üü Expected 25%+ Top Line Growth ü 27
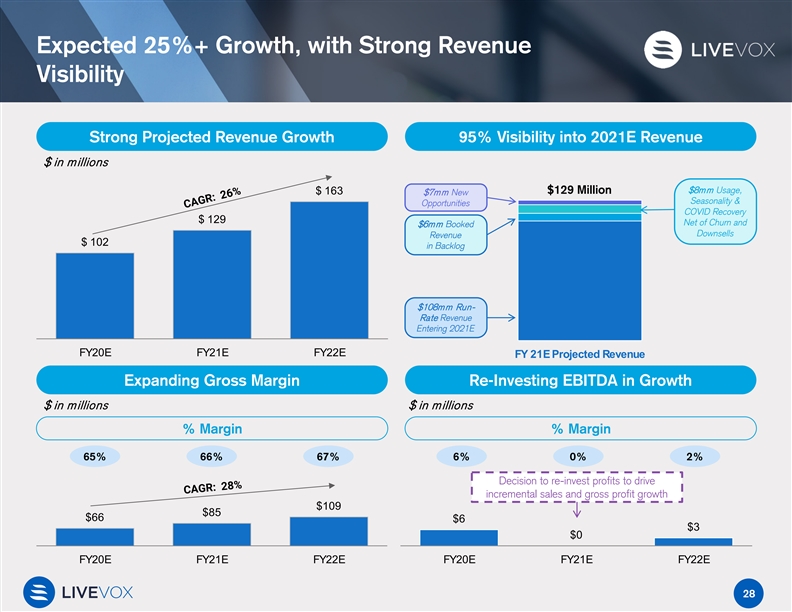
Expected 25%+ Growth, with Strong Revenue Visibility Strong Projected Revenue Growth 95% Visibility into 2021E Revenue $ in millions $8mm Usage, $129 Million $ 163 $7mm New Seasonality & Opportunities COVID Recovery $ 129 Net of Churn and $6mm Booked Downsells Revenue $ 102 in Backlog $108mm Run- Rate Revenue Entering 2021E FY20E FY21E FY22E FY 21E Projected Revenue Expanding Gross Margin Re-Investing EBITDA in Growth $ in millions $ in millions % Margin % Margin 65% 66% 67% 6% 0% 2% Decision to re-invest profits to drive incremental sales and gross profit growth $109 $85 $66 $6 $3 $0 FY20E FY21E FY22E FY20E FY21E FY22E 28Expected 25%+ Growth, with Strong Revenue Visibility Strong Projected Revenue Growth 95% Visibility into 2021E Revenue $ in millions $8mm Usage, $129 Million $ 163 $7mm New Seasonality & Opportunities COVID Recovery $ 129 Net of Churn and $6mm Booked Downsells Revenue $ 102 in Backlog $108mm Run- Rate Revenue Entering 2021E FY20E FY21E FY22E FY 21E Projected Revenue Expanding Gross Margin Re-Investing EBITDA in Growth $ in millions $ in millions % Margin % Margin 65% 66% 67% 6% 0% 2% Decision to re-invest profits to drive incremental sales and gross profit growth $109 $85 $66 $6 $3 $0 FY20E FY21E FY22E FY20E FY21E FY22E 28

LiveVox Revenue Model Multi-Pronged Revenue Model • Strong contracted revenue base which enables long-term revenue visibility Contracted revenue is a combination • Mix of revenue has shifted towards of (1) per-seat per month fees, and Contracted contracted as adoption of per-seat, per (2) minimum contracted usage Revenue month modules (e.g., WFO) has accelerated billing that is billed regardless of (~2/3 Today) consumption every month • Aligns LiveVox’s economics with value Usage revenue is billed for customer customers are receiving from the platform Usage consumption above their contracted • Lack of lock-in helps drive upsell; customers Revenue minimum. Premium pricing applies to frequently move agents onto platform as a (~1/3 Today) usage revenue. “trial” and never move them back Leading customer 8.5x LTV 118% avg. metrics as a result of Net NPS of 54 to CAC customer-centric Retention 2020E approach Source: Internal Company NPS Survey. 29LiveVox Revenue Model Multi-Pronged Revenue Model • Strong contracted revenue base which enables long-term revenue visibility Contracted revenue is a combination • Mix of revenue has shifted towards of (1) per-seat per month fees, and Contracted contracted as adoption of per-seat, per (2) minimum contracted usage Revenue month modules (e.g., WFO) has accelerated billing that is billed regardless of (~2/3 Today) consumption every month • Aligns LiveVox’s economics with value Usage revenue is billed for customer customers are receiving from the platform Usage consumption above their contracted • Lack of lock-in helps drive upsell; customers Revenue minimum. Premium pricing applies to frequently move agents onto platform as a (~1/3 Today) usage revenue. “trial” and never move them back Leading customer 8.5x LTV 118% avg. metrics as a result of Net NPS of 54 to CAC customer-centric Retention 2020E approach Source: Internal Company NPS Survey. 29
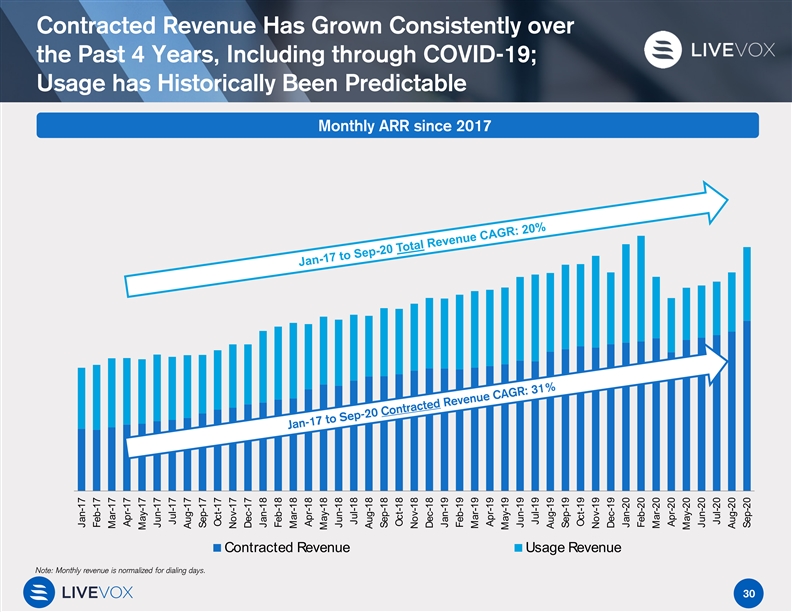
Contracted Revenue Has Grown Consistently over the Past 4 Years, Including through COVID-19; Usage has Historically Been Predictable Monthly ARR since 2017 Contracted Revenue Usage Revenue Note: Monthly revenue is normalized for dialing days. 30 Jan-17 Feb-17 Mar-17 Apr-17 May-17 Jun-17 Jul-17 Aug-17 Sep-17 Oct-17 Nov-17 Dec-17 Jan-18 Feb-18 Mar-18 Apr-18 May-18 Jun-18 Jul-18 Aug-18 Sep-18 Oct-18 Nov-18 Dec-18 Jan-19 Feb-19 Mar-19 Apr-19 May-19 Jun-19 Jul-19 Aug-19 Sep-19 Oct-19 Nov-19 Dec-19 Jan-20 Feb-20 Mar-20 Apr-20 May-20 Jun-20 Jul-20 Aug-20 Sep-20Contracted Revenue Has Grown Consistently over the Past 4 Years, Including through COVID-19; Usage has Historically Been Predictable Monthly ARR since 2017 Contracted Revenue Usage Revenue Note: Monthly revenue is normalized for dialing days. 30 Jan-17 Feb-17 Mar-17 Apr-17 May-17 Jun-17 Jul-17 Aug-17 Sep-17 Oct-17 Nov-17 Dec-17 Jan-18 Feb-18 Mar-18 Apr-18 May-18 Jun-18 Jul-18 Aug-18 Sep-18 Oct-18 Nov-18 Dec-18 Jan-19 Feb-19 Mar-19 Apr-19 May-19 Jun-19 Jul-19 Aug-19 Sep-19 Oct-19 Nov-19 Dec-19 Jan-20 Feb-20 Mar-20 Apr-20 May-20 Jun-20 Jul-20 Aug-20 Sep-20

2020 Performance | ARR has Rebounded from Period of COVID-Driven Lower Usage ARR Usage based revenue Rebound affected by COVID in 1H from 2020, during period of Usage ARR COVID lows lower volumes Contracted ARR $ 93 $ 68 $ 67 $ 65 $ 62 $ 57 $ 55 $ 54 $ 51 Q3 2018 Q4 2018 Q1 2019 Q2 2019 Q3 2019 Q4 2019 Q1 2020 Q2 2020 Q3 2020 Strong bookings outperformance for Q3 2020 with strong pipeline entering 2021 Contracted 53 % 43 % 35 % 22 % 21 % 21 % 23 % 16 % 18 % Revenue YoY %Growth 312020 Performance | ARR has Rebounded from Period of COVID-Driven Lower Usage ARR Usage based revenue Rebound affected by COVID in 1H from 2020, during period of Usage ARR COVID lows lower volumes Contracted ARR $ 93 $ 68 $ 67 $ 65 $ 62 $ 57 $ 55 $ 54 $ 51 Q3 2018 Q4 2018 Q1 2019 Q2 2019 Q3 2019 Q4 2019 Q1 2020 Q2 2020 Q3 2020 Strong bookings outperformance for Q3 2020 with strong pipeline entering 2021 Contracted 53 % 43 % 35 % 22 % 21 % 21 % 23 % 16 % 18 % Revenue YoY %Growth 31

Long-Term Operating Model Long- Term % of Revenue 2017 2018 2019 2020E Model Leverage on fixed cost Gross Margin 61% 60% 63% 65% 75%+ base as revenue grows Continued investment to S&M 26% 21% 23% 28% ~30-35% drive topline growth Product-driven company requires continued R&D 17% 17% 17% 19% ~15% investment Economies of scale G&A 15% 12% 11% 12% ~5% EBITDA 3% 10% 13% 6% ~20%+ 32Long-Term Operating Model Long- Term % of Revenue 2017 2018 2019 2020E Model Leverage on fixed cost Gross Margin 61% 60% 63% 65% 75%+ base as revenue grows Continued investment to S&M 26% 21% 23% 28% ~30-35% drive topline growth Product-driven company requires continued R&D 17% 17% 17% 19% ~15% investment Economies of scale G&A 15% 12% 11% 12% ~5% EBITDA 3% 10% 13% 6% ~20%+ 32
VALUATION OVERVIEWVALUATION OVERVIEW

LiveVox Compares Favorably Against Public Peers… Enterprise Value ($B) $ 0.84 $ 12.4 $ 17.2 $ 37.6 $ 18.6 $ 4.5 No. of Customers 325 2,000 25,000 400,000 164,200 18,000 LTM Revenue per $ 317 $ 200 $ 65 $ 3 $ 6 $ 19 Customer (000s) CC, Financial CCaaS CCaaS UCaaS Support Messaging Cloud Primary Offering Crime CAC 1.3 x ~1 x ~3 x ~2 x ~2 x ~2 x ~6 x (Enterprise) LTV to CAC 8.5 x ~2 x ~4 x ~3 x ~4 x ~2 x (Commercial) >105 to 115% Net Dollar Retention 118 % 105 to 107% Not disclosed Not disclosed 111 % Mid-Market / Enterprise 2020 Revenue ($M) $ 102 $ 422 $ 1,652 $ 1,166 $ 1,024 $ 363 2021E Revenue Growth 26 % 18 % 9 % 23 % 24 % 23 % CY21E EBITDA Margin 0% 16 % 34 % 14 % 12 % 9 % Source: Market Data as of 08-Jan-2021, publicly available equity research reports, Company public filings. 34 Financial Metrics Leading KPIs Operational MetricsLiveVox Compares Favorably Against Public Peers… Enterprise Value ($B) $ 0.84 $ 12.4 $ 17.2 $ 37.6 $ 18.6 $ 4.5 No. of Customers 325 2,000 25,000 400,000 164,200 18,000 LTM Revenue per $ 317 $ 200 $ 65 $ 3 $ 6 $ 19 Customer (000s) CC, Financial CCaaS CCaaS UCaaS Support Messaging Cloud Primary Offering Crime CAC 1.3 x ~1 x ~3 x ~2 x ~2 x ~2 x ~6 x (Enterprise) LTV to CAC 8.5 x ~2 x ~4 x ~3 x ~4 x ~2 x (Commercial) >105 to 115% Net Dollar Retention 118 % 105 to 107% Not disclosed Not disclosed 111 % Mid-Market / Enterprise 2020 Revenue ($M) $ 102 $ 422 $ 1,652 $ 1,166 $ 1,024 $ 363 2021E Revenue Growth 26 % 18 % 9 % 23 % 24 % 23 % CY21E EBITDA Margin 0% 16 % 34 % 14 % 12 % 9 % Source: Market Data as of 08-Jan-2021, publicly available equity research reports, Company public filings. 34 Financial Metrics Leading KPIs Operational Metrics
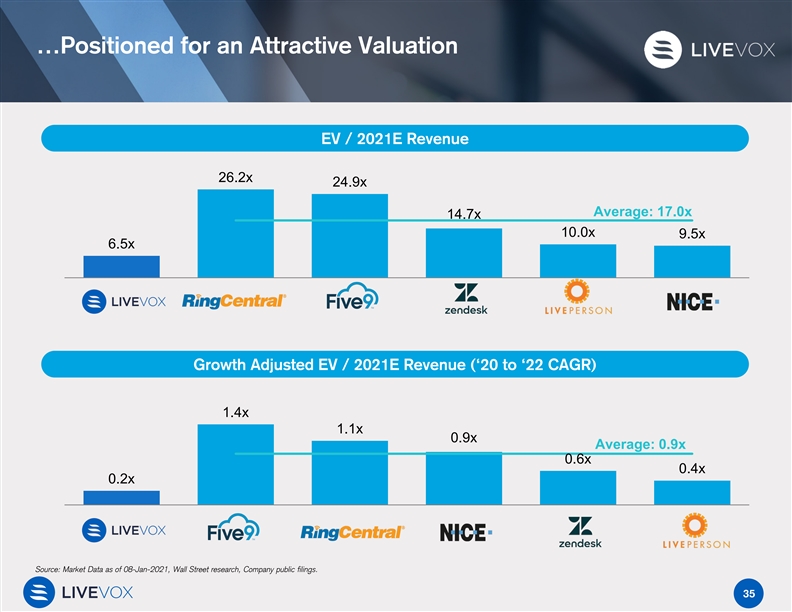
…Positioned for an Attractive Valuation EV / 2021E Revenue 26.2x 24.9x Average: 17.0x 14.7x 10.0x 9.5x 6.5x Growth Adjusted EV / 2021E Revenue (‘20 to ‘22 CAGR) 1.4x 1.1x 0.9x Average: 0.9x 0.6x 0.4x 0.2x Source: Market Data as of 08-Jan-2021, Wall Street research, Company public filings. 35…Positioned for an Attractive Valuation EV / 2021E Revenue 26.2x 24.9x Average: 17.0x 14.7x 10.0x 9.5x 6.5x Growth Adjusted EV / 2021E Revenue (‘20 to ‘22 CAGR) 1.4x 1.1x 0.9x Average: 0.9x 0.6x 0.4x 0.2x Source: Market Data as of 08-Jan-2021, Wall Street research, Company public filings. 35
Concluding Highlights 1 Large TAM with strong secular tailwinds Differentiated CCaaS platform with attractive KPIs 2 Multiple levers to accelerate growth 3 Attractive entry valuation versus peer group 4 36Concluding Highlights 1 Large TAM with strong secular tailwinds Differentiated CCaaS platform with attractive KPIs 2 Multiple levers to accelerate growth 3 Attractive entry valuation versus peer group 4 36
AppendixAppendix

Strong Sales Efficiency Less More CAC Benchmarking | LiveVox vs. Peers Favorable Favorable LiveVox CAC 7.0x $ in millions New Revenue Added Sales and Marketing $ 22 6.0x CAC $ 17 $ 17 $ 16 $ 16 $ 11 5.0x 1.3x 1.5x 0.9x 4.0x FY17A FY18A FY19A 3.0x 2.0x 1.0x 0.0x Source: Wall Street Research, Company public filings. 38Strong Sales Efficiency Less More CAC Benchmarking | LiveVox vs. Peers Favorable Favorable LiveVox CAC 7.0x $ in millions New Revenue Added Sales and Marketing $ 22 6.0x CAC $ 17 $ 17 $ 16 $ 16 $ 11 5.0x 1.3x 1.5x 0.9x 4.0x FY17A FY18A FY19A 3.0x 2.0x 1.0x 0.0x Source: Wall Street Research, Company public filings. 38
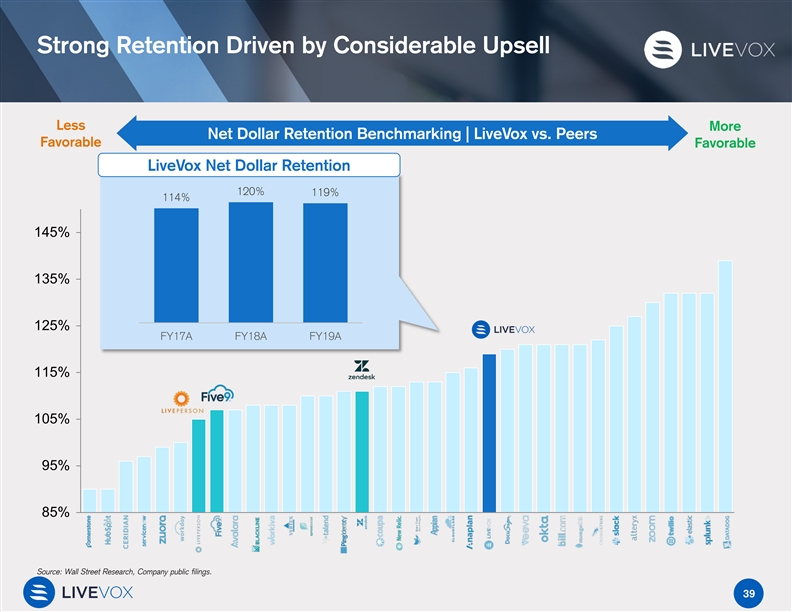
Strong Retention Driven by Considerable Upsell Less More Net Dollar Retention Benchmarking | LiveVox vs. Peers Favorable Favorable LiveVox Net Dollar Retention 120% 119% 114% 145% 135% 125% FY17A FY18A FY19A 115% 105% 95% 85% Source: Wall Street Research, Company public filings. 39Strong Retention Driven by Considerable Upsell Less More Net Dollar Retention Benchmarking | LiveVox vs. Peers Favorable Favorable LiveVox Net Dollar Retention 120% 119% 114% 145% 135% 125% FY17A FY18A FY19A 115% 105% 95% 85% Source: Wall Street Research, Company public filings. 39

Large Land and Expand Opportunity through Strong LTV to CAC Less More LTV to CAC Benchmarking | LiveVox vs. Peers Favorable Favorable 18.0x LiveVox LTV to CAC 16.0x % of Total 49% 13.1x 14.0x 8.5x 12.0x All $1mm+ 10.0x Customers Customers 8.0x 6.0x 4.0x 2.0x 0.0x Source: Wall Street Research, Company public filings. Note: LTV calculated as subscription gross margin divided by gross churn. CAC is calculated as trailing twelve months S&M expense divided by quarter 0 subscription revenue annualized less quarter 4 subscription revenue annualized. 40Large Land and Expand Opportunity through Strong LTV to CAC Less More LTV to CAC Benchmarking | LiveVox vs. Peers Favorable Favorable 18.0x LiveVox LTV to CAC 16.0x % of Total 49% 13.1x 14.0x 8.5x 12.0x All $1mm+ 10.0x Customers Customers 8.0x 6.0x 4.0x 2.0x 0.0x Source: Wall Street Research, Company public filings. Note: LTV calculated as subscription gross margin divided by gross churn. CAC is calculated as trailing twelve months S&M expense divided by quarter 0 subscription revenue annualized less quarter 4 subscription revenue annualized. 40
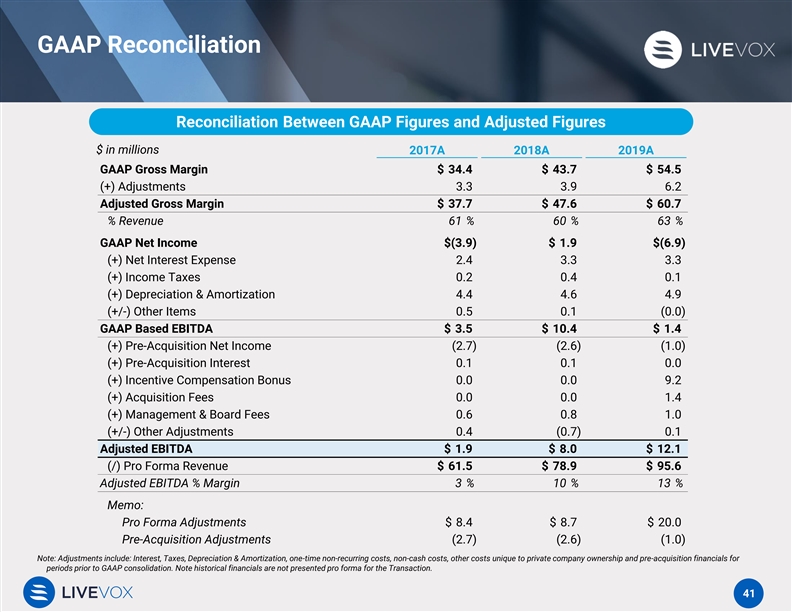
GAAP Reconciliation Reconciliation Between GAAP Figures and Adjusted Figures $ in millions 2017A 2018A 2019A GAAP Gross Margin $ 34.4 $ 43.7 $ 54.5 (+) Adjustments 3.3 3.9 6.2 Adjusted Gross Margin $ 37.7 $ 47.6 $ 60.7 % Revenue 61 % 60 % 63 % GAAP Net Income $(3.9) $ 1.9 $(6.9) (+) Net Interest Expense 2.4 3.3 3.3 (+) Income Taxes 0.2 0.4 0.1 (+) Depreciation & Amortization 4.4 4.6 4.9 (+/-) Other Items 0.5 0.1 (0.0) GAAP Based EBITDA $ 3.5 $ 10.4 $ 1.4 (+) Pre-Acquisition Net Income (2.7) (2.6) (1.0) (+) Pre-Acquisition Interest 0.1 0.1 0.0 (+) Incentive Compensation Bonus 0.0 0.0 9.2 (+) Acquisition Fees 0.0 0.0 1.4 (+) Management & Board Fees 0.6 0.8 1.0 (+/-) Other Adjustments 0.4 (0.7) 0.1 Adjusted EBITDA $ 1.9 $ 8.0 $ 12.1 (/) Pro Forma Revenue $ 61.5 $ 78.9 $ 95.6 Adjusted EBITDA % Margin 3 % 10 % 13 % Memo: Pro Forma Adjustments $ 8.4 $ 8.7 $ 20.0 Pre-Acquisition Adjustments (2.7) (2.6) (1.0) Note: Adjustments include: Interest, Taxes, Depreciation & Amortization, one-time non-recurring costs, non-cash costs, other costs unique to private company ownership and pre-acquisition financials for periods prior to GAAP consolidation. Note historical financials are not presented pro forma for the Transaction. 41GAAP Reconciliation Reconciliation Between GAAP Figures and Adjusted Figures $ in millions 2017A 2018A 2019A GAAP Gross Margin $ 34.4 $ 43.7 $ 54.5 (+) Adjustments 3.3 3.9 6.2 Adjusted Gross Margin $ 37.7 $ 47.6 $ 60.7 % Revenue 61 % 60 % 63 % GAAP Net Income $(3.9) $ 1.9 $(6.9) (+) Net Interest Expense 2.4 3.3 3.3 (+) Income Taxes 0.2 0.4 0.1 (+) Depreciation & Amortization 4.4 4.6 4.9 (+/-) Other Items 0.5 0.1 (0.0) GAAP Based EBITDA $ 3.5 $ 10.4 $ 1.4 (+) Pre-Acquisition Net Income (2.7) (2.6) (1.0) (+) Pre-Acquisition Interest 0.1 0.1 0.0 (+) Incentive Compensation Bonus 0.0 0.0 9.2 (+) Acquisition Fees 0.0 0.0 1.4 (+) Management & Board Fees 0.6 0.8 1.0 (+/-) Other Adjustments 0.4 (0.7) 0.1 Adjusted EBITDA $ 1.9 $ 8.0 $ 12.1 (/) Pro Forma Revenue $ 61.5 $ 78.9 $ 95.6 Adjusted EBITDA % Margin 3 % 10 % 13 % Memo: Pro Forma Adjustments $ 8.4 $ 8.7 $ 20.0 Pre-Acquisition Adjustments (2.7) (2.6) (1.0) Note: Adjustments include: Interest, Taxes, Depreciation & Amortization, one-time non-recurring costs, non-cash costs, other costs unique to private company ownership and pre-acquisition financials for periods prior to GAAP consolidation. Note historical financials are not presented pro forma for the Transaction. 41
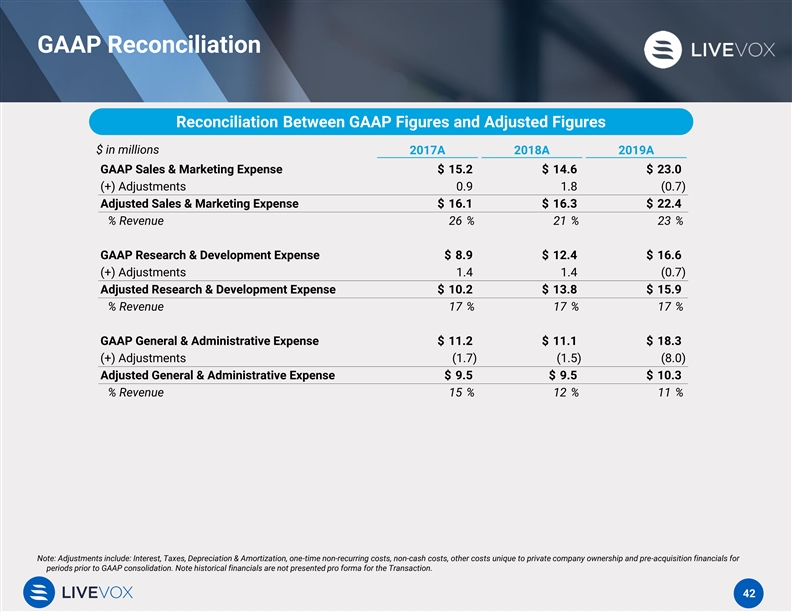
GAAP Reconciliation Reconciliation Between GAAP Figures and Adjusted Figures $ in millions 2017A 2018A 2019A GAAP Sales & Marketing Expense $ 15.2 $ 14.6 $ 23.0 (+) Adjustments 0.9 1.8 (0.7) Adjusted Sales & Marketing Expense $ 16.1 $ 16.3 $ 22.4 % Revenue 26 % 21 % 23 % GAAP Research & Development Expense $ 8.9 $ 12.4 $ 16.6 (+) Adjustments 1.4 1.4 (0.7) Adjusted Research & Development Expense $ 10.2 $ 13.8 $ 15.9 % Revenue 17 % 17 % 17 % GAAP General & Administrative Expense $ 11.2 $ 11.1 $ 18.3 (+) Adjustments (1.7) (1.5) (8.0) Adjusted General & Administrative Expense $ 9.5 $ 9.5 $ 10.3 % Revenue 15 % 12 % 11 % Note: Adjustments include: Interest, Taxes, Depreciation & Amortization, one-time non-recurring costs, non-cash costs, other costs unique to private company ownership and pre-acquisition financials for periods prior to GAAP consolidation. Note historical financials are not presented pro forma for the Transaction. 42GAAP Reconciliation Reconciliation Between GAAP Figures and Adjusted Figures $ in millions 2017A 2018A 2019A GAAP Sales & Marketing Expense $ 15.2 $ 14.6 $ 23.0 (+) Adjustments 0.9 1.8 (0.7) Adjusted Sales & Marketing Expense $ 16.1 $ 16.3 $ 22.4 % Revenue 26 % 21 % 23 % GAAP Research & Development Expense $ 8.9 $ 12.4 $ 16.6 (+) Adjustments 1.4 1.4 (0.7) Adjusted Research & Development Expense $ 10.2 $ 13.8 $ 15.9 % Revenue 17 % 17 % 17 % GAAP General & Administrative Expense $ 11.2 $ 11.1 $ 18.3 (+) Adjustments (1.7) (1.5) (8.0) Adjusted General & Administrative Expense $ 9.5 $ 9.5 $ 10.3 % Revenue 15 % 12 % 11 % Note: Adjustments include: Interest, Taxes, Depreciation & Amortization, one-time non-recurring costs, non-cash costs, other costs unique to private company ownership and pre-acquisition financials for periods prior to GAAP consolidation. Note historical financials are not presented pro forma for the Transaction. 42