LiveVox Enterprise Connect Update March 2023
© LiveVox 2023PROPRIETARY Forward-Looking Statements; Non-GAAP Information 2 This presentation does not constitute an offer or invitation for the sale or purchase of securities and has been prepared solely for informational purposes. None of LiveVox Holdings, Inc. (the “Company” or “LiveVox”) or its affiliates has authorized anyone to provide interested parties with additional or different information. The information contained herein does not purport to be all-inclusive or contain all of the information that may be required to make a full analysis of the Company. This presentation contains certain forward-looking statements within the meaning of Section 27A of the Securities Act and Section 21E of the Exchange Act. These statements may be made directly in this presentation. Some of the forwardlooking statements can be identified by the use of forward-looking words. Statements that are not historical in nature, including the words “anticipate,” “expect,” “suggests,” “plan,” “believe,” “intend,” “estimates,” “targets,” “projects,” “should,” “could,” “would,” “may,” “will,” “forecast” and other similar expressions are intended to identify forward-looking statements. All forward-looking statements and projections set forth in this presentation are based upon management estimates and forecasts and reflect the views, assumptions, expectations, and opinions of the Company as of the date of this presentation, and may include, without limitation, changes in general economic conditions, including as a result of COVID-19, all of which are accordingly subject to change. Any such estimates, assumptions, expectations, forecasts, views or opinions set forth in this presentation constitute LiveVox’s judgments and should be regarded as indicative, preliminary and for illustrative purposes only. The forward-looking statements and projections contained in this presentation are subject to a number of factors, risks and uncertainties, some of which are not currently known to LiveVox, that may cause LiveVox’s actual results, performance or financial condition to be materially different from the expectations of future results, performance or financial condition. Although such forward-looking statements and projections have been made in good faith and are based on assumptions that LiveVox believes to be reasonable, there is no assurance that the expected results will be achieved. LiveVox’s actual results may differ materially from the results discussed in forward-looking statements. Each investor must assess and bear the risk of uncertainty inherent in the forward-looking statements in this presentation. The Company discloses important factors that could cause its actual results to differ materially from its expectations in the “Risk Factors” and “Management’s Discussion and Analysis of Financial Condition and Results of Operations” sections of the Company’s Annual Report on Form 10-K filed with the Securities and Exchange Commission (“SEC”) on March 2, 2023, and its other filings with the SEC. These factors include risks or liabilities assumed as a result of our ability to meet financial and operating guidance, ability to achieve financial targets, and successfully manage capital expenditures; risks related to the high level of competition in the cloud contact center industry and the intense competition and competitive pressures from other companies in the industry in which the Company operates; risks related to the Company’s reliance on information systems and the ability to properly maintain the confidentiality and integrity of data; risks related to the occurrence of cyber incidents or a deficiency in cybersecurity protocols; risks related to the ability to obtain third-party software licenses for use in or with the Company’s products; general economic and business conditions; the impact of COVID-19 on LiveVox’s business; risks related to our intellectual property rights, risks related to our ability to secure additional financing on favorable terms, or at all, to meet our future capital needs; increased taxes and surcharges (including Universal Service Fund, whether labeled a “tax,” “surcharge,” or other designation) on our products which may increase our customers’ cost of using our products and/or increase our costs and reduce our profit margins to the extent the costs are not passed through to our customers, and our potential liability for past sales and other taxes, surcharges and fees; changes in government regulation applicable to the collections industry or any failure of us or our customers to comply with existing regulations; changes in base interest rates and significant market volatility on the Company’s business, the Company’s industry and the global economy. Accordingly, you should not place undue reliance on any of the Company’s forward-looking statements. All forward-looking statements speak only as of the date on which such statements are made and the Company undertakes no obligation to correct or update any forward-looking statement, whether as a result of new information, future events or otherwise. This presentation includes references to non-GAAP financial measures, including but not limited to Gross Margin, EBITDA and Adjusted EBITDA. Additionally, to the extent that forward-looking non-GAAP financial measures are provided, they are presented on a non-GAAP basis without reconciliations of such forward-looking non-GAAP measures due to the inherent difficulty in forecasting and quantifying certain amounts that are necessary for such reconciliation. While management believes such measures are useful for investors because they allow for greater transparency with respect to key financial metrics, they should not be used as a replacement for financial measures that are in accordance with GAAP. LiveVox does not, nor does any of its directors, officers, employees, advisors, representatives or agents, make any representation or warranty of any kind, express or implied, as to the accuracy or completeness of the information contained in this presentation, and none of them shall have any liability based on or arising from, in whole or in part, any information contained in, or omitted from, this presentation. This presentation contains information derived from third party sources, including research, surveys or studies conducted by third parties, information provided by customers and/or industry or general publications. While we believe that such third-party information is reliable, we have not independently verified, and make no representation as to the accuracy of, such third-party information. This presentation contains financial forecasts. These projections are for illustrative purposes only and should not be relied upon as being necessarily indicative of future results. Inclusion of the prospective financial information in this presentation should not be regarded as a representation by any person that the results contained in the prospective financial information will be achieved. This presentation contains references to trademarks and service marks belonging to other entities. Solely for convenience, trademarks and trade names referred to in this presentation may appear without the ® or ™ symbols, but such references are not intended to indicate, in any way, that the applicable licensor will not assert, to the fullest extent under applicable law, its rights to these trademarks and trade names. We do not intend our use or display of other companies’ trade names, trademarks or service marks to imply a relationship with, or endorsement or sponsorship of us by, any other companies.
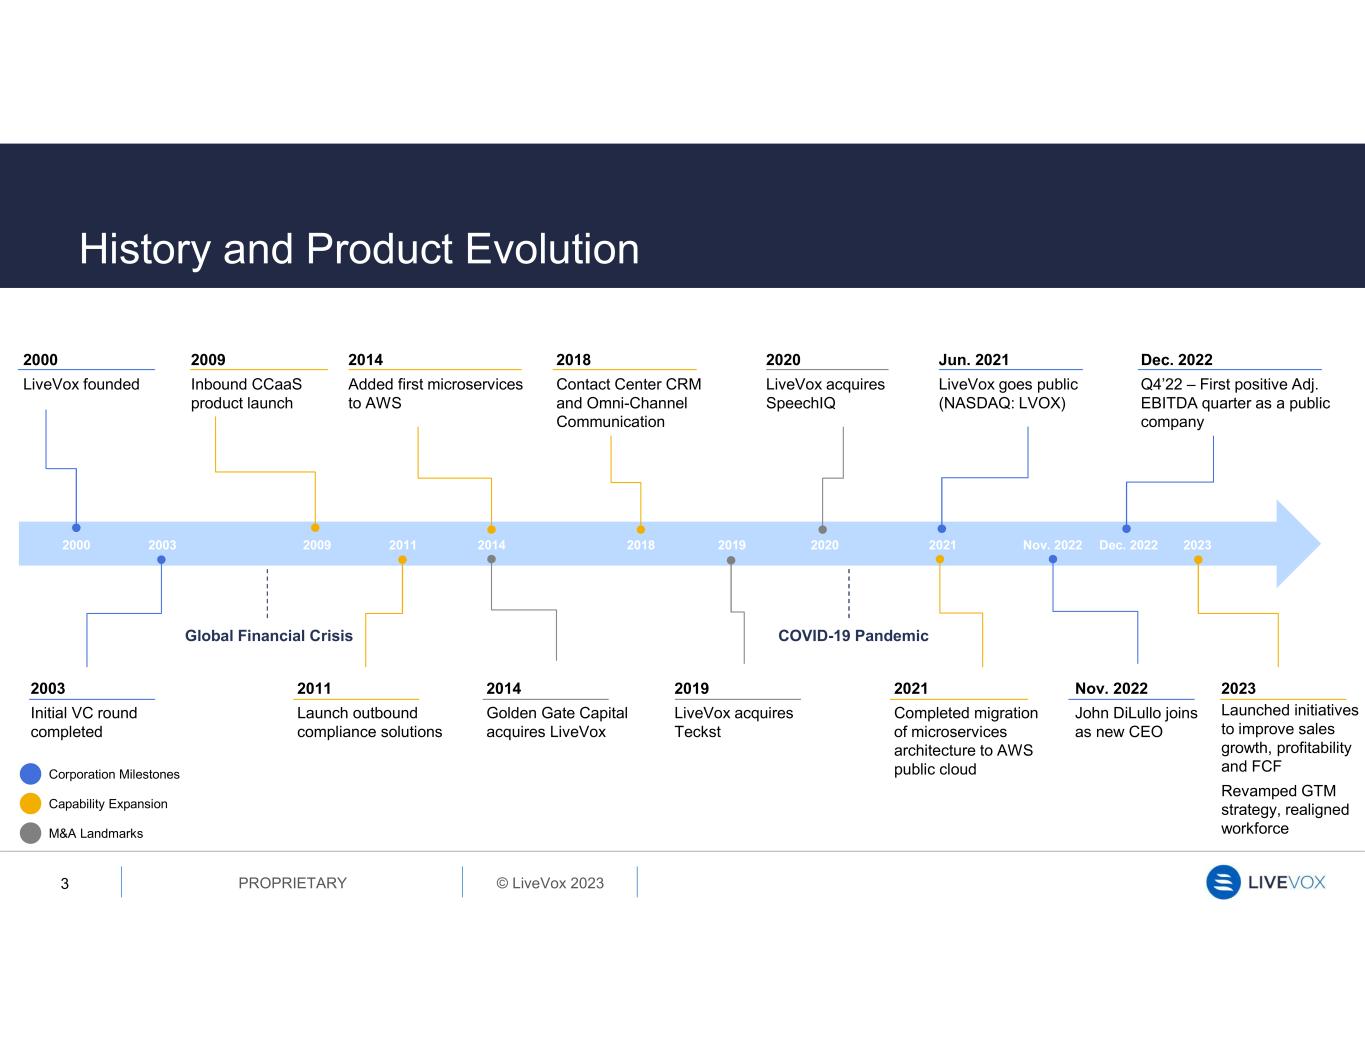
© LiveVox 2023PROPRIETARY 2020 LiveVox acquires SpeechIQ 2019 LiveVox acquires Teckst 2014 Added first microservices to AWS 2003 Initial VC round completed History and Product Evolution 3 2009 Inbound CCaaS product launch Jun. 2021 LiveVox goes public (NASDAQ: LVOX) 2000 2009 2011 2014 2018 2019 2000 LiveVox founded 2003 2011 Launch outbound compliance solutions Nov. 2022 John DiLullo joins as new CEO 2021 Completed migration of microservices architecture to AWS public cloud COVID-19 PandemicGlobal Financial Crisis 2020 2021 Nov. 2022 Dec. 2022 2023 2014 Golden Gate Capital acquires LiveVox 2018 Contact Center CRM and Omni-Channel Communication Dec. 2022 Q4’22 – First positive Adj. EBITDA quarter as a public company 2023 Launched initiatives to improve sales growth, profitability and FCF Revamped GTM strategy, realigned workforce Corporation Milestones Capability Expansion M&A Landmarks
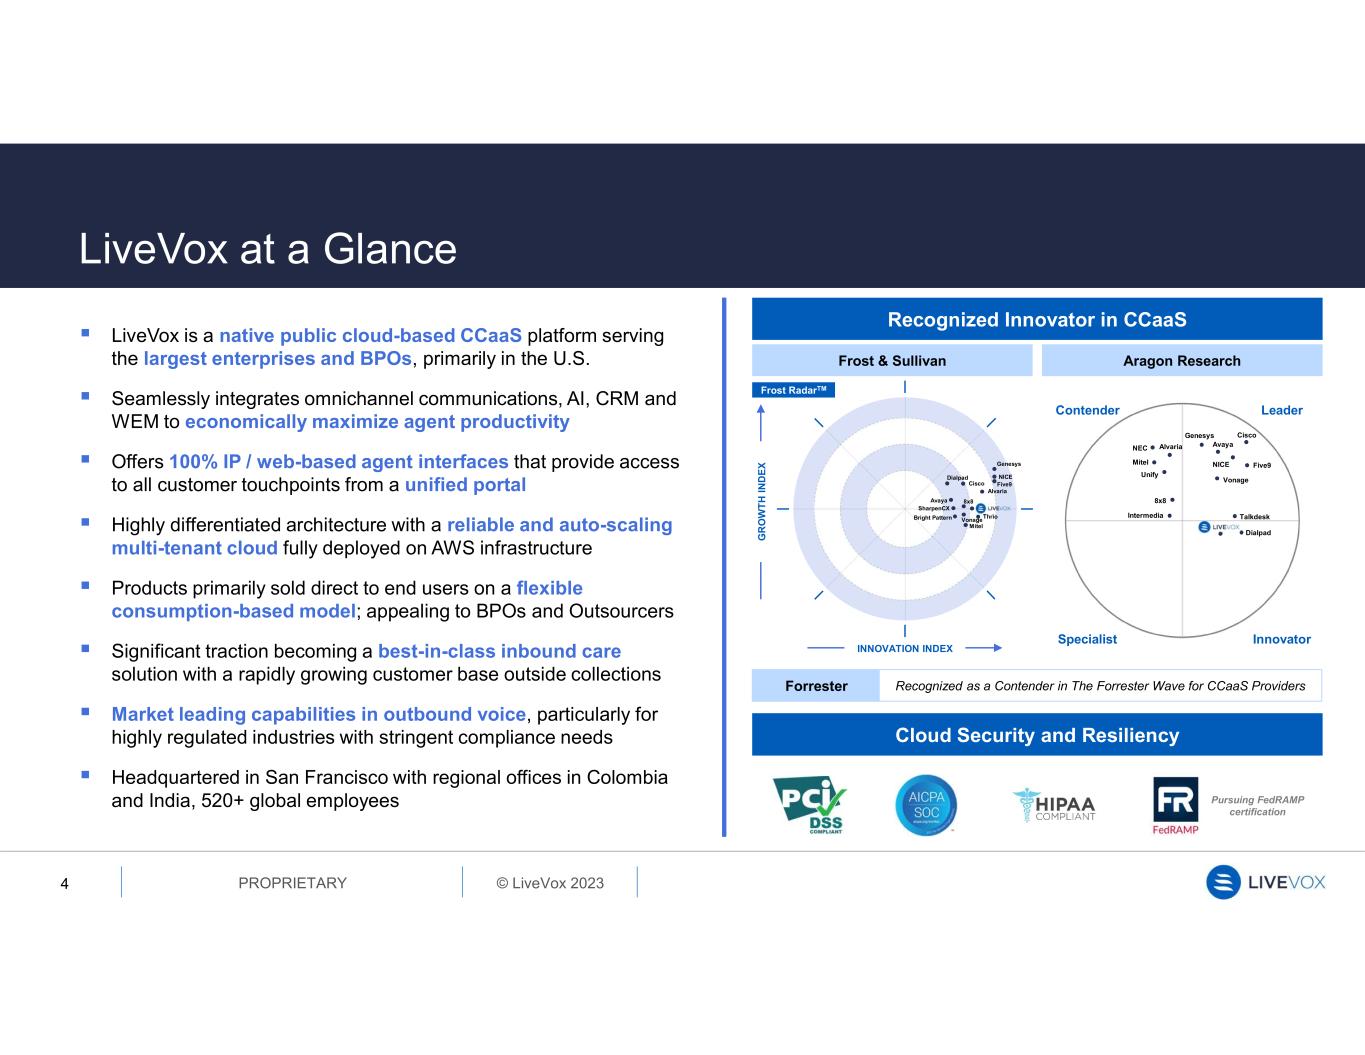
© LiveVox 2023PROPRIETARY LiveVox at a Glance 4 LiveVox is a native public cloud-based CCaaS platform serving the largest enterprises and BPOs, primarily in the U.S. Seamlessly integrates omnichannel communications, AI, CRM and WEM to economically maximize agent productivity Offers 100% IP / web-based agent interfaces that provide access to all customer touchpoints from a unified portal Highly differentiated architecture with a reliable and auto-scaling multi-tenant cloud fully deployed on AWS infrastructure Products primarily sold direct to end users on a flexible consumption-based model; appealing to BPOs and Outsourcers Significant traction becoming a best-in-class inbound care solution with a rapidly growing customer base outside collections Market leading capabilities in outbound voice, particularly for highly regulated industries with stringent compliance needs Headquartered in San Francisco with regional offices in Colombia and India, 520+ global employees Recognized Innovator in CCaaS Cloud Security and Resiliency Frost & Sullivan Aragon Research INNOVATION INDEX G R O W T H I N D E X Dialpad Genesys NICE Mitel Avaya SharpenCX Bright Pattern 8x8 Cisco Five9 Alvaria Thrio Vonage Frost RadarTM Contender Leader InnovatorSpecialist Unify Genesys NICEMitel Avaya Talkdesk NEC 8x8 Cisco Five9 Alvaria Intermedia Vonage Dialpad Pursuing FedRAMP certification Forrester Recognized as a Contender in The Forrester Wave for CCaaS Providers
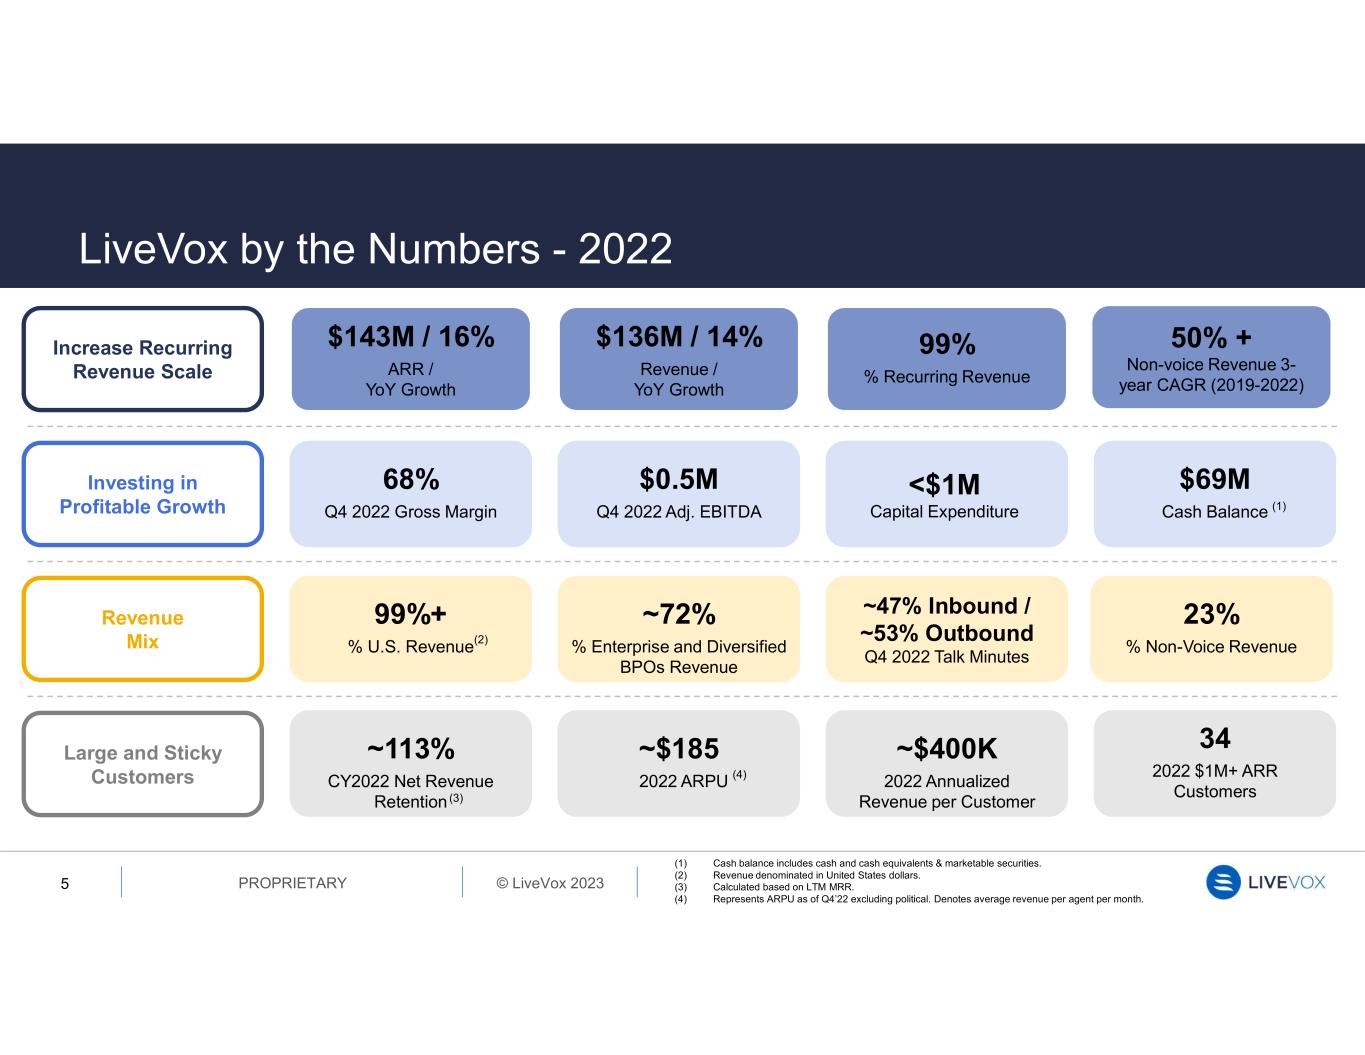
© LiveVox 2023PROPRIETARY LiveVox by the Numbers - 2022 5 (1) Cash balance includes cash and cash equivalents & marketable securities. (2) Revenue denominated in United States dollars. (3) Calculated based on LTM MRR. (4) Represents ARPU as of Q4’22 excluding political. Denotes average revenue per agent per month. 50% + Non-voice Revenue 3- year CAGR (2019-2022) 99% % Recurring Revenue $136M / 14% Revenue / YoY Growth $143M / 16% ARR / YoY Growth Increase Recurring Revenue Scale $69M Cash Balance <$1M Capital Expenditure $0.5M Q4 2022 Adj. EBITDA 68% Q4 2022 Gross Margin Investing in Profitable Growth 23% % Non-Voice Revenue ~47% Inbound / ~53% Outbound Q4 2022 Talk Minutes ~72% % Enterprise and Diversified BPOs Revenue 99%+ % U.S. Revenue Revenue Mix 34 2022 $1M+ ARR Customers ~$400K 2022 Annualized Revenue per Customer ~$185 2022 ARPU Large and Sticky Customers (4) (1) (2) ~113% CY2022 Net Revenue Retention (3)
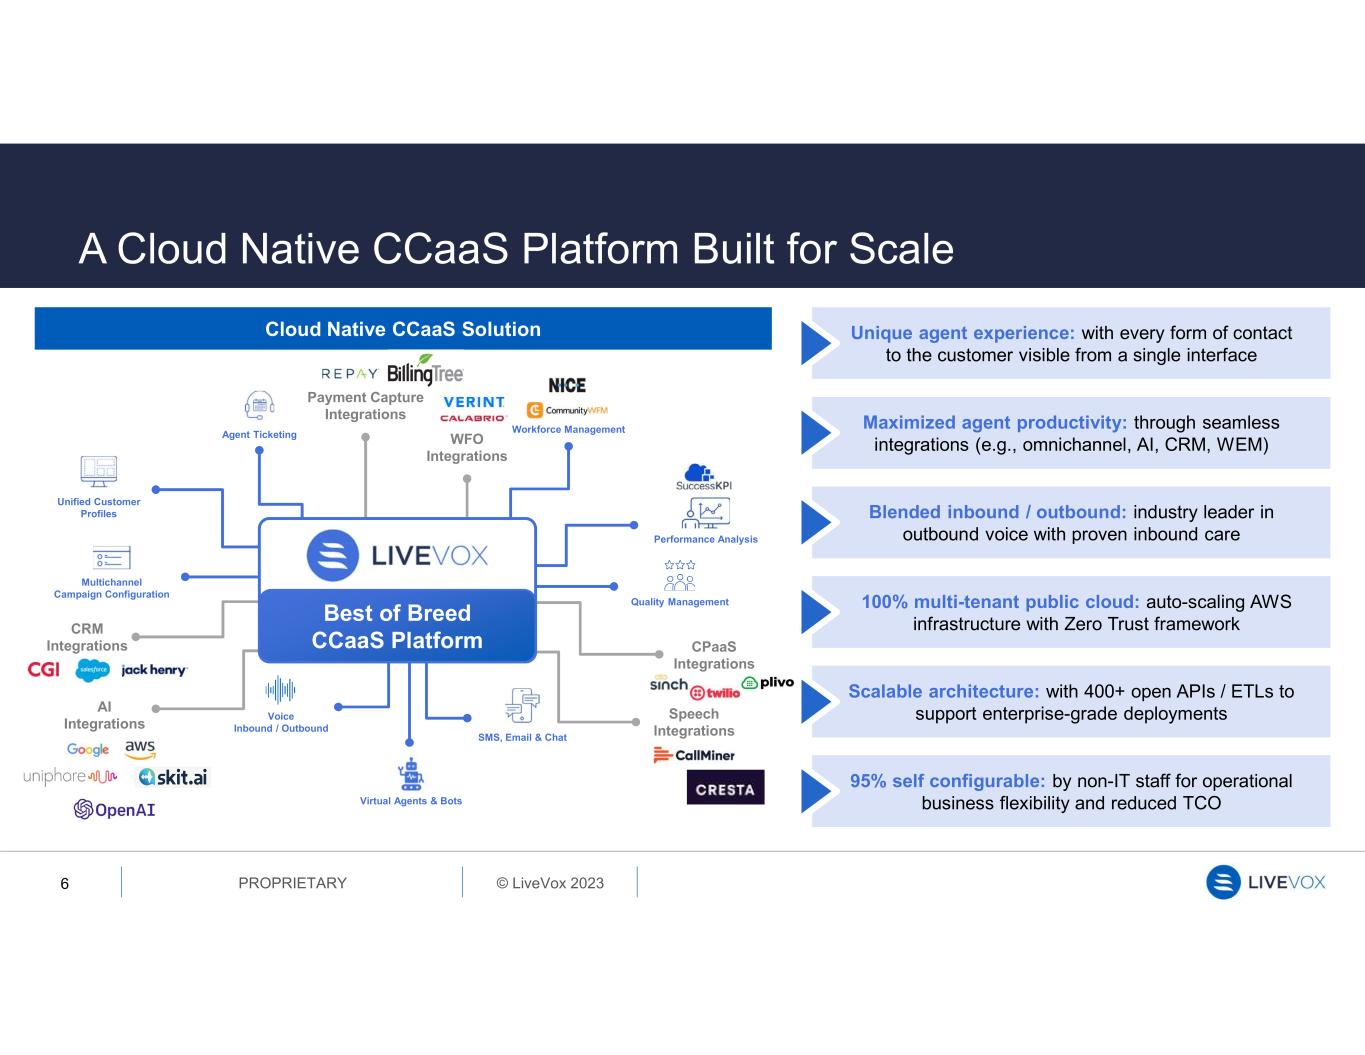
© LiveVox 2023PROPRIETARY A Cloud Native CCaaS Platform Built for Scale 6 Best of Breed CCaaS Platform Performance Analysis Quality Management Workforce Management SMS, Email & Chat Virtual Agents & Bots Voice Inbound / Outbound Agent Ticketing Unified Customer Profiles Multichannel Campaign Configuration CRM Integrations Payment Capture Integrations CPaaS Integrations Unique agent experience: with every form of contact to the customer visible from a single interface Maximized agent productivity: through seamless integrations (e.g., omnichannel, AI, CRM, WEM) Blended inbound / outbound: industry leader in outbound voice with proven inbound care 100% multi-tenant public cloud: auto-scaling AWS infrastructure with Zero Trust framework Scalable architecture: with 400+ open APIs / ETLs to support enterprise-grade deployments 95% self configurable: by non-IT staff for operational business flexibility and reduced TCO Cloud Native CCaaS Solution WFO Integrations Speech Integrations AI Integrations
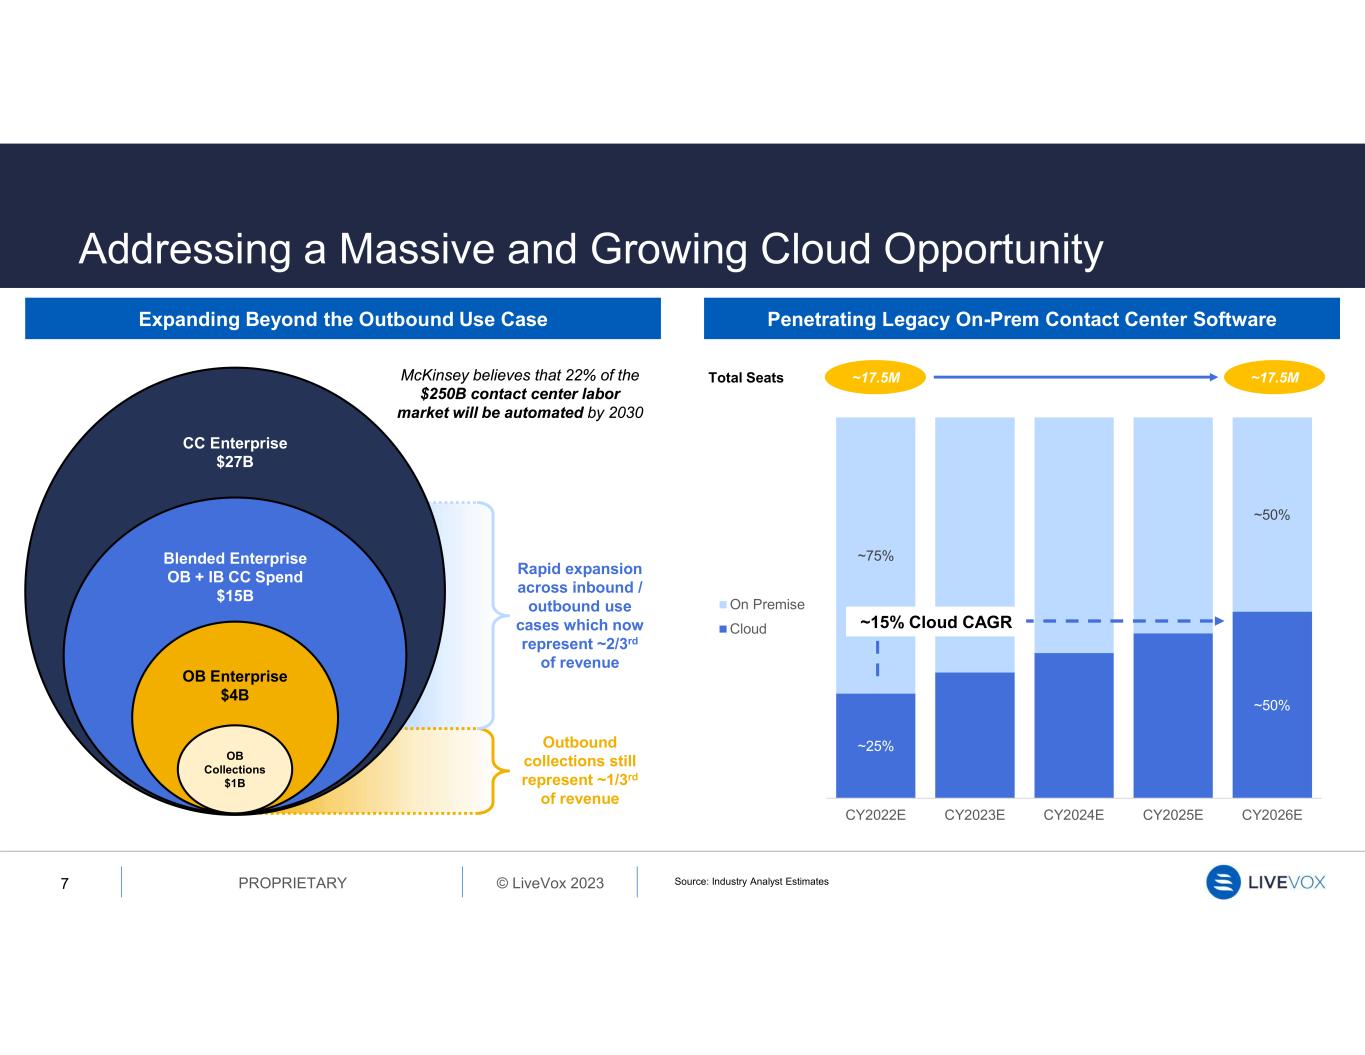
© LiveVox 2023PROPRIETARY Addressing a Massive and Growing Cloud Opportunity 7 Source: Industry Analyst Estimates Expanding Beyond the Outbound Use Case Penetrating Legacy On-Prem Contact Center Software Outbound collections still represent ~1/3rd of revenue Rapid expansion across inbound / outbound use cases which now represent ~2/3rd of revenue ~17.5M ~17.5MTotal Seats ~25% ~50% ~75% ~50% CY2022E CY2023E CY2024E CY2025E CY2026E On Premise Cloud CC Enterprise $27B Blended Enterprise OB + IB CC Spend $15B OB Enterprise $4B OB Collections $1B ~15% Cloud CAGR McKinsey believes that 22% of the $250B contact center labor market will be automated by 2030
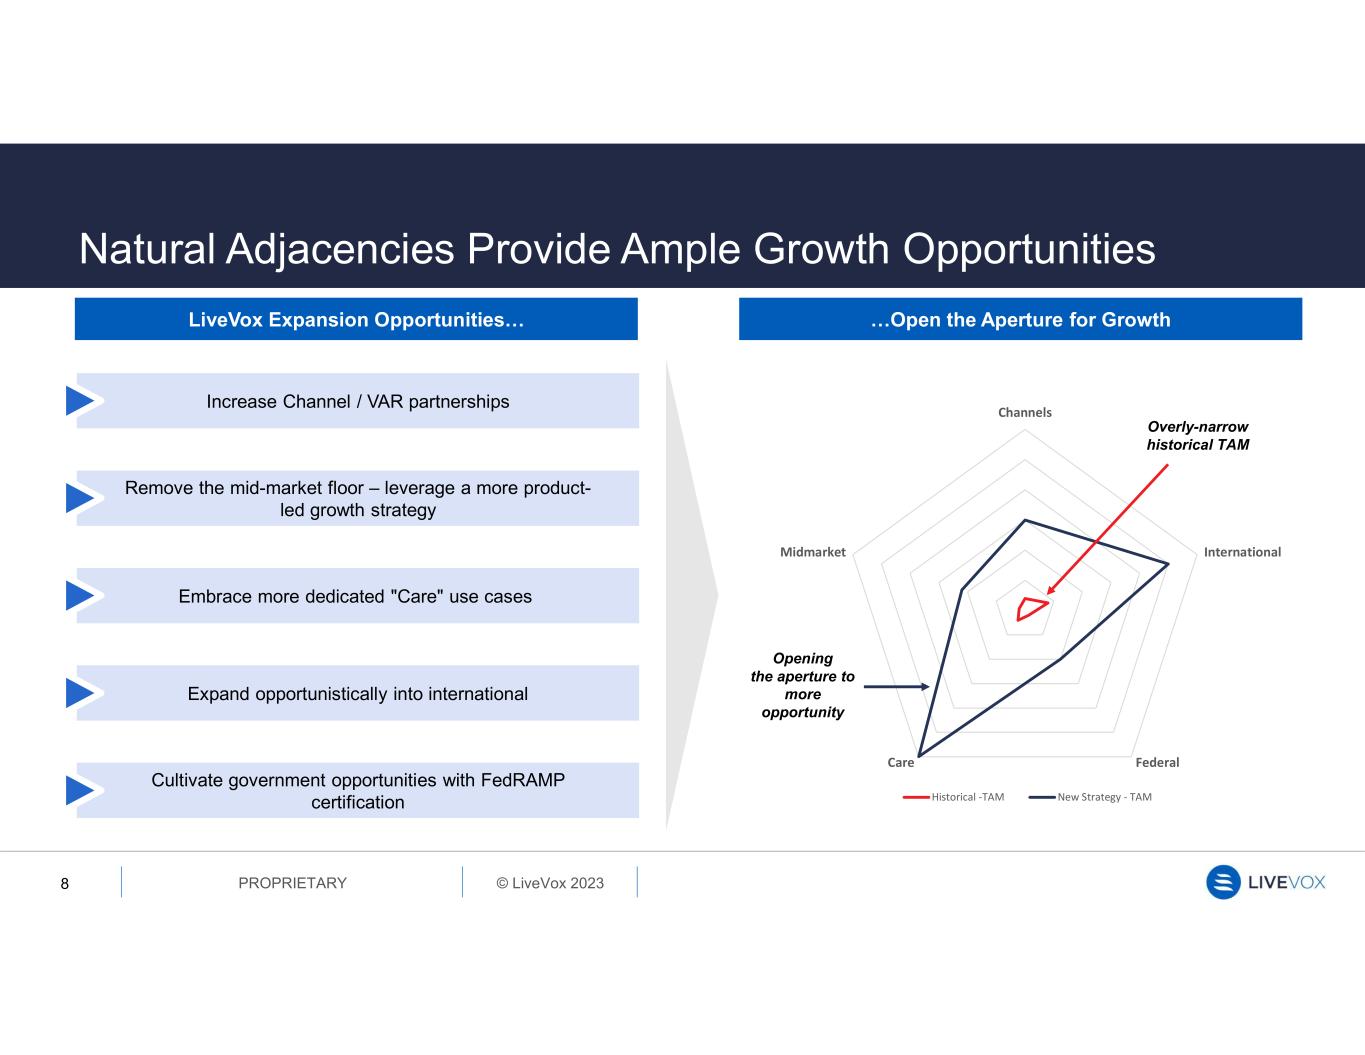
© LiveVox 2023PROPRIETARY Natural Adjacencies Provide Ample Growth Opportunities 8 Channels International FederalCare Midmarket Historical -TAM New Strategy - TAM Overly-narrow historical TAM Opening the aperture to more opportunity LiveVox Expansion Opportunities… …Open the Aperture for Growth Increase Channel / VAR partnerships Remove the mid-market floor – leverage a more product- led growth strategy Embrace more dedicated "Care" use cases Expand opportunistically into international Cultivate government opportunities with FedRAMP certification
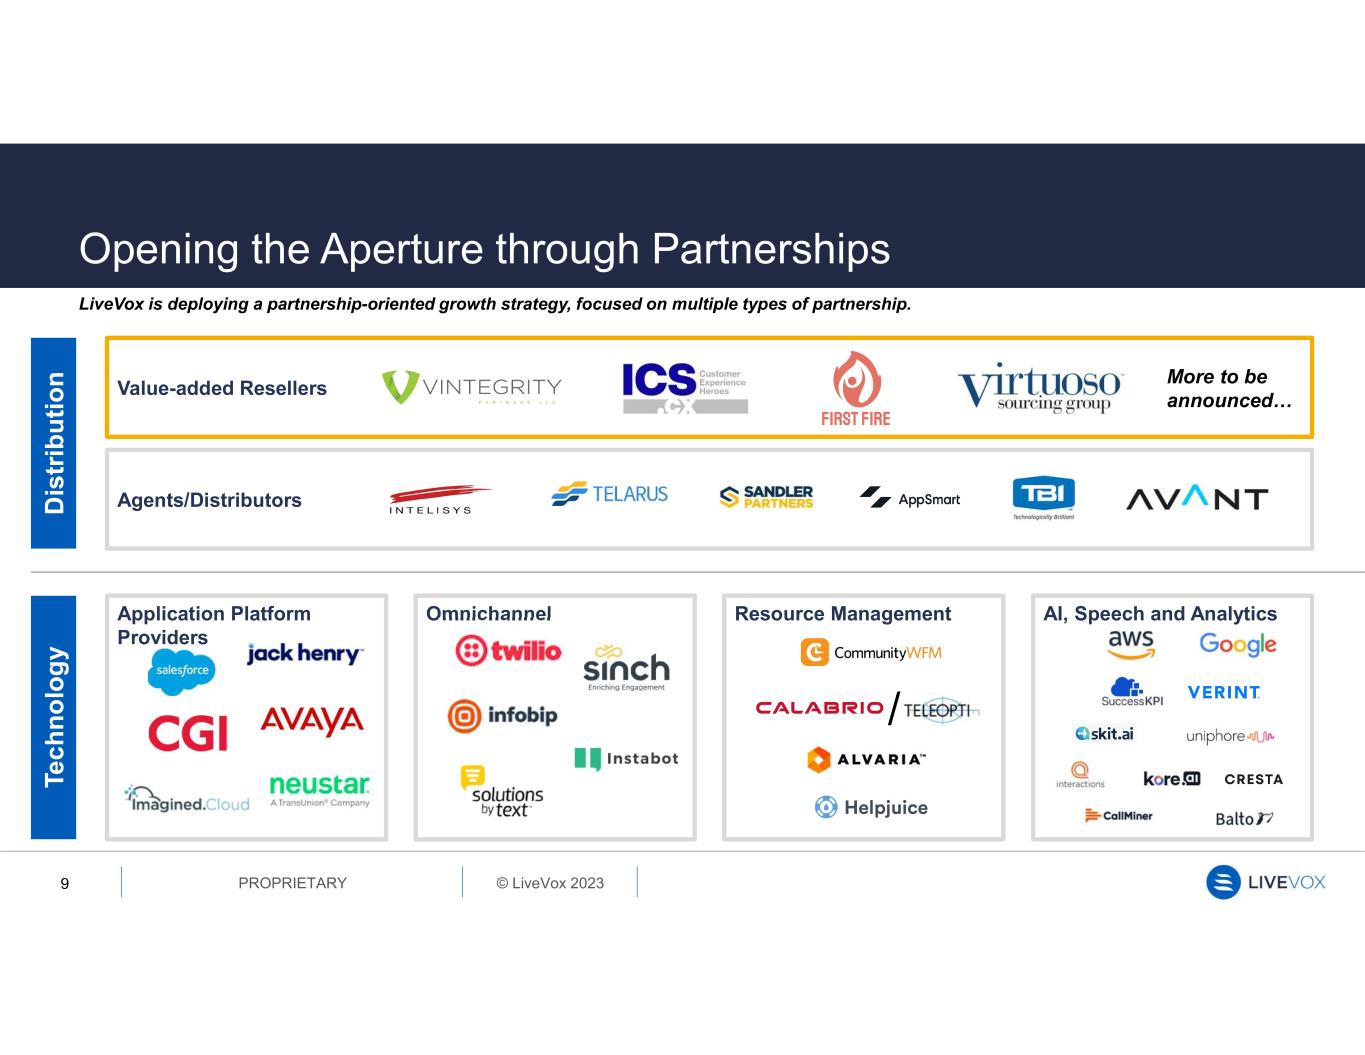
© LiveVox 2023PROPRIETARY Opening the Aperture through Partnerships 9 LiveVox is deploying a partnership-oriented growth strategy, focused on multiple types of partnership. D is tr ib u ti o n Value-added Resellers Agents/Distributors Te c h n o lo g y Application Platform Providers Omnichannel Resource Management AI, Speech and Analytics More to be announced… /
© LiveVox 2023PROPRIETARY Customer Profile at a Glance 10 Large, blue-chip customer base reliant on LiveVox's solutions with ARPC of ~$400K in CY2022 Scalability and platform sophistication attracts large enterprise and diversified BPO customers, representing ~72% of CY2022 revenue Deep competitive moat when customers require regulatory monitoring and reporting Historically focused on U.S., which represents 99%+ of total revenue in CY2022

© LiveVox 2023PROPRIETARY Strong Tailwinds Seen in the Business 11 Increasing Agent Productivity… …Leading to Higher Per Agent Revenue $100 $150 $200 $250 $300 $350 $400 $450 100 150 200 250 300 350 400 A ve ra g e R e ve n u e P e r A g e n t ( K ) C u st o m e r C o u n t Customer Count ARPC (Excl. Political) - Annualized (1) Average revenue per customer. (1) 5,000 5,500 6,000 6,500 7,000 7,500 8,000 Agent Productivity Gains with LiveVox Minutes per Agent per Month Minutes/Agent/mo Minutes/Agent/Year 2020 2021 2022 Clients experience sharp increase in productivity in initial years and incremental improvement thereafter
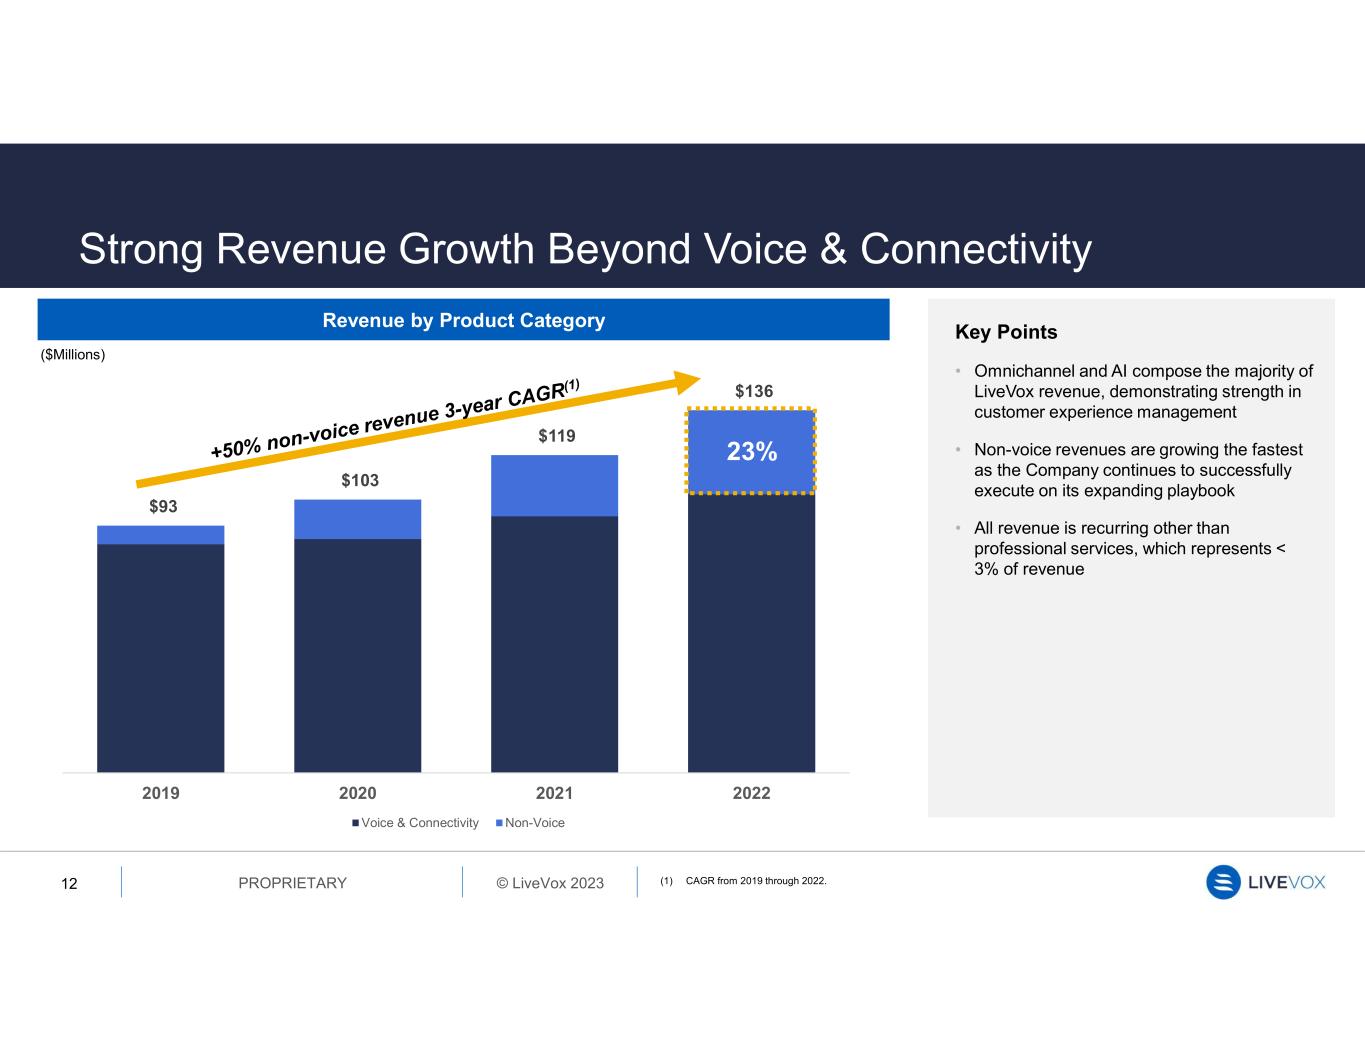
© LiveVox 2023PROPRIETARY $93 $103 $119 $136 2019 2020 2021 2022 Voice & Connectivity Non-Voice Key Points • Omnichannel and AI compose the majority of LiveVox revenue, demonstrating strength in customer experience management • Non-voice revenues are growing the fastest as the Company continues to successfully execute on its expanding playbook • All revenue is recurring other than professional services, which represents < 3% of revenue Strong Revenue Growth Beyond Voice & Connectivity 12 Revenue by Product Category ($Millions) (1) CAGR from 2019 through 2022. 23%
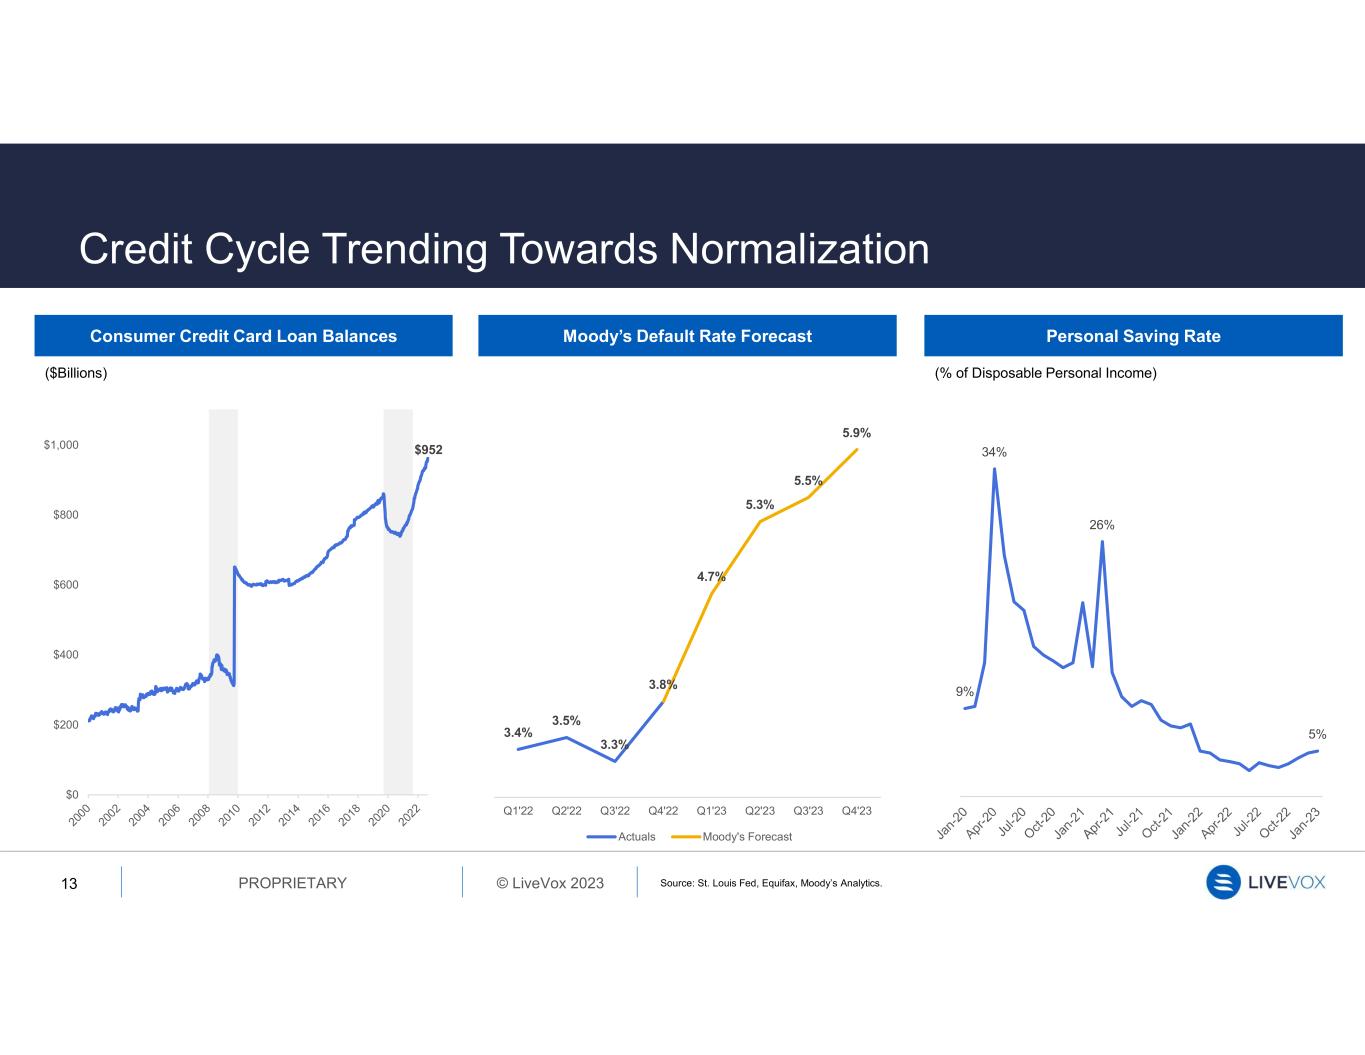
© LiveVox 2023PROPRIETARY Credit Cycle Trending Towards Normalization 13 3.4% 3.5% 3.3% 3.8% 4.7% 5.3% 5.5% 5.9% Q1'22 Q2'22 Q3'22 Q4'22 Q1'23 Q2'23 Q3'23 Q4'23 Actuals Moody's Forecast Consumer Credit Card Loan Balances Personal Saving Rate (% of Disposable Personal Income) Moody’s Default Rate Forecast ($Billions) $952 $0 $200 $400 $600 $800 $1,000 Source: St. Louis Fed, Equifax, Moody’s Analytics. 9% 34% 26% 5%
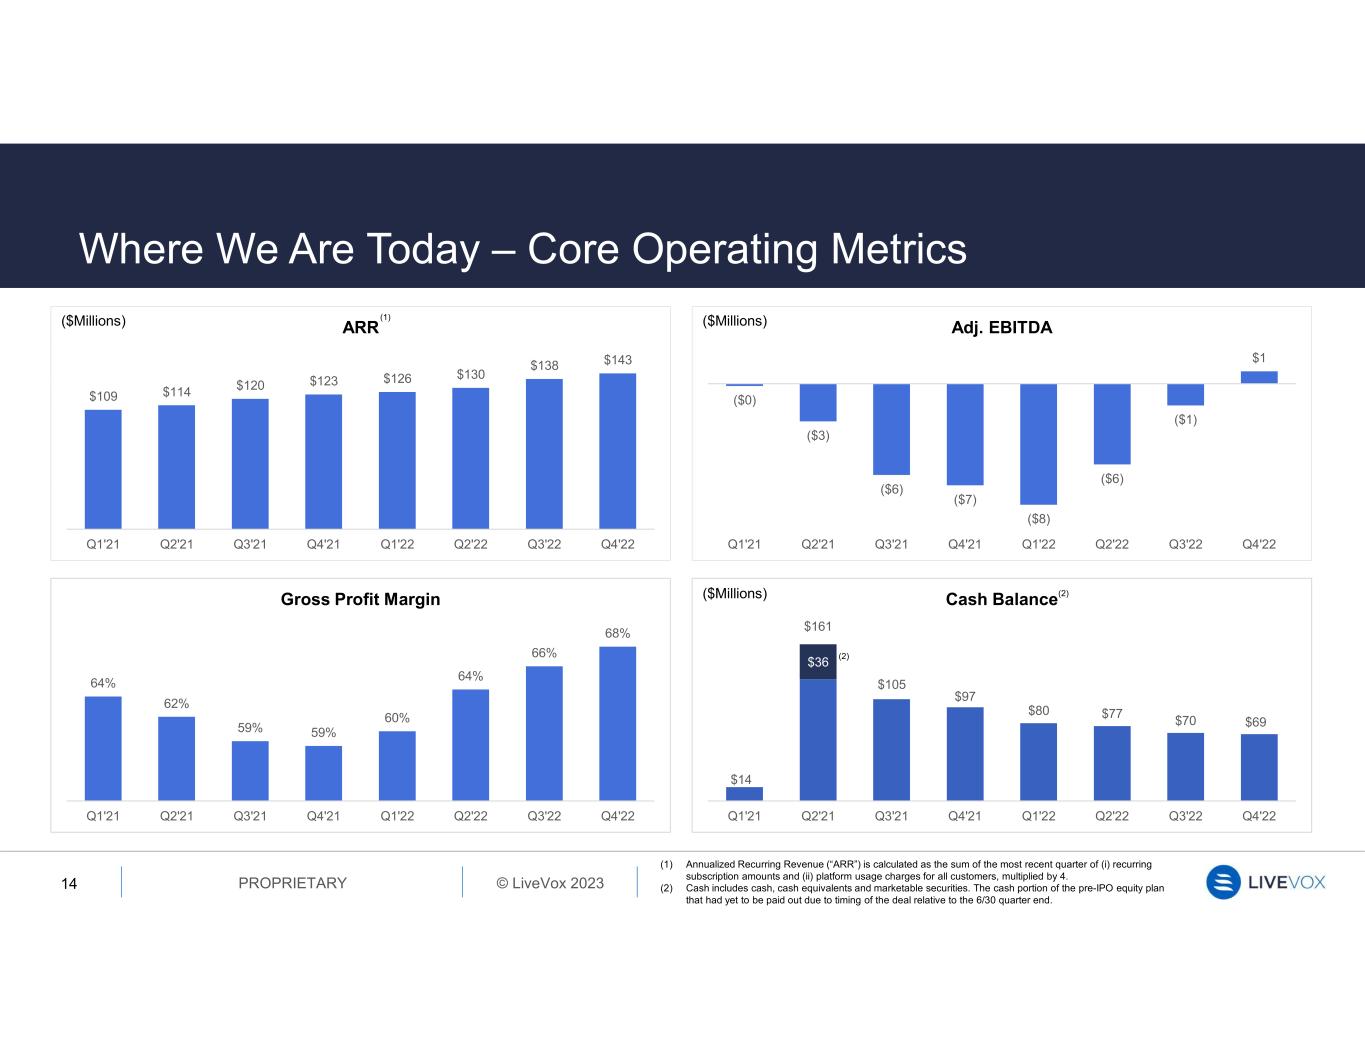
© LiveVox 2023PROPRIETARY Where We Are Today – Core Operating Metrics 14 64% 62% 59% 59% 60% 64% 66% 68% Q1'21 Q2'21 Q3'21 Q4'21 Q1'22 Q2'22 Q3'22 Q4'22 Gross Profit Margin $14 $161 $105 $97 $80 $77 $70 $69 $36 Q1'21 Q2'21 Q3'21 Q4'21 Q1'22 Q2'22 Q3'22 Q4'22 Cash Balance (1) Annualized Recurring Revenue (“ARR”) is calculated as the sum of the most recent quarter of (i) recurring subscription amounts and (ii) platform usage charges for all customers, multiplied by 4. (2) Cash includes cash, cash equivalents and marketable securities. The cash portion of the pre-IPO equity plan that had yet to be paid out due to timing of the deal relative to the 6/30 quarter end. (2) (2) ($Millions) ($Millions) ($Millions) ($0) ($3) ($6) ($7) ($8) ($6) ($1) $1 Q1'21 Q2'21 Q3'21 Q4'21 Q1'22 Q2'22 Q3'22 Q4'22 Adj. EBITDA $109 $114 $120 $123 $126 $130 $138 $143 Q1'21 Q2'21 Q3'21 Q4'21 Q1'22 Q2'22 Q3'22 Q4'22 ARR (1)

Financial Information
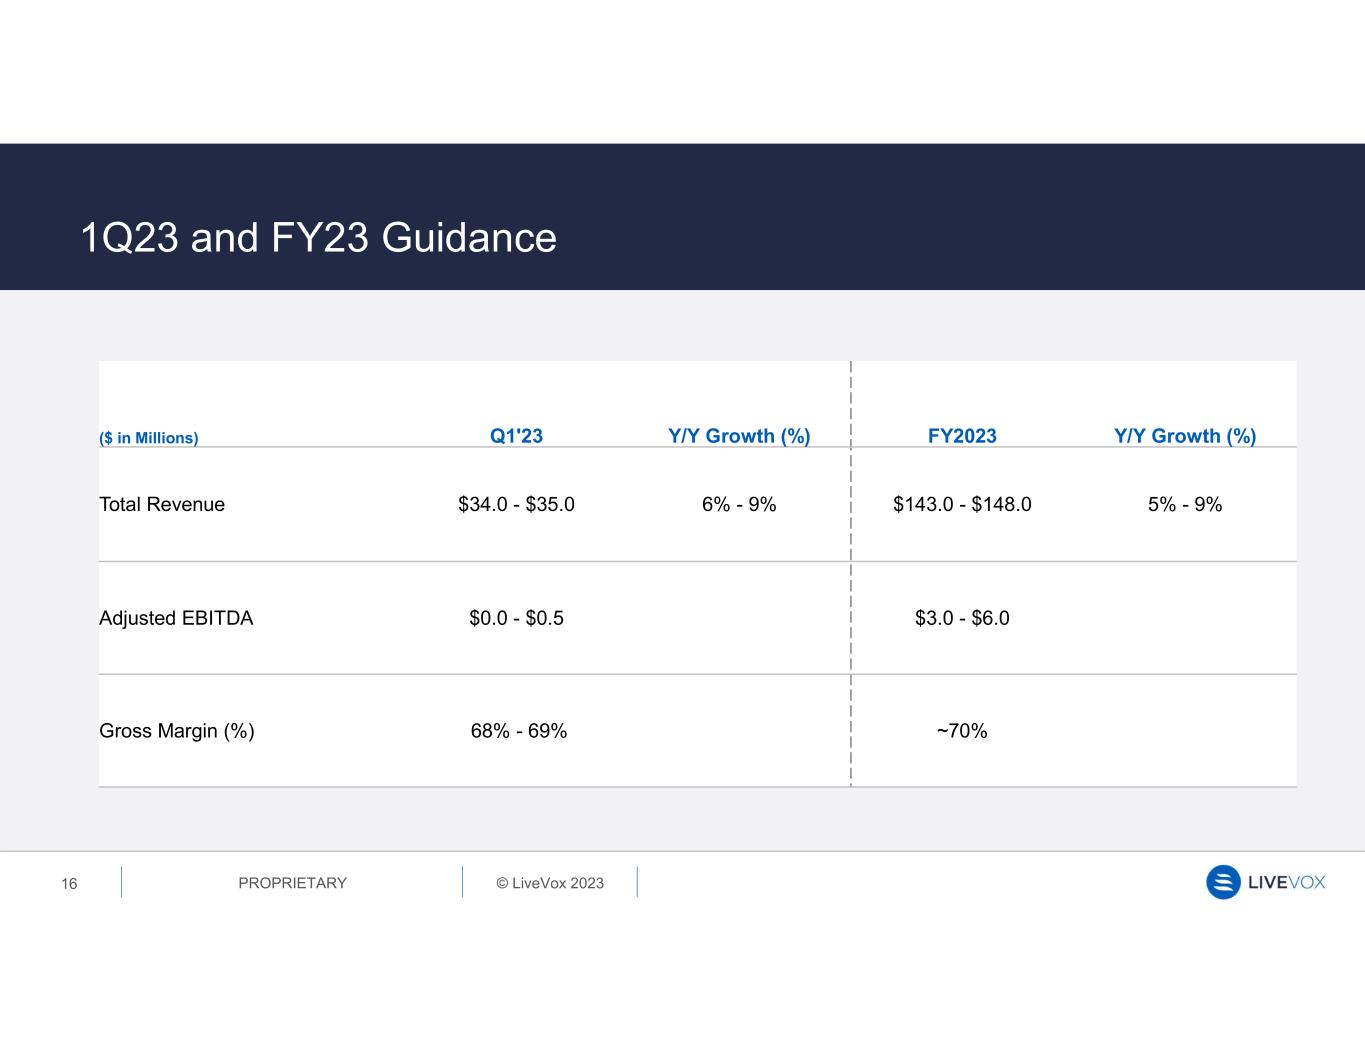
© LiveVox 2023PROPRIETARY 16 1Q23 and FY23 Guidance ($ in Millions) Q1'23 Y/Y Growth (%) FY2023 Y/Y Growth (%) Total Revenue $34.0 - $35.0 6% - 9% $143.0 - $148.0 5% - 9% Adjusted EBITDA $0.0 - $0.5 $3.0 - $6.0 Gross Margin (%) 68% - 69% ~70%
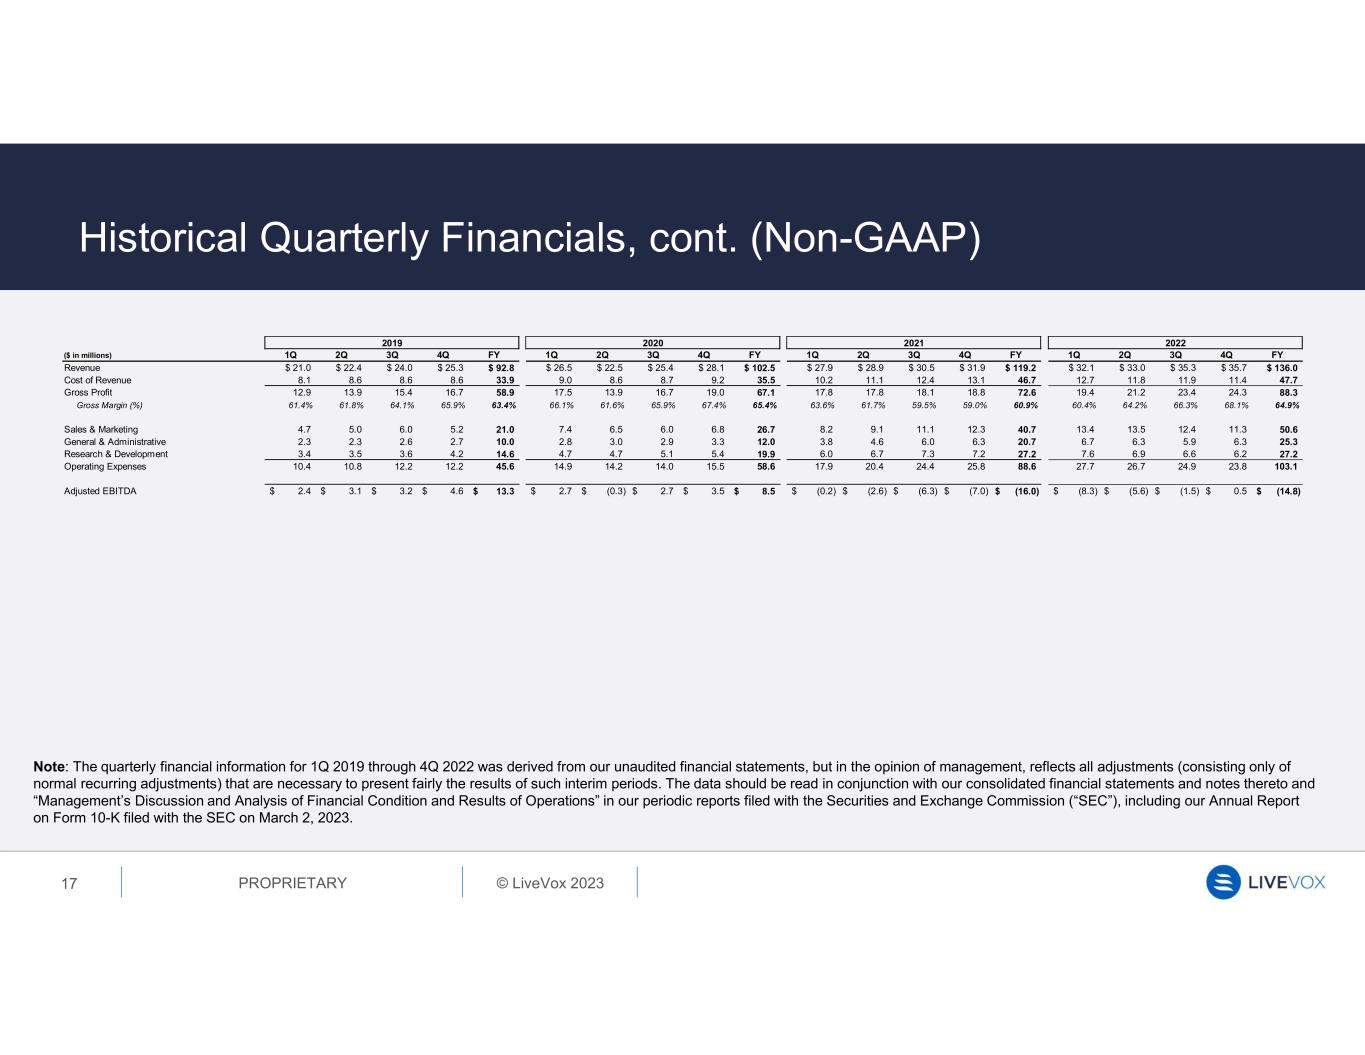
© LiveVox 2023PROPRIETARY 2019 2020 2021 2022 ($ in millions) 1Q 2Q 3Q 4Q FY 1Q 2Q 3Q 4Q FY 1Q 2Q 3Q 4Q FY 1Q 2Q 3Q 4Q FY Revenue $ 21.0 $ 22.4 $ 24.0 $ 25.3 $ 92.8 $ 26.5 $ 22.5 $ 25.4 $ 28.1 $ 102.5 $ 27.9 $ 28.9 $ 30.5 $ 31.9 $ 119.2 $ 32.1 $ 33.0 $ 35.3 $ 35.7 $ 136.0 Cost of Revenue 8.1 8.6 8.6 8.6 33.9 9.0 8.6 8.7 9.2 35.5 10.2 11.1 12.4 13.1 46.7 12.7 11.8 11.9 11.4 47.7 Gross Profit 12.9 13.9 15.4 16.7 58.9 17.5 13.9 16.7 19.0 67.1 17.8 17.8 18.1 18.8 72.6 19.4 21.2 23.4 24.3 88.3 Gross Margin (%) 61.4% 61.8% 64.1% 65.9% 63.4% 66.1% 61.6% 65.9% 67.4% 65.4% 63.6% 61.7% 59.5% 59.0% 60.9% 60.4% 64.2% 66.3% 68.1% 64.9% Sales & Marketing 4.7 5.0 6.0 5.2 21.0 7.4 6.5 6.0 6.8 26.7 8.2 9.1 11.1 12.3 40.7 13.4 13.5 12.4 11.3 50.6 General & Administrative 2.3 2.3 2.6 2.7 10.0 2.8 3.0 2.9 3.3 12.0 3.8 4.6 6.0 6.3 20.7 6.7 6.3 5.9 6.3 25.3 Research & Development 3.4 3.5 3.6 4.2 14.6 4.7 4.7 5.1 5.4 19.9 6.0 6.7 7.3 7.2 27.2 7.6 6.9 6.6 6.2 27.2 Operating Expenses 10.4 10.8 12.2 12.2 45.6 14.9 14.2 14.0 15.5 58.6 17.9 20.4 24.4 25.8 88.6 27.7 26.7 24.9 23.8 103.1 Adjusted EBITDA 2.4$ 3.1$ 3.2$ 4.6$ 13.3$ 2.7$ (0.3)$ 2.7$ 3.5$ 8.5$ (0.2)$ (2.6)$ (6.3)$ (7.0)$ (16.0)$ (8.3)$ (5.6)$ (1.5)$ 0.5$ (14.8)$ 17 Historical Quarterly Financials, cont. (Non-GAAP) Note: The quarterly financial information for 1Q 2019 through 4Q 2022 was derived from our unaudited financial statements, but in the opinion of management, reflects all adjustments (consisting only of normal recurring adjustments) that are necessary to present fairly the results of such interim periods. The data should be read in conjunction with our consolidated financial statements and notes thereto and “Management’s Discussion and Analysis of Financial Condition and Results of Operations” in our periodic reports filed with the Securities and Exchange Commission (“SEC”), including our Annual Report on Form 10-K filed with the SEC on March 2, 2023.
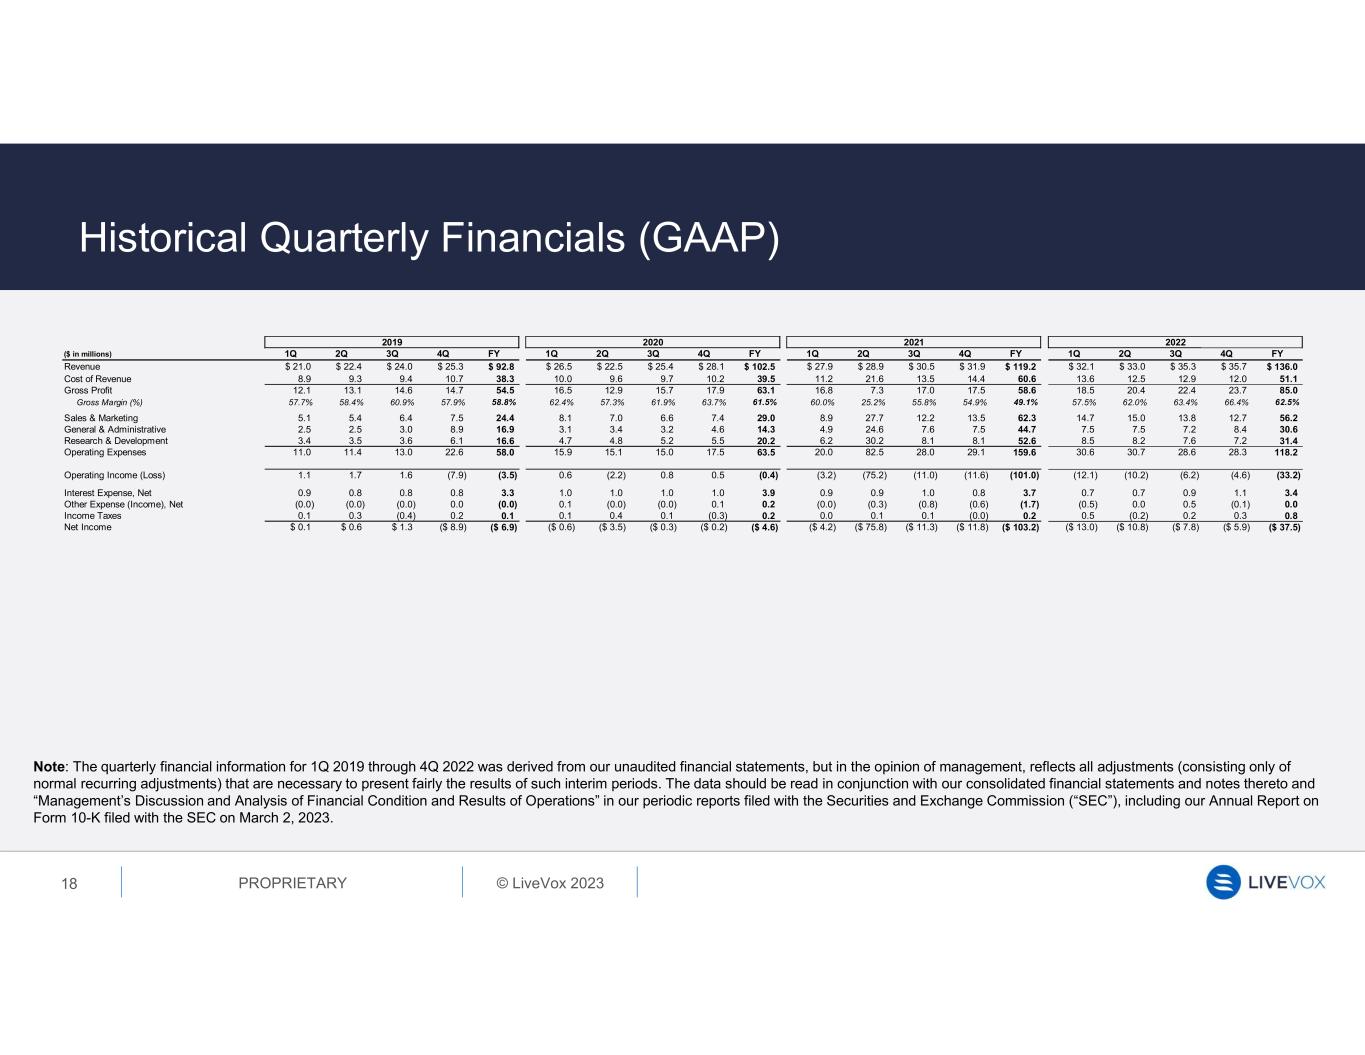
© LiveVox 2023PROPRIETARY 2019 2020 2021 2022 ($ in millions) 1Q 2Q 3Q 4Q FY 1Q 2Q 3Q 4Q FY 1Q 2Q 3Q 4Q FY 1Q 2Q 3Q 4Q FY Revenue $ 21.0 $ 22.4 $ 24.0 $ 25.3 $ 92.8 $ 26.5 $ 22.5 $ 25.4 $ 28.1 $ 102.5 $ 27.9 $ 28.9 $ 30.5 $ 31.9 $ 119.2 $ 32.1 $ 33.0 $ 35.3 $ 35.7 $ 136.0 Cost of Revenue 8.9 9.3 9.4 10.7 38.3 10.0 9.6 9.7 10.2 39.5 11.2 21.6 13.5 14.4 60.6 13.6 12.5 12.9 12.0 51.1 Gross Profit 12.1 13.1 14.6 14.7 54.5 16.5 12.9 15.7 17.9 63.1 16.8 7.3 17.0 17.5 58.6 18.5 20.4 22.4 23.7 85.0 Gross Margin (%) 57.7% 58.4% 60.9% 57.9% 58.8% 62.4% 57.3% 61.9% 63.7% 61.5% 60.0% 25.2% 55.8% 54.9% 49.1% 57.5% 62.0% 63.4% 66.4% 62.5% Sales & Marketing 5.1 5.4 6.4 7.5 24.4 8.1 7.0 6.6 7.4 29.0 8.9 27.7 12.2 13.5 62.3 14.7 15.0 13.8 12.7 56.2 General & Administrative 2.5 2.5 3.0 8.9 16.9 3.1 3.4 3.2 4.6 14.3 4.9 24.6 7.6 7.5 44.7 7.5 7.5 7.2 8.4 30.6 Research & Development 3.4 3.5 3.6 6.1 16.6 4.7 4.8 5.2 5.5 20.2 6.2 30.2 8.1 8.1 52.6 8.5 8.2 7.6 7.2 31.4 Operating Expenses 11.0 11.4 13.0 22.6 58.0 15.9 15.1 15.0 17.5 63.5 20.0 82.5 28.0 29.1 159.6 30.6 30.7 28.6 28.3 118.2 Operating Income (Loss) 1.1 1.7 1.6 (7.9) (3.5) 0.6 (2.2) 0.8 0.5 (0.4) (3.2) (75.2) (11.0) (11.6) (101.0) (12.1) (10.2) (6.2) (4.6) (33.2) Interest Expense, Net 0.9 0.8 0.8 0.8 3.3 1.0 1.0 1.0 1.0 3.9 0.9 0.9 1.0 0.8 3.7 0.7 0.7 0.9 1.1 3.4 Other Expense (Income), Net (0.0) (0.0) (0.0) 0.0 (0.0) 0.1 (0.0) (0.0) 0.1 0.2 (0.0) (0.3) (0.8) (0.6) (1.7) (0.5) 0.0 0.5 (0.1) 0.0 Income Taxes 0.1 0.3 (0.4) 0.2 0.1 0.1 0.4 0.1 (0.3) 0.2 0.0 0.1 0.1 (0.0) 0.2 0.5 (0.2) 0.2 0.3 0.8 Net Income $ 0.1 $ 0.6 $ 1.3 ($ 8.9) ($ 6.9) ($ 0.6) ($ 3.5) ($ 0.3) ($ 0.2) ($ 4.6) ($ 4.2) ($ 75.8) ($ 11.3) ($ 11.8) ($ 103.2) ($ 13.0) ($ 10.8) ($ 7.8) ($ 5.9) ($ 37.5) 18 Historical Quarterly Financials (GAAP) Note: The quarterly financial information for 1Q 2019 through 4Q 2022 was derived from our unaudited financial statements, but in the opinion of management, reflects all adjustments (consisting only of normal recurring adjustments) that are necessary to present fairly the results of such interim periods. The data should be read in conjunction with our consolidated financial statements and notes thereto and “Management’s Discussion and Analysis of Financial Condition and Results of Operations” in our periodic reports filed with the Securities and Exchange Commission (“SEC”), including our Annual Report on Form 10-K filed with the SEC on March 2, 2023.
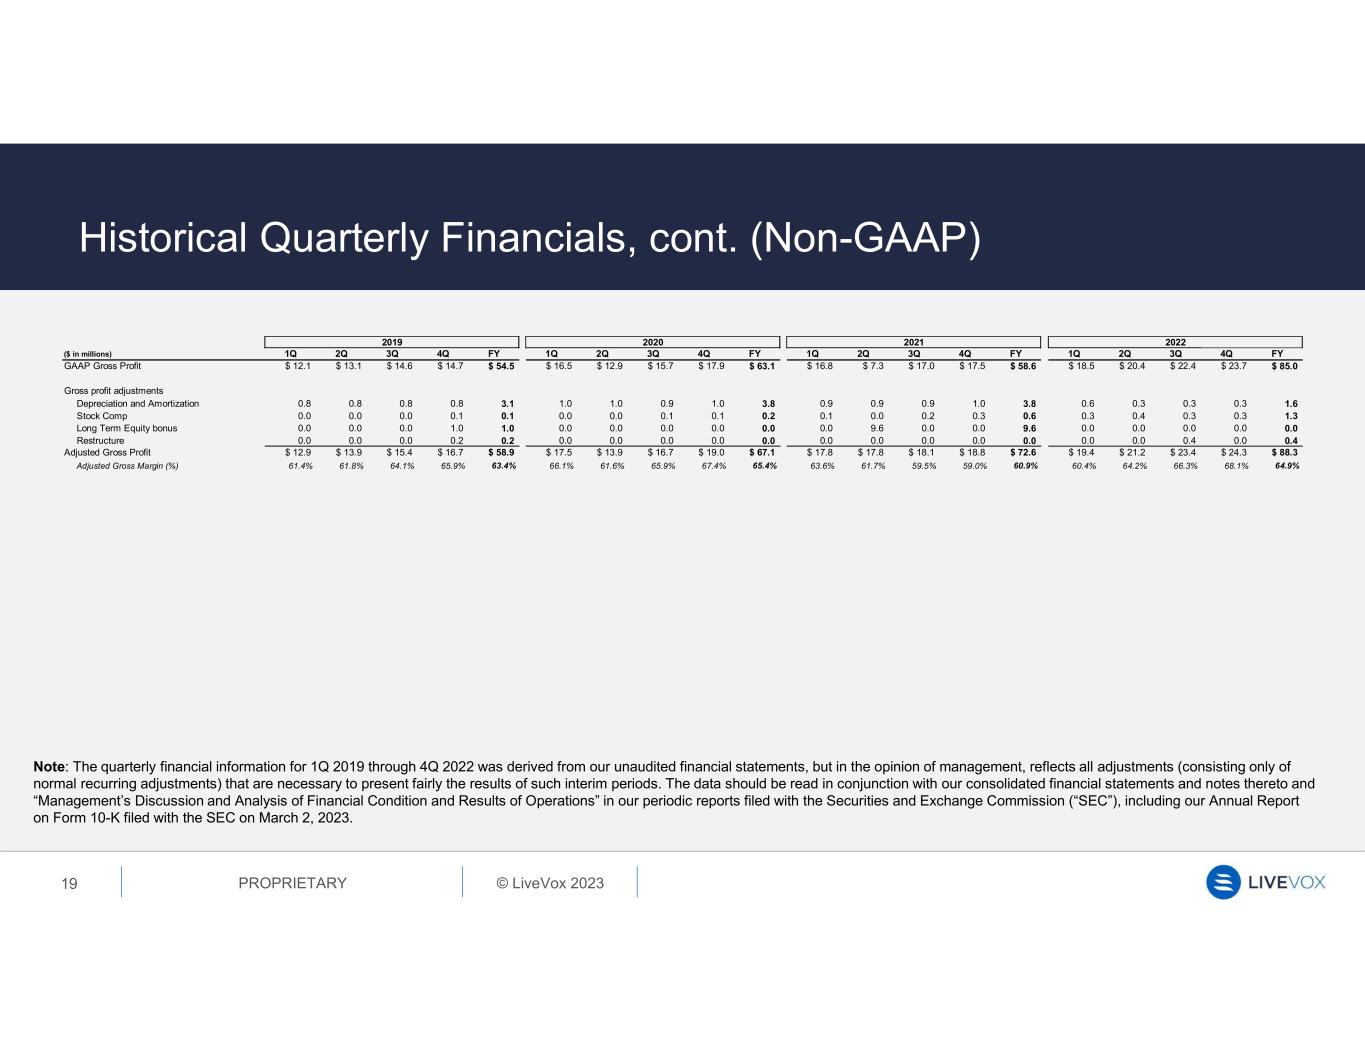
© LiveVox 2023PROPRIETARY 2019 2020 2021 2022 ($ in millions) 1Q 2Q 3Q 4Q FY 1Q 2Q 3Q 4Q FY 1Q 2Q 3Q 4Q FY 1Q 2Q 3Q 4Q FY GAAP Gross Profit $ 12.1 $ 13.1 $ 14.6 $ 14.7 $ 54.5 $ 16.5 $ 12.9 $ 15.7 $ 17.9 $ 63.1 $ 16.8 $ 7.3 $ 17.0 $ 17.5 $ 58.6 $ 18.5 $ 20.4 $ 22.4 $ 23.7 $ 85.0 Gross profit adjustments Depreciation and Amortization 0.8 0.8 0.8 0.8 3.1 1.0 1.0 0.9 1.0 3.8 0.9 0.9 0.9 1.0 3.8 0.6 0.3 0.3 0.3 1.6 Stock Comp 0.0 0.0 0.0 0.1 0.1 0.0 0.0 0.1 0.1 0.2 0.1 0.0 0.2 0.3 0.6 0.3 0.4 0.3 0.3 1.3 Long Term Equity bonus 0.0 0.0 0.0 1.0 1.0 0.0 0.0 0.0 0.0 0.0 0.0 9.6 0.0 0.0 9.6 0.0 0.0 0.0 0.0 0.0 Restructure 0.0 0.0 0.0 0.2 0.2 0.0 0.0 0.0 0.0 0.0 0.0 0.0 0.0 0.0 0.0 0.0 0.0 0.4 0.0 0.4 Adjusted Gross Profit $ 12.9 $ 13.9 $ 15.4 $ 16.7 $ 58.9 $ 17.5 $ 13.9 $ 16.7 $ 19.0 $ 67.1 $ 17.8 $ 17.8 $ 18.1 $ 18.8 $ 72.6 $ 19.4 $ 21.2 $ 23.4 $ 24.3 $ 88.3 Adjusted Gross Margin (%) 61.4% 61.8% 64.1% 65.9% 63.4% 66.1% 61.6% 65.9% 67.4% 65.4% 63.6% 61.7% 59.5% 59.0% 60.9% 60.4% 64.2% 66.3% 68.1% 64.9% 19 Historical Quarterly Financials, cont. (Non-GAAP) Note: The quarterly financial information for 1Q 2019 through 4Q 2022 was derived from our unaudited financial statements, but in the opinion of management, reflects all adjustments (consisting only of normal recurring adjustments) that are necessary to present fairly the results of such interim periods. The data should be read in conjunction with our consolidated financial statements and notes thereto and “Management’s Discussion and Analysis of Financial Condition and Results of Operations” in our periodic reports filed with the Securities and Exchange Commission (“SEC”), including our Annual Report on Form 10-K filed with the SEC on March 2, 2023.
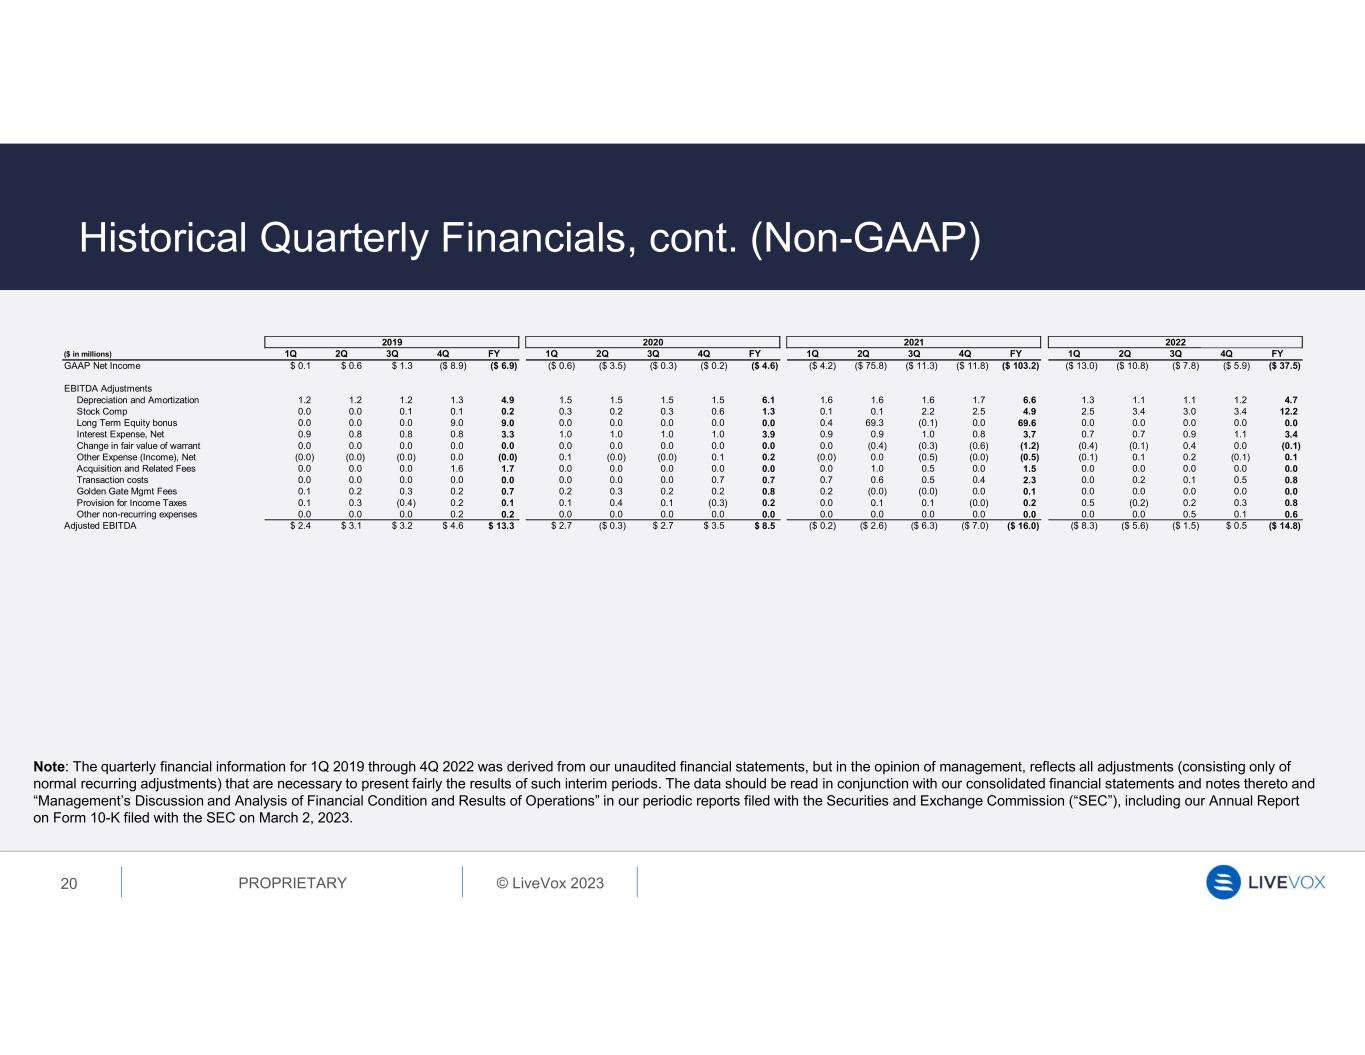
© LiveVox 2023PROPRIETARY 2019 2020 2021 2022 ($ in millions) 1Q 2Q 3Q 4Q FY 1Q 2Q 3Q 4Q FY 1Q 2Q 3Q 4Q FY 1Q 2Q 3Q 4Q FY GAAP Net Income $ 0.1 $ 0.6 $ 1.3 ($ 8.9) ($ 6.9) ($ 0.6) ($ 3.5) ($ 0.3) ($ 0.2) ($ 4.6) ($ 4.2) ($ 75.8) ($ 11.3) ($ 11.8) ($ 103.2) ($ 13.0) ($ 10.8) ($ 7.8) ($ 5.9) ($ 37.5) EBITDA Adjustments Depreciation and Amortization 1.2 1.2 1.2 1.3 4.9 1.5 1.5 1.5 1.5 6.1 1.6 1.6 1.6 1.7 6.6 1.3 1.1 1.1 1.2 4.7 Stock Comp 0.0 0.0 0.1 0.1 0.2 0.3 0.2 0.3 0.6 1.3 0.1 0.1 2.2 2.5 4.9 2.5 3.4 3.0 3.4 12.2 Long Term Equity bonus 0.0 0.0 0.0 9.0 9.0 0.0 0.0 0.0 0.0 0.0 0.4 69.3 (0.1) 0.0 69.6 0.0 0.0 0.0 0.0 0.0 Interest Expense, Net 0.9 0.8 0.8 0.8 3.3 1.0 1.0 1.0 1.0 3.9 0.9 0.9 1.0 0.8 3.7 0.7 0.7 0.9 1.1 3.4 Change in fair value of warrant 0.0 0.0 0.0 0.0 0.0 0.0 0.0 0.0 0.0 0.0 0.0 (0.4) (0.3) (0.6) (1.2) (0.4) (0.1) 0.4 0.0 (0.1) Other Expense (Income), Net (0.0) (0.0) (0.0) 0.0 (0.0) 0.1 (0.0) (0.0) 0.1 0.2 (0.0) 0.0 (0.5) (0.0) (0.5) (0.1) 0.1 0.2 (0.1) 0.1 Acquisition and Related Fees 0.0 0.0 0.0 1.6 1.7 0.0 0.0 0.0 0.0 0.0 0.0 1.0 0.5 0.0 1.5 0.0 0.0 0.0 0.0 0.0 Transaction costs 0.0 0.0 0.0 0.0 0.0 0.0 0.0 0.0 0.7 0.7 0.7 0.6 0.5 0.4 2.3 0.0 0.2 0.1 0.5 0.8 Golden Gate Mgmt Fees 0.1 0.2 0.3 0.2 0.7 0.2 0.3 0.2 0.2 0.8 0.2 (0.0) (0.0) 0.0 0.1 0.0 0.0 0.0 0.0 0.0 Provision for Income Taxes 0.1 0.3 (0.4) 0.2 0.1 0.1 0.4 0.1 (0.3) 0.2 0.0 0.1 0.1 (0.0) 0.2 0.5 (0.2) 0.2 0.3 0.8 Other non-recurring expenses 0.0 0.0 0.0 0.2 0.2 0.0 0.0 0.0 0.0 0.0 0.0 0.0 0.0 0.0 0.0 0.0 0.0 0.5 0.1 0.6 Adjusted EBITDA $ 2.4 $ 3.1 $ 3.2 $ 4.6 $ 13.3 $ 2.7 ($ 0.3) $ 2.7 $ 3.5 $ 8.5 ($ 0.2) ($ 2.6) ($ 6.3) ($ 7.0) ($ 16.0) ($ 8.3) ($ 5.6) ($ 1.5) $ 0.5 ($ 14.8) 20 Historical Quarterly Financials, cont. (Non-GAAP) Note: The quarterly financial information for 1Q 2019 through 4Q 2022 was derived from our unaudited financial statements, but in the opinion of management, reflects all adjustments (consisting only of normal recurring adjustments) that are necessary to present fairly the results of such interim periods. The data should be read in conjunction with our consolidated financial statements and notes thereto and “Management’s Discussion and Analysis of Financial Condition and Results of Operations” in our periodic reports filed with the Securities and Exchange Commission (“SEC”), including our Annual Report on Form 10-K filed with the SEC on March 2, 2023.
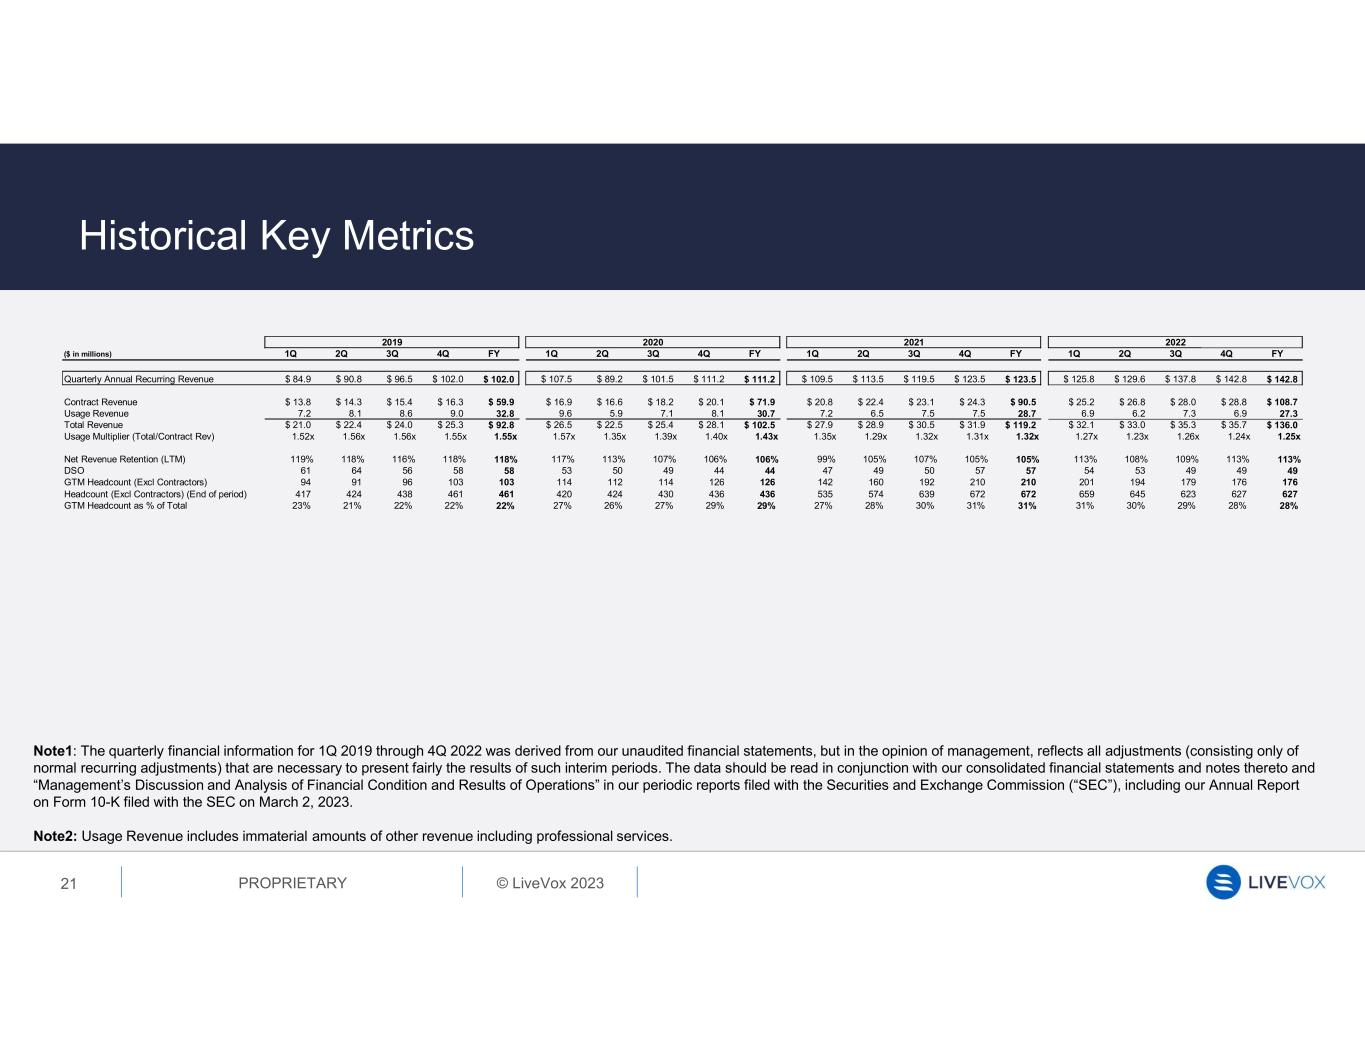
© LiveVox 2023PROPRIETARY 2019 2020 2021 2022 ($ in millions) 1Q 2Q 3Q 4Q FY 1Q 2Q 3Q 4Q FY 1Q 2Q 3Q 4Q FY 1Q 2Q 3Q 4Q FY Quarterly Annual Recurring Revenue $ 84.9 $ 90.8 $ 96.5 $ 102.0 $ 102.0 $ 107.5 $ 89.2 $ 101.5 $ 111.2 $ 111.2 $ 109.5 $ 113.5 $ 119.5 $ 123.5 $ 123.5 $ 125.8 $ 129.6 $ 137.8 $ 142.8 $ 142.8 Contract Revenue $ 13.8 $ 14.3 $ 15.4 $ 16.3 $ 59.9 $ 16.9 $ 16.6 $ 18.2 $ 20.1 $ 71.9 $ 20.8 $ 22.4 $ 23.1 $ 24.3 $ 90.5 $ 25.2 $ 26.8 $ 28.0 $ 28.8 $ 108.7 Usage Revenue 7.2 8.1 8.6 9.0 32.8 9.6 5.9 7.1 8.1 30.7 7.2 6.5 7.5 7.5 28.7 6.9 6.2 7.3 6.9 27.3 Total Revenue $ 21.0 $ 22.4 $ 24.0 $ 25.3 $ 92.8 $ 26.5 $ 22.5 $ 25.4 $ 28.1 $ 102.5 $ 27.9 $ 28.9 $ 30.5 $ 31.9 $ 119.2 $ 32.1 $ 33.0 $ 35.3 $ 35.7 $ 136.0 Usage Multiplier (Total/Contract Rev) 1.52x 1.56x 1.56x 1.55x 1.55x 1.57x 1.35x 1.39x 1.40x 1.43x 1.35x 1.29x 1.32x 1.31x 1.32x 1.27x 1.23x 1.26x 1.24x 1.25x Net Revenue Retention (LTM) 119% 118% 116% 118% 118% 117% 113% 107% 106% 106% 99% 105% 107% 105% 105% 113% 108% 109% 113% 113% DSO 61 64 56 58 58 53 50 49 44 44 47 49 50 57 57 54 53 49 49 49 GTM Headcount (Excl Contractors) 94 91 96 103 103 114 112 114 126 126 142 160 192 210 210 201 194 179 176 176 Headcount (Excl Contractors) (End of period) 417 424 438 461 461 420 424 430 436 436 535 574 639 672 672 659 645 623 627 627 GTM Headcount as % of Total 23% 21% 22% 22% 22% 27% 26% 27% 29% 29% 27% 28% 30% 31% 31% 31% 30% 29% 28% 28% Note1: The quarterly financial information for 1Q 2019 through 4Q 2022 was derived from our unaudited financial statements, but in the opinion of management, reflects all adjustments (consisting only of normal recurring adjustments) that are necessary to present fairly the results of such interim periods. The data should be read in conjunction with our consolidated financial statements and notes thereto and “Management’s Discussion and Analysis of Financial Condition and Results of Operations” in our periodic reports filed with the Securities and Exchange Commission (“SEC”), including our Annual Report on Form 10-K filed with the SEC on March 2, 2023. Note2: Usage Revenue includes immaterial amounts of other revenue including professional services. 21 Historical Key Metrics
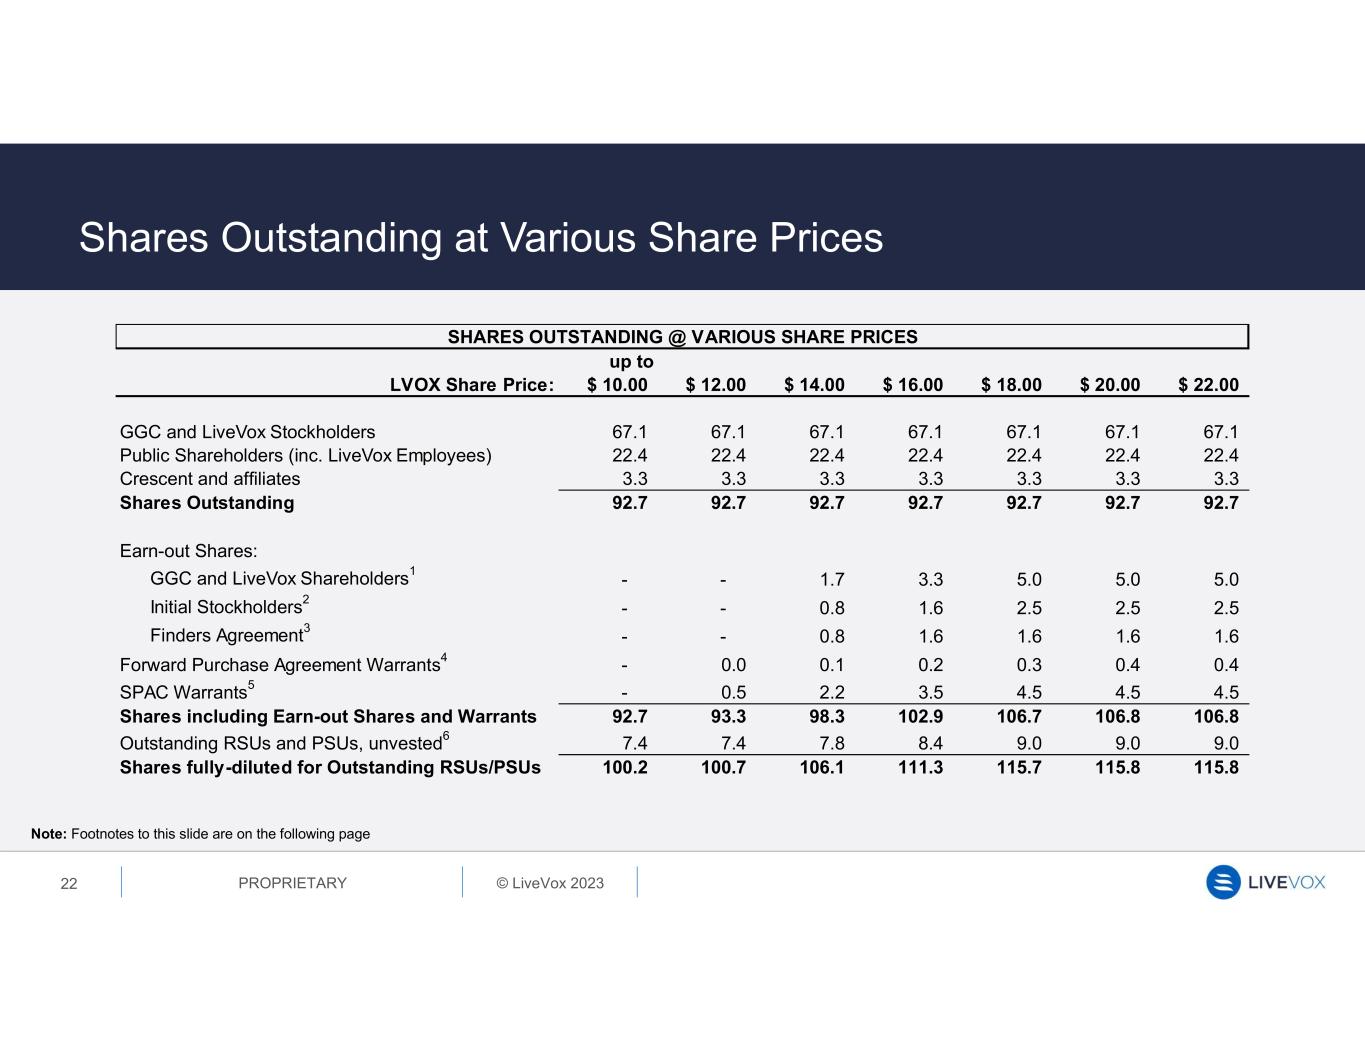
© LiveVox 2023PROPRIETARY 22 Shares Outstanding at Various Share Prices Note: Footnotes to this slide are on the following page up to LVOX Share Price: $ 10.00 $ 12.00 $ 14.00 $ 16.00 $ 18.00 $ 20.00 $ 22.00 GGC and LiveVox Stockholders 67.1 67.1 67.1 67.1 67.1 67.1 67.1 Public Shareholders (inc. LiveVox Employees) 22.4 22.4 22.4 22.4 22.4 22.4 22.4 Crescent and affiliates 3.3 3.3 3.3 3.3 3.3 3.3 3.3 Shares Outstanding 92.7 92.7 92.7 92.7 92.7 92.7 92.7 Earn-out Shares: GGC and LiveVox Shareholders1 - - 1.7 3.3 5.0 5.0 5.0 Initial Stockholders2 - - 0.8 1.6 2.5 2.5 2.5 Finders Agreement3 - - 0.8 1.6 1.6 1.6 1.6 Forward Purchase Agreement Warrants4 - 0.0 0.1 0.2 0.3 0.4 0.4 SPAC Warrants5 - 0.5 2.2 3.5 4.5 4.5 4.5 Shares including Earn-out Shares and Warrants 92.7 93.3 98.3 102.9 106.7 106.8 106.8 Outstanding RSUs and PSUs, unvested6 7.4 7.4 7.8 8.4 9.0 9.0 9.0 Shares fully-diluted for Outstanding RSUs/PSUs 100.2 100.7 106.1 111.3 115.7 115.8 115.8 SHARES OUTSTANDING @ VARIOUS SHARE PRICES
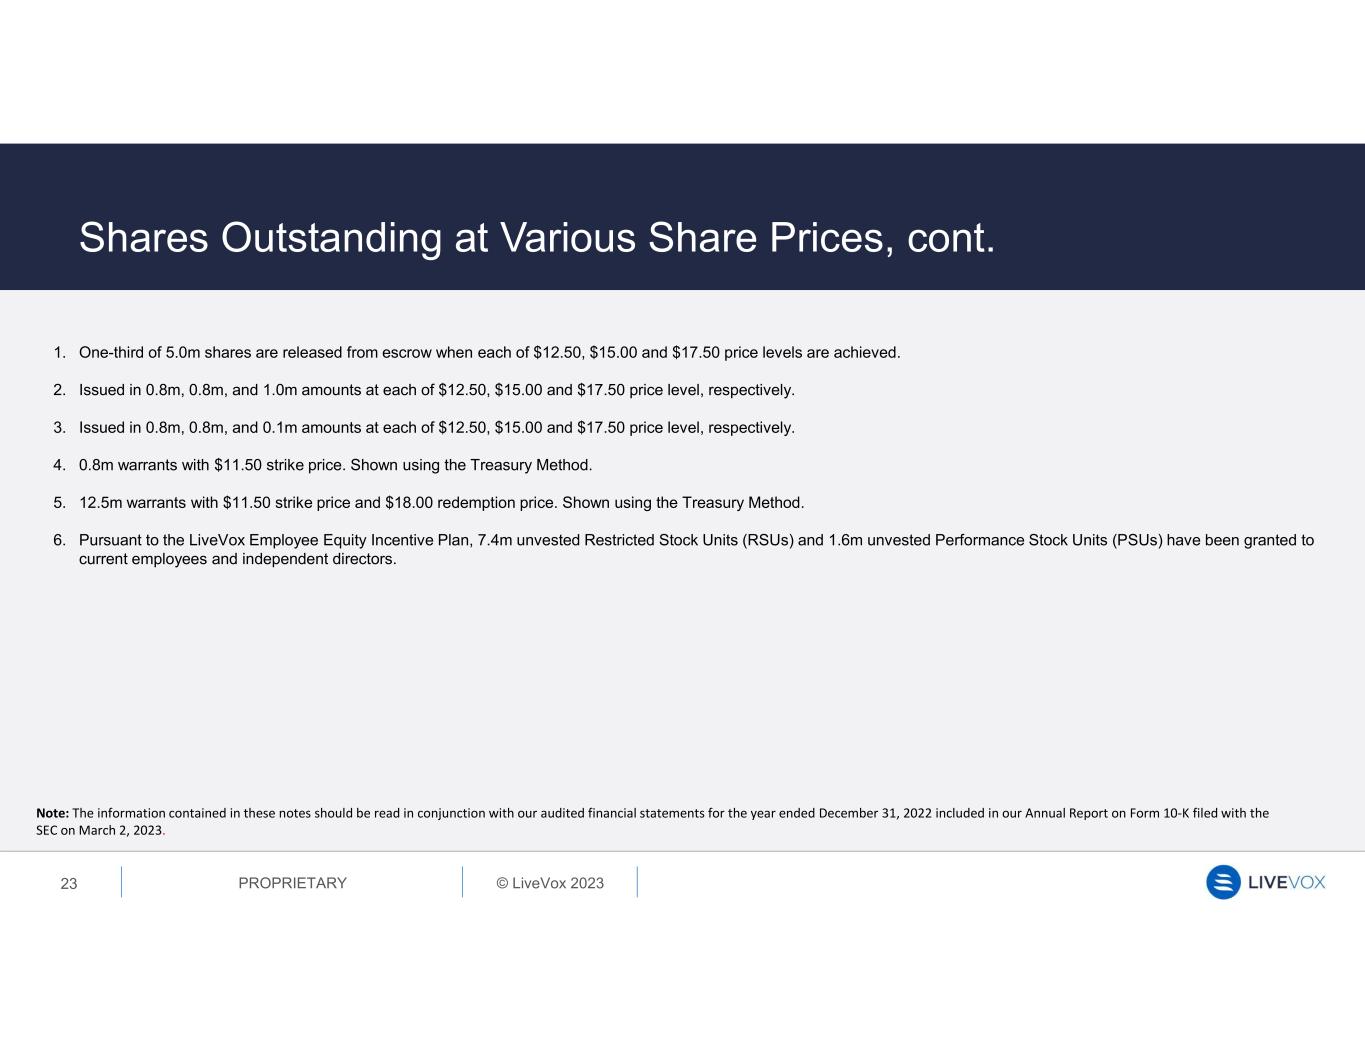
© LiveVox 2023PROPRIETARY 23 Shares Outstanding at Various Share Prices, cont. 1. One-third of 5.0m shares are released from escrow when each of $12.50, $15.00 and $17.50 price levels are achieved. 2. Issued in 0.8m, 0.8m, and 1.0m amounts at each of $12.50, $15.00 and $17.50 price level, respectively. 3. Issued in 0.8m, 0.8m, and 0.1m amounts at each of $12.50, $15.00 and $17.50 price level, respectively. 4. 0.8m warrants with $11.50 strike price. Shown using the Treasury Method. 5. 12.5m warrants with $11.50 strike price and $18.00 redemption price. Shown using the Treasury Method. 6. Pursuant to the LiveVox Employee Equity Incentive Plan, 7.4m unvested Restricted Stock Units (RSUs) and 1.6m unvested Performance Stock Units (PSUs) have been granted to current employees and independent directors. Note: The information contained in these notes should be read in conjunction with our audited financial statements for the year ended December 31, 2022 included in our Annual Report on Form 10-K filed with the SEC on March 2, 2023.
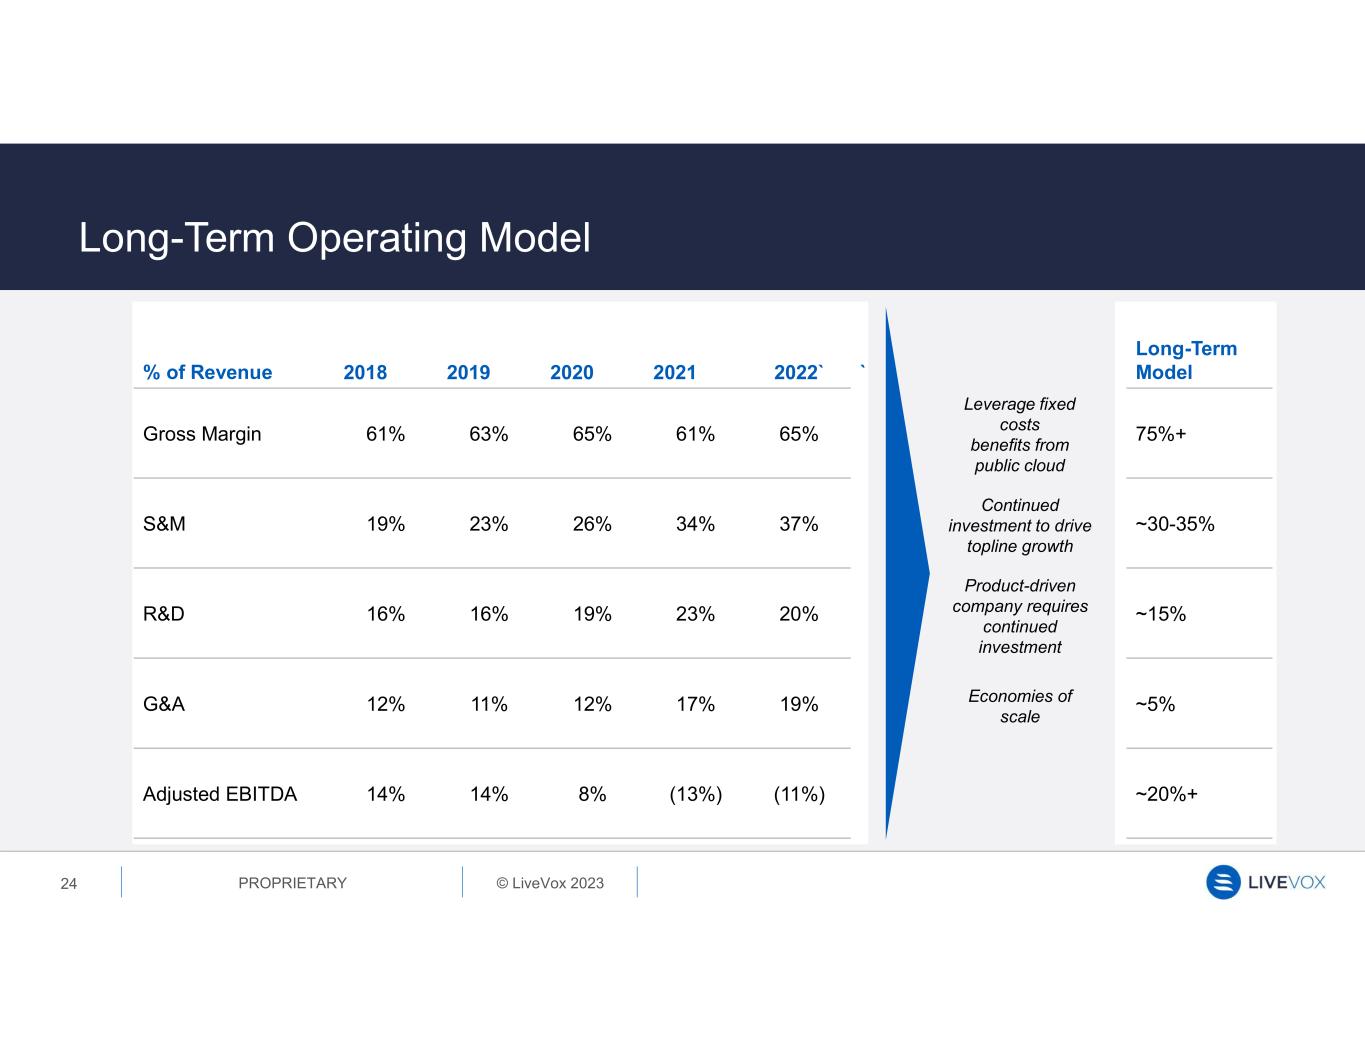
© LiveVox 2023PROPRIETARY % of Revenue 2018 2019 2020 2021 2022` ` Long-Term Model Gross Margin 61% 63% 65% 61% 65% 75%+ S&M 19% 23% 26% 34% 37% ~30-35% R&D 16% 16% 19% 23% 20% ~15% G&A 12% 11% 12% 17% 19% ~5% Adjusted EBITDA 14% 14% 8% (13%) (11%) ~20%+ 24 Long-Term Operating Model Economies of scale Product-driven company requires continued investment Continued investment to drive topline growth Leverage fixed costs benefits from public cloud
Q&A


