
Datto Inaugural Investor Day December 9, 2021

Agenda Time Topic Presenter 1:05 – 1:25pm Sustainable Growth in the Age of the MSP Tim Weller | Chief Executive Officer 1:25 - 1:50pm Datto’s Differentiated Products and Technology Bob Petrocelli | Chief Technology Officer 1:50 – 2:00pm Securing Datto Ryan Weeks | Chief Information Security Officer 10 MINUTE BREAK 2:10 – 2:35pm The Power of Channel Leverage Sanjay Singh | Chief Revenue Officer 2:35 – 3:00pm MSP Perspectives Fireside Chat Chris McCloskey | Chief Customer Officer 3:00 – 3:20pm Q&A Tim Weller, Bob Petrocelli, Sanjay Singh, Radhesh Menon 10 MINUTE BREAK 3:30 – 3:50pm Sustainable Growth and Profitability at Scale John Abbot | Chief Financial Officer 3:50 – 4:10pm Q&A Tim Weller, John Abbot, Nat Katz

Today’s Presenters Chris McCloskey Chief Customer Officer MSP Perspectives Fireside Chat Ryan Weeks CISO Securing Datto Datto’s Differentiated Products & Technology Bob Petrocelli CTO Radhesh Menon Chief Product Officer Sustainable Growth & Profitability at Scale John Abbot CFO Tim Weller CEO Sustainable Growth in the Age of the MSP The Power of Channel Leverage Sanjay Singh Chief Revenue Officer Nat Katz SVP, Finance

Logistics Notes Masks Required for Live Attendees Questions Submitted via Webcast for Virtual Attendees

Safe Harbor Forward-Looking Statements This presentation contains forward-looking statements that reflect Datto’s current expectations and projections with respect to, among other things, its financial condition, results of operations, plans, objectives, future performance and business. These statements may be preceded by, followed by or include the words ‘‘anticipate,’’ ‘‘estimate,’’ ‘‘expect,’’ ‘‘project,’’ ‘‘plan,’’ ‘‘intend,’’ ‘‘believe,’’ ‘‘may,’’ ‘‘will,’’ ‘‘should,’’ ‘‘can have,’’ ‘‘likely,” “goal,’’ “target” and the negatives thereof and other words and terms of similar meaning. Further information on potential factors that could affect our results is included in our Annual Report on Form 10-K and our Quarterly Reports on Form 10-Q. Forward-looking statements include all statements that are not historical facts. Such forward-looking statements are subject to various risks and uncertainties. Accordingly, there are or will be important factors that could cause actual outcomes or results to differ materially from those indicated in these statements. There is no assurance that any forward-looking statements will materialize. You are cautioned not to place undue reliance on forward-looking statements, which reflect expectations only as of this date. Datto does not undertake any obligation to publicly update or review any forward-looking statement, whether as a result of new information, future developments or otherwise. Market and Industry Data This presentation includes information concerning economic conditions, Datto’s industry, Datto’s markets and Datto’s competitive position that is based on a variety of sources, including information from independent industry analysts and publications, as well as Datto’s own estimates and research. Datto’s estimates are derived from publicly available information released by third party sources, as well as data from its internal research, and are based on such data and Datto’s knowledge of its industry, which Datto believes to be reasonable. The independent industry publications used in this presentation were not prepared on Datto’s behalf. While Datto is not aware of any misstatements regarding any information in this presentation, forecasts, assumptions, expectations, beliefs, estimates and projects involve risk and uncertainties and are subject to change based on various factors. Non-GAAP Financial Measures This presentation contains the financial measures Adjusted EBITDA, Non-GAAP Gross Profit, Free Cash Flow, Non-GAAP Sales and Marketing Expense and related margins which are not recognized under generally accepted accounting principles in the United States (“GAAP”). Datto believes that non-GAAP financial information, when taken collectively, may be helpful to investors because it provides consistency and comparability with past financial performance and assists in comparisons with other companies, some of which use similar non-GAAP financial information to supplement their GAAP results. The non-GAAP financial information is presented for supplemental informational purposes only, and should not be considered a substitute for financial information presented in accordance with GAAP, and may be different from similarly-titled non-GAAP measures used by other companies. Adjusted EBITDA, Non-GAAP Gross Profit, Free Cash Flow, Non-GAAP Sales and Marketing Expense and related margins have limitations as analytical tools, and you should not consider these measures either in isolation or as substitutes for other methods of analyzing the results as reported under GAAP. A reconciliation of Adjusted EBITDA, Non-GAAP Gross Profit and Free Cash Flow to the most directly comparable GAAP financial measure can be found at the end of this presentation.

Sustainable Growth in the Age of the MSP Tim Weller | Chief Executive Officer

Path to 20% Sustainable Growth Surpass $1 Billion in 2024
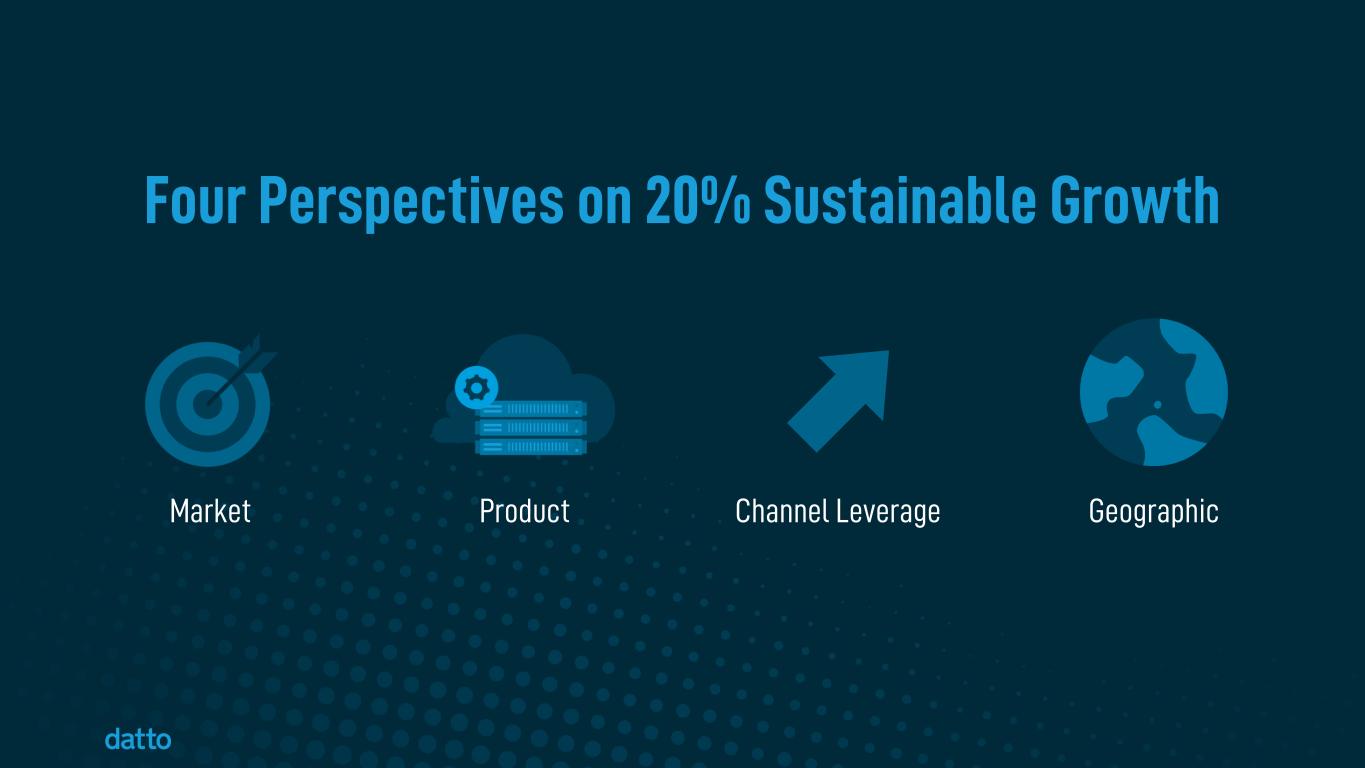
Four Perspectives on 20% Sustainable Growth Market Product Channel Leverage Geographic
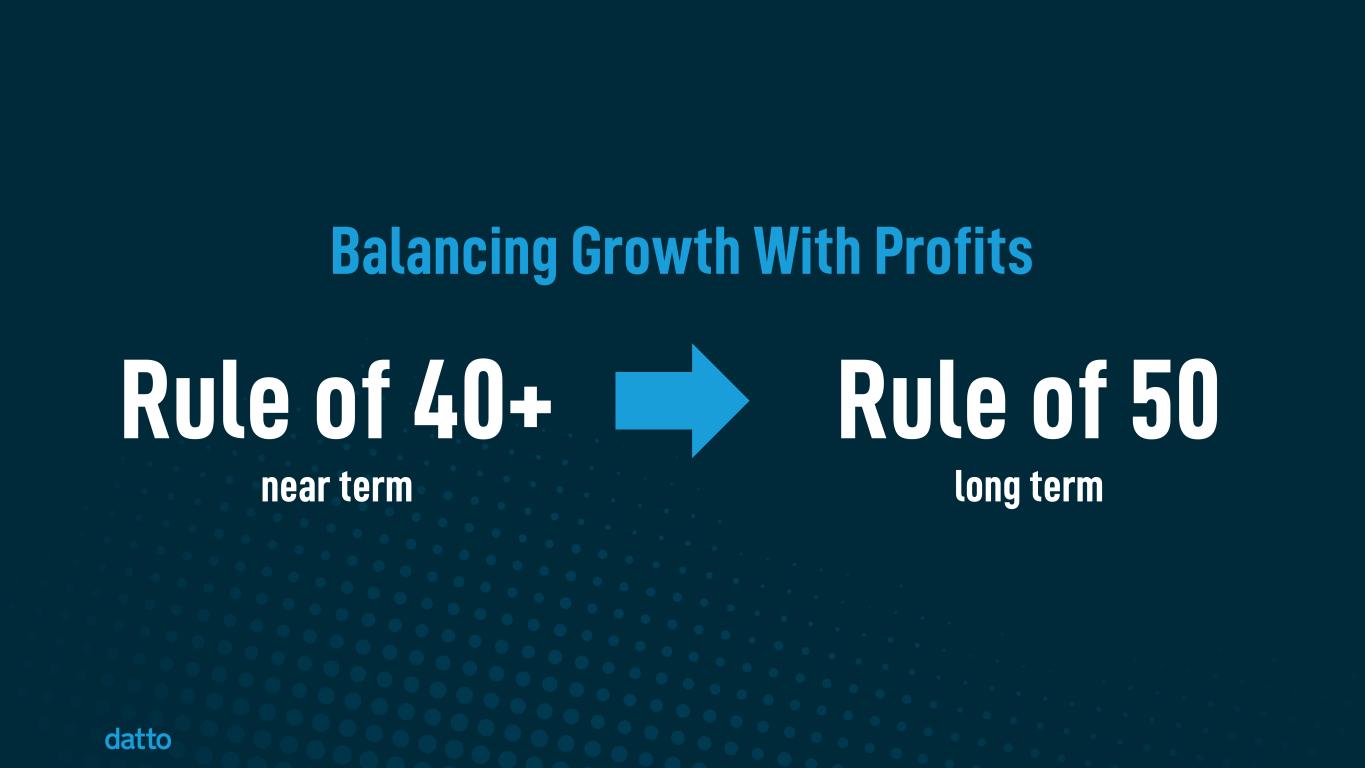
Balancing Growth With Profits Rule of 40+ near term Rule of 50 long term

I. Market Perspective

The MSP Market is Massive and Fast-Growing
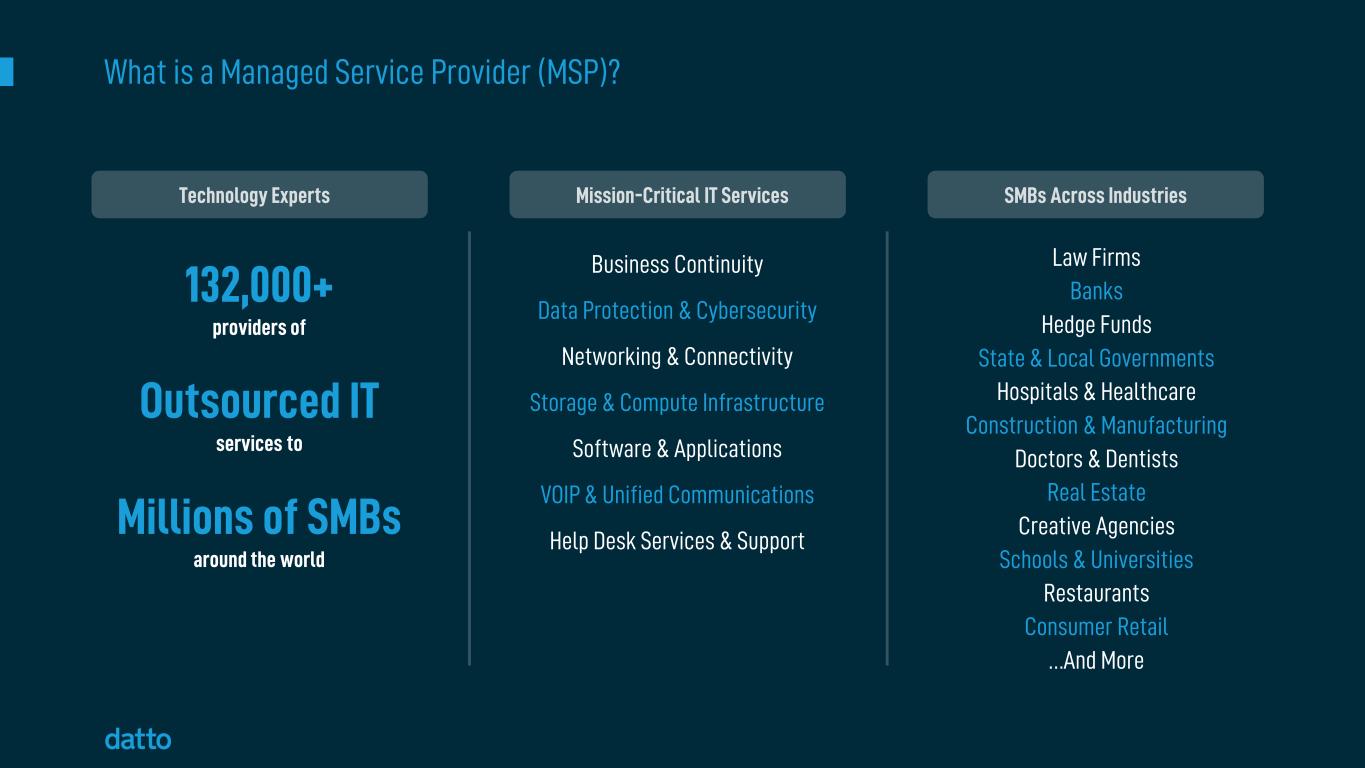
What is a Managed Service Provider (MSP)? 132,000+ providers of Outsourced IT services to Millions of SMBs around the world SMBs Across IndustriesMission-Critical IT Services Law Firms Banks Hedge Funds State & Local Governments Hospitals & Healthcare Construction & Manufacturing Doctors & Dentists Real Estate Creative Agencies Schools & Universities Restaurants Consumer Retail …And More Technology Experts Business Continuity Data Protection & Cybersecurity Networking & Connectivity Storage & Compute Infrastructure Software & Applications VOIP & Unified Communications Help Desk Services & Support

SMBs are Overwhelmed by the Expanding Challenges of IT Management Substantial Cost of Downtime Too Many Technology Choices Heightened Security Threats Evolving Technologies Lack Resources and Expertise Increased Regulatory Requirements Difficulty of Optimizing Environment
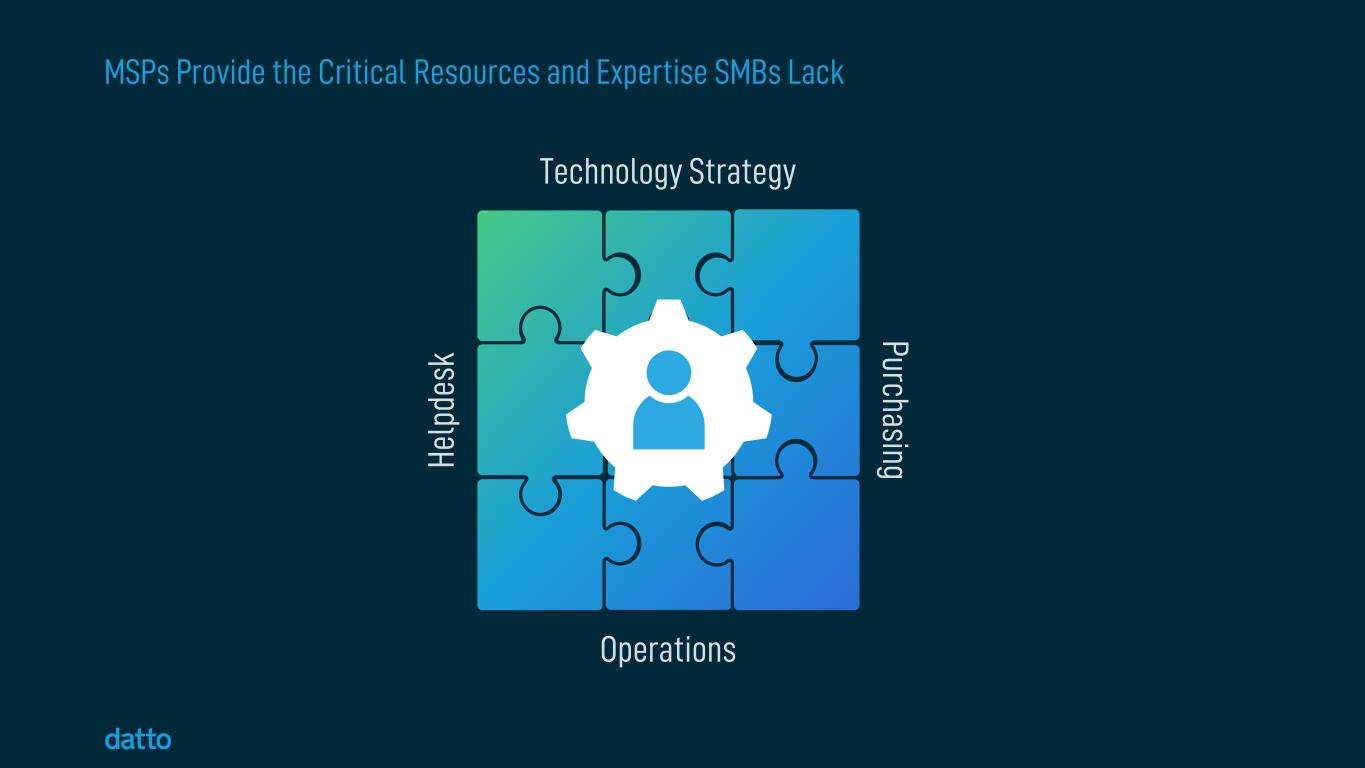
MSPs Provide the Critical Resources and Expertise SMBs Lack PurchasingHe lp de sk Technology Strategy Operations

132K MSPs Managing $193Bn 13.4% Datto Global TAM: $36Bn 17.2% Global SMB IT Spend: $1.3Tn 4.5% MSP Market Serving SMB Clients is Massive and Growing Source: Frost & Sullivan, Market Intelligence Refresh on the Global TAM Assessment on the Managed Service Provider Market, 2021; Gartner, Forecast Analysis: Small-and-Midsize Business IT Spending, Worldwide MSPs SMBs

MSPs are Moving Beyond SMB Clients GovernmentEnterprise Education

Secular Trends Driving MSP Demand… Shift to Cloud Cyber AttacksTech Labor ShortageRemote WorkDigital Transformation

Shift to CloudDigital Transformation …Accelerating in the New World of Work Remote Work Tech Labor Shortage Cyber Attacks

MSPs are Now in the Security Business
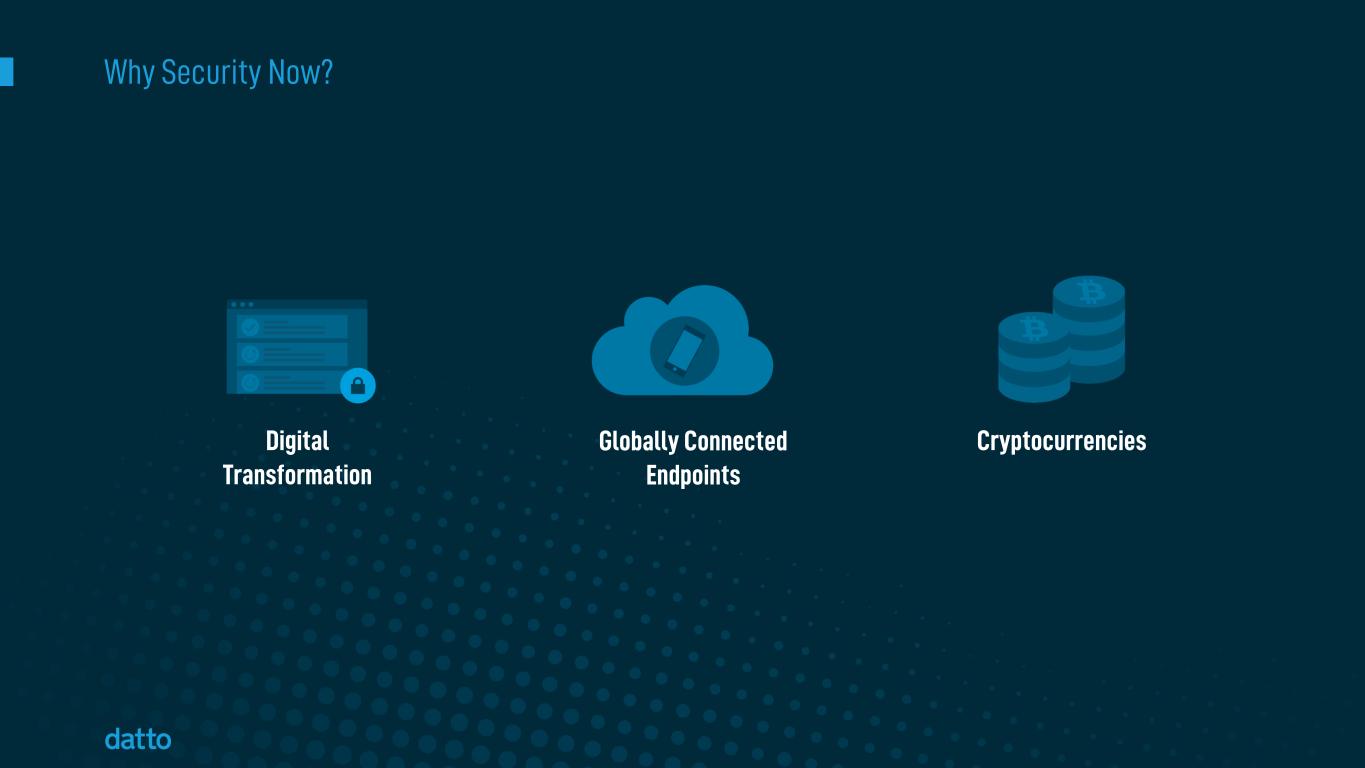
Why Security Now? CryptocurrenciesDigital Transformation Globally Connected Endpoints

Secure MSPs Secure Clients Secure Datto MSPs will choose vendors with the best security MSPs will grow selling security solutions

Datto is the Leading Pure-play in the MSP Market

Reason #1 – Culture

Our Guiding Principles Play the Long Game Save MSPs Time Always MSP Definable Technology Advantage Great Margin Opportunity

Reason #2 – Deep MSP Relationships
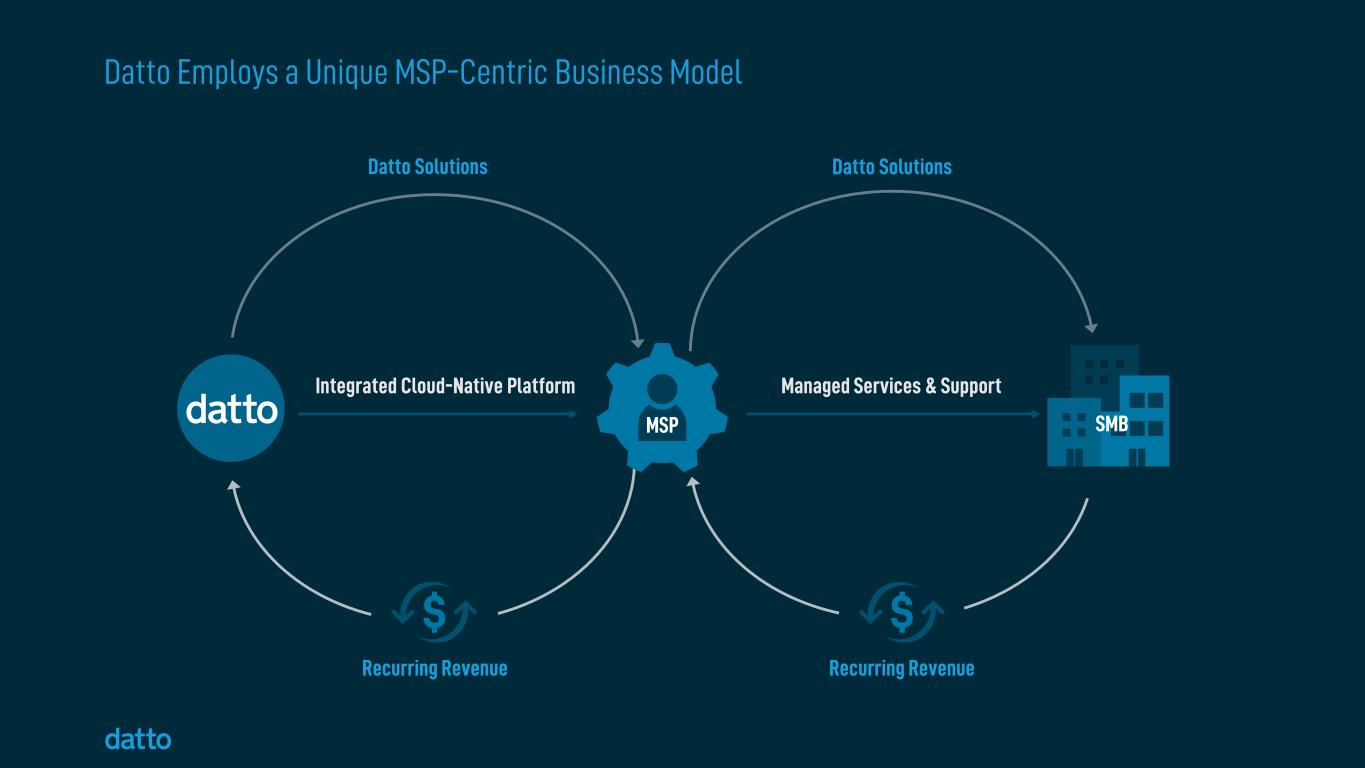
Datto Employs a Unique MSP-Centric Business Model Integrated Cloud-Native Platform Managed Services & Support Recurring Revenue Datto Solutions MSP SMB Recurring Revenue Datto Solutions MSP SMB
Reason #3 – Solve MSP Pain Points

Datto Helps MSPs Run Their Business From Top to Bottom • Recurring revenue products for MSPs to “sell-through” • Products that secure digital assets for SMB clients • Sales and Marketing tools and support • DattoCon and MSP events for best practices • Integrated Datto platform for MSPs • Superior product reliability • Datto private cloud • No published prices to SMBs • Complete, turnkey solutions easy to deploy and manage remotely • CRM, quoting, and invoicing business management software • Training and certifications Recurring Revenue Profitable Margin Scalable Operations Datto Purpose-Built Solutions Datto Drives…MSP Pain Points Revenue Margin Efficiency

Datto is Riding the Wave of MSP Growth MSP Market 13% Datto Revenue 20% MSP market and Datto TAM growth rates source: Frost & Sullivan, Market Intelligence Refresh on the Global TAM Assessment on the Managed Service Provider Market, 2021 Datto TAM 17%
II. Product Perspective

NIST Cybersecurity Framework RMM SaaS Defense RMM Ransomware Detection Continuity SaaS Protection Ransomware Detection
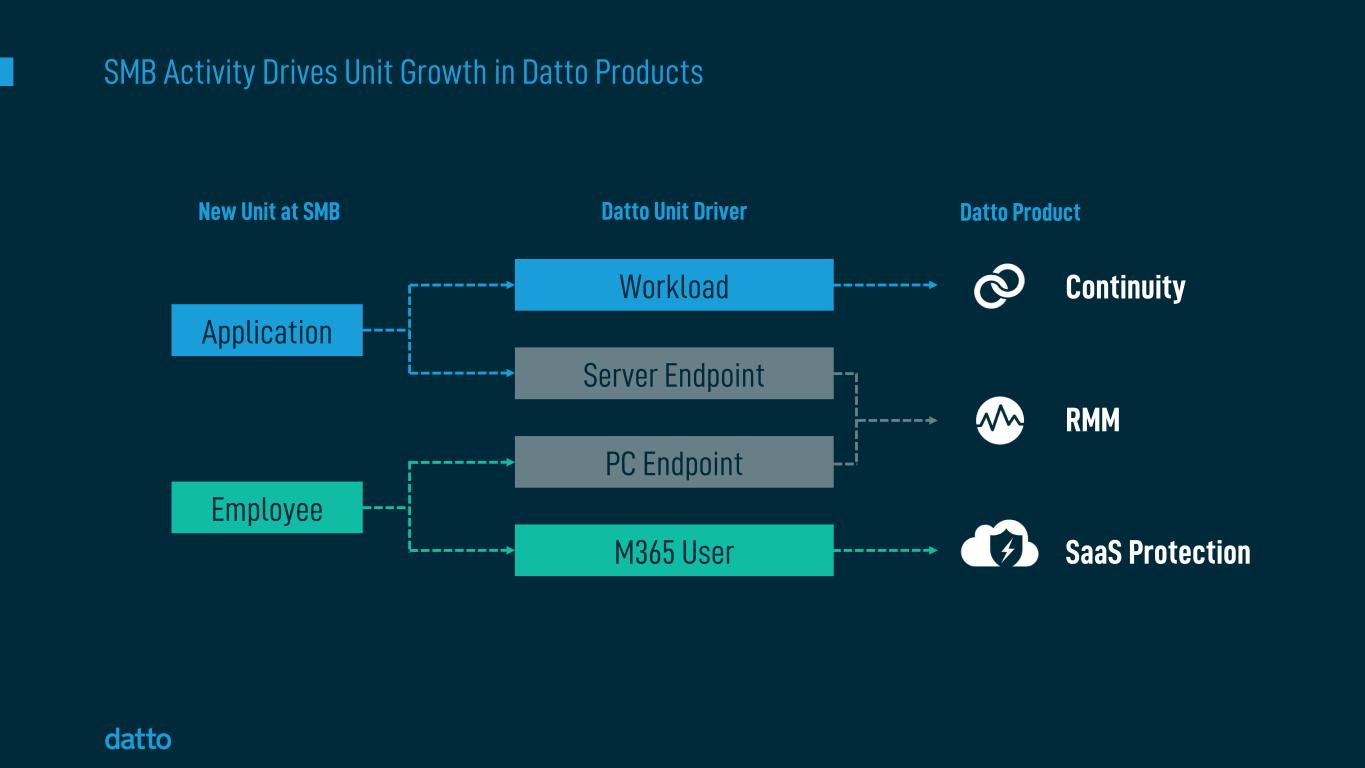
SMB Activity Drives Unit Growth in Datto Products New Unit at SMB Datto Unit Driver Datto Product Application Employee Workload Server Endpoint PC Endpoint M365 User Continuity RMM SaaS Protection
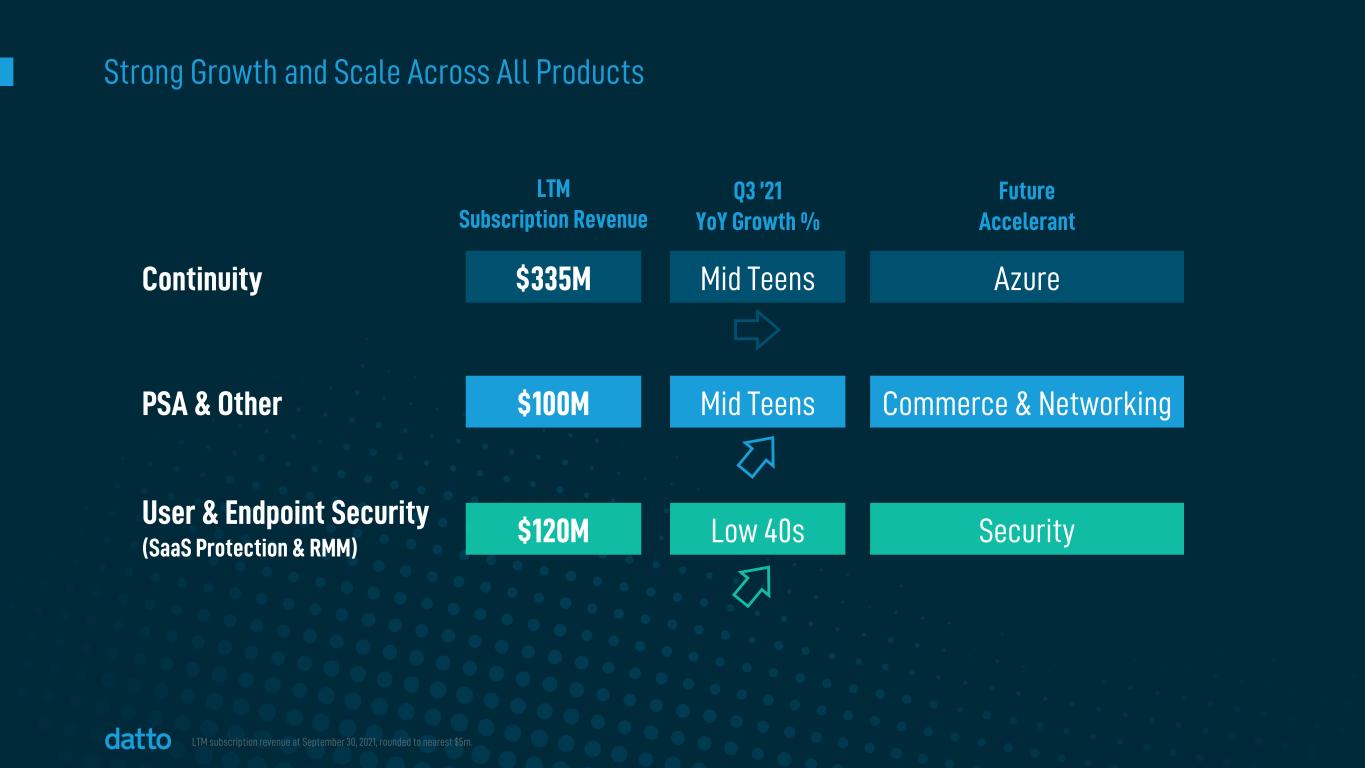
LTM Subscription Revenue Q3 ’21 YoY Growth % Mid Teens Low 40s Mid Teens Continuity User & Endpoint Security (SaaS Protection & RMM) PSA & Other Future Accelerant Azure Security Commerce & Networking $335M $120M $100M LTM subscription revenue at September 30, 2021, rounded to nearest $5m. Strong Growth and Scale Across All Products

Diversified Revenue Growth Evolution CONTINUITY (incl. Azure) PSA & OTHER USER & ENDPOINT SECURITY Surpass $1 Billion 2024E 2024E based on assumptions of 5-10% MSP Count annual growth and 10-15% ARR/MSP annual growth.

III. Channel Leverage Perspective

MSP-centric Model Solves the Challenges of Serving the SMB Market SALES LEVERAGE One Datto Sales Rep… …Through Dozens Of MSP Partners… …Can Reach Thousands Of SMB Customers ARR from MSP Partners Naturally Expands As MSPs Add More Customers & Solutions NATURAL REVENUE EXPANSION If an MSP Loses an SMB, the MSP Can Migrate the Datto Stack to Another SMB Customer CHURN PROTECTION SUPPORT & SERVICES LEVERAGE Aided by Datto Direct-to-Tech Support MSPs Provide Direct Support

18,200 MSPs Served $34K ARR per MSP Values as of September 30, 2021

Uncapped Model With Multiple Vectors of Embedded Growth $34K18.2K $627M MSPs x ARR per MSP = ARR Values as of September 30, 2021

Uncapped Model With Multiple Vectors of Embedded Growth ARR/MSP $34K18.2K $627M MSPs x SMBs/MSP x Products/SMB x Units/Product x $/Unit = ARR Values as of September 30, 2021
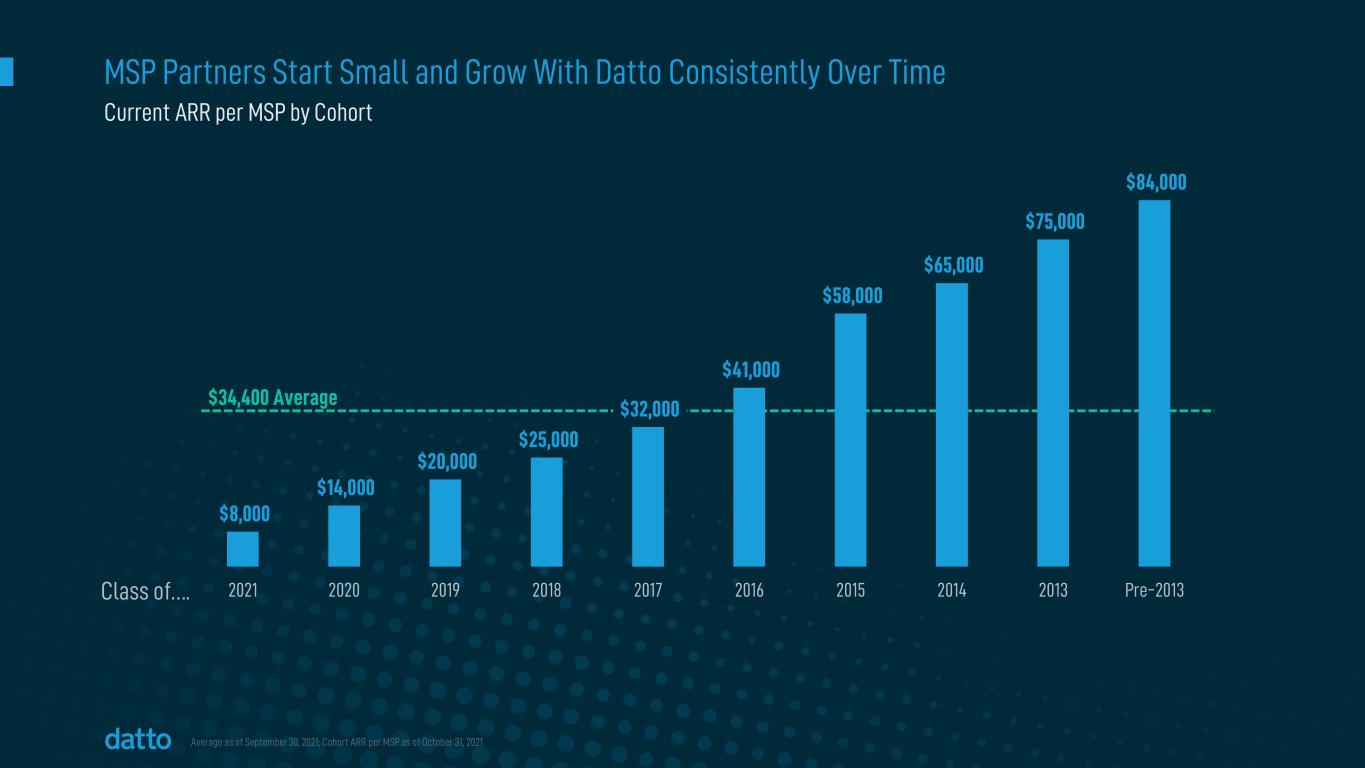
MSP Partners Start Small and Grow With Datto Consistently Over Time Current ARR per MSP by Cohort $34,400 Average Class of…. Average as of September 30, 2021; Cohort ARR per MSP as of October 31, 2021 $8,000 $14,000 $20,000 $25,000 $32,000 $41,000 $58,000 $65,000 $75,000 $84,000 2021 2020 2019 2018 2017 2016 2015 2014 2013 Pre-2013

IV. Geographic Perspective

Robust Growth in US with International Acceleration Growth rates are YoY for Q3’21 70% 30% US growing 17% International growing 32% Q3 ’21 Revenue
Four Perspectives on 20% Sustainable Growth Market Product Channel Leverage Geographic

Datto’s Differentiated Products & Technology Bob Petrocelli | Chief Technology Officer
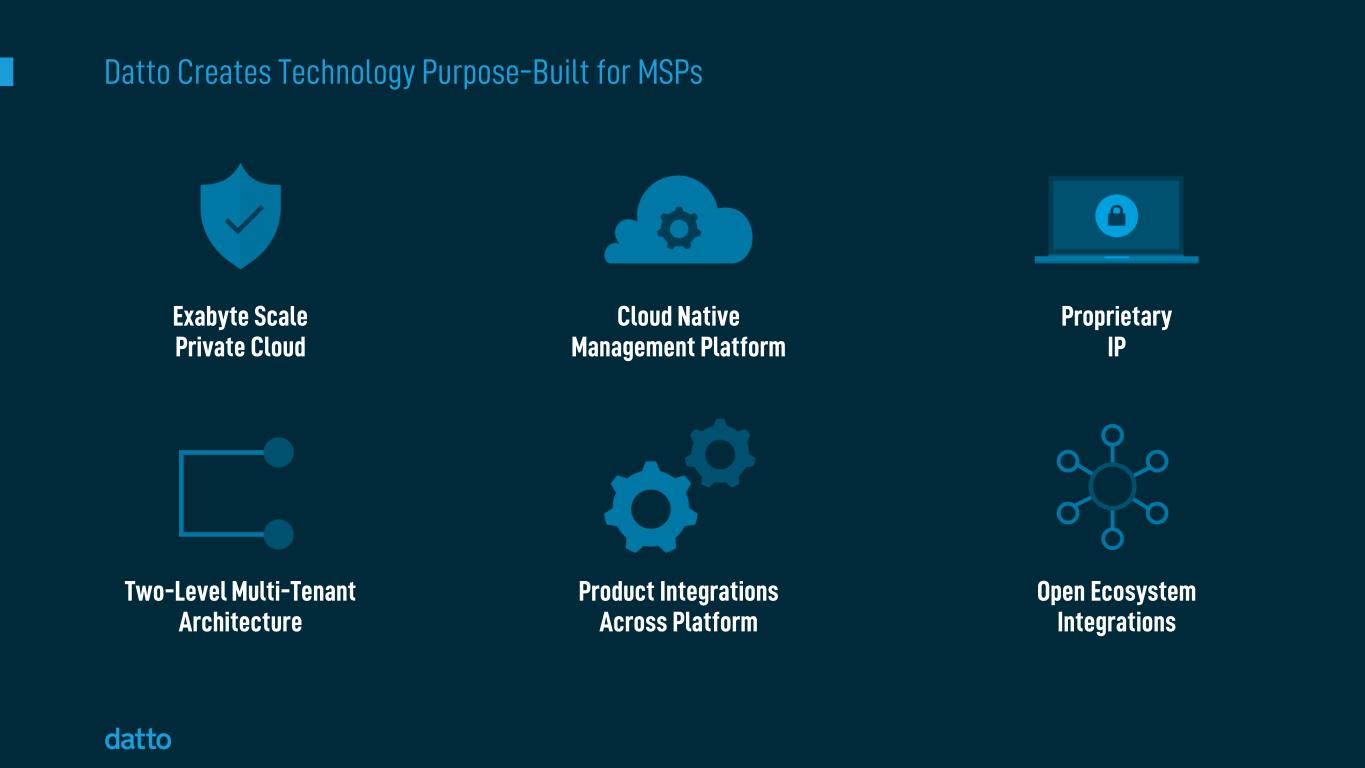
Datto Creates Technology Purpose-Built for MSPs Exabyte Scale Private Cloud Cloud Native Management Platform Proprietary IP Two-Level Multi-Tenant Architecture Product Integrations Across Platform Open Ecosystem Integrations

A Security First Vision

NIST Cybersecurity Framework

Continuity

Continuity The most essential element in the security framework

Colonial Pipeline • Consequences of a missing continuity strategy Darkside hackers attack Pipeline restart begins at 5PM ET CP halts operations, pays over $4M Attempt to rebuild systems CEO statement that full restoration of IT systems could take months May 6 & 7 May 9 May 13 June 71 DAY Total Impact 4 DAYS 8 DAYS 33 DAYS 33+ DAYS May 1712 DAYS Pipeline operation resumes Sources: https://www.msspalert.com/cybersecurity-breaches-and-attacks/ransomware/colonial-pipeline-investigation/ https://www.cnet.com/tech/services-and-software/colonial-pipeline-ceo-tells-senate-decision-to-pay-hackers-was-made-quickly/ The Colonial Pipeline CEO Explains The Decision To Pay Hackers A $4.4 Million Ransom

Alternate History • 33+ days could take 3 hours Darkside hackers attack Systems are briefly paused to close the vulnerability Live failover to continuity environment Original servers fully re-imaged May 6 May 8 1 DAY 3 DAYS Total outage 3 HOURS

Datto Continuity is a Complete Turnkey Cloud Service Validation of Virtualized Image4. Robust Restore6. Direct 24/7 Support 8. Failover5. 7. Cloud Management Portal Full Image Backup1. Cloud Replication2. Instant Virtualization3.

VMs Dominate Datto’s BCDR Workloads BCDR Installed Base 24% Physical Machines 76% Virtual Machines As of November 1, 2021
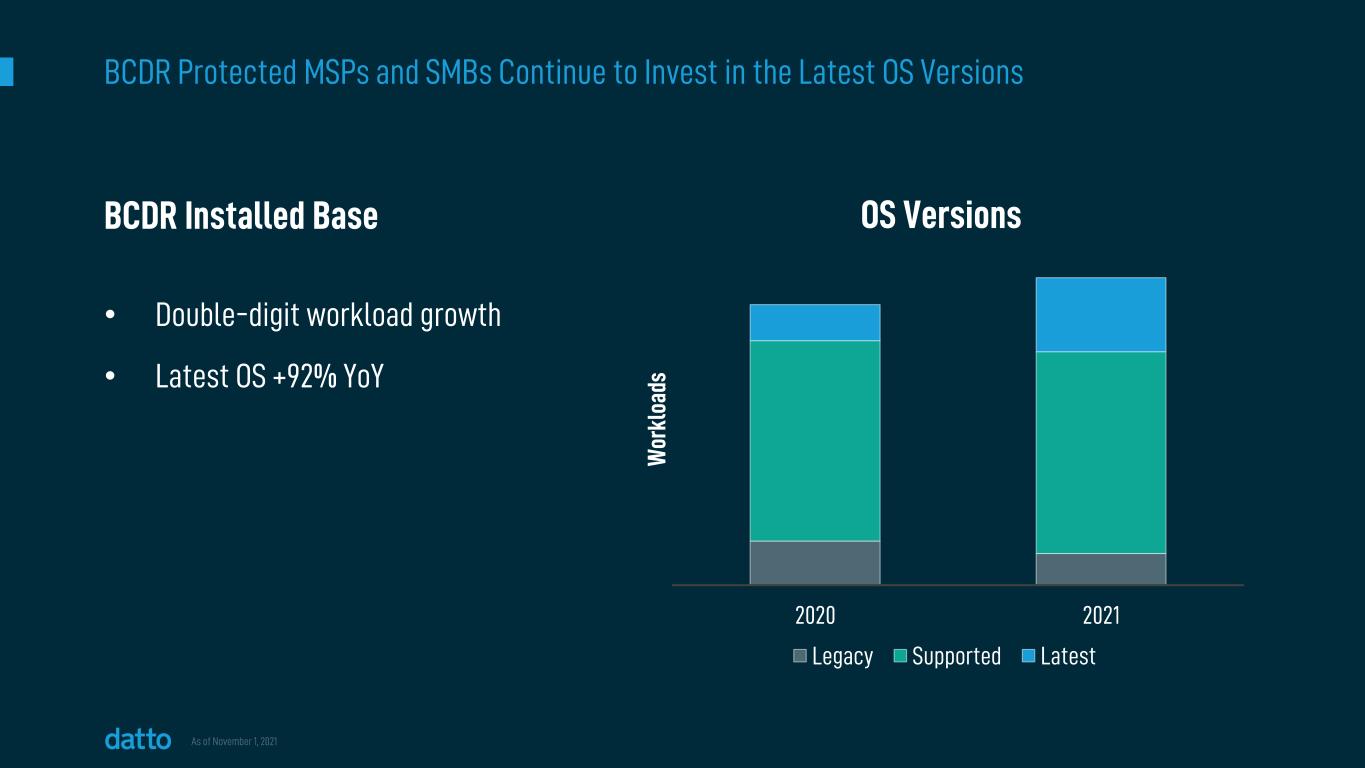
BCDR Protected MSPs and SMBs Continue to Invest in the Latest OS Versions 2020 2021 W or kl oa ds OS Versions Legacy Supported Latest BCDR Installed Base • Double-digit workload growth • Latest OS +92% YoY As of November 1, 2021

Continuity: Protecting VMs, Data, and Applications Everywhere Datto Integrated Management Platform Continuity Datto Exabyte Scale Cloud Endpoints Various Locations MSP Managed Workloads Public Cloud Private Cloud PCs

Datto Continuity for Microsoft Azure (DCMA) • Everything MSPs Love about BCDR now in the Public Cloud Same simple, predictable pricing model Same replication to the Datto Cloud Same unified management platform Same superior continuity performance Everything MSPs Love About BCDR Now in the Public Cloud

SaaS Defense Continuity SaaS Protection

SaaS Protection: Continuity Extended to SaaS Applications Datto Integrated Management Platform Continuity SaaS Protection Datto Exabyte Scale Cloud Endpoints Various Locations SaaS Apps MSP Managed Workloads
250M+ paid users Source: Is Microsoft’s Claimed 250 Million Teams Monthly Active Users Believable? - Office 365 for IT Pros

Email is the Number One Attack Vector for Cyber Attacks 20202019201820172016 19,465 25,344 26,379 114,702 241,342 Reported phishing crimes Source: *IC3 Complaint Statistics 2020 - Top 5 Crime Type Comparison

SaaS Defense: One-click Attach to SaaS Protection Datto Integrated Management Platform Continuity SaaS ProtectionSaaS Defense Datto Exabyte Scale Cloud Endpoints Various Locations SaaS Apps MSP Managed Workloads
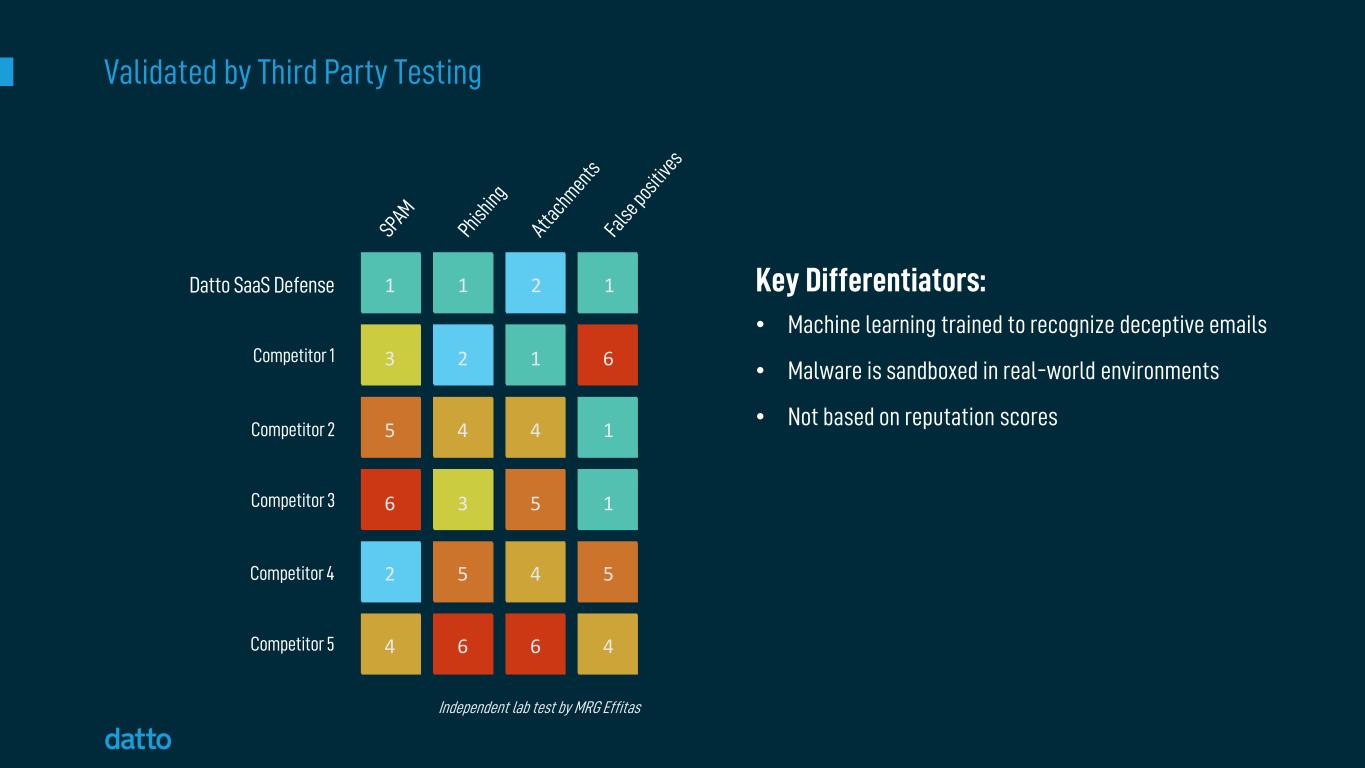
Validated by Third Party Testing Key Differentiators: • Machine learning trained to recognize deceptive emails • Malware is sandboxed in real-world environments • Not based on reputation scores Independent lab test by MRG Effitas 1 1 2 1 3 2 1 6 5 4 4 1 6 3 5 1 2 5 4 5 4 6 6 4 Datto SaaS Defense Competitor 1 Competitor 2 Competitor 3 Competitor 4 Competitor 5

Ample Whitespace As of November 1, 2021 Microsoft EOP Only + Advanced Protection 70%
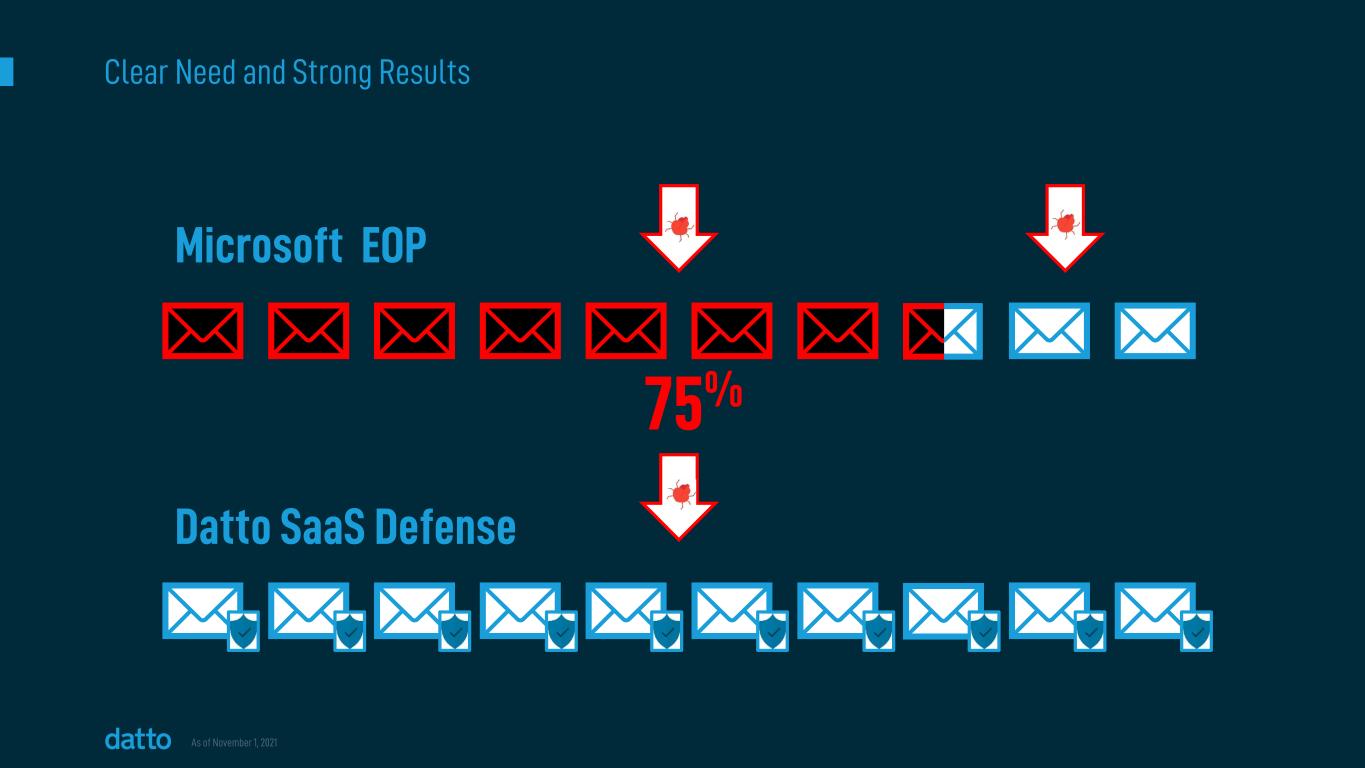
Clear Need and Strong Results As of November 1, 2021 Microsoft EOP Datto SaaS Defense 75%
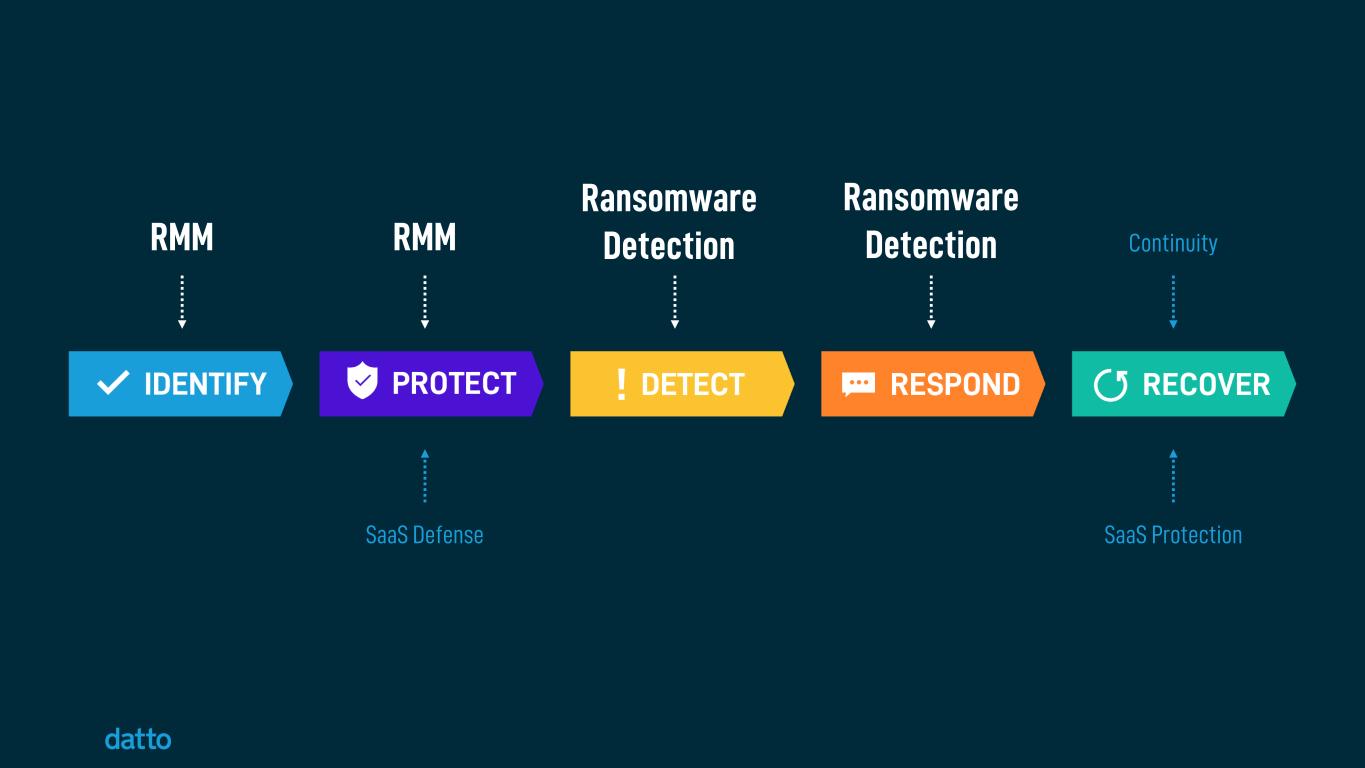
RMM SaaS Defense RMM Ransomware Detection Continuity SaaS Protection Ransomware Detection
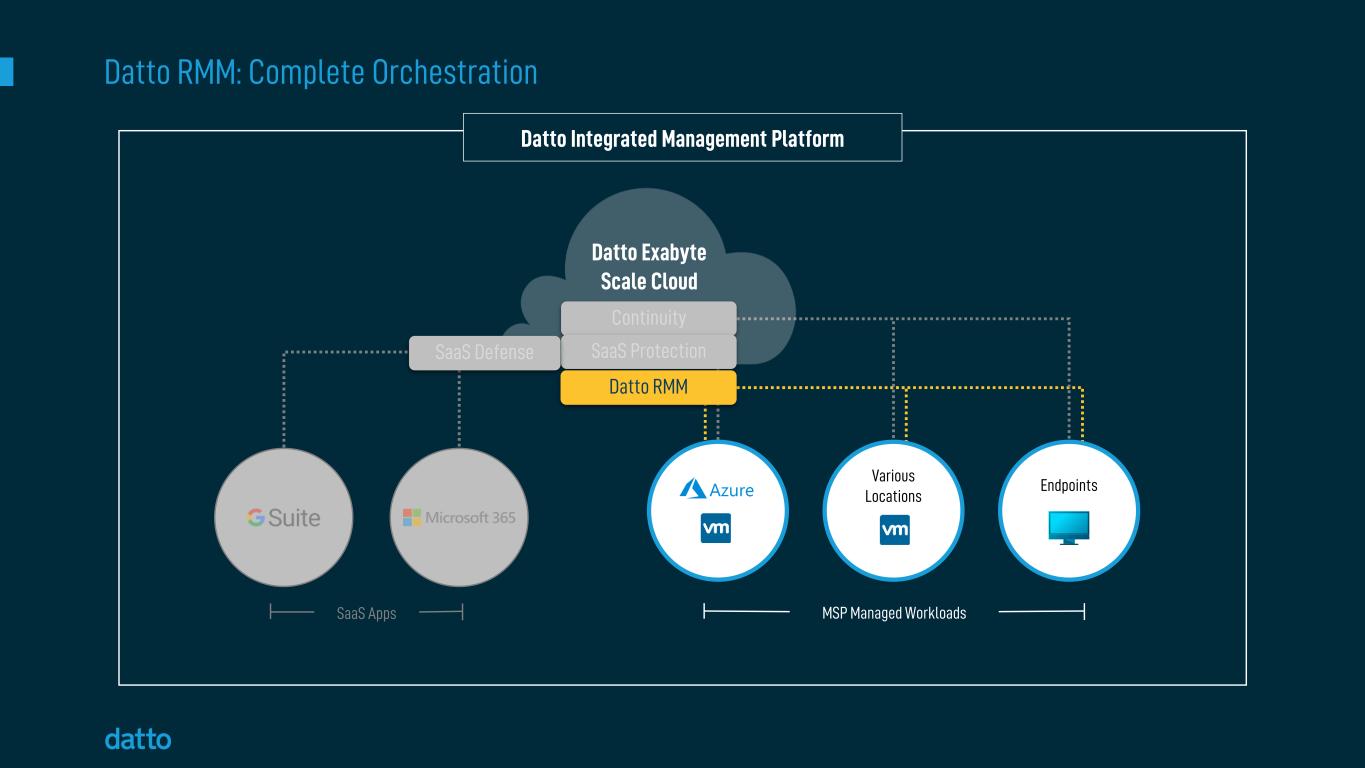
Datto RMM: Complete Orchestration Datto Integrated Management Platform Continuity SaaS ProtectionSaaS Defense Datto Exabyte Scale Cloud Endpoints Various Locations Datto RMM SaaS Apps MSP Managed Workloads

Assessed Under Industry Leading BSIMM Standards • In a Class of One: Secure & Scalable Datto is the only primarily MSP facing company to participate in BSIMM. Datto RMM is the only RMM to be evaluated. Statements as of December 9, 2021

Security Woven Throughout AV Management Patch Management Application Management Encryption Control Continuity Integration Ransomware Detection
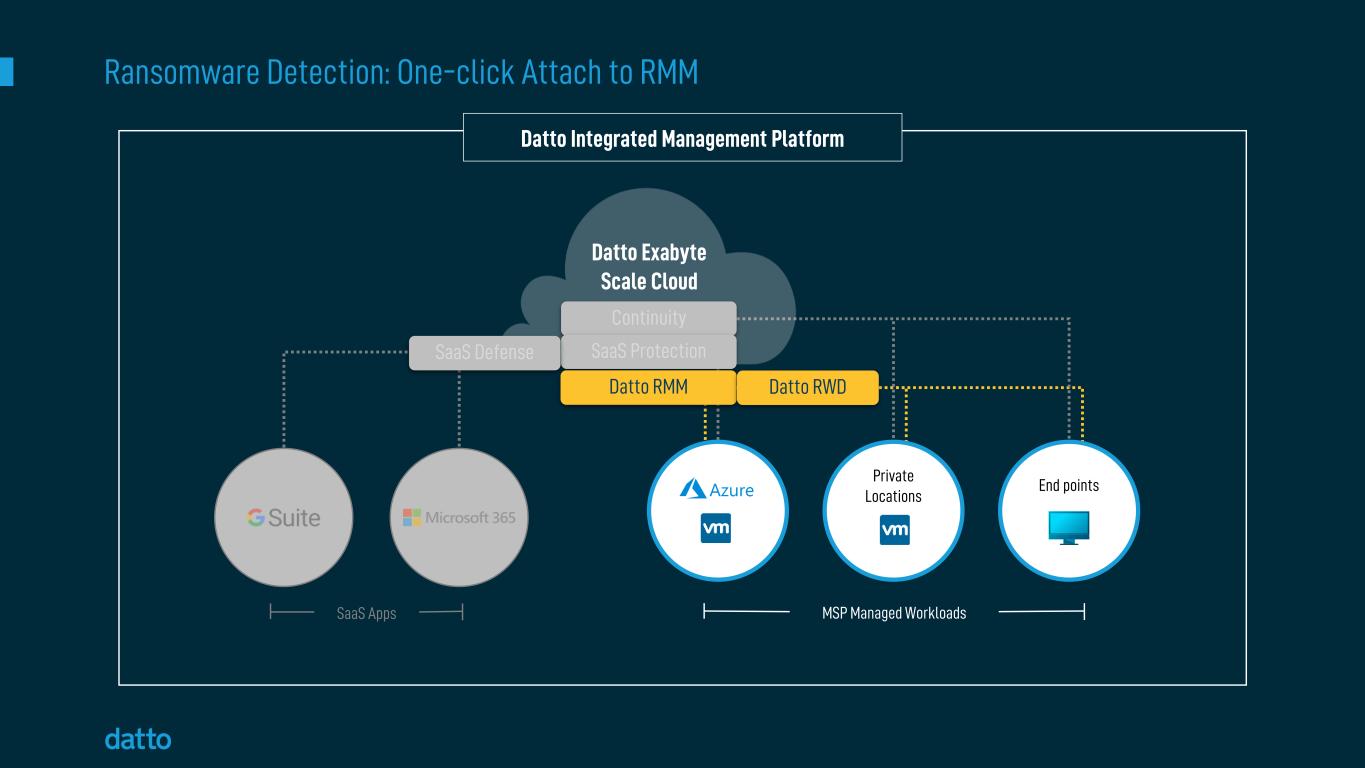
Ransomware Detection: One-click Attach to RMM Datto Integrated Management Platform Continuity SaaS ProtectionSaaS Defense Datto Exabyte Scale Cloud End points Private Locations Datto RMM Datto RWD SaaS Apps MSP Managed Workloads

Ransomware Detection for RMM • Stop live attackers in their tracks • Catches what AV/EDR misses • Automates Isolation and kills ransomware processes • Over 1.5M protected endpoints in < 12 months “Datto immediately stopped the ransomware and isolated the devices...it took us a few hours to get 100% back to normal but it could have taken days without Datto.” — Rick Topping Vice President of Operations and Technology, Ceeva
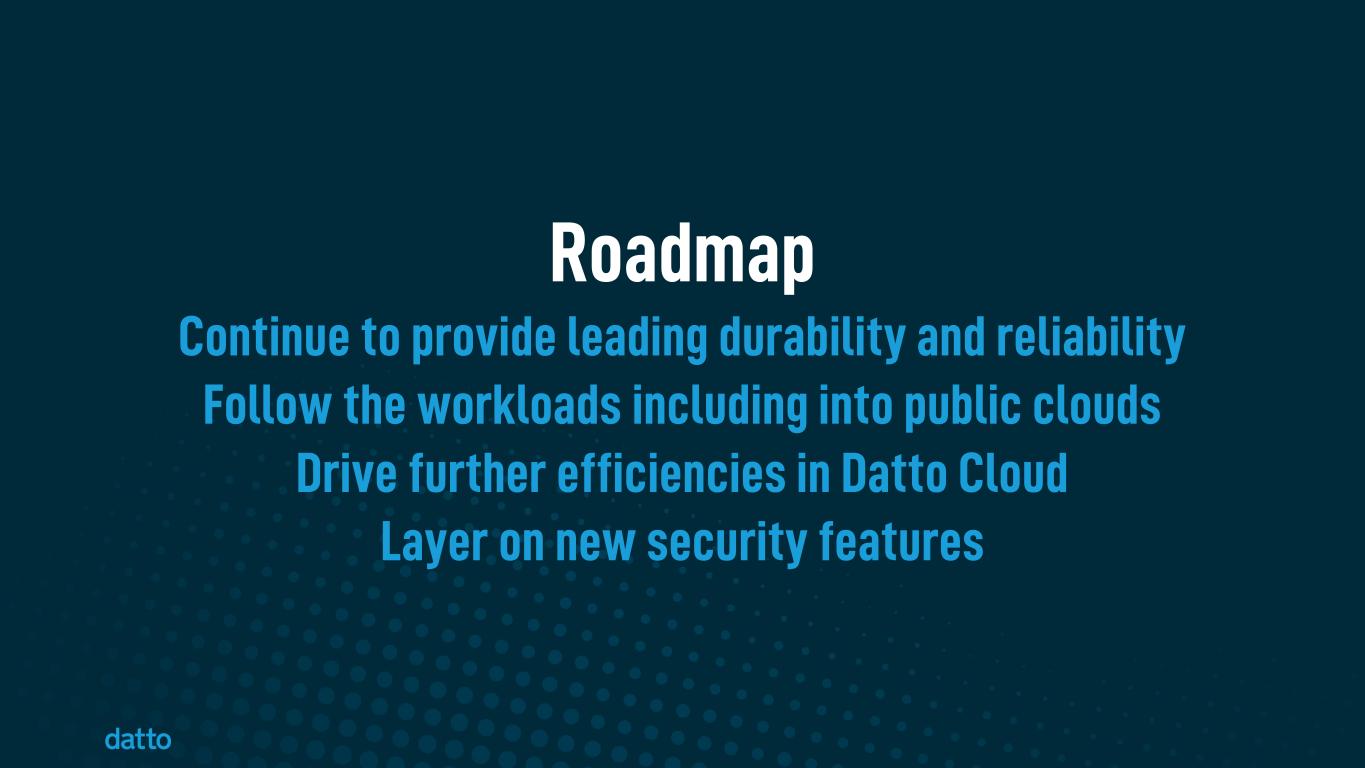
Roadmap Continue to provide leading durability and reliability Follow the workloads including into public clouds Drive further efficiencies in Datto Cloud Layer on new security features

Key Takeaways Industry leading internal security Technology purpose-built for MSPs Continuity = downtime minimization Reliably protecting workloads in any environment Clear vision for MSP-centric cybersecurity framework

The Power of Channel Leverage Sanjay Singh | Chief Revenue Officer

MSP Acquisition Reps MSP Growth Reps Demand Generation Product Marketing MSP Enablement Over 600 GTM Professionals Globally M A R K E T I N G S A L E S Awareness Qualified Lead Land MSP Expand MSP As of December 9, 2021

MSP-centric Model Solves the Challenges of Serving the SMB Market SALES LEVERAGE One Datto Sales Rep… …Through Dozens Of MSP Partners… …Can Reach Thousands Of SMB Customers ARR from MSP Partners Naturally Expands As MSPs Add More Customers & Solutions NATURAL REVENUE EXPANSION If an MSP Loses an SMB, the MSP Can Migrate the Datto Stack to Another SMB Customer CHURN PROTECTION SUPPORT & SERVICES LEVERAGE Aided by Datto Direct-to-Tech Support MSPs Provide Direct Support

MSP Channel Model Drives Best-in-Class GTM Efficiency Most Recent Quarter Non-GAAP Sales & Marketing Expense as Percentage of Revenue45% 44% 40% 37% 37% 32% 30% 29% 21% 16%42% Source: Factset, company reports; Non-GAAP measures as defined by each company. Most recent quarter as of December 7, 2021. Non-GAAP Sales & Marketing Expense is a Non-GAAP metric. See appendix for reconciliation of Datto non-GAAP Sales & Marketing to the most comparable GAAP financial measures. Most Recent Quarter Non-GAAP Sales & Marketing Expense as Percentage of Revenue

Uncapped Model With Multiple Vectors of Embedded Growth GrowthAcquisition Retention MSPs x SMBs/MSP x Products/SMB x Units/Product x $/Unit = ARR Values as of September 30, 2021
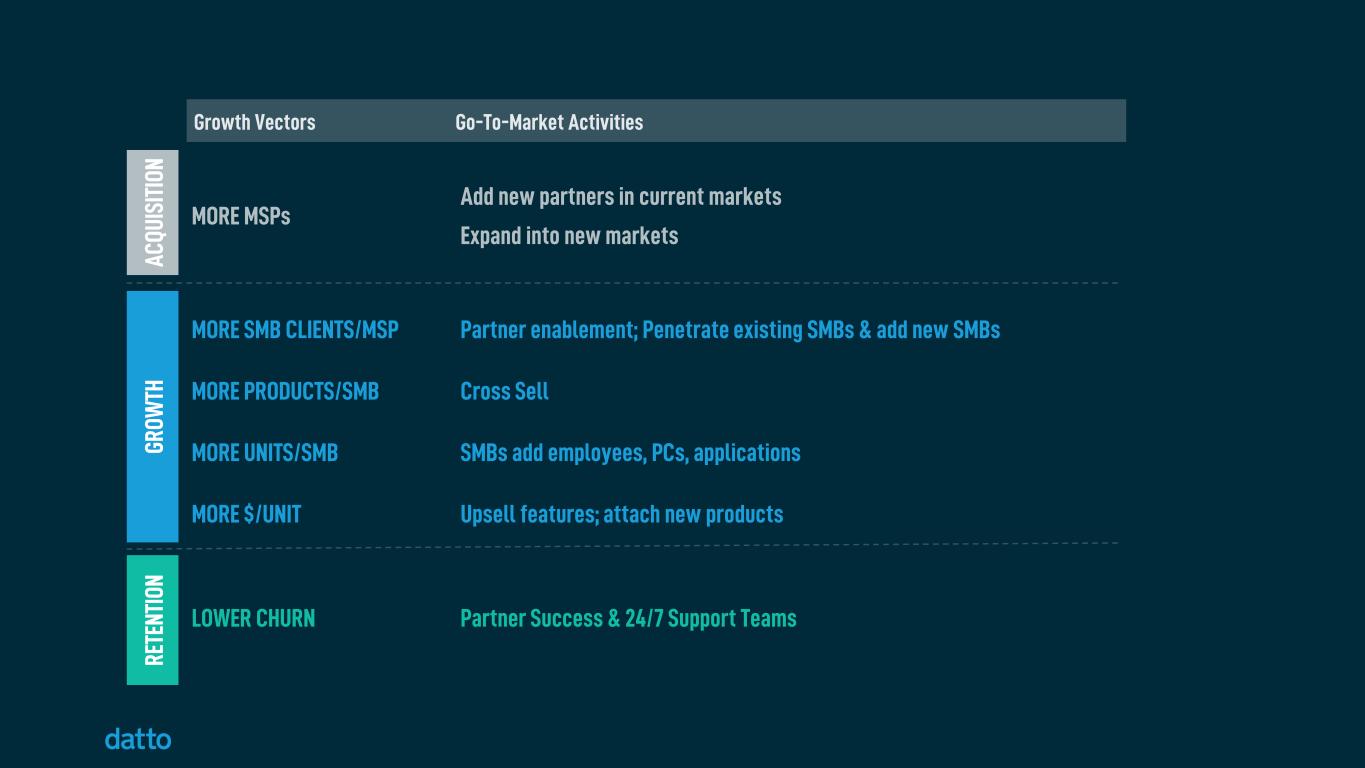
Growth Vectors Go-To-Market Activities MORE MSPs Add new partners in current markets Expand into new markets MORE SMB CLIENTS/MSP MORE PRODUCTS/SMB MORE UNITS/SMB MORE $/UNIT Partner enablement; Penetrate existing SMBs & add new SMBs Cross Sell SMBs add employees, PCs, applications Upsell features; attach new products LOWER CHURN Partner Success & 24/7 Support Teams AC QU IS IT IO N GR OW TH RE TE NT IO N

Partner Acquisition

Propensity to Grow MSP Digital Presence Size of Business and Sales Team Recurring Revenue vs. Break/Fix Model Sell-Through Product Orientation Verticals and Geos Served Partner Acquisition Strategy
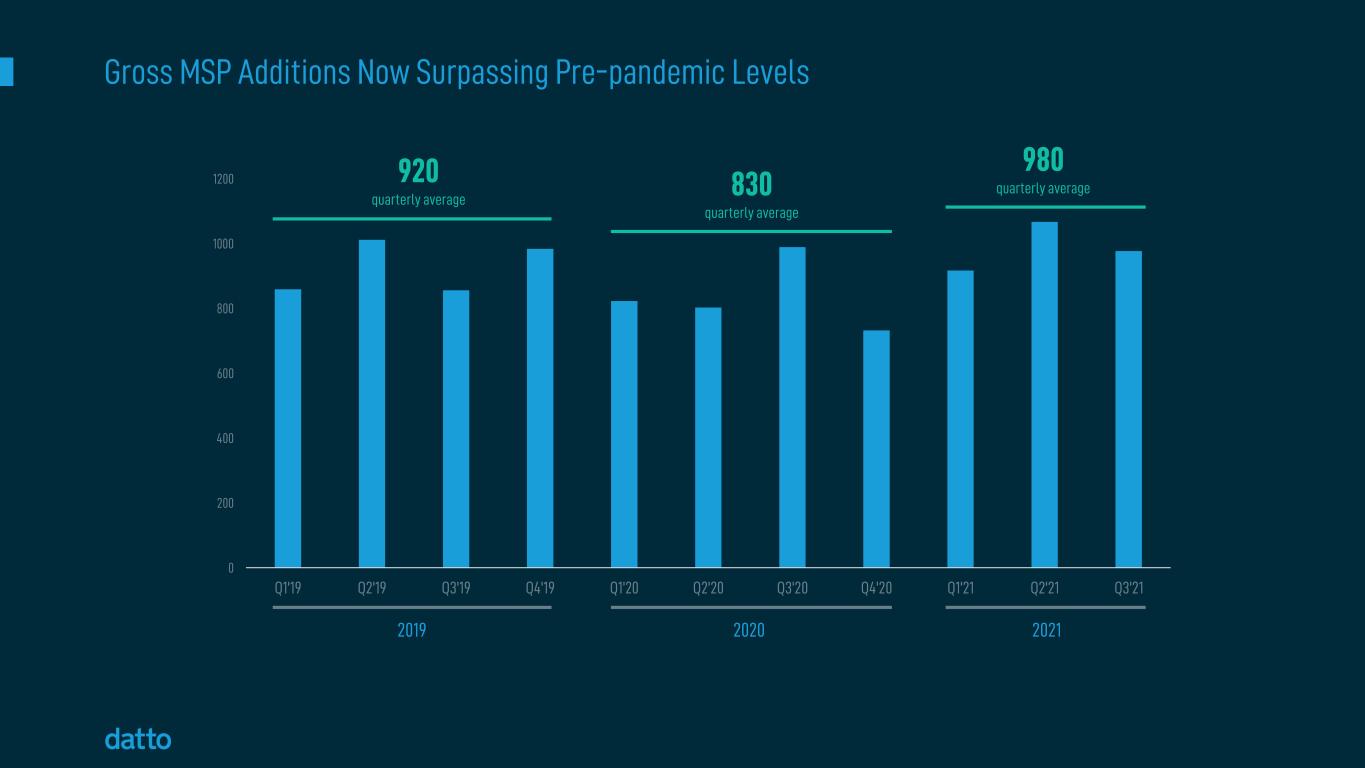
0 200 400 600 800 1000 1200 Q1'19 Q2'19 Q3'19 Q4'19 Q1'20 Q2'20 Q3'20 Q4'20 Q1'21 Q2'21 Q3'21 920 quarterly average Gross MSP Additions Now Surpassing Pre-pandemic Levels 2019 830 quarterly average 2020 980 quarterly average 2021

Datto Has a Highly Diversified, Global MSP Partner Base North America EMEA APAC ~12,300 MSPs ~1,800 MSPs ~4,100 MSPs MSP totals as of September 30, 2021
Partner Growth
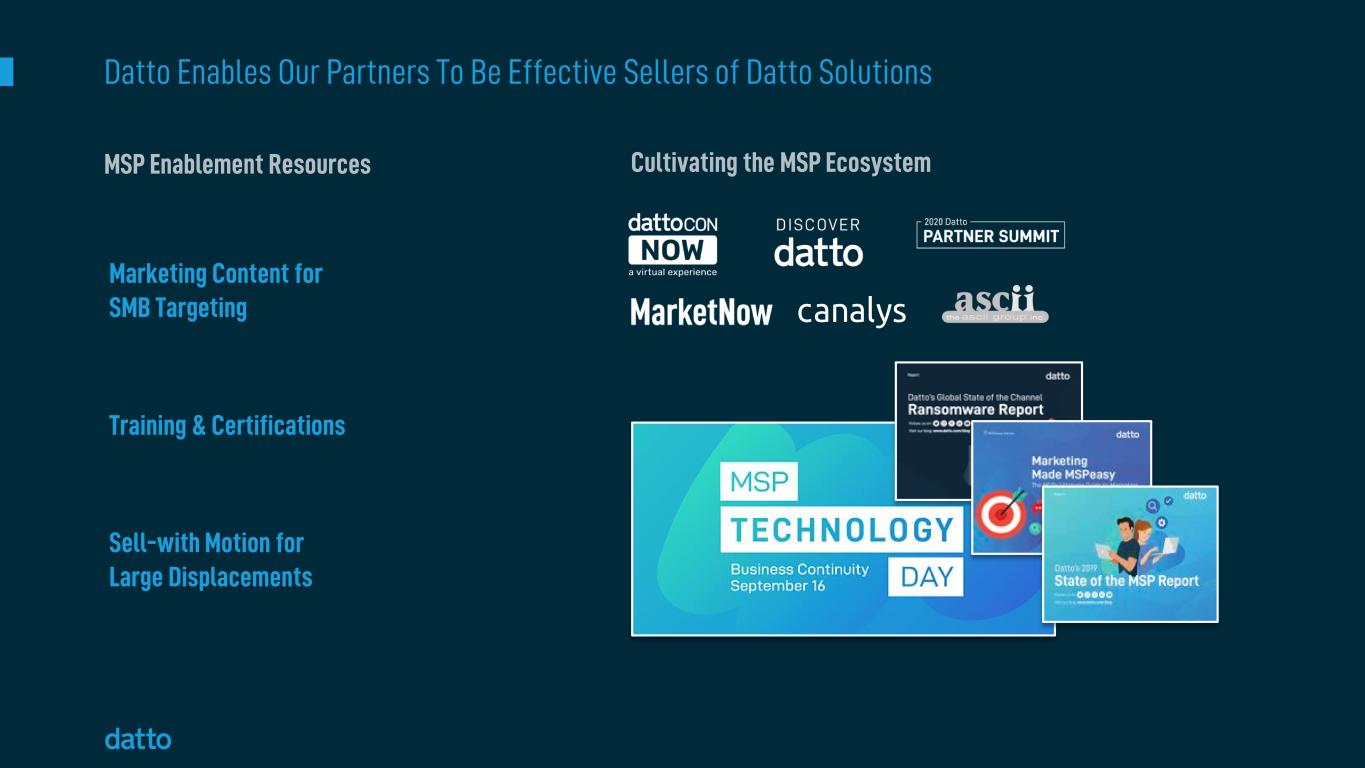
Datto Enables Our Partners To Be Effective Sellers of Datto Solutions MSP Enablement Resources Cultivating the MSP Ecosystem Marketing Content for SMB Targeting Training & Certifications Sell-with Motion for Large Displacements
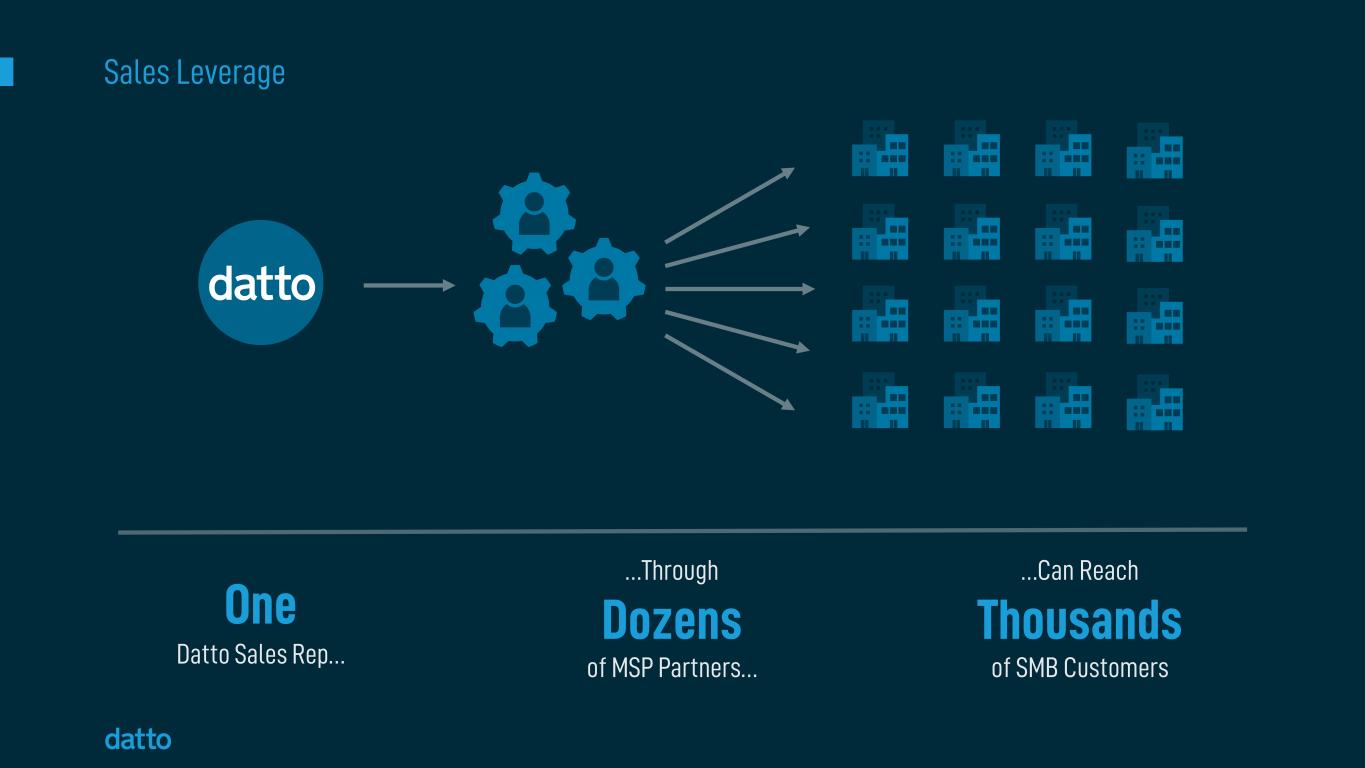
Sales Leverage One Datto Sales Rep… …Through Dozens of MSP Partners… …Can Reach Thousands of SMB Customers

50%+ With 2+ Products 25%+ With 3+ Products Cross Sell Multi-product adoption figures as of September 30, 2021 Cross Sell MSP Datto Product 2 SMB Datto Product 3 Datto Product 1 More Products per SMB
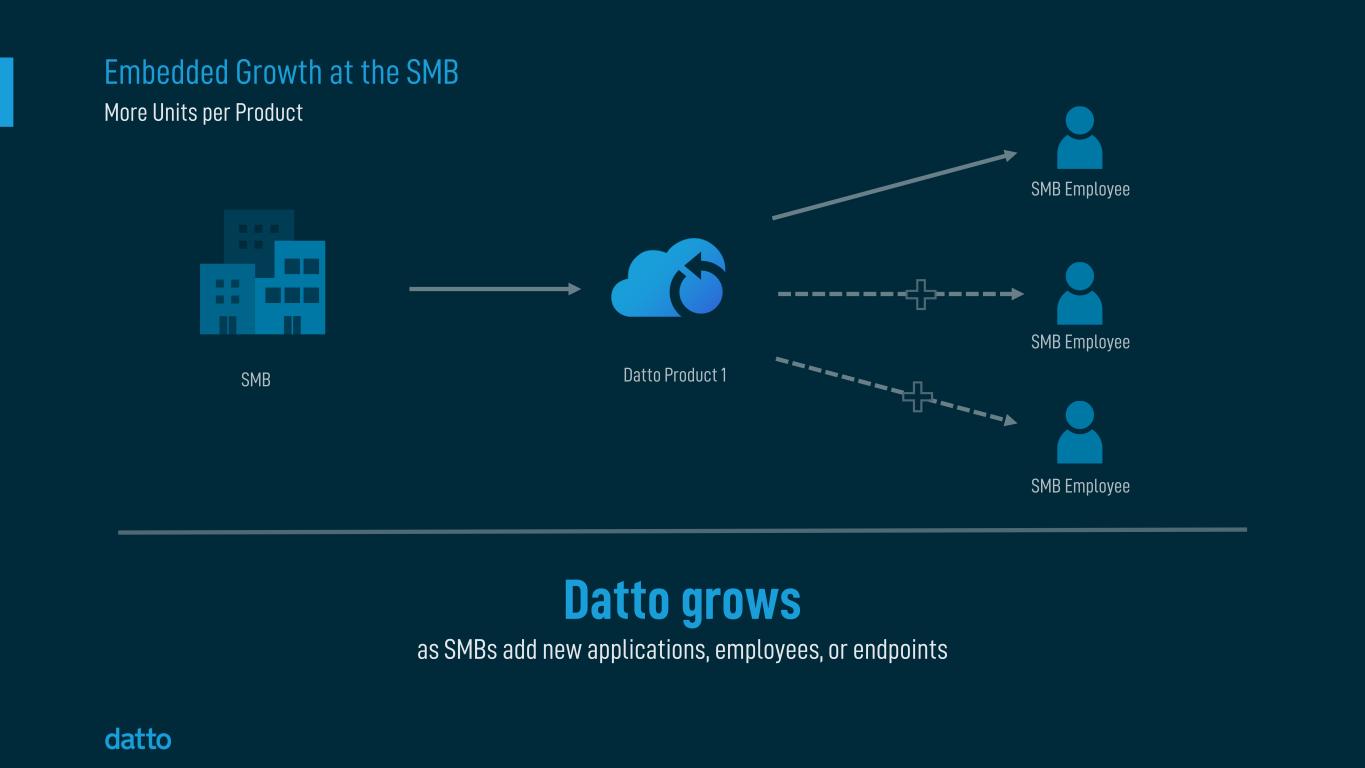
Datto grows as SMBs add new applications, employees, or endpoints Embedded Growth at the SMB SMB SMB Employee Datto Product 1 SMB Employee SMB Employee More Units per Product

Upsell Attaching SaaS Defense to SaaS Protection Attaching Ransomware Detection to RMM Upsell Datto Product $ Feature SMB Employee $ Feature $ Feature More $ per Unit
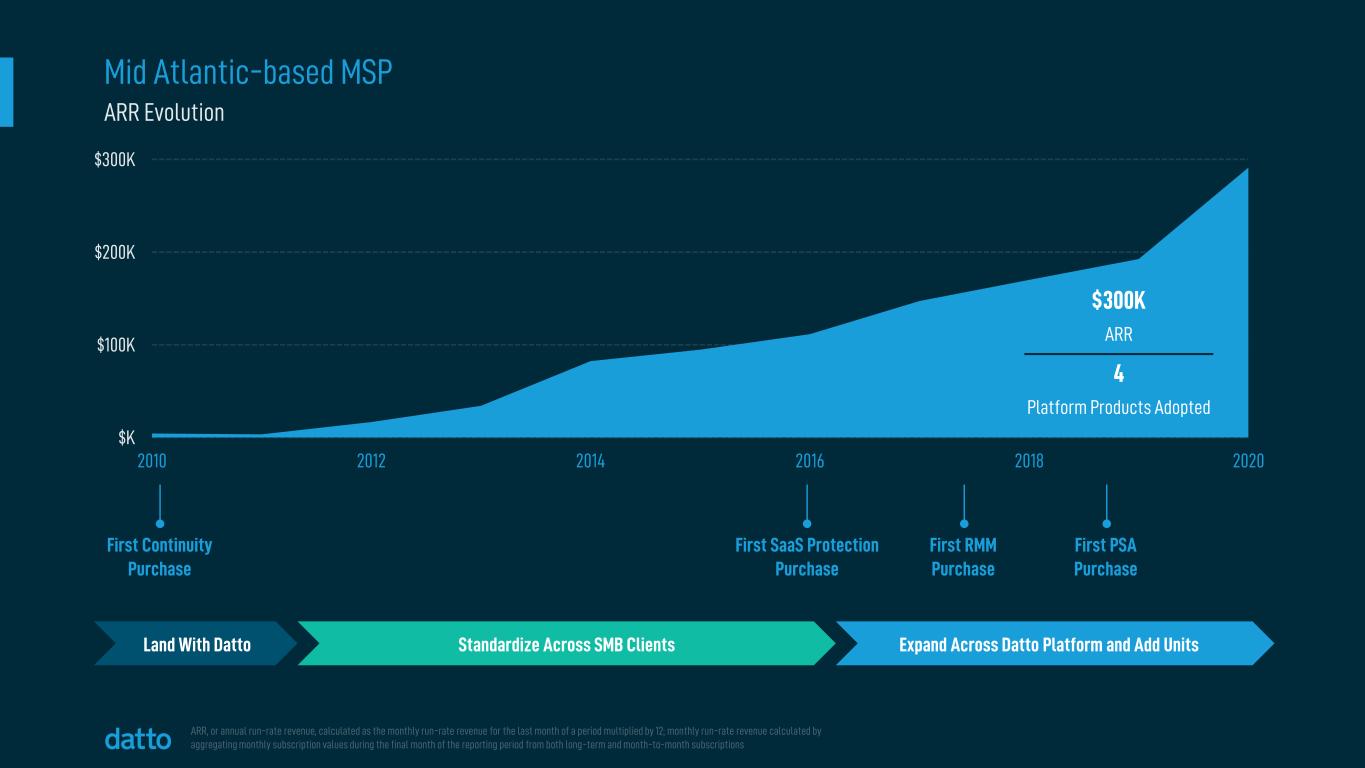
$K $100K $200K $300K 2010 2012 2014 2016 2018 2020 Land With Datto Expand Across Datto Platform and Add Units ARR, or annual run-rate revenue, calculated as the monthly run-rate revenue for the last month of a period multiplied by 12; monthly run-rate revenue calculated by aggregating monthly subscription values during the final month of the reporting period from both long-term and month-to-month subscriptions $300K ARR 4 Platform Products Adopted Mid Atlantic-based MSP Standardize Across SMB Clients First Continuity Purchase First SaaS Protection Purchase First RMM Purchase First PSA Purchase ARR Evolution

Retention
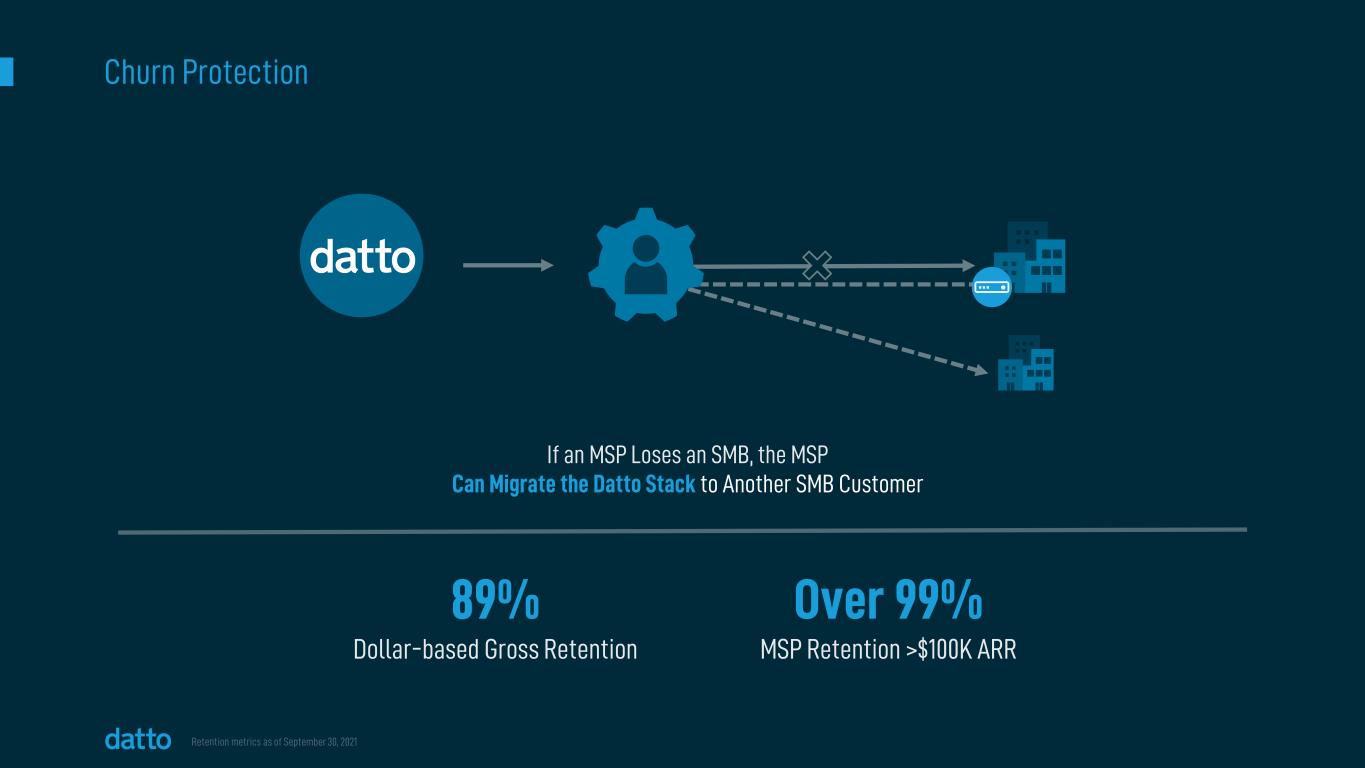
89% Dollar-based Gross Retention Churn Protection Over 99% MSP Retention >$100K ARR Retention metrics as of September 30, 2021 If an MSP Loses an SMB, the MSP Can Migrate the Datto Stack to Another SMB Customer

Support and Services Leverage 24/7/365 Global Technical Support Best in Class Net Promoter Score Code Red Support For Disaster Scenarios Aided by Datto Direct-to-Tech Support MSPs Provide Direct Support to Their SMB Customers

Competitive Landscape
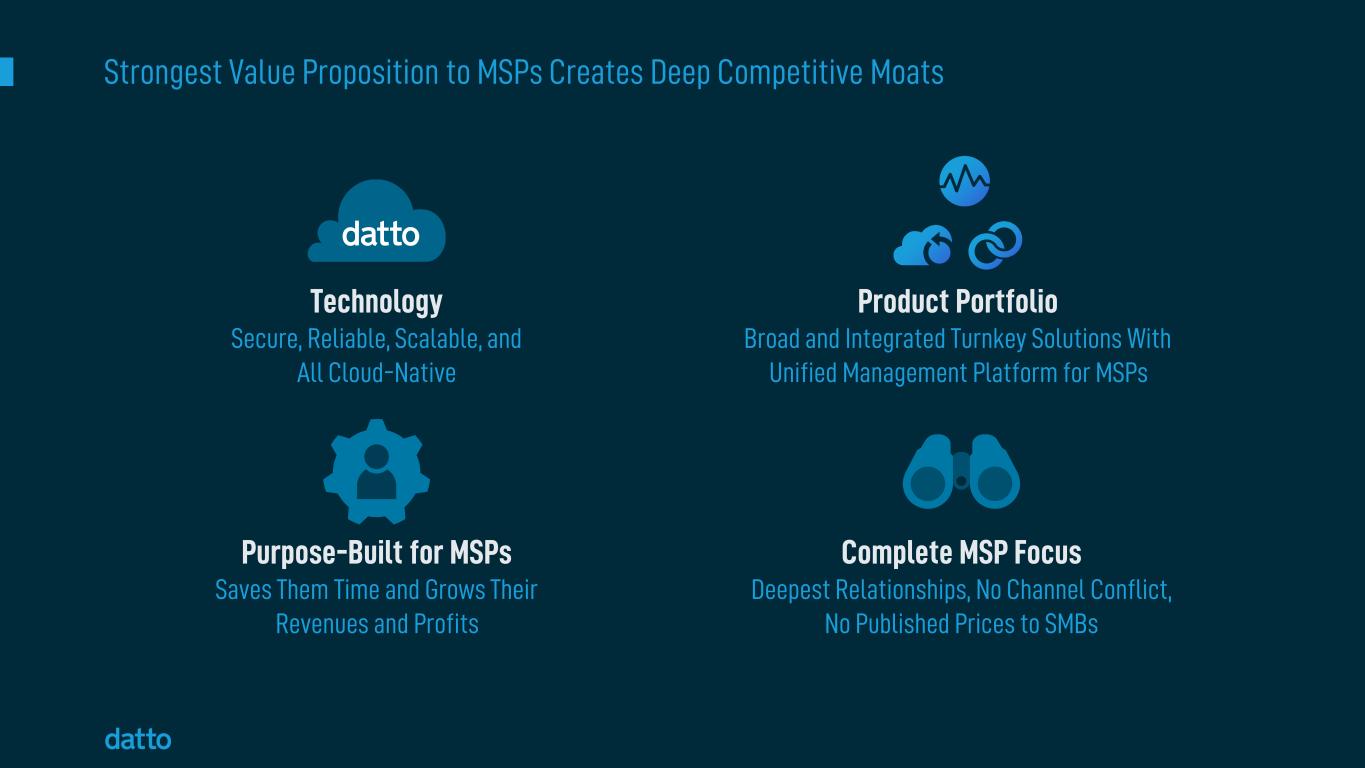
Strongest Value Proposition to MSPs Creates Deep Competitive Moats Technology Secure, Reliable, Scalable, and All Cloud-Native Product Portfolio Broad and Integrated Turnkey Solutions With Unified Management Platform for MSPs Purpose-Built for MSPs Saves Them Time and Grows Their Revenues and Profits Complete MSP Focus Deepest Relationships, No Channel Conflict, No Published Prices to SMBs

Best Technology More Sell-Through Revenue Complete MSP Focus Broad Product Portfolio Secure, Reliable and Scalable Technology Purpose-Built for MSPs Enterprise Grade Technology Lower Price Point Purpose-Built for MSPs Competitive Landscape Large MSP Vendors Point Solutions Enterprise Why Datto Consistently Wins

Our Products Consistently Win With MSPs Continuity SaaS Protection RMM PSA

Key Takeaways Uncapped Scaling Vectors Deepest MSP Relationships Embedded Growth Drivers Playing the Long Game

MSP Perspectives Fireside Chat Chris McCloskey | Chief Customer Officer Peter Melby CEO, Greystone Technology Kevin Damghani Chief Partner Experience Engineer ITPartners+
Sustainable Growth and Profitability at Scale John Abbot | Chief Financial Officer
Growth and Profitability at Scale Clear Path to $1 Billion+ Revenue Rule of 40+ Rule of 50

Growth and Profitability at Scale 19% Subscription Revenue Growth YoY YTD through September 30, 2021 93% Recurring Revenue 30% Adj. EBITDA Margin 115% Dollar-Based Net Retention at 9/30/21 Positive Free Cash Flow Adjusted EBITDA and Free Cash Flow are non-GAAP metrics. See appendix for reconciliation of Adjusted EBITDA and Free Cash Flow to the most comparable GAAP financial measures..
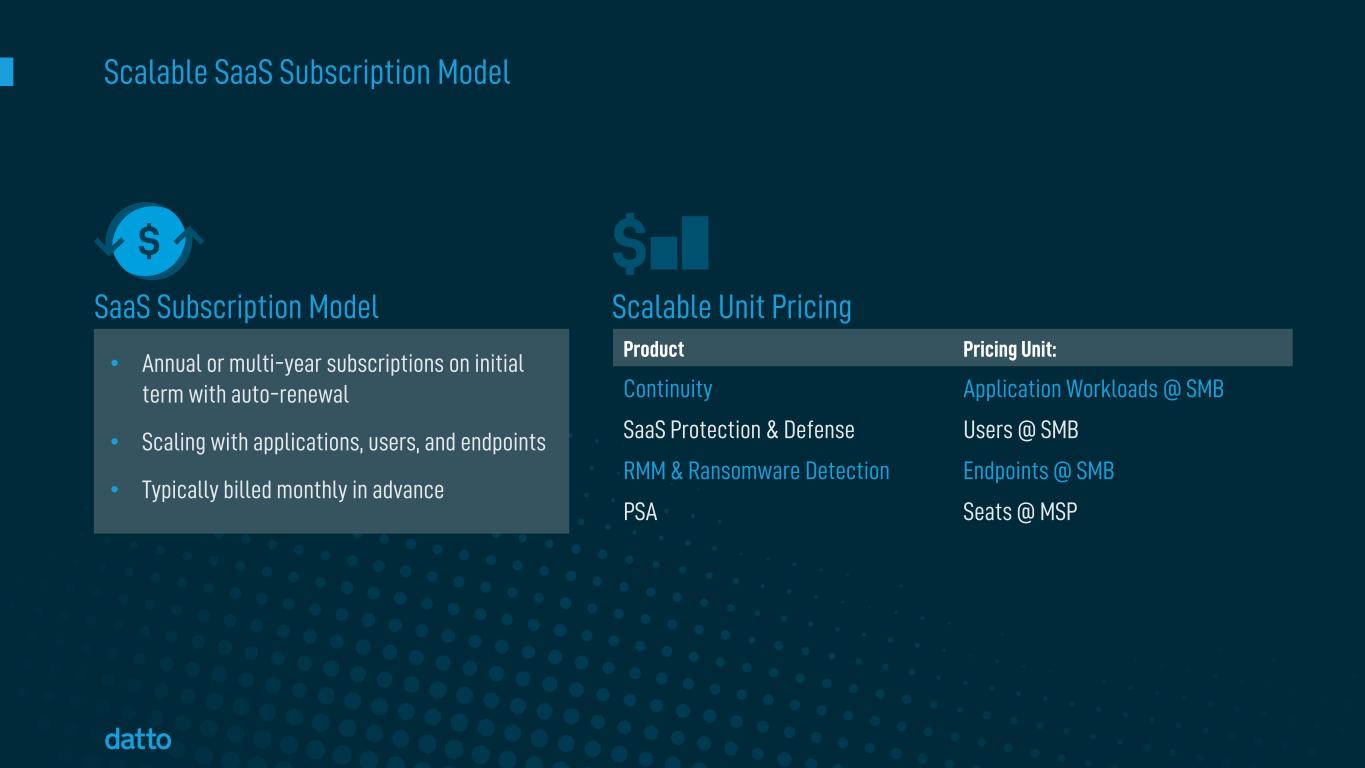
Scalable Unit Pricing • Annual or multi-year subscriptions on initial term with auto-renewal • Scaling with applications, users, and endpoints • Typically billed monthly in advance Product Pricing Unit: Continuity Application Workloads @ SMB SaaS Protection & Defense Users @ SMB RMM & Ransomware Detection Endpoints @ SMB PSA Seats @ MSP Scalable SaaS Subscription Model SaaS Subscription Model

(1) Q3’21 YoY Growth Sustainable ARR Growth at Scale Leading Indicator of Subscription Revenue $627M 9/30/21 20% YoY Growth(1) Accelerating throughout 2021 $353 $379 $400 $423 $445 $475 $498 $507 $523 $543 $572 $598 $627 2018 20212019 2020 Annual Run-Rate Revenue ($M)

(1) Includes $40MM One-time Device, Professional Services & Other Revenue. “LTM” = Last Twelve Months. (2) Includes benefit from favorable foreign exchange rates of approximately 1.5%. Sustainable Revenue Growth at Scale $86 $90 $96 $100 $105 $111 $116 $118 $123 $129 $136 $142 $147 2018 2019 2020 2021 $593M LTM GAAP Revenue(1) 93% Q3 2021 Revenue from Recurring Subscriptions 20% Q3 2021 Subscription Revenue Growth YoY(2) Subscription Revenue ($M)

ARR Growth is Reaccelerating $20 $24 $23 $29 $24 $8 $16 $20 $26 $25 $29 2019 2020 2021 Quarterly Change in ARR ($M, constant currency)
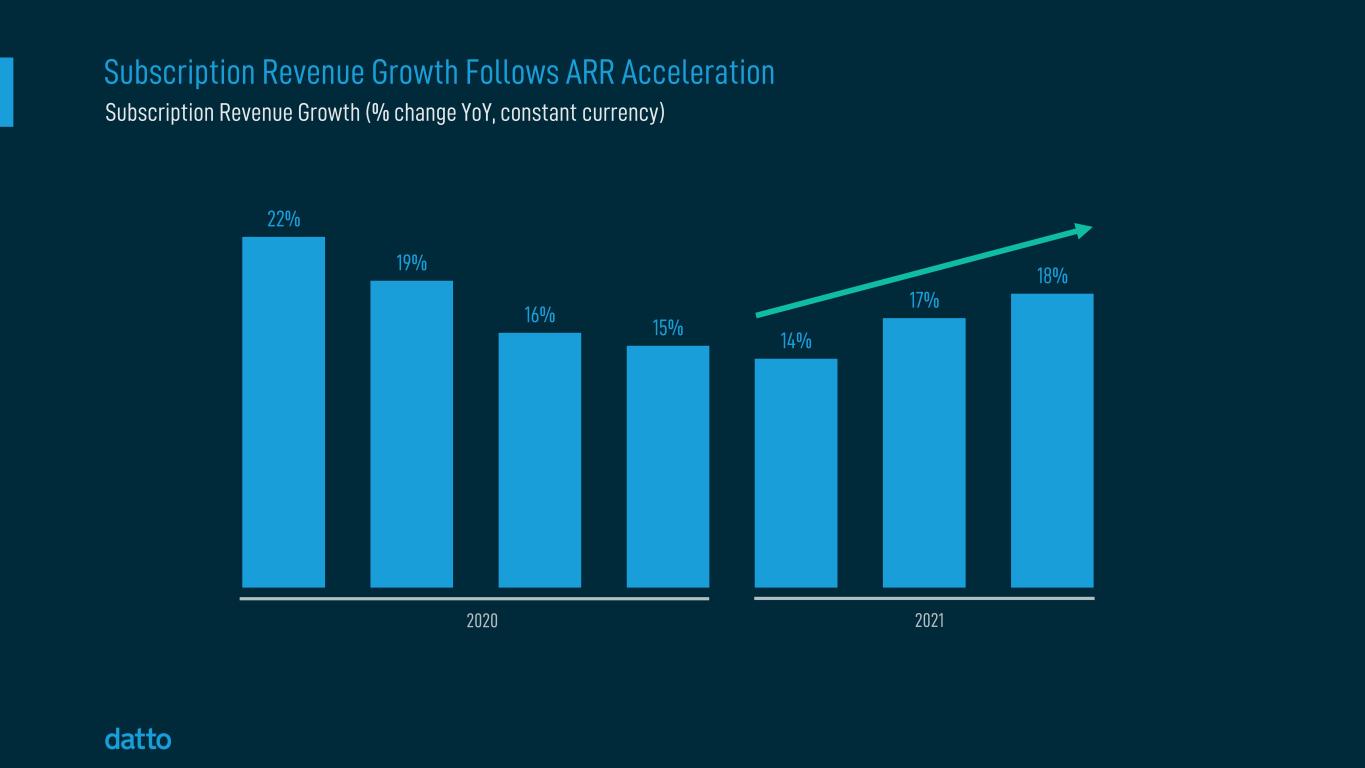
Subscription Revenue Growth Follows ARR Acceleration 22% 19% 16% 15% 14% 17% 18% 2020 2021 Subscription Revenue Growth (% change YoY, constant currency)

Our Revenue is Diversified Across Products LTM subscription revenue at September 30, 2021, rounded to nearest $5m. Continuity User & Endpoint Security $335M PSA & Other $120M$100M LTM Subscription Revenue
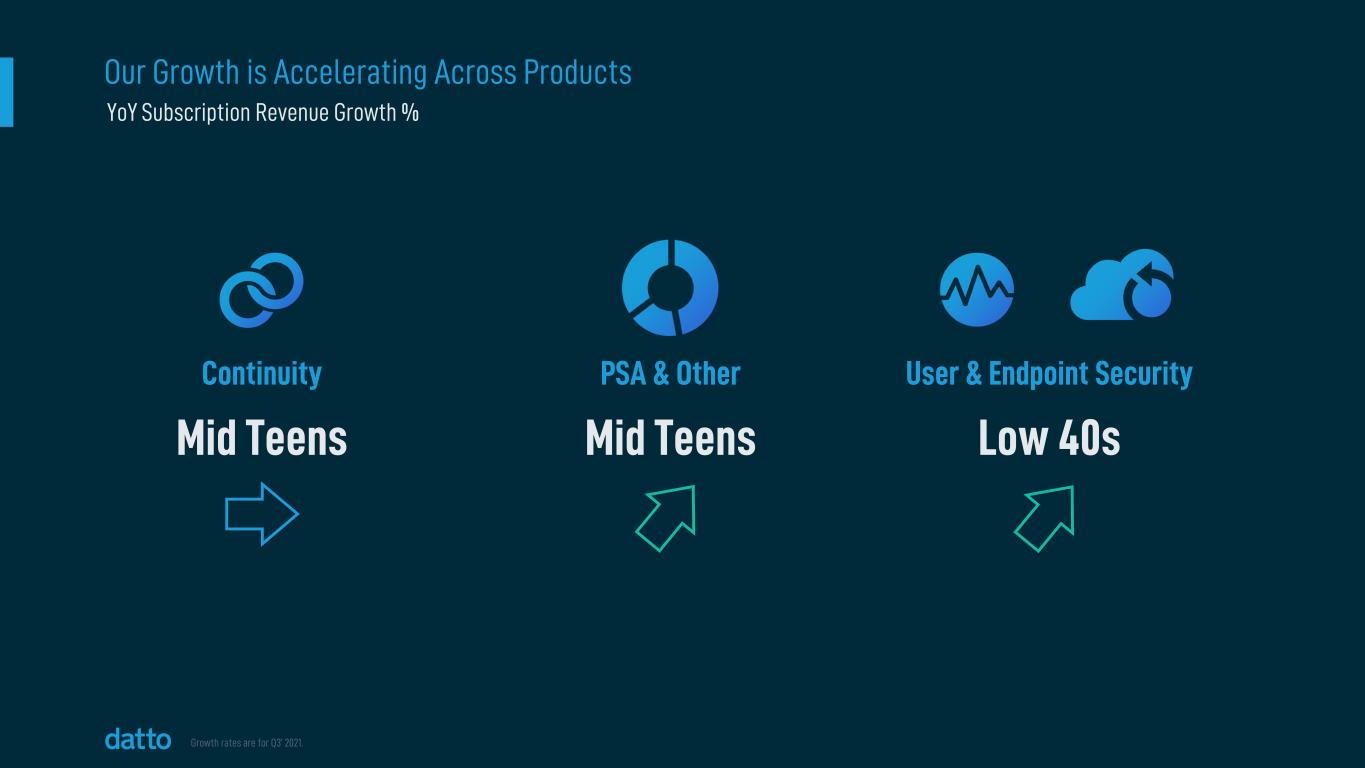
Our Growth is Accelerating Across Products Growth rates are for Q3’ 2021. YoY Subscription Revenue Growth % Continuity User & Endpoint Security Mid Teens PSA & Other Low 40sMid Teens

US and International are Both Accelerating Revenue ($M, constant currency) and Growth (% YoY) by Quarter % of Total Revenue 70% 30% 2021 19% growth $39M $41M $46M 25% growth 27% growth 12% growth 15% growth 17% growth $102M $106M $110M US International

Our Model is Highly Profitable 67% 73% 74% FY 2019 FY 2020 YTD 2021 18% 29% 30% FY 2019 FY 2020 YTD 2021 Non-GAAP Gross Profit and Adjusted EBITDA are non-GAAP metrics. See appendix for reconciliation of Non-GAAP Gross Profit and Adjusted EBITDA to the most comparable GAAP financial measures. FY 2019 and FY 2020 refers to 12 months ending December 31, 2019 and 2020 respectively. YTD 2021 refers to nine months ended September 30, 2021. Non-GAAP Gross Profit (% Margin) Adjusted EBITDA (% Margin) Expanding Gross Margins Strong Operating Leverage

We’re Generating Free Cash Flow… (6)% 13% 15% FY 2019 FY 2020 YTD 2021 Free Cash Flow (% Margin) Free Cash Flow Margin is a non-GAAP metrics. See appendix for reconciliation of Non-GAAP Free Cash Flow to the most comparable GAAP financial measure. FY 2019 and FY 2020 refers to 12 months ending December 31, 2019 and 2020 respectively. YTD 2021 refers to nine months ended September 30, 2021. Improving Capital Efficiency

…And Have a Pristine Balance Sheet ($481) $170 $149 $180 $207 Q3'20 Q4'20 Q1'21 Q2'21 Q3'21 (Net Debt)/Cash on Balance Sheet ($M) Cash includes restricted cash.

Clear Path to $1 Billion+ Revenue

The Path to $1 Billion+ Revenue is Clear 2021E revenue based on midpoint of revenue guidance provided on November 10, 2021. $387M $459M $519M $616M $1 Billion 2018 2019 2020 2021E 2022E 2023E 2024E Surpassing 5 – 10% MSP Count Growth 10 – 15% ARR/MSP Growth

We’ve Been Steadily Adding New MSP Partners 13.6 14.4 15.1 15.4 16.2 16.6 16.7 17.0 17.2 17.0 17.3 17.8 18.2 2018 2019 2020 2021 132,000 MSPs Globally Growing 3.5% per year(1) 14% Market Penetration (1) Source: Frost & Sullivan, Market Intelligence Refresh on the Global TAM Assessment on the Managed Service Provider Market, 2021. Datto MSP Partners (thousands)

Our Channel Leverage Model Drives Consistent Growth in ARR per MSP $26.0 $26.3 $26.5 $27.5 $27.5 $28.6 $29.8 $29.8 $30.4 $31.9 $33.1 $33.6 $34.4 2018 2019 2020 2021 ARR per MSP ($M) 13% Q3 2021 YoY Growth
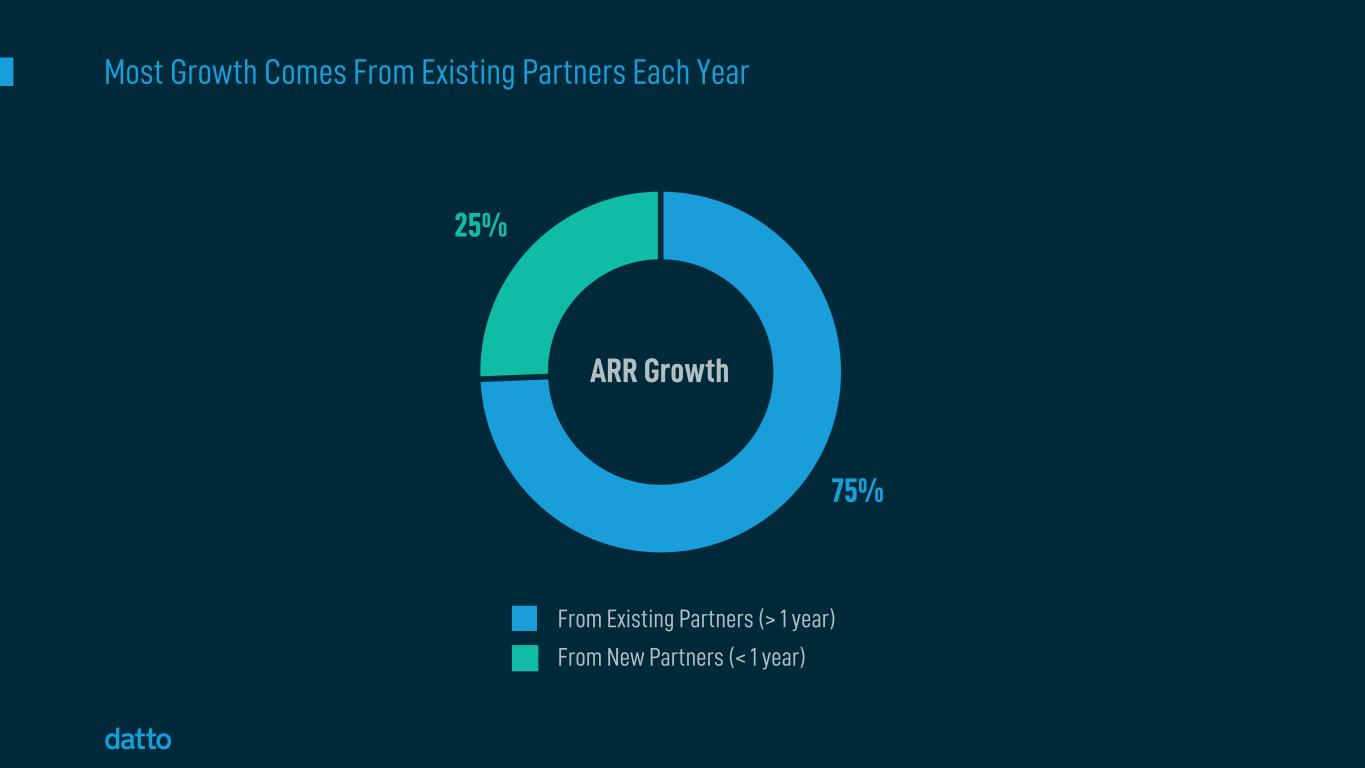
From Existing Partners (> 1 year) Most Growth Comes From Existing Partners Each Year ARR Growth 75% 25% From New Partners (< 1 year)

We Have a Growing Number of Very Deep Customer Relationships 850 950 1,000 1,000 1,050 1,100 1,150 1,250 1,300 (1) As of September 30, 2021 2019 2020 2021 $230K+ Average ARR per partner > $100k 1 Partners > $100k in ARR

122% 119% 116% 115% 110% 110% 110% 106% Our Retention is Strong and Above Direct-to-SMB Companies Source: Company reports. Most recently available LTM NRR as of 11/30/21. Datto’s Dollar-based net retention rate is calculated as ARR as of the last day of the current reporting period from partners with ARR as of the last day of the prior year comparative reporting period divided by ARR as of the last day of the prior year comparative reporting period. Net revenue retention as defined by each company. Net Revenue Retention

Dec-10 Dec-11 Dec-12 Dec-13 Dec-14 Dec-15 Dec-16 Dec-17 Dec-18 Dec-19 Dec-20 2020 2019 2018 2017 2016 2015 2014 2013 2012 2011 2010 Powerful MSP-centric Model Delivers Consistent Cohort Growth ARR, or annual run-rate revenue, calculated as the monthly run-rate revenue for the last month of a period multiplied by 12; monthly run-rate revenue calculated by aggregating monthly subscription values during the final month of the reporting period from both long-term and month-to-month subscriptions. Through December 31, 2020 Class of… Sell-through Annual Cohorts

$8K We Have a Significant Opportunity to Expand ARR Per MSP Over Time 2013 Cohort (Yr 8) Partners > $100k ARR Q3 2021 Total Company Average $34K $75K+ $230K+ 2021 Cohort (Yr 1) 4x 30x 10x ARR per MSP

Opportunistic M&A Supports Our Strategy M&A Principles • Opportunistic • Accelerate time to market • Highly skilled teams • Differentiated tech • Can be tailored to MSP market Datto NetworkingOpen Mesh SaaS ProtectionBackupify Datto CommerceGluh SaaS DefenseBitDam

The Path to $1 Billion+ Revenue is Clear 2021E revenue based on midpoint of revenue guidance provided on November 10, 2021. $387M $459M $519M $616M $1 Billion 2018 2019 2020 2021E 2022E 2023E 2024E Surpassing 5 – 10% MSP Count Growth 10 – 15% ARR/MSP Growth

Rule of 40+ Rule of 50

Near-Term We’re Investing in Growth – Rule of 40+ Rule of 40+ near term=Revenue Growth Adjusted EBITDA Margin $36Bn TAM and Growing Leading Market Position Investing in Growth Extend leadership position Capture large opportunity

Q3’ 2021 Target How We Get There Gross Margin % 73% ~75% • Lower product costs • Subscription mix • Optimize support S&M % of Revenue 21% ~20% • Partner self-service • Leverage from MSP channel model R&D % of Revenue 14% ~15% • Innovation investment • Security and cloud G&A % of Revenue 15% ~10% • Automation • Operating leverage Adj. EBITDA Margin % 28% 30%+ CapEx % Revenue 7% ~5% • Optimize cloud architecture • Lower terabyte costs Long-Term Target Financial Model – Rule of 50

Growth and Profitability at Scale Clear Path to $1 Billion+ Revenue Rule of 40+ Rule of 50 Key Takeaways

Appendix

$ thousands 2019 2020 YTD 2021 Net income (loss) ($31,188) $22,498 $45,687 Income tax (2,511) 8,062 6,461 Depreciation & amortization 43,162 49,113 43,349 Interest and other expense, net 43,693 21,920 657 Loss on extinguishment of debt 19,231 8,488 – Restructuring expense – 3,835 – Transaction related and other expense – 3,112 4,137 Stock-based compensation expense 12,215 33,460 35,355 Adjusted EBITDA $84,602 $150,488 $135,646 Non-GAAP Reconciliations $ thousands 2019 2020 YTD 2021 GAAP gross profit $301,445 $368,581 $327,191 Amortization of acquired intangible assets 4,700 5,023 6,714 Stock-based compensation expense 98 4,713 3,466 Restructuring expense – 601 – Non-GAAP Gross Profit $306,243 $378,918 $337,371 $ thousands 2019 2020 YTD 2021 GAAP net cash provided by operating activities $11,235 $108,698 $99,109 Less: Purchases of property and equipment (38,226) (40,466) (32,170) Free Cash Flow ($26,991) $68,232 $66,939

$ thousands Q3 2021 GAAP sales and marketing expense $35,173 Stock-based compensation expense ($2,354) Non-GAAP sales and marketing expense $32,819 Non-GAAP Reconciliations


