Exhibit 99.2

David Ossip
Chair and Co-CEO, Ceridian
Dear Fellow Stockholders,
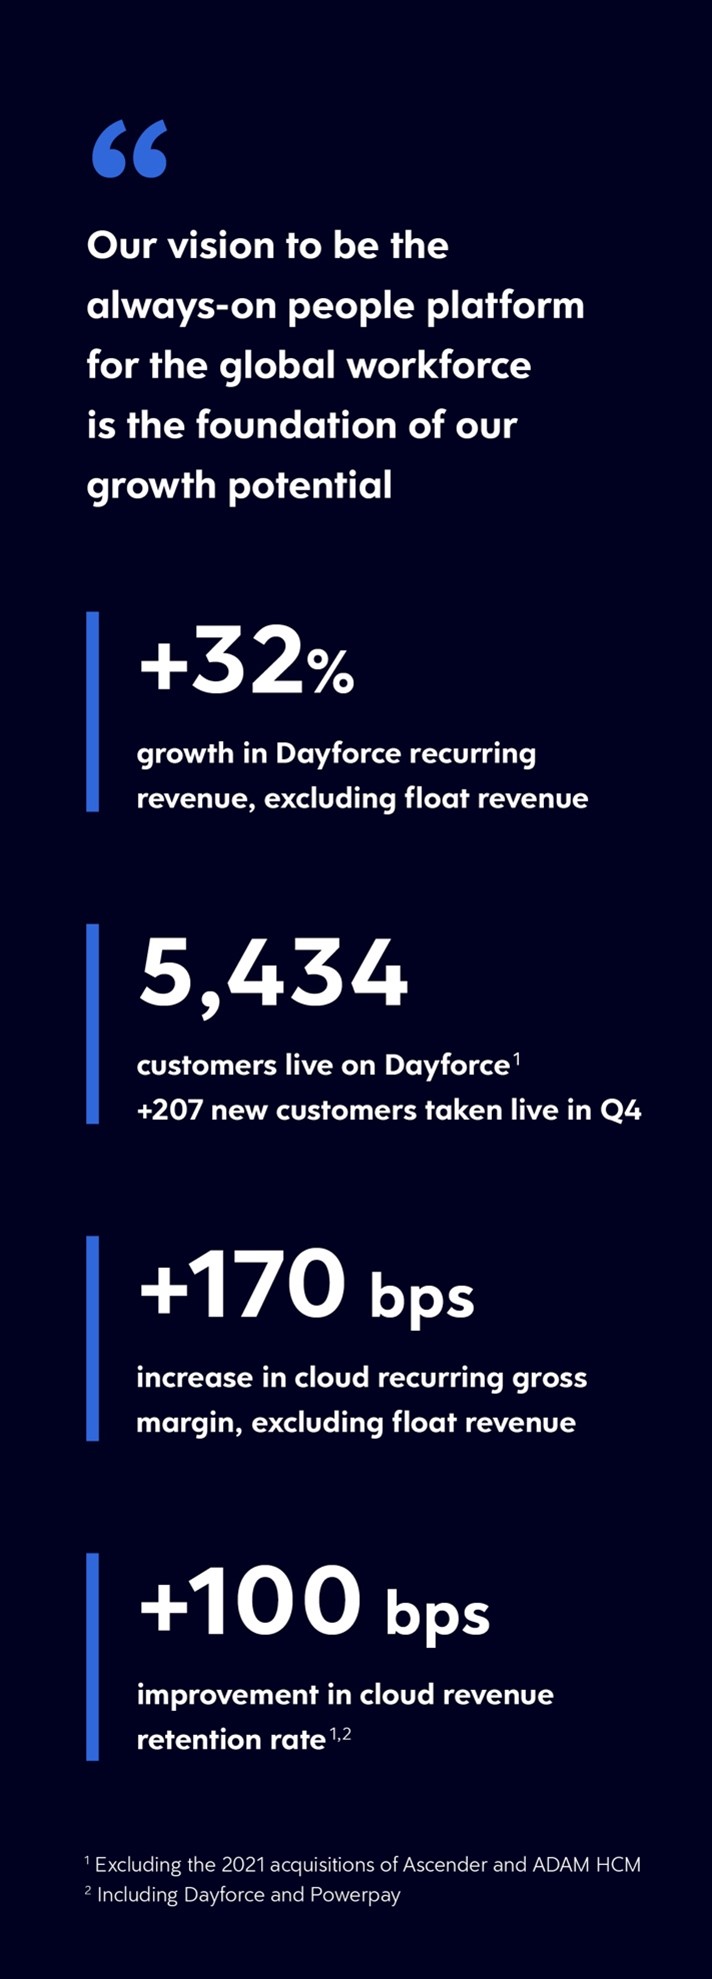
I am very pleased to report that we closed fiscal year 2021 with strong momentum and financial performance. Dayforce recurring revenue, excluding float revenue, grew by 32% in the fourth quarter and by 29% for the full year.
The end of a fiscal year provides an important opportunity to report not just on the accomplishments of the recent year but also to address the potential of the future.
This is especially true as we position Ceridian for 2022 and beyond. While we hope and expect that the impact of the pandemic will recede, it will nonetheless leave a lasting impact in what our customers need from us to redefine their workforce experience. I believe all business leaders would agree – many aspects of how we worked previously will not ever return. Given that reality, and as I look into the future, I am invigorated by the potential for our growth opportunities to expand on multiple fronts.
The future of work is here now and that requires our solutions to provide an ever more sophisticated experience for our customers. They are transitioning into a new world of work that is more fluid, borderless, skills-based, augmented, and always-on than ever before.
Our vision to be the always-on people platform for the global workforce is the foundation of our growth potential. This vision supports our customers as they adjust to becoming more agile, resilient, and better equipped to respond to the new workforce reality that puts workers in the driver’s seat.
This significant trend in the new world of work, coupled with another major trend of organizations accelerating their transition into cloud solutions, puts Ceridian at the center of two dynamic market forces where our customers benefit greatly from the power of our modern Dayforce platform along with the deep expertise of our services and partner ecosystem teams that help ensure their success.
During my many meetings with customers over the past months, I have been particularly struck by how much we can help them and by how much they recognize the value we provide.
I am especially pleased that our focus on delivering value to our customers has allowed us to deliver strong financial and operating results, while we are simultaneously building for future growth through our investments in people and products.
| | | | |
1 |  Q4 2021 Stockholder letter Q4 2021 Stockholder letter | | | | |
Turning to our results – as mentioned, in the fourth quarter, Dayforce recurring revenue, excluding float revenue, grew by 32%. In addition, total revenue grew by 27%, exceeding our guidance for the quarter.
Sales performance in the quarter was very strong. We saw continued growth and momentum in both the size and volume of sales transactions.
Go-live performance also was tremendous. We took live and activated a record amount of recurring revenue across 207 customers.
We also achieved two remarkable milestones for our company:
•More than $1 billion in total revenue, which exceeded our guidance.
•More than 5 million active employees on the Dayforce platform, an increase of 21% year-over-year.*
Customer satisfaction was at record levels. Cloud revenue retention rate, including Dayforce and Powerpay, increased by 100 basis points to 96.8%.
* Excluding the 2021 acquisitions of Ascender and ADAM HCM
| | | | |
2 | Q4 2021 Stockholder letter | | | | |
| | | | |
3 | Q4 2021 Stockholder letter | | | | |
Our five strategic levers continued to guide our execution and overall growth agenda:
•Acquiring new customers in the markets where we have seen success to date;
•Extending the Dayforce platform, allowing us to deliver more value to our current and prospective customers;
•Expanding within the enterprise segment;
•Accelerating our global expansion both by serving local customers in new geographies, and by extending our scope to service global multinational customers; and
•Driving incremental revenue from our customers by innovating in adjacent markets around our core HCM suite, such as Dayforce Wallet.
As we have further defined and advanced our product vision, we also continue to take the necessary steps within our business to maintain high growth as a global HCM leader.
We are making strategic investments in our product to continue building the full-suite capabilities of Dayforce. We believe our proven ability to innovate in response to the changing dynamics of our industry will continue to accelerate our market leadership.
We are building a strong partner ecosystem to further enhance our well-defined implementation process and enhance the quantifiable value our customers have come to expect from Ceridian and the Dayforce platform.
We are capitalizing on the strategic acquisitions we have made in Asia Pacific Japan (APJ) with Ascender and Excelity. In early 2022, we took some actions to balance our workforce across our global offices. This will strengthen our ability to service our global customers, and over time, increase our overall profitability.
With all components of our plan working together, we are taking full advantage of this significant growth opportunity in front of us, helping customers around the world win in the new world of work.
| |
| We achieved two remarkable milestones: More than $1 billion in total revenue and more than 5 million active employees on the Dayforce platform |
| |
Formalizing our leadership structure
Delivering strong results today, while building for the future, is due to the outstanding team we have built at Ceridian. In particular, through Leagh Turner’s leadership and execution in her role as President and Chief Operating Officer, we have been able to scale our organization to support the aggressive growth we have delivered.
Since Leagh joined us in the third quarter of 2018:
•Dayforce recurring revenue excluding float has more than doubled;
•Cloud recurring gross margin has increased by 640 basis points; and
| | | | |
4 | Q4 2021 Stockholder letter | | | | |
•The number of Dayforce customers has increased by 57%, while the average incremental revenue per customer* has increased by more than 80%.
Regardless of challenges like COVID-19 and operating through a pandemic, we have continued to grow, and the company has never been more successful.
Equally important, Leagh has been a talent magnet, helping us recruit new and develop existing executives to create an incredible team that has the necessary skills and operating experience to lead us into our next phase of growth.
That’s why I am excited to announce her promotion to Co-CEO and her appointment to the Board of Directors. In her new role, Leagh will continue to report to me, as Chair and Co-CEO.
As we focus on the future, this step formalizes how Leagh and I have run the company together during the last three years.
To be clear, I love Ceridian; I’m not going anywhere, and I’ve never been more committed and excited about our future. In fact, this structure will help me go even deeper into key areas of growth for the business. I want to increase my capacity to keep Ceridian in the forefront of innovation. I will be deeply focused on product innovation and the massive opportunity in front of us with Dayforce Wallet, including our ability to expand the Wallet to the extended workforce.
Additionally, I am going to continue to spend significant time with prospects and our incredible community of customers. As I detailed above, we are in the middle of the most significant workforce transformation in decades, and Ceridian has never been more relevant and necessary as organizations of all sizes navigate these changes.
| |
| Together, Leagh and I will lead Ceridian into its next chapter of growth. We believe this is what a modern, future-focused company should look like |
| |
In this expanded role for Leagh, she will be able to continue to fully drive the end-to-end operations and strong execution that is fundamental to Ceridian’s growth. She also will continue to expand our talent base, leveraging her tremendous ability to identify and recruit leaders, who are at the center of our success.
Together, Leagh and I will lead Ceridian into its next chapter of growth. We believe this is what a modern, future-focused company should look like.
* Excluding float revenue, Ascender and ADAM HCM revenue, and COVID-19 volume impact, on a constant currency basis.
| | | | |
5 | Q4 2021 Stockholder letter | | | | |
Financial highlights
We had strong financial and operating performance in the fourth quarter. We maintained strong topline growth driven by Dayforce recurring revenue, which grew by 32% excluding float revenue, or 31% on a constant currency basis.
Sales performance was significantly above the fourth quarter of 2020 as well as pre-COVID levels.
We increased annual cloud retention rate by 100 basis points to 96.8%.
Cloud recurring gross margin was 72.2%, up 130 basis points compared to the fourth quarter of 2020. Excluding float revenue cloud recurring gross margin expanded by 170 basis points.
From a profitability standpoint, Adjusted EBITDA was $38.7 million, or 13.7% of revenue.
| | | | |
6 | Q4 2021 Stockholder letter | | | | |

| | | | |
7 | Q4 2021 Stockholder letter | | | | |
Customer highlights
We are focused on delivering value to our customers throughout their lifecycle, and thereby earning customers for life. Our modern cloud platform, in combination with our services team and partner ecosystem, enable us to take customers live quickly, predictably, and on-time at a consistent pace.
As we noted previously, our go-live performance was very strong. We took live a record amount of recurring revenue across 207 customers.1 We ended the fourth quarter with 5,434 customers live on the Dayforce platform, an 11% increase compared to the fourth quarter of 2020.1 We are successfully selling the broader HCM suite, and our trailing twelve-month Dayforce recurring revenue per customer for the same period was $108,631 up 10%2 year-over-year. Incremental Dayforce recurring revenue per customer for the same period increased to $201,326.2
During the quarter, we took some notable companies live on Dayforce with key customers, including:
•A leading managed care provider that serves over 25 million members in the U.S. recently went live with Dayforce to more than 50,000 employees across the U.S.
•A worldwide manufacturing and retail organization has successfully deployed Dayforce in four global regions to over 50,000 employees in 21 countries. The company decided to partner with Ceridian as part of a global business transformation journey for its pay and time solutions.
•A premier multi-national consulting company is now live with Dayforce for 73,000 employees in the U.S. and Canada. Dayforce provides the customer with a unified, cloud-based solution capable of multi-jurisdictional taxation, managed services executed directly on the platform, and enhanced self-service offerings.
•One of Europe’s largest veterinary care providers went live with Dayforce across eight practices in the UK. This was the first phase of the project covering over 14,000 employees and encompassing HR, time and attendance, and managed pay. The second phase of the project will extend into Europe, Middle East and Africa (EMEA) in 2022.
•A large, U.S.-based home furnishing store chose Dayforce as a unified solution for its 4,700 employees. Ceridian’s single system and in-depth retail industry experience were both key factors in the company’s decision. The Dayforce implementation was completed successfully and ahead of schedule.
| |
| |
| Our focus on helping our customers adapt and evolve their workforce with our modern platform is driving strong demand for Dayforce |
| |
1Excluding the 2021 acquisitions of Ascender and ADAM HCM.
2 Excluding float revenue, Ascender and ADAM HCM revenue, and COVID-19 volume impact, on a constant currency basis.
| | | | |
8 | Q4 2021 Stockholder letter | | | | |
Sales highlights
Our focus on helping our customers adapt and evolve their workforce with our modern platform is driving strong demand for Dayforce.
In North America during the fourth quarter, we had continued success across enterprise and large enterprise markets:
•PRO Unlimited, a pioneer in staffing and managing contingent workers with nearly 30,000 employees globally, chose Dayforce as its holistic HCM solution. In addition to streamlining HR processes and gaining visibility into data on a global scale, the company also sees Dayforce Wallet as a differentiator to help attract and retain talent in North America.
•An industry leader in real estate management and development selected Dayforce for managed payroll, time, and benefits globally for 21,000 employees across more than 2,000 properties.
•A global customer care and technology company with over 20,000 employees chose Ceridian as a trusted HCM partner. As the company continues to expand its presence globally, Dayforce will eliminate the need for multiple systems, saving the company time, reducing compliance risk, and providing a more unified employee experience.
•A professional financial services organization with 6,750 employees in the U.S. and Canada chose to broaden its partnership with Ceridian from workforce management to the full Dayforce platform. The company also plans to expand into other global markets. Dayforce will provide a unified, scalable, and customizable HCM solution, allowing the company to manage compliance globally and stay ahead of the curve with Ceridian’s innovative product roadmap.
•One of Canada’s fastest-growing hospitality companies selected Dayforce for workforce management, recruiting, and managed services including payroll and benefits. The company currently has 10,000 employees across five countries and expects significant growth in the next several years. Dayforce will provide immediate value to North American operations, and the company plans to expand its use of the platform globally to centralize all HCM processes.
•A U.S. commercial printing company selected Dayforce for each of its three business units. The company has 11,500 employees in the U.S., Canada, and Mexico. Dayforce will give each division a consolidated solution for HR, pay, time, and talent management. This will enable the company to ensure each unit has its own independent system, while improving efficiency across the organization.
We continue to execute on the strategic growth lever of expanding globally in both the APJ region as well as in EMEA. Our key global wins during the fourth quarter included:
•We continue to expand our presence in the Australian market with the region’s largest residential aged care provider including 9,500 employees. The company chose Dayforce as an always-on people platform to increase operational efficiency, reduce operating costs, facilitate compliance, and attract and retain top talent.
•A leading holiday company in the UK and Ireland selected Dayforce to manage 10,000 employees across six locations. The company was looking for a first-class workforce management solution to replace existing manual processes which were not functioning for the scale and complexity of the organization. Dayforce was selected due to its ability to handle complex and varied business policies, while still providing an intuitive and engaging user experience. The company is also interested in the opportunity to expand its Ceridian partnership in the future with HR, payroll, and talent management.
| | | | |
9 | Q4 2021 Stockholder letter | | | | |
•A UK logistics company with 5,750 employees and 1,500 agency staff selected Dayforce to modernize its HCM operations. The company was struggling with multiple sets of data and inefficient manual processes that were hindering its growth. Dayforce will provide a unified solution for HR, pay, and workforce management. This will allow the company to scale its people operations, view critical workforce data, and access reporting in real time, which will support its strategic growth goals.
•A Switzerland-based watch and jewelry company with 2,000 employees around the world selected Dayforce for its global HCM operations. Dayforce will provide a unified solution to optimize workforce management at its locations globally and streamline the user experience for employees.
| | | | |
10 | Q4 2021 Stockholder letter | | | | |

| | | | |
11 | Q4 2021 Stockholder letter | | | | |
Product innovation
As the always-on people platform for the global workforce, our vision guides our innovation agenda and how we deliver value to our customers.
As organizations of all sizes navigate new hybrid work environments, the necessity to create a connected culture defined by an empowered employee experience is essential. In the fourth quarter, we made Dayforce Hub fully available to all customers. We worked in close collaboration with our charter customers to ensure we crafted the right experiences and metrics that would serve our customers best in the new world of work.
At the same time, we understand that to be able to effectively empower employees, our customers need to be able to make data-informed decisions that are augmented by intelligence, taking full advantage of the data inside their organizations. To serve this need, we recently delivered Dayforce People Intelligence, Analytics Studio, and Analytics Data Connector to our customers.
Dayforce People Intelligence brings together the richness of our ad-hoc reporting environment with access across the broad spectrum of Dayforce HCM data to deliver advanced business intelligence and data visualization capability.
Dayforce Analytics Studio, which offers 15 new analytics views, provides real-time insights into diversity, equity, and inclusion; benefit health elections; candidate activity; and other HR initiatives that can be customized and readily shared.
Dayforce Analytics Data Connector unlocks the power of our customers’ HCM data using the BI tools of their choice. It enables the transfer of larger volumes of data to our customers so they can utilize their data with familiar and consistent internal tools.
On global payroll, we announced the acquisition of ADAM HCM, which will accelerate Ceridian’s commitment to deliver Dayforce Payroll in Mexico currently planned for later in 2022 as well as over 30 countries across Latin America, South America, and the Caribbean.
We also introduced 110 unique updates to the Dayforce platform in North America and EMEA to help our customers navigate their year-end close.
| | | | |
12 | Q4 2021 Stockholder letter | | | | |

| | | | |
13 | Q4 2021 Stockholder letter | | | | |
Dayforce Wallet
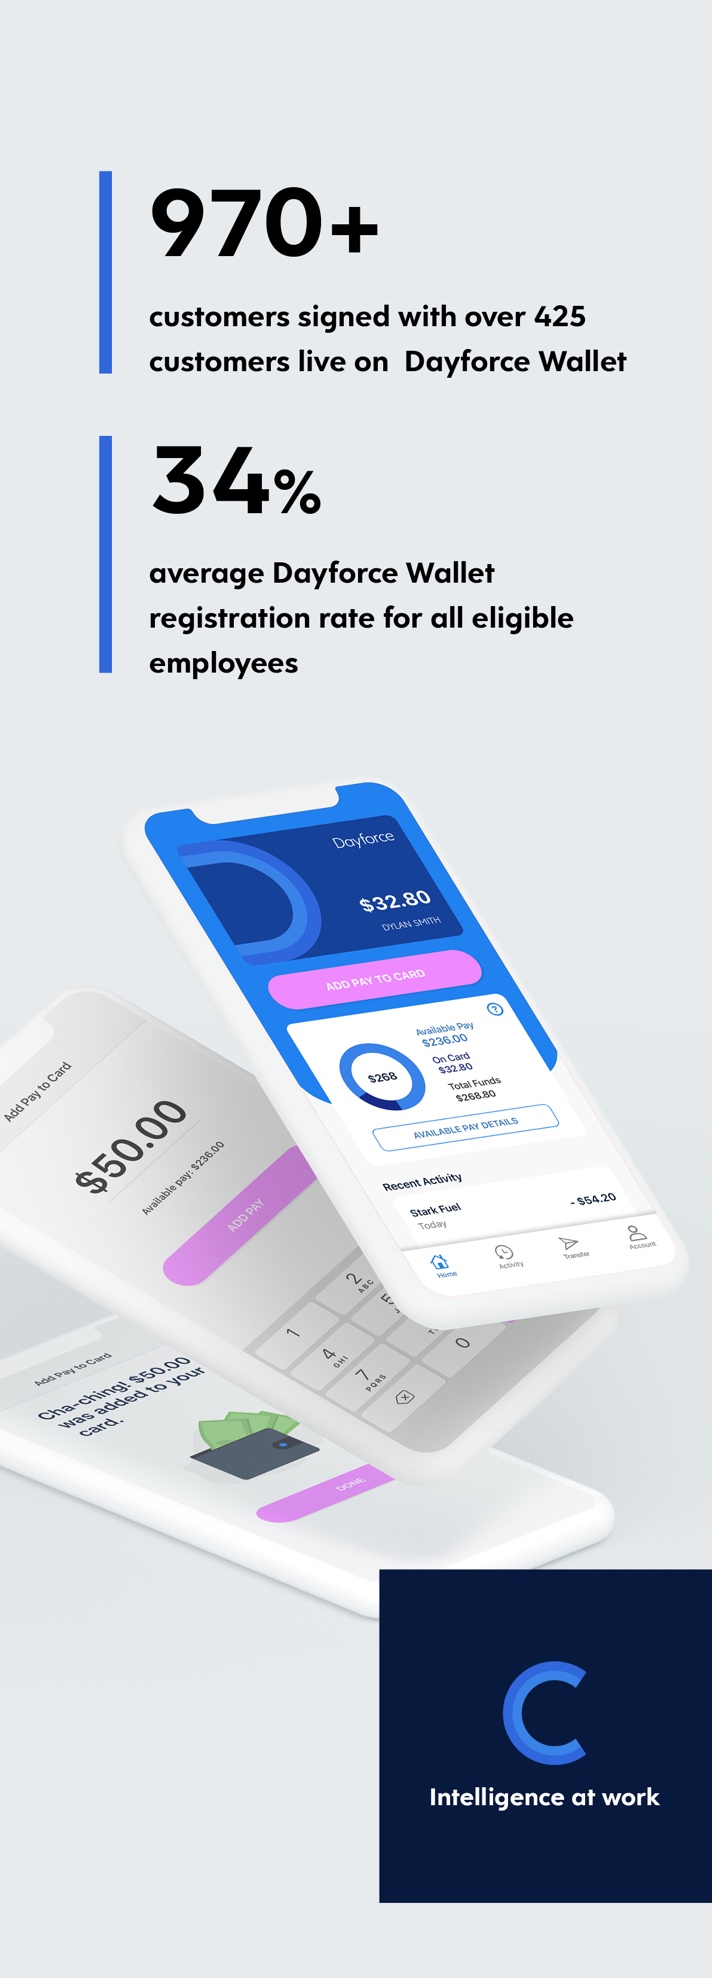
We now have more than 970 customers signed onto Dayforce Wallet with over 425 customers live on the product.
Dayforce Wallet continues to positively impact win rates in market as evidenced by the 80% attach rate of Dayforce Wallet to new sales.
In addition, we continue to see strong evidence that the Dayforce Card is top of wallet:
•Average registration rates increased to 34% of all eligible employees and are approximately 50% in our top quartile of tenured customers.*
•The Dayforce Card continues to be used more than 25 times per month by individual users on spending for groceries, convenience stores, fast food, restaurants, gas, and ATM withdrawals.
Dayforce Wallet users are enjoying new features such as cash back rewards and two day early direct deposit. Looking ahead in 2022 and taking advantage of our strong roadmap, we will be launching a referral program, streaming pay, and a new market – welcoming users in the United Kingdom.
| |
| |
| Dayforce Wallet users are enjoying new features such as cash back rewards and two day early direct deposit |
| |
To further the adoption of Dayforce Wallet, we formed a strategic partnership with PRO Unlimited, who will offer Dayforce Wallet as part of its comprehensive Worker Experience solution, providing contingent workers with direct access to their net pay as they earn it. In the contingent workforce industry’s highly competitive labor market, Dayforce Wallet will provide true value and a competitive advantage to an organization’s ability to recruit and engage workers more effectively.
We are continuing to accelerate our vision to fundamentally change how workers at every level get paid, enabling more ways for them to take full control of their financial wellbeing.
* Tenured customers have been live on Dayforce Wallet for more than a year.
| | | | |
14 | Q4 2021 Stockholder letter | | | | |
| | | | |
15 | Q4 2021 Stockholder letter | | | | |
Global expansion
As we discussed over previous quarters, we believe we have a significant opportunity for growth outside of North America as we execute against our strategy to be a global leader in the cloud HCM market.
In our APJ region, we are optimizing the strategic acquisitions we made with Ascender and Excelity, utilizing key markets in Asia to streamline our operations, ensuring we continue to deliver strong service and support levels to our customers wherever they operate in the world.
In addition, our acquisition in the fourth quarter of ADAM HCM, a payroll and HCM company serving customers in 33 countries across Central America, South America, and the Caribbean, positions Ceridian as a leading HCM provider in Latin America and will create value for existing and prospective customers in key markets, including Mexico and Brazil.
Through this acquisition, we expect ADAM HCM customers to be able to access the Dayforce platform for global HCM, allowing them to scale and grow globally across new geographies. At the same time, extending our platform in Latin America will better serve our existing multinational customers with operations in this region.
The combination of these acquisitions is a significant step forward in our strategy to make Dayforce a leading solution in all major regions of the world.
Summary
Our fourth quarter performance closed out a year defined by continued momentum across all areas of our business. We exceeded the financial and operational metrics we set out at the start of the year, as we stay focused on accelerating our position as a global HCM leader.
Looking ahead in 2022, our vision to be the always-on people platform for the global workforce, coupled with our customer-driven innovation, puts us directly at the center of two large trends: the new world of work and the transition to cloud-based solutions that enable organizations to change and adapt to it.
Our relentless customer focus, product vision, scale, and geographic reach give us great confidence in our ability to take full advantage of these market dynamics and deliver strong, profitable growth.
As we continue to invest in Dayforce, our people, and our business, we know it all serves to strengthen the quantifiable value our customers have come to expect from us and further our ability to deliver value to you, our fellow stockholders.
| | | | |
16 | Q4 2021 Stockholder letter | | | | |

Noémie Heuland
EVP and Chief Financial Officer
The quarterly and annual financial highlights and business outlook below are on a year-over-year basis and reported in U.S. dollars, unless otherwise stated.
Revenue
Our financial performance in the fourth quarter of 2021 was strong:
•Dayforce recurring revenue increased by $39.5 million, or 30%, to $170.4 million. Excluding float revenue, Dayforce recurring revenue increased by 32%, or 31% on a constant currency basis.
•Dayforce revenue increased by $45.8 million, or 27%, to $216.5 million. Excluding float revenue, Dayforce revenue increased by 28%, or 27% on a constant currency basis.
•Powerpay revenue increased by $1.7 million, or 7%, to $24.9 million. Excluding float revenue, Powerpay revenue increased by 8%, or 5% on a constant currency basis.
•Cloud revenue, which includes both Dayforce and Powerpay, increased by $47.5 million, or 24%, to $241.4 million. Excluding float revenue, Cloud revenue increased by 26%, or 25% on a constant currency basis.
•Total revenue increased by $59.3 million, or 27%, to $282.1 million. Excluding float revenue, total revenue increased by 28%, or 27% on a constant currency basis.
Our fourth quarter results included $23.3 million of Ascender revenue, of which $5.4 million was recognized in Dayforce recurring revenue, $0.6 million was recognized in Dayforce professional services and other revenue, and $17.3 million was recognized in Bureau revenue.
The average float balance for our customer funds during the fourth quarter increased 28% to $4,031.4 million, compared to $3,145.5 million. The average yield on our float balance was 1.01% during the fourth quarter, a decline of 32 basis points. As a result, float revenue from invested customer funds was $10.1 million in the fourth quarter, compared to $10.6 million. The allocation of fourth quarter 2021 float revenue to Dayforce and Cloud revenue was $7.2 million and $9.4 million, respectively.
| | | | |
17 | Q4 2021 Stockholder letter | | | | |
Impact of COVID-19
As anticipated, the COVID-19 pandemic has had an adverse impact on revenue during the fourth quarter, primarily in the form of lower employment levels at our customers, and lower demand for professional services.
We estimate that lower employment levels at our customers adversely affected fourth quarter revenue by approximately $2.5 million, of which approximately $2.0 million was related to Dayforce and approximately $0.5 million was related to Powerpay.
We believe that our ability to earn float revenue on invested customer funds is a positive aspect of our business model. Insofar as market investment rates return to pre-pandemic levels, we believe there is opportunity for high-margin float revenue to increase and provide a tailwind to future revenue growth and cash flow. Based on current market conditions, portfolio composition, and investment practices, a 100-basis point increase in market investment rates would result in an approximately $23 million increase in float revenue, and an approximately $17 million increase in cash flow, over the ensuing twelve-month period.
Gross margin
In the fourth quarter of 2021, Cloud recurring gross margin was 72.2%, compared to 70.9%, an expansion of 130 basis points. Excluding float revenue, Cloud recurring gross margin expanded by 170 basis points as we continue to realize economies of scale in customer support and hosting costs. Professional services and other gross margin was (6.3)%, compared to (4.1)% last year.
Earnings per share
Net loss in the fourth quarter of 2021 was ($9.5) million, or ($0.06) per diluted share, compared to ($17.3) million, or ($0.12) per diluted share. Adjusted net income in the fourth quarter of 2021 was $9.3 million, or $0.06 per diluted share, compared to $14.0 million, or $0.09 per diluted share.
Adjusted EBITDA
Adjusted EBITDA increased by 17% to $38.7 million in the fourth quarter of 2021. Excluding float revenue, Adjusted EBITDA increased by 27%, and Adjusted EBITDA margin contracted by 10 basis points, reflecting continued investment in product development and sales and marketing.
Depreciation and amortization
In the fourth quarter of 2021, depreciation and amortization increased by $3.3 million to $18.2 million. The increase is primarily driven by $3.7 million of depreciation and amortization from Ascender and Ideal, which includes amortization of intangible assets and depreciation of fixed assets.
Full year 2021 revenue and gross margin
We are pleased by our full year 2021 financial performance:
•Dayforce recurring services revenue increased by $126.4 million, or 25%, to $626.6 million. Excluding float revenue and on a constant currency basis, Dayforce recurring services revenue increased by 27%.
•Dayforce revenue increased by $137.1 million, or 21%, to $785.9 million. Excluding float revenue and on a constant currency basis, Dayforce revenue increased by 22%.
| | | | |
18 | Q4 2021 Stockholder letter | | | | |
•Total revenue increased by $181.7 million, or 22%, to $1,024.2 million. Excluding float revenue and on a constant currency basis, total revenue increased by 22%.
•Cloud recurring services gross margin increased 110 basis points to 72.3%, compared to 71.2% in 2020. Excluding float revenue, Cloud recurring services gross margin expanded 200 basis points.
Other key performance metrics
Annual Cloud revenue retention rate was 96.8% in 2021, compared to 95.8% in 2020.
2021 Cloud annualized recurring revenue (“ARR”) was $779.8 million as of December 31, 2021, an increase of 26.2%, or $161.9 million, from December 31, 2020.
Balance sheet and liquidity
As of December 31, 2021, we had cash and equivalents of $367.5 million, and our total debt balance was $1,242.5 million.
During the fourth quarter of 2021, we sold the office building, land, and fixed assets of our St. Petersburg, Florida facility for $40 million, less fees and expenses, which resulted in a gain on the sale of $19.1 million, which was recognized in the consolidated statements of operations within selling, general, and administrative expense. This gain on sale has been excluded from Adjusted EBITDA and improved our cash flow from investing activities in 2021.
| | | | |
19 | Q4 2021 Stockholder letter | | | | |
Business outlook
Based on information available as of February 9, 2022, Ceridian is issuing guidance for the full year and first quarter of 2022 as indicated below.
Comparisons are on a year-over-year basis, unless stated otherwise.
Full Year 2022 guidance
•Dayforce recurring revenue, excluding float revenue, of $751 million to $762 million, or an increase of 26% to 28% on both a GAAP basis and a constant currency basis.
•Cloud revenue of $1,054 million to $1,075 million, or an increase of 21% to 23% on both a GAAP basis and a constant currency basis.
•Total revenue of $1,192 million to $1,217 million, or an increase of 16% to 19% on a GAAP basis and 17% to 19% on a constant currency basis.
•Adjusted EBITDA of $180 million to $195 million.
First quarter 2022 guidance
•Dayforce recurring revenue, excluding float revenue, of $177 million to $180 million, or an increase of 29% to 31% on both a GAAP basis and a constant currency basis.
•Cloud revenue of $249 million to $254 million, or an increase of 23% to 25% on both a GAAP basis and a constant currency basis.
•Total revenue of $286 million to $292 million, or an increase of 22% to 25% on both a GAAP basis and a constant currency basis.
•Adjusted EBITDA of $41 million to $47 million.
Supplemental guidance details
Our guidance assumes productivity gains through further integration of the Excelity and Ascender acquisitions and specifically a re-balancing of our resources across our global offices. We expect this balancing of our workforce to result in one-time severance and restructuring costs of approximately $25 million, to be accounted for in cost of recurring revenue, primarily in the first quarter of 2022. These costs will be excluded from Adjusted EBITDA. Excluding these costs, we expect cloud recurring gross margin to continue to improve in 2022.
In addition, our guidance assumes an increase of 25 basis points in the Federal Reserve discount rate and current Bank of Canada interest rate in both March and June of 2022. Based on current market conditions, portfolio composition, and investment practices, each 100 basis point change in market investment rates would result in approximately $23 million of change in float revenue over the ensuing twelve month period.
While we experienced adverse impacts on our fourth quarter revenue from the COVID-19 pandemic in the form of lower employment levels at our customers, we ended 2021 with employment levels at our customers in-line with
| | | | |
20 | Q4 2021 Stockholder letter | | | | |
pre-pandemic levels. As a result, our guidance for the full year and first quarter of 2022 assumes no further improvement or reduction in employment levels at our customers due to the COVID-19 pandemic.
We have not reconciled the Adjusted EBITDA range for the full year or first quarter of 2022 to the directly comparable GAAP financial measure because applicable information for the future period, on which this reconciliation would be based, is not readily available due to uncertainty regarding, and the potential variability of, depreciation and amortization, share-based compensation expense and related employer taxes, changes in foreign currency exchange rates, and other items.
Foreign exchange impacts
For the full year and first quarter of 2022, our guidance assumes an average U.S. dollar to Canadian dollar foreign exchange rate of $1.25, compared to an average rate of $1.25 for the full year of 2021.
| | | | |
21 | Q4 2021 Stockholder letter | | | | |
Ceridian HCM Holding Inc.
Condensed consolidated balance sheets
(Dollars in millions, except share data)
| | | | | | | | |
| | December 31, | |
| | 2021 | | | 2020 | |
| | (unaudited) | | | | |
Assets | | | | | | |
Current assets: | | | | | | |
Cash and equivalents | | $ | 367.5 | | | $ | 188.2 | |
Restricted cash | | | 1.9 | | | | — | |
Trade and other receivables, net | | | 146.3 | | | | 101.1 | |
Prepaid expenses and other current assets | | | 92.6 | | | | 73.9 | |
Total current assets before customer funds | | | 608.3 | | | | 363.2 | |
Customer funds | | | 3,535.8 | | | | 3,759.4 | |
Total current assets | | | 4,144.1 | | | | 4,122.6 | |
Right of use lease asset | | | 29.4 | | | | 27.9 | |
Property, plant, and equipment, net | | | 128.2 | | | | 136.4 | |
Goodwill | | | 2,323.6 | | | | 2,031.8 | |
Other intangible assets, net | | | 332.5 | | | | 195.0 | |
Other assets | | | 208.4 | | | | 187.6 | |
Total assets | | $ | 7,166.2 | | | $ | 6,701.3 | |
Liabilities and equity | | | | | | |
Current liabilities: | | | | | | |
Current portion of long-term debt | | $ | 8.3 | | | $ | 7.2 | |
Current portion of long-term lease liabilities | | | 11.3 | | | | 10.5 | |
Accounts payable | | | 51.7 | | | | 38.9 | |
Deferred revenue | | | 48.7 | | | | 24.4 | |
Employee compensation and benefits | | | 77.3 | | | | 64.6 | |
Other accrued expenses | | | 24.7 | | | | 20.5 | |
Total current liabilities before customer funds obligations | | | 222.0 | | | | 166.1 | |
Customer funds obligations | | | 3,519.9 | | | | 3,697.8 | |
Total current liabilities | | | 3,741.9 | | | | 3,863.9 | |
Long-term debt, less current portion | | | 1,124.4 | | | | 660.6 | |
Employee benefit plans | | | 20.7 | | | | 24.4 | |
Long-term lease liabilities, less current portion | | | 32.7 | | | | 33.6 | |
Other liabilities | | | 19.0 | | | | 20.6 | |
Total liabilities | | | 4,938.7 | | | | 4,603.1 | |
Commitments and contingencies | | | | | | |
Stockholders’ equity: | | | | | | |
Common stock, $0.01 par, 500,000,000 shares authorized, 151,995,031 and 148,571,412 shares issued and outstanding, respectively | | | 1.5 | | | | 1.5 | |
Additional paid in capital | | | 2,860.0 | | | | 2,606.5 | |
Accumulated deficit | | | (309.2 | ) | | | (233.8 | ) |
Accumulated other comprehensive loss | | | (324.8 | ) | | | (276.0 | ) |
Total stockholders’ equity | | | 2,227.5 | | | | 2,098.2 | |
Total liabilities and equity | | $ | 7,166.2 | | | $ | 6,701.3 | |
| | | | |
22 | Q4 2021 Stockholder letter | | | | |
Ceridian HCM Holding Inc.
Condensed consolidated statements of operations
(Dollars in millions, except share and per share data)
| | | | | | | | | | | | | | | |
| Three months ended
December 31, | | | Year ended
December 31, | |
| 2021 | | | 2020 | | | 2021 | | | 2020 | |
| (unaudited) | | | (unaudited) | | | (unaudited) | | | | |
Revenue: | | | | | | | | | | | |
Recurring | $ | 231.6 | | | $ | 181.5 | | | $ | 850.7 | | | $ | 690.2 | |
Professional services and other | | 50.5 | | | | 41.3 | | | | 173.5 | | | | 152.3 | |
Total revenue | | 282.1 | | | | 222.8 | | | | 1,024.2 | | | | 842.5 | |
Cost of revenue: | | | | | | | | | | | |
Recurring | | 71.3 | | | | 57.5 | | | | 262.4 | | | | 213.3 | |
Professional services and other | | 53.7 | | | | 43.0 | | | | 194.6 | | | | 163.7 | |
Product development and management | | 39.8 | | | | 26.2 | | | | 134.0 | | | | 83.7 | |
Depreciation and amortization | | 13.4 | | | | 10.6 | | | | 50.9 | | | | 40.5 | |
Total cost of revenue | | 178.2 | | | | 137.3 | | | | 641.9 | | | | 501.2 | |
Gross profit | | 103.9 | | | | 85.5 | | | | 382.3 | | | | 341.3 | |
Selling, general and administrative | | 101.3 | | | | 107.4 | | | | 417.8 | | | | 333.5 | |
Operating profit (loss) | | 2.6 | | | | (21.9 | ) | | | (35.5 | ) | | | 7.8 | |
Interest expense, net | | 10.4 | | | | 5.7 | | | | 35.9 | | | | 25.1 | |
Other expense, net | | 2.7 | | | | — | | | | 18.9 | | | | 2.7 | |
Loss before income taxes | | (10.5 | ) | | | (27.6 | ) | | | (90.3 | ) | | | (20.0 | ) |
Income tax benefit | | (1.0 | ) | | | (10.3 | ) | | | (14.9 | ) | | | (16.0 | ) |
Net loss | $ | (9.5 | ) | | $ | (17.3 | ) | | $ | (75.4 | ) | | $ | (4.0 | ) |
Net loss per share: | | | | | | | | | | | |
Basic | $ | (0.06 | ) | | $ | (0.12 | ) | | $ | (0.50 | ) | | $ | (0.03 | ) |
Diluted | $ | (0.06 | ) | | $ | (0.12 | ) | | $ | (0.50 | ) | | $ | (0.03 | ) |
Weighted-average shares outstanding: | | | | | | | | | | | |
Basic | | 151,465,292 | | | | 148,086,778 | | | | 150,402,321 | | | | 146,774,471 | |
Diluted | | 151,465,292 | | | | 148,086,778 | | | | 150,402,321 | | | | 146,774,471 | |
| | | | |
23 | Q4 2021 Stockholder letter | | | | |
Ceridian HCM Holding Inc.
Condensed consolidated statements of cash flows
(Dollars in millions)
| | | | | | | | |
| | Year ended December 31, | |
| | 2021 | | | 2020 | |
| | (unaudited) | | | | |
Net loss | | $ | (75.4 | ) | | $ | (4.0 | ) |
Adjustments to reconcile net loss to net cash provided by (used in) operating activities: | | | | | | |
Deferred income tax benefit | | | (38.5 | ) | | | (7.0 | ) |
Depreciation and amortization | | | 77.5 | | | | 51.8 | |
Amortization of debt issuance costs and debt discount | | | 16.9 | | | | 1.2 | |
Lease abandonment costs | | | 2.9 | | | | 16.8 | |
Net periodic pension and postretirement cost | | | 8.8 | | | | 3.3 | |
Provision for doubtful accounts | | | 1.8 | | | | 2.0 | |
Share-based compensation | | | 113.4 | | | | 65.8 | |
Gain on sale of assets | | | (19.1 | ) | | | — | |
Change in fair value of contingent consideration | | | 0.6 | | | | — | |
Other | | | 0.9 | | | | 1.0 | |
Changes in operating assets and liabilities excluding effects of acquisitions and divestitures: | | | | | | |
Trade and other receivables | | | (34.8 | ) | | | (12.0 | ) |
Prepaid expenses and other current assets | | | (12.3 | ) | | | (6.8 | ) |
Accounts payable and other accrued expenses | | | 9.3 | | | | (1.4 | ) |
Deferred revenue | | | 5.5 | | | | (1.2 | ) |
Employee compensation and benefits | | | 2.3 | | | | (104.0 | ) |
Accrued interest | | | 0.4 | | | | — | |
Accrued taxes | | | 0.4 | | | | (3.7 | ) |
Other assets and liabilities | | | (11.8 | ) | | | (32.0 | ) |
Net cash provided by (used in) operating activities | | | 48.8 | | | | (30.2 | ) |
Cash Flows from Investing Activities | | | | | | |
Purchase of customer funds marketable securities | | | (763.8 | ) | | | (212.4 | ) |
Proceeds from sale and maturity of customer funds marketable securities | | | 488.0 | | | | 369.3 | |
Expenditures for property, plant, and equipment | | | (11.5 | ) | | | (18.1 | ) |
Expenditures for software and technology | | | (52.2 | ) | | | (41.7 | ) |
Net proceeds from sale of assets | | | 37.9 | | | | — | |
Acquisition costs, net of cash and restricted cash acquired | | | (409.5 | ) | | | (58.3 | ) |
Net cash (used in) provided by investing activities | | | (711.1 | ) | | | 38.8 | |
Cash Flows from Financing Activities | | | | | | |
(Decrease) increase in customer funds obligations, net | | | (195.7 | ) | | | 483.6 | |
Repayment of long-term debt obligations | | | (7.8 | ) | | | (10.0 | ) |
Proceeds from revolving credit facility | | | 295.0 | | | | 295.0 | |
Repayment of revolving credit facility | | | (295.0 | ) | | | (295.0 | ) |
Proceeds from issuance of common stock under share-based compensation plans | | | 95.4 | | | | 91.7 | |
Proceeds from issuance of convertible senior notes, net of issuance costs | | | 561.8 | | | | — | |
Purchases of capped calls related to convertible senior notes | | | (45.0 | ) | | | — | |
Payment of debt refinancing costs | | | (1.2 | ) | | | — | |
Net cash provided by financing activities | | | 407.5 | | | | 565.3 | |
Effect of exchange rate changes on cash, restricted cash, and equivalents | | | (20.9 | ) | | | (4.0 | ) |
Net (decrease) increase in cash and equivalents | | | (275.7 | ) | | | 569.9 | |
Cash, restricted cash, and equivalents at beginning of year | | | 2,228.5 | | | | 1,658.6 | |
Cash, restricted cash, and equivalents at end of year | | $ | 1,952.8 | | | $ | 2,228.5 | |
Reconciliation of cash, restricted cash, and equivalents to the consolidated balance sheets | | | | | | |
Cash and equivalents | | $ | 367.5 | | | $ | 188.2 | |
Restricted cash | | | 1.9 | | | | — | |
Restricted cash and equivalents included in customer funds | | | 1,583.4 | | | | 2,040.3 | |
Total cash, restricted cash, and equivalents | | $ | 1,952.8 | | | $ | 2,228.5 | |
Supplemental Cash Flow Information: | | | | | | |
Cash paid for interest | | $ | 19.1 | | | $ | 26.7 | |
Cash paid for income taxes | | | 33.4 | | | | 4.2 | |
Cash received from income tax refunds | | | 3.3 | | | | 9.6 | |
| | | | |
24 | Q4 2021 Stockholder letter | | | | |
Ceridian HCM Holding Inc.
Revenue financial measures
(Unaudited)
| | | | | | | | | | | | |
| | | Three months ended
December 31, | | Percentage change in revenue as reported | | Impact of
changes in
foreign
currency(a) | | Percentage change in revenue on a constant currency basis (a) |
| | | 2021 | | | 2020 | | 2021 vs. 2020 | | | | 2021 vs. 2020 |
| | | ($ in millions) | | | | | | |
Revenue: | | | | | | | | | | | | |
Dayforce recurring, excluding float | | $ | 163.2 | | $ | 123.8 | | 31.8% | | 0.9% | | 30.9% |
Dayforce float | | | 7.2 | | | 7.1 | | 1.4% | | (—)% | | 1.4% |
Total Dayforce recurring | | | 170.4 | | | 130.9 | | 30.2% | | 0.9% | | 29.3% |
Powerpay recurring, excluding float | | | 22.6 | | | 20.7 | | 9.2% | | 3.4% | | 5.8% |
Powerpay float | | | 2.2 | | | 2.2 | | (—)% | | 4.5% | | (4.5)% |
Total Powerpay recurring | | | 24.8 | | | 22.9 | | 8.3% | | 3.5% | | 4.8% |
Total Cloud recurring | | | 195.2 | | | 153.8 | | 26.9% | | 1.2% | | 25.7% |
Dayforce professional services and other | | | 46.1 | | | 39.8 | | 15.8% | | 0.7% | | 15.1% |
Powerpay professional services and other | | | 0.1 | | | 0.3 | | (66.7)% | | (33.4)% | | (33.3)% |
Total Cloud professional services and other | | | 46.2 | | | 40.1 | | 15.2% | | 0.5% | | 14.7% |
Total Cloud revenue | | | 241.4 | | | 193.9 | | 24.5% | | 1.1% | | 23.4% |
Bureau recurring, excluding float | | | 35.7 | | | 26.4 | | 35.2% | | 1.5% | | 33.7% |
Bureau float | | | 0.7 | | | 1.3 | | (46.2)% | | (—)% | | (46.2)% |
Total Bureau recurring | | | 36.4 | | | 27.7 | | 31.4% | | 1.4% | | 30.0% |
Bureau professional services and other | | | 4.3 | | | 1.2 | | 258.3% | | (16.7)% | | 275.0% |
Total Bureau revenue | | | 40.7 | | | 28.9 | | 40.8% | | 0.7% | | 40.1% |
Total revenue | | $ | 282.1 | | $ | 222.8 | | 26.6% | | 1.0% | | 25.6% |
| | | | | | | | | | | | |
Dayforce | | $ | 216.5 | | $ | 170.7 | | 26.8% | | 0.8% | | 26.0% |
Powerpay | | | 24.9 | | | 23.2 | | 7.3% | | 3.0% | | 4.3% |
Total Cloud revenue | | $ | 241.4 | | $ | 193.9 | | 24.5% | | 1.1% | | 23.4% |
| | | | | | | | | | | | |
Dayforce, excluding float | | $ | 209.3 | | $ | 163.6 | | 27.9% | | 0.8% | | 27.1% |
Powerpay, excluding float | | | 22.7 | | | 21.0 | | 8.1% | | 2.9% | | 5.2% |
Cloud float | | | 9.4 | | | 9.3 | | 1.1% | | 1.1% | | (—)% |
Total Cloud revenue | | $ | 241.4 | | $ | 193.9 | | 24.5% | | 1.1% | | 23.4% |
| | | | | | | | | | | | |
Cloud recurring, excluding float | | $ | 185.8 | | $ | 144.5 | | 28.6% | | 1.3% | | 27.3% |
Bureau recurring, excluding float | | | 35.7 | | | 26.4 | | 35.2% | | 1.5% | | 33.7% |
Total recurring, excluding float | | | 221.5 | | | 170.9 | | 29.6% | | 1.3% | | 28.3% |
Total revenue, excluding float | | $ | 272.0 | | $ | 212.2 | | 28.2% | | 1.1% | | 27.1% |
a)We have calculated revenue on a constant currency basis by applying the average foreign exchange rate in effect during the comparable prior period.
| | | | |
25 | Q4 2021 Stockholder letter | | | | |
Ceridian HCM Holding Inc.
Revenue financial measures
(Unaudited)
| | | | | | | | | | | | |
| | | Year ended
December 31, | | Percentage change in revenue as reported | | Impact of
changes in
foreign
currency (a) | | Percentage change in revenue on a constant currency basis (a) |
| | | 2021 | | | 2020 | | 2021 vs. 2020 | | | | 2021 vs. 2020 |
| | | ($ in millions) | | | | | | |
Revenue: | | | | | | | | | | | | |
Dayforce recurring, excluding float | | $ | 596.9 | | $ | 463.1 | | 28.9% | | 1.8% | | 27.1% |
Dayforce float | | | 29.7 | | | 37.1 | | (19.9)% | | 1.7% | | (21.6)% |
Total Dayforce recurring | | | 626.6 | | | 500.2 | | 25.3% | | 1.8% | | 23.5% |
Powerpay recurring, excluding float | | | 78.2 | | | 70.8 | | 10.5% | | 7.0% | | 3.5% |
Powerpay float | | | 8.1 | | | 8.7 | | (6.9)% | | 6.9% | | (13.8)% |
Total Powerpay recurring | | | 86.3 | | | 79.5 | | 8.6% | | 7.0% | | 1.6% |
Total Cloud recurring | | | 712.9 | | | 579.7 | | 23.0% | | 2.5% | | 20.5% |
Dayforce professional services and other | | | 159.3 | | | 148.6 | | 7.2% | | 2.1% | | 5.1% |
Powerpay professional services and other | | | 0.9 | | | 1.1 | | (18.2)% | | (—)% | | (18.2)% |
Total Cloud professional services and other | | | 160.2 | | | 149.7 | | 7.0% | | 2.1% | | 4.9% |
Total Cloud revenue | | | 873.1 | | | 729.4 | | 19.7% | | 2.4% | | 17.3% |
Bureau recurring, excluding float | | | 134.5 | | | 104.0 | | 29.3% | | 1.4% | | 27.9% |
Bureau float | | | 3.3 | | | 6.5 | | (49.2)% | | (—)% | | (49.2)% |
Total Bureau recurring | | | 137.8 | | | 110.5 | | 24.7% | | 1.4% | | 23.3% |
Bureau professional services and other | | | 13.3 | | | 2.6 | | 411.5% | | (11.6)% | | 423.1% |
Total Bureau revenue | | | 151.1 | | | 113.1 | | 33.6% | | 1.1% | | 32.5% |
Total revenue | | $ | 1,024.2 | | $ | 842.5 | | 21.6% | | 2.2% | | 19.4% |
| | | | | | | | | | | | |
Dayforce | | $ | 785.9 | | $ | 648.8 | | 21.1% | | 1.8% | | 19.3% |
Powerpay | | | 87.2 | | | 80.6 | | 8.2% | | 6.8% | | 1.4% |
Total Cloud revenue | | $ | 873.1 | | $ | 729.4 | | 19.7% | | 2.4% | | 17.3% |
| | | | | | | | | | | | |
Dayforce, excluding float | | $ | 756.2 | | $ | 611.7 | | 23.6% | | 1.8% | | 21.8% |
Powerpay, excluding float | | | 79.1 | | | 71.9 | | 10.0% | | 6.8% | | 3.2% |
Cloud float | | | 37.8 | | | 45.8 | | (17.5)% | | 2.6% | | (20.1)% |
Total Cloud revenue | | $ | 873.1 | | $ | 729.4 | | 19.7% | | 2.4% | | 17.3% |
| | | | | | | | | | | | |
Cloud recurring, excluding float | | $ | 675.1 | | $ | 533.9 | | 26.4% | | 2.4% | | 24.0% |
Bureau recurring, excluding float | | | 134.5 | | | 104.0 | | 29.3% | | 1.4% | | 27.9% |
Total recurring, excluding float | | | 809.6 | | | 637.9 | | 26.9% | | 2.3% | | 24.6% |
Total revenue, excluding float | | $ | 983.1 | | $ | 790.2 | | 24.4% | | 2.2% | | 22.2% |
a)We have calculated revenue on a constant currency basis by applying the average foreign exchange rate in effect during the comparable prior period.
| | | | |
26 | Q4 2021 Stockholder letter | | | | |
Ceridian HCM Holding Inc.
Reconciliation of GAAP to Non-GAAP financial measures
(Unaudited, dollars in millions)
The following tables present a reconciliation of the reported results to the non-GAAP financial measures EBITDA, Adjusted EBITDA, Adjusted EBITDA margin, and Adjusted net loss for all periods presented:
| | | | | | | | | | | | | | | | |
| | Three months ended December 31, | | | Year ended
December 31, | |
| | 2021 | | | 2020 | | | 2021 | | | 2020 | |
| | | |
Net loss | | $ | (9.5 | ) | | $ | (17.3 | ) | | $ | (75.4 | ) | | $ | (4.0 | ) |
Interest expense, net | | | 10.4 | | | | 5.7 | | | | 35.9 | | | | 25.1 | |
Income tax benefit | | | (1.0 | ) | | | (10.3 | ) | | | (14.9 | ) | | | (16.0 | ) |
Depreciation and amortization | | | 18.2 | | | | 14.9 | | | | 77.5 | | | | 51.8 | |
EBITDA (a) | | | 18.1 | | | | (7.0 | ) | | | 23.1 | | | | 56.9 | |
Foreign exchange loss (gain) | | | 1.0 | | | | (1.1 | ) | | | 9.5 | | | | (1.0 | ) |
Share-based compensation (b) | | | 30.9 | | | | 20.4 | | | | 116.8 | | | | 68.9 | |
Severance charges (c) | | | 1.6 | | | | 2.8 | | | | 7.4 | | | | 9.7 | |
Restructuring consulting fees (d) | | | 2.8 | | | | 1.2 | | | | 16.7 | | | | 8.1 | |
Other non-recurring items (e) | | | (15.7 | ) | | | 16.8 | | | | (11.0 | ) | | | 16.4 | |
Adjusted EBITDA | | $ | 38.7 | | | $ | 33.1 | | | $ | 162.5 | | | $ | 159.0 | |
Net profit margin (f) | | | (3.4 | )% | | | (7.8 | )% | | | (7.4 | )% | | | (0.5 | )% |
Adjusted EBITDA margin | | | 13.7 | % | | | 14.9 | % | | | 15.9 | % | | | 18.9 | % |
a)Ceridian defines EBITDA as net income (loss) before interest, taxes, and depreciation and amortization.
b)Represents share-based compensation expense and related employer taxes.
c)Represents costs for severance compensation paid to employees whose positions have been eliminated or who have been terminated not for cause.
d)Represents consulting fees and expenses incurred during the periods presented in connection with any acquisition, investment, disposition, recapitalization, equity offering, issuance or repayment of debt, issuance of equity interests, or refinancing.
e)Represents (1) impacts of changes to our facilities, resulting in a net gain of $19.1 million during 2021 primarily as a result of the sale of our St. Petersburg, Florida facility and charges of $16.8 million during 2020 related to the abandonment of certain leased facilities, (2) in 2021 the difference between the historical five-year average pension expense and the current period actuarially determined pension expense associated with the planned termination of the frozen U.S. pension plan and related changes in investment strategy associated with protecting the now fully funded status, (3) the impact of the fair value adjustment for the DataFuzion contingent consideration during 2021, and (4) recovery in 2020 of duplicate payments associated with the 2019 isolated service incident.
f)Net profit margin is determined by calculating the percentage that net income (loss) is of total revenue.
| | | | |
27 | Q4 2021 Stockholder letter | | | | |
| | | | | | | | | | | | | | | | | | | | |
| | Three months ended December 31, 2021 | |
| | As
reported | | | Share-based
compensation | | | Severance
charges | | | Other (a) | | | Adjusted (b) | |
| | ($ in millions, except per share data) | |
Cost of revenue: | | | | | | | | | | | | | | | |
Recurring | | | | | | | | | | | | | | | |
Cloud | | $ | 54.3 | | | $ | 2.8 | | | $ | 0.3 | | | $ | — | | | $ | 51.2 | |
Bureau | | | 17.0 | | | | 0.4 | | | | 0.1 | | | | — | | | | 16.5 | |
Total recurring | | | 71.3 | | | | 3.2 | | | | 0.4 | | | | — | | | | 67.7 | |
Professional services and other | | | 53.7 | | | | 2.4 | | | | 0.1 | | | | — | | | | 51.2 | |
Product development and management | | | 39.8 | | | | 4.8 | | | | 0.1 | | | | — | | | | 34.9 | |
Depreciation and amortization | | | 13.4 | | | | — | | | | — | | | | — | | | | 13.4 | |
Total cost of revenue | | | 178.2 | | | | 10.4 | | | | 0.6 | | | | — | | | | 167.2 | |
Sales and marketing | | | 64.0 | | | | 3.7 | | | | 0.3 | | | | — | | | | 60.0 | |
General and administrative | | | 37.3 | | | | 16.8 | | | | 0.7 | | | | (16.3 | ) | | | 36.1 | |
Operating profit (loss) | | | 2.6 | | | | 30.9 | | | | 1.6 | | | | (16.3 | ) | | | (13.6 | ) |
Other expense (income), net | | | 2.7 | | | | — | | | | — | | | | 4.4 | | | | (1.7 | ) |
Depreciation and amortization | | | 18.2 | | | | — | | | | — | | | | — | | | | 18.2 | |
EBITDA | | $ | 18.1 | | | $ | 30.9 | | | $ | 1.6 | | | $ | (11.9 | ) | | $ | 38.7 | |
Interest expense, net | | | 10.4 | | | | — | | | | — | | | | — | | | | 10.4 | |
Income tax (benefit) expense (c) | | | (1.0 | ) | | | — | | | | — | | | | (1.8 | ) | | | 0.8 | |
Depreciation and amortization | | | 18.2 | | | | — | | | | — | | | | — | | | | 18.2 | |
Net (loss) income | | $ | (9.5 | ) | | $ | 30.9 | | | $ | 1.6 | | | $ | (13.7 | ) | | $ | 9.3 | |
Net (loss) income per share- basic (d) | | $ | (0.06 | ) | | $ | 0.20 | | | $ | 0.01 | | | $ | (0.09 | ) | | $ | 0.06 | |
Net (loss) income per share- diluted (d) | | $ | (0.06 | ) | | $ | 0.20 | | | $ | 0.01 | | | $ | (0.09 | ) | | $ | 0.06 | |
a)Other includes net gain of $19.1 million primarily as a result of the sale of our St. Petersburg, Florida facility, foreign exchange loss, restructuring consulting fees, the difference between the historical five-year average pension expense and the current period actuarially determined pension expense associated with the planned termination of the frozen U.S. pension plan and related changes in investment strategy associated with protecting the now fully funded status, and the impact of the fair value adjustment for the DataFuzion contingent consideration.
b)The Adjusted amount is a non-GAAP financial measure.
c)Income tax effects have been calculated based on the statutory tax rates in effect in the U.S. and foreign jurisdictions during the period.
d)GAAP and Adjusted basic and diluted net (loss) income per share are calculated based upon 151,465,292 and 157,799,902 weighted-average shares of common stock, respectively.
| | | | |
28 | Q4 2021 Stockholder letter | | | | |
| | | | | | | | | | | | | | | | | | | | |
| | Three months ended December 31, 2020 | |
| | As
reported | | | Share-based
compensation | | | Severance
charges | | | Other (a) | | | Adjusted (b) | |
| | ($ in millions, except per share data) | |
Cost of revenue: | | | | | | | | | | | | | | | |
Recurring | | | | | | | | | | | | | | | |
Cloud | | $ | 44.7 | | | $ | 1.4 | | | $ | 0.2 | | | $ | — | | | $ | 43.1 | |
Bureau | | | 12.8 | | | | 0.2 | | | | — | | | | — | | | | 12.6 | |
Total recurring | | | 57.5 | | | | 1.6 | | | | 0.2 | | | | — | | | | 55.7 | |
Professional services and other | | | 43.0 | | | | 1.3 | | | | — | | | | — | | | | 41.7 | |
Product development and management | | | 26.2 | | | | 3.5 | | | | 0.3 | | | | — | | | | 22.4 | |
Depreciation and amortization | | | 10.6 | | | | — | | | | — | | | | — | | | | 10.6 | |
Total cost of revenue | | | 137.3 | | | | 6.4 | | | | 0.5 | | | | — | | | | 130.4 | |
Sales and marketing | | | 49.4 | | | | 2.0 | | | | 1.9 | | | | — | | | | 45.5 | |
General and administrative | | | 58.0 | | | | 12.0 | | | | 0.4 | | | | 18.0 | | | | 27.6 | |
Operating (loss) profit | | | (21.9 | ) | | | 20.4 | | | | 2.8 | | | | 18.0 | | | | (63.1 | ) |
Other (income) expense, net | | | — | | | | — | | | | — | | | | (1.1 | ) | | | 1.1 | |
Depreciation and amortization | | | 14.9 | | | | — | | | | — | | | | — | | | | 14.9 | |
EBITDA | | $ | (7.0 | ) | | $ | 20.4 | | | $ | 2.8 | | | $ | 16.9 | | | $ | 33.1 | |
Interest expense, net | | | 5.7 | | | | — | | | | — | | | | — | | | | 5.7 | |
Income tax benefit (c) | | | (10.3 | ) | | | — | | | | — | | | | (8.8 | ) | | | (1.5 | ) |
Depreciation and amortization | | | 14.9 | | | | — | | | | — | | | | — | | | | 14.9 | |
Net (loss) income | | $ | (17.3 | ) | | $ | 20.4 | | | $ | 2.8 | | | $ | 8.1 | | | $ | 14.0 | |
Net (loss) income per share- basic (d) | | $ | (0.12 | ) | | $ | 0.14 | | | $ | 0.02 | | | $ | 0.05 | | | $ | 0.09 | |
Net (loss) income per share- diluted (d) | | $ | (0.12 | ) | | $ | 0.14 | | | $ | 0.02 | | | $ | 0.05 | | | $ | 0.09 | |
a)Other includes lease abandonment charges, intercompany foreign exchange gain, and restructuring consulting fees.
b)The Adjusted amount is a non-GAAP financial measure.
c)Income tax effects have been calculated based on the statutory tax rates in effect in the U.S. and foreign jurisdictions during the period.
d)GAAP and Adjusted basic and diluted net (loss) income per share are calculated based upon 148,086,778 weighted-average shares of common stock.
| | | | |
29 | Q4 2021 Stockholder letter | | | | |
| | | | | | | | | | | | | | | | | | | | |
| | Twelve months ended December 31, 2021 | |
| | As
reported | | | Share-based
compensation | | | Severance
charges | | | Other (a) | | | Adjusted (b) | |
| | ($ in millions, except per share data) | |
Cost of revenue: | | | | | | | | | | | | | | | |
Recurring | | | | | | | | | | | | | | | |
Cloud | | $ | 197.7 | | | $ | 11.0 | | | $ | 0.5 | | | $ | — | | | $ | 186.2 | |
Bureau | | | 64.7 | | | | 1.9 | | | | 1.5 | | | | — | | | | 61.3 | |
Total recurring | | | 262.4 | | | | 12.9 | | | | 2.0 | | | | — | | | | 247.5 | |
Professional services and other | | | 194.6 | | | | 9.5 | | | | 0.2 | | | | — | | | | 184.9 | |
Product development and management | | | 134.0 | | | | 18.0 | | | | 0.6 | | | | — | | | | 115.4 | |
Depreciation and amortization | | | 50.9 | | | | — | | | | — | | | | — | | | | 50.9 | |
Total cost of revenue | | | 641.9 | | | | 40.4 | | | | 2.8 | | | | — | | | | 598.7 | |
Sales and marketing | | | 218.5 | | | | 13.8 | | | | 1.9 | | | | — | | | | 202.8 | |
General and administrative | | | 199.3 | | | | 62.6 | | | | 2.7 | | | | (2.0 | ) | | | 136.0 | |
Operating (loss) profit | | | (35.5 | ) | | | 116.8 | | | | 7.4 | | | | (2.0 | ) | | | (157.7 | ) |
Other expense, net | | | 18.9 | | | | — | | | | — | | | | 17.2 | | | | 1.7 | |
Depreciation and amortization | | | 77.5 | | | | — | | | | — | | | | — | | | | 77.5 | |
EBITDA | | $ | 23.1 | | | $ | 116.8 | | | $ | 7.4 | | | $ | 15.2 | | | $ | 162.5 | |
Interest expense, net | | | 35.9 | | | | — | | | | — | | | | — | | | | 35.9 | |
Income tax (benefit) expense (c) | | | (14.9 | ) | | | — | | | | — | | | | (23.6 | ) | | | 8.7 | |
Depreciation and amortization | | | 77.5 | | | | — | | | | — | | | | — | | | | 77.5 | |
Net (loss) income | | $ | (75.4 | ) | | $ | 116.8 | | | $ | 7.4 | | | $ | (8.4 | ) | | $ | 40.4 | |
Net (loss) income per share- basic (d) | | $ | (0.50 | ) | | $ | 0.78 | | | $ | 0.05 | | | $ | (0.06 | ) | | $ | 0.27 | |
Net (loss) income per share- diluted (d) | | $ | (0.50 | ) | | $ | 0.74 | | | $ | 0.05 | | | $ | (0.06 | ) | | $ | 0.26 | |
a)Other includes net gain of $19.1 million primarily as a result of the sale of our St. Petersburg, Florida facility, foreign exchange loss, restructuring consulting fees, the difference the historical five-year average pension expense and the current period actuarially determined pension expense associated with the planned termination of the frozen U.S. pension plan and related changes in investment strategy associated with protecting the now fully funded status, and the impact of the fair value adjustment for the DataFuzion contingent consideration.
b)The Adjusted amount is a non-GAAP financial measure.
c)Income tax effects have been calculated based on the statutory tax rates in effect in the U.S. and foreign jurisdictions during the period.
d)GAAP and Adjusted basic and diluted net (loss) income per share are calculated based upon 150,402,321 and 156,842,934 weighted-average shares of common stock, respectively.
| | | | |
30 | Q4 2021 Stockholder letter | | | | |
| | | | | | | | | | | | | | | | | | | | |
| | Twelve months ended December 31, 2020 | |
| | As
reported | | | Share-based
compensation | | | Severance
charges | | | Other (a) | | | Adjusted (b) | |
| | ($ in millions, except per share data) | |
Cost of revenue: | | | | | | | | | | | | | | | |
Recurring | | | | | | | | | | | | | | | |
Cloud | | $ | 166.9 | | | $ | 5.0 | | | $ | 1.4 | | | $ | — | | | $ | 160.5 | |
Bureau | | | 46.4 | | | | 1.1 | | | | 0.4 | | | | — | | | | 44.9 | |
Total recurring | | | 213.3 | | | | 6.1 | | | | 1.8 | | | | — | | | | 205.4 | |
Professional services and other | | | 163.7 | | | | 3.8 | | | | 0.9 | | | | — | | | | 159.0 | |
Product development and management | | | 83.7 | | | | 8.7 | | | | 1.5 | | | | — | | | | 73.5 | |
Depreciation and amortization | | | 40.5 | | | | — | | | | — | | | | — | | | | 40.5 | |
Total cost of revenue | | | 501.2 | | | | 18.6 | | | | 4.2 | | | | — | | | | 478.4 | |
Sales and marketing | | | 165.6 | | | | 8.0 | | | | 3.3 | | | | — | | | | 154.3 | |
General and administrative | | | 167.9 | | | | 42.3 | | | | 2.2 | | | | 24.5 | | | | 98.9 | |
Operating profit | | | 7.8 | | | | 68.9 | | | | 9.7 | | | | 24.5 | | | | (95.3 | ) |
Other expense (income), net | | | 2.7 | | | | — | | | | — | | | | (1.0 | ) | | | 3.7 | |
Depreciation and amortization | | | 51.8 | | | | — | | | | — | | | | — | | | | 51.8 | |
EBITDA | | $ | 56.9 | | | $ | 68.9 | | | $ | 9.7 | | | $ | 23.5 | | | $ | 159.0 | |
Interest expense, net | | | 25.1 | | | | — | | | | — | | | | — | | | | 25.1 | |
Income tax (benefit) expense (c) | | | (16.0 | ) | | | — | | | | — | | | | (25.0 | ) | | | 9.0 | |
Depreciation and amortization | | | 51.8 | | | | — | | | | — | | | | — | | | | 51.8 | |
Net (loss) income | | $ | (4.0 | ) | | $ | 68.9 | | | $ | 9.7 | | | $ | (1.5 | ) | | $ | 73.1 | |
Net (loss) income per share- basic (d) | | $ | (0.03 | ) | | $ | 0.47 | | | $ | 0.07 | | | $ | (0.01 | ) | | $ | 0.50 | |
Net (loss) income per share- diluted (d) | | $ | (0.03 | ) | | $ | 0.47 | | | $ | 0.07 | | | $ | (0.01 | ) | | $ | 0.50 | |
a)Other includes lease abandonment charges, intercompany foreign exchange loss, restructuring consulting fees, and recovery of duplicate payments associated with the 2019 isolated service incident.
b)The Adjusted amount is a non-GAAP financial measure.
c)Income tax effects have been calculated based on the statutory tax rates in effect in the U.S. and foreign jurisdictions during the period.
d)GAAP and Adjusted basic and diluted net income (loss) per share are calculated based upon 146,774,471 weighted-average shares of common stock.
| | | | |
31 | Q4 2021 Stockholder letter | | | | |
Use of Non-GAAP financial measures
We use certain non-GAAP financial measures in this stockholder letter including EBITDA, Adjusted EBITDA, Adjusted EBITDA margin, Adjusted net income, Adjusted diluted net income per share, revenue on a constant currency basis, Dayforce recurring revenue per customer, Cloud revenue retention rate, and Cloud ARR. We believe that EBITDA, Adjusted EBITDA, Adjusted EBITDA margin, Adjusted net income, Cloud revenue retention rate, and Cloud ARR, non-GAAP financial measures, are useful to management and investors as supplemental measures to evaluate our overall operating performance. Adjusted EBITDA and Adjusted EBITDA margin are components of our management incentive plan and are used by management to assess performance and to compare our operating performance to our competitors. We define EBITDA as net income (loss) before interest, taxes, depreciation, and amortizations and Adjusted EBITDA as EBITDA, as adjusted to exclude foreign exchange gain (loss), share-based compensation expense and related employer taxes, severance charges, restructuring consulting fees, and other non-recurring items. Adjusted EBITDA margin is determined by calculating the percentage Adjusted EBITDA is of total revenue. Adjusted net income is defined as net income (loss), as adjusted to exclude foreign exchange gain (loss), share-based compensation expense and related employer taxes, severance charges, restructuring consulting fees, and other non-recurring items, all of which are adjusted for the effect of income taxes. Management believes that EBITDA, Adjusted EBITDA, Adjusted EBITDA margin, and Adjusted net income are helpful in highlighting management performance trends because EBITDA, Adjusted EBITDA, Adjusted EBITDA margin, and Adjusted net income exclude the results of decisions that are outside the normal course of our business operations.
Our presentation of EBITDA, Adjusted EBITDA, Adjusted EBITDA margin, and Adjusted net income are intended as supplemental measures of our performance that are not required by, or presented in accordance with, GAAP. EBITDA, Adjusted EBITDA, Adjusted EBITDA margin, and Adjusted net income should not be considered as alternatives to net income (loss), earnings (loss) per share, or any other performance measures derived in accordance with GAAP, or as measures of operating cash flows or liquidity. Our presentation of EBITDA, Adjusted EBITDA, Adjusted EBITDA margin, and Adjusted net income should not be construed to imply that our future results will be unaffected by similar items to those eliminated in this presentation. EBITDA, Adjusted EBITDA, Adjusted EBITDA margin, and Adjusted net income are included in this discussion because they are key metrics used by management to assess our operating performance.
EBITDA, Adjusted EBITDA, Adjusted EBITDA margin, and Adjusted net income are not defined under GAAP, are not measures of net income (loss) or any other performance measures derived in accordance with GAAP, and are subject to important limitations. Our use of the terms EBITDA, Adjusted EBITDA, Adjusted EBITDA margin, and Adjusted net income may not be comparable to similarly titled measures of other companies in our industry and are not measures of performance calculated in accordance with GAAP.
EBITDA, Adjusted EBITDA, Adjusted EBITDA margin, and Adjusted net income have important limitations as analytical tools, and you should not consider them in isolation or as substitutes for analysis of our results as reported under GAAP.
In evaluating EBITDA, Adjusted EBITDA, Adjusted EBITDA margin, and Adjusted net income, you should be aware that in the future we may incur expenses similar to those eliminated in this presentation.
We present revenue on a constant currency basis to assess how our underlying businesses performed, excluding the effect of foreign currency rate fluctuations, which we believe is useful to management and investors. We calculate revenue on a constant currency basis by applying the average foreign exchange rate in effect during the comparable prior period.
Our Dayforce recurring revenue per customer is an indicator of the average size of our Dayforce recurring customer. To calculate Dayforce recurring revenue per customer, we start with Dayforce recurring revenue,
| | | | |
32 | Q4 2021 Stockholder letter | | | | |
excluding Ascender and ADAM HCM, on a constant currency basis by applying the prior year average exchange rate to all comparable periods for the trailing twelve months and exclude float revenue, the impact of lower employment levels due to the COVID-19 pandemic, and Ascender and ADAM HCM revenue. This amount is divided by the number of live Dayforce customers at the end of the trailing twelve month period, excluding Ascender and ADAM HCM. We set quarterly targets for Dayforce recurring revenue per customer and monitor progress toward those targets on a quarterly basis. Our Dayforce recurring revenue per customer may fluctuate as a result of a number of factors, including the number of live Dayforce customers and the number of customers purchasing the full HCM suite. We have not reconciled the Dayforce recurring revenue per customer because there is no directly comparable GAAP financial measure.
We derive the majority of our Cloud revenues from recurring fees, primarily per employee, per month subscription charges. We also derive recurring revenue from fees related to the rental and maintenance of clocks, charges for once-a-year services, such as year-end tax statements, and investment income on our customer funds before such funds are remitted to taxing authorities, customer employees, or other third parties. To calculate Cloud ARR, we start with recurring revenue at year end, excluding revenue from Ascender and ADAM HCM, subtract the once-a-year charges, annualize the revenue for customers live for less than a full year to reflect the revenue that would have been realized if the customer had been live for a full year, and add back the once-a-year charges. We set annual targets for Cloud ARR and monitor progress toward those targets on a quarterly basis. We have not reconciled the Cloud ARR because there is no directly comparable GAAP financial measure.
Our annual Cloud revenue retention rate measures the percentage of revenues that we retain from our existing Cloud customers. We use this revenue retention rate as an indicator of customer satisfaction and future revenues. We calculate the annual Cloud revenue retention rate as a percentage, excluding Ascender and ADAM HCM, where the numerator is the Cloud ARR for the prior year, less the Cloud ARR from lost Cloud customers during that year; and the denominator is the Cloud ARR for the prior year. We set annual targets for Cloud revenue retention rate and monitor progress toward those targets on a quarterly basis by reviewing known customer losses and anticipated future customer losses. Our Cloud revenue retention rate may fluctuate as a result of a number of factors, including the mix of Cloud solutions used by customers, the level of customer satisfaction, and changes in the number of users live on our Cloud solutions. We have not reconciled the annual Cloud revenue retention rate because there is no directly comparable GAAP financial measure.
Forward-looking statements
This stockholder letter contains forward-looking statements that are subject to risks and uncertainties. All statements other than statements of historical fact or relating to present facts or current conditions included in this stockholder letter are forward-looking statements. Forward-looking statements give our current expectations and projections relating to our financial condition, results of operations, plans, objectives, future performance and business. You can identify forward-looking statements by the fact that they do not relate strictly to historical or current facts. Forward-looking statements in this stockholder letter include statements relating to the fiscal year of 2022, as well as those relating to future growth initiatives. These statements may include words such as “anticipate,” “estimate,” “expect,” “project,” “seek,” “plan,” “intend,” “believe,” “will,” “may,” “could,” “continue,” “likely,” “should,” and other words and terms of similar meaning in connection with any discussion of the timing or nature of future operating or financial performance or other events but not all forward-looking statements contain these identifying words. The forward-looking statements contained in this stockholder are based on assumptions that we have made in light of our industry experience and our perceptions of historical trends, current conditions, expected future developments and other factors that we believe are appropriate under the circumstances. As you consider this stockholder letter, you should understand that these statements are not guarantees of performance
| | | | |
33 | Q4 2021 Stockholder letter | | | | |
or results. These assumptions and our future performance or results involve risks and uncertainties (many of which are beyond our control). These risks and uncertainties include, but are not limited to, the following:
•the impact of the Coronavirus disease 2019 (“COVID-19”) pandemic on our business, operations, and financial results;
•our inability to manage our growth effectively or execute on our growth strategy;
•our inability to successfully expand our current offerings into new markets or further penetrate existing markets;
•our failure to provide new or enhanced functionality and features;
•significant competition in the market in which our solutions compete;
•our failure to manage our aging technical operations infrastructure;
•system breaches, interruptions or failures, including cyber-security breaches, identity theft, or other disruptions that could compromise customer information or sensitive company information;
•our failure to comply with applicable privacy, security, data, and financial services laws, regulations and standards, including our ongoing consent order with the Federal Trade Commission regarding data protection;
•our failure to properly update our solutions to enable our customers to comply with applicable laws;
•changes in regulations governing financial services, privacy concerns, and laws or other domestic or foreign data protection regulations;
•our inability to maintain necessary third party relationships, and third party software licenses, and identify errors in the software we license;
•our inability to offer and deliver high-quality technical support, implementation and professional services;
•our inability to attract and retain senior management employees and highly skilled employees;
•the impact of our outstanding debt obligations on our financial condition, results of operations, and value of our common stock; or
•other risks and uncertainties described in our most recent annual report on Form 10-K, subsequent quarterly reports on Form 10-Q, and other filings with the Securities and Exchange Commission.
Additional factors or events that could cause our actual performance to differ from these forward-looking statements may emerge from time to time, and it is not possible for us to predict all of them. Should one or more of these risks or uncertainties materialize, or should any of our assumptions prove incorrect, our actual financial condition, results of operations, future performance and business may vary in material respects from the performance projected in these forward-looking statements. In addition to any factors and assumptions set forth above in this stockholder letter, the material factors and assumptions used to develop the forward-looking information include, but are not limited to: the general economy remains stable; the competitive environment in
| | | | |
34 | Q4 2021 Stockholder letter | | | | |
the HCM market remains stable; the demand environment for HCM solutions remains stable; our implementation capabilities and cycle times remain stable; foreign exchange rates, both current and those used in developing forward-looking statements, specifically USD to CAD, remain stable at, or near, current rates; we will be able to maintain our relationships with our employees, customers and partners; we will continue to attract qualified personnel to support our development requirements and the support of our new and existing customers; and that the risk factors noted above, individually or collectively, do not have a material impact on the company. Any forward-looking statement made by us in this stockholder letter speaks only as of the date on which it is made. We undertake no obligation to publicly update or revise any forward-looking statement, whether as a result of new information, future developments or otherwise, except as may be required by law.

Ceridian is a global human capital management software company. Dayforce, our flagship cloud HCM platform, provides human resources, payroll, benefits, workforce management, and talent management functionality. Our platform is used to optimize management of the entire employee lifecycle, including attracting, engaging, paying, deploying, and developing people. Ceridian has solutions for organizations of all sizes.
www.ceridian.com
| | | | |
35 | Q4 2021 Stockholder letter | | | | |