Gross margin
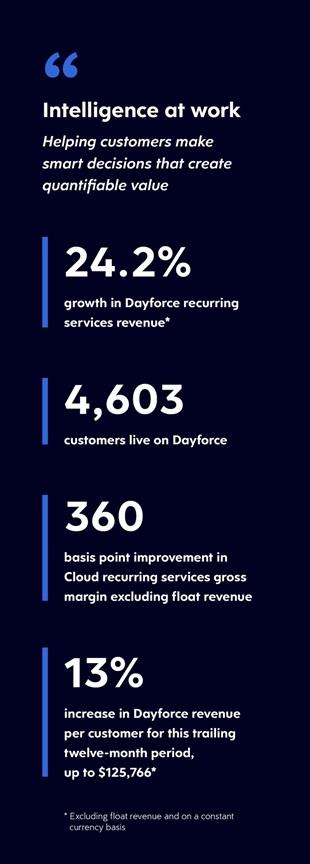
In the second quarter of 2020, Cloud recurring services gross margin increased 140 basis points to 70.7%, from 69.3% in the second quarter last year, as we continued to realize economies of scale in customer support and hosting costs. Excluding float revenue, Cloud recurring services gross margin expanded by 360 basis points. Cloud professional services margin declined from (4.3)% in the second quarter last year to (13.1)%, reflecting lower utilization of employees during the COVID-19 pandemic. Activations increased to $22.1 million, or 67% of Cloud professional services and other revenue, from $21.4 million, or 66% of Cloud professional services and other revenue in the second quarter last year. Post go-live professional services and other revenue increased to $7.9 million, or 24% of Cloud professional services and other revenue, from $7.0 million, or 22% of Cloud professional services and other revenue in the second quarter last year.
Operating profit and Adjusted EBITDA
Operating profit declined by $14.7 million, to $4.0 million, and Adjusted EBITDA declined by $6.5 million, to $37.5 million in the second quarter of 2020. Excluding float revenue, Adjusted EBITDA increased 9.7% and Adjusted EBITDA margin expanded by 90 basis points, reflecting gross margin improvement in our underlying Cloud business and lower general and administrative expenses, partially offset by the adverse effects of COVID-19 on our revenue.
Net income and net income per share
Net income in the second quarter of 2020 was $5.5 million, or $0.04 per diluted share, compared to $6.3 million, or $0.04 per diluted share, in the second quarter of last year. Adjusted net income in the second quarter of 2020 was $19.4 million, or $0.13 per diluted share, compared to $18.3 million, or $0.12 per diluted share, in the second quarter of last year.
Balance sheet and liquidity
As of June 30, 2020, we had cash and cash equivalents of $526.9 million, including $295.0 million borrowed under our revolving credit facility. Our total debt balance was $967.2 million as of June 30, 2020.
Business Outlook
Third quarter 2020 guidance
Based on information available to us as of August 5, 2020, we are issuing the following guidance for the third quarter of 2020:
| • | Dayforce recurring services revenue of $118 million to $120 million, or an increase of approximately 8% to 10% on both a GAAP and constant currency basis. Excluding float revenue, Dayforce recurring services revenue is expected to grow approximately 14% to 16% on both a GAAP and constant currency basis. |
| • | Dayforce revenue of $155 million to $158 million, or an increase of approximately 8% to 10% on a GAAP basis and 8% to 11% on a constant currency basis. Excluding float revenue, Dayforce revenue is expected to grow approximately 12% to 14% on a GAAP basis and 13% to 15% on a constant currency basis. |
| • | Cloud revenue of $173 million to $177 million, or an increase of approximately 5% to 7% on a GAAP basis and 5% to 8% on a constant currency basis. Excluding float revenue, Cloud revenue is expected to grow approximately 9% to 11% on a GAAP basis and 10% to 12% on a constant currency basis. |
| • | Total revenue of $198 million to $203 million, or a decline of approximately 2% to flat on a GAAP basis, and a decline of approximately 1% to an increase of approximately 1% on a constant currency basis. Excluding float revenue, total revenue is expected to grow approximately 2% to 5% on a GAAP basis and 3% to 6% on a constant currency basis. |
| • | Float revenue of approximately $7 million within Dayforce revenue, $9 million within Cloud revenue, and $10 million within total revenue. |
| • | Adjusted EBITDA of $27 million to $32 million. |
We have not reconciled the Adjusted EBITDA range for the third quarter of 2020 to the directly comparable GAAP financial measure because applicable information for the future period, on which this reconciliation would be based, is not readily available due to uncertainty regarding, and the potential variability of, depreciation and amortization, share-based compensation expense and related employer taxes, changes in foreign currency exchange rates, and other items.
Fourth quarter 2020 outlook
Although uncertainty still exists, we believe that the greatest impact of COVID-19 will be reflected in the third quarter of 2020. Assuming employment levels continue to improve, we expect Dayforce recurring services revenue growth, excluding float revenue and on a constant currency basis, to accelerate and to exceed 18% in the fourth quarter.
Dayforce
We invoice Dayforce recurring services revenue on a per-employee, per-month (“PEPM”) basis, generally one month in advance, based on the total of active and inactive employees in the system as measured on the 15th of the previous month. The fact that furloughed employees are included in the inactive employee counts somewhat mitigates the impact of lower employment levels on Dayforce revenues.
We disclosed last quarter that we observed an approximate 5% decline in employment levels during April, which impacted May revenue as we invoice PEPM services one month in advance of revenue.
From May through July, employment levels improved by approximately 1%, and cumulatively from March 15th through July 15th, the estimated decline in employment levels caused by the COVID-19 pandemic is approximately 4%.
In our third quarter 2020 guidance, we have assumed employment levels remain at 4% below our pre-COVID-19 expectations, resulting in an approximate $8 million impact to our Dayforce recurring services revenue. The $8 million estimated COVID-19 impact to our Dayforce recurring services revenue in the third quarter is larger than the impact in the second quarter of 2020, which we estimated was $5 million, because the third quarter includes three full months of employment level impacts, while the second quarter only included two full months of employment level impacts. In addition to employment levels, we expect to continue to see a COVID-19 impact to customer implementations on Dayforce, impacting Dayforce recurring revenue growth rates year-over-year.
The COVID-19 pandemic is expected to continue impacting the demand for Dayforce professional services and other revenue during the second half of 2020.
Powerpay
Approximately 40% of the Powerpay recurring revenue is from per-check fees, and approximately 30% of the Powerpay recurring revenue is from base fees charged per pay-run per customer. The remaining 30% of Powerpay recurring revenue is from ancillary fees, which are generally recognized in line with per-check fees.
During the second quarter, we observed a decline in both the number of employees paid and the number of customers running payroll, estimated at an average of
17% and 10% declines, respectively. These declines drove the approximately $3 million impact to Powerpay recurring revenue.
Our guidance assumes improving, but continued lower employment levels, resulting in an adverse impact of approximately $2 million in the third quarter of 2020 compared to our pre-COVID-19 expectations.
Bureau
Third quarter Bureau revenue guidance includes approximately $5 to $6 million of Excelity revenue, which will be primarily classified as Bureau recurring services revenue. The acquisition of Excelity, which had lower recurring gross margins, combined with COVID-19 pandemic impacts to employment levels, and lower float revenue have all adversely affected the Bureau recurring services gross margin, which we now expect to be in the mid-50% range for the remainder of the year.
The pace of Bureau migrations to Dayforce has continued to be between $5 and $6 million per quarter, and we are pleased with the continued transition of customers to Dayforce as we end-of-life the Bureau solutions.
Foreign exchange impacts
Our third quarter 2020 guidance assumes an average U.S. dollar to Canadian dollar foreign exchange rate of $1.36, compared to an average rate of $1.32 in the third quarter of 2019.
11 | | | | |  Q2 2020 Stockholder letter Q2 2020 Stockholder letter
|
Ceridian HCM Holding Inc.
Condensed consolidated balance sheets
(Dollars in millions, except share data)
| | June 30, | | | December 31, | |
| | 2020 | | | 2019 | |
| | (unaudited) | | | | | |
ASSETS | | | | | | | | |
Current assets: | | | | | | | | |
Cash and equivalents | | $ | 526.9 | | | $ | 281.3 | |
Trade and other receivables, net | | | 92.9 | | | | 80.4 | |
Prepaid expenses and other current assets | | | 70.4 | | | | 57.9 | |
Total current assets before customer trust funds | | | 690.2 | | | | 419.6 | |
Customer trust funds | | | 2,659.8 | | | | 3,204.1 | |
Total current assets | | | 3,350.0 | | | | 3,623.7 | |
Right of use lease asset | | | 37.6 | | | | 32.0 | |
Property, plant, and equipment, net | | | 129.6 | | | | 128.3 | |
Goodwill | | | 2,004.5 | | | | 1,973.5 | |
Other intangible assets, net | | | 195.5 | | | | 177.9 | |
Other assets | | | 136.7 | | | | 150.3 | |
Total assets | | $ | 5,853.9 | | | $ | 6,085.7 | |
LIABILITIES AND EQUITY | | | | | | | | |
Current liabilities: | | | | | | | | |
Current portion of long-term debt | | $ | 8.6 | | | $ | 10.8 | |
Current portion of long-term lease liabilities | | | 10.2 | | | | 8.8 | |
Accounts payable | | | 36.5 | | | | 43.2 | |
Deferred revenue | | | 24.0 | | | | 25.5 | |
Employee compensation and benefits | | | 56.3 | | | | 75.9 | |
Other accrued expenses | | | 14.1 | | | | 13.9 | |
Total current liabilities before customer trust funds obligations | | | 149.7 | | | | 178.1 | |
Customer trust funds obligations | | | 2,594.8 | | | | 3,193.6 | |
Total current liabilities | | | 2,744.5 | | | | 3,371.7 | |
Long-term debt, less current portion | | | 958.6 | | | | 666.3 | |
Employee benefit plans | | | 111.4 | | | | 117.2 | |
Long-term lease liabilities, less current portion | | | 34.2 | | | | 30.1 | |
Other liabilities | | | 19.5 | | | | 18.1 | |
Total liabilities | | | 3,868.2 | | | | 4,203.4 | |
Commitments and contingencies | | | | | | | | |
Stockholders’ equity: | | | | | | | | |
Common stock, $0.01 par, 500,000,000 shares authorized, 146,803,932 and 144,386,618 shares issued and outstanding as of June 30, 2020, and December 31, 2019, respectively | | | 1.5 | | | | 1.4 | |
Additional paid in capital | | | 2,528.4 | | | | 2,449.1 | |
Accumulated deficit | | | (215.7 | ) | | | (229.8 | ) |
Accumulated other comprehensive loss | | | (328.5 | ) | | | (338.4 | ) |
Total stockholders’ equity | | | 1,985.7 | | | | 1,882.3 | |
Total liabilities and equity | | $ | 5,853.9 | | | $ | 6,085.7 | |
12 | | | | | Q2 2020 Stockholder letter |
Ceridian HCM Holding Inc.
Condensed consolidated statements of operations
(Unaudited, dollars in millions, except share and per share data)
| | Three months ended June 30, | | | Six months ended June 30, | |
| | 2020 | | | 2019 | | | 2020 | | | 2019 | |
Revenue: | | | | | | | | | | | | | | | | |
Recurring services | | $ | 159.1 | | | $ | 163.5 | | | $ | 340.6 | | | $ | 336.3 | |
Professional services and other | | | 33.5 | | | | 32.8 | | | | 74.7 | | | | 63.7 | |
Total revenue | | | 192.6 | | | | 196.3 | | | | 415.3 | | | | 400.0 | |
Cost of revenue: | | | | | | | | | | | | | | | | |
Recurring services | | | 49.3 | | | | 48.7 | | | | 101.5 | | | | 99.6 | |
Professional services and other | | | 37.9 | | | | 34.2 | | | | 80.5 | | | | 69.5 | |
Product development and management | | | 17.0 | | | | 16.4 | | | | 34.6 | | | | 31.6 | |
Depreciation and amortization | | | 9.8 | | | | 9.0 | | | | 19.6 | | | | 17.7 | |
Total cost of revenue | | | 114.0 | | | | 108.3 | | | | 236.2 | | | | 218.4 | |
Gross profit | | | 78.6 | | | | 88.0 | | | | 179.1 | | | | 181.6 | |
Selling, general, and administrative | | | 74.6 | | | | 69.3 | | | | 148.8 | | | | 135.5 | |
Operating profit | | | 4.0 | | | | 18.7 | | | | 30.3 | | | | 46.1 | |
Interest expense, net | | | 6.6 | | | | 8.5 | | | | 13.5 | | | | 17.4 | |
Other expense, net | | | 0.3 | | | | 1.5 | | | | 2.9 | | | | 3.1 | |
(Loss) income before income taxes | | | (2.9 | ) | | | 8.7 | | | | 13.9 | | | | 25.6 | |
Income tax (benefit) expense | | | (8.4 | ) | | | 2.4 | | | | (0.2 | ) | | | 8.1 | |
Net income | | $ | 5.5 | | | $ | 6.3 | | | $ | 14.1 | | | $ | 17.5 | |
Net income per share: | | | | | | | | | | | | | | | | |
Basic | | $ | 0.04 | | | $ | 0.04 | | | $ | 0.10 | | | $ | 0.12 | |
Diluted | | $ | 0.04 | | | $ | 0.04 | | | $ | 0.09 | | | $ | 0.12 | |
Weighted-average shares outstanding: | | | | | | | | | | | | | | | | |
Basic | | | 145,593,019 | | | | 141,149,009 | | | | 145,119,172 | | | | 140,651,902 | |
Diluted | | | 151,444,901 | | | | 148,331,846 | | | | 151,321,093 | | | | 147,761,174 | |
13 | | | | | Q2 2020 Stockholder letter |
Ceridian HCM Holding Inc.
Condensed consolidated statements of cash flows
(Unaudited, dollars in millions)
| | Six months ended June 30, | |
| | 2020 | | | 2019 | |
Net income | | $ | 14.1 | | | $ | 17.5 | |
Adjustments to reconcile net income to net cash provided by operating activities: | | | | | | | | |
Deferred income tax expense (benefit) | | | 0.3 | | | | (4.8 | ) |
Depreciation and amortization | | | 23.9 | | | | 29.0 | |
Amortization of debt issuance costs and debt discount | | | 0.6 | | | | 0.6 | |
Net periodic pension and postretirement cost | | | 1.7 | | | | 2.6 | |
Non-cash share-based compensation | | | 27.8 | | | | 15.6 | |
Other | | | 0.9 | | | | 0.8 | |
Changes in operating assets and liabilities excluding effects of acquisitions and divestitures: | | | | | | | | |
Trade and other receivables | | | (3.8 | ) | | | (3.4 | ) |
Prepaid expenses and other current assets | | | (6.4 | ) | | | (11.1 | ) |
Accounts payable and other accrued expenses | | | (1.8 | ) | | | (5.7 | ) |
Deferred revenue | | | (1.1 | ) | | | (1.3 | ) |
Employee compensation and benefits | | | (21.3 | ) | | | (19.5 | ) |
Accrued interest | | | 0.2 | | | | 0.4 | |
Accrued taxes | | | (3.7 | ) | | | (8.1 | ) |
Other assets and liabilities | | | (7.5 | ) | | | (2.4 | ) |
Net cash provided by operating activities | | | 23.9 | | | | 10.2 | |
Cash Flows from Investing Activities | | | | | | | | |
Purchase of customer trust funds marketable securities | | | (24.8 | ) | | | (297.6 | ) |
Proceeds from sale and maturity of customer trust funds marketable securities | | | 214.0 | | | | 232.3 | |
Expenditures for property, plant, and equipment | | | (9.9 | ) | | | (7.7 | ) |
Expenditures for software and technology | | | (19.8 | ) | | | (18.7 | ) |
Acquisition costs, net of cash and restricted cash acquired | | | (58.3 | ) | | | (10.2 | ) |
Net cash provided by (used in) investing activities | | | 101.2 | | | | (101.9 | ) |
Cash Flows from Financing Activities | | | | | | | | |
(Decrease) increase in customer trust funds obligations, net | | | (571.4 | ) | | | 1,308.9 | |
Proceeds from issuance of common stock under share-based compensation plans | | | 51.5 | | | | 44.1 | |
Repayment of long-term debt obligations | | | (5.4 | ) | | | (3.4 | ) |
Proceeds from revolving credit facility | | | 295.0 | | | | — | |
Net cash (used in) provided by financing activities | | | (230.3 | ) | | | 1,349.6 | |
Effect of exchange rate changes on cash, restricted cash, and equivalents | | | (12.4 | ) | | | 7.4 | |
Net (decrease) increase in cash, restricted cash, and equivalents | | | (117.6 | ) | | | 1,265.3 | |
Cash, restricted cash, and equivalents at beginning of period | | | 1,658.6 | | | | 1,106.3 | |
Cash, restricted cash, and equivalents at end of period | | $ | 1,541.0 | | | $ | 2,371.6 | |
Reconciliation of cash, restricted cash, and equivalents to the condensed consolidated balance sheets | | | | | | | | |
Cash and equivalents | | $ | 526.9 | | | $ | 237.9 | |
Restricted cash and equivalents included in customer trust funds | | | 1,014.1 | | | | 2,133.7 | |
Total cash, restricted cash, and equivalents | | $ | 1,541.0 | | | $ | 2,371.6 | |
14 | | | | | Q2 2020 Stockholder letter |
Ceridian HCM Holding Inc.
Revenue financial measures
(Unaudited)
| | Three months ended June 30, | | | Percentage change in revenue as reported | | | Impact of changes in foreign currency (a) | | | Percentage change in revenue on constant currency basis (a) | |
| | 2020 | | | 2019 | | | 2020 vs. 2019 | | | | | | | 2020 vs. 2019 | |
| | (Dollars in millions) | | | | | | | | | | | | | |
Revenue: | | | | | | | | | | | | | | | | | | | | |
Dayforce recurring services, excluding float | | $ | 110.2 | | | $ | 89.4 | | | | 23.3 | % | | | (0.9 | )% | | | 24.2 | % |
Dayforce float | | | 8.3 | | | | 13.0 | | | | (36.2 | )% | | | (0.8 | )% | | | (35.4 | )% |
Total Dayforce recurring services | | | 118.5 | | | | 102.4 | | | | 15.7 | % | | | (0.9 | )% | | | 16.6 | % |
Powerpay recurring services, excluding float | | | 14.4 | | | | 18.0 | | | | (20.0 | )% | | | (2.2 | )% | | | (17.8 | )% |
Powerpay float | | | 1.8 | | | | 2.9 | | | | (37.9 | )% | | | (3.4 | )% | | | (34.5 | )% |
Total Powerpay recurring services | | | 16.2 | | | | 20.9 | | | | (22.5 | )% | | | (2.4 | )% | | | (20.1 | )% |
Total Cloud recurring services | | | 134.7 | | | | 123.3 | | | | 9.2 | % | | | (1.2 | )% | | | 10.4 | % |
Dayforce professional services and other | | | 33.0 | | | | 32.1 | | | | 2.8 | % | | | (0.9 | )% | | | 3.7 | % |
Powerpay professional services and other | | | 0.2 | | | | 0.3 | | | | (33.3 | )% | | | (— | )% | | | (33.3 | )% |
Total Cloud professional services and other | | | 33.2 | | | | 32.4 | | | | 2.5 | % | | | (0.9 | )% | | | 3.4 | % |
Total Cloud revenue | | | 167.9 | | | | 155.7 | | | | 7.8 | % | | | (1.1 | )% | | | 8.9 | % |
Bureau recurring services, excluding float | | | 23.0 | | | | 35.8 | | | | (35.8 | )% | | | (0.6 | )% | | | (35.2 | )% |
Bureau float | | | 1.4 | | | | 4.4 | | | | (68.2 | )% | | | (2.3 | )% | | | (65.9 | )% |
Total Bureau recurring services | | | 24.4 | | | | 40.2 | | | | (39.3 | )% | | | (0.7 | )% | | | (38.6 | )% |
Bureau professional services and other | | | 0.3 | | | | 0.4 | | | | (25.0 | )% | | | (— | )% | | | (25.0 | )% |
Total Bureau revenue | | | 24.7 | | | | 40.6 | | | | (39.2 | )% | | | (0.8 | )% | | | (38.4 | )% |
Total revenue | | $ | 192.6 | | | $ | 196.3 | | | | (1.9 | )% | | | (1.0 | )% | | | (0.9 | )% |
| | | | | | | | | | | | | | | | | | | | |
Dayforce | | $ | 151.5 | | | $ | 134.5 | | | | 12.6 | % | | | (0.9 | )% | | | 13.5 | % |
Powerpay | | | 16.4 | | | | 21.2 | | | | (22.6 | )% | | | (2.3 | )% | | | (20.3 | )% |
Total Cloud revenue | | $ | 167.9 | | | $ | 155.7 | | | | 7.8 | % | | | (1.1 | )% | | | 8.9 | % |
| | | | | | | | | | | | | | | | | | | | |
Dayforce, excluding float | | $ | 143.2 | | | $ | 121.5 | | | | 17.9 | % | | | (0.9 | )% | | | 18.8 | % |
Powerpay, excluding float | | | 14.6 | | | | 18.3 | | | | (20.2 | )% | | | (2.2 | )% | | | (18.0 | )% |
Cloud revenue, excluding float | | | 157.8 | | | | 139.8 | | | | 12.9 | % | | | (1.0 | )% | | | 13.9 | % |
Cloud float | | | 10.1 | | | | 15.9 | | | | (36.5 | )% | | | (1.3 | )% | | | (35.2 | )% |
Total Cloud revenue | | $ | 167.9 | | | $ | 155.7 | | | | 7.8 | % | | | (1.1 | )% | | | 8.9 | % |
(a) | We have calculated revenue on a constant currency basis by applying the average foreign exchange rate in effect during the comparable prior period. |
15 | | | | | Q2 2020 Stockholder letter |
Ceridian HCM Holding Inc.
Revenue financial measures
(Unaudited)
| | Six months ended June 30, | | | Percentage change in revenue as reported | | | Impact of changes in foreign currency (a) | | | Percentage change in revenue on constant currency basis (a) | |
| | 2020 | | | 2019 | | | 2020 vs. 2019 | | | | | | | 2020 vs. 2019 | |
| | (Dollars in millions) | | | | | | | | | | | | | |
Revenue: | | | | | | | | | | | | | | | | | | | | |
Dayforce recurring services, excluding float | | $ | 224.2 | | | $ | 177.0 | | | | 26.7 | % | | | (0.5 | )% | | | 27.2 | % |
Dayforce float | | | 22.4 | | | | 28.3 | | | | (20.8 | )% | | | (0.3 | )% | | | (20.5 | )% |
Total Dayforce recurring services | | | 246.6 | | | | 205.3 | | | | 20.1 | % | | | (0.6 | )% | | | 20.7 | % |
Powerpay recurring services, excluding float | | | 33.4 | | | | 36.3 | | | | (8.0 | )% | | | (1.1 | )% | | | (6.9 | )% |
Powerpay float | | | 4.6 | | | | 6.1 | | | | (24.6 | )% | | | (1.6 | )% | | | (23.0 | )% |
Total Powerpay recurring services | | | 38.0 | | | | 42.4 | | | | (10.4 | )% | | | (1.2 | )% | | | (9.2 | )% |
Total Cloud recurring services | | | 284.6 | | | | 247.7 | | | | 14.9 | % | | | (0.6 | )% | | | 15.5 | % |
Dayforce professional services and other | | | 73.7 | | | | 62.0 | | | | 18.9 | % | | | (0.6 | )% | | | 19.5 | % |
Powerpay professional services and other | | | 0.5 | | | | 0.6 | | | | (16.7 | )% | | | (— | )% | | | (16.7 | )% |
Total Cloud professional services and other | | | 74.2 | | | | 62.6 | | | | 18.5 | % | | | (0.7 | )% | | | 19.2 | % |
Total Cloud revenue | | | 358.8 | | | | 310.3 | | | | 15.6 | % | | | (0.7 | )% | | | 16.3 | % |
Bureau recurring services, excluding float | | | 51.9 | | | | 78.4 | | | | (33.8 | )% | | | (0.4 | )% | | | (33.4 | )% |
Bureau float | | | 4.1 | | | | 10.2 | | | | (59.8 | )% | | | (1.0 | )% | | | (58.8 | )% |
Total Bureau recurring services | | | 56.0 | | | | 88.6 | | | | (36.8 | )% | | | (0.5 | )% | | | (36.3 | )% |
Bureau professional services and other | | | 0.5 | | | | 1.1 | | | | (54.5 | )% | | | (— | )% | | | (54.5 | )% |
Total Bureau revenue | | | 56.5 | | | | 89.7 | | | | (37.0 | )% | | | (0.4 | )% | | | (36.6 | )% |
Total revenue | | $ | 415.3 | | | $ | 400.0 | | | | 3.8 | % | | | (0.6 | )% | | | 4.4 | % |
| | | | | | | | | | | | | | | | | | | | |
Dayforce | | $ | 320.3 | | | $ | 267.3 | | | | 19.8 | % | | | (0.6 | )% | | | 20.4 | % |
Powerpay | | | 38.5 | | | | 43.0 | | | | (10.5 | )% | | | (1.2 | )% | | | (9.3 | )% |
Total Cloud revenue | | $ | 358.8 | | | $ | 310.3 | | | | 15.6 | % | | | (0.7 | )% | | | 16.3 | % |
| | | | | | | | | | | | | | | | | | | | |
Dayforce, excluding float | | $ | 297.9 | | | $ | 239.0 | | | | 24.6 | % | | | (0.6 | )% | | | 25.2 | % |
Powerpay, excluding float | | | 33.9 | | | | 36.9 | | | | (8.1 | )% | | | (1.1 | )% | | | (7.0 | )% |
Cloud revenue, excluding float | | | 331.8 | | | | 275.9 | | | | 20.3 | % | | | (0.6 | )% | | | 20.9 | % |
Cloud float | | | 27.0 | | | | 34.4 | | | | (21.5 | )% | | | (0.6 | )% | | | (20.9 | )% |
Total Cloud revenue | | $ | 358.8 | | | $ | 310.3 | | | | 15.6 | % | | | (0.7 | )% | | | 16.3 | % |
(a) | We have calculated revenue on a constant currency basis by applying the average foreign exchange rate in effect during the comparable prior period. |
16 | | | | | Q2 2020 Stockholder letter |
Ceridian HCM Holding Inc.
Reconciliation of GAAP to Non-GAAP financial measures
(Unaudited)
The following tables present a reconciliation of our reported results to our non-GAAP financial measures Adjusted EBITDA, Adjusted EBITDA margin, and Adjusted net income for all periods presented:
| | Three months ended June 30, | | | Six months ended June 30, | |
| | 2020 | | | 2019 | | | 2020 | | | 2019 | |
| | (Dollars in millions) | |
Operating profit | | $ | 4.0 | | | $ | 18.7 | | | $ | 30.3 | | | $ | 46.1 | |
Other expense, net | | | (0.3 | ) | | | (1.5 | ) | | | (2.9 | ) | | | (3.1 | ) |
Depreciation and amortization | | | 12.1 | | | | 14.6 | | | | 23.9 | | | | 29.0 | |
EBITDA (a) | | | 15.8 | | | | 31.8 | | | | 51.3 | | | | 72.0 | |
Intercompany foreign exchange (gain) loss | | | (0.5 | ) | | | 0.2 | | | | 1.3 | | | | 0.5 | |
Share-based compensation (b) | | | 16.5 | | | | 9.6 | | | | 29.2 | | | | 15.6 | |
Severance charges (c) | | | 0.7 | | | | 1.5 | | | | 4.7 | | | | 3.6 | |
Restructuring consulting fees (d) | | | 5.1 | | | | 0.9 | | | | 6.6 | | | | 2.1 | |
Other non-recurring charges (e) | | | (0.1 | ) | | | — | | | | (0.4 | ) | | | — | |
Adjusted EBITDA | | $ | 37.5 | | | $ | 44.0 | | | $ | 92.7 | | | $ | 93.8 | |
Adjusted EBITDA margin | | | 19.5 | % | | | 22.4 | % | | | 22.3 | % | | | 23.5 | % |
(a) | We define EBITDA as net income before interest, taxes, and depreciation and amortization. |
(b) | Represents share-based compensation expense and related employer taxes. |
(c) | Represents costs for severance compensation paid to employees whose positions have been eliminated or who have been terminated not for cause. |
(d) | Represents consulting fees and expenses incurred during the periods presented in connection with any acquisition, investment, disposition, recapitalization, equity offering, issuance or repayment of debt, issuance of equity interests, or refinancing. |
(e) | Represents gain on unrecovered duplicate payments associated with an isolated service incident. |
17 | | | | | Q2 2020 Stockholder letter |
| | Three months ended June 30, 2020 | |
| | As reported | | | Share-based compensation | | | Severance charges | | | Other (a) | | | Income tax effects (b) | | | Adjusted | |
| | (Dollars in millions, except per share data) | |
Cost of revenue: | | | | | | | | | | | | | | | | | | | | | | | | |
Recurring services | | $ | 49.3 | | | $ | 1.9 | | | $ | — | | | $ | — | | | $ | — | | | $ | 47.4 | |
Professional services and other | | | 37.9 | | | | 1.0 | | | | 0.1 | | | | — | | | | — | | | | 36.8 | |
Product development and management | | | 17.0 | | | | 1.4 | | | | 0.1 | | | | — | | | | — | | | | 15.5 | |
Depreciation and amortization | | | 9.8 | | | | — | | | | — | | | | — | | | | — | | | | 9.8 | |
Total cost of revenue | | | 114.0 | | | | 4.3 | | | | 0.2 | | | | — | | | | — | | | | 109.5 | |
Sales and marketing | | | 36.0 | | | | 1.8 | | | | 0.2 | | | | — | | | | — | | | | 34.0 | |
General and administrative | | | 38.6 | | | | 10.4 | | | | 0.3 | | | | 5.0 | | | | — | | | | 22.9 | |
Operating profit | | | 4.0 | | | | 16.5 | | | | 0.7 | | | | 5.0 | | | | — | | | | 26.2 | |
Other expense, net | | | 0.3 | | | | — | | | | — | | | | (0.5 | ) | | | — | | | | 0.8 | |
Depreciation and amortization | | | 12.1 | | | | — | | | | — | | | | — | | | | — | | | | 12.1 | |
EBITDA | | $ | 15.8 | | | $ | 16.5 | | | $ | 0.7 | | | $ | 4.5 | | | $ | — | | | $ | 37.5 | |
Net income | | $ | 5.5 | | | $ | 16.5 | | | $ | 0.7 | | | $ | 4.5 | | | $ | (7.8 | ) | | $ | 19.4 | |
Net income per share- basic (c) | | $ | 0.04 | | | $ | 0.11 | | | $ | — | | | $ | 0.03 | | | $ | (0.05 | ) | | $ | 0.13 | |
Net income per share- diluted (c) | | $ | 0.04 | | | $ | 0.11 | | | $ | — | | | $ | 0.03 | | | $ | (0.05 | ) | | $ | 0.13 | |
(a) | Other includes intercompany foreign exchange gain, restructuring consulting fees, and other non-recurring charges. |
(b) | Income tax effects have been calculated based on the statutory tax rates in effect in the U.S. and foreign jurisdictions during the quarter. |
(c) | GAAP and Adjusted basic and diluted net income per share are calculated based upon 145,593,019 and 151,444,901 weighted-average shares of common stock, respectively. |
18 | | | | | Q2 2020 Stockholder letter |
| | Three months ended June 30, 2019 | |
| | As reported | | | Share-based compensation | | | Severance charges | | | Other (a) | | | Income tax effects (b) | | | Adjusted | |
| | (Dollars in millions, except per share data) | |
Cost of revenue: | | | | | | | | | | | | | | | | | | | | | | | | |
Recurring services | | $ | 48.7 | | | $ | 0.8 | | | $ | 0.6 | | | $ | — | | | $ | — | | | $ | 47.3 | |
Professional services and other | | | 34.2 | | | | 0.5 | | | | 0.2 | | | | — | | | | — | | | | 33.5 | |
Product development and management | | | 16.4 | | | | 0.7 | | | | — | | | | — | | | | — | | | | 15.7 | |
Depreciation and amortization | | | 9.0 | | | | — | | | | — | | | | — | | | | — | | | | 9.0 | |
Total cost of revenue | | | 108.3 | | | | 2.0 | | | | 0.8 | | | | — | | | | — | | | | 105.5 | |
Sales and marketing | | | 34.9 | | | | 1.3 | | | | 0.4 | | | | — | | | | — | | | | 33.2 | |
General and administrative | | | 34.4 | | | | 6.3 | | | | 0.3 | | | | 0.9 | | | | — | | | | 26.9 | |
Operating profit | | | 18.7 | | | | 9.6 | | | | 1.5 | | | | 0.9 | | | | — | | | | 30.7 | |
Other expense, net | | | 1.5 | | | | — | | | | — | | | | 0.2 | | | | — | | | | 1.3 | |
Depreciation and amortization | | | 14.6 | | | | — | | | | — | | | | — | | | | — | | | | 14.6 | |
EBITDA | | $ | 31.8 | | | $ | 9.6 | | | $ | 1.5 | | | $ | 1.1 | | | $ | — | | | $ | 44.0 | |
Net income | | $ | 6.3 | | | $ | 9.6 | | | $ | 1.5 | | | $ | 1.1 | | | $ | (0.2 | ) | | $ | 18.3 | |
Net income per share- basic (c) | | $ | 0.04 | | | $ | 0.07 | | | $ | 0.01 | | | $ | 0.01 | | | $ | — | | | $ | 0.13 | |
Net income per share- diluted (c) | | $ | 0.04 | | | $ | 0.06 | | | $ | 0.01 | | | $ | 0.01 | | | $ | — | | | $ | 0.12 | |
(a) | Other includes intercompany foreign exchange loss, restructuring consulting fees, and other non-recurring charges. |
(b) | We have not applied an income tax effect to expenses incurred in the U.S. due to a full valuation allowance against our deferred tax assets as of June 30, 2019. Income tax effect in foreign jurisdictions is calculated based on the statutory tax rates during the quarter. |
(c) | GAAP and Adjusted basic and diluted net income per share are calculated based upon 141,149,009 and 148,331,846 weighted-average shares of common stock, respectively. |
19 | | | | | Q2 2020 Stockholder letter |
| | Six months ended June 30, 2020 | |
| | As reported | | | Share-based compensation | | | Severance charges | | | Other (a) | | | Income tax effects (b) | | | Adjusted | |
| | (Dollars in millions, except per share data) | |
Cost of revenue: | | | | | | | | | | | | | | | | | | | | | | | | |
Recurring services | | $ | 101.5 | | | $ | 2.7 | | | $ | 0.8 | | | $ | — | | | $ | — | | | $ | 98.0 | |
Professional services and other | | | 80.5 | | | | 1.5 | | | | 0.9 | | | | — | | | | — | | | | 78.1 | |
Product development and management | | | 34.6 | | | | 2.3 | | | | 0.4 | | | | — | | | | — | | | | 31.9 | |
Depreciation and amortization | | | 19.6 | | | | — | | | | — | | | | — | | | | — | | | | 19.6 | |
Total cost of revenue | | | 236.2 | | | | 6.5 | | | | 2.1 | | | | — | | | | — | | | | 227.6 | |
Sales and marketing | | | 76.7 | | | | 4.0 | | | | 1.0 | | | | — | | | | — | | | | 71.7 | |
General and administrative | | | 72.1 | | | | 18.7 | | | | 1.6 | | | | 6.2 | | | | — | | | | 45.6 | |
Operating profit | | | 30.3 | | | | 29.2 | | | | 4.7 | | | | 6.2 | | | | — | | | | 70.4 | |
Other expense, net | | | 2.9 | | | | — | | | | — | | | | 1.3 | | | | — | | | | 1.6 | |
Depreciation and amortization | | | 23.9 | | | | — | | | | — | | | | — | | | | — | | | | 23.9 | |
EBITDA | | $ | 51.3 | | | $ | 29.2 | | | $ | 4.7 | | | $ | 7.5 | | | $ | — | | | $ | 92.7 | |
Net income | | $ | 14.1 | | | $ | 29.2 | | | $ | 4.7 | | | $ | 7.5 | | | $ | (14.0 | ) | | $ | 41.5 | |
Net income per share- basic (c) | | $ | 0.10 | | | $ | 0.20 | | | $ | 0.03 | | | $ | 0.05 | | | $ | (0.10 | ) | | $ | 0.28 | |
Net income per share- diluted (c) | | $ | 0.09 | | | $ | 0.19 | | | $ | 0.03 | | | $ | 0.05 | | | $ | (0.09 | ) | | $ | 0.27 | |
(a) | Other includes intercompany foreign exchange loss, restructuring consulting fees, and other non-recurring charges. |
(b) | Income tax effects have been calculated based on the statutory tax rates in effect in the U.S. and foreign jurisdictions during the period. |
(c) | GAAP and Adjusted basic and diluted net income per share are calculated based upon 145,119,172 and 151,321,093 weighted-average shares of common stock, respectively. |
20 | | | | | Q2 2020 Stockholder letter |
| | Six months ended June 30, 2019 | |
| | As reported | | | Share-based compensation | | | Severance charges | | | Other (a) | | | Income tax effects (b) | | | Adjusted | |
| | (Dollars in millions, except per share data) | |
Cost of revenue: | | | | | | | | | | | | | | | | | | | | | | | | |
Recurring services | | $ | 99.6 | | | $ | 1.2 | | | $ | 0.8 | | | $ | — | | | $ | — | | | $ | 97.6 | |
Professional services and other | | | 69.5 | | | | 0.7 | | | | 0.4 | | | | — | | | | — | | | | 68.4 | |
Product development and management | | | 31.6 | | | | 1.2 | | | | 0.1 | | | | — | | | | — | | | | 30.3 | |
Depreciation and amortization | | | 17.7 | | | | — | | | | — | | | | — | | | | — | | | | 17.7 | |
Total cost of revenue | | | 218.4 | | | | 3.1 | | | | 1.3 | | | | — | | | | — | | | | 214.0 | |
Sales and marketing | | | 70.1 | | | | 2.3 | | | | 1.4 | | | | — | | | | — | | | | 66.4 | |
General and administrative | | | 65.4 | | | | 10.2 | | | | 0.9 | | | | 2.1 | | | | — | | | | 52.2 | |
Operating profit | | | 46.1 | | | | 15.6 | | | | 3.6 | | | | 2.1 | | | | — | | | | 67.4 | |
Other expense, net | | | 3.1 | | | | — | | | | — | | | | 0.5 | | | | — | | | | 2.6 | |
Depreciation and amortization | | | 29.0 | | | | — | | | | — | | | | — | | | | — | | | | 29.0 | |
EBITDA | | $ | 72.0 | | | $ | 15.6 | | | $ | 3.6 | | | $ | 2.6 | | | $ | — | | | $ | 93.8 | |
Net income | | $ | 17.5 | | | $ | 15.6 | | | $ | 3.6 | | | $ | 2.6 | | | $ | (0.6 | ) | | $ | 38.7 | |
Net income per share- basic (c) | | $ | 0.12 | | | $ | 0.11 | | | $ | 0.03 | | | $ | 0.02 | | | $ | — | | | $ | 0.28 | |
Net income per share- diluted (c) | | $ | 0.12 | | | $ | 0.11 | | | $ | 0.02 | | | $ | 0.02 | | | $ | — | | | $ | 0.27 | |
(a) | Other includes intercompany foreign exchange loss and restructuring consulting fees. |
(b) | We have not applied an income tax effect to expenses incurred in the U.S. due to a full valuation allowance against our deferred tax assets as of June 30, 2019. Income tax effect in foreign jurisdictions is calculated based on the statutory tax rates during the quarter. |
(c) | GAAP and Adjusted basic and diluted net income per share are calculated based upon 140,651,902 and 147,761,174 weighted-average shares of common stock, respectively. |
21 | | | | | Q2 2020 Stockholder letter |
Use of Non-GAAP financial measures
We use certain non-GAAP financial measures in this stockholder letter including Adjusted EBITDA, Adjusted EBITDA margin, Adjusted net income, and revenue on a constant currency basis. We believe that Adjusted EBITDA, Adjusted EBITDA margin, and Adjusted net income, non-GAAP financial measures, are useful to management and investors as supplemental measures to evaluate our overall operating performance. Adjusted EBITDA and Adjusted EBITDA margin are components of our management incentive plan and are used by management to assess performance and to compare our operating performance to our competitors. We define Adjusted EBITDA as net income before interest, taxes, depreciation, and amortization, as adjusted to exclude gain (loss) on assets and liabilities held in a foreign currency other than the functional currency of a company subsidiary, share-based compensation expense and related employer taxes, severance charges, restructuring consulting fees, and other non-recurring charges. Adjusted EBITDA margin is determined by calculating the percentage Adjusted EBITDA is of total revenue. Adjusted net income is defined as net income, as adjusted to exclude release of the valuation allowance, gain (loss) on assets and liabilities held in a foreign currency other than the functional currency of a company subsidiary, share-based compensation expense and related employer taxes, severance charges, restructuring consulting fees, and other non-recurring charges, all of which are adjusted for the effect of income taxes. Management believes that Adjusted EBITDA, Adjusted EBITDA margin, and Adjusted net income are helpful in highlighting management performance trends because Adjusted EBITDA, Adjusted EBITDA margin, and Adjusted net income exclude the results of decisions that are outside the normal course of our business operations.
Our presentation of Adjusted EBITDA, Adjusted EBITDA margin, and Adjusted net income are intended as supplemental measures of our performance that are not required by, or presented in accordance with, GAAP. Adjusted EBITDA,
Adjusted EBITDA margin, and Adjusted net income should not be considered as alternatives to operating profit, net income, earnings per share, or any other performance measures derived in accordance with GAAP, or as measures of operating cash flows or liquidity. Our presentation of Adjusted EBITDA, Adjusted EBITDA margin, and Adjusted net income should not be construed to imply that our future results will be unaffected by similar items to those eliminated in this presentation. Adjusted EBITDA, Adjusted EBITDA margin, and Adjusted net income are included in this discussion because they are key metrics used by management to assess our operating performance.
Adjusted EBITDA, Adjusted EBITDA margin, and Adjusted net income are not defined under GAAP, are not measures of net income, operating profit, or any other performance measures derived in accordance with GAAP, and are subject to important limitations. Our use of the terms Adjusted EBITDA, Adjusted EBITDA margin, and Adjusted net income may not be comparable to similarly titled measures of other companies in our industry and are not measures of performance calculated in accordance with GAAP.
Adjusted EBITDA, Adjusted EBITDA margin, and Adjusted net income have important limitations as analytical tools, and you should not consider them in isolation or as substitutes for analysis of our results as reported under GAAP.
In evaluating Adjusted EBITDA, Adjusted EBITDA margin, and Adjusted net income, you should be aware that in the future we may incur expenses similar to those eliminated in this presentation.
We present revenue on a constant currency basis to assess how our underlying businesses performed, excluding the effect of foreign currency rate fluctuations, which we believe is useful to management and investors. We calculate revenue on a constant currency basis by applying the average foreign exchange rate in effect during the comparable prior period. Dayforce revenue per customer is calculated on a constant currency basis by applying the prior year average exchange rate to all comparable periods.
22 | | | | | Q2 2020 Stockholder letter |
Forward-looking statements
This stockholder letter contains forward-looking statements that are subject to risks and uncertainties. All statements other than statements of historical fact or relating to present facts or current conditions included in this stockholder letter are forward-looking statements. Forward-looking statements give our current expectations and projections relating to our financial condition, results of operations, plans, objectives, future performance and business. You can identify forward-looking statements by the fact that they do not relate strictly to historical or current facts. Forward-looking statements in this stockholder letter include statements relating to third quarter and full year fiscal 2020, as well as those relating to future growth initiatives. These statements may include words such as “anticipate,” “estimate,” “expect,” “project,” “seek,” “plan,” “intend,” “believe,” “will,” “may,” “could,” “continue,” “likely,” “should,” and other words and terms of similar meaning in connection with any discussion of the timing or nature of future operating or financial performance or other events but not all forward-looking statements contain these identifying words. The forward-looking statements contained in this stockholder letter are based on assumptions that we have made in light of our industry experience and our perceptions of historical trends, current conditions, expected future developments and other factors that we believe are appropriate under the circumstances. As you consider this stockholder letter, you should understand that these statements are not guarantees of performance or results. These assumptions and our future performance or results involve risks and uncertainties (many of which are beyond our control). These risks and uncertainties include, but are not limited to, the following:
• | the impact of the Coronavirus disease 2019 (“COVID-19”) pandemic on our business, operations, and financial results; |
• | our inability to attain or to maintain profitability; |
• | significant competition for our solutions; |
• | our inability to continue to develop or to sell our existing Cloud solutions; |
• | our inability to manage our growth effectively; |
• | the risk that we may not be able to successfully migrate our Bureau customers to our Cloud solutions or to offset the decline in Bureau revenue with Cloud revenue; |
• | the decline or slower than expected development of the market for enterprise cloud computing; |
• | failure of our efforts to increase use of our Cloud solutions and our other applications may not succeed; |
• | our failure to provide enhancements and new features and modifications to our solutions; |
• | failure to comply the Federal Trade Commission’s ongoing consent order regarding data protection; |
• | system interruptions or failures, including cyber-security breaches, identity theft, or other disruptions that could compromise our information; |
• | our failure to comply with applicable privacy, security, data, and financial services laws, regulations and standards; |
• | changes in regulations governing financial services, privacy concerns, and laws or other domestic or foreign data protection regulations; |
• | the risk of loss caused by customer failure to repay distribution of earned net wages and associated tax amounts made on behalf of our customers for our Dayforce Wallet or other services; |
• | our inability to successfully expand our current offerings into new markets or further penetrate existing markets; |
• | our inability to meet the more complex configuration and integration demands of our large customers; |
• | reductions in our customers’ employment levels or other overall declines in the financial viability of our current and prospective customers; |
• | the risk of our customers declining to renew their agreements with us or renewing at lower performance fee levels; |
23 | | | | | Q2 2020 Stockholder letter |
• | our failure to manage our technical operations infrastructure; |
• | our inability to maintain necessary third party relationships, and third party software licenses or there are errors in the software we license; |
• | our inability to protect our intellectual property rights, proprietary technology, information, processes, and know-how; |
• | our failure to keep pace with rapid technological changes and evolving industry standards; |
• | general economic, political and market forces beyond our control; |
• | changes in laws and regulations related to the Internet or changes in the Internet infrastructure itself; or |
• | other risks and uncertainties described in our most recent annual report on Form 10-K, subsequent quarterly reports on Form 10-Q, and other filings with the Securities and Exchange Commission. |
Additional factors or events that could cause our actual performance to differ from these forward-looking statements may emerge from time to time, and it is not possible for us to predict all of them. Should one or more of these risks or uncertainties materialize, or should any of our assumptions prove incorrect, our actual financial condition, results of operations, future performance and business may vary in material respects from the performance projected in these forward-looking statements. In addition to any factors and assumptions set forth above in this stockholder letter, the material factors and assumptions used to develop the forward-looking information include, but are not limited to: the general economy remains stable; the competitive environment in the HCM market remains stable; the demand environment for HCM solutions remains stable; our implementation capabilities and cycle times remain stable; foreign exchange rates, both current and those used in developing forward-looking statements, specifically USD to CAD, remain stable at, or near, current rates; we will be able to maintain our relationships with our employees, customers and partners; we will continue to attract qualified personnel to support our development
requirements and the support of our new and existing customers; and that the risk factors noted above, individually or collectively, do not have a material impact on the Company. Any forward-looking statement made by us in this stockholder letter speaks only as of the date on which it is made. We undertake no obligation to publicly update any forward-looking statement, whether as a result of new information, future developments or otherwise, except as may be required by law.

Ceridian is a global human capital management software company. Dayforce, our flagship cloud HCM platform, provides human resources, payroll, benefits, workforce management, and talent management functionality. Our platform is used to optimize management of the entire employee lifecycle, including attracting, engaging, paying, deploying, and developing people. Ceridian has solutions for organizations of all sizes.

24 | | | | | Q2 2020 Stockholder letter |