Exhibit 99.2

Management’s Discussion & Analysis
of Financial Condition and Results of Operations
February 20, 2019
On January 1, 2018, PotashCorp and Agrium completed a merger of equals creating the world’s largest provider of crop inputs and services. The new company, Nutrien Ltd., will play a critical role in helping growers increase food production in a sustainable manner.
The following management’s discussion and analysis (MD&A) is the responsibility of management and dated as of February 20, 2019. The Board of Directors of Nutrien carries out its responsibility for review of this disclosure principally through its audit committee, comprised exclusively of independent directors. The audit committee reviews and, prior to its publication, recommends to the Board of Directors for approval of this disclosure. The Board of Directors has approved this disclosure. The term “Nutrien” refers to Nutrien Ltd. and the terms “we,” “us,” “our,” “Nutrien” and “the Company” refer to Nutrien and, as applicable, Nutrien and its direct and indirect subsidiaries as a group, including, for greater clarity, Potash Corporation of Saskatchewan Inc. (PotashCorp or PCS) and Agrium Inc. (Agrium). This MD&A is based on the Company’s audited consolidated financial statements for the year ended December 31, 2018 (financial statements) prepared in accordance with International Financial Reporting Standards as issued by the International Accounting Standards Board (IFRS) unless otherwise stated.
This MD&A contains certainnon-IFRS financial measures which do not have a standard meaning under IFRS including:
• Combined historical results of PotashCorp and Agrium • EBITDA, Adjusted EBITDA and Potash adjusted EBITDA • Adjusted net earnings (and the related per share amounts) • Free cash flow • Gross margin excluding depreciation and amortization per tonne | • Potash cash cost of product manufactured • Urea controllable cash cost of product manufactured • Retail normalized comparable store sales • Retail average working capital to sales • Retail cash operating coverage ratio • Adjusted net debt |
See the“Non-IFRS Financial Measures” section which begins on page 77 for a description of and further information on these measures and reconciliation to the most directly comparable measures under IFRS.
Also see the cautionary statement on forward-looking information on page 76.
All references to per share amounts pertain to diluted net earnings (loss) per share. Financial data in this annual report are stated in US dollars unless otherwise noted.
See page 87 for the definitions of financial andnon-financial terms used in this annual report.
See pages 157 and 158 for a list of abbreviations and terms used in the annual report.
Additional information relating to Nutrien (which, except as otherwise noted, is not incorporated by reference herein), including our first quarter 2018 unaudited interim report, second quarter 2018 unaudited interim report, third quarter 2018 unaudited interim report, and the Annual Information Form for the year ended December 31, 2018, can be found on SEDAR at www.sedar.com and on EDGAR at www.sec.gov. The Company is a foreign private issuer under the rules and regulations of the US Securities and Exchange Commission (the SEC).
Grey shading has been used throughout this MD&A to emphasize required regulatory and IFRS comparative figures, which are amounts previously reported by PotashCorp as it is the continuing reporting entity for accounting purposes.
The information contained on or accessible from our website or any other website is not incorporated by reference into this Management’s Discussion and Analysis of Financial Condition and Results of Operations or any other report or document we file with or furnish to applicable Canadian or US securities regulatory authorities.
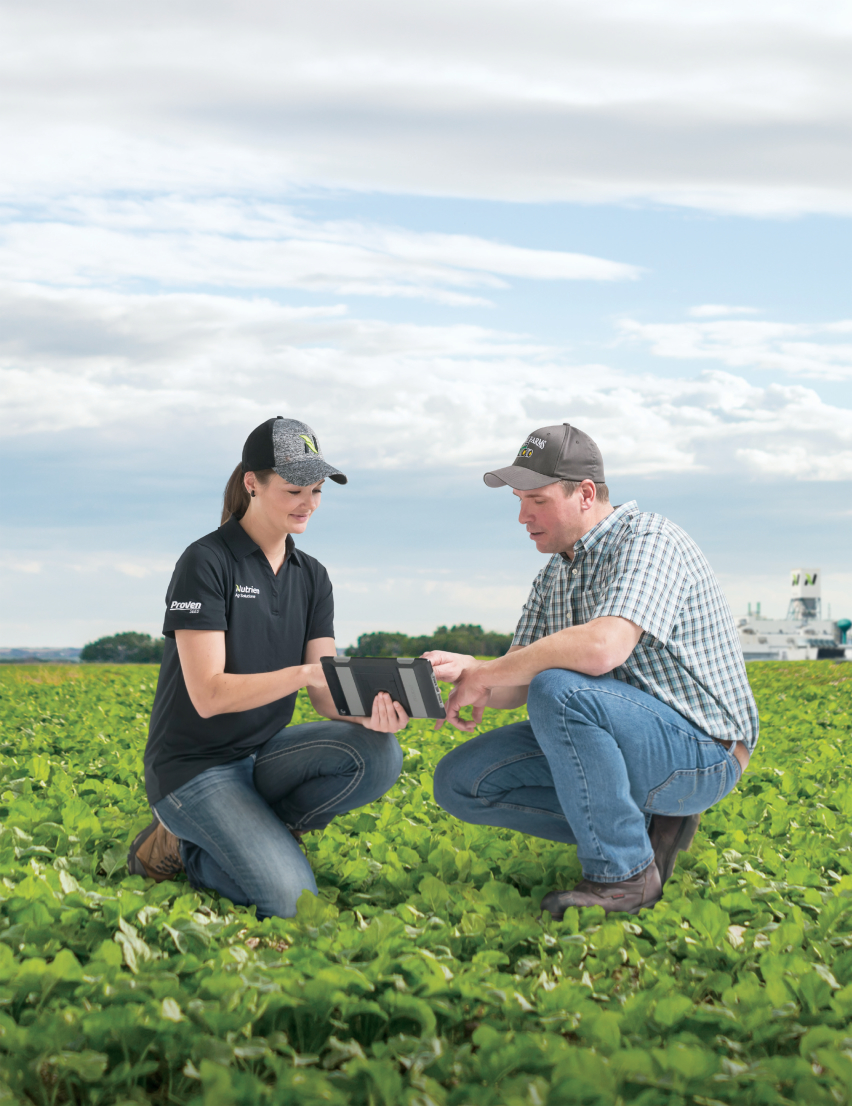
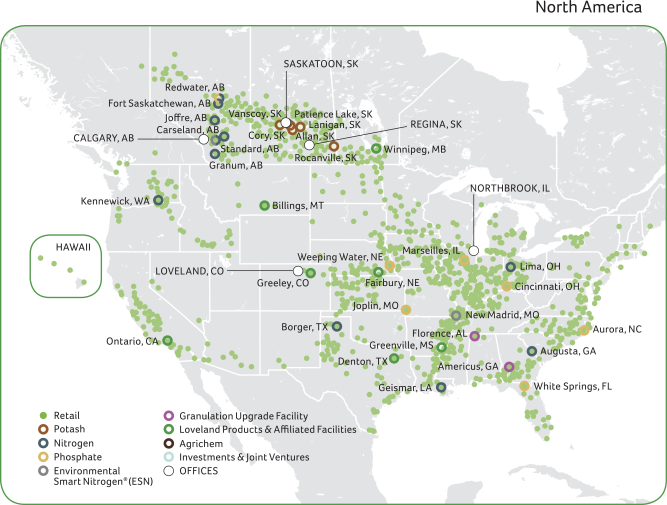
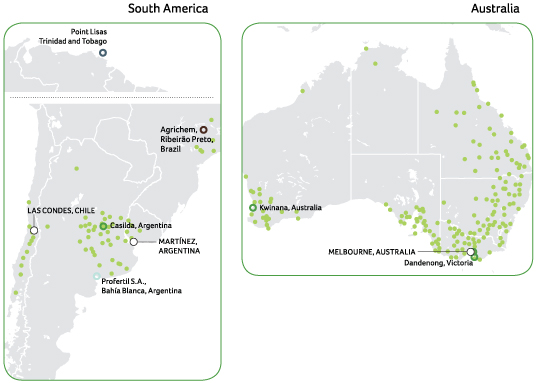
Nutrien’s Global Footprint
This is Nutrien. A global agriculture company with operations and investments in 14 countries. Our integrated platform combines the world’s premier Ag Retail network with some of the highest quality, lowest cost production assets. With this position, we are able to efficiently supply crop inputs and services to major growing regions of the world.
| NUTRIEN 2018 | 10 | ANNUAL REPORT |
MANAGEMENT'S DISCUSSION AND ANALYSIS
| NUTRIEN 2018 | 11 | ANNUAL REPORT |
Delivering Value
It begins with our people and our portfolio of assets. We have more than 20,000 employees worldwide helping grow our world from the ground up. To enable the global achievement of Nutrien’s strategy, we must attract, develop and engage employees who live our values and principles.
We have a world-class integrated portfolio of assets that provides opportunity to reduce cost, grow earnings and deliver supply chain synergies that create value for the grower and our shareholders.
We unlock this potential by building a unique relationship with the grower by establishing the best channel to the customer for reliably and effectively serving their needs,
and by backward integrating across the agricultural value chain with leading production assets and a solutions offering that is unique within our industry.
As a leading diversified company in the agricultural space, our strategy focuses on creating value through the cycle and a platform for long-term growth.
Strategic Road Map
| Basic Beliefs | Strategy and Risk | Governance |
Key external and internal factors that inform our strategic choices | ___ > | Integrated approach that considers risk throughout our strategic planning activities | ___ > | Process and oversight to ensure we deliver sustained value to all stakeholders | ||||
| Learn more on page 13 | Learn more on pages 14-28 | �� | Learn more on page 29 | |
| NUTRIEN 2018 | 12 | ANNUAL REPORT |
MANAGEMENT'S DISCUSSION AND ANALYSIS
Basic Beliefs Provide Foundation
for Our Strategic Choices
Our strategic process starts with a view of the core drivers for our business: how these factors will shape the future of our industry and how we are positioned to create value for our stakeholders today and in the future.
Basic Beliefs
 |  |  |  |  | ||||||||||||
| Ag markets will remain cyclical with favorable long-term demand drivers. | Innovation and technology development must focus on adding value for the grower. | Integrating production and distribution provides efficiencies and market access. | Leading sustainability practices will create competitive advantages and make a global difference. | Talent acquisition and people development are critical to sustaining long- term success. | ||||||||||||
|
|
| ||||||||||||||
We have a unique opportunity to benefit from recovering agriculture and fertilizer markets and generate superior returns through the cycle. | We have the resources and relationship with the grower to best develop innovative products and solutions. | The scale of our production and distribution footprint is unmatched in the ag space, providing the opportunity to generate significant cost savings across our supply chain. | Sustainability is integrated across our value chain to reduce our environmental footprint and make a meaningful contribution to society and the economy. | Fostering our purpose driven culture will create a long-term competitive advantage. | ||||||||||||

| NUTRIEN 2018 | 13 | ANNUAL REPORT |
Our Strategic Approach
Our vision is to be the leading global integrated Ag solutions provider
Our Strategy
Build the Channel
Enhance the Content
How We Compete
Build a Unique Relationship with the Grower |
Create the Best Channel to the Customer |
Own Leading Production Assets & Proprietary Offerings |
Our Key Actions
Focus on Sustainability & Safety
|
Drive Integration & Optimization |
Strategically Allocate Capital |
Invest in Growth & Innovation |
Engage Employees |
| NUTRIEN 2018 | 14 | ANNUAL REPORT |
MANAGEMENT'S DISCUSSION AND ANALYSIS
Our Strategy = Channel + Content
Our relationship with the grower, channel to the customer, and extensive product and service offering provide Nutrien with very distinct andvaluable competitive advantages—this is how we and our customers succeed on a daily basis.
How We Compete
Build a Unique Relationship with the Grower
We are the leading retailer of crop inputs and services across key global agricultural markets, primarily in North America, Australia and South America. With more than 1,700 Retail locations and 500,000 grower accounts worldwide, we interact with growers on a daily basis. This relationship provides valuable insight to help us anticipate the needs of ourend-customer.
Create the Best Channel to the Customer
Nutrien creates value through integration of our supply chain and market approach—as demonstrated by our integrated footprint in North America. Nutrien has the premier North American storage and distribution network with more than 2,100 distribution points. We are focused on having the systems, processes, and people in place to connect our business from site to customer.
Own Leading Production Assets and Proprietary Offerings
Nutrien is the world’s largest producer of crop nutrients with approximately 27 million tonnes of annual sales. We have distinct scale, market and cost advantages across our portfolio that provide a significant competitive advantage.
We also produce a range of high-quality proprietary crop protection, seed and crop nutrient products that generate higher margins for our Retail business unit. Having access to such a large offering allows Nutrien to provide meaningful solutions and yield-enhancement opportunities to our customers.
| NUTRIEN 2018 | 15 | ANNUAL REPORT |
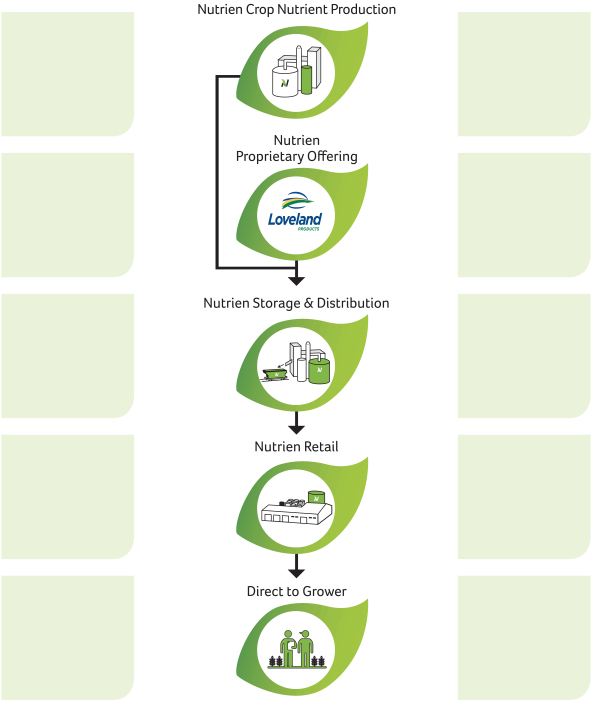
Our Integrated Platform Provides Advantages
We leverage our extensive distribution system to efficiently move our crop nutrients and proprietary products to our world-class retail network. Providing products
and solutions direct to the grower strengthens our partnership with our customer.
#1
Largest Potash
Producer
>1,700
Proprietary Products
Available
6.2Mmt
of Storage Capacity
Outside of Facilities
>1,700
Retail Locations
Globally
>500,000
Grower Accounts
3RD
Largest Nitrogen
Producer by Capacity
25%
of Retail Total Gross
Margin is Proprietary
Product Sales
~15,000
Railcars
>17,000
Total
Products Available
to Growers
>50%
of Customer Sales Linked to
Nutrien Ag Solutions
Digital Platform
| NUTRIEN 2018 | 16 | ANNUAL REPORT |
MANAGEMENT'S DISCUSSION AND ANALYSIS
Creating Value through Our Key Actions
Nutrien’s key actions drive each and every employee’s deliverables on a daily basis. We set priorities for each of these areas to ensure we can define and measure our performance. Our strategy and performance are supported by governance oversight and risk management by our leaders and Board of Directors.
is foundational to everything we do
18-19
Drive Integration & Optimization
to unlock potential and improve existing asset base
20-21
Strategically Allocate Capital
to maximize long-term shareholder returns
22-23
to identify and pursue long-termvalue-enhancing opportunities
24-25
to ensure we can deliver on our priorities
26-27
| NUTRIEN 2018 | 17 | ANNUAL REPORT |

Feeding a growing population is one of the world’s greatest opportunities and one of its greatest challenges. Nutrien is well positioned to make meaningful contributions to many of the United Nations Sustainable Development Goals (SDGs), most notably Goal 2:“End hunger, achieve food security and improved nutrition and promote sustainable agriculture”.
In 2018, we began the development of a new Nutrien sustainability strategy to advance resilient agricultural practices and strengthen sustainable food production. Through innovative solutions, we aim to balance environmental, social and economic factors in our business and across our value chain.
In 2018, we built on the following core foundations:
Ethics and Human Rights
Ethical behavior is the basis of our core values. Acting with integrity helps us attract and retain talent, and reinforces our relationships with stakeholders. We are committed to the 10 principles of the United Nations Global Compact, and we take our role to protect human rights seriously while following all laws and regulationsrelated to anti-discrimination and equal employment.
Safety
With safety as a core value in Nutrien, our priority is that everyone goes home safe, every day. Our safety culture is ingrained in everything we do; it extends to the care and protection of our people, the environment, our products and communities. As committed safety leaders, we are guided by three principles: do it safely or not at all; there is always time to do it safely; and care for each other’s safety and health. We strive for zero life-altering injuries to employees and a reduction in our recordable injury rates.
Environment
We believe it’s critical to minimize the impact our operations and products have on the environment with comprehensive stewardship programs at our sites and with key stakeholders.
We also work closely with our growers to help them sustainably intensify production with investments in digital technology, innovative product lines such as Environmentally Smart Nitrogen (ESN®) and science-based management plans such as 4R Nutrient Stewardship initiatives. Our priority is to continually improve upon our environmental performance.
| NUTRIEN 2018 | 18 | ANNUAL REPORT |
MANAGEMENT'S DISCUSSION AND ANALYSIS

Sustainability Priorities
| ||||
| • Sustainable Agriculture: Lead the next wave of innovation and sustainability in agriculture. | • Environmental Footprint: Protect the planet and minimize our environmental impact. | • Diversity and Inclusion: Champion diversity and inclusive growth in the agriculture industry. |
Stakeholder Engagement
Nutrien has a comprehensive approach to stakeholder engagement. Ongoing,two-way stakeholder dialog across a variety of channels helps us focus and refine our efforts to minimize negative impacts and maximize positive outcomes. We are committed to ensuring that our sustainability priorities match those that matter most to our stakeholders. In 2018, we engaged with our stakeholders to help determine our priority sustainability topics. Three external
sustainability-specialty companies held independent reviews, focus groups and interviews to ensure our stakeholders could speak openly and help shape our strategy.
Community Relations
We don’t just operate in communities, we are a part of them. It’s important to us that we develop meaningful partnerships to strengthen, support and enhance our communities. Through volunteering, outreach, investment and employment opportunities, we
help grow our world. In 2018, we invested$17 million dollars in communities and partnered with over 2,500non-profit organizations. A few highlights in 2018 were continuing our support of Shock Trauma Air Rescue Services (STARS) in Saskatchewan by funding a new H145 helicopter and supporting youth education programs such as Caring for our Watersheds.
In September 2018, a Company-wide Employee Volunteer Program was implemented allowing employees one day off to help grow our world.
2018 was a year of stakeholder engagement, process alignment and strategic planning. We are working on targets and initiatives to improve our social, economic and environmental impact. Details, including more about our priorities, will be available in Nutrien’s first sustainability report in 2019.
Find out more at nutrien.com/sustainability |
2018 Performance
$17M |
0.07 |
0.34 |
>600K | |||
Invested in Communities | Total Environmental Incidents Frequency* | Lost-Time Injury Frequency* | Students Reached Through Ag Education | |||
* Frequency based for every 200,000 hours worked.
| NUTRIEN 2018 | 19 | ANNUAL REPORT |
Drive Integration & Optimization
Delivering sustained value to all our stakeholders requires a constant focus on being alow-cost supplier to the markets we serve. Integrating and optimizing our extensive production and distribution channel ensures that our customers receive top quality products and services in a reliable and timely manner.
Drive Integration
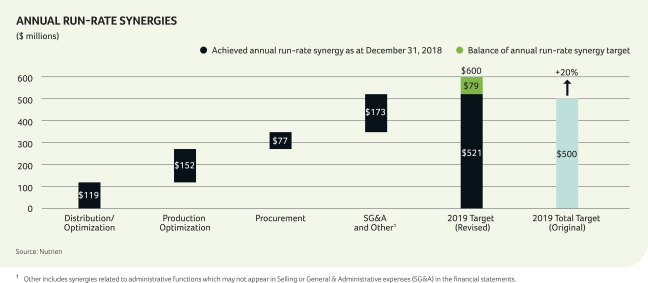
At the onset of the Merger, we committed to delivering $500 million in annualrun-rate synergies by the end of 2019. We were able to accelerate the rate of synergy capture and achieve this target within the first 12 months after the Merger. We also raised our target to $600 million by the end of 2019. The increased synergy target is indicative of the tremendous value that has been created by combining the two legacy companies.
| NUTRIEN 2018 | 20 | ANNUAL REPORT |
MANAGEMENT'S DISCUSSION AND ANALYSIS

| Integration and Optimization Priorities | ||||
• Realize$600 millionrun-rate synergy target by the end of 2019 and drive further integration opportunities across the organization in the near and long term. | • Continue toimprove capacity utilization andreduce cash costs across our nutrient production assets. | • Deliver higher year-over-year normalized comparable store sales and EBITDA margin in our Retail operations. | ||
Optimization
Our focus extends beyond the synergies realized through the Merger. Optimizing our organizational cost structure is also about operational excellence and defining what matters to our bottom line and what we can control. By focusing on these and other factors, Nutrien expects to reduce the cost to produce and sell our products and services, and thereby deliver industry leading results.
In 2018, our Potash business unitcontinued to reduce cash cost of product manufactured (COPM) through Merger synergies and rebalancing our overall portfolio to increase production from our lower cost mines.
Our Nitrogen business unitin 2018 also achieved significant improvements in cost and utilization rates as a result of Merger synergies as well as innovation and process improvements. Across all three nutrients, we are continuing to share and capitalize on maintenance practices to reduce capital spending and improve the reliability of our facilities.
Retail continues to drive margin improvement by focusing on proprietary product growth and reducing overall operating cash costs. The consolidation of Retail acquisitions also allows for cost synergies as more customers are served effectively by centralized supportive operations. These efforts have contributed to the improvement in our cash operating coverage ratio and stability in EBITDA margins, while supporting record EBITDA in 2018.
2018 Performance
$60 |
$72 |
92% |
10% | |||
Potash Cash Cost per Tonne | Urea Controllable per Tonne | Ammonia OperatingRate (excludes Trinidad and Joffre) | Retail | |||
| NUTRIEN 2018 | 21 | ANNUAL REPORT |

Strategically Allocate Capital
We maintain adisciplined approach to capital allocation,with our priorities being: invest in growth of the business, return cash to shareholders, and maintain a strong investment-grade rating.
The diversity of our asset base and stability of Retail earnings provides significant advantages for deploying capital through the agriculture commodity cycle. During low points of the cycle, we expect to focus on growing our crop nutrient production, share repurchases and transformational opportunities. At the high points of the cycle, we expect to shift to paying down debt and focusing on organic growth opportunities. The stability of Retail allows us to keep growing this business unit and our dividend throughout the cycle.
In 2018, Nutrien generated $2.0 billion of free cash flow and received $5.3 billion in net cash proceeds from the sale of equity interests in Israel Chemicals Ltd., Arab Potash Company and Sociedad Quimica y Minera de Chile S.A. due to regulatory requirements to dispose of these investments in connection with the Merger. The strength of our diversified earnings and receipt of substantial value for our equity investments allowed us to provide meaningful returns to our shareholders and invest in our organization.
| NUTRIEN 2018 | 22 | ANNUAL REPORT |
MANAGEMENT'S DISCUSSION AND ANALYSIS

| Capital Allocation Priorities | ||||
• Continue toinvest in Nutrien earnings growth,predominantly in Retail. | • Provide a stable and growing dividend in a targeted range of40-60 percent of free cash flow after sustaining capital through the cycle. | • Maintaininvestment-grade credit rating. | ||
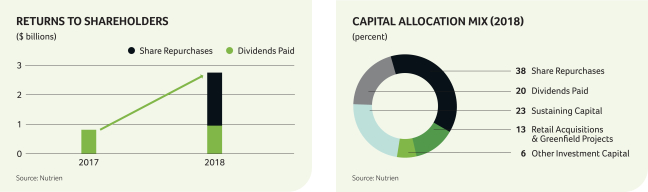
Our goal is to provide shareholders a stable and growing dividend underpinned by growth in our Retail business unit. We increased the amount of dividends paid by approximately 17 percent in 2018 compared to the combined amount paid by our legacy companies in 2017.
In 2018, we also repurchased for cancellation 36 million shares for $1.8 billion. At the end of 2018, the existing share repurchase program was extended to 8 percent from 5 percent of outstanding common shares, and as of February 20, 2019, another 6 million shares have been repurchased for $297 million. We will continue to evaluate allocation of capital to further share repurchase programs in 2019.
Our focus on Retail growth was supported by approximately $600 million invested into US and Australian Retail acquisitions, global Retail greenfield
projects, and the purchases of Agrichem in Brazil and Waypoint and Agrible in the US.
Sustaining the performance of our assets is critical to the success of our company and ensuring timely and reliable product to our customers. The appropriate level of spend requires thoughtful analysis based on historical data and industry expertise to provide the best return for risk mitigation and to deliver optimal operational performance of our assets. In 2018, Nutrien spent $1.1 billion on sustaining capital, similar to the investment level in 2017.
In the process of prudent capital allocation decisions, it is important that Nutrien maintain its balance sheet strength and sustain its investment-grade rating. This was achieved in 2018 and we were able to improve upon various debt ratios by the end of the year.
2018 Performance
58% |
$2.8B |
1.6x |
$1.1B | |||
of Capital Deployment to Dividends and Share Repurchases | in Dividends and Share Repurchases | Adjusted Net Debt / Adjusted EBITDA Ratio | in Sustaining Capital | |||
| NUTRIEN 2018 | 23 | ANNUAL REPORT |

Growth and Innovation Priorities
• Continue togrow US and Australian Retail footprint and develop Retail network in Brazil. | • Enhance our digital omni-channel offering and our proprietary crop input product technologies.
| • Evaluate nitrogen brownfield projects in North America. |
Investing in growth and innovation is intended to support not only continual earnings progression, but the long-term viability of our company and benefit all our stakeholders. We remain committed to prudently identifying and pursuing long-term, value-enhancing opportunities while executing on them in a timely manner.
Growth
Nutrien remains focused on investing in its world-class Retail distribution network in North America, Australia and Brazil. We believe the US provides the best opportunity for growth through acquisitions along with the highest margins and synergy realization. Australia remains a market with opportunities for additional acquisitions and proprietary product expansion.
Brazil represents a new focus for Retail growth as a major global player in the production of food and purchase of crop inputs and services. We expect to invest capital in Brazil in order to achieve a meaningful presence and provide Brazilian growers with the latest in yield-enhancing products, agronomic advice and digital tools.
We are evaluating debottlenecking and brownfield projects across our North American nitrogen network that could increase total capacity and our capability to produce higher-margin products. Despite the recent increase in global nitrogen prices and natural gas price advantages in North America, we do not believe greenfield nitrogen projects would be currently economically viable.
With approximately 5 million tonnes of incremental potash operational capability in Saskatchewan, we can bring on additional tonnes with minimal capital as global demand grows.
| NUTRIEN 2018 | 24 | ANNUAL REPORT |
MANAGEMENT'S DISCUSSION AND ANALYSIS

Innovation
We are focused on developing new products, services and tools that meet the needs of our customers in their challenge to feed a growing planet.
Our user-friendly Nutrien Ag Solutions’ digital platforms and eKonomics tools provide our customers with industry leading data and analytics, helping them make informed decisions to improve yields and returns. Nutrien Ag Solutions award winning integrated digital customer portal includes account management, weather data and interpretation, and commodity data. In 2019, we will be adding other valuable applications such as
e-commerce capabilities, allowing both customers and crop consultants to place online orders for crop protection products, together with actionable crop plans and tailored agronomic insights.
We have invested in more than 1,700 proprietary products that include patented technology in micronutrients, crop protection and seed. Loveland Products® is one of our key crop protection proprietary brands available to growers, as well as Dyna-Gro® and Proven™ – highly valuable seed options for growers of corn, soybeans, cotton and canola in North America and Australia. Over the
past five years, we have also invested in other agricultural technology companies, vastly increasing our portfolio of innovative products and options for our customers.
We are also providing financial services to growers under Nutrien Financial™ and Ag Resource Management™ (ARM™). These provide specialized lending to US customers, some of which is backed by grower collateral. The combination of the two lending platforms provides complementary credit options, helping growers make timely purchases of required crop inputs.
2018 Performance
~$400M |
AGRICHEM |
120 |
>50% | |||||||||
of Expected Annual Revenue Acquired
(related to purchased retail locations) | Crop Protection Acquisition in Brazil | New Product Launches and Registrations | of Customer Sales Linked to | |||||||||
| NUTRIEN 2018 | 25 | ANNUAL REPORT |
Nutrien’s People Strategy is to attract, develop and engage skilled employees who live our values and principles. In 2018, we focused on establishing our foundational people program to enable the continued growth of the business and infuse Nutrien’s purpose driven culture into the organization.
Managing Performance
In 2018, we designed and implemented a performance management system which measures both achievements and behavior. This system provides accountability for results on measurable goals as well as ensures our culture and values are guidingday-to-day behavior of our employees and leaders.
Talent Attraction and Sourcing
In 2018, Nutrien established its Talent Attraction & Sourcing group, which specializes in Strategic Talent Outreach and Delivery. Using a candidate-centric approach, this group targets and attracts job seekers into Nutrien roles and establishes diverse candidate pools.
Employee Engagement
As a new organization, we are greatly interested in hearing the voices of our employees and understanding their experience with Nutrien. One way we plan to do this is through a global employee engagement survey to be conducted in 2019. The results of the survey will be used to provide a Company-wide perspective on engagement and experience and will allow us to prioritize organizational efforts.
Purpose Driven Culture
Nutrien articulated its greater purpose as one of its first orders of business. It unifies the organization and provides meaning to employees and their work. Purpose is at the foundation of Nutrien’s culture and is supported by two of our core values of safety and integrity, as well as our engagement principles of innovation, performance, inclusion and community.
Growing Our Diverse Workforce
We recognize that having a diverse workforce enhances our organizational strength and better reflects our customers and stakeholders. In 2018, we established a robust Diversity & Inclusion strategy that focuses on increasing gender diversity andmatch-to-market representation of visible minorities, including Indigenous peoples in Canada. Within the strategy, the organization is committed to increasing inclusive practices and sense of belonging for our employees.
Developing Our Employees
In 2018, Nutrien established its Strategic Talent Management process to manage organizational risk and succession in critical roles – a process stewarded by our Executive Leadership Team.
| NUTRIEN 2018 | 26 | ANNUAL REPORT |
MANAGEMENT'S DISCUSSION AND ANALYSIS

Employee Engagement Priorities
• Achieve progress toward our diversity priority of increasing the representation of women in senior leadership to 20 percent or more by 2022.
| • Becomemore representative of our local marketsin our employment of protected groups and visible minorities. | • Maintain at least92 percent acceptance rate of all Nutrien employment offers, increasing to 95 percent acceptance by 2023. | • Maintain anannual voluntary resignation rate, globally, below 9.5 percent. | • By 2023, achieve anemployee engagement survey score of no less than 75 percent. |
Our Purpose

2018 Performance
17%
of Senior Leaders are Women |
92%
Acceptance Rate of all Nutrien Employment Offers |
<1.5%
Voluntary Resignation Rate of Senior Leaders |
85%
of North American Senior Leaders Trained in Leading | |||
| NUTRIEN 2018 | 27 | ANNUAL REPORT |
Our Integrated Approach to Strategy & Risk
Enterprise Risk Management at Nutrien is integrated into our strategic and business planning activities, with a focus on managing our key business risks and facilitating informed risk taking. By fostering a risk-aware culture in decision making at all levels of the Company, Nutrien is positioned to better manage risk and identify opportunities to enhance value.

Our strategic and risk management processes are integrated with a view to ensuring we understand and benefit from the relationship between strategy, risk, and value creation. By considering risk throughout our strategic and business planning activities, we seek to align our strategy with our vision, and effectively manage the embedded business risks that could impact the achievement of our strategy.
Our approach to risk management is governed by our Board of Directors, including through our Board Committees, which oversee our Executive Leadership
Team in understanding the principal risks to our business and strategy and implementing measures to manage those risks, while achieving an appropriate balance between risk and return.
In 2018, Nutrien undertook atop-down,bottom-up approach with our Executive Leadership Team and management in each of our business units to review and refine our risk profile. Through this process, we identified and evaluated the most significant risks and developed an approach to monitor mitigation and changes over time. See page 56 for a discussion of our Key Risks.
| NUTRIEN 2018 | 28 | ANNUAL REPORT |
MANAGEMENT'S DISCUSSION AND ANALYSIS
Corporate governance at Nutrien is key to long-term success and ensuring that our basic beliefs, strategy and enterprise risk management, are aligned and carried out with a view to acting in the best interests of all our stakeholders and are consistent with our core values. Our Board of Directors is comprised of directors with a vast array of relevant experience and education, skills and leadership that is applied in the strategic decision-making process.
In 2018, the Board played a critical role in developing the initial strategic road map for Nutrien and establishing the governance structure and policies that will support our key strategic actions that deliver value to all stakeholders.
Diversity is a core belief at Nutrien, and this is demonstrated by 33 percent of the Board being comprised of women. This diversity is invaluable and brings new and progressive perspectives and well-rounded skills to our Board. Nutrien formally adopted a Board Diversity Policy in January 2018 to help fulfill its diversity objectives. The policy provides that, although the selection of candidates for appointment to the Board will be based on merit, Board vacancy decisions will have regard for the appropriate level of diversity, including gender diversity. The Board Diversity Policy includes a target that women comprise not less than 30 percent of our directors.
It is imperative that directors understand our business, including its size, complexity and risk profile, and stay current with corporate governance, regulatory, industry
and other key issues to be effective members of our Board. Over the course of 2018, our directors continued to advance their knowledge of our business, industry, regulatory environment, as well as other topical areas of interest to enhance their effectiveness as directors and stewards of Nutrien.
To increase alignment with shareholders’ interests, allnon-executive directors are expected to hold three times their annual retainer in common shares and/or Nutrien deferred share units (DSUs) within five years of joining the Board. We believe it is important that our senior leadership have an ownership mentality in Nutrien as well, with mandatory equity ownership required, with the CEO expected to hold five times base salary.
For a more comprehensive view of Nutrien’s corporate governance practices, please refer to our Meeting and Management Proxy Circular on our website:
nutrien.com/investors
|

| NUTRIEN 2018 | 29 | ANNUAL REPORT |
Operating Segment Performance & Outlook
We report our results in four operating segments:
Retail, Potash, Nitrogen and Phosphate and Sulfate.
| • | Our reporting structure reflects how we manage our business. |
| • | EBITDA is the primary profit measure used to evaluate performance and allocate resources in all operating segments. |
| • | Net sales (sales revenues less freight, transportation and distribution expenses) is the primary revenue measure used in planning and forecasting in the Potash, Nitrogen and Phosphate and Sulfate operating segments. |
| 31-37 | Retail | |
| 38-43 | Potash | |
| 44-49 | Nitrogen | |
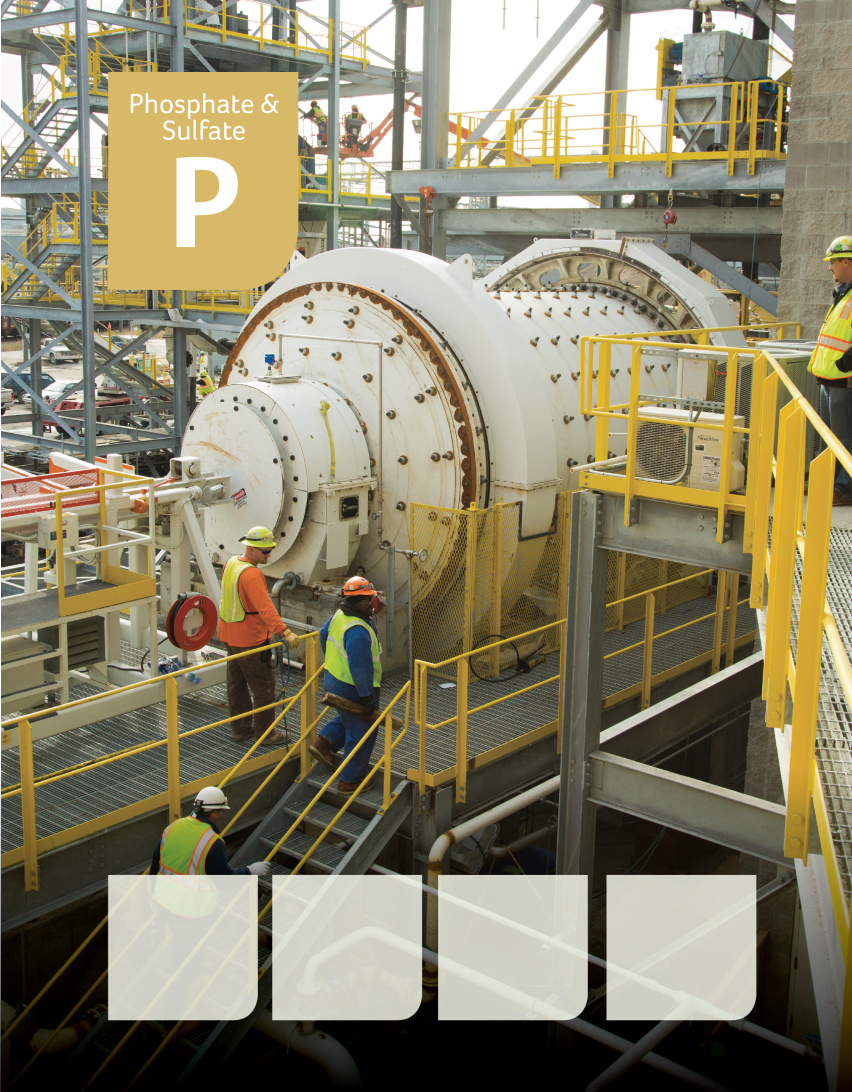
| 50-55 | Phosphate & Sulfate | |

Retail Operating Environment
Overview
Today’s grower relies heavily on the expertise of the agricultural retailer to provide yield enhancing solutions through all crop inputs, agronomic advice, application services, data analysis, and financing. Agricultural retail is comprised of a distribution network serving growers within a local region. The network of retail facilities allows for logistical and working capital efficiencies, while providing products and services to the grower in
a timely manner. Retailers deal with numerous vendors of crop inputs—so the scale of the retailer can provide procurement savings. The numerous challenges that growers face on a daily basis creates the opportunity for the retailer to be a business partner with the grower, and to provide meaningful support and guidance while improving economic and crop productivity.
Competitive Landscape
The retail landscape in most developed agriculture markets is comprised of numerous competitors of differing size and ownership structure. It is a fragmented market and continues to require scale to be able to meet evolving grower needs. Growers want more services and solutions, rooted in analytics, delivered in a shorter time window than ever before.
In North America and Australia, we compete with large national retailers,co-operatives and smaller independent operations. In Brazil, the market is characterized by smaller independent owners and represents an opportunity for larger retailers, including Nutrien, to provide a significant improvement in grower performance.
Key Success Factors
Meeting the needs of the grower requires the capability to deliver a wide range of bulk products in a timely and cost-effective manner. The ability to provide application services, agronomic advice, technology and financial services further enhances the relationship with the grower. This requires significant scale and investment supported by the latest in agricultural technology. As the
majority of products and services are required in a very short application window, it is critical that the retail network is able to deliver when the grower is in the field. Strong relationships with suppliers of crop input products and prudent working capital management are crucial to the success of the retail operations.
| NUTRIEN 2018 | 32 | ANNUAL REPORT |
MANAGEMENT'S DISCUSSION AND ANALYSIS
Our Business
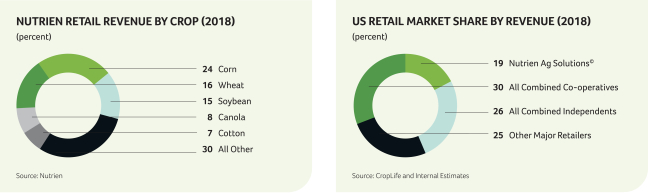
Our Nutrien Ag Solutions© and Landmark© Retail businesses provide complete agricultural solutions, including nutrients, crop protection products, seed, services and agronomic advice to growers. As the world’s largest retail distributor of crop inputs, we operate more than 1,700 Retail facilities across the US, Canada, Australia and key areas of Latin America. Our operations service more than 100 crops globally, with corn, soybeans, wheat and canola being the majority of our business.
We have approximately 3,300 agronomists and field experts working directly with growers, helping them optimize crop yields and maximize economic returns on their farms. Our experts help growers implement sustainable management practices based on a thorough understanding of soils, climate conditions and crop requirements, and utilizing our portfolio of leading products and services.
| Products & Services | Purpose for the Grower | |||||
| Crop Nutrients | Crop nutrients are the essential fertilizers of potash, nitrogen, phosphate, sulfates and micronutrients that allow plants to grow and provide meaningful nutrition to our planet. | |||||
| Crop Protection Products | Crop protection products are a broad spectrum of herbicides, fungicides, insecticides and adjuvants products that help growers minimize yield losses from weeds, diseases and insects. | |||||
| Seed | We provide the seed and seed-related information and analysis our customers require. We sell seed brands from top global suppliers as well as our proprietary seed products that include licensed traits best suited for the grower’s specific geography. | |||||
| Merchandise | Merchandise includes a variety of products in Australia and Canada, including most notably fencing, feed supplements, livestock-related animal health products, storage and irrigation equipment. It also includes the fuel and equipment businesses in Canada. | |||||
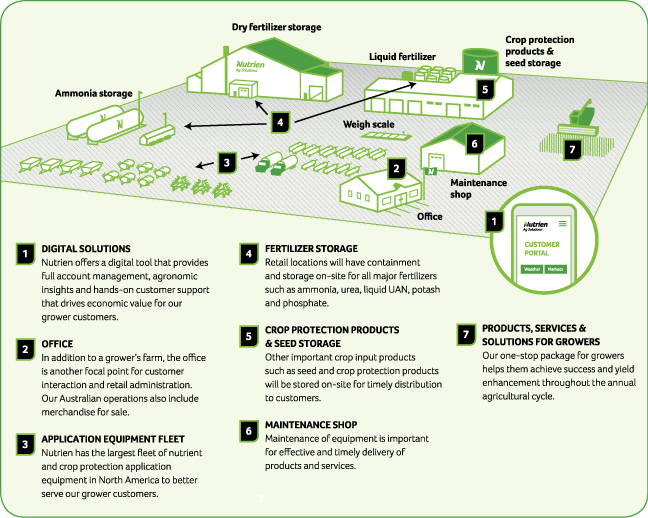
Service and Other | This includes services, such as product application, soil and leaf testing, crop scouting and precision agriculture services under our ECHELON® platform and financial services. We maintain a large fleet of application equipment and other rolling stock to ensure timely and optimal applications of both nutrients and crop protection products in a safe and effective manner for our growers.
| |||||
We also manufacture and sell several advanced proprietary crop protection products and nutritionals under the Loveland Products® brand, seed products under the brand names Dyna-Gro® and Proven™, and animal health products under the Dalgety® brand. These leading crop input and animal health products provide
farmers and ranchers with a portfolio of useful and competitive choices to successfully grow and protect their crops and livestock. The crop protection products also provide meaningfully higher margins than vendor brand offerings as we procure and blend the products at seven formulation facilities across the globe.

| NUTRIEN 2018 | 33 | ANNUAL REPORT |
In 2018, Nutrien Ag Solutions created an award-winning integrated digital platform for customers and our crop consultants to harness technology and help growers achieve the best outcomes on their farms. The customer portal was launched with industry leading tools such as customer account management, weather data, and interpretation and commodity data—all on one digital platform.
In 2019, we will be focused on adding other valuable applications such ase-commerce capabilities, allowing both customers and crop consultants to place online orders for crop protection products. Developing tools for crop planning and digital agronomy will be a key focus, with actionable crop plans and tailored agronomic insights tied to the purchase of specific products and services.
Our digital omni-channel will allow our customers and crop consultants to interact easily and cohesively, while using information and analytics directly tied to a product purchase interface and an account management tool. The value of this customer portal is demonstrated with customers representing over 50 percent of our historical sales now signed up at the end of 2018.
We are also expanding the financial services we offer to our customers through Nutrien Financial™ and ARM™. We are currently in the process of expanding our lending capabilities while minimizing collection risk. This will further support our customers’ annual crop input purchases.
Standard Retail Facility Operations
| NUTRIEN 2018 | 34 | ANNUAL REPORT |
MANAGEMENT'S DISCUSSION AND ANALYSIS
2018 Market Conditions
US/China trade restrictions pressured crop prices while weather issues impacted spring and fall application seasons.
Global grain and oilseed prices were mixed in 2018, influenced primarily by Chinese trade restrictions on US soybeans, broad market volatility from political uncertainty and historically high yields. Robust demand for corn and other grains helped support year-over-year price increases, while soybean prices declined. Farmers in key growing regions continued to plant large crop acreage and make decisions to maximize yields. Due to a strong demand environment, global grain stocks decreased year-over-year, including a 13 percent decline in US stocks. Global and US grainsstocks-to-use is now the lowest since 2014.
North American planting was delayed due to cold and wet weather in the spring, resulting in a condensed application season and a shift in Retail sales into the second quarter. Crop conditions improved through the growing season, supporting above trend yields, increased production and reduced need for crop protection products. With one of the wettest fall seasons in the US in over 100 years, growers applied lower volumes of fall fertilizer and crop protection products.
In 2018, Australia weather was extremely dry with multi-decade low rainfalls. Crop input demand remained relatively strong despite the severe drought conditions.
Market Outlook
We expect increased acreage of input intensive crops such as corn and cotton to support North American crop input expenditure in 2019.
North American grower economics continue to be challenged as a result of the impact of record corn and soybean yields and theUS-China trade dispute on crop prices and demand. However, given current prices and supply/demand fundamentals, we expect two to four million acres of increased US corn and cotton in place of soybeans, which is supportive of fertilizer, seed and crop protection demand.
The poor fall application season is expected to lead to a significant proportion ofpre-plant field work to be done in the spring. We expect this to lead to higher-than-normal spring nitrogen demand, which tends to be particularly supportive to urea and UAN. Potash and phosphate demand is also expected to be supported by the short fall application window and high nutrient removal as a result of record yields.
Globally, weather will be an important factor as dryness is currently prevalent in Brazil, while conditions in Argentina have been relatively favorable. Soybean growers in both countries have benefited from theUS-China trade dispute and higher prices, particularly on a local currency basis. The soil moisture conditions in Australia have improved, but precipitation during the winter crop growing season will be critical to 2019 crop production.
| NUTRIEN 2018 | 35 | ANNUAL REPORT |
Retail Financial Performance
| Dollars (millions) | Gross Margin Dollars (millions) | Gross Margin (percentage) | ||||||||||||||||||||||||||||||||||||||||||||||||||||||||||||||||||
| Nutrien | Nutrien | % | PCS | % | Nutrien | Nutrien | % | PCS | % | Nutrien | Nutrien | PCS | ||||||||||||||||||||||||||||||||||||||||||||||||||||||||
| 2018 | 2017 | Change | 2017 | Change | 2018 | 2017 | Change | 2017 | Change | 2018 | 2017 | 2017 | ||||||||||||||||||||||||||||||||||||||||||||||||||||||||
Sales | ||||||||||||||||||||||||||||||||||||||||||||||||||||||||||||||||||||
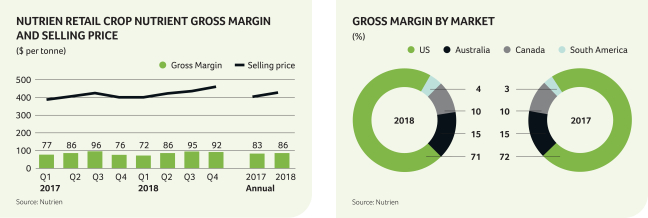
Crop nutrients 1,2 | $ | 4,577 | $ | 4,121 | 11 | $ | – | n/m | $ | 923 | $ | 848 | 9 | $ | – | n/m | 20 | 21 | – | |||||||||||||||||||||||||||||||||||||||||||||||||
Crop protection products | 4,862 | 4,937 | (2 | ) | – | n/m | 1,155 | 1,185 | (3 | ) | – | n/m | 24 | 24 | – | |||||||||||||||||||||||||||||||||||||||||||||||||||||
Seed | 1,687 | 1,628 | 4 | – | n/m | 333 | 325 | 2 | – | n/m | 20 | 20 | – | |||||||||||||||||||||||||||||||||||||||||||||||||||||||
Merchandise | 734 | 683 | 7 | – | n/m | 103 | 106 | (3 | ) | – | n/m | 14 | 16 | – | ||||||||||||||||||||||||||||||||||||||||||||||||||||||
Services and other | 810 | 734 | 10 | – | n/m | 521 | 482 | 8 | – | n/m | 64 | 66 | – | |||||||||||||||||||||||||||||||||||||||||||||||||||||||
| 12,670 | 12,103 | 5 | – | n/m | $ | 3,035 | $ | 2,946 | 3 | $ | – | n/m | ||||||||||||||||||||||||||||||||||||||||||||||||||||||||
Cost of goods sold | (9,635 | ) | (9,157 | ) | 5 | – | n/m |
|
|
| ||||||||||||||||||||||||||||||||||||||||||||||||||||||||||
Gross margin | 3,035 | 2,946 | 3 | – | n/m | |||||||||||||||||||||||||||||||||||||||||||||||||||||||||||||||
Expenses3 | (2,328 | ) | (2,090 | ) | 11 | – | n/m | |||||||||||||||||||||||||||||||||||||||||||||||||||||||||||||
EBIT | 707 | 856 | (17 | ) | – | n/m | ||||||||||||||||||||||||||||||||||||||||||||||||||||||||||||||
Depreciation and amortization | 499 | 289 | 73 | – | n/m | |||||||||||||||||||||||||||||||||||||||||||||||||||||||||||||||
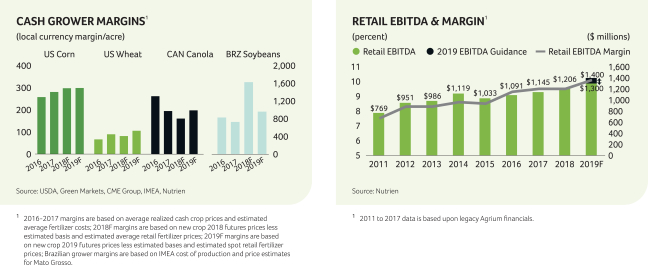
EBITDA | $ | 1,206 | $ | 1,145 | 5 | $ | – | n/m | ||||||||||||||||||||||||||||||||||||||||||||||||||||||||||||
1 Sales tonnes were 10,689,000 tonnes (2017 (Nutrien) – 10,202,000 tonnes), average per tonne prices were $428 (2017 (Nutrien) – $404) and average margin per tonne was $86 (2017 (Nutrien) – $83). 2 Includes intersegment sales. See note 4 to the financial statements. 3 Includes selling expenses of $2,303 million (2017 (Nutrien) – $2,007 million). |
| |||||||||||||||||||||||||||||||||||||||||||||||||||||||||||||||||||
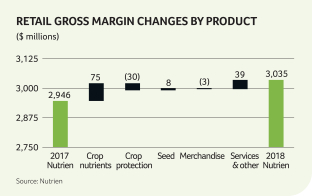
The most significant contributors to the change in EBITDA were as follows (direction of arrows refers to impact on EBITDA and● means no impact):
| 2018 vs 2017 (Nutrien) | 2018 vs 2017 (PotashCorp) | |||||
Sales volumes |  | Crop nutrient volumes were up across all geographic locations with much of the increase coming from Australia and North America acquisitions. | PotashCorp did not have Retail operations prior to the Merger. | |||
|
Crop protection volumes decreased mainly due to adverse weather in North America and Australia. | |||||
|
Strong cotton seed volumes in the US more than offset lower seed volumes in Australia caused by dry weather. | |||||
|
Merchandise sales increased in Canada primarily due to higher fuel sales and in Australia primarily due to increased animal health volumes. | |||||
|
Services and other sales increased primarily due to higher livestock sales and wool commissions in Australia.
| |||||
Sales prices | | Crop nutrients prices were higher in all geographic locations consistent with higher global benchmark prices. | ||||
Gross margin |
| Crop nutrient gross margin was higher primarily due to increased volumes in all geographic locations. Gross margin percentage was flat due to the increase in selling prices being offset by rising costs. | ||||
Selling expenses |
| Expenses were up due to higher depreciation and amortization discussed below and increased payroll from acquisitions. | ||||
| Depreciation and amortization |
● | Expense was higher primarily due to the PPA adjustments as a result of the Merger and from recently acquired businesses. |

| NUTRIEN 2018 | 36 | ANNUAL REPORT |
MANAGEMENT'S DISCUSSION AND ANALYSIS
SELECTED RETAIL FINANCIAL PERFORMANCE MEASURES
Nutrien 2018 | Nutrien 20171 | % Change | PCS 2017 | |||||||||||||||||||
Comparable store sales | 1 | % | 0 | % | n/m | n/a | ||||||||||||||||
Normalized comparable store sales | (1 | %) | 2 | % | n/m | n/a | ||||||||||||||||
Average working capital to sales | 21 | % | 17 | % | 26 | n/a | ||||||||||||||||
Cash operating coverage ratio | 59 | % | 60 | % | (2 | ) | n/a | |||||||||||||||
| 1 | 2017 average working capital to sales and cash operating coverage ratio are from Agrium’s 2017 Annual Report. |
n/a = not available
Normalized comparable store sales decreased due primarily to US and Australia weather-related impacts to fertilizer and crop protection sales volumes more than offsetting sales volume growth in Canada and South America.
| NUTRIEN 2018 | 37 | ANNUAL REPORT |
MANAGEMENT'S DISCUSSION AND ANALYSIS

Potash Operating Environment
Overview
Potassium chloride (KCl), commonly called potash, is mined from ore deposits located deep underground or extracted from specific salt lakes or seas. Potash is sold into the agricultural market primarily as solid granular or standard products. Granular product has a larger and more uniformly shaped particle that can be easily blended with solid nitrogen and phosphate fertilizers; it is typically
used in more advanced agricultural markets such as the US and Brazil. Standard product is more commonly used in major Asian markets.
Potassium plays an important role in the growth and development of plants by improving root and stem strength, water utilization and disease resistance, thereby enhancing taste, color and texture of food.
Competitive Landscape
Potash is found in significant quantity and quality in a limited number of countries. Canada has the largest known global reserves and approximately 35 percent of global production capability. More than 70 percent of the world’s potash capacity is held by the six largest producers. Our primary competitors are located in Belarus, Canada, Germany, Israel, Jordan and Russia.
Most major potash consuming countries in Asia and Latin America have limited or no indigenous production capability and rely on imports to meet their needs. This is an important difference between potash and the other
major crop nutrient businesses. Trade typically accounts for approximately three-quarters of demand for potash, which results in a globally diversified marketplace.
The demand growth rate for potash has outpaced that of other primary nutrients, reaching over 4 percent CAGR between 2013-2018. This growth is driven by the biological requirement of higher yielding crops and improving soil fertility practices, particularly in emerging markets where potash has been historically under-applied and crop yields lag.
Key Success Factors
Securing access to high-quality deposits in a country with both political stability and infrastructure availability can present significant challenges to building new potash capacity. In addition, the extensive time and cost of building greenfield capacity provides a significant
advantage to producers with the capability to expand production from existing facilities.
The most recent greenfield projects are estimated to have a cost of $2,300 to $2,700 per tonne of capacity with a seven-year timeline to commercial production.

| NUTRIEN 2018 | 39 | ANNUAL REPORT |
Our Business
Nutrien is the world’s largest producer of potash with access to decades oflow-cost reserves from our six potash mines in Saskatchewan. We have at least 5 million tonnes of incremental operational capacity that we can bring on with limited capital as global demand grows. We also have the ability to add further brownfield expansions in Saskatchewan that are much lower cost than greenfield expansions. We have the most extensive distribution network in North America, and our investment in Canpotex provideslow-cost marketing and logistics to the approximately 40 international markets we serve.
Nutrien’s potash mines represent some of the lowest cost and highest quality mines in the world. We take great care
to ensure our mines run at optimal levels and to undertake preventative maintenance to minimize safety risk and unscheduled downtime.
In September 2018, Nutrien announced the launch of the Potash Full Potential Program to drive a step change in safety, productivity, lower cost, and increase flexibility across our operations network in Saskatchewan. The program is also establishing the digital operations strategy for Potash and will leverage data, advanced analytics, automation and many other new technologies to accelerate results. We have commenced work at one site and will extend the program across our network through 2021.
Potash Production Process

| NUTRIEN 2018 | 40 | ANNUAL REPORT |
MANAGEMENT'S DISCUSSION AND ANALYSIS
2018 Market Conditions
Robust potash consumption in key consuming regions resulted in the second consecutive year of record global potash demand.
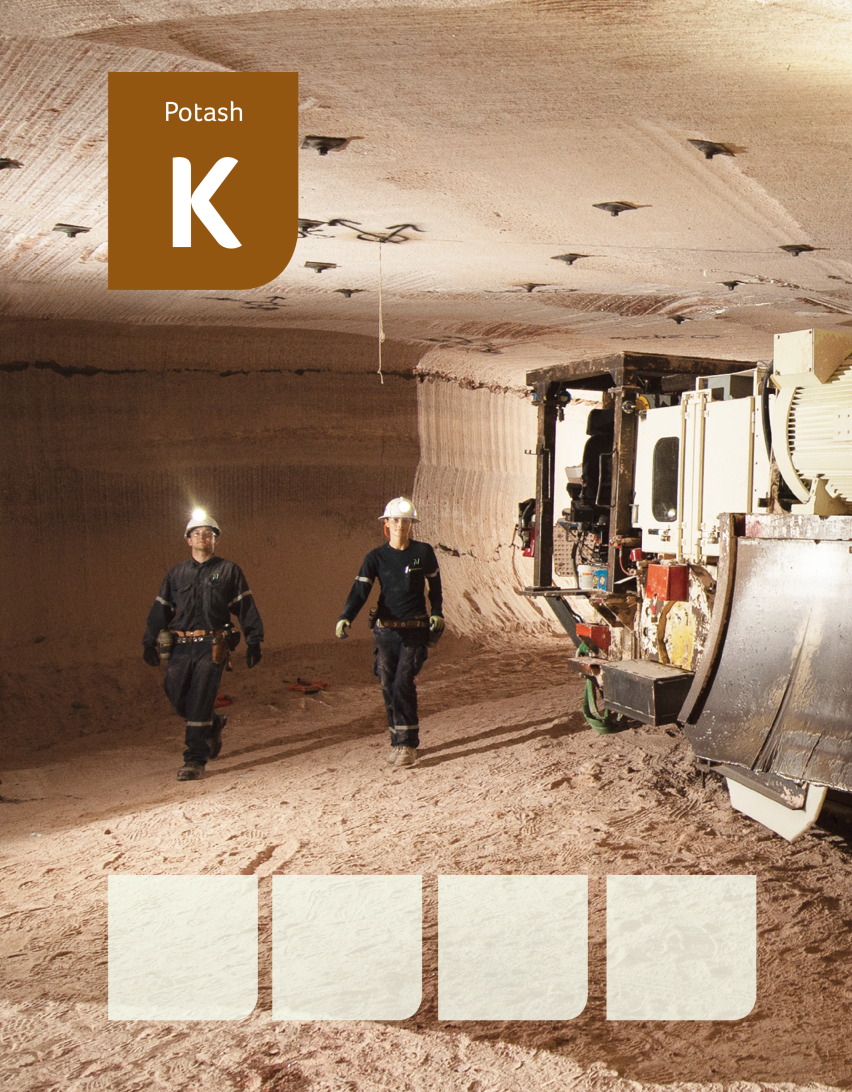
We estimate global potash shipments reached 66.5 million tonnes in 2018, an increase of approximately 1.3 million tonnes from 2017, which represents athree-year CAGR of 3.3 percent and afive-year CAGR of 4.5 percent.
North American and South American growers replenished soil nutrients following record production and elevated yields, while growers in China and Other Asia improved soil fertility practices as a result of increased soil testing and improved agronomic practices. India continues to face political barriers to significantly growing potash demand; however, the agronomic need and willingness of farmers to improve yields persists.
Supply from new projects in Canada and the Former Soviet Union (FSU) region was slow to ramp up with less than 1.4 million tonnes of new potash from greenfield projects being produced in 2018. Limited new supply and strong global demand led toyear-over-year price increases in spot markets of around 20 percent. Potash contracts with customers in China and India were concluded in the second half of 2018 with $60 per tonne and $50 per tonne increases, respectively, reflecting tight market fundamentals and higher spot market prices that existed all year.
Market Outlook
Positive global agricultural developments and lower inventories in key import regions could support another record year of shipments.
Potash market fundamentals remain firm, supported by strong demand growth and tight availability. Canpotex and several other suppliers have all reported they are fully committed through early 2019. While we do expect that product availability from greenfield plants will increase during 2019, this is expected to be partially offset by production curtailments and permanent mine closures from other existing producers.
We continue to observe positive agricultural developments in the standard-grade markets, particularly in China, where there has been a continuous shift to morepotassium-intensive crops like fruits and vegetables. While the fertilizer subsidy policy in India and weaker palm oil economics may pose some near-term risks on demand in these regions, the long-term agronomic need for potash is undeniable.
High nutrient removal in 2018 related to expected record crop yields, combined with potash prices remaining affordable relative to grower revenues, are expected to support continued strong consumption in North American and Latin America. Along with lower inventories in key import regions to begin the year, we anticipate world potash shipments between 67 million to 69 million tonnes in 2019.
| NUTRIEN 2018 | 41 | ANNUAL REPORT |
Potash Financial Performance
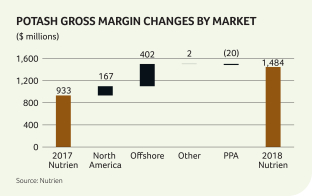
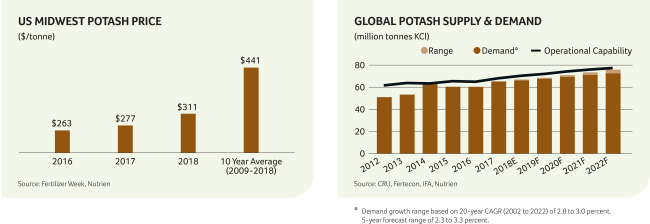
The most significant contributors to the change in EBITDA were as follows (direction of arrows refers to impact on EBITDA and● means no impact):
| 2018 vs 2017 (Nutrien) | 2018 vs 2017 (PotashCorp) | |||||||
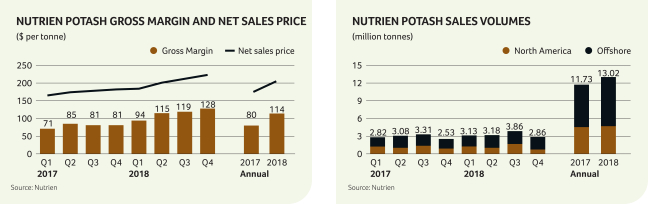
| Volumes | | Offshore volumes were higher due to increased demand and a higher Canpotex allocation.
|  | Offshore volumes were higher due to increased demand and a higher Canpotex allocation.
| ||||
| North America volumes were up primarily due to increased intercompany sales to Retail and lower imports. |
| North America volumes were up primarily due to lower imports. | |||||
|
Volumes were also higher as a result of the Merger, specifically the addition of the Vanscoy Potash mine and intercompany sales to Retail. | |||||||
Net sales prices
| | Selling prices were higher due to increased prices in all major spot markets due to strong demand. |
| Selling prices were higher due to increased prices in all major spot markets due to strong demand.
| ||||
| Cost per tonne |
| Costs decreased due to our portfolio optimization and results from our cost reduction strategy more than offsetting increased depreciation related to PPA adjustments as a result of the Merger. |
| Costs increased due to the addition of Agrium’s operations and higher depreciation on the related PPA adjustments as a result of the Merger. |

| NUTRIEN 2018 | 42 | ANNUAL REPORT |
MANAGEMENT'S DISCUSSION AND ANALYSIS
| 2018 vs 2017 (Nutrien) | 2018 vs 2017 (PotashCorp) | |||||||
| Impairment of property, plant and equipment |
| Anon-cash impairment of property, plant and equipment was recorded as a result of the decision to safely shut down our New Brunswick operations due to the operations no longer being part of our medium or long-term strategic plans. See note 16 to the financial statements. |
| Anon-cash impairment of property, plant and equipment was recorded as a result of the decision to safely shut down our New Brunswick operations due to the operations no longer being part of our medium or long-term strategic plans. See note 16 to the financial statements. | ||||
| Provincial mining and other taxes |
| Under Saskatchewan provincial legislation, we are subject to resource taxes, including the potash production tax and the resource surcharge. Provincial mining and other taxes increased primarily due to stronger potash prices. |
| Provincial mining and other taxes increased primarily due to stronger potash prices. | ||||
| Depreciation and amortization |
● | Expenses were higher due to PPA adjustments as a result of the Merger and increased sales volumes. |
● | Expenses were higher due to the addition of the Vanscoy Potash mine, increased sales volumes and PPA adjustments as a result of the Merger. |
CANPOTEX SALES BY MARKET
| (percentage of sales volumes) | Nutrien 2018 | Nutrien 2017 | % Change | |||||||||||||||||
Latin America | 33 | 30 | 10 | |||||||||||||||||
Other Asian markets 1 | 31 | 33 | (6 | ) | ||||||||||||||||
China | 18 | 18 | – | |||||||||||||||||
India | 10 | 12 | (17 | ) | ||||||||||||||||
Other markets | 8 | 7 | 14 | |||||||||||||||||
| 1 | All Asian markets except China and India. |
POTASH PRODUCTION
Nameplate | Operational Capability 2 | Nutrien Production | ||||||||||||||||||||||||||||||||||
| (million tonnes KCI) | Capacity 1 | 2019 | 2018 | 2018 | 2017 | |||||||||||||||||||||||||||||||
Rocanville Potash | 6.5 | 5.4 | 5.2 | 5.22 | 4.86 | |||||||||||||||||||||||||||||||
Allan Potash | 4.0 | 2.8 | 2.6 | 2.41 | 1.83 | |||||||||||||||||||||||||||||||
Vanscoy Potash | 3.0 | 2.2 | 2.7 | 2.24 | 2.42 | |||||||||||||||||||||||||||||||
Lanigan Potash | 3.8 | 2.1 | 2.0 | 1.96 | 1.82 | |||||||||||||||||||||||||||||||
Cory Potash3 | 3.0 | 1.0 | 0.8 | 0.81 | 0.99 | |||||||||||||||||||||||||||||||
Patience Lake Potash | 0.3 | 0.3 | 0.3 | 0.20 | 0.30 | |||||||||||||||||||||||||||||||
Total | 20.6 | 13.8 | 13.6 | 12.84 | 12.22 | |||||||||||||||||||||||||||||||
| 1 | Represents estimates of capacity as at December 31, 2018. Estimates based on capacity as per design specifications or Canpotex entitlements once determined. In the case of Patience Lake, estimate reflects current operational capability. Estimates for all other facilities do not necessarily represent operational capability. |
| 2 | Estimated annual achievable production level at current staffing and operational readiness (estimated at beginning of year). Estimate does not include inventory-related shutdowns and unplanned downtime. |
| NUTRIEN 2018 | 43 | ANNUAL REPORT |

MANAGEMENT'S DISCUSSION AND ANALYSIS

Nitrogen Operating Environment
Overview
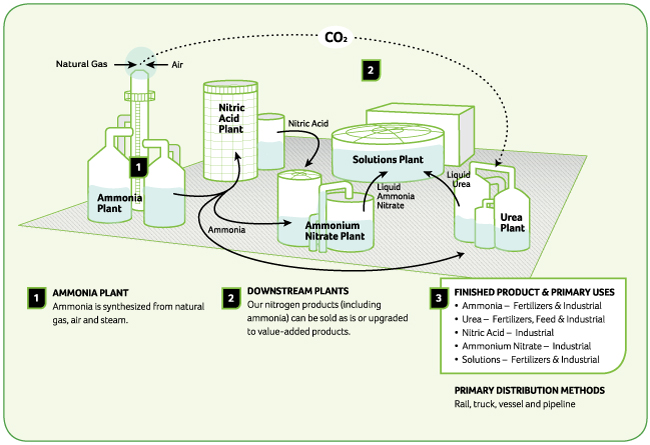
Synthesized from hydrogen sources (primarily natural gas or coal), steam and air, ammonia (NH3) is a concentrated source of nitrogen and the basic feedstock for all upgraded nitrogen products.
Nitrogen is required by every living cell and is a fundamental building block of plant proteins that improve crop yield and quality. Nitrogen is also used in a variety of industrial products such as plastic resins, adhesives and emissions control.
Competitive Landscape
Production of nitrogen is the most geographically diverse of the three primary nutrients due to the widespread availability of hydrogen sources. Ammonia is primarily consumed close to the regions in which it is produced due to the high cost of transportation, whereas urea and nitrogen solutions are more widely transported and traded. We compete with other producers in Canada, the US and a number of offshore suppliers.
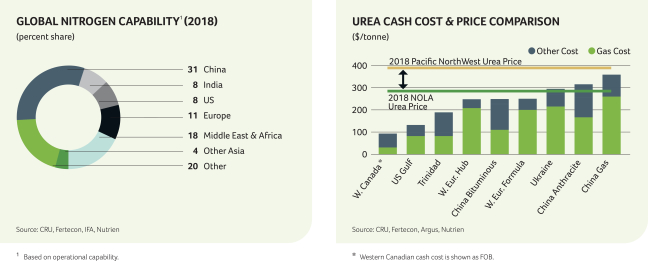
In recent years, a significant amount of new capacity was built in locations with access to low-cost gas, which displacedhigher-cost exports from regions such as China and Europe. The US remains the largest importer of nitrogen and a key driver of global trade despite a significant increase in domestic capacity and production over the past few years.
Key Success Factors
Natural gas can represent up to 60 percent to 80 percent of the cash cost of producing a tonne of ammonia, and alow-cost and reliable source of feedstock is therefore
imperative. Having reliable production assets located in key consuming regions is also advantageous as the risk and cost of transportation is significantly reduced.
| NUTRIEN 2018 | 45 | ANNUAL REPORT |
Our Business
Nutrien has a total of 7.1 million mt of ammonia capacity and the ability to produce and sell more than 11 million tonnes of total nitrogen products. Our asset base is highly flexible, allowing us to optimize product mix and profitability in response to changing market conditions. Our nitrogen plants in Canada and the US have accessto low-cost natural gas and benefit from regional selling advantages. We also operate a large-scale nitrogen facility in Trinidad with gas costs indexed primarily to ammonia prices, providing for greater margin stability and access
to import markets. In 2018, we signed new long-term gas contracts with the Government of Trinidad.
Approximately half of our nitrogen sales are agricultural related and the remaining sold for industrial purposes. A portion of our industrial sales are linked to natural gas costs, reducing variability in margins. We are currently reviewing a number of brownfield growth opportunities across our Nitrogen system that could increase total capacity and our upgraded product capability.
Nitrogen Production Process
| NUTRIEN 2018 | 46 | ANNUAL REPORT |
MANAGEMENT'S DISCUSSION AND ANALYSIS
2018 Market Conditions
Nitrogen prices were supported by limited new supply, production curtailments and higher feedstock prices.
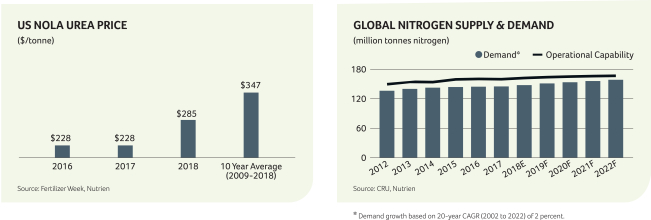
Urea benchmark prices rose 20 to 25 percent in 2018 as export volumes from high-cost producing regions such as China and Europe declined significantly, more than offsetting new capacity additions that have come online over the past few years. Chinese urea exports were 2.4 million tonnes in 2018, down 2.3 million tonnes compared to 2017. Chinese urea production has been pressured by domestic environmental regulation—resulting in shutdowns—as well as higher energy feedstock costs. European nitrogen production costs also supported global prices as domestic natural gas prices increased by between 30 and 40 percent year-over-year.
Ammonia prices reached a two-year high supported by a balanced trade market. Growing ammonia requirements in key importing regions, such as China and Morocco, in addition to lower global export supply, offset the effect of lower import requirements in the US due to increased domestic production.
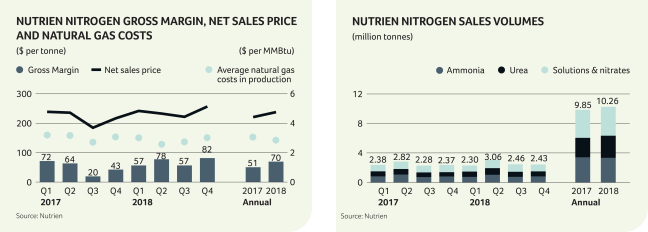
Approximately 70 percent of our nitrogen production is located in North America where natural gas prices remained subdued in 2018 relative to the rest of the world. In 2018, Canadian AECO benchmark gas prices were $1.19/MMBtu and US NYMEX gas prices were $3.09/MMBtu.
Market Outlook
Strong demand and limited supply additions expected to support prices.
We expect that limited urea capacity additions, combined with further closures, will support further tightening of the urea supply/demand balance in 2019. Chinese urea export availability is expected to remain constrained due to the impact of environmental regulations and its relatively high cost inputs, which supports the global floor price for nitrogen. Coal prices have remained relatively stable entering 2019 and Chinese production levels are in line with year ago levels. The US sanctions on Iran also place significant uncertainty around Iran’s urea export potential, which could tighten the global urea market and provide support to urea prices.
The ammonia market entered 2019 under pressure as energy prices have softened and buyers anticipate new supply, but the high-cost positions from European suppliers will continue to establish the floor.
Nitrogen demand is expected to increase by approximately 2 percent in 2019. We expect a two to four million acre increase in US corn and cotton acreage in 2019, which will support robust US nitrogen consumption. Furthermore, we expect the poor fall application season will result in a higher than normal proportion of nitrogen applications in the spring, supporting spring demand, particularly for urea and UAN.
| NUTRIEN 2018 | 47 | ANNUAL REPORT |
Nitrogen Financial Performance
| Dollars (millions) | Tonnes (thousands) | Average per Tonne | ||||||||||||||||||||||||||||||||||||||||||||||||||||||||||||||||||||||||
| Nutrien 2018 | Nutrien 2017 | % Change | PCS 2017 | % Change | Nutrien 2018 | Nutrien 2017 | % Change | PCS 2017 | % Change | Nutrien 2018 | Nutrien 2017 | % Change | PCS 2017 | % Change | ||||||||||||||||||||||||||||||||||||||||||||||||||||||||||||
Manufactured product 1 | ||||||||||||||||||||||||||||||||||||||||||||||||||||||||||||||||||||||||||
Net sales | ||||||||||||||||||||||||||||||||||||||||||||||||||||||||||||||||||||||||||
Ammonia | $ | 903 | $ | 911 | (1 | ) | $ | 584 | 55 | 3,330 | 3,404 | (2 | ) | 2,205 | 51 | $ | 271 | $ | 267 | 1 | $ | 265 | 2 | |||||||||||||||||||||||||||||||||||||||||||||||||||
Urea | 895 | 672 | 33 | 302 | 196 | 3,003 | 2,641 | 14 | 1,166 | 158 | $ | 298 | $ | 254 | 17 | $ | 259 | 15 | ||||||||||||||||||||||||||||||||||||||||||||||||||||||||
Solutions and nitrates | 644 | 594 | 8 | 421 | 53 | 3,925 | 3,808 | 3 | 2,946 | 33 | $ | 164 | $ | 156 | 5 | $ | 143 | 15 | ||||||||||||||||||||||||||||||||||||||||||||||||||||||||
| 2,442 | 2,177 | 12 | 1,307 | 87 | 10,258 | 9,853 | 4 | 6,317 | 62 | $ | 238 | $ | 221 | 8 | $ | 207 | 15 | |||||||||||||||||||||||||||||||||||||||||||||||||||||||||
Cost of goods sold | (1,729 | ) | (1,670 | ) | 4 | (1,066 | ) | 62 | $ | (168 | ) | $ | (170 | ) | (1 | ) | $ | (169 | ) | (1 | ) | |||||||||||||||||||||||||||||||||||||||||||||||||||||
Gross margin | 713 | 507 | 41 | 241 | 196 | $ | 70 | $ | 51 | 37 | $ | 38 | 84 | |||||||||||||||||||||||||||||||||||||||||||||||||||||||||||||
Other2 | 67 | 48 | 40 | 15 | 347 | Depreciation and amortization |
| $ | 42 | $ | 30 | 40 | $ | 32 | 31 | |||||||||||||||||||||||||||||||||||||||||||||||||||||||||||
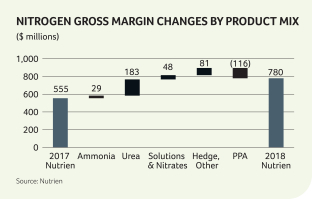
Gross margin | 780 | 555 | 41 | 256 | 205 | Gross margin excluding depreciation and amortization |
| $ | 112 | $ | 81 | 38 | $ | 70 | 60 | |||||||||||||||||||||||||||||||||||||||||||||||||||||||||||
Expenses | (47 | ) | (34 | ) | 38 | (21 | ) | 124 | ||||||||||||||||||||||||||||||||||||||||||||||||||||||||||||||||||
EBIT | 733 | 521 | 41 | 235 | 212 |
|
| |||||||||||||||||||||||||||||||||||||||||||||||||||||||||||||||||||
Depreciation and amortization | 429 | 291 | 47 | 203 | 111 | |||||||||||||||||||||||||||||||||||||||||||||||||||||||||||||||||||||
EBITDA | $ | 1,162 | $ | 812 | 43 | $ | 438 | 165 | ||||||||||||||||||||||||||||||||||||||||||||||||||||||||||||||||||
1 Includes intersegment sales. See note 4 to the financial statements. 2 Includes other nitrogen and purchased products and is comprised of net sales of $417 million (2017 (Nutrien) – $462 million, 2017 (PotashCorp) – $33 million) less cost of goods sold of $350 million (2017 (Nutrien) – $414 million, 2017 (PotashCorp) – $18 million). |
| |||||||||||||||||||||||||||||||||||||||||||||||||||||||||||||||||||||||||
The most significant contributors to the change in EBITDA were as follows (direction of arrows refers to impact on EBITDA and● means no impact):
| 2018 vs 2017 (Nutrien) | 2018 vs 2017 (PotashCorp) | |||||||
Volumes |
| Total sales volumes were up in 2018 due to higher reliability/utilization rates at our facilities, and higher production of upgraded products such as urea and UAN solutions, partly due to the continued ramp up at our Borger urea facility. |
| Volumes increased primarily as a result of the Merger. | ||||
| Ammonia sales volumes were lower due primarily to increased production of upgraded nitrogen products, limiting excess ammonia available for sale. | |||||||
Net sales prices | | Our average price increased for all manufactured product categories, reflecting the impact of higher fertilizer benchmarks supported by tight supply and continued demand growth. |
| Our average price for all manufactured product categories was higher, reflecting the impact of higher fertilizer benchmarks supported by tight supply and continued demand growth. | ||||
| Realized prices in parts of our industrial portfolio (mainly ammonia and nitrates) were lower given lower natural gas prices in Canada. |
| NUTRIEN 2018 | 48 | ANNUAL REPORT |
MANAGEMENT'S DISCUSSION AND ANALYSIS
| 2018 vs 2017 (Nutrien) | 2018 vs 2017 (PotashCorp) | |||||||
Cost per tonne |
| Costs decreased due to lower natural gas costs, higher utilization and from realized synergies, which more than offset higher depreciation and amortization related to PPA adjustments as a result of the Merger. |
| Costs decreased due to lower natural gas costs (discussed below) and higher operating rates more than offsetting higher depreciation and amortization related to PPA adjustments as a result of the Merger. | ||||
| Average natural gas costs, including our hedge position, decreased 7 percent, principally as a result of lower AECO index prices and a reduced realized impact from gas derivatives, partly offset by higher gas costs in Trinidad (contract prices indexed primarily to Tampa ammonia prices). |
| Average natural gas costs, including our hedge position, decreased 17 percent due to the relatively lower-cost gas available at our Alberta facilities acquired in the Merger, partially offset by higher gas costs in Trinidad (contract prices indexed primarily to Tampa ammonia prices). | |||||
| Expenses | ● | There were no significant changes between 2017 and 2018. |
| Expenses were higher in 2018 due to the addition of Agrium’s operations in the Merger. | ||||
Depreciation and amortization |
● | Expense was higher in 2018 due to higher volumes and the PPA adjustments as a result of the Merger. |
● | Expense was higher in 2018 due to higher volumes and the PPA adjustments as a result of the Merger. |
| Sales Tonnes (thousands) | Average Net Sales Price per Tonne | |||||||||||||||||||||||||||||||
Nutrien 2018 | Nutrien 2017 | PCS 2017 | Nutrien 2018 | Nutrien 2017 | PCS 2017 | |||||||||||||||||||||||||||
Fertilizer | 5,340 | 5,093 | 2,564 | $ | 254 | $ | 226 | $ | 215 | |||||||||||||||||||||||
Industrial and feed | 4,918 | 4,760 | 3,753 | $ | 220 | $ | 215 | $ | 201 | |||||||||||||||||||||||
| 10,258 | 9,853 | 6,317 | $ | 238 | $ | 221 | $ | 207 | ||||||||||||||||||||||||
NITROGEN PRODUCTION
| Ammonia1 | Urea2 | |||||||||||||||||||||||||||||||
| Annual Capacity3 | Production | Annual Capacity3 | Production | |||||||||||||||||||||||||||||
| (million tonnes product) | Nutrien 2018 | Nutrien 2017 | Nutrien 2018 | Nutrien 2017 | ||||||||||||||||||||||||||||
Trinidad Nitrogen | 2.2 | 1.88 | 1.94 | 0.7 | 0.58 | 0.55 | ||||||||||||||||||||||||||
Redwater Nitrogen | 0.9 | 0.88 | 0.80 | 0.7 | 0.73 | 0.53 | ||||||||||||||||||||||||||
Augusta Nitrogen | 0.8 | 0.72 | 0.60 | 0.5 | 0.52 | 0.45 | ||||||||||||||||||||||||||
Lima Nitrogen | 0.8 | 0.67 | 0.65 | 0.4 | 0.46 | 0.44 | ||||||||||||||||||||||||||
Carseland Nitrogen | 0.5 | 0.52 | 0.46 | 0.7 | 0.68 | 0.51 | ||||||||||||||||||||||||||
Joffre Nitrogen | 0.5 | 0.47 | 0.31 | – | – | – | ||||||||||||||||||||||||||
Geismar Nitrogen | 0.5 | 0.44 | 0.47 | 0.4 | 0.26 | 0.23 | ||||||||||||||||||||||||||
Fort Saskatchewan Nitrogen | 0.4 | 0.40 | 0.46 | 0.4 | 0.37 | 0.43 | ||||||||||||||||||||||||||
Borger Nitrogen | 0.5 | 0.39 | 0.31 | 0.6 | 0.42 | 0.23 | ||||||||||||||||||||||||||
Total | 7.1 | 6.37 | 6.00 | 4.4 | 4.02 | 3.37 | ||||||||||||||||||||||||||
| 1 | All figures are shown on a gross production basis. |
| 2 | Reflects capacity and production of urea liquor prior to final product upgrade. Urea liquor is used in the production of solid urea, UAN and DEF. |
| 3 | Annual capacity estimates include allowances for normal outages and planned maintenance shutdowns. |
| NUTRIEN 2018 | 49 | ANNUAL REPORT |
MANAGEMENT'S DISCUSSION AND ANALYSIS

Phosphate Operating Environment
Overview
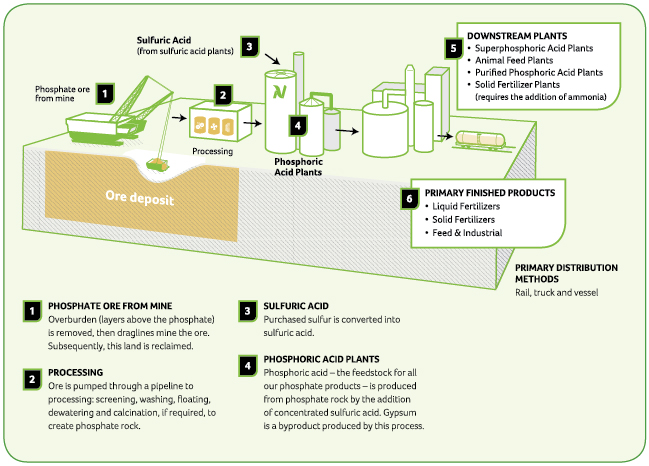
Phosphate rock is mined from underground ore deposits and dissolved in a mixture of phosphoric and sulfuric acids. This results in the production of additional phosphoric acid, which is the feedstock for most fertilizer, industrial and feed phosphate products.
Phosphoric acid can be combined with ammonia and granulated to produce solid fertilizers such as DAP and MAP, evaporated to produce merchant-grade phosphoric acid (MGA), or further evaporated to produce superphosphoric acid (SPA), which is then converted into liquid fertilizer. It is also widely used as an input for animal feed and industrial products.
Competitive Landscape
Phosphate rock is found in significant quantity and quality in only a handful of geographic locations, and few with a progressive ethical and sustainability record.
There are a number of factors that can affect the viability of developing a rock deposit for mining. These include the quality of the deposit, government stability, access to financing, environmental requirements and proximity to target markets. Given the concentration of deposits in North Africa and the Middle East, government stability is
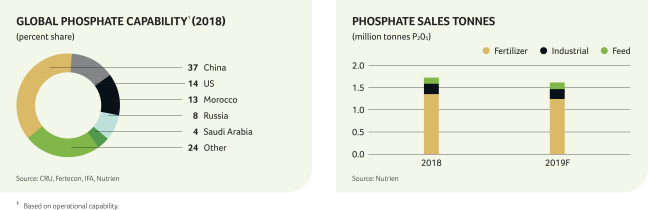
a major factor to consider when evaluating potential phosphate project developments. We compete with producers primarily from China, Morocco, Russia, Saudi Arabia and the US.
Significantlow-cost capacity has been commissioned over the past few years, including most notably in Morocco and Saudi Arabia. This, in turn, has pressured higher-cost supply in China leading to significant production curtailments and industry restructuring.
Key Success Factors
Approximately 70 percent of global phosphate production is integrated with captive sources of phosphate rock, which provides a significantly lower cost of production relative tonon-integrated producers. Access tohigh- quality rock not only provides cost advantages, but also
the ability to produce a more diversified product mix, including feed and industrial products. Having a reliable, lower-cost source of sulfur and ammonia is also a key factor that impacts margins.
| NUTRIEN 2018 | 51 | ANNUAL REPORT |
Our Business
Nutrien has two integrated phosphate facilities in the US, located near key fertilizer consuming markets. Due to the high quality of our rock, we are able to produce a diverse mix of phosphate products, including solid and liquid fertilizers, feed and industrial acids.
We made the decision in 2018 to close our Geismar, LA phosphate facility and repurpose our Redwater, Alberta
facility to double our ammonium sulfate capacity. We plan to increase production at our facilities in North Carolina and Florida to supply finished phosphate product into regions typically served by our Alberta facility. This strategy allowed us to eliminate the purchase of imported phosphate rock by the end of December 2018, while lowering per-tonne costs and maintaining existing sales volumes.
Phosphate Production Process
| NUTRIEN 2018 | 52 | ANNUAL REPORT |
MANAGEMENT'S DISCUSSION AND ANALYSIS
2018 Market Conditions
Production curtailments, delayedramp-up of new projects and strong import demand supported phosphate prices.
Global phosphate fertilizer prices increased more than 20 percent in 2018 as the effect of production curtailments in the US and delayedramp-up of projects in Morocco and Saudi Arabia helped to balance market supply. In addition, Chinese phosphate exports in the first half of 2018 were lower year-over-year due to more stringent environmental regulation. Subsequently, Chinese exports in the second half of 2018 increased as some environmental audits concluded, production rates increased and the ability to export more phosphate returned.
Global import demand for phosphate was strong in 2018 with record import volumes in the US and Brazil and multi-year high import volumes in India. Imports continue to represent a larger share of US supply considering recent domestic closures and curtailments, while demand in Brazil reached record levels due to agricultural expansion and improved agronomic practices. Despite unfavorable government policy and a weakening rupee, demand in India was strong in 2018. Higher raw material costs for ammonia, sulfur and phosphate rock in 2018 pressured Indian production of phosphate fertilizers requiring higher year-over-year imports to meet increasing domestic demand.
Market Outlook
Supplies from major exporters and feedstock costs are key factors to watch.
We expect demand growth for phosphate will match historical trends of 2 percent in 2019, and believe import requirements from India will be significant as its domestic production remains low due to favorable DAP import economics versus domestic DAP production.
New capacity in Morocco and Saudi Arabia is expected to further ramp up in 2019 after delays in 2018. However, the new supply could be largely absorbed by global demand increases, and Chinese export supplies may be constrained due to environmental pressure.
We expect movement in ammonia and sulfur prices to continue to influence phosphate prices in 2019.
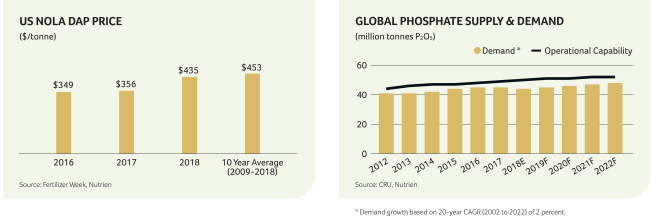
| NUTRIEN 2018 | 53 | ANNUAL REPORT |
Phosphate & Sulfate Financial Performance
| Dollars (millions) | Tonnes (thousands) | Average per Tonne | ||||||||||||||||||||||||||||||||||||||||||||||||||||||||||||||||||||||||||
| Nutrien 2018 | Nutrien 2017 | % Change | PCS 2017 | % Change | Nutrien 2018 | Nutrien 2017 | % Change | PCS 2017 | % Change | Nutrien 2018 | Nutrien 2017 | % Change | PCS 2017 | % Change | ||||||||||||||||||||||||||||||||||||||||||||||||||||||||||||||
Manufactured product 1 | ||||||||||||||||||||||||||||||||||||||||||||||||||||||||||||||||||||||||||||
Net sales | ||||||||||||||||||||||||||||||||||||||||||||||||||||||||||||||||||||||||||||
Fertilizer | $ | 995 | $ | 800 | 24 | $ | 609 | 63 | 2,425 | 2,285 | 6 | 1,809 | 34 | $ | 410 | $ | 350 | 17 | $ | 337 | 22 | |||||||||||||||||||||||||||||||||||||||||||||||||||||||
Industrial and feed | 424 | 423 | – | 494 | (14 | ) | 847 | 868 | (2 | ) | 1,002 | (15 | ) | $ | 500 | $ | 487 | 3 | $ | 493 | 1 | |||||||||||||||||||||||||||||||||||||||||||||||||||||||
Ammonium sulfate | 85 | 81 | 5 | – | n/m | 340 | 345 | (1 | ) | – | n/m | $ | 250 | $ | 235 | 6 | – | n/m | ||||||||||||||||||||||||||||||||||||||||||||||||||||||||||
| 1,504 | 1,304 | 15 | 1,103 | 36 | 3,612 | 3,498 | 3 | 2,811 | 28 | $ | 416 | $ | 373 | 12 | $ | 393 | 6 | |||||||||||||||||||||||||||||||||||||||||||||||||||||||||||
Cost of goods sold | (1,377 | ) | (1,601 | ) 2 | (14 | ) | (1,471 | ) | (6 | ) | $ | (381 | ) | $ | (457 | ) | (17 | ) | $ | (523 | ) | (27 | ) | |||||||||||||||||||||||||||||||||||||||||||||||||||||
Gross margin | 127 | (297 | ) | n/m | (368 | ) | n/m | $ | 35 | $ | (84 | ) | n/m | $ | (130 | ) | n/m | |||||||||||||||||||||||||||||||||||||||||||||||||||||||||||
Other3 | 1 | 5 | (80 | ) | 2 | (50 | ) | Depreciation and amortization | $ | 57 | $ | 68 | (16 | ) | $ | 78 | (27 | ) | ||||||||||||||||||||||||||||||||||||||||||||||||||||||||||
Gross margin | 128 | (292 | ) | n/m | (366 | ) | n/m |
| Gross margin excluding
|
|
|
|
|
|
|
| $ | 92 | $ | (16 | ) | n/m | $ | (52 | ) | n/m | ||||||||||||||||||||||||||||||||||||||||||||||||||
Expenses | (26 | ) | (23 | ) | 13 | (14 | ) | 86 | ||||||||||||||||||||||||||||||||||||||||||||||||||||||||||||||||||||
EBIT | 102 | (315 | ) | n/m | (380 | ) | n/m |
|
|
| ||||||||||||||||||||||||||||||||||||||||||||||||||||||||||||||||||
Depreciation and amortization | 206 | 240 | (14 | ) | 220 | (6 | ) | |||||||||||||||||||||||||||||||||||||||||||||||||||||||||||||||||||||
EBITDA | $ | 308 | $ | (75 | ) | n/m | $ | (160 | ) | n/m | ||||||||||||||||||||||||||||||||||||||||||||||||||||||||||||||||||
1 Includes intersegment sales. See note 4 to the financial statements. 2 Includes a non-cash impairment of property, plant and equipment of $305 million. 3 Includes other phosphate and purchased products and is comprised of net sales of $163 million (2017 (Nutrien) – $53 million, 2017 (PotashCorp) – $8 million) less cost of goods sold of $162 million (2017 (Nutrien) – $48 million, 2017 (PotashCorp) – $6 million). n/m = not meaningful |
| |||||||||||||||||||||||||||||||||||||||||||||||||||||||||||||||||||||||||||
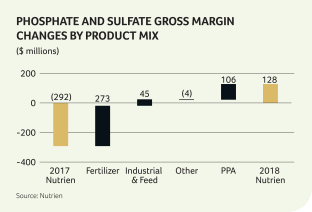
The most significant contributors to the change in EBITDA were as follows (direction of arrows refers to impact on EBITDA and● means no impact):
| 2018 vs 2017 (Nutrien) | 2018 vs 2017 (PotashCorp) | |||||||||
Volumes
|
| Volumes were up due to strong fertilizer demand and increased production levels at our phosphate facilities. |
|
|
| Volumes increased primarily as a result of the Merger. | ||||
|
|
| Industrial volumes decreased primarily due to the decision to close our small phosphate facility at Geismar. | |||||||
Net sales prices |
| Our average realized fertilizer price was up due to strong demand and higher global sulfur benchmark prices. |
|
|
| Our average realized fertilizer price was up due to strong demand and higher global sulfur benchmark prices. | ||||
Cost per tonne |
| Industrial and feed costs were lower in 2018 than in 2017 due to thenon-cash impairment of feed assets at Aurora in 2017. |
|
|
| Industrial and feed costs were lower in 2018 than in 2017 due to thenon-cash impairment of feed assets at Aurora in 2017. | ||||
| Fertilizer costs were lower in 2018 than in 2017 due to thenon-cash impairment of White Springs assets due to sustained negative performance and the write-off of other assets that were no longer used in 2017, more than offsetting higher sulfur costs in 2018. |
|
|
| Fertilizer costs were lower in 2018 than in 2017 due to thenon-cash impairment of White Springs assets due to sustained negative performance and the write-off of other assets that were no longer used in 2017, more than offsetting higher sulfur costs in 2018. | |||||
| NUTRIEN 2018 | 54 | ANNUAL REPORT |
MANAGEMENT'S DISCUSSION AND ANALYSIS
| 2018 vs 2017 (Nutrien) | 2018 vs 2017 (PotashCorp) | |||||||
| Depreciation and amortization |
● | Expense was lower in 2018 primarily due to lower depreciable asset balances at our US facilities as a result of thenon-cash impairments recorded in the latter half of 2017 and the impact of the PPA adjustments as a result of the Merger. The decrease was partially offset by an increase in depreciation at our Redwater facility due to a change in the assets’ estimated useful lives. |
● | Expense was lower in 2018 primarily due to lower depreciable asset balances at our US facilities as a result of thenon-cash impairments recorded in the latter half of 2017 and the impact of the PPA adjustments as a result of the Merger. The decrease was partially offset by an increase in depreciation at our Redwater facility due to a change in the assets’ estimated useful lives. |
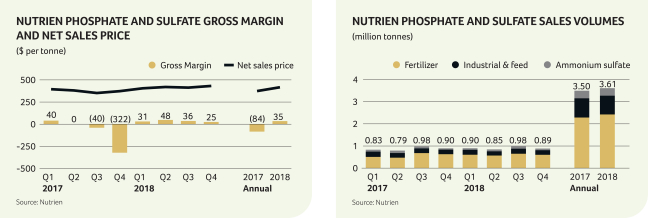
PHOSPHATE PRODUCTION
| Phosphate Rock | Phosphoric Acid (P2O5) | Liquid Products | Solid Fertilizer Products | |||||||||||||||||||||||||||||||||||||||||||||||||||||||||||||||||||||
Annual
| Nutrien Production | Annual
| Nutrien Production | Annual
| Nutrien Production | Annual
| Nutrien Production | |||||||||||||||||||||||||||||||||||||||||||||||||||||||||||||||||
| (million tonnes) | 2018 | 2017 | 2018 | 2017 | 2018 | 2017 | 2018 | 2017 | ||||||||||||||||||||||||||||||||||||||||||||||||||||||||||||||||
Aurora Phosphate | 5.4 | 4.03 | 4.78 | 1.2 | 1.08 | 1.03 | 2.7 | 2 | 2.10 | 2.04 | 0.8 | 0.82 | 0.79 | |||||||||||||||||||||||||||||||||||||||||||||||||||||||||||
White Springs Phosphate | 2.0 | 1 | 1.85 | 1.55 | 0.5 | 0.47 | 0.42 | 0.7 | 3 | 0.62 | 0.57 | 0.8 | 4 | 0.17 | 0.13 | |||||||||||||||||||||||||||||||||||||||||||||||||||||||||
Redwater Phosphate | – | – | – | 0.3 | 0.30 | 0.25 | – | – | – | 0.7 | 0.57 | 0.46 | ||||||||||||||||||||||||||||||||||||||||||||||||||||||||||||
Total | 7.4 | 5.88 | 6.33 | 2.0 | 1.85 | 1.70 | ||||||||||||||||||||||||||||||||||||||||||||||||||||||||||||||||||
| 1 | Revised capacity estimates based on review of mining operations completed in 2017. Prior capacity was 3.6 million tonnes. |
| 2 | A substantial portion is consumed internally in the production of downstream products. The balance is exported to phosphate fertilizer producers or sold domestically to dealers whocustom-mix liquid fertilizer. Capacity comprised of 2.0 million tonnes merchant grade acid and 0.7 million tonnes superphosphoric acid. |
| 3 | Represents annual superphosphoric acid capacity. A substantial portion is consumed internally in the production of downstream products. The balance is exported to phosphate fertilizer producers and sold domestically to dealers whocustom-mix liquid fertilizer. |
| 4 | The second MAP train was restarted at the end of 2018 which added 0.4 million tonnes of annual capacity. |
In addition to the production above, annual capacity (in millions of tonnes) for phosphate feed, ammonium sulfate and purified acid was 0.7, 0.4 and 0.3, respectively. 2018 production was 0.29, 0.36 and 0.23, respectively, and 2017 production was 0.28, 0.31 and 0.23, respectively.
| NUTRIEN 2018 | 55 | ANNUAL REPORT |
Key Risks
We characterize a Key Risk as a risk or combination of risks that could negatively impact the achievement of our vision and ability to deliver on our strategy. We evaluate those risks we believe could have a significant negative effect on safety, health and environment, the Company’s
financial results, or our reputation, taking into consideration mitigation efforts. We consider the following to be Key Risks at this time. For a more detailed discussion of our risks, refer to Nutrien’s 2018 Annual Information Form.

1. Long-Term Agriculture Changes
|
Associated Key Actions
| |
Description | Risk Management Approach | |
Farm and industry consolidation, shifting grower demographics, agriculture productivity and development, changes in consumer food preferences, technological innovation and digital business models, and climate change, among other factors, could impact our strategy, demand for our products or financial performance. | Our integrated platform and diversified earnings portfolio of crop inputs and services are designed to respond and adapt to changes in agriculture. We are proactive in the development and use of new agricultural products and practices and recently launched our integrated digital platform. We believe our teams have strong industry knowledge and direct customer relationships across the value chain, providing unique insights on trends and developments in the agriculture industry. | |

2. Shifting Global Dynamics
|
Associated Key Actions | |
Description | Risk Management Approach | |
| Changes in global macro-economic conditions, including trade tariffs and/or other trade restrictions and increased price competition, or a significant change in agriculture production or consumption trends, could lead to a low crop price environment and reduced demand for our products, or increased prices for, or decreased availability of, raw materials necessary to produce our products. | Our diversified portfolio of agricultural products, services and solutions, combined with our global footprint, is designed to enable us to respond to changing economic conditions and dynamics.
We have a favorable cost-to-service position and flexibility to make operational changes across our portfolio to minimize the impact of changing market dynamics. In addition, we engage in market development, education, training and customer relations initiatives to support demand growth. | |

 Sustainability & Safety Sustainability & Safety |  Drive Integration & Optimization Drive Integration & Optimization |  Strategically Allocate Capital Strategically Allocate Capital |  Invest in Growth & Innovation Invest in Growth & Innovation |  Engage Employees Engage Employees |
| NUTRIEN 2018 | 56 | ANNUAL REPORT |
MANAGEMENT'S DISCUSSION AND ANALYSIS
3. Political, Economic and Social Instability
|
Associated Key Actions | |
Description | Risk Management Approach | |
| Political, economic and social instability may affect our business in the jurisdictions in which we operate. Among other things, restrictions on monetary distributions, forced divestitures or changes to or nullification of existing agreements, mining permits or leases could result. Instability in political or regulatory regimes could also affect our ability to transact business and could impact our sales and operating results, our reputation or the value of our assets. | We have an active engagement strategy with governments, regulators and other stakeholders in the countries where we operate or plan to operate, and we assess our capital investments and project decisions against political, country and other related risk factors to ensure our exposure is controlled. Dedicated teams regularly monitor political, economic, and social developments and global trends that may impact us. | |
4. Changing Regulations
|
Associated Key Actions | |
Description | Risk Management Approach | |
| Changing laws, regulations and government policies affecting our operations, including health and safety, environmental and climate change pressures, could affect our ability to produce or sell certain products, reduce efficiency, increase our raw material, energy, transportation or compliance costs, or require us to make capital improvements to our operations, all of which could impact our financial performance or reputation. | We have an active engagement strategy with governments and regulators to stay informed of emerging issues and participate in regulatory developments affecting our business. We are also active members in various industry associations that address proposed changes to laws and regulations impacting the agriculture industry. Where regulations are subject to change, we evaluate the potential implications and strive to adapt as necessary. | |
5. Cybersecurity Threats
|
Associated Key Actions | |
Description | Risk Management Approach | |
Cyberattacks or breaches of our systems, including our digital platform or exposure to potential computer viruses, could lead to disruptions to our operations, loss of data, or the unintended disclosure of confidential information or property damage resulting in business disruptions, reputational damage, personal injury, and third-party claims, which could impact our operations, financial performance or reputation. | We maintain an enhanced focus on cybersecurity, including continuous monitoring of key systems for abnormal and elevated risk behavior in conjunction with our cybersecurity strategy, policy and framework.
Threat and risk assessments are completed for all new information technology systems, and our cybersecurity incident response processes are backstopped by external response capability. | |


6. Capital Allocation
|
Associated Key Actions | |
Description | Risk Management Approach | |
Our inability to deploy capital or to effectively execute on opportunities, whether due to market conditions, lack of options or otherwise, or our decisions to deploy capital in a manner that is inconsistent with strategic priorities, could impact our returns, operations, reputation or access to capital. | We allocate capital in a disciplined manner that is consistent with our strategic priorities focused on creating the greatest long-term value while ensuring sufficient capital is allocated to safety and asset preservation. We employ a governance process for all capital allocation decisions and incorporate risk-related factors, including execution risk, in those decisions.
See page 23 of this report for more information on our capital allocation priorities. | |

| Sustainability & Safety | Drive Integration & Optimization | Strategically Allocate Capital | Invest in Growth & Innovation | Engage Employees |
| NUTRIEN 2018 | 57 | ANNUAL REPORT |
7. Talent and Organizational Structure
|
Associated Key Actions | |
Description | Risk Management Approach | |
An inability to attract, develop, or retain skilled employees, or establish the right organizational structure or culture, could impact productivity, reliability, safety performance, costs or our reputation. | We strategically map critical talent in anticipation of future needs, seeking to hire talent at the right time and with the right fit for our culture and purpose. Our succession planning proactively identifies critical roles in the organization and links to internal top talent. Our incentive programs are competitive and support our purpose driven culture with performance expectations encouraging inclusion and a desire to add greater diversity to our workforce.
See page 26 of this report for Nutrien’s People Strategy. | |
8. Retail Business Model
|
Associated Key Actions | |
Description | Risk Management Approach | |
Digital innovations, increasing research and development activity and new technology in the agriculture market, among other factors, could alter the competitive environment, which could impact our Retail operations and financial performance. | Our full-service offering and investment in technology, including our integrated digital platform, is intended to position our Retail business as a leader in agricultural solutions for growers. We are actively involved in the ag technology innovation space through external investments and partnerships, which supports access to early stage technology. Further, we seek to maintain strong relationships with industry partners, positioning Nutrien Ag Solutions as a key part of the ag value chain for both suppliers and growers.
Our dedicatedin-house product innovation teams continue to invest in enhancing our digital platform ande-commerce capabilities through focused research and development and acquisition.
See page 25 of this report for more information on innovation. | |


| Sustainability & Safety | Drive Integration & Optimization | Strategically Allocate Capital | Invest in Growth & Innovation | Engage Employees |
| NUTRIEN 2018 | 58 | ANNUAL REPORT |
| Dollars (millions) unless otherwise noted | Nutrien 2018 | Nutrien 2017 | PCS 2017 | PCS 2016 | ||||||||||||||||||||
Sales | $ | 19,636 | $ | 18,169 | $ | 4,547 | $ | 4,456 | ||||||||||||||||
Net (loss) earnings from continuing operations | (31 | ) | 656 | 154 | 199 | |||||||||||||||||||
Basic net (loss) earnings per share from continuing operations | (0.05 | ) | n/a | 0.18 | 0.24 | |||||||||||||||||||
Diluted net (loss) earnings per share from continuing operations | (0.05 | ) | n/a | 0.18 | 0.24 | |||||||||||||||||||
Net earnings from continuing and discontinued operations | 3,573 | n/a | 327 | 323 | ||||||||||||||||||||
Basic net earnings per share from continuing and discontinued operations | 5.72 | n/a | 0.39 | 0.39 | ||||||||||||||||||||
Diluted net earnings per share from continuing and discontinued operations | 5.72 | n/a | 0.39 | 0.38 | ||||||||||||||||||||
Total assets | 45,502 | 34,940 | 16,998 | 17,255 | ||||||||||||||||||||
Totalnon-current financial liabilities | 7,616 | n/a | 3,746 | 3,763 | ||||||||||||||||||||
Dividends declared per share | 2.06 | n/a | 0.40 | 0.70 | ||||||||||||||||||||
n/a = Information was not prepared on a combined historical basis.
| 2018 vs 2017 (Nutrien) | 2018 vs 2017 (PotashCorp) | 2017 vs 2016 (PotashCorp) | ||||
Sales | Sales increased due to higher potash, urea and phosphate fertilizer prices, as well as higher potash sales volumes and increased retail sales due to recent acquisitions. | Sales increased primarily due to the addition of Agrium’s operations in the Merger. Sales also increased due to Retail acquisitions, higher potash sales volumes and increases in potash, urea and phosphate fertilizer prices. | Sales increased slightly due to increases in potash sales volumes and net sales prices being partially offset by decreases in nitrogen and phosphate net sales prices. | |||
| Earnings and earnings per share from continuing operations | There was a loss from continuing operations in 2018 compared to earnings in 2017 primarily due to anon-cash impairment of property, plant and equipment in the Potash segment of $1,809 million in 2018 more than offsetting the impact of higher gross margin in all operating segments. | There was a loss from continuing operations in 2018 compared to earnings in 2017 primarily due to anon-cash impairment of property, plant and equipment in the Potash segment of $1,809 million in 2018 more than offsetting the impact of the addition of Agrium’s operations in the Merger and higher gross margin in all operating segments. | Net earnings from continuing operations (and related per share amounts) decreased slightly due to increasednon-cash impairments of property, plant and equipment and increased Merger and related costs, which were partially offset by an income tax recovery in 2017 compared to income tax expense in 2016. | |||
| Earnings and earnings per share from continuing and discontinued operations | 2017 information was not prepared on a combined historical basis. | Net earnings, and the related per share amounts, were higher in 2018 due to the gains on sale of our investments presented as discontinued operations, the addition of Agrium’s operations in the Merger and higher gross margin in all operating segments more than offsetting thenon-cash impairment of property, plant and equipment in the Potash segment. | Net earnings (and related per share amounts) were flat due to the decrease in net earnings from continuing operations being offset by an increase in earnings from discontinued operations consisting primarily of the earnings of equity-accounted investees SQM and APC. | |||
| Assets andnon-current financial liabilities | Assets increased primarily due to the fair value adjustments to legacy Agrium assets as a result of the PPA in the Merger. Combined historicalnon-current financial liability information was not prepared. | Assets and financial liabilities increased primarily due to the addition of Agrium’s assets and liabilities, including related PPA adjustments, acquired in the Merger. | There were no significant changes. |
| NUTRIEN 2018 | 60 | ANNUAL REPORT |
MANAGEMENT'S DISCUSSION AND ANALYSIS
Nutrien 2018 EBITDA Compared to Nutrien 2017 EBITDA
Dollars (millions) except per share amounts, excluding depreciation and amortization | EBITDA | Changes in EBITDA | Earnings per share impact | |||||||||||||
EBITDA December 31, 2017 | $ | 2,412 | ||||||||||||||
RETAIL | ||||||||||||||||
Increases in Retail selling expenses |
|
|
| $ | (86 | ) | $ | (0.10 | ) | |||||||
Increase in Retail crop nutrient gross margin |
|
|
| 75 | 0.09 | |||||||||||
POTASH | ||||||||||||||||
Non-cash impairment of property, plant and equipment in Potash in 2018 |
|
|
| (1,809 | ) | (2.11 | ) | |||||||||
Increases in Potash prices |
|
|
| 389 | 0.45 | |||||||||||
Increases in Potash sales volumes |
|
|
| 110 | 0.13 | |||||||||||
Decreases in Potash cost of goods sold (COGS) |
|
|
| 109 | 0.13 | |||||||||||
Increase in Potash provincial mining and other taxes |
|
|
| (85 | ) | (0.10 | ) | |||||||||
NITROGEN | ||||||||||||||||
Increases in Nitrogen prices |
|
|
| 181 | 0.22 | |||||||||||
Decreases in Nitrogen COGS |
|
|
| 143 | 0.18 | |||||||||||
PHOSPHATE AND SULFATE | ||||||||||||||||
Decreases in Phosphate and Sulfate COGS due primarily to the 2017 non-cash impairment 1 |
|
|
| 228 | 0.28 | |||||||||||
Increases in Phosphate and Sulfate prices |
|
|
| 156 | 0.19 | |||||||||||
OTHERS | ||||||||||||||||
Decreases in Others segment other income due primarily to the defined benefit plans curtailment gain |
|
|
| 151 | 0.19 | |||||||||||
ALL OTHER CHANGES | ||||||||||||||||
Other changes |
|
|
| 32 | 0.04 | |||||||||||
EBITDA December 31, 2018 | $ 2,006 | |||||||||||||||
| 1 | Includes a non-cash impairment of property, plant and equipment of $305 million. See note 16 to the financial statements. |
| NUTRIEN 2018 | 61 | ANNUAL REPORT |
2019 Guidance
| 2019 Guidance Ranges | ||||||||
| Dollars (billions) unless otherwise noted | Low | High | ||||||
Adjusted net earnings per share1 | $ | 2.80 | $ | 3.20 | ||||
Adjusted EBITDA 1 | $ | 4.4 | $ | 4.9 | ||||
Retail EBITDA | $ | 1.3 | $ | 1.4 | ||||
Potash EBITDA | $ | 1.8 | $ | 2.0 | ||||
Nitrogen EBITDA | $ | 1.3 | $ | 1.5 | ||||
Phosphate EBITDA | $ | 0.2 | $ | 0.3 | ||||
Potash sales tonnes (millions)2 | 13.0 | 13.4 | ||||||
Nitrogen sales tonnes (millions)2 | 10.6 | 11.0 | ||||||
Depreciation and amortization | $ | 1.8 | $ | 1.9 | ||||
Integration and synergy costs (millions) | $ | 50 | $ | 75 | ||||
Effective tax rate on continuing operations | 24% | 26% | ||||||
Sustaining capital expenditures | $ | 1.0 | $ | 1.1 | ||||
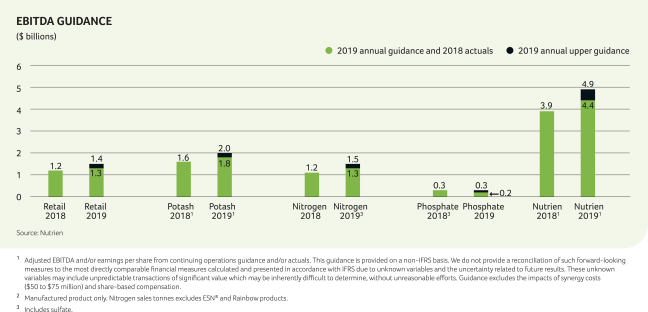
2019 Sensitivities
| Price and Volume Sensitivities | Effect on EPS | |||||
Price | Potash changes by $20/tonne | $ | 0.26 | |||
| Ammonia changes by $20/tonne | 0.05 | |||||
| Urea changes by $20/tonne | 0.08 | |||||
| DAP/MAP changes by $20/tonne | 0.04 | |||||
Volume | Potash changes by 100,000 tonnes | 0.03 | ||||
| Nitrogen changes by 50,000 N tonnes | 0.02 | |||||
Phosphate changes by 50,000 P2O5 tonnes | 0.02 | |||||
Retail | Crop nutrients changes by 1%1 | 0.07 | ||||
| Crop protection changes by 1%1 | 0.07 | |||||
| Seed changes by 1%1 | 0.02 | |||||
| 1 | Gross margin as a percentage of sales. |
| Input Cost Sensitivities | Effect on EPS | |||||
NYMEX natural gas price increases by $1/MMBTu
| Nitrogen | $ | (0.20 | ) | ||
| Potash | (0.01 | ) | ||||
Canadian to US dollar strengthens by $0.02 | Canadian operating expenses excluding provincial taxes and translation gain/loss | (0.02 | ) | |||
| NUTRIEN 2018 | 62 | ANNUAL REPORT |
MANAGEMENT'S DISCUSSION AND ANALYSIS
Others Segment Financial Performance
“Others” is anon-operating segment comprising corporate and administrative functions that provide support and governance to our operating business units. No sales are made in this segment.
| Nutrien | Nutrien | % | PCS1 | % | ||||||||||||||||||||||||
| Dollars (millions), except percentage amounts | 2018 | 2017 | Change | 2017 | Change | |||||||||||||||||||||||
Selling expenses | $ | 22 | $ | 15 | 47 | $ | (2 | ) | n/m | |||||||||||||||||||
General and administrative expenses | (400 | ) | (377 | ) | 6 | (170 | ) | 135 | ||||||||||||||||||||
Provincial mining and other taxes | (2 | ) | – | n/m | – | n/m | ||||||||||||||||||||||
Other expenses | (106 | ) | (256 | ) | (59 | ) | (99 | ) | 7 | |||||||||||||||||||
Loss before finance costs and income taxes | (486 | ) | (618 | ) | (21 | ) | (271 | ) | 79 | |||||||||||||||||||
Depreciation and amortization | 54 | 56 | (4 | ) | 37 | 46 | ||||||||||||||||||||||
EBITDA | $ | (432 | ) | $ | (562 | ) | (23 | ) | $ | (234 | ) | 85 | ||||||||||||||||
| 1 | Certain amounts have been reclassified to conform to the current period’s presentation as described in note 33 to the financial statements. |
| n/m | = not meaningful |
| 2018 vs 2017 (Nutrien) | 2018 vs 2017 (PotashCorp) | |||
EBITDA | EBITDA increased primarily due to the impact of the defined benefit plans curtailment gain included in other expenses (see note 28 to the financial statements). | EBITDA decreased primarily due to the addition of Agrium’s operations more than offsetting the impact of a defined benefit plans curtailment gain in other expenses (see note 28 to the financial statements). |
Expenses & Income Below Gross Margin
| Nutrien | Nutrien | % | PCS1 | % | ||||||||||||||||||||||||
| Dollars (millions), except percentage amounts | 2018 | 2017 | Change | 2017 | Change | |||||||||||||||||||||||
Selling expenses2 | $ | (2,337 | ) | $ | (2,043 | ) | 14 | $ | (29 | ) | n/m | |||||||||||||||||
General and administrative expenses3 | (539 | ) | (503 | ) | 7 | (185 | ) | 191 | ||||||||||||||||||||
Provincial mining and other taxes4 | (250 | ) | (159 | ) | 57 | (146 | ) | 71 | ||||||||||||||||||||
Impairment of property, plant and equipment5 | (1,809 | ) | – | n/m | – | n/m | ||||||||||||||||||||||
Other expenses | (43 | ) | (255 | ) | (83 | ) | (125 | ) | (66 | ) | ||||||||||||||||||
Finance costs | (538 | ) | (515 | ) | 4 | (238 | ) | 126 | ||||||||||||||||||||
Income tax recovery (expense) | 93 | (20 | ) | n/m | 183 | (49 | ) | |||||||||||||||||||||
Net earnings from discontinued operations | 3,604 | n/a | n/m | 173 | n/m | |||||||||||||||||||||||
| 1 | Certain amounts have been reclassified to conform to the current period’s presentation as described in note 33 to the financial statements. |
| 2 | Expenses are primarily in the Retail segment. See page 36 for analysis. |
| 3 | Expenses are primarily in the Others segment. See above for analysis. |
| 4 | Expenses are primarily in the Potash segment. See page 43 for analysis. |
| 5 | Impairment was in the Potash segment. See page 43 for analysis. |
| n/m | = not meaningful |
| n/a | = not available |
| NUTRIEN 2018 | 63 | ANNUAL REPORT |
The most significant contributors to the change in expenses and income below gross margin results were as follows:
| 2018 vs 2017 (Nutrien) | 2018 vs 2017 (PotashCorp) | |||
Other (Expenses) Income | Other expenses decreased primarily due to a defined benefit plans curtailment gain (see note 28 to the financial statements) in 2018 (none in 2017) and foreign exchange gains in 2018 (losses in 2017). | Other expenses decreased as a defined benefit plans curtailment gain (see note 28 to the financial statements) in 2018 (none in 2017) more than offset the increase in Merger and related costs. | ||
| There were no significant changes to finance costs. | Finance costs increased primarily as a result of the Merger. See note 8 to the financial statements for a breakdown of these costs. |
Finance Costs |
WEIGHTED AVERAGE DEBT BALANCES & RATES
| |||||||||||||
| Dollars (millions), except percentage amounts | Nutrien 2018 | Nutrien 2017 | PCS 2017 | |||||||||||
Short-term balance 1 | $ | 2,933 | $ | 1,525 | $ | 381 | ||||||||
Short-term rate1,2 | 3.3% | 2.4% | 1.3% | |||||||||||
Long-term balance | $ | 8,175 | $ | 8,641 | $ | 4,229 | ||||||||
Long-term rate | 4.8% | 4.7% | 4.7% | |||||||||||
| 1 | North American weighted average short-term debt balances were $2,719 (2017 (Nutrien) – $1,345, 2017 (PotashCorp) – $381) and rates were 2.5% (2017 (Nutrien) – 1.5%, 2017 (PotashCorp) – 1.3%). |
| 2 | Rates were higher in 2018 due to increases in benchmark interest rates. |
| Income Tax Recovery (Expense) | A loss from continuing operations was realized for accounting purposes in 2018 compared to earnings from continuing operations in 2017. As a result, a tax recovery was recorded in 2018 compared to a tax expense in 2017. The 2017 tax expense included a net discrete recovery of $178 as a result of a federal income tax rate decrease pursuant to US tax reform legislation.
See note 9 to the financial statements for further information on income tax recovery (expense). | A loss from continuing operations was realized for accounting purposes in 2018 and 2017. The 2017 tax recovery included a discrete recovery of $187 as a result of a federal income tax rate decrease pursuant to US tax reform legislation.
See note 9 to the financial statements for further information on income tax recovery (expense). |
EFFECTIVE TAX RATES & DISCRETE ITEMS
|
| |||||||||||
| Dollars (millions), except percentage amounts | Nutrien 2018 | Nutrien 2017 1 | PCS 2017 1 | |||||||||
Actual effective tax rate on ordinary earnings | 72% | 29% | (7)% | |||||||||
Actual effective tax rate including discrete items | 75% | 3% | n/m | |||||||||
Discrete tax adjustments that impacted the rate | $ | 4 | $ 176 | $ | 185 | |||||||
| 1 | Rates have been adjusted as a result of our equity interests in SQM, APC and ICL being classified as discontinued in 2017. |
| n/m | = not meaningful |
Net Earnings From Discontinued Operations | Combined historical Nutrien information was not prepared for discontinued operations. | Net earnings from discontinued operations were higher in 2018 primarily due to the gains on sale of our equity investments in SQM and APC, and dividends from SQM and APC, exceeding the equity earnings and dividend income from these investments in 2017 (equity accounting for these investments ceased when the investments were classified as held for sale). This was partially offset by an increase in income tax expense. |
Other Comprehensive (Loss) Income
Other comprehensive (loss) income in 2018 was a $302 million loss compared to $176 million income for 2017 Nutrien and $96 million income for 2017 PotashCorp due primarily to a loss on translation of our net operations in Canada and Australia (gain for 2017 Nutrien) and a fair value loss on our investment in Sinofert (Gain for 2017 Nutrien and 2017 PotashCorp).
| NUTRIEN 2018 | 64 | ANNUAL REPORT |
MANAGEMENT'S DISCUSSION AND ANALYSIS
Balance Sheet Analysis
The most significant contributors to the changes in our balance sheet are analyzed below (direction of arrows refers to increase or decrease in financial condition and● means no impact). All impacts for balance sheet line items are after the opening balance sheet impacts of the Merger, which includes fair value adjustments in relation to the Merger (if any).
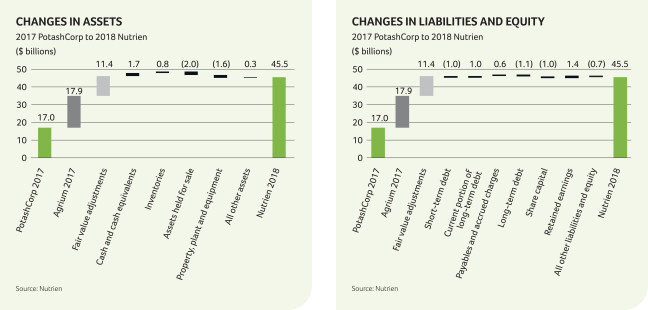
Total assets and liabilities increased primarily as a result of the Merger and fair value adjustments described in note 3 to the financial statements. Total equity increased primarily as a result of the issuance of Nutrien shares in the Merger. The analysis below explains the further changes after these adjustments.
| Assets | Liabilities | |||||||||||||
| For information regarding changes in cash and cash equivalents, refer to the “Sources and Uses of Cash” section on page 67 and the consolidated statements of cash flows in our financial statements. |
| Short-term debt decreased due to repayments upon receipt of cash proceeds from the sale of our held for sale equity investments.
Current portion of long-term debt increased and long-term debt decreased due to the 6.75 percent notes due January 15, 2019 and 6.5 percent notes due May 15, 2019 becoming due within one year. | |||||||||||
|
Inventory increased primarily due to lower than expected Retail crop protection sales caused by adverse weather in North America and earlier than average seasonal inventory purchases in Retail. | ●
| ||||||||||||
|
Assets held for sale were lower due to the sale of our equity interests in SQM, APC and ICL as discussed in note 10 to the financial statements. |
| Payables and accrued charges increased due to a higher dividend payable, accelerated seasonal Retail inventory purchases, higher customer prepayments and the timing of cash payments. | |||||||||||
|
Property, plant and equipment were primarily impacted by anon-cash impairment loss relating to our New Brunswick Potash operations as described in note 16 to the financial statements. | |||||||||||||
| Equity | ||||||||||||||
| Share capital was reduced by share repurchases.
| |||||||||||||
| Retained earnings was higher primarily as a result of net earnings exceeding the impact of share repurchases and dividends declared. | |||||||||||||
As at December 31, 2018, $NIL (December 31, 2017 (Nutrien) – $104 million, (PotashCorp) – $104 million) of our cash and cash equivalents was held in certain foreign subsidiaries that could be subject to taxes upon repatriation.
| NUTRIEN 2018 | 65 | ANNUAL REPORT |
Sources & Uses of Liquidity
Liquidity risk arises from our general funding needs and in the management of our assets, liabilities and capital structure. We manage liquidity risk to maintain sufficient liquid financial resources to fund our financial position and meet our commitments and obligations in a cost-effective manner. Our 2018 significant liquidity sources are listed below along with our expected ongoing primary uses of liquidity. Proceeds from the sale of investments are not expected to be a significant liquidity source in 2019 now that the required Merger-related divestitures have been completed.
Liquidity sources:
| Primary uses:
| |
• Cash from operations | • Operational expenses | |
• Investments sale proceeds 1 | • Seasonal working capital requirements | |
• Commercial paper issuances | • Sustaining and investing capital2 | |
• Credit facility drawdowns | • Business acquisitions and investments3 | |
• Accounts receivable securitization borrowings | • Dividends4 and interest | |
• Debt capital markets | • Debt securities principal payments | |
• Share repurchases5 |
| 1 | In 2018, we closed sales on our equity interests in SQM, ICL and APC for net proceeds of approximately $5.3 billion. |
| 2 | See graph below for forecast 2019 and actual 2018 capital expenditures to sustain operations and for investing (excluding business acquisitions and investments in equity-accounted investees). Amounts are based on a forecast exchange rate of 1.32 Canadian Dollars per US Dollar. |
| 3 | In 2018, we acquired 53 retail locations in North America and Australia, in addition to companies operating within the digital agriculture, proprietary products and agricultural services businesses (note 3 and note 21 to the financial statements). On February 5, 2019, we announced the planned acquisition of Actagro, LLC, a developer, manufacturer and marketer of environmentally sustainable soil and plant health products and technologies for approximately $340 million. Closing of the transaction is subject to US regulatory approval and is expected to be completed in the first half of 2019. |
| 4 | We target a stable and growing dividend that represents 40 to 60 percent of free cash flow after sustaining capital through the agricultural cycle. In November 2018, we increased our dividend from $0.40 per share to $0.43 per share. |
| 5 | During 2018, 36,332,197 common shares were repurchased for cancellation at a cost of $1,852 million with an average price per share of $50.97. In the fourth quarter of 2018, the Board of Directors approved an increase to the existing share repurchase program, raising the maximum number of shares that can be repurchased by February 22, 2019 to 50,363,686 common shares, representing approximately 8% of our outstanding common shares. On February 20, 2019, the Board of Directors approved the renewal of the share repurchase program of up to 5 percent of our outstanding common shares over a one-year period through a normal course issuer bid. As of February 20, 2019, an additional 5,933,135 common shares were repurchased at a cost of $297 million and an average price per share of $50.10. |
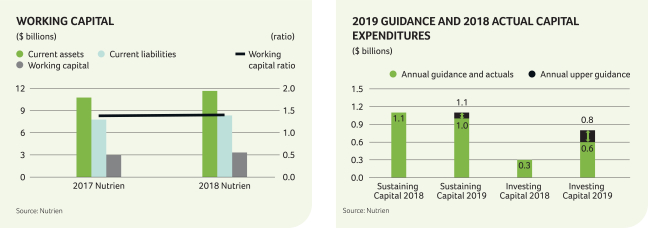
We believe that internally generated cash flow, supplemented by available borrowings under our existing financing sources, if necessary, will be sufficient to meet our anticipated capital expenditures and other cash requirements for at least the next 12 months. At this time, we do not reasonably expect any presently known trend or uncertainty to affect our ability to access our historical sources of liquidity. We had positive working capital of $3.33 billion and a working capital ratio of 1.40 at December 31, 2018 and an adjusted net debt to adjusted EBITDA ratio of 1.64.
| NUTRIEN 2018 | 66 | ANNUAL REPORT |
MANAGEMENT'S DISCUSSION AND ANALYSIS
Sources and Uses of Cash
Our cash flows from operating, investing and financing activities are summarized in the following table:
| Dollars (millions), except percentage amounts | Nutrien 2018 | Nutrien 2017 | % Change | PCS 2017 | % Change | |||||||||||||||||||||||
Cash provided by operating activities | $ | 2,052 | $ | 2,568 | (20 | ) | $ | 1,225 | 68 | |||||||||||||||||||
Cash provided by (used in) investing activities | 3,887 | (1,594 | ) | n/m | (652 | ) | n/m | |||||||||||||||||||||
Cash used in financing activities | (3,705 | ) | (824 | ) | 350 | (489 | ) | 658 | ||||||||||||||||||||
Effect of exchange rate changes on cash and cash equivalents | (36 | ) | (12 | ) | 200 | – | n/m | |||||||||||||||||||||
Increase in cash and cash equivalents | $ | 2,198 | $ | 138 | n/m | $ | 84 | n/m | ||||||||||||||||||||
n/m = not meaningful
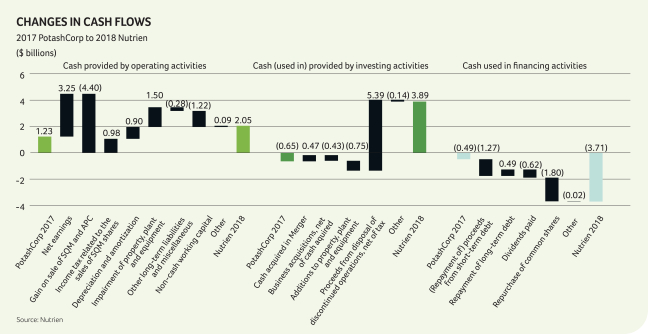
The most significant contributors to the changes in cash flows were as follows:
| 2018 vs 2017 (Nutrien) | 2018 vs 2017 (PotashCorp) | |||
| Cash Provided by Operating Activities was impacted by: | • Higher net earnings in 2018 than in 2017.
• Significant changes innon-cash adjustments were due to the gain on disposal of SQM and APC net of tax in 2018 ($NIL – 2017), higher depreciation and amortization, and higher impairment of property, plant and equipment.
• Non-cash working capital was impacted primarily by cash outflows for payables and accrued charges (inflows in 2017) and inventories (lower outflows in 2017) more than offsetting inflows from prepaid expenses and other current assets (outflows in 2017). | • Higher net earnings in 2018 than in 2017.
• Significant changes in non-cash adjustments were due to the gain on disposal of SQM and APC net of tax in 2018 ($NIL – 2017), higher depreciation and amortization, and higher impairment of property, plant and equipment.
• Non-cash working capital was impacted primarily by cash outflows for payables and accrued charges (inflows in 2017) and inventories (lower outflows in 2017) more than offsetting inflows from prepaid expenses and other current assets (outflows in 2017).
|
| NUTRIEN 2018 | 67 | ANNUAL REPORT |
| 2018 vs 2017 (Nutrien) | 2018 vs 2017 (PotashCorp) | |||
| Cash Provided by (Used in) Investing Activities was impacted by: | • Higher net cash outlays for business acquisitions (net of cash acquired) in 2018 compared to 2017.
• Cash proceeds received from the disposals of our discontinued operations in SQM, ICL and APC in 2018. | • Cash acquired in the Merger in 2018.
• Higher net cash outlays for business combinations (net of cash acquired) in 2018 compared to 2017.
• Higher cash additions to property, plant and equipment in 2018 than in 2017 due primarily to the addition of Agrium’s Retail operations in the Merger.
• Cash proceeds received from the disposals of our discontinued operations in SQM, ICL and APC in 2018. | ||
| Cash Used in Financing Activities was impacted by: | • A net repayment of commercial paper in 2018 compared to net proceeds in 2017.
• Lower cash repayments of long-term debt in 2018.
• Cash outlays for share repurchases under the NCIB in 2018 (none in 2017). | • A net repayment of commercial paper in 2018 compared to net proceeds in 2017.
• Lower cash repayments of long-term debt in 2018.
• Higher cash dividends paid in 2018 than in 2017.
• Cash outlays for share repurchases under the NCIB in 2018 (none in 2017). |
Cash Requirements
The following aggregated information about our contractual obligations and other commitments summarizes certain of our liquidity and capital resource requirements as at December 31, 2018. The information presented in the table below does not include planned (but not legally committed) capital expenditures or potential share repurchases.
| Payments Due by Period | ||||||||||||||||||||||||
| Dollars (millions) at December 31, 2018 | Total | Within 1 Year | 1 to 3 Years | 3 to 5 Years | Over 5 Years | |||||||||||||||||||
Long-term debt obligations | Notes 23, 26 | $ | 8,175 | $ | 1,000 | $ | 500 | $ 1,000 | $ | 5,675 | ||||||||||||||
Estimated interest payments on long-term debt obligations | Note 26 | 4,543 | 341 | 612 | 576 | 3,014 | ||||||||||||||||||
Operating leases | Note 26 | 1,087 | 216 | 316 | 212 | 343 | ||||||||||||||||||
Purchase commitments1 | Note 26 | 3,396 | 1,364 | 949 | 945 | 138 | ||||||||||||||||||
Capital commitments | Note 26 | 57 | 37 | 18 | 2 | – | ||||||||||||||||||
Other commitments | Note 26 | 318 | 114 | 123 | 61 | 20 | ||||||||||||||||||
Asset retirement obligations and environmental costs2 | Note 20 | 3,051 | 206 | 290 | 332 | 2,223 | ||||||||||||||||||
Other long-term liabilities 3 | Notes 9, 13, 28 | 3,468 | 119 | 99 | 93 | 3,157 | ||||||||||||||||||
Total | $ | 24,095 | $ | 3,397 | $ | 2,907 | $ 3,221 | $ | 14,570 | |||||||||||||||
| 1 | In 2018, we entered into a new long-term natural gas purchase agreement in Trinidad, which will commence January 1, 2019 and is set to expire December 31, 2023. The contract provides for prices that vary primarily with ammonia market prices, and annual escalating floor prices. The commitments included in the table are based on floor prices and minimum purchase quantities. |
| 2 | Commitments associated with our asset retirement obligations are the estimated cash outflows and are expected to occur over the next 480 years for phosphate (with the majority taking place over the next 80 years) and between 50 and 430 years for Potash. Potash cash flows are estimated for the first year of decommissioning for operating sites and for all years for permanently shut down sites. Environmental costs consist of restoration obligations, which are expected to occur through 2048. |
| 3 | Other long-term liabilities consist primarily of pension and other post-retirement benefits, derivative instruments, income taxes and deferred income taxes. Deferred income tax liabilities may vary according to changes in tax laws, tax rates and our operating results. Since it is impractical to determine whether there will be a cash impact in any particular year, all deferred income tax liabilities have been reflected as other long-term liabilities in the Over 5 Years category. |
| NUTRIEN 2018 | 68 | ANNUAL REPORT |
MANAGEMENT'S DISCUSSION AND ANALYSIS
Capital Structure & Management
We manage our capital structure with a focus on maintaining a strong balance sheet, enabling a strong investment-grade credit rating.
Principal Debt Instruments
We use a combination of cash generated from operations and short-term and long-term debt to finance our operations. We have the following short-term debt instruments available:
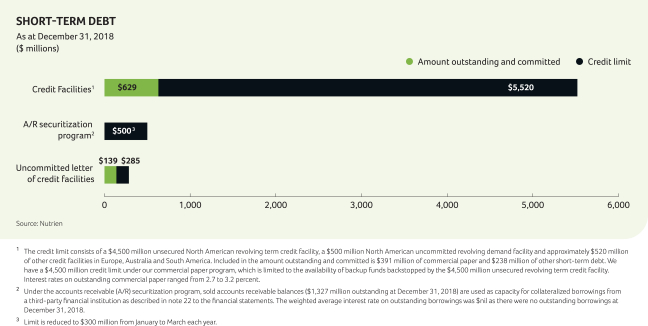
Our long-term debt consists primarily of notes with the following maturities and interest rates:
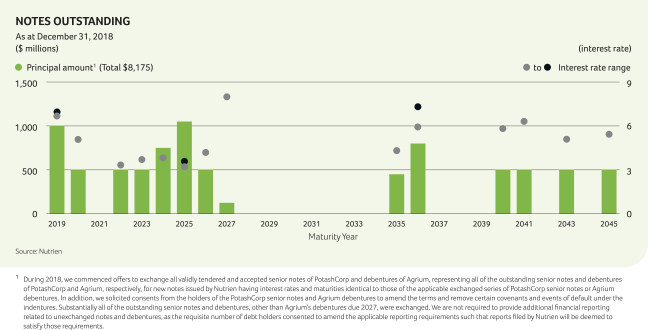
| NUTRIEN 2018 | 69 | ANNUAL REPORT |
DEBT COVENANTS
Our credit facilities have financial tests and other covenants with which we must comply at eachquarter-end.Non-compliance with any such covenants could result in accelerated payment of amounts borrowed and termination of lenders’ further funding obligations under the credit facilities. We were in compliance with all covenants as at December 31, 2018.
The accompanying table summarizes the limits and results of certain covenants.
| DEBT COVENANTS AT DECEMBER 31 | Limit | 2018 | ||||||||||
Debt-to-capital ratio1 | £ | 0.65 | 0.28 | |||||||||
| 1 | This debt covenant is a non-IFRS financial measure and is calculated as the sum of short-term debt, long-term debt (including current portion), finance lease obligations and financial letters of credit divided by the sum of those amounts, non-controlling interests and shareholders’ equity. The ratio of our short-term debt and long-term debt (including current portion) to our short-term debt, long-term debt (including current portion) and shareholders’ equity, which is the nearest comparable IFRS measure, is 0.27. |
CREDIT RATINGS
Our ability to access reasonably priced debt in the capital markets is dependent, in part, on the quality of our credit ratings. We continue to maintain investment-grade credit ratings for our long-term debt. A downgrade of the credit rating of our long-term debt could increase the interest rates applicable to borrowings under our credit facilities.
Commercial paper markets are normally a source ofsame-day cash for us. Our access to the US commercial paper market primarily depends on maintaining our current short-term credit ratings as well as general conditions in the money markets.
Long-Term Debt Rating (Outlook) | Short-Term Debt Rating | |||||||
| December 31, 2018 | December 31, 2018 | |||||||
Moody’s | Baa2 (stable) | P-2 | ||||||
S&P | BBB (stable) | A-2 | ||||||
A security rating is not a recommendation to buy, sell or hold securities. Such ratings may be subject to revision or withdrawal at any time by the respective credit rating agency and each rating should be evaluated independently of any other rating.
OUTSTANDING SHARE DATA
| December 31, 2018 | ||||
Common shares1 | 602,630,027 | |||
Options to purchase common shares | 9,044,237 | |||
Share-settled performance share units | 65,850 | |||
| 1 | Common shares issued and outstanding as at February 20, 2019. |
For more information on our capital structure and management, see note 25 to the financial statements.
For more information on our short-term debt and long-term debt, see notes 22 and 23 to the financial statements.
| NUTRIEN 2018 | 70 | ANNUAL REPORT |
MANAGEMENT'S DISCUSSION AND ANALYSIS
Off-Balance Sheet Arrangements
Principaloff-balance sheet activities include:
| • | Operating leases and long-term contracts containing fixed price and/or volume components (disclosed on page 68 under Cash Requirements). As of January 1, 2019, we adopted the new accounting standard for leases as described in note 32 to the financial statements. We anticipate approximately $1 billion of leases being brought on the balance sheet as “right of use assets” and an equal amount recognized for lease obligations. The expected impact on net earnings is minimal based on leases currently outstanding as the adoption of the standard is expected to result in a decrease in lease expenses of $225 million (COGS of $145 million and selling expenses and general and administrative expenses of $80 million), an increase in depreciation and amortization of $190 million (COGS of $130 million and selling expenses and general and administrative expenses of $60 million) and an increase in finance costs of $30 million. The expected impact on EBITDA is an increase of $225 million. |
| • | Agreement to reimburse losses of Canpotex (see note 31 to the financial statements). |
| • | Issuance of guarantee contracts (see note 27 to the financial statements). |
| • | Certainnon-financial derivatives that were entered into and continued to be held for the purpose of the receipt or delivery ofa non-financial item in accordance with expected purchase, sale or usage requirements. Other derivatives are included on our balance sheet at fair value. |
We do not reasonably expect any presently known trend or uncertainty to affect our ability to continue using these arrangements.
Related Party Transactions
Refer to note 30 to the financial statements for information on related party transactions.
Market Risks Associated with Financial Instruments
Market risk is the potential for loss from adverse changes in the market value of financial instruments. The level of market risk to which we are exposed varies depending on the composition of our derivative instrument portfolio, as well as current and expected market conditions. See note 13 to the financial statements for information on our financial instruments’ risks and risk management.
Critical Accounting Estimates
We prepare our financial statements in accordance with IFRS, which requires us to make judgments, assumptions and estimates in applying accounting policies. Critical accounting estimates are those which are highly uncertain at the time they are made or where different estimates would be reasonably likely to have a material impact on our financial condition or results of operations.
| Critical Accounting Estimate | Financial Statement Note Reference1 | Primary Segment(s) Impacted | ||
Business combinations |
Note 3 | All segments were impacted as all assets acquired, and liabilities assumed, from Agrium in the Merger were required to be measured at fair value. | ||
Goodwill impairment |
Note 17 and Note 32 | The Retail, Potash, Nitrogen and Phosphate and Sulfate segments have goodwill allocated to them that could be subject to impairment. | ||
Long-lived asset impairment |
Note 16 and Note 32 | The Potash and Phosphate and Sulfate segments have had impairments recorded, which could be subject to reversal. Further, all segments could be subject to impairment in the event there is an impairment trigger. | ||
Income taxes |
Note 9 and Note 31 | Income taxes are not allocated to segments, therefore no segments are impacted by these estimates. | ||
Asset retirement obligations and accrued environmental costs |
Note 20 | The Potash and Phosphate and Sulfate segments have these liabilities associated with their mining operations (Others segment has asset retirement obligations associated with non-operational mines) which have a high degree of estimation uncertainty for future costs and estimated timelines. |
| 1 | Included in the notes are a description of the estimate and the methodology for calculating (when applicable) key areas of judgment related to the estimate, changes to the estimate (if any) and sensitivity analysis (when available and would provide material information to investors). |
We have discussed the development, selection and application of our key accounting policies, and the critical accounting estimates and assumptions they involve, with the audit committee of the Board.
Recent Accounting Changes
Refer to note 32 to the financial statements.
| NUTRIEN 2018 | 71 | ANNUAL REPORT |
Dollars (millions) except as otherwise noted | Nutrien 2018 | PCS 20171 | ||||||||||||||||||||||||||||||||||||||||||
| Q1 | Q2 | Q3 | Q4 | Total | Q1 | Q2 | Q3 | Q4 | Total | |||||||||||||||||||||||||||||||||||
Sales | $ | 3,695 | $ | 8,145 | $ | 4,034 | $ | 3,762 | $ | 19,636 | $ | 1,112 | $ | 1,120 | $ | 1,234 | $ | 1,081 | $ | 4,547 | ||||||||||||||||||||||||
Gross margin | 847 | 2,131 | 1,155 | 1,259 | 5,392 | 273 | 260 | 233 | (72 | ) | 694 | |||||||||||||||||||||||||||||||||
Earnings (loss) before finance costs and income taxes | 76 | 1,151 | (1,359 | ) | 546 | 414 | 175 | 149 | 100 | (215 | ) | 209 | ||||||||||||||||||||||||||||||||
Net (loss) earnings from continuing operations | (1 | ) | 741 | (1,067 | ) | 296 | (31 | ) | 106 | 152 | 16 | (120 | ) | 154 | ||||||||||||||||||||||||||||||
Net earnings from discontinued operations | – | 675 | 23 | 2,906 | 3,604 | 43 | 49 | 37 | 44 | 173 | ||||||||||||||||||||||||||||||||||
Net (loss) earnings2 | (1 | ) | 1,416 | (1,044 | ) | 3,202 | 3,573 | 149 | 201 | 53 | (76 | ) | 327 | |||||||||||||||||||||||||||||||
EBITDA | 487 | 1,507 | (932 | ) | 944 | 2,006 | 347 | 317 | 280 | (43 | ) | 901 | ||||||||||||||||||||||||||||||||
Basic net (loss) earnings per share from continuing operations | – | 1.18 | (1.74 | ) | 0.48 | (0.05 | ) | 0.13 | 0.18 | 0.02 | (0.14 | ) | 0.18 | |||||||||||||||||||||||||||||||
Diluted net (loss) earnings per share from continuing operations | – | 1.17 | (1.74 | ) | 0.48 | (0.05 | ) | 0.13 | 0.18 | 0.02 | (0.14 | ) | 0.18 | |||||||||||||||||||||||||||||||
Basic net (loss) earnings per share2 | – | 2.25 | (1.70 | ) | 5.23 | 5.72 | 0.18 | 0.24 | 0.06 | (0.09 | ) | 0.39 | ||||||||||||||||||||||||||||||||
Diluted net (loss) earnings per share2 | – | 2.24 | (1.70 | ) | 5.22 | 5.72 | 0.18 | 0.24 | 0.06 | (0.09 | ) | 0.39 | ||||||||||||||||||||||||||||||||
Other comprehensive (loss) income | (70 | ) | (105 | ) | 1 | (128 | ) | (302 | ) | 39 | 69 | 42 | (54 | ) | 96 | |||||||||||||||||||||||||||||
Cash (used in) provided by operating activities | (340 | ) | 601 | (177 | ) | 1,968 | 2,052 | 223 | 328 | 293 | 381 | 1,225 | ||||||||||||||||||||||||||||||||
| 1 | Certain amounts have been reclassified to conform with Nutrien’s new method of presentation and certain fourth quarter amounts have been reclassified as a result of discontinued operations discussed in note 10 of the financial statements. |
| 2 | From continuing and discontinued operations. |
The agricultural products business is seasonal. Crop input sales are primarily concentrated in the spring and fall application seasons. Crop nutrient inventories are normally accumulated leading up to each application season. Our cash collections generally occur after the application season is complete, and our customer prepayments are concentrated in December and January. Feed and industrial sales are more evenly distributed throughout the year. Beginning in 2018, earnings were impacted by the operations acquired in the Merger. In the third quarter of 2018, earnings were impacted by a $1.8 billion non-cash impairment to property, plant and equipment in the Potash segment as discussed in note 16 to the financial statements. In the fourth quarter of 2017, earnings were impacted by a $276 million non-cash impairment to property, plant and equipment in the Phosphate and Sulfate segment.
Dollars (millions) | Nutrien 2018 | Nutrien 2017 | ||||||||||||||||||||||||||||||||||||||||||
| Q1 | Q2 | Q3 | Q4 | Total | Q1 | Q2 | Q3 | Q4 | Total | |||||||||||||||||||||||||||||||||||
Sales | $ | 3,695 | $ | 8,145 | $ | 4,034 | $ | 3,762 | $ | 19,636 | $ | 3,737 | $ | 7,348 | $ | 3,586 | $ | 3,498 | $ | 18,169 | ||||||||||||||||||||||||
Gross margin | 847 | 2,131 | 1,155 | 1,259 | 5,392 | 838 | 1,791 | 793 | 729 | 4,151 | ||||||||||||||||||||||||||||||||||
Earnings (loss) before finance costs and income taxes | 76 | 1,151 | (1,359 | ) | 546 | 414 | 222 | 995 | 74 | (100 | ) | 1,191 | ||||||||||||||||||||||||||||||||
Net (loss) earnings from continuing operations | (1 | ) | 741 | (1,067 | ) | 296 | (31 | ) | 97 | 705 | (53 | ) | (93 | ) | 656 | |||||||||||||||||||||||||||||
EBITDA | 487 | 1,507 | (932 | ) | 944 | 2,006 | 521 | 1,306 | 375 | 210 | 2,412 | |||||||||||||||||||||||||||||||||
| NUTRIEN 2018 | 72 | ANNUAL REPORT |
MANAGEMENT'S DISCUSSION AND ANALYSIS
Fourth Quarter Financial Performance
| Sales | Gross Margin | |||||||||||||||||||||||||||||||||||||||||||||||
Dollars (millions) Three months ended December 31 | Nutrien 2018 | Nutrien 2017 | % Change | PCS 2017 | % Change | Nutrien 2018 | Nutrien 2017 | % Change | PCS 2017 | % Change | ||||||||||||||||||||||||||||||||||||||
RETAIL | ||||||||||||||||||||||||||||||||||||||||||||||||
Crop nutrients | $ | 917 | $ | 890 | 3 | $ | – | n/m | $ | 184 | $ | 168 | 10 | $ | – | n/m | ||||||||||||||||||||||||||||||||
Crop protection products | 644 | 712 | (10 | ) | – | n/m | 270 | 327 | (17 | ) | – | n/m | ||||||||||||||||||||||||||||||||||||
Seed | 103 | 107 | (4 | ) | – | n/m | 56 | 51 | 10 | – | n/m | |||||||||||||||||||||||||||||||||||||
Merchandise | 179 | 187 | (4 | ) | – | n/m | 27 | 28 | (4 | ) | – | n/m | ||||||||||||||||||||||||||||||||||||
Services and other | 211 | 193 | 9 | – | n/m | 125 | 121 | 3 | – | n/m | ||||||||||||||||||||||||||||||||||||||
Total | $ | 2,054 | $ | 2,089 | (2 | ) | $ | – | n/m | $ | 662 | $ | 695 | (5 | ) | $ | – | n/m | ||||||||||||||||||||||||||||||
| Manufactured Product Sales Tonnes (thousands) | Manufactured Product Average Net Price per MT | |||||||||||||||||||||||||||||||||||||||||||||||
Dollars (millions) Three months ended December 31 | Nutrien 2018 | Nutrien 2017 | % Change | PCS 2017 | % Change | Nutrien 2018 | Nutrien 2017 | % Change | PCS 2017 | % Change | ||||||||||||||||||||||||||||||||||||||
POTASH | ||||||||||||||||||||||||||||||||||||||||||||||||
North America | 731 | 896 | (18 | ) | 568 | 29 | $ | 242 | $ | 207 | 17 | $ | 214 | 13 | ||||||||||||||||||||||||||||||||||
Offshore | 2,126 | 1,631 | 30 | 1,340 | 59 | $ | 216 | $ | 168 | 29 | $ | 169 | 28 | |||||||||||||||||||||||||||||||||||
Sales | 2,857 | 2,527 | 13 | 1,908 | 50 | $ | 223 | $ | 182 | 23 | $ | 182 | 23 | |||||||||||||||||||||||||||||||||||
Cost of Goods Sold | $ | (95 | ) | $ | (101 | ) | (6 | ) | $ | (96 | ) | (1 | ) | |||||||||||||||||||||||||||||||||||
Gross Margin | $ | 128 | $ | 81 | 58 | $ | 86 | 49 | ||||||||||||||||||||||||||||||||||||||||
NITROGEN | ||||||||||||||||||||||||||||||||||||||||||||||||
Ammonia | 808 | 801 | 1 | 505 | 60 | $ | 290 | $ | 256 | 13 | $ | 270 | 7 | |||||||||||||||||||||||||||||||||||
Urea | 687 | 583 | 18 | 283 | 143 | $ | 337 | $ | 272 | 24 | $ | 288 | 17 | |||||||||||||||||||||||||||||||||||
Solutions and nitrates | 939 | 986 | (5 | ) | 795 | 18 | $ | 169 | $ | 151 | 12 | $ | 138 | 22 | ||||||||||||||||||||||||||||||||||
Sales | 2,434 | 2,370 | 3 | 1,583 | 54 | $ | 257 | $ | 217 | 18 | $ | 207 | 24 | |||||||||||||||||||||||||||||||||||
Cost of Goods Sold | $ | (175 | ) | $ | (174 | ) | 1 | $ | (167 | ) | 5 | |||||||||||||||||||||||||||||||||||||
Gross Margin | $ | 82 | $ | 43 | 91 | $ | 40 | 105 | ||||||||||||||||||||||||||||||||||||||||
PHOSPHATE AND SULFATE | ||||||||||||||||||||||||||||||||||||||||||||||||
Fertilizer | 601 | 629 | (4 | ) | 534 | 13 | $ | 423 | $ | 348 | 22 | $ | 342 | 24 | ||||||||||||||||||||||||||||||||||
Industrial and feed | 207 | 205 | 1 | 239 | (13 | ) | $ | 513 | $ | 485 | 6 | $ | 483 | 6 | ||||||||||||||||||||||||||||||||||
Sulfate | 77 | 61 | 26 | – | n/m | $ | 267 | $ | 236 | 13 | $ | – | n/m | |||||||||||||||||||||||||||||||||||
Sales | 885 | 895 | (1 | ) | 773 | 14 | $ | 431 | $ | 372 | 16 | $ | 385 | 12 | ||||||||||||||||||||||||||||||||||
Cost of Goods Sold | $ | (406 | ) | $ | (694 | ) | (41 | ) | $ | (782 | ) | (48 | ) | |||||||||||||||||||||||||||||||||||
Gross Margin | $ | 25 | $ | (322 | ) | n/m | $ | (397 | ) | n/m | ||||||||||||||||||||||||||||||||||||||
n/m = not meaningful
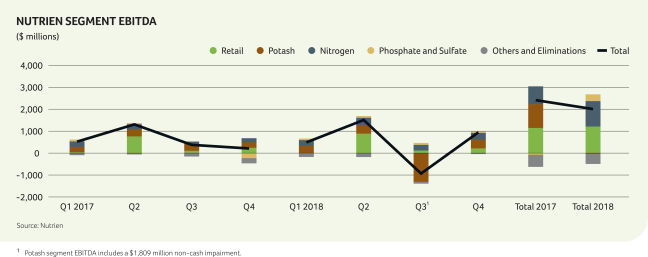
| NUTRIEN 2018 | 73 | ANNUAL REPORT |
Highlights of our 2018 fourth quarter compared to the 2017 combined historical Nutrien fourth quarter results and the 2017 PotashCorp fourth quarter results were as follows (direction of arrows refers to impact on comprehensive income and● means no impact):
| Q4 2018 vs Q4 2017 (Nutrien) | Q4 2018 vs Q4 2017 (PotashCorp) | |||||||||
Retail
|
|
|
| Sales volumes for crop nutrients and crop protection were impacted by a shortened application season in the US caused by adverse weather.
|
| PotashCorp did not have Retail operations prior to the Merger. | ||||
|
|
| Gross margin for crop nutrients was higher due to strong fertilizer prices more than offsetting lower sales volumes. | |||||||
Potash |
|
|
| Sales volumes were up due to strong demand in offshore markets more than offsetting lower North America sales due to adverse weather that postponed fall application.
|
| Sales volumes were up due to the addition of the Vanscoy Potash mine in the Merger and strong offshore demand. | ||||
|
|
| Sales prices were up due to strong global demand and tight supply.
|
| Sales prices were up due to strong global demand and tight supply. | |||||
|
|
| Costs per tonne were lower due to realized synergies and mine optimization. |
● | Costs per tonne were flat due to realized synergies and mine optimization offsetting the addition of Agrium’s operations, higher depreciation on the related PPA adjustments, and shutdowns at certain mines occurring in the fourth quarter in 2018 and in the third quarter in 2017. | |||||
Nitrogen |
|
●
|
| Sales volumes were higher due to improved production rates and stable fall ammonia application in Canada.
Sales prices were up due to tight global supply and higher global feedstock costs.
Costs per tonne were flat due to higher production volumes and synergy realizations being offset by higher depreciation and amortization from the PPA adjustments. |
| Sales volumes increased primarily as a result of the Merger.
Sales prices were up due to tight global supply , stable demand and higher global feedstock costs.
Costs per tonne were higher due to higher depreciation and amortization from the PPA adjustments more than offsetting lower average natural gas costs from plants acquired in the Merger.
| ||||
Phosphate and Sulfate
|
|
● |
| Sales volumes were flat as higher ammonium sulfate sales offset lower dry fertilizer sales caused by the shortened application in the US.
|
| Sales volumes increased primarily as a result of the Merger.
Sales prices were up due to higher sulfur and ammonia input costs and a more balanced global supply and demand.
Costs per tonne were down significantly as the impact of higher sulfur and ammonia input costs were more than offset by thenon-cash impairment in the prior year. | ||||
| Sales prices were up due to higher sulfur and ammonia input costs and a more balanced global supply and demand.
| |||||||||
| Costs per tonne were down significantly as the impact of higher sulfur and ammonia input costs were more than offset by the non-cash impairment in the prior year. | |||||||||
Expenses and income below gross margin
|
|
|
| Selling costs in Retail increased due to acquisitions and increased depreciation related to PPA adjustments.
General and administrative costs decreased due primarily to a share-based payment recovery in 2018 compared to share based payment expenses in 2017.
Other expenses decreased (Other income in 2018) primarily due to lower Merger and related costs. |
| Expenses increased primarily due to the acquisition of Agrium’s operations in the Merger. | ||||
| Selling costs also increased due to Retail acquisitions and increased depreciation related to PPA adjustments from the Merger. | |||||||||
| Other expenses decreased (Other income in 2018) primarily due to lower Merger and related costs. | |||||||||
Income tax expense (recovery) |
|
|
| We realized earnings from continuing operations for the three months ended December 31, 2018 compared to a loss from continuing operations for the same period in 2017. Significantly higher earnings were realized in high tax rate jurisdictions in the fourth quarter of 2018 compared to the same period in 2017. Discrete tax recoveries were $4 million in the fourth quarter of 2018 compared to $109 million in the fourth quarter of 2017. |
| We realized earnings from continuing operations for the three months ended December 31, 2018 compared to a loss from continuing operations for the same period in 2017. Significantly higher earnings were realized in high tax rate jurisdictions in the fourth quarter of 2018 compared to the same period in 2017. Discrete tax recoveries were $4 million in the fourth quarter of 2018 compared to $118 million in the fourth quarter of 2017. | ||||
Net earnings from discontinued operations | Combined historical Nutrien information was not prepared for discontinued operations. |
| Net earnings from discontinued operations were higher primarily due to the gains on sale of our equity investments in SQM and APC. | |||||||
Other comprehensive loss (OCI) |
|
|
| Other comprehensive loss increased primarily due to a loss on translation of net operations in Canada and Australia due to weaker foreign currencies that were acquired in the Merger and an actuarial loss on defined benefit plans in 2018 (compared to a gain in 2017) more than offsetting a decreased fair value loss on our investments measured at fair value through OCI. (2018 included a loss on Sinofert; 2017 included losses on Sinofert and ICL) |
| Other comprehensive loss increased primarily due to a loss on translation of net operations in Canada and Australia due to weaker foreign currencies that were acquired in the Merger and an actuarial loss on defined benefit plans in 2018 (compared to a gain in 2017) more than offsetting a decreased fair value loss on our investments measured at fair value through OCI. (2018 included a loss on Sinofert; 2017 included losses on Sinofert and ICL) | ||||
| NUTRIEN 2018 | 74 | ANNUAL REPORT |
MANAGEMENT'S DISCUSSION AND ANALYSIS
Disclosure Controls and Procedures
We maintain disclosure controls and procedures designed to provide reasonable assurance that information required to be disclosed by Nutrien in its annual filings, interim filings (as these terms are defined in National Instrument52-109 – Certification of Disclosure (NI 52-109) in Issuers’ Annual and Interim Filings) and other reports filed or submitted by us under securities legislation is recorded, processed, summarized and reported within the required time periods. Our Chief Executive Officer and Chief Financial Officer, after evaluating the effectiveness of our disclosure controls and procedures as of the end of the period covered by the annual filings, being December 31, 2018, have concluded that, as of such date, our disclosure controls and procedures were effective in providing reasonable assurance that information required to be disclosed by Nutrien in its annual filings, interim filings or other reports filed or submitted by it under securities legislation is (a) recorded, processed, summarized and reported within the time periods specified in the securities legislation, and (b) accumulated and communicated to management, including our Chief Executive Officer and Chief Financial Officer, as appropriate, to allow timely decisions regarding required disclosure.
There are inherent limitations to the effectiveness of any system of disclosure controls and procedures, including the possibility of human error and the circumvention or overriding of the controls and procedures. Accordingly, even effective disclosure controls and procedures can only provide reasonable assurance of achieving their control objectives.
Internal Controls Over Financial Reporting
Management is responsible for establishing and maintaining adequate internal control over financial reporting, as defined inRules 13a-15(f) and15d-15(f) under theSecurities Exchange Act of 1934, as amended, and NI 52-109. Internal control over financial reporting is designed to provide reasonable assurance regarding the reliability of financial reporting and preparation of financial statements for external purposes in accordance with IFRS.
On January 1, 2018, PotashCorp and Agrium combined their businesses in a transaction by way of a plan of arrangement by becoming wholly owned subsidiaries of a new parent company named Nutrien. For the year ended December 31, 2018, the Company has designed internal control over financial reporting for Nutrien, while maintaining the internal control over financial reporting for its subsidiaries, PotashCorp and Agrium.
Under the supervision and with the participation of our management, including our Chief Executive Officer and Chief Financial Officer, we conducted an evaluation of the design and effectiveness of our internal control over financial reporting as of the end of the fiscal year covered by this report based on the framework issued by the Committee of Sponsoring Organizations of the Treadway Commission (COSO) in Internal Control – Integrated Framework (2013). There was no change in our internal control over financial reporting in 2018 that has materially affected, or is reasonably likely to materially affect, our internal control over financial reporting. Based on this evaluation, our Chief Executive Officer and Chief Financial Officer concluded that, as at December 31, 2018, Nutrien Ltd. did maintain effective internal control over financial reporting.
The effectiveness of the Company’s internal control over financial reporting as at December 31, 2018 was audited by KPMG LLP, as reflected in their report, which is included in this 2018 Annual Report included on page 91.
| NUTRIEN 2018 | 75 | ANNUAL REPORT |
This 2018 Annual Report, including the “Outlook” section of “Management’s Discussion & Analysis of Financial Condition and Results of Operations,” contains and incorporates by reference “forward-looking statements” or “forward-looking information” (within the meaning of the US Private Securities Litigation Reform Act of 1995, and other US federal securities laws and applicable Canadian securities laws) (collectively, “forward-looking statements”) that relate to future events or our future financial performance. These statements can be identified by expressions of belief, expectation or intention, as well as those statements that are not historical fact. These statements often contain words such as “should”, “could”, “expect”, “may”, “anticipate”, “forecast”, “believe”, “intend”, “estimates”, “plans” and similar expressions. These statements are based on certain factors and assumptions as set forth in this Annual Report, including with respect to: foreign exchange rates, expected synergies, expected growth, results of operations, performance, business prospects and opportunities, and effective tax rates. While the Company considers these factors and assumptions to be reasonable based on information currently available, they may prove to be incorrect. Forward-looking statements are subject to risks and uncertainties that are difficult to predict. The results or events set forth in forward-looking statements may differ materially from actual results or events. Several factors could cause actual results or events to differ materially from those expressed in forward-looking statements, including, but not limited to, the following: a number of matters relating to the Merger, including the failure to realize the anticipated benefits of the Merger; the risk that our credit ratings may be downgraded or there may be adverse conditions in the credit markets; any significant impairment of the carrying amount of certain of our assets; variations from our assumptions with respect to foreign exchange rates, expected growth, results of operations, performance, business prospects and opportunities, and effective tax rates; fluctuations in supply and demand in the fertilizer, sulfur and petrochemical markets; changes in competitive pressures, including pricing pressures; risks and uncertainties related to any operating and workforce changes made in response to our industry and the markets we serve, including mine and inventory shutdowns; adverse or uncertain economic conditions and changes in credit and financial markets; economic and political uncertainty around the world; changes in capital markets; the results of sales contract negotiations; unexpected or adverse weather conditions; changes in foreign currency and exchange rates; risks related to reputational loss; the occurrence of a major safety incident; inadequate insurance coverage for a significant liability; inability to obtain relevant permits for our operations; catastrophic events or malicious acts, including terrorism; certain complications that may arise in our mining process, including water inflows; risks and uncertainties related to our international operations and assets; our ownership ofnon-controlling equity interests in other companies; our prospects to reinvest capital in strategic opportunities and acquisitions; risks associated with natural gas and other hedging activities; security risks related to our information technology systems; imprecision in mineral resource and reserve estimates; costs and availability of transportation and distribution for our raw materials and products, including railcars and ocean freight; changes in, and the effects of, government policies and regulations; earnings and the decisions of taxing authorities which could affect our effective tax rates; increases in the price or reduced availability of the raw materials that we use; our ability to attract, develop, engage and retain skilled employees; strikes or other forms of work stoppage or slowdowns; rates of return on, and the risks associated with, our investments and capital expenditures; timing and impact of capital expenditures; the impact of further innovation; adverse developments in new and pending legal proceedings or government investigations; and violations of our governance and compliance policies. Forward-looking statements are based on certain assumptions and analyses made by us in light of our experience and perception of historical trends, current conditions and expected future developments as well as other factors we believe are appropriate in the circumstances. Readers are cautioned not to place undue reliance on the forward-looking statements which involve known and unknown risks and uncertainties that may cause our actual results, performance or achievements to be materially different from any future results, performance or achievements expressed or implied by suchforward-looking statements. These risks and uncertainties and additional risks and uncertainties can be found in our Annual Information Form for the year ended December 31, 2018 and in our filings with the SEC and the Canadian provincial securities commissions. The purpose of our expected adjusted earnings per share, adjusted EBITDA and EBITDA by segment guidance range is to assist readers in understanding our expected and targeted financial results, and this information may not be appropriate for other purposes. Forward-looking statements in or incorporated into this report are given only as at the date of this report or the document incorporated into this report and the Company disclaims any obligation to update or revise any forward-looking statements, whether as a result of new information, future events or otherwise, except as required by law.
| NUTRIEN 2018 | 76 | ANNUAL REPORT |
MANAGEMENT'S DISCUSSION AND ANALYSIS
Non-IFRS Financial Measures
We use both IFRS and certainnon-IFRS measures to assess performance.Non-IFRS measures are a numerical measure of a company’s performance, that either excludes or includes amounts that are not normally excluded or included in the most directly comparable measures calculated and presented in accordance with IFRS. In evaluating these measures, investors should consider that the methodology applied in calculating such measures may differ among companies and analysts.
Management believes thenon-IFRS measures provide transparent and useful supplemental information to investors in order that they may evaluate our financial performance using the same measures as management. Thesenon-IFRS financial measures should not be considered as a substitute for, nor superior to, measures of financial performance prepared in accordance with IFRS.
The following section outlines ournon-IFRS financial measures, their definitions, why management uses each measure and contains reconciliations to the most directly comparable IFRS measures.
COMBINED HISTORICAL RESULTS OF POTASHCORP AND AGRIUM FOR THE YEAR ENDED DECEMBER 31, 2017
The combined historical information below may differ from the Nutrien pro forma earnings and balance sheet presented in the Business Acquisition Report dated February 20, 2017 (BAR) as the pro forma information presented therein required certain adjustments under applicable securities laws and accounting standards that we believe does not provide as useful a measure as the combined historical financial information. The primary differences in the statement of earnings were that pro forma finance costs were reduced by the amortization of the change in carrying amount of Agrium’s debt resulting from the PPA adjustments and the pro forma other expenses were adjusted to remove any Merger-related costs. There were no comparable adjustments in the combined historical financial information. The primary differences in the balance sheet were the pro forma adjustments for the estimated proceeds from the sale of SQM, APC, ICL and Agrium’s Conda Idaho phosphate production facility and adjacent phosphate mineral rights at December 31, 2017, while there was no adjustment in the combined historical financial information, and the PPA adjustments in the pro forma information was largely allocated to goodwill as fewer provisional fair value adjustments were known at the time of its preparation.
Most directly comparable IFRS financial measure: As the continuing reporting entity under IFRS, the audited annual financial statements of PotashCorp for the year ended December 31, 2017 are the IFRS comparative figures.
Definition: The combined historical results for Nutrien were calculated by adding the historical IFRS financial statements prepared by PotashCorp and Agrium and then eliminating intercompany transactions and reclassifying line items to conform with our financial statement presentation. This combined historical information does not include, among other things, estimated cost synergies, adjustments related to restructuring or integration activities, adjustments related to the PPA and the impact of discontinued operations.
Why we use the measure and why it is useful to investors: It provides a measure of what the combined results may have been had the Merger been completed on January 1, 2017. Information prepared includes a combined historical balance sheet, combined historical EBITDA by segment and in total, combined historical summary cash flow information and a combined historical summary other comprehensive income.
NUTRIEN COMBINED HISTORICAL SUMMARY CASH FLOW INFORMATION FOR THE YEAR ENDED DECEMBER 31, 2017
|
| |||||||||||||||
| Dollars (millions) | Historical PotashCorp | Historical Agrium | Adjustments 1 | Nutrien | ||||||||||||
Cash provided by operating activities | $ | 1,225 | $ | 1,319 | $ | 24 | 1 | $ | 2,568 | |||||||
Cash used in investing activities | (652 | ) | (922 | ) | (20 | ) 1 | (1,594 | ) | ||||||||
Cash used in financing activities | (489 | ) | (335 | ) | – | (824 | ) | |||||||||
| Effect of exchange rate changes on cash and cash equivalents | – | (12 | ) | – | (12 | ) | ||||||||||
| Increase in cash and cash equivalents | $ | 84 | $ | 50 | $ | 4 | $ | 138 | ||||||||
| 1 | To reclassify legacy Agrium cash used in discontinued operations to match Nutrien’s method of presentation. |
NUTRIEN COMBINED HISTORICAL SUMMARY OTHER COMPREHENSIVE INCOME FOR THE YEAR ENDED DECEMBER 31, 2017
|
| |||||||||||
Dollars (millions) | Historical | Historical | Nutrien | |||||||||
| Other comprehensive income | $ | 96 | $ | 80 | $ | 176 | ||||||
| NUTRIEN 2018 | 77 | ANNUAL REPORT |
NUTRIEN COMBINED HISTORICAL BALANCE SHEET AS AT DECEMBER 31, 2017
|
| |||||||||||||||
| Dollars (millions) | Historical PotashCorp | Historical Agrium | Adjustments 1 | Nutrien | ||||||||||||
ASSETS | ||||||||||||||||
Current assets | ||||||||||||||||
Cash and cash equivalents | $ | 116 | $ | 466 | $ | – | $ | 582 | ||||||||
Receivables | 489 | 2,406 | 18 | 2 | 2,913 | |||||||||||
Income tax receivables | – | 18 | (18 | ) 2 | – | |||||||||||
Inventories | 788 | 3,321 | – | 4,109 | ||||||||||||
Prepaid expenses and other current assets | 72 | 1,004 | 120 | 3 | 1,196 | |||||||||||
Other current assets | – | 120 | (120 | ) 3 | – | |||||||||||
| 1,465 | 7,335 | – | 8,800 | |||||||||||||
Assets held for sale | 1,858 | 105 | – | 1,963 | ||||||||||||
| 3,323 | 7,440 | – | 10,763 | |||||||||||||
Non-current assets | ||||||||||||||||
Property, plant and equipment | 12,971 | 7,091 | – | 20,062 | ||||||||||||
Goodwill | – | 2,228 | 97 | 4 | 2,325 | |||||||||||
Other intangible assets | 166 | 518 | (97 | ) 4 | 587 | |||||||||||
Investments | 30 | 522 | 262 | 5 | 814 | |||||||||||
Available for sale investments | 262 | – | (262 | ) 5 | – | |||||||||||
Deferred income tax assets | – | 85 | (85 | ) 6 | – | |||||||||||
Other assets | 246 | 58 | 85 | 6 | 389 | |||||||||||
TOTAL ASSETS | $ | 16,998 | $ | 17,942 | $ | – | $ | 34,940 | ||||||||
LIABILITIES | ||||||||||||||||
Current liabilities | ||||||||||||||||
Short-term debt | $ | 730 | $ | 867 | $ | – | 7 | $ | 1,597 | |||||||
Payables and accrued charges | 807 | 5,206 | 119 | 8, 9, 10 | 6,132 | |||||||||||
Income taxes payable | – | 27 | (27 | ) 8 | – | |||||||||||
Current portion of long-term debt | – | 11 | – | 7 | 11 | |||||||||||
Current portion of derivative instrument liabilities | 29 | – | (29 | ) 9 | – | |||||||||||
Current portion of other provisions | – | 63 | (63 | ) 10 | – | |||||||||||
Deferred income tax liabilities on assets held for sale | 36 | – | – | 36 | ||||||||||||
| 1,602 | 6,174 | – | 7,776 | |||||||||||||
Non-current liabilities | ||||||||||||||||
Long-term debt | 3,711 | 4,397 | – | 8,108 | ||||||||||||
Deferred income tax liabilities | 2,205 | 473 | – | 2,678 | ||||||||||||
Pension and other post-retirement benefit liabilities | 440 | 142 | – | 582 | ||||||||||||
Asset retirement obligations and accrued environmental costs | 651 | 522 | – | 1,173 | ||||||||||||
Derivative instrument liabilities | 35 | – | (35 | ) 11 | – | |||||||||||
Othernon-current liabilities | 51 | 106 | 42 | 11, 12 | 199 | |||||||||||
TOTAL LIABILITIES | 8,695 | 11,814 | 7 | 20,516 | ||||||||||||
SHAREHOLDERS’ EQUITY | ||||||||||||||||
Share capital | 1,806 | 1,776 | – | 3,582 | ||||||||||||
Contributed surplus | 230 | – | – | 230 | ||||||||||||
Accumulated other comprehensive income (loss) | 25 | (1,116 | ) | – | (1,091 | ) | ||||||||||
Retained earnings | 6,242 | 5,461 | – | 11,703 | ||||||||||||
| 8,303 | 6,121 | – | 14,424 | |||||||||||||
Non-controlling interests | – | 7 | (7 | ) 12 | – | |||||||||||
TOTAL SHAREHOLDERS’ EQUITY | 8,303 | 6,128 | (7 | ) | 14,424 | |||||||||||
TOTAL LIABILITIES AND SHAREHOLDERS’ EQUITY | $ | 16,998 | $ | 17,942 | $ | – | $ | 34,940 | ||||||||
| 1 | The following balances do not reflect the issuance of new shares or the PPA adjustments resulting from the Merger. |
| 2 | Reclassified Agrium income tax receivables as part of receivables. |
| 3 | Reclassified Agrium other current assets as part of prepaid expenses and other current assets. |
| 4 | Reclassified PotashCorp goodwill from intangibles to a separate line item. |
| 5 | Combined investments in equity-accounted investees and available for sale. |
| 6 | Reclassified Agrium deferred income tax assets as part of other assets. |
| 7 | Reclassified PotashCorp current portion of long-term debt as a separate line item. |
| 8 | Reclassified Agrium income taxes payable as part of payables and accrued charges. |
| 9 | Reclassified PotashCorp current portion of derivative instrument liabilities as part of payables and accrued charges. |
| 10 | Reclassified Agrium current portion of other provisions as part of payables and accrued charges. |
| 11 | Reclassified PotashCorp derivative instrument liabilities as part of othernon-current liabilities. |
| 12 | Reclassified Agriumnon-controlling interests as part of othernon-current liabilities. |
| NUTRIEN 2018 | 78 | ANNUAL REPORT |
MANAGEMENT'S DISCUSSION AND ANALYSIS
NUTRIEN COMBINED HISTORICAL EARNINGS FROM CONTINUING OPERATIONS AND EBITDA FOR THE YEAR ENDED DECEMBER 31, 2017
| Dollars (millions) | Retail | Potash | Nitrogen | Phosphate and Sulfate | �� | Others | Eliminations | Nutrien | ||||||||||||||||||||
SALES | $ | 12,103 | $ | 2,391 | $ | 2,986 | $ | 1,561 | $ | – | $ | (872 | ) | $ | 18,169 | |||||||||||||
Freight, transportation and distribution | – | (334 | ) | (347 | ) | (204 | ) | – | (885 | ) | ||||||||||||||||||
Cost of goods sold | (9,157 | ) | (1,124 | ) | (2,084 | ) | (1,649 | ) | – | 881 | (13,133 | ) | ||||||||||||||||
GROSS MARGIN | 2,946 | 933 | 555 | (292 | ) | – | 9 | 4,151 | ||||||||||||||||||||
Selling expenses | (2,007 | ) | (12 | ) | (31 | ) | (8 | ) | 15 | – | (2,043 | ) | ||||||||||||||||
General and administrative expenses | (100 | ) | (5 | ) | (13 | ) | (8 | ) | (377 | ) | – | (503 | ) | |||||||||||||||
Provincial mining and other taxes | – | (159 | ) | – | – | – | – | (159 | ) | |||||||||||||||||||
Earnings of equity-accounted investees | 9 | 1 | 35 | – | 1 | – | 46 | |||||||||||||||||||||
Other income (expenses) | 8 | (20 | ) | (25 | ) | (7 | ) | (257 | ) | – | (301 | ) | ||||||||||||||||
EARNINGS (LOSS) BEFORE FINANCE COSTS AND INCOME TAXES | 856 | 738 | 521 | (315 | ) | (618 | ) | 9 | 1,191 | |||||||||||||||||||
Finance costs | – | – | – | – | (515 | ) | – | (515 | ) | |||||||||||||||||||
EARNINGS (LOSS) BEFORE INCOME TAXES | 856 | 738 | 521 | (315 | ) | (1,133 | ) | 9 | 676 | |||||||||||||||||||
Income taxes | – | – | – | – | (20 | ) | – | (20 | ) | |||||||||||||||||||
NET EARNINGS (LOSS) FROM CONTINUING OPERATIONS | $ | 856 | $ | 738 | $ | 521 | $ | (315 | ) | $ | (1,153 | ) | $ | 9 | $ | 656 | ||||||||||||
Finance costs | – | – | – | – | 515 | – | 515 | |||||||||||||||||||||
Income taxes | – | – | – | – | 20 | – | 20 | |||||||||||||||||||||
Depreciation and amortization | 289 | 345 | 291 | 240 | 56 | – | 1,221 | |||||||||||||||||||||
EBITDA | $ | 1,145 | $ | 1,083 | $ | 812 | $ | (75 | ) | $ | (562 | ) | $ | 9 | $ | 2,412 | ||||||||||||
| EBITDA RECONCILIATION TO HISTORICAL | Nutrien | |||||||||||||||||||||||||||
PotashCorp | $ | 901 | ||||||||||||||||||||||||||
Agrium | 1,546 | |||||||||||||||||||||||||||
Combined EBITDA | 2,447 | |||||||||||||||||||||||||||
Adjustments: | ||||||||||||||||||||||||||||
Allocate Retail finance costs | (34 | ) | ||||||||||||||||||||||||||
Other | (1 | ) | ||||||||||||||||||||||||||
NUTRIEN EBITDA | $ | 2,412 | ||||||||||||||||||||||||||
NUTRIEN COMBINED HISTORICAL RETAIL SEGMENT EBITDA FOR THE YEAR ENDED DECEMBER 31, 2017
| Dollars (millions) | Historical PotashCorp | Historical Agrium | Adjustments | Nutrien | ||||||||||||
SALES | ||||||||||||||||
External | $ | – | $ | 12,056 | $ | – | $ | 12,056 | ||||||||
Intersegment | – | 47 | – | 47 | ||||||||||||
TOTAL SALES | – | 12,103 | – | 12,103 | ||||||||||||
Cost of goods sold | – | (9,157 | ) | – | (9,157 | ) | ||||||||||
GROSS MARGIN | – | 2,946 | – | 2,946 | ||||||||||||
Selling expenses | – | (2,007 | ) | – | (2,007 | ) | ||||||||||
General and administrative expenses | – | (100 | ) | – | (100 | ) | ||||||||||
Earnings of equity-accounted investees | – | 9 | – | 9 | ||||||||||||
Other income (expenses) | – | 42 | (34 | ) 1 | 8 | |||||||||||
EARNINGS BEFORE FINANCE COSTS AND INCOME TAXES | – | 890 | (34 | ) | 856 | |||||||||||
Depreciation and amortization | – | 289 | – | 289 | ||||||||||||
EBITDA | $ | – | $ | 1,179 | $ | (34 | ) | $ | 1,145 | |||||||
| 1 | Finance costs associated with Retail operations will be allocated to the Retail segment, and will be presented in other income (expenses). |
| NUTRIEN 2018 | 79 | ANNUAL REPORT |
NUTRIEN COMBINED HISTORICAL POTASH SEGMENT EBITDA FOR THE YEAR ENDED DECEMBER 31, 2017
|
| |||||||||||||||
| Dollars (millions) | Historical PotashCorp | Historical Agrium | Adjustments | Nutrien | ||||||||||||
SALES | ||||||||||||||||
External | $ | 1,868 | $ | 386 | $ | 4 | $ | 2,258 | ||||||||
Intersegment | – | 133 | – | 133 | ||||||||||||
| �� | ||||||||||||||||
TOTAL SALES | 1,868 | 519 | 4 | 2,391 | ||||||||||||
Freight, transportation and distribution | (235 | ) | – | (99 | ) 1 | (334 | ) | |||||||||
Cost of goods sold | (848 | ) | (390 | ) | 114 | 1, 4 | (1,124 | ) | ||||||||
GROSS MARGIN | 785 | 129 | 19 | 933 | ||||||||||||
Selling expenses | – | (5 | ) | (7 | ) 4 | (12 | ) | |||||||||
General and administrative expenses | – | (6 | ) | 1 | 3, 4 | (5 | ) | |||||||||
Provincial mining and other taxes | (151 | ) | – | (8 | ) 2, 4 | (159 | ) | |||||||||
Earnings of equity-accounted investees | – | – | 1 | 4 | 1 | |||||||||||
Other expenses | – | (13 | ) | (7 | ) 2, 4 | (20 | ) | |||||||||
EARNINGS BEFORE FINANCE COSTS AND INCOME TAXES | 634 | 105 | (1 | ) | 738 | |||||||||||
Depreciation and amortization | 232 | 113 | – | 345 | ||||||||||||
EBITDA | $ | 866 | $ | 218 | $ | (1 | ) | $ | 1,083 | |||||||
| 1 | To separately present legacy Agrium direct and indirect freight costs. |
| 2 | To separately present legacy Agrium provincial mining taxes. |
| 3 | To reclassify legacy Agrium costs related to business support functions to Others. |
| 4 | To allocate legacy PotashCorp all Others segment selling and administrative expenses to segment. |
NUTRIEN COMBINED HISTORICAL NITROGEN SEGMENT EBITDA FOR THE YEAR ENDED DECEMBER 31, 2017
| Dollars (millions) | Historical PotashCorp | Historical Agrium | Adjustments | Nutrien | ||||||||||||
SALES | ||||||||||||||||
External | $ | 1,395 | $ | 755 | $ | 387 | 2 | $ | 2,537 | |||||||
Intersegment | 74 | 254 | 121 | 2, 4 | 449 | |||||||||||
TOTAL SALES | 1,469 | 1,009 | 508 | 2,986 | ||||||||||||
Freight, transportation and distribution | (129 | ) | – | (218 | ) 1 | (347 | ) | |||||||||
Cost of goods sold | (1,046 | ) | (757 | ) | (243 | ) 1, 2, 4 | (2,046 | ) | ||||||||
Cost of intersegment purchases | (38 | ) | – | – | (38 | ) | ||||||||||
GROSS MARGIN | 256 | 252 | 47 | 555 | ||||||||||||
Selling expenses | – | (12 | ) | (19 | ) 2, 5 | (31 | ) | |||||||||
General and administrative expenses | – | (13 | ) | – | 2, 3, 5 | (13 | ) | |||||||||
Earnings of equity-accounted investees | – | – | 35 | 2, 5 | 35 | |||||||||||
Other expenses | – | (18 | ) | (7 | ) 2, 5 | (25 | ) | |||||||||
EARNINGS BEFORE FINANCE COSTS AND INCOME TAXES | 256 | 209 | 56 | 521 | ||||||||||||
Depreciation and amortization | 203 | 79 | 9 | 2, 4 | 291 | |||||||||||
EBITDA | $ | 459 | $ | 288 | $ | 65 | $ | 812 | ||||||||
| 1 | To separately present legacy Agrium direct and indirect freight costs. |
| 2 | To reclassify legacy wholesale other Agrium segment between Nitrogen and Phosphate and Sulfate. |
| 3 | To reclassify legacy Agrium costs related to business support functions to Others. |
| 4 | To record profit on legacy Agrium transfers of ammonia to Phosphate and Sulfate segment not previously recorded. |
| 5 | To allocate legacy PotashCorp all Others segment selling and administrative expenses to segment. |
| NUTRIEN 2018 | 80 | ANNUAL REPORT |
MANAGEMENT'S DISCUSSION AND ANALYSIS
NUTRIEN COMBINED HISTORICAL PHOSPHATE AND SULFATE SEGMENT EBITDA FOR THE YEAR ENDED DECEMBER 31, 2017
| Dollars (millions) | Historical PotashCorp | Historical Agrium | Adjustments | Nutrien | ||||||||||||
SALES | ||||||||||||||||
External | $ | 1,284 | $ | 115 | $ | (18 | ) 2, 5 | $ | 1,381 | |||||||
Intersegment | – | 122 | 58 | 2 | 180 | |||||||||||
TOTAL SALES | 1,284 | 237 | 40 | 1,561 | ||||||||||||
Freight, transportation and distribution | (173 | ) | – | (31 | ) 1, 5 | (204 | ) | |||||||||
Cost of goods sold | (1,441 | ) | (228 | ) | 56 | 1, 2, 3, 5 | (1,613 | ) | ||||||||
Cost of intersegment purchases | (36 | ) | – | – | (36 | ) | ||||||||||
GROSS MARGIN | (366 | ) | 9 | 65 | (292 | ) | ||||||||||
Selling expenses | – | (2 | ) | (6 | ) 4 | (8 | ) | |||||||||
General and administrative expenses | – | – | (8 | ) 2, 4 | (8 | ) | ||||||||||
Other expenses | – | (3 | ) | (4 | ) 2, 4 | (7 | ) | |||||||||
(LOSS) EARNINGS BEFORE FINANCE COSTS AND INCOME TAXES | (366 | ) | 4 | 47 | (315 | ) | ||||||||||
Depreciation and amortization | 220 | 17 | 3 | 2, 3 | 240 | |||||||||||
EBITDA | $ | (146 | ) | $ | 21 | $ | 50 | $ | (75 | ) | ||||||
| 1 | To separately present legacy Agrium direct and indirect freight costs. |
| 2 | To reclassify legacy wholesale other Agrium segment between Nitrogen and Phosphate and Sulfate. |
| 3 | To record incremental cost on legacy Agrium transfers of ammonia to Phosphate and Sulfate segment not previously recorded. |
| 4 | To allocate legacy PotashCorp all Others segment selling and administrative expenses to segment. |
| 5 | To reclassify certain phosphate products to Others segment. |
NUTRIEN COMBINED HISTORICAL OTHERS SEGMENT AND ELIMINATIONS EBITDA FOR THE YEAR ENDED DECEMBER 31, 2017
| Dollars (millions) | Historical PotashCorp | Historical Agrium | Adjustments | Nutrien | ||||||||||||
SALES | ||||||||||||||||
Intersegment | $ | – | $ | (696 | ) | $ | (176 | ) 1, 2, 9 | $ | (872 | ) | |||||
TOTAL SALES | – | (696 | ) | (176 | ) | (872 | ) | |||||||||
Cost of goods sold | – | 705 | 176 | 1, 2, 9 | 881 | |||||||||||
GROSS MARGIN | – | 9 | – | 9 | ||||||||||||
Selling and administrative expenses | (214 | ) | – | 214 | 10 | – | ||||||||||
Selling expenses | – | 17 | (2 | ) 10 | 15 | |||||||||||
General and administrative expenses | – | (121 | ) | (256 | ) 4, 5, 10 | (377 | ) | |||||||||
Share-based payments | – | (69 | ) | 69 | 4 | – | ||||||||||
Earnings of equity-accounted investees | 121 | – | (120 | ) 7, 10 | 1 | |||||||||||
Other expenses | (90 | ) | (127 | ) | (40 | ) 8, 10, 11 | (257 | ) | ||||||||
LOSS BEFORE FINANCE COSTS AND INCOME TAXES | (183 | ) | (291 | ) | (135 | ) | (609 | ) | ||||||||
Finance costs | (238 | ) | (101 | ) | (176 | ) 3, 6 | (515 | ) | ||||||||
Finance costs related to long-term debt | – | (210 | ) | 210 | 6 | – | ||||||||||
LOSS BEFORE INCOME TAXES | (421 | ) | (602 | ) | (101 | ) | (1,124 | ) | ||||||||
Income tax recovery (expense) | 180 | (203 | ) | 3 | 7 | (20 | ) | |||||||||
NET LOSS FROM CONTINUING OPERATIONS | (241 | ) | (805 | ) | (98 | ) | (1,144 | ) | ||||||||
Finance costs | 238 | 101 | 176 | 3, 6 | 515 | |||||||||||
Finance costs related to long-term debt | – | 210 | (210 | ) 6 | – | |||||||||||
Income tax (recovery) expense | (180 | ) | 203 | (3 | ) 7 | 20 | ||||||||||
Depreciation and amortization | 37 | 19 | – | 56 | ||||||||||||
EBITDA | $ | (146 | ) | $ | (272 | ) | $ | (135 | ) | $ | (553 | ) | ||||
| 1 | To eliminate sales made from legacy PotashCorp to legacy Agrium. |
| 2 | To eliminate incremental sales and cost of goods sold related to ammonia transfers to Phosphate and Sulfate segment. |
| 3 | Finance costs associated with Retail operations will be allocated to Retail segment, and presented in other expenses. |
| 4 | To reclassify legacy Agrium’s share-based payments to general and administrative expenses. |
| 5 | To reclassify legacy Agrium costs related to business support functions to Others. |
| 6 | To reclassify finance costs related to long-term debt to finance costs. |
| 7 | To eliminate the earnings of legacy PotashCorp’s investments in SQM and APC. |
| 8 | To eliminate the earnings of legacy PotashCorp’s investment in ICL. |
| 9 | To eliminate legacy PotashCorp intersegment sales between Nitrogen and Phosphate and Sulfate. |
| 10 | To allocate legacy PotashCorp all Others segment selling and administrative expenses to segments. |
| 11 | To reclassify certain phosphate products to Others segment. |
| NUTRIEN 2018 | 81 | ANNUAL REPORT |
EBITDA, ADJUSTED EBITDA AND POTASH ADJUSTED EBITDA
Most Directly Comparable IFRS financial measure: Net earnings (loss) from continuing operations.
Definition: EBITDA is calculated as net earnings (loss) from continuing operations before finance costs, income taxes and depreciation and amortization. Adjusted EBITDA is calculated as net earnings (loss) from continuing operations before finance costs, income taxes and depreciation and amortization, impairment, Merger and related costs, share-based compensation and defined benefit plans curtailment gain.
Why we use the measure and why it is useful to investors: As a valuation measurement it excludes the effects of items that primarily reflect the impact of long-term investment and financing decisions, rather than the performance of our day-to-day operations, and as a measure of our ability to service debt and to meet other payment obligations.
| Dollars (millions) | Nutrien 2018 | Nutrien 2017 1 | ||||||||||||||
Net (loss) earnings from continuing operations | $ | (31 | ) | $ | 656 | |||||||||||
Finance costs | 538 | 515 | ||||||||||||||
Income tax (recovery) expense | (93 | ) | 20 | |||||||||||||
Depreciation and amortization | 1,592 | 1,221 | ||||||||||||||
EBITDA | 2,006 | 2,412 | ||||||||||||||
Impairment of property, plant and equipment | 1,809 | 305 | ||||||||||||||
Merger and related costs | 170 | 178 | ||||||||||||||
Share-based compensation | 116 | 92 | ||||||||||||||
Defined benefit plans curtailment gain | (157 | ) | – | |||||||||||||
Adjusted EBITDA | $ | 3,944 | $ | 2,987 | ||||||||||||
Nutrien 2018 | Nutrien 2017 | |||||||||||||||
Potash EBITDA | $ | (203 | ) | $ | 1,083 | |||||||||||
Impairment of property, plant and equipment | 1,809 | – | ||||||||||||||
Potash adjusted EBITDA | $ | 1,606 | $ | 1,083 | ||||||||||||
| 1 | Amount presented is the combined historical financial results of PotashCorp and Agrium. |
ADJUSTED NET EARNINGS (AND THE RELATED PER SHARE AMOUNTS)
Most Directly Comparable IFRS financial measure:Net (loss) earnings from continuing operations and net (loss) earnings per share.
Definition: Net loss from continuing operations before purchase price allocation, impairment, Merger and related costs, share-based compensation, defined benefit plans curtailment gain and dividend income from discontinued operations net of tax.
Why we use the measure and why it is useful to investors: Focuses on the performance of our day-to-day operations excluding the effects of non-operating items.
| 2018 | ||||||||||||
| Dollars (millions), except per share amounts | Increases (Decreases) | Post-Tax | Per Share | |||||||||
Net loss from continuing operations | $ | (31 | ) | $ | (0.05 | ) | ||||||
Adjustments: | ||||||||||||
Purchase price allocation | $ | 211 | 161 | 0.26 | ||||||||
Impairment of property, plant and equipment | 1,809 | 1,320 | 2.11 | |||||||||
Merger and related costs | 170 | 130 | 0.21 | |||||||||
Share-based compensation | 116 | 89 | 0.14 | |||||||||
Defined benefit plans curtailment gain | (157 | ) | (120 | ) | (0.19 | ) | ||||||
Dividend income of SQM and APC | 156 | 130 | 0.21 | |||||||||
Adjusted net earnings | $ | 1,679 | $ | 2.69 | ||||||||
GROSS MARGIN EXCLUDING DEPRECIATION AND AMORTIZATION PER TONNE
Most Directly Comparable IFRS financial measure:Gross margin per tonne.
Definition: Gross margin less depreciation and amortization per tonne. (Reconciliations are provided on pages 42, 48 and 54.)
Why we use the measure and why it is useful to investors: Focuses on the performance of our day-to-day operations, which excludes the effects of items that primarily reflect the impact of long-term investment and financing decisions.
| NUTRIEN 2018 | 82 | ANNUAL REPORT |
MANAGEMENT'S DISCUSSION AND ANALYSIS
FREE CASH FLOW
Most Directly Comparable IFRS financial measure: Cash provided by operating activities.
Definition: Cash provided by operating activities less sustaining capital expenditures, cash provided by operating activities from discontinued operations and changes in non-cash operating working capital. Sustaining capital expenditures include the cost of replacements and betterments for our facilities.
Why we use the measure and why it is useful to investors: For evaluation of liquidity and financial strength, and as a component of employee remuneration calculations. It is also useful as an indicator of our ability to service debt, meet other payment obligations and make strategic investments. Free cash flow does not represent residual cash flow available for discretionary expenditures.
| Dollars (millions) | 2018 Nutrien | 2017 Nutrien 1 | ||||||||||||||
Cash provided by operating activities | $ | 2,052 | $ | 2,568 | ||||||||||||
Cash provided by operating activities from discontinued operations | (130 | ) | (200 | ) | ||||||||||||
Sustaining capital expenditures | (1,085 | ) | (1,018 | ) | ||||||||||||
Changes innon-cash operating working capital | 1,138 | (57 | ) | |||||||||||||
Free cash flow | $ | 1,975 | $ | 1,293 | ||||||||||||
| 1 | Amount presented is the combined historical financial results of PotashCorp and Agrium. |
POTASH CASH COPM
Most Directly Comparable IFRS financial measure: Cost of goods sold (COGS).
Definition: Potash COGS for the period excluding depreciation and amortization expense and inventory and other adjustments divided by the production tonnes for the period.
Why we use the measure and why it is useful to investors: To assess operational performance. Cash COPM excludes the effects of production from other periods and long-term investment decisions, supporting a focus on the performance of our day-to-day operations.
| Dollars (millions), except per tonne amounts | 2018 Nutrien | 2017 Nutrien 1 | ||||||||||||||
Total COGS – Potash | $ | 1,183 | $ | 1,124 | ||||||||||||
Change in inventory | (5 | ) | 36 | |||||||||||||
Other adjustments | (14 | ) | 20 | |||||||||||||
COPM | $ | 1,164 | $ | 1,180 | ||||||||||||
Depreciation and amortization included in COPM | (391 | ) | (378 | ) | ||||||||||||
Cash COPM | $ | 773 | $ | 802 | ||||||||||||
Production tonnes (tonnes - thousands) | 12,842 | 12,224 | ||||||||||||||
Potash cash COPM per tonne | $ | 60 | $ | 66 | ||||||||||||
| 1 | Amount presented is the combined historical financial results of PotashCorp and Agrium. |
UREA CONTROLLABLE CASH COPM
Most directly comparable IFRS financial measure: COGS.
Definition: Urea COGS for the Nitrogen segment excluding depreciation and amortization expense, cash COGS for products excluding urea, inventory and other adjustments and urea natural gas and steam costs, divided by the urea production tonnes for the period.
Why we use the measure and why it is useful to investors: To assess operational performance. Cash COPM excludes the effects of production from other periods and long-term investment decisions, supporting a focus on the performance of our day-to-day operations.
| Dollars (millions), except per tonne amounts | 2018 Nutrien | 2017 Nutrien 1 | ||||||||||||||
Total COGS – Nitrogen | $ | 2,079 | $ | 2,084 | ||||||||||||
Nitrogen depreciation and amortization | (429 | ) | (291 | ) | ||||||||||||
Cash COGS for products other than urea | (1,251 | ) | (1,421 | ) | ||||||||||||
Urea | ||||||||||||||||
Total cash COGS | $ | 399 | $ | 372 | ||||||||||||
Change in inventory and other adjustments | 70 | 52 | ||||||||||||||
Total cash COPM | $ | 469 | $ | 424 | ||||||||||||
Natural gas and steam costs | (221 | ) | (205 | ) | ||||||||||||
Controllable cash COPM | $ | 248 | $ | 219 | ||||||||||||
Production (tonnes - thousands) | 3,422 | 2,891 | ||||||||||||||
Urea controllable cash COPM per tonne | $ | 72 | $ | 76 | ||||||||||||
| 1 | Amount presented is the combined historical financial results of PotashCorp and Agrium. |
| NUTRIEN 2018 | 83 | ANNUAL REPORT |
RETAIL NORMALIZED COMPARABLE STORE SALES
Most directly comparable IFRS financial measure: Retail sales from comparable base as a component of total Retail sales.
Definition: Retail normalized comparable store sales is determined by adjusting prior year comparable store sales for published potash, nitrogen and phosphate benchmark prices and foreign exchange rates used in the current year. We retain sales of closed locations in the comparable base if the closed location is in close proximity to an existing location, unless we plan to exit the market area or are unable to economically or logistically serve it. We do not adjust for temporary closures, expansions or renovations of stores.
Why we use the measure and why it is useful to investors: Evaluate sales growth by adjusting for fluctuations in commodity prices and foreign exchange rates. Included are locations owned by us for more than 12 months.
| Dollars (millions), except percentage amounts | 2018 Nutrien | 2017 Nutrien 1 | ||||||||||||||
Sales from comparable base | ||||||||||||||||
Current period | $ | 12,253 | $ | 11,782 | ||||||||||||
Prior period | 12,103 | 11,766 | ||||||||||||||
Comparable store sales (%) | 1% | 0% | ||||||||||||||
Prior period normalized for benchmark prices and foreign exchange rates | 12,363 | 11,509 | ||||||||||||||
Normalized comparable store sales (%) | (1% | ) | 2% | |||||||||||||
| 1 | Amount presented is the combined historical financial results of PotashCorp and Agrium. |
RETAIL AVERAGE WORKING CAPITAL TO SALES
Most directly comparable IFRS financial measure: (Current assets minus current liabilities for Retail) divided by Retail sales.
Definition: Retail average working capital divided by sales for the last four rolling quarters.
Why we use the measure and why it is useful to investors: To evaluate operational efficiency. A lower or higher percentage represents increased or decreased efficiency, respectively.
| Rolling four quarters ended December 31, 2018 | ||||||||||||||||||||
| Dollars (millions), except percentage amounts | Q1 2018 | Q2 2018 | Q3 2018 | Q4 2018 | Average/Total | |||||||||||||||
Working capital | $ | 1,781 | $ | 3,170 | $ | 3,633 | $ | 2,312 | $ | 2,724 | ||||||||||
Sales | 2,099 | 6,342 | 2,175 | 2,054 | 12,670 | |||||||||||||||
Average working capital to sales | 21% | |||||||||||||||||||
RETAIL CASH OPERATING COVERAGE RATIO
Most directly comparable IFRS financial measure: Retail expenses below gross margin as a percentage of Retail gross margin.
Definition: Retail gross margin less depreciation and amortization, EBIT and Merger-related adjustments, divided by Retail gross margin excluding depreciation and amortization expense in cost of goods sold.
Why we use the measure and why it is useful to investors: To understand the costs and underlying economics of our Retail operations and to assess our Retail operating performance and ability to generate free cash flow.
| Rolling four quarters ended December 31, 2018 | ||||||||||||||||||||
| Dollars (millions), except percentage amounts | Q1 2018 | Q2 2018 | Q3 2018 | Q4 2018 | Total | |||||||||||||||
Gross margin | $ | 408 | $ | 1,432 | $ | 533 | $ | 662 | $ | 3,035 | ||||||||||
Depreciation and amortization in cost of goods sold | 2 | 2 | 1 | 2 | 7 | |||||||||||||||
Gross margin excluding depreciation and amortization | $ | 410 | $ | 1,434 | $ | 534 | $ | 664 | $ | 3,042 | ||||||||||
EBIT | (133 | ) | 764 | (6 | ) | 82 | 707 | |||||||||||||
Depreciation and amortization | 123 | 122 | 122 | 132 | 499 | |||||||||||||||
Merger-related adjustments1 | 14 | 12 | 6 | 8 | 40 | |||||||||||||||
Operating expenses excluding depreciation and amortization | ||||||||||||||||||||
and Merger-related adjustments | $ | 406 | $ | 536 | $ | 412 | $ | 442 | $ | 1,796 | ||||||||||
1 Adjusted for the impact of Merger-related presentation adjustments. |
| |||||||||||||||||||
Cash operating coverage ratio (%) | 59% | |||||||||||||||||||
ADJUSTED NET DEBT
Most directly comparable IFRS financial measure: Long-term debt.
Definition: Long-term debt less net unamortized fair value adjustments plus short-term debt and current portion of long-term debt.
Why we use the measure and why it is useful to investors: As a component of adjusted net debt to adjusted EBITDA, it is used to evaluate our ability to pay our debts. See note 25 to the financial statements for a reconciliation of adjusted net debt.
| NUTRIEN 2018 | 84 | ANNUAL REPORT |
MANAGEMENT'S DISCUSSION AND ANALYSIS
Community Investment | Represents cash disbursements, matching of employee gifts and in-kind contributions of equipment, goods and services and employee volunteerism (on corporate time). | |
Compound Annual Growth Rate (CAGR) | CAGR is the rate of return that would be required for an investment to grow from its beginning balance to its ending balance assuming the profits were reinvested at the end of each year of the investment’s lifespan. | |
Environmental Incidents | Number of incidents includes release quantities that exceed the US Comprehensive Environmental Response, Compensation, and Liability Act (CERCLA) limits, in Potash facilities any release that exceeds Saskatchewan Release Limits (based on the Saskatchewan Environmental Code), non-compliance incidents that exceed $10 thousand in costs to reach compliance or enforcement actions with fines exceeding $1 thousand. | |
Employee Turnover Rate | The number of permanent employees who left the Company (due to deaths and voluntary and involuntary terminations, and excluding retirements and announced workforce reductions) as a percentage of average total employees during the year. Retirements and terminations of temporary employees are excluded. | |
Investing Capital | Capital for significant expansions of current operations or to create cost savings (synergies), including capitalized interest. Investing capital excludes capital outlays for business acquisitions and equity-accounted investees. | |
Net Sales | Sales minus freight, transportation and distribution expenses. | |
Lost-Time Injury Frequency | Total lost-time injuries for every 200,000 hours worked for all Nutrien employees, contractors and others on site. Calculated as the total lost-time injuries multiplied by 200,000 hours worked divided by the actual number of hours worked. | |
Merger | The merger of equals transaction between PotashCorp and Agrium completed effective January 1, 2018, pursuant to which PotashCorp and Agrium combined their businesses pursuant to a statutory plan of arrangement under theCanada Business Corporations Act and became wholly owned subsidiaries of Nutrien Ltd. | |
Purchase Price Allocation (PPA) | The allocation of the purchase price in a business combination to the fair values of assets acquired and liabilities assumed. The PPA adjustments impacted net earnings primarily through increased depreciation and amortization and decreased finance costs. | |
Sustaining Capital | Sustaining capital expenditures are required to sustain operations at existing levels and include major repairs and maintenance and plant turnarounds. | |
Taxes and Royalties | Includes tax and royalty amounts on an accrual basis calculated as: current income tax expense from continuing and discontinued operations minus investment tax credits and realized excess tax benefit related to share-based compensation plus potash production tax, resource surcharge, royalties, municipal taxes and other miscellaneous taxes. | |
Total Recordable Injury Frequency | Total recordable injuries for every 200,000 hours worked for all Nutrien employees, contractors and others on site. Calculated as the total recordable injuries multiplied by 200,000 hours worked divided by the actual number of hours worked. | |
Total Shareholder Return | Return on investment in Nutrien shares from the time the investment is made based on two components: (1) growth in share price and (2) return from reinvested dividend income on the shares. | |
Working Capital Ratio | Current assets divided by current liabilities. | |
| NUTRIEN 2018 | 87 | ANNUAL REPORT |