Exhibit 99.1
NUTRIEN LTD.
ALLAN
NATIONAL INSTRUMENT 43-101 TECHNICAL REPORT ON
ALLAN POTASH DEPOSIT (KL 112R B),
SASKATCHEWAN, CANADA
FEBRUARY 25, 2022
NUTRIEN LTD.
GEOSERVICES & LAND—ENGINEERING, TECHNOLOGY & CAPITAL
SUITE 1700, 211 19TH STREET EAST
SASKATOON, SASKATCHEWAN, CANADA
S7K 5R6
QUALIFIED PERSON: CRAIG FUNK, P. ENG., P. GEO.
DATE AND SIGNATURE PAGE
The scientific and technical information included in this report has been prepared under the supervision of persons who are ‘‘qualified persons’’ under Canadian National Instrument 43-101. Craig Funk, P. Eng., P. Geo. is the qualified person who supervised the preparation of the information presented in this report and who verified the data disclosed herein.
/s/ “Craig Funk” | ||||||||
Signature | Craig Funk, P. Eng., P. Geo. | |||||||
Director, GeoServices & Land Nutrien Ltd. | ||||||||
Date | February 25, 2022 |
2
AUTHOR PAGE
The scientific and technical information included in this report has been prepared by, or under the supervision of, persons who are ‘‘qualified persons’’ under Canadian National Instrument 43-101.
Craig Funk, B. Sc., M.Sc., P. Eng., P. Geo. (APEGS Member # 16034)
• | Director, GeoServices & Land—Engineering, Technology & Capital |
• | B. Sc. (Geological Engineering – Geophysics), University of Saskatchewan, Saskatoon, Saskatchewan, Canada, 1989 |
• | M. Sc. (Geophysics), University of Saskatchewan, Saskatoon, Saskatchewan, Canada, 1992 |
• | with Nutrien or its subsidiaries since 2008 |
is the qualified person who supervised the preparation of all information presented in this report and who verified the data disclosed herein.
The team of persons who conducted the majority of the work presented in this report consists of:
Jodi Derkach, B. Sc., Cert. GIS, P. Geo. (APEGS Member # 14897)
• | Senior Manager, Land & Resource—Engineering, Technology & Capital |
• | B. Sc. (Geology), University of Saskatchewan, Saskatoon, Saskatchewan, Canada, 2007 |
• | Geographic Information Science for Resource Management Certificate, Saskatchewan Polytechnic, Prince Albert, Saskatchewan, Canada, 2010 |
• | with Nutrien or its subsidiaries since 2010 |
Lisa MacKenzie, Cert. GIS
• | Senior Advisor, Land—Engineering, Technology & Capital |
• | Geographic Information Science for Resource Management Certificate, Saskatchewan Polytechnic, Prince Albert, Saskatchewan, Canada, 2012 |
with Nutrien or its subsidiaries since 2012
Jennifer Nicolay Lawlor, B. Sc., P. Geo. (APEGS Member # 16167)
• | Senior Advisor, Land & Resource – Engineering, Technology & Capital |
• | B. Sc. (Geology), University of Regina, Regina, Saskatchewan, Canada, 2008 |
• | with Nutrien or its subsidiaries since 2013 |
3
TABLE OF CONTENTS
DATE AND SIGNATURE PAGE | 2 | |||||
AUTHOR PAGE | 3 | |||||
TABLE OF CONTENTS | 4 | |||||
LIST OF FIGURES | 6 | |||||
LIST OF TABLES | 7 | |||||
1.0 | SUMMARY | 8 | ||||
2.0 | INTRODUCTION | 10 | ||||
3.0 | RELIANCE ON OTHER EXPERTS | 11 | ||||
4.0 | PROPERTY DESCRIPTION AND LOCATION | 11 | ||||
4.1 | GENERAL | 11 | ||||
4.2 | MINERAL RIGHTS | 12 | ||||
5.0 | ACCESSIBILITY, CLIMATE, LOCAL RESOURCES, INFRASTRUCTURE AND PHYSIOGRAPHY | 13 | ||||
6.0 | HISTORY | 14 | ||||
7.0 | GEOLOGICAL SETTING AND MINERALIZATION | 15 | ||||
8.0 | DEPOSIT TYPE | 16 | ||||
9.0 | EXPLORATION | 17 | ||||
10.0 | DRILLING | 19 | ||||
11.0 | SAMPLING PREPARATION, ANALYSES AND SECURITY | 21 | ||||
11.1 | BASIC APPROACH | 21 | ||||
11.2 | MEAN POTASH MINERAL GRADE FROM IN-MINE SAMPLES | 23 | ||||
11.3 | POTASH ORE DENSITY FROM IN-MINE MINERAL GRADE MEASUREMENTS | 24 | ||||
12.0 | DATA VERIFICATION | 25 | ||||
12.1 | ASSAY DATA | 25 | ||||
12.2 | EXPLORATION DATA | 25 | ||||
13.0 | MINERAL PROCESSING AND METALLURGICAL TESTING | 26 | ||||
14.0 | MINERAL RESOURCE ESTIMATES | 26 | ||||
14.1 | DEFINITIONS OF MINERAL RESOURCE | 26 |
4
14.2 | ALLAN POTASH RESOURCE CALCULATIONS | 27 | ||||
15.0 | MINERAL RESERVE ESTIMATES | 28 | ||||
15.1 | DEFINITIONS OF MINERAL RESERVE | 28 | ||||
15.2 | ALLAN POTASH RESERVE CALCULATIONS | 29 | ||||
16.0 | MINING METHOD | 30 | ||||
16.1 | MINING OPERATIONS | 30 | ||||
16.2 | RISKS TO POTASH MINING OPERATIONS, WITH EMPHASIS ON WATER INFLOWS | 32 | ||||
17.0 | RECOVERY METHODS | 32 | ||||
18.0 | PROJECT INFRASTRUCTURE | 34 | ||||
19.0 | MARKET STUDIES AND CONTRACTS | 34 | ||||
20.0 | ENVIRONMENTAL STUDIES, PERMITTING, AND SOCIAL OR COMMUNITY IMPACT | 38 | ||||
21.0 | CAPITAL AND OPERATING COSTS | 39 | ||||
22.0 | ECONOMIC ANALYSIS | 39 | ||||
22.1 | FUNDAMENTALS | 39 | ||||
22.2 | TAXES | 40 | ||||
23.0 | ADJACENT PROPERTIES | 41 | ||||
24.0 | OTHER RELEVANT DATA AND INFORMATION | 41 | ||||
25.0 | INTERPRETATION AND CONCLUSIONS | 41 | ||||
26.0 | RECOMMENDATIONS | 41 | ||||
27.0 | REFERENCES | 42 |
5
LIST OF FIGURES
Unless otherwise noted, figures for which a source and / or date are not provided are current as of the effective date of this report and were prepared by the Company.
Figure 1: Aerial photo of Allan surface operations, 2012 | 8 | |||
Figure 2: Actual finished potash products production from the Allan mine over the past 10 years (in million tonnes per year) | 9 | |||
Figure 3: Map showing location of Nutrien Operations, including Allan | 11 | |||
Figure 4: Nutrien’s potash operations, including Allan, relative to potash mineralization (pink) in Saskatchewan | 12 | |||
Figure 5: Map showing Allan Crown Lease KL 112R B (blue) | 13 | |||
Figure 6: Map showing infrastructure near Allan. Allan surface operations shown as red dot | 14 | |||
Figure 7: Vertical section showing basic layered-Earth stratigraphy in a typical Saskatchewan potash region | 15 | |||
Figure 8: Geophysical wireline logs showing basic stratigraphy of the Prairie Evaporite Formation in the Saskatoon area | 16 | |||
Figure 9: Cross-section of the Prairie Evaporite Formation across southern Saskatchewan showing relative position of potash members | 17 | |||
Figure 10: Potash exploration at Allan including 3D seismic (purple), 2D seismic infill (orange lines), and potash drillholes (black dots) | 18 | |||
Figure 11: A seismic section showing relative rock velocities and major geological units at Nutrien’s conventional potash operations | 19 | |||
Figure 12: Stratigraphic section showing local nomenclature at, and adjacent to, the mining horizon | 20 | |||
Figure 13: Potash assay plot for PCS Allan 09-27-034-01 W3 indicating the best 3.35 m (11’) mining interval | 22 | |||
Figure 14: Histogram of potash ore grade from 7,584 Allan in-mine grade samples (data from 1968 through to the end of 2021) | 23 | |||
Figure 15: Map showing Allan Mineral Resource as of December 2021 | 28 | |||
Figure 16: Map showing Allan Mineral Reserve to December 2021 | 30 | |||
Figure 17: Schematic cross-section through the Prairie Evaporite Formation, illustrating mining horizons at each of Nutrien’s conventional potash operations | 31 | |||
Figure 18: Mined tonnes, product tonnes, and concentration ratio for the Allan mine over the past 10 years | 32 | |||
Figure 19: Simplified flow diagram for potash flotation and crystallization milling methods used at Allan | 33 | |||
Figure 20: Allan mill recovery rate over the past 10 years | 33 | |||
Figure 21: Historical Company potash sales 2012 to 2021 in million tonnes / year | 35 | |||
Figure 22: Historical Company potash net sales 2012 to 2021 in million USD $ / year2 | 36 | |||
Figure 23: World potash production and demand for 2021E | 36 | |||
Figure 24: World potash shipments and consumption, 2016-2021E | 37 | |||
Figure 25: Aerial photo showing the Allan surface operations, disposal wells, and Tailings Management Area | 39 | |||
Figure 26: Historic annual average realized potash price in USD / tonne | 40 |
6
LIST OF TABLES
Table 1: Potash Mineral Resources and Reserves for Allan, as of December 31, 2021 | 10 | |||
Table 2: Assay results for all potash test holes within Allan Lease KL 112R B | 21 | |||
Table 3: Values for potash assay plot in Figure 13 | 22 | |||
Table 4: Primary Potash Market Profile | 37 |
7
EFFECTIVE DATE OF REPORT
The effective date of this report is December 31, 2021, other than where otherwise noted.
1.0 | SUMMARY |
Effective January 1, 2018, Potash Corporation of Saskatchewan Inc. (“PotashCorp”) and Agrium Inc. (“Agrium”) completed a court-approved plan of arrangement (the “Arrangement”), involving, among others, PotashCorp, Agrium and Nutrien Ltd. (“Nutrien”) the new parent company of PotashCorp and Agrium. As a result of completing the Arrangement, PotashCorp and Agrium are wholly-owned subsidiaries of Nutrien. References to “the Company” means Nutrien, indirectly through PotashCorp, or, for references prior to the completion of the Arrangement, PotashCorp, as the context requires.
Nutrien is the world’s largest provider of crop inputs and services, with operations and investments in 13 countries. It produces the three primary plant nutrients: potash, phosphate, and nitrogen. It also has a retail network that services every major growing region of the world.
Nutrien is a corporation organized under the Canada Business Corporations Act, the common shares of which listed and publicly traded on the Toronto and New York stock exchanges (symbol NTR).
The Company owns and operates a potash mine at Allan, Saskatchewan, Canada (“Allan mine” or “Allan”). An aerial view of the Allan surface operations is shown in Figure 1. The Allan Crown Subsurface Mineral Lease is numbered KL 112R B and was expanded in January 2020. Production of potash from the Allan mine began in 1968.
Figure 1: Aerial photo of Allan surface operations, 2012.
In 2021, annual nameplate capacity for Allan was 4.0 million tonnes and annual operational capability is 3.0 million tonnes of finished potash products (concentrated KCl). Estimates of nameplate capacity are based on capacity as per design specifications or Canpotex entitlements once these have been determined. Operational capability is the estimated annual achievable production level at current staffing and operational readiness (estimated at beginning of year), not including any inventory-related shutdowns and unplanned downtime and may vary during the year and year-to-year including as between our potash operations.
8
While the term potash refers to a wide variety of potassium bearing minerals, in the Allan region of Saskatchewan, the predominant potash mineralization is sylvinite, which is comprised mainly of the minerals sylvite (KCl / potassium-salt) and halite (NaCl / rock salt), with minor amounts water insolubles. Carnallite (KMgCl3 · 6H2O) occurs only in trace amounts at Allan. Potash fertilizer is concentrated, nearly pure KCl (i.e. greater than 95% pure KCl), but ore grade is traditionally reported on a % K2O equivalent basis. The “% K2O equivalent” gives a standard measurement of the nutrient value of different potassium-bearing rocks and minerals. To convert from % K2O equivalent tonnes to actual KCl tonnes, multiply by 1.58.
The Allan mine is a conventional underground mining operation whereby continuous mining machines are used to excavate the potash ore by the stress-relief mining method, with continuous conveyor belt transport of ore from the mining face to the bottom of the production shaft. In addition to hoisting potash ore to surface, the production shaft also provides fresh air ventilation to the mine and serves as a secondary egress. The Service Shaft is used for service access, and exhaust ventilation from the mine. Raw potash ore is processed and concentrated on surface and concentrated finished potash products (near-pure KCl) are sold and shipped to markets in North America and offshore.
Virtually all Allan underground mining rooms are in the potash mineralized zone situated approximately 12 m below the top of the host evaporite salt, the Prairie Evaporite Formation. More specifically, the Allan mine is located within the Patience Lake Member of the Prairie Evaporite Formation. In this Member, there are two potash seams named A Zone (the upper seam) and B Zone (the lower seam); at present, only the A Zone is being mined at Allan. Mine elevations range from approximately 980 m to 1,120 m. These depths to A Zone potash mineralization are anticipated over most of the Allan lease area. Mine workings are protected from aquifers in overlying formations by salt and potash beds which overlie the mineralized zone. Conservative local extraction ratios (never exceeding 45% in any mining block) are employed at Allan to minimize potential detrimental effects of mining on overlying strata; this is common practice in flat-lying, tabular ore bodies overlain by water-bearing layers.
Part of the normal surface infrastructure associated with operating the potash mine in Saskatchewan includes waste disposal on the land and disposal of salt brine into deep subsurface aquifers. The Company stows salt tailings within an engineered and licensed Tailings Management Area (TMA) and operates two brine disposal wells near the surface plant of the Allan mine.
Since opening in 1968, 171.984 million tonnes of potash ore have been mined and hoisted at Allan to produce 60.700 million tonnes of finished potash products. The life-of-mine average concentration ratio (raw ore / finished potash products) is 2.83 and the overall extraction ratio over this period is 33%. Actual production of finished potash products at Allan for the last 10 years is shown in Figure 2.
Figure 2: Actual finished potash products production from the Allan mine over the past 10 years (in million tonnes per year).
Over the past three years (2019, 2020, 2021), actual potash production at Allan has totaled:
• | 21.746 million tonnes of ore mined and hoisted (7.249 million tonnes per year, on average) |
• | 7.751 million tonnes of finished potash products produced (2.584 million tonnes per year, on average) |
• | Average mill feed ore grade was 25.1% K20 equivalent |
• | Average concentration ratio (ore mined / potash produced) was 2.80 |
9
The Canadian Institute of Mining and Metallurgy and Petroleum (CIM) has defined Mineral Resources and Reserves in The CIM Definition Standards for Mineral Resources and Reserves (2014). Based on these guidelines, all mineral rights owned or leased by the Company at Allan can be assigned to Mineral Resource categories (Inferred, Indicated, and Measured) and Mineral Reserve categories (Probable and Proven). Mineral Resources (reported as in-place tonnes) and Mineral Reserves (reported as recoverable ore tonnes) for Allan as of December 31, 2021, are outlined in Table 1. Mineral Resources reported are exclusive of Mineral Reserves.
Table 1: Potash Mineral Resources and Reserves for Allan, as of December 31, 2021.
Proven Mineral Reserve (millions of tonnes recoverable ore) | 107 | |||
Probable Mineral Reserve (millions of tonnes recoverable ore) | 244 | |||
|
| |||
Total Mineral Reserve (millions of tonnes recoverable ore) | 351 | |||
Measured Mineral Resource - A Zone (millions of tonnes in-place) | 1,183 | |||
Measured Mineral Resource - B Zone (millions of tonnes in-place) | 1,707 | |||
Indicated Mineral Resource - A Zone (millions of tonnes in-place) | 2,533 | |||
Indicated Mineral Resource - B Zone (millions of tonnes in-place) | 2,545 | |||
Inferred Mineral Resource - A Zone (millions of tonnes in-place) | 1,164 | |||
Inferred Mineral Resource - B Zone (millions of tonnes in-place) | 1,169 | |||
|
| |||
Total Mineral Resource (millions of tonnes in-place) | 10,301 | |||
Average % K2O Grade - A Zone (from Allan in-mine samples) | 24.7 | % | ||
Average % K2O Grade - B Zone (from Lanigan in-mine samples) | 20.2 | % | ||
|
| |||
Years of Remaining Mine Life | 48 |
Potash production in any given year at the Allan potash mine is a function of many variables, so actual production in any given year can vary dramatically from tonnages produced in previous years. The Mineral Reserve tonnage and historic average production are used to estimate remaining mine life. If the average mining rate seen over the past three years (7.249 million tonnes of potash ore mined and hoisted per year) is sustained, and if Mineral Reserves remain unchanged, then the Allan mine life is 48 years from December 31, 2021.
The mining of potash is a capital-intensive business subject to the normal risks and capital expenditure requirements associated with mining operations. The production and processing of ore may be subject to delays and costs resulting from mechanical failures and such hazards as: unusual or unexpected geological conditions, subsidence, water inflows of varying degree, and other situations associated with any potash mining operation.
2.0 | INTRODUCTION |
The purpose of this document is to give a formal reporting of potash Mineral Resource and Reserve for Allan, and to provide a description of the method used to compute Mineral Resource and Reserve tonnages. Sources of geological and geotechnical information analysed from this study include:
• | Publicly available geological maps, reports, and publications (listed in Section 27.0) |
• | Internal reports on historic exploration drillholes |
• | Hydrogeological analysis conducted in historic exploration drillholes |
• | Geological studies conducted at the Allan mine over the past 50+ years |
• | In-mine geophysical studies conducted at the Allan mine over the past 50+ years |
• | Geotechnical studies conducted for the Allan mine over the past 50+ years |
• | 2D surface seismic exploration data (approximately 366 linear km collected to date) |
• | 3D surface seismic exploration data (an area covering approximately 640 km2 to date) |
All data and reports are archived at the Nutrien corporate office in Saskatoon, the Allan mine site, or secure offsite commercial document storage facilities. In addition, drillhole data (well-log data, drilling reports, drill-stem test results, etc.) are archived with the Saskatchewan Ministry of Energy & Resources, Integrated Resource Information System (IRIS), and surface seismic data (shot records and stack) are archived through an offsite commercial data storage service.
All geological and geophysical data and information presented in this report were personally reviewed and inspected by qualified geoscience staff at Nutrien who are registered with the Association of Professional Engineers and Geoscientists of Saskatchewan (APEGS) under the supervision of Craig Funk (P. Eng., P. Geo., Director, GeoServices & Land). Mr. Funk last visited Allan on October 19, 2021. All reserve and resource estimates and mineral rights data presented in this report were personally evaluated and reviewed by the authors of this report. Each of these staff collaborates with Allan personnel multiple times per year.
10
The authors would like to thank the many staff who provided information and expert reviews on portions of this report.
3.0 | RELIANCE ON OTHER EXPERTS |
Responsibility for the accuracy of the technical data presented in this report is assumed by the authors. Outside experts were not used in the preparation of this report.
4.0 | PROPERTY DESCRIPTION AND LOCATION |
4.1 | GENERAL |
The Allan mine is located in central Saskatchewan, approximately 45 kilometers east of the city of Saskatoon, Saskatchewan. The general location is shown on the map in Figure 3.
Figure 3: Map showing location of Nutrien Operations, including Allan.
The legal land description (Saskatchewan Township / Range) of the Allan surface plant is Section 22 Township 34 Range 01 West of 3rd Meridian. More precisely, the Allan Shaft #2 collar is located at:
– | Latitude: | 51 degrees 55 minutes 55.56 seconds North | ||
– | Longitude: | 106 degrees 04 minutes 18.84 seconds West | ||
– | Elevation: | 524.26 metres above mean Sea Level (SL) | ||
– | Easting: | 426,303.225 m | ||
– | Northing: | 5,754,028.978 m | ||
– | Projection: | UTM | ||
– | Datum: | NAD83 | ||
– | Zone: | 13 |
11
The Company owns approximately 3,404 hectares (8,411 acres) of surface rights required for current Allan mine operations, including all areas covered by the existing surface plant and TMA, and all surface lands required for anticipated future Allan mine and expanded milling operations.
All permits and approvals required for the operation of a potash mine in Saskatchewan are in place at Allan.
Figure 4 is a more detailed map showing the location of Allan relative to the potash deposits in Saskatchewan.
Figure 4: Nutrien’s potash operations, including Allan, relative to potash mineralization (pink) in Saskatchewan.
4.2 | MINERAL RIGHTS |
Mineral rights at Allan are mined pursuant to mining leases with the Province of Saskatchewan, Canada (the Crown), and with non-Crown (Freehold) mineral rights owners. Crown mineral rights are governed by The Subsurface Mineral Tenure Regulations, 2015, and Crown Leases are approved and issued by the Saskatchewan Ministry of Energy & Resources.
The original Allan Crown Subsurface Mineral Lease, numbered KL 112, was entered into in September 1962. In the following years, minor amendments were made to the Lease, resulting in Crown Subsurface Mineral Lease KL 112R. In October 2017, a large area of land totaling 20,784 hectares (51,359 acres) was added to the Lease resulting in Crown Subsurface Mineral Lease KL 112R A. In January 2020, an area of land totaling 5,838 hectares (14,427 acres) was added to KL 112R A, resulting in Crown Subsurface Mineral Lease KL 112R B (the “Allan Crown Lease”) as shown in Figure 5 which covers an area of approximately 80,950 hectares (200,032 acres). At Allan, the Company has leased potash mineral rights for 50,688 hectares (125,253 acres) of Crown Land and owns or has leased approximately 26,298 hectares (64,984 acres) of Freehold Land within the lease boundary. The Allan Crown Lease term is for a period of 21 years from September 2004, with renewals (at the Company’s option) for 21-year periods. Freehold Lands also remain under lease providing, generally, that production is continuing and that there is a continuation of the Crown Lease.
12
Within the Allan Crown Lease area, 19,183 hectares (47,403 acres) are mined pursuant to unitization agreements with mineral rights holders (Crown and Freehold) within two unitized areas.
When underground workings of a potash mine are designed, there are inevitably regions that are mined with higher mining extraction (e.g. production panels) and other regions where mining extraction is lower (e.g. conveyor-belt development rooms). To treat mineral rights holders in both low extraction and high extraction areas fairly, and to promote good mining practices, a unitization agreement is the preferred method for determining royalty payouts. Under a unitization agreement, each mineral rights holder is paid a royalty based on their proportional share of the entire Unit Area regardless of whether their lands are mined. For example, if one mineral rights holder owns rights to 4,000 hectares within a 40,000-hectare Unit Area, they would be paid 10% of the total monthly royalty payout from that Unit Area.
Figure 5: Map showing Allan Crown Lease KL 112R B (blue).
5.0 | ACCESSIBILITY, CLIMATE, LOCAL RESOURCES, INFRASTRUCTURE AND PHYSIOGRAPHY |
The Allan mine surface facilities are accessed by an existing paved road that is part of the Saskatchewan Provincial Highway System. All potash product is shipped by rail over existing track. Location of Allan with respect to the features described in this section (major road and rail infrastructure, as well as nearby river systems) is shown in Figure 6.
The Allan mine is served by a number of villages within 50 kilometres of the mine site. The nearest city is Saskatoon (45 km distant).
Allan is situated near the northern extent of the Great Plains of North America. Topography is relatively flat, with gently rolling hills and occasional valleys. There are no rivers or other major watercourse channels near the Allan mine site. Climate at the Allan mine is typical for an inland prairie location at latitude 52º North (often characterized as “mid-latitude steppe” climate).
13
Part of the normal surface infrastructure associated with operating the potash mine in Saskatchewan includes waste disposal on the land and disposal of salt brine into deep subsurface aquifers. Facilities to carry out all aspects of these tasks are in place at Allan (see Section 20.0).
Figure 6: Map showing infrastructure near Allan. Allan surface operations shown as red dot.
6.0 | HISTORY |
Ten potash mines were brought into production in Saskatchewan between 1962 to 1970. With over 50 years of production history, most potash mines have contracted or expanded production in response to the demand for potash. No new mines had been commissioned until 2017. Most of the operating mines are conventional underground mines, while three operate using solution mining methods.
Exploration drilling for potash in the Allan area was carried out in the 1950s and 1960s. The Allan mine was built by a consortium of companies (U. S. Borax, Homestake Potash Company, and Swift Canadian Company) in the 1960s. Potash production began at Allan in April 1968 and the mine has run on a continuous basis since then (other than short-term shutdowns taken for inventory management purposes or occasional plant maintenance and construction work, or other outages that are typical for operations of this nature).
PotashCorp acquired a 60% ownership of the Allan mine in 1978 (through purchase of the U. S. Borax and Swift Canadian interests) and became the operator of the mine in 1981. In 1990, PotashCorp purchased the remaining 40% interest.
Effective January 1, 2018, PotashCorp and Agrium completed the Arrangement. As a result of completing the Arrangement, PotashCorp and Agrium are wholly-owned subsidiaries of Nutrien.
Both flotation and crystallization methods are used at Allan to produce granular, standard, and industrial grade potash used for agricultural applications and industrial purposes. Debottlenecking and compaction expansion projects were completed at Allan during two phases of construction in 2005 and 2007. A major refurbishment and expansion of the Allan mine was completed in 2013, increasing nameplate capacity to 4.0 million tonnes of finished potash products per year.
14
7.0 | GEOLOGICAL SETTING AND MINERALIZATION |
Much of southern Saskatchewan is underlain by the Prairie Evaporite Formation, a layered sequence of salts and anhydrite which contains one of the world’s largest deposits of potash. The potash extracted from the predominantly sylvinite ore has its main use as a fertilizer. A map showing the extent of the potash deposits in Saskatchewan is shown in Figure 4.
The 100 m to 200 m thick Prairie Evaporite Formation is overlain by approximately 500 m of Devonian carbonates, followed by 100 m of Cretaceous sandstone, and 400 m of Cretaceous shales and Pleistocene glacial tills to surface; it is underlain by Devonian carbonates (Fuzesy, 1982). The Phanerozoic stratigraphy of Saskatchewan is remarkable in that units are flat-lying and relatively undisturbed over very large areas. A geological section representing Saskatchewan stratigraphy is shown in Figure 7 (modified from Fuzesy, 1982). A geological section representing the Prairie Evaporite Formation stratigraphy in the Saskatoon area is shown in Figure 8 (modified from Fuzesy, 1982).
Figure 7: Vertical section showing basic layered-Earth stratigraphy in a typical Saskatchewan potash region.
15
Potash mineralization in this region of Saskatchewan is predominantly sylvinite, which is comprised mainly of the minerals sylvite (KCl) and halite or rock salt (NaCl), with trace carnallite (KMgCl3 · 6H2O) and minor water insolubles. Potash fertilizer is concentrated, nearly pure KCl (i.e. greater than 95% pure KCl), but ore grade is traditionally reported on a % K2O equivalent basis. The “% K2O equivalent” gives a standard measurement of the nutrient value of different potassium-bearing rocks and minerals. To convert from % K2O equivalent tonnes to actual KCl tonnes, multiply by 1.58.
Over the past three years (2019, 2020, 2021), the average, measured potash ore grade of the mill feed at Allan was 25.1% K20 equivalent. The average ore grade reported from 18 historic surface drillhole intersections, all within Allan Subsurface Mineral Lease KL 112R B, is 26.65% K20 equivalent (discussed further in Section 10.0). The average ore grade observed from thousands of in-mine samples collected to the end of 2021 is 24.7% K20 equivalent (discussed further in Section 11.2).
Figure 8: Geophysical wireline logs showing basic stratigraphy of the Prairie Evaporite Formation in the Saskatoon area.
8.0 | DEPOSIT TYPE |
There are three mineable potash members within the Prairie Evaporite Formation of Saskatchewan. Stratigraphically highest to lowest, these members are: Patience Lake, Belle Plaine, and Esterhazy. A geological section showing potash members that occur in Saskatchewan is shown in Figure 9.
The Allan potash deposit lies within the Patience Lake Member of Prairie Evaporite Formation. There are two potash seams named A Zone and B Zone within this member; at present, only the A Zone is being mined at Allan. Some test mining has been carried out in the B Zone, but no mining is done in this layer at present. Neither the Esterhazy nor the White Bear Potash Members are present in the Allan area. The Belle Plaine Potash Member is not well-developed, and therefore is not mined.
16
Allan potash mineralization occurs at about 1,000 metres depth below surface. The A Zone is approximately 3.35 metres thick and occurs near the top of the Prairie Evaporite Formation salts. Salt cover from the ore zone to overlying units is approximately 12 m. The Allan mine operates as a conventional, underground potash mine.
Figure 9: Cross-section of the Prairie Evaporite Formation across southern Saskatchewan showing relative position of potash members.
9.0 | EXPLORATION |
Before the Allan mine was established in 1968, all exploration consisted of drilling from surface and analysis of core from these drillholes; drilling results are discussed in Section 10.0. Since mining began in 1968, exploration drilling has been infrequent. A map showing potash exploration coverage at Allan (drillholes, 2D and 3D seismic coverage) is shown in Figure 10.
In most of southern Saskatchewan, potash mineralization is in place wherever Prairie Evaporite Formation salts exist, are flat-lying, and are undisturbed. Since the surface seismic exploration method is an excellent tool for mapping the top and bottom of Prairie Evaporite salts, this has become the main potash exploration tool in any existing Saskatchewan Subsurface (potash) Mineral Lease. Historically, 2D seismic, and now the more accurate and full coverage 3D seismic methods are used to map continuity and extent of potash beds in flat-lying potash deposits. Seismic data are relied upon to identify collapse structures that must be avoided in the process of mine development since these structures can act as conduits for water ingress to the mine. As a result, isolation pillars or mining buffer zones are left around these anomalous features. This practice reduces the overall mining extraction ratio, but the risk of inflow to mine workings are effectively mitigated. Localized and relatively small ore zone mine anomalies do occur and typically are not discernable (or imaged) by the seismic method and so are not mapped. When such anomalies are encountered, they are dealt with in the normal course of mining and extraction through these anomalous areas is typically minimized. Where there is uncertainty in seismic interpretations, drilling is often used to confirm or improve refine the seismic interpretation.
17
A total of 366 linear kilometres of 2D seismic lines have been acquired at Allan. Between 2002 and 2021, 3D seismic has been acquired over an area covering 640 square kilometres. The most recent seismic survey was conducted in 2020 and accounted for 177 square kilometres of the total square kilometres stated above.
Figure 10: Potash exploration at Allan including 3D seismic (purple), 2D seismic infill (orange lines), and potash drillholes (black dots).
A typical seismic section from Nutrien’s conventional seismic operations is shown in Figure 11. This is a cross-section extracted from a multi-program 3D seismic volume (earliest program was 2002). The vertical scale is in metres relative to sea level (SL). The seismic section is coloured by rock velocities computed from the seismic data and represents different rock types. Note that the Prairie Evaporite (salt) is continuous. This indicates an undisturbed, flat-lying salt within which potash is likely to be found based on over 50 years of mining experience at Allan.
Experience has shown that the potash mining horizon is continuous when seismic data are undisturbed and flat-lying, as shown in Figure 11. It is now Nutrien’s policy to collect detailed 3D seismic data ahead of mining. Any areas recognized as seismically unusual are identified early, and mine plans are adjusted as needed.
18
Figure 11: A seismic section showing relative rock velocities and major geological units at Nutrien’s conventional potash operations.
10.0 | DRILLING |
For the original Allan potash test holes drilled in the 1950s and 1960s, the primary objective was to sample potash horizons to establish basic mining parameters. The seismic method was still novel and crude at that time and as such, 2D seismic surveys were done sparingly, so the drillhole information was relied upon heavily to evaluate potash deposits. Test holes would penetrate the evaporite section with a hydrocarbon-based drilling mud (oil-based or diesel fuel) to protect the potash mineralization from dissolution. Basic geophysical well-logs were acquired, and in many cases, drill stem tests were run on the Dawson Bay Formation to help assess water-make potential of the caprock. Core samples from the targeted potash intersections were split or quartered (cut with a masonry saw), crushed and analysed to establish potash grades.
Relatively thin interbeds or seams of insoluble material, referred to as clay seams in the potash industry, are an ever-present component of the A Zone and B Zone at Allan. Figure 12 shows the basic stratigraphic relationships. These seams, along with the clay and other detrital minerals disseminated throughout the potash rock matrix, make up the water insoluble portion of the ore. The same sequences of clay seams can be correlated for many kilometres across the central Saskatchewan potash mining district.
At Allan, a particular sequence of three clay seams marks the top of the A Zone, as illustrated in Figure 12 (modified from Robertson, 1978). These seams are used to guide the vertical positioning of the mining machine. The uppermost portion of the sequence of three seams is maintained at the top of the mining cut to keep the mining machines “on grade”. Cutting too high above this upper seam or top marker results in dilution, as halite (rather than sylvinite) immediately overlies the production zone. In practice though, the top marker seam is slightly overcut (between 10 cm to 20 cm) to prevent an unstable condition from being created. Clay seams are often planes of weakness, and if they are undercut, material immediately below the clay seam becomes a hazard as it may separate and fall. Since the hazard must be remediated prior to proceeding, thus slowing production, the moderately diluted mineral grade that results from the overcutting is preferable from a safety point of view.
19
The A Zone mining interval was historically fixed at 3.35 m (11’). Recently acquired mining machines cut at a fixed height of 3.65 m (12’). At present, seven older mining machines cut at a height of 3.35 m (11’) and four new mining machines cut at a height of 3.65 m (12’). These mining heights allow for comfortable working headroom and efficient extraction of potash ore. It is difficult to determine at which mining height certain Mineral Resources and Reserves will be cut in the future, so the more conservative mining height of 3.35 m (11’) was applied to Mineral Resource and Reserve calculations.
Figure 12: Stratigraphic section showing local nomenclature at, and adjacent to, the mining horizon.
The original exploration area was explored with several test holes spaced at intervals of 1.6 km to 6.4 km (1 – 4 miles). Assays from most of these original test holes were studied by independent consultant David S. Robertson and Associates (1978) and are found in Table 2. An additional six historical test holes were studied by Nutrien staff in 2018 when the lease was expanded; these drillhole assays are also listed in Table 2 below. In each case, the best 3.35 m (11’) mining interval intersected in each drillhole was determined from the assay values, using clay marker seams as a guide. Note that five test holes were omitted from the assay calculation for one of the following reasons: a section of missing core in the ore zone, erroneous assay data which could not be resolved, or anomalous ore grade of less than 15% K2O. Another drillhole was missing insoluble analytical results. With over 50 years of mining experience at Allan, it is the opinion of the authors that areas of low grade (i.e. <15% K2O) are localized with a relatively small lateral extent.
20
Drillhole assay data for the A Zone at Allan gives an estimated mean grade of 26.65% K2O with 4.96% water insolubles.
B Zone mineralization is indicated by gamma ray geophysical log response in each of the exploration drillholes listed in Table 2 indicating a potash Mineral Resource. Some test mining of the B Zone has been done. However, sustained production from that zone has not been established. Assay results for the B Zone are not presented here.
Table 2: Assay results for all potash test holes within Allan Lease KL 112R B.
Average in 3.35 m (11’) mining interval (undiluted) | ||||||
Drillhole | Year Drilled | % K2O | % Water Insolubles | |||
04-10-033-01 W3 | 1954 | * | * | |||
12-32-034-02 W3 | 1956 | 28.74 | 5.76 | |||
16-11-033-01W3 | 1956 | * | * | |||
04-29-034-01 W3 | 1957 | 25.79 | 4.74 | |||
01-25-034-01 W3 | 1957 | 28.05 | 4.74 | |||
16-11-034-02 W3 | 1957 | 29.05 | 3.40 | |||
13-11-034-01 W3 | 1957 | 28.75 | 4.54 | |||
13-11-034-03 W3 | 1957 | 21.97 | 1.74 | |||
16-09-035-01 W3 | 1957 | 25.04 | 5.11 | |||
05-26-035-01 W3 | 1957 | 16.78 | * | |||
09-29-033-02 W3 | 1957 | * | * | |||
09-28-034-01 W3 | 1961 | 29.53 | 5.26 | |||
09-27-034-01 W3 | 1961 | 30.63 | 4.52 | |||
09-26-034-01 W3 | 1961 | 27.71 | 6.33 | |||
09-33-034-01 W3 | 1961 | 23.95 | 5.89 | |||
08-34-034-01 W3 | 1961 | 26.31 | 5.76 | |||
09-35-034-01 W3 | 1961 | 25.89 | 8.64 | |||
05-22A-034-01 W3 | 1961 | 26.47 | 3.19 | |||
16-14-034-01 W3 | 1962 | 26.78 | 5.25 | |||
01-17-034-01 W3 | 1962 | 28.63 | 5.29 | |||
01-12-034-01 W3 | 1962 | * | * | |||
14-23-034-03 W3 | 1969 | 29.56 | 4.18 | |||
|
| |||||
Average (from 18 usable values): | 26.65 | 4.96 | ||||
|
|
Due to the remarkably consistent mineralogy and continuity of the resource, as experienced through decades of mine production, very little potash exploration drilling has been done at Allan since 1969. Instead of exploration drillholes, seismic surveying has been relied upon to explore ahead of mine development. Where normal Prairie Evaporite sequences are mapped in the seismic data, potash beds have unfailingly been present. Occasional small-scale salt anomalies not mapped by seismic data do occur. When they do, they are dealt with in the normal course of mining, and extraction through these anomalous areas is typically minimized. Anomalies associated with possible water inflow problems, which are mapped in the seismic data, are avoided.
11.0 | SAMPLING PREPARATION, ANALYSES AND SECURITY |
11.1 | BASIC APPROACH |
Exploration in the Allan area was conducted in the 1950s and 1960s. Sampling and assaying of potash core samples was done using methods considered consistent with standard procedures for potash exploration at these times.
Drillhole sampling methods have remained essentially the same over the years. Potash core samples are acquired as described in earlier sections of this report. Short segments of core usually about 0.3 m (1’) in length are labeled based on visible changes in mineralization, and sometimes based on fixed intervals. Each segment of core is then split using some type of rock or masonry saw. The split portion of core is then bagged and labeled and sent to a laboratory for chemical analysis. Historical potash samples remain stored at the Subsurface Geological Laboratory (Regina, Saskatchewan) of the Saskatchewan Ministry of Energy & Resources.
21
Figure 13: Potash assay plot for PCS Allan 09-27-034-01 W3 indicating the best 3.35 m (11’) mining interval.
An assay plot for drillhole PCS Allan 09-27-034-01 W3 is shown above in Figure 13. Similar data were compiled for all historical potash test holes. The best 3.35 m (11’) mining interval intersected in each drillhole, as discussed in Section 10.0, is determined from the assay values, using clay seams as a guide. Table 3 lists the assay values plotted in
Figure 13.
Table 3: Values for potash assay plot in Figure 13.
All new drilling efforts have targeted areas of geological uncertainty. Although normal ore zone conditions may occur in the tested areas, they are not targeted specifically, For this reason, and because ore grade is known to be locally variable, assays from drilling are not relied upon for ore grade estimation. Instead, grade determined from routinely collected in-mine ore zone samples are found to be most reliable. The long-term average from in-mine tends to best represent the larger ore zone as it normalizes local variability.
22
Thousands of in-mine ore grade samples were collected at Allan to the end of December 2021 (discussed further in section 11.2). All in-mine samples were analysed in the Allan mill laboratory using analysis techniques that were up-to-date for the era in which the sample was collected.
Regarding quality assurance for analytical results, the Company participates in the Canpotex Producer Sample Exchange Program using methods developed by the Saskatchewan Potash Producers Association (SPPA). The Sample Exchange Program monitors the accuracy of analytical procedures used in its labs. In the early 1970s, the SPPA initiated a round-robin Sample Exchange Program, the purpose of which was to assist the potash laboratories in developing a high level of confidence in analytical results. This program, now named the Canpotex Producer Sample Exchange Program using SPPA Methods (CPSEP), has continued up to the present. Current participants include all Canpotex member potash mine site labs, the Nutrien Pilot Plant Lab, and independent third-party surveyor labs. The CPSEP provides participants with three unknown potash samples for analysis quarterly. Results for the unknown sample analysis are correlated by an independent agency that distributes statistical analysis and a summary report to all participants. Completed exchange program samples can be used for control standards as required in QA/QC sections of standard analytical procedures.
The Nutrien Pilot Plant is secured in the same way as modern office buildings are secured. Authorized personnel have access and visitors are accompanied by staff. No special security measures are taken beyond that. Currently, no external laboratory certification is held by the Nutrien Pilot Plant. On occasion, product quality check samples are sent to the Saskatchewan Research Council, a fully certified analytical facility.
In the opinion of the authors, the sample preparation, security, and analytical procedures are acceptable, are consistent with industry-standard practices, and are adequate for Mineral Resource and Reserve estimation purposes.
11.2 | MEAN POTASH MINERAL GRADE FROM IN-MINE SAMPLES |
At Allan, in-mine grade samples are taken by collecting fine “muck” from the floor of the mine (i.e. grab sampling) approximately once per week per active mining face. This is roughly equivalent to a sample taken every 68 m to 74 m in production panels, and a sample taken every 85 m to 128 m in development panels. Since start-up in 1968 through to the end of 2021, a total of 7,584 in-mine potash mineral grade samples were collected from the Allan A Zone, the main potash horizon at Allan. All samples were analysed in the Allan mill laboratory using analysis techniques that were up-to-date for the era in which the sample was collected. Figure 14 shows a histogram of A Zone in-mine grade sample results from the Allan mine.
Figure 14: Histogram of potash ore grade from 7,584 Allan in-mine grade samples (data from 1968 through to the end of 2021).
The median ore grade for this family of in-mine samples is 25.4% K2O equivalent and the mean ore grade is 24.7%. The five-year (2017 – 2021) mean ore grade is 24.0% K2O equivalent and was determined from 1,031 samples.
23
This is considered to be a more representative estimate of expected potash ore grade at Allan than drillhole assay results presented in Section 10.0.
For the B Zone at Allan, mineral grade is reported to be 20.2% K2O equivalent, the grade observed from thousands of in-mine samples at the Lanigan mine where the B Zone has been extensively mined. Even though Allan mine is some distance from Lanigan, this is considered the best estimate of expected mineral grade for this potash layer because the deposit is known to be regionally continuous from west of Vanscoy to east of Lanigan (Fuzesy, 1982 and references therein). Although it is possible that once mining proceeds into the B Zone the reported grade could change from what is reported, it is expected that any such change would be minimal.
11.3 | POTASH ORE DENSITY FROM IN-MINE MINERAL GRADE MEASUREMENTS |
An estimate of in-situ rock density is used to calculate potash mineralization volumes in Mineral Resource and Reserve assessments. A common approach, and the one used by Nutrien, is to determine in-place Mineral Resource and Reserve volumes (m3), then multiply this number by in-situ bulk-rock density (tonnes / m3) to give in-place Mineral Resource and Reserve tonnes.
Well-log data from drillholes can be used to calculate bulk density if accurate and calibrated well-logs are acquired during exploration drilling. In practical terms, modern well-logs tend to meet these criteria, but historic well-logs (collected before the 1990s) do not. In Saskatchewan, almost all potash exploration drilling took place in the 1950s and 1960s, well before density logs were accurate and reliable.
Another approach, and the one used by Nutrien, is to look up density values for the minerals which constitute potash rock – values determined in a laboratory to a high degree of accuracy and published in reliable scientific journals / textbooks – then apply these densities to the bulk rock. Given that the density of each pure mineral is quantified and known, the only variable is what proportion of each mineral makes up the bulk rock. An obvious benefit of this approach is that a mean value computed on the in-mine samples shown in Figure 14 has a much greater confidence interval than a mean value computed from just a few drillhole assays.
The four main mineralogical components of the ore zones of Saskatchewan’s Prairie Evaporite Formation with their respective mineral densities are:
Mineral | Density (kg / m3) | Components | ||||
Halite | 2,170 | NaCl | ||||
Sylvite | 1,990 | KCl | ||||
Carnallite | 1,600 | KMgCl3 · 6(H2O) | ||||
Insolubles | 2,510 | Anhydrite, dolomite, quartz, muscovite, and other minor mineral components (Nutrien Pilot Plant, 2018) |
All Nutrien potash mines measure and record the in-mine % K2O grade and insoluble content of the mined rock. The magnesium content is not measured at Allan since carnallite is a negligible component of the ore here. From this set of measurements, density of the ore can be calculated.
The value for insoluble density is based on known densities of the constituent parts of the insoluble components of the mineralization and the average occurrence of these insoluble components, which is known from over 50 years of mining experience at Allan. Assuming the lowest plausible density of insolubles known for Saskatchewan potash deposits of this nature, the effect upon overall bulk-rock ore density and Mineral Resource and Reserve calculations would be negligible.
From life-of-mine in-mine samples taken at Allan, bulk density has been determined to be:
= (halite density * % halite) + (sylvite density * % sylvite) + (insolubles density * % insolubles)
= (2,170 kg / m3 * 58.1%) + (1,990 kg / m3 * 39.2%) + (2,510 kg / m3 * 2.7%)
= 2,110 kg / m3
RHObulk-rock(Allan A Zone) = 2,110 kg / m3 = 2.11 tonnes / m3
This method is as accurate as the ore grade measurements and mineral density estimates.
No test mining of the B Zone has been conducted at Allan to permit a bulk density calculation based on Allan in-mine grade samples. If test mining of the B Zone at Allan is conducted in future, there may be enough samples with all constituent minerals measured to warrant a change from what is reported. It is expected that any such change would have only a minimal effect on bulk-rock density used in tonnage calculations.
24
Instead, the potash bulk-rock density is calculated using thousands of in-mine grade samples from Lanigan B Zone:
RHObulk-rock(Allan B Zone) = RHObulk-rock(Lanigan B Zone) = 2,120 kg / m3 = 2.12 tonnes / m3
This estimate is considered acceptable since both Allan B Zone and Lanigan B Zone are the same potash seam. Should the Allan B Zone bulk density change from the predicted value of 2,120 kg / m3, the later defined Allan B Zone Mineral Resources and Reserves in Sections 14.2 and 15.2 will also change, albeit, insignificantly.
12.0 | DATA VERIFICATION |
12.1 | ASSAY DATA |
Most of the original drillhole assays were studied by independent consultant David S. Robertson and Associates (1978). In 2018, six historical drillhole assay results were studied by Nutrien technical staff, Jodi Derkach (GIS Cert., P. Geo.) and Tanner Soroka (P. Geo.).
The original assay results for core samples from historical drillholes were taken as accurate in these studies, as there is no way to reliably reanalyse these samples. Most of the remaining samples in storage have long since deteriorated to the point where they are not usable.
Ore grades of in-mine samples are measured inhouse at the Allan mine laboratory by Company staff using modern, standard chemical analysis tools and procedures; an independent agency does not verify these results. However, check sampling through the CPSEP, discussed in Section 11.1, does occur.
It should be noted that assay results from historical drillholes match in-mine sample results reasonably well – within 1% – even though drillhole sample spacing is much greater. This correlation is further validation of the in-mine sampling methodology. Mean mineral grade determined from in-mine samples taken over decades of mining at Allan is thought to provide the most accurate measurement of potash grade for the Allan mine, also providing a good basis for estimating ore grade in areas of future mining at Allan.
12.2 | EXPLORATION DATA |
The purpose of any mineral exploration program is to determine extent, continuity, and grade of mineralization to a certain level of confidence and accuracy. For potash exploration, it is important to minimize the amount of cross-formational drilling, since each drillhole is a potential conduit for subsurface groundwater from overlying (or underlying) water-bearing formations into future mine workings. Every potash test drillhole from surface sterilizes potash mineralization as a safety pillar is required around every surface drillhole once underground mining commences.
Initial sampling and assaying of cores were done during potash exploration at Allan in the 1950s and 1960s. Methods were consistent with standard procedures for that era. The mine began production in 1969 and test drilling conducted after that was largely for the purpose of better understanding the caprock rather than potash mineralization. This approach to potash sampling is in accordance with widely accepted industry practice for areas adjacent and contiguous to an existing operating potash mine.
Assay of physical samples (drillhole cores and/or in-mine samples) is the only way to gain information about mineral grade, but extent and continuity of mineralization are correctly determined using data collected from seismic surveys correlated with historic drilling information. To date, surface seismic data at Allan have been collected, analysed, and verified by Company staff, at times, in cooperation with independent consultants.
Data for the Mineral Resource and Reserve estimates for Allan mine reported in Sections 14.0 and 15.0 were verified by Company staff as follows:
• | Review of potash assay sample information (drillholes and in-mine grade samples), |
• | Review of surface geophysical exploration results (3D and 2D seismic data), |
• | Crosscheck of mined tonnages reported by mine site technical staff with tonnages estimated from mine survey information, and |
• | Crosscheck of Mineral Resource and Mineral Reserve calculations carried out by corporate technical staff. |
25
In the opinion of the authors, this approach to data verification of potash mineral grade and surface seismic information is in accordance with generally accepted industry practice for areas adjacent and contiguous to an existing operating potash mine.
13.0 | MINERAL PROCESSING AND METALLURGICAL TESTING |
At Allan, potash ore has been mined and concentrated using flotation and crystallization methods to produce saleable quantities of high-grade finished potash products since 1968.
Since opening in 1968, 171.984 million tonnes of potash ore have been mined and hoisted at Allan to produce 60.700 million tonnes of finished potash products. Given this level of sustained production over several decades, basic mineralogical processing and prospective metallurgical testing of Allan potash is not considered relevant.
See also Section 17.0.
14.0 | MINERAL RESOURCE ESTIMATES |
14.1 | DEFINITIONS OF MINERAL RESOURCE |
The CIM has defined Mineral Resource in The CIM Definition Standards for Mineral Resources and Reserves (2014) as:
1) | Inferred Mineral Resource: that part of a Mineral Resource for which quantity and grade or quality are estimated on the basis of limited geological evidence and sampling. Geological evidence is sufficient to imply but not verify geological and grade or quality continuity. |
2) | Indicated Mineral Resource: that part of a Mineral Resource for which quantity, grade or quality, densities, shape, and physical characteristics are estimated with sufficient confidence to allow the application of Modifying Factors in sufficient detail to support mine planning and evaluation of the economic viability of the deposit. Geological evidence is derived from adequately detailed and reliable exploration, sampling and testing and is sufficient to assume geological and grade quality continuity between points of observation. |
3) | Measured Mineral Resource: that part of a Mineral Resource for which quantity, grade or quality, densities, shape, and physical characteristics are estimated with confidence sufficient to allow the application of Modifying Factors to support detailed mine planning and final evaluation of the economic viability of the deposit. Geological evidence is derived from detailed and reliable exploration, sampling and testing and is sufficient to confirm geological and grade or quality continuity between points of observation. |
CIM defines Modifying Factors as “considerations used to convert Mineral Resources into Mineral Reserves. These include, but are not restricted to, mining, processing, metallurgical, infrastructure, economic, marketing, legal, environmental, social and governmental factors.”
In south-central Saskatchewan, where geological correlations are straightforward, and within a (potash) subsurface mineral lease at an operating potash mine, Mineral Resource categories are generally characterized by Nutrien as follows:
1) | Inferred Mineral Resource: areas of limited exploration, such as areas that have been investigated through regional geological studies, or areas with 2D regional surface seismic coverage, little or no drilling, at some distance from underground workings, and within Crown Subsurface Mineral Lease KL 112R B. |
2) | Indicated Mineral Resource: areas of adequate exploration, such as areas with 3D surface seismic coverage, little or no drilling, at some distance from underground workings, and within Crown Subsurface Mineral Lease KL 112R B. |
3) | Measured Mineral Resource: areas of detailed, physical exploration through actual drilling or mine sampling, near existing underground workings, and within Crown Subsurface Mineral Lease KL 112R B. |
The mine began production in 1968 and test drilling conducted after that was largely for the purpose of better understanding the caprock rather than potash mineralization. Instead, exploration involved collecting surface seismic data, which became better in quality over the years. Exploration drilling has demonstrated the presence of the potash horizon, and seismic coverage shows the continuity of the Prairie Evaporite Formation within which the potash horizon occurs.
26
Along with this approach, analysis of in-mine samples for potash grade has provided an observation-based understanding of the potash mineralized zone at Allan that is far superior to the level of understanding provided by any surface drilling-based exploration program. The authors believe that this approach provides a body of information that guides and constrains exploration inferences in a much better way than could be achieved from any conventional exploration investigation in areas immediately surrounding, and contiguous to, the Allan potash mine.
14.2 | ALLAN POTASH RESOURCE CALCULATIONS |
Exploration information used to calculate reported Mineral Resource tonnages at Allan consist of both physical sampling (drillhole and in-mine) and surface seismic (2D and 3D) as discussed in earlier sections. Based on the definitions and guidelines in Section 14.1, all mineral rights leased or owned by the Company, and within Crown Subsurface Mineral Lease KL 112R B, are assigned to one of the three Mineral Resource categories.
Mineral Resources are reported as mineralization in-place and are exclusive of Mineral Reserves. In-place tonnes were calculated for each of the Mineral Resource categories using the following parameters:
Mining Height: | 3.35 metres (11 feet) | |
Ore Density: | 2.11 tonnes / cubic metre (A Zone) | |
Ore Density: | 2.12 tonnes / cubic metre (B Zone) |
The Mineral Resources for Allan, as of December 31, 2021, are as follows:
Allan A Zone:
Inferred Resource | 1,164 | millions of tonnes | ||||||
Indicated Resource | 2,533 | millions of tonnes | ||||||
Measured Resource | 1,183 | millions of tonnes | ||||||
| ||||||||
Total A Zone Resource | 4,880 | millions of tonnes |
Allan B Zone:
Inferred Resource | 1,169 | millions of tonnes | ||||
Indicated Resource | 2,545 | millions of tonnes | ||||
Measured Resource | 1,707 | millions of tonnes | ||||
| ||||||
Total B Zone Resource | 5,421 | millions of tonnes |
Total for Allan (A Zone + B Zone):
Inferred Resource | 2,333 | millions of tonnes | ||||
Indicated Resource | 5,078 | millions of tonnes | ||||
Measured Resource | 2,890 | millions of tonnes | ||||
| ||||||
Total A Zone + B Zone Resource | 10,301 | millions of tonnes |
Allan Mineral Resources are plotted in Figure 15.
The average mineral grade of the Allan A Zone Mineral Resource is 24.7% K20 equivalent and was determined from thousands of in-mine samples at Allan. The average mineral grade of the Allan B Zone Mineral Resource is 20.2% K20 equivalent and was determined from thousands of in-mine samples at Lanigan mine where the B Zone has been extensively mined. See Section 11.2 for more detail.
The tonnage reported in the Allan A Zone Measured Resource is comprised of the potash that is within 1.6 km (1 mile) of a physically sampled location (i.e. drillholes or mine workings). Also included as Measured Resource is the potash in the pillars of mined-out areas of the Allan mine as there is the possibility of retrieving ore from the remnant mining pillars at some point in the future. An example of this is the Patience Lake mine which was successfully converted from a conventional mine to a solution mine after being lost to flooding in 1989. Since mining of remnant mining pillars is not anticipated in the near future at Allan, in-place pillar mineralization remains as a Mineral Resource rather than a Mineral Reserve at this time.
27
Portions of the B Zone that are immediately underlying the Proven and Probable A Zone Mineral Reserve as well as portions of the B Zone that are immediately underlying drillholes and the 1.6 Km (1 mile) buffer placed around drillholes have been classified as Measured Resource.
Figure 15: Map showing Allan Mineral Resource as of December 2021.
15.0 | MINERAL RESERVE ESTIMATES |
15.1 | DEFINITIONS OF MINERAL RESERVE |
The CIM has defined Mineral Reserve in The CIM Definition Standards for Mineral Resources and Reserves (2014) as:
1) | Probable Mineral Reserve: the economically mineable part of an Indicated, and in some circumstances, a Measured Mineral Resource. The confidence in the Modifying Factors applying to a Probable Mineral Reserve is lower than that applying to a Proven Mineral Reserve. |
2) | Proven Mineral Reserve: the economically mineable part of a Measured Mineral Resource. A Proven Mineral Reserve implies a high degree of confidence in the Modifying Factors. |
CIM defines Modifying Factors as “considerations used to convert Mineral Resources into Mineral Reserves. These include, but are not restricted to, mining, processing, metallurgical, infrastructure, economic, marketing, legal, environmental, social and governmental factors.”
28
For Saskatchewan, in regions adjacent and contiguous to an operating potash mine and within a (potash) subsurface mineral lease, Mineral Reserve categories are characterized by Nutrien as follows:
1) | Probable Mineral Reserve: identified recoverable potash mineralization classified as a Measured Resource, within a 1.6 km (1 mile) radius of a sampled mine entry or exploration drillhole contiguous to mine workings, and within Crown Subsurface Mineral Lease KL 112R B. |
2) | Proven Mineral Reserve: identified recoverable potash mineralization classified as a Measured Resource, delineated on at least three sides by sampled mined entries or exploration drillholes to a maximum of 3.2 km (2 miles) apart, and within Crown Subsurface Mineral Lease KL 112R B. |
Along with this approach, analysis of in-mine samples for potash grade has provided an observation-based understanding of the potash mineralized zone at Allan that is far superior to the level of understanding provided by any surface drilling-based exploration program. An understanding of the amount of ore that can be conventionally mined from the Measured Resource category using current mining practices comes from over 50 years of potash mining experience at Allan.
15.2 | ALLAN POTASH RESERVE CALCULATIONS |
Using the definitions outlined in Section 15.1, a portion of the Allan A Zone Measured Resource has been converted to Mineral Reserve. The assigned Mineral Reserve category is dependent on proximity to sampled mine entries also described in Section 15.1. An overall extraction ratio for the Allan mine has been applied to the qualifying areas outlined as Measured Resource in Figure 15. This extraction ratio is significantly lower than the local extraction ratio described in Section 16.1, as it takes into account areas which cannot be mined due to unfavorable geology.
The overall extraction ratio at the Allan mine is 33%. It was derived by dividing the total tonnes mined to date by the tonnage equivalent of the total area of the mine workings (i.e. the perimeter around the mine workings) less future mining blocks. Since an extraction ratio has been applied, Mineral Reserves are considered recoverable ore, and are reported as such. Note that only drillholes whose 1.6 km radii are contiguous to mine workings or the 1.6 km radius placed around mine workings are used to compute probable mineral reserve. The remaining non-contiguous drillholes remain in the measured resource category.
The Mineral Reserves for Allan as of December 31, 2021, are as follows:
Allan A Zone:
Probable Reserve | 244 | millions of tonnes | ||||
Proven Reserve | 107 | millions of tonnes | ||||
| ||||||
Total A Zone Reserve | 351 | millions of tonnes |
Allan B Zone:
Probable Reserve | nil | |||
Proven Reserve | nil | |||
| ||||
Total B Zone Reserve | nil |
Total for Allan (A Zone + B Zone):
Probable Reserve | 244 | millions of tonnes | ||||
Proven Reserve | 107 | millions of tonnes | ||||
| ||||||
Total A Zone and B Zone Reserve | 351 | millions of tonnes |
Allan Mineral Reserves are plotted in Figure 16.
The average mineral grade of the Allan A Zone Mineral Reserve is 24.7% K20 equivalent and was determined from thousands of in-mine samples at Allan.
29
Figure 16: Map showing Allan Mineral Reserve to December 2021.
16.0 MINING METHOD
16.1 MINING OPERATIONS
All conventional potash mines in Saskatchewan operate at 900 m to 1,200 m below surface within 9 m to 30 m of the top of the Prairie Evaporite Formation. Over the scale of any typical Saskatchewan potash mine, potash beds are tabular and regionally flat-lying, with only moderate local variations in dip. At Allan, potash ore is mined using conventional mining methods, whereby:
• | Shafts are sunk to the potash ore body; |
• | Continuous mining machines cut out the ore, which is hoisted to surface through the production shaft; |
• | Raw potash is processed and concentrated in a mill on surface; and |
• | Concentrated finished potash products (near-pure KCl) are sold and shipped to markets in North America and offshore. |
Sinking of the two original shafts (Shaft #1 and Shaft #2) from surface to the potash zone was completed in early 1968, and the first potash ore was hoisted by in April of that year. The Allan mine has run on a continuous basis since the first ore was hoisted in 1968, other than short-term shutdowns taken for inventory management purposes or occasional plant maintenance and construction work, or other outages that are typical for operations of this nature.
In recent years, the Allan mine underwent a major expansion which brought the nameplate capacity up to 4.0 million tonnes of finished potash products per year. The operational capability at the Allan facility as of December 31, 2021, is 3.0 million tonnes per year.
30
Virtually all Allan underground mining rooms are in one potash mineralized zone, the upper layer (or A Zone) of the Patience Lake Member of the Prairie Evaporite Formation (the host evaporite salt). In contrast, some potash mines further east in Saskatchewan mine in a different potash layer, the Esterhazy Member of the Prairie Evaporite Formation. Saskatchewan potash geology is illustrated in Figure 17. At Allan, mine elevations range from approximately 980 m to 1,120 m. These depths to A Zone potash mineralization are anticipated over most of the Allan lease area. Mine workings are protected from aquifers in overlying formations by approximately 12 m of overlying salt and potash beds, along with salt plugged porosity in the Dawson Bay Formation, a carbonate layer lying immediately above potash hosting salt beds.
The Allan mine is a conventional underground mining operation whereby continuous mining machines are used to excavate the potash ore by the stress-relief mining method. Continuous conveyor belts transport ore from the mining face to the bottom of the production shaft. Mining methods employed in Saskatchewan are discussed in Jones and Prugger (1982) and in Gebhardt (1993). The highest mineral grade section of the Allan potash seam is approximately 3.35 m (11’) thick, with gradations to lower grade salts immediately above and below the mining horizon. The actual mining thickness at Allan is dictated by the height of continuous boring machines used to cut the ore. Eight older mining machines are designed to cut at a thickness of 3.35 m (11’) and five new mining machines are designed to cut 3.65 m (12’).
As discussed in Section 10.0, Allan cuts to a marker (clay) seam that is slightly above the high-grade mineralized zone to establish a safe and stable mine roof. The top marker seam is slightly overcut by 10 cm to 20 cm. Clay seams are often planes of weakness, and if they are undercut, material immediately below the clay seam becomes a hazard as it may separate and fall. Since the hazard must be remediated prior to proceeding, thus slowing production, the moderately diluted mineral grade that results from the overcutting is preferable from a safety point of view.
Figure 17: Schematic cross-section through the Prairie Evaporite Formation, illustrating mining horizons at each of Nutrien’s conventional potash operations.
Conservative local extraction ratios (never exceeding 45% in any mining block) are employed at all Saskatchewan mines, including Allan, to minimize potential detrimental effects of mining on overlying strata; this is common practice in flat-lying, tabular ore bodies overlain by water-bearing layers.
From the shaft-bottom, potash ore is hoisted approximately 1,000 m from the potash level through the vertical shafts to a surface mill. In addition to hoisting potash ore to surface, the production shaft also provides fresh air ventilation to the mine and serves as a secondary egress. The Service Shaft is used for service access, and exhaust ventilation from the mine.
31
Over the 53-year mine life, 171.984 million tonnes of potash ore have been mined and hoisted at Allan to produce 60.700 million tonnes of finished potash products (from startup in 1968 to December 31, 2021). The life-of-mine average concentration ratio (raw ore / finished potash products) is 2.83 and the overall extraction ratio over this period is 33%. Actual potash production tonnages for the Allan mine, along with concentration ratios (tonnes mined / tonnes product), are plotted for the past decade in Figure 18.
Figure 18: Mined tonnes, product tonnes, and concentration ratio for the Allan mine over the past 10 years.
16.2 | RISKS TO POTASH MINING OPERATIONS, WITH EMPHASIS ON WATER INFLOWS |
The mining of potash is a capital-intensive business, subject to the normal risks and capital expenditure requirements associated with mining operations. The production and processing of ore may be subject to delays and costs resulting from mechanical failures and such hazards as unusual or unexpected geological conditions, subsidence, water inflows of varying degree, and other situations associated with any potash mining operation.
Potash beds in all regions of Saskatchewan are overlain by a number of water-bearing formations, and there are water zones underlying the potash beds as well. A water inflow into mine workings is generally significant in a potash mine since salt dissolves in water; an inflow can lead to anything from increased costs at best to closure of the mine at worst (e.g. see Prugger and Prugger, 1991).
When sinking of the Allan Shaft #1 was near the bottom of the Blairmore Formation at approximately 570 m depth, a breach developed in the ice wall and the shaft was flooded (Prugger and Prugger, 1991). A concrete plug was installed in the shaft bottom (underwater), and two additional freeze holes were drilled to seal the area of the breach and allow recovery of the shaft. The shaft was completed in 1968. In the mid-1990s the concrete shaft liner in an area of the Allan production shaft had deteriorated to the point where it required replacement. The concrete in the 671 m to 750m (2,203’ to 2,463’) level was replaced with iron tubbing segments in 1999, successfully repairing the shaft through this area. Small scale shaft liner repairs have since occurred in both the production and service shafts as part of an ongoing maintenance program. At present, inflow into the existing shafts is estimated at 23 litres / minute (6 US gallons / minute) for the Service Shaft and 117 litres / minute (31 US gallons / minute) for the Production Shaft.
In 1996, a connate potash seam brine was encountered in an area that had recently been mined; this was the first inflow into underground workings at Allan. This inflow, initially estimated at approximately 20 litres / minute, did not require active intervention, and the flow eventually diminished to virtually nil. There have been a few similar occurrences of brine in underground workings at Allan; all of these have been minor occurrences that were addressed without any impact to mine operations. There has not been any significant water ingress into underground workings at Allan since production began in 1968. At present, brine ingress into underground mine workings at Allan is negligible.
17.0 | RECOVERY METHODS |
At Allan, potash ore has been mined and concentrated to produce saleable quantities of high grade finished potash products since 1968. Products include granular, standard, and industrial grade potash used for agricultural applications and industrial purposes.
Both flotation methods and crystallization methods are used to concentrate potash ore into finished potash products at the Allan mill. A simplified process flow diagram is shown in Figure 19. Raw potash ore is processed on surface, and concentrated finished potash products (near-pure KCl) are sold and shipped to markets in North America and offshore.
32
Figure 19: Simplified flow diagram for potash flotation and crystallization milling methods used at Allan.
Over the past three years, production of finished potash products at Allan was:
2019: 2.178 million tonnes finished potash products at 61.20% K2O (average grade)
2020: 2.792 million tonnes finished potash products at 61.20% K2O (average grade)
2021: 2.781 million tonnes finished potash products at 61.17% K2O (average grade)
Over the past decade actual mill recovery rates have been between 83.1% and 87.0%, averaging 85.9% (see Figure 20). Given the long-term experience with potash geology and actual mill recovery at Allan, no fundamental potash milling problems are anticipated in the foreseeable future.
Quality control testing and monitoring geared towards fine-tuning and optimizing potash milling and concentrating processes are conducted on a continual basis at all Nutrien minesites and at Nutrien research facilities. At Allan, this is no exception; test work to optimize circuit performance and ensure product quality is carried out on an ongoing basis.
Figure 20: Allan mill recovery rate over the past 10 years.
33
18.0 | PROJECT INFRASTRUCTURE |
Infrastructure is in place to meet current and projected requirements for transportation, energy (electricity and natural gas), water and process materials at Allan. See also Section 5.0.
The Allan mine is served by a number of villages within 50 kilometres of the mine site. The nearest city is Saskatoon (approximately 45 km distant).
The Allan surface facilities are accessed by existing paved roads and highways that are part of the Saskatchewan Provincial Highway System. All finished potash products are shipped by rail over existing track.
At present, high voltage power capacity at the Allan is 44 MVA. The ten-year projection of power utilization indicates that the utility can meet all foreseeable future demand.
The Allan operation requires a sustained fresh water supply for the milling process which is provided from a local reservoir called the Bradwell Reservoir operated by SaskWater (approximately 6 km distant). This water supply provides a sustainable source of process water for Allan milling operations without having any impact on other users of water in the area.
19.0 | MARKET STUDIES AND CONTRACTS |
Potash from Company mines (including Allan) has been sold on a continuous basis since mining began in 1968. At present, Nutrien products are sold in more than 50 countries, to three types of end-use:
1. | Fertilizer, focused on balanced plant nutrition to boost crop yields in order to meet the world’s ever-increasing appetite for food (nitrogen, phosphate, potash) |
2. | Feed Supplements, focused on animal nutrition (mainly phosphate) |
3. | Industrial, focused on products for high-grade food, technical and other applications (nitrogen, phosphate, as phosphoric acid, potash) |
The Company owns and operates six potash mines in Saskatchewan and a potash mine in New Brunswick, Canada, which no longer produces potash and was permanently closed in 2018. Over the past three years (2019, 2020, 2021) the Company had potash sales of 37.970 million tonnes1. Historical Company potash sales data for the past 10 years are plotted in Figure 21 and Figure 221.
1 | Company potash sales data for years prior to 2018 includes only PotashCorp sales. |
34
Potash is mainly used for fertilizer, which typically makes up approximately 90% of the company’s annual potash sales volumes. By helping plants develop strong root systems and retain water, it enhances yields and promotes greater resistance to disease and insects. Because it improves the taste and nutritional value of food, potash is often called the “quality nutrient.” Industrial applications of potash include use in soaps, water softeners, de-icers, drilling muds and food products.
Potash fertilizer is sold primarily as solid granular and standard products. Granular product has a larger and more uniformly shaped particle than standard product and can be easily blended with solid nitrogen and phosphate fertilizers. It is typically used in more advanced agricultural markets such as the US and Brazil.
Most major potash consuming countries in Asia and Latin America have limited or no indigenous production capability and rely primarily on imports to meet their needs. This is an important difference between potash and the other major crop nutrient businesses. Trade typically accounts for more than three-quarters of demand for potash, which ensures a globally diversified marketplace.
The most significant exporters are producers with mines in the large producing regions of Canada, the Middle East, and the former Soviet Union, which all have relatively small domestic requirements.
Figure 21: Historical Company potash sales 2012 to 2021 in million tonnes / year2.
2 | Company potash sales data for years prior to 2018 includes only PotashCorp sales. |
35
Figure 22: Historical Company potash net sales 2012 to 2021 in million USD $ / year2.
World consumption of potash fertilizer has grown over the last decade, with the primary growth regions being developing markets in Asia and Latin America. These are countries with expanding crop production requirements, where potash has historically been under-applied and crop yields lag behind those of the developed world. Although temporary pauses can occur in certain countries, the underlying fundamentals of food demand that encourage increased potash application are expected to continue the growth trends in key importing countries. See Figure 23 for world potash production and demand in 2021.
Figure 23: World potash production and demand for 2021E.
Potash is used on many agricultural commodities. Wheat, rice, corn, oilseed, and sugar crops consume over half of the potash used worldwide. Fruits and vegetables are also important users of potash fertilizers, accounting for about 19 percent of the total consumption. The remainder goes to other consumer and industrial crops such as oil palm, rubber, cotton, coffee, and cocoa. See Table 4 for primary potash market profile. This diversity means that global potash demand is not tied to the market fundamentals for any single crop or growing region.
36
Table | 4: Primary Potash Market Profile |
Country/Region | Growth Rate* | Key Consuming Crops | ||
China | 2.1% | Vegetables, rice, fruits, corn | ||
India | 3.6% | Rice, wheat, vegetables, sugar crops | ||
Other Asia | 2.6% | Oil palm, rice, sugar crops, fruits, vegetables | ||
Latin America | 4.7% | Soybeans, sugar crops, corn | ||
North America | 0.5% | Corn, soybeans |
* | 5-year CAGR for consumption (2016-2021E) |
Global potash shipments are estimated to have reached record levels at approximately 70 million tonnes in 2021, an increase of about 1.0 million tonnes from the previous year. Potash consumption has grown at an annualized rate of 2.6 percent over the past 5 years, driven by strong potash consumption trends in all major potash markets.
North American and South American growers applied significant amounts of potash to replenish soil nutrients removed by large harvests. Potash application rates are increasing in China and Southeast Asian countries as a result of increased soil testing and improved agronomic practices. Growers in these countries are also increasing acreage of potassium-intensive crops such as fruits, vegetables, and oil palm. India continues to face political barriers to significantly growing potash demand, however, the agronomic need and willingness of farmers to improve yields persists. The Company believes that supportive agriculture fundamentals and the need to address declining soil fertility levels will enable strong demand growth in the years ahead. World potash shipments and consumption in recent years is shown in Figure 24.
Figure 24: World potash shipments and consumption, 2016-2021E.
Canpotex Limited (Canpotex), the offshore marketing company owned by the Company and other Saskatchewan potash producers, handles all sales, marketing and distribution of potash produced by its member companies to customers outside of the US and Canada (including the potash produced at Allan).
In North America, Nutrien sells potash to retailers, cooperatives, and distributors, who provide storage and application services to farmers, the end-users. This includes sales to Nutrien’s retail distribution business, which has the largest retail distribution network in North America. Typically, the Company’s North American potash sales are larger in the first half of the year. The primary customers for potash fertilizer products at the Allan operation are retailers, dealers, cooperatives, distributors, and other fertilizer producers who have both distribution and application capabilities.
Nutrien’s market research group provides management with market information on a regular basis including global agriculture and fertilizer markets, demand and supply in fertilizer markets and general economic conditions that may impact fertilizer sales. These may include specific market studies and analyses on different topics as may be required. This information is reviewed on a regular basis and the author of this report takes this information into account in understanding the markets and the assumptions within this report.
37
Plans and arrangements for potash mining, mineral processing, product transportation, and product sales are established by Nutrien and are within industry norms.
20.0 ENVIRONMENTAL | STUDIES, PERMITTING, AND SOCIAL OR COMMUNITY IMPACT |
The tailings management strategy at all Nutrien potash mines in Saskatchewan, including Allan, is one of sequestering solid mine tailings in an engineered and provincially licenced TMA near the surface plant site. The Allan TMA currently covers an area of approximately 600 hectares (1,483 acres) of land owned by the Company. Solid potash mine tailings typically consist of 85% to 95% rock salt (NaCl) and 5% to 15% insolubles (carbonate mud = CaCO3, anhydrite mud = CaSO4, and clays like chlorite, illite, and so on). An engineered slurry-wall (in some portions, a compacted earth trench barrier) has been constructed where required around approximately half of the Allan TMA. In future years this wall can be expanded if required for operational needs. The slurry-wall provides secondary containment for any saline mine waters, minimizing brine impacts from the TMA to surrounding surface water bodies and near-surface aquifers. Areas surrounding the TMA are closely monitored: this includes everything from daily visual perimeter inspections to annual investigations and inspections of surrounding groundwater and aquifers.
Allan currently operates two brine disposal wells near the surface plant of the Allan mine (marked in Figure 25) where clear salt brine (i.e. no silt, clay slimes, or other waste) is borehole-injected into the Winnipeg / Deadwood Formations, deep subsurface aquifers approximately 1,500 m to 1,700 m below the surface (marked in Figure 12). The disposal wells are provincially licensed and formation water in these extensive deep aquifers is naturally saline.
Emissions to air consisting primarily of particulate matter are kept below regulatory limits through various modern air pollution abatement systems (e.g. dust collection systems built into mill processes) that are provincially licensed. This same procedure is followed at all Nutrien mines in Saskatchewan.
The Allan operation requires a sustained fresh water supply for the milling process which is provided by a waterline from the Bradwell Reservoir (approximately 6 km distant). This water supply is provincially licensed and provides a sustainable source of process water for Allan milling operations with no known impact on other users of water in the area.
In Saskatchewan, all potash tailings management activities are carried out under an “Approval to Operate” granted by the Saskatchewan Ministry of Environment (MOE), the provincial regulator. Staff at the Allan mine actively monitor and inspect operations and routinely report the observations and measurements to the Environmental Protection Branch of MOE. The current Allan Approval to Operate has been granted to July 1, 2028, the renewal date.
In terms of long-term decommissioning, environmental regulations of the Province of Saskatchewan require that all operating potash mines in Saskatchewan create a long-term decommissioning and reclamation plan that will ensure all surface facilities are removed, and the site is left in a chemically and physically stable condition once mine operations are complete. The Company has conducted numerous studies of this topic, and the most recent decommissioning and reclamation plan for Allan was approved by MOE technical staff in October 2016. Because the current expected mine life for Allan is many decades into the future, it is not meaningful to come up with detailed engineering designs for decommissioning annually. Instead, decommissioning plans are reviewed every five years, and updated to accommodate new concepts, technological change, incorporation of new data, and adjustments of production forecasts and cost estimates. Any updated decommissioning and reclamation reports generated by this process are submitted to provincial regulatory agencies. For Allan, a revised decommissioning and reclamation plan was submitted for MOE review on June 28th, 2021.
In addition to the long-term decommissioning plan, provincial regulations require that every potash producing company in Saskatchewan set up an Environmental Financial Assurance Fund, which is to be held in trust for the decommissioning, restoration, and rehabilitation of the plant site after mining is complete. This fund is for all mines operated by Nutrien in the province of Saskatchewan (i.e., Allan, Cory, Lanigan, Patience Lake, Rocanville, and Vanscoy).
38
Figure 25: Aerial photo showing the Allan surface operations, disposal wells, and Tailings Management Area.
21.0 | CAPITAL AND OPERATING COSTS |
The Allan mine has been in operation since 1968; in the years immediately preceding this, major capital investment was made to bring this mine into production. Since then, capital expenditures were made on a regular and ongoing basis to sustain production, and to expand production from time to time.
A major refurbishment and expansion of the Allan mine was completed in 2013, increasing nameplate capacity to 4.0 million tonnes of finished potash products per year. This work involved enhancement of hoists and shaft conveyances, major expansions of both mine and mill, improvements to loadout facilities, and some infrastructure improvements. All construction was carried out without significant disruption to existing potash production from the site.
22.0 | ECONOMIC ANALYSIS |
22.1 | FUNDAMENTALS |
The Company conducts ongoing and detailed economic analyses on each of its operations and on all aspects of its business. While the Company considers its operating costs and results on a per mine basis to be competitively sensitive and confidential information, the Company is confident that the economic analysis conducted routinely for each of the Company’s operating potash mines is complete, reasonable, and meets industry standards.
39
On a cash flow basis, The Company’s potash segment generated USD $8,785 million in net sales over the past three years (2019, 2020 and 2021) based on sales volume of 37.970 million tonnes of finished potash products3. The annual average realized potash price for manufactured products (includes North American and offshore sales) over a 10-year period (2012 – 2021) is plotted in Figure 26.
Over the past three years (2019, 2020, and 2021) the Allan mine produced 7.751 million tonnes of finished potash products. In the past three years (2019, 2020, and 2021), the Allan mine accounted for 20% of total potash production at the Company over this period. Allan is currently making a positive contribution to the Company’s potash segment.
Given the Company’s previous history (including over 50 years of mining at the Allan operation), recent market conditions, and extensive reserve base, the economic analysis for Allan has met the Company’s internal hurdle rates.
Figure 26: Historic annual average realized potash price in USD / tonne4.
22.2 | TAXES |
Royalties are paid to the Province of Saskatchewan in connection with the Company’s Potash operations, which holds most of the mineral rights in the lease areas, and royalties from Freehold lands are paid to various freeholders of mineral rights in the area. The Crown royalty rate is 3 percent and is governed by The Subsurface Mineral Royalty Regulations, 2017. The actual amount paid is dependent on selling price and production tonnes.
3 | Company potash sales data for years prior to 2018 includes only PotashCorp sales. |
4 | Company annual average realized potash price for years prior to 2018 includes only PotashCorp sales. |
40
Municipal taxes are paid based on site property values to the applicable municipality in Saskatchewan. Saskatchewan potash production is taxed at the provincial level under The Mineral Taxation Act, 1983. This tax, governed by The Potash Production Tax Regulations, consists of a base payment and a profit tax, collectively known as the potash production tax. As a resource corporation in the Province of Saskatchewan, the Company is also subject to a resource surcharge equal to a percentage of the value of its resource sales (as defined in The Corporation Capital Tax Act of Saskatchewan). In addition to this, the Company pays federal and provincial income taxes based on corporate profits from all of its operations in Canada.
23.0 ADJACENT | PROPERTIES |
The Company’s Allan Lease KL 112R B is adjacent to the following Crown potash dispositions:
• | Potash Corporation of Saskatchewan Inc. KL 109B (Nutrien Patience Lake) |
• | Mosaic Potash Colonsay ULC KL 108 |
• | BHP Billiton Canada Inc. 100% KL 213 and KL 224 |
Mosaic Potash Colonsay (Mosaic) operates a mine with extensive underground workings within Crown Subsurface Mineral Lease KL 108, which are immediately adjacent to Allan Lease KL 112R B. Nutrien and Mosaic each have a safety buffer between the two companies’ lease areas, where it is agreed that no mining will occur. This buffer ensures that mine workings in one company’s lease area will not impact workings of the other company.
24.0 OTHER | RELEVANT DATA AND INFORMATION |
Not applicable.
25.0 INTERPRETATION | AND CONCLUSIONS |
Nutrien has a long history of successful potash mining at Allan, where potash has been produced for over 50 years. The authors believe that the experience gained mining and milling potash for this length of time has produced a reliable body of information about potash mineralization, mining and milling at Allan.
In a Saskatchewan potash mine that has been producing for many decades, reduction of mine life through increased production is counter-balanced by development mining into new mineral land parcels. This increases mine life through increasing the potash Mineral Reserve.
For Allan, mine life can be estimated by dividing the total Mineral Reserve (Proven + Probable) of 351 million tonnes by the average annual mining rate (million tonnes of ore hoisted per year). For Allan, the mining rate is defined as equal to the actual three-year running average (consecutive, most recent years). The average mining rate at Allan over the last three years (2019, 2020 and 2021) was 7.249 million tonnes of potash ore mined and hoisted per year.
If this mining rate is sustained, and if Mineral Reserves remain unchanged, then the Allan mine life would be 48 years. This estimate of mine life is likely to change as mining advances further into new mining blocks, and / or if mining rates change.
26.0 RECOMMENDATIONS |
Not applicable for a potash mine that has been in operation since 1968.
41
27.0 REFERENCES |
Companion Policy 43-101CP to National Instrument 43-101 Standards of Disclosure for Mineral Projects (2011). Retrieve this and related documents from many websites.
The CIM Definition Standards for Mineral Resources and Reserves (2014). Retrieve this and related documents from many websites.
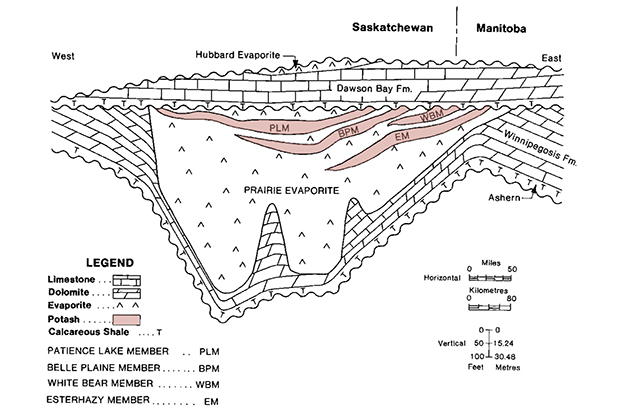
Fuzesy, Anne (1982). Potash in Saskatchewan (44p). Saskatchewan Industry and Resources Report 181. https://publications.saskatchewan.ca/#/products/7307.
Gebhardt, E. (1993). Mine planning and design integration, CIM Bulletin, May 1993, pp. 41 – 49.
Government of Saskatchewan (2020). Saskatchewan Mining and Petroleum GeoAtlas. https://gisappl.saskatchewan.ca/Html5Ext/index.html?viewer=GeoAtlas. Accessed January 2020.
Government of Saskatchewan. The Corporation Capital Tax Act of Saskatchewan. Available online at http://www.qp.gov.sk.ca/documents/English/Statutes/Statutes/c38-1.pdf.
Government of Saskatchewan. The Mineral Taxation Act, 1983. Available online at http://www.qp.gov.sk.ca/documents/English/Statutes/Statutes/M17-1.pdf.
Government of Saskatchewan. The Potash Production Tax Regulations. Available online at https://publications.saskatchewan.ca/#/products/1263.
Government of Saskatchewan. The Subsurface Mineral Royalty Regulations, 2017. Available online at http://publications.gov.sk.ca/details.cfm?p=88223&cl=8.
Government of Saskatchewan. The Subsurface Mineral Tenure Regulations, 2015. Available online at http://www.publications.gov.sk.ca/details.cfm?p=72797.
Jones, P. R., and F. F. Prugger (1982). Underground mining in Saskatchewan potash. Mining Engineering, 34, pp. 1677 – 1683.
Nutrien Pilot Plant (2018). Personal communication on density of insoluble minerals in different ore zones.
Prugger, F.F., (1979), The flooding of the Cominco potash mine and its rehabilitation; CIM Bulletin, Vol. 72, No. 807, pp. 86 – 90.
Prugger, F. F. and A. F. Prugger (1991). Water problems in Saskatchewan potash mining – what can be learned from them? Bulletin of the Canadian Institute of Mining and Metallurgy (CIM Bulletin), Vol. 84, No. 945, pp. 58 – 66.
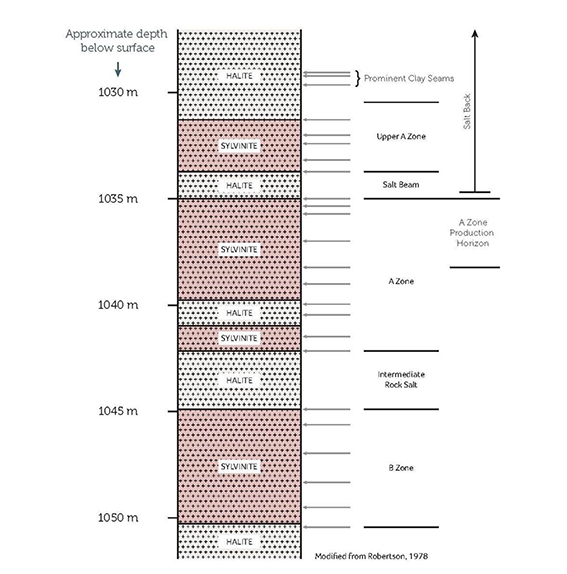
Robertson, David S., and Associates (1978). Summary Report on Evaluation of Potash Assets for Potash Corporation of Saskatchewan. Unpublished consultant’s report to Potash Corporation of Saskatchewan Inc.
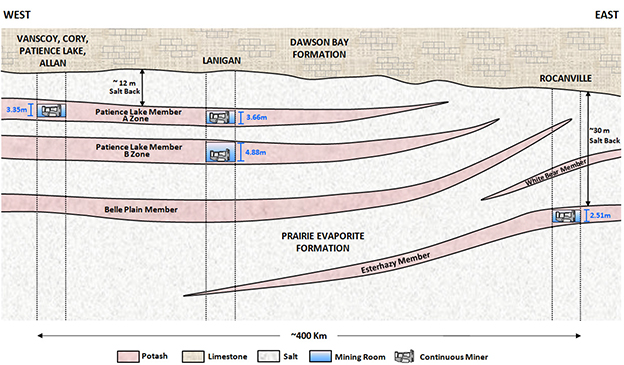
Yang, C., Jensen, G., and Berenyi, J. (2009a). The Stratigraphic Framework of the Potash-rich Members of the Middle Devonian Upper Prairie Evaporite Formation, Saskatchewan; Summary of Investigations 2009, Volume 1, Saskatchewan Geological Survey.
42