| FREE WRITING PROSPECTUS | ||
| FILED PURSUANT TO RULE 433 | ||
| REGISTRATION FILE NO.: 333-207340-09 | ||
January 29, 2018 FREE WRITING PROSPECTUS COLLATERAL TERM SHEET $ 1,045,167,892 (Approximate Total Mortgage Pool Balance) UBS 2018-C8 UBS Commercial Mortgage Securitization Corp. Depositor UBS AG Ladder Capital Finance LLC Société Générale Cantor Commercial Real Estate Lending, L.P. Rialto Mortgage Finance, LLC CIBC Inc. Barclays Bank PLC Sponsors and Mortgage Loan Sellers UBS Securities LLC Société Générale Barclays Cantor Fitzgerald & Co. Co-Lead Managers and Joint Bookrunners CIBC World Markets Drexel Hamilton Academy Securities Co-Managers The depositor has filed a registration statement (including a prospectus) with the Securities and Exchange Commission (‘‘SEC’’) (SEC File No. 333-207340) for the offering to which this communication relates. Before you invest, you should read the prospectus in the registration statement and other documents the depositor has filed with the SEC for more complete information about the depositor, the issuing entity and this offering. You may get these documents for free by visiting EDGAR on the SEC Web site at www.sec.gov. Alternatively, the depositor, any underwriter, or any dealer participating in the offering will arrange to send you the prospectus after filing if you request it by calling toll free 1-877-713-1030 (8 a.m. – 5 p.m. EST). The Offered Certificates referred to in these materials and the asset pool backing them are subject to modification or revision (including the possibility that one or more classes of certificates may be split, combined or eliminated at any time prior to issuance or availability of a final prospectus) and are offered on a “when, as and if issued” basis.
STATEMENT REGARDING THIS FREE WRITING PROSPECTUS
Nothing in this document constitutes an offer of securities for sale in any jurisdiction where the offer or sale is not permitted. The information contained herein is preliminary as of the date hereof, supersedes any such information previously delivered to you and will be superseded by any such information subsequently delivered prior to the time of sale and ultimately by the final prospectus relating to the offered certificates. These materials are subject to change, completion, supplement or amendment from time to time.
This free writing prospectus has been prepared by the underwriters for information purposes only and does not constitute, in whole or in part, a prospectus for the purposes of Directive 2003/71/EC (as amended) and/or Part VI of the Financial Services and Markets Act 2000, as amended, or other offering document.
STATEMENT REGARDING ASSUMPTIONS AS TO SECURITIES, PRICING ESTIMATES AND OTHER INFORMATION
This free writing prospectus contains certain forward-looking statements. If and when included in this free writing prospectus, the words “expects”, “intends”, “anticipates”, “estimates” and analogous expressions and all statements that are not historical facts, including statements about our beliefs or expectations, are intended to identify forward-looking statements. Any forward-looking statements are made subject to risks and uncertainties which could cause actual results to differ materially from those stated. Those risks and uncertainties include, among other things, declines in general economic and business conditions, increased competition, changes in demographics, changes in political and social conditions, regulatory initiatives and changes in customer preferences, many of which are beyond our control and the control of any other person or entity related to this offering. The forward- looking statements made in this free writing prospectus are made as of the date stated on the cover. We have no obligation to update or revise any forward-looking statement.
The attached information contains certain tables and other statistical analyses (the “Computational Materials”) that have been prepared in reliance upon information furnished by the Mortgage Loan Sellers. Numerous assumptions were used in preparing the Computational Materials, which may or may not be reflected herein. As such, no assurance can be given as to the Computational Materials’ accuracy, appropriateness or completeness in any particular context; or as to whether the Computational Materials and/or the assumptions upon which they are based reflect present market conditions or future market performance. The Computational Materials should not be construed as either projections or predictions or as legal, tax, financial or accounting advice. You should consult your own counsel, accountant and other advisors as to the legal, tax, business, financial and related aspects of a purchase of the offered certificates. Any weighted average lives, yields and principal payment periods shown in the Computational Materials are based on prepayment and/or loss assumptions, and changes in such prepayment and/or loss assumptions may dramatically affect such weighted average lives, yields and principal payment periods. In addition, it is possible that prepayments or losses on the underlying assets will occur at rates higher or lower than the rates shown in the attached Computational Materials. The specific characteristics of the offered certificates may differ from those shown in the Computational Materials due to differences between the final underlying assets and the preliminary underlying assets used in preparing the Computational Materials. The principal amount and designation of any security described in the Computational Materials are subject to change prior to issuance. None of UBS Securities LLC, SG Americas Securities, LLC, Barclays Capital Inc., Cantor Fitzgerald & Co., CIBC World Markets Corp., Drexel Hamilton, LLC or Academy Securities, Inc., or any of their respective affiliates, make any representation or warranty as to the actual rate or timing of payments or losses on any of the underlying assets or the payments or yield on the offered certificates. The information in this presentation is based upon management forecasts and reflects prevailing conditions and management’s views as of this date, all of which are subject to change. In preparing this presentation, we have relied upon and assumed, without independent verification, the accuracy and completeness of all information available from public sources or which was provided to us by or on behalf of the Mortgage Loan Sellers or which was otherwise reviewed by us.
IMPORTANT NOTICE REGARDING THE OFFERED CERTIFICATES
The offered certificates described herein are not suitable investments for all investors. In particular, you should not purchase any class of offered certificates unless you understand and are able to bear the prepayment, credit, liquidity and market risks associated with such class of certificates. For those reasons and for the reasons set forth under the heading “Risk Factors” in the Preliminary Prospectus, the yield to maturity and the aggregate amount and timing of distributions on the offered certificates are subject to material variability from period to period and give rise to the potential for significant loss over the life of such certificates. The interaction of these factors and their effects are impossible to predict and are likely to change from time to time. As a result, an investment in the offered certificates involves substantial risks and uncertainties and should be considered only by sophisticated institutional investors with substantial investment experience with similar types of securities and who have conducted appropriate due diligence on the mortgage loans and the certificates. Potential investors are advised and encouraged to review the Preliminary Prospectus in full and to consult with their legal, tax, accounting and other advisors prior to making any investment in the offered certificates described in this free writing prospectus.
This free writing prospectus is not to be construed as an offer to sell or the solicitation of any offer to buy any security in any jurisdiction where such an offer or solicitation would be illegal. The information contained in this free writing prospectus may not pertain to any securities that will actually be sold. The information contained in this free writing prospectus may be based on assumptions regarding market conditions and other matters as reflected in this free writing prospectus. We make no representations regarding the reasonableness of such assumptions or the likelihood that any of such assumptions will coincide with actual market conditions or events, and this free writing prospectus should not be relied upon for such purposes. The Underwriters and their respective affiliates, officers, directors, partners and employees, including persons involved in the preparation or issuance of this free writing prospectus may, from time to time, have long or short positions in, and buy or sell, the offered certificates mentioned in this free writing prospectus or derivatives thereof (including options). Information contained in this free writing prospectus is current as of the date appearing on this free writing prospectus only. None of UBS Securities LLC, SG Americas Securities, LLC, Barclays Capital Inc., Cantor Fitzgerald & Co., CIBC World Markets Corp., Drexel Hamilton, LLC or Academy Securities, Inc. provides accounting, tax or legal advice.
2
The issuing entity will be relying upon an exclusion or exemption from the definition of “investment company” under the Investment Company Act of 1940, as amended (the “Investment Company Act”), contained in Section 3(c)(5) of the Investment Company Act or Rule 3a-7 under the Investment Company Act, although there may be additional exclusions or exemptions available to the issuing entity. The issuing entity is being structured so as not to constitute a “covered fund” for purposes of the Volcker Rule under the Dodd-Frank Act (both as defined in “Risk Factors—Other Risks Relating to the Certificates—Legal and Regulatory Provisions Affecting Investors Could Adversely Affect the Liquidity of the Offered Certificates” in the Preliminary Prospectus). See also “Legal Investment” in the Preliminary Prospectus.
The information contained herein supersedes any previous such information delivered to any prospective investor and will be superseded by information delivered to such prospective investor prior to the time of sale.
IMPORTANT NOTICE RELATING TO AUTOMATICALLY-GENERATED EMAIL DISCLAIMERS
Any legends, disclaimers or other notices that may appear at the bottom of any email communication to which this free writing prospectus is attached relating to (1) these materials not constituting an offer (or a solicitation of an offer), (2) any representation that these materials are accurate or complete and may not be updated or (3) these materials possibly being confidential, are not applicable to these materials and should be disregarded. Such legends, disclaimers or other notices have been automatically generated as a result of these materials having been sent via Bloomberg or another system.
3
UBS 2018-C8
Capitalized terms used but not defined herein have the meanings assigned to them in the preliminary prospectus expected to be dated January 31, 2018 relating to the offered certificates (hereinafter referred to as the “Preliminary Prospectus”).
| KEY FEATURES OF SECURITIZATION |
| Offering Terms: | |
| Co-Lead Managers and Joint Bookrunners: | UBS Securities LLC SG Americas Securities, LLC Barclays Capital Inc. Cantor Fitzgerald & Co. |
| Co-Managers: | CIBC World Markets Corp. Drexel Hamilton, LLC Academy Securities, Inc. |
| Mortgage Loan Sellers: | UBS AG, by and through its branch office at 1285 Avenue of the Americas, New York, New York (“UBS AG”) (17.8%), Ladder Capital Finance LLC (“LCF”) (23.1%), Société Générale (“SG”) (17.3%), Cantor Commercial Real Estate Lending, L.P. (“CCRE”) (12.9%), Rialto Mortgage Finance, LLC (“RMF”) (10.8%), CIBC Inc. (“CIBC”) (9.4%), and Barclays Bank PLC (“Barclays”) (8.9%) |
| Master Servicer: | Midland Loan Services, a Division of PNC Bank, National Association |
| Operating Advisor: | Park Bridge Lender Services LLC |
| Asset Representations Reviewer: | Park Bridge Lender Services LLC |
| Special Servicer: | Midland Loan Services, a Division of PNC Bank, National Association |
| Trustee: | Wells Fargo Bank, National Association |
| Certificate Administrator: | Wells Fargo Bank, National Association |
| Rating Agencies: | Fitch Ratings, Inc., Kroll Bond Rating Agency, Inc. and Moody’s Investors Service, Inc. |
| U.S. Credit Risk Retention: | UBS AG is expected to act as the “retaining sponsor” for this securitization and intends to satisfy the U.S. credit risk retention requirement through the purchase by KKR Real Estate Credit Opportunity Partners AIV Aggregator I L.P., as a third party purchaser (as defined in Regulation RR), from the initial purchasers, on the Closing Date, of an “eligible horizontal residual interest”. The aggregate estimated fair value of the “eligible horizontal residual interest” will equal at least 5% of the estimated fair value of all of the certificates issued by the issuing entity. The pooling and servicing agreement will include the required provisions applicable to an operating advisor necessary for the securitization to comply with the credit risk retention rules utilizing the “third party purchaser” option. See “Operating Advisor” below. For additional information, see “Credit Risk Retention” in the Preliminary Prospectus. |
| EU Credit Risk Retention: | The transaction isnot structured to satisfy the EU risk retention and due diligence requirements. |
| Cut-off Date: | The mortgage loans will be considered part of the trust fund as of their respective cut-off dates. The cut-off date with respect to each mortgage loan is the respective due date for the monthly debt service payment that is due in February 2018 (or, in the case of any mortgage loan that has its first due date after February 2018, the date that would have been its due date in February 2018 under the terms of that mortgage loan if a monthly debt service payment were scheduled to be due in that month). |
| Closing Date: | On or about February 27, 2018 |
| Clean-up Call: | 1.0% |
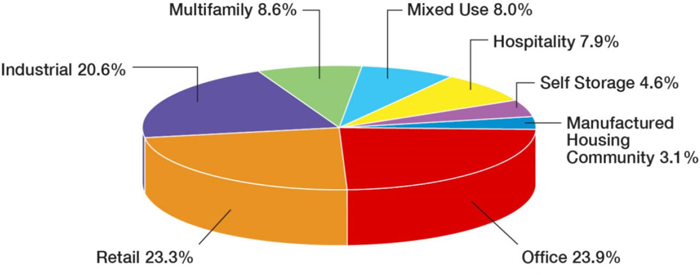
| Distribution of Collateral by Property Type |
THE INFORMATION IN THIS COLLATERAL TERM SHEET IS NOT COMPLETE AND MAY BE AMENDED PRIOR TO THE TIME OF SALE. THIS TERM SHEET IS NOT AN OFFER TO SELL THESE SECURITIES AND IT IS NOT A SOLICITATION OF AN OFFER TO BUY THESE SECURITIES IN ANY JURISDICTION WHERE THE OFFER OR SALE IS NOT PERMITTED.
4
UBS 2018-C8
| TRANSACTION HIGHLIGHTS |
| Mortgage Loan Sellers | Number of Mortgage Loans | Number of Mortgaged Properties | Aggregate Cut-off Date Balance | % of Outstanding Pool Balance(1) |
| Ladder Capital Finance LLC | 18 | 31 | $240,914,103 | 23.1% |
| UBS AG(2) | 13 | 31 | $185,760,271 | 17.8% |
| Société Générale(2) | 7 | 23 | $180,386,589 | 17.3% |
| Cantor Commercial Real Estate Lending, L.P.(2) | 7 | 8 | $134,620,128 | 12.9% |
| Rialto Mortgage Finance | 8 | 8 | $112,425,000 | 10.8% |
| CIBC Inc. | 9 | 10 | $98,083,420 | 9.4% |
| Barclays Bank PLC | 7 | 28 | $92,978,380 | 8.9% |
| Total | 67 | 126 | $1,045,167,892 | 100.0% |
| Pooled Collateral Facts: | |
| Initial Outstanding Pool Balance: | $1,045,167,892 |
| Number of Mortgage Loans: | 67 |
| Number of Mortgaged Properties: | 126 |
| Average Mortgage Loan Cut-off Date Balance: | $15,599,521 |
| Average Mortgaged Property Cut-off Date Balance: | $8,294,983 |
| Weighted Average Mortgage Rate: | 4.724% |
| Weighted Average Mortgage Loan Original Term to Maturity Date or ARD (months)(3): | 116 |
| Weighted Average Mortgage Loan Remaining Term to Maturity Date or ARD (months)(3): | 115 |
| Weighted Average Mortgage Loan Seasoning (months): | 1 |
| % of Mortgaged Properties Leased to a Single Tenant: | 23.1% |
| % of Mortgage Loans Secured by a Property or a Portfolio of Mortgaged Properties Leased to a Single Tenant: | 14.3% |
| Credit Statistics | |
| Weighted Average Mortgage Loan U/W NCF DSCR(4): | 1.92x |
| Weighted Average Mortgage Loan Cut-off Date LTV(4)(5): | 59.5% |
| Weighted Average Mortgage Loan Maturity Date or ARD LTV(4)(5): | 55.4% |
| Weighted Average U/W NOI Debt Yield(4): | 10.8% |
| Amortization Overview | |
| % Mortgage Loans which pay Interest Only through Maturity Date or ARD(3): | 57.1% |
| % Mortgage Loans with Amortization through Maturity Date or ARD(3): | 23.7% |
| % Mortgage Loans which pay Interest Only followed by Amortization through Maturity Date or ARD(3): | 19.2% |
| Weighted Average Remaining Amortization Term (months)(6): | 356 |
| Loan Structural Features | |
| % Mortgage Loans with Upfront or Ongoing Tax Reserves: | 73.4% |
| % Mortgage Loans with Upfront or Ongoing Replacement Reserves(7): | 73.3% |
| % Mortgage Loans with Upfront or Ongoing Insurance Reserves: | 62.2% |
| % Mortgage Loans with Upfront or Ongoing TI/LC Reserves(8): | 83.2% |
| % Mortgage Loans with Upfront Engineering Reserves: | 51.4% |
| % Mortgage Loans with Upfront or Ongoing Other Reserves: | 64.0% |
| % Mortgage Loans with In Place Hard Lockboxes: | 50.6% |
| % Mortgage Loans with Cash Traps Triggered at DSCR Levels ≥ 1.05x(9): | 88.8% |
| % Mortgage Loans with Defeasance Only After a Lockout Period and Prior to an Open Period: | 75.9% |
| % Mortgage Loans with Prepayment with a Yield Maintenance Charge Only After a Lockout Period and Prior to an Open Period: | 20.7% |
| % Mortgage Loans with a Period of Prepayment with a Yield Maintenance Charge Followed by a Period of Prepayment with a Yield Maintenance Charge or Defeasance Followed by an Open Period: | 3.5% |
Please see footnotes on the following page.
THE INFORMATION IN THIS COLLATERAL TERM SHEET IS NOT COMPLETE AND MAY BE AMENDED PRIOR TO THE TIME OF SALE. THIS TERM SHEET IS NOT AN OFFER TO SELL THESE SECURITIES AND IT IS NOT A SOLICITATION OF AN OFFER TO BUY THESE SECURITIES IN ANY JURISDICTION WHERE THE OFFER OR SALE IS NOT PERMITTED.
5
UBS 2018-C8
| TRANSACTION HIGHLIGHTS |
| (1) | Unless otherwise indicated, all references to “% of Outstanding Pool Balance” in this Term Sheet reflect a percentage of the aggregate principal balance of the mortgage pool as of the Cut-off Date, after application of all payments of principal due during or prior to February 2018. |
| (2) | The UBS AG and Société Générale allocations each include the AFIN Portfolio mortgage loan (1 loan and 12 properties), and the UBS AG and CCRE allocations each include the Tryad Industrial & Business Center mortgage loan (1 loan and 1 property). |
| (3) | For any mortgage loan with an anticipated repayment date, calculated to or as of, as applicable, that anticipated repayment date. |
| (4) | With respect to any mortgage loan that is part of a whole loan, unless otherwise indicated, LTV, DSCR and Debt Yield calculations in this Term Sheet include any relatedpari passu companion loans and exclude any subordinate companion loans, as applicable. Additionally, LTV, DSCR and Debt Yield figures in this Term Sheet are calculated for mortgage loans without regard to any additional indebtedness that may be incurred at a future date. |
| (5) | With respect to the whole loan secured by the mortgaged properties identified on Annex A-1 to the Preliminary Prospectus as Park Place at Florham Park, the Cut-off Date LTV, Maturity Date or ARD LTV, and appraised value are based on the alternate market “As-Is” appraised value of $96,000,000 as of December 4, 2017, which assumes that outstanding landlord obligations for free rent, tenant improvements, and leasing commissions are fully funded and escrowed by the lender through a title company. At origination, landlord obligations of $5,044,401 were escrowed. The Cut-off Date LTV and Maturity Date or ARD LTV assuming the “As-Is” appraised value of $91,200,000 for the Park Place at Florham Park Mortgaged Properties are 68.5% and 68.5%, respectively. With respect to the mortgage loan secured by the mortgaged property identified on Annex A-1 to the Preliminary Prospectus as The Village at La Orilla, the Cut-off Date LTV, Maturity Date or ARD LTV, and appraised value are based on the “As-Stabilized” appraised value of $22,050,000 as of January 1, 2018, which assumes certain tenants are in occupancy who have signed leases but have not yet taken their space. At origination, $622,968 was reserved with respect to these tenants. The Cut-off Date LTV and Maturity Date or ARD LTV assuming the “As-Is” appraised value of $21,450,000 as of August 2, 2017 are 71.7% and 58.8%, respectively. For additional information, see “Description of the Mortgage Pool—Mortgage Pool Characteristics – Appraised Value” in the Preliminary Prospectus and the footnotes to Annex A-1 in the Preliminary Prospectus. |
| (6) | Excludes mortgage loans that are interest-only for the full loan term. |
| (7) | Includes FF&E Reserves. |
| (8) | Represents the percent of the allocated aggregate principal balance of the mortgage pool as of the Cut-off Date of retail, office, industrial, and mixed use, and the Yorkshire & Lexington Towers properties only. |
| (9) | The Yorkshire & Lexington Towers Whole Loan has a cash trap trigger that, among other trigger events requires that the debt service coverage ratio for the trailing twelve-month period must not fall below 1.05x and, after the second anniversary of the first payment date, the debt service coverage ratio based on the trailing twelve-month must not fall below 1.10x. If the Yorkshire & Lexington Towers Whole Loan was included in this calculation the % of Mortgage Loans with Cash Traps Triggered at DSCR Levels greater than and equal to 1.05x would be 90.0% of the Initial Pool Balance. |
THE INFORMATION IN THIS COLLATERAL TERM SHEET IS NOT COMPLETE AND MAY BE AMENDED PRIOR TO THE TIME OF SALE. THIS TERM SHEET IS NOT AN OFFER TO SELL THESE SECURITIES AND IT IS NOT A SOLICITATION OF AN OFFER TO BUY THESE SECURITIES IN ANY JURISDICTION WHERE THE OFFER OR SALE IS NOT PERMITTED.
6
UBS 2018-C8
| OVERVIEW OF MORTGAGE POOL CHARACTERISTICS |
| Distribution of Cut-off Date Balances | |||||||||||
| Weighted Averages | |||||||||||
| Range of Cut-off Date Balances | Number of Mortgage Loans | Aggregate Cut-off Date Balance | % of Initial Outstanding Pool Balance(1) | Mortgage Rate | Stated Remaining Term (Mos.)(6) | U/W NCF DSCR(1)(2) | Cut-off Date LTV Ratio(1)(2)(3) | Maturity Date or ARD LTV Ratio(1)(2)(3) | |||
| $896,000 | - | $10,000,000 | 33 | $190,119,922 | 18.2% | 5.050% | 112 | 1.66x | 62.2% | 55.8% | |
| $10,000,001 | - | $15,000,000 | 13 | $166,574,611 | 15.9% | 4.566% | 113 | 1.99x | 57.9% | 52.2% | |
| $15,000,001 | - | $20,000,000 | 5 | $80,633,103 | 7.7% | 4.963% | 120 | 1.64x | 62.9% | 56.7% | |
| $20,000,001 | - | $25,000,000 | 3 | $67,300,000 | 6.4% | 4.475% | 119 | 1.51x | 67.4% | 59.0% | |
| $25,000,001 | - | $30,000,000 | 2 | $53,950,000 | 5.2% | 4.503% | 88 | 2.19x | 62.5% | 62.5% | |
| $30,000,001 | - | $35,000,000 | 4 | $133,650,000 | 12.8% | 4.430% | 118 | 2.54x | 56.2% | 56.2% | |
| $35,000,001 | - | $45,000,000 | 2 | $90,000,000 | 8.6% | 4.905% | 120 | 1.78x | 57.4% | 57.4% | |
| $45,000,001 | - | $50,000,000 | 3 | $146,500,000 | 14.0% | 4.804% | 120 | 1.98x | 59.5% | 56.1% | |
| $50,000,001 | - | $60,000,000 | 2 | $116,440,256 | 11.1% | 4.593% | 119 | 1.89x | 54.6% | 50.1% | |
| Total/Weighted Average | 67 | $1,045,167,892 | 100.0% | 4.724% | 115 | 1.92x | 59.5% | 55.4% | |||
| Distribution of Mortgage Rates | ||||||||||
| Weighted Averages | ||||||||||
| Range of Mortgage Rates | Number of Mortgage Loans | Aggregate Cut-off Date Balance | % of Initial Outstanding Pool Balance(1) | Mortgage Rate | Stated Remaining Term (Mos.)(6) | U/W NCF DSCR(1)(2) | Cut-off Date LTV Ratio(1)(2)(3) | Maturity Date or ARD LTV Ratio(1)(2)(3) | ||
| 2.7400% | - | 4.0000% | 1 | $15,000,000 | 1.4% | 2.740% | 56 | 4.28x | 22.5% | 22.5% |
| 4.0001% | - | 4.2500% | 3 | $97,400,000 | 9.3% | 4.141% | 119 | 2.50x | 54.5% | 54.5% |
| 4.2501% | - | 4.5000% | 7 | $133,900,000 | 12.8% | 4.390% | 107 | 2.21x | 60.5% | 56.2% |
| 4.5001% | - | 4.7500% | 16 | $359,612,500 | 34.4% | 4.639% | 119 | 1.98x | 59.0% | 57.5% |
| 4.7501% | - | 5.0000% | 18 | $155,328,844 | 14.9% | 4.884% | 119 | 1.71x | 63.1% | 56.1% |
| 5.0001% | - | 5.2500% | 16 | $240,536,073 | 23.0% | 5.105% | 119 | 1.52x | 61.1% | 53.9% |
| 5.2501% | - | 5.5000% | 2 | $12,740,475 | 1.2% | 5.320% | 119 | 1.27x | 72.1% | 60.7% |
| 5.5001% | - | 6.1600% | 4 | $30,650,000 | 2.9% | 5.948% | 75 | 1.53x | 59.4% | 53.3% |
| Total/Weighted Average | 67 | $1,045,167,892 | 100.0% | 4.724% | 115 | 1.92x | 59.5% | 55.4% | ||
| Property Type Distribution(1) | |||||||||||
| Weighted Averages | |||||||||||
| Property Type | Number of Mortgage Properties | Aggregate Cut-Off Date Balance | % of Initial Outstanding Pool Balance(1) | Number of Units/Rooms/Pads/ NRA/Beds | Cut-off Date Balance per Unit/Room/Pads NRA(1)(2) | Mortgage Rate | Stated Remaining Term (Mos.)(6) | Occupancy | U/W NCF DSCR(1)(2) | Cut-off Date LTV Ratio(1)(2)(3) | Maturity Date or ARD LTV Ratio(1)(2)(3) |
| Office | 15 | $249,950,000 | 23.9% | 2,878,585 | $151 | 4.759% | 120 | 94.7% | 1.86x | 63.0% | 59.5% |
| Suburban | 11 | $206,000,000 | 19.7% | 2,618,684 | $135 | 4.731% | 120 | 95.5% | 1.95x | 62.8% | 60.5% |
| Medical | 3 | $31,200,000 | 3.0% | 121,880 | $280 | 4.892% | 119 | 93.7% | 1.53x | 61.1% | 55.2% |
| CBD | 1 | $12,750,000 | 1.2% | 138,021 | $92 | 4.885% | 119 | 83.1% | 1.32x | 69.7% | 53.4% |
| Retail | 49 | $243,124,044 | 23.3% | 3,849,338 | $141 | 4.570% | 119 | 96.8% | 2.00x | 62.0% | 58.3% |
| Anchored | 20 | $171,923,773 | 16.4% | 3,354,028 | $123 | 4.527% | 119 | 95.5% | 2.06x | 61.6% | 58.9% |
| Free-Standing | 23 | $47,209,796 | 4.5% | 399,939 | $119 | 4.465% | 119 | 100.0% | 2.08x | 59.7% | 55.9% |
| Shadow Anchored | 4 | $16,983,709 | 1.6% | 56,671 | $335 | 5.039% | 119 | 100.0% | 1.39x | 66.8% | 56.8% |
| Unanchored | 2 | $7,006,765 | 0.7% | 38,700 | $253 | 5.190% | 120 | 100.0% | 1.42x | 74.1% | 61.3% |
| Industrial | 25 | $215,791,708 | 20.6% | 8,985,497 | $46 | 4.760% | 112 | 90.4% | 1.88x | 56.6% | 50.5% |
| Warehouse/Distribution | 21 | $139,244,652 | 13.3% | 5,348,752 | $51 | 4.718% | 108 | 98.1% | 1.94x | 58.8% | 53.2% |
| Flex | 1 | $56,440,256 | 5.4% | 3,353,230 | $33 | 5.021% | 119 | 68.1% | 1.42x | 52.6% | 43.3% |
| Flex/R&D | 1 | $13,341,000 | 1.3% | 127,105 | $52 | 4.320% | 120 | 100.0% | 2.76x | 52.3% | 52.3% |
| Light Industrial | 1 | $4,098,300 | 0.4% | 58,546 | $52 | 4.320% | 120 | 100.0% | 2.76x | 52.3% | 52.3% |
| Manufacturing | 1 | $2,667,500 | 0.3% | 97,864 | $52 | 4.320% | 120 | 100.0% | 2.76x | 52.3% | 52.3% |
| Multifamily | 13 | $90,100,000 | 8.6% | 1,955 | $123,024 | 4.511% | 103 | 96.5% | 2.13x | 54.0% | 51.6% |
| Garden | 9 | $38,287,500 | 3.7% | 780 | $68,630 | 5.012% | 109 | 95.5% | 1.51x | 61.5% | 55.9% |
| Student Housing | 1 | $34,500,000 | 3.3% | 342 | $100,877 | 4.690% | 115 | 99.7% | 1.95x | 58.8% | 58.8% |
| High Rise | 2 | $15,000,000 | 1.4% | 827 | $241,838 | 2.740% | 56 | 92.0% | 4.28x | 22.5% | 22.5% |
| Mid Rise | 1 | $2,312,500 | 0.2% | 6 | $583,333 | 5.023% | 119 | 95.1% | 1.35x | 62.5% | 62.5% |
| Mixed Use | 7 | $83,725,522 | 8.0% | 508,199 | $32,924 | 4.773% | 120 | 91.4% | 1.71x | 54.3% | 51.7% |
| Office/Garage/Retail | 1 | $45,000,000 | 4.3% | 246,136 | $366 | 4.728% | 120 | 94.2% | 1.76x | 49.7% | 49.7% |
| Retail/Office | 2 | $22,988,022 | 2.2% | 143,333 | $183 | 4.803% | 118 | 84.8% | 1.71x | 58.6% | 53.1% |
| Medical/Office/Retail | 1 | $6,550,000 | 0.6% | 33,056 | $198 | 4.805% | 120 | 92.0% | 1.69x | 61.5% | 55.4% |
| Multifamily/Retail | 2 | $4,687,500 | 0.4% | 6 | $583,333 | 5.023% | 119 | 95.1% | 1.35x | 62.5% | 62.5% |
| Office/Retail | 1 | $4,500,000 | 0.4% | 85,668 | $53 | 4.768% | 120 | 91.6% | 1.60x | 58.4% | 47.7% |
| Hospitality | 9 | $82,392,296 | 7.9% | 886 | $141,303 | 5.011% | 114 | 79.0% | 2.19x | 62.4% | 55.6% |
| Limited Service | 6 | $41,892,296 | 4.0% | 470 | $122,963 | 5.139% | 119 | 72.9% | 1.91x | 65.9% | 53.5% |
| Extended Stay | 3 | $40,500,000 | 3.9% | 416 | $160,273 | 4.879% | 109 | 85.3% | 2.49x | 58.7% | 57.8% |
| Self Storage | 6 | $47,584,320 | 4.6% | 662,596 | $79 | 4.787% | 119 | 87.9% | 1.97x | 53.6% | 52.7% |
| Manufactured Housing Community | 2 | $32,500,000 | 3.1% | 578 | $61,215 | 5.007% | 103 | 93.6% | 1.26x | 64.6% | 59.8% |
| Total/Weighted Average | 126 | $1,045,167,892 | 100.0% | 4.724% | 115 | 92.6% | 1.92x | 59.5% | 55.4% | ||
Please see footnotes on page 10.
THE INFORMATION IN THIS COLLATERAL TERM SHEET IS NOT COMPLETE AND MAY BE AMENDED PRIOR TO THE TIME OF SALE. THIS TERM SHEET IS NOT AN OFFER TO SELL THESE SECURITIES AND IT IS NOT A SOLICITATION OF AN OFFER TO BUY THESE SECURITIES IN ANY JURISDICTION WHERE THE OFFER OR SALE IS NOT PERMITTED.
7
UBS 2018-C8
| OVERVIEW OF MORTGAGE POOL CHARACTERISTICS |
| Geographic Distribution(1) | ||||||||
| Weighted Averages | ||||||||
| State/Location | Number of Mortgage Properties | Aggregate Cut-off Date Balance | % of Initial Outstanding Pool Balance(1) | Mortgage Rate | Stated Remaining Term (Mos.)(6) | U/W NCF DSCR(1)(2) | Cut-off Date LTV Ratio(1)(2)(3) | Maturity Date or ARD LTV Ratio(1)(2)(3) |
| California | 10 | $162,300,000 | 15.5% | 4.811% | 116 | 1.87x | 55.1% | 53.9% |
| California - Southern(4) | 6 | $98,800,000 | 9.5% | 4.895% | 114 | 1.91x | 57.7% | 55.7% |
| California - Northern(4) | 4 | $63,500,000 | 6.1% | 4.680% | 120 | 1.81x | 51.0% | 51.0% |
| Texas | 7 | $136,442,813 | 13.1% | 4.826% | 117 | 1.80x | 59.9% | 54.4% |
| New York | 15 | $92,564,319 | 8.9% | 4.565% | 109 | 1.96x | 50.3% | 43.9% |
| Indiana | 5 | $60,350,000 | 5.8% | 4.833% | 117 | 1.73x | 62.3% | 57.7% |
| Massachusetts | 2 | $59,327,500 | 5.7% | 4.692% | 111 | 2.27x | 60.7% | 60.7% |
| Other | 87 | $534,183,258 | 51.1% | 4.690% | 116 | 1.94x | 61.9% | 57.3% |
| Total/Weighted Average | 126 | 1,045,167,890 | 100.0% | 4.724% | 115 | 1.92x | 59.5% | 55.4% |
| Distribution of Cut-off Date LTV Ratios(1)(2)(3) | ||||||||||
| Weighted Averages | ||||||||||
| Range of Cut-off Date LTV Ratios | Number of Mortgage Loans | Aggregate Cut-off Date Balance | % of Initial Outstanding Pool Balance(1) | Mortgage Rate | Stated Remaining Term (Mos.)(6) | U/W NCF DSCR(1)(2) | Cut-off Date LTV Ratio(1)(2)(3) | Maturity Date or ARD LTV Ratio(1)(2)(3) | ||
| 22.5% | - | 35.0% | 2 | $19,000,000 | 1.8% | 3.010% | 69 | 3.87x | 25.0% | 25.0% |
| 35.1% | - | 45.0% | 1 | $6,000,000 | 0.6% | 4.374% | 120 | 3.42x | 39.3% | 39.3% |
| 45.1% | - | 55.0% | 11 | $234,474,576 | 22.4% | 4.728% | 116 | 1.95x | 52.0% | 49.0% |
| 55.1% | - | 60.0% | 13 | $284,642,750 | 27.2% | 4.652% | 119 | 2.04x | 58.2% | 55.6% |
| 60.1% | - | 65.0% | 19 | $283,368,671 | 27.1% | 4.767% | 112 | 1.93x | 62.1% | 58.6% |
| 65.1% | - | 70.0% | 12 | $140,963,250 | 13.5% | 4.974% | 119 | 1.54x | 67.5% | 59.9% |
| 70.1% | - | 75.0% | 9 | $76,718,645 | 7.3% | 4.808% | 119 | 1.47x | 73.2% | 63.3% |
| Total/Weighted Average | 67 | $1,045,167,892 | 100.0% | 4.724% | 115 | 1.92x | 59.5% | 55.4% | ||
| Distribution of Maturity Date or ARD LTV Ratios(1)(2)(3) | ||||||||||
| Weighted Averages | ||||||||||
| Range of LTV Ratios at Maturity or ARD | Number of Mortgage Loans | Aggregate Cut-off Date Balance | % of Initial Outstanding Pool Balance(1) | Mortgage Rate | Stated Remaining Term (Mos.)(6) | U/W NCF DSCR(1)(2) | Cut-off Date LTV Ratio(1)(2)(3) | Maturity Date or ARD LTV Ratio(1)(2)(3) | ||
| 22.5% | - | 45.0% | 6 | $97,274,576 | 9.3% | 4.548% | 109 | 2.06x | 46.1% | 39.6% |
| 45.1% | - | 55.0% | 20 | $316,318,671 | 30.3% | 4.769% | 117 | 1.89x | 56.4% | 51.0% |
| 55.1% | - | 60.0% | 19 | $340,203,170 | 32.6% | 4.673% | 119 | 1.92x | 61.3% | 57.9% |
| 60.1% | - | 65.0% | 16 | $224,090,475 | 21.4% | 4.730% | 110 | 1.98x | 64.6% | 61.8% |
| 65.1% | - | 70.0% | 6 | $67,281,000 | 6.4% | 5.002% | 120 | 1.68x | 67.6% | 65.7% |
| Total/Weighted Average | 67 | $1,045,167,892 | 100.0% | 4.724% | 115 | 1.92x | 59.5% | 55.4% | ||
| Distribution of Underwritten NCF Debt Service Coverage Ratios(1)(2) | |||||||||||
| Weighted Averages | |||||||||||
| Range of Underwritten NCF Debt Service Coverage Ratios | Number of Mortgage Loans | Aggregate Cut-off Date Balance | % of Initial Outstanding Pool Balance(1) | Mortgage Rate | Stated Remaining Term (Mos.)(6) | U/W NCF DSCR(1)(2) | Cut-off Date LTV Ratio(1)(2)(3) | Maturity Date or ARD LTV Ratio(1)(2)(3) | |||
| 1.25x | - | 1.35x | 8 | $90,565,475 | 8.7% | 5.055% | 113 | 1.28x | 66.6% | 58.8% | |
| 1.36x | - | 1.45x | 8 | $169,673,349 | 16.2% | 5.053% | 119 | 1.41x | 59.9% | 50.3% | |
| 1.46x | - | 1.55x | 7 | $52,575,522 | 5.0% | 4.812% | 118 | 1.51x | 65.8% | 56.9% | |
| 1.56x | - | 1.65x | 8 | $67,944,060 | 6.5% | 4.908% | 114 | 1.59x | 62.6% | 53.9% | |
| 1.66x | - | 1.75x | 9 | $82,268,500 | 7.9% | 4.599% | 120 | 1.70x | 59.6% | 53.4% | |
| 1.76x | - | 1.85x | 4 | $110,500,000 | 10.6% | 4.971% | 116 | 1.79x | 56.9% | 56.6% | |
| 1.86x | - | 1.95x | 8 | $108,111,647 | 10.3% | 4.723% | 118 | 1.91x | 60.7% | 59.0% | |
| 1.96x | - | 2.05x | 2 | $11,092,750 | 1.1% | 4.524% | 119 | 2.01x | 59.1% | 59.1% | |
| 2.06x | - | 2.30x | 3 | $109,886,589 | 10.5% | 4.667% | 120 | 2.26x | 60.6% | 59.3% | |
| 2.31x | - | 2.55x | 4 | $108,900,000 | 10.4% | 4.367% | 104 | 2.40x | 58.3% | 58.3% | |
| 2.56x | - | 4.28x | 6 | $133,650,000 | 12.8% | 4.180% | 113 | 2.93x | 51.5% | 51.5% | |
| Total/Weighted Average | 67 | $1,045,167,892 | 100.0% | 4.724% | 115 | 1.92x | 59.5% | 55.4% | |||
Please see footnotes on page 10.
THE INFORMATION IN THIS COLLATERAL TERM SHEET IS NOT COMPLETE AND MAY BE AMENDED PRIOR TO THE TIME OF SALE. THIS TERM SHEET IS NOT AN OFFER TO SELL THESE SECURITIES AND IT IS NOT A SOLICITATION OF AN OFFER TO BUY THESE SECURITIES IN ANY JURISDICTION WHERE THE OFFER OR SALE IS NOT PERMITTED.
8
UBS 2018-C8
| OVERVIEW OF MORTGAGE POOL CHARACTERISTICS |
| Original Terms to Maturity or ARD | ||||||||
| Weighted Averages | ||||||||
| Original Terms to Maturity or ARD | Number of Mortgage Loans | Aggregate Cut-off Date Balance | % of Initial Outstanding Pool Balance(1) | Mortgage Rate | Stated Remaining Term (Mos.)(6) | U/W NCF DSCR(1)(2) | Cut-off Date LTV Ratio(1)(2)(3) | Maturity Date or ARD LTV Ratio(1)(2)(3) |
| 60 | 5 | $66,350,000 | 6.3% | 4.623% | 59 | 2.55x | 52.1% | 51.2% |
| 120 | 62 | $978,817,892 | 93.7% | 4.731% | 119 | 1.88x | 60.0% | 55.7% |
| Total/Weighted Average | 67 | $1,045,167,892 | 100.0% | 4.724% | 115 | 1.92x | 59.5% | 55.4% |
| Distribution of Remaining Terms to Maturity or ARD | ||||||||||
| Weighted Averages | ||||||||||
| Range of Remaining Terms to Maturity or ARD | Number of Mortgage Loans | Aggregate Cut-off Date Balance | % of Initial Outstanding Pool Balance(1) | Mortgage Rate | Stated Remaining Term (Mos.)(6) | U/W NCF DSCR(1)(2) | Cut-off Date LTV Ratio(1)(2)(3) | Maturity Date or ARD LTV Ratio(1)(2)(3) | ||
| 56 | - | 118 | 13 | $158,224,990 | 15.1% | 4.722% | 92 | 2.04x | 57.0% | 54.5% |
| 119 | - | 120 | 54 | $886,942,901 | 84.9% | 4.724% | 120 | 1.90x | 60.0% | 55.6% |
| Total/Weighted Average | 67 | $1,045,167,892 | 100.0% | 4.724% | 115 | 1.92x | 59.5% | 55.4% | ||
| Distribution of Underwritten NOI Debt Yields(1)(2)(3) | ||||||||||
| Weighted Averages | ||||||||||
| Range of Underwritten NOI Debt Yields | Number of Mortgage Loans | Aggregate Cut-off Date Balance | % of Initial Outstanding Pool Balance(1) | Mortgage Rate | Stated Remaining Term (Mos.)(6) | U/W NCF DSCR(1)(2) | Cut-off Date LTV Ratio(1)(2)(3) | Maturity Date or ARD LTV Ratio(1)(2)(3) | ||
| 7.0% | - | 8.5% | 6 | $69,475,000 | 6.6% | 4.915% | 111 | 1.39x | 62.4% | 59.1% |
| 8.6% | - | 9.0% | 9 | $112,192,077 | 10.7% | 4.921% | 120 | 1.54x | 59.6% | 55.1% |
| 9.1% | - | 9.5% | 6 | $52,246,820 | 5.0% | 4.675% | 118 | 1.75x | 60.0% | 56.8% |
| 9.6% | - | 10.0% | 11 | $124,142,750 | 11.9% | 4.788% | 118 | 1.72x | 61.3% | 56.8% |
| 10.1% | - | 10.5% | 7 | $123,480,926 | 11.8% | 4.822% | 119 | 1.53x | 58.6% | 51.0% |
| 10.6% | - | 11.0% | 4 | $109,688,022 | 10.5% | 5.102% | 120 | 1.60x | 62.3% | 56.1% |
| 11.1% | - | 11.5% | 6 | $145,094,060 | 13.9% | 4.410% | 119 | 2.14x | 61.1% | 58.5% |
| 11.6% | - | 12.0% | 2 | $65,000,000 | 6.2% | 4.274% | 105 | 2.71x | 51.3% | 51.3% |
| 12.1% | - | 12.5% | 6 | $128,900,000 | 12.3% | 4.386% | 104 | 2.51x | 56.7% | 55.3% |
| 12.6% | - | 16.2% | 10 | $114,948,236 | 11.0% | 4.931% | 116 | 2.26x | 59.5% | 54.2% |
| Total/Weighted Average | 67 | $1,045,167,892 | 100.0% | 4.724% | 115 | 1.92x | 59.5% | 55.4% | ||
| Amortization Types | ||||||||
| Weighted Averages | ||||||||
| Amortization Type | Number of Mortgage Loans | Aggregate Cut-off Date Balance | % of Initial Outstanding Pool Balance(1) | Mortgage Rate | Stated Remaining Term (Mos.)(6) | U/W NCF DSCR(1)(2) | Cut-off Date LTV Ratio(1)(2)(3) | Maturity Date or ARD LTV Ratio(1)(2)(3) |
| Full IO | 28 | $593,792,750 | 56.8% | 4.569% | 114 | 2.24x | 56.9% | 56.9% |
| Amortizing | 19 | $248,144,142 | 23.7% | 5.080% | 116 | 1.54x | 60.8% | 50.2% |
| Partial IO | 17 | $200,462,500 | 19.2% | 4.733% | 119 | 1.46x | 65.4% | 57.3% |
| Full IO, ARD | 3 | $2,768,500 | 0.3% | 5.200% | 120 | 1.69x | 70.0% | 70.0% |
| Total/Weighted Average | 67 | $1,045,167,892 | 100.0% | 4.724% | 115 | 1.92x | 59.5% | 55.4% |
| Loan Purposes | ||||||||
| Weighted Averages | ||||||||
| Loan Purpose | Number of Mortgage Loans | Aggregate Cut-off Date Balance | % of Initial Outstanding Pool Balance(1) | Mortgage Rate | Stated Remaining Term (Mos.)(6) | U/W NCF DSCR(1)(2) | Cut-off Date LTV Ratio(1)(2)(3) | Maturity Date or ARD LTV Ratio(1)(2)(3) |
| Refinance | 36 | $515,571,417 | 49.3% | 4.813% | 115 | 1.80x | 58.8% | 54.0% |
| Acquisition | 29 | $420,596,475 | 40.2% | 4.642% | 116 | 2.07x | 61.0% | 57.9% |
| Recapitalization(5) | 2 | $109,000,000 | 10.4% | 4.618% | 119 | 1.94x | 57.3% | 52.8% |
| Total/Weighted Average | 67 | $1,045,167,892 | 100.0% | 4.724% | 115 | 1.92x | 59.5% | 55.4% |
Please see footnotes on page 10.
THE INFORMATION IN THIS COLLATERAL TERM SHEET IS NOT COMPLETE AND MAY BE AMENDED PRIOR TO THE TIME OF SALE. THIS TERM SHEET IS NOT AN OFFER TO SELL THESE SECURITIES AND IT IS NOT A SOLICITATION OF AN OFFER TO BUY THESE SECURITIES IN ANY JURISDICTION WHERE THE OFFER OR SALE IS NOT PERMITTED.
9
UBS 2018-C8
| OVERVIEW OF MORTGAGE POOL CHARACTERISTICS |
| (1) | All numerical information concerning the mortgage loans is approximate and, in the case of mortgage loans secured by multiple properties, is based on allocated loan amounts with respect to such properties. All weighted average information regarding the mortgage loans reflects the weighting of the mortgage loans based on their outstanding principal balances as of the Cut-off Date or, in the case of mortgage loans secured by multiple properties, allocated loan amounts. The sum of numbers and percentages in columns may not match the “Total” due to rounding. |
| (2) | With respect to any mortgage loan that is part of a whole loan, unless otherwise indicated, Balance per Unit/Room/Pad/NRA, LTV, DSCR and Debt Yield calculations in this Term Sheet include any relatedpari passu companion loans and exclude any subordinate companion loans, as applicable. Additionally, Balance per Unit/Room/Pad/NRA, LTV, DSCR and Debt Yield figures in this Term Sheet are calculated for mortgage loans without regard to any additional indebtedness that may be incurred at a future date. |
| (3) | With respect to the whole loan secured by the mortgaged properties identified on Annex A-1 to the Preliminary Prospectus as Park Place at Florham Park, the Cut-off Date LTV Ratio, Maturity Date or ARD LTV Ratio, and appraised value are based on the alternate market “As-Is” appraised value of $96,000,000 as of December 4, 2017, which assumes that outstanding landlord obligations for free rent, tenant improvements, and leasing commissions are fully funded and escrowed by the lender through a title company. At origination, landlord obligations of $5,044,401 were escrowed. The Cut-off Date LTV Ratio and Maturity Date or ARD LTV Ratio assuming the “As-Is” appraised value of $91,200,000 for the Park Place at Florham Park Mortgaged Properties are 68.5% and 68.5%, respectively. With respect to the mortgage loan secured by the mortgaged property identified on Annex A-1 to the Preliminary Prospectus as The Village at La Orilla, the Cut-off Date LTV Ratio, Maturity Date or ARD LTV Ratio, and appraised value are based on the "As-Stabilized" appraised value of $22,050,000 as of January 1, 2018, which assumes certain tenants are in occupancy who have signed leases but have not yet taken their space. At origination, $622,968 was reserved with respect to these tenants. The Cut-off Date LTV Ratio and Maturity Date or ARD LTV Ratio assuming the “As-Is” appraised value of $21,450,000 as of August 2, 2017 are 71.7% and 58.8%, respectively. For additional information, see “Description of the Mortgage Pool—Mortgage Pool Characteristics – Appraised Value” in the Preliminary Prospectus and the footnotes to Annex A-1 in the Preliminary Prospectus. |
| (4) | “California—Northern” includes zip codes above 93600, and “California—Southern” includes zip codes at or below 93600. |
| (5) | With respect to the whole loan secured by the mortgaged properties identified on Annex A-1 to the Preliminary Prospectus as AFIN Portfolio, loan proceeds were used to refinance existing debt of approximately $18.0 million encumbering the San Pedro Crossing Mortgaged Property and recapitalize the borrower sponsors recent acquisition of the remaining 11 AFIN Portfolio Mortgaged Properties. With respect to the mortgage loan secured by the mortgaged properties identified on Annex A-1 to the Preliminary Prospectus as AFIN Industrial and Retail Net-Leased Portfolio, loan proceeds were used to recapitalize the borrower sponsor after the purchase the AFIN Industrial and Retail Net-Leased Portfolio Mortgaged Properties between March 31, 2017 and November 7, 2017. |
| (6) | With respect to an ARD loan, refers to the term through the related anticipated repayment date. |
THE INFORMATION IN THIS COLLATERAL TERM SHEET IS NOT COMPLETE AND MAY BE AMENDED PRIOR TO THE TIME OF SALE. THIS TERM SHEET IS NOT AN OFFER TO SELL THESE SECURITIES AND IT IS NOT A SOLICITATION OF AN OFFER TO BUY THESE SECURITIES IN ANY JURISDICTION WHERE THE OFFER OR SALE IS NOT PERMITTED.
10
UBS 2018-C8
| OVERVIEW OF MORTGAGE POOL CHARACTERISTICS |
| Ten Largest Mortgage Loans | |||||||||
| Mortgage Loan | Mortgage Loan Seller | City, State | Property Type | Cut-off Date Balance | % of Initial Outstanding Pool Balance | Cut-off Date Balance per Unit/Room/ Pad/NRA(1) | Cut-off Date LTV Ratio(1) | U/W NCF DSCR(1) | U/W NOI Debt Yield(1) |
| AFIN Portfolio | SG; UBS AG | Various | Retail | $60,000,000 | 5.7% | $87 | 56.5% | 2.34x | 11.1% |
| Tryad Industrial & Business Center | CCRE; UBS AG | Rochester, NY | Industrial | $56,440,256 | 5.4% | $33 | 52.6% | 1.42x | 10.5% |
| CrossPoint | CCRE | Lowell, MA | Office | $50,000,000 | 4.8% | $114 | 60.0% | 2.24x | 11.8% |
| Houston Distribution Center | SG | Katy, TX | Industrial | $49,000,000 | 4.7% | $56 | 58.3% | 1.44x | 10.6% |
| Moore Plaza | RMF | Corpus Christi, TX | Retail | $47,500,000 | 4.5% | $126 | 60.2% | 2.27x | 11.4% |
| Park Place at Florham Park(2) | UBS AG | Florham Park, NJ | Office | $45,000,000 | 4.3% | $176 | 65.1% | 1.80x | 10.6% |
| City Square and Clay Street | LCF | Oakland, CA | Mixed Use | $45,000,000 | 4.3% | $366 | 49.7% | 1.76x | 8.9% |
| University Properties Portfolio | CIBC | Bloomington, IN | Multifamily | $34,500,000 | 3.3% | $100,877 | 58.8% | 1.95x | 9.6% |
| AFIN Industrial and Retail Net-Leased Portfolio | Barclays Bank PLC | Various | Various | $33,400,000 | 3.2% | $73 | 53.4% | 2.81x | 12.4% |
| Residence Inn Irvine | SG | Irvine, CA | Hospitality | $33,000,000 | 3.2% | $189,655 | 60.0% | 2.65x | 14.0% |
| Total/Weighted Average | $453,840,256 | 43.4% | 57.4% | 2.03x | 11.0% | ||||
| (1) | With respect to any mortgage loan that is part of a whole loan, unless otherwise indicated, all LTV Ratio, U/W NCF DSCR, Debt Yield and Balance per Unit/Room/Pad/NRA calculations in this Term Sheet include any relatedpari passu companion loans and exclude any subordinate companion loans, as applicable. Additionally, LTV Ratio, U/W NCF DSCR, Debt Yield and Balance per Unit/Room/Pad/NRA figures in this Term Sheet are calculated for mortgage loans without regard to any additional indebtedness that may be incurred at a future date. |
| (2) | With respect to the whole loan secured by the mortgaged properties identified on Annex A-1 to the Preliminary Prospectus as Park Place at Florham Park, the Cut-off Date LTV Ratio and appraised value are based on the alternate market “As-Is” appraised value of $96,000,000 as of December 4, 2017, which assumes that outstanding landlord obligations for free rent, tenant improvements, and leasing commissions are fully funded and escrowed by the lender through a title company. At origination, landlord obligations of $5,044,401 were escrowed. The Cut-off Date LTV Ratio assuming the “As-Is” appraised value of $91,200,000 for the Park Place at Florham Park Mortgaged Properties is 68.5%. |
| Existing Mezzanine Debt Summary | ||||||||
| Mortgage Loan | Mortgage Loan Cut-off Date Balance | Mezzanine Debt Cut-off Date Balance | Trust U/W NCF DSCR(1) | Total Debt U/W NCF DSCR(2) | Trust Cut-off Date LTV Ratio(1) | Total Debt Cut-off Date LTV Ratio(2) | Trust U/W NOI Debt Yield(1) | Total Debt U/W NOI Debt Yield(2) |
| Tryad Industrial & Business Center | $56,440,256 | $19,500,000 | 1.42x | 1.09x | 52.6% | 61.8% | 10.5% | 8.9% |
| Park Place at Florham Park | $45,000,000 | $12,500,000 | 1.80x | 1.18x | 65.1% | 78.1% | 10.6% | 8.8% |
| University Properties Portfolio | $34,500,000 | $5,000,000 | 1.95x | 1.43x | 58.8% | 67.3% | 9.6% | 8.3% |
| Yorkshire & Lexington Towers | $15,000,000 | $150,000,000 | 4.28x | 1.04x | 22.5% | 61.8% | 12.0% | 4.4% |
| (1) | With respect to any mortgage loan that is part of a whole loan, the Trust U/W NCF DSCR, Trust Cut-off Date LTV Ratio and Trust U/W NOI Debt Yield include the relatedpari passucompanion loan(s) and exclude any related subordinate companion loan(s) and the related mezzanine loan(s). |
| (2) | Total Debt U/W NCF DSCR, Total Debt Cut-off Date LTV Ratio and Total Debt U/W NOI Debt Yield calculations include any relatedpari passu companion loan(s), related subordinate companion loan(s) and/or related mezzanine loan(s). |
| Subordinate Debt Summary | |||||||||
| Mortgage Loan | Mortgage Loan Cut-off Date Balance | Pari Passu Companion Loan(s) Cut-off Date Balance | Subordinate Debt Cut-off Date Balance | Trust U/W NCF DSCR | Total Mortgage Debt U/W NCF DSCR(1) | Trust Cut-off Date LTV Ratio | Total Mortgage Debt Cut-off Date LTV Ratio(1) | Trust U/W NOI Debt Yield | Total Mortgage Debt U/W NOI Debt Yield(1) |
| Yorkshire & Lexington Towers | $15,000,000 | $185,000,000 | $200,000,000 | 4.28x | 1.68x | 22.5% | 44.9% | 12.0% | 6.0% |
| (1) | Total Mortgage Debt U/W NCF DSCR, Total Mortgage Debt Cut-off Date LTV, Total Mortgage Debt U/W NOI Debt Yield calculations include any relatedpari passu companion loan(s), relate subordinate companion loan(s) and excludes related mezzanine loan(s), if any. |
THE INFORMATION IN THIS COLLATERAL TERM SHEET IS NOT COMPLETE AND MAY BE AMENDED PRIOR TO THE TIME OF SALE. THIS TERM SHEET IS NOT AN OFFER TO SELL THESE SECURITIES AND IT IS NOT A SOLICITATION OF AN OFFER TO BUY THESE SECURITIES IN ANY JURISDICTION WHERE THE OFFER OR SALE IS NOT PERMITTED.
11
UBS 2018-C8
| OVERVIEW OF MORTGAGE POOL CHARACTERISTICS |
| Pari Passu Companion Loan Summary | ||||||
| Mortgage Loan | Note(s) | Original Balance | Holder of Note(1) | Lead Servicer for Whole Loan (Y/N) | Master Servicer Under Lead Securitization | Special Servicer Under Lead Securitization |
| AFIN Portfolio | A-1, A-5, A-10, A-15 | $60,000,000 | UBS 2018-C8(2) | No | Wells Fargo Bank, National Association(2) | KeyBank Real Estate Capital(2) |
| A-3, A-4, A-9, A-14 | $60,000,000 | UBS 2017-C7 | No | |||
| A-2, A-6, A-7, A-8 (controlling) | $45,000,000 | Société Générale | Yes | |||
| A-11, A-12, A-13, A-16 | $25,000,000 | UBS AG | No | |||
| Tryad Industrial & Business Center | A-1-2 (controlling), A-1-3, A-1-4, A-2-2, A-2-3, A-2-4 | $56,500,000 | UBS 2018-C8 | Yes | Midland Loan Services | Midland Loan Services |
| A-1-1, A-2-1 | $54,000,000 | UBS 2017-C7 | No | |||
| CrossPoint | A-2, A-3, A-9 | $50,000,000 | UBS 2018-C8(3) | No | Midland Loan Services(3) | Midland Loan Services(3) |
| A-1 (controlling), A-4, A-7, A-8, A-10 | $75,000,000 | CCRE | Yes | |||
| A-5, A-6 | $25,000,000 | Starwood Mortgage Capital LLC | No | |||
| Houston Distribution Center | A-1 (controlling), A-2 | $49,000,000 | UBS 2018-C8 | Yes | Midland Loan Services | Midland Loan Services |
| A-3 | $35,000,000 | Barclays Bank, PLC | No | |||
| Park Place at Florham Park | A-1 (controlling), A-2, A-5 | $45,000,000 | UBS 2018-C8 | Yes | Midland Loan Services | Midland Loan Services |
| A-3, A-4 | $17,500,000 | UBS AG | No | |||
| City Square and Clay Street | A-2, A-4 | $45,000,000 | UBS 2018-C8(4) | No | Midland Loan Services(4) | Midland Loan Services(4) |
| A-1 (controlling) | $30,000,000 | LCF or an affiliate | Yes | |||
| A-3 | $15,000,000 | LCF or an affiliate | No | |||
| BlueLinx Portfolio | A-3, A-4 | $28,600,000 | UBS 2018-C8 | No | (5) | (5) |
| A-1 (controlling), A-2 | $42,900,000 | (5) | Yes | |||
| Yorkshire & Lexington Towers | A-7, A-8-2 | $15,000,000 | UBS 2018-C8 | No | KeyBank Real Estate Capital | CWCapital Asset Management LLC |
| A-1 (controlling)(6), A-2 | $60,000,000 | CSAIL 2017-CX10 | Yes | |||
| A-4 | $40,000,000 | UBS 2017-C5 | No | |||
| A-5 | $40,000,000 | UBS 2017-C6 | No | |||
| A-6, A-8-1 | $25,000,000 | CCUBS 2017-C1 | No | |||
| A-3 | $20,000,000 | Natixis | No | |||
| (1) | Identifies the expected holder as of the Closing Date. |
| (2) | The AFIN Portfolio Whole Loan is currently serviced under the UBS 2017-C7 pooling and servicing agreement until the securitization of the related controllingpari passu Note A-8 (the date thereof, the “AFIN Portfolio Servicing Shift Securitization Date”), after which the AFIN Portfolio Whole Loan will be serviced under the pooling and servicing agreement related to the securitization of the related controllingpari passu Note A-8 (the “AFIN Portfolio Servicing Shift PSA”). The master servicer and the special servicer under the AFIN Portfolio Servicing Shift PSA will be identified in a notice, report or statement to holders of the UBS 2018-C8 certificates after the securitization of the related controllingpari passu Note A-8. |
| (3) | The CrossPoint Whole Loan is expected to initially be serviced under the UBS 2018-C8 pooling and servicing agreement until the securitization of the related controllingpari passuNote A-1 (the date thereof, the “CrossPoint Servicing Shift Securitization Date”), after which the CrossPoint Whole Loan will be serviced under the pooling and servicing agreement related to the securitization of the related controllingpari passu Note A-1 (the “CrossPoint Servicing Shift PSA”). The master servicer and the special servicer under the CrossPoint Servicing Shift PSA will be identified in a notice, report or statement to holders of the UBS 2018-C8 certificates after the securitization of the related controlling pari passu Note A-1. |
| (4) | The City Square and Clay Street Whole Loan is expected to initially be serviced under the UBS 2018-C8 pooling and servicing agreement until the securitization of the related controllingpari passu Note A-1 (the date thereof, the “City Square and Clay Street Servicing Shift Securitization Date”), after which the City Square and Clay Street Whole Loan will be serviced under the pooling and servicing agreement related to the securitization of the related controllingpari passu Note A-1 (the “City Square and Clay Street Servicing Shift PSA”). The master servicer and the special servicer under the City Square and Clay Street Servicing Shift PSA will be identified in a notice, report or statement to holders of the UBS 2018-C8 certificates after the securitization of the related controlling pari passu Note A-1. |
| (5) | The BlueLinx Portfolio Whole Loan is expected to be serviced by the related master servicer and special servicer pursuant to the pooling and servicing agreement governing the public conduit securitization in which the controlling Note A-1 will be deposited. |
| (6) | The related whole loan will be serviced pursuant to the indicated pooling and servicing agreement or trust and servicing agreement, as applicable. However, so long as no “control appraisal period” (or similar term) has occurred and is continuing, the holder of the related subordinate companion loan will be the controlling noteholder and will have the right to approve certain modifications and consent to certain actions taken with respect to the related whole loan. If a control appraisal period has occurred and is continuing, the holder of the note indicated as the “controlling” note will be the controlling noteholder. |
THE INFORMATION IN THIS COLLATERAL TERM SHEET IS NOT COMPLETE AND MAY BE AMENDED PRIOR TO THE TIME OF SALE. THIS TERM SHEET IS NOT AN OFFER TO SELL THESE SECURITIES AND IT IS NOT A SOLICITATION OF AN OFFER TO BUY THESE SECURITIES IN ANY JURISDICTION WHERE THE OFFER OR SALE IS NOT PERMITTED.
12
UBS 2018-C8
| OVERVIEW OF MORTGAGE POOL CHARACTERISTICS |
| Previous Securitization History(1) | ||||||
| Mortgage Loan | Mortgage Loan Seller | City, State | Property Type | Cut-off Date Balance | % of Initial Outstanding Pool Balance | Previous Securitization(s) |
| University Properties Portfolio | CIBC | Bloomington, IN | Multifamily | $34,500,000 | 3.3% | MSC 2007-IQ16 |
| Residence Inn Irvine | SG | Irvine, CA | Hospitality | $33,000,000 | 3.2% | BACM 2008-1 |
| City Square & Clay Street | LCF | Oakland, CA | Mixed Use | $45,000,000 | 4.3% | COMM 2014-CCRE14 |
| BlueLinx Portfolio | SG | Various | Industrial | $28,600,000 | 2.7% | WBCMT 2006-C27 |
| South Bend Medical Office | CCRE | South Bend, IN | Office | $15,200,000 | 1.5% | MSC 2006-HQ10 |
| Storage Direct Roseville | RMF | Roseville, CA | Self Storage | $8,350,000 | 0.8% | BACM 2006-3 |
| WoodSpring Suites Baton Rouge Portfolio | CIBC | Baton Rouge, LA | Hospitality | $7,500,000 | 0.7% | CGCMT 2013-GC11 |
| Brooklyn Multifamily Portfolio | LCF | Brooklyn, NY | Various | $7,000,000 | 0.7% | COMM 2014-UBS4 |
| San Pedro Crossing(2) | SG; UBS AG | San Antonio, TX | Retail | $4,477,143 | 0.4% | COMM 2013-LC6 |
| Walgreens - Harlingen, TX | CIBC | Harlingen, TX | Retail | $3,250,000 | 0.3% | LBUBS 2008-C1 |
| Walgreens - Dallas, GA | CIBC | Dallas, GA | Retail | $2,800,000 | 0.3% | LBUBS 2008-C1 |
| Walgreens - Guthrie, OK | CIBC | Guthrie, OK | Retail | $2,742,750 | 0.3% | LBUBS 2008-C1 |
| (1) | Includes mortgage loans for which all or a portion of the previously existing debt was most recently securitized in one or more conduit securitizations, based on information provided by the related borrower or obtained through searches of a third-party database. The information has not otherwise been confirmed by the mortgage loan sellers. |
| (2) | Part of the collateral for the AFIN Portfolio Mortgage Loan |
THE INFORMATION IN THIS COLLATERAL TERM SHEET IS NOT COMPLETE AND MAY BE AMENDED PRIOR TO THE TIME OF SALE. THIS TERM SHEET IS NOT AN OFFER TO SELL THESE SECURITIES AND IT IS NOT A SOLICITATION OF AN OFFER TO BUY THESE SECURITIES IN ANY JURISDICTION WHERE THE OFFER OR SALE IS NOT PERMITTED.
13
| Various | Collateral Asset Summary – Loan No. 1 AFIN Portfolio | Cut-off Date Balance: Cut-off Date LTV Ratio: UW NCF DSCR: UW NOI Debt Yield: | 11.1% |
THE INFORMATION IN THIS COLLATERAL TERM SHEET IS NOT COMPLETE AND MAY BE AMENDED PRIOR TO THE TIME OF SALE. THIS TERM SHEET IS NOT AN OFFER TO SELL THESE SECURITIES AND IT IS NOT A SOLICITATION OF AN OFFER TO BUY THESE SECURITIES IN ANY JURISDICTION WHERE THE OFFER OR SALE IS NOT PERMITTED.
14
| Various | Collateral Asset Summary – Loan No. 1 AFIN Portfolio | Cut-off Date Balance: Cut-off Date LTV Ratio: UW NCF DSCR: UW NOI Debt Yield: | 11.1% |
THE INFORMATION IN THIS COLLATERAL TERM SHEET IS NOT COMPLETE AND MAY BE AMENDED PRIOR TO THE TIME OF SALE. THIS TERM SHEET IS NOT AN OFFER TO SELL THESE SECURITIES AND IT IS NOT A SOLICITATION OF AN OFFER TO BUY THESE SECURITIES IN ANY JURISDICTION WHERE THE OFFER OR SALE IS NOT PERMITTED.
15
| Various | Collateral Asset Summary – Loan No. 1 AFIN Portfolio | Cut-off Date Balance: Cut-off Date LTV Ratio: UW NCF DSCR: UW NOI Debt Yield: | 11.1% |
| Mortgage Loan Information | Property Information | ||||||
| Mortgage Loan Seller(1): | Société Générale; UBS AG | Single Asset/Portfolio: | Portfolio | ||||
| Original Balance(2): | $60,000,000 | Location: | Various | ||||
| Cut-off Date Balance(2): | $60,000,000 | General Property Type: | Retail | ||||
| % of Initial Pool Balance: | 5.7% | Detailed Property Type: | Anchored | ||||
| Loan Purpose(3): | Recapitalization | Title Vesting: | Fee | ||||
| Borrower Sponsor: | American Finance Operating Partnership, L.P. | Year Built/Renovated: | Various | ||||
| Size: | 2,418,910 SF | ||||||
| Mortgage Rate: | 4.1910% | Cut-off Date Balance per SF(2): | $87 | ||||
| Note Date: | 12/8/2017 | Maturity Date Balance per SF(2): | $87 | ||||
| First Payment Date: | 2/1/2018 | Property Manager: | American Finance Properties, LLC | ||||
| Maturity Date: | 1/1/2028 | ||||||
| Original Term to Maturity: | 120 months | ||||||
| Original Amortization Term: | 0 months | ||||||
| IO Period: | 120 months | ||||||
| Seasoning: | 1 month | ||||||
| Prepayment Provisions(4): | LO (11); YM1 (107); O (2) | Underwriting and Financial Information | |||||
| Lockbox/Cash Mgmt Status: | Hard/Springing | UW NOI: | $23,341,476 | ||||
| Additional Debt Type(2): | Pari Passu | UW NOI Debt Yield(2): | 11.1% | ||||
| Additional Debt Balance(2): | $150,000,000 | UW NOI Debt Yield at Maturity(2): | 11.1% | ||||
| Future Debt Permitted (Type): | No (N/A) | UW NCF DSCR(2): | 2.34x | ||||
| Reserves(5) | Most Recent NOI: | $26,006,908 (9/30/2017 TTM) | |||||
| Type | Initial | Monthly | Cap | 2nd Most Recent NOI: | $27,004,951 (12/31/2016) | ||
| RE Tax: | $832,502 | $355,956 | N/A | 3rd Most Recent NOI: | N/A | ||
| Insurance: | $203,509 | $43,761 | N/A | Most Recent Occupancy: | 90.3% (11/28/2017) | ||
| Replacements: | $0 | Springing | N/A | 2nd Most Recent Occupancy: | 97.6% (12/31/2016) | ||
| Deferred Maintenance: | $101,926 | $0 | N/A | 3rd Most Recent Occupancy: | N/A | ||
| TI/LC: | $798,196 | Springing | N/A | Appraised Value (as of): | $371,735,000 (Various) | ||
| Environmental: | $9,827 | $0 | N/A | Cut-off Date LTV Ratio(2): | 56.5% | ||
| Free Rent: | $154,430 | $0 | N/A | Maturity Date LTV Ratio(2): | 56.5% | ||
| Sources and Uses | ||||||
| Sources | Proceeds | % of Total | Uses | Proceeds | % of Total | |
| Loan Amount(2): | $210,000,000 | 100.0% | Loan Payoff(3): | $17,985,000 | 8.6% | |
| Reserves: | $2,100,391 | 1.0% | ||||
| Closing Costs: | $4,431,142 | 2.1% | ||||
| Return of Equity: | $185,483,468 | 88.3% | ||||
| Total Sources: | $210,000,000 | 100.0% | Total Uses: | $210,000,000 | 100.0% | |
| (1) | The AFIN Portfolio Whole Loan was co-originated by Société Générale and UBS AG, by and through its branch office at 1285 Avenue of the Americas, New York, New York (“UBS AG”). |
| (2) | The AFIN Portfolio Mortgage Loan (as defined below) is part of the AFIN Portfolio Whole Loan, which is comprised of sixteenpari passusenior promissory notes with an aggregate principal balance of $210,000,000. The Cut-off Date Balance per SF, Maturity Date Balance per SF, UW NOI Debt Yield, UW NOI Debt Yield at Maturity, UW NCF DSCR, Cut-off Date LTV Ratio and Maturity Date LTV Ratio numbers presented above are based on the aggregate principal balance of the AFIN Portfolio Whole Loan. |
| (3) | Loan proceeds were used to refinance existing debt of approximately $18.0 million encumbering the San Pedro Crossing Property and recapitalize the borrower sponsor’s recent acquisition of the remaining 11 AFIN Portfolio Properties. |
| (4) | Prior to the open prepayment date occurring in December 2027, the AFIN Portfolio Whole Loan can be prepaid with yield maintenance. Partial release is permitted. See “Release of Property” below for further discussion of release requirements. |
| (5) | See “Escrows and Reserves” below for further discussion of reserve requirements. |
The Mortgage Loan. The largest mortgage loan (the “AFIN Portfolio Mortgage Loan”) is part of a whole loan (the “AFIN Portfolio Whole Loan”) evidenced by sixteenpari passu promissory notes with an aggregate original principal balance of $210,000,000. The AFIN Portfolio Whole Loan is secured by a first priority fee mortgage encumbering a 2,418,910 SF, 12-property portfolio of anchored retail properties located in North Carolina (three properties), Florida (two properties), Nevada (two properties), Kentucky (one property), Ohio (one property), Oklahoma (one property), Texas (one property) and South Carolina (one property) (collectively, the “AFIN Portfolio Properties”). The AFIN Portfolio Whole Loan was co-originated by Société Générale and UBS AG. Promissory Notes A-1, A-5, A-10 and A-15, with an aggregate original principal balance of $60,000,000, collectively represent the AFIN Portfolio Mortgage Loan and will be included in the UBS 2018-C8 Trust. The below table summarizes the remaining promissory notes, which were either previously securitized or are currently held by Société Générale and UBS AG and are expected to be contributed to one or more future securitization transactions or may be otherwise transferred at any time.
THE INFORMATION IN THIS COLLATERAL TERM SHEET IS NOT COMPLETE AND MAY BE AMENDED PRIOR TO THE TIME OF SALE. THIS TERM SHEET IS NOT AN OFFER TO SELL THESE SECURITIES AND IT IS NOT A SOLICITATION OF AN OFFER TO BUY THESE SECURITIES IN ANY JURISDICTION WHERE THE OFFER OR SALE IS NOT PERMITTED.
16
| Various | Collateral Asset Summary – Loan No. 1 AFIN Portfolio | Cut-off Date Balance: Cut-off Date LTV Ratio: UW NCF DSCR: UW NOI Debt Yield: | 11.1% |
| AFIN Portfolio Whole Loan Summary | ||||
| Note | Original Balance | Cut-off Date Balance | Anticipated Note Holder | Controlling Piece |
| Note A-1 | $25,000,000 | $25,000,000 | UBS 2018-C8 | No |
| Note A-2 | $25,000,000 | $25,000,000 | Société Générale | No |
| Note A-3 | $20,000,000 | $20,000,000 | UBS 2017-C7 | No |
| Note A-4 | $12,000,000 | $12,000,000 | UBS 2017-C7 | No |
| Note A-5 | $10,000,000 | $10,000,000 | UBS 2018-C8 | No |
| Note A-6 | $10,000,000 | $10,000,000 | Société Générale | No |
| Note A-7 | $5,000,000 | $5,000,000 | Société Générale | No |
| Note A-8 | $5,000,000 | $5,000,000 | Société Générale | Yes |
| Note A-9 | $20,000,000 | $20,000,000 | UBS 2017-C7 | No |
| Note A-10 | $20,000,000 | $20,000,000 | UBS 2018-C8 | No |
| Note A-11 | $15,000,000 | $15,000,000 | UBS AG | No |
| Note A-12 | $15,000,000 | $15,000,000 | UBS AG | No |
| Note A-13 | $10,000,000 | $10,000,000 | UBS AG | No |
| Note A-14 | $8,000,000 | $8,000,000 | UBS 2017-C7 | No |
| Note A-15 | $5,000,000 | $5,000,000 | UBS 2018-C8 | No |
| Note A-16 | $5,000,000 | $5,000,000 | UBS AG | No |
| Total | $210,000,000 | $210,000,000 | ||
The proceeds of the AFIN Portfolio Whole Loan were used to refinance existing debt of approximately $18.0 million encumbering the San Pedro Crossing Property, recapitalize the borrower sponsor’s investment in the remaining 11 AFIN Portfolio Properties, fund reserves, and pay closing costs.
The Borrowers and the Borrower Sponsor. The borrowers are ARC CPOKCOK001, LLC; ARC SMWMBFL001, LLC; ARC CPFAYNC001, LLC; ARC SPSANTX001, LLC; ARC JCLOUKY001, LLC; ARC NPHUBOH001, LLC; ARC ASANDSC001, LLC; ARC NLLKLFL001, LLC; ARC RBASHNC001, LLC; ARC MCLVSNV001, LLC; ARC BBLVSNV001, LLC; and ARC RGCHRNC001, LLC (collectively, the “AFIN Portfolio Borrowers”), all single-purpose Delaware limited liability companies structured to be bankruptcy remote with two independent directors. The AFIN Portfolio Borrowers are 100.0% owned by the borrower sponsor and nonrecourse carve-out guarantor, American Finance Operating Partnership, L.P. (the “Guarantor”).
American Finance Trust, Inc. (“AFIN”) is a public non-traded real estate investment trust that acquires and manages a diversified portfolio of commercial properties, which are net leased primarily to investment grade and national tenants, as well as a portfolio of stabilized core retail properties consisting primarily of power centers and lifestyle centers. As of the second quarter 2017, the borrower sponsor had a portfolio of 516 properties totaling approximately 19.2 million square feet. AFIN is externally managed by AR Global Investments, LLC, which has raised and invested over $30.0 billion in capital, served over 150,000 shareholders, and grown to one of the largest external managers of direct investment programs in the United States. See “Description of the Mortgage Pool—Litigation and Other Considerations” in the Preliminary Prospectus.
The Properties.The following table describes each property comprising the AFIN Portfolio Properties by descending Allocated Whole Loan Cut-off Date Balance.
| Portfolio Summary | |||||||||
| Property Name | Location | Year Built/ Renovated | Net Rentable Area (SF)(1) | UW NCF | % of UW NCF | Allocated Whole Loan Cut-off Date Balance(2) | % of Whole Loan Cut-off Date Balance | Appraised Value | Allocated Cut-off Date LTV Ratio(2) |
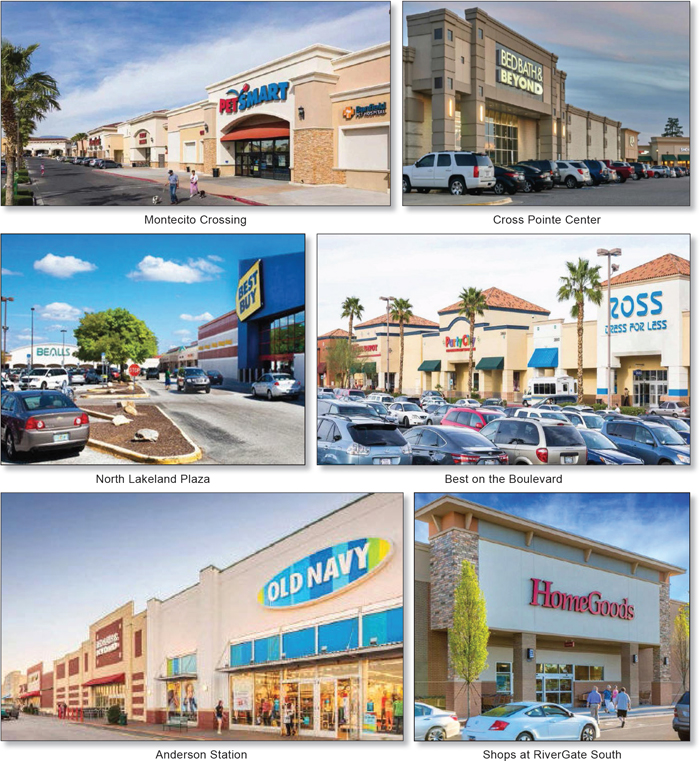
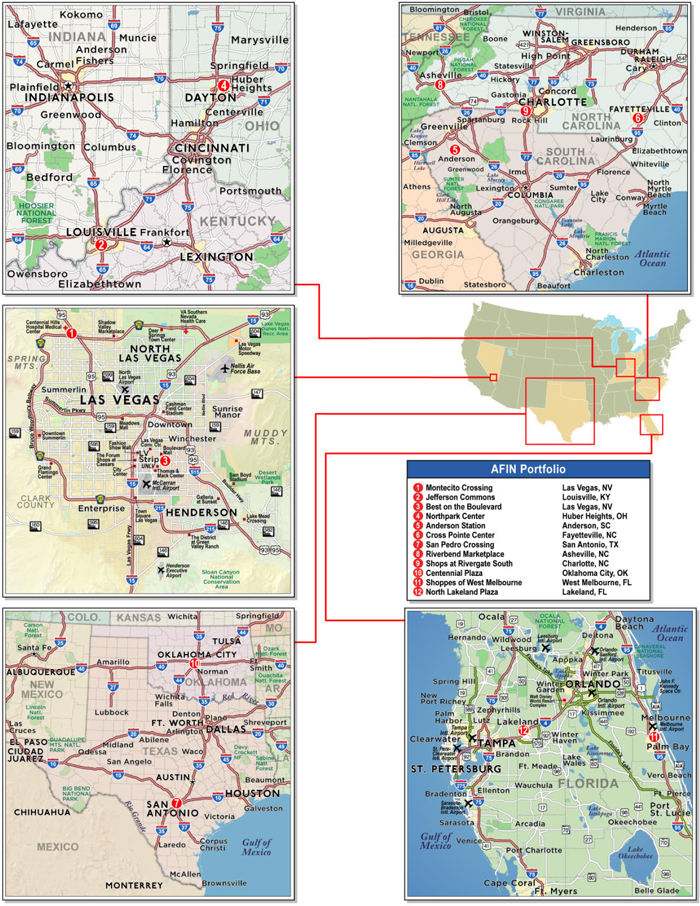
| Montecito Crossing | Las Vegas, NV | 2005/N/A | 179,721 | $3,101,756 | 14.9% | $33,040,000 | 15.7% | $52,450,000 | 63.0% |
| Jefferson Commons | Louisville, KY | 2014/N/A | 205,918 | $2,424,762 | 11.6% | $24,440,000 | 11.6% | $38,800,000 | 63.0% |
| Best on the Boulevard | Las Vegas, NV | 1996/2000 | 204,568 | $2,260,490 | 10.8% | $24,350,000 | 11.6% | $38,650,000 | 63.0% |
| Northpark Center | Huber Heights, OH | 1994/2017 | 318,330 | $2,394,795 | 11.5% | $20,350,000 | 9.7% | $36,330,000 | 56.0% |
| Anderson Station | Anderson, SC | 2001/N/A | 244,171 | $1,864,006 | 8.9% | $15,860,000 | 7.6% | $28,000,000 | 56.6% |
| Cross Pointe Center | Fayetteville, NC | 1986/2003 | 226,089 | $1,686,633 | 8.1% | $15,730,000 | 7.5% | $27,675,000 | 56.8% |
| San Pedro Crossing | San Antonio, TX | 1995-1999/N/A | 207,121 | $1,398,161 | 6.7% | $15,670,000 | 7.5% | $39,800,000 | 39.4% |
| Riverbend Marketplace | Asheville, NC | 2004/N/A | 142,617 | $1,237,445 | 5.9% | $14,120,000 | 6.7% | $22,580,000 | 62.5% |
| Shops at RiverGate South | Charlotte, NC | 2014/N/A | 140,697 | $1,081,973 | 5.2% | $14,090,000 | 6.7% | $25,000,000 | 56.4% |
| Centennial Plaza | Oklahoma City, OK | 1992-1994/N/A | 233,797 | $1,209,463 | 5.8% | $13,360,000 | 6.4% | $25,600,000 | 52.2% |
| Shoppes of West Melbourne | West Melbourne, FL | 1984/N/A | 144,484 | $1,529,708 | 7.3% | $12,480,000 | 5.9% | $21,900,000 | 57.0% |
| North Lakeland Plaza | Lakeland, FL | 1986/N/A | 171,397 | $649,325 | 3.1% | $6,510,000 | 3.1% | $14,950,000 | 43.5% |
| Total/Wtd. Avg. | 2,418,910 | $20,838,518 | 100.0% | $210,000,000 | 100.0% | $371,735,000 | 56.5% | ||
| (1) | Information is based on the underwritten rent roll. |
| (2) | Based on the AFIN Portfolio Whole Loan allocated loan amounts. |
THE INFORMATION IN THIS COLLATERAL TERM SHEET IS NOT COMPLETE AND MAY BE AMENDED PRIOR TO THE TIME OF SALE. THIS TERM SHEET IS NOT AN OFFER TO SELL THESE SECURITIES AND IT IS NOT A SOLICITATION OF AN OFFER TO BUY THESE SECURITIES IN ANY JURISDICTION WHERE THE OFFER OR SALE IS NOT PERMITTED.
17
| Various | Collateral Asset Summary – Loan No. 1 AFIN Portfolio | Cut-off Date Balance: Cut-off Date LTV Ratio: UW NCF DSCR: UW NOI Debt Yield: | 11.1% |
The AFIN Portfolio Properties benefit from nine distinct retailers (23.8% of underwritten base rent), representing investment grade tenants, including Kohl’s (rated BBB/Baa2/BBB- by Fitch/Moody’s/S&P), Best Buy (rated BBB-/Baa1/BBB- by Fitch/Moody’s/S&P), The Home Depot (rated A/A2/A by Fitch/Moody’s/S&P), Bed Bath & Beyond (rated NR/Baa1/BBB by Fitch/Moody’s/S&P), Ross Dress For Less (rated NR/A3/A- by Fitch/Moody’s/S&P), The TJX Companies, Inc. (parent company of TJ Maxx and Marshalls, rated NR/A2/A+ by Fitch/Moody’s/S&P), and Gap, Inc. (parent company of Old Navy, rated BB+/Baa2/BB+ by Fitch/Moody’s/S&P), among others.
The AFIN Portfolio Properties have a weighted average tenant tenure of 14.4 years and a weighted average remaining lease term of 5.7 years. Additionally, 59.1% of tenants by NRA have been in occupancy for more than 11 years.
The following table presents certain information relating the tenants at the AFIN Portfolio Properties:
| Tenant Summary(1) | ||||||||
| Tenant Name | Portfolio Locations | Credit Rating (Fitch/Moody’s/S&P)(2) | Tenant SF | Approximate % of SF | Annual UW Base Rent(3) | % of Total Annual UW Base Rent | Annual UW Base Rent PSF(3) | Lease Expiration |
| Kohl’s | 2 | BBB/Baa2/BBB- | 169,139 | 7.0% | $1,353,380 | 5.0% | $8.00 | Various |
| Best Buy | 3 | BBB-/Baa1/BBB- | 155,347 | 6.4% | $1,529,407 | 5.6% | $9.85 | Various |
| Home Depot | 1 | A/A2/A | 102,962 | 4.3% | $854,585 | 3.1% | $8.30 | 1/31/2019 |
| Elder Beerman | 1 | NR/NR/NR | 101,840 | 4.2% | $407,360 | 1.5% | $4.00 | 10/31/2019 |
| Bealls | 1 | NR/NR/NR | 84,146 | 3.5% | $483,839 | 1.8% | $5.75 | 4/30/2020 |
| Bed Bath & Beyond | 3 | NR/Baa1/BBB | 77,986 | 3.2% | $770,152 | 2.8% | $9.88 | Various |
| Academy Sports + Outdoors | 1 | NR/B3/NR | 71,914 | 3.0% | $701,162 | 2.6% | $9.75 | 2/28/2030 |
| PetSmart | 3 | NR/B1/B | 66,351 | 2.7% | $899,498 | 3.3% | $13.56 | Various |
| Ross Dress For Less | 2 | NR/A3/A- | 62,034 | 2.6% | $707,021 | 2.6% | $11.40 | Various |
| Toys R Us(4) | 1 | NR/NR/NR | 60,687 | 2.5% | $0 | 0.0% | $0.00 | 1/31/2021 |
| Office Depot | 3 | NR/B1/B | 57,262 | 2.4% | $589,295 | 2.2% | $10.29 | Various |
| Shoe Carnival | 4 | NR/NR/NR | 56,287 | 2.3% | $730,967 | 2.7% | $12.99 | Various |
| Hobby Lobby | 1 | NR/NR/NR | 55,000 | 2.3% | $426,240 | 1.6% | $7.75 | 8/31/2019 |
| Jo-Ann Fabric | 2 | NR/B1/B | 54,859 | 2.3% | $566,586 | 2.1% | $10.33 | Various |
| Party City | 3 | NR/NR/NR | 52,427 | 2.2% | $616,513 | 2.3% | $11.76 | Various |
| HomeGoods | 2 | NR/A2/A+ | 49,000 | 2.0% | $370,894 | 1.4% | $7.57 | Various |
| Seafood City Supermarket | 1 | NR/NR/NR | 42,618 | 1.8% | $500,369 | 1.8% | $11.74 | 2/28/2022 |
| Barnes & Noble | 1 | NR/NR/NR | 35,475 | 1.5% | $645,000 | 2.4% | $18.18 | 2/28/2021 |
| Michaels | 2 | NR/NR/NR | 34,502 | 1.4% | $412,785 | 1.5% | $11.96 | Various |
| ULTA Beauty | 3 | NR/NR/NR | 30,415 | 1.3% | $595,426 | 2.2% | $19.58 | Various |
| Pier 1 Imports | 3 | NR/NR/B | 30,300 | 1.3% | $533,550 | 2.0% | $17.61 | Various |
| TJ Maxx | 1 | NR/A2/A+ | 30,000 | 1.2% | $330,000 | 1.2% | $11.00 | 10/31/2026 |
| Marshalls | 1 | NR/A2/A+ | 29,500 | 1.2% | $309,750 | 1.1% | $10.50 | 5/31/2026 |
| Aldi | 1 | NR/NR/NR | 24,067 | 1.0% | $264,737 | 1.0% | $11.00 | 5/31/2028 |
| The Container Store | 1 | NR/NR/NR | 22,817 | 0.9% | $607,389 | 2.2% | $26.62 | 1/31/2023 |
| Liquor Barn | 1 | NR/NR/NR | 22,000 | 0.9% | $302,500 | 1.1% | $13.75 | 5/31/2025 |
| Dollar Tree | 2 | NR/Ba1/BB+ | 21,563 | 0.9% | $192,530 | 0.7% | $8.93 | Various |
| Old Navy | 1 | BB+/Baa2/BB+ | 20,000 | 0.8% | $260,000 | 1.0% | $13.00 | 1/31/2022 |
| Five Below | 2 | NR/NR/NR | 15,815 | 0.7% | $243,364 | 0.9% | $15.39 | Various |
| Guitar Center | 1 | NR/NR/NR | 15,200 | 0.6% | $149,720 | 0.6% | $9.85 | 10/31/2025 |
| Kirkland’s | 2 | NR/NR/NR | 13,661 | 0.6% | $227,784 | 0.8% | $16.67 | Various |
| Cavender’s Boot City | 1 | NR/NR/NR | 13,548 | 0.6% | $270,960 | 1.0% | $20.00 | 6/30/2022 |
| Big 5 Sports | 1 | NR/NR/NR | 10,080 | 0.4% | $157,308 | 0.6% | $15.61 | 1/31/2021 |
| Tuesday Morning | 1 | NR/NR/NR | 10,000 | 0.4% | $115,000 | 0.4% | $11.50 | 7/31/2021 |
| Subtotal/Wtd. Avg. | 59 | 1,698,802 | 70.2% | $17,125,071 | 62.9% | $10.45 | ||
| Remaining Tenants | 145 | 484,411 | 20.0% | $10,096,411 | 37.1% | $20.84 | ||
| Vacant Space | 0 | 235,697 | 9.7% | $0 | 0.0% | $0.00 | ||
| Total/Wtd. Avg. | 204 | 2,418,910 | 100.0% | $27,221,482 | 100.0% | $12.83 | ||
| (1) | Information is based on the underwritten rent roll. |
| (2) | Ratings provided are for the parent company of the entity listed in the Tenant Name field whether or not the parent company guarantees the lease. |
| (3) | Annual UW Base Rent and Annual UW Base Rent PSF exclude vacant space and Toys R Us, which was underwritten as vacant. |
| (4) | Toys R Us was underwritten as vacant; however, it is currently in occupancy and paying annual base rent of $910,305. |
THE INFORMATION IN THIS COLLATERAL TERM SHEET IS NOT COMPLETE AND MAY BE AMENDED PRIOR TO THE TIME OF SALE. THIS TERM SHEET IS NOT AN OFFER TO SELL THESE SECURITIES AND IT IS NOT A SOLICITATION OF AN OFFER TO BUY THESE SECURITIES IN ANY JURISDICTION WHERE THE OFFER OR SALE IS NOT PERMITTED.
18
| Various | Collateral Asset Summary – Loan No. 1 AFIN Portfolio | Cut-off Date Balance: Cut-off Date LTV Ratio: UW NCF DSCR: UW NOI Debt Yield: | 11.1% |
The following table presents certain information relating to the lease rollover schedule at the AFIN Portfolio Properties:
| Lease Rollover Schedule(1)(2) | ||||||||
| Year | # of Leases Rolling | SF Rolling | Approx. % of Total SF Rolling | Approx. Cumulative % of SF Rolling | UW Base Rent PSF Rolling(3) | Total UW Base Rent Rolling | Approx. % of Total Rent Rolling | Approx. Cumulative % of Total Rent Rolling |
| MTM | 3 | 1,200 | 0.0% | 0.0% | $13.00 | $15,600 | 0.1% | 0.1% |
| 2017 | 1 | 6,450 | 0.3% | 0.3% | $17.05 | $110,000 | 0.4% | 0.5% |
| 2018 | 12 | 30,119 | 1.2% | 1.6% | $23.72 | $714,319 | 2.6% | 3.1% |
| 2019 | 37 | 385,633 | 15.9% | 17.5% | $10.43 | $4,021,681 | 14.8% | 17.9% |
| 2020 | 40 | 305,740 | 12.6% | 30.1% | $11.70 | $3,575,705 | 13.1% | 31.0% |
| 2021 | 24 | 304,056 | 12.6% | 42.7% | $16.52 | $4,020,214 | 14.8% | 45.8% |
| 2022 | 20 | 209,122 | 8.6% | 51.4% | $13.25 | $2,770,175 | 10.2% | 55.9% |
| 2023 | 15 | 147,255 | 6.1% | 57.4% | $15.59 | $2,295,977 | 8.4% | 64.4% |
| 2024 | 10 | 107,970 | 4.5% | 61.9% | $13.97 | $1,508,345 | 5.5% | 69.9% |
| 2025 | 22 | 375,206 | 15.5% | 77.4% | $13.66 | $5,126,583 | 18.8% | 88.7% |
| 2026 | 5 | 80,723 | 3.3% | 80.8% | $13.24 | $1,068,564 | 3.9% | 92.7% |
| 2027 | 3 | 13,563 | 0.6% | 81.3% | $28.03 | $380,233 | 1.4% | 94.1% |
| 2028 & Beyond | 12 | 216,176 | 8.9% | 90.3% | $7.47 | $1,614,086 | 5.9% | 100.0% |
| Vacant | 0 | 235,697 | 9.7% | 100.0% | $0.00 | $0 | 0.0% | 100.0% |
| Total/Wtd. Avg. | 204 | 2,418,910 | 100.0% | $12.83 | $27,221,482 | 100.0% | ||
| (1) | Information is based on the underwritten rent roll. |
| (2) | Certain tenants may have lease termination options that are exercisable prior to the originally stated expiration date of the subject lease and that are not considered in the lease rollover schedule. |
| (3) | Wtd. Avg. UW Base Rent PSF Rolling excludes vacant space. |
The Market.
The following table presents certain market information relating to the AFIN Portfolio Properties:
| Market Overview(1) | |||||||
| Property Name | Location | Market | Submarket | Estimated 2017 Population(2) | Estimated 2017 Average Household Income(2) | Rental Rate PSF | |
| Actual(3) | Submarket(4) | ||||||
| Montecito Crossing | Las Vegas, NV | Las Vegas | Northwest | 233,930 | $86,121 | $21.10 | $19.80 |
| Jefferson Commons | Louisville, KY | Louisville | South Central | 176,569 | $59,649 | $14.29 | $9.67 |
| Best on the Boulevard | Las Vegas, NV | Las Vegas | Central East | 448,909 | $50,073 | $14.33 | $15.48 |
| Northpark Center | Huber Heights, OH | Dayton | NE Central Dayton | 83,316 | $71,020 | $8.74 | $7.42 |
| Anderson Station | Anderson, SC | Greenville/Spartanburg | Anderson | 56,860 | $64,691 | $11.61 | $8.73 |
| Cross Pointe Center | Fayetteville, NC | Fayetteville | N/A(5) | 151,777 | $58,794 | $9.55 | $10.26(5) |
| San Pedro Crossing | San Antonio, TX | San Antonio | North Central | 322,165 | $78,955 | $17.34 | $18.72 |
| Riverbend Marketplace | Asheville, NC | Asheville | East Asheville | 87,541 | $66,334 | $12.13 | $13.57 |
| Shops at RiverGate South | Charlotte, NC | Charlotte | Southwest | 99,238 | $95,171 | $17.44 | $20.75 |
| Centennial Plaza | Oklahoma City, OK | Oklahoma City | Penn Square | 243,184 | $63,794 | $9.31 | $12.72 |
| Shoppes of West Melbourne | West Melbourne, FL | Orlando | Brevard County | 132,623 | $61,786 | $12.34 | $11.85 |
| North Lakeland Plaza | Lakeland, FL | Tampa/St. Pete | Polk County | 124,578 | $55,569 | $7.33 | $13.41 |
| Avg. | $12.96 | $13.53 | |||||
| (1) | Information is based on third party market research reports. |
| (2) | Information is based on a five-mile radius. |
| (3) | Information is based on the underwritten rent roll. |
| (4) | Information is based on the appraisals. |
| (5) | Submarket and Submarket Rental Rate PSF for the Cross Pointe Center property reflect the appraisal’s market rental rate PSF conclusion as there was no observable submarket. |
THE INFORMATION IN THIS COLLATERAL TERM SHEET IS NOT COMPLETE AND MAY BE AMENDED PRIOR TO THE TIME OF SALE. THIS TERM SHEET IS NOT AN OFFER TO SELL THESE SECURITIES AND IT IS NOT A SOLICITATION OF AN OFFER TO BUY THESE SECURITIES IN ANY JURISDICTION WHERE THE OFFER OR SALE IS NOT PERMITTED.
19
| Various | Collateral Asset Summary – Loan No. 1 AFIN Portfolio | Cut-off Date Balance: Cut-off Date LTV Ratio: UW NCF DSCR: UW NOI Debt Yield: | 11.1% |
Operating History and Underwritten Net Cash Flow. The following table presents certain information relating to the historical operating performance and the Underwritten Net Cash Flow at the AFIN Portfolio Properties:
| Cash Flow Analysis | ||||||
| 2014(1) | 2015(1) | 2016 | 9/30/2017 TTM | UW | UW PSF | |
| Gross Potential Rent(2) | N/A | N/A | $29,685,333 | $28,957,564 | $27,221,482 | $11.25 |
| Percentage Rent | N/A | N/A | $201,989 | $196,835 | $201,169 | $0.08 |
| Total Recoveries | N/A | N/A | $6,993,844 | $7,437,869 | $6,265,070 | $2.59 |
| Other Income(3) | N/A | N/A | $513,017 | $475,555 | $475,555 | $0.20 |
| Less Vacancy & Credit Loss | N/A | N/A | $0 | $0 | ($910,305) | ($0.38) |
| Effective Gross Income | N/A | N/A | $37,394,183 | $37,067,823 | $33,252,972 | $13.75 |
| Total Operating Expenses | N/A | N/A | $10,389,232 | $11,060,915 | $9,911,495 | $4.10 |
| Net Operating Income | N/A | N/A | $27,004,951 | $26,006,908 | $23,341,476 | $9.65 |
| Capital Expenditures | N/A | N/A | $0 | $0 | $406,890 | $0.17 |
| TI/LC | N/A | N/A | $0 | $0 | $2,096,069 | $0.87 |
| Net Cash Flow | N/A | N/A | $27,004,951 | $26,006,908 | $20,838,518 | $8.61 |
| Occupancy % | N/A | N/A | 97.6% | 91.4% | 89.2%(4) | |
| NOI DSCR(5) | N/A | N/A | 3.03x | 2.91x | 2.62x | |
| NCF DSCR(5) | N/A | N/A | 3.03x | 2.91x | 2.34x | |
| NOI Debt Yield(5) | N/A | N/A | 12.9% | 12.4% | 11.1% | |
| NCF Debt Yield(5) | N/A | N/A | 12.9% | 12.4% | 9.9% | |
| (1) | The AFIN Portfolio Properties were acquired between 2012 and 2015 and as such, historical financial information for 2014 and 2015 is unavailable. |
| (2) | UW Gross Potential Rent includes underwritten rent steps of $229,592 taken through June 5, 2018. |
| (3) | Other Income is primarily from utility expenses which are fully reimbursable at several of the AFIN Portfolio Properties. |
| (4) | UW Occupancy % excludes all dark and bankrupt tenants. |
| (5) | Debt service coverage ratios and debt yields are based on the AFIN Portfolio Whole Loan. |
Escrows and Reserves. The AFIN Portfolio Whole Loan documents provide for upfront escrows in the amount of $832,502 for real estate taxes, $203,509 for insurance premiums, $101,926 for deferred maintenance, $9,827 for environmental insurance, $154,430 for free rent and $798,196 for tenant improvement and leasing commissions. In addition, the AFIN Portfolio Whole Loan documents provide for ongoing monthly escrows of $355,956 for real estate taxes and $43,761 for insurance premiums and other assessments.
The AFIN Portfolio Whole Loan documents also provide for on-going replacement reserves and tenant improvement and leasing commissions in an amount initially equal to 1/12 of the product by multiplying $0.25 by the aggregate number of rentable square feet in the AFIN Portfolio Properties initially equal to $50,394 and 1/12 of the product by multiplying $1.00 by the aggregate number of rentable square feet of space in AFIN Portfolio Properties initially equal to $201,576, respectively. Notwithstanding the foregoing, the AFIN Portfolio Borrowers are not required to make deposits into the capital reserve subaccount or rollover reserve subaccount, for so long as the occurrence and continuance of a Cash Management Period (as defined below) is not then in effect.
Lockbox and Cash Management. The AFIN Portfolio Whole Loan has a hard lockbox with springing cash management upon the occurrence and continuance of a Cash Management Period (as defined below).
A “Cash Management Period” will commence upon the lender giving notice to the clearing bank of the occurrence of any of the following: (i) the AFIN Portfolio Whole Loan maturity date, (ii) an event of default, (iii) the trailing 12-month debt service coverage ratio falling below 1.80x, or (iv) the commencement of a Lease Sweep Period (as defined below), and will end upon the lender giving notice to the clearing bank that the sweeping of funds into the deposit account may cease, which notice the lender will only be required to give if (1) the AFIN Portfolio Whole Loan and all other obligations under the AFIN Portfolio Whole Loan documents have been repaid in full or (2) the AFIN Portfolio Whole Loan maturity date has not occurred and (A) with respect to the matters described in clause (ii) above, such event of default has been cured and no other event of default has occurred and is continuing or (B) with respect to the matter described in clause (iii) above, the debt service coverage ratio is at least 1.80x for two consecutive calendar quarters, or (C) with respect to the matter described in clause (iv) above, such Lease Sweep Period has ended.
A “Lease Sweep Period” will occur upon any of the following: (i) the date that is twelve (12) months prior to the end of the term of any Major Lease (as defined below) (including any renewal terms), (ii) the date under a Major Lease by which the applicable Major Tenant (as defined below) is required to give notice of its exercise of a renewal option thereunder (and such renewal has not been so exercised), (iii) any Major Lease (or any material portion thereof) is surrendered, cancelled or terminated prior to its then current expiration date, (iv) any Major Tenant discontinues its business at its premises (i.e., “goes dark”) or gives notice that it intends to discontinue its business, (v) the occurrence and continuance (beyond any applicable notice and cure periods) of a material default under any Major Lease by the applicable Major Tenant thereunder, or (vi) the occurrence of a Major Tenant insolvency proceeding and will end upon the earlier to occur of (x) the date that funds in an amount equal to $15 per square foot of the space demised under the Major Lease (or Major Leases) that gave rise to the subject Lease Sweep Period have been accumulated in the special rollover reserve subaccount (or the AFIN Portfolio Borrowers have provided lender with a letter of credit equal to the initial rollover deposit or (y), with respect to the occurrence of a Lease Sweep Period caused by a matter described in clause (i), (ii), (iii) or (iv) above, upon the earlier to occur of (A) the date on which a Major Tenant irrevocably exercises its renewal or extension option (or otherwise enters into an extension agreement with the AFIN Portfolio Borrowers that is acceptable to the lender in its reasonable discretion) with respect to all of the space demised under its Major Lease, and in the lender’s good faith judgment, sufficient funds have been accumulated in the special rollover reserve subaccount (during the continuance of the subject Lease Sweep Period) to pay for all anticipated
THE INFORMATION IN THIS COLLATERAL TERM SHEET IS NOT COMPLETE AND MAY BE AMENDED PRIOR TO THE TIME OF SALE. THIS TERM SHEET IS NOT AN OFFER TO SELL THESE SECURITIES AND IT IS NOT A SOLICITATION OF AN OFFER TO BUY THESE SECURITIES IN ANY JURISDICTION WHERE THE OFFER OR SALE IS NOT PERMITTED.
20
| Various | Collateral Asset Summary – Loan No. 1 AFIN Portfolio | Cut-off Date Balance: Cut-off Date LTV Ratio: UW NCF DSCR: UW NOI Debt Yield: | 11.1% |
major leasing expenses for such Major Lease and any other anticipated expenses in connection with such renewal or extension, or (B) the date on which all of the space demised under the Major Lease (or portion thereof) that gave rise to the Lease Sweep Period has been fully leased pursuant to a replacement lease or replacement leases, and all major lease leasing expenses (and any other expenses in connection with the re-tenanting of such space) have been paid in full, (2) with respect to a Lease Sweep Period caused by a matter described in clause (v) above, if the subject Major Tenant default has been cured, and no other Major Tenant default has occurred for a period of three consecutive months following such cure, or (3) with respect to a Lease Sweep Period caused by a matter described in clause (vi) above, if the applicable Major Tenant insolvency proceeding has terminated and the applicable Major Lease has been affirmed, assumed or assigned in a manner satisfactory to the lender in the exercise of lender’s reasonable discretion.
A “Major Lease” means (i) any lease (or leases) to a tenant or replacement tenant that, together with its affiliates, demises space comprising 50,000 or more rentable square feet of the improvements at any AFIN Portfolio Property or (ii) any lease (or leases) to a tenant that, together with its affiliates, provides for rent, in the aggregate, equal to 30% or more of the total in-place base rent at any AFIN Portfolio Property.
A “Major Tenant” means any tenant under either a Major Lease, or under one or more leases (leased by such tenant and/or its affiliates), which when taken together either (i) demises space comprising 50,000 or more rentable square feet of the improvements at any AFIN Portfolio Property or (ii) provides for rent, in the aggregate, equals 30% or more of the total in-place base rent at any AFIN Portfolio Property.
Additional Secured Indebtedness (not including trade debts).Not permitted.
Mezzanine Loan and Preferred Equity.Not permitted.
Release of Property. Any time after the expiration of the lockout period, the AFIN Portfolio Borrowers may obtain the release of any AFIN Portfolio Properties, provided, among other things, (i) the sale of such property is pursuant to an arm’s-length agreement to a third party not affiliated with any AFIN Portfolio Borrower or the Guarantor; (ii) the AFIN Portfolio Borrowers may obtain a release of the property if the AFIN Portfolio Borrowers make a prepayment of principal equal to the Release Amount (as defined below) for the property in question, together with any yield maintenance premium applicable thereto; (iii) no event of default under the AFIN Portfolio Whole Loan documents has or will be continuing; (iv) the AFIN Portfolio Borrowers will remain special purpose bankruptcy remote entities; (v) the AFIN Portfolio Borrowers and the Guarantor execute and deliver such documents as lender may reasonably request to confirm the continued validity of the loan documents and liens; (vi) the debt service coverage ratio for all of the remaining AFIN Portfolio Properties will not be less than the greater of (a) the debt service coverage ratio immediately preceding such release and (b) 2.34x; and (vii) the loan-to-value ratio (such value to be determined, in lender’s sole discretion, by any commercially reasonable method permitted to a REMIC trust; and which will exclude the value of personal property or going concern value, if any) is greater than 125%, the AFIN Portfolio Borrowers will also make payment of principal in an amount such that the loan-to-value ratio (such value to be determined, in lender’s sole discretion, by any commercially reasonable method permitted to a REMIC trust; and which will exclude the value of personal property or going concern value, if any) is no more than 125%. See“Description of the Mortgage Pool—Releases; Partial Releases”in the Preliminary Prospectus.
A “Release Amount” is the greater of (i) 100% of the net sales proceeds with respect to such AFIN Portfolio Property and (ii) 110.0% - 120.0% of the allocated loan amount for such property as set forth in the loan agreement.
Substitution. Any time after December 31, 2018, the AFIN Portfolio Borrowers may obtain the release of any AFIN Portfolio Properties by providing one or more substitute properties (individually or collectively, the “Substitute Property”), provided that among other things, (i) no event of default has occurred and is continuing, (ii) the allocated loan amounts for all AFIN Portfolio Properties theretofore substituted do not exceed 25% of the AFIN Portfolio Whole Loan, (iii) unless otherwise agreed to by lender in its sole discretion, the total number of substitutions requested by AFIN Portfolio Borrowers (taking into account the then requested substitution) will not exceed three substitutions, (iv) no substitution will occur during the twelve month period preceding January 1, 2028, (v) the AFIN Portfolio Borrowers will deliver to lender a rating agency comfort letter as to the substitution, (vi) after giving effect to the substitution, the debt service coverage ratio for all of the AFIN Portfolio Properties will be no less than the debt service coverage ratio for all of the AFIN Portfolio Properties immediately preceding such substitution, (vii) the AFIN Portfolio Borrowers will deliver to lender an acceptable appraisal of each proposed substitute property and each proposed released AFIN Portfolio Property indicating an appraised value of the substitute property (as reflected in such acceptable appraisal) that is equal to or greater than the appraised value of the released property as of the substitution date (as reflected in such acceptable appraisal) (provided however, with respect to the AFIN Portfolio Properties known as Montecito Crossing, Best on the Boulevard and Jefferson Common, such properties may only be substituted if the value of the substitute property is equal to or greater than 110% of the appraised value of the released AFIN Portfolio Property), (viii) with respect to the Mortgaged Properties known as Montecito Crossing, Best on the Boulevard or Jefferson Common, such properties may only be substituted if the net operating income of the Substitute Property is equal to or greater than 110% of the net operating income of the released AFIN Portfolio Property and (ix) the AFIN Portfolio Borrowers will deliver to lender such other documents, instruments and agreements as lender may reasonably require relating to such substitution (including any documents as may be reasonably required by a special servicer in a securitization). See“Description of the Mortgage Pool—Releases; Partial Releases”in the Preliminary Prospectus.
Terrorism Insurance. The AFIN Portfolio Borrowers are required to obtain insurance against acts of terrorism for loss resulting from perils and acts of terrorism in amounts and with terms and conditions applicable to commercial property, general liability, business income and umbrella liability insurance required pursuant to the AFIN Portfolio Mortgage Whole Loan documents.
THE INFORMATION IN THIS COLLATERAL TERM SHEET IS NOT COMPLETE AND MAY BE AMENDED PRIOR TO THE TIME OF SALE. THIS TERM SHEET IS NOT AN OFFER TO SELL THESE SECURITIES AND IT IS NOT A SOLICITATION OF AN OFFER TO BUY THESE SECURITIES IN ANY JURISDICTION WHERE THE OFFER OR SALE IS NOT PERMITTED.
21
Rochester Technology Park Rochester, NY 14624 | Collateral Asset Summary – Loan No. 2 Tryad Industrial & Business Center | Cut-off Date Balance: Cut-off Date LTV Ratio: UW NCF DSCR: UW NOI Debt Yield: | $56,440,256 52.6% 1.42x 10.5% |
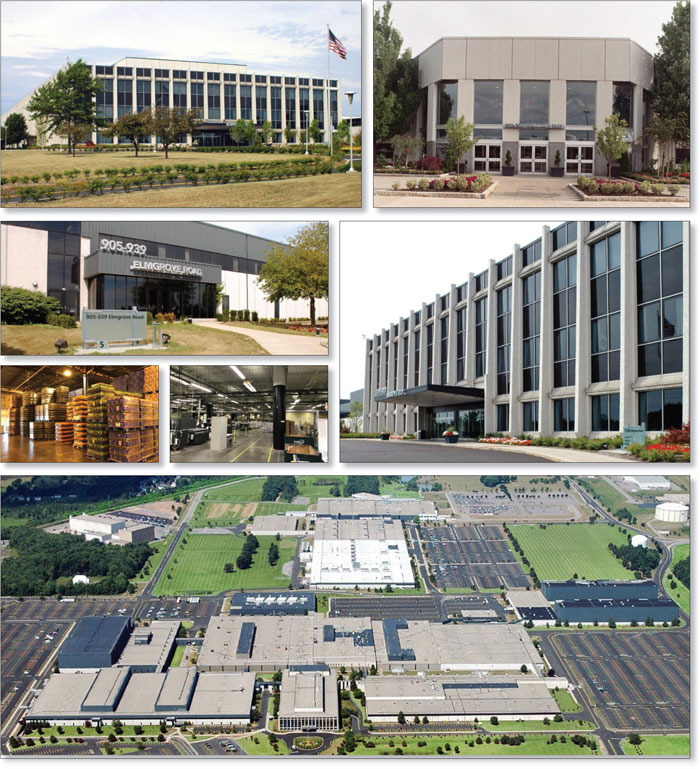
THE INFORMATION IN THIS COLLATERAL TERM SHEET IS NOT COMPLETE AND MAY BE AMENDED PRIOR TO THE TIME OF SALE. THIS TERM SHEET IS NOT AN OFFER TO SELL THESE SECURITIES AND IT IS NOT A SOLICITATION OF AN OFFER TO BUY THESE SECURITIES IN ANY JURISDICTION WHERE THE OFFER OR SALE IS NOT PERMITTED.
22
Rochester Technology Park Rochester, NY 14624 | Collateral Asset Summary – Loan No. 2 Tryad Industrial & Business Center | Cut-off Date Balance: Cut-off Date LTV Ratio: UW NCF DSCR: UW NOI Debt Yield: | $56,440,256 52.6% 1.42x 10.5% |

THE INFORMATION IN THIS COLLATERAL TERM SHEET IS NOT COMPLETE AND MAY BE AMENDED PRIOR TO THE TIME OF SALE. THIS TERM SHEET IS NOT AN OFFER TO SELL THESE SECURITIES AND IT IS NOT A SOLICITATION OF AN OFFER TO BUY THESE SECURITIES IN ANY JURISDICTION WHERE THE OFFER OR SALE IS NOT PERMITTED.
23
Rochester Technology Park Rochester, NY 14624 | Collateral Asset Summary – Loan No. 2 Tryad Industrial & Business Center | Cut-off Date Balance: Cut-off Date LTV Ratio: UW NCF DSCR: UW NOI Debt Yield: | $56,440,256 52.6% 1.42x 10.5% |
| Mortgage Loan Information | Property Information | ||||||
| Mortgage Loan Seller: | CCRE; UBS AG | Single Asset/Portfolio: | Single Asset | ||||
| Original Balance(1): | $56,500,000 | Location: | Rochester, NY 14624 | ||||
| Cut-off Date Balance(1): | $56,440,256 | General Property Type: | Industrial | ||||
| % of Initial Pool Balance: | 5.4% | Detailed Property Type: | Flex | ||||
| Loan Purpose: | Refinance | Title Vesting: | Fee | ||||
| Borrower Sponsors: | Leslie Westreich, Morty Yashar | Year Built/Renovated: | 1966-1983/2000-2004, 2017 | ||||
| Mortgage Rate: | 5.0210% | Size: | 3,353,230 SF | ||||
| Note Date: | 12/11/2017 | Cut-off Date Balance per SF(1): | $33 | ||||
| First Payment Date: | 2/6/2018 | Maturity Date Balance per SF(1): | $27 | ||||
| Maturity Date: | 1/6/2028 | Property Manager: | Tech Park Manager LLC (borrower related) | ||||
| Original Term to Maturity: | 120 months | ||||||
| Original Amortization Term: | 360 months | ||||||
| IO Period: | 0 months | ||||||
| Seasoning: | 1 month | ||||||
| Prepayment Provisions(2): | LO (25); DEF (90); O (5) | Underwriting and Financial Information | |||||
| Lockbox/Cash Mgmt Status: | Hard/In Place | UW NOI(6): | $11,618,642 | ||||
| Additional Debt Type(1)(3): | Pari Passu/Mezzanine | UW NOI Debt Yield(1): | 10.5% | ||||
| Additional Debt Balance(1)(3): | $53,942,899/$19,500,000 | UW NOI Debt Yield at Maturity(1): | 12.8% | ||||
| Future Debt Permitted (Type): | No (N/A) | UW NCF DSCR(1): | 1.42x | ||||
| Reserves(4) | Most Recent NOI(6): | $10,759,437 (9/30/2017 TTM) | |||||
| Type | Initial | Monthly | Cap | 2nd Most Recent NOI(6): | $9,528,464 (12/31/2016) | ||
| RE Tax: | $700,000 | $100,000 | N/A | 3rd Most Recent NOI(6): | $5,920,327 (12/31/2015) | ||
| Insurance: | $144,000 | $24,000 | N/A | Most Recent Occupancy(5)(6): | 68.1% (1/26/2018) | ||
| Replacements: | $0 | $51,576 | N/A | 2nd Most Recent Occupancy(6): | 66.9% (12/31/2016) | ||
| Immediate Repairs: | $45,250 | $0 | N/A | 3rd Most Recent Occupancy(6): | 61.7% (12/31/2015) | ||
| Rollover: | $3,000,000 | Springing | $3,000,000 | Appraised Value (as of): | $210,000,000 (12/1/2017) | ||
| TI/LC(5): | $9,203,324 | $0 | N/A | Cut-off Date LTV Ratio(1): | 52.6% | ||
| Free Rent Holdback(5): | $1,917,974 | $0 | N/A | Maturity Date LTV Ratio(1): | 43.3% | ||
| Sources and Uses | ||||||
| Sources | Proceeds | % of Total | Uses | Proceeds | % of Total | |
| Loan Amount(1): | $110,500,000 | 85.0% | Loan Payoff: | $58,876,247 | 45.3% | |
| Mezzanine Loan(3): | $19,500,000 | 15.0% | Partnership Payoff(7): | $31,657,140 | 24.4% | |
| Reserves: | $15,010,548 | 11.5% | ||||
| Closing Costs: | $2,390,858 | 1.8% | ||||
| Return of Equity | $22,065,207 | 17.0% | ||||
| Total Sources: | $130,000,000 | 100.0% | Total Uses: | $130,000,000 | 100.0% | |
| (1) | The Tryad Industrial & Business Center Mortgage Loan (as defined below) is part of the Tryad Industrial & Business Center Whole Loan, which is comprised of eightpari passupromissory notes with an aggregate original principal balance of $110,500,000. The Cut-off Date Balance per SF, Maturity Date Balance per SF, UW NOI Debt Yield, UW NOI Debt Yield at Maturity, UW NCF DSCR, Cut-off Date LTV Ratio and Maturity Date LTV Ratio presented above are based on the aggregate principal balance of the promissory notes comprising the Tryad Industrial & Business Center Whole Loan. The Cut-off Date Balance per SF, Maturity Date Balance per SF, UW NOI Debt Yield, UW NOI Debt Yield at Maturity, UW NCF DSCR, Cut-off Date LTV Ratio and Maturity Date LTV Ratio based on the Tryad Industrial & Business Center Whole Loan and the Tryad Industrial & Business Center Mezzanine Loan (as defined below) are $39, $33, 8.9%, 10.5%, 1.09x, 61.8%, and 52.6%, respectively. |
| (2) | Partial release of vacant parcels is permitted. See “Release of Property”below for further discussion of release requirements. |
| (3) | See “The Mortgage Loan” and “Mezzanine Loan and Preferred Equity” below for further discussion of mezzanine debt. |
| (4) | See “Escrows and Reserves” below for further discussion of reserve requirements. |
| (5) | Kodak Alaris (248,184 SF) executed a 10-year lease in July 2017. The tenant is expected to take occupancy of a portion of its space in March 2018 and its remaining space in May 2018. At loan origination, the Tryad Industrial & Business Center Borrower (as defined below) deposited (i) approximately $9,203,324 into a TI/LC reserve, of which approximately $8,729,407 is earmarked for Kodak Alaris, and (ii) approximately $1,917,974 into a free rent reserve earmarked for Kodak Alaris. |
| (6) | The borrower sponsors acquired the Tryad Industrial & Business Center Property (as defined below) in 2007 and have since leased up over 1.7 million SF of space bringing occupancy from approximately 20% at acquisition to 68.1% as of January 6, 2018. |
| (7) | Leslie Westreich, one of the non-recourse carveout guarantors, structured certain capital projects related to the Tryad Industrial & Business Center Property as loans to the partnership. The “Partnership Payoff” represents the payoff of such loans. |
The Mortgage Loan. The second largest mortgage loan (the “Tryad Industrial & Business Center Mortgage Loan”) is part of a whole loan (the “Tryad Industrial & Business Center Whole Loan”) with an aggregate original principal balance of $110,500,000. The Tryad Industrial & Business Center Whole Loan is secured by a first priority fee mortgage encumbering eleven office and industrial/flex buildings totaling 3,353,230 SF located in Rochester, New York (the “Tryad Industrial & Business Center Property”). Promissory Notes A-1-2, A-1-3, A-1-4, A-2-2, A-2-3 and A-2-4, with an aggregate original principal balance of $56,500,000, represent the Tryad Industrial & Business Center Mortgage Loan and will be included in the UBS 2018-C8 Trust. The remainingpari passunotes, with an aggregate original principal balance of $54,000,000 (collectively, the “Tryad Industrial & Business Center Pari Passu Companion Loans”), are currently held in the UBS 2017-C7 Trust. The Tryad Industrial & Business Center Whole Loan will be serviced pursuant to the pooling and servicing agreement for the UBS 2018-C8 Trust. See “Description of the Mortgage Pool—The Whole Loans—The Serviced Pari Passu Whole Loans”, and “Pooling and Servicing Agreement” in the Preliminary Prospectus.
THE INFORMATION IN THIS COLLATERAL TERM SHEET IS NOT COMPLETE AND MAY BE AMENDED PRIOR TO THE TIME OF SALE. THIS TERM SHEET IS NOT AN OFFER TO SELL THESE SECURITIES AND IT IS NOT A SOLICITATION OF AN OFFER TO BUY THESE SECURITIES IN ANY JURISDICTION WHERE THE OFFER OR SALE IS NOT PERMITTED.
24
Rochester Technology Park Rochester, NY 14624 | Collateral Asset Summary – Loan No. 2 Tryad Industrial & Business Center | Cut-off Date Balance: Cut-off Date LTV Ratio: UW NCF DSCR: UW NOI Debt Yield: | $56,440,256 52.6% 1.42x 10.5% |
| Tryad Industrial & Business Center Whole Loan Summary | ||||
| Note | Original Balance | Cut-off Date Balance | Anticipated Note Holder | Controlling Piece |
| Note A-1-1 | $27,000,000 | $26,971,450 | UBS 2017-C7 | No |
| Note A-1-2 | $13,000,000 | $12,986,254 | UBS 2018-C8 | Yes |
| Note A-1-3 | $10,000,000 | $9,989,426 | UBS 2018-C8 | No |
| Note A-1-4 | $5,250,000 | $5,244,449 | UBS 2018-C8 | No |
| Note A-2-1 | $27,000,000 | $26,971,450 | UBS 2017-C7 | No |
| Note A-2-2 | $13,000,000 | $12,986,254 | UBS 2018-C8 | No |
| Note A-2-3 | $10,000,000 | $9,989,426 | UBS 2018-C8 | No |
| Note A-2-4 | $5,250,000 | $5,244,449 | UBS 2018-C8 | No |
| Total | $110,500,000 | $110,383,156 | No | |
The proceeds of the Tryad Industrial & Business Center Whole Loan, together with a mezzanine loan with an original principal balance of $19,500,000 (the “Tryad Industrial & Business Center Mezzanine Loan”), were used to refinance the Tryad Industrial & Business Center Property, pay off a partnership loan, fund reserves, pay closing costs and return equity to the borrower sponsors.
The Borrower and the Borrower Sponsors. The borrower is Tech Park Owner LLC (the “Tryad Industrial & Business Center Borrower”), a Delaware limited liability company and single-purpose entity structured to be bankruptcy remote with two independent directors. The Tryad Industrial & Business Center Borrower provided a non-consolidation opinion at origination. The borrower sponsors and the nonrecourse carve-out guarantors, who are jointly and severally liable, are Leslie Westreich and Morty Yashar. Mr. Westreich and Mr. Yashar are principals of Tryad Group and each have more than 25 years of experience as real estate developers having owned and developed properties in more than 15 states.
Founded in 2004, the Tryad Group is a diversified real estate organization based in New York City. The Tryad Group’s portfolio includes approximately 6.0 million SF of commercial real estate throughout New York, New Jersey, Florida, Pennsylvania and Michigan. Tryad Group oversees all leasing and management functions at their properties.
The Property.The Tryad Industrial & Business Center Property is a 3.4 million SF industrial/flex office park comprised of 14 buildings located in Rochester, New York. Eleven of the buildings are occupied by a variety of office and industrial tenants including high tech manufacturing tenants, call centers and warehouse tenants. The three other buildings include a service garage, salt storage building and storage shed. The Tryad Industrial & Business Center Property also features a full-service cafeteria.
The Tryad Industrial & Business Center Property is one of the largest technology parks in the United States with office, research, distribution, industrial, and manufacturing space in 11 connected buildings. The Tryad Industrial & Business Center Property has sophisticated telecommunications and onsite security configurations with a direct digital energy management system for HVAC and lighting control throughout the complex, and has its own utility plant for chilled water, and compressed air services. The Tryad Industrial & Business Center Property is located near access to major highways and is within 6 miles of Greater Rochester International Airport.
The Tryad Industrial & Business Center Property is situated along NY-531 and has its own highway exit, offering ease of access for the 4,000+ employees that travel there on a daily basis. There are several bus stops within the campus providing access from downtown Rochester. Additionally, the Tryad Industrial & Business Center Property includes 8,429 parking spaces situated across six interconnected parking lots. Given the vast size of the parking areas, the borrower sponsors added a shuttle service throughout the park and parking lot for employees.
The Tryad Industrial & Business Center Property was originally constructed from 1966 to 1983 for Kodak as one of their primary facilities in Rochester and was renovated from 2000 to 2004 as well as 2017. Since 2007, the Tryad Industrial & Business Center Property has undergone approximately $34.3 million of capital expenditures and tenant improvements. Additionally, the borrower sponsors have invested approximately $1.25 million in capital expenditures since 2015, which include upgrading and expanding the parking lot, installing new server technology to better accommodate tenants and the building systems and new property maintenance equipment.
Since acquiring the Tryad Industrial & Business Center Property in 2007, the borrower sponsors have leased up over 1.7 million SF of space, bringing occupancy from approximately 20% at acquisition to 68.1% as of January 8, 2018. Notable new tenants include Bottling Group LLC (a subsidiary of PepsiCo) (107,236 SF), Jacobson Warehouse Co. (107,447 SF), University of Rochester (146,264 SF), Kodak Alaris (248,184 SF) and Bridgestone Tires (31,624 SF), among others.
THE INFORMATION IN THIS COLLATERAL TERM SHEET IS NOT COMPLETE AND MAY BE AMENDED PRIOR TO THE TIME OF SALE. THIS TERM SHEET IS NOT AN OFFER TO SELL THESE SECURITIES AND IT IS NOT A SOLICITATION OF AN OFFER TO BUY THESE SECURITIES IN ANY JURISDICTION WHERE THE OFFER OR SALE IS NOT PERMITTED.
25
Rochester Technology Park Rochester, NY 14624 | Collateral Asset Summary – Loan No. 2 Tryad Industrial & Business Center | Cut-off Date Balance: Cut-off Date LTV Ratio: UW NCF DSCR: UW NOI Debt Yield: | $56,440,256 52.6% 1.42x 10.5% |
| Tryad Industrial & Business Center Historical Occupancy | ||||||||||
| 2007 | 2008 | 2009 | 2010 | 2011 | 2012 | 2013 | 2014 | 2015 | 2016 | 2017 |
| 20.0% | 34.6% | 36.5% | 37.2% | 41.2% | 46.1% | 50.9% | 55.9% | 61.7% | 66.9% | 69.0% |
Major Tenants.
Maximus (195,450 SF, 5.8% of NRA, 17.9% of underwritten base rent). Founded in 1975, Maximus is a for-profit operator of government health and human services programs in the United States, United Kingdom, Canada, Australia and Saudi Arabia. The company focuses on administering government-sponsored programs, such as Medicaid, the Children’s Health Insurance Program, welfare-to-work and Medicare, among others. Maximus, Inc. is a publicly-traded company (NYSE: MMS) and is the lessee on the lease. As of December 6, 2017, MMS had a market capitalization of over $4.5 billion and as of Q3 2017, the company reported a net income of approximately $209.43 million.
Maximus utilizes its space at the Tryad Industrial & Business Center Property as a call center for New York State healthcare programs with nearly 2,000 employees. According to the borrower sponsors, upon taking its space in August 2016, Maximus received an $8.6 million tenant improvement package, which Maximus is currently paying back to the Tryad Industrial & Business Center Borrower under the terms of its lease. Maximus has a lease expiration of August 31, 2019 with an ongoing termination option if their contract with the government has been terminated, materially altered or permitted to expire, subject to a termination fee. Maximus has three, one-year renewal options.
Harris Corporation (260,108 SF, 7.8% of NRA, 13.9% of underwritten base rent). Harris Corporation (NYSE: HRS) is an American technology company, specializing in IT services, wireless equipment, tactical radios, electronics, night vision equipment and antennas of which it provides primarily to the United States Department of Defense. Harris Corporation has a market capitalization of nearly $17.0 billion as of December 6, 2017 and reported annual revenues of $5.9 billion as of June 30, 2017.
Harris Corporation acquired ITT Space Systems in 2015 for approximately $4.7 billion and subsequently took over its space at the Tryad Industrial & Business Center Property.
Harris Corporation occupies three spaces at the Tryad Industrial & Business Center Property totaling 107,283 SF (“Lease 1”), 111,322 SF and 41,503 SF with lease expirations of 8/31/2020, 12/31/2022 and 4/30/2027, respectively. Each lease has two, five-year renewal options. Harris Corporation has the right to terminate up to 50% of its space under Lease 1 after September 1, 2018 with 180 day’s prior notice. The termination option represents approximately 29% of Harris Corporation’s total space and 2.2% of NRA.
Kodak Alaris (248,184 SF, 7.4% of NRA, 12.7% of underwritten base rent). Founded in 2013, Kodak Alaris is a Rochester-based company that offers retail photo print, photographic paper and workflow products supply, still camera films and retail and souvenir photo products. In 2017, Kodak Alaris received a $2.0 million grant from New York State as an incentive to move to the Tryad Industrial & Business Center Property. The Tryad Industrial & Business Center Property serves as the headquarters for three of its four business units.
Kodak Alaris executed a ten-year lease in July 2017. The Tryad Industrial & Business Center Borrower is expected to deliver and the tenant is expected to take occupancy of approximately 148,964 SF of its space in March 2018 and the remaining approximately 99,220 SF of the space by May 2018. The lease has a rent commencement date of September 1, 2018 and an expiration date of December 31, 2028. The lease includes a termination option on or after December 31, 2025 with one-year notice and the payment of a termination fee. Kodak Alaris has two, five-year renewal options. At loan origination, the Tryad Industrial & Business Center Borrower deposited (i) approximately $9.2 million into a TI/LC reserve, of which approximately $8.7 million is earmarked for Kodak Alaris, and (ii) approximately $1.9 million into a free rent reserve earmarked for Kodak Alaris.
Other tenants include the University of Rochester, Hammer Packaging Corporation, Bottling Group LLC (PepsiCo), Mercury Print, Eastman Kodak Company, Pharmasmart and Jacobson Warehouse Co. Overall, the Tryad Industrial & Business Center Property is leased to 34 tenants.
| Tryad Industrial & Business Center Tenancy Mix | |||
| Tenant Industry | Occupied Net Rentable Area | % of Occupied Net Rentable Area | Notable Tenants |
| Label/Package Printing | 268,109 | 11.7% | Hammer Packaging Corporation |
| Medical | 263,220 | 11.5% | Ortho Clinical |
| Defense | 260,108 | 11.4% | Harris Corporation |
| Digital Photography/Imaging | 248,184 | 10.9% | Kodak Alaris |
| Software & Services | 195,450 | 8.6% | Maximus |
| Education | 189,729 | 8.3% | University of Rochester |
| Photography | 177,123 | 7.8% | Eastman Kodak Company |
| Printing - Educational Material | 169,688 | 7.4% | Mercury Print |
| Warehousing/Logistics | 164,483 | 7.2% | Jacobson Warehouse Co. |
| Other | 148,711 | 6.5% | Weldrite Closures Inc. |
| Food & Beverage | 125,236 | 5.5% | Bottling Group LLC (PepsiCo) |
| Automotive | 74,170 | 3.2% | Bridgestone |
THE INFORMATION IN THIS COLLATERAL TERM SHEET IS NOT COMPLETE AND MAY BE AMENDED PRIOR TO THE TIME OF SALE. THIS TERM SHEET IS NOT AN OFFER TO SELL THESE SECURITIES AND IT IS NOT A SOLICITATION OF AN OFFER TO BUY THESE SECURITIES IN ANY JURISDICTION WHERE THE OFFER OR SALE IS NOT PERMITTED.
26
Rochester Technology Park Rochester, NY 14624 | Collateral Asset Summary – Loan No. 2 Tryad Industrial & Business Center | Cut-off Date Balance: Cut-off Date LTV Ratio: UW NCF DSCR: UW NOI Debt Yield: | $56,440,256 52.6% 1.42x 10.5% |
The following table presents certain information relating to the largest tenants at the Tryad Industrial & Business Center Property based on UW Base Rent:
| Tenant Summary(1) | |||||||
| Tenant Name | Credit Rating (Fitch/Moody's/S&P)(2) | Tenant SF | Approximate % of SF | Annual UW Base Rent | % of Total Annual Base UW Rent | Annual UW Base Rent PSF(3) | Lease Expiration |
| Maximus(4) | NR/NR/NR | 195,450 | 5.8% | $2,562,350 | 17.9% | $13.11(4) | 8/31/2019 |
| Harris Corporation | BBB-/Baa3/BBB- | 260,108 | 7.8% | $1,990,778 | 13.9% | $7.65 | Various(5) |
| Kodak Alaris(6) | NR/NR/NR | 248,184 | 7.4% | $1,814,153 | 12.7% | $7.31 | 12/31/2028 |
| University of Rochester | AA-/Aa3/AA- | 146,264 | 4.4% | $1,333,392 | 9.3% | $9.12 | Various(7) |
| Hammer Packaging Corporation | NR/NR/NR | 268,109 | 8.0% | $938,382 | 6.6% | $3.50 | 12/31/2018 |
| Bottling Group LLC(8) | A/A1/A+ | 107,236 | 3.2% | $723,946 | 5.1% | $6.75 | 1/31/2020 |
| Mercury Print | NR/NR/NR | 169,688 | 5.1% | $626,149 | 4.4% | $3.69 | 12/31/2024 |
| Eastman Kodak Company | NR/Caa1/CCC+ | 177,123 | 5.3% | $575,650 | 4.0% | $3.25 | 11/30/2018 |
| Pharmasmart(9) | NR/NR/NR | 53,000 | 1.6% | $384,250 | 2.7% | $7.25 | 9/30/2023 |
| Jacobson Warehouse Co. | NR/NR/NR | 107,447 | 3.2% | $351,314 | 2.5% | $3.27 | 1/31/2021 |
| Subtotal/Wtd. Avg. | 1,732,609 | 51.7% | $11,300,364 | 78.9% | $6.52 | ||
| Remaining Tenants | 551,602 | 16.4% | $3,015,132 | 21.1% | $5.47 | ||
| Vacant Space | 1,069,019 | 31.9% | $0 | 0.0% | $0.00 | ||
| Total/Wtd. Avg. | 3,353,230 | 100.0% | $14,315,495 | 100.0% | $6.27 | ||
| (1) | Information is based on the underwritten rent roll. |
| (2) | Ratings provided are for the parent company of the entity listed under the heading “Tenant Name” whether or not the parent company guarantees the lease. |
| (3) | Wtd. Avg. Annual UW Base Rent PSF excludes vacant space. |
| (4) | Maximus’ current rent is $21.76 PSF, which includes amortizing tenant improvements. Annual UW Base Rent PSF of $13.11 is based on the renewal option after the tenant improvement allowance has been repaid and is in line with the appraiser’s market rent conclusion of $13.00 PSF. Maximus has the right to terminate its lease at any time if their contract with the government has been terminated, materially altered or permitted to expire, subject to a termination fee. |
| (5) | Harris Corporation has three leases at the Tryad Industrial & Business Center Property as follows: 107,283 SF, 111,322 SF and 41,503 SF with lease expirations of 8/31/2020, 12/31/2022 and 4/30/2027, respectively. With respect to the 107,283 SF lease, Harris Corporation has the right to terminate up to 50% of its space under Lease 1 after September 1, 2018 with 180 day’s prior notice. The termination option represents approximately 29% of Harris Corporation’s total space and 2.2% of NRA. |
| (6) | Kodak Alaris executed a ten-year lease in July 2017. The Tryad Industrial & Business Center Borrower is expected to deliver and the tenant is expected to take occupancy of approximately 148,964 SF in March 2018 with the remainder of the space being delivered by May 2018. The lease has a rent commencement date of September 1, 2018 and expiration date of December 31, 2028. The lease includes a termination option on or after December 31, 2025 with one-year notice and the payment of a termination fee. Kodak Alaris has two five-year renewal options. At loan origination, the Tryad Industrial & Business Center Borrower deposited (i) approximately $9.2 million into a TI/LC reserve, of which approximately $8.7 million is earmarked for Kodak Alaris, and (ii) approximately $1.9 million into a free rent reserve earmarked for Kodak Alaris. |
| (7) | University of Rochester occupies five spaces at the Tryad Industrial & Business Center Property as follows: 81,562 SF, 28,482 SF, 20,350 SF, 10,870 SF and 5,000 SF with lease expirations of 11/30/2027, 11/30/2026, 11/30/2027, 12/31/2018 and 5/31/2018, respectively. |
| (8) | Bottling Group LLC is a subsidiary of PepsiCo, Inc. |
| (9) | Pharmasmart has a one-time right to terminate its lease in December 2022 with 180 days’ prior written notice and the payment of a termination fee. |
THE INFORMATION IN THIS COLLATERAL TERM SHEET IS NOT COMPLETE AND MAY BE AMENDED PRIOR TO THE TIME OF SALE. THIS TERM SHEET IS NOT AN OFFER TO SELL THESE SECURITIES AND IT IS NOT A SOLICITATION OF AN OFFER TO BUY THESE SECURITIES IN ANY JURISDICTION WHERE THE OFFER OR SALE IS NOT PERMITTED.
27
Rochester Technology Park Rochester, NY 14624 | Collateral Asset Summary – Loan No. 2 Tryad Industrial & Business Center | Cut-off Date Balance: Cut-off Date LTV Ratio: UW NCF DSCR: UW NOI Debt Yield: | $56,440,256 52.6% 1.42x 10.5% |
The following table presents certain information relating to the lease rollover schedule at the Tryad Industrial & Business Center Property:
| Lease Rollover Schedule(1)(2) | ||||||||
| Year | # of Leases Rolling | SF Rolling | Approx. % of Total SF Rolling | Approx. Cumulative % of SF Rolling | UW Base Rent PSF Rolling(3) | Total UW Base Rent Rolling | Approx. % of Total Rent Rolling | Approx. Cumulative % of Total Rent Rolling |
| MTM | 1 | 4,480 | 0.1% | 0.1% | $5.61 | $25,111 | 0.2% | 0.2% |
| 2018 | 10 | 642,160 | 19.2% | 19.3% | $3.88 | $2,491,339 | 17.4% | 17.6% |
| 2019 | 6 | 250,740 | 7.5% | 26.8% | $11.05 | $2,769,764 | 19.3% | 36.9% |
| 2020 | 8 | 253,513 | 7.6% | 34.3% | $9.64 | $2,444,412 | 17.1% | 54.0% |
| 2021 | 3 | 147,447 | 4.4% | 38.7% | $3.56 | $524,914 | 3.7% | 57.7% |
| 2022 | 6 | 153,842 | 4.6% | 43.3% | $4.89 | $751,882 | 5.3% | 62.9% |
| 2023 | 3 | 84,475 | 2.5% | 45.8% | $8.38 | $708,000 | 4.9% | 67.9% |
| 2024 | 1 | 169,688 | 5.1% | 50.9% | $3.69 | $626,149 | 4.4% | 72.2% |
| 2025 | 2 | 112,600 | 3.4% | 54.2% | $4.88 | $549,475 | 3.8% | 76.1% |
| 2026 | 2 | 42,043 | 1.3% | 55.5% | $8.30 | $349,029 | 2.4% | 78.5% |
| 2027 | 4 | 175,039 | 5.2% | 60.7% | $7.21 | $1,261,268 | 8.8% | 87.3% |
| 2028 | 3 | 248,184 | 7.4% | 68.1% | $7.31 | $1,814,153 | 12.7% | 100.0% |
| 2029 & Beyond | 0 | 0 | 0.0% | 68.1% | $0.00 | $0 | 0.0% | 100.0% |
| Vacant | 0 | 1,069,019 | 31.9% | 100.0% | $0.00 | $0 | 0.0% | 100.0% |
| Total/Wtd. Avg. | 49 | 3,353,230 | 100.00% | $6.27 | $14,315,495 | 100.00% | ||
| (1) | Information is based on the underwritten rent roll. |
| (2) | Certain tenants may have lease termination options that are exercisable prior to the originally stated expiration date of the subject lease and that are not considered in the lease rollover schedule. |
| (3) | Wtd. Avg. UW Base Rent PSF Rolling excludes vacant space. |
The Market.The Tryad Industrial & Business Center Property is located approximately 6.0 miles west of downtown Rochester in an industrial area in the Town of Gates. The greater Rochester area is New York State’s third largest metropolitan area with a 2016 population of approximately 1.1 million individuals. Rochester is known as a technology hub and the area has been the birthplace to such corporations as Kodak, Western Union, Bausch & Lomb, Gleason and Xerox, companies that conduct extensive research and manufacturing in the fields of industrial and consumer products. Additionally, Rochester is known as the world capital of imaging.
The immediate area offers adequate access to the Tryad Industrial & Business Center Property with three freeway exits providing access to the interstate system via State Route 531 and Interstate 490. One exit is dedicated to the Tryad Industrial & Business Center Property. In addition, there are several bus stops within the campus providing access from downtown Rochester.
According to a third party market research report, the 2016 population within a three- and five-mile radius of the Tryad Industrial & Business Center Property is 39,868 and 140,951, respectively, and the median household income within a three- and five-mile radius of the Tryad Industrial & Business Center Property is $51,601 and $47,290, respectively.
As of Q2 2017, the Rochester market had a total industrial inventory of 93.6 million SF with a vacancy rate of 6.2%, which is in line with the 2016 average of 6.1%. As of Q3 2017, the Rochester market had a total office inventory of approximately 46.4 million SF with a vacancy rate of 8.8%, which is in line with the average vacancy rate for the past 9 years of 9.0%.
The appraisal identified fifteen comparable leases and concluded a weighted average market rent of $6.33 PSF, which is in line with UW Base Rent PSF of $6.27 PSF.
| Tryad Industrial & Business Center Market Rent | |||
| Net Rentable Area | UW Base Rent PSF(1) | Market Rent PSF | |
| Flex/Office | 1,128,937 | $9.33 | $10.00 |
| Flex/Office-Small Unit | 27,799 | $6.83 | $12.00 |
| Maximus Office Unit | 195,450 | $13.11 | $13.00 |
| Industrial-Small Unit | 37,283 | $4.19 | $5.00 |
| Industrial | 1,963,761 | $3.90 | $3.50 |
| Total/Wtd. Avg. | 3,353,230 | $6.27(2) | $6.33 |
Source:Appraisal
| (1) | Information is based on the underwritten rent roll. |
| (2) | Wtd. Avg. UW Base Rent PSF excludes vacant space. |
THE INFORMATION IN THIS COLLATERAL TERM SHEET IS NOT COMPLETE AND MAY BE AMENDED PRIOR TO THE TIME OF SALE. THIS TERM SHEET IS NOT AN OFFER TO SELL THESE SECURITIES AND IT IS NOT A SOLICITATION OF AN OFFER TO BUY THESE SECURITIES IN ANY JURISDICTION WHERE THE OFFER OR SALE IS NOT PERMITTED.
28
Rochester Technology Park Rochester, NY 14624 | Collateral Asset Summary – Loan No. 2 Tryad Industrial & Business Center | Cut-off Date Balance: Cut-off Date LTV Ratio: UW NCF DSCR: UW NOI Debt Yield: | $56,440,256 52.6% 1.42x 10.5% |
Operating History and Underwritten Net Cash Flow. The following table presents certain information relating to the historical operating performance and the Underwritten Net Cash Flow at the Tryad Industrial & Business Center Property:
| Cash Flow Analysis(1) | ||||||
| 2014 | 2015 | 2016 | 9/30/2017 TTM | UW | UW PSF | |
| Gross Potential Rent(2)(3)(4) | $7,403,937 | $9,027,325 | $11,875,899 | $14,009,391 | $21,101,242 | $6.29 |
| Total Recoveries | $5,677,471 | $5,959,222 | $5,975,325 | $5,788,021 | $6,136,757 | $1.83 |
| Other Income(5) | $270,130 | $220,565 | $869,517 | $267,735 | $267,735 | $0.08 |
| Less Vacancy & Credit Loss | $0 | $0 | $0 | $0 | ($6,785,747) | ($2.02) |
| Effective Gross Income | $13,351,538 | $15,207,112 | $18,720,741 | $20,065,147 | $20,719,987 | $6.18 |
| Real Estate Taxes(6) | $1,113,064 | $1,145,405 | $1,160,289 | $1,197,181 | $1,197,181 | $0.36 |
| Insurance | $274,313 | $290,098 | $299,443 | $303,861 | $299,032 | $0.09 |
| Management Fee | $630,057 | $584,343 | $673,030 | $658,938 | $621,600 | $0.19 |
| Other Operating Expenses | $8,009,960 | $7,266,939 | $7,059,515 | $7,145,730 | $6,983,532 | $2.08 |
| Total Operating Expenses | $10,027,394 | $9,286,785 | $9,192,277 | $9,305,710 | $9,101,345 | $2.71 |
| Net Operating Income | $3,324,144 | $5,920,327 | $9,528,464 | $10,759,437 | $11,618,642 | $3.46 |
| Capital Expenditures | $0 | $0 | $0 | $0 | $611,684 | $0.18 |
| TI/LC | $0 | $0 | $0 | $0 | $871,840 | $0.26 |
| Net Cash Flow | $3,324,144 | $5,920,327 | $9,528,464 | $10,759,437 | $10,135,118 | $3.02 |
| Occupancy % | 55.9% | 61.7% | 66.9% | 71.2% | 68.1% | |
| NOI DSCR(7) | 0.47x | 0.83x | 1.34x | 1.51x | 1.63x | |
| NCF DSCR(7) | 0.47x | 0.83x | 1.34x | 1.51x | 1.42x | |
| NOI Debt Yield(7) | 3.0% | 5.4% | 8.6% | 9.7% | 10.5% | |
| NCF Debt Yield(7) | 3.0% | 5.4% | 8.6% | 9.7% | 9.2% | |
| (1) | The borrower sponsors acquired the Tryad Industrial & Business Center Property in 2007 and have since leased up over 1.7 million SF of space bringing occupancy from approximately 20% at acquisition to 68.1% as of January 11, 2018. |
| (2) | Includes contractual rent steps through January 31, 2019 ($59,639). |
| (3) | Maximus’ current rent is $21.76 PSF, which includes amortizing tenant improvements. Underwritten rent is $13.11 PSF, which is based on the renewal option after the tenant improvement allowance has been repaid and is in line with the appraiser’s market rent conclusion of $13.00 PSF. |
| (4) | UW Gross Potential Rent includes rent for Kodak Alaris ($1,814,153). Kodak Alaris executed a ten-year lease in July 2017 and is currently building out its space. A portion of the space is expected to be delivered in March 2018 with the remainder of the space expected to be delivered by May 2018. The lease has a rent commencement date of September 1, 2018 and expiration date of December 31, 2028. At loan origination, the Tryad Industrial & Business Center Borrower deposited (i) approximately $9.2 million into a TI/LC reserve of which approximately $8.7 million is earmarked for Kodak Alaris and (ii) approximately $1.9 million into a free rent reserve earmarked for Kodak Alaris. |
| (5) | The increase in 2016 Other Income is a primarily a result of a one-time termination fee for a tenant that vacated. |
| (6) | The Tryad Industrial & Business Center Property is subject to a 20-year PILOT agreement with the Monroe County Industrial Development Authority, which abates the real estate taxes through 2028. The real estate taxes reflect the PILOT payment paid. The 9/30/2017 TTM and the underwritten real estate taxes ($1,197,181) reflect the current PILOT payment based on the trailing 12-months and is subject to annual increases of 3%. See “PILOT Agreement and IDA Ground Lease” below for further discussion. |
| (7) | Debt service coverage ratios and debt yields are based on the Tryad Industrial & Business Center Whole Loan. |
Escrows and Reserves. At origination, the Tryad Industrial & Business Center Borrower deposited in escrow (i) $700,000 upfront for annual real estate taxes and is required to escrow monthly 1/12 of the annual estimated tax payments, (ii) $144,000 upfront for annual insurance premiums and is required to escrow monthly 1/12 of the annual estimated insurance premiums, (iii) $9,203,324 upfront for owed tenant improvements of which approximately $8.7 million is earmarked for Kodak Alaris, (iv) $3,000,000 upfront for future rollover and is required to escrow $97,803 monthly into a rollover reserve in the event that the balance of the rollover reserve falls below $1,500,000 until such time as the amount on deposit equals $3,000,000, (v) $1,917,974 upfront in escrow for free rent associated with Kodak Alaris, (vi) $51,576 monthly for capital expenditures and (vii) $45,250 upfront for immediate repairs.
Lockbox and Cash Management. The Tryad Industrial & Business Center Whole Loan is structured with a hard lockbox and in place cash management. The Tryad Industrial & Business Center Borrower is required to send tenant direction letters to all tenants instructing them to deposit all rents and payments directly into the lockbox account controlled by the lender. All funds in the lockbox account are swept daily to a cash management account under the control of the lender and amounts in this account are used to pay monthly debt service payments on the Tryad Industrial & Business Center Whole Loan & Tryad Industrial & Business Center Mezzanine Loan and any reserves due under the Tryad Industrial & Business Center Whole Loan documents with excess amounts remaining in this account returned to the borrower in accordance with the Tryad Industrial & Business Center Whole Loan documents, unless a Cash Trap Period (as defined below) is continuing.
All excess cash will be swept into a lender-controlled account during the continuation of a Cash Trap Period.
A “Cash Trap Period” will commence upon written notice from lender to borrower of the occurrence of (i) an event of default under the Tryad Industrial & Business Center Mortgage Loan or the Tryad Industrial & Business Center Mezzanine Loan, (ii) the filing of a bankruptcy or insolvency proceeding by or against the Tryad Industrial & Business Center Borrower, guarantor or property manager, (iii) a Primary Tenant Cash Trap Period (as defined below) or (iv) the failure by the Tryad Industrial & Business Center Borrower, after the end of two consecutive calendar quarters, to maintain a debt service coverage ratio (in the aggregate taking into account both the Tryad Industrial & Business Center Whole Loan and the Tryad Industrial & Business Center Mezzanine Loan) of at least 1.05x. A Cash Sweep Period will continue until, in regard to clause (i) above, the cure of such event of default and acceptance of such cure by the lender, in regard to clause (ii) above, with respect to a bankruptcy action by or against the property manager only, the Tryad Industrial &
THE INFORMATION IN THIS COLLATERAL TERM SHEET IS NOT COMPLETE AND MAY BE AMENDED PRIOR TO THE TIME OF SALE. THIS TERM SHEET IS NOT AN OFFER TO SELL THESE SECURITIES AND IT IS NOT A SOLICITATION OF AN OFFER TO BUY THESE SECURITIES IN ANY JURISDICTION WHERE THE OFFER OR SALE IS NOT PERMITTED.
29
Rochester Technology Park Rochester, NY 14624 | Collateral Asset Summary – Loan No. 2 Tryad Industrial & Business Center | Cut-off Date Balance: Cut-off Date LTV Ratio: UW NCF DSCR: UW NOI Debt Yield: | $56,440,256 52.6% 1.42x 10.5% |
Business Center Borrower replacing the manager with a qualified manager under an acceptable replacement management agreement, with regard to clause (iii) above, such Primary Tenant Cash Trap Period having terminated and no other Cash Trap Period then existing, or with regard to clause (iv) above, the debt service coverage ratio being at least 1.05x (in the aggregate taking into account both the Tryad Industrial & Business Center Whole Loan and the Tryad Industrial & Business Center Mezzanine Loan) for two consecutive calendar quarters and no other Cash Trap Period then being in effect or event that would trigger another Cash Trap Period has occurred.
A “Primary Tenant Cash Trap Period” will commence upon the earlier of (i) six months prior to the then current expiration of any Primary Tenant lease, (ii) the date upon which any Primary Tenant (as defined below) becomes a debtor in any bankruptcy or insolvency proceeding, (iii) the date upon which any Primary Tenant vacates, surrenders, “goes dark” or otherwise gives notice of its intent to discontinue business at the space under their respective lease(s) or (iv) a monetary or material non-monetary default by the Primary Tenant under its lease. A Primary Tenant Cash Trap Period will end upon (a) the occurrence of a Primary Tenant Trigger Cure Event (as defined below), or (b) the NCF debt yield being equal to or greater than 8.50% (without including any income from any Primary Tenant who triggered such Primary Tenant Trigger Event) for a period of two consecutive calendar quarters subsequent to the commencement of the existing Primary Tenant Cash Trap Period.
A “Primary Tenant Trigger Cure Event” will occur upon the Tryad Industrial & Business Center Borrower satisfying all of the following conditions: (i) with respect to any Primary Tenant Cash Trap Period, the Tryad Industrial & Business Center Borrower has entered into one or more leases with one or more replacement tenants reasonably satisfactory to the lender demising not less than 85.0% of the applicable Primary Tenant space for a term of not less than three years, each at a net effective rental rate of not less than either (x) the net effective rental rate under the Primary Tenant lease at loan origination, (y) the effective fair market rent then prevailing for similar properties and leases in the market area (and taking into account the type and creditworthiness of the tenant, the length of the term including any renewals, and the location and size of the premises covered thereby) or (z) the net effective rental rate reasonably acceptable to the lender; (ii) with respect to a Primary Tenant Cash Trap Period that is triggered solely due to a bankruptcy trigger, the date on which Primary Tenant is no longer a debtor in any bankruptcy or insolvency proceeding).
A “Primary Tenant” means, individually and collectively, (i) Maximus, (ii) Harris Corporation, (iii) Eastman Kodak Company, (iv) University of Rochester, (v) Hammer Packaging Corporation, (vi) Kodak Alaris or (vii) any tenant or its affiliates that collectively occupy at least 200,000 SF at the Tryad Industrial & Business Center Property.
Additional Secured Indebtedness (not including trade debts). Not permitted.
Mezzanine Loan and Preferred Equity.In connection with the loan origination, Sound Mark Partners, LLC funded a mezzanine loan with an original principal balance of $19,500,000 that accrues interest at a rate of 10.7500%per annum.The Tryad Industrial & Business Center Mezzanine Loan is co-terminous with the Tryad Industrial & Business Center Whole Loan and is interest-only for its full term. The mezzanine lender entered into an intercreditor agreement with the lenders.
Release of Property. The Tryad Industrial & Business Center Borrower may obtain the free release of one or more vacant release parcels, subject to the terms of the Tryad Industrial & Business Center Whole Loan documents, which parcels are defined in the Tryad Industrial & Business Center Whole Loan documents. The identified vacant parcels were not included in the underwriting or appraised value of the Tryad Industrial & Business Center Whole Loan.
PILOT Agreement and IDA Ground Lease. In August 2007, the Tryad Industrial & Business Center Borrower entered into a 20-year payment in lieu of taxes (“PILOT”) agreement with the County of Monroe Industrial Development Agency (“IDA”) pursuant to which the borrower is required to pay, in lieu of taxes, an amount equal to $1,082,118 (the “Base Amount”) in special district charges and assessments during years 1-5 with a 3% per annum increase in the Base Amount in years 6-20; provided that the agreement permits the reduction of the Base Amount in the event there are special charges and assessments in excess of $60,000; and provided, further, that in the event the borrower constructs additional improvements that lead to an increase in the assessed value, the Base Amount may increase. In connection with the PILOT agreement, the Tryad Industrial & Business Center Borrower leased the Tryad Industrial & Business Center Property to IDA pursuant to a ground lease that requires rent of $1.00 per year and is co-terminous with the PILOT agreement. The IDA subleased the Tryad Industrial & Business Center Property back to the borrower to operate the related property. The lender has the right to terminate the ground lease and the related sub-lease in connection with a foreclosure proceeding against the Tryad Industrial & Business Center Borrower. See “Description of the Mortgage Pool—Real Estate and Other Tax Considerations” in the Preliminary Prospectus.
Terrorism Insurance. The Tryad Industrial & Business Center Borrower is required to obtain insurance against acts of terrorism for loss resulting from perils and acts of terrorism in amounts and with terms and conditions applicable to commercial property, general liability, business income and umbrella liability insurance required pursuant to the Tryad Industrial & Business Center Whole Loan documents.
THE INFORMATION IN THIS COLLATERAL TERM SHEET IS NOT COMPLETE AND MAY BE AMENDED PRIOR TO THE TIME OF SALE. THIS TERM SHEET IS NOT AN OFFER TO SELL THESE SECURITIES AND IT IS NOT A SOLICITATION OF AN OFFER TO BUY THESE SECURITIES IN ANY JURISDICTION WHERE THE OFFER OR SALE IS NOT PERMITTED.
30
(THIS PAGE INTENTIONALLY LEFT BLANK)
31
900 Chelmsford Street Lowell, MA 01851 | Collateral Asset Summary – Loan No. 3 CrossPoint | Cut-off Date Balance: Cut-off Date LTV Ratio: UW NCF DSCR: UW NOI Debt Yield: | $50,000,000 60.0% 2.24x 11.8% |

THE INFORMATION IN THIS COLLATERAL TERM SHEET IS NOT COMPLETE AND MAY BE AMENDED PRIOR TO THE TIME OF SALE. THIS TERM SHEET IS NOT AN OFFER TO SELL THESE SECURITIES AND IT IS NOT A SOLICITATION OF AN OFFER TO BUY THESE SECURITIES IN ANY JURISDICTION WHERE THE OFFER OR SALE IS NOT PERMITTED.
32
900 Chelmsford Street Lowell, MA 01851 | Collateral Asset Summary – Loan No. 3 CrossPoint | Cut-off Date Balance: Cut-off Date LTV Ratio: UW NCF DSCR: UW NOI Debt Yield: | $50,000,000 60.0% 2.24x 11.8% |
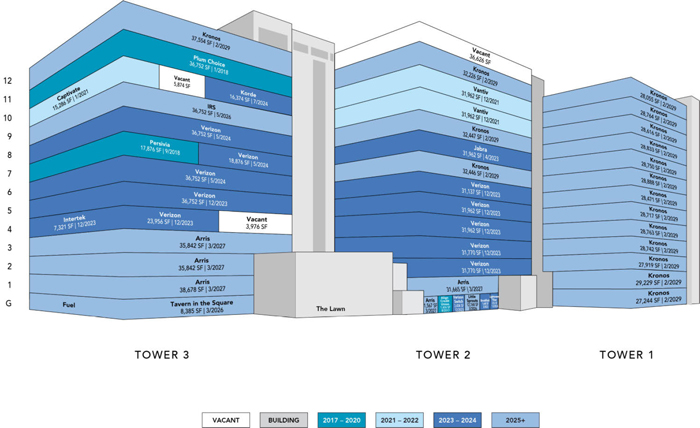
THE INFORMATION IN THIS COLLATERAL TERM SHEET IS NOT COMPLETE AND MAY BE AMENDED PRIOR TO THE TIME OF SALE. THIS TERM SHEET IS NOT AN OFFER TO SELL THESE SECURITIES AND IT IS NOT A SOLICITATION OF AN OFFER TO BUY THESE SECURITIES IN ANY JURISDICTION WHERE THE OFFER OR SALE IS NOT PERMITTED.
33
900 Chelmsford Street Lowell, MA 01851 | Collateral Asset Summary – Loan No. 3 CrossPoint | Cut-off Date Balance: Cut-off Date LTV Ratio: UW NCF DSCR: UW NOI Debt Yield: | $50,000,000 60.0% 2.24x 11.8% |
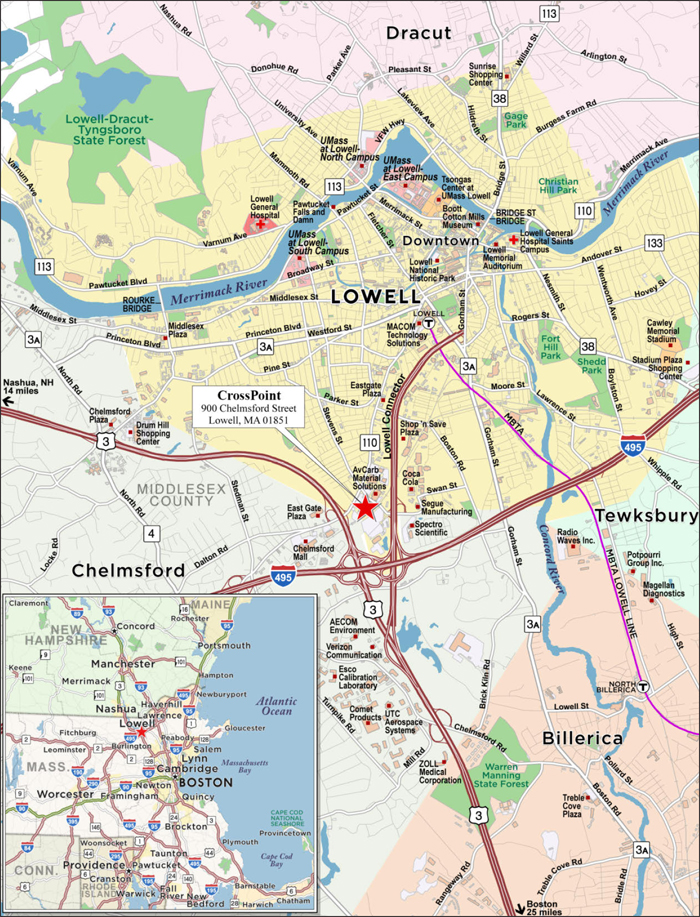
THE INFORMATION IN THIS COLLATERAL TERM SHEET IS NOT COMPLETE AND MAY BE AMENDED PRIOR TO THE TIME OF SALE. THIS TERM SHEET IS NOT AN OFFER TO SELL THESE SECURITIES AND IT IS NOT A SOLICITATION OF AN OFFER TO BUY THESE SECURITIES IN ANY JURISDICTION WHERE THE OFFER OR SALE IS NOT PERMITTED.
34
900 Chelmsford Street Lowell, MA 01851 | Collateral Asset Summary – Loan No. 3 CrossPoint | Cut-off Date Balance: Cut-off Date LTV Ratio: UW NCF DSCR: UW NOI Debt Yield: | $50,000,000 60.0% 2.24x 11.8% |
| Mortgage Loan Information | Property Information | ||||||
| Mortgage Loan Seller: | CCRE | Single Asset/Portfolio: | Single Asset | ||||
| Original Balance(1): | $50,000,000 | Location: | Lowell, MA 01851 | ||||
| Cut-off Date Balance(1): | $50,000,000 | General Property Type: | Office | ||||
| % of Initial Pool Balance: | 4.8% | Detailed Property Type: | Suburban | ||||
| Loan Purpose(2): | Acquisition | Title Vesting: | Fee | ||||
| Borrower Sponsors: | William H. Kremer; Samuel T. Byrne | Year Built/Renovated: | 1979/2017 | ||||
| Mortgage Rate: | 4.73400% | Size: | 1,320,254 SF | ||||
| Note Date: | 1/16/2018 | Cut-off Date Balance per SF(1): | $114 | ||||
| First Payment Date: | 3/4/2018 | Maturity Date Balance per SF(1): | $114 | ||||
| Maturity Date: | 2/6/2028 | Property Manager: | ALP CrossPoint Manager LLC | ||||
| Original Term to Maturity: | 120 months | ||||||
| Original Amortization Term: | 0 months | ||||||
| IO Period: | 120 months | Underwriting and Financial Information | |||||
| Seasoning: | 0 months | UW NOI: | $17,661,721 | ||||
| Prepayment Provisions(3)(4): | LO (24); DEF (90); O (6) | UW NOI Debt Yield(1): | 11.8% | ||||
| Lockbox/Cash Mgmt Status: | Hard/Springing | UW NOI Debt Yield at Maturity(1): | 11.8% | ||||
| Additional Debt Type(1)): | Pari Passu | UW NCF DSCR(1): | 2.24x | ||||
| Additional Debt Balance(1)(4)(5): | $100,000,000 | Most Recent NOI(6): | $11,312,928 (11/30/2017 TTM) | ||||
| Future Debt Permitted (Type): | No (N/A) | 2nd Most Recent NOI(6): | $6,360,488 (12/31/2016) | ||||
| Reserves(8) | 3rd Most Recent NOI(7): | N/A | |||||
| Type | Initial | Monthly | Cap | Most Recent Occupancy: | 95.4% (1/11/2018) | ||
| RE Tax: | $240,000 | $240,000 | N/A | 2nd Most Recent Occupancy: | 63.7% (12/31/2016) | ||
| Insurance: | $0 | Springing | N/A | 3rd Most Recent Occupancy: | 67.0% (12/31/2015) | ||
| Replacements: | $0 | $18,703 | N/A | Appraised Value (as of): | $250,000,000 (1/8/2018) | ||
| TI/LC: | $0 | $110,021 | $3,960,762 | Cut-off Date LTV Ratio(1): | 60.0% | ||
| Kronos Free Rent Reserve: | $6,500,000 | $0 | N/A | Maturity Date LTV Ratio(1): | 60.0% | ||
| Sources and Uses | ||||||
| Sources | Proceeds | % of Total | Uses | Proceeds | % of Total | |
| Loan Amount(1): | $150,000,000 | 63.7% | Purchase Price(2): | $227,200,000 | 96.5% | |
| Borrower Equity | $85,555,563 | 36.3% | Reserves: | $6,740,000 | 2.9% | |
| Closing Costs: | $1,615,563 | 0.7% | ||||
| Total Sources: | $235,555,563 | 100.0% | Total Uses: | $235,555,563 | 100.0% | |
| (1) | The original principal balance represents a portion of the CrossPoint Whole Loan (as defined below), which is comprised of 10pari passupromissory notes with an aggregate original principal balance of $150,000,000. The Cut-off Date Balance per SF, Maturity Date Balance per SF, UW NOI Debt Yield, UW NOI Debt Yield at Maturity, UW NCF DSCR, Cut-off Date LTV Ratio and Maturity Date LTV Ratio presented above are based on the aggregate principal balance of the CrossPoint Whole Loan. |
| (2) | Anchor Line, an affiliate of the CrossPoint manager, was part of the prior ownership structure of the CrossPoint Property and has retained an approximate 3.5% ownership stake in conjunction with the acquisition. |
| (3) | Partial release of a one-acre parcel is permitted. See “Release of Property” below for further discussion of release requirements. |
| (4) | The lockout period for defeasance will be at least 24 payment dates beginning with and including the first payment date of March 4, 2018. Following the lockout period, the CrossPoint Borrower (as defined below) has the right to defease the CrossPoint Whole Loan in whole, but not in part, on any date before September 4, 2027. The lockout period will expire on the earlier to occur of (i) two years after the closing date of the securitization that includes the last note to be securitized or (ii) March 4, 2021. For the purposes of this term sheet, the assumed lockout period of 24 months is based on the expected UBS 2018-C8 securitization closing date in February 2018. The actual lockout period may be longer. |
| (5) | See “Escrows and Reserves” below for further discussion of reserve requirements. |
| (6) | The increase in NOI from 2016 to 11/30/2017 TTM is primarily associated with an increase in occupancy from 63.7% to 95.4%. In May 2016, Kronos executed a new 12-year lease for 505,664 SF (38.3% of NRA). |
| (7) | The borrower sponsors acquired the CrossPoint Property in January 2018. As a result, historical financials prior to 2016 are unavailable. |
THE INFORMATION IN THIS COLLATERAL TERM SHEET IS NOT COMPLETE AND MAY BE AMENDED PRIOR TO THE TIME OF SALE. THIS TERM SHEET IS NOT AN OFFER TO SELL THESE SECURITIES AND IT IS NOT A SOLICITATION OF AN OFFER TO BUY THESE SECURITIES IN ANY JURISDICTION WHERE THE OFFER OR SALE IS NOT PERMITTED.
35
900 Chelmsford Street Lowell, MA 01851 | Collateral Asset Summary – Loan No. 3 CrossPoint | Cut-off Date Balance: Cut-off Date LTV Ratio: UW NCF DSCR: UW NOI Debt Yield: | $50,000,000 60.0% 2.24x 11.8% |
The Mortgage Loan. The third largest mortgage loan (the “CrossPoint Mortgage Loan”) is part of a whole loan (the “CrossPoint Whole Loan”) with an aggregate original principal balance of $150,000,000. The CrossPoint Whole Loan is secured by a first priority mortgage encumbering the CrossPoint Borrower’s fee interest in four interconnected Class A office towers totaling 1,320,254 SF located in Lowell, MA (the “CrossPoint Property”). Promissory Notes A-2, A-3, and A-9, with an aggregate original principal balance of $50,000,000, collectively represent the CrossPoint Mortgage Loan and will be included in the UBS 2018-C8 Trust. Promissory Notes A-1, A-4, A-7, A-8 and A-10 are currently held by CCRE or an affiliate, and are expected to be contributed to one or more future securitization transactions or may be otherwise transferred at any time. Promissory Notes A-5 and A-6 are currently held by Starwood Mortgage Capital LLC (“Starwood”) or an affiliate, and are expected to be contributed to one or more future securitization transactions or may be otherwise transferred at any time. See “Description of the Mortgage Pool—The Whole Loans—The Serviced Pari Passu Whole Loans” and “Pooling and Servicing Agreement” in the Preliminary Prospectus.
| CrossPoint Loan Summary | ||||
| Note | Original Balance | Cut-off Date Balance | Anticipated Note Holder | Controlling Piece |
| Note A-1 | $30,000,000 | $30,000,000 | CCRE | Yes |
| Note A-2 | $25,000,000 | $25,000,000 | UBS 2018-C8 | No |
| Note A-3 | $20,000,000 | $20,000,000 | UBS 2018-C8 | No |
| Note A-4 | $20,000,000 | $20,000,000 | CCRE | No |
| Note A-5 | $15,000,000 | $15,000,000 | Starwood | No |
| Note A-6 | $10,000,000 | $10,000,000 | Starwood | No |
| Note A-7 | $10,000,000 | $10,000,000 | CCRE | No |
| Note A-8 | $10,000,000 | $10,000,000 | CCRE | No |
| Note A-9 | $5,000,000 | $5,000,000 | UBS 2018-C8 | No |
| Note A-10 | $5,000,000 | $5,000,000 | CCRE | No |
| Total | $150,000,000 | $150,000,000 | ||
The proceeds of the CrossPoint Whole Loan, along with approximately $85.6 million of borrower equity, were used to acquire the CrossPoint Property, fund reserves of approximately $6.74 million, and pay closing costs.
The Borrower and the Borrower Sponsors. The borrower is CH LH CrossPoint Owner LLC (the “CrossPoint Borrower”), a single-purpose Delaware limited liability company structured to be bankruptcy remote with two independent directors. The borrower sponsors of the CrossPoint Whole Loan are Samuel T. Byrne and William H. Kremer. The initial nonrecourse carveout guarantors of the CrossPoint Loan are Samuel T. Byrne and Brian Chaisson. One or more of the guarantors may be replaced from time to time by a replacement guarantor that has a net worth of not less than $50,000,000, and, if such replacement guarantor is not a natural person, liquid assets of at least $5,000,000 and which otherwise satisfy the requirements set forth in the CrossPoint Whole Loan documents. Lighthouse Real Estate Holdings LLC was deemed to satisfy certain of such other requirements so long as no material and adverse change occurred with respect to such prior to the date of the replacement of one or more of the existing guarantors.
Samuel T. Byrne and William Kremer are managing partner and co-founder of Cross Harbor Capital Partners, LLC (“Cross Harbor”), a Boston-based real estate private equity firm founded in 1993. Cross Harbor develops and manages private equity investment products in three principal business areas: real assets, distressed securities and mezzanine capital and has invested in more than $13 billion of commercial real estate on behalf of a diversified group of endowments, foundations, public and corporate pension plans, financial institutions, family offices, and sovereign entities.
Brian Chaisson is a founder and managing partner of Anchor Line Partners, LLC (“Anchor Line”). Anchor Line, an affiliate of the CrossPoint Property manager, was part of the prior ownership structure prior to the sale of the CrossPoint Property to the CrossPoint Borrower and has retained an approximate 3.5% ownership stake in conjunction with the acquisition. Anchor Line is a Boston-based company that focuses on core plus, value add, and opportunistic investment opportunities in the commercial real estate sector. Brian Chaisson has served in senior positions across multiple real estate finance platforms as a principal of Cross Harbor and as the Regional Director in Boston for Tishman Speyer.
The Property. The CrossPoint Property consists of three Class A multi-tenanted office towers (Tower 1, Tower 2 and Tower 3), and one vacant 13,700 SF single-story building on the northeast corner, across 42.9 acres in Lowell, Massachusetts. Towers 1 & 3 each consist of 13 floors while Tower 2 has 14 floors, resulting in a total of 40 floors and 1,320,254 SF. The CrossPoint Property was constructed between 1979 and 1985 and recently underwent a large-scale renovation totaling $76.3 million in capital expenditures and leasing costs that was completed in 2017. The renovation included an exterior wall reconstruction to increase square footage and improve natural light penetration, a lobby renovation, HVAC upgrades and relocation, electrical system upgrades, and the addition of the fitness center and cafeteria.
The CrossPoint Property is a Class A property that features a range of amenities including (i) Fuel, a 16,186 SF dining facility, (ii) Flex, a 7,027 SF fitness facility that includes a weight room, gaming center, yoga classes, and golf-simulator, (iii) Lawn, a 16,811 SF conference facility that includes two auditoriums (500 and 200 seats) and three conference rooms (50, 30, and 20 seat rooms) and (iv) a basketball court. In addition, the CrossPoint Property has tenants that provide additional amenities including (i) Little Sprouts, a 12,768 SF day-care facility that has a 215 child capacity and (ii) Tavern in the Square, an 8,385 SF restaurant located on the main floor of Tower 3, with 2017 gross sales of $6,152,608 (2.7% occupancy cost).
The CrossPoint Property is located between entrance points to U.S Route 3 (the Northwest Expressway), State Route 2B (the Lowell Connector), and Interstate-495, providing access to transportation throughout New England. The CrossPoint Property provides for approximately 4,000 parking spaces, 306 of which are contained in an attached two-level garage.
The CrossPoint Property benefits from an easement agreement with the owner of an adjacent parcel that provides 2,745 parking spaces on approximately 27 acres. Any amendments to the parking easement agreement are subject to (i) the lender’s prior written approval and (ii) compliance with zoning laws and ordinances.
THE INFORMATION IN THIS COLLATERAL TERM SHEET IS NOT COMPLETE AND MAY BE AMENDED PRIOR TO THE TIME OF SALE. THIS TERM SHEET IS NOT AN OFFER TO SELL THESE SECURITIES AND IT IS NOT A SOLICITATION OF AN OFFER TO BUY THESE SECURITIES IN ANY JURISDICTION WHERE THE OFFER OR SALE IS NOT PERMITTED.
36
900 Chelmsford Street Lowell, MA 01851 | Collateral Asset Summary – Loan No. 3 CrossPoint | Cut-off Date Balance: Cut-off Date LTV Ratio: UW NCF DSCR: UW NOI Debt Yield: | $50,000,000 60.0% 2.24x 11.8% |
The CrossPoint Property is currently 95.4% leased to 21 tenants, with major national tenants such as Kronos (38.3%% of NRA; rated BB/B2/NR by Fitch/Moody’s/S&P), Verizon (23.9% of NRA; rated A-/Baa1/BBB+ by Fitch/Moody’s/S&P), Arris Technology (10.9% of NRA; rated NR/Ba3/BB by Fitch/Moody’s/S&P), and Vantiv eCommerce (4.8% of NRA).
Major Tenants.
Kronos Incorporated (505,664 SF, 38.3% of NRA, 37.8% of underwritten base rent, rated BB/B2/NR by Fitch/Moody’s/S&P). Kronos Incorporated (“Kronos”), which leases all of Tower 1 and portions of Towers 2 and 3, is a provider of workforce management and human capital management cloud solutions for businesses, healthcare providers, educational institutions, and government agencies of all sizes. Tens of thousands of organizations, including more than half of the Fortune 1000 and more than 40 million people in over 100 countries use Kronos every day. Founded in Lowell in 1977, Kronos recently relocated its headquarters back to Lowell by executing a 12-year lease in May 2016 at the CrossPoint Property. In conjunction with its headquarters relocation, Kronos invested approximately $12.0 million and according to the borrower sponsors, Kronos plans to grow its corporate headquarters’ employee count from 1,600 to 2,000. Additionally, the tenant received a $33.0 million tenant improvement package from the prior owner that included structural and base system upgrades. The tenant improvement allowance granted to tenant has been disbursed in full by the landlord under the Kronos lease.
In the event the CrossPoint Borrower intends to sell the CrossPoint Property, Kronos has a right of first offer to purchase the CrossPoint Property. The right to purchase does not apply to a sale pursuant to an exercise of a power of sale, foreclosure by mortgage, delivery of a deed in lieu of foreclosure or any ensuing sale of the CrossPoint Property after the CrossPoint Property is relinquished by the CrossPoint Borrower as a result of the aforementioned events. See “Description of the Mortgage Pool—Tenant Issues—Purchase Options and Rights of First Refusal” in the Preliminary Prospectus.
Additionally, Kronos has a right of first refusal for any space becoming available at the CrossPoint Property subject to Verizon’s right of first offer with respect to certain space and the conditions set forth in the Kronos lease. In December 2016, Kronos exercised this right and leased an additional 37,554 SF suite on the 12th floor of Tower 3.
In conjunction with its new lease and the relocation of its corporate headquarters to the CrossPoint Property, the city of Lowell granted Kronos a tax exemption through a tax incentive financing (“TIF”) agreement. The 12-year agreement provides the tenant with a tax exemption and in return the tenant is required to, among other things, (i) create 400 new jobs at the CrossPoint Property, (ii) work with UMass Lowell & other local colleges to hire Lowell residents and (iii) invest $18.5 million of capital improvements into the building. See “Description of the Mortgage Pool—Real Estate and Other Tax Considerations” in the Preliminary Prospectus.
Verizon New England (314,981 SF, 23.9% of NRA, 21.5% of underwritten base rent, rated A-/Baa1/BBB+ by Fitch/Moody’s/S&P). Verizon New England Inc., a subsidiary of Verizon Communications Inc. (“Verizon”) (NYSE: VZ), provides voice, data, and video services to homes and businesses in Massachusetts. The Verizon lease is not guaranteed by its parent company. Verizon offers fiber optics Internet, TV, and digital voice services; Internet; and wireless 4G LTE services, utilizes six floors at the CrossPoint Property for engineering, sales and management while the remaining four floors are call centers.
Verizon has been a tenant at the CrossPoint Property since 1994, and has expanded its space by over 220,000 SF since then. According to the tenant, Verizon has invested $20.0-$25.0 million into its space. As of January 2018, Verizon had a market cap of approximately $217 billion. Verizon has a right of first offer on certain space within the CrossPoint Property. Additionally, Verizon has the right to terminate up to 219,561 SF of its space effective on 12/31/2020 and/or 92,380 SF of its space effective 5/31/2021 by giving notice one year prior on 12/31/2019.
Arris Technology, Inc. (143,594 SF, 10.9% of NRA, 10.4% of underwritten base rent, rated NR/Ba3/BB by Fitch/Moody’s/S&P). Arris Technology, Inc. (“Arris”) (NASDAQ: ARRS) is a world leader in entertainment and communications technology. Arris provides a diverse array of different communications and multimedia solutions including content security, UltraHD TV, cloud-based DVR services, and high-bandwidth Wi-Fi, along with many others. At the CrossPoint Property, Arris utilizes its space as a research and testing center for TV, Internet, and cloud-based products. As of January 26 2018, Arris had a market cap of approximately $4.7 billion.
The remaining tenants include a mix of national and local office tenants such as the U.S Internal Revenue Service, Vantiv eCommerce, Captivate LLC, Persivia, and Jabra, among others. These remaining tenants comprise 22.4% of the NRA and 30.3% of the UW base rent. Of the 1,320,254 SF at the CrossPoint Property, approximately 40,024 SF represents amenities that include an auditorium, a conference center, a cafeteria, and a fitness center.
THE INFORMATION IN THIS COLLATERAL TERM SHEET IS NOT COMPLETE AND MAY BE AMENDED PRIOR TO THE TIME OF SALE. THIS TERM SHEET IS NOT AN OFFER TO SELL THESE SECURITIES AND IT IS NOT A SOLICITATION OF AN OFFER TO BUY THESE SECURITIES IN ANY JURISDICTION WHERE THE OFFER OR SALE IS NOT PERMITTED.
37
900 Chelmsford Street Lowell, MA 01851 | Collateral Asset Summary – Loan No. 3 CrossPoint | Cut-off Date Balance: Cut-off Date LTV Ratio: UW NCF DSCR: UW NOI Debt Yield: | $50,000,000 60.0% 2.24x 11.8% |
The following table presents certain information relating to the leases at the CrossPoint Property:
| Tenant Summary(1) | |||||||
| Tenant Name | Credit Rating (Fitch/Moody’s/ S&P)(2) | Tenant SF | Approximate % of SF | Annual UW Base Rent | % of Total Annual UW Base Rent | Annual UW Base Rent PSF(3) | Lease Expiration |
| Kronos Incorporated(6) | BB/B2/NR | 505,664 | 38.3% | $7,837,792 | 37.8% | $15.50 | 2/6/2029 |
| Verizon New England(4) | A-/Baa1/BBB+ | 314,981 | 23.9% | $4,453,589 | 21.5% | $14.14 | 12/31/2023(5) |
| Arris Technology, Inc. | NR/Ba3/BB | 143,594 | 10.9% | $2,145,286 | 10.4% | $14.94 | 4/30/2027 |
| Vantiv eCommerce, LLC | NR/NR/NR | 63,924 | 4.8% | $1,534,176 | 7.4% | $24.00 | 12/31/2021 |
| United States of America (GSA) - IRS | AAA/Aaa/AA+ | 36,752 | 2.8% | $1,266,958 | 6.1% | $34.47 | 8/14/2026(6) |
| Subtotal/Wtd. Avg. | 1,064,915 | 80.7% | $17,237,801 | 83.2% | $16.19 | ||
| Remaining Tenants(7) | 194,688 | 14.7% | $3,487,858 | 16.8% | $17.92 | ||
| Vacant Space | 60,651 | 4.6% | $0 | 0.0% | $0.00 | ||
| Total/Wtd. Avg. | 1,320,254 | 100.0% | $20,725,659 | 100.0% | $16.45 | ||
| (1) | Information is based on the underwritten rent roll. |
| (2) | Ratings provided are for the parent company of the entity listed in the “Tenant Name” field whether or not the parent company guarantees the lease. |
| (3) | Wtd. Avg. Annual UW Base Rent PSF excludes vacant space. |
| (4) | Annual UW Base Rent for Verizon New England represents the average rent for the tenant through its lease expiration. Verizon New England’s current annual rent is $4,165,349 ($13.22 PSF). |
| (5) | Verizon New England has 222,601 SF that expires on 12/31/2023 and 92,380 SF that expires on 5/21/2024. Verizon New England has the right to terminate up to 222,601 SF of its space effective on 12/31/2020 and 92,380 SF of its space effective 5/31/2021 by giving notice one year prior on 12/31/2019, subject to a termination fee of $10.2 million (assuming both rights are exercised). In the event Verizon New England exercises this right, the CrossPoint Whole Loan provides for a cash sweep. |
| (6) | United States of America (GSA) - IRS may terminate its lease at any time by giving 180 days’ notice. |
| (7) | Approximately 40,024 SF of Remaining Tenants represents amenities that include: a cafeteria, an auditorium, a conference center and a fitness center. These spaces are represented as occupied square footage with no rent attributed. |
The following table presents certain information relating to the lease rollover schedule at the CrossPoint Property:
| Lease Rollover Schedule(1)(2) | ||||||||
| Year | # of Leases Rolling | SF Rolling | Approx. % of Total SF Rolling | Approx. Cumulative % of SF Rolling | UW Base Rent PSF Rolling(3) | Total UW Base Rent Rolling | Approx. % of Total Rent Rolling | Approx. Cumulative % of Total Rent Rolling |
| MTM | 1 | 800 | 0.1% | 0.1% | $72.47 | $57,980 | 0.3% | 0.3% |
| 2018 | 1 | 17,876 | 1.4% | 1.4% | $21.35 | $381,653 | 1.8% | 2.1% |
| 2019 | 0 | 0 | 0.0% | 1.4% | $0.00 | $0 | 0.0% | 2.1% |
| 2020 | 0 | 0 | 0.0% | 1.4% | $0.00 | $0 | 0.0% | 2.1% |
| 2021 | 4 | 115,962 | 8.8% | 10.2% | $24.36 | $2,824,426 | 13.6% | 15.7% |
| 2022 | 0 | 0 | 0.0% | 10.2% | $0.00 | $0 | 0.0% | 15.7% |
| 2023 | 12 | 263,535 | 20.0% | 30.2% | $15.25 | $4,018,053 | 19.4% | 35.1% |
| 2024 | 5 | 109,030 | 8.3% | 38.4% | $16.12 | $1,757,684 | 8.5% | 43.6% |
| 2025 | 0 | 0 | 0.0% | 38.4% | $0.00 | $0 | 0.0% | 43.6% |
| 2026 | 3 | 57,905 | 4.4% | 42.8% | $29.41 | $1,702,786 | 8.2% | 51.8% |
| 2027 | 5 | 143,594 | 10.9% | 53.7% | $14.94 | $2,145,286 | 10.4% | 62.2% |
| 2028 | 0 | 0 | 0.0% | 53.7% | $0.00 | $0 | 0.0% | 62.2% |
| 2029 | 17 | 505,664 | 38.3% | 92.0% | $15.50 | $7,837,792 | 37.8% | 100.0% |
| Thereafter(4) | 5 | 45,237 | 3.4% | 95.4% | $0.00 | $0 | 0.0% | 100.0% |
| Vacant | 0 | 60,651 | 4.7% | 100.0% | $0.00 | $0 | 0.0% | 100.0% |
| Total/Wtd. Avg. | 53 | 1,320,254 | 100.0% | $16.45 | $20,725,659 | 100.00% | ||
| (1) | Information is based on the underwritten rent roll. |
| (2) | Certain tenants may have lease termination options that are exercisable prior to the originally stated expiration date of the subject lease and that are not considered in the lease rollover schedule. |
| (3) | Wtd. Avg. UW Base Rent PSF Rolling excludes vacant space. |
| (4) | Approximately 40,024 SF represents amenities that include: cafeteria, auditorium, a conference center and a fitness center. Approximately 5,213 SF represents the management office. These spaces are represented as occupied square footage with no rent attributed. |
The Market. The CrossPoint Property is situated between entrance points to U.S. Route 3 (the Northwest Expressway), State Route 2B (the Lowell Connector), and Interstate-495 in Lowell, MA. These access points allow for transportation throughout New England for the tenants and their employees. The population within a 5-mile radius of the CrossPoint Property is 205,069 residents, with a median household income of $70,638, above the national average of $59,039, and in-line with the median household income in the State of Massachusetts at $72,266.
According to a third party research report, the CrossPoint Property is located in the Lowell/Chelmsford submarket of the Greater Boston office market. Overall, the Lowell/Chelmsford submarket has a supply of 19.7 million SF of office space and average asking rents of $18.68 PSF, as of Q3 2017. Of the 19.7 million SF of office space in the submarket, approximately 4.9 million SF are Class A properties, and the CrossPoint Property represents a significant portion of the 4.9 million SF supply. This class A submarket has average asking rents of $20.79 PSF and vacancy of 16.1%, as of Q3 2017.
THE INFORMATION IN THIS COLLATERAL TERM SHEET IS NOT COMPLETE AND MAY BE AMENDED PRIOR TO THE TIME OF SALE. THIS TERM SHEET IS NOT AN OFFER TO SELL THESE SECURITIES AND IT IS NOT A SOLICITATION OF AN OFFER TO BUY THESE SECURITIES IN ANY JURISDICTION WHERE THE OFFER OR SALE IS NOT PERMITTED.
38
900 Chelmsford Street Lowell, MA 01851 | Collateral Asset Summary – Loan No. 3 CrossPoint | Cut-off Date Balance: Cut-off Date LTV Ratio: UW NCF DSCR: UW NOI Debt Yield: | $50,000,000 60.0% 2.24x 11.8% |
A broader search of Class A, multi-tenanted buildings with rentable SF equal to or greater than 200,000 SF in the suburbs to the west and north/northeast of the Boston CBD yielded a competitive set of 15.5 million SF across 49 buildings, recording a vacancy rate of 8.0% and average rent of $26.65 PSF.
The appraiser identified six comparable office leases signed between 2015 and 2017 relative to the leases signed at the CrossPoint Property. The comparable set had leases ranging from $10.40 to $18.59 PSF on an adjusted basis, with an average of $16.44 PSF, in-line with UW base rent of $16.45 PSF at the CrossPoint Property.
The following table presents certain information relating to the directly competitive buildings with respect to the CrossPoint Property:
| Comparable Office Buildings | |||||||
| Property Name | Location | Distance from Subject | Net Rentable Area (SF) | Tenant | SF Leased | Rent PSF | Adjusted Rent PSF |
| CrossPoint Property | Lowell, MA | - | 1,320,254(1) | $16.45(1) | $16.45(1) | ||
| Westford Technology Park | Westford, MA | 5.5 miles | 162,000 | Aspect Software Inc. | 29,930 | $22.00 | $14.03 |
| Connector Park | Lowell, MA | 0.2 miles | 199,783 | Altranais Home Care | 2,351 | $18.50 | $11.48 |
| Westford Technology Park | Westford, MA | 5.5 miles | 162,000 | Akamai Technologies | 42,286 | $22.75 | $13.65 |
| Altid Business Park | Chelmsford, MA | 1.7 miles | 131,430 | Comcast | 131,430 | $16.25 | $18.59 |
| 1 Executive Drive | Chelmsford, MA | 0.5 miles | 111,454 | Spectro | 7,201 | $19.50 | $10.40 |
| Chelmsford Office & Reserve Park | Chelmsford, MA | 1.0 mile | 293,422 | HNTB Corporation | 21,018 | $14.00 | $14.70 |
| Total/Wtd. Avg.(2) | 176,682 | 39,036 | $18.08 | $16.44 | |||
Source:Appraisal
| (1) | Based on the underwritten rent roll. |
| (2) | Total/Wtd. Avg. excludes the CrossPoint Property. |
Operating History and Underwritten Net Cash Flow. The following table presents certain information relating to the historical operating performance and the Underwritten Net Cash Flow at the CrossPoint Property:
| Cash Flow Analysis | |||||||||||||
| 2014(1) | 2015(1) | 2016 | TTM 11/30/2017 | UW | UW PSF | ||||||||
| Gross Potential Rent(2) | N/A | N/A | $11,610,171 | $15,907,616 | $21,725,968 | $16.46 | |||||||
| Total Recoveries | N/A | N/A | $5,783,881 | $7,648,558 | $11,478,465 | $8.69 | |||||||
| Percentage Rent | N/A | N/A | $0 | $0 | $0 | $0.00 | |||||||
| Other Income(3) | N/A | N/A | $671,090 | $812,877 | $854,767 | $0.65 | |||||||
| Less Vacancy & Credit Loss(4) | N/A | N/A | $0 | $0 | ($2,656,355) | ($2.01) | |||||||
| Effective Gross Income | N/A | N/A | $18,065,142 | $24,369,051 | $31,402,846 | $23.79 | |||||||
| Total Operating Expenses | N/A | N/A | $11,704,653 | $13,056,123 | $13,741,126 | $10.41 | |||||||
| Net Operating Income | N/A | N/A | $6,360,488 | $11,312,928 | $17,661,721 | $13.38 | |||||||
| Capital Expenditures | N/A | N/A | $0 | $0 | $224,443 | $0.17 | |||||||
| TI/LC | N/A | N/A | $0 | $0 | $1,320,254 | $1.00 | |||||||
| Net Cash Flow(5) | N/A | N/A | $6,360,488 | $11,312,928 | $16,117,023 | $12.21 | |||||||
| Occupancy % | N/A | N/A | 63.7% | 95.4% | 92.0% | ||||||||
| NOI DSCR(6) | N/A | N/A | 0.88x | 1.57x | 2.45x | ||||||||
| NCF DSCR(6) | N/A | N/A | 0.88x | 1.57x | 2.24x | ||||||||
| NOI Debt Yield(6) | N/A | N/A | 4.2% | 7.5% | 11.8% | ||||||||
| NCF Debt Yield(6) | N/A | N/A | 4.2% | 7.5% | 10.7% | ||||||||
| (1) | The borrower sponsors acquired the CrossPoint Property in January 2018. As a result, historical financials prior to 2016 are unavailable. |
| (2) | UW Gross Potential Rent is based on the underwritten rent roll with vacant spaces grossed up to market rents and includes (i) rent steps through January 2019 of $804,117 and (ii) average rent for Verizon totaling $288,240. |
| (3) | Other Income includes contractual income for antenna leases as well as parking income, among other things. |
| (4) | Vacancy is underwritten to 8.0% economic vacancy, which is in line with the appraiser’s vacancy conclusion of 8.0%. As of January 11, 2018, the CrossPoint Property was 95.4% occupied. |
| (5) | The increase in Net Cash Flow from 2016 to 11/30/2017 TTM is primarily associated with an increase in occupancy from 63.7% in December 2017 to 95.4% in January 2018. In May 2016, Kronos executed a new 12-year lease for 505,664 SF (38.3% of NRA). |
| (6) | Debt service coverage ratios and debt yields are based on the CrossPoint Whole Loan. |
Escrows and Reserves. At loan origination, the CrossPoint Borrower deposited in escrow: (i) $240,000 for annual real estate taxes, and (ii) $6,500,000 into the Kronos Free Rent Reserve for outstanding free rent associated with the Kronos lease. The CrossPoint Borrower is required to escrow monthly (i) $240,000 towards annual estimated tax payments, (ii) $18,704 towards replacement reserves and (iii) $110,021 for tenant improvements and leasing commissions, which is subject to a cap of $3.96 million, so long as (a) at least 88.0% of the NRA of the CrossPoint Property improvements are occupied (excluding any tenants that are the subject of a bankruptcy action, have gone-dark in more than 25% of their premises or vacated their respective premises, have given notice of their intent not to renew their respective leases or have leases which are expiring within twelve months of the applicable date of
THE INFORMATION IN THIS COLLATERAL TERM SHEET IS NOT COMPLETE AND MAY BE AMENDED PRIOR TO THE TIME OF SALE. THIS TERM SHEET IS NOT AN OFFER TO SELL THESE SECURITIES AND IT IS NOT A SOLICITATION OF AN OFFER TO BUY THESE SECURITIES IN ANY JURISDICTION WHERE THE OFFER OR SALE IS NOT PERMITTED.
39
900 Chelmsford Street Lowell, MA 01851 | Collateral Asset Summary – Loan No. 3 CrossPoint | Cut-off Date Balance: Cut-off Date LTV Ratio: UW NCF DSCR: UW NOI Debt Yield: | $50,000,000 60.0% 2.24x 11.8% |
determination), and (b) the DSCR is at least 1.75x.
Lockbox and Cash Management. The CrossPoint Whole Loan provides for a hard lockbox (which is in place) and springing cash management, which will commence during the continuance of a Cash Management Period (as defined below). During the continuance of a Cash Management Period, funds deposited into the lockbox account will be swept daily into the cash management account and all excess funds in the cash management account (after distribution of monthly amounts due under the CrossPoint Whole Loan) will be retained by the lender.
A “Cash Management Period” will commence upon (i) an event of default, (ii) the occurrence of a bankruptcy action with respect to the CrossPoint Borrower, guarantor or any additional required special purpose entity, (iii) failure after the end of one calendar quarter to maintain a DSCR of at least 1.50x (a “DSCR Trigger”) or (iv) any Lease Trigger Period.
A “Lease Trigger Period” will commence upon (i) the earlier of (a) 12 months prior to the lease expiration under the Kronos or Verizon lease or any replacement lease that demises at least 150,000 SF of space currently demised under the Kronos or Verizon lease (the Kronos and Verizon and any tenant under any such replacement lease, an “Occupancy Reserve Tenant”), or (b) the date on which any Occupancy Reserve Tenant delivers notice or otherwise indicates its intention not to renew its lease at the CrossPoint Property; (ii) at such time, if ever, as any Occupancy Reserve Tenant (A) declares bankruptcy, (B) gives notice of its intent to terminate or not renew its lease or (C) goes-dark with respect to 15% or more of its leased premises or vacates or gives notice of its intent to vacate its demised premises and either (y) such Occupancy Reserve Tenant (or any guarantor of such tenant’s lease) no longer receives an investment grade unsecured long-term debt rating, or (z) such tenant is not obligated to continue to pay full, unabated rent under such tenant’s Lease, or (iii) February 6, 2027; except (a) any Lease Trigger Period arising under clause (i) or (ii) will be suspended for so long as the DSCR is at least 1.75x (excluding rents from the applicable Occupancy Reserve Tenant and any other tenants that are the subject of a bankruptcy action, have gone-dark in more than 25% of their premises or vacated their respective premises, have given notice of their intent not to renew their respective leases or have leases that are expiring within twelve months of the applicable date of determination), and (b) any Lease Trigger Period arising under clause (iii)(C) will be suspended if the Occupancy Reserve Tenant that triggered the applicable Lease Trigger Period is operating in at least 50% of its premises and the balance of available funds in the Occupancy Reserve is at least equal to $35 PSF for the aggregate total square feet demised under such tenant’s lease.
During the continuance of a Lease Trigger Period, the excess cash flow will be held by the lender in an “Occupancy Reserve” and disbursed to the CrossPoint Borrower for (a) approved leasing expenses incurred in connection with the re-tenanting of the Verizon and/or Kronos premises, as applicable, (b) approved leasing expenses incurred with respect to other vacant premises at the CrossPoint Property if funds then on deposit in the rollover reserve are insufficient, and/or (c) approved capital expenditures incurred if funds then on deposit in the replacement reserve are insufficient. During the continuance of a Cash Management period triggered by an event of default, all excess funds will be retained by lender as additional collateral for the CrossPoint Whole Loan.
In order to suspend a Cash Management Period occurring due to a DSCR Trigger, the CrossPoint Borrower may pay to lender an amount reasonably determined by the lender that, if used to prepay the CrossPoint Whole Loan, would result in the DSCR being equal to 1.50x.
Partial Release:The CrossPoint Borrower may obtain the release a one acre parcel on the CrossPoint Property that includes a vacant one-story 13,700 SF (1% of NRA) building located on the northeast corner of the CrossPoint Property, upon, among other things, the delivery of defeasance collateral in an amount equal to $1,440,000. See “Description of the Mortgage Pool—Mortgage Pool Characteristics-Releases; Partial Releases” in the Preliminary Prospectus.
Additional Secured Indebtedness (not including trade debts).None.
Mezzanine Loan and Preferred Equity.Not permitted.
Environmental Guarantor.The CrossPoint Whole Loan documents do not provide for recourse to the related guarantor for breaches of the environmental covenants. Environmental insurance was obtained in lieu of an environmental guarantor. See “Description of the Mortgage Pool—Environmental Considerations” and “—Non-Recourse Carveout Limitations” in the Preliminary Prospectus
Terrorism Insurance. The CrossPoint Borrower is required to obtain insurance against acts of terrorism for loss resulting from perils and acts of terrorism in amounts and with terms and conditions applicable to commercial property, general liability, business income and umbrella liability insurance required pursuant to the CrossPoint Whole Loan documents.
THE INFORMATION IN THIS COLLATERAL TERM SHEET IS NOT COMPLETE AND MAY BE AMENDED PRIOR TO THE TIME OF SALE. THIS TERM SHEET IS NOT AN OFFER TO SELL THESE SECURITIES AND IT IS NOT A SOLICITATION OF AN OFFER TO BUY THESE SECURITIES IN ANY JURISDICTION WHERE THE OFFER OR SALE IS NOT PERMITTED.
40
(THIS PAGE INTENTIONALLY LEFT BLANK)
41
1800 North Mason Road Katy, TX 77449 | Collateral Asset Summary – Loan No. 4 Houston Distribution Center | Cut-off Date Balance: Cut-off Date LTV Ratio: UW NCF DSCR: UW NOI Debt Yield: | $49,000,000 58.3% 1.44x 10.6% |
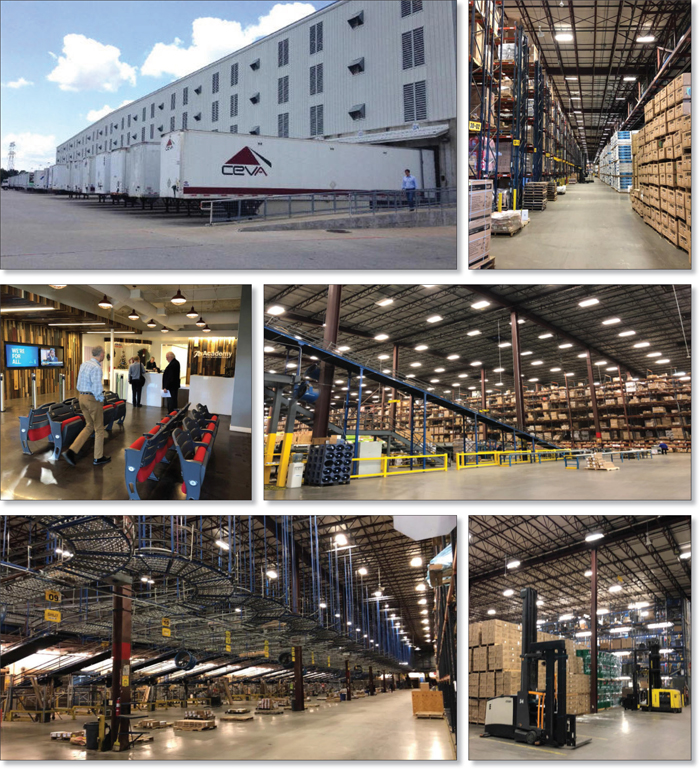
THE INFORMATION IN THIS COLLATERAL TERM SHEET IS NOT COMPLETE AND MAY BE AMENDED PRIOR TO THE TIME OF SALE. THIS TERM SHEET IS NOT AN OFFER TO SELL THESE SECURITIES AND IT IS NOT A SOLICITATION OF AN OFFER TO BUY THESE SECURITIES IN ANY JURISDICTION WHERE THE OFFER OR SALE IS NOT PERMITTED.
42
1800 North Mason Road Katy, TX 77449 | Collateral Asset Summary – Loan No. 4 Houston Distribution Center | Cut-off Date Balance: Cut-off Date LTV Ratio: UW NCF DSCR: UW NOI Debt Yield: | $49,000,000 58.3% 1.44x 10.6% |

THE INFORMATION IN THIS COLLATERAL TERM SHEET IS NOT COMPLETE AND MAY BE AMENDED PRIOR TO THE TIME OF SALE. THIS TERM SHEET IS NOT AN OFFER TO SELL THESE SECURITIES AND IT IS NOT A SOLICITATION OF AN OFFER TO BUY THESE SECURITIES IN ANY JURISDICTION WHERE THE OFFER OR SALE IS NOT PERMITTED.
43
1800 North Mason Road Katy, TX 77449 | Collateral Asset Summary – Loan No. 4 Houston Distribution Center | Cut-off Date Balance: Cut-off Date LTV Ratio: UW NCF DSCR: UW NOI Debt Yield: | $49,000,000 58.3% 1.44x 10.6% |
| Mortgage Loan Information | Property Information | |||||||
| Mortgage Loan Seller: | Société Générale | Single Asset/Portfolio: | Single Asset | |||||
| Original Balance(1): | $49,000,000 | Location: | Katy, TX 77449 | |||||
| Cut-off Date Balance(1): | $49,000,000 | General Property Type: | Industrial | |||||
| % of Initial Pool Balance: | 4.7% | Detailed Property Type: | Warehouse/Distribution | |||||
| Loan Purpose: | Recapitalization | Title Vesting: | Fee | |||||
| Borrower Sponsor: | Spirit Realty, L.P. | Year Built/Renovated: | 1973, 2000-2005/N/A | |||||
| Mortgage Rate: | 5.1410% | Size: | 1,500,596 SF | |||||
| Note Date: | 1/22/2018 | Cut-off Date Balance per SF(1): | $56 | |||||
| First Payment Date: | 3/1/2018 | Maturity Date Balance per SF(1): | $46 | |||||
| Maturity Date: | 2/1/2028 | Property Manager: | Self-Managed | |||||
| Original Term to Maturity: | 120 months | |||||||
| Original Amortization Term: | 360 months | Underwriting and Financial Information | ||||||
| IO Period: | 0 months | UW NOI: | $8,867,565 | |||||
| Seasoning: | 0 months | UW NOI Debt Yield(1): | 10.6% | |||||
| Prepayment Provisions: | LO (24); YM1 (92); O (4) | UW NOI Debt Yield at Maturity(1): | 12.8% | |||||
| Lockbox/Cash Mgmt Status: | Hard/Springing | UW NCF DSCR(1): | 1.44x | |||||
| Additional Debt Type(1): | Pari Passu | Most Recent NOI: | $9,160,273 (12/31/2017) | |||||
| Additional Debt Balance(1): | $35,000,000 | 2nd Most Recent NOI: | $9,016,467 (12/31/2016) | |||||
| Future Debt Permitted (Type): | No (N/A) | 3rd Most Recent NOI: | $8,901,505 (12/31/2015) | |||||
| Reserves(2) | Most Recent Occupancy: | 100.0% (2/1/2018) | ||||||
| Type | Initial | Monthly | Cap | 2nd Most Recent Occupancy: | 100.0% (12/31/2016) | |||
| RE Tax: | $0 | Springing | N/A | 3rd Most Recent Occupancy: | 100.0% (12/31/2015) | |||
| Insurance: | $0 | Springing | N/A | Appraised Value (as of)(3): | $144,000,000 (10/17/2017) | |||
| TI/LC: | $0 | $50,020 | N/A | Cut-off Date LTV Ratio(1)(3): | 58.3% | |||
| Replacements: | $0 | $31,262 | N/A | Maturity Date LTV Ratio(1)(3): | 48.2% | |||
| Sources and Uses(4) | ||||||
| Sources | Proceeds | % of Total | Uses | Proceeds | % of Total | |
| Loan Amount(1): | $84,000,000 | 100.0% | Recapitalization: | $83,131,776 | 99.0% | |
| Closing Costs: | $868,224 | 1.0% | ||||
| Total Sources: | $84,000,000 | 100.0% | Total Uses: | $84,000,000 | 100.0% | |
| (1) | The original principal balance represents a portion of the Houston Distribution Center Whole Loan (as defined below), which is comprised of threepari passupromissory notes with an aggregate original principal balance of $84,000,000. The Cut-off Date Balance per Unit, Maturity Date Balance per Unit, UW NOI Debt Yield, UW NOI Debt Yield at Maturity, UW NCF DSCR, Cut-off Date LTV Ratio and Maturity Date LTV Ratio presented above are based on the aggregate principal balance of the Houston Distribution Center Whole Loan. |
| (2) | See“Escrows and Reserves”below for further discussion of reserve requirements. |
| (3) | The appraisal concluded a hypothetical “dark value” of $96,000,000 for the Houston Distribution Center Property. The Cut-off Date LTV Ratio and Maturity Date LTV Ratio based on the hypothetical “dark value” are 87.5% and 72.2%, respectively. |
| (4) | The Houston Distribution Center Property was unencumbered prior to the funding of the Houston Distribution Center Whole Loan. |
The Mortgage Loan. The fourth largest mortgage loan (the “Houston Distribution Center Mortgage Loan”) is part of a whole loan (the “Houston Distribution Center Whole Loan”) evidenced by threepari passu promissory notes with an aggregate original principal amount of $84,000,000. The Houston Distribution Center Whole Loan is secured by the fee interest in a 1,500,596 SF industrial warehouse and distribution center property located in Katy, Texas (the “Houston Distribution Center Property”). Promissory Note A-1 and Note A-2, with an aggregate original principal balance of $49,000,000, represents the Houston Distribution Center Mortgage Loan and will be included in the UBS 2018-C8 Trust. The remainingpari passunote, with an original principal balance of $35,000,000 (collectively, the “Houston Distribution Center Pari Passu Companion Loan”), is currently held by Barclays Bank PLC, or affiliates thereof, and are expected to be contributed to one or more future securitization transactions. The Houston Distribution Center Whole Loan will be serviced pursuant to the pooling and servicing agreement for the UBS 2018-C8 Trust. See “Description of the Mortgage Pool—The Whole Loans—The Serviced Pari Passu Whole Loans” and “Pooling and Servicing Agreement” in the Preliminary Prospectus.
| Houston Distribution Center Whole Loan Summary | ||||
| Note | Original Balance | Cut-off Date Balance | Anticipated Note Holder | Controlling Piece |
| Note A-1 | $35,000,000 | $35,000,000 | UBS 2018-C8 | Yes |
| Note A-2 | $14,000,000 | $14,000,000 | UBS 2018-C8 | No |
| Note A-3 | $35,000,000 | $35,000,000 | Barclays Bank PLC | No |
| Total | $84,000,000 | $84,000,000 | ||
THE INFORMATION IN THIS COLLATERAL TERM SHEET IS NOT COMPLETE AND MAY BE AMENDED PRIOR TO THE TIME OF SALE. THIS TERM SHEET IS NOT AN OFFER TO SELL THESE SECURITIES AND IT IS NOT A SOLICITATION OF AN OFFER TO BUY THESE SECURITIES IN ANY JURISDICTION WHERE THE OFFER OR SALE IS NOT PERMITTED.
44
1800 North Mason Road Katy, TX 77449 | Collateral Asset Summary – Loan No. 4 Houston Distribution Center | Cut-off Date Balance: Cut-off Date LTV Ratio: UW NCF DSCR: UW NOI Debt Yield: | $49,000,000 58.3% 1.44x 10.6% |
The Borrower and the Borrower Sponsor. The borrower is Spirit AS Katy TX, LP (the “Houston Distribution Center Borrower”), a single-purpose Delaware limited partnership. The Houston Distribution Center Borrower is managed and majority owned by Spirit Realty Capital, Inc. (“Spirit”) (NYSE: SRC), a REIT primarily investing in real estate subject to long term, net leases. As of September 30, 2017, Spirit's gross investment in real estate properties and loans totaled approximately $8.0 billion, representing investments in 2,423 properties which were 99.1% occupied and leased to 421 tenants operating in 30 different industries across 49 states with only one state, Texas, accounting for more than 10% of Spirit's real estate investment portfolio rental revenue. Spirit has recently announced that it plans to transfer its ownership interest in the Houston Distribution Center Property to its newly formed Spirit Master Trust Agreement REIT ("SMTA"). The transfer is expected to occur in the first half of 2018. SMTA will have approximately $2.7 billion in assets under management comprised of over 925 properties.
The Property. The Houston Distribution Center Property is a 1,500,596 SF single-tenant, industrial warehouse/distribution facility located on a 93.5-acre site in Katy, Texas. The Houston Distribution Center Property consists of four buildings, two of which, were constructed in 1973 and comprise 35.5% of the total Houston Distribution Center Property. The last two buildings to be constructed were developed by the tenant, Academy Sports, between 2000 and 2005 and comprise approximately 64.5% of the total Houston Distribution Center Property. The Houston Distribution Center Property is comprised of 1,425,596 SF of industrial warehouse (95.0% of NRA) and 75,000 SF of office space (5.0% of NRA).
As of February 1, 2018, the Houston Distribution Center Property was 100.0% leased to Academy Sports, which utilizes the Houston Distribution Center Property as its primary distribution center and office space for merchandising and e-commerce employees. The Houston Distribution Center Property is located immediately north of Academy Sports’ approximately 220,000 SF corporate headquarters. The Houston Distribution Property houses 1,300 Academy Sports employees, and services 45% of its retail locations nationwide. Academy Sports has been at the Houston Distribution Center Property since 1990 and has invested $15.0 million in the space, including developing more than 975,000 SF of expansion space and building out extensive racking systems, conveyor belts, and other distribution technology.
The Houston Distribution Center Property features 31 - 50 foot clear ceiling heights and 247 dock high loading doors, some of which have built-up concrete ramps that permit drive-in access. There are 967 parking spaces, resulting in a parking ratio of 0.6 spaces per 1,000 SF of NRA. Academy Sports’ NNN lease at the Houston Distribution Center Property runs through January 31, 2027.
Major Tenants.
Academy Sports (1,500,596 SF, 100.0% of NRA, 100.0% of underwritten base rent).Founded in 1938 by Max Gochman, Academy Sports offers a merchandise mix that extends beyond traditional sporting goods merchandise, carrying an extensive line of name-brands across clothing, shoes, and equipment for competitive sports, physical fitness training, and outdoor recreational activities such as camping, hunting, fishing, and boating. In addition to nationally recognized brand labels, Academy Sports offers a variety of products through a private label including licensed products for apparel, footwear, barbecue equipment and outdoor equipment. Academy Sports generates annual sales exceeding $4.7 billion from its 230 stores across 16 states. Academy Sports employs in excess of 23,000 people throughout the south, southeast and midwest United States. Kohlberg Kravis Roberts & Co L.P. (“KKR”) acquired Academy Sports in 2011.
Academy Sports has occupied 100% of the Houston Distribution Center Property since 1990. Academy Sports commenced its current lease on January 18, 2007 for a 20-year term through January 31, 2027, and has eight five-year renewal options remaining with no termination options.
The following table presents certain information relating to the leases at the Houston Distribution Center Property:
| Tenant Summary(1) | |||||||
| Tenant Name | Credit Rating (Fitch/Moody's/S&P) | Tenant SF | Approximate % of SF | Annual UW Rent | % of Total Annual UW Rent | Annual UW Rent PSF(3) | Lease Expiration |
| Academy Sports | NR/NR/NR | 1,500,596 | 100.0% | $9,348,713 | 100.0% | $6.23 | 1/31/2027 |
| Subtotal/Wtd. Avg. | 1,500,596 | 100.0% | $9,348,713 | 100.0% | $6.23 | ||
| Vacant Space | 0 | 0.0% | $0 | 0.0% | $0.00 | ||
| Total/Wtd. Avg. | 1,500,596 | 100.0% | $9,348,713 | 100.0% | $6.23 | ||
| (1) | Information is based on the underwritten rent roll. |
THE INFORMATION IN THIS COLLATERAL TERM SHEET IS NOT COMPLETE AND MAY BE AMENDED PRIOR TO THE TIME OF SALE. THIS TERM SHEET IS NOT AN OFFER TO SELL THESE SECURITIES AND IT IS NOT A SOLICITATION OF AN OFFER TO BUY THESE SECURITIES IN ANY JURISDICTION WHERE THE OFFER OR SALE IS NOT PERMITTED.
45
1800 North Mason Road Katy, TX 77449 | Collateral Asset Summary – Loan No. 4 Houston Distribution Center | Cut-off Date Balance: Cut-off Date LTV Ratio: UW NCF DSCR: UW NOI Debt Yield: | $49,000,000 58.3% 1.44x 10.6% |
The following table presents certain information relating to the lease rollover schedule at the Houston Distribution Center Property:
| Lease Rollover Schedule(1) | ||||||||
| Year | # of Leases Rolling | SF Rolling | Approx. % of Total SF Rolling | Approx. Cumulative % of SF Rolling | UW Base Rent PSF Rolling | Total UW Base Rent Rolling | Approx. % of Total Rent Rolling | Approx. Cumulative % of Total Rent Rolling |
| MTM | 0 | 0 | 0.0% | 0.0% | $0.00 | $0 | 0.0% | 0.0% |
| 2018 | 0 | 0 | 0.0% | 0.0% | $0.00 | $0 | 0.0% | 0.0% |
| 2019 | 0 | 0 | 0.0% | 0.0% | $0.00 | $0 | 0.0% | 0.0% |
| 2020 | 0 | 0 | 0.0% | 0.0% | $0.00 | $0 | 0.0% | 0.0% |
| 2021 | 0 | 0 | 0.0% | 0.0% | $0.00 | $0 | 0.0% | 0.0% |
| 2022 | 0 | 0 | 0.0% | 0.0% | $0.00 | $0 | 0.0% | 0.0% |
| 2023 | 0 | 0 | 0.0% | 0.0% | $0.00 | $0 | 0.0% | 0.0% |
| 2024 | 0 | 0 | 0.0% | 0.0% | $0.00 | $0 | 0.0% | 0.0% |
| 2025 | 0 | 0 | 0.0% | 0.0% | $0.00 | $0 | 0.0% | 0.0% |
| 2026 | 0 | 0 | 0.0% | 0.0% | $0.00 | $0 | 0.0% | 0.0% |
| 2027 | 1 | 1,500,596 | 100.0% | 100.0% | $6.23 | $9,348,713 | 100.0% | 100.0% |
| 2028 & Beyond | 0 | 0 | 0.0% | 100.0% | $0.00 | $0 | 0.0% | 100.0% |
| Vacant | 0 | 0 | 0.0% | 100.0% | $0.00 | $0 | 0.0% | 100.0% |
| Total/Wtd. Avg. | 1 | 1,500,596 | 100.0% | $6.23 | $9,348,713 | 100.0% | ||
| (1) | Information is based on the underwritten rent roll. |
The Market.The Houston Distribution Center Property is located at 1800 North Mason Road in Katy, Texas, approximately 20 miles west of the Houston central business district. Primary regional access to the Houston Distribution Center Property's neighborhood is provided by Interstate 10, located approximately one mile south, and provides east and west access to and from Houston.
According to the appraisal, the Houston Distribution Center Property's neighborhood consists of a variety of commercial and residential land uses. The immediate area surrounding the Houston Distribution Center Property is a relatively new area, consisting primarily of residential uses built in the 1990’s to the present. According to a third party market research provider, the median home value within a three-mile radius is about $148,028.
The Houston Distribution Center Property is located in Katy, Texas within the Houston- The Woodlands-Sugar Land, Texas metropolitan statistical area (the “Houston MSA”). Moody’s Economy.com reports that the Houston MSA had a population of approximately 6.9 million as of August 2017, which represents a 1.9% increase over 2016. According to a third party market research report, the estimated 2017 population within a one-, three- and five-mile radius of the Houston Distribution Center Property is 13,077, 119,179 and 257,478, respectively. The estimated 2017 average household income within a one-, three- and five-mile radius of the Houston Distribution Center Property is $88,085, $94,176 and $111,168, respectively.
According to a third party market research report, the Houston Distribution Center Property is located within the Northwest Industrial Submarket. The existing inventory as of the second quarter 2017 was 146,074,764 SF with a vacancy rate of 4.9% and asking rent of $7.44 PSF.
The following table presents recent leasing data at competitive office buildings with respect to the Houston Distribution Center Property:
| Comparable Industrial Leases | |||||||
| Property Name | Location | Distance to subject (miles) | Lease Size (SF) | Occupancy % | Clear Height | Initial Rent PSF | Lease Type |
| Houston Distribution Center Property | Katy, TX | - | 1,500,596(1) | 100.0% | 31-50 ft. | $6.23(1) | NNN |
| Ellington Trade Center | Houston, TX | 47.3 | 513,800 | 99.0% | 24 ft. | $6.50 | NNN |
| Amazon Schertz Fulfillment Center | Schertz, TX | 162.7 | 1,262,294 | 100.0% | 32 ft. | $5.04 | NNN |
| Amazon Fulfillment Center – San Marcos | San Marcos, TX | 147.3 | 855,000 | 100.0% | 41 ft. | $6.25 | NNN |
| Claymoore I & II | Houston, TX | 15.9 | 742,250 | 93.0% | 24 ft. | $5.50 | NNN |
| Bayou Bend Business Park | Houston, TX | 25.3 | 378,380 | 100.0% | 24 ft. | $3.55 | NNN |
Source:Appraisal
| (1) | Information is based on the underwritten rent roll. |
THE INFORMATION IN THIS COLLATERAL TERM SHEET IS NOT COMPLETE AND MAY BE AMENDED PRIOR TO THE TIME OF SALE. THIS TERM SHEET IS NOT AN OFFER TO SELL THESE SECURITIES AND IT IS NOT A SOLICITATION OF AN OFFER TO BUY THESE SECURITIES IN ANY JURISDICTION WHERE THE OFFER OR SALE IS NOT PERMITTED.
46
1800 North Mason Road Katy, TX 77449 | Collateral Asset Summary – Loan No. 4 Houston Distribution Center | Cut-off Date Balance: Cut-off Date LTV Ratio: UW NCF DSCR: UW NOI Debt Yield: | $49,000,000 58.3% 1.44x 10.6% |
Operating History and Underwritten Net Cash Flow.The following table presents certain information relating to the historical operating performance and the Underwritten Net Cash Flow at the Houston Distribution Center Property:
| Cash Flow Analysis | |||||
| 2015 | 2016 | 2017 | UW | UW PSF | |
| Gross Potential Rent(1) | $8,924,229 | $9,058,093 | $9,193,964 | $9,348,713 | $6.23 |
| Total Recoveries(2) | $0 | $0 | $0 | $274,255 | $0.18 |
| Total Other Income | $0 | $0 | $0 | $0 | $0.00 |
| Less Vacancy & Credit Loss(3) | $0 | $0 | $0 | ($481,148) | ($0.32) |
| Effective Gross Income | $8,924,229 | $9,058,093 | $9,193,964 | $9,141,820 | $6.09 |
| Total Operating Expenses(2) | $22,724 | $41,626 | $33,691 | $274,255 | $0.18 |
| Net Operating Income | $8,901,505 | $9,016,467 | $9,160,273 | $8,867,565 | $5.91 |
| Capital Expenditures | $0 | $0 | $0 | $375,149 | $0.25 |
| TI/LC | $0 | $0 | $0 | $600,238 | $0.40 |
| Net Cash Flow | $8,901,505 | $9,016,467 | $9,160,273 | $7,892,178 | $5.26 |
| Occupancy % | 100.0% | 100.0% | 100.0% | 100.0% | |
| NOI DSCR(4) | 1.62x | 1.64x | 1.67x | 1.61x | |
| NCF DSCR(4) | 1.62x | 1.64x | 1.67x | 1.44x | |
| NOI Debt Yield(4) | 10.6% | 10.7% | 10.9% | 10.6% | |
| NCF Debt Yield(4) | 10.6% | 10.7% | 10.9% | 9.4% | |
| (1) | UW Gross Potential Rent has been underwritten based on the underwritten rent roll, and includes the annual rent step for 2018 of 1.6% or $143,417. |
| (2) | The Academy Sports lease is absolute net and all expenses are paid directly by the tenant. UW Total Recoveries is a pass-through adjustment to offset the 3.0% underwritten management fee. |
| (3) | The Houston Distribution Center Property is 100.0% occupied as of February 1, 2018. However, vacancy was underwritten to 5.0%. |
| (4) | Debt service coverage ratios and debt yields are based on the Houston Distribution Center Whole Loan. |
Escrows and Reserves.Due to the single tenant at the Houston Distribution Center Property (or such other tenant leasing all or a portion of the Houston Distribution Center (“Replacement Tenant”) under a lease approved by the lender pursuant to the Houston Distribution Center Whole Loan documents (“Replacement Lease”)) being responsible for the payment of real estate taxes under the lease, monthly collections of real estate taxes are waived, provided that (a) no event of default has occurred and is continuing, (b) Academy Sports (or Replacement Tenant under a Replacement Lease) is in occupancy of the Houston Distribution Center Property and is required by the terms of the Academy Sports lease (or Replacement Lease) to pay all real estate taxes and other charges directly to the applicable taxing authorities and actually does pay such real estate taxes and other charges directly to the applicable taxing authorities, (c) the Houston Distribution Center Borrower has provided written evidence acceptable to the lender that all the real estate taxes and other charges for the applicable tax parcels have been paid in full prior to the date such payment is due, and (d) the Academy Sports lease (or Replacement Lease) is in full force and effect. Monthly escrows of insurance premiums are waived, provided that (a) no event of default has occurred and is continuing, and (b) the Houston Distribution Center Borrower has provided the lender with reasonably satisfactory evidence (as determined by the lender) that the Houston Distribution Center Property is insured in accordance with the Houston Distribution Center Whole Loan documents pursuant to a blanket insurance policy reasonably acceptable to lender. The Houston Distribution Center Whole Loan documents also provide for on-going monthly replacement reserves and tenant improvement and leasing commissions in an amount equal to approximately $31,262 and $50,020, respectively.
Lockbox and Cash Management. The Houston Distribution Center Whole Loan has a hard lockbox with springing cash management upon the occurrence and continuance of a Cash Sweep Period (as defined below).
A “Cash Sweep Period” will commence upon the occurrence of (i) the maturity date, (ii) an event of default, (iii) if, as of the last day of the calendar quarter, the debt service coverage ratio is less than 1.20x or (iv) the commencement of a Tenant Trigger Period (as defined below); and will end if (A) the Houston Distribution Center Whole Loan has been repaid in full, (B) the maturity date has not occurred and (C) (x) with respect to the matters described in clause (ii) above, such event of default has been cured and no other event of default has occurred and is continuing, (y) with respect to the matter described in clause (iii) above, lender has determined that the Houston Distribution Center Property has achieved a debt service coverage ratio of at least 1.20x for two consecutive calendar quarters or (z) with respect to the matter described in clause (iv) above, such Tenant Trigger Period has ended.
A “Tenant Trigger Period” will commence upon (i) the date that is 12 months prior to the end of the term of any Major Lease (as defined below) (including any renewal terms), or (ii) the date required under a Major Lease by which the applicable Major Tenant (as defined below) is required to give notice of its exercise of a renewal option thereunder (and such renewal has not been so exercised); or (iii) the date any Major Lease being surrendered, cancelled or terminated prior to its then current expiration date; or (iv) the date any Major Tenant discontinues its business at its premises (i.e.,“goes dark”) or gives notice that it intends to discontinue its business; or (v) the occurrence and continuance (beyond any applicable notice and cure periods) of a default under any Major Lease by the applicable Major Tenant thereunder; or (vi) the occurrence of a bankruptcy action with respect to a Major Tenant. A Tenant Trigger Period will end upon the earlier to occur of (x) the reasonable determination by the lender that sufficient funds have been accumulated in the special rollover reserve account to pay for all anticipated expenses in connection with the re-leasing of the space under the applicable Major Lease that gave rise to the subject Tenant Trigger Period, including brokerage commissions and tenant improvements, and any anticipated shortfalls of payments required hereunder during any period of time that rents are insufficient as a result of down-time or free rent periods, or (y) the occurrence of any of the following: (1) with respect to a Tenant Trigger Period caused by a matter described in clauses (i), (ii), (iii) or (iv) above, upon the earlier to occur of (A) the date on which the subject Major Tenant irrevocably exercises its renewal or extension option (or otherwise enters into an extension agreement with the Houston Distribution Center Borrower and reasonably acceptable to lender) with respect to all of the space demised under its Major Lease, and in lender’s reasonable judgment, sufficient funds have been accumulated in the special rollover reserve account (during the continuance of the subject Tenant Trigger Period) to pay for all anticipated approved major lease leasing expenses for such Major Lease and any other anticipated expenses in connection with such
THE INFORMATION IN THIS COLLATERAL TERM SHEET IS NOT COMPLETE AND MAY BE AMENDED PRIOR TO THE TIME OF SALE. THIS TERM SHEET IS NOT AN OFFER TO SELL THESE SECURITIES AND IT IS NOT A SOLICITATION OF AN OFFER TO BUY THESE SECURITIES IN ANY JURISDICTION WHERE THE OFFER OR SALE IS NOT PERMITTED.
47
1800 North Mason Road Katy, TX 77449 | Collateral Asset Summary – Loan No. 4 Houston Distribution Center | Cut-off Date Balance: Cut-off Date LTV Ratio: UW NCF DSCR: UW NOI Debt Yield: | $49,000,000 58.3% 1.44x 10.6% |
renewal or extension, or (B) the date on which all of the space demised under the subject Major Lease that gave rise to the subject Tenant Trigger Period has been fully leased pursuant to a replacement lease or replacement leases approved by the lender, and entered into in accordance with the Houston Distribution Center Whole Loan documents, and all approved Major Lease leasing expenses (and any other expenses in connection with the re-tenanting of such space) have been paid in full; (2) with respect to a Tenant Trigger Period caused by a matter described in clause (v) above, if the subject Major Tenant default has been cured, and no other Major Tenant default has occurred for a period of six consecutive months following such cure; or (3) with respect to a Tenant Trigger Period caused by a matter described in clause (vi) above, if the applicable Major Tenant bankruptcy action has terminated and the applicable Major Lease has been affirmed, assumed or assigned in a manner reasonably satisfactory to the lender.
A “Major Lease” means the Academy Sports lease, and any other lease which, together with all other leases to the same tenant or its affiliates, demises twenty-percent or more of the rentable square feet of the Houston Distribution Center Property.
A “Major Tenant” means any tenant under either a Major Lease, or under one or more leases (leased by such tenant and/or its affiliates), which when taken together cover in the aggregate twenty-percent or more of the rentable square feet of the Houston Distribution Center Property.
Right of First Refusal. Academy Sports has a right of first refusal to purchase the Houston Distribution Center Property in the event that the Houston Distribution Center Borrower receives a bona fide offer from a third party to purchase the Houston Distribution Center Property. In such event, the Houston Distribution Center Borrower will extend the right of first refusal to purchase the Houston Distribution Center Property on the terms of such offer. Academy Sports right of first refusal is fully subordinated to the Houston Distribution Center Whole Loan and does not apply to foreclosure or deed-in-lieu thereof.
Additional Secured Indebtedness (not including trade debts).Not permitted.
Mezzanine Loan and Preferred Equity. Not permitted.
Release of Property. Not permitted.
Terrorism Insurance. The Houston Distribution Center Borrower is required to obtain and maintain or cause to be obtained and maintained property insurance, commercial general liability insurance, and business income or rental loss insurance that covers perils of terrorism and acts of terrorism, both foreign and domestic.
THE INFORMATION IN THIS COLLATERAL TERM SHEET IS NOT COMPLETE AND MAY BE AMENDED PRIOR TO THE TIME OF SALE. THIS TERM SHEET IS NOT AN OFFER TO SELL THESE SECURITIES AND IT IS NOT A SOLICITATION OF AN OFFER TO BUY THESE SECURITIES IN ANY JURISDICTION WHERE THE OFFER OR SALE IS NOT PERMITTED.
48
(THIS PAGE INTENTIONALLY LEFT BLANK)
49
5425 South Padre Island Corpus Christi, TX 78411 | Collateral Asset Summary – Loan No. 5 Moore Plaza | Cut-off Date Balance: Cut-off Date LTV Ratio: UW NCF DSCR: UW NOI Debt Yield: | $47,500,000 60.2% 2.27x 11.4% |
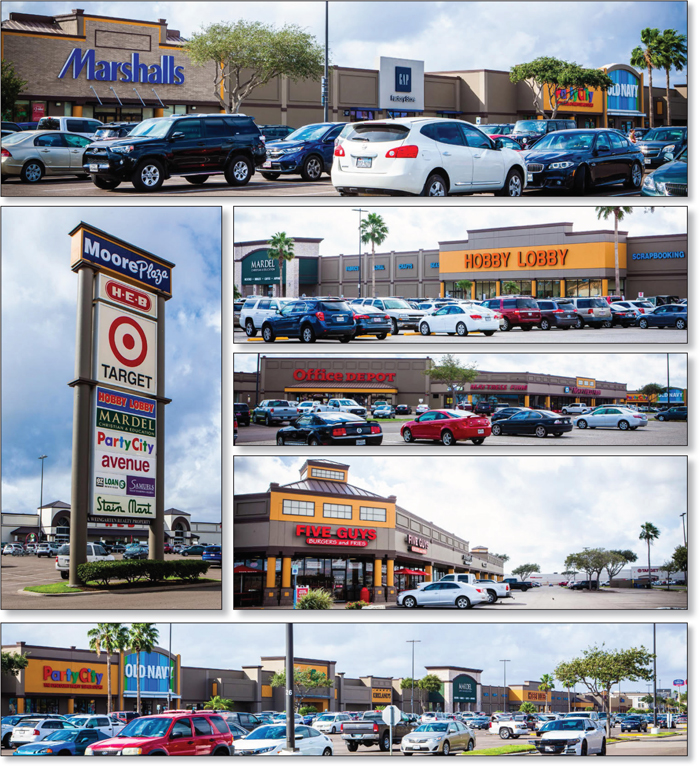
THE INFORMATION IN THIS COLLATERAL TERM SHEET IS NOT COMPLETE AND MAY BE AMENDED PRIOR TO THE TIME OF SALE. THIS TERM SHEET IS NOT AN OFFER TO SELL THESE SECURITIES AND IT IS NOT A SOLICITATION OF AN OFFER TO BUY THESE SECURITIES IN ANY JURISDICTION WHERE THE OFFER OR SALE IS NOT PERMITTED.
50
5425 South Padre Island Corpus Christi, TX 78411 | Collateral Asset Summary – Loan No. 5 Moore Plaza | Cut-off Date Balance: Cut-off Date LTV Ratio: UW NCF DSCR: UW NOI Debt Yield: | $47,500,000 60.2% 2.27x 11.4% |
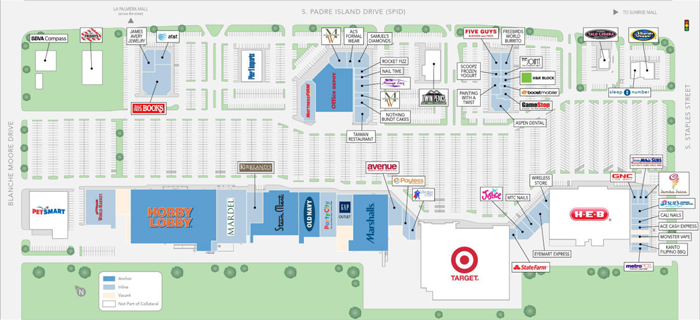
THE INFORMATION IN THIS COLLATERAL TERM SHEET IS NOT COMPLETE AND MAY BE AMENDED PRIOR TO THE TIME OF SALE. THIS TERM SHEET IS NOT AN OFFER TO SELL THESE SECURITIES AND IT IS NOT A SOLICITATION OF AN OFFER TO BUY THESE SECURITIES IN ANY JURISDICTION WHERE THE OFFER OR SALE IS NOT PERMITTED.
51
5425 South Padre Island Corpus Christi, TX 78411 | Collateral Asset Summary – Loan No. 5 Moore Plaza | Cut-off Date Balance: Cut-off Date LTV Ratio: UW NCF DSCR: UW NOI Debt Yield: | $47,500,000 60.2% 2.27x 11.4% |

THE INFORMATION IN THIS COLLATERAL TERM SHEET IS NOT COMPLETE AND MAY BE AMENDED PRIOR TO THE TIME OF SALE. THIS TERM SHEET IS NOT AN OFFER TO SELL THESE SECURITIES AND IT IS NOT A SOLICITATION OF AN OFFER TO BUY THESE SECURITIES IN ANY JURISDICTION WHERE THE OFFER OR SALE IS NOT PERMITTED.
52
5425 South Padre Island Corpus Christi, TX 78411 | Collateral Asset Summary – Loan No. 5 Moore Plaza | Cut-off Date Balance: Cut-off Date LTV Ratio: UW NCF DSCR: UW NOI Debt Yield: | $47,500,000 60.2% 2.27x 11.4% |
| Mortgage Loan Information | Mortgaged Property Information | ||||||
| Mortgage Loan Seller: | Rialto Mortgage Finance, LLC | Single Asset/Portfolio: | Single Asset | ||||
| Original Balance: | $47,500,000 | Location: | Corpus Christi, TX 78411 | ||||
| Cut-off Date Balance: | $47,500,000 | General Property Type: | Retail | ||||
| % of Initial Pool Balance: | 4.5% | Detailed Property Type: | Anchored | ||||
| Loan Purpose: | Acquisition | Title Vesting: | Fee | ||||
| Borrower Sponsor: | J. Kenneth Dunn | Year Built/Renovated: | 1989 / 2017 | ||||
| Mortgage Rate: | 4.5300% | Size: | 377,261 SF | ||||
| Note Date: | 1/18/2018 | Cut-off Date Balance per SF: | $126 | ||||
| First Payment Date: | 3/6/2018 | Maturity Date Balance per SF: | $126 | ||||
| Maturity Date: | 2/6/2028 | Property Manager: | Rainer Realty Management, LLC | ||||
| Original Term to Maturity | 120 months | (borrower-affiliated) | |||||
| Original Amortization Term: | 0 months | ||||||
| IO Period: | 120 months | ||||||
| Seasoning: | 0 month | Underwriting and Financial Information | |||||
| Prepayment Provisions: | LO (24); DEF (92); O (4) | UW NOI: | $5,404,604 | ||||
| Lockbox/Cash Mgmt Status: | Springing/Springing | UW NOI Debt Yield: | 11.4% | ||||
| Additional Debt Type: | N/A | UW NOI Debt Yield at Maturity: | 11.4% | ||||
| Additional Debt Balance: | N/A | UW NCF DSCR: | 2.27x | ||||
| Future Debt Permitted (Type): | No (N/A) | Most Recent NOI: | $5,551,028 (10/31/2017 TTM) | ||||
| Reserves(1) | 2nd Most Recent NOI: | $5,359,919 (12/31/2016) | |||||
| Type | Initial | Monthly | Cap | 3rd Most Recent NOI: | $5,142,268 (12/31/2015) | ||
| RE Tax: | $145,269 | $69,176 | N/A | Most Recent Occupancy: | 97.0% (1/4/2018) | ||
| Insurance: | $14,780 | $14,076 | N/A | 2nd Most Recent Occupancy: | 98.8% (12/31/2016) | ||
| Replacements: | $0 | $5,659 | N/A | 3rd Most Recent Occupancy: | 98.6% (12/31/2015) | ||
| TI/LC: | $1,000,000 | Springing | $1,500,000 | Appraised Value (as of): | $78,900,000 (11/17/2017) | ||
| Deferred Maintenance: | $5,679 | $0 | N/A | Cut-off Date LTV Ratio: | 60.2% | ||
| Environmental Remediation: | $3,000 | (1) | N/A | Maturity Date LTV Ratio: | 60.2% | ||
Sources and Uses
| |||||||
| Sources | Proceeds | % of Total | Uses | Proceeds | % of Total | ||
| Loan Amount: | $47,500,000 | 65.0% | Purchase Price: | $70,645,000 | 96.7% | ||
| Borrower Equity: | $25,544,399 | 35.0% | Closing Costs: | $1,230,672 | 1.7% | ||
| Reserves: | $1,168,727 | 1.6% | |||||
| Total Sources: | $73,044,399 | 100.0% | Total Uses: | $73,044,399 | 100.0% | ||
| (1) | See “Escrows and Reserves” below for further discussion of reserve requirements. |
The Mortgage Loan.The fifth largest mortgage loan (the “Moore Plaza Mortgage Loan”) is evidenced by a promissory note in the original principal amount of $47,500,000 secured by a first priority fee mortgage encumbering a 377,261 SF retail power center located in Corpus Christi, Texas (the “Moore Plaza Property”). The proceeds of the Moore Plaza Mortgage Loan were used to purchase the Moore Plaza Property, pay closing costs and fund upfront reserves.
The Borrower and the Borrower Sponsor. The borrower is Rainier Moore Plaza Acquisitions, LLC (the “Moore Plaza Borrower”), a Delaware limited liability company structured to be bankruptcy-remote. The Moore Plaza Borrower is managed by Rainier Moore Plaza Manager, LLC and is owned by Rainier Moore Plaza, LLC (100%, Sole Member). Rainier Moore Plaza, LLC is owned by CIL 2 REIT, LLC (49.5%, Member), Newport Moore Plaza LLC (30.2%, Member), and Rainier Moore Plaza Investors, LP (20.3%, Member). CIL 2 REIT, LLC is owned solely by CIL 2, LLC. CIL 2 LLC is owned by EMIRA Property Holdings Limited (South African Public REIT; 96.84%, Member) and Continuum Holdings Limited (Seychelles IBC; 3.16%, Member). Rainier Moore Plaza Investors, LP is owned by Individual HNW Investors (Limited Partners), and Rainier Moore Plaza Investors GP, LLC (General Partner). Rainier Moore Plaza Investors GP, LLC is managed by RRI GP, LLC, which is owned by its members, J. Kenneth Dunn, Timothy C. Nichols, Daniel S. Lovell, and Thomas B. Mock.
The non-recourse carveout guarantor of the Moore Plaza Mortgage Loan is J. Kenneth Dunn of Rainier Realty Investments, LP. Rainier Realty Investments, L.P. is an affiliate of The Rainier Companies (“Rainier”) in Dallas, Texas. Founded in 2003, Rainier has over $1.5 billion of investment assets under management for individual, corporate and institutional investment partners. Rainier’s portfolio includes multifamily, office, retail, medical office, hotel/lifestyle, and government building assets. Co-founders Tim Nichols and J. Kenneth Dunn have been investing together since 1996 and the principals at Rainier have more than one hundred years of collective experience in real estate acquisitions, financing and operations. Rainier targets value-add real estate investment opportunities with high-quality developers and operators on projects with a primary focus is in the southern United States.
THE INFORMATION IN THIS COLLATERAL TERM SHEET IS NOT COMPLETE AND MAY BE AMENDED PRIOR TO THE TIME OF SALE. THIS TERM SHEET IS NOT AN OFFER TO SELL THESE SECURITIES AND IT IS NOT A SOLICITATION OF AN OFFER TO BUY THESE SECURITIES IN ANY JURISDICTION WHERE THE OFFER OR SALE IS NOT PERMITTED.
53
5425 South Padre Island Corpus Christi, TX 78411 | Collateral Asset Summary – Loan No. 5 Moore Plaza | Cut-off Date Balance: Cut-off Date LTV Ratio: UW NCF DSCR: UW NOI Debt Yield: | $47,500,000 60.2% 2.27x 11.4% |
The Property.The Moore Plaza Property is a 377,261 SF anchored retail center located in Corpus Christi, within Nueces County, approximately 10 miles southeast of Corpus Christi central business district. The improvements consist of five multi-tenant, single-story buildings that were constructed in 1989. The Moore Plaza Property is situated on a 34.19-acre site with 1,790 surface parking spaces (approximately 4.74 per 1,000 SF). As of the January 4, 2018 rent roll, the Moore Plaza Property was 97.0% leased by a mix of 48 national, regional and local tenants. The Moore Plaza Property is anchored by Hobby Lobby and Mardel (101,760 SF), Marshall’s (32,228 SF), Stein Mart (28,157 SF), Office Depot (26,520 SF), Cost Plus World Market (17,340 SF), Old Navy (15,000 SF), and junior anchored by Half Price Books (12,321 SF) and Party City (12,000 SF). Additionally, the Moore Plaza Property is shadow-anchored by Target and H-E-B stores. The remaining tenant base is comprised of national, regional and local tenants, with no tenant occupying greater than 2.5% of the Moore Plaza Property’s net rentable area (“NRA”).
Major Tenants.
Hobby Lobby and Mardel (101,760 SF, 27.0% of NRA, 14.5% ofunderwritten rent). Founded in 1970, Hobby Lobby Stores, Inc. (“Hobby Lobby”) owns and operates a chain of arts and crafts stores in the United States. The company is based in Oklahoma City, Oklahoma and is the largest privately owned arts-and-crafts retailer employing approximately 32,000 employees and operating more than 700 stores in 47 states. The company offers products under various categories including hobbies, picture framing, jewelry making, fabrics, floral and wedding supplies, cards and party ware, baskets, wearable art, home accents and holiday merchandise. Founded in 1981 by Mart Green, Mardel is a book store and education supplier which specializes in meeting the needs of homeschooling parents, educators, and all kinds of Christian lifestyles. There are 34 stores located in the central region of the United States, including Oklahoma, Texas, Arkansas, Missouri, Kansas, Colorado and Louisiana. Mardel’s corporate location is headquartered with Hobby Lobby’s complex in Oklahoma City and Mardel has more than 800 employees. In 2010, Hobby Lobby expanded its premise from 66,000 SF to its current size, changed the trade name to Hobby Lobby and Mardel. Hobby Lobby has been a tenant at the Moore Plaza Property since 1993 under a lease that commenced September 11, 1993 and expires September 30, 2030, with two 5-year extension options remaining.
Marshall’s (32,228 SF, 8.5% of NRA, 5.1% of underwritten rent). Marshall’s is owned by the TJX Companies, Inc. (NYSE: TJX), the leading off-price apparel and home fashions retailer in the United States and worldwide. The company offers a changing assortment of brand name and designer merchandise generally at discounted prices. T.J. Maxx and Marshall’s chains are collectively the largest off-price retailer in the United States with a total of 2,221 stores, which includes 1,035 Marshall’s stores. The company founded T.J. Maxx in 1976 and acquired Marshall’s in 1995. Marshall’s has been a tenant at the Moore Plaza Property since 2001 under a lease that commenced May 20, 2001 and expires May 31, 2021, with one 5-year extension option remaining and no termination options.
Stein Mart (28,157 SF, 7.5% of NRA, 4.2% of underwritten rent).Stein Mart (NYSE: SMRT) is a national discount department store chain that was founded in the early 1900’s and is based in Jacksonville, Florida. Stein Mart locations are primarily concentrated in the Southeast and Texas and carry an assortment of merchandise including moderate to better fashion apparel for women and men, as well as accessories, shoes and home fashions, all offered at prices competitive with off-price retail chains. Stein Mart currently operates 290 stores in 31 states plus an online store, steinmart.com. Stein Mart has been a tenant at the Moore Plaza Property since 2010 under a lease that commenced March 13, 2010 and expires March 31, 2020, with three 5-year extension options remaining and no termination options. Additionally, Stein Mart pays $250 per month for the placement of a 2,000 SF storage container directly behind its premises.
Office Depot (26,520 SF, 7.0% of NRA, 5.3% of underwritten rent).Office Depot, Inc. provides a broad selection of products and services to consumers and businesses. Office Depot, Inc. currently offers products in the supplies, technology, and furniture categories. Most of its retail stores also offer copy and print services to its customers. Office Depot, Inc. currently operates 1,441 office supply stores in North America. The average store is currently over 20,000 SF, with most stores located in Texas, California, and Florida. Office Depot has been a tenant at the Moore Plaza Property since 1990 under a lease that commenced July 1, 1990 and expires June 30, 2020, with one 5-year renewal option remaining.
Cost Plus World Market (19,673 SF, 5.2% of NRA, 3.7% of underwritten rent).Cost Plus World Market is a retailer that specializes in providing goods from all over the world. Cost Plus World Market is an omnichannel retailer selling a wide range of home decorating items, furniture, gifts, holiday and other seasonal items, and specialty food and beverages. Cost Plus World Market is a value retailer that provides solutions for entertaining and decorating needs. Cost Plus World Market currently operates 276 stores throughout the United States. Cost Plus World Market is owned by Bed Bath and Beyond Inc. Cost Plus World Market has been a tenant at the Moore Plaza Property since 2003 under a lease that commenced November 26, 2003 and expires January 31, 2018, with two 5-year renewal options remaining and no termination options. Cost Plus World Market leases an additional storage space consisting of 2,333 SF and pays $2.57 PSF throughout the lease term.
THE INFORMATION IN THIS COLLATERAL TERM SHEET IS NOT COMPLETE AND MAY BE AMENDED PRIOR TO THE TIME OF SALE. THIS TERM SHEET IS NOT AN OFFER TO SELL THESE SECURITIES AND IT IS NOT A SOLICITATION OF AN OFFER TO BUY THESE SECURITIES IN ANY JURISDICTION WHERE THE OFFER OR SALE IS NOT PERMITTED.
54
5425 South Padre Island Corpus Christi, TX 78411 | Collateral Asset Summary – Loan No. 5 Moore Plaza | Cut-off Date Balance: Cut-off Date LTV Ratio: UW NCF DSCR: UW NOI Debt Yield: | $47,500,000 60.2% 2.27x 11.4% |
The following table presents a summary regarding the largest tenants at the Moore Plaza Property.
| Tenant Summary(1) | ||||||||||
| Tenant Name | Credit Rating (Fitch/Moody’s/ S&P)(2) | Tenant SF | Approximate % of SF | Annual UW Base Rent | % of Annual UW Base Rent | Annual UW Base Rent PSF(3) | Most Recently Reported Sales | Occ. Cost %(4) | Lease Expiration | |
$ |
PSF | |||||||||
| Anchor/Major Tenants | ||||||||||
| Hobby Lobby and Mardel | NR/NR/NR | 101,760 | 27.0% | $829,200 | 14.5% | $8.15 | N/A | N/A | N/A | 9/30/2030 |
| Marshall’s | NR/A2/A+ | 32,228 | 8.5% | $294,000 | 5.1% | $9.12 | N/A | N/A | N/A | 5/31/2021 |
| Stein Mart(5) | NR/NR/NR | 28,157 | 7.5% | $242,334 | 4.2% | $8.61 | $3,582,109 | $127 | 9.4% | 3/31/2020 |
| Office Depot | NR/B1/NR | 26,520 | 7.0% | $304,980 | 5.3% | $11.50 | N/A | N/A | N/A | 6/30/2020 |
| Cost Plus World Market(6) | NR/Baa1/BBB+ | 19,673 | 5.2% | $214,080 | 3.7% | $10.88 | N/A | N/A | N/A | Various |
| Old Navy | BB+/Baa2/BB+ | 15,000 | 4.0% | $180,000 | 3.1% | $12.00 | $7,195,538(7) | $480 | 3.2% | 1/31/2023 |
| Half Price Books | NR/NR/NR | 12,321 | 3.3% | $227,939 | 4.0% | $18.50 | $2,406,098(7) | $195 | 12.1% | 6/30/2019 |
| Party City | NR/NR/NR | 12,000 | 3.2% | $216,000 | 3.8% | $18.00 | $3,009,429(8) | $251 | 8.4% | 4/30/2028 |
| Kirkland’s, Inc. | NR/NR/NR | 8,626 | 2.3% | $150,955 | 2.6% | $17.50 | $1,917,478(9) | $222 | 10.1% | 1/31/2021 |
| Avenue Stores, LLC | NR/NR/NR | 5,606 | 1.5% | $95,054 | 1.7% | $16.96 | N/A | N/A | N/A | 1/31/2021 |
| Anchor/Major Tenants | 261,891 | 69.4% | $2,754,541 | 48.1% | $10.52 | |||||
| Other Tenants | 103,262 | 27.4% | $2,968,468 | 51.9% | $28.75 | |||||
| Vacant Space(10) | 12,108 | 3.2% | $0 | 0.0% | $0.00 | |||||
| Total/Wtd. Avg. | 377,261 | 100.0% | $5,723,009 | 100.0% | $15.67 | |||||
| (1) | Information is based on the underwritten rent roll. |
| (2) | Certain ratings are those of the parent company whether or not the parent guarantees the lease. |
| (3) | Wtd. Avg. Annual UW Base Rent PSF excludes vacant space. |
| (4) | Occ Cost % is based on the contractual rent as of the January 4, 2018 rent roll and Underwritten Reimbursements divided by most recently reported sales. |
| (5) | Annual UW Base Rent includes $3,000 in annual rent for the placement of storage container directly behind the Moore Plaza Property, the storage container is on a month to month lease. Most Recently Reported Sales reflect the 12-month period ending March 2017. |
| (6) | Annual UW Base Rent includes $6,000 in annual rent for additional storage space consisting of 2,333 SF which expires on January 31, 2019. The Cost Plus World Market lease expires January 31, 2018. |
| (7) | Most Recently Reported Sales reflect the 12-month period ending September 2017. |
| (8) | Most Recently Reported Sales reflect the 12-month period ending April 2017. |
| (9) | Most Recently Reported Sales reflect the 12-month period ending March 2017. |
| (10) | Vacant Space includes 937 SF of storage space which does not contribute any rent or have frontage space. |
The following table presents historical sales information for the anchor tenants at the Moore Plaza Property:
| Historical Sales Summary(1) | ||||||||||||
| 3rdMost Recent Reported Sales | 2nd Most Recent Reported Sales | Most Recent Reported Sales | ||||||||||
| Tenant | Sales ($) | Sales (PSF) | Occ. Cost(2) | Sales ($) | Sales (PSF) | Occ. Cost(2) | Sales ($) | Sales (PSF) | Occ. Cost(2) | |||
| Hobby Lobby and Mardel | $14,307,040 | $141 | 8.8% | $13,379,360 | $131 | 9.4% | N/A | N/A | N/A | |||
| Marshall’s | $9,031,246 | $280 | 4.6% | $8,853,665 | $275 | 4.7% | N/A | N/A | N/A | |||
| Stein Mart | $4,166,963 | $148 | 8.1% | N/A | N/A | N/A | $3,582,109 | $127 | 9.4% | |||
| Office Depot | $10,279,428 | $388 | 4.2% | $9,628,453 | $363 | 4.5% | N/A | N/A | N/A | |||
| Cost Plus World Market | $3,154,030 | $182 | 8.9% | $3,145,499 | $181 | 8.9% | N/A | N/A | N/A | |||
| Old Navy | $7,239,493 | $483 | 3.2% | $6,927,303 | $462 | 3.3% | $7,195,538 | $480 | 3.2% | |||
| Half Price Books | $2,513,772 | $204 | 11.6% | $2,505,499 | $203 | 11.6% | $2,406,098 | $195 | 12.1% | |||
| Party City | $3,391,603 | $283 | 7.5% | $3,096,495 | $258 | 8.2% | $3,009,429 | $251 | 8.4% | |||
| Kirkland’s, Inc. | $2,132,364 | $247 | 9.1% | $1,961,746 | $227 | 9.8% | $1,917,478 | $222 | 10.1% | |||
| Total/Wtd. Avg. | $56,215,939 | $227 | 7.5% | $49,498,020 | $218 | 7.8% | $18,110,652 | $238 | 8.5% | |||
| (1) | Information is based on the underwritten rent roll. |
| (2) | Occ. Cost % is based on the base rent as of the January 4, 2018 rent roll and Underwritten Reimbursements divided by the respective year’s reported sales. |
THE INFORMATION IN THIS COLLATERAL TERM SHEET IS NOT COMPLETE AND MAY BE AMENDED PRIOR TO THE TIME OF SALE. THIS TERM SHEET IS NOT AN OFFER TO SELL THESE SECURITIES AND IT IS NOT A SOLICITATION OF AN OFFER TO BUY THESE SECURITIES IN ANY JURISDICTION WHERE THE OFFER OR SALE IS NOT PERMITTED.
55
5425 South Padre Island Corpus Christi, TX 78411 | Collateral Asset Summary – Loan No. 5 Moore Plaza | Cut-off Date Balance: Cut-off Date LTV Ratio: UW NCF DSCR: UW NOI Debt Yield: | $47,500,000 60.2% 2.27x 11.4% |
The following table presents certain information relating to the lease rollover at the Moore Plaza Property:
| Lease Rollover Schedule(1)(2) | ||||||||
| Year | # of Leases Rolling | SF Rolling(3) | Approx. % of Total SF Rolling | Approx. Cumulative % of SF Rolling | UW Base Rent PSF Rolling(3) | Total UW Base Rent Rolling | Approx. % of Total Rent Rolling | Approx. Cumulative % of Total Rent Rolling |
| MTM | 3 | 5,672 | 1.5% | 1.5% | $3.17 | $18,000 | 0.3% | 0.3% |
| 2018 | 6 | 29,248 | 7.8% | 9.3% | $20.20 | $590,712 | 10.3% | 10.6% |
| 2019 | 8 | 24,329 | 6.4% | 15.7% | $22.64 | $550,702 | 9.6% | 20.3% |
| 2020 | 12 | 84,377 | 22.4% | 38.1% | $17.48 | $1,475,237 | 25.8% | 46.0% |
| 2021 | 8 | 59,900 | 15.9% | 53.9% | $15.12 | $905,534 | 15.8% | 61.9% |
| 2022 | 7 | 23,314 | 6.2% | 60.1% | $27.19 | $633,849 | 11.1% | 72.9% |
| 2023 | 3 | 20,210 | 5.4% | 65.5% | $17.41 | $351,770 | 6.1% | 79.1% |
| 2024 | 0 | 0 | 0.0% | 65.5% | $0.00 | $0 | 0.0% | 79.1% |
| 2025 | 1 | 4,343 | 1.2% | 66.6% | $35.00 | $152,005 | 2.7% | 81.7% |
| 2026 | 0 | 0 | 0.0% | 66.6% | $0.00 | $0 | 0.0% | 81.7% |
| 2027 | 0 | 0 | 0.0% | 66.6% | $0.00 | $0 | 0.0% | 81.7% |
| 2028 & Beyond | 4 | 113,760 | 30.2% | 96.8% | $9.19 | $1,045,200 | 18.3% | 100.0% |
| Vacant(4) | 0 | 12,108 | 3.2% | 100.0% | $0.00 | $0 | 0.0% | 100.0% |
| Total/Wtd. Avg. | 52 | 377,261 | 100.0% | $15.67 | $5,723,009 | 100.0% | ||
| (1) | Information is based on the underwritten rent roll. |
| (2) | Certain tenants may have lease termination options that are exercisable prior to the stated expiration date of the subject lease or leases which are not considered in the lease rollover schedule. |
| (3) | Wtd. Avg. Annual UW Rent PSF Rolling excludes vacant space. |
| (4) | SF Rolling excludes 937 SF of storage space which does not contribute any rent or have frontage space. |
The Market. The Moore Plaza Property is located in Corpus Christi, Nueces County, approximately 10 miles southeast of the Corpus Christi central business district. Corpus Christi is located between Padre Island and Rockport, along the Gulf of Mexico. Access to the Moore Plaza Property neighborhood is provided by Interstate 37 and the Crosstown Expressway. Interstate 37 connects the Moore Plaza Property neighborhood with the City of San Antonio to the northwest. The Crosstown Expressway provides north-south access to the area. This arterial merges with Interstate 37 in the northwestern portion of Corpus Christi. South Padre Island Drive is a major connector, proceeding south from Interstate 37 to Padre Island and access to Mustang Island and Port Aransas. Secondary access to the neighborhood is provided by Staples Street, Morgan Avenue and Shoreline Boulevard. Moore Plaza Property is located less than 0.25 miles from the intersection of South Padre Island Drive and Blanche Moore Drive, which has an average daily traffic count of 151,328 vehicles per day.
The neighborhood surrounding the Moore Plaza Property consists of a mixture of commercial, industrial and residential development. The immediate area surrounding the Moore Plaza Property consists of development built in the 1970s. Located directly across South Padre Island Drive are the Corpus Christi’s two malls, La Palmera Mall and Sunrise Mall. The La Palmera is a super-regional mall that features over 100 stores, as well as a movie theater and a two-story exotic fish aquarium. The mall is anchored by Bealls, Dillard’s, Macy’s, and JCPenney. La Palmera underwent an estimated $60 million renovation in 2010, becoming the nation’s first LEED certified mall. In April 2012, the mall ownership purchased the 19.298 acre former Staples Center to redevelop into a 200,000 SF extension of retail space known as The Shops at La Palmera. The Shops at La Palmera includes tenants such as Dick’s Sporting Goods, DSW, Jared The Galleria of Jewelry, T.J. Maxx, HomeGoods, Chipotle Mexican Grill and Corner Bakery Cafe. Sunrise Mall is anchored by Macy’s, Sears and JCPenney. Other retailers located along South Padre Island Drive also include Home Depot, Barnes and Noble, Academy Sports and Outdoors, Sam’s Club, Bed, Bath & Beyond, Ross Dress for Less, Best Buy and Michael’s. Other notable developments within the Moore Plaza Property’s neighborhood include Naval Air Station Corpus Christi (8.4 miles east), the single largest employer in the city. According to the appraisal, the 2017 estimated population within a one-, three-, and five-mile radius of the Moore Plaza Property is 16,120, 119,582, and 213,093, respectively. The 2017 average household income within the same radius is $52,680, $69,109, and $71,307, respectively.
According to a third party market research report, the Moore Plaza Property is located within the Corpus Christi retail market and the Mid City retail submarket. As of the second quarter 2017, the Corpus Christ retail market reported an overall vacancy rate of 3.2%, and an average asking rental rate of $13.68 PSF. As of second quarter 2017, the Corpus Christi retail market reported net absorption of 733,508 SF. The Mid City retail submarket reported an overall vacancy rate of 4.2% and an average asking rental rate of $15.75 PSF. As of second quarter 2017, the Mid City retail market reported absorption of 27,058 SF.
THE INFORMATION IN THIS COLLATERAL TERM SHEET IS NOT COMPLETE AND MAY BE AMENDED PRIOR TO THE TIME OF SALE. THIS TERM SHEET IS NOT AN OFFER TO SELL THESE SECURITIES AND IT IS NOT A SOLICITATION OF AN OFFER TO BUY THESE SECURITIES IN ANY JURISDICTION WHERE THE OFFER OR SALE IS NOT PERMITTED.
56
5425 South Padre Island Corpus Christi, TX 78411 | Collateral Asset Summary – Loan No. 5 Moore Plaza | Cut-off Date Balance: Cut-off Date LTV Ratio: UW NCF DSCR: UW NOI Debt Yield: | $47,500,000 60.2% 2.27x 11.4% |
The following table presents competitive retail properties with respect to the Moore Plaza Property:
| Competitive Property Summary | ||||||
| Property Name | Type | Year Built/Renovated | Size (SF) | Total Occupancy | Anchor Tenants | Distance to Subject |
| Moore Plaza | Anchored Retail | 1989/2017 | 377,261 | 97.0%(1) | Hobby Lobby, Mardel, Marshall’s, Stein Mart, Office Depot, Cost Plus World Market, Old Navy, Half Price Books, Party City, Kirkland’s Inc., Avenue Stores, LLC | N/A |
| The Shops at La Palmera | Power Center | 1985/2016 | 219,540 | 97.0% | Dick’s Sporting Goods, Big Lots, DSW, T.J. Maxx | 0.5 miles |
| Saratoga Town Center | Neighborhood Center | 2003/2007 | 64,755 | 98.0% | Petco | 2.0 miles |
| Portairs Shopping Center | Neighborhood Center | 1953/1998 | 116,710 | 99.0% | CVS Pharmacy, Dollar Tree, Beall’s, Family Dollar | 5.7 miles |
| 5625 S. Padre Island Drive | Un-anchored Retail Strip | 1967/N/A | 65,449 | 94.0% | N/A | 0.5 miles |
Source: Appraisal
| (1) | Information is based on the underwritten rent roll as of January 4, 2018. |
Operating History and Underwritten Net Cash Flow.The following table presents certain information relating to the historical operating performance and the Underwritten Net Cash Flow at the Moore Plaza Property:
| Cash Flow Analysis | ||||||
| 2014 | 2015 | 2016 | 10/30/2017 TTM | UW | UW PSF | |
| Base Rent(1) | $5,130,938 | $5,385,215 | $5,603,065 | $5,760,816 | $6,058,139 | $16.06 |
| Total Recoveries | $1,508,569 | $1,654,678 | $1,574,153 | $1,639,782 | $1,591,379 | $4.22 |
| Other Income(2) | $157,656 | $172,674 | $151,869 | $145,866 | $145,866 | $0.39 |
| Less Vacancy & Credit Loss | ($25,466) | $8,663 | ($7,111) | $15,678 | ($382,476) | ($1.01) |
| Effective Gross Income | $6,771,697 | $7,221,230 | $7,321,976 | $7,562,142 | $7,412,908 | $19.65 |
| Total Expenses | $2,022,691 | $2,078,962 | $1,962,057 | $2,011,114 | $2,008,304 | $5.32 |
| Net Operating Income | $4,749,006 | $5,142,268 | $5,359,919 | $5,551,028 | $5,404,604 | $14.33 |
| Capital Expenditures | $0 | $0 | $0 | $0 | $67,907 | $0.18 |
| TI/LC | $0 | $0 | $0 | $0 | $377,261 | $1.00 |
| Net Cash Flow | $4,749,006 | $5,142,268 | $5,359,919 | $5,551,028 | $4,959,436 | $13.15 |
| Occupancy %(3) | 97.7% | 98.6% | 98.8% | 99.3% | 95.0% | |
| NOI DSCR | 2.18x | 2.36x | 2.46x | 2.54x | 2.48x | |
| NCF DSCR | 2.18x | 2.36x | 2.46x | 2.54x | 2.27x | |
| NOI Debt Yield | 10.0% | 10.8% | 11.3% | 11.7% | 11.4% | |
| NCF Debt Yield | 10.0% | 10.8% | 11.3% | 11.7% | 10.4% | |
| (1) | Underwritten Rent is based on the rent roll dated January 4, 2018 and includes rent steps through December 1, 2018 totaling $63,742. |
| (2) | Other Income includes Targets reciprocal easement agreement billing amount, late fees, NSF fees, and miscellaneous income. |
| (3) | Underwritten Occupancy % based on the underwritten economic vacancy of 5.0% |
Escrows and Reserves. The Moore Plaza Borrower deposited $145,269 upfront for annual real estate taxes; $14,780 for annual insurance premiums; $1,000,000 for TI/LC reserves, $5,679 for deferred maintenance and $3,000 for environmental remediation funds for the extension of the environmental liability insurance policy. The Moore Plaza Borrower will be required to escrow monthly 1/12 of the annual estimated tax payments, 1/12 of the annual estimated insurance premiums, replacement reserves of $5,659, tenant improvements and leasing commissions reserve of $31,438 when TI/LC reserve balance falls below $500,000, subject to a cap of $1,500,000. Each January, through the term of the Moore Plaza Mortgage Loan, the Moore Plaza Borrower will be required to deposit $3,000 in the environmental reserve for the extension of the environmental liability insurance policy.
Lockbox and Cash Management. The Moore Plaza Mortgage Loan provides for a springing lockbox and springing cash management. During the occurrence and continuance of a Cash Management Trigger Event (as defined below), the Moore Plaza Borrower is required to instruct tenants to deposit rents and other amounts due into the lockbox account and funds in the lockbox account are required to be transferred to the cash management account within one business day. All funds in the cash management are required to be applied on each monthly payment date in accordance with the Moore Plaza Mortgage Loan documents. Pursuant to the Moore Plaza Mortgage Loan documents, all excess funds on deposit (after payment of monthly reserve deposits, debt service payment and cash management bank fees) will be applied as follows (a) if a Cash Sweep Event (as defined below) period is not in effect, to the Moore Plaza Borrower, (b) if a Cash Sweep Event is in effect due to the existence of a Critical Tenant Trigger Event (as defined below) to the Critical Tenant TI/LC account until the applicable Critical Tenant Trigger Event cure has occurred and (c) if a Cash Sweep Event is in effect but a Critical Tenant Trigger Event is not in effect, then to the lender controlled excess cash flow account.
THE INFORMATION IN THIS COLLATERAL TERM SHEET IS NOT COMPLETE AND MAY BE AMENDED PRIOR TO THE TIME OF SALE. THIS TERM SHEET IS NOT AN OFFER TO SELL THESE SECURITIES AND IT IS NOT A SOLICITATION OF AN OFFER TO BUY THESE SECURITIES IN ANY JURISDICTION WHERE THE OFFER OR SALE IS NOT PERMITTED.
57
5425 South Padre Island Corpus Christi, TX 78411 | Collateral Asset Summary – Loan No. 5 Moore Plaza | Cut-off Date Balance: Cut-off Date LTV Ratio: UW NCF DSCR: UW NOI Debt Yield: | $47,500,000 60.2% 2.27x 11.4% |
A ”Cash Management Trigger Event” will occur upon (i) an event of default, (ii) any bankruptcy action of the Moore Plaza Borrower, the guarantor or manager,provided that if the bankruptcy action of the manager involves a manager who is not affiliated with the Moore Plaza Borrower, then the Moore Plaza Borrower shall have a period of 30 days to terminate and replace the manager before a Cash Management Trigger Event occurs; (iii) a debt service coverage ratio based on the trailing 12-month period falling below 1.15x, or (iv) a Critical Tenant Trigger Event. A Cash Management Event will continue until, in regard to clause (i) above, when such event of default has been cured or waived, in regard to clause (ii) above, when such bankruptcy petition has been discharged, stayed, or dismissed within 30 days of such filing among other conditions for the Moore Plaza Borrower or guarantor and within 120 days for the property manager (or, solely with respect to the bankruptcy of the property manager, when the Moore Plaza Borrower has replaced the property manager with a qualified property manager acceptable to the lender), in regard to clause (iii) above, the date the trailing 12-month amortizing net operating income debt service coverage ratio is greater than 1.20x for two consecutive calendar quarters, or in regard to clause (iv) above, the date a Critical Tenant Trigger Event cure has occurred.
A “Cash Sweep Event” will occur upon (i) an event of default, (ii) any bankruptcy action of the Moore Plaza Borrower, the guarantor or manager, provided that if the bankruptcy action of the manager involves a manager who is not affiliated with the Moore Plaza Borrower, then the Moore Plaza Borrower shall have a period of 30 days to terminate and replace the manager before a Cash Sweep Event occurs (iii) a debt service coverage ratio based on the trailing 12-month period falling below 1.15x; unless, within five days of such date, the Moore Plaza Borrower deposits $1,250,000 in cash in the Critical Tenant TI/LC account for each year the Moore Plaza Borrower desires to avoid a Cash Sweep Event as it relates to clause (iii), or (iv) a Critical Tenant Trigger Event, unless, within five days of such date, the Moore Plaza Borrower deposits an amount equal to $1,526,400 in cash in the Critical Tenant TI/LC account as it relates to clause (iv). A Cash Sweep Event will continue until, in regard to clause (i) above, when such event of default has been cured or waived, in regard to clause (ii) above, when such bankruptcy petition has been discharged, stayed, or dismissed within 30 days of such filing among other conditions for Moore Plaza Borrower or guarantor and within 120 days for the property manager (or, solely with respect to the bankruptcy of the property manager, when the Moore Plaza Borrower has replaced the property manager with a qualified property manager acceptable to the lender), in regard to clause (iii) above, the date the trailing 12-month amortizing net operating income debt service coverage ratio is greater than 1.20x for two consecutive calendar quarters, or in regard to clause (iv) above, the date a Critical Tenant Trigger Event cure has occurred.
A “Critical Tenant Trigger Event” will occur upon (i) Hobby Lobby or any tenant leasing 100,000 SF or more of the space at the Moore Plaza Property (each, a “Critical Tenant”) gives notice of its intention to terminate its lease, or any Critical Tenant other than Hobby Lobby give notice of its intention to not extend or renew its lease, (ii) on or prior to twelve (12) months prior to the expiration date the Critical Tenant which is not Hobby Lobby fails to give notice of its election to renew its lease, (iii) on or prior to the date on which the Critical Tenant which is not Hobby Lobby is required under its lease to notify landlord of its election to renew its lease, if Critical Tenant fails to give such notice, (iv) an event of default under the Hobby Lobby lease, or any other lease with a Critical Tenant, exists, (v) a bankruptcy action of the Critical Tenant or guarantor of any Critical Tenant lease occurs, or (vi) if the Critical Tenant discontinues its normal business operations at the Moore Plaza Property. A Critical Tenant Trigger Event will end (a) with respect to clauses (i), (ii) or (iii) the date that (1) the Critical Tenant lease extension is executed and delivered by the Moore Plaza Borrower along with related tenant improvements costs, leasing commissions and other material costs and expenses have been deposited into the Critical Tenant TI/LC account, or (2) a Critical Tenant Space Re-tenanting Event (as defined below) has occurred, (b) with respect to clause (iv) above, after a cure of applicable event of default, (c) with respect to clause (v) above, after an affirmation of the Critical Tenant lease in the applicable bankruptcy proceeding and confirmation that the Critical Tenant is actually paying all rents and other amounts under its lease, or (d) with respect to clause (vi) above, the Critical Tenant re-commences its normal business operations at the Moore Plaza Property or a Critical Tenant Space Re-tenanting Event has occurred.
A “Critical Tenant Space Re-tenanting Event” will occur on the date each of the following conditions have been satisfied: (i) the Critical Tenant space is leased to one or more replacement tenants for a term of at least five years and on terms that are acceptable to the lender, (ii) all tenant improvement costs, leasing commissions and other material costs and expenses relating to the re-letting of the space have been paid in full, and (iii) the replacement tenant(s) are conducting normal business operations at the related Critical Tenant space.
Additional Secured Indebtedness (not including trade debts).Not permitted.
Mezzanine Loan and Preferred Equity. Not permitted.
Release of Property. Not permitted.
Environmental Matters.The Phase I environmental report dated September 19, 2017 identified historical use of a portion of the Moore Plaza Property as an on-site dry cleaner and recommended a Phase II environmental report. A limited subsurface investigation report dated November 28, 2017 recommended entering the Moore Plaza Mortgaged Property into the Texas Commission on Environmental Quality (TCEQ). The environmental condition relating to the dry cleaner is expected to be remediated by the Moore Plaza Borrower under TCEQ supervision. Additionally, the borrower obtained an environmental impairment liability (“EIL”) insurance policy, from Beazley (Lloyd’s of London Syndicates 623/2623) (rated “A” by A.M. Best), which lists the borrower as the first named insured and the lender, with its successors, assigns, and/or affiliates as additional named insured. The EIL policy has a term of 121 months, with an optional extended reporting period of 36 months, policy limits of $2,000,000 per incident and in the aggregate, with a $100,000 deductible per incident. The policy premium was paid at origination, and the Moore Plaza Borrower is required to deposit $3,000 each January during the term of the Moore Plaza Mortgage Loan into an environmental remediation reserve account. See“Description of the Mortgage Pool—Mortgage Pool Characteristics—Environmental Considerations”in the Preliminary Prospectus.
Terrorism Insurance. The Moore Plaza Borrower is required to obtain and maintain property insurance, commercial general liability insurance, and business income or rental loss insurance that covers perils of terrorism and acts of terrorism, both foreign and domestic.
THE INFORMATION IN THIS COLLATERAL TERM SHEET IS NOT COMPLETE AND MAY BE AMENDED PRIOR TO THE TIME OF SALE. THIS TERM SHEET IS NOT AN OFFER TO SELL THESE SECURITIES AND IT IS NOT A SOLICITATION OF AN OFFER TO BUY THESE SECURITIES IN ANY JURISDICTION WHERE THE OFFER OR SALE IS NOT PERMITTED.
58
(THIS PAGE INTENTIONALLY LEFT BLANK)
59
Various Florham Park, NJ 07932
| Collateral Asset Summary – Loan No. 6 Park Place at Florham Park
| Cut-off Date Balance: Cut-off Date LTV Ratio: UW NCF DSCR: UW NOI Debt Yield: | $45,000,000 65.1% 1.80x 10.6% |

THE INFORMATION IN THIS COLLATERAL TERM SHEET IS NOT COMPLETE AND MAY BE AMENDED PRIOR TO THE TIME OF SALE. THIS TERM SHEET IS NOT AN OFFER TO SELL THESE SECURITIES AND IT IS NOT A SOLICITATION OF AN OFFER TO BUY THESE SECURITIES IN ANY JURISDICTION WHERE THE OFFER OR SALE IS NOT PERMITTED.
60
Various Florham Park, NJ 07932
| Collateral Asset Summary – Loan No. 6 Park Place at Florham Park
| Cut-off Date Balance: Cut-off Date LTV Ratio: UW NCF DSCR: UW NOI Debt Yield: | $45,000,000 65.1% 1.80x 10.6% |

THE INFORMATION IN THIS COLLATERAL TERM SHEET IS NOT COMPLETE AND MAY BE AMENDED PRIOR TO THE TIME OF SALE. THIS TERM SHEET IS NOT AN OFFER TO SELL THESE SECURITIES AND IT IS NOT A SOLICITATION OF AN OFFER TO BUY THESE SECURITIES IN ANY JURISDICTION WHERE THE OFFER OR SALE IS NOT PERMITTED.
61
Various Florham Park, NJ 07932
| Collateral Asset Summary – Loan No. 6 Park Place at Florham Park
| Cut-off Date Balance: Cut-off Date LTV Ratio: UW NCF DSCR: UW NOI Debt Yield: | $45,000,000 65.1% 1.80x 10.6% |

THE INFORMATION IN THIS COLLATERAL TERM SHEET IS NOT COMPLETE AND MAY BE AMENDED PRIOR TO THE TIME OF SALE. THIS TERM SHEET IS NOT AN OFFER TO SELL THESE SECURITIES AND IT IS NOT A SOLICITATION OF AN OFFER TO BUY THESE SECURITIES IN ANY JURISDICTION WHERE THE OFFER OR SALE IS NOT PERMITTED.
62
Various Florham Park, NJ 07932
| Collateral Asset Summary – Loan No. 6 Park Place at Florham Park
| Cut-off Date Balance: Cut-off Date LTV Ratio: UW NCF DSCR: UW NOI Debt Yield: | $45,000,000 65.1% 1.80x 10.6% |
| Mortgage Loan Information | Property Information | |||||
| Mortgage Loan Seller: | UBS AG | Single Asset/Portfolio: | Portfolio | |||
| Original Balance(1): | $45,000,000 | Location: | Florham Park, 07932 | |||
| Cut-off Date Balance(1): | $45,000,000 | General Property Type: | Office | |||
| % of Initial Pool Balance: | 4.3% | Detailed Property Type: | Suburban | |||
| Loan Purpose: | Refinance | Title Vesting: | Fee | |||
Borrower Sponsors:
| Normandy Real Estate Fund, L.P.; Normandy Real Estate Management, LLC | Year Built/Renovated: | Various/Various | |||
| Size: | 354,381 SF | |||||
| Mortgage Rate: | 5.0815% | Cut-off Date Balance per SF(1): | $176 | |||
| Note Date: | 1/19/2018 | Maturity Date Balance per SF(1): | $176 | |||
| First Payment Date: | 3/6/2018 | Property Manager: | Normandy FundSub Management Co., LLC (borrower-related) | |||
| Maturity Date: | 2/6/2028 | |||||
| Original Term to Maturity: | 120 months | |||||
| Original Amortization Term: | 0 months | |||||
| IO Period: | 120 months | |||||
| Seasoning: | 0 months | |||||
| Prepayment Provisions(2): | LO (24); DEF (89); O (7) | Underwriting and Financial Information | ||||
| Lockbox/Cash Mgmt Status: | Hard/Springing | UW NOI(5): | $6,606,415 | |||
| Additional Debt Type(1)(3): | Pari Passu/Mezzanine Debt | UW NOI Debt Yield(1): | 10.6% | |||
| Additional Debt Balance(1)(3): | $17,500,000/$12,500,000 | UW NOI Debt Yield at Maturity(1): | 10.6% | |||
| Future Debt Permitted (Type): | No (N/A) | UW NCF DSCR(1): | 1.80x | |||
| Reserves(4) | Most Recent NOI(5): | $3,510,694 (9/30/2017 TTM) | ||||
| Type | Initial | Monthly | Cap | 2nd Most Recent NOI(5): | $3,097,981 (12/31/2016) | |
| RE Tax: | $168,292 | $64,728 | N/A | 3rd Most Recent NOI(5): | $5,121,716 (12/31/2015) | |
| Insurance: | $29,273 | $4,435 | N/A | Most Recent Occupancy(6): | 94.3% (12/6/2017) | |
| Replacements: | $0 | $5,906 | N/A | 2nd Most Recent Occupancy: | 94.3% (9/30/2017) | |
| TI/LC: | $0 | $44,298 | $2,000,000 | 3rd Most Recent Occupancy: | 92.2% (12/31/2016) | |
| Deferred Maintenance: | $37,500 | $0 | N/A | Appraised Value (as of)(7): | $96,000,000 (12/4/2017) | |
| Tenant Obligation: | $5,044,401 | $0 | N/A | Cut-off Date LTV Ratio(1)(7): | 65.1% | |
| Environmental Insurance: | $0 | Springing | N/A | Maturity Date LTV Ratio(1)(7): | 65.1% | |
| Sources and Uses | ||||||
| Sources | Proceeds | % of Total | Uses | Proceeds | % of Total | |
| Loan Amount(1): | $62,500,000 | 83.3% | Loan Payoff: | $64,367,005 | 85.8% | |
| Mezzanine Loan: | $12,500,000 | 16.7% | Reserves: | $5,279,467 | 7.0% | |
| Closing Costs: | $1,573,010 | 2.1% | ||||
| Return of Equity: | $3,780,519 | 5.0% | ||||
| Total Sources: | $75,000,000 | 100.0% | Total Uses: | $75,000,000 | 100.0% | |
| (1) | The Park Place at Florham Park Mortgage Loan (as defined below) is part of the Park Place at Florham Park Whole Loan (as defined below), which is comprised of fivepari passupromissory notes with an aggregate original principal balance of $62,500,000. The Cut-off Date Balance per SF, Maturity Date Balance per SF, UW NOI Debt Yield, UW NOI Debt Yield at Maturity, UW NCF DSCR, Cut-off Date LTV Ratio and Maturity Date LTV Ratio presented above are based on the aggregate principal balance of the promissory notes comprising the Park Place at Florham Park Whole Loan. |
| (2) | Prior to the open prepayment date of August 6, 2027, the Park Place at Florham Park Whole Loan can be defeased after the earlier to occur of (a) March 6, 2021 and (b) the first monthly payment date following the end of the two-year period commencing on the closing date of the securitization of the last Park Place at Florham Park Whole Loan promissory note (the “Permitted Release Date”). Partial Release is permitted. See “Release of Individual Property” and “Release of Developmental Parcel” below for further discussion of release requirements. |
| (3) | See “The Mortgage Loan”and“Mezzanine Loan and Preferred Equity”below for further discussion of additional debt. |
| (4) | See “Escrows and Reserves” below for further discussion of reserve requirements. |
| (5) | The decline in NOI from 12/31/2015 to 12/31/2016 is due to the vacating of two tenants, which accounted for approximately 76,000 SF, from the 200 Park Place property. Furthermore, the borrower sponsors continued to vacate expiring tenants at 200 Park Place while renovations where being completed at the building in order to increase rental rates. Subsequently, the recovery of NOI is related to leasing activity following the completion of renovations and capital improvements at the Park Place at Florham Park Property (as defined below) and expiring free rent periods. In 2017, the borrower sponsors signed three new leases with RBC Capital Markets LLC (14.9% of NRA, 16.5% of underwritten base rent), Viner Finance (3.4% of NRA, 3.8% of underwritten base rent) and Normandy FundSub Mgmt Co., LLC (1.8% of NRA, 1.5% of underwritten base rent). |
| (6) | Hyman Beck & Company, Inc. leases 2,105 SF in the 210 Park Place property, which has a lease expiration in July 2018. Its space is currently vacant and the tenant is paying all obligations under its lease, however, such space is underwritten as vacant. |
| (7) | The appraisal concluded an “as-is” appraised value of $91.2 million. The Cut-off Date LTV Ratio and Maturity Date LTV Ratio presented above are based on the alternate market “as-is” appraised value of the Park Place at Florham Park Property of $96.0 million, as of December 4, 2017, which assumes that outstanding landlord obligations for free rent, tenant improvements, and leasing commissions are fully funded and escrowed by the lender through a title company. At loan origination, landlord obligations of $5,044,401 were escrowed. Based on the “as is” appraised value of $91.2 million and the Park Place at Florham Park Whole Loan, the Cut-off Date LTV Ratio and Maturity Date LTV Ratio are 68.5% and 68.5%, respectively. |
The Mortgage Loan. The sixth largest mortgage loan (the “Park Place at Florham Park Mortgage Loan”) is part of a whole loan (the “Park Place at Florham Park Whole Loan”) evidenced by fivepari passupromissory notes with an aggregate original principal balance of $62,500,000. The Park Place at Florham Park Whole Loan is secured by a first priority mortgage encumbering the borrower’s fee interest in a 354,381 SF Class A suburban office park comprised of four buildings located in Florham Park, New Jersey (the “Park Place at Florham Park Property”). Promissory Notes A-1, A-2 and A-5, with an aggregate original principal balance of $45,00,000, represent the Park Place at Florham Park Mortgage Loan and will be included in the UBS 2018-C8
THE INFORMATION IN THIS COLLATERAL TERM SHEET IS NOT COMPLETE AND MAY BE AMENDED PRIOR TO THE TIME OF SALE. THIS TERM SHEET IS NOT AN OFFER TO SELL THESE SECURITIES AND IT IS NOT A SOLICITATION OF AN OFFER TO BUY THESE SECURITIES IN ANY JURISDICTION WHERE THE OFFER OR SALE IS NOT PERMITTED.
63
Various Florham Park, NJ 07932
| Collateral Asset Summary – Loan No. 6 Park Place at Florham Park
| Cut-off Date Balance: Cut-off Date LTV Ratio: UW NCF DSCR: UW NOI Debt Yield: | $45,000,000 65.1% 1.80x 10.6% |
Trust. Promissory Notes A-3 and A-4, with an aggregate original principal balance of $17,500,000, are currently held by UBS AG, or an affiliate thereof, and are expected to be contributed to one or more future securitization transactions or may be otherwise transferred at any time. The lender provides no assurances that any of the non-securitized notes will not be split further. The Park Place at Florham Park Whole Loan will be serviced pursuant to the pooling and servicing agreement for the UBS 2018-C8 Trust. See “Description of the Mortgage Pool—The Whole Loans—The Serviced Whole Loans” and “Pooling and Servicing Agreement” in the Preliminary Prospectus.
| Park Place at Florham Park Whole Loan Summary | ||||
| Note | Original Balance | Cut-off Date Balance | Anticipated Note Holder | Controlling Piece |
| Note A-1 | $30,000,000 | $30,000,000 | UBS 2018-C8 | Yes |
| Note A-2 | $10,000,000 | $10,000,000 | UBS 2018-C8 | No |
| Note A-3 | $10,000,000 | $10,000,000 | UBS AG | No |
| Note A-4 | $7,500,000 | $7,500,000 | UBS AG | No |
| Note A-5 | $5,000,000 | $5,000,000 | UBS 2018-C8 | No |
| Total | $62,500,000 | $62,500,000 | ||
The proceeds of the Park Place at Florham Park Whole Loan and a $12,500,000 mezzanine loan (the “Park Place at Florham Park Mezzanine Loan”) were used to refinance the Park Place at Florham Park Property, fund reserves, pay closing costs, and return equity to the borrower sponsors.
The Borrower and the Borrower Sponsors. The borrower is Advance at Park Place, LLC (the “Park Place at Florham Park Borrower”), a single-purpose Delaware limited liability company structured to be bankruptcy remote with two independent directors. The guarantors and borrower sponsors of the Park Place at Florham Park Whole Loan are Normandy Real Estate Fund, LP and Normandy Real Estate Management, LLC. The Park Place at Florham Park Borrower is indirectly owned by NRE Office Fund Private Limited (28.2%), Normandy Real Estate Fund GP, LLC (0.1%) and other limited partners (71.7%). Normandy Real Estate Fund, LP has been involved in prior deeds in lieu of foreclosure, discounted payoffs and foreclosure proceedings. See “Description of the Mortgage Pool—Default History, Bankruptcy Issues and Other Proceedings” in the Preliminary Prospectus.
Normandy Real Estate Partners (“Normandy”) is a privately-owned real estate operator and investment manager that targets underperforming office and mixed-use investments in well-located urban and transit-oriented submarkets in the Northeast and Mid-Atlantic region. Since 1996, Normandy has invested over $2.7 billion of institutional capital and acquired over 38 million SF of commercial real estate. Its core capabilities include investment management, leasing and asset management, construction and development and property management. Normandy manages a portfolio of over 14 million SF of commercial properties primarily located in the Northeast.
The Property. The Park Place at Florham Park Property is a four-building 354,381 SF Class A office park located in Florham Park, New Jersey, comprised of the 200 Park Place property, 210 Park Place property, 220 Park Place property and 230 Park Place property (each, an “Individual Property”). Situated on 29.9 acres, the Park Place at Florham Park Property was originally built in between 1974 and 1976 for Exxon Mobil, gut renovated in 2001 and last renovated in 2015-2016. Amenities at the Park Place at Florham Park Property include a new fitness center with restroom and locker facilities, a newly renovated cafeteria with seating for up to 70, 1,306 parking spaces (approximately 3.69 spaces per 1,000 SF), a shared conference room and a complimentary shuttle service to the Convent Station Train Station, which provides direct access to New York Penn Station. Since its acquisition of the Park Place at Florham Park Property, the borrower sponsors have invested approximately $26.6 million in capital expenditures and soft goods ($75.14 PSF).
Occupancy of the Park Place at Florham Park Property over the last 11 years averages 90.9%. Excluding 2015, which had year-end occupancy of 78.4% due to the borrower sponsors’ strategy of vacating expiring tenants while the 200 Park Place property underwent renovations, the average occupancy over the 11-year period is 92.1%. As of December 6, 2017, the Park Place at Florham Park Property was 94.3% physically occupied and 94.9% leased to 16 tenants. Five tenants, comprising of approximately 46.4% of NRA and 44.3% of underwritten base rent, are investment grade tenants including RBC Capital Markets LLC (Moody's/S&P: A3/AA-), Santander Bank, N.A. (Fitch/Moody's/S&P: BBB+/Baa1/BBB+), Manufacturers & Traders Trust (Fitch/Moody's/S&P: A/A3/A), Penn Mutual Life Insurance Co. (Moody's/S&P: Aa3/A+) and Fairleigh Dickinson University (Fitch: BBB+).
| Property Summary | ||||||||
| Individual Property | Year Built/ Renovated | Property NRA (SF) | Approximate % of Total SF | Allocated Cut-Off Date Loan Amount | Appraised Value(1) | LTV(1) | UW NCF | UW NCF Debt Yield |
| 200 Park Place | 1974/2016 | 160,518 | 45.3% | $28,313,000 | $43,400,000 | 65.2% | $2,575,705 | 9.1% |
| 230 Park Place | 1974/2016 | 67,924 | 19.2% | $14,549,000 | $22,300,000 | 65.2% | $1,359,101 | 9.3% |
| 220 Park Place | 1974/2015 | 68,116 | 19.2% | $10,504,000 | $16,100,000 | 65.2% | $993,167 | 9.5% |
| 210 Park Place | 1976/2015 | 57,823 | 16.3% | $9,134,000 | $14,000,000 | 65.2% | $871,826 | 9.5% |
| Total/Wtd. Avg. | 354,381 | 100.0% | $62,500,000 | $96,000,000 | 65.1% | $5,799,800 | 9.3% | |
| (1) | Total Appraised Value and Wtd. Avg. LTV is based on the consolidated alternate market “as-is” appraised value is $96.0 million, as the Park Place at Florham Park Property is an interconnected corporate park situated upon two municipal lots. Based on the aggregate of the alternate market “as-is” appraised values of the individual Park Place at Florham Park Property buildings of $95,800,000, the LTV of the Park Place at Florham Park Whole Loan is 65.2%. |
THE INFORMATION IN THIS COLLATERAL TERM SHEET IS NOT COMPLETE AND MAY BE AMENDED PRIOR TO THE TIME OF SALE. THIS TERM SHEET IS NOT AN OFFER TO SELL THESE SECURITIES AND IT IS NOT A SOLICITATION OF AN OFFER TO BUY THESE SECURITIES IN ANY JURISDICTION WHERE THE OFFER OR SALE IS NOT PERMITTED.
64
Various Florham Park, NJ 07932
| Collateral Asset Summary – Loan No. 6 Park Place at Florham Park
| Cut-off Date Balance: Cut-off Date LTV Ratio: UW NCF DSCR: UW NOI Debt Yield: | $45,000,000 65.1% 1.80x 10.6% |
Major Tenants.
Fairleigh Dickinson University (67,924 SF, 19.2% of NRA, 14.1% of underwritten base rent). Fairleigh Dickinson University (“FDU”) is the largest private university in New Jersey, with academic enrollment of over 12,000 and part-time and full-time faculty of over 1,100. Founded in 1942, FDU offers over 100 undergraduate and graduate degree programs as well as doctoral programs. FDU occupies the entire 230 Park Place property at the Park Place at Florham Park Property, and utilizes its space for its Graduate Pharmacy Program, as part of its Florham Park campus. Fairleigh Dickinson University (Fitch BBB+) has been in occupancy at the Park Place at Florham Park Property since its original lease commencement date of July 1, 2012. It recently extended its lease term through June 30, 2028 and expanded its footprint at the Park Place at Florham Park Property to occupy all of the 230 Park Place property totaling 67,924 SF at an UW base rent rate of $19.50 PSF triple net with annual rent steps of $0.50 PSF. FDU has two five-year renewal options remaining and no termination options.
RBC Capital Markets LLC (52,787 SF, 14.9% of NRA, 16.5% of underwritten base rent). Royal Bank of Canada (“RBC”) Capital Markets LLC is a global investment bank providing expertise in banking, finance and capital markets to corporations, institutional investors, asset managers and governments around the world. RBC Capital Markets LLC, which occupies the entire second floor of the 200 Park Place property, houses their regional wealth management office as well as several high profile sales positions at the Park Place at Florham Park Property. RBC Capital Markets LLC has an original rent commencement date of February 1, 2017 with a current base rent of $29.50 PSF modified gross, with annual rent steps of $0.50 PSF. RBC Capital Markets LLC’s lease expires on July 31, 2028. The tenant has two five-year renewal options remaining and no termination options.
Schenk Price Smith & King LLP (38,519SF, 10.9% of NRA, 13.0% of underwritten base rent). Founded in 1912, Schenck Price Smith & King LLP (“SPSM”) is a full-service law firm with offices in New Jersey and Manhattan consisting of over 80 lawyers and 26 practice groups. SPSM has been in occupancy at the Park Place at Florham Park Property since March 2010 when it occupied its space via a sublease. SPSM currently occupies three suites within the 220 Park Place property totaling 38,519 SF through August 2022. SPSM pays an UW base rent of $32.00 PSF modified gross on 34,642 SF of its space and $29.50 PSF modified gross on 3,877 SF of its space. SPSM’s lease provides for annual rent steps of $0.50 PSF and two 5-year renewal options remaining and no termination options.
The following table presents certain information relating to the leases at the Park Place at Florham Park Property:
| Tenant Summary(1) | ||||||||
| Tenant Name | Individual Property | Credit Rating (Fitch/Moody's/ S&P)(2) | Tenant SF | Approximate % of SF | Annual UW Base Rent | % of Total Annual UW Base Rent | Annual UW Base Rent PSF(3) | Lease Expiration |
| Fairleigh Dickinson University | 230 Park Place | BBB+/NR/NR | 67,924 | 19.2% | $1,324,518 | 14.1% | $19.50 | 6/30/2028 |
| RBC Capital Markets LLC | 200 Park Place | NR/A3/AA- | 52,787 | 14.9% | $1,557,217 | 16.5% | $29.50 | 7/31/2028 |
| Schenk Price Smith & King LLP | 220 Park Place | NR/NR/NR | 38,519 | 10.9% | $1,222,916 | 13.0% | $31.75 | 8/31/2022 |
| Level 3 Communication, LLC(4) | 200 Park Place | BB/Ba3/NR | 34,908 | 9.9% | $1,230,507 | 13.1% | $35.25 | 4/30/2020 |
| Santander Bank, N.A.(5) | 200 Park Place | BBB+/Baa1/BBB+ | 30,563 | 8.6% | $901,609 | 9.6% | $29.50 | 10/31/2027 |
| Subtotal/Wtd. Avg. | 224,701 | 63.4% | $6,236,766 | 66.2% | $27.76 | |||
| Remaining Tenants(6) | 109,525 | 30.9% | $3,183,647 | 33.8% | $29.07 | |||
| Vacant Space(7) | 20,155 | 5.7% | $0 | 0.0% | $0.00 | |||
| Total/Wtd. Avg. | 354,381 | 100.0% | $9,420,413 | 100.0% | $28.19 | |||
| (1) | Information is based on the underwritten rent roll. |
| (2) | Ratings provided are for the parent company of the entity listed in the “Tenant Name” field whether or not the parent company guarantees the lease. |
| (3) | Wtd. Avg. Annual UW Base Rent PSF excludes vacant space. |
| (4) | Level 3 Communication, LLC subleases its entire space to Armada Healthcare LLC through March 2020 at a sublease rental rate of $16.00 PSF. Level 3 Communication, LLC’s prime lease rate of $35.25 PSF was underwritten. |
| (5) | Santander Bank, N.A. has a one-time right to terminate effective as of November 2024, upon notice no later than November 2023 and a termination payment of $1,123,188. |
| (6) | Two spaces at the 200 Park Place and 210 Park Place properties totaling 21,733 SF are subleased to two tenants at a weighted average sublease rental rate of $17.65 PSF. The sublessors’ weighted average prime lease rate of $30.14 PSF was underwritten. |
| (7) | Hyman Beck & Company, Inc. leases 2,105 SF in the 210 Park Place property, which has a lease expiration in July 2018. Its space is currently vacant and the tenant is paying all obligations under its lease, however, such space is underwritten as vacant. |
THE INFORMATION IN THIS COLLATERAL TERM SHEET IS NOT COMPLETE AND MAY BE AMENDED PRIOR TO THE TIME OF SALE. THIS TERM SHEET IS NOT AN OFFER TO SELL THESE SECURITIES AND IT IS NOT A SOLICITATION OF AN OFFER TO BUY THESE SECURITIES IN ANY JURISDICTION WHERE THE OFFER OR SALE IS NOT PERMITTED.
65
Various Florham Park, NJ 07932
| Collateral Asset Summary – Loan No. 6 Park Place at Florham Park
| Cut-off Date Balance: Cut-off Date LTV Ratio: UW NCF DSCR: UW NOI Debt Yield: | $45,000,000 65.1% 1.80x 10.6% |
The following table presents certain information relating to the lease rollover schedule at the Park Place at Florham Park Property:
| Lease Rollover Schedule(1)(2) | ||||||||
| Year | # of Leases Rolling | SF Rolling | Approx. % of Total SF Rolling | Approx. Cumulative % of SF Rolling | UW Base Rent PSF Rolling(3) | Total UW Base Rent Rolling | Approx. % of Total Rent Rolling | Approx. Cumulative % of Total Rent Rolling |
| MTM | 0 | 0 | 0.0% | 0.0% | $0.00 | $0 | 0.0% | 0.0% |
| 2018 | 0 | 0 | 0.0% | 0.0% | $0.00 | $0 | 0.0% | 0.0% |
| 2019 | 1 | 6,290 | 1.8% | 1.8% | $22.00 | $138,380 | 1.5% | 1.5% |
| 2020(4) | 2 | 44,387 | 12.5% | 14.3% | $34.13 | $1,514,877 | 16.1% | 17.5% |
| 2021(5) | 3 | 38,280 | 10.8% | 25.1% | $30.80 | $1,178,873 | 12.5% | 30.1% |
| 2022 | 5 | 53,354 | 15.1% | 40.2% | $30.95 | $1,651,272 | 17.5% | 47.6% |
| 2023 | 1 | 8,472 | 2.4% | 42.5% | $25.00 | $211,800 | 2.2% | 49.8% |
| 2024 | 3 | 20,213 | 5.7% | 48.3% | $29.00 | $586,177 | 6.2% | 56.1% |
| 2025 | 0 | 0 | 0.0% | 48.3% | $0.00 | $0 | 0.0% | 56.1% |
| 2026 | 0 | 0 | 0.0% | 48.3% | $0.00 | $0 | 0.0% | 56.1% |
| 2027 | 1 | 30,563 | 8.6% | 56.9% | $29.50 | $901,609 | 9.6% | 65.6% |
| 2028 | 5 | 132,667 | 37.4% | 94.3% | $24.40 | $3,237,426 | 34.4% | 100.0% |
| 2029 & Beyond | 0 | 0 | 0.0% | 94.3% | $0.00 | $0 | 0.0% | 100.0% |
| Vacant(6) | 0 | 20,155 | 5.7% | 100.0% | $0.00 | $0 | 0.0% | 100.0% |
| Total/Wtd. Avg. | 21 | 354,381 | 100.0% | $28.19 | $9,420,413 | 100.0% | ||
| (1) | Information is based on the underwritten rent roll. |
| (2) | Certain tenants may have lease termination options that are exercisable prior to the originally stated expiration date of the subject lease and that are not considered in the lease rollover schedule. |
| (3) | Wtd. Avg. UW Base Rent PSF Rolling excludes vacant space. |
| (4) | Level 3 Communication, LLC subleases its entire space to Armada Healthcare LLC through March 2020 at a sublease rental rate of $16.00 PSF. Level 3 Communication, LLC’s prime lease rate of $35.25 PSF was underwritten. Sun National Bank subleases its entire space to Points Group, LLC at a sublease rental rate of $17.50 PSF through May 2018, which increases to $18.50 PSF thereafter through the sublease expiration date in May 2020. Sun National Bank’s prime lease rate of $30.00 PSF was underwritten. |
| (5) | CCG Holdings, LLC (“Clearview Cinemas”) subleases its entire space to DataMotion, Inc. through August 2021 at a current sublease rental rate of $17.00 PSF with annual rent increases of $0.50 PSF. Clearview Cinemas’ prime lease rate of $30.25 PSF was underwritten. |
| (6) | Hyman Beck & Company, Inc. leases 2,105 SF in the 210 Park Place property, which has a lease expiration in July 2018. Its space is currently vacant and the tenant is paying all obligations under its lease, however, such space is underwritten as vacant. |
The Market. The Park Place at Florham Park Property is located in Florham Park, New Jersey, located just off Route 24, a highway connecting Interstates 287 and 78. The Park Place at Florham Park Property also benefits from its close proximity to downtown Morristown, Madison and Florham Park, which include a diverse mix of commercial and retail establishments to serve the needs of nearby residents and office workers, as well as regional and interstate highways. Additionally, the Park Place at Florham Park Property is located approximately 29.5 miles west of New York City and 20.4 miles west of Newark Liberty International Airport.
Development in the area is predominantly of Class A office space primarily for single-tenant/owner-user, hotel, and multifamily uses. The largest proposed redevelopment within the area is the redevelopment of a 147-acre site at the intersection of Park Avenue and Columbia Turnpike, the location of the former Honeywell Corporate Headquarters, into 235 residential townhomes, 715,000 SF of corporate headquarters office space and preservation of approximately 15 acres as open space. The Green at Florham Park is a 268-acre master planned development into single-tenant and multi-tenant occupancy office space, a 256-unit furnished rental corporate suites community, a 161-room Archer boutique hotel, a 120,000 SF Jets training facility, and more.
According to a third party research report, the estimated 2017 population within a three- and five-mile radius of the Park Place at Florham Park Property is 50,317 and 150,471, respectively. The estimated 2017 average household income within a three- and five-mile radius of the Park Place at Florham Park Property is $184,562 and $181,217, respectively, compared to New Jersey’s average household income of $107,672.
The Park Place at Florham Park Property is physically located in the Florham Park submarket, however, the immediate area also encompasses portions of the Morristown office submarket. Within this region, the Route 24 Corridor is defined as one of the most desirable locations for high quality office buildings in Northern New Jersey, according to the appraisal. The Park Place at Florham Park Property is also considered to be located within the Route 24 Corridor, and it directly competes with the higher quality office space along this corridor, which extends from Interstate Route 287 to the west, to Interstate Route 78 to the east. The Route 24 Corridor generally encompasses portions of the towns of Summit, Short Hills, Livingston, Florham Park, Chatham, Madison, and Morristown. According to Costar, there are 55 office properties located along the Route 24 Corridor with net rentable area greater than 55,000 SF. The properties total 9.6 million SF and reported an average asking rental rate of $30.15 PSF as of July 2017. The Route 24 Corridor vacancy rate of 7.0% is below the Florham Park Class A submarket vacancy rate of 15.1%.
The appraisal identified 16 comparable office properties ranging in size from 105,607 SF to 431,495 SF, which are similar in class, quality, tenancy and location to the Park Place at Florham Park Property.
THE INFORMATION IN THIS COLLATERAL TERM SHEET IS NOT COMPLETE AND MAY BE AMENDED PRIOR TO THE TIME OF SALE. THIS TERM SHEET IS NOT AN OFFER TO SELL THESE SECURITIES AND IT IS NOT A SOLICITATION OF AN OFFER TO BUY THESE SECURITIES IN ANY JURISDICTION WHERE THE OFFER OR SALE IS NOT PERMITTED.
66
Various Florham Park, NJ 07932
| Collateral Asset Summary – Loan No. 6 Park Place at Florham Park
| Cut-off Date Balance: Cut-off Date LTV Ratio: UW NCF DSCR: UW NOI Debt Yield: | $45,000,000 65.1% 1.80x 10.6% |
The following table presents certain information relating to the directly competitive properties with respect to the Park Place at Florham Park Property:
| Comparable Office Properties | ||||||
| Property Name / Location | Address | Submarket | Net Rentable Area (SF) | Year Built | Rent PSF ($) | Vacancy Rate (%) |
| Park Place at Florham Park Property | 200, 210, 220, 230 Park Place | Florham Park | 354,381(1) | 1974 - 1976 | $28.19(1) | 5.7%(1) |
| Park Ave At Morris County | 100 Campus Drive | Florham Park | 392,867 | 1989 | $35.00 - $37.00 | 45.7%(2) |
| Park Ave At Morris County | 200 Campus Drive | Florham Park | 203,885 | 1989 | $35.00 - $37.00 | 17.2% |
| Park Ave At Morris County | 300 Campus Drive | Florham Park | 106,261 | 1998 | $35.00 - $37.00 | 9.8% |
| Park Ave At Morris County | 400 Campus Drive | Florham Park | 181,938 | 1997 | $35.00 - $37.00 | 0.0% |
| Park Ave At Morris County | 500 Campus Drive | Florham Park | 185,337 | 1999 | $35.00 - $37.00 | 15.9% |
| Park Ave At Morris County | 600 Campus Drive | Florham Park | 105,607 | 1989 | $35.00 - $37.00 | 9.8% |
| The Green @ Florham Park | 170-180 Park Avenue | Florham Park | 368,780 | 2012 | $28.50 - $29.50 | 73.0%(2) |
| Florham Park Corporate Center | 25 A&B Vreeland Road | Florham Park | 230,000 | 1983 | $21.00 | 20.0% |
| Mack Cali Business Campus | 325 Columbia Turnpike | Florham Park | 168,144 | 1987 | $29.00 | 5.4% |
| Southgate 435 | 435 South Street | Morristown | 189,000 | 1982 | $29.00 - $32.00 | 0.0% |
| Southgate 475 | 475 South Street | Morristown | 210,000 | 1980 | $29.00 - $32.00 | 0.0% |
| Lexington Garden/Southgate | 465 South Street | Morristown | 140,581 | 1988 | $29.00 - $32.00 | 0.0% |
| Blackberry Corp I | 100 Southgate Parkway | Morristown | 148,790 | 1982 | $29.00 - $32.00 | 29.9% |
| Giralda Farms | 3 Giralda Farms | Madison | 141,000 | 1990 | $35.00 | 100.0%(2) |
| Giralda Farms | 5 Giralda Farms | Madison | 431,495 | 1992 | $35.00 | 0.0% |
| Giralda Farms | 7 Giralda Farms | Madison | 203,182 | 2000 | $35.00 | 43.7%(2) |
| Total/Wtd. Avg.(3) | 3,406,867 | $32.55 | 25.3% | |||
Source:Appraisal
| (1) | Based on the underwritten rent roll. |
| (2) | Four properties in the competitive set, which have the highest vacancy rates, are increasing the weighted average vacancy rate due to recent single tenant departures or planned renovations with intentional vacancies: 100 Campus Drive and 3 Giralda Farms reflect the vacating of single tenants, 170-180 Park Avenue are planned to undergo a substantial renovation in 2018, 7 Giralda Farms reflects the relocation of a tenant to another property within the Morristown submarket. Excluding these properties, the competitive set's weighted average vacancy is 8.0%. |
| (3) | Total/Wtd. Avg. excludes the Park Place at Florham Park Property. |
Operating History and Underwritten Net Cash Flow. The following table presents certain information relating to the historical operating performance and the Underwritten Net Cash Flow at the Park Place at Florham Park Property:
| Cash Flow Analysis | ||||||
| 2014 | 2015(1) | 2016(1) | 9/30/2017 TTM(1) | UW(1) | UW PSF | |
| Gross Potential Rent(2) | $8,994,416 | $8,934,810 | $6,517,277 | $7,565,464 | $10,377,901 | $29.28 |
| Total Recoveries | $1,010,123 | $990,650 | $654,905 | $1,229,882 | $1,249,446 | $3.53 |
| Other Income(3) | $36,326 | $25,733 | $104,069 | $187,922 | $67,130 | $0.19 |
| Less Vacancy & Credit Loss | ($407,924) | ($341,310) | ($271,991) | ($1,282,465) | ($848,422) | ($2.39) |
| Effective Gross Income | $9,632,941 | $9,609,883 | $7,004,260 | $7,700,803 | $10,846,056 | $30.61 |
| Total Operating Expenses | $4,353,741 | $4,488,167 | $3,906,279 | $4,190,109 | $4,239,641 | $11.96 |
| Net Operating Income | $5,279,200 | $5,121,716 | $3,097,981 | $3,510,694 | $6,606,415 | $18.64 |
| Capital Expenditures | $0 | $0 | $0 | $0 | $133,267 | $0.38 |
| TI/LC | $0 | $0 | $0 | $0 | $673,348 | $1.90 |
| Net Cash Flow | $5,279,200 | $5,121,716 | $3,097,981 | $3,510,694 | $5,799,800 | $16.37 |
| Occupancy %(4) | 89.4% | 78.4% | 92.2% | 94.3% | 94.3% | |
| NOI DSCR(5) | 1.64x | 1.59x | 0.96x | 1.09x | 2.05x | |
| NCF DSCR(5) | 1.64x | 1.59x | 0.96x | 1.09x | 1.80x | |
| NOI Debt Yield(5) | 8.4% | 8.2% | 5.0% | 5.6% | 10.6% | |
| NCF Debt Yield(5) | 8.4% | 8.2% | 5.0% | 5.6% | 9.3% | |
| (1) | The decline in Net Operating Income from 2015 to 2016 is due to the vacating of two tenants, which accounted for approximately 76,000 SF, from the 200 Park Place property. Furthermore, the borrower sponsors continued to vacate expiring tenants at 200 Park Place while renovations where being completed at the 200 Park Place property in order to increase rental rates. Subsequently, the recovery of Net Operating Income is related to leasing activity following the completion of renovations and capital improvements at the Park Place at Florham Park Property and expiring free rent periods. In 2017, the borrower sponsors signed three new leases with RBC Capital Markets LLC (14.9% of NRA, 16.5% of underwritten base rent), Viner Finance (3.4% of NRA, 3.8% of underwritten base rent) and Normandy FundSub Mgmt Co., LLC (1.8% of NRA, 1.5% of underwritten base rent). |
| (2) | UW Gross Potential Rent is based on the underwritten rent roll and includes (i) rent steps through January 2019 of $114,143, (ii) vacancy gross up of $602,545, and (iii) straight line rent of $354,944 associated with investment grade tenants. |
| (3) | Other Income includes miscellaneous income and tenant services reimbursement. |
| (4) | UW Occupancy % is based on economic vacancy of 7.3%. The appraisal concluded stabilized vacancy and collection loss allowance of 7.0% The Park Place at Florham Park Property was 94.9% leased as of December 6, 2017 and 94.3% physically occupied. |
| (5) | Debt service coverage ratios and debt yields are based on the Park Place at Florham Park Whole Loan. |
THE INFORMATION IN THIS COLLATERAL TERM SHEET IS NOT COMPLETE AND MAY BE AMENDED PRIOR TO THE TIME OF SALE. THIS TERM SHEET IS NOT AN OFFER TO SELL THESE SECURITIES AND IT IS NOT A SOLICITATION OF AN OFFER TO BUY THESE SECURITIES IN ANY JURISDICTION WHERE THE OFFER OR SALE IS NOT PERMITTED.
67
Various Florham Park, NJ 07932
| Collateral Asset Summary – Loan No. 6 Park Place at Florham Park
| Cut-off Date Balance: Cut-off Date LTV Ratio: UW NCF DSCR: UW NOI Debt Yield: | $45,000,000 65.1% 1.80x 10.6% |
Escrows and Reserves. The Park Place at Florham Park Borrower deposited in escrow at loan origination (i) $168,292 for real estate taxes, (ii) $29,273 for insurance premiums, (iii) 37,500 for deferred maintenance and (iv) $5,044,401 for unfunded obligations with respect to outstanding tenant improvements ($3,880,114), leasing commissions ($9,565) and free rent ($1,154,722). The Park Place at Florham Park Borrower is required to escrow monthly (i) 1/12 of the annual estimated tax payments, (ii) 1/12 of the annual insurance premiums, (iii) $5,906 for capital expenditures, (iv) $44,298 for tenant improvements and leasing commissions, subject to a cap of $2,000,000, and (v) on each monthly payment date commencing in February 2027 through and including the monthly payment date in November 2027, $2,437 for environmental insurance premium coverage.
Lockbox and Cash Management. A hard lockbox is in place with respect to the Park Place at Florham Park Whole Loan. The Park Place at Florham Park Whole Loan has springing cash management during the continuance of a Cash Management Trigger Event (as defined below). During the continuance of a Cash Management Trigger Event, funds in the lockbox account are required to be swept to the cash management account on each business day, to be applied on each monthly payment date to fund the required reserves deposits as described above under “Escrows and Reserves,” to pay debt service on the Park Place at Florham Park Whole Loan, to pay operating and extraordinary expenses, to pay debt service on the Park Place at Florham Park Mezzanine Loan, and during the continuance of a Material Tenant Trigger Event (as defined below), to escrow monthly excess cash flow into a Material Tenant Rollover account until the balance of such account equals or exceeds the Material Tenant Rollover Funds Cap (as defined below). Provided no Material Tenant Trigger Event exists and during the continuance of a Cash Sweep Trigger Event (as described below), excess cash flow is required to be swept into an excess cash flow account, or if a Cash Sweep Trigger Event is caused solely by an event of default under the Park Place at Florham Park Mezzanine Loan, into a mezzanine loan subaccount.
A “Cash Management Trigger Event” will occur upon (i) an event of default, (ii) any bankruptcy action involving the Park Place at Florham Park Borrower, the guarantor, or the affiliated property manager, (iii) the debt service coverage ratio based on the Park Place at Florham Park Whole Loan falling below 1.50x, (iv) the aggregate debt service coverage ratio based on the Park Place at Florham Park Whole Loan and the Park Place at Florham Park Mezzanine Loan falling below 1.10x, (v) a Material Tenant Trigger Event, (vi) any indictment for fraud or misappropriation of funds by the Park Place at Florham Park Borrower, the guarantor, or the affiliated property manager or related officer or director or (vii) event of default under the Park Place at Florham Park Mezzanine Loan. A Cash Management Trigger Event will continue until, in regard to clause (i) or (vii) above, the cure of such event of default (or the waiver of such default) by the lender, in regard to clause (ii) above, the filing being discharged, stayed or dismissed within 90 days for the Park Place at Florham Park Borrower or the guarantor (or the guarantor has been replaced by a guarantor acceptable to the lender), or within 120 days for the property manager (or the manager has been replaced by a qualified manager), and the lender’s determination that such filing does not materially affect the monetary obligations of the Park Place at Florham Park Borrower, the guarantor, or the property manager, in regard to clause (iii) above, the debt service coverage ratio is at least 1.55x for two consecutive quarters, in regard to clause (iv) above, the aggregate debt service coverage ratio is at least 1.15x for two consecutive quarters, in regard to clause (v) above, a Material Tenant Trigger Event cure, or in regard to clause (vi) above, dismissal of the related indictment for the Park Place at Florham Park Borrower, or replacement of the guarantor or property manager with a replacement guarantor or a qualified manager pursuant to the loan documents.
A “Cash Sweep Trigger Event” will occur upon (i) an event of default, (ii) any bankruptcy action involving the Park Place at Florham Park Borrower, the guarantor, or the affiliated property manager, (iii) the debt service coverage ratio based on the Park Place at Florham Park Whole Loan falling below 1.50x, (iv) the aggregate debt service coverage ratio based on the Park Place at Florham Park Whole Loan and the Park Place at Florham Park Mezzanine Loan falling below 1.10x, or (v) event of default under the Park Place at Florham Park Mezzanine Loan. A Cash Sweep Trigger Event will continue until, in regard to clause (i) or (v) above, the cure of such event of default (or the waiver of such default) by the lender, in regard to clause (ii) above, the filing being discharged, stayed or dismissed within 90 days for the Park Place at Florham Park Borrower or the guarantor (or the guarantor has been replaced by a guarantor acceptable to the lender), or within 120 days for the property manager (or the manager has been replaced by a qualified manager), and the lender’s determination that such filing does not materially affect the monetary obligations of the Park Place at Florham Park Borrower, the guarantor, or the property manager, in regard to clause (iii) above, the debt service coverage ratio is at least 1.55x for two consecutive quarters, and in regard to clause (iv) above, the aggregate debt service coverage ratio is at least 1.15x for two consecutive quarters.
A “Material Tenant Trigger Event” will occur upon (i) a Material Tenant (as defined below) giving written notice of its intent to terminate, cancel, not extend or not renew its Material Tenant lease, and will continue until, (a) an acceptable Material Tenant lease extension, (b) one or more acceptable Material Tenant space re-tenanting events or (c) the unconditional revocation of all termination and cancellation notices, is accepted by the lender with respect to all or substantially all of such Material Tenant space, (ii) a Material Tenant not extending or renewing its Material Tenant lease on or prior to the date that is the earlier of 12 months prior to the (x) maturity date of the Park Place at Florham Park Whole Loan or (y) the then applicable expiration date under the Material Tenant lease, and will continue until, (a) an acceptable Material Tenant lease extension, (b) one or more acceptable Material Tenant space re-tenanting events or (c) an acceptable new lease scheduled to generate annual rents that are not less than rental rates comparable to existing local market rates for properties similar to the Park Place at Florham Park Property, is accepted by the lender with respect to all or substantially all of such Material Tenant space, (iii) a Material Tenant failing to give notice of its extension or renewal on or prior to the date required under its Material Tenant lease, and will continue until, (a) an acceptable Material Tenant lease extension, (b) one or more acceptable Material Tenant space re-tenanting events or (c) an acceptable new lease scheduled to generate annual rents that are not less than rental rates comparable to existing local market rates for properties similar to the Park Place at Florham Park Property, is accepted by the lender with respect to all or substantially all of such Material Tenant space, (iv) an event of default under a Material Tenant lease beyond any applicable notice and cure period, and will continue until the applicable event of default has been cured, (v) a Material Tenant or lease guarantor of the Material Tenant’s lease becoming insolvent or a debtor in any bankruptcy action, and will continue until the Material Tenant’s lease is unconditionally affirmed in the applicable bankruptcy and the Material Tenant is paying full unabated rent or, if applicable, the guarantor bankruptcy has been discharged or dismissed, (vi) a Material Tenant’s lease being terminated, (vii) a Material Tenant (other than a Material Tenant that is rated “BBB-” or better by rating agencies) “going dark,” vacating, ceasing to occupy or discontinuing its operations at the space demised under the Material Tenant lease, unless all or substantially all of the affected space has been sublet by a subtenant pursuant to a sublease with requirements as specified in the loan agreement, and will continue until (a) the applicable Material Tenant is in actual possession of and utilizing the Material Tenant space and is paying full unabated rent, (b) one or more acceptable Material Tenant space re-tenanting events with respect to all or substantially all of such Material Tenant space or (c) an acceptable new lease scheduled to generate annual rents that are not less than rental rates comparable to existing local market rates for properties similar to the Park Place at Florham Park Property, is accepted by the lender with respect to all or substantially all of such Material Tenant space.
A “Material Tenant Rollover Funds Cap” means an aggregate amount equal to $42.50 PSF of each applicable Material Tenant space relating to any outstanding Material Tenant Trigger Event.
THE INFORMATION IN THIS COLLATERAL TERM SHEET IS NOT COMPLETE AND MAY BE AMENDED PRIOR TO THE TIME OF SALE. THIS TERM SHEET IS NOT AN OFFER TO SELL THESE SECURITIES AND IT IS NOT A SOLICITATION OF AN OFFER TO BUY THESE SECURITIES IN ANY JURISDICTION WHERE THE OFFER OR SALE IS NOT PERMITTED.
68
Various Florham Park, NJ 07932
| Collateral Asset Summary – Loan No. 6 Park Place at Florham Park
| Cut-off Date Balance: Cut-off Date LTV Ratio: UW NCF DSCR: UW NOI Debt Yield: | $45,000,000 65.1% 1.80x 10.6% |
A “Material Tenant” means (i) Fairleigh Dickinson University, (ii) RBC Capital Markets, LLC or (iii) any tenant which, either individually or when taken together with any other lease with the same tenant or an affiliate of such tenant, comprises 15% or more of either (a) the total rentable SF at the Park Place at Florham Park Property or (b) the total in-place base rent at the Park Place at Florham Park Property.
Additional Secured Indebtedness (not including trade debts).Not permitted.
Mezzanine Loan and Preferred Equity.The Park Place at Florham Park Mezzanine Loan is secured by the equity in the Park Place at Florham Park Borrower. The Park Place at Florham Park Mezzanine Loan has an original principal balance $12,500,000, accrues interest at a rate of 6.5000%, amortizes over a 120-month term and is coterminous with the Park Place at Florham Park Whole Loan. Including the Park Place at Florham Park Whole Loan and the Park Place at Florham Park Mezzanine Loan, the cumulative Cut-off Date LTV Ratio, cumulative UW NCF DSCR and cumulative UW NOI Debt Yield are 78.1%, 1.18x and 8.8%, respectively. The Park Place at Florham Park Whole Loan lender and Park Place at Florham Park Mezzanine Loan lender have entered into an intercreditor agreement.
Release of Development Parcel.Provided no event of default has occurred and is continuing, the Park Place at Florham Park Borrower has the one-time right to obtain the release of one of the unimproved portions of the Park Place at Florham Park Property as identified in the Park Place at Florham Park Whole Loan documents,provided that, among other things: (i) the Park Place at Florham Park Borrower provides 30 days’ prior notice; (ii) the Park Place at Florham Park Borrower continues to qualify as a single purpose, bankruptcy remote entity; and (iii) the Park Place at Florham Park Borrower enters into reciprocal easements, cross-easements and mutual or non-exclusive easements reasonably necessary for ingress, egress, access, pedestrian walkways, parking, traffic flow, drainage, utilities and services and which agreements limit the uses of the released parcel to retail, residential, for sale residential condominiums or hotel uses.
Release of Individual Property. The Park Place at Florham Park Borrower may defease a portion of the Park Place at Florham Park Whole Loan and release an Individual Property (i) at any time on or after the Permitted Release Date (as defined above) and only in connection with a bona fide sale of an Individual Property to an unaffiliated third party or (ii) in connection with a casualty or condemnation mandatory prepayment affecting an Individual Property, provided that, among other things: (a) no event of default has occurred and is continuing; (b) the Park Place at Florham Park Borrower provides 30 days’ prior notice; (c) the Park Place at Florham Park Borrower defeases a portion of the Park Place at Florham Park Whole Loan equal to the greater of (x) 120% of the outstanding allocated loan amount of the Individual Property being released and (y) the lender’s share of the net sales proceeds; (d) the debt service coverage ratio for the remaining Individual Properties following the release based on the trailing 12 months is no less than the greater of the debt service coverage ratio immediately preceding such release and 1.75x; (e) the loan-to-value ratio for the remaining Individual Properties is no greater than the lesser of the loan-to-value ratio immediately preceding such release and 65.1%; and (f) the net cash flow debt yield for the remaining Individual Properties is no less than the greater of the net cash flow debt yield immediately preceding such release and 9.0%. See “Description of the Mortgage Pool—Mortgage Pool Characteristics—Releases; Partial Releases” in the Preliminary Prospectus.
Terrorism Insurance. The Park Place at Florham Park Borrower is required to obtain insurance against acts of terrorism for loss resulting from perils and acts of terrorism in amounts and with terms and conditions applicable to commercial property, general liability, business income and umbrella liability insurance required pursuant to the Park Place at Florham Park Whole Loan documents.
THE INFORMATION IN THIS COLLATERAL TERM SHEET IS NOT COMPLETE AND MAY BE AMENDED PRIOR TO THE TIME OF SALE. THIS TERM SHEET IS NOT AN OFFER TO SELL THESE SECURITIES AND IT IS NOT A SOLICITATION OF AN OFFER TO BUY THESE SECURITIES IN ANY JURISDICTION WHERE THE OFFER OR SALE IS NOT PERMITTED.
69
500 12th Street & 499, 501, 525 14th Oakland, CA 94612 | Collateral Asset Summary – Loan No. 7 City Square and Clay Street | Cut-off Date Balance: Cut-off Date LTV Ratio: UW NCF DSCR: UW NOI Debt Yield: | 8.9% |
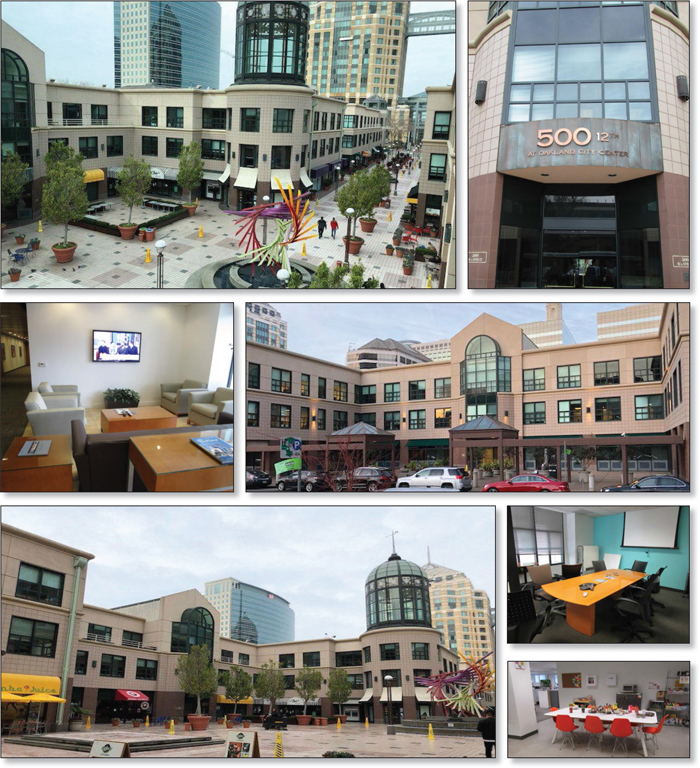
THE INFORMATION IN THIS COLLATERAL TERM SHEET IS NOT COMPLETE AND MAY BE AMENDED PRIOR TO THE TIME OF SALE. THIS TERM SHEET IS NOT AN OFFER TO SELL THESE SECURITIES AND IT IS NOT A SOLICITATION OF AN OFFER TO BUY THESE SECURITIES IN ANY JURISDICTION WHERE THE OFFER OR SALE IS NOT PERMITTED.
70
500 12th Street & 499, 501, 525 14th Oakland, CA 94612 | Collateral Asset Summary – Loan No. 7 City Square and Clay Street | Cut-off Date Balance: Cut-off Date LTV Ratio: UW NCF DSCR: UW NOI Debt Yield: | 8.9% |

THE INFORMATION IN THIS COLLATERAL TERM SHEET IS NOT COMPLETE AND MAY BE AMENDED PRIOR TO THE TIME OF SALE. THIS TERM SHEET IS NOT AN OFFER TO SELL THESE SECURITIES AND IT IS NOT A SOLICITATION OF AN OFFER TO BUY THESE SECURITIES IN ANY JURISDICTION WHERE THE OFFER OR SALE IS NOT PERMITTED.
71
500 12th Street & 499, 501, 525 14th Oakland, CA 94612 | Collateral Asset Summary – Loan No. 7 City Square and Clay Street | Cut-off Date Balance: Cut-off Date LTV Ratio: UW NCF DSCR: UW NOI Debt Yield: | 8.9% |
| Mortgage Loan Information | Property Information | ||||||
| Mortgage Loan Seller: | Ladder Capital Finance LLC | Single Asset/Portfolio: | Single Asset | ||||
| Original Balance(1): | $45,000,000 | Location: | Oakland, CA | ||||
| Cut-off Date Balance(1): | $45,000,000 | General Property Type: | Mixed Use | ||||
| % of Initial Pool Balance: | 4.3% | Detailed Property Type: | Office/Garage/Retail | ||||
| Loan Purpose: | Refinance | Title Vesting: | Fee | ||||
| Borrower Sponsor: | John Ziegler | Year Built/Renovated: | 1986,1992/ N/A | ||||
| Mortgage Rate: | 4.7280% | Size(4): | 246,136 SF | ||||
| Note Date: | 1/25/2018 | Cut-off Date Balance per SF(1)(4): | $366 | ||||
| First Payment Date: | 3/6/2018 | Maturity Date Balance per SF(1)(4): | $366 | ||||
| Maturity Date: | 2/6/2028 | Property Manager: | STG Asset Management, Inc. (borrower-related) | ||||
| Original Term to Maturity: | 120 months | ||||||
| Original Amortization Term: | 0 months | ||||||
| IO Period: | 120 months | ||||||
| Seasoning: | 0 months | ||||||
| Prepayment Provisions(2): | LO (24); DEF (93); O (3) | Underwriting and Financial Information | |||||
| Lockbox/Cash Mgmt Status: | Hard/In Place | UW NOI(4)(5): | $8,051,219 | ||||
| Additional Debt Type(1): | Pari Passu | UW NOI Debt Yield(1): | 8.9% | ||||
| Additional Debt Balance(1): | $45,000,000 | UW NOI Debt Yield at Maturity(1): | 8.9% | ||||
| Future Debt Permitted (Type): | No (N/A) | UW NCF DSCR(1): | 1.76x | ||||
| Reserves(3) | Most Recent NOI(5): | $6,637,378 (12/31/2017) | |||||
| Type | Initial | Monthly | Cap | 2nd Most Recent NOI: | $7,015,772 (12/31/2016) | ||
| RE Tax: | $0 | $83,662 | N/A | 3rd Most Recent NOI: | $5,986,480 (12/31/2015) | ||
| Insurance: | $54,080 | $9,013 | N/A | Most Recent Occupancy: | 94.2% (12/31/2017) | ||
| Replacements: | $0 | $7,512 | $450,868 | 2nd Most Recent Occupancy: | 97.2% (12/31/2016) | ||
| Immediate Repairs: | $12,500 | $0 | N/A | 3rd Most Recent Occupancy: | 90.1% (12/31/2015) | ||
| TI/LC: | $2,000,000 | $30,691 | $500,000 | Appraised Value (as of): | $181,000,000 (12/20/2017) | ||
| Free Rent Deposit: | $812,214 | $0 | N/A | Cut-off Date LTV Ratio(1): | 49.7% | ||
| Outstanding Free Rent/TIs: | $1,452,227 | $0 | N/A | Maturity Date LTV Ratio(1): | 49.7% | ||
| Clubsource Litigation | $300,000 | $0 | N/A | ||||
| Sources and Uses | ||||||
| Sources | Proceeds | % of Total | Uses | Proceeds | % of Total | |
| Loan Amount(1): | $90,000,000 | 100.0% | Loan Payoff: | $66,151,802 | 73.5% | |
| Reserves: | $4,631,021 | 5.1% | ||||
| Closing Costs: | $1,231,662 | 1.4% | ||||
| Return of Equity: | $17,985,515 | 20.0% | ||||
| Total Sources: | $90,000,000 | 100.0% | Total Uses: | $90,000,000 | 100.0% | |
| (1) | The City Square and Clay Street Mortgage Loan (as defined below) is part of the City Square and Clay Street Whole Loan (as defined below), which is comprised of fourpari passupromissory notes with an aggregate principal balance of $90,000,000. The Cut-off Date Balance per SF, Maturity Date Balance per SF, UW NOI Debt Yield, UW NOI Debt Yield at Maturity, UW NCF DSCR, Cut-off Date LTV Ratio and Maturity Date LTV Ratio presented above are based on the aggregate principal balance of the promissory notes comprising the City Square and Clay Street Whole Loan. |
| (2) | Prior to the open prepayment date of December 6, 2027, the City Square and Clay Street Whole Loan can be defeased after the earlier to occur of (i) March 6, 2022 and (ii) the first monthly payment date following the end of the two-year period commencing on the closing date of the securitization of the last City Square and Clay Street Whole Loan promissory note. The lockout period for defeasance will be at least 24 payment dates beginning with and including the first payment date of March 6, 2018. For the purposes of this term sheet, the assumed lockout period of 24 months is based on the expected UBS 2018-C8 securitization closing date in February 2018. The actual lockout period may be longer. |
| (3) | See “Escrows and Reserves”below for further discussion of reserve information. |
| (4) | The Size, Cut-off Date Balance per SF and Maturity Date Balance per SF do not include or take into account, as applicable, the parking garage that includes 1,154 parking stalls. |
| (5) | See “Cash Flow Analysis” table. |
The Mortgage Loan. The seventh largest mortgage loan (the “City Square and Clay Street Mortgage Loan”) is part of a whole loan (the “City Square and Clay Street Whole Loan”) evidenced by fourpari passu promissory notes with an aggregate original principal balance of $90,000,000. The City Square and Clay Street Whole Loan is secured by a first priority fee mortgage encumbering four mixed-use buildings totaling 246,136 SF and a 1,154 parking stall garage located in Oakland, California (the “City Square and Clay Street Property”). Promissory Notes A-2 and A-4 with an aggregate original principal balance of $45,000,000, represent the City Square and Clay Street Mortgage Loan and will be included in the UBS 2018-C8 Trust. The controlling Promissory Note A-1 and non-controlling Promissory Note A-3, with an aggregate original principal balance of $45,000,000, are currently held by Ladder Capital Finance LLC, or an affiliate thereof, and are expected to be contributed to one of more future securitization transactions or may be otherwise transferred at any time. The lender provides no assurances that the non-securitized notes will not be split further or reissued with reallocated principal amounts. The City Square and Clay Street Whole Loan will be serviced pursuant to the pooling and servicing agreement for the UBS 2018-C8 Trust until the controllingpari passuPromissory Note A-1 is securitized, whereupon the City Square and Clay Street Whole Loan will be serviced pursuant to the pooling and servicing agreement for such future securitization. See “Description of the Mortgage Pool—The Whole Loans—The Serviced Pari Passu Whole Loans”,“—The Whole Loans—The Non-Serviced Pari Passu Whole Loans” and “Pooling and Servicing Agreement” in the Preliminary Prospectus.
THE INFORMATION IN THIS COLLATERAL TERM SHEET IS NOT COMPLETE AND MAY BE AMENDED PRIOR TO THE TIME OF SALE. THIS TERM SHEET IS NOT AN OFFER TO SELL THESE SECURITIES AND IT IS NOT A SOLICITATION OF AN OFFER TO BUY THESE SECURITIES IN ANY JURISDICTION WHERE THE OFFER OR SALE IS NOT PERMITTED.
72
500 12th Street & 499, 501, 525 14th Oakland, CA 94612 | Collateral Asset Summary – Loan No. 7 City Square and Clay Street | Cut-off Date Balance: Cut-off Date LTV Ratio: UW NCF DSCR: UW NOI Debt Yield: | 8.9% |
| City Square and Clay Street Whole Loan Summary | ||||
| Note | Original Balance | Cut-off Date Balance | Anticipated Note Holder | Controlling Piece |
| Note A-1 | $30,000,000 | $30,000,000 | LCF or an affiliate | Yes |
| Note A-2 | $25,000,000 | $25,000,000 | UBS 2018-C8 | No |
| Note A-3 | $15,000,000 | $15,000,000 | LCF or an affiliate | No |
| Note A-4 | $20,000,000 | $20,000,000 | UBS 2018-C8 | No |
| Total | $90,000,000 | $90,000,000 | ||
The Borrowers and the Borrower Sponsor. The borrowers are STG City Square, LLC and STG Clay Street, LLC (collectively, the “City Square and Clay Street Borrower”), each a single-purpose Delaware limited liability company, with two independent directors. The borrower sponsor and non-recourse carveout guarantor is John Ziegler, an individual.
John Ziegler is a principal of STG Group (“STG”), which is a value-add real estate developer, owner and operator headquartered in Petaluma, California. Since opening in 1985, STG has owned office, retail and industrial properties across the western US with a focus in northern California. As of January 2018, the portfolio has grown to over 4 million SF of office, retail and industrial properties.
The Property. The City Square and Clay Street Property is a 246,136 SF Class A mixed use building and a 1,154 space parking garage located in Downtown Oakland, California, within the Oakland central business district. The City Square and Clay Street Property consists of three different components: City Square (165,145 SF), Clay Street (80,991 SF), and the 1,154 space parking garage. The City Square and Clay Street Property is located at 500 12th Street & 499, 501 and 525 14th Street and 1200 Clay Street. The improvements on the City Square and Clay Street Property were built in 1986 and 1992, respectively, are situated on a 3.8-acre site and include a 1,154 space subterranean parking garage, which results in a parking ratio of 4.7 spaces per 1,000 SF. The City Square and Clay Street Property consists of 151,304 SF of office space, 38,032 SF of retail space, and a 56,800 SF full service fitness gym. The City Square and Clay Street Property is within the City Center District of Downtown Oakland, which is a multi-block district consisting of office and retail as well as a 489 key Marriott Hotel and the Oakland Convention Center. The subject has access to major East Bay freeway systems and I-980 and I-880 are within one mile of the subject and provide access to other Bay Area cities. The tenant base consists of 35 tenants representing national, regional, and local firms. As of December 31, 2017, the City Square and Clay Street Property was 94.2% leased.
Major Tenants.
Clubsource at City Center (56,800 SF, 23.1% of NRA, 13.1% of underwritten base rent).Clubsource at City Center is one of three clubs that operates under Active Wellness, LLC, founded as a wholly owned subsidiary of Active Acquisition Partners in June 2015. Active Wellness, LLC entered into a joint venture with St. Joseph Health and maintains majority interest. The management company operates the Active Sports Clubs in the San Francisco Bay area, as well as more than 45 corporate, residential, medical and community fitness centers across the country. Clubsource at City Center features an indoor cycling studio, squash courts, a basketball court, an indoor running track, and a pool. Clubsource at City Center has been in occupancy since 1995 and has a lease expiration date of November 2020 with no renewal options and no unilateral termination options. Clubsource at City Center pays $18.18 PSF in base rent, which is significantly below the appraiser’s concluded market rent of $33.00 PSF for its space.
Chevron Federal Credit Union (34,592 SF, 14.1% of NRA; 14.2% of underwritten base rent). Chevron Federal Credit Union is a not-for-profit financial institution that provides a variety of services to its members, including checking & savings accounts, real estate loans, auto and personal loans, and credit cards. Chevron Federal Credit Union (“CFCU”) operates as a wholly owned subsidiary of Chevron Corporation (S&P/Moody’s: AA-/Aa2), an American multinational corporation headquartered in San Ramon, CA that is engaged in integrated geothermal energy, oil, and natural gas operations. CFCU has over 7,200 CO-OP shared branches and over 85,000 surcharge free ATMs. Chevron Federal Credit Union has been in occupancy since 2012 at the City Square and Clay Street Property with a lease expiration of June 2022 with two five-year extension options and no termination options.
Kaiser Foundation Health Plan (16,991 SF, 6.9% of NRA, 10.9% of underwritten base rent). Kaiser Foundation Health Plan (S&P/Fitch: AA-/A+) is an operating subsidiary of Kaiser Permanente Inc., which was founded in 1945 and is one of the nation’s largest not-for-profit health plans, serving 11.7 million members. Kaiser Permanente is headquartered in Oakland, CA, and is comprised of three distinct but independent groups, including Kaiser Foundation Health Plan, Kaiser Foundation Hospitals, and The Permanente Medical Groups. Kaiser Foundation Health Plan executed a new lease in October 2017 at the City Square and Clay Street Property and is expected to take occupancy in March 2018 with a lease expiration of May 2028 and two five-year extension options with no termination options.
Ace Parking Management, Inc. (1,154 Parking Spaces): Ace Parking Management, Inc. (“Ace”) provides a full range of parking services and manages every type of parking application, including office, retail, hotel, airport, stadium, arena and event parking. Managing over 450 locations across the United States and servicing nearly 200,000 customers per day, Ace employs more than 4,500 people and is one of the largest parking companies in the United States.
THE INFORMATION IN THIS COLLATERAL TERM SHEET IS NOT COMPLETE AND MAY BE AMENDED PRIOR TO THE TIME OF SALE. THIS TERM SHEET IS NOT AN OFFER TO SELL THESE SECURITIES AND IT IS NOT A SOLICITATION OF AN OFFER TO BUY THESE SECURITIES IN ANY JURISDICTION WHERE THE OFFER OR SALE IS NOT PERMITTED.
73
500 12th Street & 499, 501, 525 14th Oakland, CA 94612 | Collateral Asset Summary – Loan No. 7 City Square and Clay Street | Cut-off Date Balance: Cut-off Date LTV Ratio: UW NCF DSCR: UW NOI Debt Yield: | 8.9% |
The following table presents certain information relating to the leases at the City Square and Clay Street Property:
| Tenant Summary(1) | |||||||
| Tenant Name | Credit Rating (Fitch/Moody’s/S&P)(2) | Tenant SF | Approximate % of SF | Annual UW Base Rent | % of Total Annual UW Base Rent | Annual UW Base Rent PSF | Lease Expiration |
| Parking Tenant | |||||||
| Ace Parking Management, Inc. | NR/NR/NR | NAP | NAP | $3,240,000(3) | NAP | NAP | 6/30/2022 |
| Office Tenants | |||||||
| Clubsource at City Center | NR/NR/NR | 56,800 | 23.1% | $1,032,504 | 13.1% | $18.18 | 11/30/2020 |
| Chevron Federal Credit Union | NR/Aa2/AA- | 34,592 | 14.1% | $1,117,953 | 14.2% | $32.32 | 6/30/2022 |
| Kaiser Foundation Health Plan(4) | A+/NR/AA- | 16,991 | 6.9% | $856,346 | 10.9% | $50.40 | 5/31/2028 |
| OpTerra Energy Services, Inc. | A/A2/A- | 16,830 | 6.8% | $674,715 | 8.6% | $40.09 | 12/31/2021 |
| Langan Engineering & Environmental Services, Inc. | NR/NR/NR | 8,808 | 3.6% | $409,308 | 5.2% | $46.47 | 9/30/2021 |
| Subtotal/Wtd. Avg. | 134,021 | 54.4% | $4,090,826 | 51.9% | $30.52 | ||
| Other Tenants | 97,883 | 39.8% | $3,789,510 | 48.1% | $38.71 | ||
| Vacant Space | 14,232 | 5.8% | $0 | 0.0% | $0.00 | ||
| Total/Wtd. Avg.(5) | 246,136 | 100.0% | $7,880,336 | 100.0% | $33.98 | ||
| (1) | Information is based on the underwritten rent roll unless otherwise noted. |
| (2) | Certain ratings are those of the parent company whether or not the parent guarantees the lease. |
| (3) | Base Rent associated with the parking garage was underwritten in Other Income. See “Cash Flow Analysis” table. |
| (4) | Kaiser Foundation Health Plan has executed its lease but is not yet in occupancy. Kaiser Foundation Health Plan is expected to take occupancy in March 2018 and commence rental payments in October 2018. |
| (5) | Wtd. Avg. Annual UW Base Rent PSF excludes vacant space. Total/Wtd. Avg. excludes Annual U/W Base Rent associated with the parking garage. |
The following table presents certain information relating to the lease rollover schedule at the City Square and Clay Street Property:
| Lease Rollover Schedule(1)(2) | ||||||||
| Year | # of Leases Rolling | SF Rolling | Approx. % of Total SF Rolling | Approx. Cumulative % of SF Rolling | UW Base Rent PSF Rolling(3) | Total UW Base Rent Rolling(3) | Approx. % of Total Base Rent Rolling | Approx. Cumulative % of Total Base Rent Rolling |
| MTM | 0 | 0 | 0% | 0.0% | $0.00 | $0 | 0.0% | 0.0% |
| 2018 | 3 | 4,116 | 1.7% | 1.7% | $31.20 | $128,401 | 1.6% | 1.6% |
| 2019 | 4 | 14,814 | 6.0% | 7.7% | $38.23 | $566,390 | 7.2% | 8.8% |
| 2020 | 10 | 86,902 | 35.3% | 43.0% | $25.76 | $2,238,544 | 28.4% | 37.2% |
| 2021 | 5 | 39,623 | 16.1% | 59.1% | $39.10 | $1,549,313 | 19.7% | 56.9% |
| 2022 | 8 | 52,181 | 21.2% | 80.3% | $34.90 | $1,821,345 | 23.1% | 80.0% |
| 2023 | 1 | 1,030 | 0.4% | 80.7% | $36.00 | $37,080 | 0.5% | 80.5% |
| 2024 | 1 | 6,432 | 2.6% | 83.3% | $35.16 | $226,149 | 2.9% | 83.3% |
| 2025 | 1 | 1,500 | 0.6% | 83.9% | $32.92 | $49,380 | 0.6% | 84.0% |
| 2026 | 0 | 0 | 0.0% | 83.9% | $0.00 | $0 | 0.0% | 84.0% |
| 2027 | 1 | 1,572 | 0.6% | 84.6% | $32.67 | $51,357 | 0.7% | 84.6% |
| 2028 & Beyond | 3 | 23,734 | 9.6% | 94.2% | $0.00 | $1,212,377 | 15.4% | 100.0% |
| Vacant | 0 | 14,232 | 5.8% | 100.0% | $0.00 | $0 | 0.0% | 100.0% |
| Total/Wtd. Avg. | 37 | 246,136 | 100.0% | $33.98 | $7,880,336 | 100.0% | ||
| (1) | Information is based on the underwritten rent roll. |
| (2) | Certain tenants may have lease termination options that are exercisable prior to the originally stated expiration date of the subject lease and that are not considered in the lease rollover schedule. |
| (3) | UW Base Rent PSF Rolling and Total UW Base Rent Rolling excludes vacant space. |
THE INFORMATION IN THIS COLLATERAL TERM SHEET IS NOT COMPLETE AND MAY BE AMENDED PRIOR TO THE TIME OF SALE. THIS TERM SHEET IS NOT AN OFFER TO SELL THESE SECURITIES AND IT IS NOT A SOLICITATION OF AN OFFER TO BUY THESE SECURITIES IN ANY JURISDICTION WHERE THE OFFER OR SALE IS NOT PERMITTED.
74
500 12th Street & 499, 501, 525 14th Oakland, CA 94612 | Collateral Asset Summary – Loan No. 7 City Square and Clay Street | Cut-off Date Balance: Cut-off Date LTV Ratio: UW NCF DSCR: UW NOI Debt Yield: | 8.9% |
The Market. The City Square and Clay Street Property is located in the Oakland-East Bay metro area. According to the appraisal, significant increases in rents for San Francisco commercial space between 2010 and 2015 has led to a migration of tenants into the Oakland and the emerging East Bay submarkets. The City Square and Clay Street Property is located in Alameda County, which is four miles east of San Francisco. Alameda County had an estimated 2017 population of 1,647,386, which represented an average annual increase of 1.2% year over year since 2010, exceeding the annual growth rate of San Francisco of 1.1%. Between 2006 and 2017, employment in Alameda County increased by 73,780 jobs, which was a 10.7% increase over the same period. The City Square and Clay Street Property is located 5.3 miles from University of California, Berkley, which employs approximately 23,962 people.
The City Square and Clay Street Property is located adjacent to the City Center BART mass transit station on Broadway. Downtown San Francisco’s Embarcadero BART station is two spots and less than a 14-minute transit ride from this stop. The City Center BART station is the 5th busiest BART station in the Bay area. Bus service is also available to San Francisco and East Bay locations, and ferry service to San Francisco is available at Jack London Square, approximately one mile south of the City Square and Clay Street Property.
According to the appraisal, the City Square and Clay Street Property is located within the Oakland-East Bay Class A submarket. As of the third quarter 2017, the Oakland-East Bay Class A office market consisted of 26,682,000 SF of inventory, with net absorption of 173,000 SF. According to a third party market research report, the estimated 2017 population within a one-, three-, and five-mile radius of the City Square and Clay Street Property was 38,030, 246,081, 492,328, respectively, and the 2017 estimated median household income within the same one-, three-, and five-mile radius is $36,192, $55,809, and $60,236, respectively. The Oakland-East Bay Class A office submarket reported a vacancy rate of 8.2%, which has decreased from 9.8% in 2011. Also according to the appraisal, asking office rents averaged $36.51 and have increased 25.3% since 2011.The appraiser concluded a market rent of $51.00 PSF for the office space and $36.00 PSF for the retail space at the City Square and Clay Street Property. As of the December rent roll, the UW base rent at the City Square and Clay Street Property was $33.98 PSF, well below the appraisers market rent conclusions.
The following table presents recent leasing data at competitive office buildings with respect to the City Square and Clay Street Property:
| Comparable Office Leases | ||||||||
| Property Name/Address | Year Built | Size (SF) | Tenant Name | Lease Size (SF) | Lease Date | Lease Term (Yrs.) | Initial Rent/SF | Lease Type |
City Square and Clay Street 500 12th St. & 499, 501, 525 14th St. and 1200 Clay St. Oakland, CA | 1986 1992 | 246,136(1) | Various(1) | 246,136(1) | Various(1) | Various(1) | $33.98(1) | Various |
Oakland Tower 1111 Broadway Oakland, CA | 1990 | 553,210 | WeWork | 81,452 | January 2018 | 11.5 Yrs. | $52.00 | Full Service |
475 City Center 475 14th St. Oakland, CA | 1983 | 192,926 | Siegel & Yee | 4,086 | September 2017 | 4 Yrs. | $52.80 | Full Service |
Oakland City Center 1333 Broadway Oakland, CA | 1973 | 238,000 | Make a Wish Foundation | 9,409 | August 2017 | 7.8 Yrs. | $51.00 | Full Service |
Oakland Tower 1111 Broadway Oakland, CA | 1990 | 553,210 | GT Nexus | 23,951 | May 2017 | 7 Yrs. | $53.04 | Full Service |
The Rotunda 300 Frank Ogawa Plaza Oakland, CA | 1912 | 242,000 | Bremer Whyte | 6,875 | February 2017 | 5 Yrs. | $48.00 | Full Service |
Source:Appraisal
| (1) | Based on the underwritten rent roll. |
THE INFORMATION IN THIS COLLATERAL TERM SHEET IS NOT COMPLETE AND MAY BE AMENDED PRIOR TO THE TIME OF SALE. THIS TERM SHEET IS NOT AN OFFER TO SELL THESE SECURITIES AND IT IS NOT A SOLICITATION OF AN OFFER TO BUY THESE SECURITIES IN ANY JURISDICTION WHERE THE OFFER OR SALE IS NOT PERMITTED.
75
500 12th Street & 499, 501, 525 14th Oakland, CA 94612 | Collateral Asset Summary – Loan No. 7 City Square and Clay Street | Cut-off Date Balance: Cut-off Date LTV Ratio: UW NCF DSCR: UW NOI Debt Yield: | 8.9% |
Operating History and Underwritten Net Cash Flow.The following table presents certain information relating to the historical operating performance and the Underwritten Net Cash Flow at the City Square and Clay Street Property:
| Cash Flow Analysis | ||||||
| 2014 | 2015 | 2016 | 2017 | UW | UW PSF | |
| Gross Potential Rent(1) | $5,344,174 | $5,540,677 | $6,784,940 | $6,520,133 | $8,389,628 | $34.09 |
| Total Recoveries | $763,590 | $776,815 | $564,080 | $654,530 | $904,119 | $3.67 |
| Total Other Income(2) | $3,348,034 | $3,372,051 | $3,366,550 | $3,400,408 | $3,400,408 | $13.82 |
| Straight Line Rent | $0 | $0 | $0 | $0 | $207,711 | $0.84 |
| Less Vacancy & Credit Loss | $0 | $0 | $0 | $0 | ($627,546) | ($2.55) |
| Percentage Rent | $0 | $0 | $0 | $6,002 | $0 | $0.00 |
| Effective Gross Income | $9,455,797 | $9,689,543 | $10,715,569 | $10,581,073 | $12,274,319 | $49.87 |
| Total Operating Expenses | $3,565,243 | $3,703,063 | $3,699,797 | $3,943,696 | $4,223,100 | $17.16 |
| Net Operating Income(3) | $5,890,554 | $5,986,480 | $7,015,772 | $6,637,378 | $8,051,219 | $32.71 |
| Capital Expenditures | $0 | $0 | $0 | $0 | $90,174 | $0.37 |
| TI/LC | $0 | $0 | $0 | $0 | $376,332 | $1.53 |
| Net Cash Flow | $5,890,554 | $5,986,480 | $7,015,772 | $6,637,378 | $7,584,713 | $30.82 |
| Occupancy %(4) | 85.6% | 90.1% | 97.2% | 94.2% | 93.4%(3) | |
| NOI DSCR(5) | 1.37x | 1.39x | 1.63x | 1.54x | 1.87x | |
| NCF DSCR(5) | 1.37x | 1.39x | 1.63x | 1.54x | 1.76x | |
| NOI Debt Yield(5) | 6.5% | 6.7% | 7.8% | 7.4% | 8.9% | |
| NCF Debt Yield(5) | 6.5% | 6.7% | 7.8% | 7.4% | 8.4% | |
| (1) | UW Gross Potential Rent includes contractual rent steps through September 2018 totaling $133,760. |
| (2) | Other Income includes storage income, parking lease income, and other miscellaneous income. |
| (3) | Net Operating Income increased from 2017 to UW due to new leasing, tenant expansion, rent steps, and straight line rent. |
| (4) | UW Occupancy % is based on underwritten economic vacancy of 6.6%. The City Square and Clay Street Property was 94.2% leased as of December 31, 2017. |
| (5) | Debt service coverage ratios and debt yields are based on the City Square and Clay Street Whole Loan. |
Escrows and Reserves.At origination, the City Square and Clay Street Borrower deposited (i) $54,080 into an insurance escrow, (ii) $2,264,441 into a free rent and outstanding TIs escrow, (iii) $2,000,000 into a TI/LC escrow, (iv) $12,500 into a deferred maintenance escrow and (v) $300,000 into an escrow for ongoing litigation. On a monthly basis, the City Square and Clay Street Borrower is required to deposit into the appropriate reserves (i) $83,662 for ongoing taxes, (ii) $9,013 for ongoing insurance premiums, (iii) $7,512 for ongoing capital expenditures, subject to a $450,868 cap and (iv) $30,691 for ongoing TI/LCs subject to a $500,000 cap.
Lockbox and Cash Management. The City Square and Clay Street Whole Loan is structured with a hard lockbox and in place cash management. The City Square and Clay Street Borrower is required to send tenant direction letters to all tenants instructing them to deposit all rents and payments directly into the lockbox account controlled by the lender. All funds in the lockbox account are swept daily to a cash management account under the control of the lender and amounts in this account are used to pay monthly debt service payments and any reserves due under the City Square and Clay Street Whole Loan documents with any excess amounts remaining in this account returned to the City Square and Clay Street Borrower in accordance with the City Square and Clay Street Whole Loan documents, unless a Cash Sweep Event (as defined below) is continuing.
A “Cash Sweep Event” occurs when (i) an event of default occurs under the loan documents or property management agreement, (ii) the debt service coverage ratio for the City Square and Clay Street Property falls below 1.10x, (iii) Chevron Federal Credit Union and/or Kaiser Foundation Health Plan (each, a “Significant Tenant”) ceases to conduct, or gives notice of intent to cease, its normal business operation at substantially all of its leased premises (iv) any Significant Tenant (or such tenant’s parent, if applicable) becomes insolvent or files for bankruptcy, (v) it is six months prior to the expiration of a Significant Tenant’s lease or (vi) the lender determines that available litigation funds are insufficient to pay the litigation fund resolution amount.
Additional Secured Indebtedness (not including trade debts).Not permitted.
Mezzanine Loan and Preferred Equity. Not permitted.
Release of Property. Not permitted.
Terrorism Insurance. The City Square and Clay Street Borrower is required to obtain and maintain property insurance, commercial general liability insurance, and business income or rental loss insurance that covers perils of terrorism and acts of terrorism, both foreign and domestic.
THE INFORMATION IN THIS COLLATERAL TERM SHEET IS NOT COMPLETE AND MAY BE AMENDED PRIOR TO THE TIME OF SALE. THIS TERM SHEET IS NOT AN OFFER TO SELL THESE SECURITIES AND IT IS NOT A SOLICITATION OF AN OFFER TO BUY THESE SECURITIES IN ANY JURISDICTION WHERE THE OFFER OR SALE IS NOT PERMITTED.
76
(THIS PAGE INTENTIONALLY LEFT BLANK)
77
2015 North Dunn Street Bloomington, IN 47408 | Collateral Asset Summary – Loan No. 8 University Properties Portfolio | Cut-off Date Balance: Cut-off Date LTV Ratio: UW NCF DSCR: UW NOI Debt Yield: | $34,500,000 58.8% 1.95x 9.6% |
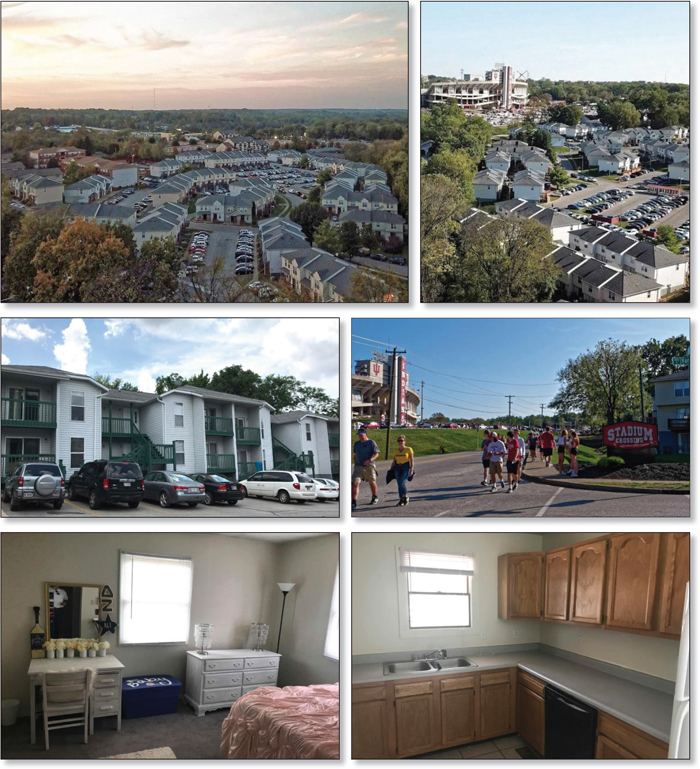
THE INFORMATION IN THIS COLLATERAL TERM SHEET IS NOT COMPLETE AND MAY BE AMENDED PRIOR TO THE TIME OF SALE. THIS TERM SHEET IS NOT AN OFFER TO SELL THESE SECURITIES AND IT IS NOT A SOLICITATION OF AN OFFER TO BUY THESE SECURITIES IN ANY JURISDICTION WHERE THE OFFER OR SALE IS NOT PERMITTED.
78
2015 North Dunn Street Bloomington, IN 47408 | Collateral Asset Summary – Loan No. 8 University Properties Portfolio | Cut-off Date Balance: Cut-off Date LTV Ratio: UW NCF DSCR: UW NOI Debt Yield: | $34,500,000 58.8% 1.95x 9.6% |
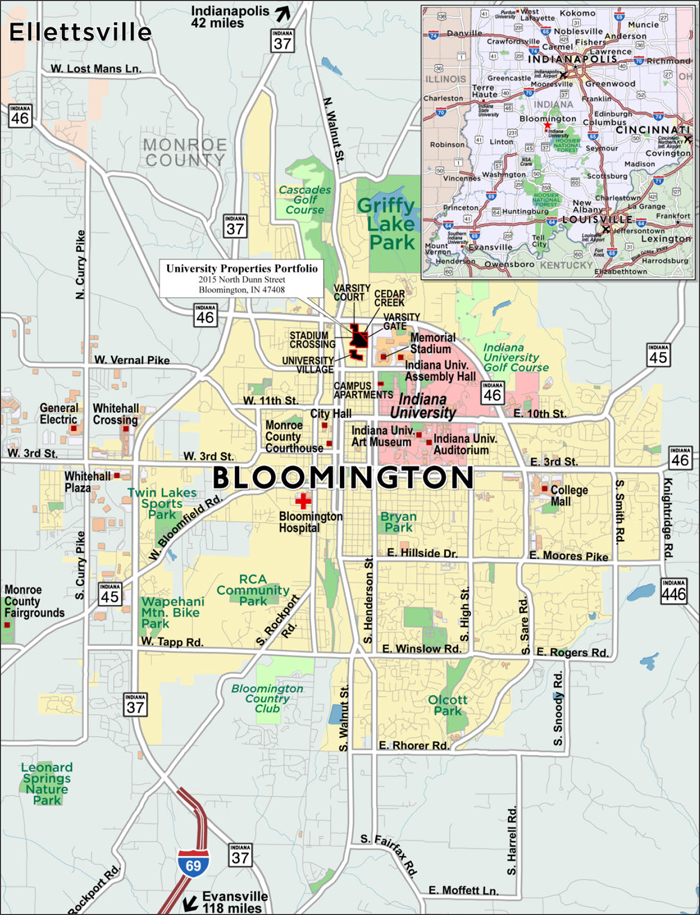
THE INFORMATION IN THIS COLLATERAL TERM SHEET IS NOT COMPLETE AND MAY BE AMENDED PRIOR TO THE TIME OF SALE. THIS TERM SHEET IS NOT AN OFFER TO SELL THESE SECURITIES AND IT IS NOT A SOLICITATION OF AN OFFER TO BUY THESE SECURITIES IN ANY JURISDICTION WHERE THE OFFER OR SALE IS NOT PERMITTED.
79
2015 North Dunn Street Bloomington, IN 47408 | Collateral Asset Summary – Loan No. 8 University Properties Portfolio | Cut-off Date Balance: Cut-off Date LTV Ratio: UW NCF DSCR: UW NOI Debt Yield: | $34,500,000 58.8% 1.95x 9.6% |
| Mortgage Loan Information | Property Information | ||||||
| Mortgage Loan Seller: | CIBC | Single Asset/Portfolio: | Single Asset | ||||
| Original Balance: | $34,500,000 | Location: | Bloomington, IN 47408 | ||||
| Cut-off Date Balance: | $34,500,000 | General Property Type: | Multifamily | ||||
| % of Initial Pool Balance: | 3.3% | Detailed Property Type: | Student Housing | ||||
| Loan Purpose: | Refinance | Title Vesting: | Fee | ||||
| Borrower Sponsors: | Thomas C. Guthrie; Kimberly D. Hendren | Year Built/Renovated: | 1930-2002/2016 | ||||
| Mortgage Rate: | 4.6900% | Size: | 342 Units | ||||
| Note Date: | 8/8/2017 | Cut-off Date Balance per Unit: | $100,877 | ||||
| First Payment Date: | 10/1/2017 | Maturity Date Balance per Unit: | $100,877 | ||||
| Maturity Date: | 9/1/2027 | Property Manager: | Varsity Properties Management Corp. (borrower-related) | ||||
| Original Term to Maturity: | 120 months | ||||||
| Original Amortization Term: | 0 months | ||||||
| IO Period: | 120 months | Underwriting and Financial Information | |||||
| Seasoning: | 5 months | UW NOI: | $3,296,594 | ||||
| Prepayment Provisions: | LO (29); DEF (84); O (7) | UW NOI Debt Yield: | 9.6% | ||||
| Lockbox/Cash Mgmt Status: | Soft/Springing | UW NOI Debt Yield at Maturity: | 9.6% | ||||
| Additional Debt Type: | Mezzanine | UW NCF DSCR: | 1.95x | ||||
| Additional Debt Balance: | $5,000,000 | Most Recent NOI(2): | $3,163,306 (TTM 11/30/2017) | ||||
| Future Debt Permitted (Type): | No (N/A) | 2nd Most Recent NOI(2): | $2,637,021 (12/31/2016) | ||||
| Reserves(1) | 3rd Most Recent NOI(2): | $2,553,130 (12/31/2015) | |||||
| Type | Initial | Monthly | Cap | Most Recent Occupancy: | 99.7% (11/30/2017) | ||
| RE Tax: | $279,206 | $55,841 | N/A | 2nd Most Recent Occupancy(2): | 99.7% (12/31/2016) | ||
| Insurance: | $102,545 | $15,070 | N/A | 3rd Most Recent Occupancy(2): | 100.0% (12/31/2015) | ||
| Immediate Repairs: | $100,000 | $0 | N/A | Appraised Value (as of): | $58,700,000 (6/1/2017) | ||
| Replacements: | $500,000 | Springing | $500,000 | Cut-off Date LTV Ratio: | 58.8% | ||
| Other: | $451,250 | $0 | N/A | Maturity Date LTV Ratio: | 58.8% | ||
| Sources and Uses | ||||||
| Sources | Proceeds | % of Total | Uses | Proceeds | % of Total | |
| Loan Amount: | $34,500,000 | 87.3% | Loan Payoff: | $27,959,729 | 70.8% | |
| Mezzanine Loan: | $5,000,000 | 12.7% | Reserves: | $1,433,002 | 3.6% | |
| Closing Costs: | $748,749 | 1.9% | ||||
| Return of Equity: | $9,358,520 | 23.7% | ||||
| Total Sources: | $39,500,000 | 100.0% | Total Uses: | $39,500,000 | 100.0% | |
| (1) | See “Escrows and Reserves” below for further discussion of reserve requirements. |
| (2) | From 2016 to 2017, 56 units were added to the University Properties Portfolio Property. |
The Mortgage Loan. The eighth largest mortgage loan (the “University Properties Portfolio Mortgage Loan”) is evidenced by a promissory note with an original principal amount of $34,500,000 secured by a first priority fee mortgage encumbering a portfolio of six student housing properties with 68 buildings totaling 342 units (the “University Properties Portfolio Property”) located in Bloomington, Indiana, the home of Indiana University Bloomington (“IU”). The proceeds of the University Properties Portfolio Mortgage Loan along with the proceeds of a $5 million mezzanine loan (the “University Properties Portfolio Mezzanine Loan”) were primarily used to: (i) refinance a prior mortgage loan of approximately $19.2 million which encumbered a 269-unit portion of the University Properties Portfolio Property and was included in the MSC 2007-IQ16 securitization trust, (ii) refinance approximately $6.8 million of prior mortgage loans made in connection with the acquisition of additional units, (iii) refinance approximately $1.5 million of existing mezzanine debt, (iv) repay approximately $0.5 million of intercompany debt, (v) pay closing costs, (vi) fund upfront reserves and (vii) return equity to the University Properties Portfolio Borrower (as defined below).
The Borrower and the Borrower Sponsors. The borrower is University Properties III LLC (the “University Properties Portfolio Borrower”), a single-purpose Delaware limited liability company structured to be bankruptcy remote with one independent director. The borrower sponsors and non-recourse carve-out guarantors are Thomas C. Guthrie and Kimberly D. Hendren. Mr. Guthrie indirectly owns 21.0% of the University Properties Portfolio Borrower and is majority owner and president of Varsity Properties Management Corp., which has been the property manager of the University Properties Portfolio Property since 2003. Ms. Hendren indirectly owns 50.5% of the University Properties Portfolio Borrower and is also the founder and CEO of CC Holdings, Inc., an owner and operator of 25 restaurants in Indianapolis, Indiana and Cincinnati, Ohio.
The Property. The University Properties Portfolio Property consists of a combination of multi-level apartment complexes, two- and three-story townhomes, and single family homes located on a non-contiguous 25.5-acre site concentrated on the north end of IU’s campus, adjacent to or in close proximity to IU’s recently renovated football stadium and basketball arena and new baseball stadium. The University Properties Portfolio Property is located within walking distance to the center of IU’s campus, approximately one mile to the south, and directly across the street or within 2 blocks from IU’s shuttle station at the football stadium which services two of the IU’s four bus routes. The University Properties Portfolio Property includes:
THE INFORMATION IN THIS COLLATERAL TERM SHEET IS NOT COMPLETE AND MAY BE AMENDED PRIOR TO THE TIME OF SALE. THIS TERM SHEET IS NOT AN OFFER TO SELL THESE SECURITIES AND IT IS NOT A SOLICITATION OF AN OFFER TO BUY THESE SECURITIES IN ANY JURISDICTION WHERE THE OFFER OR SALE IS NOT PERMITTED.
80
2015 North Dunn Street Bloomington, IN 47408 | Collateral Asset Summary – Loan No. 8 University Properties Portfolio | Cut-off Date Balance: Cut-off Date LTV Ratio: UW NCF DSCR: UW NOI Debt Yield: | $34,500,000 58.8% 1.95x 9.6% |
Stadium Crossing – Built between 1985 and 1987, the Stadium Crossing property consists of 201 condominium units (649 beds) situated on 15.0 acres with 504 parking spaces. There are a total of 226 condominium units at the Stadium Crossing property; however, 25 units are not owned by the University Properties Portfolio Borrower. The Stadium Crossing property is governed by the Varsity Villas Homeowner’s Association (“VVHOA”) which is controlled and managed by one of the borrower sponsors, Thomas Guthrie. VVHOA provides for all repairs, maintenance and security services on behalf of the condominium owners, which is covered by the VVHOA fees of $100/unit per month. The Stadium Crossing property's unit mix consists of: seven 2-bed/2-bath townhome units averaging 910 SF; 34 3-bed/3-bath flat units averaging 1,100 SF; 107 3-bed/3-bath townhome units averaging 1,365 SF; and 53 4-bed/4-bath units averaging 1,598 SF. The buildings include porches and/or decks and patios, and all units feature in-unit washer/dryer. Stadium Crossing is 100.0% leased as of the November 8, 2017 rent roll.
Varsity Court – Built in 1991, the Varsity Court property is comprised of six two-story plus basement wood frame buildings containing 56 units (141 beds) situated on 4.0 acres with 134 parking spaces. The Varsity Court property's unit mix consists of: two 1-bed/1-bath flat units averaging 546 SF; 23 2-bed/2-bath townhouse units averaging 1,091 SF; and 31 3-bed/3-bath townhouse units average 1,597 SF. The buildings include porches and/or decks and patios, and all units feature in-unit washer/dryer. The Varsity Court property is 100% leased as of the November 8, 2017 rent roll.
Cedar Creek – Built in 1952 and 1988, the Cedar Creek property is comprised of seven two-story wood frame buildings containing 41 units (84 beds) situated on 2.5 acres with 76 parking spaces. The Cedar Creek property's unit mix consists of: one 1-bed/1.5-bath unit totaling 545 SF; four 2-bed/1-bath units averaging 1,280 SF; 34 2-bed/1.5-bath averaging 1,024 SF; one 3-bed/2-bath unit totaling 1,774 SF; and one 4-bed/2-bath unit totaling 2,366 SF. The buildings include porches and decks, and all units feature in-unit washer/dryer. The Cedar Creek property also features a swimming pool and the University Properties Portfolio Property management office. The Cedar Creek property is 100% leased as of the November 8, 2017 rent roll.
University Village – Built between 1930 and 2002, the University Village property is comprised of 16 detached, two- and three-story buildings containing 23 units (109 beds) situated on 3.2 acres with 134 parking spaces, including 16 garage spaces. The property's unit mix includes: one 3-bed/1-bath unit totaling 800 SF; four 4-bed/2-bath units averaging 1,425 SF; four 5-bed/2-bath units averaging 1,707 SF; six 5-bed/2.5-bath units averaging 1,566 SF; and eight 5-bed/3-bath units averaging 1,704 SF. The buildings include balconies/patios, parking driveways, and all units feature in-unit washer/dryer. The University Village property is 95.7% leased as of the November 8, 2017 rent roll.
Varsity Gate – Built in 1991, the Varsity Gate property consists of a two-story wood frame building containing 13 units (15 beds) situated on 0.7 acres with 19 parking spaces. The property's unit mix includes: 11 1-bed/1-bath units averaging 412 SF; one 2-bed/1.5 bath unit with 787 SF and one 2-bed/1-bath unit with 787 SF. The building includes a common laundry room on the ground floor. Varsity Gate is 100% leased as of the November 8, 2017 rent roll.
Campus Apartments – Built in 1970, the Campus Apartments property consists of a two-story wood frame building containing eight 1-bed/1-bath units averaging 300 SF (8 beds) situated on 0.20 acres with 10 parking spaces. The Campus Apartments property is 100% leased as of the November 8, 2017 rent roll.
Stadium Crossing, Varsity Court, Cedar Creek, and Varsity Gate share adjacent borders along North Dunn Street, between East 20th Street and East State Road 45. University Village is situated approximately 0.2 miles south from the other four properties and Campus Apartments is approximately 0.4 miles south from the other four properties. The University Properties Portfolio Property is leased on an un-furnished, per unit basis. The University Properties Portfolio Property is 99.7% leased as of the November 8, 2017 rent roll, and all leases are for 12-month periods with the exception of 19 units that leased on a per-semester basis and 3 units on a 10-month lease period.
The University Properties Portfolio Borrower amassed the University Properties Portfolio Property over time through a series of acquisitions. The 269-unit/775-bed portion of the University Properties Portfolio Property that was previously securitized was acquired between 2003 and 2007 with a cost basis of approximately $27.5 million ($26.2 million total acquisition cost and $1.3 million of capital expenditures through 2007 for a total of $102,295/unit). Such portion of the University Properties Portfolio Property has consistently been over 98% occupied over the last 10 years. The University Properties Portfolio Borrower subsequently acquired an additional 18 units at Stadium Crossing in 2013 for approximately $2.0 million ($109,910/unit) and an additional 56 units at Stadium Crossing from 2016 through 2017 for approximately $5.5 million ($97,768/unit). These additional units have also been over 98% occupied since acquisition. The University Properties Portfolio Borrower has invested a total of approximately $3.8 million in capital expenditures into the University Properties Portfolio Property and the total cost basis is approximately $37.4 million.
The University Properties Portfolio Property’s unit mix includes 22 one-bedroom units averaging 390 SF, 70 two-bedroom units averaging 1,042 SF, 174 three-bedroom units averaging 1,354 SF, 58 four-bedroom units averaging 1,599 SF, and 18 five-bedroom units averaging 1,659 SF. The table below shows the apartment mix at the University Properties Portfolio Property:
| University Properties Portfolio Property Unit Mix Summary(1) | ||||||
| Unit Type | No. of Units | % of Total Units | Avg. Unit Size (SF) | No. of Occupied Units | Occupancy (%) | Avg. In Place Monthly Rent Per Unit |
| 1-bedroom | 22 | 6.4% | 390 | 22 | 100.0% | $564 |
| 2-bedrooms | 70 | 20.5% | 1,042 | 70 | 100.0% | $929 |
| 3-bedrooms | 174 | 50.9% | 1,354 | 174 | 100.0% | $1,211 |
| 4-bedrooms | 58 | 17.0% | 1,599 | 58 | 100.0% | $1,610 |
| 5-bedrooms | 18 | 5.3% | 1,659 | 17 | 94.4% | $2,578 |
| Total/Wtd. Avg. | 342 | 100.0% | 1,286 | 341 | 99.7% | $1,247 |
| (1) | Information is based on the underwritten rent roll. |
The Market. The University Properties Portfolio Property is located in Bloomington, Indiana, within walking distance to the center of the IU campus, approximately one mile to the south, and directly across the street or within 2-blocks from IU’s recently renovated football stadium, basketball arena and baseball stadium as well as the shuttle station at the football stadium which services two of the IU’s four bus routes.
THE INFORMATION IN THIS COLLATERAL TERM SHEET IS NOT COMPLETE AND MAY BE AMENDED PRIOR TO THE TIME OF SALE. THIS TERM SHEET IS NOT AN OFFER TO SELL THESE SECURITIES AND IT IS NOT A SOLICITATION OF AN OFFER TO BUY THESE SECURITIES IN ANY JURISDICTION WHERE THE OFFER OR SALE IS NOT PERMITTED.
81
2015 North Dunn Street Bloomington, IN 47408 | Collateral Asset Summary – Loan No. 8 University Properties Portfolio | Cut-off Date Balance: Cut-off Date LTV Ratio: UW NCF DSCR: UW NOI Debt Yield: | $34,500,000 58.8% 1.95x 9.6% |
Founded in 1838, IU is the principal campus of the Indiana University System. IU is the tenth largest university in the United States and is one of the fourteen schools in the Big Ten intercollegiate athletic conference. According to the appraisal, IU has received various accolades for its academic achievement and campus life. IU had a fall 2017 full-time enrollment of 43,762 students, representing a 3.9% increase from fall 2012. IU has over 750 student organizations, over 300 overseas study programs and over 200 research centers and institutes, in addition to more than 200 undergraduate majors and more than 550 academic programs. IU has the capacity to accommodate approximately 12,559 students (approximately 29% of the fall 2017 enrollment) in their residential halls, including the newly renovated and repurposed Wells Quadrangle which re-opened for the 2017/2018 school year. In addition, sororities and fraternities have approximately 8,200 members (approximately 19% of the fall 2017 enrollment) the majority of which are housed by their organization. As a result, IU relies on privately owned, off-campus housing to accommodate the rest of its student population.
According to the appraisal, the estimated 2016 population within a one-, three-, and five-mile radius was 17,487, 67,741, and 112,147, respectively. The 2016 estimated average household income within a one-, three-, and five-mile radius was $32,574, $51,544, and $62,143, respectively.
The appraisal identified two student housing properties slated to open in the summer of 2018, Ethos (480 beds) and Evolve (746 beds). Ethos and Evolve are located approximately 2.3-miles and 0.9-miles, respectively, from the center of IU’s campus. Evolve is located in close proximity to the University Properties Portfolio Property and was developed on a site that was previously improved with 328 beds. Evolve and Ethos are marketed as luxury student housing leased by the bed. Asking monthly rents per bed at Ethos and Evolve range from $640 to $1,019 and $799 to $1,229, respectively, depending on the floorplan. The average monthly rent per bed at the University Properties Portfolio Property is approximately $425.
According to a third party market research report, as of the third quarter of 2017, the Bloomington metro apartment market had an average vacancy rate of 5.3% and average asking monthly rent of $787 per unit, an increase of 3.4% year over year. The appraiser surveyed six comparable rental properties in the market and concluded that the in-place rent at the University Properties Portfolio Property is in-line with market rates.
Comparable rental properties to the University Properties Portfolio Property are shown in the table below:
| University Properties Portfolio Property Comparable Rentals Summary | |||||||
Address City, State | Year Built | Vacancy | Distance to center of IU campus | Number of Units | Unit Type | Avg. Unit Size (SF) | Avg. Monthly Rent per Unit |
University Properties Portfolio Property(1) 2015 North Dunn Street Bloomington, IN | 1930-2002 | 0.3% | 1.1 miles | 342 | One Bedroom Two Bedrooms Three Bedrooms Four Bedrooms Five Bedrooms | 390 1,042 1,354 1,599 1,659 | $564 $929 $1,211 $1,610 $2,578 |
The Arch 703 West Gourley Pike Bloomington, IN | 1982 | 10.1% | 1.6 miles | 208 | Studio One Bedroom Two Bedrooms Three Bedrooms | 425 706 887 1,345 | $560 $630 $692 $830 |
Terra Trace 321 East 14th Street Bloomington, IN | 1973 | 1.8% | 0.9 miles | 114 | One Bedroom Two Bedrooms Four Bedrooms | 690 950 1400 | $696 $854 $1,874 |
Covenanter Hill Apartments 3101 East Covenanter Drive Bloomington, IN | 1985 | 3.3% | 1.7 miles | 184 | One Bedroom Two Bedrooms | 545 1,159 | $802 $1,011 |
Regency Court 1616 South Henderson Bloomington, IN | 2001 | 4.6% | 1.9 miles | 108 | One Bedroom Two Bedrooms Three Bedrooms Four Bedrooms Five Bedrooms | 648 1,100 1,842 2,250 2,572 | $772 $1,109 $1,481 $1,460 $2,107 |
The Dillon 525 South Patterson Drive Bloomington, IN | 2014 | 11.3% | 2.2 miles | 204 | One Bedroom Two Bedrooms Four Bedrooms Five Bedrooms | 475 949 1,428 1,728 | $920 $1,382 $2,312 $2,756 |
The Village at Muller Park 500 South Muller Parkway Bloomington, IN | 2008 | 8.5% | 3.0 miles | 248 | One Bedroom Two Bedrooms Three Bedrooms Four Bedrooms | 608 1,161 1,317 1,631 | $877 $1,237 $1,494 $2,032 |
Source:Appraisal
| (1) | Based on the underwritten rent roll. |
THE INFORMATION IN THIS COLLATERAL TERM SHEET IS NOT COMPLETE AND MAY BE AMENDED PRIOR TO THE TIME OF SALE. THIS TERM SHEET IS NOT AN OFFER TO SELL THESE SECURITIES AND IT IS NOT A SOLICITATION OF AN OFFER TO BUY THESE SECURITIES IN ANY JURISDICTION WHERE THE OFFER OR SALE IS NOT PERMITTED.
82
2015 North Dunn Street Bloomington, IN 47408 | Collateral Asset Summary – Loan No. 8 University Properties Portfolio | Cut-off Date Balance: Cut-off Date LTV Ratio: UW NCF DSCR: UW NOI Debt Yield: | $34,500,000 58.8% 1.95x 9.6% |
Operating History and Underwritten Net Cash Flow. The following table presents certain information relating to the historical and forecasted operating performance and the Underwritten Net Cash Flow at the University Properties Portfolio Property:
| Cash Flow Analysis | ||||||
| 2014(1) | 2015(1) | 2016(1) | TTM 11/30/2017(1) | UW | UW Per Unit | |
| Gross Potential Rent(2) | $3,716,353 | $3,850,460 | $4,095,274 | $4,800,761 | $5,134,748 | $15,014 |
| Less Vacancy & Concessions(3) | ($15,228) | ($48,905) | ($29,445) | ($23,140) | ($256,737) | ($751) |
| Other Income(4) | $322,646 | $294,403 | $308,003 | $324,208 | $324,208 | $948 |
| Effective Gross Income | $4,023,771 | $4,095,958 | $4,373,833 | $5,101,829 | $5,202,218 | $15,211 |
| Total Operating Expenses | $1,668,119 | $1,542,828 | $1,736,813 | $1,938,523 | $1,905,624 | $5,572 |
| Net Operating Income | $2,355,651 | $2,553,130 | $2,637,021 | $3,163,306 | $3,296,594 | $9,639 |
| Capital Expenditures | $35,453 | $31,356 | $44,291 | $79,741 | $100,600 | $294 |
| Net Cash Flow | $2,320,198 | $2,521,774 | $2,592,730 | $3,083,565 | $3,195,994 | $9,345 |
| Occupancy % | 99.6% | 100.0% | 99.7% | 99.7% | 95.0% | |
| NOI DSCR | 1.44x | 1.56x | 1.61x | 1.93x | 2.01x | |
| NCF DSCR | 1.41x | 1.54x | 1.58x | 1.88x | 1.95x | |
| NOI Debt Yield | 6.8% | 7.4% | 7.6% | 9.2% | 9.6% | |
| NCF Debt Yield | 6.7% | 7.3% | 7.5% | 8.9% | 9.3% | |
| (1) | From 2016-2017, 56 units were added to the University Properties Portfolio Property. |
| (2) | Underwritten Gross Potential Rent is based the November 8, 2017 rent roll, which reflects physical occupancy of 99.7% and includes gross up of 1 vacant unit based on average in-place rents. |
| (3) | Underwritten Vacancy & Concessions is based on a 5% underwritten vacancy rate. |
| (4) | Underwritten Other Income consists of security deposit income, homeowner’s association income and other miscellaneous items. |
Escrows and Reserves. At loan origination, the University Properties Portfolio Borrower deposited $279,206 in escrow for annual real estate taxes, $102,545 in escrow for annual insurance premiums, $100,000 into a reserve for immediate repairs and $500,000 into a reserve for replacement reserves. The University Properties Portfolio Borrower is required to escrow monthly 1/12 of the annual estimated tax payments and 1/12 of the annual estimated insurance premiums. In the event that the balance in the replacement reserve falls below $500,000, the University Properties Portfolio Borrower is required to make monthly deposits of $8,383 for replacement reserves, subject to a $500,000 cap. At loan origination, the University Properties Portfolio Borrower deposited $451,250 into a reserve for the installation of a radon mitigation system and is required (i) to deliver to the lender evidence acceptable to the lender and its environmental consultant that the radon mitigation system is in good working order and continues to be effective in remediating radon concentrations in each building to be at or below 4.0 pCi/L and (ii) implement an operations and maintenance program relating to radon in each building.
Lockbox and Cash Management.The University Properties Portfolio Mortgage Loan is structured with a soft lockbox and springing cash management. The University Properties Portfolio Borrower or property manager is required to deposit all rents and profits into the lockbox within one business day after receipt thereof. Absent the existence of a Cash Management Period (as defined below), available funds that are on deposit in the lockbox will be transferred to an operating account under the exclusive dominion and control of the University Properties Portfolio Borrower. During the existence of a Cash Management Period, all transfers from the lockbox to the operating account will cease and funds in the lockbox account are required to be applied on each monthly payment date (i) to fund the required real estate tax and insurance reserves deposits, (ii) to pay debt service on the University Properties Portfolio Mortgage Loan, (iii) to pay any other amounts due under the University Properties Portfolio Mortgage Loan documents, (iv) to fund the required deposits into the replacement reserve, (v) to pay operating expenses not otherwise paid or reserved for as described above under“Escrows and Reserves” and referenced in the annual budget approved by the lender together with other amounts incurred by the University Properties Portfolio Borrower in connection with the operation and maintenance of the University Properties Portfolio Property, (vi) provided no event of default is continuing, to pay the monthly payment of interest due under the University Properties Portfolio Mezzanine Loan to the mezzanine lender and (vii) to disburse the remainder to a cash collateral account to be held by the lender as additional security for the University Properties Portfolio Mortgage Loan.
A “Cash Management Period” will commence (i) upon the occurrence of an event of default under the University Properties Portfolio Mortgage Loan documents and will continue until the event of default has been cured and such cure has been accepted by the lender; (ii) if the debt service coverage ratio (calculated based on a 30 year amortization schedule) is less than 1.10x for three consecutive calendar months and will continue until the debt service coverage ratio (calculated based on a 30 year amortization schedule) is at least 1.10x for four consecutive calendar quarters; or (iii) upon the occurrence of an event of default under the University Properties Portfolio Mezzanine Loan documents and will continue until the repayment in full of the University Properties Portfolio Mezzanine Loan.
Additional Secured Indebtedness (not including trade debts).Not permitted.
Mezzanine Loan and Preferred Equity.The University Properties Portfolio Mezzanine Loan is secured by the membership interests in the University Properties Portfolio Borrower pledged by the direct members of the University Properties Portfolio Borrower. The University Properties Portfolio Mezzanine Loan has an outstanding principal balance of $5.0 million, has an interest-only coupon of 11.75% throughout the full term, and is coterminous with the University Properties Portfolio Mortgage Loan. Including the University Properties Portfolio Mortgage Loan and the University Properties Portfolio Mezzanine Loan, the cumulative Cut-off Date LTV, cumulative UW NCF DSCR and cumulative UW NOI Debt Yield are 67.3%, 1.43x and 8.3%, respectively. The lender and the mezzanine lender have entered into an intercreditor agreement.
Release of Property.Not permitted.
Environmental Matters.The Phase I environmental report dated July 27, 2017 reported that the University Properties Portfolio Property is located in EPA designated Radon Zone 1, in which the average predicted radon concentration levels are expected to be at or above the EPA residential action level
THE INFORMATION IN THIS COLLATERAL TERM SHEET IS NOT COMPLETE AND MAY BE AMENDED PRIOR TO THE TIME OF SALE. THIS TERM SHEET IS NOT AN OFFER TO SELL THESE SECURITIES AND IT IS NOT A SOLICITATION OF AN OFFER TO BUY THESE SECURITIES IN ANY JURISDICTION WHERE THE OFFER OR SALE IS NOT PERMITTED.
83
2015 North Dunn Street Bloomington, IN 47408 | Collateral Asset Summary – Loan No. 8 University Properties Portfolio | Cut-off Date Balance: Cut-off Date LTV Ratio: UW NCF DSCR: UW NOI Debt Yield: | $34,500,000 58.8% 1.95x 9.6% |
of 4.0 pCi/L. Several rounds of radon testing were conducted on the ground floor units of each of the buildings at the University Properties Portfolio Property, and samples collected from 73 of those units indicated radon concentrations above 4.0 pCi/L. Based on the testing results and the recommendation in the ESA, the installation and activation of a radon mitigation system was required in each building located at the University Properties Portfolio Property in which elevated concentrations of radon was identified in the ESA. At loan origination, the University Properties Portfolio Borrower deposited $451,250 into a reserve, which equals 125% of the estimated cost of such mitigation system. See“Description of the Mortgage Pool—Environmental Considerations” in the Preliminary Prospectus.
Terrorism Insurance.The University Properties Portfolio Borrower is required to obtain and maintain property insurance, commercial general liability insurance, and business income or rental loss insurance that covers perils of terrorism and acts of terrorism, both foreign and domestic.
THE INFORMATION IN THIS COLLATERAL TERM SHEET IS NOT COMPLETE AND MAY BE AMENDED PRIOR TO THE TIME OF SALE. THIS TERM SHEET IS NOT AN OFFER TO SELL THESE SECURITIES AND IT IS NOT A SOLICITATION OF AN OFFER TO BUY THESE SECURITIES IN ANY JURISDICTION WHERE THE OFFER OR SALE IS NOT PERMITTED.
84
(THIS PAGE INTENTIONALLY LEFT BLANK)
85
| Various | Collateral Asset Summary – Loan No. 9 AFIN Industrial and Retail Net-Leased Portfolio | Cut-off Date Balance: Cut-off Date LTV Ratio: UW NCF DSCR: UW NOI Debt Yield: | 12.4% |
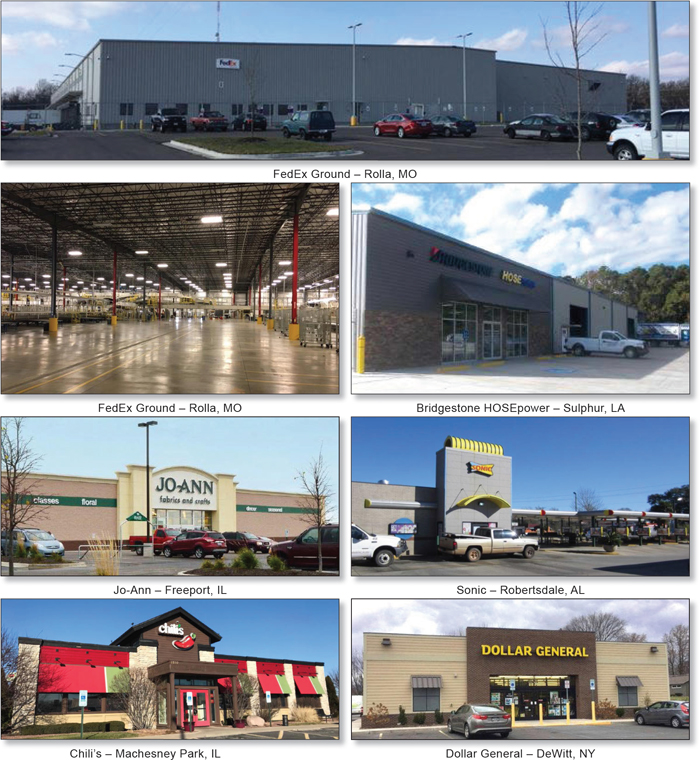
THE INFORMATION IN THIS COLLATERAL TERM SHEET IS NOT COMPLETE AND MAY BE AMENDED PRIOR TO THE TIME OF SALE. THIS TERM SHEET IS NOT AN OFFER TO SELL THESE SECURITIES AND IT IS NOT A SOLICITATION OF AN OFFER TO BUY THESE SECURITIES IN ANY JURISDICTION WHERE THE OFFER OR SALE IS NOT PERMITTED.
86
| Various | Collateral Asset Summary – Loan No. 9 AFIN Industrial and Retail Net-Leased Portfolio | Cut-off Date Balance: Cut-off Date LTV Ratio: UW NCF DSCR: UW NOI Debt Yield: | 12.4% |
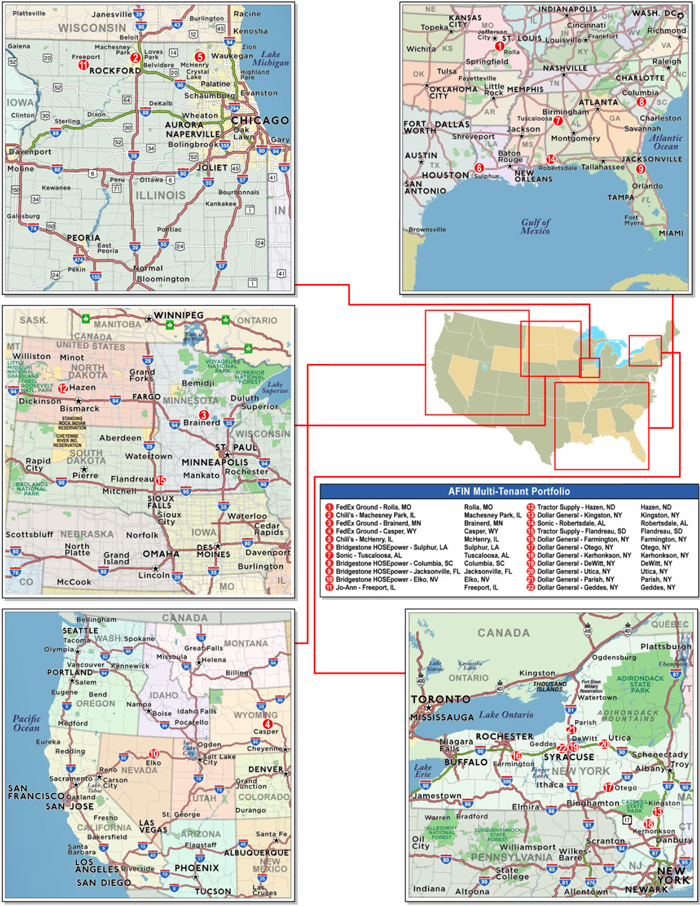
THE INFORMATION IN THIS COLLATERAL TERM SHEET IS NOT COMPLETE AND MAY BE AMENDED PRIOR TO THE TIME OF SALE. THIS TERM SHEET IS NOT AN OFFER TO SELL THESE SECURITIES AND IT IS NOT A SOLICITATION OF AN OFFER TO BUY THESE SECURITIES IN ANY JURISDICTION WHERE THE OFFER OR SALE IS NOT PERMITTED.
87
| Various | Collateral Asset Summary – Loan No. 9 AFIN Industrial and Retail Net-Leased Portfolio | Cut-off Date Balance: Cut-off Date LTV Ratio: UW NCF DSCR: UW NOI Debt Yield: | 12.4% |
| Mortgage Loan Information | Property Information | |||||||
| Mortgage Loan Seller: | Barclays Bank PLC | Single Asset/Portfolio: | Portfolio | |||||
| Original Balance: | $33,400,000 | Location(1): | Various | |||||
| Cut-off Date Balance: | $33,400,000 | General Property Type(1): | Various | |||||
| % of Initial Pool Balance: | 3.2% | Detailed Property Type(1): | Various | |||||
| Loan Purpose: | Acquisition | Title Vesting: | Fee | |||||
Borrower Sponsor: | American Finance Operating Partnership, L.P. | Year Built/Renovated(1): | Various | |||||
| Size: | 459,230 SF | |||||||
| Mortgage Rate: | 4.0660% | Cut-off Date Balance per SF: | $73 | |||||
| Note Date: | 12/27/2017 | Maturity Date Balance per SF: | $73 | |||||
| First Payment Date: | 2/6/2018 | Property Manager: | American Finance Properties, LLC (borrower-related) | |||||
| Maturity Date: | 1/6/2028 | |||||||
| Original Term to Maturity: | 120 months | |||||||
| Original Amortization Term: | 0 months | |||||||
| IO Period: | 120 months | Underwriting and Financial Information | ||||||
| Seasoning: | 1 month | UW NOI: | $4,150,930 | |||||
| Prepayment Provisions: | YM1(25);DEF/YM1(91);O(4) | UW NOI Debt Yield: | 12.4% | |||||
| Lockbox/Cash Mgmt Status: | Hard/Springing | UW NOI Debt Yield at Maturity: | 12.4% | |||||
| Additional Debt Type: | N/A | UW NCF DSCR: | 2.81x | |||||
| Additional Debt Balance: | N/A | Most Recent NOI(3): | N/A | |||||
| Future Debt Permitted (Type): | No (N/A) | 2nd Most Recent NOI(3): | N/A | |||||
| Reserves(2) | 3rd Most Recent NOI(3): | N/A | ||||||
| Type | Initial | Monthly | Cap | Most Recent Occupancy: | 100.0% (2/1/2018) | |||
| RE Tax: | $113,903 | Springing | N/A | 2nd Most Recent Occupancy: | N/A | |||
| Insurance: | $0 | Springing | N/A | 3rd Most Recent Occupancy: | N/A | |||
| Replacements: | $0 | Springing | N/A | Appraised Value (as of): | $62,515,000 (Various) | |||
| TI/LC: | $0 | Springing | N/A | Cut-off Date LTV Ratio: | 53.4% | |||
| Deferred Maintenance: | $33,402 | $0 | N/A | Maturity Date LTV Ratio: | 53.4% | |||
| Sources and Uses | ||||||
| Sources | Proceeds | % of Total | Uses | Proceeds | % of Total | |
| Loan Amount: | $33,400,000 | 53.8% | Purchase Price(3): | $60,680,951 | 97.7% | |
| Borrower Equity: | $28,680,645 | 46.2% | Closing Costs: | $1,252,389 | 2.0% | |
| Reserves: | $147,305 | 0.2% | ||||
| Total Sources: | $62,080,646 | 100.0% | Total Uses: | $62,080,646 | 100.0% | |
| (1) | See“The Properties” below for further discussion of property information. |
| (2) | See“Escrows and Reserves” below for further discussion of reserve requirements. |
| (3) | The AFIN Industrial and Retail Net-Leased Portfolio Properties (as defined below) were acquired by the borrower sponsor between March 31, 2017 and November 7, 2017. According to the borrower sponsor, the sellers of the AFIN Industrial and Retail Net-Leased Portfolio Properties did not provide historical operating statements to the AFIN Industrial and Retail Net-Leased Portfolio Borrowers (as defined below) so historical cash flows and historical occupancy is unavailable. |
The Mortgage Loan. The ninth largest mortgage loan (the “AFIN Industrial and Retail Net-Leased Portfolio Mortgage Loan”) is evidenced by a single promissory note with an original principal balance of $33,400,000 and is secured by first priority fee mortgages and deeds of trust encumbering 22 cross-collateralized, single-tenant industrial and retail properties located in twelve states (collectively, the “AFIN Industrial and Retail Net-Leased Portfolio Properties”). The AFIN Industrial and Retail Net-Leased Portfolio Mortgage Loan was originated on December 27, 2017 by Barclays Bank PLC. The AFIN Industrial and Retail Net-Leased Portfolio Mortgage Loan accrues interest at an interest rate of 4.0660%per annum. The AFIN Industrial and Retail Net-Leased Portfolio Mortgage Loan had an initial term of 120 months, has a remaining term of 119 months as of the Cut-off Date and requires payments of interest-only through the AFIN Industrial and Retail Net-Leased Portfolio Mortgage Loan term. The AFIN Industrial and Retail Net-Leased Portfolio Mortgage Loan matures on January 6, 2028. The proceeds of the AFIN Industrial and Retail Net-Leased Portfolio Mortgage Loan were used to recapitalize the borrower sponsor after the purchase the AFIN Industrial and Retail Net-Leased Portfolio Properties between March 31, 2017 and November 7, 2017, fund reserves, and pay closing costs.
The Borrowers and the Borrower Sponsor.The borrowers are all single-purpose Delaware limited liability companies structured to be bankruptcy remote with one independent director, as follows: ARG DGGDDNY001, LLC; ARG DGUTCNY001, LLC; ARG DGDWTNY001, LLC; ARG DGFRMNY001, LLC; ARG DGPRSNY001, LLC; ARG DGOTGNY001, LLC; ARG DGKNGNY001, LLC; ARG DGKRHNY001, LLC; ARG TSFLDSD001, LLC; ARG TSHZNND001, LLC; ARG JAFPTIL001, LLC; ARG CHMCPIL001, LLC; ARG CHMCHIL001, LLC; ARG SNRBRAL001, LLC; ARG SNTSCAL001, LLC; ARG FEBRNMN001, LLC; ARG FECSPWY001, LLC; ARG FERLLMO001, LLC; ARG BHCLMSC001, LLC; ARG BHELKNV001, LLC; ARG BHJCKFL001, LLC; and ARG BHSLPLA001, LLC. (collectively, the “AFIN Industrial and Retail Net-Leased Portfolio Borrowers”). The AFIN Industrial and Retail Net-Leased Portfolio Borrowers are 100.0% owned by the borrower sponsor and nonrecourse carve-out guarantor, American Finance Operating Partnership, L.P. American Finance Trust, Inc. (“AFIN”) owns 100% of the general partnership interests in American Finance Operating Partnership, L.P.
THE INFORMATION IN THIS COLLATERAL TERM SHEET IS NOT COMPLETE AND MAY BE AMENDED PRIOR TO THE TIME OF SALE. THIS TERM SHEET IS NOT AN OFFER TO SELL THESE SECURITIES AND IT IS NOT A SOLICITATION OF AN OFFER TO BUY THESE SECURITIES IN ANY JURISDICTION WHERE THE OFFER OR SALE IS NOT PERMITTED.
88
| Various | Collateral Asset Summary – Loan No. 9 AFIN Industrial and Retail Net-Leased Portfolio | Cut-off Date Balance: Cut-off Date LTV Ratio: UW NCF DSCR: UW NOI Debt Yield: | 12.4% |
AFIN is a public non-traded real estate investment trust that acquires and manages a diversified portfolio of commercial properties, which are net leased primarily to investment grade and national tenants, as well as a portfolio of stabilized core retail properties consisting primarily of power centers and lifestyle centers. As of the second quarter 2017, the borrower sponsor had a portfolio of 516 properties totaling approximately 19.2 million SF. AFIN is externally managed by AR Global Investments, LLC, which has raised and invested over $30.0 billion in capital, served over 150,000 shareholders, and has grown to become one of the largest external managers of direct investment programs in the United States. See “Description of the Mortgage Pool—Litigation and Other Considerations” in the Preliminary Prospectus.
The Properties.The AFIN Industrial and Retail Net-Leased Portfolio Properties are comprised of 22 cross-collateralized single-tenant properties, totaling 459,230 SF across twelve states. Seven of the AFIN Industrial and Retail Net-Leased Portfolio Properties are industrial properties, representing approximately 50.5% of the Cut-Off Date allocated loan amount and 50.6% of net operating income, and 15 of the AFIN Industrial and Retail Net-Leased Portfolio Properties are retail properties, representing approximately 49.5% of the Cut-Off Date allocated loan amount and 49.4% of net operating income. Built between 1992 and 2017, the AFIN Industrial and Retail Net-Leased Portfolio Properties range in size from 1,256 SF to 141,582 SF. The borrower sponsor acquired the AFIN Industrial and Retail Net-Leased Portfolio Properties between March 31, 2017 and November 7, 2017 for a combined purchase price of approximately $60.7 million. As of February 1, 2018, the AFIN Industrial and Retail Net-Leased Portfolio Properties were 100.0% occupied.
The AFIN Industrial and Retail Net-Leased Portfolio Properties are 100.0% occupied by seven tenants at 22 different locations including nationally recognized tenants, such as Dollar General, FedEx Ground, Bridgestone HOSEpower, Tractor Supply and Sonic. Investment grade tenants, including FedEx Ground (a subsidiary of FedEx Corporation), Bridgestone HOSEpower and Dollar General, occupy 15 of the 22 properties, representing 81.7% of NRA and 69.9% of underwritten base rent. The largest property, FedEx Ground - Rolla, MO, comprises approximately 141,582 SF (30.8% of the total net rentable area) and $780,495 of the underwritten base rent (18.1% of underwritten base rent) and is utilized as industrial space. Other than FedEx Ground - Rolla, MO, no individual property accounts for more than 11.7% of NRA and 7.8% of the underwritten base rent. Each individual lease is either direct with the parent company or guaranteed by the parent company, with the exception of the Chili’s and Sonic locations, which operate as franchises, and FedEx Ground which is a subsidiary of FedEx Corporation. All leases are NNN and the average remaining lease term for the AFIN Industrial and Retail Net-Leased Portfolio Properties is approximately 11.0 years.
The following table presents certain information relating to the AFIN Industrial and Retail Net-Leased Portfolio Properties:
| Property Summary(1)(2) | |||||||
| Property Name | Property Type | Allocated Cut-off Date Loan Amount | % of Allocated Cut-off Date Loan Amount | Underwritten NOI | Year Built/ Renovated | Tenant SF | Appraised Value |
| FedEx Ground - Rolla, MO | Industrial | $6,403,768 | 19.2% | $733,449 | 2017/N/A | 141,582 | $12,000,000 |
| Chili’s - Machesney Park, IL | Retail | $2,543,134 | 7.6% | $309,705 | 2003/N/A | 6,039 | $4,760,000 |
| FedEx Ground - Brainerd, MN | Industrial | $2,511,077 | 7.5% | $317,263 | 2016/N/A | 53,739 | $4,700,000 |
| FedEx Ground - Casper, WY | Industrial | $2,404,223 | 7.2% | $277,063 | 2017/N/A | 29,246 | $4,500,000 |
| Chili’s - McHenry, IL | Retail | $2,158,458 | 6.5% | $255,113 | 2002/N/A | 6,039 | $4,040,000 |
| Bridgestone HOSEpower - Sulphur, LA | Industrial | $1,736,383 | 5.2% | $245,413 | 2016/N/A | 20,900 | $3,250,000 |
| Sonic - Tuscaloosa, AL | Retail | $1,607,702 | 4.8% | $179,500 | 1992/2013 | 1,256 | $3,000,000 |
| Bridgestone HOSEpower - Columbia, SC | Industrial | $1,375,750 | 4.1% | $192,795 | 1999/N/A | 19,979 | $2,575,000 |
| Bridgestone HOSEpower - Jacksonville, FL | Industrial | $1,228,825 | 3.7% | $168,304 | 2008/N/A | 25,125 | $2,300,000 |
| Bridgestone HOSEpower - Elko, NV | Industrial | $1,191,426 | 3.6% | $166,362 | 2016/N/A | 12,000 | $2,230,000 |
| Jo-Ann - Freeport, IL | Retail | $1,175,398 | 3.5% | $145,250 | 2014/N/A | 18,000 | $2,200,000 |
| Tractor Supply - Hazen, ND | Retail | $1,057,858 | 3.2% | $136,127 | 2008/N/A | 25,612 | $1,980,000 |
| Dollar General - Kingston, NY | Retail | $886,891 | 2.7% | $116,291 | 2014/N/A | 9,100 | $1,660,000 |
| Sonic - Robertsdale, AL | Retail | $857,441 | 2.6% | $101,667 | 2001/N/A | 1,621 | $1,600,000 |
| Tractor Supply - Flandreau, SD | Retail | $849,492 | 2.5% | $109,379 | 2008/N/A | 25,612 | $1,590,000 |
| Dollar General - Farmington, NY | Retail | $838,807 | 2.5% | $110,102 | 2014/N/A | 9,100 | $1,570,000 |
| Dollar General - Otego, NY | Retail | $806,750 | 2.4% | $105,385 | 2014/N/A | 9,026 | $1,510,000 |
| Dollar General - Kerhonkson, NY | Retail | $796,065 | 2.4% | $104,360 | 2015/N/A | 9,100 | $1,490,000 |
| Dollar General - Dewitt, NY | Retail | $764,009 | 2.3% | $100,193 | 2014/N/A | 9,002 | $1,430,000 |
| Dollar General - Utica, NY | Retail | $747,980 | 2.2% | $91,923 | 2013/N/A | 9,100 | $1,400,000 |
| Dollar General - Parish, NY | Retail | $747,980 | 2.2% | $92,302 | 2013/N/A | 9,026 | $1,400,000 |
| Dollar General - Geddes, NY | Retail | $710,581 | 2.1% | $92,984 | 2014/N/A | 9,026 | $1,330,000 |
| Total/Wtd. Avg. | $33,400,000 | 100.0% | $4,150,930 | 459,230 | $62,515,000 | ||
| (1) | The AFIN Industrial and Retail Net-Leased Portfolio Properties comprise 22 single tenant retail and industrial properties, each 100.0% occupied. |
| (2) | Tenant Sales are unavailable with the exception of Chili’s - Machesney Park, IL which reports annual sales of $4,200,000 ($695.48 per square foot), Chili’s - McHenry, IL which reports annual sales of $2,800,000 ($463.65 PSF), Sonic - Tuscaloosa, AL which reports sales of $2,364,250 ($1,882.37 PSF) and Sonic - Robertsdale, AL which reports sales of $1,270,838 ($783.98 PSF). |
THE INFORMATION IN THIS COLLATERAL TERM SHEET IS NOT COMPLETE AND MAY BE AMENDED PRIOR TO THE TIME OF SALE. THIS TERM SHEET IS NOT AN OFFER TO SELL THESE SECURITIES AND IT IS NOT A SOLICITATION OF AN OFFER TO BUY THESE SECURITIES IN ANY JURISDICTION WHERE THE OFFER OR SALE IS NOT PERMITTED.
89
| Various | Collateral Asset Summary – Loan No. 9 AFIN Industrial and Retail Net-Leased Portfolio | Cut-off Date Balance: Cut-off Date LTV Ratio: UW NCF DSCR: UW NOI Debt Yield: | 12.4% |
The following table presents certain information relating to the leases at the AFIN Industrial and Retail Net-Leased Portfolio Properties:
| Tenant Summary(1) | ||||||||
| Tenant Name | Credit Rating (Fitch/Moody’s/S&P)(2) | Property Count | Tenant SF | Approximate % of SF | Annual | % of Total Annual UW Base Rent | Annual UW Base Rent PSF | Lease Expiration |
| FedEx Ground | NR/Baa2/BBB | 3 | 224,567 | 48.9% | $1,410,887 | 32.8% | $6.28 | Various(3) |
| Bridgestone HOSEpower | NR/NR/A | 4 | 78,004 | 17.0% | $772,874 | 17.9% | $9.91 | Various(4) |
| Dollar General | NR/Baa2/BBB | 8 | 72,480 | 15.8% | $825,898 | 19.2% | $11.39 | Various(5) |
| Tractor Supply | NR/NR/NR | 2 | 51,224 | 11.2% | $258,692 | 6.0% | $5.05 | Various(6) |
| Jo-Ann Fabrics | NR/Caa1/B | 1 | 18,000 | 3.9% | $153,153 | 3.6% | $8.51 | 1/31/2025(7) |
| Chili’s | NR/NR/NR | 2 | 12,078 | 2.6% | $595,151 | 13.8% | $49.28 | 10/31/2027(8) |
| Sonic Drive-In | NR/NR/NR | 2 | 2,877 | 0.6% | $290,807 | 6.8% | $101.08 | 6/30/2032(9) |
| Subtotal/Wtd. Avg. | 459,230 | 100.0% | $4,307,463 | 100.0% | $9.38 | |||
| Vacant Space | 0 | 0.0% | $0 | 0.0% | $0.00 | |||
| Total/Wtd. Avg. | 459,230 | 100.0% | $4,307,463 | 100.0% | $9.38 | |||
| (1) | Information is based on the underwritten rent roll. |
| (2) | Certain ratings are those of the parent company whether or not the parent company guarantees the lease. |
| (3) | FedEx Ground is a tenant at three of the AFIN Industrial and Retail Net-Leased Portfolio Properties with leases that expire between May 31, 2026 and June 30, 2027. FedEx Ground has two five-year renewal options at each property. |
| (4) | Bridgestone HOSEpower is a tenant at four of the AFIN Industrial and Retail Net-Leased Portfolio Properties with leases that expire between September 30, 2029 and December 31, 2031. Bridgestone HOSEpower has three five-year renewal options at each property. |
| (5) | Dollar General is a tenant at eight of the AFIN Industrial and Retail Net-Leased Portfolio Properties with leases that expire between October 31, 2028 and August 31, 2030. Dollar General has four five-year renewal options at each property. |
| (6) | Tractor Supply is a tenant at two of the AFIN Industrial and Retail Net-Leased Portfolio Properties with leases that expire on August 31, 2026 and January 31, 2027. Tractor Supply has four five-year renewal options at each property. |
| (7) | Jo-Ann Fabrics is a tenant at one of the AFIN Industrial and Retail Net-Leased Portfolio Properties with a lease that expires on January 31, 2025. Jo-Ann Fabrics has three five-year renewal options. |
| (8) | Chili’s is a tenant at two of the AFIN Industrial and Retail Net-Leased Portfolio Properties with leases that expire on October 31, 2027 at each property. Chili’s has four five-year renewal options at each property. |
| (9) | Sonic Drive-In is a tenant at two of the AFIN Industrial and Retail Net-Leased Portfolio Properties with leases that expire on June 30, 2032 at each property. Sonic Drive-In has five five-year renewal options at each property. |
The following table presents certain information relating to the lease rollover schedule at the AFIN Industrial and Retail Net-Leased Portfolio Properties:
| Lease Rollover Schedule(1) | ||||||||
| Year | # of Leases Rolling | SF Rolling | Approx. % of Total SF Rolling | Approx. Cumulative % of SF Rolling | UW Base Rent PSF Rolling | Total UW Base Rent Rolling | Approx. % of Total Base Rent Rolling | Approx. Cumulative % of Total Base Rent Rolling |
| MTM | 0 | 0 | 0.0% | 0.0% | $0.00 | $0 | 0.0% | 0.0% |
| 2018 | 0 | 0 | 0.0% | 0.0% | $0.00 | $0 | 0.0% | 0.0% |
| 2019 | 0 | 0 | 0.0% | 0.0% | $0.00 | $0 | 0.0% | 0.0% |
| 2020 | 0 | 0 | 0.0% | 0.0% | $0.00 | $0 | 0.0% | 0.0% |
| 2021 | 0 | 0 | 0.0% | 0.0% | $0.00 | $0 | 0.0% | 0.0% |
| 2022 | 0 | 0 | 0.0% | 0.0% | $0.00 | $0 | 0.0% | 0.0% |
| 2023 | 0 | 0 | 0.0% | 0.0% | $0.00 | $0 | 0.0% | 0.0% |
| 2024 | 0 | 0 | 0.0% | 0.0% | $0.00 | $0 | 0.0% | 0.0% |
| 2025 | 1 | 18,000 | 3.9% | 3.9% | $8.51 | $153,153 | 3.6% | 3.6% |
| 2026 | 2 | 79,351 | 17.3% | 21.2% | $6.06 | $481,102 | 11.2% | 14.7% |
| 2027 | 5 | 208,518 | 45.4% | 66.6% | $8.55 | $1,783,629 | 41.4% | 56.1% |
| 2028 | 2 | 18,126 | 3.9% | 70.6% | $10.85 | $196,584 | 4.6% | 60.7% |
| 2029 & Beyond | 12 | 135,235 | 29.4% | 100.0% | $12.52 | $1,692,996 | 39.3% | 100.0% |
| Vacant | 0 | 0 | 0.0% | 100.0% | $0.00 | $0 | 0.0% | 100.0% |
| Total/Wtd. Avg. | 22 | 459,230 | 100.0% | $9.38 | $4,307,463 | 100.0% | ||
| (1) | Information is based on the underwritten rent roll. |
THE INFORMATION IN THIS COLLATERAL TERM SHEET IS NOT COMPLETE AND MAY BE AMENDED PRIOR TO THE TIME OF SALE. THIS TERM SHEET IS NOT AN OFFER TO SELL THESE SECURITIES AND IT IS NOT A SOLICITATION OF AN OFFER TO BUY THESE SECURITIES IN ANY JURISDICTION WHERE THE OFFER OR SALE IS NOT PERMITTED.
90
| Various | Collateral Asset Summary – Loan No. 9 AFIN Industrial and Retail Net-Leased Portfolio | Cut-off Date Balance: Cut-off Date LTV Ratio: UW NCF DSCR: UW NOI Debt Yield: | 12.4% |
The Market. The AFIN Industrial and Retail Net-Leased Portfolio Properties are located across 12 states and 19 distinct markets. The following table presents certain market information relating to the AFIN Industrial and Retail Net-Leased Portfolio Properties:
| Market Summary | |||||
| Property Name | Market(1) | Market Vacancy(1) | Rental Rate PSF | ||
| Property Type | Actual(2) | Market(1)(3) | |||
| FedEx Ground - Rolla, MO | Industrial | Phelps | 2.5% | $5.51 | $5.50 |
| Chili’s - Machesney Park, IL | Retail | Chicago | 10.5% | $53.24 | $53.00 |
| FedEx Ground - Brainerd, MN | Industrial | Minneapolis/St. Paul | 4.2% | $6.28 | $6.25 |
| FedEx Ground - Casper, WY | Industrial | Natrona | 11.1% | $10.01 | $10.01 |
| Chili’s - McHenry, IL | Retail | Chicago | 10.5% | $43.86 | $44.00 |
| Bridgestone HOSEpower - Sulphur, LA | Industrial | Calcasieu Parish | 9.6% | $10.72 | $10.72 |
| Sonic - Tuscaloosa, AL | Retail | Metro Birmingham | 5.6% | $150.59 | $150.00 |
| Bridgestone HOSEpower - Columbia, SC | Industrial | Columbia | 7.2% | $8.68 | $8.50 |
| Bridgestone HOSEpower - Jacksonville, FL | Industrial | Jacksonville | 4.2% | $6.09 | $6.00 |
| Bridgestone HOSEpower - Elko, NV | Industrial | Elko | 0.8% | $12.41 | $12.66 |
| Jo-Ann - Freeport, IL | Retail | Chicago | 10.5% | $8.51 | $8.50 |
| Tractor Supply - Hazen, ND | Retail | Hazen | 3.4% | $5.60 | $5.60 |
| Dollar General - Kingston, NY | Retail | Ulster | 3.6% | $12.78 | $12.75 |
| Sonic - Robertsdale, AL | Retail | Baldwin | 3.7% | $62.72 | $63.00 |
| Tractor Supply - Flandreau, SD | Retail | Flandreau | 2.5% | $4.50 | $4.50 |
| Dollar General - Farmington, NY | Retail | Rochester | 5.4% | $12.10 | $12.00 |
| Dollar General - Otego, NY | Retail | Otsego | 1.3% | $11.68 | $11.50 |
| Dollar General - Kerhonkson, NY | Retail | Kerhonkson | N/A | $11.47 | $11.50 |
| Dollar General - Dewitt, NY | Retail | Southeast Outer Onondaga | 3.6% | $11.13 | $11.00 |
| Dollar General - Utica, NY | Retail | Utica-Rome | 3.6% | $10.80 | $11.25 |
| Dollar General - Parish, NY | Retail | Syracuse | 3.6% | $10.89 | $10.75 |
| Dollar General - Geddes, NY | Retail | Syracuse | 3.6% | $10.30 | $10.00 |
| Weighted Average | 5.7%(4) | $9.20(5) | $9.18(5) | ||
| (1) | Information is based on the appraisals. |
| (2) | Information is based on the underwritten rent roll. |
| (3) | Information is based on the appraisal market rent conclusions for each property. |
| (4) | Weighted Average Market Vacancy is based on the Cut-off Date allocated loan amount. |
| (5) | Weighted Average Actual Rental Rate PSF and Market Rental Rate PSF are based on square footage. |
THE INFORMATION IN THIS COLLATERAL TERM SHEET IS NOT COMPLETE AND MAY BE AMENDED PRIOR TO THE TIME OF SALE. THIS TERM SHEET IS NOT AN OFFER TO SELL THESE SECURITIES AND IT IS NOT A SOLICITATION OF AN OFFER TO BUY THESE SECURITIES IN ANY JURISDICTION WHERE THE OFFER OR SALE IS NOT PERMITTED.
91
| Various | Collateral Asset Summary – Loan No. 9 AFIN Industrial and Retail Net-Leased Portfolio | Cut-off Date Balance: Cut-off Date LTV Ratio: UW NCF DSCR: UW NOI Debt Yield: | 12.4% |
Operating History and Underwritten Net Cash Flow. The following table presents certain information relating to the historical operating performance and the Underwritten Net Cash Flow at the AFIN Industrial and Retail Net-Leased Portfolio Properties:
| Cash Flow Analysis | ||||||
| 2014(1) | 2015(1) | 2016(1) | TTM(1) | UW | UW PSF | |
| Gross Potential Rent(2) | N/A | N/A | N/A | N/A | $4,307,463 | $9.38 |
| Total Recoveries(3) | N/A | N/A | N/A | N/A | $496,106 | $1.08 |
| Less Vacancy & Credit Loss | N/A | N/A | N/A | N/A | ($156,532) | ($0.34) |
| Effective Gross Income | N/A | N/A | N/A | N/A | $4,647,036 | $10.12 |
| Total Operating Expenses(4) | N/A | N/A | N/A | N/A | $496,106 | $1.08 |
| Net Operating Income | N/A | N/A | N/A | N/A | $4,150,930 | $9.04 |
| Capital Expenditures | N/A | N/A | N/A | N/A | $49,287 | $0.11 |
| TI/LC | N/A | N/A | N/A | N/A | $237,125 | $0.52 |
| Net Cash Flow | N/A | N/A | N/A | N/A | $3,864,518 | $8.42 |
| Occupancy % | N/A | N/A | N/A | N/A | 96.7% | |
| NOI DSCR | N/A | N/A | N/A | N/A | 3.01x | |
| NCF DSCR | N/A | N/A | N/A | N/A | 2.81x | |
| NOI Debt Yield | N/A | N/A | N/A | N/A | 12.4% | |
| NCF Debt Yield | N/A | N/A | N/A | N/A | 11.6% | |
| (1) | Historical cash flows are unavailable as the AFIN Industrial and Retail Net-Leased Portfolio Properties were acquired by the borrower sponsor between March 31, 2017 and November 7, 2017. According to the borrower sponsor, the sellers of the AFIN Industrial and Retail Net-Leased Portfolio Properties did not provide historical operating statements to the AFIN Industrial and Retail Net-Leased Portfolio Borrowers. |
| (2) | UW Gross Potential Rent is based on in-place rent per lease, approximately $73,245 of straight-line rent attributable to Bridgestone HOSEpower, an investment grade tenant, and $8,795 for rent steps for Chili’s in the first 12 months of the loan term. |
| (3) | UW Total Recoveries are underwritten based on tenant leases. |
| (4) | UW Total Operating Expenses include real estate taxes and management fees calculated as 2.0% of AFIN Industrial and Retail Net-Leased Portfolio Properties effective gross income. |
Escrows and Reserves. The AFIN Industrial and Retail Net-Leased Portfolio Mortgage Loan documents provide for upfront escrows in the amount of $113,903 for real estate taxes and $33,402 for deferred maintenance.
During the occurrence and continuance of a Trigger Period (as defined below) the AFIN Industrial and Retail Net-Leased Portfolio Mortgage Loan documents provide for ongoing monthly escrows of 1/12 of the estimated annual taxes, 1/12 of the annual insurance premiums (provided an acceptable blanket policy is no longer in place), $57,404 for tenant improvement and leasing commissions (“TI/LCs”) and $9,567 for replacement reserves. During the occurrence and continuance of a Rollover Trigger Period (as defined below), the AFIN Industrial and Retail Net-Leased Portfolio Borrowers will also be required to deposit excess cash flow into the TI/LCs account until the Rollover Trigger Period Cap (defined below) is satisfied. Notwithstanding the foregoing, the AFIN Industrial and Retail Net-Leased Portfolio Borrowers will not be required to provide monthly real estate taxes and insurance premiums, which are solely the obligation of each tenant and paid directly to the relevant taxing authority or insurance company by each tenant in accordance with each tenant’s lease, for so long as (i) no event of default has occurred and is continuing and (ii) the lease(s) with the applicable tenant(s) will be and continue to be in full force and effect and will not be subject to any default beyond any applicable grace or notice and cure period by either the AFIN Industrial and Retail Net-Leased Portfolio Borrowers or the tenant.
A “Trigger Period” will occur upon (i) an event of default, (ii) the debt service coverage ratio as of the last day of any calendar quarter falling below 1.50x and (iii) at any time after December 31, 2026, the debt service coverage ratio as of the last day of any calendar quarter falling below 2.24x (as calculated pursuant to the AFIN Industrial and Retail Net-Leased Portfolio Mortgage Loan documents). A Trigger Period will continue until, in regard to clause (i) above, the cure of such event of default, and in regard to clause (ii) above, the debt service coverage ratio is at least 1.50x for two consecutive quarters.
A “Rollover Trigger Period” will commence upon the date that either (a) three or more tenants or (b) tenants under leases representing 10.0% or more of the aggregate base rent of the AFIN Industrial and Retail Net-Leased Portfolio Properties (i) have terminated the applicable leases or such leases have expired and have not been re-tenanted as required under the AFIN Industrial and Retail Net-Leased Portfolio Mortgage Loan documents, (ii) are not in occupancy of the premises demised under the applicable leases for any reason for a period of 30 consecutive days or (iii) are bankrupt or otherwise subject to insolvency or similar proceedings. A Rollover Trigger Period will continue until (i) an amount equal to $20.00 per SF with respect to the space demised pursuant to such affected leases (the “Rollover Trigger Period Cap”) shall be deposited into the TI/LCs account or (ii) the applicable AFIN Industrial and Retail Net-Leased Portfolio Property which contains the demised space shall be subject to a release or substitution in accordance with the terms of the AFIN Industrial and Retail Net-Leased Portfolio Mortgage Loan documents.
The AFIN Industrial and Retail Net-Leased Portfolio Mortgage Loan Borrowers may deliver a letter of credit to lender to satisfy reserve requirements for immediate repairs, replacements and TI/LCs, in an amount equal to the amount otherwise required to be deposited in such reserve. Additionally, the Mortgage Loan Borrowers may deliver a letter of credit to lender to satisfy reserve requirements for the excess reserve account in an amount equal to the amount otherwise required to be deposited plus the excess cash flow projected to be collected and reserved for the succeeding three months.
THE INFORMATION IN THIS COLLATERAL TERM SHEET IS NOT COMPLETE AND MAY BE AMENDED PRIOR TO THE TIME OF SALE. THIS TERM SHEET IS NOT AN OFFER TO SELL THESE SECURITIES AND IT IS NOT A SOLICITATION OF AN OFFER TO BUY THESE SECURITIES IN ANY JURISDICTION WHERE THE OFFER OR SALE IS NOT PERMITTED.
92
| Various | Collateral Asset Summary – Loan No. 9 AFIN Industrial and Retail Net-Leased Portfolio | Cut-off Date Balance: Cut-off Date LTV Ratio: UW NCF DSCR: UW NOI Debt Yield: | 12.4% |
Lockbox and Cash Management.A hard lockbox is in place with respect to the AFIN Industrial and Retail Net-Leased Portfolio Mortgage Loan and on each business day, funds in the hard lockbox account are transferred to a cash management account. On each business day, other than during the occurrence and continuance of either a Trigger Period or Rollover Trigger Period, all amounts on deposit in the cash management account will be distributed to an account designated by the AFIN Industrial and Retail Net-Leased Portfolio Borrowers. During the continuance of a Trigger Period or a Rollover Trigger Period, funds on deposit in the cash management account will be disbursed in accordance with the AFIN Industrial and Retail Net-Leased Portfolio Mortgage Loan documents with all excess funds collected and reserved in an excess cash flow account. During the occurrence of a Rollover Trigger Period, prior to excess cash flow being reserved in the excess cash flow account, all excess cash flow will be deposited into the TI/LCs account until the Rollover Trigger Period Cap is satisfied.
Additional Secured Indebtedness (not including trade debts).Not permitted.
Mezzanine Loan and Preferred Equity.Not permitted.
Release of Property. Provided no event of default has occurred and is continuing (unless such event of default related solely to the release property and such release would cause such event of default to be cured in full), the AFIN Industrial and Retail Net-Leased Portfolio Borrowers may obtain the release of any of the AFIN Industrial and Retail Net-Leased Portfolio Properties by electing either (i) partial defeasance (any time after two years after the closing of the UBS 2018-C8 transaction and before October 6, 2027) in the amount equal to the Release Amount (as defined below) with respect to the applicable release property or (ii) a partial prepayment of the AFIN Industrial and Retail Net-Leased Portfolio Mortgage Loan (after the 12th monthly payment date and before October 6, 2027) in an amount equal to the Release Amount accompanied by a yield maintenance premium. The applicable release must satisfy each of the following conditions: (i) 30 days prior written notice of the proposed release, (ii) the debt service coverage ratio for the remaining AFIN Industrial and Retail Net-Leased Portfolio Properties following the release based on the trailing 12 months is no less than the greater of the debt service coverage ratio immediately preceding such release and 2.81x, (iii) the loan-to-value ratio for the remaining AFIN Industrial and Retail Net-Leased Portfolio Properties following the release is no greater than the lesser of the loan-to-value ratio immediately preceding such release and 53.4%, (iv) the AFIN Industrial and Retail Net-Leased Portfolio Borrowers and the guarantor execute and deliver such documents as lender may reasonably request to confirm the continued validity of the loan documents and liens, (v) satisfaction of REMIC requirements and (vi) other conditions set forth in the AFIN Industrial and Retail Net-Leased Portfolio Mortgage Loan documents. See “Description of the Mortgage Pool—Releases; Partial Releases” in the Preliminary Prospectus.
A “Release Amount” is an amount equal to 120.0% of the Cut-Off Date allocated loan amount with respect to the applicable release property.
Substitution. Provided no event of default has occurred and is continuing (unless such event of default related solely to the release property and such substitution would cause such event of default to be cured in full), in connection with the release of property above, in lieu of partially defeasing or partially prepaying the AFIN Industrial and Retail Net-Leased Portfolio Mortgage Loan, the AFIN Industrial and Retail Net-Leased Portfolio Borrowers may obtain the release of any AFIN Industrial and Retail Net-Leased Portfolio Properties by providing one or more substitute properties (individually or collectively, the “Substitute Property”), provided that among other things, (i) during the term of the AFIN Industrial and Retail Net-Leased Portfolio Mortgage Loan, the AFIN Industrial and Retail Net-Leased Portfolio Borrowers may only make four substitutions (substitution of the FedEx Ground - Rolla, MO property shall be considered two substitutions) unless the tenant with the space demised at the related release property has terminated their lease or has gone dark, (ii) 60 days prior written notice, (iii) the Substitute Property is required to be a retail or industrial property (unless that release property is FedEx Ground - Rolla, MO, FedEx Ground - Brainerd, MN or FedEx Ground - Casper, WY, the Substitute Property is required to be an industrial property) to a tenant with a credit rating not less than the tenant occupying the applicable release property under a NNN lease with (a) a term equal to or longer than the longer of the term of lease at the release property and five years past the maturity date of the AFIN Industrial and Retail Net-Leased Portfolio Mortgage Loan, (b) net rent equal to or greater than the greater of the rent under the lease at the applicable release property on the origination date and immediately prior to the substitution and (c) no monetary obligations thereunder are the responsibility of the AFIN Industrial and Retail Net-Leased Portfolio Borrowers, (iv) delivery of a satisfactory estoppel, third party reports, and other such documents required as lender may reasonably request to confirm the continued validity of the AFIN Industrial and Retail Net-Leased Portfolio Mortgage Loan documents and liens, (v) satisfaction of REMIC requirements, (vi) rating agency confirmation and (vii) other conditions set forth in the AFIN Industrial and Retail Net-Leased Portfolio Mortgage Loan documents. See “Description of the Mortgage Pool—Releases; Partial Releases” in the Preliminary Prospectus.
Terrorism Insurance.The AFIN Industrial and Retail Net-Leased Portfolio Mortgage Loan documents require that an “all risk” insurance policy be maintained by the AFIN Industrial and Retail Net-Leased Portfolio Borrowers and such policy must provide coverage for terrorism in an amount equal to the full replacement cost of the AFIN Industrial and Retail Net-Leased Portfolio Properties,provided that such coverage is available. The AFIN Industrial and Retail Net-Leased Portfolio Mortgage Loan documents also require business interruption insurance covering no less than the 12-month period following the occurrence of a casualty event, together with a six-month extended period of indemnity
THE INFORMATION IN THIS COLLATERAL TERM SHEET IS NOT COMPLETE AND MAY BE AMENDED PRIOR TO THE TIME OF SALE. THIS TERM SHEET IS NOT AN OFFER TO SELL THESE SECURITIES AND IT IS NOT A SOLICITATION OF AN OFFER TO BUY THESE SECURITIES IN ANY JURISDICTION WHERE THE OFFER OR SALE IS NOT PERMITTED.
93
2855 Main Street Irvine, CA 92614
| Collateral Asset Summary – Loan No. 10 Residence Inn Irvine
| Cut-off Date Balance: Cut-off Date LTV Ratio: UW NCF DSCR: UW NOI Debt Yield: | $33,000,000 60.0% 2.65x 14.0% |
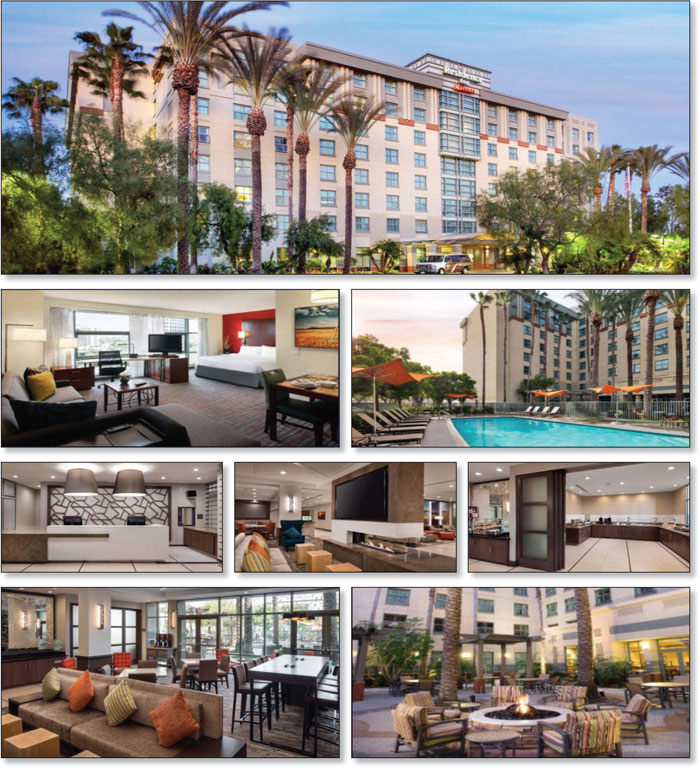
THE INFORMATION IN THIS COLLATERAL TERM SHEET IS NOT COMPLETE AND MAY BE AMENDED PRIOR TO THE TIME OF SALE. THIS TERM SHEET IS NOT AN OFFER TO SELL THESE SECURITIES AND IT IS NOT A SOLICITATION OF AN OFFER TO BUY THESE SECURITIES IN ANY JURISDICTION WHERE THE OFFER OR SALE IS NOT PERMITTED.
94
2855 Main Street Irvine, CA 92614
| Collateral Asset Summary – Loan No. 10 Residence Inn Irvine
| Cut-off Date Balance: Cut-off Date LTV Ratio: UW NCF DSCR: UW NOI Debt Yield: | $33,000,000 60.0% 2.65x 14.0% |

THE INFORMATION IN THIS COLLATERAL TERM SHEET IS NOT COMPLETE AND MAY BE AMENDED PRIOR TO THE TIME OF SALE. THIS TERM SHEET IS NOT AN OFFER TO SELL THESE SECURITIES AND IT IS NOT A SOLICITATION OF AN OFFER TO BUY THESE SECURITIES IN ANY JURISDICTION WHERE THE OFFER OR SALE IS NOT PERMITTED.
95
2855 Main Street Irvine, CA 92614
| Collateral Asset Summary – Loan No. 10 Residence Inn Irvine
| Cut-off Date Balance: Cut-off Date LTV Ratio: UW NCF DSCR: UW NOI Debt Yield: | $33,000,000 60.0% 2.65x 14.0% |
| Mortgage Loan Information | Property Information | |||||
| Mortgage Loan Seller: | Société Générale | Single Asset/Portfolio: | Single Asset | |||
| Original Balance: | $33,000,000 | Location: | Irvine, CA 92614 | |||
| Cut-off Date Balance: | $33,000,000 | General Property Type: | Hospitality | |||
| % of Initial Pool Balance: | 3.2% | Detailed Property Type: | Extended Stay | |||
| Loan Purpose: | Refinance | Title Vesting: | Leasehold | |||
| Borrower Sponsors: | Robert D. Olson; Robert D. Olson, Trustee of the Robert D. Olson Separate Property Trust, Established July 1, 2003 | Year Built/Renovated: | 2000/2017 | |||
| Size: | 174 Rooms | |||||
| Cut-off Date Balance per Room: | $189,655 | |||||
| Mortgage Rate: | 4.6350% | Maturity Date Balance per Room: | $189,655 | |||
| Note Date: | 1/12/2018 | Property Manager: | Residence Inn By Marriott, LLC | |||
| First Payment Date: | 3/1/2018 | |||||
| Maturity Date: | 2/1/2028 | |||||
| Original Term to Maturity: | 120 months | |||||
| Original Amortization Term: | 0 months | Underwriting and Financial Information | ||||
| IO Period: | 120 months | UW NOI: | $4,612,142 | |||
| Seasoning: | 0 months | UW NOI Debt Yield: | 14.0% | |||
| Prepayment Provisions: | LO (61); YM1 (55); O (4) | UW NOI Debt Yield at Maturity: | 14.0% | |||
| Lockbox/Cash Mgmt Status: | Hard/Springing | UW NCF DSCR: | 2.65x | |||
| Additional Debt Type: | N/A | Most Recent NOI: | $4,760,126 (11/30/2017 TTM) | |||
| Additional Debt Balance: | N/A | 2nd Most Recent NOI: | $4,937,524 (12/31/2016) | |||
| Future Debt Permitted (Type): | No (N/A) | 3rd Most Recent NOI: | $4,715,720 (12/31/2015) | |||
| Reserves(1) | Most Recent Occupancy: | 87.2% (12/15/2017) | ||||
| Type | Initial | Monthly | Cap | 2nd Most Recent Occupancy: | 85.9% (12/31/2016) | |
| RE Tax: | $0 | Springing | N/A | 3rd Most Recent Occupancy: | 85.9% (12/31/2015) | |
| Insurance: | $0 | Springing | N/A | Appraised Value (as of): | $55,000,000 (10/31/2017) | |
| FF&E: | $0 | Springing | N/A | Cut-off Date LTV Ratio: | 60.0% | |
| Ground Rent Reserve: | $0 | Springing | N/A | Maturity Date LTV Ratio: | 60.0% | |
| Sources and Uses | ||||||
| Sources | Proceeds | % of Total | Uses | Proceeds | % of Total | |
| Loan Amount: | $33,000,000 | 100.0% | Loan Payoff: | $31,278,074 | 94.8% | |
| Closing Costs: | $379,563 | 1.2% | ||||
| Return of Equity: | $1,342,363 | 4.1% | ||||
| Total Sources: | $33,000,000 | 100.0% | Total Uses: | $33,000,000 | 100.0% | |
| (1) | See“Escrows and Reserves” below for further discussion of reserve requirements. |
The Mortgage Loan. The tenth largest mortgage loan (the “Residence Inn Irvine Mortgage Loan”) is evidenced by a promissory note with an original principal amount of $33,000,000, secured by a leasehold interest in a 174-room extended stay hospitality property located in Irvine, California (the “Residence Inn Irvine Property”) under the Marriott flag. The proceeds of the Residence Inn Irvine Mortgage Loan were used to refinance an existing loan, fund reserves, pay closing costs and return equity to the borrower sponsor.
The Borrower and the Borrower Sponsors.The borrower is Main Street Hotels, LLC (the “Residence Inn Irvine Borrower”), a single purpose California limited liability company structured to be bankruptcy remote, with one independent director. The non-recourse carveout guarantors and borrower sponsors are Robert Olson and Robert D. Olson, Trustee of the Robert D. Olson Separate Property Trust, Established July 1, 2003. Robert Olson is the founder of R.D. Olson Development, a Newport Beach, California based firm engaged in the development and re-positioning of commercial properties throughout the United States. In December 2016, R.D. Olson Development was awarded Development Partner of the Year by Marriott International at the hotelier’s Full Service Owner’s Conference in Washington, D.C. Mr. Olson established R.D. Olson Development in 1997 following nearly 20 years as founder and CEO of R.D. Olson Construction.
The Property.The Residence Inn Irvine Property is a 174-room, eight-story, extended stay hotel located in Irvine, California, less than 1.5 miles from John Wayne Airport, six miles from Newport Beach, and ten miles from Disneyland. The Residence Inn Irvine Property was constructed in 2000 by the Residence Inn Irvine Borrower and has undergone multiple renovations since its opening. According to the appraisal, the last renovation, which was completed in March 2017, included meeting space and, lobby renovations and corridor upgrades. The guestrooms were last renovated in 2014 with a $1.4 million PIP ($8,297 per room). Since 2014, the Residence Inn Irvine Borrower has spent a total of $4.7 million ($26,922 per room) to meet Marriott's current brand standards.
The guestroom mix includes 105 studio suites, 39 one-bedroom suites and 30 two-bedroom suites. In-room amenities include iron and ironing board, kitchen with coffeemaker, and hairdryer. The Residence Inn Irvine Property guestrooms feature fully equipped kitchens with refrigerators, stoves, microwaves, dishwashers, dishes, pots/pans, and cooking utensils. The bathrooms have tub/shower combinations in some rooms, and walk-in showers
THE INFORMATION IN THIS COLLATERAL TERM SHEET IS NOT COMPLETE AND MAY BE AMENDED PRIOR TO THE TIME OF SALE. THIS TERM SHEET IS NOT AN OFFER TO SELL THESE SECURITIES AND IT IS NOT A SOLICITATION OF AN OFFER TO BUY THESE SECURITIES IN ANY JURISDICTION WHERE THE OFFER OR SALE IS NOT PERMITTED.
96
2855 Main Street Irvine, CA 92614
| Collateral Asset Summary – Loan No. 10 Residence Inn Irvine
| Cut-off Date Balance: Cut-off Date LTV Ratio: UW NCF DSCR: UW NOI Debt Yield: | $33,000,000 60.0% 2.65x 14.0% |
in others. The standard rooms at the Residence Inn Irvine Property feature either one king size or two queen size beds; however, the two-bedroom suites feature both. The Residence Inn Irvine Property amenities include a swimming pool and spa, multi-purpose sports court, fitness center, business center, picnic area with an outdoor grill, complimentary Wi-Fi, complimentary airport shuttle, and a lounge/breakfast area where complimentary breakfast is served daily. Parking is provided by 240 surface level parking spaces or 1.38 parking space per room.
According to the appraisal, the Residence Inn Irvine Property generates approximately 60% of its room revenue from corporate demand, approximately 32% from a combination of leisure and tourism demand and approximately 9% from convention group demand.
The Residence Inn Irvine Property is ground leased from The Carter Family Investment Partnership on a 4.2-acre site and has a remaining term of approximately 132 years, including renewal options. The ground lease commenced in January 1, 2000 with a 30-year term and has four, 30-year renewal options at the tenant’s sole option. The lessee, R.D. Olson Development Company, currently pays base rent of approximately $425,328 per annum NNN, which is adjusted every year by multiplying the monthly rent for the previous lease year by the consumer price index. The Residence Inn Irvine Property subleases approximately 7,744 SF to Souplantation Restaurant, a freestanding building pad in the southwestern corner of the Residence Inn Irvine Property. The lease commenced on April 11, 2001 with a 20-year term and has two five-year renewal options. The sub-lessee, Garden Fresh Restaurant Corp., currently pays base rent of approximately $172,910 per annum NNN, which is adjusted every fifth year by multiplying the monthly rent for the previous lease year by the consumer price index. Garden Fresh Restaurant Corp. also pays percentage rent in an amount equal to the difference between (i) 3% of gross sales and (ii) the monthly installment of minimum annual rent payable during such month (determined and payable on a monthly basis).
| Residence Inn Irvine Market Historical Occupancy, ADR, RevPAR | |||||||||
| Competitive Set(1) | Residence Inn Irvine | Penetration Factor | |||||||
| Year | Occupancy | ADR | RevPAR | Occupancy | ADR | RevPAR | Occupancy | ADR | RevPAR |
| 12/31/2015 TTM | 82.8% | $125.26 | $103.72 | 85.4% | $173.72 | $148.42 | 103.2% | 138.7% | 143.1% |
| 12/31/2016 TTM | 84.3% | $129.02 | $108.82 | 85.7% | $179.52 | $153.90 | 101.6% | 139.1% | 141.4% |
| 10/31/2017 TTM | 83.6% | $132.78 | $110.95 | 86.3% | $174.62 | $150.64 | 103.2% | 131.5% | 135.8% |
Source:Industry Report
| (1) | The competitive set includes Residence Inn Irvine John Wayne Airport Orange County, Embassy Suites Irvine Orange County Airport, Wyndham Irvine Orange County Airport, Ayres Hotel & Suites Costa Mesa, Candlewood Suites Orange County Airport Irvine West and DoubleTree Santa Ana Orange County Airport. |
The Market.The Residence Inn Irvine Property is located in the northwest portion of the city of Irvine, California adjacent to the John Wayne Airport and 1.1 miles east from Irvine Business Complex. Primary regional access to the Residence Inn Irvine Property's neighborhood is provided by Interstate 405/San Diego Freeway (0.3 miles south), and Highway 55/Costa Mesa Freeway (1.0 mile north). Interstate 405/San Diego Freeway is a north/south bypass auxiliary route of Interstate 5, which extends south through San Diego to the Mexican border and north through Los Angeles, Sacramento, and Seattle, WA to the Canadian border. On a local level, the Residence Inn Irvine Property is situated along Main Street, which connects the Residence Inn Irvine Property to Santa Ana (8.8 miles northwest).
The Residence Inn Irvine Property’s major demand drivers include John Wayne Airport, Disneyland, the Anaheim Convention Center, Knott’s Berry Farm, Irvine Spectrum, South Coast Plaza, Fashion Island, University of California-Irvine, and Segerstrom Center for the Arts, among others. According to the appraisal, the Residence Inn Irvine Property is located less than 1.5 miles from the John Wayne Airport, the only commercial airport within Orange County. More than ten million passengers passed through John Wayne Airport in 2016, a growth of 8.7% from 2013. Between October 2016 and October 2017, passenger traffic increased by 1.4%. Commercial aircraft operations increased 3.2% and commuter aircraft operations decreased 28.4% when compared with October 2016 levels. Disneyland, located 10 miles north of the Residence Inn Irvine Property, is one of two theme parks built at the Disneyland Resort in the city of Anaheim, California. It also features the newly expanded Disney California Adventure Park which includes the new 12-acre Cars Land, the cornerstone of Disney’s $1.0 billion expansion. In addition, the Residence Inn Irvine Property benefits from the 1.6 million SF Anaheim Convention Center, located 14.0 miles northwest of the Residence Inn Irvine Property. The Anaheim Convention Center is the largest convention center on the West Coast and the 6th largest in the nation. The center features 815,000 SF of exhibit space, 130,000 SF of meeting space and a range of outdoor function space that contains the 100,000 SF Grand Plaza, which opened January 2013. In September 2017, the Anaheim Convention Center had the grand opening of its 7th expansion, which is referred to as ACC North. It added 200,000 SF of flexible space, which can be used for exhibits, meeting rooms or ballroom functions. There is also a 1,400-space parking structure. This 2017 addition increased the Anaheim Convention Center's total exhibit space to over 1.0 million SF. The University of California-Irvine, located 2.8 miles south of the Residence Inn Irvine Property, is Orange County’s second largest employer with an estimated annual economic impact of $4.2 billion and over 28,000 students.
The Residence Inn Irvine Property is located within the Los Angeles-Long Beach-Glendale, California metropolitan statistical area (“MSA”). A third-party market data provider reports that the MSA had a population of approximately 10.2 million as of August 2017, which represents a 0.2% increase over 2016. The population increased 2.7% from 2011 to 2017, and is expected to increase an additional 2.0% through 2022.
According to the U.S. Bureau of Labor Statistics, the MSA had an unemployment rate of 4.1% in November 2017, down from 4.8% in November 2016. According to a third party market research report, the estimated 2017 population within a one-, three- and five-mile radius of the Residence Inn Irvine Property is 19,800, 150,517 and 528,979, respectively. The estimated 2017 average household income within a one-, three- and five-mile radius of the Residence Inn Irvine Property is $111,015, $110,679 and $112,497, respectively.
The appraiser also identified eight new and/or planned hotels within the Residence Inn Irvine Property’s market, four of which are considered somewhat competitive, although none directly. The appraiser’s consideration for the four competitive hotels equates to a competitive ratio of 37.0%. Of the competitive hotels, the 161-room Homewood Suites by Hilton Irvine John Wayne Airport and 149-room Hyatt House Irvine opened on December 31, 2016 and April 4, 2017, respectively. The 168-room Staybridge Irvine is projected to open on November 1, 2018 and the 122-room Element Irvine – 17662 Armstrong is projected to open on April 2, 2019. The non-competitive hotels consist of a 176-room AC Hotels by Marriott, 164-room Hampton Inn Irvine, 271-room Marriott Irvine Spectrum, and 165-room TownePlace Suites. The appraiser reported that the AC and Marriott Irvine are full service hotels, which are not directly competitive. In addition, the Hampton Inn Irvine is a limited service hotel and the TownPlace Suites is inferior in terms of quality. After accounting for this new supply, the appraiser concluded to a stabilized occupancy rate of 86.0% and RevPAR of $155.65 for the year ending October 30, 2017.
THE INFORMATION IN THIS COLLATERAL TERM SHEET IS NOT COMPLETE AND MAY BE AMENDED PRIOR TO THE TIME OF SALE. THIS TERM SHEET IS NOT AN OFFER TO SELL THESE SECURITIES AND IT IS NOT A SOLICITATION OF AN OFFER TO BUY THESE SECURITIES IN ANY JURISDICTION WHERE THE OFFER OR SALE IS NOT PERMITTED.
97
2855 Main Street Irvine, CA 92614
| Collateral Asset Summary – Loan No. 10 Residence Inn Irvine
| Cut-off Date Balance: Cut-off Date LTV Ratio: UW NCF DSCR: UW NOI Debt Yield: | $33,000,000 60.0% 2.65x 14.0% |
Competitive properties to the Residence Inn Irvine Property are shown in the table below:
| Competitive Set | ||||||||
| Property | Rooms | Year Built | 2016 Occupancy | 2016 Average ADR | 2016 RevPAR | 2017 Occupancy | 2017 Average ADR | 2017 RevPAR |
| Residence Inn Irvine | 174 | 2000 | 85.0% | $180.02 | $154.16 | 86.0% | $174.44 | $150.07 |
| Springhill Suites Irvine | 132 | 2009 | 88.0% | $145 | $127.11 | 80.0%-85.0% | $145.00-$150.00 | $120.00-$125.00 |
| Doubletree Santa Ana | 253 | 2002 | 87.0% | $130 | $113.62 | 80.0%-85.0% | $140.00-$145.00 | $115.00-$120.00 |
| Embassy Suites by Hilton Irvine | 295 | 1986 | 73.0% | $157 | $114.61 | 80.0%-85.0% | $160.00-$170.00 | $130.00-$135.00 |
| Courtyard Irvine John Wayne Airport | 153 | 1989 | 77.0% | $160 | $122.45 | 75.0%-80.0% | $155.00-$165.00 | $120.00-$125.00 |
| Hilton Garden Inn | 170 | 2015 | 79.0% | $151.06 | $119.34 | 80.0%-85.0% | $150.00-$160.00 | $125.00-$130.00 |
| Homewood Suites by Hilton Irvine John Wayne Airport | 161 | 2017 | N/A | N/A | N/A | 65.0%-70.0% | $140.00-$145.00 | $95.00-$100.00 |
Source:Appraisal
Operating History and Underwritten Net Cash Flow. The following table presents certain information relating to the historical operating performance and the Underwritten Net Cash Flow at the Residence Inn Irvine Property.
| Cash Flow Analysis | |||||
| 2015 | 2016 | 11/30/2017 TTM | UW | UW per Room | |
| Occupancy | 85.9% | 85.9% | 87.3% | 87.2% | |
| ADR | $172.84 | $179.08 | $174.06 | $174.06 | |
| RevPAR | $148.42 | $153.90 | $151.86 | $151.86 | |
| Rooms Revenue | $9,426,257 | $9,800,755 | $9,644,732 | $9,644,732 | $55,429 |
| Food & Beverage | $115,240 | $112,327 | $108,983 | $108,983 | $626 |
| Other Income(1) | $403,343 | $372,369 | $377,464 | $351,715 | $2,021 |
| Total Revenue | $9,944,840 | $10,285,451 | $10,131,179 | $10,105,430 | $58,077 |
| Total Expenses | $5,229,120 | $5,347,927 | $5,371,053 | $5,493,288 | $31,571 |
| Net Operating Income | $4,715,720 | $4,937,524 | $4,760,126 | $4,612,142 | $26,507 |
| FF&E | $0 | $0 | $0 | $505,272 | $2,904 |
| Net Cash Flow | $4,715,720 | $4,937,524 | $4,760,126 | $4,106,870 | $23,603 |
| NOI DSCR | 3.04x | 3.18x | 3.07x | 2.97x | |
| NCF DSCR | 3.04x | 3.18x | 3.07x | 2.65x | |
| NOI Debt Yield | 14.3% | 15.0% | 14.4% | 14.0% | |
| NCF Debt Yield | 14.3% | 15.0% | 14.4% | 12.4% | |
| (1) | Other Income includes telephone revenue, market, grocery and vending services and other miscellaneous revenue. |
Escrows and Reserves.On a monthly basis, the Residence Inn Irvine Borrower is required to deposit (i) 1/12 of the annual estimated tax payments, (ii) 1/12 of the annual estimated insurance premiums, (iii) 1/12 of 5.0% of gross revenues for each fiscal year (as such terms are defined in the management agreement) excluding extraordinary items of income for capital/FF&E expenses and (iv) an amount that is estimated by the lender to be sufficient to pay any installment of ground rent under the ground lease at least 20 days before its due date.
The lender waived monthly deposits into the tax reserve provided that (a) the Residence Inn Irvine Borrower strictly complies with all of its obligations under the management agreement (with respect to tax impounds and payment of taxes); (b) all taxes are paid before delinquency and (c) the Residence Inn Irvine Borrower provides to the lender, without further request from the lender, evidence of timely payment of taxes before delinquency. The lender waived monthly deposits into the insurance reserve, provided that (A) (x) the Residence Inn Irvine Borrower participates in an insurance program offered by the manager and strictly complies with all obligations under the management agreement with respect to insurance reserves and payment of insurance premiums; (y) all insurance premiums are paid before delinquency, and (z) the Residence Inn Irvine Borrower provides to the lender, without further notice of timely payment of insurance premiums before delinquency or (B) (i) no Cash Management Period (as defined below) is continuing; (ii) the policies maintained by the Residence Inn Irvine Borrower covering the Residence Inn Irvine Property are approved by the lender, which policies may be part of a blanket or umbrella policy, in which case the lender’s the approval will include, without limitation, approval of the schedule of locations and values; (iii) all insurance premiums are paid before delinquency; (iv) the Residence Inn Irvine Borrower provides the lender evidence of renewal of such policies; and (v) the Residence Inn Irvine Borrower provides to the lender evidence of timely payment of insurance premiums before delinquency. The lender also waived monthly deposits into the capital/FF&E expense reserve; provided that (i) the Residence Inn Irvine Borrower satisfies certain post-closing obligations detailed in the Residence Inn Irvine Mortgage Loan documents, (ii) the manager is holding the reserve pursuant to the reserve account agreement (and so long as the account(s) under the reserve account agreement are opened by February 25, 2018) and (iii) the Residence Inn Irvine Borrower strictly complies with all of its obligations under the management agreement with respect to reserves for and payment of capital/FF&E expenses. Unless the manager is collecting ground rent installments pursuant to the management agreement (and then, only to the extent or percentage of ground rent installments so collected), in which case the ground rent subaccount is waived, then during the continuance of a Cash Management Period, the Residence
THE INFORMATION IN THIS COLLATERAL TERM SHEET IS NOT COMPLETE AND MAY BE AMENDED PRIOR TO THE TIME OF SALE. THIS TERM SHEET IS NOT AN OFFER TO SELL THESE SECURITIES AND IT IS NOT A SOLICITATION OF AN OFFER TO BUY THESE SECURITIES IN ANY JURISDICTION WHERE THE OFFER OR SALE IS NOT PERMITTED.
98
2855 Main Street Irvine, CA 92614
| Collateral Asset Summary – Loan No. 10 Residence Inn Irvine
| Cut-off Date Balance: Cut-off Date LTV Ratio: UW NCF DSCR: UW NOI Debt Yield: | $33,000,000 60.0% 2.65x 14.0% |
Inn Irvine Borrower will pay to the lender on each payment date an amount that is estimated by the lender to be sufficient to pay any installment of ground rent under the ground lease at least 20 days before its due date and the lender will transfer such amounts to a subaccount.
Lockbox and Cash Management.The Residence Inn Irvine Mortgage Loan has a hard lockbox with springing cash management upon the occurrence and continuance of a Cash Management Period (as defined below).
A “Cash Management Period” will commence upon the occurrence of any of the following: (i) the maturity date, (ii) an event of default, (iii) if, as of the last day of the calendar quarter, the debt service coverage ratio (as determined under the Residence Inn Irvine Mortgage Loan documents) is less than 1.30x, (iv) a default has occurred and continues beyond any applicable cure period under the management agreement (or any successor management agreement) and such default permits the manager to cancel or terminate the management agreement (or any successor management agreement), (v) the Residence Inn Irvine Borrower or manager delivers notice of its intent to terminate the management agreement, (vi) the Residence Inn Irvine Borrower or manager terminates the management agreement or (vii) the date that is twelve months prior to the expiration of the management agreement; and will end upon the lender giving notice to the clearing bank that the sweeping of funds into the cash management account may cease, which notice the lender is only be required to give if (1) the Residence Inn Irvine Mortgage Loan and all other obligations under the Residence Inn Irvine Mortgage Loan documents have been repaid in full or (2) the maturity date has not occurred and (A) with respect to the matters described in clause (ii) above, such event of default has been cured and no other event of default has occurred and is continuing or (B) with respect to the matter described in clause (iii) above, the lender has determined that the Residence Inn Irvine Property has achieved a debt service coverage ratio (as determined under the Residence Inn Irvine Mortgage Loan documents) of at least 1.30x for two consecutive calendar quarters or (C) with respect to the matter described in clause (iv) above, upon the cure (if applicable) of such default under the management agreement (or any successor management agreement) and acceptance of such cure by manager as evidenced by a written statement from manager in a form acceptable to the lender in its commercially reasonable discretion (provided that no other Cash Management Period has occurred and is continuing) or (D) with respect to the matter described in clause (v) above, upon the Residence Inn Irvine Borrower or manager withdrawing its notice of intent to terminate the management agreement (provided that no other Cash Management Period has occurred and is continuing), or (E) with respect to the matter described in clauses (iv), (v) or (vi) above, (x) the Residence Inn Irvine Borrower enters into a qualified management agreement for a term that does not expire until a date which is no earlier than December 31, 2031 and (y) the term of such Qualified Management Agreement (as defined below) has commenced (provided that no other Cash Management Period has occurred and is continuing) or (F) with respect to the matter described in clause (vii) above, (I) the Residence Inn Irvine Borrower extends or renews the management agreement for a term that does not expire until a date which is no earlier than December 31, 2031, (II) (x) the Residence Inn Irvine Borrower enters into a Qualified Management Agreement for a term that does not expire until a date which is no earlier than December 31, 2031 and (y) the term of such Qualified Management Agreement has commenced or (III) the Residence Inn Irvine Borrower delivers a letter of credit in an amount equal to $2,750,000 and otherwise in accordance with the Residence Inn Irvine Mortgage Loan agreement (provided that, in each such case, no other Cash Management Period has occurred and is continuing).
A “Qualified Management Agreement” means a management agreement with a Qualified Manager (as defined below) with respect to the Residence Inn Irvine Property which is approved by the lender in writing (which such approval will not be unreasonably withheld; provided, however, such approval may be conditioned upon the lender’s receipt of a rating comfort letter with respect to such management agreement).
A “Qualified Manager” means a reputable and experienced manager possessing experience in operating hotel properties similar in size, scope, use and value as the Residence Inn Irvine Property and approved by the lender in writing (which such approval may be granted or withheld in the lender’s reasonable discretion and may be conditioned upon lender’s receipt of a rating comfort letter with respect to such person).
Right of First Offer. The manager of the Residence Inn Irvine Property has a right of first refusal to purchase the Residence Inn Irvine Property in the event the Residence Inn Irvine Borrower receives an acceptable bona fide offer (if the Residence Inn Irvine Borrower is the offeree), which offer is accepted, or acceptance of a bona fide offer (if the Residence Inn Irvine Borrower is the offeror) from a third party to purchase the Residence Inn Irvine Property. In such event, the Residence Inn Irvine Borrower will extend the right of first refusal to purchase the Residence Inn Irvine Property to the manager on the terms of such offer, except as otherwise provided in the management agreement. The manager’s right of first refusal is fully subordinated to the Residence Inn Irvine Mortgage Loan and does not apply to foreclosure or deed-in-lieu thereof.
Additional Secured Indebtedness (not including trade debts). Not permitted.
Mezzanine Loan and Preferred Equity. Not permitted.
Release of Property. Not permitted.
Terrorism Insurance.The Residence Inn Irvine Borrower is required to obtain and maintain property insurance, commercial general liability insurance, and business income or rental loss insurance that covers perils of terrorism and acts of terrorism, both foreign and domestic.
THE INFORMATION IN THIS COLLATERAL TERM SHEET IS NOT COMPLETE AND MAY BE AMENDED PRIOR TO THE TIME OF SALE. THIS TERM SHEET IS NOT AN OFFER TO SELL THESE SECURITIES AND IT IS NOT A SOLICITATION OF AN OFFER TO BUY THESE SECURITIES IN ANY JURISDICTION WHERE THE OFFER OR SALE IS NOT PERMITTED.
99
| UBS 2018-C8 |
| TRANSACTION CONTACT INFORMATION |
Questions regarding this Collateral Term Sheet may be directed to any of the following individuals:
| UBS Securities LLC | |
| David Schell | Tel. (212) 713-3375 |
| Nicholas Galeone | Tel. (212) 713-8832 |
| Siho Ham | Tel. (212) 713-1278 |
| SG Americas Securities, LLC | |
| Adam Ansaldi | Tel. (212) 278-6126 |
| Jim Barnard | Tel. (212) 278-6263 |
| Warren Geiger | Tel. (212) 278-5692 |
| Justin Cappuccino | Tel. (212) 278-6393 |
| Barclays Bank PLC | |
| Daniel Vinson | Tel. (212) 528-8224 |
| Brian Wiele | Tel. (212) 412-5780 |
| Brian La Belle | Tel. (212) 526-1809 |
| Cantor Fitzgerald & Co. / CCRE | |
| Steve Gargiulo | Tel. (212) 829-5259 |
| Clark Andreson | Tel. (212) 829-5290 |
| Brett Katz | Tel. (212) 610-2305 |
| Michael Brown | Tel. (212) 610-2357 |
| Baz Preston | Tel. (212) 829-5294 |
| Kiran Manda | Tel. (212) 915-1925 |
THE INFORMATION IN THIS COLLATERAL TERM SHEET IS NOT COMPLETE AND MAY BE AMENDED PRIOR TO THE TIME OF SALE. THIS TERM SHEET IS NOT AN OFFER TO SELL THESE SECURITIES AND IT IS NOT A SOLICITATION OF AN OFFER TO BUY THESE SECURITIES IN ANY JURISDICTION WHERE THE OFFER OR SALE IS NOT PERMITTED.
100