Exhibit (c)(4)
Special Committee Reporting Materials
Project Betta
October 2020
CONFIDENTIAL
Legal Disclaimer
This document has been prepared by Morgan Stanley Asia Limited (“Morgan Stanley”) pursuant to a letter of engagement dated August 24, 2020 and a letter of indemnification dated August 17, 2020 with the special committee (the “Client”) of the Board of Directors of DouYu International Holdings Limited (“DouYu”).
This document has been prepared for the Client only in the context of the Transaction and the Transfer (each as defined below). The Client and its directors, officers, employees, agents and affiliates must hold this document and any oral information provided in connection with this document in strict confidence and may not communicate, reproduce, distribute or disclose it to any other person, or refer to it publicly, in whole or in part at any time except with our prior written consent.
The purpose of this document is to provide the Client with an explanation of the basis upon which Morgan Stanley is issuing a financial opinion letter (the “Opinion”) in relation to the proposed combination of DouYu and HUYA Inc. (“Huya”) in a stock-for-stock merger (the “Transaction”). In connection with the Transaction, DouYu proposes to acquire 100% of the equity of Penguin E-Sports (the “Transfer”). This document should be read in conjunction with and is subject to the terms of the Opinion. This document supersedes any previous documents or presentations delivered by Morgan Stanley to the Client in connection with the Transaction and the Transfer.
In preparing this document, Morgan Stanley has: (i) used information obtained from DouYu, Huya, Penguin E-Sports and public sources; (ii) assumed and relied upon, without independent verification, the accuracy and completeness of the information supplied or otherwise made available to it for the purpose of this document; (iii) assumed that the financial projections and other financial data relating to DouYu, Huya and Penguin E-Sports have been reasonably and properly prepared on bases reflecting the best currently available estimates and judgments of the future financial performance of DouYu, Huya and Penguin E-Sports, as applicable, as at the date of this document; (iv) not conducted any independent valuation or appraisal of the assets or liabilities of any company involved in any proposed transaction; and (v) not been provided with any such valuation or appraisal.
Neither we nor any of our affiliates, or our or their respective officers, employees or agents (the “Morgan Stanley Group”), make any representation or warranty, express or implied, in relation to the accuracy or completeness of the information contained in this document or any oral information provided in connection herewith, or any data it generates and accept no responsibility, obligation or liability (whether direct or indirect, in contract, tort or otherwise) in relation to any of such information. Each member of the Morgan Stanley Group expressly disclaims any and all liability which may be based on this document and any errors therein or omissions therefrom. No member of the Morgan Stanley Group makes any representation or warranty, express or implied, that any transaction has been or may be effected on the terms or in the manner stated in this document, or as to the achievement or reasonableness of future projections, management targets, estimates, prospects or returns, if any. Any views or terms contained herein are preliminary only, and are based on financial, economic, market and other conditions prevailing as of the date of this document and are therefore subject to change. We undertake no obligation or responsibility to update any of the information contained in this document. Past performance does not guarantee or predict future performance.
For the avoidance of doubt, no member of the Morgan Stanley Group owes any fiduciary duties to the Client, DouYu, Huya, Penguin E-Sports or any other person whether in respect of this document, the Opinion, the Transaction, the Transfer or otherwise. The only duties Morgan Stanley owes to the Client are those set forth in, and subject to the other provisions of, the engagement letter and the indemnification letter entered into between Morgan Stanley and the Client in connection with the Transaction and the Transfer.
This document and the information contained herein do not constitute an offer to sell or the solicitation of an offer to buy any security, commodity or instrument or related derivative, nor do they constitute an offer or commitment to lend, syndicate or arrange a financing, underwrite or purchase or act as an agent or advisor or in any other capacity with respect to any transaction, or commit capital, or to participate in any trading strategies, and do not constitute legal, regulatory, accounting or tax advice to the Client. We recommend that the Client seek independent third party legal, regulatory, accounting and tax advice regarding the contents of this document. This document is not a research report and was not prepared by the research department of Morgan Stanley or any of its affiliates.
Notwithstanding anything herein to the contrary, the Client and DouYu (and their employees, representatives, and other agents) may disclose to any and all persons, without limitation of any kind from the commencement of discussions, the U.S. federal and state income tax treatment and tax structure of the proposed transaction and all materials of any kind (including opinions or other tax analyses) that are provided relating to the tax treatment and tax structure. For this purpose, “tax structure” is limited to facts relevant to the U.S. federal and state income tax treatment of the proposed transaction and does not include information relating to the identity of the parties, their affiliates, agents or advisors.
This document is provided by Morgan Stanley & Co. LLC and/or certain of its affiliates or other applicable entities, which may include Morgan Stanley Realty Incorporated, Morgan Stanley Senior Funding, Inc., Morgan Stanley Bank, N.A., Morgan Stanley & Co. International plc, Morgan Stanley Securities Limited, Morgan Stanley Bank AG, Morgan Stanley MUFG Securities Co., Ltd., Mitsubishi UFJ Morgan Stanley Securities Co., Ltd., Morgan Stanley Asia Limited, Morgan Stanley Australia Securities Limited, Morgan Stanley Australia Limited, Morgan Stanley Asia (Singapore) Pte., Morgan Stanley Services Limited, Morgan Stanley & Co. International plc Seoul Branch and/or Morgan Stanley Canada Limited Unless governing law permits otherwise, you must contact an authorized Morgan Stanley entity in your jurisdiction regarding this document or any of the information contained herein.
© Morgan Stanley and/or certain of its affiliates. All rights reserved.
PROJECT BETTA CONFIDENTIAL 2
Table of Contents
Section 1 Executive Summary 4 Section 2 Valuation Summary 7 Appendix Supplementary Information 29
PROJECT BETTA CONFIDENTIAL 3
SECTION 1
Executive Summary
CONFIDENTIAL 4
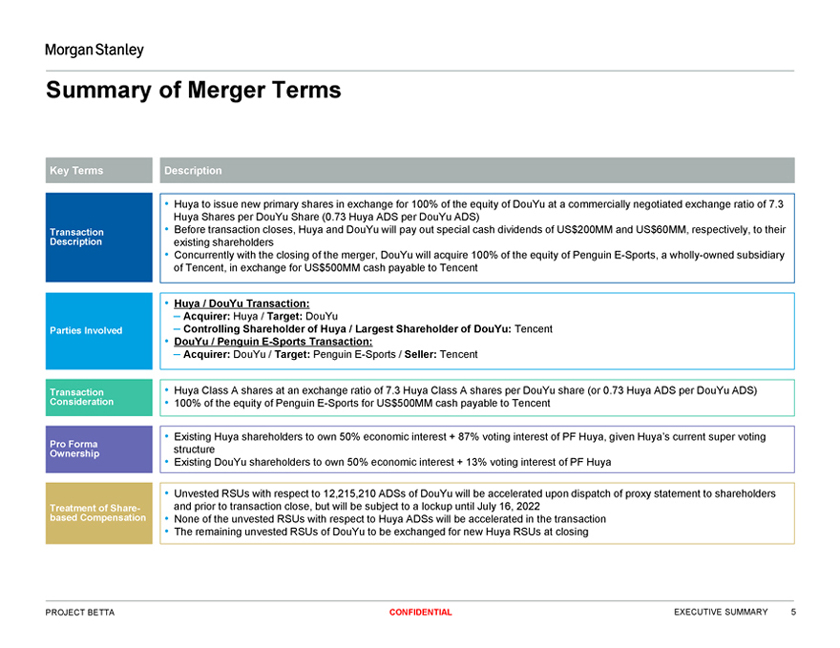
Summary of Merger Terms
Key Terms Description
• Huya to issue new primary shares in exchange for 100% of the equity of DouYu at a commercially negotiated exchange ratio of 7.3 Huya Shares per DouYu Share (0.73 Huya ADS per DouYu ADS) Transaction • Before transaction closes, Huya and DouYu will pay out special cash dividends of US$200MM and US$60MM, respectively, to their Description existing shareholders
• Concurrently with the closing of the merger, DouYu will acquire 100% of the equity of Penguin E-Sports, a wholly-owned subsidiary of Tencent, in exchange for US$500MM cash payable to Tencent
• Huya / DouYu Transaction:
– Acquirer: Huya / Target: DouYu
Parties Involved – Controlling Shareholder of Huya / Largest Shareholder of DouYu: Tencent
• DouYu / Penguin E-Sports Transaction:
– Acquirer: DouYu / Target: Penguin E-Sports / Seller: Tencent
Transaction • Huya Class A shares at an exchange ratio of 7.3 Huya Class A shares per DouYu share (or 0.73 Huya ADS per DouYu ADS) Consideration • 100% of the equity of Penguin E-Sports for US$500MM cash payable to Tencent
• Existing Huya shareholders to own 50% economic interest + 87% voting interest of PF Huya, given Huya’s current super voting
Pro Forma
Ownership structure
• Existing DouYu shareholders to own 50% economic interest + 13% voting interest of PF Huya
• Unvested RSUs with respect to 12,215,210 ADSs of DouYu will be accelerated upon dispatch of proxy statement to shareholders Treatment of Share- and prior to transaction close, but will be subject to a lockup until July 16, 2022 based Compensation • None of the unvested RSUs with respect to Huya ADSs will be accelerated in the transaction
• The remaining unvested RSUs of DouYu to be exchanged for new Huya RSUs at closing
PROJECT BETTA CONFIDENTIAL EXECUTIVE SUMMARY 5
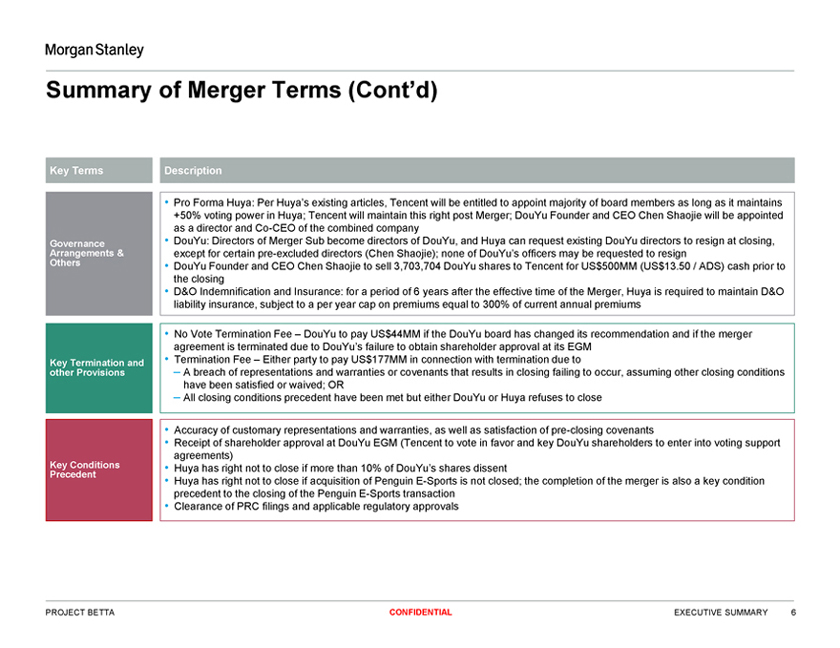
Summary of Merger Terms (Cont’d)
Key Terms Description
• Pro Forma Huya: Per Huya’s existing articles, Tencent will be entitled to appoint majority of board members as long as it maintains +50% voting power in Huya; Tencent will maintain this right post Merger; DouYu Founder and CEO Chen Shaojie will be appointed as a director and Co-CEO of the combined company Governance • DouYu: Directors of Merger Sub become directors of DouYu, and Huya can request existing DouYu directors to resign at closing,
Arrangements & except for certain pre-excluded directors (Chen Shaojie); none of DouYu’s officers may be requested to resign
Others • DouYu Founder and CEO Chen Shaojie to sell 3,703,704 DouYu shares to Tencent for US$500MM (US$13.50 / ADS) cash prior to the closing
• D&O Indemnification and Insurance: for a period of 6 years after the effective time of the Merger, Huya is required to maintain D&O liability insurance, subject to a per year cap on premiums equal to 300% of current annual premiums
• No Vote Termination Fee – DouYu to pay US$44MM if the DouYu board has changed its recommendation and if the merger agreement is terminated due to DouYu’s failure to obtain shareholder approval at its EGM
Key Termination and • Termination Fee – Either party to pay US$177MM in connection with termination due to other Provisions – A breach of representations and warranties or covenants that results in closing failing to occur, assuming other closing conditions have been satisfied or waived; OR
– All closing conditions precedent have been met but either DouYu or Huya refuses to close
• Accuracy of customary representations and warranties, as well as satisfaction of pre-closing covenants
• Receipt of shareholder approval at DouYu EGM (Tencent to vote in favor and key DouYu shareholders to enter into voting support agreements) Key Conditions • Huya has right not to close if more than 10% of DouYu’s shares dissent
Precedent
• Huya has right not to close if acquisition of Penguin E-Sports is not closed; the completion of the merger is also a key condition precedent to the closing of the Penguin E-Sports transaction
• Clearance of PRC filings and applicable regulatory approvals
PROJECT BETTA CONFIDENTIAL EXECUTIVE SUMMARY 6
SECTION 2
Valuation Summary
CONFIDENTIAL 7
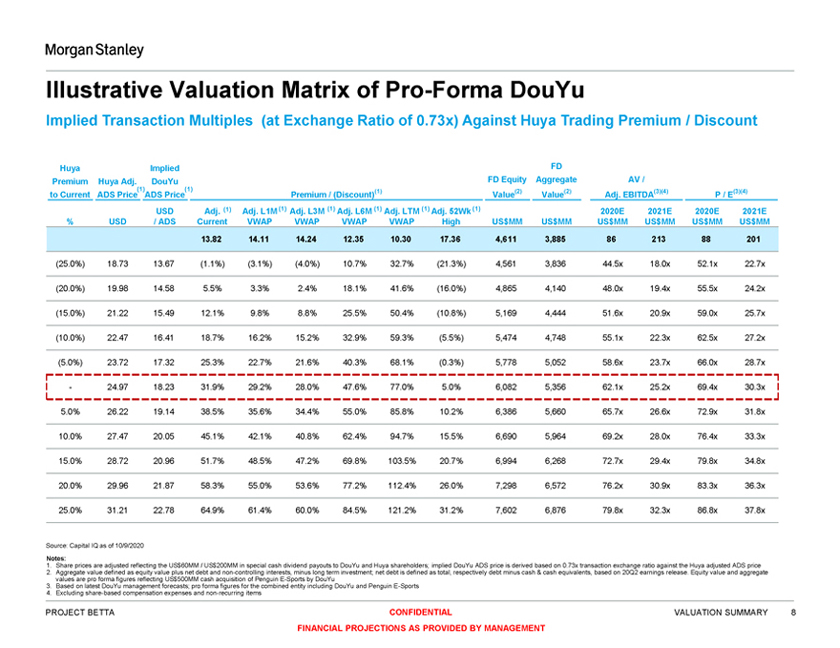
Illustrative Valuation Matrix of Pro-Forma DouYu
Implied Transaction Multiples (at Exchange Ratio of 0.73x) Against Huya Trading Premium / Discount
Huya Implied FD
Premium Huya Adj. DouYu FD Equity Aggregate AV /
(1) (1) (1) (2) (2) (3)(4) (3)(4)
to Current ADS Price ADS Price Premium / (Discount) Value Value Adj. EBITDA P / E
USD Adj. (1) Adj. L1M (1) Adj. L3M (1) Adj. L6M (1) Adj. LTM (1) Adj. 52Wk (1) 2020E 2021E 2020E 2021E
% USD / ADS Current VWAP VWAP VWAP VWAP High US$MM US$MM US$MM US$MM US$MM US$MM
13.82 14.11 14.24 12.35 10.30 17.36 4,611 3,885 86 213 88 201
(25.0%) 18.73 13.67 (1.1%) (3.1%) (4.0%) 10.7% 32.7% (21.3%) 4,561 3,836 44.5x 18.0x 52.1x 22.7x (20.0%) 19.98 14.58 5.5% 3.3% 2.4% 18.1% 41.6% (16.0%) 4,865 4,140 48.0x 19.4x 55.5x 24.2x (15.0%) 21.22 15.49 12.1% 9.8% 8.8% 25.5% 50.4% (10.8%) 5,169 4,444 51.6x 20.9x 59.0x 25.7x (10.0%) 22.47 16.41 18.7% 16.2% 15.2% 32.9% 59.3% (5.5%) 5,474 4,748 55.1x 22.3x 62.5x 27.2x (5.0%) 23.72 17.32 25.3% 22.7% 21.6% 40.3% 68.1% (0.3%) 5,778 5,052 58.6x 23.7x 66.0x 28.7x
- 24.97 18.23 31.9% 29.2% 28.0% 47.6% 77.0% 5.0% 6,082 5,356 62.1x 25.2x 69.4x 30.3x 5.0% 26.22 19.14 38.5% 35.6% 34.4% 55.0% 85.8% 10.2% 6,386 5,660 65.7x 26.6x 72.9x 31.8x 10.0% 27.47 20.05 45.1% 42.1% 40.8% 62.4% 94.7% 15.5% 6,690 5,964 69.2x 28.0x 76.4x 33.3x 15.0% 28.72 20.96 51.7% 48.5% 47.2% 69.8% 103.5% 20.7% 6,994 6,268 72.7x 29.4x 79.8x 34.8x 20.0% 29.96 21.87 58.3% 55.0% 53.6% 77.2% 112.4% 26.0% 7,298 6,572 76.2x 30.9x 83.3x 36.3x 25.0% 31.21 22.78 64.9% 61.4% 60.0% 84.5% 121.2% 31.2% 7,602 6,876 79.8x 32.3x 86.8x 37.8x
Source: Capital IQ as of 10/9/2020
Notes:
1. Share prices are adjusted reflecting the US$60MM / US$200MM in special cash dividend payouts to DouYu and Huya shareholders; implied DouYu ADS price is derived based on 0.73x transaction exchange ratio against the Huya adjusted ADS price
2. Aggregate value defined as equity value plus net debt and non-controlling interests, minus long term investment; net debt is defined as total, respectively debt minus cash & cash equivalents, based on 20Q2 earnings release. Equity value and aggregate values are pro forma figures reflecting US$500MM cash acquisition of Penguin E-Sports by DouYu
3. Based on latest DouYu management forecasts; pro forma figures for the combined entity including DouYu and Penguin E-Sports
4. Excluding share-based compensation expenses and non-recurring items
PROJECT BETTA CONFIDENTIAL VALUATION SUMMARY 8
FINANCIAL PROJECTIONS AS PROVIDED BY MANAGEMENT

DouYu + Penguin E-Sports Standalone Valuation Summary
Pro Forma Valuation Excluding Synergies
Implied DouYu per ADS Value
US$ (1)
Unadj. DouYu Current Share Price: 14.00
Analyst TP Summary(3)
1 Historical Trading Range (1) Adj. Huya’s Nominal Offer: 18.23(1) Adj. DouYu Current Share Price: 13.82
One Month 13.21 16.36 Analyst 1 $16.50
Price Adj. DouYu Unaffected Share Price: 6.89(1)
Three Month 11.48 17.54
Share Since DouYu IPO(2) 6.24 17.54 Analyst 2 $18.50
2 Analyst Target Price Analyst 3
Consensus Target Price : 16.62 $14.00 Target Price(3) 14.00 18.50
Unadjusted 3 Precedent Transaction Analyst 4 $15.30
Median Precedent MOE Premium (8.9%) / US Red-Chip Take
15.57 17.01
Private Transactions (19.0%) Premium (Over L1M VWAP) Analyst 5 $15.50
L1M VWAP: $14.29 Consensus $16.62
4 Comparable Companies(4)
Street Case
2020E AV / Adj. EBITDA (20.7x – 29.7x) 10.88 14.66
2021E AV / Adj. EBITDA (13.0x – 21.5x) 12.52 19.29 Financial
(7) Summary Mgmt. Street
2020E P/E (23.0x – 37.3x) 9.34 15.14 (USD MM) Est. Est. (6) 2021E P/E (14.9x – 27.8x) (7) 10.83 20.20
Price D + P 2020E
86 140
Share Management Case Adj. EBITDA
2020E AV / Adj. EBITDA (20.7x – 29.7x) 7.52 9.85 D + P 2021E
213 266
2021E AV / Adj. EBITDA (13.0x – 21.5x) Adj. EBITDA 10.47 15.90
D +
P 2020E
Adjusted 2020E P/E (23.0x – 37.3x) (7) 6.04 9.79 88 135
Adj. NI
2021E P/E (14.9x – 27.8x) (7) 8.98 16.75
D + P 2021E
201 243
Adj. NI
5 DCF (5)
DCF Mid-point: 14.05 Pro Forma DouYu + Penguin E-Sports: Management Case 17.18 12.08 (10.8% -12.8% WACC, 2.0%—4.0% Perpetual Growth)
Notes: 0 20 40
1. adjusted All share for prices proposed and nominal US$60MM offer /price US$ 200MM as of 10/9/2020, closing cash except dividends for unaffected for DouYu share and price Huya of respectively, DouYu, which pursuant is as of to 4/3/2020, the Merger when Agreement Tencent became Huya’s controlling shareholder; adjusted price of DouYu, unaffected share price and nominal offer price are 3. 2. Analyst DouYu IPO’ed target prices on 7/17/2019 are undiscounted prices
4. For management street case, forecasts adj. EBITDA, adj. net income estimates are based on DouYu selected analysts’ median forecasts + Penguin E-Sports DouYu management forecast; for management case, adj. EBITDA, adj. net income estimates are based on DouYu 5. 6. Include Mid-point both calculated DouYu and as using Penguin mid-point E-Sports. PGR Consensus of 3% and estimates WACC of 11.8% reflect selected analysts’ consensus forecasts for DouYu and DouYu management forecast for Penguin E-Sports
7. Adjusted net income reflects tax-effected foregone cash interest on US$60MM closing dividend and US$500MM cash acquisition of Penguin E-Sports
PROJECT BETTA CONFIDENTIAL VALUATION SUMMARY 9
FINANCIAL PROJECTIONS AS PROVIDED BY MANAGEMENT
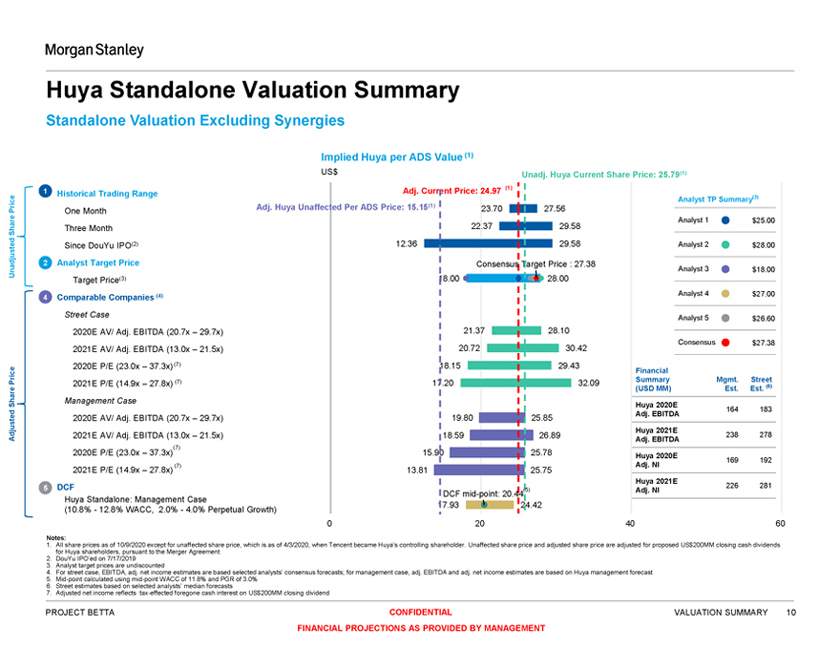
Huya Standalone Valuation Summary
Standalone Valuation Excluding Synergies
Implied Huya per ADS Value (1)
US$ Unadj. Huya Current Share Price: 25.79(1) Adj. Current Price: 24.97 (1)
1 Historical Trading Range
Analy
st TP Summary(3)
Price Adj. Huya Unaffected Per ADS Price: 15.15(1) 23.70 27.56 One Month
Analyst 1 $25.00
Share Three Month 22.37 29.58
Since DouYu IPO(2) 12.36 29.58 Analyst 2 $28.00 Unadjusted 2 Analyst Target Price Consensus Target Price : 27.38 Analyst 3 $18.00 Target Price(3) 18.00 28.00
(4) Analyst 4 $27.00
4 Comparable Companies
Street Case Analyst 5 $26.60
2020E AV/ Adj. EBITDA (20.7x – 29.7x) 21.37 28.10
Consensus $27.38
2021E AV/ Adj. EBITDA (13.0x – 21.5x) 20.72 30.42
2020E P/E (23.0x – 37.3x) (7) 18.15 29.43 Financial
Price (7) 17.20 32.09 Summary Mgmt. Street 2021E P/E (14.9x – 27.8x) (6)
(USD MM) Est. Est.
Management Case
Share Huya 2020E
164 183
Ad
j. EBITDA
2020E AV/ Adj. EBITDA (20.7x – 29.7x) 19.80 25.85
Huya 2021E
Adjusted 2021E AV/ Adj. EBITDA (13.0x – 21.5x) 18.59 26.89 238 278
Adj. EBITDA
(7)
2020E P/E (23.0x – 37.3x) 15.90 25.78 Huya 2020E
169 192
(7) Adj. NI
2021E P/E (14.9x – 27.8x) 13.81 25.75
Huya 2021E
5 DCF 226 281
(5) Adj. NI
DCF mid-point: 20.44 Huya Standalone: Management Case 17.93 24.42 (10.8%—12.8% WACC, 2.0%—4.0% Perpetual Growth)
0 20 40 60
Notes:
1. All share prices as of 10/9/2020 except for unaffected share price, which is as of 4/3/2020, when Tencent became Huya’s controlling shareholder. Unaffected share price and adjusted share price are adjusted for proposed US$200MM closing cash dividends for Huya shareholders, pursuant to the Merger Agreement
2. DouYu IPO’ed on 7/17/2019
3. Analyst target prices are undiscounted
4. For street case, EBITDA, adj. net income estimates are based selected analysts’ consensus forecasts; for management case, adj. EBITDA and adj. net income estimates are based on Huya management forecast
5. Mid-point calculated using mid-point WACC of 11.8% and PGR of 3.0%
6. Street estimates based on selected analysts’ median forecasts
7. Adjusted net income reflects tax-effected foregone cash interest on US$200MM closing dividend
PROJECT BETTA CONFIDENTIAL VALUATION SUMMARY 10
FINANCIAL PROJECTIONS AS PROVIDED BY MANAGEMENT

Exchange Ratio Analysis
Standalone Valuation Excluding Synergies
Implied Exchange Ratio
(x)
Analyst TP Summary(3)
1 Historical Trading Range (1)
Current Exchange Ratio: 0.55x Huya’s Offer: 0.73x
0.54 0.61 Analyst 1 0.66x
One Month (1)
Price Unaffected Exchange Ratio: 0.46x
Three Month 0.50 0.61
Analyst 2 0.66x
Share Since Douyu IPO(2) 0.30 0.63
Consensus Implied Exchange Ratio:
2 Analyst Target Price Analyst 3 0.78x
0.61
Target Price(3) 0.57 0.78
Unadjusted Analyst 4 0.57x
3 Precedent Transaction
Median Precedent MOE / Take Private Transactions Premium 0.60 0.66
Analyst 5 0.58x
4 Comparable Companies(4) Consensus 0.61x
Street Case
2020E AV/ Adj. EBITDA 0.46 0.61
2021E AV/ Adj. EBITDA 0.54 0.80 2020E P/E 0.45 0.70
Price 2021E P/E 0.55 0.97
Share Management Case
2020E AV/ Adj. EBITDA 0.34 0.45
Adjusted 2021E AV/ Adj. EBITDA 0.51 0.74 2020E P/E 0.33 0.52
2021E P/E 0.56 1.00
5 DCF DCF Mid-point: 0.69 Management Case (5) 0.61 0.84
0.0 0.5 1.0 1.5 2.0
Notes:
1. Current exchange ratio based on share prices of DouYu and Huya as of 10/9/2020; unaffected share price as of 4/3/2020, when Tencent became Huya’s controlling shareholder; All share prices used for implied exchange ratio calculations are adjusted for proposed US$60MM / US$200MM closing cash dividends to DouYu / Huya shareholders, pursuant to the Merger Agreement
2. DouYu IPO’ed on 7/17/2019
3. Analyst target prices are undiscounted
4. For street case, adj. EBITDA, adj. net income estimates are based on HUYA / DouYu analysts’ consensus forecasts + Penguin th E-Sports DouYu th management forecast; for management case, adjusted EBITDA, adj. net income estimates are based on HUYA / DouYu th (for the combined th entity with Penguin E-Sports) management forecasts. Exchange ratio range is adjusted using 25 percentile / 75 percentile as low / high end of each range
5. 25 percentile and 75 percentile of the DCF valuation range used as low-end and high-end. DCF implied mid point exchange ratio calculated using mid-point DCF valuation of PF DouYu + Penguin E-Sports over that of Huya
PROJECT BETTA CONFIDENTIAL VALUATION SUMMARY 11
FINANCIAL PROJECTIONS AS PROVIDED BY MANAGEMENT
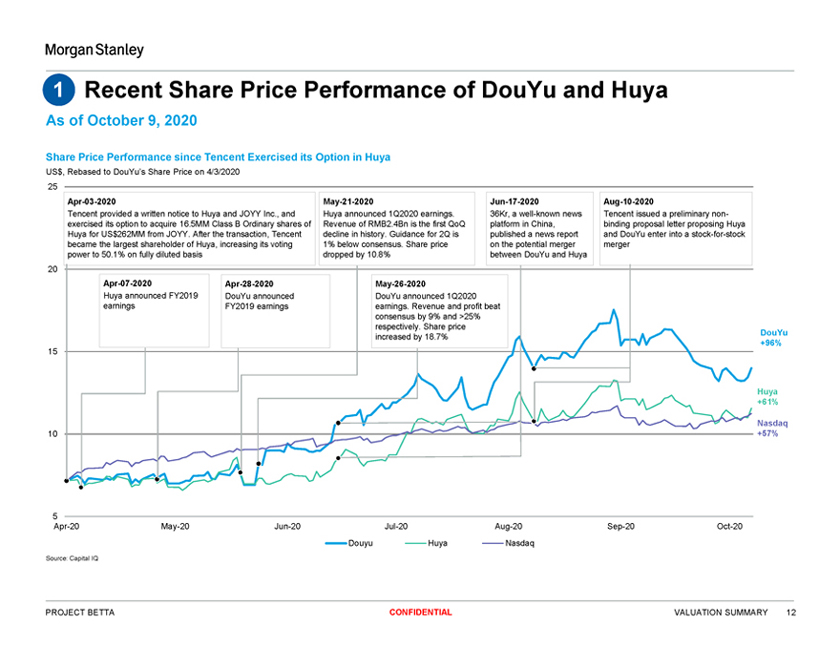
1 Recent Share Price Performance of DouYu and Huya
As of October 9, 2020
Share Price Performance since Tencent Exercised its Option in Huya
US$, Rebased to DouYu’s Share Price on 4/3/2020
25
Apr-03-2020 May-21-2020 Jun-17-2020 Aug-10-2020
Tencent provided a written notice to Huya and JOYY Inc., and Huya announced 1Q2020 earnings. 36Kr, a well-known news Tencent issued a preliminary non-exercised its option to acquire 16.5MM Class B Ordinary shares of Revenue of RMB2.4Bn is the first QoQ platform in China, binding proposal letter proposing Huya Huya for US$262MM from JOYY. After the transaction, Tencent decline in history. Guidance for 2Q is published a news report and DouYu enter into a stock-for-stock became the largest shareholder of Huya, increasing its voting 1% below consensus. Share price on the potential merger merger power to 50.1% on fully diluted basis dropped by 10.8% between DouYu and Huya 20
Apr-07-2020 Apr-28-2020 May-26-2020
Huya announced FY2019 DouYu announced DouYu announced 1Q2020 earnings FY2019 earnings earnings. Revenue and profit beat consensus by 9% and >25% respectively. Share price
DouYu increased by 18
.7%
+96%
15
Huya +61%
Nasdaq
10 +57%
5
Apr-20 May-20 Jun-20 Jul-20 Aug-20 Sep-20 Oct-20
Douyu Huya Nasdaq
Source: Capital IQ
PROJECT BETTA CONFIDENTIAL VALUATION SUMMARY 12
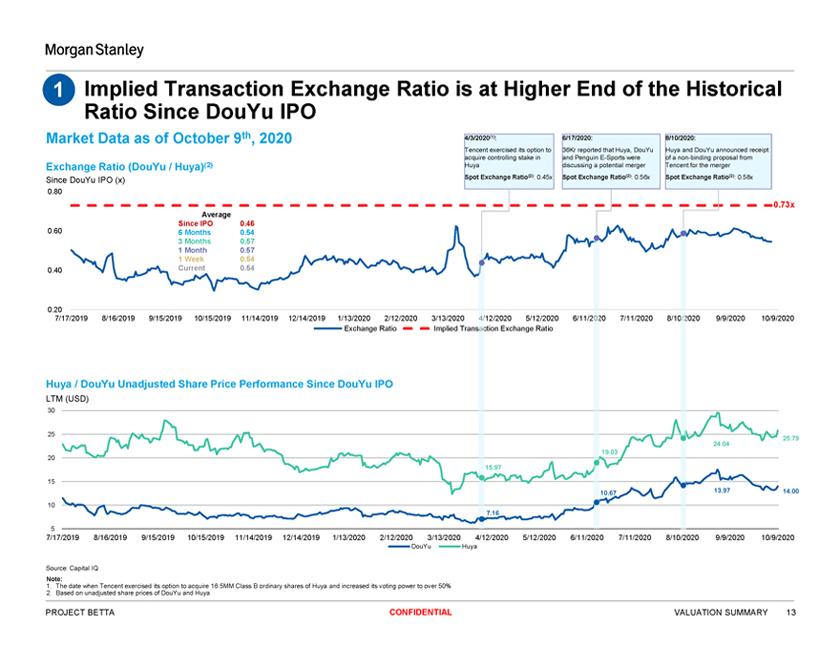
1 Implied Transaction Exchange Ratio is at Higher End of the Historical Ratio Since DouYu IPO
Market Data as of October 9th, 2020 4/3/2020(1): 6/17/2020: 8/10/2020:
Tencent exercised its option to 36Kr reported that Huya, DouYu Huya and DouYu announced receipt acquire controlling stake in and Penguin E-Sports were of a non-binding proposal from Exchange Ratio (DouYu / Huya)(2) Huya discussing a potential merger Tencent for the merger
Since DouYu IPO (x) Spot Exchange Ratio(2): 0.45x Spot Exchange Ratio(2): 0.56x Spot Exchange Ratio(2): 0.58x
0.80
0.7
3x
Average Since IPO 0.46
0.60 6 Months 0.54
3 Months 0.57
1 Month 0.57
1 Week 0.54
0.40 Current 0.54
0.20
7/17/2019 8/16/2019 9/15/2019 10/15/2019 11/14/2019 12/14/2019 1/13/2020 2/12/2020 3/13/2020 4/12/2020 5/12/2020 6/11/2020 7/11/2020 8/10/2020 9/9/2020 10/9/2020 Exchange Ratio Implied Transaction Exchange Ratio
Huya / DouYu Unadjusted Share Price Performance Since DouYu IPO
LTM (USD)
30
25
24.04 25.79
20 19.03 15.97
15
10.67 13.97 14.00
10
7.16
5
7/17/2019 8/16/2019 9/15/2019 10/15/2019 11/14/2019 12/14/2019 1/13/2020 2/12/2020 3/13/2020 4/12/2020 5/12/2020 6/11/2020 7/11/2020 8/10/2020 9/9/2020 10/9/2020
DouYu Huya
Source: Capital IQ
Note:
1. The date when Tencent exercised its option to acquire 16.5MM Class B ordinary shares of Huya and increased its voting power to over 50%
2. Based on unadjusted share prices of DouYu and Huya
PROJECT BETTA CONFIDENTIAL VALUATION SUMMARY 13
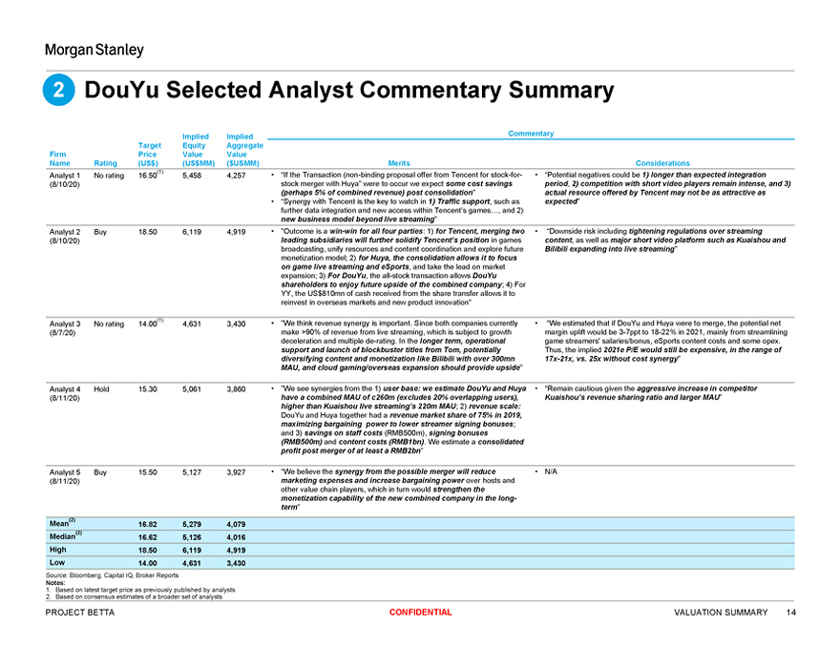
2 DouYu Selected Analyst Commentary Summary
Implied Implied Commentary Target Equity Aggregate Firm Price Value Value
Name Rating (US$) (US$MM) ($USMM) Merits Considerations
(1) • “If the Transaction (non-binding proposal offer from Tencent for stock-for- • “Potential negatives could be 1) longer than expected integration
Analyst 1 No rating 16.50 5,458 4,257
(8/10/20) stock merger with Huya” were to occur we expect some cost savings period, 2) competition with short video players remain intense, and 3) (perhaps 5% of combined revenue) post consolidation” actual resource offered by Tencent may not be as attractive as
• “Synergy with Tencent is the key to watch in 1) Traffic support, such as expected” further data integration and new access within Tencent’s games…, and 2) new business model beyond live streaming”
Analyst 2 Buy 18.50 6,119 4,919 • ”Outcome is a win-win for all four parties: 1) for Tencent, merging two • “Downside risk including tightening regulations over streaming
(8/10/20) leading subsidiaries will further solidify Tencent’s position in games content, as well as major short video platform such as Kuaishou and broadcasting, unify resources and content coordination and explore future Bilibili expanding into live streaming” monetization model; 2) for Huya, the consolidation allows it to focus on game live streaming and eSports, and take the lead on market expansion; 3) For DouYu, the all-stock transaction allows DouYu shareholders to enjoy future upside of the combined company; 4) For YY, the US$810mn of cash received from the share transfer allows it to reinvest in overseas markets and new product innovation”
(1) • ”We think revenue synergy is important. Since both companies currently • “We estimated that if DouYu and Huya were to merge, the potential net
Analyst 3 No rating 14.00 4,631 3,430
(8/7/20) make >90% of revenue from live streaming, which is subject to growth margin uplift would be 3-7ppt to 18-22% in 2021, mainly from streamlining deceleration and multiple de-rating. In the longer term, operational game streamers’ salaries/bonus, eSports content costs and some opex. support and launch of blockbuster titles from Tom, potentially Thus, the implied 2021e P/E would still be expensive, in the range of diversifying content and monetization like Bilibili with over 300mn 17x-21x, vs. 25x without cost synergy” MAU, and cloud gaming/overseas expansion should provide upside”
Analyst 4 Hold 15.30 5,061 3,860 • ”We see synergies from the 1) user base: we estimate DouYu and Huya • “Remain cautious given the aggressive increase in competitor (8/11/20) have a combined MAU of c260m (excludes 20% overlapping users), Kuaishou’s revenue sharing ratio and larger MAU” higher than Kuaishou live streaming’s 220m MAU; 2) revenue scale:
DouYu and Huya together had a revenue market share of 75% in 2019, maximizing bargaining power to lower streamer signing bonuses; and 3) savings on staff costs (RMB500m), signing bonuses (RMB500m) and content costs (RMB1bn). We estimate a consolidated profit post merger of at least a RMB2bn”
Analyst 5 Buy 15.50 5,127 3,927 • “We believe the synergy from the possible merger will reduce • N/A (8/11/20) marketing expenses and increase bargaining power over hosts and other value chain players, which in turn would strengthen the monetization capability of the new combined company in the long-term”
(2)
Mean 16.82 5,279 4,079
(2)
Median 16.62 5,126 4,016 High 18.50 6,119 4,919 Low 14.00 4,631 3,430
Source: Bloomberg, Capital IQ, Broker Reports
Notes:
1. Based on latest target price as previously published by analysts
2. Based on consensus estimates of a broader set of analysts
PROJECT BETTA CONFIDENTIAL VALUATION SUMMARY 14
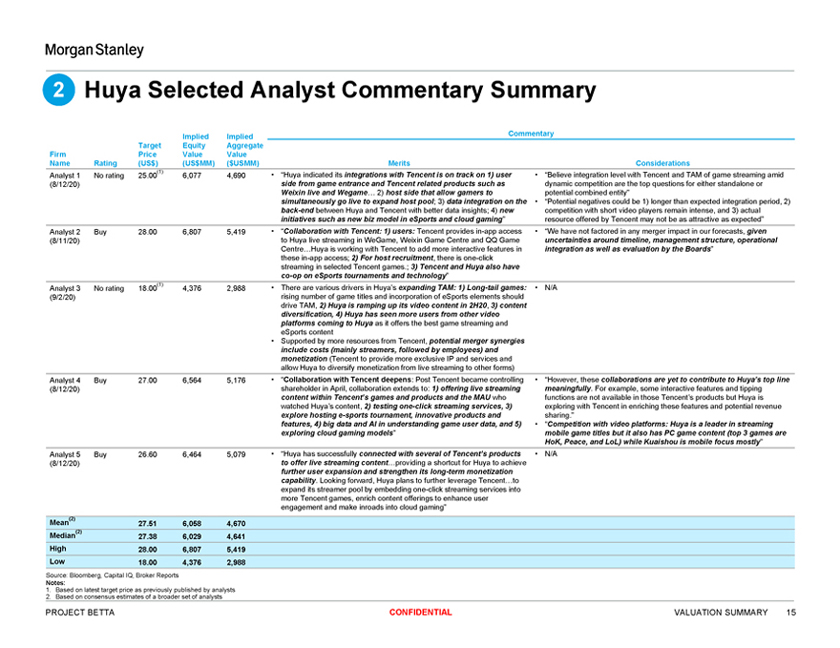
2 Huya Selected Analyst Commentary Summary
Implied Implied Commentary Target Equity Aggregate Firm Price Value Value
Name Rating (US$) (US$MM) ($USMM) Merits Considerations
(1) • “Huya indicated its integrations with Tencent is on track on 1) user • “Believe integration level with Tencent and TAM of game streaming amid Analyst 1 No rating 25.00 6,077 4,690 (8/12/20) side from game entrance and Tencent related products such as dynamic competition are the top questions for either standalone or
Weixin live and Wegame… 2) host side that allow gamers to potential combined entity” simultaneously go live to expand host pool; 3) data integration on the • “Potential negatives could be 1) longer than expected integration period, 2) back-end between Huya and Tencent with better data insights; 4) new competition with short video players remain intense, and 3) actual initiatives such as new biz model in eSports and cloud gaming” resource offered by Tencent may not be as attractive as expected” Analyst 2 Buy 28.00 6,807 5,419 • “Collaboration with Tencent: 1) users: Tencent provides in-app access • “We have not factored in any merger impact in our forecasts, given
(8/11/20) to Huya live streaming in WeGame, Weixin Game Centre and QQ Game uncertainties around timeline, management structure, operational
Centre…Huya is working with Tencent to add more interactive features in integration as well as evaluation by the Boards” these in-app access; 2) For host recruitment, there is one-click streaming in selected Tencent games.; 3) Tencent and Huya also have co-op on eSports tournaments and technology”
(1) • There are various drivers in Huya’s expanding TAM: 1) Long-tail games: • N/A Analyst 3 No rating 18.00 4,376 2,988 (9/2/20) rising number of game titles and incorporation of eSports elements should drive TAM, 2) Huya is ramping up its video content in 2H20, 3) content diversification, 4) Huya has seen more users from other video platforms coming to Huya as it offers the best game streaming and eSports content
• Supported by more resources from Tencent, potential merger synergies include costs (mainly streamers, followed by employees) and monetization (Tencent to provide more exclusive IP and services and allow Huya to diversify monetization from live streaming to other forms)
Analyst 4 Buy 27.00 6,564 5,176 • “Collaboration with Tencent deepens: Post Tencent became controlling • “However, these collaborations are yet to contribute to Huya’s top line (8/12/20) shareholder in April, collaboration extends to: 1) offering live streaming meaningfully. For example, some interactive features and tipping content within Tencent’s games and products and the MAU who functions are not available in those Tencent’s products but Huya is watched Huya’s
content, 2) testing one-click streaming services, 3) exploring with Tencent in enriching these features and potential revenue explore hosting e-sports tournament, innovative products and sharing.” features, 4) big data and AI in understanding game user data, and 5) • “Competition with video platforms: Huya is a leader in streaming exploring cloud gaming models” mobile game titles but it also has PC game content (top 3 games are HoK, Peace, and LoL) while Kuaishou is mobile focus mostly”
Analyst 5 Buy 26.60 6,464 5,079 • “Huya has successfully connected with several of Tencent’s products • N/A (8/12/20) to offer live streaming content…providing a shortcut for Huya to achieve further user expansion and strengthen its long-term monetization capability. Looking forward, Huya plans to further leverage Tencent…to expand its streamer pool by embedding one-click streaming services into more Tencent games, enrich content offerings to enhance user engagement and make inroads into cloud gaming”
(2)
Mean 27.51 6,058 4,670
(2)
Median 27.38 6,029 4,641 High 28.00 6,807 5,419 Low 18.00 4,376 2,988
Source: Bloomberg, Capital IQ, Broker Reports
Notes:
1. Based on latest target price as previously published by analysts
2. Based on consensus estimates of a broader set of analysts
PROJECT BETTA CONFIDENTIAL VALUATION SUMMARY 15
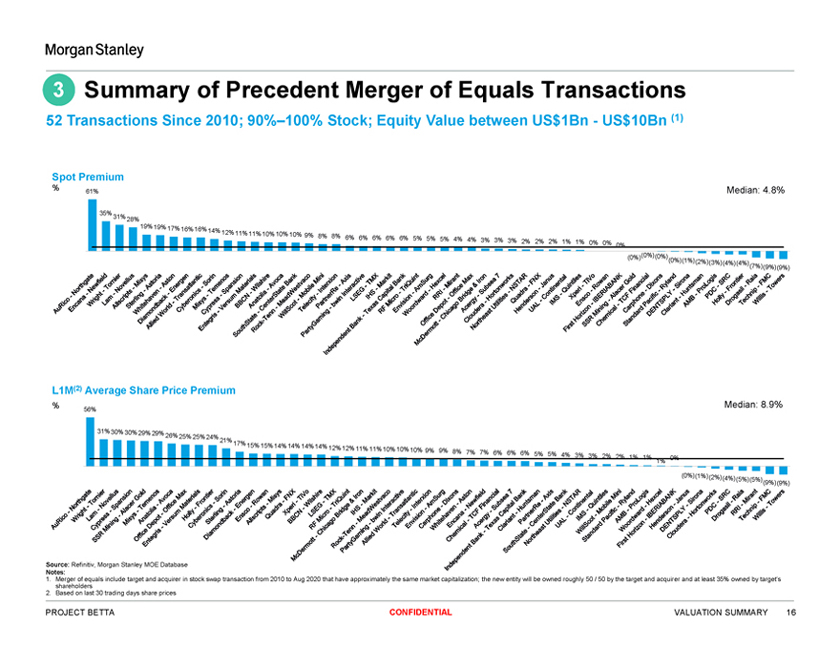
3 Summary of Precedent Merger of Equals Transactions
52 Transactions Since 2010; 90%–100% Stock; Equity Value between US$1Bn—US$10Bn (1)
Spot Premium
% Median: 4.8%
61%
35%
31% 28%
19% 19% 17% 16%
16% 14%
12% 11% 11% 10% 10% 10%
9% 8% 8% 6% 6% 6%
6% 6% 5% 5% 5% 4% 4% 3% 3% 3%
2% 2% 2% 1% 1% 0% 0% 0%
(0%)(0%)(0%)
(0%)(1%)(2%)(3%)
(4%)(4
%)
(7%)(9%)(9%)
L1M(2) Average Share Price Premium
% Median: 8.9%
56%
31% 30% 30% 29% 29%
26% 25% 25% 24% 21%
17% 15% 15% 14% 14%
14% 14% 12% 12% 11% 11%
10% 10% 10% 9% 9% 8%
7% 7% 6% 6% 6% 5% 5% 4%
3% 3% 2% 2% 1% 1% 1% 0%
(0%)(1%)(2%)(4%)
(5%)(5%)
(9%)(9%)
Source: Refinitiv, Morgan Stanley MOE Database
Notes:
1. Merger of equals include target and acquirer in stock swap transaction from 2010 to Aug 2020 that have approximately the same market capitalization; the new entity will be owned roughly 50 / 50 by the target and acquirer and at least 35% owned by target’s shareholders
2. Based on last 30 trading days share prices
PROJECT BETTA CONFIDENTIAL VALUATION SUMMARY 16
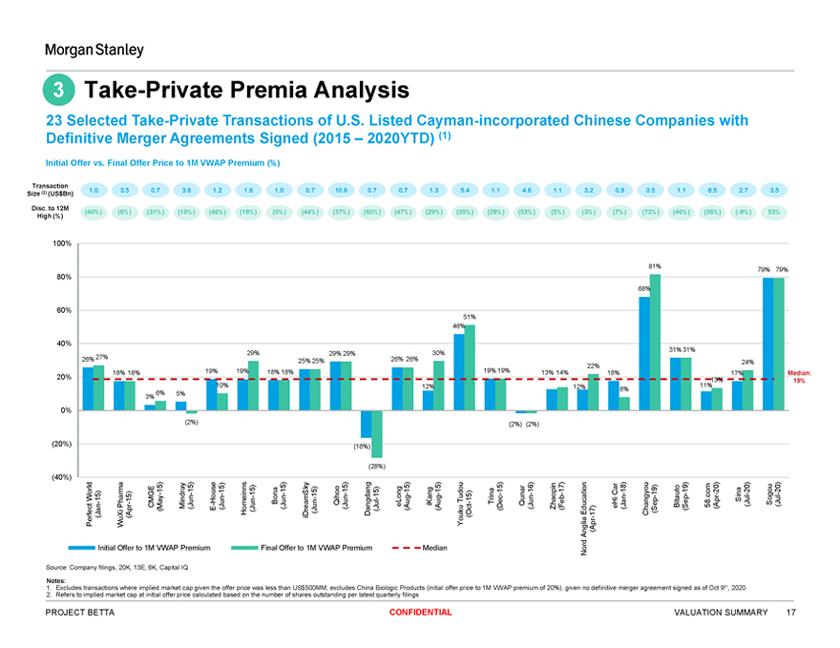
3 Take-Private Premia Analysis
23 Selected Take-Private Transactions of U.S. Listed Cayman-incorporated Chinese Companies with
Definitive Merger Agreements Signed (2015 – 2020YTD) (1)
Initial Offer vs. Final Offer Price to 1M VWAP Premium (%)
Transaction
(2) 1.0 3.3 0.7 3.6 1.2 1.6 1.0 0.7 10.6 0.7 0.7 1.3 5.4 1.1 4.6 1.1 3.2 0.9 0.5 1.1 8.5 2.7 3.5 Size (US$Bn)
Disc. to 12M
(40%) (6%) (31%) (19%) (46%) (18%) (0%) (44%) (37%) (60%) (47%) (29%) (35%) (28%) (53%) (5%) (3%) (7%) (73%) (46%) (36%) (-8%) 53% High (%)
100%
81%
79% 79%
80%
68%
60%
51% 46%
40% 31% 31% 29% 29% 29% 30% 26% 27% 26% 26%
25% 25% 24% 22%
20% 18% 18% 19% 19% 18% 18% 19% 19% 13% 14% 18% 17% Median: 10% 11% 13% 19% 12% 12% 8%
6% 5% 3%
0%
(2%) (2%) (2%)
(20%) (16%)
(28%)
(40%) a 15) 15) 15) 15) Sky 15) 15) 15) 15) 16) 17) 18) 19) 20) 20) 20)
— — 15)—15)—15) — — -Car — 19)—com — -World 15) 15) — Tudou 15) . Sina
- Pharm—CMGE Mindray (Jun—House Bona (Jun Qihoo (Jun eLong iKang—Trina Qunar (Jun Zhaopin eHi (Jan Bitauto 58 (Apr (Jul Sogou (Jul (May E (Jun Homeinns (Jun (Jun Dangdang (Jul (Aug (Aug (Dec (Feb Education 17) Changyou (Sep (Sep (Jan (Apr iDream (Oct Perfect WuXi Youku Anglia (Apr -Initial Offer to 1M VWAP Premium Final Offer to 1M VWAP Premium Median Nord
Source: Company filings, 20K, 13E, 6K, Capital IQ
Notes:
1. Excludes transactions where implied market cap given the offer price was less than US$500MM; excludes China Biologic Products (initial offer price to 1M VWAP premium of 20%), given no definitive merger agreement signed as of Oct 9th, 2020
2. Refers to implied market cap at initial offer price calculated based on the number of shares outstanding per latest quarterly filings
PROJECT BETTA CONFIDENTIAL VALUATION SUMMARY 17
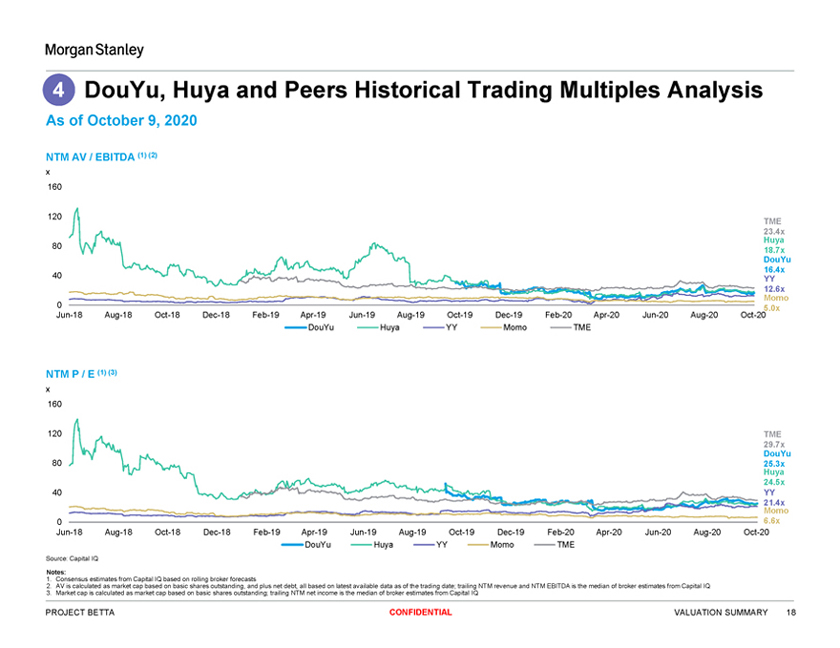
4 DouYu, Huya and Peers Historical Trading Multiples Analysis
As of October 9, 2020
NTM AV / EBITDA (1) (2)
x 160
120
TME 23.4x Huya
80
18.7x DouYu 16.4x
40 YY 12.6x
0 Momo
Jun-18 Aug-18 Oct-18 Dec-18 Feb-19 Apr-19 Jun-19 Aug-19 Oct-19 Dec-19 Feb-20 Apr-20 Jun-20 Aug-20 Oct-20 5.0x DouYu Huya YY Momo TME
NTM P / E (1) (3)
x 160
120 TME 29.7x DouYu
80 25.3x Huya 24.5x
40 YY 21.4x Momo
0 6.6x
Jun-18 Aug-18 Oct-18 Dec-18 Feb-19 Apr-19 Jun-19 Aug-19 Oct-19 Dec-19 Feb-20 Apr-20 Jun-20 Aug-20 Oct-20 DouYu Huya YY Momo TME
Source: Capital IQ
Notes:
1. Consensus estimates from Capital IQ based on rolling broker forecasts
2. AV is calculated as market cap based on basic shares outstanding, and plus net debt, all based on latest available data as of the trading date; trailing NTM revenue and NTM EBITDA is the median of broker estimates from Capital IQ
3. Market cap is calculated as market cap based on basic shares outstanding; trailing NTM net income is the median of broker estimates from Capital IQ
PROJECT BETTA CONFIDENTIAL VALUATION SUMMARY 18
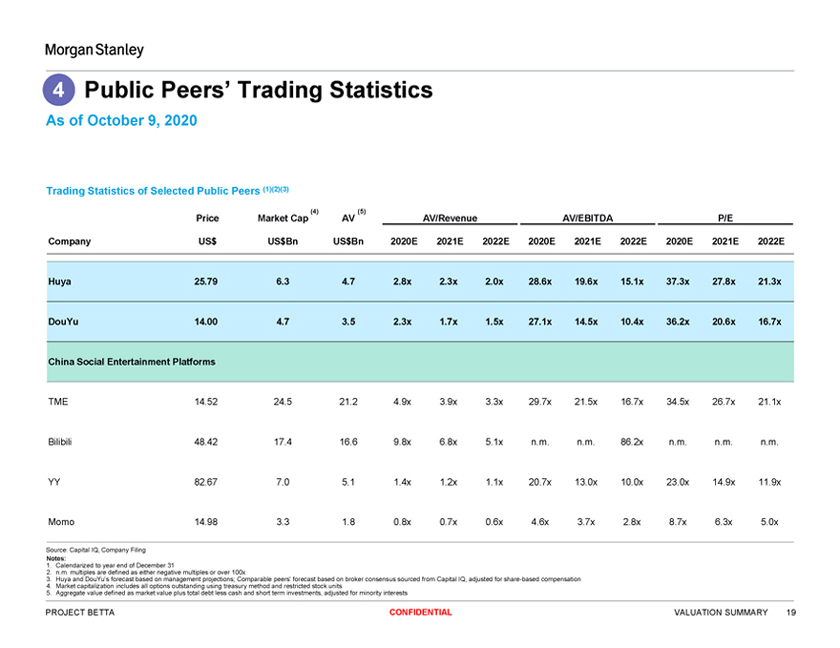
4 Public Peers’ Trading Statistics
As of October 9, 2020
Trading Statistics of Selected Public Peers (1)(2)(3)
Price Market Cap (4) AV (5) AV/Revenue AV/EBITDA P/E
Company US$ US$Bn US$Bn 2020E 2021E 2022E 2020E 2021E 2022E 2020E 2021E 2022E Huya 25.79 6.3 4.7 2.8x 2.3x 2.0x 28.6x 19.6x 15.1x 37.3x 27.8x 21.3x DouYu 14.00 4.7 3.5 2.3x 1.7x 1.5x 27.1x 14.5x 10.4x 36.2x 20.6x 16.7x China Social Entertainment Platforms
TME 14.52 24.5 21.2 4.9x 3.9x 3.3x 29.7x 21.5x 16.7x 34.5x 26.7x 21.1x Bilibili 48.42 17.4 16.6 9.8x 6.8x 5.1x n.m. n.m. 86.2x n.m. n.m. n.m. YY 82.67 7.0 5.1 1.4x 1.2x 1.1x 20.7x 13.0x 10.0x 23.0x 14.9x 11.9x
Momo 14.98 3.3 1.8 0.8x 0.7x 0.6x 4.6x 3.7x 2.8x 8.7x 6.3x 5.0x
Source: Capital IQ, Company Filing
Notes:
1. Calendarized to year end of December 31
2. n.m. multiples are defined as either negative multiples or over 100x
3. Huya and DouYu’s forecast based on management projections; Comparable peers’ forecast based on broker consensus sourced from Capital IQ, adjusted for share-based compensation
4. Market capitalization includes all options outstanding using treasury method and restricted stock units
5. Aggregate value defined as market value plus total debt less cash and short term investments, adjusted for minority interests
PROJECT BETTA CONFIDENTIAL VALUATION SUMMARY 19
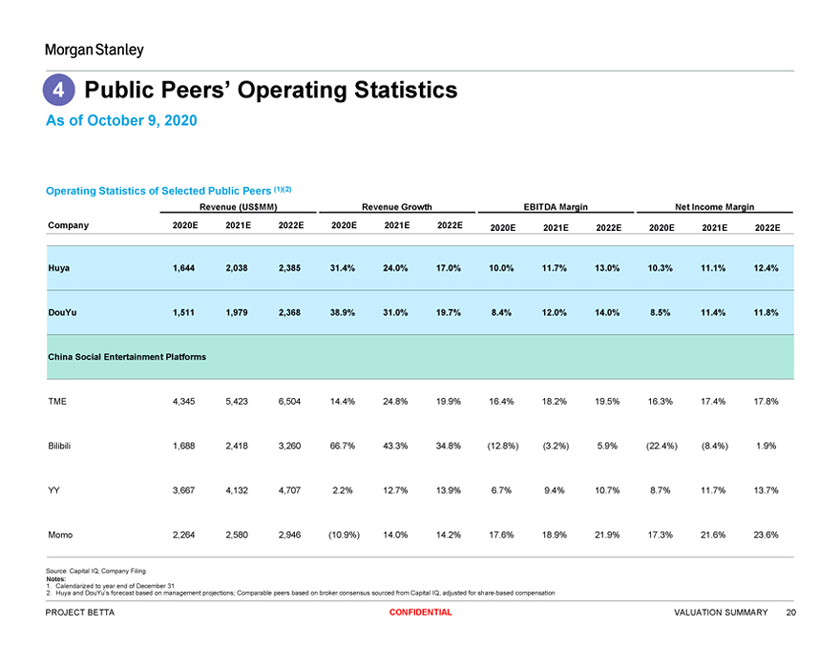
Morgan Stanley 4 Public Peers’ Operating Statistics As of October 9, 2020
Operating Statistics of Selected Public Peers (1)(2)
Revenue (US$MM) Revenue Growth EBITDA Margin Net Income Margin
Company 2020E 2021E 2022E 2020E 2021E 2022E 2020E 2021E 2022E 2020E 2021E 2022E
Huya 1,644 2,038 2,385 31.4% 24.0% 17.0% 10.0% 11.7% 13.0% 10.3% 11.1% 12.4% DouYu 1,511 1,979 2,368 38.9% 31.0% 19.7% 8.4% 12.0% 14.0% 8.5% 11.4% 11.8% China Social Entertainment Platforms
TME 4,345 5,423 6,504 14.4% 24.8% 19.9% 16.4% 18.2% 19.5% 16.3% 17.4% 17.8% Bilibili 1,688 2,418 3,260 66.7% 43.3% 34.8% (12.8%) (3.2%) 5.9% (22.4%) (8.4%) 1.9% YY 3,667 4,132 4,707 2.2% 12.7% 13.9% 6.7% 9.4% 10.7% 8.7% 11.7% 13.7% Momo 2,264 2,580 2,946 (10.9%) 14.0% 14.2% 17.6% 18.9% 21.9% 17.3% 21.6% 23.6%
Source: Capital IQ, Company Filing Notes: 1. Calendarized to year end of December 31 2. Huya and DouYu’s forecast based on management projections; Comparable peers based on broker consensus sourced from Capital IQ, adjusted for share-based compensation
PROJECT BETTA CONFIDENTIAL VALUATION SUMMARY
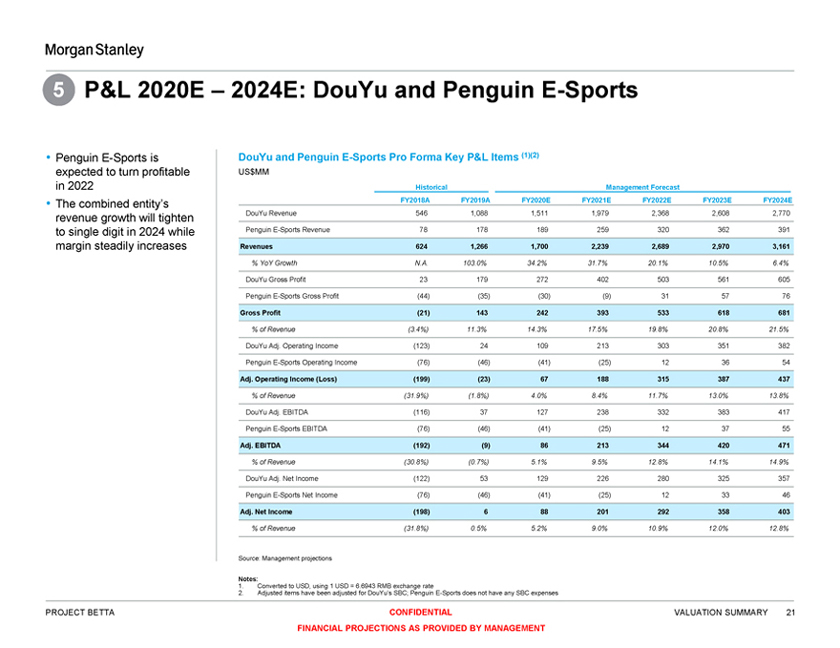
Morgan Stanley 5 P&L 2020E – 2024E: DouYu and Penguin E-Sports • Penguin E-Sports is expected to turn profitable in 2022
• The combined entity’s revenue growth will tighten to single digit in 2024 while margin steadily increases
DouYu and Penguin E-Sports Pro Forma Key P&L Items (1)(2) US$MM Historical Management Forecast FY2018A FY2019A FY2020E FY2021E FY2022E FY2023E FY2024E DouYu Revenue 546 1,088 1,511 1,979 2,368 2,608 2,770 Penguin E-SportsRevenue 78 178 189 259 320 362 391 Revenues 624 1,266 1,700 2,239 2,689 2,970 3,161
% YoY Growth N.A. 103.0% 34.2% 31.7% 20.1% 10.5% 6.4% DouYu Gross Profit 23 179 272 402 503 561 605
Penguin E-Sports Gross Profit (44) (35) (30) (9) 31 57 76 Gross Profit (21) 143 242 393 533 618 681
% of Revenue (3.4%) 11.3% 14.3% 17.5% 19.8% 20.8% 21.5% DouYu Adj. Operating Income (123) 24 109 213 303 351 382
Penguin E-Sports Operating Income (76) (46) (41) (25) 12 36 54 Adj. Operating Income (Loss) (199) (23) 67 188 315 387 437
% of Revenue (31.9%) (1.8%) 4.0% 8.4% 11.7% 13.0% 13.8% DouYu Adj. EBITDA (16) 37 127 238 332 383 417
Penguin E-Sports EBITDA (76) (46) (41) (25) 12 37 55 Adj. EBITDA (192) (9) 86 213 344 420 471
% of Revenue (30.8%) (0.7%) 5.1% 9.5% 12.8% 14.1% 14.9% DouYu Adj. Net Income (122) 53 129 226 280 325 357
Penguin E-Sports Net Income (76) (46) (41) (25) 12 33 46 Adj. Net Income (198) 6 88 201 292 358 403
% of Revenue (31.8%) 0.5% 5.2% 9.0% 10.9% 12.0% 12.8% Source: Management projections
Notes: 1. Converted to USD, using 1 USD = 6.6943 RMB exchange rate
2. Adjusted items have been adjusted for DouYu’s SBC; Penguin E-Sports does not have any SBC expenses
PROJECT BETTA CONFIDENTIAL FINANCIAL PROJECTIONS AS PROVIDED BY MANAGEMENT VALUATION SUMMARY
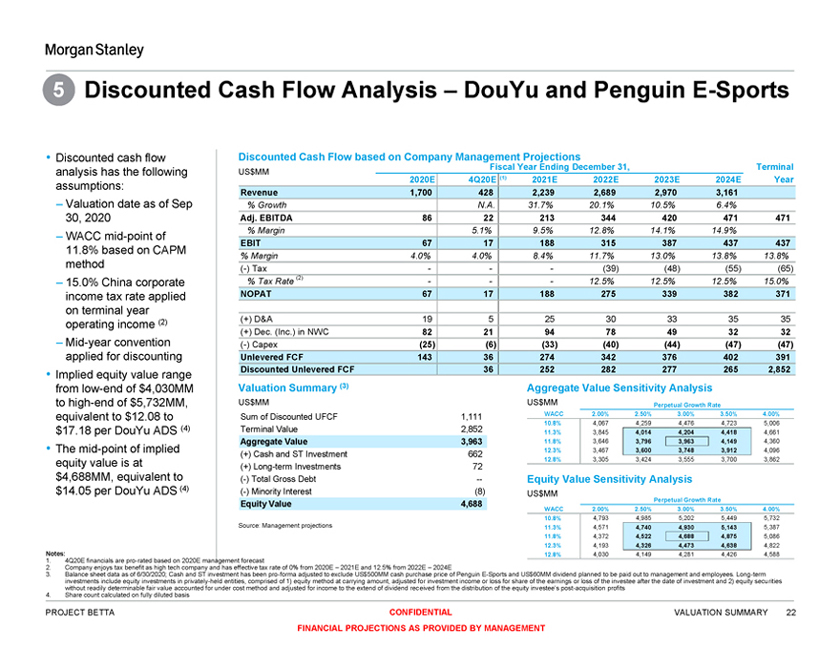
Morgan Stanley 5 Discounted Cash Flow Analysis – DouYu and Penguin E-Sports
• Discounted cash flow analysis has the following assumptions: – Valuation date as of Sep 30, 2020
– WACC mid-point of 11.8% based on CAPM method – 15.0% China corporate income tax rate applied on terminal year operating income (2) – Mid-year convention applied for discounting • Implied equity value range from low-end of $4,030MM to high-end of $5,732MM, equivalent to $12.08 to $17.18 per DouYu ADS (4) The mid-point of implied equity value is at $4,688MM, equivalent to $14.05 per DouYu ADS (4) Discounted Cash Flow based on Company Management Projections Fiscal Year Ending December 31, Terminal US$MM 2020E 4Q20E (1) 2021E 2022E 2023E 2024E Year Revenue 1,700 428 2,239 2,689 2,970 3,161 % Growth N.A. 31.7% 20.1% 10.5% 6.4% Adj. EBITDA 86 22 213 344 420 471471 % Margin 5.1% 9.5% 12.8% 14.1% 14.9% EBIT 67 17 188 315 387 437 437 % Margin 4.0% 4.0% 8.4% 11.7% 13.0% 13.8% 13.8% (-) Tax — - (39) (48) (55) (65) % Tax Rate (2) ——12.5% 12.5% 12.5% 15.0% NOPAT 67 17 188 275 339 382 371 (+) D&A 19 5 25 30 33 35 35 (+) Dec. (Inc.) in NWC 82 21 94 78 49 32 32
(-) Capex (25) (6) (33) (40) (44) (47) (47) Unlevered FCF 143 36 274 342 376 402 391 Discounted Unlevered FCF 36 252 282 277 265 2,852 Valuation Summary (3) US$MM Sum of Discounted UFCF 1,111 Terminal Value 2,852 Aggregate Value 3,963
(+) Cash and ST Investment 662 (+) Long-term Investments 72 (-) Total Gross Debt —(-) Minority Interest (8) Equity Value 4,688
Source: Management projections Aggregate Value Sensitivity Analysis US$MM Perpetual Growth Rate WACC 2.00% 2.50% 3.00% 3.50% 4.00% 10.8% 4,067 4,259 4,476 4,723 5,006 11.3% 3,845 4,014 4,204 4,418 4,661 11.8% 3,646 3,796 3,963 4,149 4,360
12.3% 3,467 3,600 3,748 3,912 4,096 12.8% 3,305 3,424 3,555 3,700 3,862 Equity Value Sensitivity Analysis US$MM Perpetual Growth Rate WACC 2.00% 2.50% 3.00% 3.50% 4.00% 10.8% 4,793 4,985 5,202 5,449 5,732 11.3% 4,571 4,740 4,930 5,143 5,387
11.8% 4,372 4,522 4,688 4,875 5,086 12.3% 4,193 4,326 4,473 4,638 4,822 12.8% 4,030 4,149 4,281 4,426 4,588 Notes: 1. 4Q20E financials are pro-rated based on 2020E management forecast 2. Company enjoys tax benefit as high tech company and has effective tax rate of 0% from 2020E – 2021E and 12.5% from 2022E – 2024E 3. Balance sheet data as of 6/30/2020; Cash and ST investment has been pro-forma adjusted to exclude US$500MM cash purchase price of Penguin E-Sports and US$60MM dividend planned to be paid out to management and employees. Long-term investments include equity investments in privately-held entities, comprised of 1) equity method at carrying amount, adjusted for investment income or loss for share of the earnings or loss of the investee after the date of investment and 2) equity securities without readily determinable fair value accounted for under cost method and adjusted for income to the extend of dividend received from the distribution of the equity investee’s post-acquisition profits 4. Share count calculated on fully diluted basis PROJECT BETTA CONFIDENTIAL FINANCIAL PROJECTIONS AS PROVIDED BY MANAGEMENT VALUATION SUMMARY
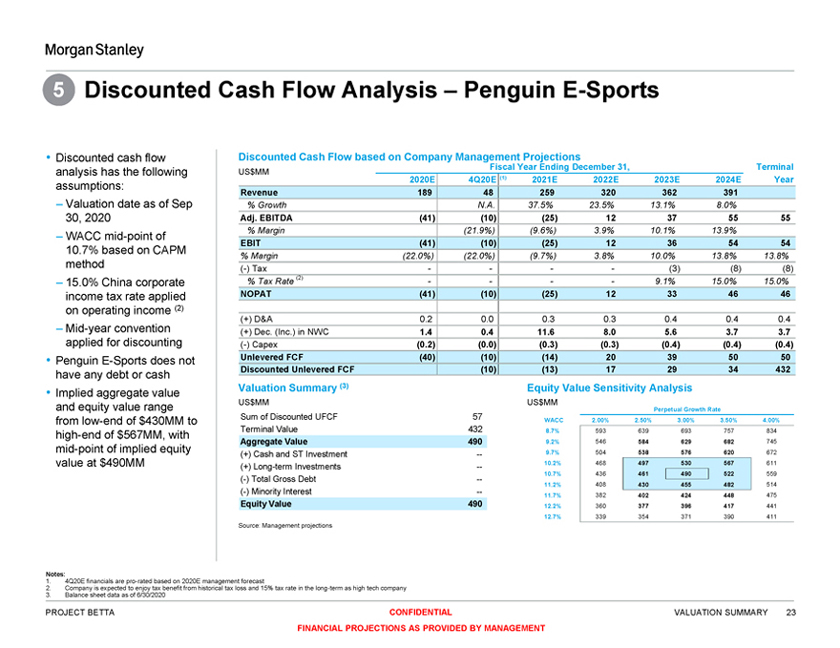
Morgan Stanley 5 Discounted Cash Flow Analysis – Penguin E-Sports
• Discounted cash flow analysis has the following assumptions: – Valuation date as of Sep 30, 2020
– WACC mid-point of 10.7% based on CAPM method – 15.0% China corporate income tax rate applied on operating income (2)
– Mid-year convention applied for discounting • Penguin E-Sports does not have any debt or cash
• Implied aggregate value and equity value range from low-end of $430MM to high-end of $567MM, with mid-point of implied equity value at $490MM Discounted Cash Flow based on Company Management Projections
Fiscal Year Ending December 31, Terminal US$MM 2020E 4Q20E (1) 2021E 2022E 2023E 2024E Year Revenue 189 48 259 320 362 391 % Growth N.A. 37.5% 23.5% 13.1% 8.0% Adj. EBITDA (41) (10) (25) 12 37 55 55 % Margin (21.9%) (9.6%) 3.9% 10.1% 13.9% EBIT (41) (10) (25) 12 36 54 54 % Margin (22.0%) (22.0%) (9.7%) 3.8% 10.0% 13.8% 13.8% (-) Tax - - - - (3) (8) (8)
% Tax Rate (2) - - - - 9.1% 15.0% 15.0% NOPAT (41) (10) (25) 12 33 46 46
(+) D&A 0.2 0.0 0.3 0.3 0.4 0.4 0.4 (+) Dec. (Inc.) in NWC 1.4 0.4 11.6 8.0 5.6 3.7 3.7 (-) Capex (0.2) (0.0) (0.3) (0.3) (0.4) (0.4) (0.4) Unlevered FCF (40) (10) (14) 20 39 50 50 Discounted Unlevered FCF (10) (13) 17 29 34 432
Valuation Summary (3) US$MM Sum of Discounted UFCF 57 Terminal Value 432 Aggregate Value 490
(+) Cash and ST Investment --(+) Long-term Investments --(-) Total Gross Debt --(-) Minority Interest --
Equity Value 490 Source: Management projections Equity Value Sensitivity Analysis US$MM Perpetual Growth Rate
WACC 2.00% 2.50% 3.00% 3.50% 4.00% 8.7% 593 639 693 757 834 9.2% 546 584 629 682 745 9.7% 504 538 576 620 672 10.2% 468 497 530 567 611 10.7% 436 461 490 522 559 11.2% 408 430 455 482 514 11.7% 382 402 424 448 475 12.2% 360 377 396 417 441 12.7% 339 354 371 390 411 Notes: 1. 4Q20E financials are pro-rated based on 2020E management forecast
2. Company is expected to enjoy tax benefit from historical tax loss and 15% tax rate in the long-term as high tech company
3. Balance sheet data as of 6/30/2020 PROJECT BETTA CONFIDENTIAL FINANCIAL PROJECTIONS AS PROVIDED BY MANAGEMENT VALUATION SUMMARY
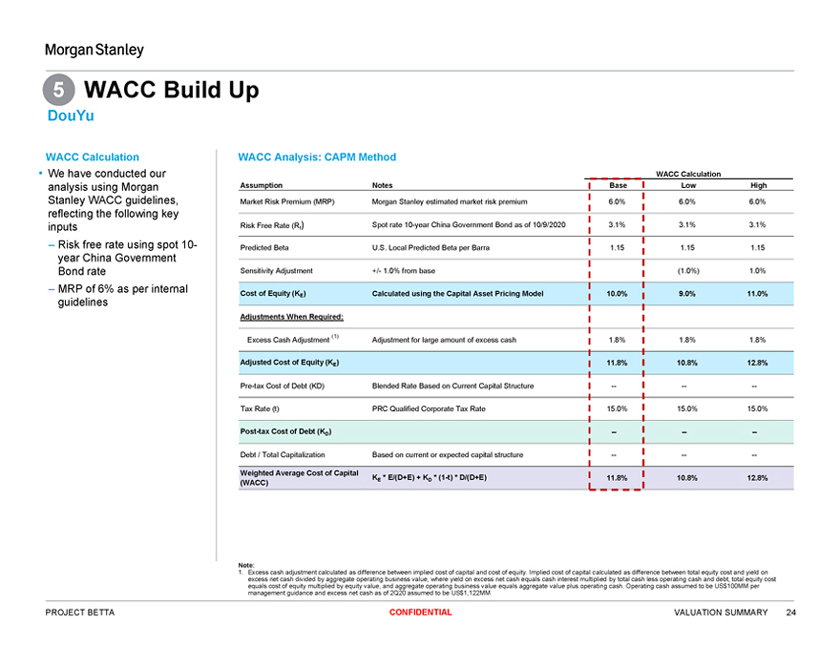
Morgan Stanley 5 WACC Build Up DouYu WACC Calculation • We have conducted our analysis using Morgan Stanley WACC guidelines, reflecting the following key inputs – Risk free rate using spot 10-year China Government Bond rate – MRP of 6% as per internal guidelines WACC Analysis: CAPM Method WACC Calculation Assumption Notes Base Low High Market Risk Premium (MRP) Morgan Stanley estimated market risk premium 6.0% 6.0% 6.0% Risk Free Rate (R ) Spot rate 10-year China Government Bond as of 10/9/2020 3.1% 3.1% 3.1% f Predicted Beta U.S. Local Predicted Beta per Barra 1.15 1.15 1.15 Sensitivity Adjustment +/- 1.0% from base (1.0%) 1.0% Cost of Equity (KE) Calculated using the Capital Asset Pricing Model 10.0% 9.0% 11.0% Adjustments When Required: (1) Excess Cash Adjustment Adjustment for large amount of excess cash 1.8% 1.8% 1.8% Adjusted Cost of Equity (KE) 11.8% 10.8% 12.8% Pre-tax Cost of Debt (KD) Blended Rate Based on Current Capital Structure Tax Rate (t) PRC Qualified Corporate Tax Rate 15.0% 15.0% 15.0% Post-tax Cost of Debt (KD) Debt / Total Capitalization Based on current or expected capital structure Weighted Average Cost of Capital KE * E/(D+E) + KD * (1-t) * D/(D+E) 11.8% 10.8% 12.8% (WACC) Note:
1. Excess cash adjustment calculated as difference between implied cost of capital and cost of equity. Implied cost of capital calculated as difference between total equity cost and yield on excess net cash divided by aggregate operating business value, where yield on excess net cash equals cash interest multiplied by total cash less operating cash and debt, total equity cost equals cost of equity multiplied by equity value, and aggregate operating business value equals aggregate value plus operating cash. Operating cash assumed to be US$100MM per management guidance and excess net cash as of 2Q20 assumed to be US$1,122MM
PROJECT BETTA CONFIDENTIAL VALUATION SUMMARY
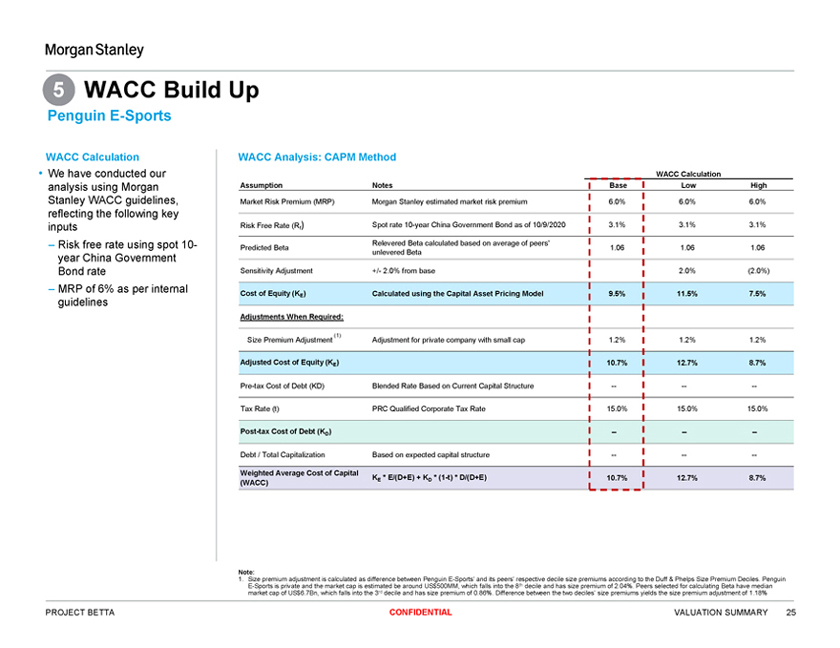
Morgan Stanley 5 WACC Build Up Penguin E-Sports WACC Calculation • We have conducted our analysis using Morgan Stanley WACC guidelines, reflecting the following key inputs – Risk free rate using spot 10-year China Government Bond rate – MRP of 6% as per internal guidelines WACC Analysis: CAPM Method WACC Calculation Assumption Notes Base Low High Market Risk Premium (MRP) Morgan Stanley estimated market risk premium 6.0% 6.0% 6.0% Risk Free Rate (R ) Spot rate 10-year China Government Bond as of 10/9/2020 3.1% 3.1% 3.1% f Relevered Beta calculated based on average of peers’ Predicted Beta 1.06 1.06 1.06 unlevered Beta Sensitivity Adjustment +/- 2.0% from base 2.0% (2.0%) Cost of Equity (KE) Calculated using the Capital Asset Pricing Model 9.5% 11.5% 7.5% Adjustments When Required: (1) Size Premium Adjustment Adjustment for private company with small cap 1.2% 1.2% 1.2% Adjusted Cost of Equity (KE) 10.7% 12.7% 8.7% Pre-tax Cost of Debt (KD) Blended Rate Based on Current Capital Structure Tax Rate (t) PRC Qualified Corporate Tax Rate 15.0% 15.0% 15.0% Post-tax Cost of Debt (KD)
Debt / Total Capitalization Based on expected capital structure Weighted Average Cost of Capital KE * E/(D+E) + KD * (1-t) * D/(D+E) 10.7% 12.7% 8.7% (WACC) Note: 1. Size premium adjustment is calculated as difference between Penguin E-Sports’ and its peers’ respective decile size premiums according to the Duff & Phelps Size Premium Deciles. Penguin E-Sports is private and the market cap is estimated be around US$500MM, which falls into the 8th decile and has size premium of 2.04%. Peers selected for calculating Beta have median market cap of US$6.7Bn, which falls into the 3rd decile and has size premium of 0.86%. Difference between the two deciles’ size premiums yields the size premium adjustment of 1.18% PROJECT BETTA CONFIDENTIAL
VALUATION SUMMARY
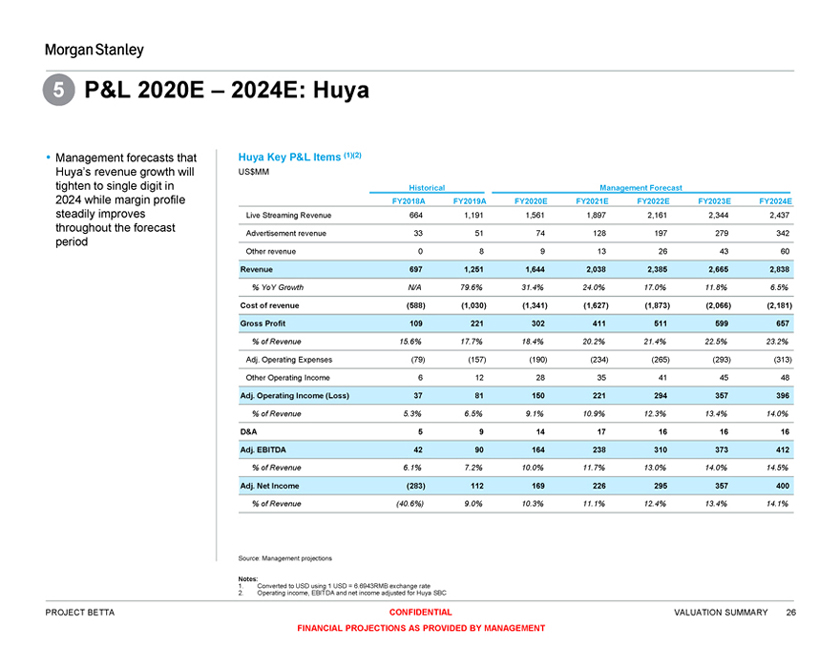
Morgan Stanley 5 P&L 2020E – 2024E: Huya • Management forecasts that Huya’s revenue growth will tighten to single digit in 2024 while margin profile steadily improves throughout the forecast period Huya Key P&L Items (1)(2) US$MM Historical Management Forecast FY2018A FY2019A FY2020E FY2021E FY2022E FY2023E FY2024E Live Streaming Revenue 664 1,191 1,561 1,897 2,161 2,344 2,437 Advertisement revenue 33 51 74 128 197 279 342 Other revenue 0 8 9 13 26 43 60 Revenue 697 1,251 1,644 2,038 2,385 2,665 2,838 % YoY Growth N/A 79.6% 31.4% 24.0% 17.0% 11.8% 6.5% Cost of revenue (588) (1,030) (1,341) (1,627) (1,873) (2,066) (2,181) Gross Profit 109 221 302 411 511 599 657 % of Revenue 15.6% 17.7% 18.4% 20.2% 21.4% 22.5% 23.2% Adj. Operating Expenses (79) (157) (190) (234) (265) (293) (313) Other Operating Income 6 12 28 35 41 45 48 Adj. Operating Income (Loss) 37 81 150 221 294 357 396 % of Revenue 5.3% 6.5% 9.1% 10.9% 12.3% 13.4% 14.0% D&A 5 9 14 17 16 16 16 Adj. EBITDA 42 90 164 238 310 373 412 % of Revenue 6.1% 7.2% 10.0% 11.7% 13.0% 14.0% 14.5% Adj. Net Income (283) 112 169 226 295 357 400 % of Revenue (40.6%) 9.0% 10.3% 11.1% 12.4% 13.4% 14.1% Source: Management projections Notes: 1. Converted to USD using 1 USD = 6.6943RMB exchange rate 2. Operating income, EBITDA and net income adjusted for Huya SBC
PROJECT BETTA CONFIDENTIAL FINANCIAL PROJECTIONS AS PROVIDED BY MANAGEMENT VALUATION SUMMARY
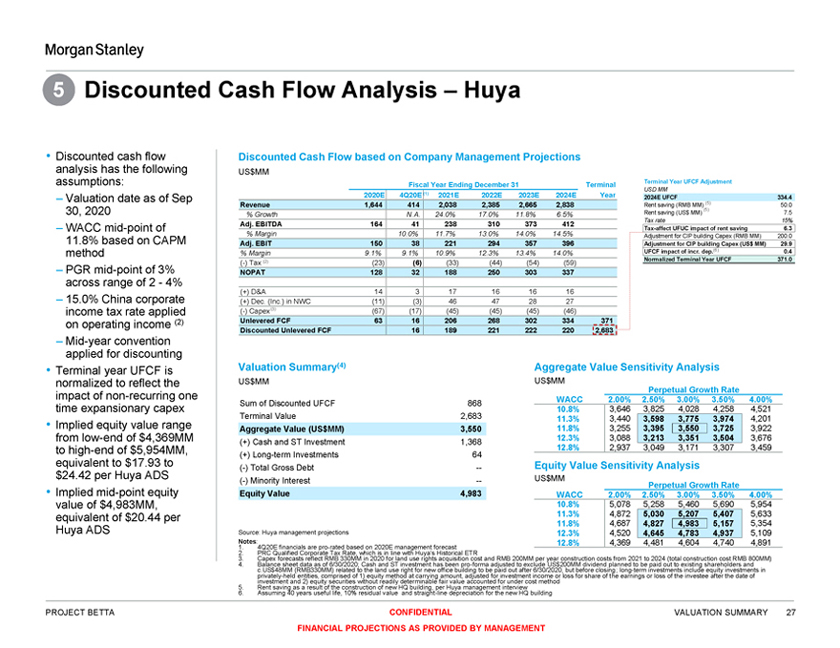
Morgan Stanley 5 Discounted Cash Flow Analysis – Huya • Discounted cash flow analysis has the following assumptions: – Valuation date as of Sep 30, 2020 – WACC mid-point of 11.8% based on CAPM method – PGR mid-point of 3% across range of 2—4% – 15.0% China corporate income tax rate applied on operating income (2) – Mid-year convention applied for discounting
• Terminal year UFCF is normalized to reflect the impact of non-recurring one time expansionary capex • Implied equity value range from low-end of $4,369MM to high-end of $5,954MM, equivalent to $17.93 to $24.42 per Huya ADS • Implied mid-point equity value of $4,983MM, equivalent of $20.44 per Huya ADS Discounted Cash Flow based on Company Management Projections
US$MM Fiscal Year Ending December 31 Terminal 2020E 4Q20E (1) 2021E 2022E 2023E 2024E Year Revenue 1,644 414 2,038 2,385 2,665 2,838 % Growth N.A. 24.0% 17.0% 11.8% 6.5% Adj. EBITDA 164 41 238 310 373 412 412 % Margin 10.0% 11.7% 13.0% 14.0% 14.5% Adj. EBIT 150 38 221 294 357 396 % Margin 9.1% 9.1% 10.9% 12.3% 13.4% 14.0% (-) Tax (2) (23) (6) (33) (44) (54) (59) NOPAT 128 32 188 250 303 337 (+) D&A 14 3 17 16 16 16 (+) Dec. (Inc.) in NWC (11) (3) 46 47 28 27 (-) Capex(3) (67) (17) (45) (45) (45) (46) Unlevered FCF 63 16 206 268 302 334 371 Discounted Unlevered FCF 16 189 221 222 220 2,683 Terminal Year UFCF Adjustment USD MM 2024E UFCF 334.4 Rent saving (RMB MM) (5) 50.0 (5) Rent saving (US$ MM) 7.5
Tax rate 15% Tax-affect UFUC impact of rent saving 6.3 Adjustment for CIP building Capex (RMB MM) 200.0
Adjustment for CIP building Capex (US$ MM) 29.9 UFCF impact of incr. dep.(6) 0.4 Normalized Terminal Year UFCF 371.0
Valuation Summary(4) US$MM Sum of Discounted UFCF 868 Terminal Value 2,683 Aggregate Value (US$MM) 3,550
(+) Cash and ST Investment 1,368 (+) Long-term Investments 64 (-) Total Gross Debt —(-) Minority Interest — Equity Value 4,983
Aggregate Value Sensitivity Analysis US$MM Perpetual Growth Rate WACC 2.00% 2.50% 3.00% 3.50% 4.00% 10.8% 3,646 3,825 4,028 4,258 4,521 11.3% 3,440 3,598 3,775 3,974 4,201 11.8% 3,255 3,395 3,550 3,725 3,922 12.3% 3,088 3,213 3,351 3,504 3,676
12.8% 2,937 3,049 3,171 3,307 3,459 Equity Value Sensitivity Analysis US$MM Perpetual Growth Rate WACC 2.00% 2.50% 3.00% 3.50% 4.00% 10.8% 5,078 5,258 5,460 5,690 5,954 11.3% 4,872 5,030 5,207 5,407 5,633 11.8% 4,687 4,827 4,983 5,157 5,354 12.3% 4,520 4,645 4,783 4,937 5,109 12.8% 4,369 4,481 4,604 4,740 4,891 Source: Huya management projections
1. Notes:4Q20E financials are pro-rated based on 2020E management forecast 2. PRC Qualified Corporate Tax Rate, which is in line with Huya’s Historical ETR 3. 4. Balance Capex forecasts sheet data reflect as of RMB 6/30/2020; 330MM Cash in 2020 and for ST land investment use rights has acquisition been pro-forma cost and adjusted RMB 200MM to exclude per year US$ 200MM construction dividend costs planned from 2021 to be to paid 2024 out (total to existing construction shareholders cost RMB and 800MM) privately-held c.US$48MM (RMB330MM) entities, comprised related of to 1) the equity land method use right at for carrying new office amount, building adjusted to be for paid investment out after income 6/30/2020, or loss but for before share closing; of the long-term earnings or investments loss of the include investee equity after the investments date of in
5. Rent investment saving and as a 2) result equity of securities the construction without of readily new HQ determinable building, per fair Huya value management accounted for interview under cost method 6. Assuming 40 years useful life, 10% residual value and straight-line depreciation for the new HQ building PROJECT BETTA CONFIDENTIAL FINANCIAL PROJECTIONS AS PROVIDED BY MANAGEMENT VALUATION SUMMARY
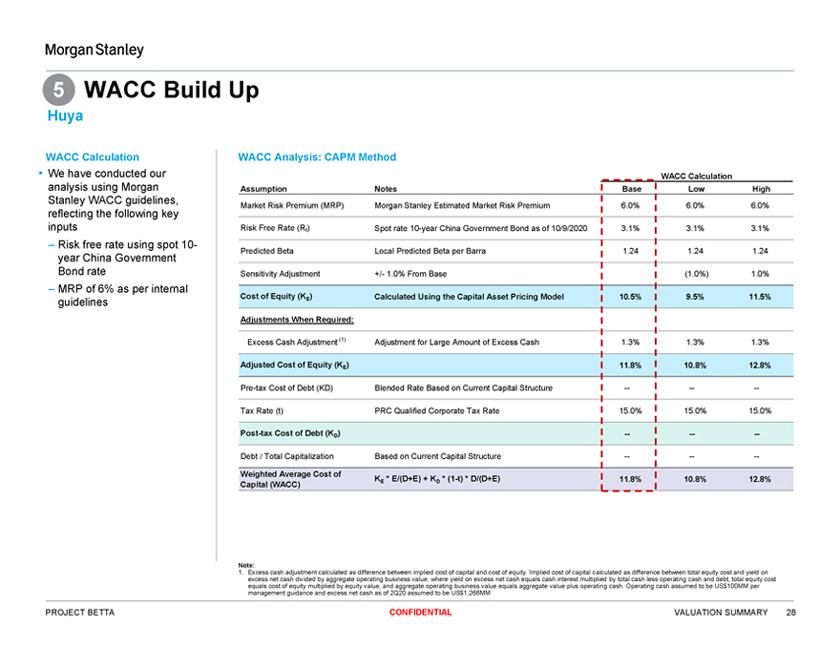
Morgan Stanley 5 WACC Build Up Huya WACC Calculation • We have conducted our analysis using Morgan Stanley WACC guidelines, reflecting the following key inputs – Risk free rate using spot 10-year China Government Bond rate – MRP of 6% as per internal guidelines WACC Analysis: CAPM Method WACC Calculation Assumption Notes Base Low High Market Risk Premium (MRP) Morgan Stanley Estimated Market Risk Premium 6.0% 6.0% 6.0% Risk Free Rate (Rf) Spot rate 10-year China Government Bond as of 10/9/2020 3.1% 3.1% 3.1% Predicted Beta Local Predicted Beta per Barra 1.24 1.24 1.24 Sensitivity Adjustment +/- 1.0% From Base (1.0%) 1.0% Cost of Equity (KE) Calculated Using the Capital Asset Pricing Model 10.5% 9.5% 11.5% Adjustments When Required: Excess Cash Adjustment (1) Adjustment for Large Amount of Excess Cash 1.3% 1.3% 1.3% Adjusted Cost of Equity (KE) 11.8% 10.8% 12.8% Pre-tax Cost of Debt (KD) Blended Rate Based on Current Capital Structure Tax Rate (t) PRC Qualified Corporate Tax Rate 15.0% 15.0% 15.0% Post-tax Cost of Debt (KD) Debt / Total Capitalization Based on Current Capital Structure
Weighted Average Cost of KE * E/(D+E) + KD * (1-t) * D/(D+E) 11.8% 10.8% 12.8% Capital (WACC) Note: 1. Excess cash adjustment calculated as difference between implied cost of capital and cost of equity. Implied cost of capital calculated as difference between total equity cost and yield on excess net cash divided by aggregate operating business value, where yield on excess net cash equals cash interest multiplied by total cash less operating cash and debt, total equity cost equals cost of equity multiplied by equity value, and aggregate operating business value equals aggregate value plus operating cash. Operating cash assumed to be US$100MM per management guidance and excess net cash as of 2Q20 assumed to be US$1,268MM PROJECT BETTA CONFIDENTIAL VALUATION SUMMARY
Morgan Stanley APPENDIX Supplementary Information CONFIDENTIAL
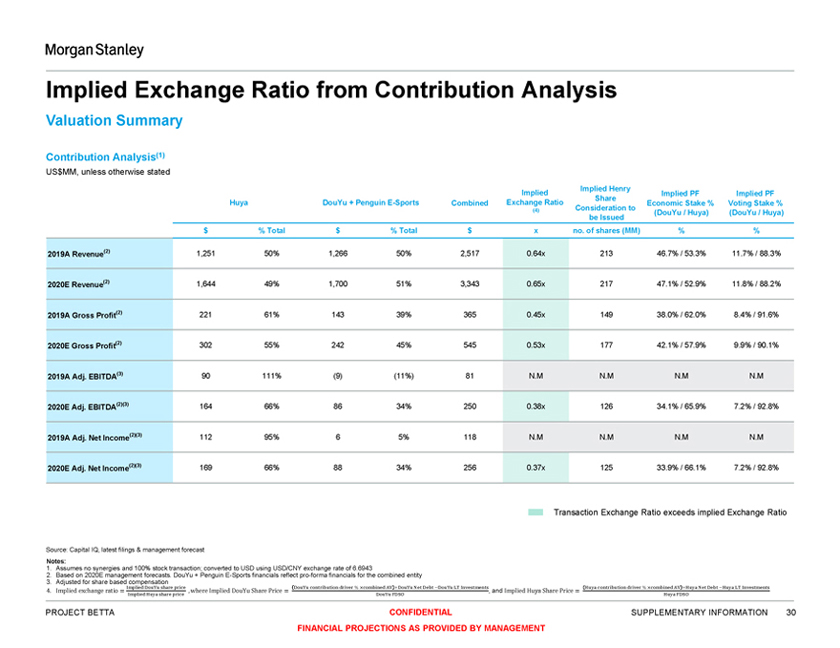
Morgan Stanley Implied Exchange Ratio from Contribution Analysis Valuation Summary Contribution Analysis(1) US$MM, unless otherwise stated Implied Henry Implied Implied PF Implied PF Share Huya DouYu + Penguin E-Sports Combi ned Exchange Ratio Economic Stake % Voting Stake % (4) Consideration to (DouYu / Huya) (DouYu / Huya) be Issued $ % Total $ % Total $ x no. of shares (MM) % % 2019A Revenue(2) 1,251 50% 1,266 50% 2,517 0.64x 213 46.7% / 53.3% 11.7% / 88.3% 2020E Revenue(2) 1,644 49% 1,700 51% 3,343 0.65x 217 47.1% / 52.9% 11.8% / 88.2% 2019A Gross Profit(2) 221 61% 143 39% 365 0.45x 149 38.0% / 62.0% 8.4% / 91.6% 2020E Gross Profit(2) 302 55% 242 45% 545 0.53x 177 42.1% / 57.9% 9.9% / 90.1% 2019A Adj. EBITDA(3) 90 111% (9) (11%) 81 N.M N.M N.M N.M 2020E Adj. EBITDA(2)(3) 164 66% 86 34% 250 0.38x 126 34.1% / 65.9% 7.2% / 92.8% 2019A Adj. Net Income(2)(3) 112 95% 6 5% 118 N.M N.M N.M N.M 2020E Adj. Net Income(2)(3) 169 66% 88 34% 256 0.37x 125 33.9% / 66.1% 7.2% / 92.8% Transaction Exchange Ratio exceeds implied Exchang e Ratio Source: Capital IQ, latest filings & management forecast Notes: 1. Assumes no synergies and 100% stock transaction; converted to USD using USD/CNY exchange rate of 6.6943 2. Based on 2020E management forecasts. DouYu + Penguin E-Sports financials reflect pro-forma financials for the combined entity 3. Adjusted for share based compensation Implied DouYu share price DouYu contribution driver % ×combined AV +DouYu Net Debt -DouYu LT Investments Huya contribution driver % ×combined AV +Huya Net Debt -Huya LT Investments
4. Implied exchange ratio = Implied Huya share price , where Implied DouYu Share Price = DouYu FDSO , and Implied Huya SharePrice = Huya FDSO PROJECT BETTA CONFIDENTIAL SUPPLEMENTARY INFORMATION
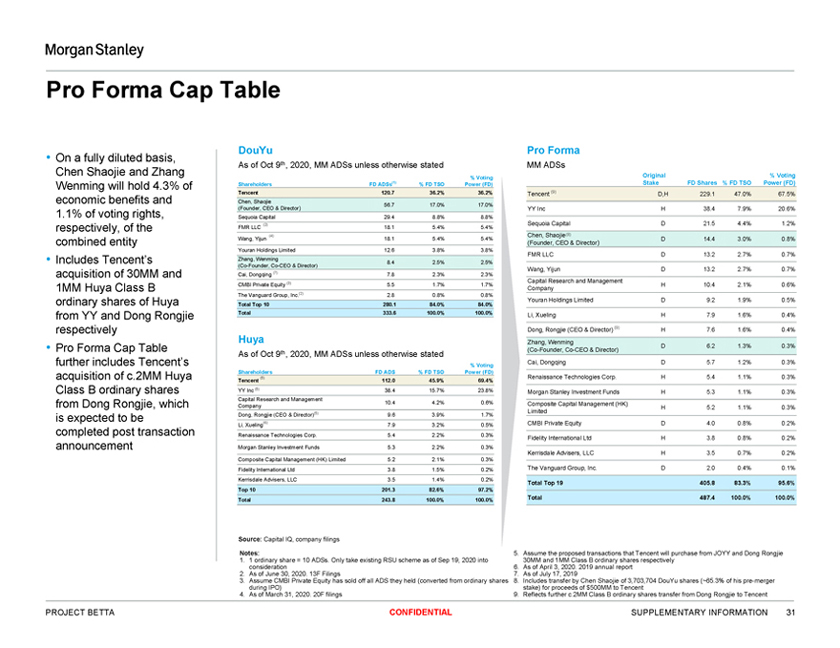
FINANCIAL PROJECTIONS AS PROVIDED BY MANAGEMENT Morgan Stanley Pro Forma Cap Table • On a fully diluted basis, Chen Shaojie and Zhang Wenming will hold 4.3% of economic benefits and 1.1% of voting rights, respectively, of the combined entity • Includes Tencent’s acquisition of 30MM and 1MM Huya Class B ordinary shares of Huya from YY and Dong Rongjie respectively • Pro Forma Cap Table further includes Tencent’s acquisition of c.2MM Huya Class B ordinary shares from Dong Rongjie, which is expected to be completed post transaction announcement DouYu As of Oct 9th, 2020, MM ADSs unless otherwise stated % Voting Shareholders FD ADSs(1) % FD TSO Power (FD) Tencent 120.7 36.2% 36.2%
Chen, Shaojie 56.7 17.0% 17.0% (Founder, CEO & Director) Sequoia Capital 29.4 8.8% 8.8% (2) FMR LLC 18.1 5.4% 5.4% (4)
Wang, Yijun 18.1 5.4% 5.4% Youran Holdings Limited 12.6 3.8% 3.8% Zhang, Wenming 8.4 2.5% 2.5% (Co-Founder, Co-CEO & Director) Cai, Dongqing (7) 7.8 2.3% 2.3% CMBI Private Equity (3) 5.5 1.7% 1.7% The Vanguard Group, Inc.(2) 2.8 0.8% 0.8%
Total Top 10 280.1 84.0% 84.0% Total 333.6 100.0% 100.0% Huya As of Oct 9th, 2020, MM ADSs unless otherwise stated % Voting Shareholders FD ADS % FD TSO Power (FD) (5) Tencent 112.0 45.9% 69.4% YY Inc (5) 38.4 15.7% 23.8% Capital Research and Management 10.4 4.2% 0.6% Company Dong, Rongjie (CEO & Director)(5) 9.6 3.9% 1.7% Li, Xueling(6) 7.9 3.2% 0.5% Renaissance Technologies Corp. 5.4 2.2% 0.3% Morgan Stanley Investment Funds 5.3 2.2% 0.3% Composite Capital Management (HK) Limited 5.2 2.1% 0.3% Fidelity International Ltd 3.8 1.5% 0.2% Kerrisdale Advisers, LLC 3.5 1.4% 0.2%
Top 10 201.3 82.6% 97.2% Total 243.8 100.0% 100.0% Pro Forma MM ADSs Original % Voting Stake FD Shares % FD TSO Power (FD) Tencent (9) D,H 229.1 47.0% 67.5% YY Inc H 38.4 7.9% 20.6% Sequoia Capital D 21.5 4.4% 1.2% Chen, Shaojie (8) D 14.4 3.0% 0.8% (Founder, CEO & Director) FMR LLC D 13.2 2.7% 0.7% Wang, Yijun D 13.2 2.7% 0.7% Capital Research and Management H 10.4 2.1% 0.6% Company Youran Holdings Limited D 9.2 1.9% 0.5% Li, Xueling H 7.9 1.6% 0.4% Dong, Rongjie (CEO & Director) (9) H 7.6 1.6% 0.4% Zhang, Wenming D 6.2 1.3% 0.3% (Co-Founder, Co-CEO & Director) Cai, Dongqing D 5.7 1.2% 0.3% Renaissance Technologies Corp. H 5.4 1.1% 0.3% Morgan Stanley Investment Funds H 5.3 1.1% 0.3% Composite Capital Management (HK) H 5.2 1.1% 0.3% Limited CMBI Private Equity D 4.0 0.8% 0.2% Fidelity International Ltd H 3.8 0.8% 0.2% Kerrisdale Advisers, LLC H 3.5 0.7% 0.2% The Vanguard Group, Inc. D 2.0 0.4% 0.1% Total Top 19 405.8 83.3% 95.6% Total 487.4 100.0% 100.0% Source: Capital IQ, company filings Notes: 1. 1 ordinary share = 10 ADSs. Only take existing RSU scheme as of Sep 19, 2020 into consideration 2. As of June 30, 2020. 13F Filings 3. Assume CMBI Private Equity has sold off all ADS they held (converted from ordinary shares during IPO) 4. As of March 31, 2020. 20F filings 5. Assume the proposed transactions that Tencent will purchase from JOYY and Dong Rongjie 30MM and 1MM Class B ordinary shares respectively 6. As of April 3, 2020. 2019 annual report 7. As of July 17, 2019 8. Includes transfer by Chen Shaojie of 3,703,704 DouYu shares (~65.3% of his pre-merger stake) for proceeds of $500MM to Tencent 9. Reflects further c.2MM Class B ordinary shares transfer from Dong Rongjie to Tencent
PROJECT BETTA CONFIDENTIAL SUPPLEMENTARY INFORMATION