Filed by: Sayona Mining Limited
Pursuant to Rule 425 under the Securities Act of 1933
and deemed filed pursuant to Rule 14d-2(b) and Rule 14a-12
under the Securities Exchange Act of 1934
Subject Company: Piedmont Lithium Inc.
Commission File Number: 001-38427
The following communication is being filed in connection with the proposed merger of Sayona Mining Limited and Piedmont Lithium Inc.
Additional Information and Where to Find It
In connection with the proposed transaction, Sayona intends to send its shareholders a notice of meeting and explanatory materials ahead of an extraordinary general meeting of Sayona shareholders and Sayona encourages its shareholders to review those materials in full. Sayona will also file with the SEC a registration statement on Form F-4 that also constitutes a prospectus of Sayona. Sayona also plans to file other relevant documents with the SEC regarding the proposed transaction. No offer of securities shall be made, except by means of a prospectus meeting the requirements of Section 10 of the Securities Act of 1933, as amended. INVESTORS AND SHAREHOLDERS ARE URGED TO READ THE REGISTRATION STATEMENT, PROSPECTUS AND OTHER DOCUMENTS THAT MAY BE FILED WITH THE SEC CAREFULLY AND IN THEIR ENTIRETY IF AND WHEN THEY BECOME AVAILABLE BECAUSE THEY WILL CONTAIN IMPORTANT INFORMATION ABOUT THE PROPOSED TRANSACTION. Investors and shareholders will be able to obtain free copies of these documents (if and when available), and other documents containing important information about Piedmont and Sayona, once such documents are filed with the SEC through the website maintained by the SEC at http://www.sec.gov. Copies of the documents filed with the SEC by Sayona will be available free of charge on Sayona’s website at sayonamining.com.au or by contacting Sayona’s Investor Relations Department by email at ir@sayonamining.com.au or by phone at +61 7 3369 7058. Copies of the documents filed with the SEC by Piedmont will be available free of charge on Piedmont’s website at http://www.piedmontlithium.com/ or by contacting Piedmont’s Investor Relations Department by email at info@piedmontlithium.com or by phone at +1 (704) 461-8000.
No Offer or Solicitation
This communication is not intended to and shall not constitute an offer to sell or the solicitation of an offer to buy any Sayona securities pursuant to the acquisition, nor shall there be any sale of Sayona securities pursuant to the acquisition in any jurisdiction in which such offer, solicitation or sale would be unlawful prior to registration or qualification under the securities laws of such jurisdiction. No offer of Sayona securities pursuant to the acquisition shall be made, except by means of a prospectus meeting the requirements of Section 10 of the Securities Act of 1933, as amended.
Participants in the Solicitation
This communication is not a solicitation of proxies in connection with the proposed transaction. However, under SEC rules, Sayona, Piedmont and certain of their respective directors, executive officers and other members of the management and employees may be deemed to be participants in the solicitation of proxies in connection with the proposed transaction. Information about Piedmont’s directors and executive officers may be found in its 2024 Annual Report on Form 10-K filed with the SEC on February 26, 2025, available at www.piedmontlithium.com/ir/ and www.sec.gov. Information about Sayona’s directors and executive officers may be found in its 2024 Annual Report to Shareholders available on its website at https://sayonamining.com.au/investors/financial-reports/ and filed with the ASX on August 29, 2024. The information included on, or accessible through, Sayona’s or Piedmont’s website is not incorporated by reference into this communication. These documents can be obtained free of charge from the sources indicated above. Additional information regarding the interests of such potential participants in the solicitation of proxies in connection with the proposed transaction will be included in the proxy statement/prospectus and other relevant materials to be filed with the SEC and applicable securities regulators in Australia when they become available.
FY25 Half Year Results 28 February 2025 ASX:SYA | OTCQB:SYAXF The following is a presentation released by Sayona Mining Limited on the Australian Securities Exchange on February 28, 2025.

FY25 Half Year Highlights Operational Performance Financial Performance Merger Update Lithium Market and Guidanc e Agenda 2

FY25 Half Year Highlights 1 North American Lithium achieves consistently strong production $122M REVENUE $110M CASH AT 31 DECEMBER 2024 Production Sales Financial Corporate 53,444 2 METRES DRILLING COMPLETED NAL 76,202 2 METRES DRILLING COMPLETED MOBLAN 90% MILL UTILISATION NAL 67% RECOVERY NAL Conditional A$69 million capital raise at merger completion with RCF Merger with Piedmont Lithium announced DRY METRIC TONNES DRY METRIC TONNES Successful A$38 million capital raise Nov. 2024 Notes 1. All figures are AUD (A$) unless otherwise noted. 2. Funded by Flow Through Share funding as allowed under the Income Tax Act (Canada). 103,063 UP 57% 115,027 UP 59% 3
Operational Performance 4

5 NAL Operational Performance • Continued increase in ore mined up 12% against PCP • Process plant utilisation consistently ~90% with improved plant stability • Consistent lithium recoveries of 67% which was 7% higher against PCP • Concentrate production of 103kt was a 57% increase on the prior year • Sales to customers hit a record 115kt with continuing efficiencies in logistics arrangements • Continued focus on safety improvement in FY25 3,510 29,610 31,486 34,237 40,439 49,660 52,141 50,922 1,231 1,397 1,536 1,506 1,335 1,280 0 200 400 600 800 1000 1200 1400 1600 0 10,000 20,000 30,000 40,000 50,000 60,000 70,000 80,000 Q3FY23 Q4FY23 Q1FY24 Q2FY24 Q3FY24 Q4FY24 Q1FY25 Q2FY25 Concentrate production (dmt) Unit Operating Costs (A$/dmt) 43% 57% 58% 62% 67% 68% 67% 68% 51% 71% 72% 75% 73% 83% 91% 90% 30% 40% 50% 60% 70% 80% 90% 100% Q3FY23 Q4FY23 Q1FY24 Q2FY24 Q3FY24 Q4FY24 Q1FY25 Q2FY25 Global recovery (%) Mill utilisation (%) NAL Global Recovery and Mill Utilisation NAL Concentrate Production and Unit Operating Costs Delivering Production in line with budget

6 North American Lithium Focused on resource extension and infill for potential JORC category increase Additional drilling of 53,444m completed in CY24 Supported by utilisation of Flow Through Share funding High - grade lithium mineralisation confirmed beyond existing estimates Supports potential brownfield expansion of NAL Enhances project value amid the Sayona - Piedmont merger New MRE to be completed during 2025
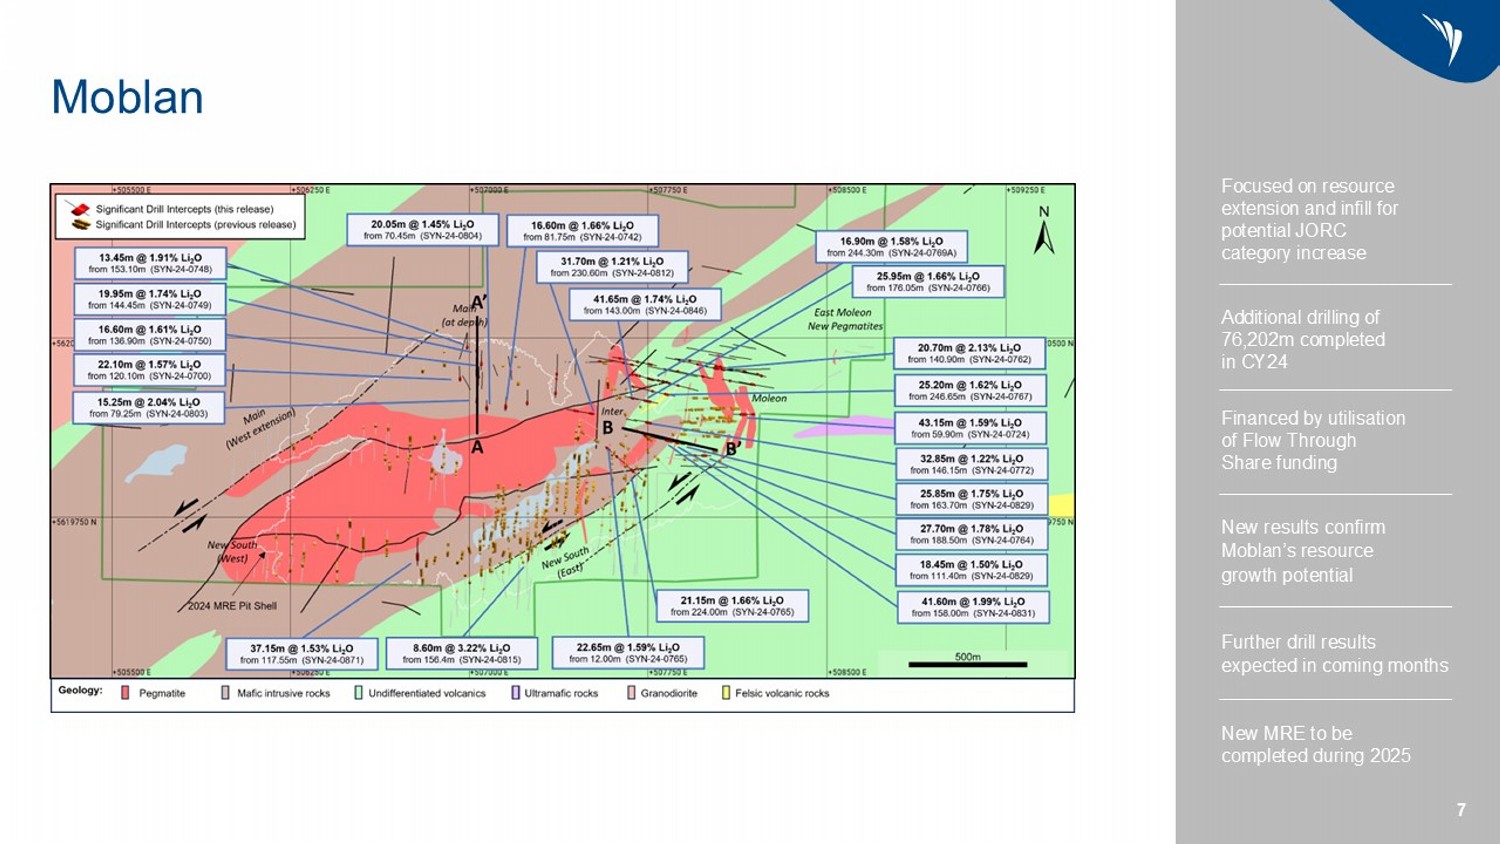
7 Moblan Focused on resource extension and infill for potential JORC category increase Additional drilling of 76,202m completed in CY24 Financed by utilisation of Flow Through Share funding New results confirm Moblan’s resource growth potential Further drill results expected in coming months New MRE to be completed during 2025 7
Financial Performance 8
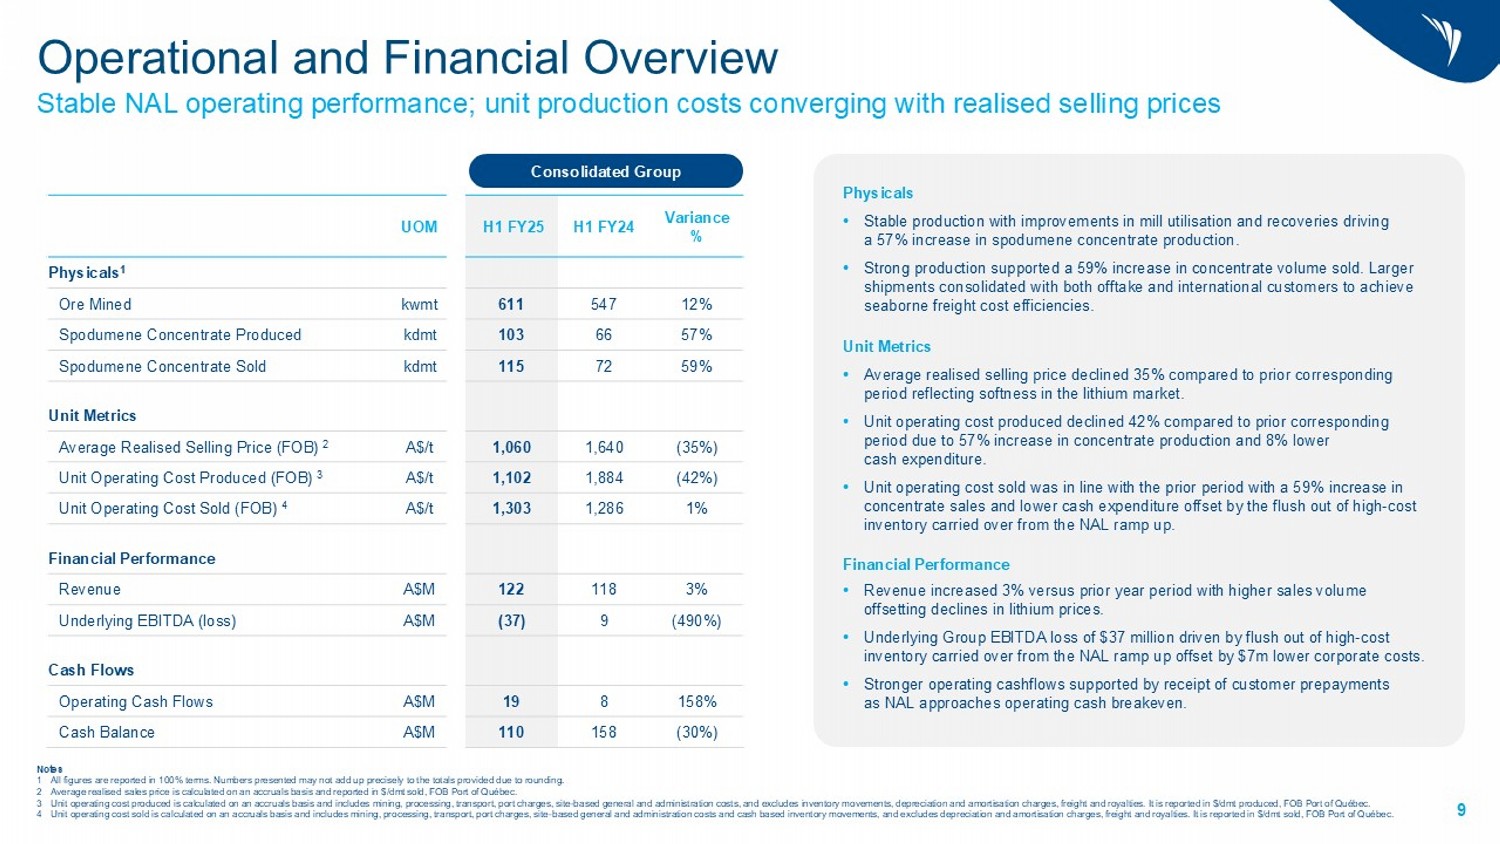
FY 2024 FY 2024 FY 2024 22 9 9 Operational and Financial Overview Stable NAL operating performance; unit production costs converging with realised selling prices 9 Variance % H1 FY24 H1 FY25 UOM Physicals 1 12% 547 611 kwmt Ore Mined 57% 66 103 kdmt Spodumene Concentrate Produced 59% 72 115 kdmt Spodumene Concentrate Sold Unit Metrics (35%) 1,640 1,060 A$/t Average Realised Selling Price (FOB) 2 (42%) 1,884 1,102 A$/t Unit Operating Cost Produced (FOB) 3 1% 1,286 1,303 A$/t Unit Operating Cost Sold (FOB) 4 Financial Performance 3% 118 122 A$M Revenue (490%) 9 (37) A$M Underlying EBITDA (loss) Cash Flows 158% 8 19 A$M Operating Cash Flows (30%) 158 110 A$M Cash Balance Consolidated Group Notes 1 All figures are reported in 100% terms. Numbers presented may not add up precisely to the totals provided due to rounding. 2 Average realised sales price is calculated on an accruals basis and reported in $/ dmt sold, FOB Port of Québec. 3 Unit operating cost produced is calculated on an accruals basis and includes mining, processing, transport, port charges, sit e - b ased general and administration costs, and excludes inventory movements, depreciation and amortisation charges, freight and royalties. It is reported in $/ dmt produced, FOB Port of Québec. 4 Unit operating cost sold is calculated on an accruals basis and includes mining, processing, transport, port charges, site - based general and administration costs and cash based inventory movements, and excludes depreciation and amortisation charges, freight and royalties. It is reported in $/ dmt sold, FOB Port of Québec. Physicals • Stable production with improvements in mill utilisation and recoveries driving a 57% increase in spodumene concentrate production. • Strong production supported a 59% increase in concentrate volume sold. Larger shipments consolidated with both offtake and international customers to achieve seaborne freight cost efficiencies. Unit Metrics • Average realised selling price declined 35% compared to prior corresponding period reflecting softness in the lithium market. • Unit operating cost produced declined 42% compared to prior corresponding period due to 57% increase in concentrate production and 8% lower cash expenditure. • Unit operating cost sold was in line with the prior period with a 59% increase in concentrate sales and lower cash expenditure offset by the flush out of high - cost inventory carried over from the NAL ramp up. Financial Performance • Revenue increased 3% versus prior year period with higher sales volume offsetting declines in lithium prices. • Underlying Group EBITDA loss of $37 million driven by flush out of high - cost inventory carried over from the NAL ramp up offset by $7m lower corporate costs. • Stronger operating cashflows supported by receipt of customer prepayments as NAL approaches operating cash breakeven.
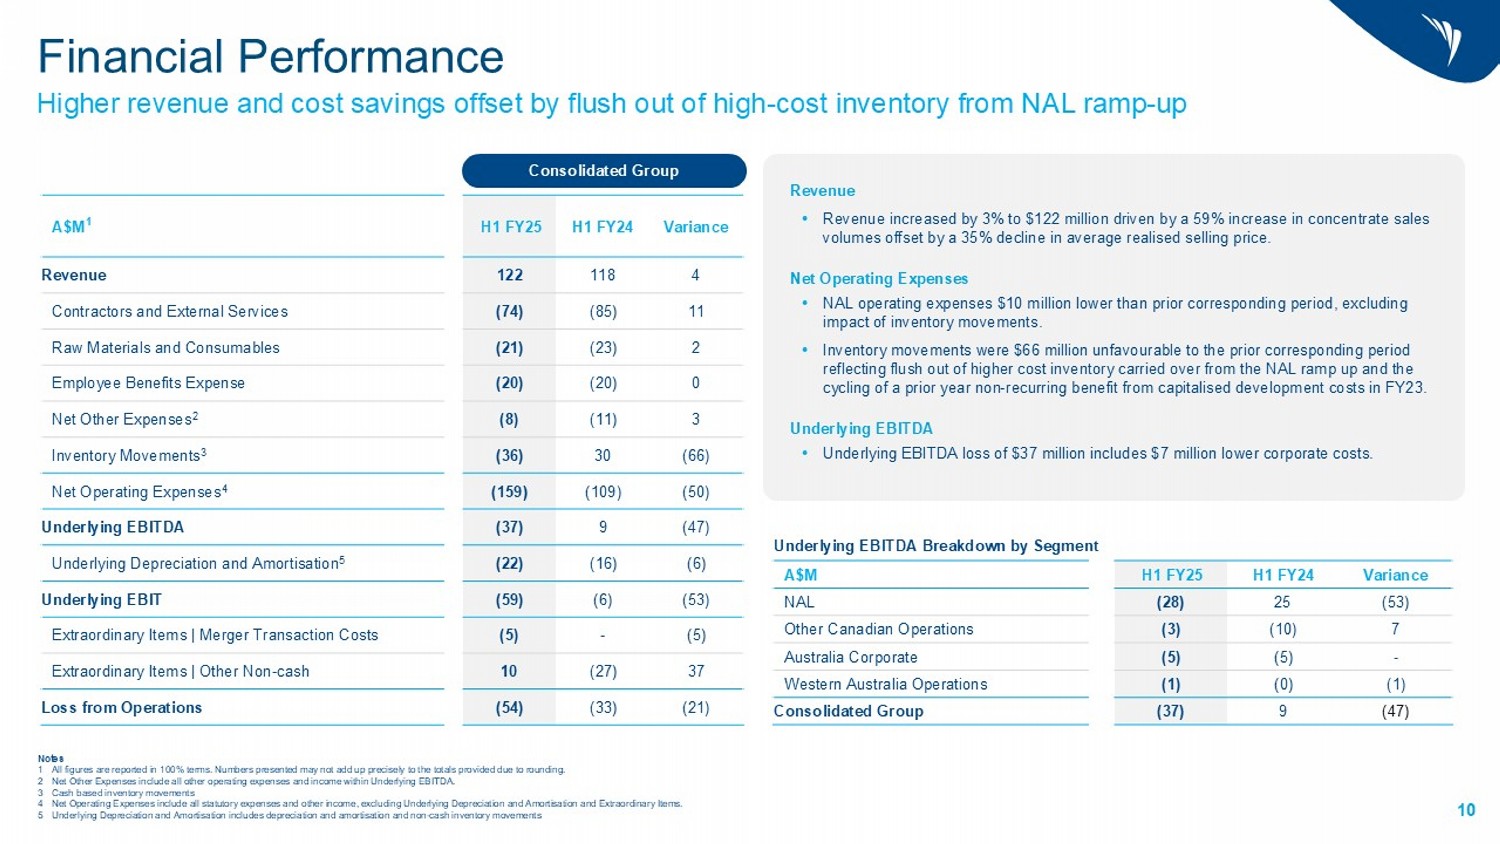
FY 2024 FY 2024 FY 2024 22 10 Financial Performance Higher revenue and cost savings offset by flush out of high - cost inventory from NAL ramp - up 10 Variance H1 FY24 H1 FY25 A$M 1 4 118 122 Revenue 11 (85) (74) Contractors and External Services 2 (23) (21) Raw Materials and Consumables 0 (20) (20) Employee Benefits Expense 3 (11) (8) Net Other Expenses 2 (66) 30 (36) Inventory Movements 3 (50) (109) (159) Net Operating Expenses 4 (47) 9 (37) Underlying EBITDA (6) (16) (22) Underlying Depreciation and Amortisation 5 (53) (6) (59) Underlying EBIT (5) - (5) Extraordinary Items | Merger Transaction Costs 37 (27) 10 Extraordinary Items | Other Non - cash (21) (33) (54) Loss from Operations Consolidated Group Notes 1 All figures are reported in 100% terms. Numbers presented may not add up precisely to the totals provided due to rounding. 2 Net Other Expenses include all other operating expenses and income within Underlying EBITDA. 3 Cash based inventory movements 4 Net Operating Expenses include all statutory expenses and other income, excluding U nderlying Depreciation and Amortisation and Extraordinary Items. 5 Underlying Depreciation and Amortisation includes depreciation and amortisation and non - cash inventory movements Revenue • Revenue increased by 3% to $122 million driven by a 59% increase in concentrate sales volumes offset by a 35% decline in average realised selling price. Net Operating Expenses • NAL operating expenses $10 million lower than prior corresponding period, excluding impact of inventory movements. • Inventory movements were $66 million unfavourable to the prior corresponding period reflecting flush out of higher cost inventory carried over from the NAL ramp up and the cycling of a prior year non - recurring benefit from capitalised development costs in FY23. Underlying EBITDA • Underlying EBITDA loss of $37 million includes $7 million lower corporate costs. Underlying EBITDA Breakdown by Segment Variance H1 FY24 H1 FY25 A$M (53) 25 (28) NAL 7 (10) (3) Other Canadian Operations - (5) (5) Australia Corporate (1) (0) (1) Western Australia Operations (47) 9 (37) Consolidated Group

(1) 7 9 WA Operations | Increased Activity Corporate | Cost Savings NAL | Cost Savings 22 11 Sales volume growth and cost savings offset significant declines in lithium prices 11 Notes 1 All figures are reported in 100% terms. Numbers presented may not add up precisely to the totals provided due to rounding. 2 H1 FY24 Underlying EBITDA adjusted by cycling of A$40 million non - recurring benefit relating to the capitalisation of development costs in FY23. 3 Inflation based on Annual CPI to December - 24; Australia CPI 3.2% published by CBS and Quebec CPI 2.3% published by Statistique Quebec. Underlying EBITDA Bridge 1 Controllable costs Controllable Uncontrollable (31) 43 15 3 1 (3) (65) (37) H1 FY24 Underlying EBITDA [2] Volume Controllable Costs Improved Commercial Terms on Sales FX Impact on Translation Inflation [3] Lithium Market Price H1 FY25 Underlying EBITDA

FY 2024 FY 2024 FY 2024 22 12 12 NAL Operat ing Costs Unit operating costs decline with higher production and reduction in cash expenditure % Variance H1 FY24 H1 FY25 UOM Physicals 1 57% 37 66 103 kdmt Spodumene Concentrate Produced 59% 43 72 115 kdmt Spodumene Concentrate Sold NAL Operating Costs (FOB) (8%) (10) 124 114 A$M Operating Cost Produced (FOB) 2 62% 57 93 150 A$M Operating Cost Sold (FOB) 3 Unit Costs (42%) (782) 1,884 1,102 A$/t Unit Operating Cost Produced (FOB) 2 1% 17 1,286 1,303 A$/t Unit Operating Cost Sold (FOB) 3 (41%) (502) 1,230 728 US$/t Unit Operating Cost Produced (FOB) 2 3% 22 839 861 US$/t Unit Operating Cost Sold (FOB) 3 NAL Notes 1 All figures are reported in 100% terms. Numbers presented may not add up precisely to the totals provided due to rounding. 2 Unit operating cost produced is calculated on an accruals basis and includes mining, processing, transport, port charges, sit e - b ased general and administration costs, and excludes inventory movements, depreciation and amortisation charges, freight and r oya lties. It is reported in $/ dmt produced, FOB Port of Québec 3 Unit operating cost sold is calculated on an accruals basis and includes mining, processing, transport, port charges, site - based general and administration costs and cash based inventory movements, and excludes depreciation and amortisation charges, frei gh t and royalties. It is reported in $/ dmt sold, FOB Port of Québec NAL Operating Costs • Unit operating cost produced declined 42% compared to prior corresponding period due to 57% increase in concentrate production and 8% lower cash expenditure. • Unit operating cost sold was in line with the prior period with a 59% increase in concentrate sales and lower cash expenditure offset by the flush out of high - cost inventory carried over from the NAL ramp up. NAL Concentrate Production and Unit Operating Costs 31 34 40 50 52 51 1,231 1,397 1,536 1,506 1,335 1,280 1,841 1,924 1,681 1,275 1,088 1,117 - 20 40 60 80 100 - 200 400 600 800 1,000 1,200 1,400 1,600 1,800 2,000 Q1FY24 Q2FY24 Q3FY24 Q4FY24 Q1FY25 Q2FY25 Spodumene Concentrate Produced | kdmt Unit Operating Cost Sold (FOB) | A$/t Unit Operating Cost Produced (FOB) | A$/t

91 (28) 15 47 (8) (3) (5) 2 (13) (23) 38 (2) 110 June 2024 Cash Balance Cash Loss from Operations (NAL) Other Net Working Capital Movements (NAL) Customer Prepayments (NAL) Cash Loss from Operations (Group) Net Working Capital Movements (Group) Merger Transaction Costs Net Interest Received Capital Expenditure Exploration Expenditure Net Proceeds from Equity Placements Other Net Cash Flows [2] Dec 2024 Cash Balance 13 Cash Flow Movements 1 Notes 1 All figures are reported in 100% terms. Numbers presented may not add up precisely to the totals provided due to rounding. 2 Other includes lease payments, foreign exchange impacts. NAL approaching operating cash breakeven with remaining FTS funds utilized on exploration activity NAL Operating Cashflow Operating Cashflows Investing Cashflows Financing Cashflows
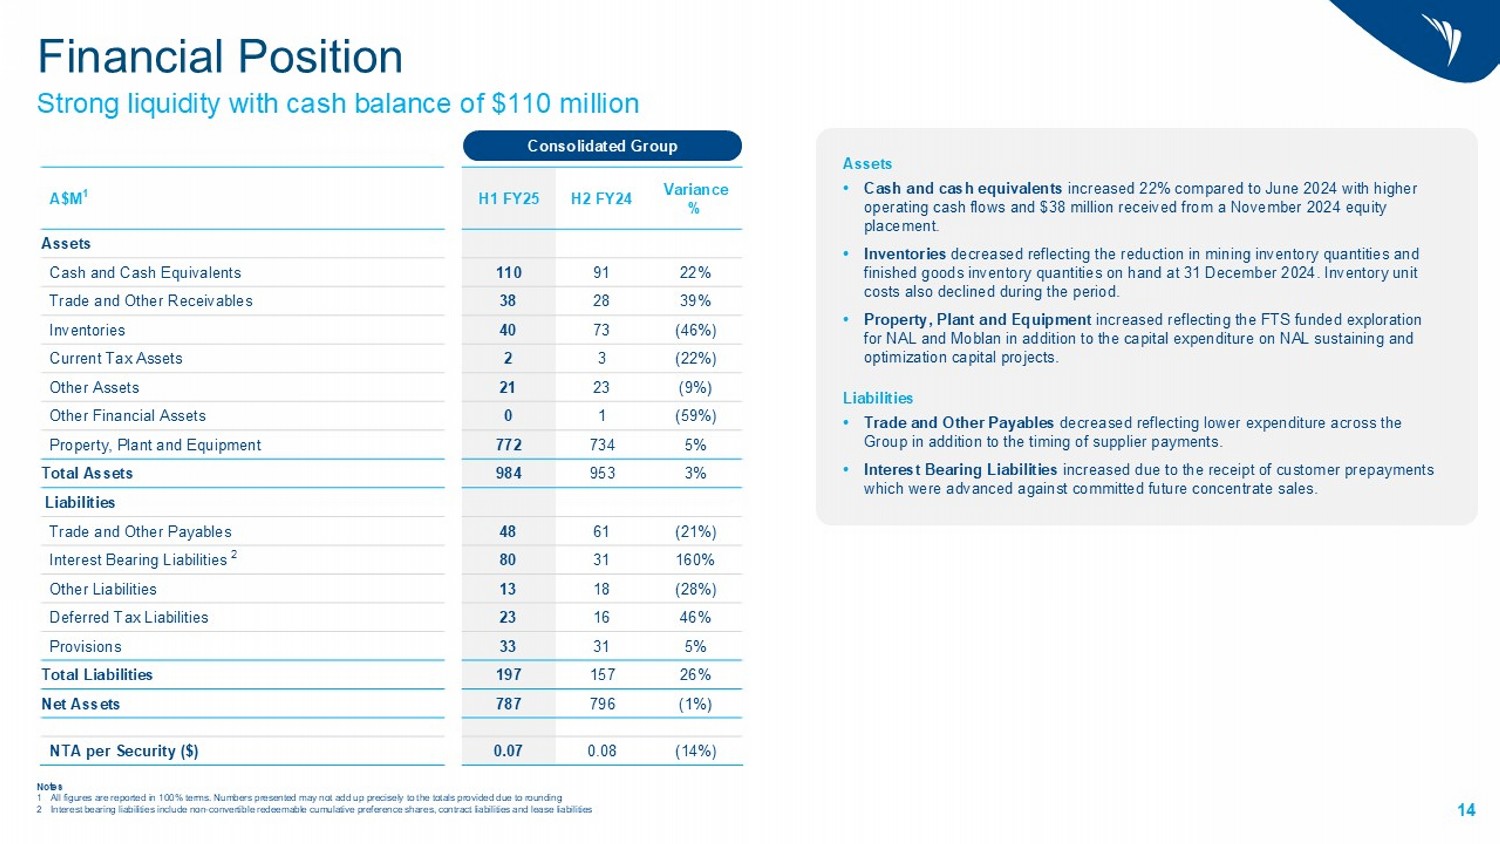
FY 2024 FY 2024 FY 2024 22 Lithium carbonate study demonstrates value in downstream integration 14 14 Financial Position Strong liquidity with cash balance of $110 million 14 Variance % H2 FY24 H1 FY25 A$M 1 Assets 22% 91 110 Cash and Cash Equivalents 39% 28 38 Trade and Other Receivables (46%) 73 40 Inventories (22%) 3 2 Current Tax Assets (9%) 23 21 Other Assets (59%) 1 0 Other Financial Assets 5% 734 772 Property, Plant and Equipment 3% 953 984 Total Assets Liabilities (21%) 61 48 Trade and Other Payables 160% 31 80 Interest Bearing Liabilities 2 (28%) 18 13 Other Liabilities 46% 16 23 Deferred Tax Liabilities 5% 31 33 Provisions 26% 157 197 Total Liabilities (1%) 796 787 Net Assets (14%) 0.08 0.07 NTA per Security ($) Consolidated Group Assets • Cash and cash equivalents increased 22% compared to June 2024 with higher operating cash flows and $38 million received from a November 2024 equity placement. • Inventories decreased reflecting the reduction in mining inventory quantities and finished goods inventory quantities on hand at 31 December 2024. Inventory unit costs also declined during the period. • Property, Plant and Equipment increased reflecting the FTS funded exploration for NAL and Moblan in addition to the capital expenditure on NAL sustaining and optimization capital projects. Liabilities • Trade and Other Payables decreased reflecting lower expenditure across the Group in addition to the timing of supplier payments. • Interest Bearing Liabilities increased due to the receipt of customer prepayments which were advanced against committed future concentrate sales. Notes 1 All figures are reported in 100% terms. Numbers presented may not add up precisely to the totals provided due to rounding 2 Interest bearing liabilities include non - convertible redeemable cumulative preference shares, contract liabilities and lease liabilities
Merger Update 15

16 Merger Transaction Structure Overview of the merger • Newly - formed US subsidiary of Sayona to merge with and into Piedmont, subject to shareholder approvals. • Sayona will be the ultimate parent entity (i.e. “MergeCo”) with Piedmont as a wholly owned subsidiary. • Post transaction ownership split: approximately 50% Sayona shareholders / 50% Piedmont shareholders, on a fully - diluted basis, prior to conditional placement. • MergeCo will be domiciled in Australia – with an ASX primary listing and NASDAQ secondary listing. • Subject to shareholder approval, MergeCo to rebrand under a new name to be announced. Benefits of ASX primary listing and a Nasdaq secondary listing • ASX has demonstrated track record of supporting emerging mining companies, already familiar with MergeCo’s assets. • Nasdaq listing provides enhanced liquidity and potential to broaden equity research coverage and institutional investor interest. Newly Created Delaware Subsidiary MergeCo ASX primary listing Nasdaq secondary listing of ADRs (Renamed from Sayona )

17 Positioned to be a North American Lithium Champion 593 569 397 350 308 285 259 147 141 100 58 Merge Co (NAMR) Patriot Rio Tinto Albemarle (NAMR) Sayona Piedmont (ex-Ewoyaa) Winsome Resources Critical Elements Frontier Lithium Rock Tech Lithium Avalon Advanced North America Hard Rock Lithium Producers North American LOM Avg. Spodumene Concentrate Capacity ( ktpa SC6 equivalent) (1) 1. Capacity based on public company data (see “Important Information and Disclaimer” section for details). Totals may differ due to small rounding. Excludes Chinese companies. Refer to supporting information on page 35 2. LOM average spodumene production for North American Lithium expected to be 190ktpa SC5.4 (171ktpa SC6.0), includes Authier pr oje ct Moblan NAL (2) Carolina Carolina Moblan NAL (2) NAL (2) NAL (2) MergeCo North American pure - play hard rock lithium producer #1 Currently the largest permitted & producing hard - rock lithium mine in North America with potential to develop 3 additional high quality projects
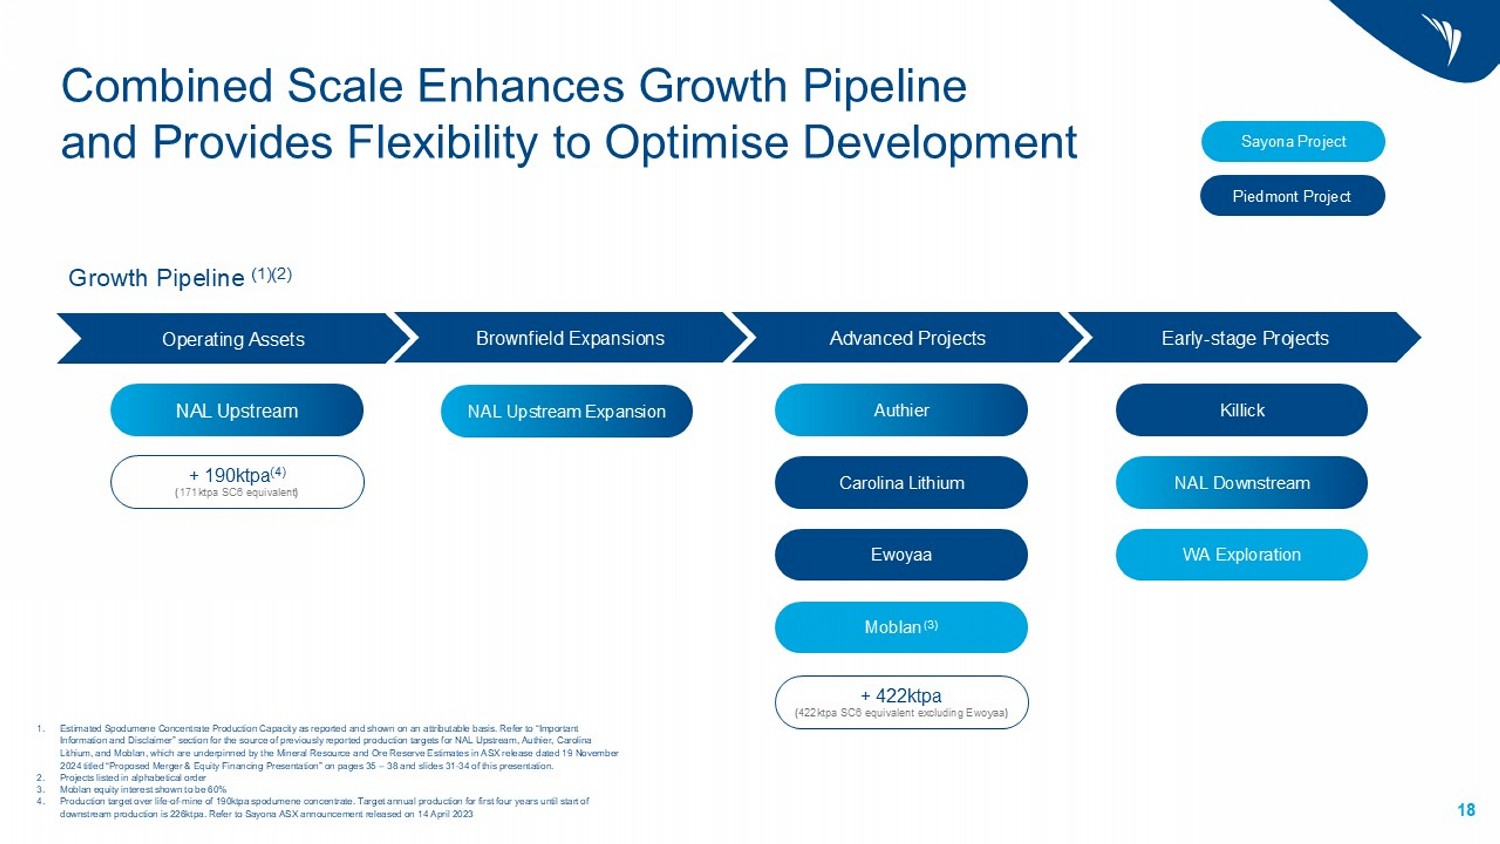
18 Combined Scale Enhances Growth Pipeline and Provides Flexibility to Optimise Development 1. Estimated Spodumene Concentrate Production Capacity as reported and shown on an attributable basis. Refer to “Important Information and Disclaimer” section for the source of previously reported production targets for NAL Upstream, Authier, Carol ina Lithium, and Moblan, which are underpinned by the Mineral Resource and Ore Reserve Estimates in ASX release dated 19 November 2024 titled “Proposed Merger & Equity Financing Presentation” on pages 35 – 38 and slides 31 - 34 of this presentation. 2. Projects listed in alphabetical order 3. Moblan equity interest shown to be 60% 4. Production target over life - of - mine of 190ktpa spodumene concentrate. Target annual production for first four years until start of downstream production is 226ktpa. Refer to Sayona ASX announcement released on 14 April 2023 Early - stage Projects Brownfield Expansions Advanced Projects Sayona Project Piedmont Project NAL Upstream Expansion Operating Assets NAL Upstream Carolina Lithium NAL Downstream Authier WA Exploration Killick Moblan (3) Ewoyaa Growth Pipeline (1)(2) + 422ktpa ( 422ktpa SC6 equivalent excluding Ewoyaa ) + 190ktpa (4) ( 171ktpa SC6 equivalent )

Current status of merger CFIUS (US national security) filing accepted – awaiting ruling Investment Canada Act (ICA) regulatory clearance complete HSR (US competition clearance) notice submitted – ongoing engagement with DOJ ASIC and ASX engagement progressing MergeCo Board composition near finalised Organisational structure being considered Integration planning progressing Rebranding project commenced Targeting merger completion mid - CY2025 Draft SEC F - 4 Registration Statement prepared – review and feedback from SEC is typically 1 – 2 ½ months EGM preparation commenced Draft NOM underway including share consolidation Regulatory and procedural Corporate and implementation New website underway MergeCo strategy and project prioritisation is progressing Finance integration assessment completed 19

Lithium Market and Guidance 20

21 Lithium market perspectives BEV + PHEV growth to remain around 20 - 25% p.a. in 2025 All EV market expected to grow at CAGR of 17% between 2024 - 2034 The average battery pack size for BEV+PHEV light - duty vehicles is expected to rise from an average of 48 kWh in 2024 to 62 kWh in 2030 ESS CAGR is expected to be ~12% from 2024 - 2034 Mine curtailments tighten short - term supply forecasts, 2025 supply forecast has reduced by 9% compared to forecast made in Q1 2024 Source: Benchmark Mineral Intelligence (BMI) supply and demand forecast as of December 2024 Longer term fundamentals remain strong with market forecasters expecting lithium demand to double by 2030

$8,000 $9,000 $10,000 $11,000 $12,000 $13,000 $14,000 $15,000 $16,000 CME Futures ($/t) $725 $745 $765 $785 $805 $825 $845 $865 $885 $905 9/10/2024 10/10/2024 11/10/2024 12/10/2024 1/10/2025 2/10/2025 Spodumene Concentrate 6% CIF China Spot Price Spodumene Prices Have Continued to Recover; Lithium Hydroxide Futures Remain Strongly in Contango 6% Lithium Oxide Spodumene Concentrate Spot Price (US$/t) (1) 1. Fastmarkets pricing as of February 13, 2025 2. Chicago Mercantile Exchange settlements as of February 13, 2025 CME Lithium Hydroxide CIF Futures (US$/t) (2) • Spodumene Concentrate prices have recovered from multi - year lows as industry responds to supply curtailments and project delays • Resilient demand growth from EVs and ESS driving downstream inventory destocking • Lithium Hydroxide futures market remains in contango providing higher prices for future sales volume • MergeCo can forward sell spodumene concentrate deliveries against the futures curve to increase certainty over price realisations and limit downside exposure February13 Spot: US$895/t February 13 Spot: US$9,310/t 22

FY25 Guidance 5 Notes 1 Guidance assumes average annual foreign exchange rates of AUD:CAD 0.91 and AUD:USD 0.667. 2 Capital expenditure guidance excludes movements in capital creditors which amounted to A$3 million as at 30 June 2024. 3 Exploration expenditure guidance excludes movements in exploration creditors which amounted to A$7 million as at 30 June 2024 . 4 Unit operating cost is calculated on an accruals basis and includes mining, processing, transport, port charges, site - based gene ral and administration costs and cash based inventory movements, and excludes depreciation and amortisation charges, freight and royalties. It is reported in A$ / dmt sold, FOB Port of Québec. 5 Guidance published in ASX release 30 August 2024 is based on assumptions, budgets and estimates existing at the time of asses sme nt which may change over time impacting the accuracy of those estimates. These estimates are developed in the context of an u nce rtain operating environment including in respect of inflationary macroeconomic conditions, incomplete engineering and uncertainties surrounding the risks associated with mining and project development including construction, commissioning and ramp up which may delay or impact production and have a flow on e ffect on sales. Actual results may therefore vary significantly depending on these risks and the timing required to address them. The information is provided as an indicative gui de to assist sophisticated investors with modelling of the Company. It should not be relied upon as a predictor of future per for mance. 190,000 - 210,000 DRY METRIC TONNES Spodumene Concentrate Production SC 5.4% product grade 100% NAL production FY25 production guidance assumes NAL achieves steady state production levels in FY25 23 200,000 - 230,000 DRY METRIC TONNES Spodumene Concentrate Sales SC 5.4% product grade 100% NAL sales Approximately two thirds (67%) of concentrate sales will be sold by NAL to Piedmont Lithium under the offtake agreement in FY25 A$1,150 - A$1,300 PER DRY METRIC TONNE Unit Operating Costs (1,4) SC 5.4% product grade 100% NAL unit operating costs A$ / dmt sold, FOB Port of Québec Unit operating costs reflect achievement of steady state production levels ~A$20M Capital Expenditure (1,2) Group capital expenditure relates predominantly to sustaining capital projects at NAL ~A$30M Exploration Expenditure (1,3) Relates to utilisation of Flow Through Share funding which must be spent on Quebec lithium projects by end of 2024 Q3 ~ 30% Q4 ~ 70% H2FY25 Shipment Volumes (Q3vQ4) Shipping volumes have been deliberately weighted to Q4FY25 in order to deliver into higher priced forward sales arrangements that commence in April 2025. Full year sales volume outcomes will not be affected

Connect with us. Sayona Mining Limited ACN 091 951 978 ASX:SYAOTCQB:SYAXF Level 28, 10 Eagle Street Brisbane, Queensland, 4000 Australia info@sayonamining.com.au sayonamining.com.au +61 (7) 3369 7058 @SayonaMining

Appendix
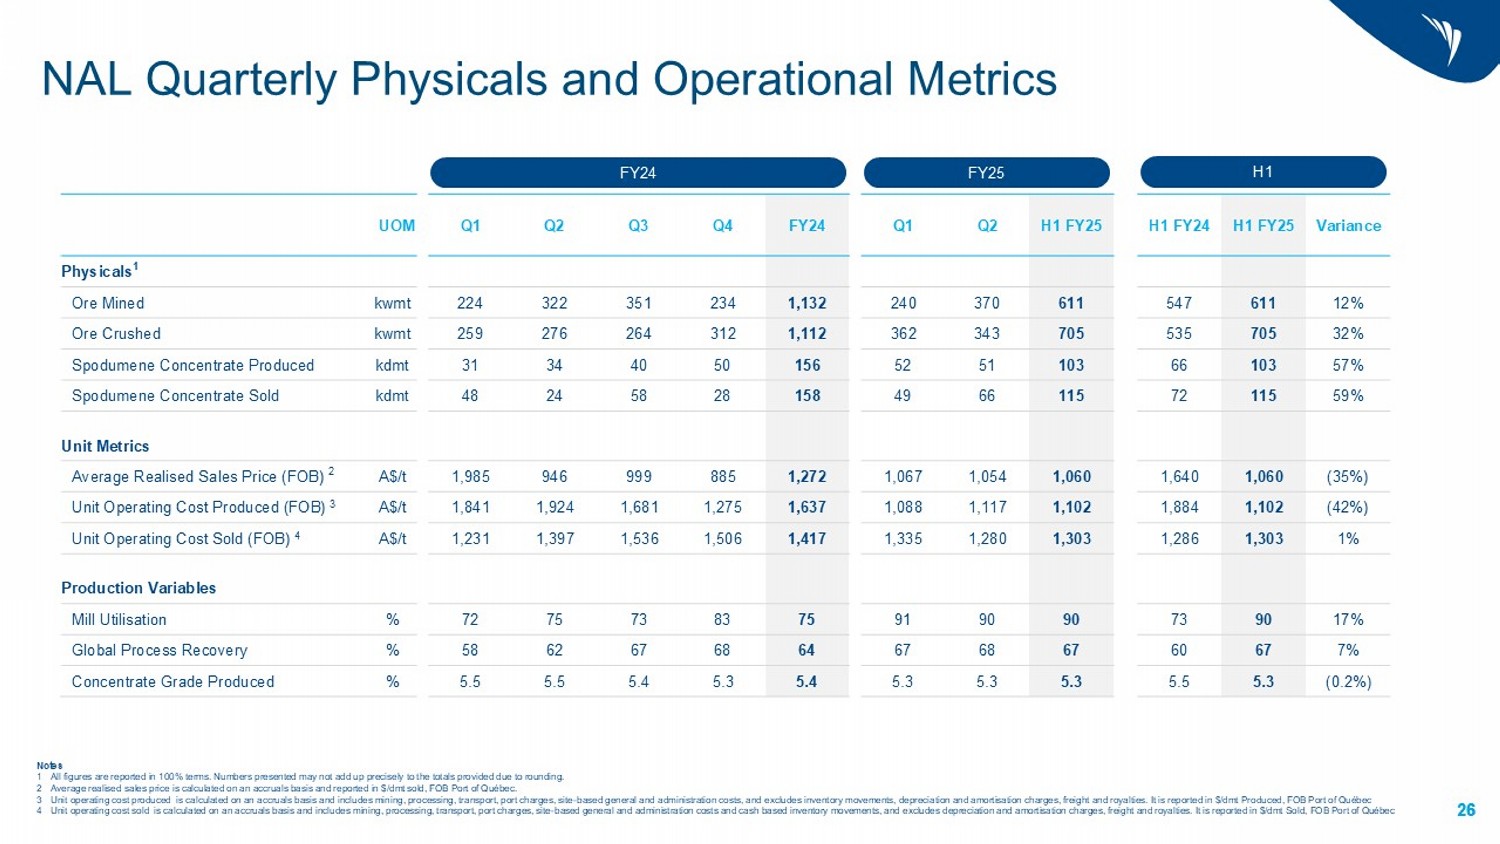
NAL Quarterly Physicals and Operational Metrics 26 FY24 FY23 Variance H1 FY25 H1 FY24 H1 FY25 Q2 Q1 FY24 Q4 Q3 Q2 Q1 UOM Physicals 1 12% 611 547 611 370 240 1,132 234 351 322 224 kwmt Ore Mined 32% 705 535 705 343 362 1,112 312 264 276 259 kwmt Ore Crushed 57% 103 66 103 51 52 156 50 40 34 31 kdmt Spodumene Concentrate Produced 59% 115 72 115 66 49 158 28 58 24 48 kdmt Spodumene Concentrate Sold Unit Metrics (35%) 1,060 1,640 1,060 1,054 1,067 1,272 885 999 946 1,985 A$/t Average Realised Sales Price (FOB) 2 (42%) 1,102 1,884 1,102 1,117 1,088 1,637 1,275 1,681 1,924 1,841 A$/t Unit Operating Cost Produced (FOB) 3 1% 1,303 1,286 1,303 1,280 1,335 1,417 1,506 1,536 1,397 1,231 A$/t Unit Operating Cost Sold (FOB) 4 Production Variables 17% 90 73 90 90 91 75 83 73 75 72 % Mill Utilisation 7% 67 60 67 68 67 64 68 67 62 58 % Global Process Recovery (0.2%) 5.3 5.5 5.3 5.3 5.3 5.4 5.3 5.4 5.5 5.5 % Concentrate Grade Produced FY24 FY25 H1 Notes 1 All figures are reported in 100% terms. Numbers presented may not add up precisely to the totals provided due to rounding. 2 Average realised sales price is calculated on an accruals basis and reported in $/ dmt sold, FOB Port of Québec. 3 Unit operating cost produced is calculated on an accruals basis and includes mining, processing, transport, port charges, si te - based general and administration costs, and excludes inventory movements, depreciation and amortisation charges, freight and royalties. It is reported in $/ dmt Produced, FOB Port of Québec 4 Unit operating cost sold is calculated on an accruals basis and includes mining, processing, transport, port charges, site - base d general and administration costs and cash based inventory movements, and excludes depreciation and amortisation charges, freight and royalties. It is reported in $/ dmt Sold, FOB Port of Québec 26

FY 2024 FY 2024 FY 2024 22 Reconciliation of Underlying EBITDA to Loss after Income Tax 27 27 Variance H1 FY24 H1 FY25 A$M 1 (46.5) 9.5 (37.0) Underlying EBITDA (6.5) (15.6) (22.1) Underlying Depreciation and Amortisation Expense 2 (53.0) (6.1) (59.1) Underlying EBIT Extraordinary Items 3.1 3.0 6.1 Income from sale of tax benefits under flow through share arrangements 28.6 (24.8) 3.8 Movement of inventories relating to net realisable value adjustments 5.3 (5.3) - Impairment and write down of non - financial assets (5.2) - (5.2) Merger transaction and integration costs (21.2) (33.2) (54.4) Loss from Operations (2.5) 4.8 2.3 Financial Income (1.5) (2.7) (4.2) Financial Expenses (25.2) (31.1) (56.3) Loss before Income Tax (6.1) (1.3) (7.4) Income Tax Expense (31.2) (32.5) (63.7) Loss after Income Tax Consolidated Group Notes 1 All figures are reported in 100% terms. Numbers presented may not add up precisely to the totals provided due to rounding. 2 Underlying Depreciation and Amortisation includes depreciation and amortisation and non - cash inventory movements
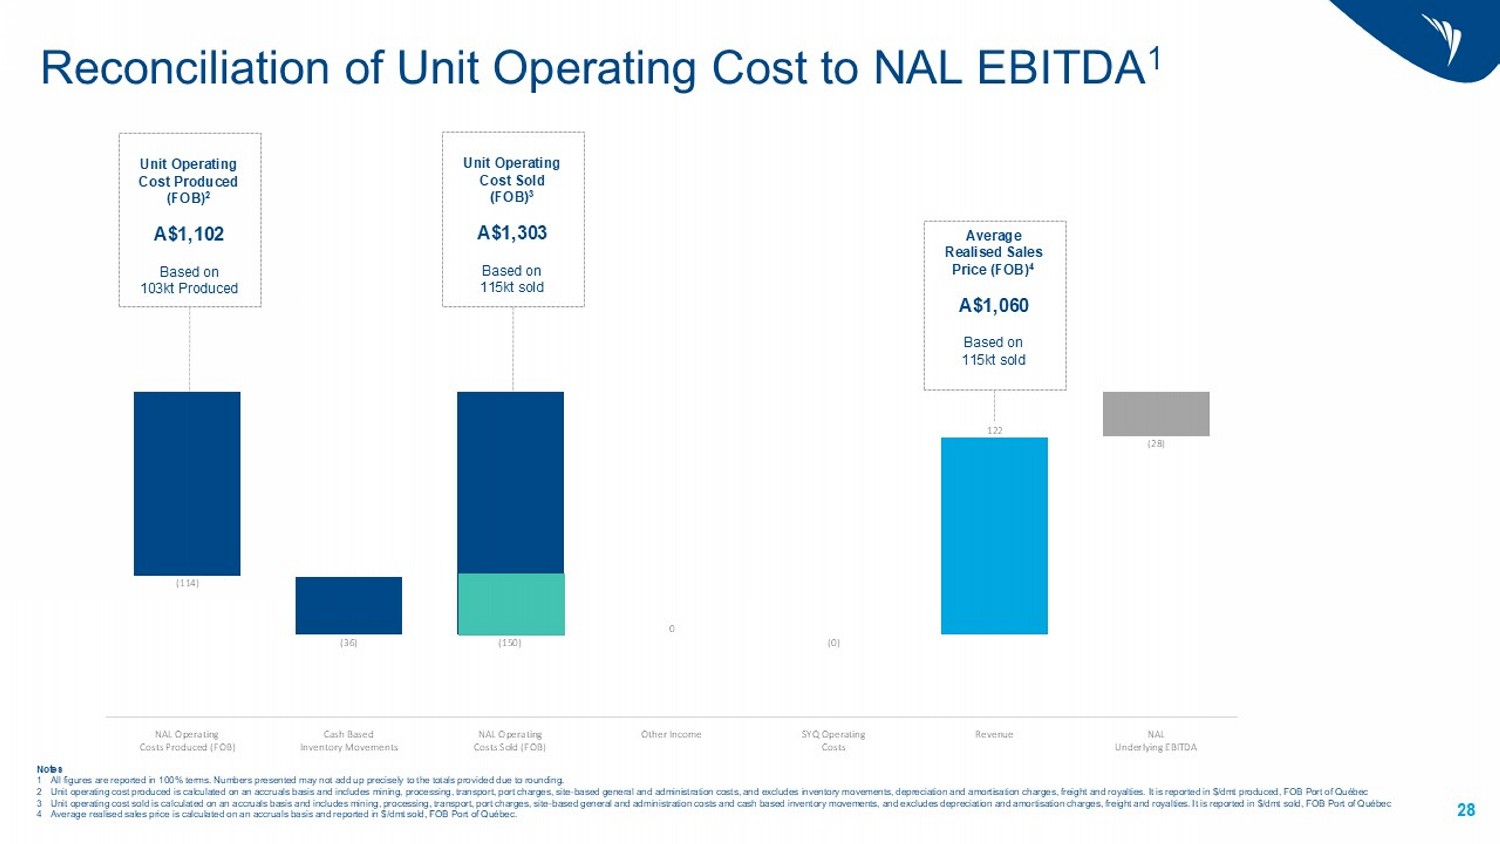
28 Notes 1 All figures are reported in 100% terms. Numbers presented may not add up precisely to the totals provided due to rounding. 2 Unit operating cost produced is calculated on an accruals basis and includes mining, processing, transport, port charges, sit e - b ased general and administration costs, and excludes inventory movements, depreciation and amortisation charges, freight and r oya lties. It is reported in $/ dmt produced, FOB Port of Québec 3 Unit operating cost sold is calculated on an accruals basis and includes mining, processing, transport, port charges, site - based general and administration costs and cash based inventory movements, and excludes depreciation and amortisation charges, frei gh t and royalties. It is reported in $/ dmt sold, FOB Port of Québec 4 Average realised sales price is calculated on an accruals basis and reported in $/ dmt sold, FOB Port of Québec. Reconciliation of Unit Operating Cost to NAL EBITDA 1 Average Realised Sales Price (FOB) 4 A$1,060 Based on 115kt sold Unit Operating Cost Produced (FOB) 2 A$1,102 Based on 103kt Produced Unit Operating Cost Sold (FOB) 3 A$1,303 Based on 115kt sold (114) (36) (150) 0 (0) 122 (28) NAL Operating Costs Produced (FOB) Cash Based Inventory Movements NAL Operating Costs Sold (FOB) Other Income SYQ Operating Costs Revenue NAL Underlying EBITDA
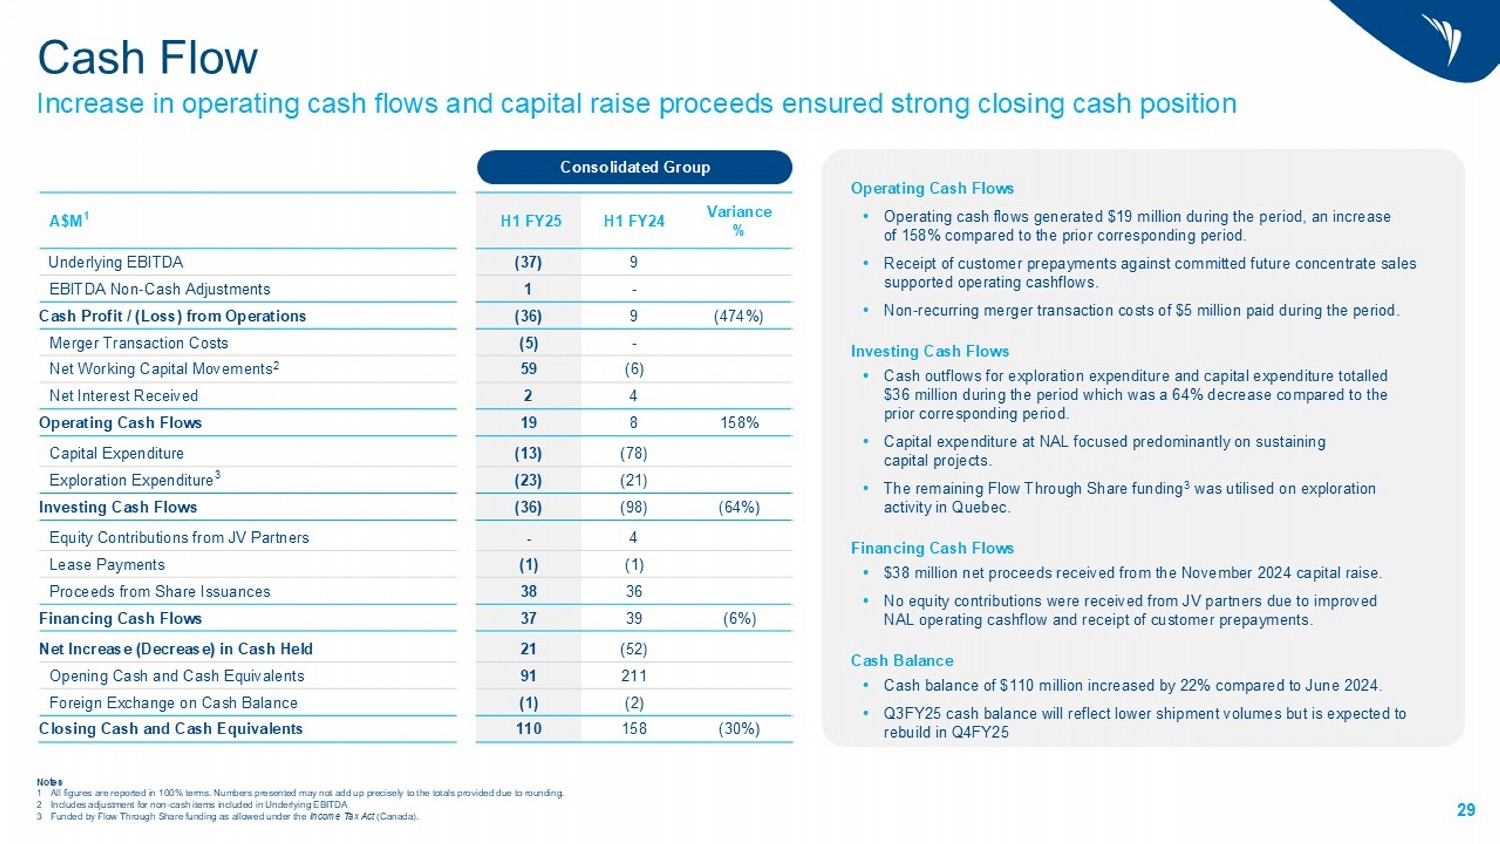
FY 2024 FY 2024 FY 2024 22 Lithium carbonate study demonstrates value in downstream integration 29 29 Cash Flow Increase in operating cash flows and capital raise proceeds ensured strong closing cash position 29 Variance % H1 FY24 H1 FY25 A$M 1 9 (37) Underlying EBITDA - 1 EBITDA Non - Cash Adjustments (474%) 9 (36) Cash Profit / (Loss) from Operations - (5) Merger Transaction Costs (6) 59 Net Working Capital Movements 2 4 2 Net Interest Received 158% 8 19 Operating Cash Flows (78) (13) Capital Expenditure (21) (23) Exploration Expenditure 3 (64%) (98) (36) Investing Cash Flows 4 - Equity Contributions from JV Partners (1) (1) Lease Payments 36 38 Proceeds from Share Issuances (6%) 39 37 Financing Cash Flows (52) 21 Net Increase (Decrease) in Cash Held 211 91 Opening Cash and Cash Equivalents (2) (1) Foreign Exchange on Cash Balance (30%) 158 110 Closing Cash and Cash Equivalents Operating Cash Flows • Operating cash flows generated $19 million during the period, an increase of 158% compared to the prior corresponding period. • Receipt of customer prepayments against committed future concentrate sales supported operating cashflows. • Non - recurring merger transaction costs of $5 million paid during the period. Investing Cash Flows • Cash outflows for exploration expenditure and capital expenditure totalled $36 million during the period which was a 64% decrease compared to the prior corresponding period. • Capital expenditure at NAL focused predominantly on sustaining capital projects. • The remaining Flow Through Share funding 3 was utilised on exploration activity in Quebec. Financing Cash Flows • $38 million net proceeds received from the November 2024 capital raise. • No equity contributions were received from JV partners due to improved NAL operating cashflow and receipt of customer prepayments. Cash Balance • Cash balance of $110 million increased by 22% compared to June 2024. • Q3FY25 cash balance will reflect lower shipment volumes but is expected to rebuild in Q4FY25 Consolidated Group Notes 1 All figures are reported in 100% terms. Numbers presented may not add up precisely to the totals provided due to rounding. 2 Includes adjustment for non - cash items included in Underlying EBITDA 3 Funded by Flow Through Share funding as allowed under the Income Tax Act (Canada).

30 Capital Investment Capital expenditure focused on NAL sustaining projects with exploration utilising remaining FTS funds Capital Expenditure • $65 million reduction in capital expenditure reflecting NAL approaching stable operations post completion of critical projects in FY24. • Optimisation projects included the Courier8 in - line spectrometer to enable real - time monitoring of the production process. • Sustaining capital projects included phase 2 of the tailings storage facility capacity upgrade and expansion of waste rock stockpiles. • Restart capital projects included the refurbishment of the MVA transformer to ensure reliable power supply and provide optionality for future expanded power capacity requirements. Capitalised Exploration Expenditure • Exploration expenditure utilised the remaining Flow Through Share funding 4 in Quebec by the end of 2024. • FTS funds were deployed predominantly towards exploration drilling at Moblan and NAL, with some funding directed towards exploration on the Troilus claims. Notes 1 All figures are reported in 100% terms. Numbers presented may not add up precisely to the totals provided due to rounding. 2 Movement in capital creditors has not been allocated by segment. 3 NAL comprises all activity within the Sayona Québec Joint Venture, including minor expenditure outside of the NAL operation. 4 Funded by Flow Through Share funding as allowed under the Income Tax Act (Canada). Variance H1 FY24 H1 FY25 A$M 1 Capital Expenditure (33) 36 3 Optimisation (40) 41 1 Restart & Ramp - up 8 - 8 Sustaining 1 - 1 Movements in Capital Creditors 2 (65) 78 13 Total Capital Expenditure Capitalised Exploration Expenditure (5) 15 10 NAL 3 7 6 13 Moblan 4 - 4 Troilus (4) - (4) Movements in Capital Creditors 2 2 21 23 Total Capitalised Exploration Expenditure Consolidated Group
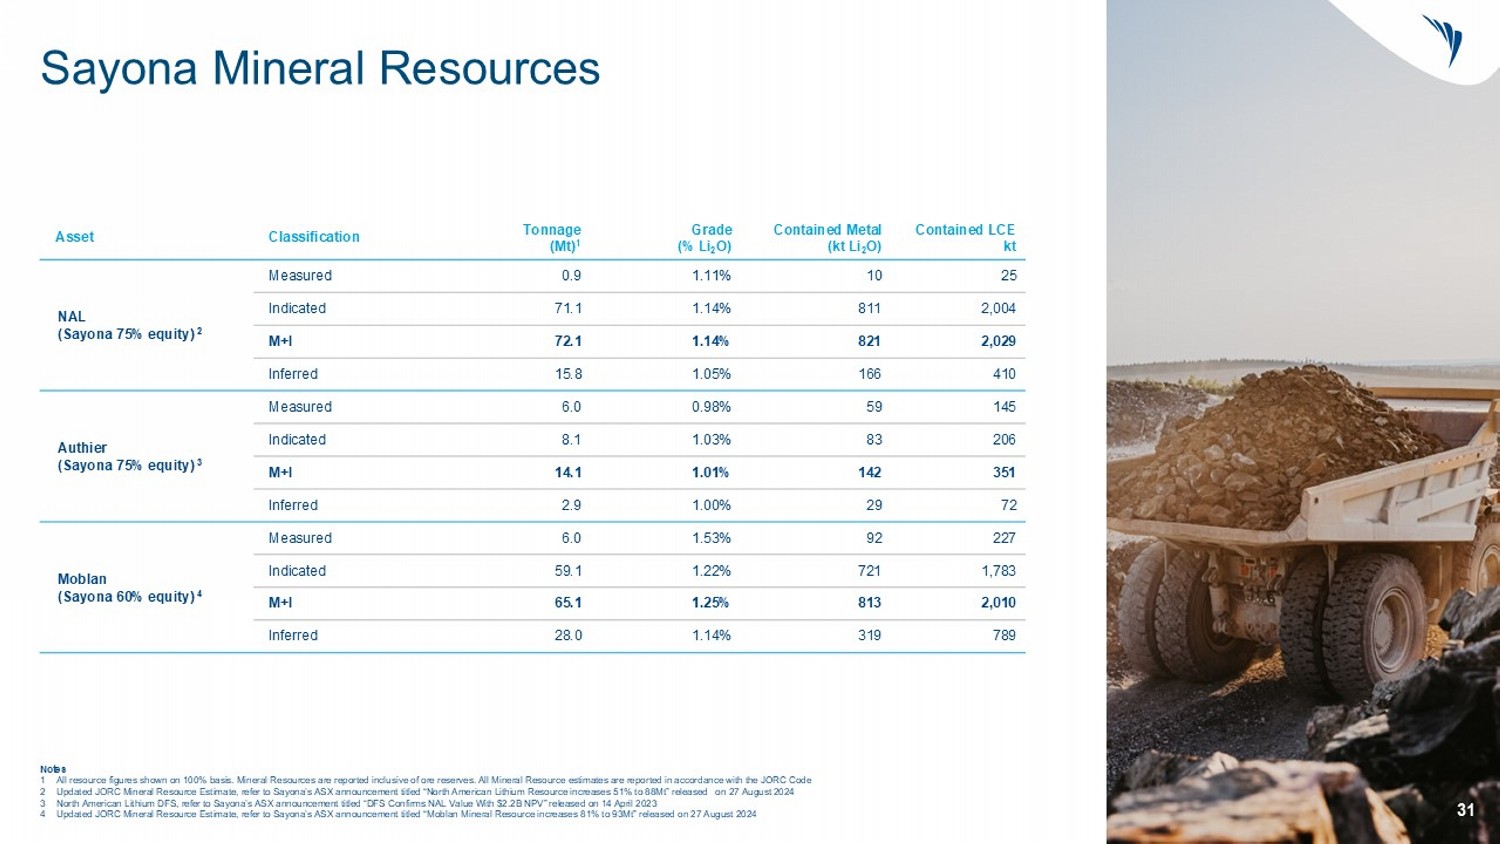
24 31 Sayona Mineral Resources Notes 1 All resource figures shown on 100% basis. Mineral Resources are reported inclusive of ore reserves. All Mineral Resource esti ma tes are reported in accordance with the JORC Code 2 Updated JORC Mineral Resource Estimate, refer to Sayona’s ASX announcement titled “North American Lithium Resource increases 51% to 88Mt” released on 27 August 2024 3 North American Lithium DFS, refer to Sayona’s ASX announcement titled “DFS Confirms NAL Value With $2.2B NPV” released on 14 April 2023 4 Updated JORC Mineral Resource Estimate, refer to Sayona’s ASX announcement titled “ Moblan Mineral Resource increases 81% to 93Mt” released on 27 August 2024 Contained LCE kt Contained Metal (kt Li 2 O) Grade (% Li 2 O) Tonnage (Mt) 1 Classification Asset 25 10 1.11% 0.9 Measured NAL ( Sayona 75% equity) 2 2,004 811 1.14% 71.1 Indicated 2,029 821 1.14% 72.1 M+I 410 166 1.05% 15.8 Inferred 145 59 0.98% 6.0 Measured Authier ( Sayona 75% equity) 3 206 83 1.03% 8.1 Indicated 351 142 1.01% 14.1 M+I 72 29 1.00% 2.9 Inferred 227 92 1.53% 6.0 Measured Moblan ( Sayona 60% equity) 4 1,783 721 1.22% 59.1 Indicated 2,010 813 1.25% 65.1 M+I 789 319 1.14% 28.0 Inferred
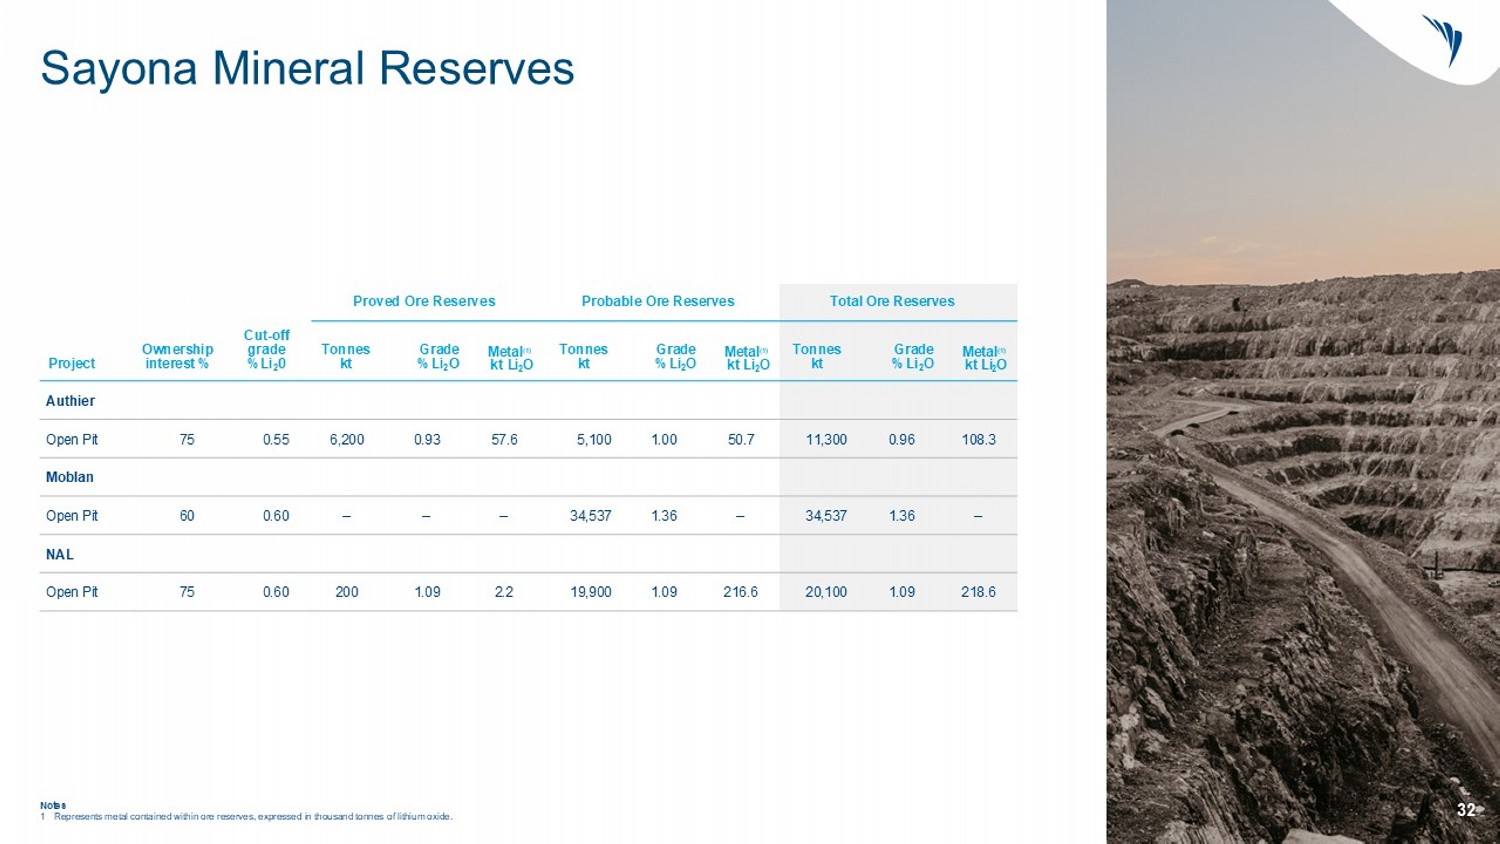
24 32 Sayona Mineral Reserves Notes 1 Represents metal contained within ore reserves, expressed in thousand tonnes of lithium oxide. Total Ore Reserves Probable Ore Reserves Proved Ore Reserves Metal (1) kt Li 2 O Grade % Li 2 O Tonnes kt Metal (1) kt Li 2 O Grade % Li 2 O Tonnes kt Metal (1) kt Li 2 O Grade % Li 2 O Tonnes kt Cut - off grade %Li 2 0 Ownership interest % Project Authier 108.3 0.96 11,300 50.7 1.00 5,100 57.6 0.93 6,200 0.55 75 Open Pi t Moblan – 1.36 34,537 – 1.36 34,537 – – – 0.60 60 Open Pi t NAL 218.6 1.09 20,100 216.6 1.09 19,900 2.2 1.09 200 0.60 75 Open Pit
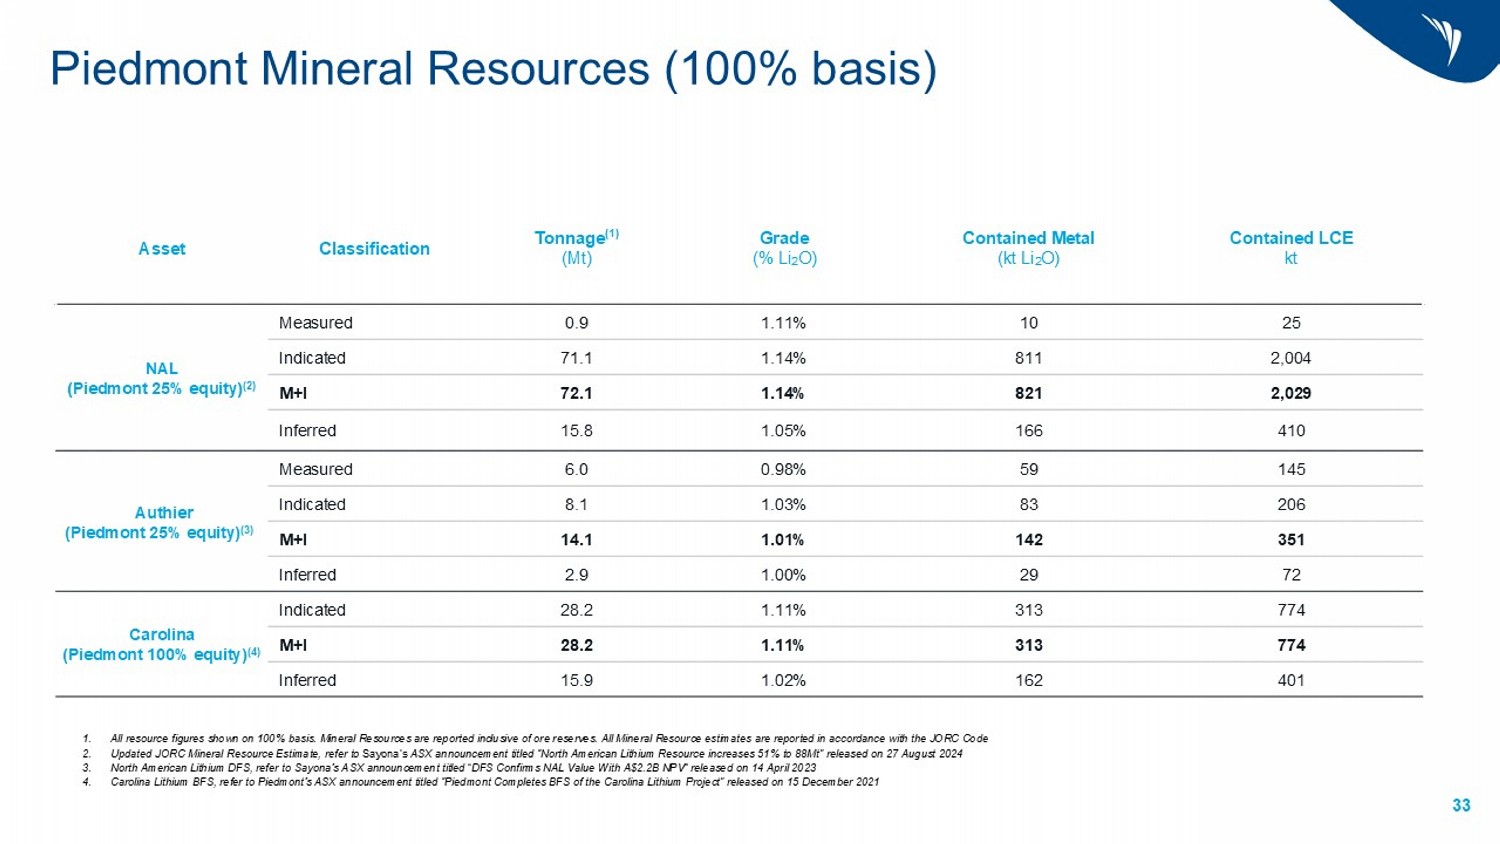
24 33 Piedmont Mineral Resources (100% basis) Contained LCE kt Contained Metal (kt Li 2 O) Grade (% Li 2 O) Tonnage (1) (Mt) Classification Asset 25 10 1.11% 0.9 Measured NAL (Piedmont 25% equity) (2) 2,004 811 1.14% 71.1 Indicated 2,029 821 1.14% 72.1 M+I 410 166 1.05% 15.8 Inferred 145 59 0.98% 6.0 Measured Authier (Piedmont 25% equity) (3) 206 83 1.03% 8.1 Indicated 351 142 1.01% 14.1 M+I 72 29 1.00% 2.9 Inferred 774 313 1.11% 28.2 Indicated Carolina (Piedmont 100% equity) (4) 774 313 1.11% 28.2 M+I 401 162 1.02% 15.9 Inferred 1. All resource figures shown on 100% basis. Mineral Resources are reported inclusive of ore reserves. All Mineral Resource esti mat es are reported in accordance with the JORC Code 2. Updated JORC Mineral Resource Estimate, refer to Sayona’s ASX announcement titled “ North American Lithium Resource increases 51% to 88Mt” released on 27 August 2024 3. North American Lithium DFS, refer to Sayona’s ASX announcement titled “ DFS Confirms NAL Value With A$2.2B NPV ” released on 14 April 2023 4. Carolina Lithium BFS, refer to Piedmont’s ASX announcement titled “ Piedmont Completes BFS of the Carolina Lithium Project” released on 15 December 2021 33
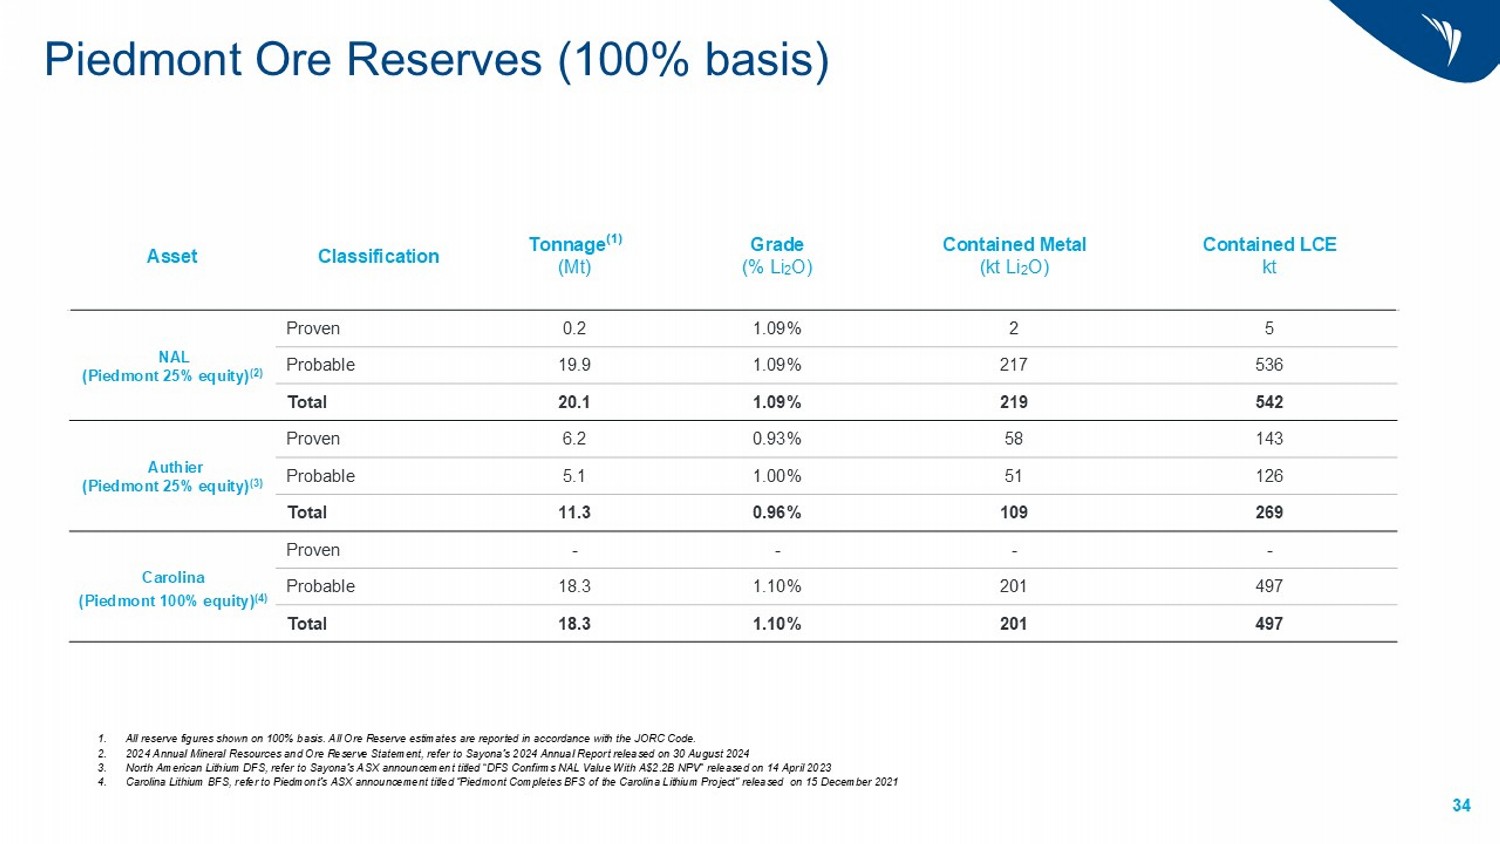
24 34 Piedmont Ore Reserves (100% basis) Contained LCE kt Contained Metal (kt Li 2 O) Grade (% Li 2 O) Tonnage (1) (Mt) Classification Asset 5 2 1.09% 0.2 Proven NAL (Piedmont 25% equity) (2) 536 217 1.09% 19.9 Probable 542 219 1.09% 20.1 Total 143 58 0.93% 6.2 Proven Authier (Piedmont 25% equity) (3) 126 51 1.00% 5.1 Probable 269 109 0.96% 11.3 Total - - - - Proven Carolina (Piedmont 100% equity) (4) 497 201 1.10% 18.3 Probable 497 201 1.10% 18.3 Total 1. All reserve figures shown on 100% basis. All Ore Reserve estimates are reported in accordance with the JORC Code. 2. 2024 Annual Mineral Resources and Ore Reserve Statement, refer to Sayona’s 2024 Annual Report released on 30 August 2024 3. North American Lithium DFS, refer to Sayona’s ASX announcement titled “ DFS Confirms NAL Value With A$2.2B NPV ” released on 14 April 2023 4. Carolina Lithium BFS , refer to Piedmont’s ASX announcement titled “ Piedmont Completes BFS of the Carolina Lithium Project” released on 15 December 2021 34

24 35 Supporting data: Positioned to be a North American Lithium Champion Date Source Attr . Capacity ( ktpa SC6 eqv .) (1) Attr . Capacity ( ktpa SC) (1) Ownership Country Asset Company 24 - Oct - 24 Piedmont Company Presentation - Offering Near - term Leverage to Lithium Prices 242 242 100.0% USA Carolina Piedmont Lithium 24 - Oct - 24 Piedmont Company Presentation - Offering Near - term Leverage to Lithium Prices 43 48 25.0% Canada NAL 20 - Feb - 24 Sayona ASX Announcement - Moblan Lithium projects definitive feasibility study positive results deliver C$2.2B NPV 180 180 60.0% Canada Moblan Sayona Mining 24 - Oct - 24 Piedmont Company Presentation - Offering Near - term Leverage to Lithium Prices 128 143 75.0% Canada NAL 19 - Sep - 24 Arcadium Lithium - Investor Day Presentation 108 118 50.0% Canada Whabouchi Rio Tinto (2) 19 - Sep - 24 Arcadium Lithium - Investor Day Presentation 289 310 100.0% Canada Galaxy (James Bay) 16 - Nov - 22 Georgia Lake Project: Pre - Feasibility Study published 100 100 100.0% Canada Georgia Lake RockTech Lithium 27 - Sep - 18 Separation Rapids PEA 58 81 40.0% Canada Seperation Rapids Avalon 31 - May - 23 Pre - Feasibilty Study for the PAK Project 141 141 92.5% Canada PAK Lithium Frontier Lithium 03 - Oct - 24 Critical Elements Investor Presentation - Lithium Charged High Purity Spodumene Project 147 158 100.0% Canada Rose Critical Elements 27 - Feb - 24 2024 JP Morgan Global High Yield & Leveraged Finance Conference Presentation 413 450 50.0% Australia Wodgina Albemarle 09 - Feb - 24 SEC Technical Report Summary Pre - Feasibility Study Greenbushes Mine Western Australia 772 772 49.0% Australia Greenbushes 15 - Feb - 24 Albemarle 2023 Form 10 - K 350 350 100.0% USA Kings Mountain 27 - Feb - 24 2024 JP Morgan Global High Yield & Leveraged Finance Conference Presentation 413 450 50.0% Australia Wodgina MinRes 27 - Feb - 24 2024 JP Morgan Global High Yield & Leveraged Finance Conference Presentation 300 450 50.0% Australia Mt Marion 27 - Feb - 24 2024 JP Morgan Global High Yield & Leveraged Finance Conference Presentation 138 150 100.0% Australia Bald Hill 21 - Jun - 24 Study Delivers 2MTPA Expansion Option - Highly Accretive 1,642 1,895 100.0% Australia Pilgangoora (3) Pilbara Minerals (2) 25 - Mar - 24 Investor Presentation - Future Facing Commodities Conference 433 528 100.0% Brazil Salinas 24 - Sep - 24 NI 43 - 101 Report - Grota do Cirilo Lithium Project 702 766 100.0% Brazil Grota do Cirilo Sigma 17 - Sep - 24 Scoping Study delivers a capital efficient solution for North American lithium production 259 282 100.0% Canada Adina Winsome Resources 22 - Aug - 24 PEA Highlights Shaakichiuwaanaan Project as a Potential North American Lithium Raw Materials Supply Base 569 621 100.0% Canada Shaakickiuwaanaan Patriot Battery Metals 1. Chemical Grade spodumene concentrate capacity only 2. Assumes completion of Rio Tinto’s acquisition of Arcadium and Pilbara Minerals’ acquisition of Latin Resources 3. Based on 10 - yr average production target per P2000 PFS 35

Important Information and Disclaimer Statements in this presentation are made only as of the date of this presentation unless otherwise stated, and the information in this presentation remains subject to change without notice. Presentation for the Purposes of Providing Information Only This presentation is not a prospectus, disclosure document or offering document under Australian law or under the law of any other jurisdiction. It is for informational purposes only. This document does not constitute and should not be construed as, an offer to sell or a solicitation of an offer or invitation to subscribe for, buy, or sell securities in the Company . Any material used in this presentation is only an overview and summary of certain data selected by the management of the Company. The presentation does not purport to contain all the information that a prospective investor may require in evaluating a possible investment in the Company, nor does it contain all the information which would be required in a disclosure document prepared in accordance with the requirements of the Corporations Act and should not be used in isolation as a basis to invest in the Company. Recipients of this presentation must make their own independent investigations, consideration and evaluation of the Company. The distribution of this presentation in other jurisdictions outside of Australia may also be restricted by law and any restrictions should be observed. To avoid doubt, this presentation is not for distribution or dissemination within the US and Canada. Any failure to comply with such restrictions may constitute a violation of applicable securities laws. Disclaimer No representation or warranty, express or implied, is made as to the fairness, accuracy, completeness or correctness of the information, opinions or conclusions contained in or derived from this presentation or any omission from this presentation or of any other written or oral information or opinions provided now or in the future to any person. To the maximum extent permitted by law, neither the Company nor any of its affiliates , related bodies corporate and their respective officers, directors, employees, advisors and agents, nor any other person, accepts any liability as to or in relation to the accuracy or completeness of the information, statements, opinions, or matters (express or implied) arising out of, contained in or derived from this presentation or any omission from this presentation or of any other written of oral information or opinions provided now or in the future to any person. Forward Looking Statements This presentation may contain certain forward - looking statements. Such statements are only predictions, based on certain assumptions and involve known and unknown risks, uncertainties and other factors, many of which are beyond Sayona Mining Limited’s control. Actual events or results may differ materially from the events or results expected or implied in any forward - looking statement. The inclusion of such statements should not be regarded as a representation, warranty or prediction with respect to the accuracy of the underlying assumptions or that any forward - looking statements will be or are likely to be fulfilled. Sayona Mining Limited undertakes no obligation to update any forward - looking statement or other statement to reflect events or circumstances after the date of this presentation (subject to securities exchange disclosure requirements). The information in this presentation does not take into account the objectives, financial situation or particular needs of any person. Nothing contained in this presentation constitutes investment, legal, tax or other advice. The Company confirms that it is not aware of any new information or data that materially affects the information included in the original market announcement and all material assumptions and technical parameters continue to apply and have not materially changed. The Company confirms that the form and context in which the Competent Person’s findings are presented have not been materially modified from the original market announcements. 36 Important Information and Disclaimer