VIA EDGAR SUBMISSION
Mr. John Coleman and Mr. Gus Rodriguez
Division of Corporation Finance
Office of Energy & Transportation
Securities and Exchange Commission
100 F Street NE
Washington, D.C. 20549
February 16, 2023
Re: Piedmont Lithium Inc.
Form 10-KT for the Six Months Ended December 31, 2021
Filed February 28, 2022
File No. 001-38427
Dear Mr. Coleman and Mr. Rodriguez,
Please find our response to the comments set forth in a letter dated February 10, 2023 (the “Letter”) from the staff (the “Staff”) of the Securities and Exchange Commission (the “Commission”) relating to the above-mentioned Transition Report on Form 10-KT for the six months ended December 31, 2021 (the “2021 10-KT”). References to the “Company,” “Piedmont,” “we,” “us” and “our” in this letter refer to Piedmont Lithium Inc., unless otherwise indicated.
Per our letter dated January 26, 2023, we are in the process of coordinating an amendment to the Technical Report Summary (“TRS”) that was originally filed as an exhibit to the 2021 10-KT (the “Existing TRS”). We expect that an amended TRS (the “Amended TRS”) will, similar to the Existing TRS, require the expertise of Qualified Persons from three engineering firms as technical advisors. It is our intention that the Amended TRS will be based substantially upon the assumptions included in the Existing TRS and will represent the status of our project as of the filing date of the Existing TRS. Our Form 10-K for the year ended December 31, 2022 (our “2022 10-K”) will contain the Amended TRS as an exhibit and address the comments provided by the Staff in its Letter. For your convenience, we have restated below in bold each comment from the Letter and supplied our responses immediately thereafter. Unless otherwise indicated, all references in this letter to “$” are to United States dollars.
Form 10-KT for the Fiscal Year Ending December 31, 2021 Filed February 28, 2022
Item 1. Business, page 5
| 1. | We note your response to prior comment 1, including summary language and a list of additional information that you will provide for the Carolina Lithium Project, as your only material property, along with proposed language for non-material properties. |
Please confirm your understanding that production projections should not be disclosed unless supported by a technical report summary, prepared in accordance with Subpart 1300 of Regulation S-K. Also revise to remove ounces of gold or associated estimates concerning neighboring properties in which you do not own a mineral interest.
Response 1:
We confirm our understanding that production projections should not be disclosed unless supported by a technical report summary, prepared in accordance with Subpart 1300 of Regulation S-K.
We further advise the Staff that the proposed summary language for our non-material properties as of December 31, 2022 will be revised to remove ounces of gold or associated estimates concerning neighboring properties in which we do not own a mineral interest.
Specifically, we propose modified draft text related to our non-material properties for our 2020 10-K substantially in the form of the following:
Equity Method Investment Projects
We hold an equity interest of approximately 14% in Sayona Mining. We own a 25% interest in Sayona Quebec, with Sayona Mining holding the remaining 75% ownership. Sayona Quebec owns the past-producing NAL project, the Authier Lithium project, and the Tansim Lithium project. Through our strategic partnership, Sayona Quebec is prioritizing the manufacturing of lithium products in Quebec and capitalizing on Quebec’s competitive advantages, which include access to skilled labor, strong infrastructure, governmental mining support and zero-carbon, low-cost hydropower.
Sayona Mining’s assets in Quebec include a 75% ownership in Sayona Quebec’s assets and a 100% interest in Northern Hub’s Moblan and Lac Albert projects. Sayona Mining also holds a 100% ownership in Western Australian assets including (i) Western Australia Lithium, (ii) Western Australia gold projects and (iii) Kimberley Graphite project.
We hold an equity interest of approximately 9% in Atlantic Lithium whose assets in Ghana are comprised of a 100% ownership in Atlantic Lithium Ghana’s Ewoyaa project. We have a strategic partnership with Atlantic Lithium whereby we have the ability to acquire an equity interest of 50% in Atlantic Lithium Ghana through future staged investments, as discussed below.
Sayona Mining
Quebec
Investment
As of December 31, 2022, our investments in Quebec totaled $65.1 million, net of acquisition costs, and consisted of $20.2 million in Sayona Mining and $44.9 million in Sayona Quebec. Through our investments, we hold equity interests of approximately 14% and 25% in Sayona Mining and Sayona Quebec, respectively. Sayona Mining holds the remaining 75% equity interest in Sayona Quebec.
2
During the year ended December 31, 2022, we made additional cash investments in Sayona Quebec totaling $19.6 million as part of our 25% equity interest contribution for cash expenditures incurred by Sayona Quebec related to exploration and evaluation activities and NAL for restart activities. During the year ended December 31, 2022, we paid $1.4 million to Sayona Mining to acquire additional shares as part of equity offerings by Sayona Mining.
Revenue and expenses of Sayona Quebec and Sayona Mining are not consolidated into our financial statements; rather, our proportionate share of the earnings or loss of each investee is reported as “Loss from equity method investments in unconsolidated affiliates” in our consolidated statements of operations.
Supply Agreement
We entered into a long-term supply agreement with Sayona Quebec in January 2021. Under the terms of the supply agreement, Sayona Quebec will supply Piedmont Lithium the greater of 113,000 metric tons per year or 50% of Sayona Quebec’s spodumene concentrate production from the combination of NAL and the Authier project. Under the agreement, spodumene concentrate is priced on a market price basis with a floor price of $500 per metric ton and a ceiling price of $900 per metric ton.
Properties
The information provided below was derived from information publicly disclosed by each such Investee company.
Sayona Quebec
We own a 25% interest in Sayona Quebec. Sayona Quebec’s assets are comprised of three projects: (i) NAL (development stage), (ii) the Authier project (development stage), and (iii) the Tansim project (exploration stage).
3

North American Lithium
NAL was acquired by Sayona Quebec in August 2021. NAL is comprised of 19 contiguous claims covering 1,438 acres and one mining lease covering approximately 1,729 acres. NAL is situated in La Corne township in Quebec’s Abitibi region. The project is located approximately 20 miles from the Authier project near Val-d’Or, a major mining city in Quebec.
NAL is a brownfield open pit mining operation with a concentrator and a carbonate plant. Prior to acquisition by Sayona Quebec, more than CAD $400 million was previously invested in the concentrator. NAL receives most of its power from hydroelectricity and is well serviced by provincial highways and an all-weather secondary road. Restart activity has commenced at NAL with the expectation of commencing spodumene concentrate production in the first half of 2023. NAL holds all of the material permits required to restart operations.
4
Authier
The Authier project is located approximately 28 miles northwest of the city of Val-d’Or. Val-d’Or is located approximately 290 miles northwest of the city of Montreal. The Authier project is easily accessible by a rural road network connecting to a national highway a few miles east of the project site. The project area comprises 19 mineral claims totaling 1,613 acres and directionally extends 1 mile east-west and 1 mile north-south. The mineral claims are located over Crown Lands (land owned by the Province of Quebec).

The deposit is hosted in a spodumene-bearing pegmatite intrusion. The deposit is 2,707 feet long, striking east-west, with an average thickness of 82 feet, minimum 13 feet and maximum 180 feet, dipping at 40 degrees to the north. The current pit optimization has the mineralization extending down to 656 feet depth but the deposit remains open in all directions.
The Authier project has been subject to more than 19 miles of drilling. Between 2010 and 2012 Glen Eagle, the previous tenement holder, completed over 19 miles of diamond drilling in 69 diamond drill holes (“DDH”) of which 5 miles were drilled on the Authier deposit; 1,998 feet (five DDH) were drilled on the northwest and 1,385 feet on the south-southwest of the property. Sayona Mining announced the completion of three phases of drilling totaling more than 6.5 miles in 81 DDH. All the holes completed by Sayona Mining have used standard DDH diameter size, using a standard tube and bit.
5
Sayona Quebec continues to engage closely concerning Authier’s development with all stakeholders, including holding information sessions and consultations with local municipalities, landowners, First Nations communities, nongovernmental organizations and other stakeholders.
Sayona Quebec progressed a revised Environmental Impact Study (“EIS”) in accordance with Québec’s regulatory requirements. The EIS is a rigorous scientific study containing all the necessary documentation to satisfy the necessary legal and regulatory requirements. The revised EIS was submitted to Québec’s Ministry of the Environment and the Fight against Climate Change (“MELCC”) in January 2020. The plan to process Authier ore at NAL may impact on the requirements for approvals under the Quebec Bureau d’Audiences Publiques Sur l’Environnement (“BAPE”) process. Regardless, Sayona Quebec will continue the development of the Authier project under strict guidelines to minimize impacts on the environment, including reducing wind and water erosion, promoting revegetation and optimizing water management practices.
Tansim
Sayona Quebec’s Tansim Lithium project is situated 51 miles south-west of the Authier Lithium project. Tansim comprises 355 mineral claims spanning 50,749 acres and is prospective for lithium, tantalum, and beryllium.
Mineralization is hosted within spodumene-bearing pegmatite intrusions striking east-west, dipping to the north, and hosted by metasedimentary – metavolcanic rocks of the Pontiac sub-province. The main prospects are Viau-Dallaire, Viau and Vezina. The potential quantity and grade of the exploration target is uncertain as there has been insufficient exploration to estimate a mineral resource and it is uncertain if further exploration will result in the estimation of a mineral resource.
Northern Hub
Northern Hub assets are owned by Sayona Mining, in which we have an equity interest of approximately 14% interest as noted above.
6
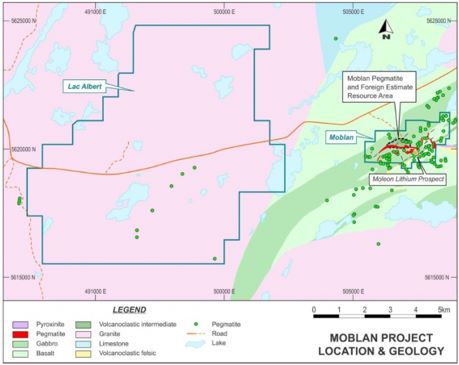
Moblan project
The Moblan Lithium project (“Moblan”) is owned by a joint venture with Sayona Mining owning 60% and SOQUEM Inc, a wholly owned subsidiary of Investissement Québec, owning 40%. Moblan is in the development stage, and is located in the Eeyou-Istchee James Bay region of northern Québec, a proven lithium mining province which hosts established, world-class lithium resources including Nemaska Lithium’s Whabouchi mine. The area is well serviced by key infrastructure and transport and has access to low-cost, environmentally friendly hydropower.
Moblan is host to high-grade spodumene mineralization in a well-studied proven deposit with more than 10 miles of diamond drilling. The project covers approximately 1,070 acres for a total of 20 claims. In January 2022, Sayona Mining announced the opportunity to expand the mineralization outside the existing proven resource envelope and the commencement of a major drilling program at the project in partnership with SOQUEM. In April 2022, Sayona Mining announced the discovery of a significant new southern lithium pegmatite zone, the Moblan South Discovery. The following month Sayona Mining announced the discovery of multiple new mineralized lithium pegmatites at Moblan South, South-East Extension, Moleon and extensions to the Main Moblan lithium deposit. As of October 2022, Sayona Mining had completed approximately 17 miles of drilling at the project.
7
In October 2022, Sayona Mining launched a pre-feasibility study (“PFS”) for Moblan, targeting the development of a lithium mine and concentrator. The PFS will be conducted by InnovExplo, a Quebec company, with a target completion date in May 2023, followed by a definitive feasibility study expected by September 2023.

Lac Albert project
In January 2022, Sayona Mining announced the acquisition of 121 new claims in the vicinity of Moblan known as the Lac Albert project (exploration stage). Located 1 mile west of the Moblan project and within the same proven lithium mining province, the new claims span 16,282 acres. These claims are separate to the current Moblan joint venture agreement.
Past work has been limited and the geology of the new claim area at Lac Albert is poorly understood. Glacial moraines obscure a significant portion of the area. In May 2022, a till and soil sampling program was undertaken at Lac Albert and mapping of outcrops and boulders was completed. The identified pegmatite occurrences are located in an area with favorable access and proximity to the Route Du Nord, an all-weather regional highway. The area of the new claims is displayed in the figure above.
8
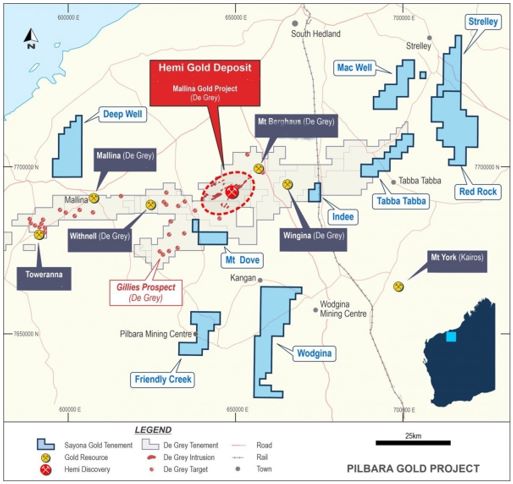
Western Australia Pilbara Lithium Projects
We have an equity interest of approximately 14% interest in Sayona Mining’s Western Australian properties via our equity stake in Sayona Mining as noted above.
Sayona Mining holds 100% economic interest in certain exploration phase properties in Western Australia. Sayona’s leases in Western Australia cover 264,895 acres and comprise lithium, gold and graphite tenure in the Pilbara, Yilgarn and East Kimberley regions. All of Sayona Mining’s Western Australia projects are in the exploration stage.
The Pilbara projects comprise 12 lithium leases totaling 230,548 acres in the Pilgangoora lithium district of Western Australia, with 10 of the tenements also having associated gold rights. These are proximal to the De Grey Mining’s Mallina Gold project, which includes the Hemi gold discovery.
Of the 12 Pilbara tenements with lithium rights, nine are subject to an earn‐in agreement, where Morella Corporation Limited, listed on the Australian stock exchange and previously known as Altura Mining, is carrying out exploration to earn an interest. The three remaining tenements are held within Sayona’s 100% owned lithium exploration portfolio.

9
Morella Lithium Earn-in
In 2021, Morella commenced an earn-in agreement with Sayona covering eight tenements including the Mallina, Tabba East and Strelley areas, all in the Pilgangoora lithium district, and two tenements in the South Murchison. Morella has to spend AUD $1.5 million on exploration within three years to earn a 51% interest.
Mallina Project E47/2983
The Mallina project is the most advanced of Sayona’s Pilbara portfolio. Multiple zones of spodumene pegmatites have been identified within a 6,178 acre zone. The pegmatites occur in three main swarms: the western Discovery prospect, the central Area C prospect and the Eastern Group pegmatites. Surface sampling has been encouraging, with rock results up to 4.6% Li2O returned from spodumene pegmatite at surface. Mapping has confirmed the pegmatites can be extensive, with the Eastern No. 2 pegmatite being over 4,265 feet in strike extent and up to 66 feet in thickness.
During Sayona’s fiscal 2022, Morella reported significant progress at the Mallina Lithium project with the completion of a targeted deep drilling program. In total, three RC holes for 1,411 feet and four diamond core holes (including two core tail extensions to RC drilling) were completed for 2,728 feet. Fine grained spodumene quartz intergrowths within aplite intrusive intervals were observed in the drill core. RC chips and drill core were logged on site and samples have been prepared for mineralogical studies and geochemical assay work to be completed at a Perth laboratory. Results are pending.
Mt Edon Lithium Project E59/2092
This project located in the South Murchison covers the southern portion of the Payne’s Find greenstone belt and hosts an extensive swarm of pegmatites. During Sayona’s fiscal 2022, Morella commenced exploration, mapping a total of 53 pegmatite outcrops. Rock chip assay results indicate the potential of the area for lithium mineralization.
Western Australia Gold Projects
Sayona’s Pilbara gold leases are prospective for intrusion related gold mineralization, similar in style to that identified at the Hemi gold discovery. This style of mineralization is hosted within altered late stage hi‐Mg diorites. Sayona’s tenement portfolio remains effectively untested for its gold potential with large areas masked by superficial cover.
10
Mt Dove Project E47/3950
The Mt Dove project is within 1.6 miles of De Grey’s greater Hemi project area, a 4.8 mile trend which includes Hemi and adjacent intrusions. During the year, airborne magnetic surveys and geological mapping was undertaken which identified magnetic features for drill testing.
Deep Well Project E47/3829
The Deep Well project covers an area of 29,405 acres to the west of Port Hedland. Interpretation of new high resolution geophysical data, covering the entire lease area, has identified 11 discrete magnetic anomalies. A 60-hole air-core drilling program, carried out in May, completed a total of 60 DDH for 5,502 feet. Drill samples have been submitted for gold, lithium and multi-element analysis. Results are pending. Drilling targeted magnetic features that display similarities to the Hemi style of intrusion-related gold mineralization. The T1, T2, T3, T7, T12a and T12b targets were tested. Planning for follow up RC drilling is underway.
11
Sayona Pilbara Lithium Exploration
Sayona holds the lithium rights at the Deep Well, Tabba Tabba and Red Rock tenements which cover a total of 82,533 acres.
Tabba Tabba Project E45/2364
The Tabba Tabba project is located north of the Pilgangoora lithium mining area, in a region of historic tin and tantalum mining. It comprises six tenements covering 145,297 acres, located 13 miles to the north of the Pilgangoora lithium mining area. The main Tabba Tabba tenement, E45/2364 (lithium rights only), is centered in an area of historic tin and tantalum mining. Spodumene pegmatite has been identified in adjacent tenure and the Tabba Tabba project provides exposure to the area’s emerging lithium prospectivity. Soil geochemistry and geological mapping has identified pegmatite and geochemical anomalies and planning for drill testing of these features in the 2022 season are advanced.
Red Rock Project, E45/4716
During Sayona’s fiscal 2022, a geological and regolith terrain mapping study was undertaken over the tenements area, identifying a north-east trading structural corridor extending from Pilgangoora in the south. As a first pass test for lithium and gold mineralization, a soil geochemical sampling program was completed over a 3 mile extent to this target zone. Once results are returned they will be assessed for potential targets for drill testing.
Kimberley Graphite Project
Past exploration by Sayona has identified graphite mineralization within an 8 mile strike extent of the Corkwood geochemical and geophysical anomaly. The target is structurally deformed, higher grade graphite portions of the stratigraphy with the potential to host coarse flake, high purity graphite mineralization.
Sayona is planning further drill testing of the mineralization to obtain samples for metallurgical and beneficiation testwork.
12

Atlantic Lithium
Investments
As of December 31, 2022, our investments in Atlantic Lithium totaled $16.0 million, net of acquisition costs.
On August 31, 2021, we entered into a long-term supply agreement for spodumene concentrate, whereby we have the ability to acquire a 50% equity interest in Atlantic Lithium Ghana, through future staged payments totaling approximately $87.0 million in two phases over a period of three to four years, as follows:
| • | Phase 1—We have the ability to acquire a 22.5% equity interest in Atlantic Lithium Ghana by, (1) funding approximately $17.0 million in the Ewoyaa project for exploration, evaluation and technical study expenses over 24 months and, (2) making the election to proceed with Phase 2 (described below). We have a cost sharing arrangement with Atlantic Lithium whereby Piedmont Lithium will pay 50% of the cost savings to Atlantic Lithium if the total costs of phase 1 are less than $17.0 million or Atlantic Lithium will pay 50% of the cost overrun to Piedmont Lithium if the total costs of phase 1 are more than $17.0 million. In the event we do not fully fund our required amount for phase 1, we will forfeit all cash advances paid to date. If we decide not to proceed with phase 2 upon completion of phase 1, we will lose all cash advances paid to date and our 22.5% equity interest in Atlantic Lithium Ghana. |
13
| • | Phase 2—We have ability to acquire an additional 27.5% in Atlantic Lithium Ghana by solely funding an additional $70.0 million in the Ewoyaa project for capital costs. |
As of December 31, 2022, cash payments to Atlantic Lithium for phase 1 of the Ewoyaa project totaled $17.0 million and are reported as “Non-current assets” in the consolidated balance sheets. (See Note 9—Other Assets).
Atlantic Lithium Ghana, which owns the Ewoyaa project, is owned and consolidated by Atlantic Lithium. Revenue and expenses of Atlantic Lithium are not consolidated into our financial statements; rather, our proportionate share of the earnings or loss of Atlantic Lithium is reported as “Loss from equity method investments in unconsolidated affiliates” in our consolidated statements of operations.
Supply Agreement
On July 1, 2021, we entered into a long-term supply agreement, subject to future staged investments, with Atlantic Lithium granting Piedmont Lithium the right to purchase 50% of Atlantic Lithium Ghana’s life-of-mine production of spodumene concentrate. Pricing for the offtake supply of spodumene concentrate will be at market rates at the time of purchase. Under the agreement, spodumene concentrate is priced on a CIF, China market price basis less ocean freight and insurance on a net back basis to free on board vessel (Incoterms 2020) at the Port of Takoradi, Ghana.
Properties
Ewoyaa Project
The Ewoyaa project is an exploration stage project for the mining, development and production of spodumene concentrate located on the south coast of Ghana and covering an area of approximately 348 square miles. As noted above, we have the ability to acquire an equity interest of 50% in the Ewoyaa project via Atlantic Lithium Ghana through future staged investments.
The Ewoyaa lithium project includes the Ewoyaa, Abonko and Kaampakrom deposits and is located in Ghana, West Africa, approximately 32 miles southwest of the capital of Accra. The project area is immediately north of Saltpond, in the Central Region, and falls within the Mfantseman Municipality where Saltpond is the district capital (Figure [X] Below).
Access to the site from Accra is along the asphalt N1 Accra-Cape Coast-Takoradi highway which runs along the southern coastal boundary of the project. Several laterite roads extend northwards from the highway and link communities in the project area. The deep-sea port of Takoradi. The Ewoyaa is within 35 miles west of the site, and accessible via the same highway (Figure X Below).
14

Figure X: Ewoyaa Project location and tenure, showing proximity to Takoradi Port, highway and grid power
The topography of the project varies with steep hills surrounding low-lying valleys throughout the proposed mining area. The terrain of the project area rises sharply from a narrow coastal plane to an undulating peneplane where elevation ranges from 66 feet to 394 feet above mean sea level.
Ghana is a republic within the Commonwealth. Ghana gained independence from colonial Britain in 1957, being the first sub-Saharan African country in colonial Africa to do so. Despite some turbulent history in the first decades following independence, Ghana has emerged since the 1990s as a stable, multi-party democracy.
15

Figure X: High voltage power transmission lines, bitumen highway and deep-sea Takoradi port close to project site.
The Ewoyaa project covers two contiguous exploration licenses, The Mankessim (RL 3/55) and Mankessim South (RL PL3/109) licenses. The Mankessim is a joint-venture, with the license in the name of the joint-venture party (Barari DV Ghana); document number 0853652-18. The Mineral Prospecting license was renewed on July 27, 2021 for a further three year period valid through July 27, 2024. Mankessim South is a wholly-owned subsidiary of Green Metals Resources. A Mineral Prospecting license was renewed on February 19, 2020 for a further three year period through February 18, 2023. The tenement is in good standing with no known impediments. The Ewoyaa project is the subject of a Mining License application submitted to the Minerals Commission of Ghana and announced by Atlantic Lithium on October 13, 2022.
| 2. | We note that you submitted tables to be utilized in reporting summary mineral resources and mineral reserves in response to prior comment 3, although Note 3 to the first table indicates that mineral resources would be reported inclusive of the mineral reserves. |
Please revise the proposed format along with any intended future disclosures as necessary to report all estimates of mineral resources exclusive of mineral reserves to comply with Item 1304(d)(2) of Regulation S-K, notwithstanding any election by the qualified persons to include such aggregated quantities in the technical report summary.
Response 2:
We advise the Staff that the proposed format of the summary mineral resources and mineral reserves tables will be revised along with any intended future disclosures as necessary to report all estimates of mineral resources exclusive of mineral reserves to comply with Item 1304(d)(2) of Regulation S-K.
16
Specifically, we plan to present the summary mineral resources exclusive of mineral reserves in our upcoming 2022 10-K in tables based upon the formats shown below:
Summary of Lithium Mineral Resources Exclusive of Reserves as of October 20, 2021 Based on US$1,893 /t SC6
Tonnes (Mt) | Grade (Li2O%) | Li2O (t) | LCE (t) | LiOH•H2O (t) | Cut-Off Grade (%Li2O) 1 | Metallurgical Recovery | |
| Indicated | 10.0 | 1.14 | 112,140 | 774,000 | 315,000 | 0.4 | 77.1%2 |
| Inferred | 15.9 | 1.02 | 162,000 | 401,000 | 455,000 | ||
Total3 | 25.9 | 1.06 | 274,000 | 678,000 | 770,000 | ||
Note 1 – Based on long-term pricing of US$ 1,893/t SC6, Average By-Product Pricing of US$ 79.50/t. Byproduct mineral resources are estimated only from the spodumene bearing pegmatites which comprise the Mineral Resource Estimate. Note 2 – Metallurgical recovery from spodumene concentration Note 3 – Tabulated Mineral Resources for the Project are exclusive of the Mineral Reserves estimated for the Core Property. Some figures may not add up due to rounding. | |||||||
Summary of Lithium, Quartz, Feldspar, and Mica Mineral Resources Exclusive of Reserves as of October 20, 2021
Li2O | Quartz | Feldspar | Mica | |||||||
Cut-Off Grade (Li2O %)1 | 0.4 | 0.4 | 0.4 | 0.4 | ||||||
| Metallurgical Recovery (%) | 77.12 | 50.8 | 51.1 | 35.5 | ||||||
| Category | Deposit | Tonnes (Mt) | Grade (%) | Tonnes (Mt) | Grade (%) | Tonnes (Mt) | Grade (%) | Tonnes (Mt) | Grade (%) | Tonnes (Mt) |
| Indicated | Core3 | 7.49 | 1.08 | 0.081 | 29.63 | 2.22 | 46.23 | 3.46 | 4.19 | 0.31 |
Central4 | 2.47 | 1.30 | 0.031 | 28.79 | 0.71 | 45.16 | 1.12 | 3.24 | 0.08 | |
Huffstetler4 | 0.00 | 0.00 | 0.000 | 0.00 | 0.00 | 0.00 | 0.00 | 0.00 | 0.00 | |
| Total | 9.96 | 1.14 | 0.112 | 29.42 | 2.93 | 45.96 | 4.58 | 3.96 | 0.39 | |
| Inferred | Core | 10.93 | 1.02 | 0.111 | 29.13 | 3.18 | 45.52 | 4.97 | 4.18 | 0.46 |
| Central | 2.69 | 1.10 | 0.030 | 29.99 | 0.81 | 43.88 | 1.18 | 4.08 | 0.11 | |
| Huffstetler | 2.31 | 0.91 | 0.021 | 28.82 | 0.67 | 48.60 | 1.12 | 3.24 | 0.08 | |
| Total | 15.93 | 1.02 | 0.162 | 29.22 | 4.66 | 45.67 | 7.28 | 4.03 | 0.64 | |
Total5 | 25.89 | 1.06 | 0.274 | 29.32 | 7.59 | 45.81 | 11.86 | 3.98 | 1.03 | |
Note 1 – Based on long-term pricing of US$ 1,893/t SC6, Average By-Product Pricing of US$ 79.50/t. Byproduct mineral resources are estimated only from the spodumene bearing pegmatites which comprise the Mineral Resource Estimate. Note 2 – Metallurgical recovery from spodumene concentration Note 3 – Tabulated Mineral Resources for the Core Property are exclusive of the Mineral Reserves estimated for the Core Property. Note 4 – Reserves have not been estimated for the Central and Huffstetler Properties. Tabulated Mineral resources for these Properties are exclusive of Mineral Reserves. Note 5 – Tabulated Mineral Resources for the Project are exclusive of the Mineral Reserves estimated for the Core Property. Some figures may not add up due to rounding. | ||||||||||
17
Additionally we will include the tables above in our Amended TRS showing the estimated mineral resources exclusive of mineral reserves, and our Qualified Person has elected to also illustrate the mineral resources inclusive of mineral reserves within the Amended TRS.
Item 15. Exhibits.
Exhibit 96.1, page 49
| 3. | We note your response to prior comment 5, regarding content of the technical report summary, and have the following additional points that you should address in consultation with the qualified persons involved in preparing that report. Please ensure that the technical report summary conforms to the following guidance: |
| • | Although the qualified person may elect to include estimates of mineral resources inclusive of mineral reserves, the technical report summary must also include estimates of mineral resources exclusive of mineral reserves to comply with Item 601(b)(96)(iii)(B)(11)(ii) of Regulation S-K. |
Response 3:
As noted above in Response 2, we advise the Staff that the Amended TRS will include estimates of mineral resources exclusive of mineral reserves to comply with Item 601(b)(96)(iii)(B)(11)(ii) of Regulation S-K.
| • | The table of discounted cash flows submitted with your response should be modified to include a column for cumulative amounts and footnotes with the equations used to convert production of the mineral reserves into each of the products listed in the table, such as spodumene concentrate and lithium hydroxide, along with explanations of how those formulas were established and found to be reasonable. |
Response
We advise the Staff that the table of discounted cash flows submitted with our prior response has been amended to include a column for cumulative amounts and footnotes with the equations used to convert production of the mineral reserves into each of the products listed in the table, such as spodumene concentrate and lithium hydroxide, along with explanations of how those formulas were established and found to be reasonable, as shown on the following page:
18
| Financial Model (yearly) | Year | Total | -2 | -1 | 1 | 2 | 3 | 4 | 5 | 6 | 7 | 8 | 9 | 10 | 11 | 12 | 13 | 14 | |||||||||||||||||||||||||||||||||||||||||||||||||||
| Production - Mining | Units | ||||||||||||||||||||||||||||||||||||||||||||||||||||||||||||||||||||
| Total Material Moved | Mt | $ | 252.50 | - | - | 12.7 | 28.5 | 25.4 | 24.3 | 24.5 | 13.9 | 27.7 | 29.0 | 23.4 | 22.3 | 18.8 | 2.0 | - | - | ||||||||||||||||||||||||||||||||||||||||||||||||||
| Total Ore | Mt | $ | 20.10 | - | - | 1.0 | 1.9 | 1.9 | 1.9 | 1.9 | 1.9 | 1.9 | 1.9 | 1.9 | 1.9 | 1.9 | 0.1 | - | - | ||||||||||||||||||||||||||||||||||||||||||||||||||
| Production - Process Plant | |||||||||||||||||||||||||||||||||||||||||||||||||||||||||||||||||||||
| Spodumene | kt | 2,555 | - | - | 120 | 256 | 234 | 225 | 252 | 250 | 225 | 233 | 236 | 251 | 255 | 18 | - | - | |||||||||||||||||||||||||||||||||||||||||||||||||||
| Mica | kt | 298 | - | - | 15 | 29 | 28 | 28 | 28 | 28 | 28 | 28 | 28 | 28 | 28 | 2 | - | - | |||||||||||||||||||||||||||||||||||||||||||||||||||
| Feldspar | kt | 4,170 | - | - | 217 | 392 | 392 | 392 | 392 | 392 | 392 | 392 | 392 | 392 | 392 | 33 | - | - | |||||||||||||||||||||||||||||||||||||||||||||||||||
| Quartz | kt | 2,681 | - | - | 140 | 252 | 252 | 252 | 252 | 252 | 252 | 252 | 252 | 252 | 252 | 21 | - | - | |||||||||||||||||||||||||||||||||||||||||||||||||||
LiOH•H2O Production | kt | 374 | - | - | 2.0 | 26.5 | 30.0 | 30.0 | 30.0 | 30.0 | 30.0 | 30.0 | 30.0 | 30.0 | 30.0 | 30.0 | 30.0 | 15.0 | |||||||||||||||||||||||||||||||||||||||||||||||||||
| Gross Revenue | |||||||||||||||||||||||||||||||||||||||||||||||||||||||||||||||||||||
| Spodumene | US$mm | - | - | - | - | - | - | - | - | - | - | - | - | - | - | - | - | - | |||||||||||||||||||||||||||||||||||||||||||||||||||
| Mica | US$mm | $ | 31.1 | - | - | $ | 1.5 | $ | 3.0 | $ | 2.9 | $ | 2.9 | $ | 2.9 | $ | 2.9 | $ | 2.9 | $ | 2.9 | $ | 2.9 | $ | 2.9 | $ | 2.9 | $ | 0.2 | - | - | ||||||||||||||||||||||||||||||||||||||
| Feldspar | US$mm | $ | 225.2 | - | - | $ | 11.7 | $ | 21.2 | $ | 21.2 | $ | 21.2 | $ | 21.2 | $ | 21.2 | $ | 21.2 | $ | 21.2 | $ | 21.2 | $ | 21.2 | $ | 21.2 | $ | 1.8 | - | - | ||||||||||||||||||||||||||||||||||||||
| Quartz | US$mm | $ | 241.3 | - | - | $ | 12.6 | $ | 22.7 | $ | 22.7 | $ | 22.7 | $ | 22.7 | $ | 22.7 | $ | 22.7 | $ | 22.7 | $ | 22.7 | $ | 22.7 | $ | 22.7 | $ | 1.9 | - | - | ||||||||||||||||||||||||||||||||||||||
LiOH•H2O Battery Grade | US$mm | $ | 6,722.3 | - | - | $ | 35.8 | $ | 476.6 | $ | 540.0 | $ | 540.0 | $ | 540.0 | $ | 540.0 | $ | 540.0 | $ | 540.0 | $ | 540.0 | $ | 540.0 | $ | 540.0 | $ | 540.0 | $ | 540.0 | $ | 270.0 | ||||||||||||||||||||||||||||||||||||
LiOH•H2O Technical Grade | US$mm | - | - | - | - | - | - | - | - | - | - | - | - | - | - | - | - | - | |||||||||||||||||||||||||||||||||||||||||||||||||||
| Gross Revenue | US$mm | $ | 7,219.9 | - | - | $ | 61.6 | $ | 523.5 | $ | 586.8 | $ | 586.8 | $ | 586.8 | $ | 586.8 | $ | 586.8 | $ | 586.8 | $ | 586.8 | $ | 586.8 | $ | 586.8 | $ | 543.9 | $ | 540.0 | $ | 270.0 | ||||||||||||||||||||||||||||||||||||
| Capital Expenditure | Units | ||||||||||||||||||||||||||||||||||||||||||||||||||||||||||||||||||||
| Total CAPEX | US$mm | $ | 987.5 | $ | 294.2 | $ | 623.2 | $ | 70.1 | - | - | - | - | - | - | - | - | - | - | - | - | - | |||||||||||||||||||||||||||||||||||||||||||||||
| Operating Expenditure | Units | ||||||||||||||||||||||||||||||||||||||||||||||||||||||||||||||||||||
| Total OPEX | US$mm | $ | 1,799.2 | - | $ | 2.0 | $ | 82.7 | $ | 172.1 | $ | 161.2 | $ | 160.8 | $ | 160.3 | $ | 130.3 | $ | 166.7 | $ | 170.1 | $ | 155.5 | $ | 152.4 | $ | 143.2 | $ | 61.8 | $ | 53.3 | $ | 26.7 | |||||||||||||||||||||||||||||||||||
| Royalties | US$mm | $ | 20.09 | - | - | $ | 1.0 | $ | 1.9 | $ | 1.9 | $ | 1.9 | $ | 1.9 | $ | 1.9 | $ | 1.9 | $ | 1.9 | $ | 1.9 | $ | 1.9 | $ | 1.9 | $ | 0.1 | - | - | ||||||||||||||||||||||||||||||||||||||
| Head Office Allocation | US$mm | $ | 108.00 | - | - | $ | 8.0 | $ | 8.0 | $ | 8.0 | $ | 8.0 | $ | 8.0 | $ | 8.0 | $ | 8.0 | $ | 8.0 | $ | 8.0 | $ | 8.0 | $ | 8.0 | $ | 8.0 | $ | 8.0 | $ | 4.0 | ||||||||||||||||||||||||||||||||||||
| Mine Closure Costs | US$mm | $ | 18.76 | - | - | - | - | - | - | - | - | - | - | - | - | - | $ | 17.2 | $ | 1.6 | - | ||||||||||||||||||||||||||||||||||||||||||||||||
| Sustaining Capital | |||||||||||||||||||||||||||||||||||||||||||||||||||||||||||||||||||||
| Total Sustaining Capital | US$mm | $ | 258.78 | - | - | $ | 23.6 | $ | 43.8 | $ | 25.5 | $ | 14.6 | $ | 19.8 | $ | 42.5 | $ | 17.8 | $ | 17.4 | $ | 21.6 | $ | 13.4 | $ | 12.5 | - | $ | 6.3 | - | ||||||||||||||||||||||||||||||||||||||
| Depletion, Depreciation, and Tax | |||||||||||||||||||||||||||||||||||||||||||||||||||||||||||||||||||||
| EBITDA | US$mm | $ | 5,273.8 | - | $ | -2.0 | $ | -30.1 | $ | 341.5 | $ | 415.6 | $ | 416.0 | $ | 416.6 | $ | 446.5 | $ | 410.2 | $ | 406.7 | $ | 421.4 | $ | 424.5 | $ | 433.7 | $ | 456.7 | $ | 477.1 | $ | 239.3 | |||||||||||||||||||||||||||||||||||
| Depreciation Allowance | US$mm | $ | 1,231.2 | - | - | $ | 699.8 | $ | 120.4 | $ | 84.7 | $ | 59.2 | $ | 46.9 | $ | 42.8 | $ | 39.4 | $ | 32.3 | $ | 28.0 | $ | 24.4 | $ | 20.6 | $ | 29.5 | $ | 2.6 | $ | 0.6 | ||||||||||||||||||||||||||||||||||||
| Depletion | US$mm | $ | 578.3 | - | - | $ | 27.4 | $ | 57.5 | $ | 53.2 | $ | 51.4 | $ | 56.6 | $ | 56.3 | $ | 51.3 | $ | 53.0 | $ | 53.4 | $ | 56.6 | $ | 57.2 | $ | 4.2 | - | - | ||||||||||||||||||||||||||||||||||||||
| Interest Expense | US$mm | - | - | - | - | - | - | - | - | - | - | - | - | - | - | - | - | - | |||||||||||||||||||||||||||||||||||||||||||||||||||
| Taxable Income | US$mm | $ | 3,464.4 | - | $ | -2.0 | $ | -757.2 | $ | 163.6 | $ | 277.8 | $ | 305.4 | $ | 313.1 | $ | 347.4 | $ | 319.5 | $ | 321.4 | $ | 340.0 | $ | 343.5 | $ | 355.8 | $ | 423.0 | $ | 474.5 | $ | 238.7 | |||||||||||||||||||||||||||||||||||
| Tax | US$mm | $ | 729.9 | - | - | - | - | - | - | $ | 65.5 | $ | 73.0 | $ | 67.1 | $ | 67.5 | $ | 71.4 | $ | 72.1 | $ | 74.7 | $ | 88.8 | $ | 99.6 | $ | 50.1 | ||||||||||||||||||||||||||||||||||||||||
| Net Profit After Tax | US$mm | $ | 3,312.8 | - | $ | -2.0 | $ | -729.8 | $ | 221.1 | $ | 331.0 | $ | 356.8 | $ | 304.2 | $ | 330.8 | $ | 303.7 | $ | 306.9 | $ | 322.0 | $ | 327.9 | $ | 338.3 | $ | 338.4 | $ | 374.9 | $ | 188.6 | |||||||||||||||||||||||||||||||||||
19
Recovery Calculations
The mineral reserves have been converted to lithium hydroxide in the production schedule and cash flow forecast using the following formulas and assumptions:
Spodumene Concentrator
Lithium production in the concentrate as spodumene concentrate (SC6) has been based on the head grades recovery curves determined by the variability test work programs, and ramp-up rates determined by prior project experience.
Ramp-up
Li Yield = 2E-06[T]^5 - 0.0001[T]^4 + 0.004[T]^3 - 0.0521[T]^2 + 0.3565[T] - 0.1439, [T]=time in month
The yield aligns with McNulty ramp-up rates for a Series 1. Primero, in consultation with the Qualified Person, has confidence this will be achievable in the concentrator.
Lithium recovery during production
Li yield% = 24.71*0.0122*100+52.39/100 when LiHG>0.0122, and LiHG = Li head grade (%)/100
Li yield% = 24.71*LiHG*100+52.39/100 when LiHG<0.0122 and LiHG = Li head grade (%)/100
The recovery over the varying feed grades (lithium recoverable) aligns within ranges Primero has seen in other lithium concentrator operations.
Lithium Hydroxide Converter
Conversion is based on a fixed recovery (91%), but with Yield being significantly reduced to account for throughput, reprocessing.
Ramp-up
Li Yield = 0.0001[T]3 - 0.0082[T]2 + 0.1676[T] - 0.1767, T = time in months
20
This is a rate that the technology provider (MO) has provided. Primero has not independently validated this assumption to confirm this ramp rate.
| • | The economic analysis provided in Section 19 must include annual cash flow forecasts based on an annual production schedule for the life of the mining project to comply with Item 601(b)(96)(iii)(B)(19) of Regulation S-K. |
Response
We advise the Staff that the Amended TRS will contain information required by Item 601(b)(96)(iii)(B)(19) including annual cash flow forecasts based on an annual production schedule solely based on the life of the mining project, excluding the purchase of spodumene concentrate from third parties to extend the chemical plant life, as well as excluding sales of spodumene concentrate to third parties.
Specifically, we plan to replace Section 19 (Economic Model and Sensitivity Analysis) in the Amended TRS with a version substantially in the form of the below paragraphs:
ECONOMIC MODEL
A detailed financial model and discounted monthly cash flow (DCF) has been developed to complete the economic assessment of the project and is based on current (Q4 2021) price projections and cost estimates in U.S. dollars. No provision was made for the effects of inflation, but cost estimates incorporate recent inflationary price increases. The evaluation was carried out on a 100%-equity basis using an 8% discount factor. Current US federal and North Carolina state tax regulations were applied to assess the corporate tax liabilities.
The key project production values are presented in Table 19-1 below.
Table 19-1 Project Economics Summary
| Base Case Financial Results | Unit of Measure | Value |
| Pre-Tax NPV @ 8% | $mm | 1,564 |
| After-Tax NPV @ 8% | $mm | 1,247 |
| Pre-Tax IRR | % | 25.5 |
| After-Tax IRR | % | 23.4 |
| Pre-Tax Payback Period | Years | 5.99 |
| After-Tax Payback Period | Years | 4.00 |
The main project economic indicators are presented in Table 19-2. The economic study shows a net profit after tax (NPAT) of $3,312 million (“mm”). The net present value of the 14-year based project is $1,247 mm at an 8% discount rate and after applicable taxes. The after-tax internal rate of return (IRR) is 23.4%.
21
Table 19-2 Project Cash Flow and Profitability Summary
| Income Statement | Life of Project |
| $ million | |
| Gross revenues (LiOH, SC6 and by-products) | 7,220 |
| Net revenues after royalties | 7,200 |
| Operating cost cash flow | (1,799) |
| Head office allocation | (108) |
| EBITDA | 5,273 |
| Capital expenditure (pre-production) | (988) |
| Sustaining and deferred capital | (278) |
| Gross profit before tax (EBT) | 4,042 |
| Tax | (730) |
| Net Profit After Tax (NPAT) | 3,312 |
SENSITIVITY ANALYSIS
The major financial assumptions used in the base case are given in Table 19-3. The project forecasts are based on a sale price for the 6 % Li2O Spodumene Concentrate product of $900/t and Battery Grade Lithium Hydroxide product of $18,000/t. Various Sales forecasts (Table 19-3) were examined to decide the final sale prices utilized in the base case and the rates chosen represent a 42% and 61% discount to the currents spot prices (December 2021) of Lithium Hydroxide and Spodumene Concentrate respectively. Details on the derivation of this price forecast are given in section 19.3 below. The sensitivity analysis examines a range of prices 30% above and below this base case forecast.
Table 19-3 – LiOH Price Forecasts
| Price Forecasts for Battery Grade LiOH US$/t | 2022 | 2023 | 2024 | 2025 |
| Benchmark Minerals | 20,600 | 26,200 | 25,200 | 20,900 |
| J.P. Morgan | 26,625 | 22,500 | 19,737 | 18,420 |
| Macquarie | 21,275 | 20,415 | 18,545 | 17,540 |
The base case was carried out on a 100 % equity basis regardless of how the project will be financed. A discount factor of 8 % was chosen as a reflection of the cost of equity and this is the most widely used discount factor for comparative project analysis.
22
The tax rates utilized in the financial model are based on current federal and state tax laws. The current federal tax rate is 21 % and the current North Carolina Tax rate is 2.5 % but it reduces to 0 % between 2024-2028. A depletion allowance for tax purposes is applied across the Spodumene, Quartz, Feldspar and Mica sales with an amount of 22 % applied to Spodumene and Mica and 14% applied to Feldspar and Quartz.
There has been an allowance for a bonus depreciation deduction based on the bonus depreciation allowance in the Tax Cuts and Jobs Act of 2017, which is 100 % in 2022 and reduces to 0 % by 2027. Depreciation in the concentrate operations is based on Asset Class 10.0 - Mining in IRS Table B-1 using the general depreciation system (“GDS”) over 7 years with the double declining balance method. Depreciation in the chemical plant is based on Asset Class 28.0 – Mfg. of Chemical and Allied Products in Table B-1 using GDS of 5 years with the double declining balance method.
There is an allowance of $1.00 per ROM ore tonne for royalties based on Piedmont’s direction based on the average land option agreement. No other government royalty payments are expected at this time.
Table 19-4 – Financial Assumptions
| Item | Unit of Measure | Value |
| Lithium Hydroxide Sale Price | $/t | 18,000 |
| Discount Factor | % | 8 |
| Applicable Tax Rate | % | 22.98-21.00 |
| Mica Sale Price | $/t | 104 |
| Feldspar Sale Price | $/t | 54 |
| Quartz Sale Price | $/t | 90 |
| Royalties | $/t | 1 |
| Spodumene Depletion | % | 22 |
| Mica Depletion | % | 22 |
| Feldspar Depletion | % | 14 |
| Quartz Depletion | % | 14 |
| Mine / Concentrator Depreciation | 7 Year Double Declining Method | |
| Conversion Plant Depreciation | 5 Year Double Declining Method |
TECHNICAL ASSUMPTIONS
The main technical assumptions in the model are outlined in table 19-5 below.
23
The total mine life in the model is 11 years and 1 month with the first 5 years of the mine plan scheduled quarterly before reverting to annually for the remaining 6 years. The concentrator commences operations at the same time as mining commences and has a ramp up period of 8 months before it reaches nameplate production. The Chemical Plant commences 3 months after mining operations commence with a ramp up period of 12 months before reaching nameplate production. The chemical plant is assumed to have a life of 14 years until the mineral reserves are depleted and any stockpile of spodumene concentrate is consumed.
Table 19-5 – Project Production Summary
| Production Summary | Value | Units |
| Mill feed mined | 20.1 | Mt |
| Waste mined | 232.5 | Mt |
| Total material mined | 252.6 | Mt |
| Mine life | 11.1 | years |
| Chemical plant life | 14 | years |
| Average strip ratio (waste:ore) | 11.6 | (w:o) |
| Spodumene Concentrate Produced | 2.56 | Mt |
| Quartz Production | 2.7 | Mt |
| Feldspar Production | 4.2 | Mt |
| Mica Production | 0.3 | Mt |
| LOM Average Li2O grade (diluted) | 1.00 | % Li2O |
| Average Li2O recovery | 77 | % |
| LOM average annual ore production | 1.81 | Mtpa |
| Spodumene Purchases | 0 | Mt |
LiOH:H2O Recovery | 91 | % |
| Lithium Hydroxide (LiOH) Total Production | 388 | kt |
FINANCIAL MODEL AND CASHFLOW
Real project yearly and cumulative cashflows can be seen in Figure 19-6. Total after tax cash generated by project at the end of project life of $3,313mm and the after-tax payback period including construction phase equates to 5.99 years.
24
| Financial Model (yearly) | Year | Total | -2 | -1 | 1 | 2 | 3 | 4 | 5 | 6 | 7 | 8 | 9 | 10 | 11 | 12 | 13 | 14 | |||||||||||||||||||||||||||||||||||||||||||||||||||
| Production - Mining | Units | ||||||||||||||||||||||||||||||||||||||||||||||||||||||||||||||||||||
| Total Material Moved | Mt | $ | 252.50 | - | - | 12.7 | 28.5 | 25.4 | 24.3 | 24.5 | 13.9 | 27.7 | 29.0 | 23.4 | 22.3 | 18.8 | 2.0 | - | - | ||||||||||||||||||||||||||||||||||||||||||||||||||
| Total Ore | Mt | $ | 20.10 | - | - | 1.0 | 1.9 | 1.9 | 1.9 | 1.9 | 1.9 | 1.9 | 1.9 | 1.9 | 1.9 | 1.9 | 0.1 | - | - | ||||||||||||||||||||||||||||||||||||||||||||||||||
| Production - Process Plant | |||||||||||||||||||||||||||||||||||||||||||||||||||||||||||||||||||||
| Spodumene | kt | 2,555 | - | - | 120 | 256 | 234 | 225 | 252 | 250 | 225 | 233 | 236 | 251 | 255 | 18 | - | - | |||||||||||||||||||||||||||||||||||||||||||||||||||
| Mica | kt | 298 | - | - | 15 | 29 | 28 | 28 | 28 | 28 | 28 | 28 | 28 | 28 | 28 | 2 | - | - | |||||||||||||||||||||||||||||||||||||||||||||||||||
| Feldspar | kt | 4,170 | - | - | 217 | 392 | 392 | 392 | 392 | 392 | 392 | 392 | 392 | 392 | 392 | 33 | - | - | |||||||||||||||||||||||||||||||||||||||||||||||||||
| Quartz | kt | 2,681 | - | - | 140 | 252 | 252 | 252 | 252 | 252 | 252 | 252 | 252 | 252 | 252 | 21 | - | - | |||||||||||||||||||||||||||||||||||||||||||||||||||
LiOH•H2O Production | kt | 374 | - | - | 2.0 | 26.5 | 30.0 | 30.0 | 30.0 | 30.0 | 30.0 | 30.0 | 30.0 | 30.0 | 30.0 | 30.0 | 30.0 | 15.0 | |||||||||||||||||||||||||||||||||||||||||||||||||||
| Gross Revenue | |||||||||||||||||||||||||||||||||||||||||||||||||||||||||||||||||||||
| Spodumene | US$mm | - | - | - | - | - | - | - | - | - | - | - | - | - | - | - | - | - | |||||||||||||||||||||||||||||||||||||||||||||||||||
| Mica | US$mm | $ | 31.1 | - | - | $ | 1.5 | $ | 3.0 | $ | 2.9 | $ | 2.9 | $ | 2.9 | $ | 2.9 | $ | 2.9 | $ | 2.9 | $ | 2.9 | $ | 2.9 | $ | 2.9 | $ | 0.2 | - | - | ||||||||||||||||||||||||||||||||||||||
| Feldspar | US$mm | $ | 225.2 | - | - | $ | 11.7 | $ | 21.2 | $ | 21.2 | $ | 21.2 | $ | 21.2 | $ | 21.2 | $ | 21.2 | $ | 21.2 | $ | 21.2 | $ | 21.2 | $ | 21.2 | $ | 1.8 | - | - | ||||||||||||||||||||||||||||||||||||||
| Quartz | US$mm | $ | 241.3 | - | - | $ | 12.6 | $ | 22.7 | $ | 22.7 | $ | 22.7 | $ | 22.7 | $ | 22.7 | $ | 22.7 | $ | 22.7 | $ | 22.7 | $ | 22.7 | $ | 22.7 | $ | 1.9 | - | - | ||||||||||||||||||||||||||||||||||||||
LiOH•H2O Battery Grade | US$mm | $ | 6,722.3 | - | - | $ | 35.8 | $ | 476.6 | $ | 540.0 | $ | 540.0 | $ | 540.0 | $ | 540.0 | $ | 540.0 | $ | 540.0 | $ | 540.0 | $ | 540.0 | $ | 540.0 | $ | 540.0 | $ | 540.0 | $ | 270.0 | ||||||||||||||||||||||||||||||||||||
LiOH•H2O Technical Grade | US$mm | - | - | - | - | - | - | - | - | - | - | - | - | - | - | - | - | - | |||||||||||||||||||||||||||||||||||||||||||||||||||
| Gross Revenue | US$mm | $ | 7,219.9 | - | - | $ | 61.6 | $ | 523.5 | $ | 586.8 | $ | 586.8 | $ | 586.8 | $ | 586.8 | $ | 586.8 | $ | 586.8 | $ | 586.8 | $ | 586.8 | $ | 586.8 | $ | 543.9 | $ | 540.0 | $ | 270.0 | ||||||||||||||||||||||||||||||||||||
| Capital Expenditure | Units | ||||||||||||||||||||||||||||||||||||||||||||||||||||||||||||||||||||
| Total CAPEX | US$mm | $ | 987.5 | $ | 294.2 | $ | 623.2 | $ | 70.1 | - | - | - | - | - | - | - | - | - | - | - | - | - | |||||||||||||||||||||||||||||||||||||||||||||||
| Operating Expenditure | Units | ||||||||||||||||||||||||||||||||||||||||||||||||||||||||||||||||||||
| Total OPEX | US$mm | $ | 1,799.2 | - | $ | 2.0 | $ | 82.7 | $ | 172.1 | $ | 161.2 | $ | 160.8 | $ | 160.3 | $ | 130.3 | $ | 166.7 | $ | 170.1 | $ | 155.5 | $ | 152.4 | $ | 143.2 | $ | 61.8 | $ | 53.3 | $ | 26.7 | |||||||||||||||||||||||||||||||||||
| Royalties | US$mm | $ | 20.09 | - | - | $ | 1.0 | $ | 1.9 | $ | 1.9 | $ | 1.9 | $ | 1.9 | $ | 1.9 | $ | 1.9 | $ | 1.9 | $ | 1.9 | $ | 1.9 | $ | 1.9 | $ | 0.1 | - | - | ||||||||||||||||||||||||||||||||||||||
| Head Office Allocation | US$mm | $ | 108.00 | - | - | $ | 8.0 | $ | 8.0 | $ | 8.0 | $ | 8.0 | $ | 8.0 | $ | 8.0 | $ | 8.0 | $ | 8.0 | $ | 8.0 | $ | 8.0 | $ | 8.0 | $ | 8.0 | $ | 8.0 | $ | 4.0 | ||||||||||||||||||||||||||||||||||||
| Mine Closure Costs | US$mm | $ | 18.76 | - | - | - | - | - | - | - | - | - | - | - | - | - | $ | 17.2 | $ | 1.6 | - | ||||||||||||||||||||||||||||||||||||||||||||||||
| Sustaining Capital | |||||||||||||||||||||||||||||||||||||||||||||||||||||||||||||||||||||
| Total Sustaining Capital | US$mm | $ | 258.78 | - | - | $ | 23.6 | $ | 43.8 | $ | 25.5 | $ | 14.6 | $ | 19.8 | $ | 42.5 | $ | 17.8 | $ | 17.4 | $ | 21.6 | $ | 13.4 | $ | 12.5 | - | $ | 6.3 | - | ||||||||||||||||||||||||||||||||||||||
| Depletion, Depreciation, and Tax | |||||||||||||||||||||||||||||||||||||||||||||||||||||||||||||||||||||
| EBITDA | US$mm | $ | 5,273.8 | - | $ | -2.0 | $ | -30.1 | $ | 341.5 | $ | 415.6 | $ | 416.0 | $ | 416.6 | $ | 446.5 | $ | 410.2 | $ | 406.7 | $ | 421.4 | $ | 424.5 | $ | 433.7 | $ | 456.7 | $ | 477.1 | $ | 239.3 | |||||||||||||||||||||||||||||||||||
| Depreciation Allowance | US$mm | $ | 1,231.2 | - | - | $ | 699.8 | $ | 120.4 | $ | 84.7 | $ | 59.2 | $ | 46.9 | $ | 42.8 | $ | 39.4 | $ | 32.3 | $ | 28.0 | $ | 24.4 | $ | 20.6 | $ | 29.5 | $ | 2.6 | $ | 0.6 | ||||||||||||||||||||||||||||||||||||
| Depletion | US$mm | $ | 578.3 | - | - | $ | 27.4 | $ | 57.5 | $ | 53.2 | $ | 51.4 | $ | 56.6 | $ | 56.3 | $ | 51.3 | $ | 53.0 | $ | 53.4 | $ | 56.6 | $ | 57.2 | $ | 4.2 | - | - | ||||||||||||||||||||||||||||||||||||||
| Interest Expense | US$mm | - | - | - | - | - | - | - | - | - | - | - | - | - | - | - | - | - | |||||||||||||||||||||||||||||||||||||||||||||||||||
| Taxable Income | US$mm | $ | 3,464.4 | - | $ | -2.0 | $ | -757.2 | $ | 163.6 | $ | 277.8 | $ | 305.4 | $ | 313.1 | $ | 347.4 | $ | 319.5 | $ | 321.4 | $ | 340.0 | $ | 343.5 | $ | 355.8 | $ | 423.0 | $ | 474.5 | $ | 238.7 | |||||||||||||||||||||||||||||||||||
| Tax | US$mm | $ | 729.9 | - | - | - | - | - | - | $ | 65.5 | $ | 73.0 | $ | 67.1 | $ | 67.5 | $ | 71.4 | $ | 72.1 | $ | 74.7 | $ | 88.8 | $ | 99.6 | $ | 50.1 | ||||||||||||||||||||||||||||||||||||||||
| Net Profit After Tax | US$mm | $ | 3,312.8 | - | $ | -2.0 | $ | -729.8 | $ | 221.1 | $ | 331.0 | $ | 356.8 | $ | 304.2 | $ | 330.8 | $ | 303.7 | $ | 306.9 | $ | 322.0 | $ | 327.9 | $ | 338.3 | $ | 338.4 | $ | 374.9 | $ | 188.6 | |||||||||||||||||||||||||||||||||||
Figure 19-6 - Cash Flow Analysis
SENSITIVITY ANALYSIS
Primero has studied the economical models’ sensitivity regarding a variation of:
| • | Capital cost; |
| • | Operating cost; |
| • | Spodumene Recovery; |
| • | Lithium Hydroxide Recovery; |
| • | Product Pricing. |
25
The results are summarized in Figure 19-7 and Figure 19-8.

Figure 19-7 - Sensitivity Analysis After-Tax NPV8

Figure 19-8 - Sensitivity Analysis After-Tax IRR
26
The results are showing that the NPV and the IRR are:
| • | Sensitive to Lithium Hydroxide selling price and the IRR is sensitive to variability in CAPEX costs |
| • | Less sensitive to variations in OPEX and process recovery |
| 4. | We note that in response to prior comment 5, regarding information disclosed about market studies providing justification for demand or sales over the life of the mine, pursuant to Item 601(b)(96)(iii)(B)(16) of Regulation S-K, you indicate that you will supplement the financial modeling information associated with your long term business plan, with a standalone cash flow model “...based solely upon the processing and sales of mineral reserves converted to lithium hydroxide,” which we understand is representing your expectation that ore production will occur over approximately eleven years. |
However, with regard to Item 601(b)(96)(iii)(B)(19) of Regulation S-K, you refer to Figures 12-1 and 19-1 (possibly intending reference to Tables 12-1 and 19-1 on pages 121 and 200) of the technical report summary as having “collectively satisfied the substantive requirements” pertaining to the economic analysis, although you indicate that additional cash flow details will be provided for some line items in Section 19 and that reserve information in Section 12 “will be re-cast/overlaid with additional cash flow information on the basis of processing mineral reserves only....”
We understand from the technical assumptions disclosed on page 202 of the technical report summary that details of the economic analysis provided in Section 19 are based on a model that assumes not only production and processing of your mineral reserves into lithium hydroxide monohydrate over a period of eleven years, but also processing spodumene concentrate purchased from third parties for an additional twenty years.
Given the objective of the technical report summary, as outlined in Item 601(b)(96)(i) of Regulation S-K, to support disclosures of mineral resources and mineral reserves, by identifying and summarizing the underlying scientific and technical information and conclusions, it is unclear how inclusion of cash flows incremental to those derived from processing your mineral reserves would be consistent with this objective.
We believe that content throughout the technical report summary should generally be aligned with this objective. For example, the economic analysis in Section 19 should include annual cash flow forecasts based on an annual production schedule for the life of the mining project, along with measures of economic viability such as net present value (NPV), internal rate of return (IRR), and payback period of capital.
Please explain to us, with input from the qualified persons, why economics associated with processing spodumene concentrate acquired from third parties for twenty years beyond the life of your mine would be appropriately regarded as support for your disclosures of mineral resources and mineral reserves, in your view; and tell us the extent to which the mining project would be economic or uneconomic if recovery of the concentrator and chemical plant costs were dependent upon the mining project alone.
27
If you believe that you are able to show how financial modeling associated with your long term business plan has utility in supporting your mineral resources and reserves in the technical report summary, please submit the entire corresponding annual discounted cash flow forecasts for our review, and we will further consider your position.
Response 5:
We advise the Staff, based on input from our Qualified Persons, that as noted in our Response 3 and Response 4 above, our project is economic when it is dependent upon the mining project alone. On this basis, it is not necessary to extend the operation of our proposed chemical plant for an additional period of time beyond the Life of Mine in order to support the disclosures of mineral resources and mineral reserves.
Therefore, we will amend Section 19 of our Amended TRS to include the annual cash flow forecast based solely on the Life of Mine as shown in our Response 3 and Response 4 above, and we will not include a separate business case which considers processing of spodumene concentrate from third parties.
| Sincerely, | ||
| /s/ Michael White | ||
| Michael White | ||
| Chief Financial Officer | ||
Via E-mail: | ||
| cc: | Bruce Czachor, Chief Legal Officer | |
| Eric Scarazzo, Gibson, Dunn & Crutcher LLP | ||
28