| FREE WRITING PROSPECTUS | ||
| FILED PURSUANT TO RULE 433 | ||
| REGISTRATION FILE NO.: 333-206361-13 | ||
| February 5, 2018 | Benchmark 2018-B2 |
| Free Writing Prospectus Structural and Collateral Term Sheet | ||
| BENCHMARK 2018-B2 | ||
| $1,507,013,899 | ||
| (Approximate Mortgage Pool Balance) | ||
| $1,341,242,000 | ||
| (Approximate Offered Certificates) | ||
| J.P. Morgan Chase Commercial Mortgage Securities Corp. | ||
| Depositor | ||
BENCHMARK 2018 MORTGAGE TRUST,
| ||
| JPMorgan Chase Bank, National Association German American Capital Corporation Citi Real Estate Funding Inc. | ||
| Sponsors and Mortgage Loan Sellers | ||
| J.P. Morgan | Deutsche Bank Securities | Citigroup |
| Co-Lead Managers and Joint Bookrunners | ||
| Drexel Hamilton | Academy Securities | |
| Co-Managers | ||
THE INFORMATION IN THIS STRUCTURAL AND COLLATERAL TERM SHEET IS NOT COMPLETE AND MAY BE AMENDED PRIOR TO THE TIME OF SALE. THIS TERM SHEET IS NOT AN OFFER TO SELL THESE SECURITIES AND IT IS NOT A SOLICITATION OF AN OFFER TO BUY THESE SECURITIES IN ANY JURISDICTION WHERE THE OFFER OR SALE IS NOT PERMITTED
| February 5, 2018 | Benchmark 2018-B2 |
This material is for your information, and none of J.P. Morgan Securities LLC (“JPMS”), Deutsche Bank Securities Inc. (“DBSI”), Citigroup Global Markets Inc. (“CGMI”), Drexel Hamilton, LLC (“Drexel”) or Academy Securities, Inc. (“Academy Securities”) (each individually, an “Underwriter”, and together, the ’’Underwriters’’) are soliciting any action based upon it. This material is not to be construed as an offer to sell or the solicitation of any offer to buy any security in any jurisdiction where such an offer or solicitation would be illegal.
The Depositor has filed a registration statement (including a prospectus) with the SEC (SEC File no. 333-206361) for the offering to which this free writing prospectus relates. Before you invest, you should read the prospectus in the registration statement and other documents the Depositor has filed with the SEC for more complete information about the Depositor, the issuing entity and this offering. You may get these documents for free by visiting EDGAR on the SEC Website at www.sec.gov. Alternatively, the Depositor or any Underwriter or any dealer participating in the offering will arrange to send you the prospectus if you request itby calling (800) 408-1016 or by emailing the ABS Syndicate Desk at abs_synd@jpmorgan.com.
Neither this document nor anything contained in this document shall form the basis for any contract or commitment whatsoever. The information contained in this document is preliminary as of the date of this document, supersedes any previous such information delivered to you and will be superseded by any such information subsequently delivered prior to the time of sale. These materials are subject to change, completion or amendment from time to time.
This document has been prepared by the Underwriters for information purposes only and does not constitute, in whole or in part, a prospectus for the purposes of Directive 2003/71/EC (as amended) and/or Part VI of the Financial Services and Markets Act 2000 (as amended) or other offering document.
The attached information contains certain tables and other statistical analyses (the “Computational Materials”) that have been prepared in reliance upon information furnished by the Mortgage Loan Sellers. Numerous assumptions were used in preparing the Computational Materials, which may or may not be reflected in this document. The Computational Materials should not be construed as either projections or predictions or as legal, tax, financial or accounting advice. You should consult your own counsel, accountant and other advisors as to the legal, tax, business, financial and related aspects of a purchase of these certificates. Any weighted average lives, yields and principal payment periods shown in the Computational Materials are based on prepayment and/or loss assumptions, and changes in such prepayment and/or loss assumptions may dramatically affect such weighted average lives, yields and principal payment periods. In addition, it is possible that prepayments or losses on the underlying assets will occur at rates higher or lower than the rates shown in the Computational Materials. The specific characteristics of the certificates may differ from those shown in the Computational Materials due to differences between the final underlying assets and the preliminary underlying assets used in preparing the Computational Materials. The principal amount and designation of any certificate described in the Computational Materials are subject to change prior to issuance. None of the Underwriters nor any of their respective affiliates make any representation or warranty as to the actual rate or timing of payments or losses on any of the underlying assets or the payments or yield on the certificates.
This information is based upon management forecasts and reflects prevailing conditions and management’s views as of this date, all of which are subject to change.
This document contains forward-looking statements. Those statements are subject to certain risks and uncertainties that could cause the success of collections and the actual cash flow generated to differ materially from the information set forth in this document. While such information reflects projections prepared in good faith based upon methods and data that are believed to be reasonable and accurate as of their dates, the Depositor undertakes no obligation to revise these forward-looking statements to reflect subsequent events or circumstances. Investors should not place undue reliance on forward-looking statements and are advised to make their own independent analysis and determination with respect to the forecasted periods, which reflect the Depositor’s view only as of the date of this document.
J.P. Morgan is the marketing name for the investment banking businesses of JPMorgan Chase & Co. and its subsidiaries worldwide. Securities, syndicated loan arranging, financial advisory and other investment banking activities are performed by JPMS and its securities affiliates, and lending, derivatives and other commercial banking activities are performed by JPMorgan Chase Bank, National Association and its banking affiliates. JPMS is a member of SIPC and the NYSE. Securities and investment banking activities in the United States are performed by Deutsche Bank Securities Inc., a member of NYSE, FINRA and SIPC, and its broker-dealer affiliates. Lending and other commercial banking activities in the United States are performed by Deutsche Bank AG, acting through its New York Branch.
Capitalized terms used in this material but not defined herein shall have the meanings ascribed to them in the Preliminary Prospectus (as defined below).
THE CERTIFICATES REFERRED TO IN THESE MATERIALS ARE SUBJECT TO MODIFICATION OR REVISION (INCLUDING THE POSSIBILITY THAT ONE OR MORE CLASSES OF CERTIFICATES MAY BE SPLIT, COMBINED OR ELIMINATED AT ANY TIME PRIOR TO ISSUANCE OR AVAILABILITY OF A FINAL PROSPECTUS) AND ARE OFFERED ON A “WHEN, AS AND IF ISSUED” BASIS.
THE UNDERWRITERS MAY FROM TIME TO TIME PERFORM INVESTMENT BANKING SERVICES FOR, OR SOLICIT INVESTMENT BANKING BUSINESS FROM, ANY COMPANY NAMED IN THESE MATERIALS. THE UNDERWRITERS AND/OR THEIR AFFILIATES OR RESPECTIVE EMPLOYEES MAY FROM TIME TO TIME HAVE A LONG OR SHORT POSITION IN ANY CERTIFICATE OR CONTRACT DISCUSSED IN THESE MATERIALS.
THE INFORMATION IN THIS STRUCTURAL AND COLLATERAL TERM SHEET IS NOT COMPLETE AND MAY BE AMENDED PRIOR TO THE TIME OF SALE. THIS TERM SHEET IS NOT AN OFFER TO SELL THESE SECURITIES AND IT IS NOT A SOLICITATION OF AN OFFER TO BUY THESE SECURITIES IN ANY JURISDICTION WHERE THE OFFER OR SALE IS NOT PERMITTED.
 |  |  |
2 of 151
| Structural and Collateral Term Sheet | Benchmark 2018-B2 | |
| Indicative Capital Structure | ||
Publicly Offered Certificates
| Class | Expected Ratings (S&P / Fitch / KBRA) | Approximate Initial Certificate Balance or Notional Amount(1) | Approximate Initial Credit Support(2) | Expected Weighted Avg. Life (years)(3) | Expected Principal Window(3) | Certificate Principal to Value Ratio(4) | Underwritten NOI Debt Yield(5) | ||||||
| A-1 | AAA(sf) / AAAsf / AAA(sf) | $29,604,000 | 30.000% | 2.52 | 3/18 – 6/22 | 40.0% | 16.0% | ||||||
| A-2 | AAA(sf) / AAAsf / AAA(sf) | $341,798,000 | 30.000% | 4.82 | 6/22 – 2/23 | 40.0% | 16.0% | ||||||
| A-3 | AAA(sf) / AAAsf / AAA(sf) | $60,000,000 | 30.000% | 6.80 | 12/24 – 12/24 | 40.0% | 16.0% | ||||||
| A-4 | AAA(sf) / AAAsf / AAA(sf) | $125,000,000 | 30.000% | 9.58 | 3/27 – 11/27 | 40.0% | 16.0% | ||||||
| A-5 | AAA(sf) / AAAsf / AAA(sf) | $444,175,000 | 30.000% | 9.83 | 11/27 – 1/28 | 40.0% | 16.0% | ||||||
| A-SB | AAA(sf) / AAAsf / AAA(sf) | $54,333,000 | 30.000% | 7.11 | 2/23 – 3/27 | 40.0% | 16.0% | ||||||
| X-A | NR / AAAsf / AAA(sf) | $1,220,681,000 | (6) | N/A | 7.96 | N/A | N/A | N/A | |||||
| X-B | NR / AA-sf / AAA(sf) | $60,281,000 | (6) | N/A | 9.88 | N/A | N/A | N/A | |||||
| A-S | NR / AAAsf / AAA(sf) | $165,771,000 | 19.0000% | 9.88 | 1/28 – 1/28 | 46.3% | 13.8% | ||||||
| B | NR / AA-sf / AA-(sf) | $60,281,000 | 15.0000% | 9.88 | 1/28 – 2/28 | 48.6% | 13.2% | ||||||
| C | NR / A-sf / A-(sf) | $60,280,000 | 11.0000% | 9.97 | 2/28 – 2/28 | 50.9% | 12.6% | ||||||
Privately Offered Certificates(7)
| Class | Expected Ratings (S&P / Fitch / KBRA) | Approximate Initial Certificate Balance or Notional Amount(1) | Approximate Initial Credit Support | Expected Weighted Avg. Life (years)(3) | Expected Principal Window(3) | Certificate Principal to Value Ratio(4) | Underwritten NOI Debt Yield(5) | ||||||
| X-D | NR / BBB+sf / BBB+(sf) | $18,838,000 | (6)(8) | N/A | 9.97 | N/A | N/A | N/A | |||||
| D | NR / BBB+sf / BBB+(sf) | $18,838,000 | (8) | 9.750% | 9.97 | 2/28 – 2/28 | 51.6% | 12.4% | |||||
| E-RR | NR / BBB-sf / BBB-(sf) | $52,746,000 | (8) | 6.250% | 9.97 | 2/28 – 2/28 | 53.6% | 11.9% | |||||
| F-RR | NR / BBsf / BB(sf) | $18,837,000 | 5.000% | 9.97 | 2/28 – 2/28 | 54.3% | 11.8% | ||||||
| G-RR | NR / Bsf / B(sf) | $18,838,000 | 3.750% | 9.97 | 2/28 – 2/28 | 55.1% | 11.6% | ||||||
| NR-RR | NR / NR / NR | $56,512,898 | 0.000% | 9.97 | 2/28 – 2/28 | 57.2% | 11.2% | ||||||
| (1) | In the case of each such Class, subject to a permitted variance of plus or minus 5%. In addition, the notional amounts of the Class X-A, Class X-B and Class X-D Certificates may vary depending upon the final pricing of the Classes of Principal Balance Certificates whose Certificate Balances comprise such notional amounts, and, if as a result of such pricing the pass-through rate of any Class of the Class X-A, Class X-B or Class X-D Certificates, as applicable, would be equal to zero at all times, such Class of Certificates will not be issued on the closing date of this securitization. |
| (2) | The credit support percentages set forth for Class A-1, Class A-2, Class A-3, Class A-4, Class A-5 and Class A-SB Certificates represent the approximate initial credit support for the Class A-1, Class A-2, Class A-3, Class A-4, Class A-5 and Class A-SB Certificates in the aggregate. |
| (3) | Assumes 0% CPR / 0% CDR and a February 27, 2018 closing date. Based on modeling assumptions as described in the Preliminary Prospectus dated February 5, 2018 (the “Preliminary Prospectus”). |
| (4) | The “Certificate Principal to Value Ratio” for any Class of Principal Balance Certificates (other than the Class A-1, Class A-2, Class A-3, Class A-4, Class A-5 and Class A-SB Certificates) is calculated as the product of (a) the weighted average Cut-off Date LTV for the mortgage loans, multiplied by (b) a fraction, the numerator of which is the total initial Certificate Balance of such Class of Certificates and all Classes of Principal Balance Certificates senior to such Class of Certificates and the denominator of which is the total initial Certificate Balance of all of the Principal Balance Certificates. The Class A-1, Class A-2, Class A-3, Class A-4, Class A-5 and Class A-SB Certificate Principal to Value Ratios are calculated in the aggregate for those Classes as if they were a single Class. Investors should note, however, that excess mortgaged property value associated with a mortgage loan will not be available to offset losses on any other mortgage loan. |
| (5) | The “Underwritten NOI Debt Yield” for any Class of Principal Balance Certificates (other than the Class A-1, Class A-2, Class A-3, Class A-4, Class A-5 and Class A-SB Certificates) is calculated as the product of (a) the weighted average UW NOI Debt Yield for the mortgage loans and (b) the total initial Certificate Balance of all of the Classes of Principal Balance Certificates divided by the total initial Certificate Balance for such Class and all Classes of Principal Balance Certificates senior to such Class of Certificates. The Underwritten NOI Debt Yield for each of the Class A-1, Class A-2, Class A-3, Class A-4, Class A-5 and Class A-SB Certificates is calculated in the aggregate for those Classes as if they were a single Class. Investors should note, however, that net operating income from any mortgaged property supports only the related mortgage loan and will not be available to support any other mortgage loan. |
| (6) | The Class X-A, Class X-B and Class X-D Notional Amounts are defined in the Preliminary Prospectus. |
| (7) | The Class X-D, Class D, Class E-RR, Class F-RR, Class G-RR and Class NR-RR Certificates are not being offered by the Preliminary Prospectus or this Term Sheet. The Class S and Class R Certificates are not shown above. |
| (8) | The approximate initial Notional Amount and Certificate Balances of the Class X-D, Class D and Class E-RR Certificates are estimated based in part on the estimated ranges of Notional Amounts, Certificate Balances and estimated fair values described in “Credit Risk Retention” in the Preliminary Prospectus. The Class X-D and Class D Notional Amount and Certificate Balances are expected to fall within a range of $15,071,000 and $26,373,000, with the ultimate Notional Amount and Certificate Balance determined, such that the aggregate fair value of the Yield-Priced Principal Balance Certificates will equal at least 5% of the estimated fair value of all of the classes of certificates (other than the Class R Certificates) issued by the issuing entity. The Class E-RR Certificate Balances are expected to fall within a range of $45,211,000 and $56,513,000, with the ultimate Certificate Balance determined such that the aggregate fair value of the Yield-Priced Principal Balance Certificates will equal at least 5% of the estimated fair value of all the classes of certificates (other than the Class R Certificates) issued by the issuing entity. |
THE INFORMATION IN THIS STRUCTURAL AND COLLATERAL TERM SHEET IS NOT COMPLETE AND MAY BE AMENDED PRIOR TO THE TIME OF SALE. THIS TERM SHEET IS NOT AN OFFER TO SELL THESE SECURITIES AND IT IS NOT A SOLICITATION OF AN OFFER TO BUY THESE SECURITIES IN ANY JURISDICTION WHERE THE OFFER OR SALE IS NOT PERMITTED.
| | |
3 of 151
| Structural and Collateral Term Sheet | Benchmark 2018-B2 | |
| Summary of Transaction Terms | ||
| Securities Offered: | $1,341,242,000 monthly pay, multi-class, commercial mortgage REMIC Pass-Through Certificates. |
| Co-Lead Managers and Joint Bookrunners: | J.P. Morgan Securities LLC, Deutsche Bank Securities Inc. and Citigroup Global Markets Inc. |
| Co-Managers: | Drexel Hamilton, LLC and Academy Securities, Inc. |
| Mortgage Loan Sellers: | JPMorgan Chase Bank, National Association (“JPMCB”) (31.1%), German American Capital Corporation (“GACC”) (38.8%) and Citi Real Estate Funding Inc. (“CREFI”) (30.2%). |
| Master Servicer: | KeyBank National Association. |
| Special Servicer: | CWCapital Asset Management LLC. |
| Directing Certificateholder: | Barings LLC. |
| Trustee: | Wells Fargo Bank, National Association. |
| Certificate Administrator: | Wells Fargo Bank, National Association. |
| Operating Advisor: | Pentalpha Surveillance LLC. |
| Asset Representations Reviewer: | Pentalpha Surveillance LLC. |
| Rating Agencies: | S&P Global Ratings, acting through Standard and Poor’s Financial Services LLC (“S&P”), Fitch Ratings, Inc. (“Fitch”) and Kroll Bond Rating Agency (“KBRA”). |
| U.S. Credit Risk Retention: | JPMCB is expected to act as the “retaining sponsor” for this securitization and intends to satisfy the U.S. credit risk retention requirement through the purchase by Massachusetts Mutual Life Insurance Company, as a third-party purchaser (as defined in Regulation RR), from the depositor, on the Closing Date, of an “eligible horizontal residual interest”, which will be comprised of the Class E-RR, Class F-RR, Class G-RR and Class NR-RR Certificates. The aggregate estimated fair value of the Class E-RR, Class F-RR, Class G-RR and Class NR-RR Certificates will be at least equal to 5% of the estimated fair value of all of the Certificates (other than the Class R Certificates) issued by the issuing entity.
Massachusetts Mutual Life Insurance Company, in its capacity as the “third-party purchaser” for this transaction, will be required to comply with the hedging, transfer and financing restrictions applicable to a “third-party purchaser” under the credit risk retention rules in effect on the Closing Date, which generally prohibit the transfer of the applicable Certificates, other than to a majority owned affiliate of Massachusetts Mutual Life Insurance Company, until February 27, 2023. After that date, transfers are permitted under certain circumstances, in accordance with the credit risk retention rules, to another “third-party purchaser”.
The restrictions on hedging and transfer under the credit risk retention rules as in effect on the closing date of this transaction will expire on and after the date that is the earliest of (A) the date that is the latest of (i) the date on which the aggregate principal balance of the mortgage loans has been reduced to 33% of the aggregate principal balance of the mortgage loans as of the Cut-off Date; (ii) the date on which the total unpaid principal obligations under the Certificates has been reduced to 33% of the aggregate total unpaid principal obligations under the Certificates as of the Closing Date; or (iii) two years after the Closing Date and (B) the date on which all of the mortgage loans have been defeased in accordance with §244.7(b)(8)(i) of Regulation RR.
The Pooling and Servicing Agreement (as defined below) will include the required provisions applicable to an operating advisor necessary for the securitization to comply with the credit risk retention rules utilizing the “third-party purchaser” option. See “Operating Advisor” below.
Notwithstanding any references in this term sheet to the credit risk retention rules, the Regulation RR, the retaining sponsor, the third-party purchaser and other risk retention related matters, in the event the credit risk retention rules and/or Regulation RR (or any relevant portion thereof) are repealed or determined by applicable regulatory agencies to be no longer applicable to this securitization transaction, none of the retaining sponsor, the third-party purchaser or any other party will be required to comply with or act in accordance with the credit risk retention rules and/or Regulation RR (or such relevant portion thereof).
For additional information, see “Credit Risk Retention” in the Preliminary Prospectus. |
| EU Credit Risk Retention: | The transaction is not structured to satisfy the EU risk retention and due diligence requirements. |
| Pricing Date: | On or about February 9, 2018. |
| Closing Date: | On or about February 27, 2018. |
| Cut-off Date: | With respect to each mortgage loan, the related due date in February 2018, or with respect to any mortgage loan that has its first due date in March 2018, the date that would otherwise have been the related due date in February 2018. |
THE INFORMATION IN THIS STRUCTURAL AND COLLATERAL TERM SHEET IS NOT COMPLETE AND MAY BE AMENDED PRIOR TO THE TIME OF SALE. THIS TERM SHEET IS NOT AN OFFER TO SELL THESE SECURITIES AND IT IS NOT A SOLICITATION OF AN OFFER TO BUY THESE SECURITIES IN ANY JURISDICTION WHERE THE OFFER OR SALE IS NOT PERMITTED.
| | |
4 of 151
| Structural and Collateral Term Sheet | Benchmark 2018-B2 | |
| Summary of Transaction Terms | ||
| Distribution Date: | The 4th business day after the Determination Date in each month, commencing in March 2018. |
| Determination Date: | 11thday of each month, or if the 11th day is not a business day, the next succeeding business day, commencing in March 2018. |
| Assumed Final Distribution Date: | The Distribution Date in February 2028, which is the latest anticipated repayment date of the Certificates. |
| Rated Final Distribution Date: | The Distribution Date in February 2051. |
| Tax Treatment: | The Publicly Offered Certificates are expected to be treated as REMIC “regular interests” for U.S. federal income tax purposes. |
| Form of Offering: | The Class A-1, Class A-2, Class A-3, Class A-4, Class A-5, Class A-SB, Class X-A, Class X-B, Class A-S, Class B and Class C Certificates (the “Publicly Offered Certificates”) will be offered publicly. The Class X-D, Class D, Class E-RR, Class F-RR, Class G-RR, Class NR-RR, Class S and Class R Certificates (the “Privately Offered Certificates”) will be offered domestically to Qualified Institutional Buyers and to Institutional Accredited Investors (other than the Class R Certificates) and to institutions that are not U.S. Persons pursuant to Regulation S. |
| SMMEA Status: | The Certificates will not constitute “mortgage related securities” for purposes of SMMEA. |
| ERISA: | The Publicly Offered Certificates are expected to be ERISA eligible. |
| Optional Termination: | On any Distribution Date on which the aggregate principal balance of the pool of mortgage loans is less than 1% of the aggregate principal balance of the mortgage loans as of the Cut-off Date, certain entities specified in the Preliminary Prospectus will have the option to purchase all of the remaining mortgage loans (and all property acquired through exercise of remedies in respect of any mortgage loan) at the price specified in the Preliminary Prospectus. Refer to “Pooling and Servicing Agreement—Termination; Retirement of Certificates” in the Preliminary Prospectus. |
| Minimum Denominations: | The Publicly Offered Certificates (other than the Class X-A and Class X-B Certificates) will be issued in minimum denominations of $10,000 and integral multiples of $1 in excess of $10,000. The Class X-A and Class X-B Certificates will be issued in minimum denominations of $1,000,000 and in integral multiples of $1 in excess of $1,000,000. |
| Settlement Terms: | DTC, Euroclear and Clearstream Banking. |
| Analytics: | The transaction is expected to be modeled by Intex Solutions, Inc. and Trepp, LLC and is expected to be available on Bloomberg L.P., Blackrock Financial Management, Inc., Interactive Data Corporation, CMBS.com, Inc., Markit Group Limited, Moody’s Analytics, RealInsight and Thomson Reuters Corporation. |
| Risk Factors: | THE CERTIFICATES INVOLVE CERTAIN RISKS AND MAY NOT BE SUITABLE FOR ALL INVESTORS. REFER TO “RISK FACTORS” IN THE PRELIMINARY PROSPECTUS. |
THE INFORMATION IN THIS STRUCTURAL AND COLLATERAL TERM SHEET IS NOT COMPLETE AND MAY BE AMENDED PRIOR TO THE TIME OF SALE. THIS TERM SHEET IS NOT AN OFFER TO SELL THESE SECURITIES AND IT IS NOT A SOLICITATION OF AN OFFER TO BUY THESE SECURITIES IN ANY JURISDICTION WHERE THE OFFER OR SALE IS NOT PERMITTED.
| | |
5 of 151
| Structural and Collateral Term Sheet | Benchmark 2018-B2 | |
| Collateral Characteristics | ||
| Loan Pool | ||
| Initial Pool Balance (“IPB”): | $1,507,013,899 | |
| Number of Mortgage Loans: | 57 | |
| Number of Mortgaged Properties: | 67 | |
| Average Cut-off Date Balance per Mortgage Loan: | $26,438,840 | |
| Weighted Average Current Mortgage Rate: | 4.21894% | |
| 10 Largest Mortgage Loans as % of IPB: | 40.9% | |
| Weighted Average Remaining Term to Maturity(1): | 104 months | |
| Weighted Average Seasoning: | 2 months | |
| Credit Statistics | ||
| Weighted Average UW NCF DSCR(2)(3): | 2.29x | |
| Weighted Average UW NOI Debt Yield(2): | 11.2% | |
| Weighted Average Cut-off Date Loan-to-Value Ratio (“LTV”)(2)(4): | 57.2% | |
| Weighted Average Maturity Date LTV(1)(2)(4): | 53.0% | |
| Other Statistics | ||
| % of Mortgage Loans with Additional Debt: | 22.0% | |
| % of Mortgaged Properties with Single Tenants: | 16.9% | |
| Amortization | ||
| Weighted Average Original Amortization Term(5): | 353 months | |
| Weighted Average Remaining Amortization Term(5): | 352 months | |
| % of Mortgage Loans with Interest-Only: | 47.6% | |
| % of Mortgage Loans with Partial Interest-Only followed by Amortizing Balloon: | 25.3% | |
| % of Mortgage Loans with Amortizing Balloon: | 19.8% | |
| % of Mortgage Loans with Interest-Only followed by ARD structure: | 7.2% | |
| Lockbox / Cash Management(6) | ||
| % of Mortgage Loans with In-Place, Hard Lockboxes: | 66.5% | |
| % of Mortgage Loans with Springing Lockboxes: | 20.9% | |
| % of Mortgage Loans with In-Place, Soft Lockboxes: | 12.6% | |
| % of Mortgage Loans with Springing Cash Management: | 79.8% | |
| % of Mortgage Loans with In-Place Cash Management: | 20.2% | |
| Reserves | ||
| % of Mortgage Loans Requiring Monthly Tax Reserves: | 57.6% | |
| % of Mortgage Loans Requiring Monthly Insurance Reserves: | 29.4% | |
| % of Mortgage Loans Requiring Monthly CapEx Reserves(7): | 56.2% | |
| % of Mortgage Loans Requiring Monthly TI/LC Reserves(8): | 41.1% | |
| (1) | In the case of Loan Nos. 3 and 15, each with an anticipated repayment date, Remaining Term to Maturity and Maturity Date LTV are calculated as of the related anticipated repayment date. |
| (2) | In the case of Loan Nos. 3, 4, 5, 6, 7, 8, 10, 13, 14, 15, 16, 17, 18, 19, 21, 22, 23, 32, 35, 39, 42, 46, 49 and 53, the UW NCF DSCR, UW NOI Debt Yield, Cut-off Date LTV and Maturity Date LTV calculations include the related Pari Passu Companion Loan(s). In the case of Loan Nos. 1, 10, 16, 35, 39, 42, 46, 49 and 53, the UW NCF DSCR, UW NOI Debt Yield, Cut-off Date LTV and Maturity Date LTV calculations exclude the related Subordinate Companion Loan(s). |
| (3) | In the case of Loan No. 33, the UW NCF DSCR is calculated using the sum of principal and interest payments over the first 12 months based on the assumed principal payment schedule provided on Annex H to the Preliminary Prospectus. |
| (4) | In the case of Loan Nos. 3, 7, 9, 12, 19, 25, 29, 33, 36, 43 and 54, the Cut-off Date LTV and the Maturity Date LTV are calculated by using an appraised value based on certain hypothetical assumptions. Refer to “Description of the Mortgage Pool—Assessments of Property Value and Condition” and “—Appraised Value” in the Preliminary Prospectus for additional details. |
| (5) | Excludes 24 mortgage loans that are interest-only for the entire term or until the related anticipated repayment date. |
| (6) | For a more detailed description of Lockbox / Cash Management, refer to “Description of the Mortgage Pool—Certain Terms of the Mortgage Loans—Mortgaged Property Accounts” in the Preliminary Prospectus. |
| (7) | CapEx Reserves include FF&E reserves for hotel properties. |
| (8) | Calculated only with respect to the Cut-off Date Balance of mortgage loans secured or partially secured by office, retail, mixed use and industrial properties. |
THE INFORMATION IN THIS STRUCTURAL AND COLLATERAL TERM SHEET IS NOT COMPLETE AND MAY BE AMENDED PRIOR TO THE TIME OF SALE. THIS TERM SHEET IS NOT AN OFFER TO SELL THESE SECURITIES AND IT IS NOT A SOLICITATION OF AN OFFER TO BUY THESE SECURITIES IN ANY JURISDICTION WHERE THE OFFER OR SALE IS NOT PERMITTED.
| | |
6 of 151
| Structural and Collateral Term Sheet | Benchmark 2018-B2 |
| Collateral Characteristics | |
Mortgage Loan Seller | Number of | Number of | Aggregate | % of |
| GACC(1) | 21 | 26 | $584,161,017 | 38.8% |
| JPMCB(2) | 19 | 19 | 468,409,651 | 31.1 |
| CREFI(3) | 17 | 22 | 454,443,230 | 30.2 |
| Total: | 57 | 67 | $1,507,013,899 | 100.0% |
| (1) | With the exception of Loan Nos. 3, 10, 15, 23 and 47, all of the loans for which GACC is the Mortgage Loan Seller were originated by Deutsche Bank, AG, New York Branch (“DBNY”) (an affiliate of GACC). In the case of Loan No. 3, the whole loan was co-originated by Wells Fargo Bank, National Association, Goldman Sachs Mortgage Company (“GSMC”) and DBNY. In the case of Loan Nos. 10 and 15, the whole loans were originated by GSMC, which sold certain notes, including the Worldwide Plaza mortgage loan and the Marina Heights State Farm mortgage loan, to DBNY. In the case of Loan No. 23, the whole loan was originated by CREFI, which sold certain notes, including the Two Harbor Point Square mortgage loan, to DBNY. In the case of Loan No. 47, the whole loan was originated by Cantor Commercial Real Estate Lending, L.P. |
| (2) | In the case of Loan No. 18, the whole loan was co-originated by JPMorgan Chase Bank, National Association, Column Financial, Inc. and Cantor Commercial Real Estate, L.P. |
| (3) | In the case of Loan No. 14, the whole loan was co-originated by Citi Real Estate Funding Inc. (“CREFI”) and Société Générale. |
| Ten Largest Mortgage Loans | ||||||||||||
| No. | Loan Name | Mortgage Loan Seller | No. of Prop. | Cut-off Date Balance | % of IPB | SF/Units/ Rooms | Property Type | UW NCF DSCR(1) | UW NOI Debt Yield(1) | Cut-off Date LTV(1)(2) | Maturity Date LTV(1)(2) | |
| 1 | Central Park of Lisle | CREFI | 1 | $79,500,000 | 5.3% | 693,606 | Office | 2.58x | 12.6% | 58.9% | 58.9% | |
| 2 | Promenade Shops at Aventura | JPMCB | 1 | $70,000,000 | 4.6% | 291,834 | Retail | 1.29x | 8.6% | 64.7% | 52.6% | |
| 3 | Apple Campus 3 | GACC | 1 | $68,000,000 | 4.5% | 882,657 | Office | 3.55x | 12.2% | 44.0% | 44.0% | |
| 4 | EOS 21 | JPMCB | 1 | $60,000,000 | 4.0% | 1,180 | Multifamily | 1.87x | 7.5% | 64.8% | 64.8% | |
| 5 | Rochester Hotel Portfolio | GACC | 4 | $60,000,000 | 4.0% | 1,222 | Hotel | 1.50x | 12.2% | 66.7% | 55.4% | |
| 6 | InterContinental San Francisco | GACC | 1 | $59,922,671 | 4.0% | 550 | Hotel | 2.29x | 16.0% | 41.9% | 33.5% | |
| 7 | Sentinel Square II | GACC | 1 | $57,660,000 | 3.8% | 280,363 | Office | 2.70x | 9.0% | 59.7% | 59.7% | |
| 8 | The Woods | CREFI | 1 | $57,500,000 | 3.8% | 1,841 | Multifamily | 5.01x | 15.2% | 29.6% | 29.6% | |
| 9 | 600 Clipper | JPMCB | 1 | $54,300,000 | 3.6% | 158,596 | Office | 3.17x | 12.7% | 57.8% | 57.8% | |
| 10 | Worldwide Plaza | GACC | 1 | $50,000,000 | 3.3% | 2,049,553 | Office | 3.77x | 14.2% | 35.4% | 35.4% | |
| Top 3 Total/Weighted Average | 3 | $217,500,000 | 14.4% | 2.47x | 11.2% | 56.1% | 52.2% | |||||
| Top 5 Total/Weighted Average | 8 | $337,500,000 | 22.4% | 2.19x | 10.7% | 59.5% | 55.0% | |||||
| Top 10 Total/Weighted Average | 13 | $616,882,671 | 40.9% | 2.72x | 11.9% | 52.9% | 49.7% | |||||
| (1) | In the case of Loan Nos. 3, 4, 5, 6, 7, 8 and 10, the UW NCF DSCR, UW NOI Debt Yield, Cut-off Date LTV and Maturity Date LTV calculations include the related Pari Passu Companion Loan(s). In the case of Loan Nos. 1 and 10, the UW NCF DSCR, UW NOI Debt Yield, Cut-off Date LTV and Maturity Date LTV calculations exclude the related Subordinate Companion Loan(s). |
| (2) | In the case of Loan Nos. 3, 7 and 9, the Cut-off Date LTV and the Maturity Date LTV are calculated by using an appraised value based on certain hypothetical assumptions. Refer to “Description of the Mortgage Pool—Assessments of Property Value and Condition” and “—Appraised Value” in the Preliminary Prospectus for additional details. |
THE INFORMATION IN THIS STRUCTURAL AND COLLATERAL TERM SHEET IS NOT COMPLETE AND MAY BE AMENDED PRIOR TO THE TIME OF SALE. THIS TERM SHEET IS NOT AN OFFER TO SELL THESE SECURITIES AND IT IS NOT A SOLICITATION OF AN OFFER TO BUY THESE SECURITIES IN ANY JURISDICTION WHERE THE OFFER OR SALE IS NOT PERMITTED.
| | |
7 of 151
| Structural and Collateral Term Sheet | Benchmark 2018-B2 |
| Collateral Characteristics | |
| Pari Passu Companion Loan Summary | |||||||||||||
No. | Loan Name | Trust Cut-off Date Balance | Pari Passu | Total Mortgage | Controlling Pooling & Servicing Agreement | Master Servicer | Special Servicer | Control Rights | |||||
| 3 | Apple Campus 3 | $68,000,000 | $272,000,000 | $340,000,000 | BANK 2018-BNK10 | Wells Fargo | Torchlight | BANK 2018-BNK10 | |||||
| 4 | EOS 21 | $60,000,000 | $90,000,000 | $150,000,000 | BMARK 2018-B2 | KeyBank | CWCapital | BMARK 2018-B2 | |||||
| 5 | Rochester Hotel Portfolio | $60,000,000 | $80,000,000 | $140,000,000 | BMARK 2018-B2 | KeyBank | CWCapital | BMARK 2018-B2 | |||||
| 6 | InterContinental San Francisco | $59,922,671 | $49,935,559 | $109,858,230 | BMARK 2018-B2 | KeyBank | CWCapital | BMARK 2018-B2 | |||||
| 7 | Sentinel Square II | $57,660,000 | $45,000,000 | $102,660,000 | BMARK 2018-B2 | KeyBank | CWCapital | BMARK 2018-B2 | |||||
| 8 | The Woods | $57,500,000 | $142,500,000 | $200,000,000 | MSC 2017-HR2 | Wells Fargo | LNR | MSC 2017-HR2 | |||||
| 10 | Worldwide Plaza | $50,000,000 | $566,286,000 | $616,286,000 | WPT 2017-WWP | Wells Fargo | Cohen | WPT 2017-WWP | |||||
| 13 | Braddock Metro Center | $44,200,000 | $30,000,000 | $74,200,000 | BMARK 2018-B2 | KeyBank | CWCapital | BMARK 2018-B2 | |||||
| 14 | BlueLinx Portfolio | $42,900,000 | $28,600,000 | $71,500,000 | BMARK 2018-B2 | KeyBank | CWCapital | BMARK 2018-B2 | |||||
| 15 | Marina Heights State Farm | $41,000,000 | $519,000,000 | $560,000,000 | GS 2017-FARM | KeyBank | AEGON | GS 2017-FARM | |||||
| 16 | Red Building | $40,000,000 | $40,000,000 | $80,000,000 | BMARK 2018-B2 | KeyBank | CWCapital | (2) | |||||
| 17 | 599 Broadway | $40,000,000 | $35,000,000 | $75,000,000 | BMARK 2018-B2 | KeyBank | CWCapital | BMARK 2018-B2 | |||||
| 18 | Lehigh Valley Mall | $35,355,560 | $163,830,696 | $199,186,256 | BMARK 2018-B1 | Wells Fargo | Midland | BMARK 2018-B1 | |||||
| 19 | Atrium Center | $35,000,000 | $80,000,000 | $115,000,000 | (3) | (3) | (3) | (3) | |||||
| 21 | 90 Hudson | $30,000,000 | $100,000,000 | $130,000,000 | BMARK 2018-B1 | Wells Fargo | Midland | BMARK 2018-B1 | |||||
| 22 | Marriott Charlotte City Center | $30,000,000 | $73,000,000 | $103,000,000 | (3) | (3) | (3) | (3) | |||||
| 23 | Two Harbor Point Square | $24,750,000 | $24,750,000 | $49,500,000 | (3) | (3) | (3) | (3) | |||||
| 32 | Towers at University Town Center | $15,000,000 | $31,000,000 | $46,000,000 | BMARK 2018-B2 | KeyBank | CWCapital | BMARK 2018-B2 | |||||
| 35 | Beacon - Criterion | $13,305,255 | $24,675,200 | $37,980,455 | JPMCC 2017-BCON | KeyBank | Cohen | JPMCC 2017-BCON | |||||
| 39 | Beacon - Hague | $11,420,588 | $21,180,000 | $32,600,588 | JPMCC 2017-BCON | KeyBank | Cohen | JPMCC 2017-BCON | |||||
| 42 | Beacon - Paramount | $9,703,725 | $17,996,000 | $27,699,725 | JPMCC 2017-BCON | KeyBank | Cohen | JPMCC 2017-BCON | |||||
| 46 | Beacon - Mercury / Garage | $7,968,529 | $14,778,000 | $22,746,529 | JPMCC 2017-BCON | KeyBank | Cohen | JPMCC 2017-BCON | |||||
| 49 | Beacon - Orpheum | $7,417,020 | $13,755,200 | $21,172,220 | JPMCC 2017-BCON | KeyBank | Cohen | JPMCC 2017-BCON | |||||
| 53 | Beacon - Tower | $5,184,882 | $9,615,600 | $14,800,482 | JPMCC 2017-BCON | KeyBank | Cohen | JPMCC 2017-BCON | |||||
| (1) | In the case of Loan Nos. 10, 16, 35, 39, 42, 46, 49 and 53, the Total Mortgage Loan Cut-off Date Balance excludes the related Subordinate Companion Loan(s). |
| (2) | The initial controlling noteholder is a third party investor, as holder of the related controlling subordinate companion loan. Upon the occurrence and during the continuance of a control appraisal period, the trust governed by the related lead servicing agreement will be the controlling noteholder. |
| (3) | In the case of Loan Nos. 19, 22 and 23, the whole loan is serviced under the BMARK 2018-B1 Pooling and Servicing Agreement until such time that the controllingpari passu companion loan has been securitized, at which point the whole loan will be serviced under the related pooling and servicing agreement. With respect to Loan Nos. 19 and 22, JPMCB holds the related controllingpari passu companion loan and is entitled to exercise control rights until the securitization of such controllingpari passucompanion loan. With respect to Loan No. 23, CREFI holds the related controllingpari passucompanion loan and is entitled to exercise control rights until the securitization of such controllingpari passu companion loan. |
THE INFORMATION IN THIS STRUCTURAL AND COLLATERAL TERM SHEET IS NOT COMPLETE AND MAY BE AMENDED PRIOR TO THE TIME OF SALE. THIS TERM SHEET IS NOT AN OFFER TO SELL THESE SECURITIES AND IT IS NOT A SOLICITATION OF AN OFFER TO BUY THESE SECURITIES IN ANY JURISDICTION WHERE THE OFFER OR SALE IS NOT PERMITTED.
| | |
8 of 151
| Structural and Collateral Term Sheet | Benchmark 2018-B2 |
| Collateral Characteristics | |
| Additional Debt Summary |
No. | Loan Name | Trust | Subordinate | Total Debt Cut-off Date Balance | Mortgage Loan UW NCF DSCR(2)(3) | Total Debt UW NCF DSCR(3) | Mortgage Loan | Total Debt Cut-off Date LTV(4) | Mortgage Loan UW NOI Debt Yield(2) | Total Debt UW NOI Debt Yield | |
| 1 | Central Park of Lisle | $79,500,000 | $14,350,000 | $93,850,000 | 2.58x | 1.96x | 58.9% | 69.5% | 12.6% | 10.7% | |
| 3 | Apple Campus 3 | $68,000,000 | $235,000,000 | $575,000,000 | 3.55x | 1.70x | 44.0% | 74.3% | 12.2% | 7.2% | |
| 10 | Worldwide Plaza | $50,000,000 | $583,714,000 | $1,200,000,000 | 3.77x | 1.75x | 35.4% | 69.0% | 14.2% | 7.3% | |
| 16 | Red Building | $40,000,000 | $116,000,000 | $196,000,000 | 3.31x | 1.15x | 27.9% | 68.4% | 16.1% | 6.6% | |
| 23 | Two Harbor Point Square | $24,750,000 | $11,500,000 | $61,000,000 | 1.78x | 1.28x | 61.9% | 76.3% | 11.3% | 9.2% | |
| 33 | Fairfield Portfolio | $14,490,000 | $1,260,000 | $15,750,000 | 1.80x | 1.54x | 64.4% | 70.0% | 13.6% | 12.5% | |
| 35 | Beacon - Criterion | $13,305,255 | $39,046,545 | $77,027,000 | 3.01x | 1.19x | 37.0% | 75.0% | 11.7% | 5.8% | |
| 39 | Beacon - Hague | $11,420,588 | $32,308,412 | $64,909,000 | 2.87x | 1.17x | 37.1% | 73.9% | 11.2% | 5.6% | |
| 42 | Beacon - Paramount | $9,703,725 | $31,976,275 | $59,676,000 | 3.37x | 1.20x | 33.0% | 71.0% | 13.1% | 6.1% | |
| 46 | Beacon - Mercury / Garage | $7,968,529 | $25,948,471 | $48,695,000 | 3.36x | 1.21x | 33.9% | 72.6% | 13.2% | 6.1% | |
| 49 | Beacon - Orpheum | $7,417,020 | $22,648,780 | $43,821,000 | 3.14x | 1.19x | 36.0% | 74.5% | 12.2% | 5.9% | |
| 53 | Beacon - Tower | $5,184,882 | $16,071,518 | $30,872,000 | 3.22x | 1.21x | 36.6% | 76.4% | 12.5% | 6.0% | |
| (1) | In the case of Loan No. 1, Subordinate Debt Cut-off Date Balance represents a Subordinate Companion Loan. In the case of Loan No. 3, Subordinate Debt Cut-off Date Balance represents two mezzanine loans. In the case of Loan No. 10, Subordinate Debt Cut-off Date Balance represents a Subordinate Companion Loan and a mezzanine loan. In the case of Loan No. 16, Subordinate Debt Cut-off Date Balance represents two Subordinate Companion Loans. In the case of Loan Nos. 23 and 33, Subordinate Debt Cut-off Date Balance represents a mezzanine loan. In the case of Loan Nos. 35, 39, 42, 46, 49 and 53, Subordinate Debt Cut-off Date Balance represents a Subordinate Companion Loan and a mezzanine loan. |
| (2) | In the case of Loan Nos. 10, 16, 23, 35, 39, 42, 46, 49 and 53, Mortgage Loan UW NCF DSCR, Mortgage Loan Cut-off Date LTV and Mortgage Loan UW NOI Debt Yield calculations include any related Pari Passu Companion Loans, where applicable, but exclude the related Subordinate Companion Loan(s) or mezzanine loan(s), as applicable. |
| (3) | In the case of Loan No. 33, the Mortgage Loan UW NCF DSCR and Total Debt UW NCF DSCR are calculated using the sum of principal and interest payments over the first 12 months based on the assumed principal payment schedule provided on Annex H to the Preliminary Prospectus. |
| (4) | In the case of Loan Nos. 3 and 33, the Mortgage Loan Cut-off Date LTV and the Total Debt Cut-off Date LTV are calculated by using an appraised value based on certain hypothetical assumptions. Refer to “Description of the Mortgage Pool—Assessments of Property Value and Condition” and “—Appraised Value” in the Preliminary Prospectus for additional details. |
THE INFORMATION IN THIS STRUCTURAL AND COLLATERAL TERM SHEET IS NOT COMPLETE AND MAY BE AMENDED PRIOR TO THE TIME OF SALE. THIS TERM SHEET IS NOT AN OFFER TO SELL THESE SECURITIES AND IT IS NOT A SOLICITATION OF AN OFFER TO BUY THESE SECURITIES IN ANY JURISDICTION WHERE THE OFFER OR SALE IS NOT PERMITTED.
| | |
9 of 151
| Structural and Collateral Term Sheet | Benchmark 2018-B2 |
| Collateral Characteristics | |
| Mortgaged Properties by Type(1) |
| Weighted Average | |||||||||||
| Property Type | Property Subtype | Number of Properties | Cut-off Date Principal Balance | % of IPB | Occupancy | UW NCF DSCR(2)(3) | UW NOI Debt Yield(2) | Cut-off Date LTV(2)(4) | Maturity Date LTV(2)(4) | ||
| Office | Suburban | 10 | $358,670,000 | 23.8% | 93.8% | 2.60x | 11.6% | 59.3% | 56.9% | ||
| CBD | 7 | 230,910,000 | 15.3 | 92.8% | 2.74x | 11.7% | 49.7% | 48.6% | |||
| Subtotal: | 17 | $589,580,000 | 39.1% | 93.4% | 2.65x | 11.7% | 55.5% | 53.6% | |||
| Hotel | Full Service | 5 | $154,354,509 | 10.2% | 75.8% | 2.06x | 13.7% | 55.9% | 47.1% | ||
| Select Service(5) | 3 | 61,251,569 | 4.1 | 65.3% | 1.73x | 12.6% | 66.9% | 57.1% | |||
| Limited Service | 5 | 41,144,091 | 2.7 | 73.7% | 1.74x | 12.6% | 62.5% | 54.7% | |||
| Extended Stay | 2 | 23,928,571 | 1.6 | 77.5% | 1.61x | 11.6% | 66.8% | 55.9% | |||
| Subtotal: | 15 | $280,678,740 | 18.6% | 73.3% | 1.90x | 13.1% | 60.2% | 51.2% | |||
| Multifamily | Garden | 4 | $123,362,093 | 8.2% | 95.4% | 3.07x | 11.9% | 50.4% | 45.8% | ||
| Mid-rise | 1 | 60,000,000 | 4.0 | 97.3% | 1.87x | 7.5% | 64.8% | 64.8% | |||
| High-rise(6) | 6 | 55,000,000 | 3.6 | 94.6% | 3.13x | 12.2% | 35.7% | 35.7% | |||
| Student | 1 | 15,000,000 | 1.0 | 99.2% | 1.55x | 10.0% | 63.4% | 55.9% | |||
| Subtotal: | 12 | $253,362,093 | 16.8% | 95.9% | 2.71x | 10.8% | 51.4% | 48.7% | |||
| Retail | Anchored | 6 | $125,606,828 | 8.3% | 98.5% | 1.51x | 10.1% | 67.3% | 55.7% | ||
| Unanchored | 1 | 40,000,000 | 2.7 | 100.0% | 1.75x | 7.3% | 50.0% | 50.0% | |||
| Super Regional Mall | 1 | 35,355,560 | 2.3 | 83.9% | 2.07x | 12.5% | 44.8% | 35.8% | |||
| Freestanding | 3 | 17,230,677 | 1.1 | 100.0% | 1.60x | 10.4% | 67.0% | 55.6% | |||
| Subtotal: | 11 | $218,193,066 | 14.5% | 96.5% | 1.65x | 10.0% | 60.5% | 51.4% | |||
| Mixed Use | Office/Retail | 2 | $83,000,000 | 5.5% | 100.0% | 1.70x | 7.4% | 57.3% | 57.3% | ||
| Subtotal: | 2 | $83,000,000 | 5.5% | 100.0% | 1.70x | 7.4% | 57.3% | 57.3% | |||
| Industrial | Warehouse/Distribution | 4 | $42,900,000 | 2.8% | 100.0% | 2.46x | 12.1% | 64.2% | 64.2% | ||
| Subtotal: | 4 | $42,900,000 | 2.8% | 100.0% | 2.46x | 12.1% | 64.2% | 64.2% | |||
| Other | Leased Fee | 1 | $24,500,000 | 1.6% | NAP | 1.69x | 7.4% | 74.2% | 74.2% | ||
| Subtotal: | 1 | $24,500,000 | 1.6% | NAP | 1.69x | 7.4% | 74.2% | 74.2% | |||
| Self Storage | Self Storage | 3 | $7,700,000 | 0.5% | 82.4% | 1.26x | 8.4% | 74.8% | 66.1% | ||
| Subtotal: | 3 | $7,700,000 | 0.5% | 82.4% | 1.26x | 8.4% | 74.8% | 66.1% | |||
| Manufactured Housing | Manufactured Housing | 2 | $7,100,000 | 0.5% | 95.4% | 1.41x | 9.0% | 74.6% | 61.0% | ||
| Subtotal: | 2 | $7,100,000 | 0.5% | 95.4% | 1.41x | 9.0% | 74.6% | 61.0% | |||
| Total / Weighted Average: | 67 | 1,507,013,899 | 100.0% | 91.0% | 2.29x | 11.2% | 57.2% | 53.0% | |||
| (1) | Because this table presents information relating to the mortgaged properties and not mortgage loans, the information for mortgage loans secured by more than one mortgaged property is based on allocated loan amounts. |
| (2) | In the case of Loan Nos. 3, 4, 5, 6, 7, 8, 10, 13, 14, 15, 16, 17, 18, 19, 21, 22, 23, 32, 35, 39, 42, 46, 49 and 53, the UW NCF DSCR, UW NOI Debt Yield, Cut-off Date LTV and Maturity Date LTV calculations include the related Pari Passu Companion Loan(s). In the case of Loan Nos. 1, 10, 16, 35, 39, 42, 46, 49 and 53, the UW NCF DSCR, UW NOI Debt Yield, Cut-off Date LTV and Maturity Date LTV calculations exclude the related Subordinate Companion Loan(s). |
| (3) | In the case of Loan No. 33, the UW NCF DSCR is calculated using the sum of principal and interest payments over the first 12 months based on the assumed principal payment schedule provided on Annex H to the Preliminary Prospectus. |
| (4) | In the case of Loan Nos. 3, 7, 9, 12, 19, 25, 29, 33, 36, 43 and 54, the Cut-off Date LTV and the Maturity Date LTV are calculated by using an appraised value based on certain hypothetical assumptions. Refer to “Description of the Mortgage Pool—Assessments of Property Value and Condition” and “—Appraised Value” in the Preliminary Prospectus for additional details. |
| (5) | Select Service includes the Hotel Indigo & Austin property, which is a dual-branded hotel consisting of a 134-room select-service hotel and a 171-room limited-service hotel. |
| (6) | High-rise includes the Beacon – Mercury / Garage property, which consists of a 126-unit multifamily property and a 510-space parking garage. Occupancy is for the multifamily portion of the property only. |
THE INFORMATION IN THIS STRUCTURAL AND COLLATERAL TERM SHEET IS NOT COMPLETE AND MAY BE AMENDED PRIOR TO THE TIME OF SALE. THIS TERM SHEET IS NOT AN OFFER TO SELL THESE SECURITIES AND IT IS NOT A SOLICITATION OF AN OFFER TO BUY THESE SECURITIES IN ANY JURISDICTION WHERE THE OFFER OR SALE IS NOT PERMITTED.
| | |
10 of 151
| Structural and Collateral Term Sheet | Benchmark 2018-B2 |
| Collateral Characteristics | |
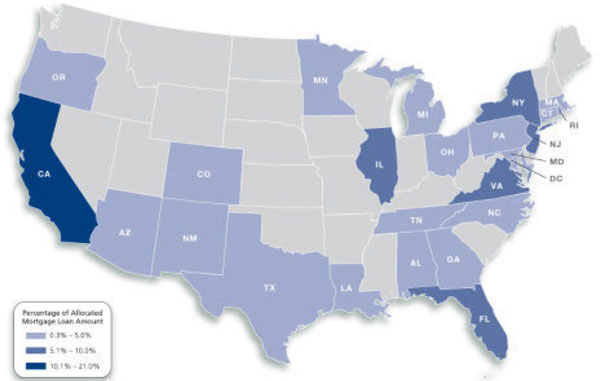
| Mortgaged Properties by Location(1) | |||||||||||||
Weighted Average | |||||||||||||
State | Number of Properties | Cut-off Date Principal Balance | % of IPB | Occupancy | UW NCF DSCR(2)(3) | UW NOI Debt Yield(2) | Cut-off Date LTV(2)(4) | Maturity Date LTV(2)(4) | |||||
| California | 8 | $316,392,671 | 21.0% | 92.7% | 3.26x | 13.7% | 44.1% | 42.0% | |||||
| New York | 3 | 138,000,000 | 9.2 | 99.4% | 2.37x | 9.6% | 48.2% | 48.2% | |||||
| Virginia | 2 | 104,200,000 | 6.9 | 95.2% | 1.71x | 8.3% | 65.6% | 63.3% | |||||
| Illinois | 2 | 104,000,000 | 6.9 | 84.2% | 2.37x | 11.4% | 62.5% | 62.5% | |||||
| Florida | 4 | 102,933,438 | 6.8 | 97.6% | 1.39x | 9.4% | 66.8% | 54.8% | |||||
| New Jersey | 7 | 85,000,000 | 5.6 | 95.6% | 2.75x | 11.1% | 44.3% | 44.3% | |||||
| Arizona | 2 | 71,500,000 | 4.7 | 97.7% | 2.34x | 9.9% | 60.5% | 57.7% | |||||
| Georgia | 8 | 68,300,230 | 4.5 | 86.8% | 1.65x | 11.0% | 67.8% | 56.4% | |||||
| Texas | 4 | 63,862,093 | 4.2 | 73.5% | 1.66x | 11.4% | 70.1% | 59.5% | |||||
| Minnesota | 4 | 60,000,000 | 4.0 | 62.7% | 1.50x | 12.2% | 66.7% | 55.4% | |||||
| North Carolina | 5 | 57,897,140 | 3.8 | 78.7% | 2.34x | 12.8% | 63.5% | 59.4% | |||||
| District of Columbia | 1 | 57,660,000 | 3.8 | 94.1% | 2.70x | 9.0% | 59.7% | 59.7% | |||||
| Massachusetts | 2 | 48,991,250 | 3.3 | 100.0% | 2.17x | 9.3% | 56.6% | 56.6% | |||||
| Ohio | 2 | 39,500,000 | 2.6 | 93.8% | 1.82x | 11.9% | 72.8% | 62.2% | |||||
| Pennsylvania | 2 | 38,033,560 | 2.5 | 85.0% | 2.05x | 12.4% | 45.5% | 36.8% | |||||
| Maryland | 2 | 29,820,000 | 2.0 | 99.6% | 2.00x | 11.0% | 63.8% | 60.0% | |||||
| Connecticut | 1 | 24,750,000 | 1.6 | 94.3% | 1.78x | 11.3% | 61.9% | 56.4% | |||||
| Michigan | 1 | 23,600,000 | 1.6 | 96.8% | 1.45x | 9.9% | 72.0% | 63.7% | |||||
| Oregon | 1 | 19,500,000 | 1.3 | 100.0% | 1.68x | 10.5% | 63.3% | 57.5% | |||||
| Louisiana | 1 | 12,900,000 | 0.9 | 72.5% | 1.83x | 13.2% | 54.4% | 52.0% | |||||
| Rhode Island | 1 | 10,775,000 | 0.7 | 95.4% | 2.04x | 13.4% | 68.2% | 59.5% | |||||
| New Mexico | 1 | 9,482,984 | 0.6 | 80.9% | 1.48x | 10.4% | 71.8% | 60.5% | |||||
| Alabama | 1 | 8,500,000 | 0.6 | 91.4% | 1.94x | 12.4% | 68.8% | 60.3% | |||||
| Tennessee | 1 | 7,144,426 | 0.5 | 71.4% | 2.05x | 15.2% | 58.6% | 48.1% | |||||
| Colorado | 1 | 4,271,107 | 0.3 | 67.9% | 1.89x | 12.3% | 59.7% | 49.4% | |||||
| Total / Weighted Average: | 67 | $1,507,013,899 | 100.0% | 91.0% | 2.29x | 11.2% | 57.2% | 53.0% | |||||
| (1) | Because this table presents information relating to the mortgaged properties and not mortgage loans, the information for mortgage loans secured by more than one mortgaged property is based on allocated loan amounts. |
| (2) | In the case of Loan Nos. 3, 4, 5, 6, 7, 8, 10, 13, 14, 15, 16, 17, 18, 19, 21, 22, 23, 32, 35, 39, 42, 46, 49 and 53, the UW NCF DSCR, UW NOI Debt Yield, Cut-off Date LTV and Maturity Date LTV calculations include the related Pari Passu Companion Loan(s). In the case of Loan Nos. 1, 10, 16, 35, 39, 42, 46, 49 and 53, the UW NCF DSCR, UW NOI Debt Yield, Cut-off Date LTV and Maturity Date LTV calculations exclude the related Subordinate Companion Loan(s). |
| (3) | In the case of Loan No. 33, the UW NCF DSCR is calculated using the sum of principal and interest payments over the first 12 months based on the assumed principal payment schedule provided on Annex H to the Preliminary Prospectus. |
| (4) | In the case of Loan Nos. 3, 7, 9, 12, 19, 25, 29, 33, 36, 43 and 54, the Cut-off Date LTV and the Maturity Date LTV are calculated by using an appraised value based on certain hypothetical assumptions. Refer to “Description of the Mortgage Pool—Assessments of Property Value and Condition” and “—Appraised Value” in the Preliminary Prospectus for additional details. |
THE INFORMATION IN THIS STRUCTURAL AND COLLATERAL TERM SHEET IS NOT COMPLETE AND MAY BE AMENDED PRIOR TO THE TIME OF SALE. THIS TERM SHEET IS NOT AN OFFER TO SELL THESE SECURITIES AND IT IS NOT A SOLICITATION OF AN OFFER TO BUY THESE SECURITIES IN ANY JURISDICTION WHERE THE OFFER OR SALE IS NOT PERMITTED.
| | |
11 of 151
| Structural and Collateral Term Sheet | Benchmark 2018-B2 |
| Collateral Characteristics |
| Cut-off Date Principal Balance |
Weighted Average | |||||||||||
| Range of Cut-off Date Principal Balances | Number of Loans | Cut-off Date Principal Balance | % of IPB | Mortgage Rate | Remaining Loan Term(1) | UW NCF DSCR(2)(3) | UW NOI DY(2) | Cut-off Date LTV(2)(4) | Maturity Date LTV(1)(2)(4) | ||
| $2,678,000 | - | $9,999,999 | 16 | $108,867,342 | 7.2% | 4.55667% | 101 | 2.15x | 11.4% | 58.3% | 51.8% |
| $10,000,000 | - | $19,999,999 | 14 | 201,458,326 | 13.4 | 4.65740% | 108 | 1.85x | 11.6% | 63.5% | 54.6% |
| $20,000,000 | - | $24,999,999 | 5 | 117,850,000 | 7.8 | 4.50132% | 119 | 1.61x | 9.7% | 70.3% | 64.0% |
| $25,000,000 | - | $49,999,999 | 12 | 461,955,560 | 30.7 | 4.30279% | 109 | 2.11x | 10.5% | 56.7% | 54.1% |
| $50,000,000 | - | $79,500,000 | 10 | 616,882,671 | 40.9 | 3.89940% | 96 | 2.72x | 11.9% | 52.9% | 49.7% |
| Total / Weighted Average: | 57 | $1,507,013,899 | 100.0% | 4.21894% | 104 | 2.29x | 11.2% | 57.2% | 53.0% | ||
| Mortgage Interest Rates |
Weighted Average | |||||||||||
| Range of Mortgage Interest Rates | Number of Loans | Cut-off Date Principal Balance | % of IPB | Mortgage Rate | Remaining Loan Term(1) | UW NCF DSCR(2)(3) | UW NOI DY(2) | Cut-off Date LTV(2)(4) | Maturity Date LTV(1)(2)(4) | ||
| 2.94050% | - | 3.99999% | 14 | $478,460,000 | 31.7% | 3.53234% | 93 | 3.20x | 11.5% | 48.4% | 48.4% |
| 4.00000% | - | 4.49999% | 16 | 522,373,231 | 34.7 | 4.28369% | 105 | 2.09x | 11.2% | 55.6% | 52.8% |
| 4.50000% | - | 4.99999% | 22 | 436,836,576 | 29.0 | 4.70135% | 112 | 1.65x | 11.0% | 67.0% | 57.3% |
| 5.00000% | - | 5.71000% | 5 | 69,344,091 | 4.6 | 5.42948% | 120 | 1.60x | 11.3% | 68.3% | 58.6% |
| Total / Weighted Average: | 57 | $1,507,013,899 | 100.0% | 4.21894% | 104 | 2.29x | 11.2% | 57.2% | 53.0% | ||
| Original Term to Maturity in Months |
Weighted Average | |||||||||
| Original Term to Maturity in Months | Number of Loans | Cut-off Date Principal Balance | % of IPB | Mortgage Rate | Remaining Loan Term(1) | UW NCF DSCR(2)(3) | UW NOI DY(2) | Cut-off Date LTV(2)(4) | Maturity Date LTV(1)(2)(4) |
| 60 | 12 | $335,460,000 | 22.3% | 3.87927% | 58 | 3.08x | 12.3% | 50.9% | 50.8% |
| 84 | 1 | 60,000,000 | 4.0 | 3.88000% | 82 | 1.87x | 7.5% | 64.8% | 64.8% |
| 120 | 44 | 1,111,553,899 | 73.8 | 4.33974% | 119 | 2.08x | 11.1% | 58.7% | 53.0% |
| Total / Weighted Average: | 57 | $1,507,013,899 | 100.0% | 4.21894% | 104 | 2.29x | 11.2% | 57.2% | 53.0% |
| Remaining Term to Maturity in Months | |||||||||
| Weighted Average | |||||||||||
| Range of Remaining Term to Maturity in Months | Number of Loans | Cut-off Date Principal Balance | % of IPB | Mortgage Rate | Remaining Loan Term(1) | UW NCF DSCR(2)(3) | UW NOI DY(2) | Cut-off Date LTV(2)(4) | Maturity Date LTV(1)(2)(4) | ||
| 52 | - | 84 | 13 | $395,460,000 | 26.2% | 3.87938% | 62 | 2.90x | 11.6% | 53.0% | 52.9% |
| 85 | - | 119 | 34 | 852,963,899 | 56.6 | 4.21966% | 118 | 2.25x | 11.6% | 56.8% | 51.9% |
| 120 | - | 120 | 10 | 258,590,000 | 17.2 | 4.73583% | 120 | 1.50x | 9.4% | 65.2% | 56.7% |
| Total / Weighted Average: | 57 | $1,507,013,899 | 100.0% | 4.21894% | 104 | 2.29x | 11.2% | 57.2% | 53.0% | ||
| (1) | In the case of Loan Nos. 3 and 15, each with an anticipated repayment date, Remaining Loan Term and Maturity Date LTV are calculated as of the related anticipated repayment date. |
| (2) | In the case of Loan Nos. 3, 4, 5, 6, 7, 8, 10, 13, 14, 15, 16, 17, 18, 19, 21, 22, 23, 32, 35, 39, 42, 46, 49 and 53, the UW NCF DSCR, UW NOI Debt Yield, Cut-off Date LTV and Maturity Date LTV calculations include the related Pari Passu Companion Loan(s). In the case of Loan Nos. 1, 10, 16, 35, 39, 42, 46, 49 and 53, the UW NCF DSCR, UW NOI Debt Yield, Cut-off Date LTV and Maturity Date LTV calculations exclude the related Subordinate Companion Loan(s). |
| (3) | In the case of Loan No. 33, the UW NCF DSCR is calculated using the sum of principal and interest payments over the first 12 months based on the assumed principal payment schedule provided on Annex H to the Preliminary Prospectus. |
| (4) | In the case of Loan Nos. 3, 7, 9, 12, 19, 25, 29, 33, 36, 43 and 54, the Cut-off Date LTV and the Maturity Date LTV are calculated by using an appraised value based on certain hypothetical assumptions. Refer to “Description of the Mortgage Pool—Assessments of Property Value and Condition” and “—Appraised Value” in the Preliminary Prospectus for additional details. |
THE INFORMATION IN THIS STRUCTURAL AND COLLATERAL TERM SHEET IS NOT COMPLETE AND MAY BE AMENDED PRIOR TO THE TIME OF SALE. THIS TERM SHEET IS NOT AN OFFER TO SELL THESE SECURITIES AND IT IS NOT A SOLICITATION OF AN OFFER TO BUY THESE SECURITIES IN ANY JURISDICTION WHERE THE OFFER OR SALE IS NOT PERMITTED.
| | |
12 of 151
| Structural and Collateral Term Sheet | Benchmark 2018-B2 |
| Collateral Characteristics |
| Original Amortization Term in Months |
| Weighted Average | |||||||||
| Original Amortization Term in Months | Number of Loans | Cut-off Date Principal Balance | % of IPB | Mortgage Rate | Remaining Loan Term(1) | UW NCF DSCR(2)(3) | UW NOI DY(2) | Cut-off Date LTV(2)(4) | Maturity Date LTV(1)(2)(4) |
| Interest Only | 24 | $826,530,000 | 54.8% | 3.87451% | 92 | 2.81x | 11.2% | 51.8% | 51.8% |
| 300 | 2 | 79,967,553 | 5.3 | 4.73326% | 117 | 1.51x | 12.1% | 66.7% | 53.9% |
| 360 | 31 | 600,516,346 | 39.8 | 4.62450% | 117 | 1.68x | 11.2% | 63.4% | 54.4% |
| Total / Weighted Average: | 57 | $1,507,013,899 | 100.0% | 4.21894% | 104 | 2.29x | 11.2% | 57.2% | 53.0% |
| Remaining Amortization Term in Months |
| Weighted Average | |||||||||||
| Range of Remaining Amortization Term in Months | Number of Loans | Cut-off Date Principal Balance | % of IPB | Mortgage Rate | Remaining Loan Term(1) | UW NCF DSCR(2)(3) | UW NOI DY(2) | Cut-off Date LTV(2)(4) | Maturity Date LTV(1)(2)(4) | ||
| Interest Only | 24 | 826,530,000 | 54.8% | 3.87451% | 92 | 2.81x | 11.2% | 51.8% | 51.8% | ||
| 299 | - | 356 | 3 | 87,865,942 | 5.8 | 4.75076% | 117 | 1.52x | 12.1% | 67.2% | 54.4% |
| 357 | - | 360 | 30 | 592,617,956 | 39.3 | 4.62045% | 117 | 1.68x | 11.2% | 63.3% | 54.3% |
| Total / Weighted Average: | 57 | $1,507,013,899 | 100.0% | 4.21894% | 104 | 2.29x | 11.2% | 57.2% | 53.0% | ||
| Amortization Types |
Weighted Average | |||||||||
| Amortization Types | Number of Loans | Cut-off Date Principal Balance | % of IPB | Mortgage Rate | Remaining Loan Term(1) | UW NCF DSCR(2)(3) | UW NOI DY(2) | Cut-off Date LTV(2)(4) | Maturity Date LTV(1)(2)(4) |
| Interest Only | 22 | $717,530,000 | 47.6% | 3.94080% | 88 | 2.72x | 11.1% | 52.2% | 52.2% |
| IO-Balloon | 17 | 381,603,000 | 25.3 | 4.62239% | 116 | 1.61x | 10.9% | 67.1% | 59.1% |
| Balloon | 16 | 298,880,899 | 19.8 | 4.65629% | 119 | 1.73x | 11.8% | 59.5% | 48.2% |
| ARD-Interest Only | 2 | 109,000,000 | 7.2 | 3.43815% | 119 | 3.39x | 11.9% | 49.4% | 49.4% |
| Total / Weighted Average: | 57 | $1,507,013,899 | 100.0% | 4.21894% | 104 | 2.29x | 11.2% | 57.2% | 53.0% |
| Underwritten Net Cash Flow Debt Service Coverage Ratios(2)(3) |
| Weighted Average | |||||||||||
| Range of Underwritten Net Cash Flow Debt Service Coverage Ratios | Number of Loans |
Cut-off Date | % of IPB | Mortgage Rate | Remaining Loan Term(1) | UW NCF DSCR(2)(3) | UW NOI DY(2) | Cut-off Date LTV(2)(4) | Maturity Date LTV(1)(2)(4) | ||
| 1.26x | - | 1.49x | 11 | $280,297,824 | 18.6% | 4.63885% | 119 | 1.39x | 8.6% | 66.4% | 58.8% |
| 1.50x | - | 1.74x | 13 | 273,899,310 | 18.2 | 4.71259% | 117 | 1.62x | 11.2% | 68.6% | 58.6% |
| 1.75x | - | 1.99x | 8 | 167,589,107 | 11.1 | 4.30326% | 101 | 1.82x | 9.4% | 59.9% | 57.3% |
| 2.00x | - | 2.24x | 8 | 149,444,986 | 9.9 | 4.19826% | 118 | 2.05x | 10.8% | 57.2% | 52.8% |
| 2.25x | - | 5.01x | 17 | 635,782,671 | 42.2 | 3.80377% | 88 | 3.16x | 13.0% | 47.6% | 46.8% |
| Total / Weighted Average: | 57 | $1,507,013,899 | 100.0% | 4.21894% | 104 | 2.29x | 11.2% | 57.2% | 53.0% | ||
| (1) | In the case of Loan Nos. 3 and 15, each with an anticipated repayment date, Remaining Loan Term and Maturity Date LTV are calculated as of the related anticipated repayment date. |
| (2) | In the case of Loan Nos. 3, 4, 5, 6, 7, 8, 10, 13, 14, 15, 16, 17, 18, 19, 21, 22, 23, 32, 35, 39, 42, 46, 49 and 53, the UW NCF DSCR, UW NOI Debt Yield, Cut-off Date LTV and Maturity Date LTV calculations include the related Pari Passu Companion Loan(s). In the case of Loan Nos. 1, 10, 16, 35, 39, 42, 46, 49 and 53, the UW NCF DSCR, UW NOI Debt Yield, Cut-off Date LTV and Maturity Date LTV calculations exclude the related Subordinate Companion Loan(s). |
| (3) | In the case of Loan No. 33, the UW NCF DSCR is calculated using the sum of principal and interest payments over the first based on the assumed principal payment schedule provided on Annex H to the Preliminary Prospectus. |
| (4) | In the case of Loan Nos. 3, 7, 9, 12, 19, 25, 29, 33, 36, 43 and 54, the Cut-off Date LTV and the Maturity Date LTV are calculated by using an appraised value based on certain hypothetical assumptions. Refer to “Description of the Mortgage Pool—Assessments of Property Value and Condition” and “—Appraised Value” in the Preliminary Prospectus for additional details. |
THE INFORMATION IN THIS STRUCTURAL AND COLLATERAL TERM SHEET IS NOT COMPLETE AND MAY BE AMENDED PRIOR TO THE TIME OF SALE. THIS TERM SHEET IS NOT AN OFFER TO SELL THESE SECURITIES AND IT IS NOT A SOLICITATION OF AN OFFER TO BUY THESE SECURITIES IN ANY JURISDICTION WHERE THE OFFER OR SALE IS NOT PERMITTED.
| | |
13 of 151
| Structural and Collateral Term Sheet | Benchmark 2018-B2 |
| Collateral Characteristics |
| LTV Ratios as of the Cut-off Date(2)(4) |
| Weighted Average | |||||||||||
| Range of Cut-off Date LTVs | Number of Loans | Cut-off Date Principal Balance | % of IPB | Mortgage Rate | Remaining Loan Term(1) | UW NCF DSCR(2)(3) | UW NOI DY(2) | Cut-off Date LTV(2)(4) | Maturity Date LTV(1)(2)(4) | ||
| 27.9% | - | 49.9% | 12 | $365,778,231 | 24.3% | 3.69977% | 100 | 3.37x | 14.0% | 37.3% | 35.0% |
| 50.0% | - | 59.9% | 10 | 334,453,533 | 22.2 | 3.93266% | 92 | 2.55x | 10.8% | 57.0% | 56.5% |
| 60.0% | - | 64.9% | 13 | 398,310,000 | 26.4 | 4.40280% | 102 | 1.79x | 9.4% | 63.0% | 59.1% |
| 65.0% | - | 69.9% | 10 | 227,428,668 | 15.1 | 4.78501% | 118 | 1.61x | 11.5% | 67.4% | 57.2% |
| 70.0% | - | 74.8% | 12 | 181,043,466 | 12.0 | 4.68109% | 119 | 1.59x | 10.0% | 72.7% | 64.0% |
| Total / Weighted Average: | 57 | $1,507,013,899 | 100.0% | 4.21894% | 104 | 2.29x | 11.2% | 57.2% | 53.0% | ||
| LTV Ratios as of the Maturity Date(1)(2)(4) |
Weighted Average | |||||||||||
| Range of Maturity Date LTVs | Number of Loans | Cut-off Date Principal Balance | % of IPB | Mortgage Rate | Remaining Loan Term(1) | UW NCF DSCR(2)(3) | UW NOI DY(2) | Cut-off Date LTV(2)(4) | Maturity Date LTV(1)(2)(4) | ||
| 27.9% | - | 44.9% | 12 | $365,778,231 | 24.3% | 3.69977% | 100 | 3.37x | 14.0% | 37.3% | 35.0% |
| 45.0% | - | 49.9% | 3 | 31,383,086 | 2.1 | 4.80929% | 119 | 1.70x | 12.7% | 63.8% | 49.0% |
| 50.0% | - | 54.9% | 6 | 175,068,000 | 11.6 | 4.49422% | 115 | 1.64x | 9.0% | 58.2% | 52.3% |
| 55.0% | - | 59.9% | 17 | 497,369,505 | 33.0 | 4.26726% | 102 | 2.18x | 11.3% | 62.8% | 57.8% |
| 60.0% | - | 74.2% | 19 | 437,415,076 | 29.0 | 4.44560% | 104 | 1.82x | 9.6% | 66.7% | 63.0% |
| Total / Weighted Average: | 57 | $1,507,013,899 | 100.0% | 4.21894% | 104 | 2.29x | 11.2% | 57.2% | 53.0% | ||
| Prepayment Protection |
Weighted Average | |||||||||
| Prepayment Protection | Number of Loans | Cut-off Date Principal Balance | % of IPB | Mortgage Rate | Remaining Loan Term(1) | UW NCF DSCR(2)(3) | UW NOI DY(2) | Cut-off Date LTV(2)(4) | Maturity Date LTV(1)(2)(4) |
| Defeasance(5) | 36 | $925,441,228 | 61.4% | 4.31105% | 102 | 2.21x | 11.2% | 58.6% | 54.3% |
| Yield Maintenance | 14 | 366,222,671 | 24.3 | 4.09830% | 110 | 2.31x | 11.3% | 54.4% | 49.5% |
| Defeasance or Yield Maintenance | 7 | 215,350,000 | 14.3 | 4.02822% | 99 | 2.60x | 11.3% | 56.1% | 53.0% |
| Total / Weighted Average: | 57 | $1,507,013,899 | 100.0% | 4.21894% | 104 | 2.29x | 11.2% | 57.2% | 53.0% |
| Loan Purpose |
Weighted Average | |||||||||
| Loan Purpose | Number of Loans | Cut-off Date Principal Balance | % of IPB | Mortgage Rate | Remaining Loan Term(1) | UW NCF DSCR(2)(3) | UW NOI DY(2) | Cut-off Date LTV(2)(4) | Maturity Date LTV(1)(2)(4) |
| Refinance | 31 | $818,256,561 | 54.3% | 4.18093% | 110 | 2.36x | 11.6% | 52.1% | 46.9% |
| Acquisition | 24 | 646,057,337 | 42.9 | 4.27563% | 94 | 2.22x | 11.0% | 63.7% | 60.5% |
| Recapitalization | 1 | 35,000,000 | 2.3 | 3.90000% | 119 | 2.05x | 8.2% | 53.5% | 53.5% |
| Acquisition/Recapitalization | 1 | 7,700,000 | 0.5 | 4.95000% | 120 | 1.26x | 8.4% | 74.8% | 66.1% |
| Total / Weighted Average: | 57 | $1,507,013,899 | 100.0% | 4.21894% | 104 | 2.29x | 11.2% | 57.2% | 53.0% |
| (1) | In the case of Loan Nos. 3 and 15, each with an anticipated repayment date, Remaining Loan Term and Maturity Date LTV are calculated as of the related anticipated repayment date. |
| (2) | In the case of Loan Nos. 3, 4, 5, 6, 7, 8, 10, 13, 14, 15, 16, 17, 18, 19, 21, 22, 23, 32, 35, 39, 42, 46, 49 and 53, the UW NCF DSCR, UW NOI Debt Yield, Cut-off Date LTV and Maturity Date LTV calculations include the related Pari Passu Companion Loan(s). In the case of Loan Nos. 1, 10, 16, 35, 39, 42, 46, 49 and 53, the UW NCF DSCR, UW NOI Debt Yield, Cut-off Date LTV and Maturity Date LTV calculations exclude the related Subordinate Companion Loan(s). |
| (3) | In the case of Loan No. 33, the UW NCF DSCR is calculated using the sum of principal and interest payments over the first 12 months based on the assumed principal payment schedule provided on Annex H to the Preliminary Prospectus. |
| (4) | In the case of Loan Nos. 3, 7, 9, 12, 19, 25, 29, 33, 36, 43 and 54, the Cut-off Date LTV and the Maturity Date LTV are calculated by using an appraised value based on certain hypothetical assumptions. Refer to “Description of the Mortgage Pool—Assessments of Property Value and Condition” and “—Appraised Value” in the Preliminary Prospectus for additional details. |
| (5) | In the case of Loan No. 4, 17, 18 and 22 the loan documents permit the borrowers to prepay the related loan with yield maintenance premium in the event the defeasance lockout period has not expired after certain dates. See the “Description of the Mortgage Pool—Certain Terms of the Mortgage Loans—Defeasance; Collateral Substitution” in the Preliminary Prospectus. |
THE INFORMATION IN THIS STRUCTURAL AND COLLATERAL TERM SHEET IS NOT COMPLETE AND MAY BE AMENDED PRIOR TO THE TIME OF SALE. THIS TERM SHEET IS NOT AN OFFER TO SELL THESE SECURITIES AND IT IS NOT A SOLICITATION OF AN OFFER TO BUY THESE SECURITIES IN ANY JURISDICTION WHERE THE OFFER OR SALE IS NOT PERMITTED.
| | |
14 of 151
| Structural and Collateral Term Sheet | Benchmark 2018-B2 |
| Collateral Characteristics |
| Previous Securitization History(1) |
| No. | Loan Name | Cut-off Date Principal Balance | % of IPB | Location | Property Type | Previous Securitization |
| 2 | Promenade Shops at Aventura | $70,000,000 | 4.6% | Aventura, FL | Retail | JPMCC 2010-C2 |
| 5 | Rochester Hotel Portfolio | 60,000,000 | 4.0 | Rochester, MN | Hotel | COMM 2013-CCRE6 |
| 10 | Worldwide Plaza | 50,000,000 | 3.3 | New York, NY | Office | COMM 2013-WWP |
| 14 | BlueLinx Portfolio | 42,900,000 | 2.8 | Various | Industrial | WBCMT 2006-C27; BACM 2006-4 |
| 17 | 599 Broadway | 40,000,000 | 2.7 | New York, NY | Retail | Prima 2011-1 |
| 25 | Village Green of Waterford | 23,600,000 | 1.6 | Waterford, MI | Multifamily | FREMF 2014-K40; FHMS K040 |
| 26 | Gateway Plaza | 23,500,000 | 1.6 | Santa Clarita, CA | Office | MSC 2008-T29 |
| 32 | Towers at University Town Center | 15,000,000 | 1.0 | Hyattsville, MD | Multifamily | MLCFC 2007-8 |
| 38 | Coral Club Apartments | 11,762,093 | 0.8 | Houston, TX | Multifamily | GSMS 2013-GC14 |
| 45 | Homewood Commons | 8,500,000 | 0.6 | Homewood, AL | Retail | WBCMT 2007-C32 |
| Total | $345,262,093 | 22.9% |
| (1) | The table above represents the properties for which the previously existing debt was securitized, based on information provided by the related borrower or obtained through searches of a third-party database. |
THE INFORMATION IN THIS STRUCTURAL AND COLLATERAL TERM SHEET IS NOT COMPLETE AND MAY BE AMENDED PRIOR TO THE TIME OF SALE. THIS TERM SHEET IS NOT AN OFFER TO SELL THESE SECURITIES AND IT IS NOT A SOLICITATION OF AN OFFER TO BUY THESE SECURITIES IN ANY JURISDICTION WHERE THE OFFER OR SALE IS NOT PERMITTED.
| | |
15 of 151
| Structural and Collateral Term Sheet | Benchmark 2018-B2 |
| Class A-2(1) |
No. | Loan Name | Location | Cut-off Date | % of | Maturity | % of | Original | Remaining | UW | UW | Cut-off | Maturity |
| 1 | Central Park of Lisle | Lisle, IL | $79,500,000 | 5.3% | $79,500,000 | 23.3% | 60 | 59 | 2.58x | 12.6% | 58.9% | 58.9% |
| 7 | Sentinel Square II | Washington, DC | $57,660,000 | 3.8 | $57,660,000 | 16.9 | 60 | 59 | 2.70x | 9.0% | 59.7% | 59.7% |
| 8 | The Woods | San Jose, CA | $57,500,000 | 3.8 | $57,500,000 | 16.8 | 60 | 58 | 5.01x | 15.2% | 29.6% | 29.6% |
| 14 | BlueLinx Portfolio | Various, Various | $42,900,000 | 2.8 | $42,900,000 | 12.6 | 60 | 60 | 2.46x | 12.1% | 64.2% | 64.2% |
| 22 | Marriott Charlotte City Center | Charlotte, NC | $30,000,000 | 2.0 | $30,000,000 | 8.8 | 60 | 52 | 2.76x | 12.7% | 60.6% | 60.6% |
| 35 | Beacon - Criterion | Jersey City, NJ | $13,305,255 | 0.9 | $13,305,255 | 3.9 | 60 | 59 | 3.01x | 11.7% | 37.0% | 37.0% |
| 36 | Holiday Inn Express New Orleans | New Orleans, LA | $12,900,000 | 0.9 | $12,321,787 | 3.6 | 60 | 59 | 1.83x | 13.2% | 54.4% | 52.0% |
| 39 | Beacon - Hague | Jersey City, NJ | $11,420,588 | 0.8 | $11,420,588 | 3.3 | 60 | 59 | 2.87x | 11.2% | 37.1% | 37.1% |
| 42 | Beacon - Paramount | Jersey City, NJ | $9,703,725 | 0.6 | $9,703,725 | 2.8 | 60 | 59 | 3.37x | 13.1% | 33.0% | 33.0% |
| 46 | Beacon - Mercury / Garage | Jersey City, NJ | $7,968,529 | 0.5 | $7,968,529 | 2.3 | 60 | 59 | 3.36x | 13.2% | 33.9% | 33.9% |
| 49 | Beacon - Orpheum | Jersey City, NJ | $7,417,020 | 0.5 | $7,417,020 | 2.2 | 60 | 59 | 3.14x | 12.2% | 36.0% | 36.0% |
| 53 | Beacon - Tower | Jersey City, NJ | $5,184,882 | 0.3 | $5,184,882 | 1.5 | 60 | 59 | 3.22x | 12.5% | 36.6% | 36.6% |
| Total / Weighted Average: | $335,460,000 | 22.3% | $334,881,787 | 98.0% | 60 | 58 | 3.08x | 12.3% | 50.9% | 50.8% | ||
| (1) | The table above presents the mortgage loans whose balloon payments would be applied to pay down the certificate balance of the Class A-2 Certificates, assuming a 0% CPR and applying the “Modeling Assumptions” described in the Preliminary Prospectus, including the assumptions that (i) none of the mortgage loans in the pool experience prepayments, defaults or losses; (ii) there are no extensions of maturity dates of any mortgage loans in the pool; and (iii) each mortgage loan in the pool is paid in full on its stated maturity date. Each Class of Certificates, including the Class A-2 Certificates, evidences undivided ownership interests in the entire pool of mortgage loans. Debt service coverage ratio, debt yield and loan-to-value ratio information does not take into account subordinate debt (whether or not secured by the mortgaged property), if any, that exists or is allowed under the terms of any mortgage loan. See Annex A-1 to the Preliminary Prospectus. |
| (2) | Reflects the percentage equal to the Maturity Date Balance divided by the initial Class A-2 Certificate Balance. |
| (3) | In the case of Loan Nos. 7, 8, 14, 22, 35, 39, 42, 46, 49 and 53, the UW NCF DSCR, UW NOI Debt Yield, Cut-off Date LTV and Maturity Date LTV calculations include the related Pari Passu Companion Loan(s). In the case of Loan Nos. 1, 35, 39, 42, 46, 49 and 53, the UW NCF DSCR, UW NOI Debt Yield, Cut-off Date LTV and Maturity Date LTV calculations exclude the related Subordinate Companion Loan(s). |
| (4) | In the case of Loan Nos. 7 and 36, the Cut-off Date LTV and the Maturity Date LTV are calculated by using an appraised value based on certain hypothetical assumptions. Refer to “Description of the Mortgage Pool—Assessments of Property Value and Condition” and “—Appraised Value” in the Preliminary Prospectus for additional details. |
THE INFORMATION IN THIS STRUCTURAL AND COLLATERAL TERM SHEET IS NOT COMPLETE AND MAY BE AMENDED PRIOR TO THE TIME OF SALE. THIS TERM SHEET IS NOT AN OFFER TO SELL THESE SECURITIES AND IT IS NOT A SOLICITATION OF AN OFFER TO BUY THESE SECURITIES IN ANY JURISDICTION WHERE THE OFFER OR SALE IS NOT PERMITTED.
| | |
16 of 151
| Structural and Collateral Term Sheet | Benchmark 2018-B2 |
| Class A-3(1) |
No. | Loan Name | Location | Cut-off Date | % of | Maturity | % of | Original | Remaining | UW | UW | Cut-off | Maturity |
| 4 | EOS 21 | Alexandria, VA | $60,000,000 | 4.0% | $60,000,000 | 100.0% | 84 | 82 | 1.87x | 7.5% | 64.8% | 64.8% |
| Total / Weighted Average: | $60,000,000 | 4.0% | $60,000,000 | 100.0% | 84 | 82 | 1.87x | 7.5% | 64.8% | 64.8% |
| (1) | The table above presents the mortgage loans whose balloon payments would be applied to pay down the certificate balance of the Class A-3 Certificates, assuming a 0% CPR and applying the “Modeling Assumptions” described in the Preliminary Prospectus, including the assumptions that (i) none of the mortgage loans in the pool experience prepayments, defaults or losses; (ii) there are no extensions of maturity dates of any mortgage loans in the pool; and (iii) each mortgage loan in the pool is paid in full on its stated maturity date. Each Class of Certificates, including the Class A-3 Certificates, evidences undivided ownership interests in the entire pool of mortgage loans. Debt service coverage ratio, debt yield and loan-to-value ratio information does not take into account subordinate debt (whether or not secured by the mortgaged property), if any, that is allowed under the terms of any mortgage loan. See Annex A-1 to the Preliminary Prospectus. |
| (2) | Reflects the percentage equal to the Maturity Date Balance divided by the initial Class A-3 Certificate Balance. |
THE INFORMATION IN THIS STRUCTURAL AND COLLATERAL TERM SHEET IS NOT COMPLETE AND MAY BE AMENDED PRIOR TO THE TIME OF SALE. THIS TERM SHEET IS NOT AN OFFER TO SELL THESE SECURITIES AND IT IS NOT A SOLICITATION OF AN OFFER TO BUY THESE SECURITIES IN ANY JURISDICTION WHERE THE OFFER OR SALE IS NOT PERMITTED.
| | |
17 of 151
| Structural and Collateral Term Sheet | Benchmark 2018-B2 | |
| Structural Overview | ||
| ■ Accrual: | Each Class of Certificates (other than the Class S and Class R Certificates) will accrue interest on a 30/360 basis. The Class S and Class R Certificates will not accrue interest. On each Distribution Date, any excess interest collected in respect of any mortgage loan in the trust with an anticipated repayment date, solely to the extent received from the related borrower during the related collection period, will be distributed to the holders of the Class S Certificates. | |
■ Distribution of Interest:
| On each Distribution Date, accrued interest for each Class of Certificates (other than the Class S and Class R) at the applicable pass-through rate will be distributed in the following order of priority to the extent of Available Funds: first, to the Class A-1, Class A-2, Class A-3, Class A-4, Class A-5, Class A-SB, Class X-A, Class X-B and Class X-D Certificates (the “Senior Certificates”), on apro rata basis, based on the interest entitlement for each such Class on such date, and then to the Class A-S, Class B, Class C, Class D, Class E-RR, Class F-RR, Class G-RR and Class NR-RR Certificates, in that order, in each case until the interest entitlement for such date payable to each such Class is paid in full.
The pass-through rate applicable to the Class A-1, Class A-2, Class A-3, Class A-4, Class A-5, Class A-SB, Class A-S, Class B, Class C, Class D, Class E-RR, Class F-RR, Class G-RR and Class NR-RR Certificates on each Distribution Date, will be aper annum rate equal to one of (i) a fixed rate, (ii) the weighted average of the net mortgage rates on the mortgage loans (in each case adjusted, if necessary, to accrue on the basis of a 360-day year consisting of twelve 30-day months), (iii) the lesser of a specified fixed pass-through rate and the rate described in clause (ii) above or (iv) the rate described in clause (ii) above less a specified percentage.
The pass-through rate for the Class X-A Certificates for any Distribution Date will be aper annum rate equal to the excess, if any, of (a) the weighted average of the net mortgage rates on the mortgage loans (in each case adjusted, if necessary, to accrue on the basis of a 360-day year consisting of twelve 30-day months), over (b) the weighted average of the pass-through rates on the Class A-1, Class A-2, Class A-3, Class A-4, Class A-5, Class A-SB and Class A-S Certificates for the related Distribution Date, weighted on the basis of their respective Certificate Balances outstanding immediately prior to that Distribution Date.
The pass-through rate for the Class X-B Certificates for any Distribution Date will be aper annum rate equal to the excess, if any, of (a) the weighted average of the net mortgage rates on the mortgage loans (in each case adjusted, if necessary, to accrue on the basis of a 360-day year consisting of twelve 30-day months), over (b) the pass-through rates on the Class B Certificates for the related Distribution Date.
The pass-through rate for the Class X-D Certificates for any Distribution Date will be aper annum rate equal to the excess, if any, of (a) the weighted average of the net mortgage rates on the mortgage loans (in each case adjusted, if necessary, to accrue on the basis of a 360-day year consisting of twelve 30-day months), over (b) the pass-through rate on the Class D Certificates for the related Distribution Date.
The Class S Certificates will not have a pass-through rate. On each Distribution Date, a specified portion of any excess interest collected in respect of any mortgage loan in the trust with an anticipated repayment date, solely to the extent received from the related borrower during the related collection period, will be distributed to the holders of the Class S Certificates.
See “Description of the Certificates—Distributions” in the Preliminary Prospectus.
| |
| ■ Distribution of Principal: | On any Distribution Date prior to the Cross-Over Date, payments in respect of principal will be distributed, up to the Available Funds:
first, to the Class A-SB Certificates until the Certificate Balance of the Class A-SB Certificates is reduced to the Class A-SB planned principal balance for the related Distribution Date set forth in Annex E to the Preliminary Prospectus, second, to the Class A-1 Certificates, until the Certificate Balance of such Class is reduced to zero, third, to the Class A-2 Certificates, until the Certificate Balance of such Class is reduced to zero, fourth, to the Class A-3 Certificates, until the Certificate Balance of such Class is reduced to zero, fifth, to the Class A-4 Certificates, until the Certificate Balance of such Class is reduced to zero, sixth, to the Class A-5 Certificates, until the Certificate Balance of such Class is reduced to zero, and seventh, to the Class A-SB Certificates, until the Certificate Balance of such Class is reduced to zero and then to the Class A-S, Class B, Class C, Class D, Class E-RR, Class F-RR, Class G-RR and Class NR-RR Certificates, in that order, until the Certificate Balance of each such Class is reduced to zero. |
THE INFORMATION IN THIS STRUCTURAL AND COLLATERAL TERM SHEET IS NOT COMPLETE AND MAY BE AMENDED PRIOR TO THE TIME OF SALE. THIS TERM SHEET IS NOT AN OFFER TO SELL THESE SECURITIES AND IT IS NOT A SOLICITATION OF AN OFFER TO BUY THESE SECURITIES IN ANY JURISDICTION WHERE THE OFFER OR SALE IS NOT PERMITTED.
| | |
18 of 151
| Structural and Collateral Term Sheet | Benchmark 2018-B2 | |
| Structural Overview | ||
On any Distribution Date on or after the Cross-Over Date, payments in respect of principal will be distributed, up to the Available Funds, to the Class A-1, Class A-2, Class A-3, Class A-4, Class A-5 and Class A-SB Certificates,pro ratabased on the Certificate Balance of each such Class until the Certificate Balance of each such Class is reduced to zero.
The “Cross-Over Date” means the Distribution Date on which the aggregate Certificate Balances of the Class A-S, Class B, Class C, Class D, Class E-RR, Class F-RR, Class G-RR and Class NR-RR Certificates have been reduced to zero as a result of the allocation of realized losses to such Classes.
The Class X-A, Class X-B and Class X-D Certificates (the “Class X Certificates”) will not be entitled to receive distributions of principal; however, the notional amount of the Class X-A Certificates will be reduced by the aggregate amount of principal distributions, realized losses and trust fund expenses, if any, allocated to the Class A-1, Class A-2, Class A-3, Class A-4, Class A-5, Class A-SB and Class A-S Certificates, the notional amount of the Class X-B Certificates will be reduced by the aggregate amount of principal distributions, realized losses and trust fund expenses, if any, allocated to the Class B Certificates and the notional amount of the Class X-D Certificates will be reduced by the aggregate amount of principal distributions, realized losses and trust fund expenses, if any, allocated to the Class D Certificates.
The Class S Certificates have no certificate balance, notional amount, credit support, pass-through rate, rated final distribution date or rating, and will not be entitled to distributions of principal.
See “Description of the Certificates—Distributions” in the Preliminary Prospectus.
| ||
| ■ Yield Maintenance / Fixed Penalty Allocation: | For purposes of the distribution of Yield Maintenance Charges on any Distribution Date any Yield Maintenance Charges collected in respect of the mortgage loans will be allocated pro rata among four groups (based on the aggregate amount of principal distributed to the Principal Balance Certificates in each group), consisting of (a) the Class A-1, Class A-2, Class A-3, Class A-4, Class A-5, Class A-SB, Class A-S and Class X-A Certificates (“YM Group A”), (b) the Class B, Class C and Class X-B Certificates (“YM Group B”), (c) the Class X-D and Class D Certificates (“YM Group C”) and (d) the Class E-RR, Class F-RR, Class G-RR and Class NR-RR Certificates (“YM Group RR”). As among the Classes of Certificates in each YM Group, other than the YM Group RR, each Class of Certificates entitled to distributions of principal will receive an amount calculated generally in accordance with the following formula and as more specifically described in the Preliminary Prospectus, with any remaining Yield Maintenance Charges on such Distribution Date being distributed to the class of Class X Certificates in such YM Group. |
| YM | X | Principal Paid to Class | X | (Pass-Through Rate on Class – Discount Rate) | |
| Charge | Total Principal Paid to | (Mortgage Rate on Loan – Discount Rate) | |||
| the related YM Group |
| As among the Classes of Certificates in the YM Group RR, each Class of Certificates in such YM Group entitled to distributions of principal will receive an amount calculated generally in accordance with the following formula and as more specifically described in the Preliminary Prospectus. |
| Principal Paid to Class | ||||
| YM | X | Total Principal Paid to | ||
| Charge | the related YM Group |
No Yield Maintenance Charges will be distributed to the Class S or Class R Certificates. |
| ■ Realized Losses: | On each Distribution Date, losses on the mortgage loans will be allocated first to the Class NR-RR, Class G-RR, Class F-RR, Class E-RR, Class D, Class C, Class B and Class A-S Certificates, in that order, in each case until the Certificate Balance of all such Classes have been reduced to zero, and then, to the Class A-1, Class A-2, Class A-3, Class A-4, Class A-5 and Class A-SB Certificates,pro rata,based on the Certificate Balance of each such Class, until the Certificate Balance of each such Class has been reduced to zero. The notional amounts of the Class X-A, Class X-B and X-D Certificates will be reduced by the aggregate amount of realized losses allocated to Certificates that are components of the notional amounts of the Class X-A, Class X-B and X-D Certificates, respectively. |
THE INFORMATION IN THIS STRUCTURAL AND COLLATERAL TERM SHEET IS NOT COMPLETE AND MAY BE AMENDED PRIOR TO THE TIME OF SALE. THIS TERM SHEET IS NOT AN OFFER TO SELL THESE SECURITIES AND IT IS NOT A SOLICITATION OF AN OFFER TO BUY THESE SECURITIES IN ANY JURISDICTION WHERE THE OFFER OR SALE IS NOT PERMITTED.
| | |
19 of 151
| Structural and Collateral Term Sheet | Benchmark 2018-B2 | |
| Structural Overview | ||
Losses on each Whole Loan will be allocated first, to any related subordinate companion loan(s) until reduced to zero and then to the related mortgage loan and any relatedpari passu companion loans,pro rata, based on their respective principal balances.
See “Description of the Certificates—Priority of Distributions” in the Preliminary Prospectus.
| ||
| ■ Interest Shortfalls: | A shortfall with respect to the amount of available funds distributable in respect of interest can result from, among other sources: (a) delinquencies and defaults by borrowers; (b) shortfalls resulting from the application of appraisal reductions to reduce P&I Advances; (c) shortfalls resulting from interest on Advances made by the Master Servicer, the Special Servicer or the Trustee; (d) shortfalls resulting from the payment of Special Servicing Fees and other additional compensation that the Special Servicer is entitled to receive; (e) shortfalls resulting from extraordinary expenses of the trust, including indemnification payments payable to the Depositor, the Master Servicer, the Special Servicer, the Certificate Administrator, the Trustee, the Operating Advisor and the Asset Representations Reviewer; (f) shortfalls resulting from a modification of a mortgage loan’s interest rate or principal balance; and (g) shortfalls resulting from other unanticipated or default-related expenses of the trust. Any such shortfalls that decrease the amount of available funds distributable in respect of interest to the Certificateholders will reduce distributions to the classes of Certificates (other than the Class S and Class R Certificates) beginning with those with the lowest payment priorities, in reverse sequential order. See “Description of the Certificates—Distributions—Priority of Distributions” in the Preliminary Prospectus. | |
| ■ Appraisal Reduction Amounts: | With respect to mortgage loans serviced under the Pooling and Servicing Agreement, upon the occurrence of certain trigger events with respect to a mortgage loan, which are generally tied to certain events of default under the related mortgage loan documents, the Special Servicer will be obligated to obtain an appraisal of the related mortgaged property and the Master Servicer will calculate the Appraisal Reduction Amount. The “Appraisal Reduction Amount” is generally the amount by which the current principal balance of the related mortgage loan or serviced whole loan, plus outstanding advances, real estate taxes, unpaid servicing fees and certain similar amounts exceeds the sum of (a) 90% of the appraised value of the related mortgaged property, (b) the amount of any escrows, letters of credit and reserves and (c) all insurance and casualty proceeds and condemnation awards that are collateral for the related mortgage loan.
With respect to the Non-Serviced Whole Loans, any Appraisal Reduction Amount will be similarly determined pursuant to the related trust and servicing agreement or pooling and servicing agreement, as applicable, under which it is serviced.
In general, the Appraisal Reduction Amount that is allocated to the mortgage loans is notionally allocated to reduce, in reverse sequential order, the Certificate Balance of each Class of Certificates (other than the Class A-1, Class A-2, Class A-3, Class A-4, Class A-5 and Class A-SB) beginning with the Class NR-RR Certificates for certain purposes, including certain voting rights and the determination of the controlling class. As a result of calculating one or more Appraisal Reduction Amounts (and, in the case of any Whole Loan, to the extent allocated to the related mortgage loan), the amount of any required P&I Advance will be reduced, which will have the effect of reducing the amount of interest available to the most subordinate class of certificates then-outstanding (i.e.,first, to Class NR-RR Certificates;second, to the Class G-RR Certificates;third, to the Class F-RR Certificates;fourth, to the Class E-RR Certificates;fifth, to the Class D Certificates,sixth, to the Class C Certificates,seventh, to the Class B Certificates,eighth, to the Class A-S Certificates and finally,pro rata based on their respective interest entitlements, to the Senior Certificates).
With respect to each serviced Whole Loan, the Appraisal Reduction Amount is notionally allocated,first,to any related serviced subordinate companion loan(s),then pro rata, between the related mortgage loan and the related servicedpari passu companion loan(s), based upon their respective principal balances.
| |
| ■ Appraisal Reduced Interest: | Accrued and unpaid interest at the related Mortgage Rate for a mortgage loan that is not advanced by the Master Servicer or the Trustee as backup master servicer due to the application of Appraisal Reduction Amounts to such mortgage loan. | |
| ■ Master Servicer Advances: | The Master Servicer will be required to advance certain delinquent scheduled mortgage loan payments of principal and interest and certain property protection advances, in each case, to the extent the Master Servicer deems such advances to be recoverable. At any time that an |
THE INFORMATION IN THIS STRUCTURAL AND COLLATERAL TERM SHEET IS NOT COMPLETE AND MAY BE AMENDED PRIOR TO THE TIME OF SALE. THIS TERM SHEET IS NOT AN OFFER TO SELL THESE SECURITIES AND IT IS NOT A SOLICITATION OF AN OFFER TO BUY THESE SECURITIES IN ANY JURISDICTION WHERE THE OFFER OR SALE IS NOT PERMITTED.
| | |
20 of 151
| Structural and Collateral Term Sheet | Benchmark 2018-B2 | |
| Structural Overview | ||
| Appraisal Reduction Amount exists, the amount that would otherwise be required to be advanced by the Master Servicer in respect of delinquent payments of interest on any mortgage loan will be reduced to equal the product of (x) the interest portion of the amount that would be advanced without regard to any Appraisal Reduction Amount and (y) a fraction, the numerator of which is the then-outstanding principal balance of the mortgage loan minus the Appraisal Reduction Amount and the denominator of which is the then-outstanding principal balance of the mortgage loan. The Master Servicer will not make any principal or interest advances with respect to any companion loan. | ||
| ■ Whole Loans: | Twenty-five mortgage loans are each evidenced by one mortgage loan and one or more companion loans (each a “Companion Loan” and collectively with the related mortgage loan, a “Whole Loan”), secured by the same mortgage(s) on the related mortgaged property(ies). Each such mortgage loan and its related Companion Loan(s) are subject to an intercreditor agreement. None of these Companion Loans will be part of the trust.
In the case of all of the Whole Loans, referred to as the “Apple Campus 3 Whole Loan”, the “EOS 21 Whole Loan”, the “Rochester Hotel Portfolio Whole Loan”, the “InterContinental San Francisco Whole Loan”, the “Sentinel Square II Whole Loan”, the “The Woods Whole Loan”, the “Worldwide Plaza Whole Loan”, “Braddock Metro Center Whole Loan”, the “BlueLinx Portfolio Whole Loan”, the “Marina Heights State Farm Whole Loan”, the “Red Building Whole Loan”, the “599 Broadway Whole Loan”, the “Lehigh Valley Mall Whole Loan”, the “Atrium Center Whole Loan”, the “90 Hudson Whole Loan”, the “Marriott Charlotte City Center Whole Loan”, the “Two Harbor Point Square Whole Loan”, the “Towers at University Town Center Whole Loan”, the “Beacon - Criterion Whole Loan”, the “Beacon - Hague Whole Loan”, the “Beacon - Paramount Whole Loan”, the “Beacon - Mercury / Garage Whole Loan”, the “Beacon - Orpheum Whole Loan” and the “Beacon - Tower Whole Loan”, one or more related Companion Loans arepari passu with the related mortgage loan (these Companion Loans are also referred to as the “Pari Passu Companion Loans”). In the case of each of the “Central Park of Lisle Whole Loan”, the Worldwide Plaza Whole Loan, the Red Building Whole Loan, the Beacon - Criterion Whole Loan, the Beacon - Hague Whole Loan, the Beacon - Paramount Whole Loan, the Beacon - Mercury / Garage Whole Loan, the Beacon - Orpheum Whole Loan and the Beacon - Tower Whole Loan, in addition to any related Pari Passu Companion Loans, one or more related Companion Loans are subordinate in right of payment to the related mortgage loan and the related Pari Passu Companion Loans (these Companion Loans are also referred to as the “Subordinate Companion Loans”). The Central Park of Lisle Subordinate Companion Loan, the EOS 21 Companion Loan, the Rochester Hotel Portfolio Companion Loans, the InterContinental San Francisco Companion Loans, the Sentinel Square II Companion Loans, the Braddock Metro Center Companion Loan, the BlueLinx Portfolio Companion Loans, the 599 Broadway Companion Loan, the Red Building Companion Loans, the Red Building Subordinate Companion Loans and the Towers at University Town Center Companion Loans are referred to as “Serviced Companion Loans”.
The Central Park of Lisle Whole Loan, the EOS 21 Whole Loan, the Rochester Hotel Portfolio Whole Loan, the InterContinental San Francisco Whole Loan, the Sentinel Square II Whole Loan, the Braddock Metro Center Whole Loan, the BlueLinx Portfolio Whole Loan, the Red Building Whole Loan, the 599 Broadway Whole Loan and the Towers at University Town Center Whole Loan (each, a “Serviced Whole Loan”) will be serviced under the pooling and servicing agreement for the Benchmark 2018-B2 transaction (the “Pooling and Servicing Agreement”).
The Apple Campus 3 Whole Loan, The Woods Whole Loan, the Worldwide Plaza Whole Loan, the Marina Heights State Farm Whole Loan, the Lehigh Valley Mall Whole Loan, the Atrium Center Whole Loan, the 90 Hudson Whole Loan, the Marriott Charlotte City Center Whole Loan, the Two Harbor Point Square Whole Loan, the Beacon - Criterion Whole Loan, the Beacon - Hague Whole Loan, the Beacon - Paramount Whole Loan, the Beacon - Mercury / Garage Whole Loan, the Beacon - Orpheum Whole Loan and the Beacon - Tower Whole Loan are being serviced and administered pursuant to the applicable trust and servicing agreement or pooling and servicing agreement as described under “Description of the Mortgage Pool—The Whole Loans—The Non-Serviced Pari Passu Whole Loans” in the Preliminary Prospectus.
The Apple Campus 3 Whole Loan, The Woods Whole Loan, the Worldwide Plaza Whole Loan, the Marina Heights State Farm Whole Loan, the Lehigh Valley Mall Whole Loan, the Atrium Center Whole Loan, the 90 Hudson Whole Loan, the Marriott Charlotte City Center Whole Loan, the Two Harbor Point Square Whole Loan, the Beacon - Criterion Whole Loan, the |
THE INFORMATION IN THIS STRUCTURAL AND COLLATERAL TERM SHEET IS NOT COMPLETE AND MAY BE AMENDED PRIOR TO THE TIME OF SALE. THIS TERM SHEET IS NOT AN OFFER TO SELL THESE SECURITIES AND IT IS NOT A SOLICITATION OF AN OFFER TO BUY THESE SECURITIES IN ANY JURISDICTION WHERE THE OFFER OR SALE IS NOT PERMITTED.
| | |
21 of 151
| Structural and Collateral Term Sheet | Benchmark 2018-B2 | |
| Structural Overview | ||
| Beacon - Hague Whole Loan, the Beacon - Paramount Whole Loan, the Beacon - Mercury / Garage Whole Loan, the Beacon - Orpheum Whole Loan and the Beacon - Tower Whole Loan are each a “Non-Serviced Whole Loan” and collectively the “Non-Serviced Whole Loans”. | ||
| ■ Highlighted Servicing Provisions: | The following are certain servicing provisions of note:
A mortgage loan may become a specially serviced loan as a result of an imminent or reasonably foreseeable default only if the Master Servicer determines such default is not likely to be cured by the related borrower within 60 days. However, if the Special Servicer believes an imminent default exists and the Master Servicer does not transfer the mortgage loan to special servicing, it is entitled to request the Master Servicer deliver an explanation in the form of an officer’s certificate to the Depositor and the Special Servicer setting forth its determination and the related reasoning.
A mortgage loan will not become a specially serviced loan for up to 120 days in circumstances where the related borrower does not make its balloon payment at maturity upon satisfaction of certain conditions, including that the borrower has, prior to such maturity date, provided documentation from an acceptable lender, including, without limitation, an executed term sheet or refinancing commitment or an executed purchase and sale agreement, in each case, that is consistent with CMBS market practices and is reasonably satisfactory in form and substance to the Master Servicer evidencing an expected refinancing of the mortgage loan or sale of the related mortgaged property.
In order to streamline the servicing and administration of the mortgage loans with the goal of reducing the amount of time a CMBS borrower has to wait for certain approvals from the lender, “major decisions” will be administered solely by the Special Servicer, thereby reducing the number of parties involved in the approval process. Under these updated terms, the Special Servicer will be directly responsible for obtaining the consent of the Directing Certificateholder for “major decisions” involving all mortgage loans, rather than requiring the Master Servicer’s involvement in the approval process for Non-Specially Serviced Loans. In prior CMBS transactions, the master servicer would commonly prepare a recommendation related to a particular approval and be required to obtain the consent of the special servicer (who, in turn, would commonly be required to obtain the consent of the Directing Certificateholder before providing its consent to the master servicer) prior to taking any action with respect to that “major decision”.
In addition, certain revisions have been incorporated in the scope of the “major decisions” in the Preliminary Prospectus, that limit the involvement of the Directing Certificateholder in (1) the replacement of the related property management company, (2) the approval of releases of certain performance escrows and earnouts, and (3) the consent to modifications of any mezzanine intercreditor agreement in circumstances when the Directing Certificateholder is affiliated with the mezzanine lender.
The Certificate Administrator will be required to identify the then-current Directing Certificateholder as part of its monthly distribution date statement.
See“Description of the Certificates” and“Pooling and Servicing Agreement” in the Preliminary Prospectus.
| |
| ■ Liquidated Loan Waterfall: | On liquidation of any mortgage loan, all net liquidation proceeds related to the mortgage loan (but not any related Companion Loan) will be applied so that amounts allocated as a recovery of accrued and unpaid interest will not, in the first instance, include any delinquent interest that was not advanced as a result of Appraisal Reduction Amounts or interest that accrued on any junior note(s) if such mortgage loan is an AB Modified Loan. After the adjusted interest amount is so allocated, any remaining liquidation proceeds will be allocated to offset certain advances and to pay principal on the mortgage loan until the unpaid principal amount of the mortgage loan has been reduced to zero. Any remaining liquidation proceeds will then be allocated to pay delinquent interest that was not advanced as a result of Appraisal Reduction Amounts and any interest that accrued on any junior note(s) if such mortgage loan is an AB Modified Loan. Any liquidation proceeds in respect of each such mortgage loan in excess of the related outstanding balance willfirst be applied to offset any interest shortfalls allocated to the Certificates (other than the Class S and Class R Certificates), in sequential order, andthen to offset any realized losses allocated to the Certificates (other than the Class S and Class R Certificates), in sequential order. Any liquidation proceeds remaining after such applications will be distributed to the Class R Certificates. |
THE INFORMATION IN THIS STRUCTURAL AND COLLATERAL TERM SHEET IS NOT COMPLETE AND MAY BE AMENDED PRIOR TO THE TIME OF SALE. THIS TERM SHEET IS NOT AN OFFER TO SELL THESE SECURITIES AND IT IS NOT A SOLICITATION OF AN OFFER TO BUY THESE SECURITIES IN ANY JURISDICTION WHERE THE OFFER OR SALE IS NOT PERMITTED.
| | |
22 of 151
| Structural and Collateral Term Sheet | Benchmark 2018-B2 | |
| Structural Overview | ||
| ■ Sale of Defaulted Loans and REO Properties: | The Special Servicer is required to solicit offers for any defaulted loan (other than a non-serviced mortgage loan) in such a manner as will be reasonably likely to maximize the value of the defaulted loan on a net present value basis, if the Special Servicer determines that no satisfactory arrangements can be made for collection of delinquent payments and the sale would be in the best economic interests of the certificateholders (or, in the case of any Serviced Whole Loan, the certificateholders and any holders of the related Serviced Pari Passu Companion Loans, as a collective whole, taking into account thepari passu or subordinate nature of such Serviced Companion Loans), on a net present value basis. Additionally, the Special Servicer may offer to sell any REO property if, and when, the Special Servicer determines that such a sale would be in the best economic interest of the issuing entity and the holders of any related Companion Loans, on a net present value basis.
In the case of each non-serviced mortgage loan, under certain circumstances permitted under the related intercreditor agreement, to the extent that such non-serviced mortgage loan is not sold together with the related non-serviced companion loan by the special servicer for the related Non-Serviced Whole Loans, the Special Servicer will be entitled to sell (with respect to any mortgage loan other than an Excluded Loan, with the consent of the Directing Certificateholder if no Control Termination Event has occurred and is continuing) such non-serviced mortgage loan if it determines in accordance with the servicing standard that such action would be in the best interests of the certificateholders.
The Special Servicer is required to accept a cash offer received from any person for any defaulted loan or REO property in an amount at least equal to par plus accrued interest plus all other outstanding amounts due under such mortgage loan and any outstanding expenses of the trust relating to such mortgage loan (the “Purchase Price”) except as described in the Preliminary Prospectus.
With respect to the Serviced Whole Loans, any such sale of the related defaulted loan is required to also include the related Pari Passu Companion Loans, if any, and the prices will be adjusted accordingly.
Within 30 days of a defaulted loan becoming a specially serviced loan, the Special Servicer is required to order an appraisal and, within 30 days of receipt of such appraisal, is required to determine the fair value of such defaulted loan in accordance with the applicable servicing standard. If, however, the Special Servicer is already in the process of obtaining an appraisal with respect to the related mortgaged property, the Special Servicer is required to make its fair value determination as soon as reasonably practicable (but in any event within 30 days) after its receipt of such appraisal. Additionally, with respect to the mortgage loans that have mezzanine debt or permit mezzanine debt in the future, the mezzanine lenders may have the option to purchase the related mortgage loan after certain events of default under such mortgage loan. In addition, with respect to the Central Park of Lisle Whole Loan and the Red Building Whole Loan, the holder of the related controlling Subordinate Companion Loan may have an option to purchase the related mortgage loan after certain events of default under such mortgage loan.
The Directing Certificateholder will not have a right of first refusal to purchase a defaulted loan.
If the Special Servicer does not receive a cash offer at least equal to the Purchase Price, the Special Servicer may purchase the defaulted loan or REO property at the Purchase Price. If the Special Servicer does not purchase the defaulted loan or REO property at the Purchase Price, the Special Servicer is required to accept the highest offer received from any person that is determined to be a fair price (supported by an appraisal required to be obtained by the Special Servicer within 30 days of a mortgage loan becoming a specially serviced loan) for such defaulted loan or REO property, if the highest offeror is a person other than an Interested Person. If the highest offer is made by an Interested Person, the Trustee will determine (based upon the most recent appraisal or updated appraisal conducted in accordance with the terms of the Pooling and Servicing Agreement) whether the offer constitutes a fair price for the defaulted loan or REO property provided that no offer from an Interested Person will constitute a fair price unless (A) it is the highest offer received and (B) if the offer is less than the applicable Purchase Price, at least two other offers are received from independent third parties and the Trustee may conclusively rely on the opinion of an independent appraiser or other independent expert retained by the Trustee in connection with making such determination. Neither the Trustee nor any of its affiliates may make an offer for or purchase any specially serviced loan or REO property. An “Interested Person” is any person that is (i) a party to the Pooling and Servicing Agreement, the Directing Certificateholder, any sponsor, any borrower, any manager of a |
THE INFORMATION IN THIS STRUCTURAL AND COLLATERAL TERM SHEET IS NOT COMPLETE AND MAY BE AMENDED PRIOR TO THE TIME OF SALE. THIS TERM SHEET IS NOT AN OFFER TO SELL THESE SECURITIES AND IT IS NOT A SOLICITATION OF AN OFFER TO BUY THESE SECURITIES IN ANY JURISDICTION WHERE THE OFFER OR SALE IS NOT PERMITTED.
| | |
23 of 151
| Structural and Collateral Term Sheet | Benchmark 2018-B2 | |
| Structural Overview | ||
mortgaged property, any independent contractor engaged by the Special Servicer, any holder of a mezzanine loan (but only with respect to the related mortgage loan) or any known affiliate of any such person or, (ii) with respect to a defaulted whole loan, the depositor, the master servicer, the special servicer (or independent contractor engaged by such special servicer) or the trustee for the securitization of any related Companion Loan and each holder of any related Companion Loan, or any known affiliate of any such person.
The Special Servicer is not required to accept the highest offer and may accept a lower offer for a defaulted loan or REO property if the Special Servicer determines, in accordance with the servicing standard (and subject to the requirements of any related intercreditor agreement), that a rejection of such offer would be in the best interests of the Certificateholders and, with respect to any Serviced Whole Loan, the holder of the related Companion Loans, as a collective whole, as if such Certificateholders and, if applicable, the related Companion Loan Holder(s) constituted a single lender), so long as such lower offer was not made by the Special Servicer or any of its affiliates. If title to any mortgaged property is acquired by the trust fund, the Special Servicer will be required to sell such mortgaged property prior to the close of the third calendar year beginning after the year of acquisition, unless (a) the IRS grants or has not denied an extension of time to sell such mortgaged property or (b) the Special Servicer, Trustee and the Certificate Administrator receive an opinion of independent counsel to the effect that the holding of the property by the trust longer than the above-referenced three-year period will not result in the imposition of a tax on any REMIC of the trust fund or cause any REMIC of the trust fund to fail to qualify as a REMIC.
The foregoing applies to mortgage loans serviced under the Pooling and Servicing Agreement. With respect to each Non-Serviced Whole Loan, if the special servicer under the applicable trust and servicing agreement or pooling and servicing agreement, as applicable, determines to sell the related Companion Loan(s) as described above, then the applicable special servicer will be required to sell the related non-serviced mortgage loan, included in the Benchmark 2018-B2 trust, and the related Companion Loan(s), as a single loan. In connection with any such sale, the then-applicable special servicer will be required to follow procedures substantially similar to those set forth above.
| ||
| ■ Control Eligible Certificates: | Classes E-RR, F-RR, G-RR and NR-RR. | |
| ■ Control Rights: | The Control Eligible Certificates will have certain control rights attached to them. The “Directing Certificateholder” will be the Controlling Class Certificateholder (or its representative) selected by more than 50% of the Controlling Class Certificateholders;provided,however, that (1) absent that selection, (2) until a Directing Certificateholder is so selected or (3) upon receipt of a notice from a majority of the Controlling Class Certificateholders that a Directing Certificateholder is no longer designated, the Controlling Class Certificateholder that owns the largest aggregate Certificate Balance of the Controlling Class (or its representative) will be the Directing Certificateholder;provided,however, that in the case of this clause (3), in the event no one holder owns the largest aggregate Certificate Balance of the Controlling Class, then there will be no Directing Certificateholder until appointed in accordance with the terms of the Pooling and Servicing Agreement. With respect to any mortgage loan (other than any non-serviced mortgage loan or any Excluded Loan), unless a Control Termination Event has occurred and is continuing, the Directing Certificateholder will be entitled to direct the Special Servicer to take, or refrain from taking, certain actions with respect to such mortgage loan. Furthermore, the Directing Certificateholder will also have the right to receive notice and provide consent with respect to certain material actions that the Master Servicer and the Special Servicer plan on taking with respect to a mortgage loan (other than any non-serviced mortgage loan or any Excluded Loan). With respect to any mortgage loan that has or may in the future have mezzanine debt, pursuant to the related intercreditor agreement, the related mezzanine lender may have certain consent rights with respect to certain modifications related to such mortgage loan.
Notwithstanding anything to the contrary, with respect to the Central Park of Lisle Whole Loan and the Red Building Whole Loan, prior to the occurrence and continuance of a control appraisal period under the related intercreditor agreement, direction and consent rights with respect to the related Whole Loan will be exercised by the holder of the related controlling Subordinate Companion Loan pursuant to the related intercreditor agreement as described in the Preliminary Prospectus. In addition, the holder of the related controlling Subordinate Companion Loan will have certain rights to cure defaults under the related mortgage loan, and in certain circumstances, each holder of a related Subordinate Companion Loan will have the |
THE INFORMATION IN THIS STRUCTURAL AND COLLATERAL TERM SHEET IS NOT COMPLETE AND MAY BE AMENDED PRIOR TO THE TIME OF SALE. THIS TERM SHEET IS NOT AN OFFER TO SELL THESE SECURITIES AND IT IS NOT A SOLICITATION OF AN OFFER TO BUY THESE SECURITIES IN ANY JURISDICTION WHERE THE OFFER OR SALE IS NOT PERMITTED.
| | |
24 of 151
| Structural and Collateral Term Sheet | Benchmark 2018-B2 | |
| Structural Overview | ||
right to purchase the related defaulted mortgage loan.
A “Borrower Party” means a borrower, a mortgagor, a manager of a mortgaged property, an Accelerated Mezzanine Loan Lender, any other person controlling or controlled by or under common control with such borrower, mortgagor, manager or Accelerated Mezzanine Loan Lender, as applicable, or any other person owning, directly or indirectly, 25% or more of the beneficial interests in such borrower, mortgagor, manager or Accelerated Mezzanine Loan Lender, as applicable. For purposes of this definition, “control” when used with respect to any specified person means the power to direct the management and policies of such person, directly or indirectly, whether through the ownership of voting securities, by contract or otherwise and the terms “controlling” and “controlled” have meanings correlative to the foregoing.
An “Accelerated Mezzanine Loan Lender” means a mezzanine lender under a mezzanine loan that has been accelerated or as to which foreclosure or enforcement proceedings have been commenced against the equity collateral pledged to secure such mezzanine loan.
An “Excluded Loan” is a mortgage loan or Whole Loan with respect to which the Directing Certificateholder or the holder of the majority of the controlling class is a Borrower Party. As of the Closing Date, it is expected that there will be no Excluded Loans in this securitization.
With respect to the Serviced Whole Loans, direction, consent and consultation rights with respect to the related Whole Loan are subject to certain consultation rights of the holder of the related Pari Passu Companion Loans pursuant to the related intercreditor agreement.
With respect to any Non-Serviced Whole Loan, direction, consent and consultation rights with respect to the related Whole Loan will be exercised by the directing certificateholder or controlling class representative under the applicable trust and servicing agreement or pooling and servicing agreement, as applicable.
| ||
| ■ Directing Certificateholder: | Barings LLC (or its affiliate), is expected to be appointed as the initial directing certificateholder with respect to all serviced mortgage loans (other than the Excluded Loans). | |
| ■ Controlling Class: | The “Controlling Class” will at any date of determination be the most subordinate Class of Control Eligible Certificates then outstanding that has an aggregate Certificate Balance, as notionally reduced by any Cumulative Appraisal Reduction Amounts allocable to such Class, equal to no less than 25% of the initial Certificate Balance for such Class;provided that if at any time the Certificate Balances of the certificates other than the Control Eligible Certificates have been reduced to zero as a result of the allocation of principal payments on the mortgage loans, then the Controlling Class will be the most subordinate Class among the Control Eligible Certificates that has an aggregate Certificate Balance greater than zero without regard to any Cumulative Appraisal Reduction Amounts. The Controlling Class as of the Closing Date will be the Class NR-RR Certificates.
Each holder of a certificate of the Controlling Class is referred to herein as a “Controlling Class Certificateholder”.
| |
| ■ Control Termination Event: | A “Control Termination Event” will occur when the Class E-RR Certificates have a Certificate Balance (taking into account the application of any Cumulative Appraisal Reduction Amounts to notionally reduce the Certificate Balance of such class) of less than 25% of the initial Certificate Balance of that class;provided that a Control Termination Event will not be deemed to be continuing in the event the Certificate Balances of all Classes of Principal Balance Certificates other than the Control Eligible Certificates have been reduced to zero.
The “Cumulative Appraisal Reduction Amount” as of any date of determination, is equal to the sum of (i) with respect to any mortgage loan, all Appraisal Reduction Amounts then in effect, and (ii) with respect to any AB Modified Loan, any Collateral Deficiency Amount then in effect.
An “AB Modified Loan” means any corrected loan (1) that became a corrected loan (which includes for purposes of this definition any non-serviced mortgage loan that became a “corrected loan” (or any term substantially similar thereto) pursuant to the trust and servicing agreement or pooling and servicing agreement, as applicable, governing such non-serviced mortgage loan) due to a modification thereto that resulted in the creation of an A/B note structure (or similar structure) and as to which the new junior note(s) did not previously exist or the principal amount of the new junior note(s) was previously part of either an A note held by the issuing entity or the original unmodified mortgage loan and (2) as to which an Appraisal Reduction Amount is not in effect. |
THE INFORMATION IN THIS STRUCTURAL AND COLLATERAL TERM SHEET IS NOT COMPLETE AND MAY BE AMENDED PRIOR TO THE TIME OF SALE. THIS TERM SHEET IS NOT AN OFFER TO SELL THESE SECURITIES AND IT IS NOT A SOLICITATION OF AN OFFER TO BUY THESE SECURITIES IN ANY JURISDICTION WHERE THE OFFER OR SALE IS NOT PERMITTED.
| | |
25 of 151
| Structural and Collateral Term Sheet | Benchmark 2018-B2 | |
| Structural Overview | ||
The “Collateral Deficiency Amount” means, with respect to any AB Modified Loan as of any date of determination, the excess of (i) the principal balance of such AB Modified Loan (taking into account the related junior note(s) and anypari passu notes included therein), over (ii) the sum of (in the case of a Whole Loan, solely to the extent allocable to the subject mortgage loan) (x) the most recent Appraised Value for the related mortgaged property or mortgaged properties, plus (y) solely to the extent not reflected or taken into account in such Appraised Value and to the extent on deposit with, or otherwise under the control of, the lender as of the date of such determination, any capital or additional collateral contributed by the related borrower at the time the mortgage loan became (and as part of the modification related to) such AB Modified Loan for the benefit of the related mortgaged property or mortgaged properties (provided, that in the case of a non-serviced mortgage loan, the amounts set forth in this clause (y) will be taken into account solely to the extent relevant information is received by the Master Servicer), plus (z) any other escrows or reserves (in addition to any amounts set forth in the immediately preceding clause (y)) held by the lender in respect of such AB Modified Loan as of the date of such determination.
Upon the occurrence and during the continuance of a Control Termination Event, the Controlling Class will no longer have any control rights. After the occurrence and during the continuance of a Control Termination Event, the Directing Certificateholder will relinquish its right to direct certain actions of the Special Servicer and will no longer have consent rights with respect to certain actions that the Master Servicer or the Special Servicer plan on taking with respect to a mortgage loan. Following the occurrence and during the continuance of a Control Termination Event, the Directing Certificateholder will retain consultation rights with the Special Servicer with respect to certain material actions that the Special Servicer plans on taking with respect to any mortgage loan other than an Excluded Loan. Such consultation rights will continue until the occurrence of a Consultation Termination Event.
With respect to the Central Park of Lisle Whole Loan and the Red Building Whole Loan, pursuant to the related intercreditor agreement, the holder of the related controlling Subordinate Companion Loan will lose its right to direct certain actions upon the occurrence and continuance of a control appraisal event under such intercreditor agreement.
| ||
| ■ Consultation Termination Event: | A “Consultation Termination Event” will occur when there is no class of Control Eligible Certificates that has a then-outstanding Certificate Balance at least equal to 25% of the initial Certificate Balance of that class, in each case, without regard to the application of any Cumulative Appraisal Reduction Amounts;provided that a Consultation Termination Event will not be deemed to be continuing in the event the Certificate Balances of all Classes of Principal Balance Certificates other than the Control Eligible Certificates have been reduced to zero.
Upon the occurrence of a Consultation Termination Event, there will be no Class of Certificates that will act as the Controlling Class and the Directing Certificateholder will have no rights under the Pooling and Servicing Agreement, other than those rights generally available to all Certificateholders.
| |
■ Operating Advisor Consultation Event:
| An“Operating Advisor Consultation Event” will occur when the Certificate Balances of the Class E-RR, Class F-RR, Class G-RR and Class NR-RR Certificates in the aggregate (taking into account the application of any Cumulative Appraisal Reduction Amounts to notionally reduce the Certificate Balances of such classes) is 25% or less of the initial Certificate Balances of such classes in the aggregate. | |
| ■ Appraised-Out Class: | A Class of Control Eligible Certificates that has been determined, as a result of Appraisal Reduction Amounts or Collateral Deficiency Amounts allocable to such Class, to no longer be the Controlling Class. | |
| ■ Remedies Available to Holders of an Appraised-Out Class: | Holders of the majority of any Appraised-Out Class will have the right, at their sole expense, to require the Special Servicer to order a supplemental appraisal report from an MAI appraiser (selected by the Special Servicer) for any mortgage loan (or Serviced Whole Loan) that results in the Class becoming an Appraised-Out Class.
Upon receipt of that supplemental appraisal, the Special Servicer will be required to determine, in accordance with the Servicing Standard, whether, based on its assessment of the supplemental appraisal, any recalculation of the Appraisal Reduction Amount or Collateral Deficiency Amount is warranted, and if so warranted, the Master Servicer will be required to |
THE INFORMATION IN THIS STRUCTURAL AND COLLATERAL TERM SHEET IS NOT COMPLETE AND MAY BE AMENDED PRIOR TO THE TIME OF SALE. THIS TERM SHEET IS NOT AN OFFER TO SELL THESE SECURITIES AND IT IS NOT A SOLICITATION OF AN OFFER TO BUY THESE SECURITIES IN ANY JURISDICTION WHERE THE OFFER OR SALE IS NOT PERMITTED.
| | |
26 of 151
| Structural and Collateral Term Sheet | Benchmark 2018-B2 | |
| Structural Overview | ||
recalculate the Appraisal Reduction Amount or Collateral Deficiency Amount, as applicable, based on the supplemental appraisal and if required by such recalculation, the Appraised-Out Class will be reinstated as the Controlling Class. The holders of an Appraised-Out Class requesting a supplemental appraisal are not permitted to exercise any control or consent rights of the Controlling Class until such time, if any, as the Class is reinstated as the Controlling Class.
| ||
| ■ Operating Advisor: | The Operating Advisor will initially be Pentalpha Surveillance LLC. The Operating Advisor will have certain review and consultation rights relating to the performance of the Special Servicer and with respect to its actions taken in connection with the resolution and/or liquidation of specially serviced loans. With respect to each mortgage loan (other than a non-serviced mortgage loan) or Serviced Whole Loan, the Operating Advisor will be responsible for:
● reviewing the actions of the Special Servicer with respect to any Specially Serviced Loan;
● reviewing (i) all reports by the Special Servicer made available to Privileged Persons on the Certificate Administrator’s website and (ii) each Final Asset Status Report;
● recalculating and reviewing for accuracy and consistency with the Pooling and Servicing Agreement mathematical calculations and the corresponding application of the non-discretionary portion of the applicable formulas required to be utilized in connection with net present value calculations used in the Special Servicer’s determination of what course of action to take in connection with the workout or liquidation of a Specially Serviced Loan; and
● preparing an annual report (if any mortgage loan (other than any non-serviced mortgage loan) or Serviced Whole Loan was a Specially Serviced Loan at any time during the prior calendar year or an Operating Advisor Consultation Event occurred during the prior calendar year) that sets forth whether the Operating Advisor believes, in its sole discretion exercised in good faith, that the Special Servicer is operating in compliance with the Servicing Standard with respect to its performance of its duties under the Pooling and Servicing Agreement with respect to Specially Serviced Loans (and, after the occurrence and continuance of an Operating Advisor Consultation Event, with respect to Major Decisions on Non-Specially Serviced Loans) during the prior calendar year on an “asset-level basis”. The Operating Advisor will identify (1) which, if any, standards the Operating Advisor believes, in its sole discretion exercised in good faith, the Special Servicer has failed to comply with and (2) any material deviations from the Special Servicer’s obligations under the Pooling and Servicing Agreement with respect to the resolution or liquidation of any Specially Serviced Loan or REO Property (other than with respect to any REO Property related to any non-serviced mortgage loan). In preparing any Operating Advisor Annual Report, the Operating Advisor will not be required to report on instances of non-compliance with, or deviations from, the Servicing Standard or the Special Servicer’s obligations under the Pooling and Servicing Agreement that the Operating Advisor determines, in its sole discretion exercised in good faith, to be immaterial.
With respect to each mortgage loan (other than any non-serviced mortgage loan) or Serviced Whole Loan, after the Operating Advisor has received notice that an Operating Advisor Consultation Event has occurred and is continuing, in addition to the duties described above, the Operating Advisor will be required to perform the following additional duties:
● to consult (on a non-binding basis) with the Special Servicer in respect of Asset Status Reports and
● to consult (on a non-binding basis) with the Special Servicer with respect to “major decisions” processed by the Special Servicer or for which the consent of the Special Servicer is required.
In addition, if at any time the Operating Advisor determines, in its sole discretion exercised in good faith, that (1) the Special Servicer is not performing its duties as required under the Pooling and Servicing Agreement in accordance with the Servicing Standard and (2) the replacement of the Special Servicer would be in the best interest of the certificateholders as a collective whole, then, the Operating Advisor will have the right to recommend the replacement of the Special Servicer and will submit its formal recommendation to the Trustee and the Certificate Administrator (along with its rationale, its proposed replacement special servicer and other relevant information justifying its recommendation). |
THE INFORMATION IN THIS STRUCTURAL AND COLLATERAL TERM SHEET IS NOT COMPLETE AND MAY BE AMENDED PRIOR TO THE TIME OF SALE. THIS TERM SHEET IS NOT AN OFFER TO SELL THESE SECURITIES AND IT IS NOT A SOLICITATION OF AN OFFER TO BUY THESE SECURITIES IN ANY JURISDICTION WHERE THE OFFER OR SALE IS NOT PERMITTED.
| | |
27 of 151
| Structural and Collateral Term Sheet | Benchmark 2018-B2 | |
| Structural Overview | ||
The Operating Advisor’s recommendation to replace the Special Servicer must be confirmed by an affirmative vote of holders of Principal Balance Certificates evidencing at least a majority of a quorum of certificateholders (which, for this purpose, is the holders of Principal Balance Certificates that (i) evidence at least 20% of the Voting Rights (taking into account the application of any appraisal reduction amounts to notionally reduce the respective Certificate Balances) of all Principal Balance Certificates on an aggregate basis, and (ii) consist of at least three Certificateholders or certificate owners that are not affiliated with each other). In the event the holders of Principal Balance Certificates evidencing at least a majority of a quorum of certificateholders elect to remove and replace the Special Servicer (which requisite affirmative votes must be received within 180 days of the posting of the notice of the Operating Advisor’s recommendation to replace the Special Servicer to the Certificate Administrator’s website), the Certificate Administrator will be required to receive a Rating Agency Confirmation from each of the Rating Agencies at that time.
However, Pentalpha Surveillance LLC is currently the operating advisor under the GS 2017-FARM trust and servicing agreement and the BANK 2018-BNK10 pooling and servicing agreement and, in each such capacity, has certain obligations and consultation rights with respect to the Marina Heights State Farm Whole Loan and the Apple Campus 3 Whole Loan, respectively, that are substantially similar to those of the Operating Advisor under the Pooling and Servicing Agreement. | ||
| ■ Replacement of Operating Advisor: | The Operating Advisor may be terminated or removed under certain circumstances and a replacement operating advisor appointed as described in the Preliminary Prospectus.
Any replacement operating advisor (or the personnel responsible for supervising the obligations of the replacement operating advisor) must be an institution (A) that is a special servicer or operating advisor on a commercial mortgage-backed securities transaction rated by S&P, Fitch and KBRA (including, in the case of the Operating Advisor, this transaction) but has not been special servicer or operating advisor on a transaction for which any of S&P, Fitch and KBRA has qualified, downgraded or withdrawn its rating or ratings of, one or more classes of certificates for such transaction publicly citing servicing concerns with the operating advisor in its capacity as special servicer or operating advisor on such commercial mortgage-backed securities transaction as the sole or a material factor in such rating action; (B) that can and will make the representations and warranties of the operating advisor set forth in the Pooling and Servicing Agreement; (C) that is not (and is not affiliated with) the Depositor, the Trustee, the Certificate Administrator, the Master Servicer, the Special Servicer, a Mortgage Loan Seller, the Directing Certificateholder, a depositor, a trustee, a certificate administrator, a master servicer or special servicer with respect to the securitization of a Companion Loan, or any of their respective affiliates; (D) that has not been paid by any Special Servicer or successor special servicer any fees, compensation or other remuneration (x) in respect of its obligations hereunder or (y) for the appointment or recommendation for replacement of a successor special servicer to become the Special Servicer; (E) that (x) has been regularly engaged in the business of analyzing and advising clients in commercial mortgage-backed securities matters and that has at least 5 years of experience in collateral analysis and loss projections and (y) has at least 5 years of experience in commercial real estate asset management and experience in the workout and management of distressed commercial real estate assets and (F) that does not directly or indirectly, through one or more affiliates or otherwise, own or have derivative exposure in any interest in any certificates, any mortgage loans, any Companion Loan or any securities backed by a Companion Loan or otherwise have any financial interest in the securitization transaction to which the PSA relates, other than in fees from its role as operating advisor and asset representations reviewer (to the extent it also acts as the asset representations reviewer).
| |
| ■ Asset Representations Reviewer: | The Asset Representations Reviewer will be required to review certain delinquent mortgage loans after a specified delinquency threshold has been exceeded and notification from the Certificate Administrator that the required percentage of Certificateholders have voted to direct a review of such delinquent mortgage loans. An “Asset Review Trigger” will occur when either (1) mortgage loans with an aggregate outstanding principal balance of 25.0% or more of the aggregate outstanding principal balance of all of the mortgage loans (including any REO Loans (or a portion of any REO Loan in the case of a Whole Loan) held by the issuing entity as of the end of the applicable Collection Period are Delinquent Loans, (2)(A) prior to and including the second anniversary of the Closing Date, at least 10 mortgage loans are Delinquent Loans and the outstanding principal balance of such Delinquent Loans in the aggregate constitutes at least |
THE INFORMATION IN THIS STRUCTURAL AND COLLATERAL TERM SHEET IS NOT COMPLETE AND MAY BE AMENDED PRIOR TO THE TIME OF SALE. THIS TERM SHEET IS NOT AN OFFER TO SELL THESE SECURITIES AND IT IS NOT A SOLICITATION OF AN OFFER TO BUY THESE SECURITIES IN ANY JURISDICTION WHERE THE OFFER OR SALE IS NOT PERMITTED.
| | |
28 of 151
| Structural and Collateral Term Sheet | Benchmark 2018-B2 | |
| Structural Overview | ||
| 15.0% of the aggregate outstanding principal balance of all of the mortgage loans (including any REO Loans (or a portion of any REO Loan in the case of a Whole Loan)) held by the issuing entity as of the end of the applicable Collection Period or (B) after the second anniversary of the Closing Date, at least 15 mortgage loans are Delinquent Loans and the outstanding principal balance of such Delinquent Loans in the aggregate constitutes at least 20.0% of the aggregate outstanding principal balance of all of the mortgage loans (including any REO Loans (or a portion of any REO Loan in the case of a Whole Loan)) held by the issuing entity as of the end of the applicable Collection Period.
Following the determination that an Asset Review Trigger has occurred, the Certificate Administrator will include in the Form 10-D relating to the distribution period in which the Asset Review Trigger occurred a description of the events that caused the Asset Review Trigger to occur. Once an Asset Review Trigger has occurred, Certificateholders evidencing not less than 5% of the voting rights may deliver to the Certificate Administrator a written direction requesting a vote on whether to commence an Asset Review within 90 days after the filing of the Form 10-D reporting the occurrence of the Asset Review Trigger (an “Asset Review Vote Election”). If directed by such Certificateholders, a vote of all Certificateholders will commence and an Asset Review will occur if a majority of Certificateholders voting (assuming Certificateholders representing a minimum of 5% of the voting rights respond) vote affirmatively within 150 days of the Asset Review Vote Election. If the vote does not pass, then no Certificateholder may request a vote or cast a vote for an Asset Review and the Asset Representations Reviewer will not be required to review any delinquent mortgage loan until an additional mortgage loan becomes a Delinquent Loan, an Asset Review Trigger occurs as a result or is otherwise in effect, another Asset Review Vote Election is made and a majority of Certificateholders voting (assuming Certificateholders representing a minimum of 5% of the voting rights respond) vote affirmatively within 150 days of such Asset Review Vote Election.
| ||
| ■ Replacement of the Asset Representations Reviewer: | The Asset Representations Reviewer may be terminated and replaced without cause. Upon (i) the written direction of Certificateholders evidencing not less than 25% of the voting rights (without regard to the application of any Appraisal Reduction Amounts) requesting a vote to terminate and replace the Asset Representations Reviewer with a proposed successor asset representations reviewer that is an Eligible Asset Representations Reviewer, and (ii) payment by such holders to the Certificate Administrator of the reasonable fees and expenses to be incurred by the Certificate Administrator in connection with administering such vote, the Certificate Administrator will promptly provide notice to all Certificateholders and the Asset Representations Reviewer of such request by posting such notice on its website, and by mailing to all Certificateholders and the Asset Representations Reviewer. Upon the written direction of Certificateholders evidencing at least 75% of a Certificateholder Quorum (without regard to the application of any Appraisal Reduction Amounts), the Trustee will terminate all of the rights and obligations of the Asset Representations Reviewer under the Pooling and Servicing Agreement by written notice to the Asset Representations Reviewer, and the proposed successor asset representations reviewer will be appointed. | |
| ■ Appointment and Replacement of Special Servicer: | The Directing Certificateholder will appoint the initial Special Servicer as of the Closing Date. Prior to the occurrence and continuance of a Control Termination Event, the Special Servicer may generally be replaced at any time, with or without cause by the Directing Certificateholder;provided, however, that with respect to the Central Park of Lisle Whole Loan and the Red Building Whole Loan, the holder of the related controlling Subordinate Companion Loan (prior to the occurrence and continuance of a control appraisal period) will have the right to replace the Special Servicer with respect to that Whole Loan.
If the Special Servicer obtains knowledge that it is a Borrower Party with respect to any mortgage loan or Serviced Whole Loan (any such mortgage loan or Serviced Whole Loan, an “Excluded Special Servicer Loan”), the Special Servicer will be required to resign as Special Servicer of that Excluded Special Servicer Loan. Prior to the occurrence and continuance of a Control Termination Event, if the applicable Excluded Special Servicer Loan is not also an Excluded Loan, the Directing Certificateholder or the controlling class certificateholder on its behalf will be required to select a successor special servicer that is not a Borrower Party in accordance with the terms of the Pooling and Servicing Agreement (an “Excluded Special Servicer”) for the related Excluded Special Servicer Loan. After the occurrence and during the continuance of a Control Termination Event or if at any time the applicable Excluded Special Servicer Loan is also an Excluded Loan, the resigning Special Servicer will be required to use reasonable efforts to select the related Excluded Special Servicer.
Upon the occurrence and during the continuance of a Control Termination Event, the Directing |
THE INFORMATION IN THIS STRUCTURAL AND COLLATERAL TERM SHEET IS NOT COMPLETE AND MAY BE AMENDED PRIOR TO THE TIME OF SALE. THIS TERM SHEET IS NOT AN OFFER TO SELL THESE SECURITIES AND IT IS NOT A SOLICITATION OF AN OFFER TO BUY THESE SECURITIES IN ANY JURISDICTION WHERE THE OFFER OR SALE IS NOT PERMITTED.
| | |
29 of 151
| Structural and Collateral Term Sheet | Benchmark 2018-B2 | |
| Structural Overview | ||
Certificateholder will no longer have the right to replace the Special Servicer and such replacement will occur based on a vote of holders of all voting eligible Classes of Certificates as described below.
The Operating Advisor may also recommend the replacement of the Special Servicer at any time as described in “Operating Advisor” above. | ||
| ■ Replacement of Special Servicer by Vote of Certificateholders: | After the occurrence and during the continuance of a Control Termination Event and upon (a) the written direction of holders of Principal Balance Certificates evidencing not less than 25% of the Voting Rights of the Principal Balance Certificates (taking into account the application of Appraisal Reduction Amounts to notionally reduce the Certificate Balances of the Principal Balance Certificates) requesting a vote to replace the Special Servicer with a replacement special servicer, (b) payment by such requesting holders to the Certificate Administrator of all reasonable fees and expenses to be incurred by the Certificate Administrator in connection with administering such vote and (c) delivery by such holders to the Certificate Administrator and the Trustee of written confirmations from each Rating Agency that the appointment of such replacement special servicer will not result in a downgrade, withdrawal or qualification of the Certificates (which confirmations will be obtained at the expense of such holders), the Certificate Administrator will be required to post notice of such direction on its website and by mail, and conduct the solicitation of votes of all Certificates in such regard, which such vote must occur within 180 days of the posting of such notice. Upon the written direction of holders of Principal Balance Certificates evidencing at least 50% of a Certificateholder Quorum, the Trustee will immediately replace the Special Servicer with a qualified replacement special servicer designated by such holders of Certificates.
A “Certificateholder Quorum” means, in connection with any solicitation of votes in connection with the replacement of the Special Servicer or the Asset Representations Reviewer described above, the holders of Certificates evidencing at least 50% of the aggregate Voting Rights (taking into account the application of realized losses and, other than with respect to the termination of the Asset Representations Reviewer, the application of any Appraisal Reduction Amounts to notionally reduce the Certificate Balance of the Certificates) of all Principal Balance Certificates on an aggregate basis.
With respect to each of the Serviced Whole Loan, subject to the related intercreditor agreement, the holders of the related Pari Passu Companion Loans, under certain circumstances following a servicer termination event with respect to the Special Servicer, will be entitled to direct the Trustee (and the Trustee will be required) to terminate the Special Servicer solely with respect to such Serviced Whole Loan. A replacement special servicer will be selected by the Trustee or, prior to a Control Termination Event, by the Directing Certificateholder;provided,however, that any successor special servicer appointed to replace the Special Servicer with respect to such Whole Loan can generally not be the person (or its affiliate) that was terminated at the direction of the holder of the related Pari Passu Companion Loan.
With respect to any Non-Serviced Whole Loan, subject to the related intercreditor agreement, the Benchmark 2018-B2 trust as holder of the related mortgage loan has similar termination rights in the event of a servicer termination event with respect to the special servicer under the applicable trust and servicing agreement or pooling and servicing agreement, as applicable, as described above, which may be exercised by the Directing Certificateholder prior to the Control Termination Event. However, the successor special servicer will be selected pursuant to the applicable trust and servicing agreement or pooling and servicing agreement, as applicable, by the related directing holder prior to a control event under such trust and servicing agreement or pooling and servicing agreement, as applicable. The Master Servicer and Special Servicer are entitled to certain fees in connection with the servicing and administration of the mortgage loans as more fully described in “Pooling and Servicing Agreement—Servicing and Other Compensation and Payment of Expenses” in the Preliminary Prospectus.
|
| ■ Dispute Resolution Provisions: | Each Mortgage Loan Seller will be subject to the dispute resolution provisions set forth in the Pooling and Servicing Agreement to the extent those provisions are triggered with respect to any mortgage loan sold to the Depositor by a Mortgage Loan Seller and such Mortgage Loan Seller will be obligated under the related mortgage loan purchase agreement to comply with all applicable provisions and to take part in any mediation or arbitration proceedings that may result.
Generally, in the event that a request to repurchase a mortgage loan (a “Repurchase Request”) |
THE INFORMATION IN THIS STRUCTURAL AND COLLATERAL TERM SHEET IS NOT COMPLETE AND MAY BE AMENDED PRIOR TO THE TIME OF SALE. THIS TERM SHEET IS NOT AN OFFER TO SELL THESE SECURITIES AND IT IS NOT A SOLICITATION OF AN OFFER TO BUY THESE SECURITIES IN ANY JURISDICTION WHERE THE OFFER OR SALE IS NOT PERMITTED.
| | |
30 of 151
| Structural and Collateral Term Sheet | Benchmark 2018-B2 | |
| Structural Overview | ||
is not “Resolved” (as defined below) within 180 days after the related Mortgage Loan Seller receives such Repurchase Request (a “Resolution Failure”), then the Enforcing Servicer (as defined below) will be required to send a notice to the “Initial Requesting Certificateholder” (if any) indicating the Enforcing Servicer’s intended course of action with respect to the Repurchase Request. If (a) the Enforcing Servicer’s intended course of action with respect to the Repurchase Request does not involve pursuing further action to exercise rights against the related Mortgage Loan Seller with respect to the Repurchase Request and the Initial Requesting Certificateholder, if any, or any other Certificateholder or Certificate Owner wishes to exercise its right to refer the matter to mediation (including nonbinding arbitration) or arbitration, or (b) the Enforcing Servicer’s intended course of action is to pursue further action to exercise rights against the related Mortgage Loan Seller with respect to the Repurchase Request but the Initial Requesting Certificateholder, if any, or any other Certificateholder or Certificate Owner does not agree with the dispute resolution method selected by the Enforcing Servicer, then the Initial Requesting Certificateholder, if any, or such other Certificateholder or Certificate Owner may deliver a written notice to the Enforcing Servicer indicating its intent to exercise its right to refer the matter to either mediation or arbitration.
The Enforcing Servicer will be required to consult with any Certificateholder or Certificate Owner that delivers a notice of its intent to exercise its dispute resolution rights (a “Requesting Certificateholder”) so that a Requesting Certificateholder may consider the views of the Enforcing Servicer as to the claims underlying the Repurchase Request and possible dispute resolution methods. If a Requesting Certificateholder elects to exercise its right to refer the matter to either mediation or arbitration, then it will become the party responsible for enforcing the Repurchase Request and must promptly submit the matter to mediation (including nonbinding arbitration) or arbitration. Failure to make an election to exercise that right or failure to begin the elected form of proceedings within the certain timeframe set forth in the Pooling and Servicing Agreement will generally waive the Certificateholders’ or Certificate Owners’ rights with respect to the related Repurchase Request.
The “Enforcing Servicer” will be (a) with respect to a specially serviced loan, the Special Servicer, and (b) with respect to a non-specially serviced loan, (i) in the case of a Repurchase Request made by the Special Servicer, the Directing Certificateholder or a Controlling Class Certificateholder, the Master Servicer, and (ii) in the case of a Repurchase Request made by any person other than the Special Servicer, the Directing Certificateholder or a Controlling Class Certificateholder, (A) prior to a Resolution Failure relating to such non-specially serviced loan, the Master Servicer, and (B) from and after a Resolution Failure relating to such non-specially serviced Loan, the Special Servicer.
“Resolved” means, with respect to a Repurchase Request, (i) that the related Material Defect has been cured, (ii) the related mortgage loan has been repurchased in accordance with the related mortgage loan purchase agreement, (iii) a mortgage loan has been substituted for the related mortgage loan in accordance with the related mortgage loan purchase agreement, (iv) the applicable Mortgage Loan Seller has made a Loss of Value Payment, (v) a contractually binding agreement is entered into between the Enforcing Servicer, on behalf of the issuing entity, and the related Mortgage Loan Seller that settles the related Mortgage Loan Seller’s obligations under the related mortgage loan purchase agreement, or (vi) the related mortgage loan is no longer property of the issuing entity as a result of a sale or other disposition in accordance with the Pooling and Servicing Agreement.
| ||
| ■ Investor Communications | The Certificate Administrator is required to include on any Form 10–D any request received from a Certificateholder to communicate with other Certificateholders related to Certificateholders exercising their rights under the terms of the Pooling and Servicing Agreement. Any Certificateholder wishing to communicate with other Certificateholders regarding the exercise of its rights under the terms of the Pooling and Servicing Agreement should deliver a written request signed by an authorized representative of the requesting investor to the Certificate Administrator at the address below:
9062 Old Annapolis Road
Columbia, Maryland 21045
Attention: Corporate Trust Administration Group – Benchmark 2018-B2
With a copy to: trustadministrationgroup@wellsfargo.com
|
THE INFORMATION IN THIS STRUCTURAL AND COLLATERAL TERM SHEET IS NOT COMPLETE AND MAY BE AMENDED PRIOR TO THE TIME OF SALE. THIS TERM SHEET IS NOT AN OFFER TO SELL THESE SECURITIES AND IT IS NOT A SOLICITATION OF AN OFFER TO BUY THESE SECURITIES IN ANY JURISDICTION WHERE THE OFFER OR SALE IS NOT PERMITTED.
| | |
31 of 151
| Structural and Collateral Term Sheet | Benchmark 2018-B2 | |
| Structural Overview | ||
| ■ Master Servicer and Special Servicer Compensation: | The Master Servicer is entitled to a fee (the “Servicing Fee”) payable monthly from interest received in respect of each mortgage loan, any related REO loan and any related Serviced Companion Loan that will accrue at the related servicing fee rate described in the Preliminary Prospectus. The Special Servicer is also entitled to a fee (the “Special Servicing Fee”) with respect to each specially serviced loan and REO loan (other than a non-serviced mortgage loan) at the special servicing fee rate described in the Preliminary Prospectus.
In addition to the Servicing Fee, Special Servicing Fee and certain other fees described below, the Master Servicer and Special Servicer are entitled to retain and share certain additional servicing compensation, including assumption application fees, assumption fees, defeasance fees, processing fees and certain Excess Modification Fees and consent fees with respect to the mortgage loans. The Special Servicer may also be entitled to either a Workout Fee or Liquidation Fee, but not both, from recoveries in respect of any particular mortgage loan.
An “Excess Modification Fee” with respect to any mortgage loan (other than the non-serviced mortgage loans) or Serviced Whole Loan is the sum of (A) the excess, if any, of (i) any and all Modification Fees with respect to a mortgage loan or Serviced Whole Loan, as applicable, over (ii) all unpaid or unreimbursed additional expenses described in the Preliminary Prospectus (excluding Special Servicing Fees, Workout Fees and Liquidation Fees) outstanding or previously incurred on behalf of the issuing entity with respect to the related mortgage loan or Serviced Whole Loan, as applicable, and reimbursed from such Modification Fees and (B) expenses previously paid or reimbursed from Modification Fees as described in clause (A), which expenses have subsequently been recovered from the related borrower or otherwise.
With respect to the Master Servicer and Special Servicer, the Excess Modification Fees collected and earned by such servicer from the related borrower (taken in the aggregate with any other Excess Modification Fees collected and earned by such servicer from the related borrower within the prior 18 months of the collection of the current Excess Modification Fees) will be subject to a cap of 1.00% of the outstanding principal balance of the related mortgage loan or Serviced Whole Loan, as applicable, on the closing date of the related modification, extension, waiver or amendment. A “Modification Fee” with respect to any mortgage loan (other than the non-serviced mortgage loans) or Serviced Companion Loan is generally any fee with respect to a modification, extension, waiver or amendment of any mortgage loan and/or related Serviced Companion Loan (other than all assumption fees, assumption application fees, consent fees, defeasance fees, Special Servicing Fees, Liquidation Fees or Workout Fees).
A “Workout Fee” will generally be payable with respect to each corrected loan (as more specifically described in the Preliminary Prospectus) and will be calculated at a rate of 1.00% of payments of principal and interest on the respective mortgage loan for so long as it remains a corrected loan, subject to a maximum of $1,000,000 in the aggregate with respect to any particular corrected loan. After receipt by the Special Servicer of Workout Fees with respect to a corrected loan in an amount equal to $25,000, any Workout Fees in excess of such amount will be reduced by the Excess Modification Fee Amount;provided that in the event the Workout Fee, collected over the course of such workout calculated at the Workout Fee Rate is less than $25,000, then the Special Servicer will be entitled to an amount from the final payment on the related corrected loan (including any related Serviced Companion Loan) that would result in the total Workout Fees payable to the Special Servicer in respect of that corrected loan (including any related Serviced Companion Loan) to be $25,000.
The “Excess Modification Fee Amount” for any corrected loan is an amount equal to any Excess Modification Fees paid by or on behalf of the related borrower with respect to the related mortgage loan (including the related Serviced Companion Loan) and received and retained by the Master Servicer or the Special Servicer, as applicable, as additional servicing compensation within the prior 18 months of the related modification, waiver, extension or amendment resulting in the mortgage loan or REO loan being a corrected loan, but only to the extent those fees have not previously been deducted from a Workout Fee or Liquidation Fee.
A “Liquidation Fee” will generally be payable with respect to each specially serviced loan or REO property (except with respect to any non-serviced mortgage loan) as to which the Special Servicer obtains a full or partial recovery of the related asset. The Liquidation Fee for each specially serviced loan will be payable at a rate of 1.00% of the liquidation proceeds (exclusive of default interest) subject to a maximum of $1,000,000;provided,however, that no Liquidation Fee will be less than $25,000.
The Liquidation Fees will be reduced by the amount of any Excess Modification Fees received |
THE INFORMATION IN THIS STRUCTURAL AND COLLATERAL TERM SHEET IS NOT COMPLETE AND MAY BE AMENDED PRIOR TO THE TIME OF SALE. THIS TERM SHEET IS NOT AN OFFER TO SELL THESE SECURITIES AND IT IS NOT A SOLICITATION OF AN OFFER TO BUY THESE SECURITIES IN ANY JURISDICTION WHERE THE OFFER OR SALE IS NOT PERMITTED.
| | |
32 of 151
| Structural and Collateral Term Sheet | Benchmark 2018-B2 | |
| Structural Overview | ||
by the Special Servicer with respect to the related mortgage loan (including a Serviced Companion Loan) or REO property as additional compensation within the prior 18 months, but only to the extent those fees have not previously been deducted from a Workout Fee or Liquidation Fee.
Similar fees to those described above will be payable to the applicable special servicer for the Non-Serviced Whole Loans under the related trust and servicing agreement or pooling and servicing agreement, as applicable.
Subject to certain limited exceptions, in connection with its duties under the Pooling and Servicing Agreement, the Special Servicer and its affiliates are prohibited from receiving or retaining any compensation (other than compensation specifically provided for under the Pooling and Servicing Agreement) from anyone in connection with the disposition, workout or foreclosure of any mortgage loan, the management or disposition of any REO property, or the performance of any other special servicing duties under the Pooling and Servicing Agreement. In the event the Special Servicer does receive any such compensation, it will be required to disclose those fees to the Certificate Administrator who will include it as part of the statement to Certificateholders.
In addition, no liquidation fee will be payable to the Special Servicer if a mortgage loan or Serviced Whole Loan becomes a specially serviced loan only because of a maturity default and the related liquidation proceeds are received within 90 days following the related maturity date as a result of the related mortgage loan or Serviced Whole Loan being refinanced or otherwise repaid in full.
See “Pooling and Servicing Agreement—Servicing and Other Compensation and Payment of Expenses” in the Preliminary Prospectus.
| ||
| ■ Deal Website: | The Certificate Administrator will maintain a deal website to which certain persons will have access to certain information including, but not limited to the following, which will be posted: ■ special notices; ■ summaries of any final asset status reports; ■ appraisals in connection with Appraisal Reductions plus any second appraisals ordered; ■ an “Investor Q&A Forum”; ■ a voluntary investor registry; ■ SEC EDGAR filings; and ■ risk retention. |
THE INFORMATION IN THIS STRUCTURAL AND COLLATERAL TERM SHEET IS NOT COMPLETE AND MAY BE AMENDED PRIOR TO THE TIME OF SALE. THIS TERM SHEET IS NOT AN OFFER TO SELL THESE SECURITIES AND IT IS NOT A SOLICITATION OF AN OFFER TO BUY THESE SECURITIES IN ANY JURISDICTION WHERE THE OFFER OR SALE IS NOT PERMITTED.
| | |
33 of 151
| Structural and Collateral Term Sheet | Benchmark 2018-B2 | |
| Central Park of Lisle | ||
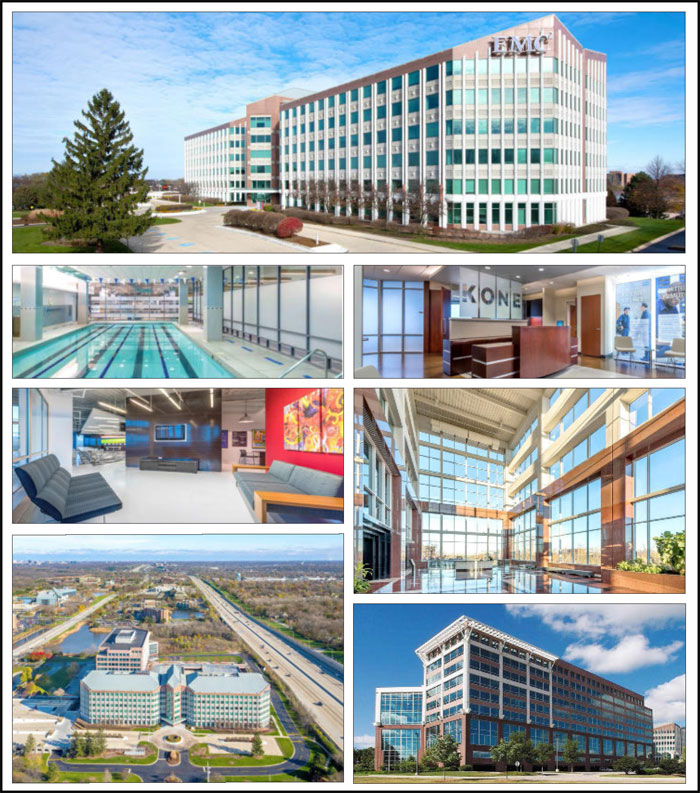
THE INFORMATION IN THIS STRUCTURAL AND COLLATERAL TERM SHEET IS NOT COMPLETE AND MAY BE AMENDED PRIOR TO THE TIME OF SALE. THIS TERM SHEET IS NOT AN OFFER TO SELL THESE SECURITIES AND IT IS NOT A SOLICITATION OF AN OFFER TO BUY THESE SECURITIES IN ANY JURISDICTION WHERE THE OFFER OR SALE IS NOT PERMITTED.
| | |
34 of 151
| Structural and Collateral Term Sheet | Benchmark 2018-B2 | |
| Central Park of Lisle | ||
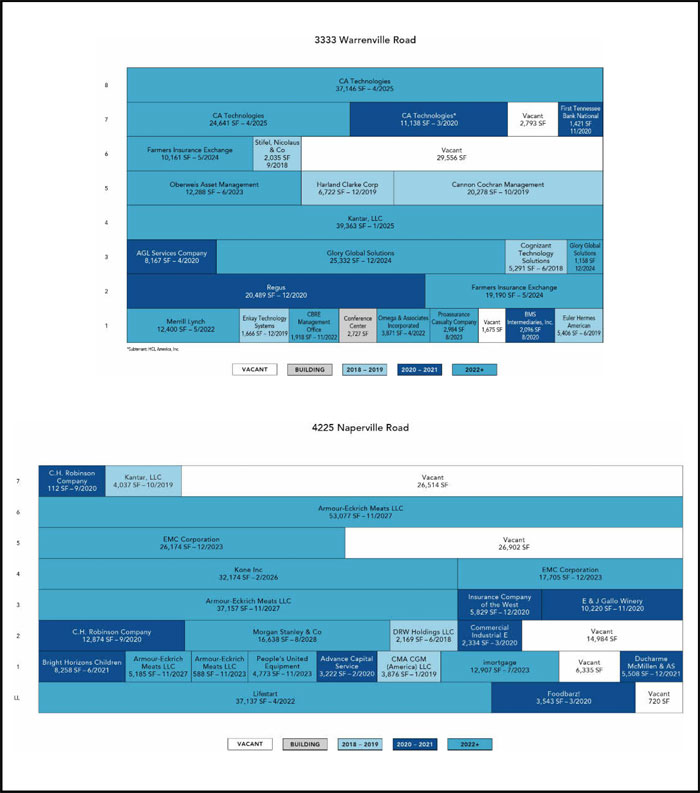
THE INFORMATION IN THIS STRUCTURAL AND COLLATERAL TERM SHEET IS NOT COMPLETE AND MAY BE AMENDED PRIOR TO THE TIME OF SALE. THIS TERM SHEET IS NOT AN OFFER TO SELL THESE SECURITIES AND IT IS NOT A SOLICITATION OF AN OFFER TO BUY THESE SECURITIES IN ANY JURISDICTION WHERE THE OFFER OR SALE IS NOT PERMITTED.
| | |
35 of 151
| Structural and Collateral Term Sheet | Benchmark 2018-B2 | |
| Central Park of Lisle | ||
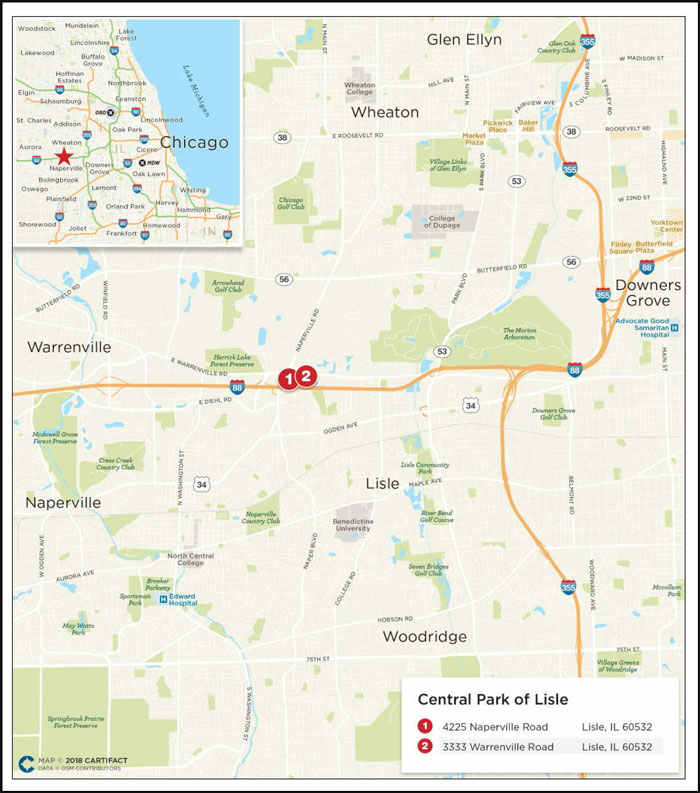
THE INFORMATION IN THIS STRUCTURAL AND COLLATERAL TERM SHEET IS NOT COMPLETE AND MAY BE AMENDED PRIOR TO THE TIME OF SALE. THIS TERM SHEET IS NOT AN OFFER TO SELL THESE SECURITIES AND IT IS NOT A SOLICITATION OF AN OFFER TO BUY THESE SECURITIES IN ANY JURISDICTION WHERE THE OFFER OR SALE IS NOT PERMITTED.
| | |
36 of 151
| Structural and Collateral Term Sheet | Benchmark 2018-B2 | |
| Central Park of Lisle | ||
| Mortgage Loan Information | Property Information | |||
| Mortgage Loan Seller: | CREFI | Single Asset / Portfolio: | Single Asset | |
| Original Principal Balance(1): | $79,500,000 | Title: | Fee | |
| Cut-off Date Principal Balance(1): | $79,500,000 | Property Type - Subtype: | Office – Suburban | |
| % of Pool by IPB: | 5.3% | Net Rentable Area (SF): | 693,606 | |
| Loan Purpose: | Acquisition | Location: | Lisle, IL | |
| Borrower: | CP Lisle SPV, LLC | Year Built / Renovated: | 1991, 2001 / 2015 | |
| Sponsor: | Lincoln Property Company | Occupancy: | 84.2% | |
| Commercial, Inc. | Occupancy Date: | 10/18/2017 | ||
| Interest Rate(2): | 4.35360% | Number of Tenants: | 37 | |
| Note Date: | 12/14/2017 | 2014 NOI(3): | $6,617,319 | |
| Maturity Date: | 1/6/2023 | 2015 NOI(3): | $8,967,996 | |
| Interest-only Period: | 60 months | 2016 NOI: | $9,752,552 | |
| Original Term: | 60 months | TTM NOI (as of 10/2017): | $9,691,114 | |
| Original Amortization: | None | UW Economic Occupancy: | 87.3% | |
| Amortization Type: | Interest Only | UW Revenues: | $17,454,537 | |
| Call Protection(4): | L(25),Def(30),O(5) | UW Expenses: | $7,402,305 | |
| Lockbox / Cash Management: | Hard / Springing | UW NOI: | $10,052,232 | |
| Additional Debt: | Yes | UW NCF: | $9,045,701 | |
| Additional Debt Balance: | $14,350,000 | Appraised Value / Per SF: | $135,000,000 / $195 | |
| Additional Debt Type: | B-Note | Appraisal Date: | 11/3/2017 | |
| Escrows and Reserves(5) | Financial Information(1) | ||||||||
| Initial | Monthly | Initial Cap | A-Note | Whole Loan | |||||
| Taxes: | $1,149,594 | $191,599 | N/A | Cut-off Date Loan / SF: | $115 | $135 | |||
| Insurance: | $23,934 | Springing | $23,934 | Maturity Date Loan / SF: | $115 | $135 | |||
| Replacement Reserves: | $3,672,605 | $11,560 | $277,442 | Cut-off Date LTV: | 58.9% | 69.5 | % | ||
| TI/LC: | $0 | $72,277 | N/A | Maturity Date LTV: | 58.9% | 69.5 | % | ||
| Other: | $2,999,016 | $0 | N/A | UW NCF DSCR: | 2.58x | 1.96 | x | ||
| UW NOI Debt Yield: | 12.6% | 10.7 | % | ||||||
| Sources and Uses | ||||||||
| Sources | Proceeds | % of Total | Uses | Proceeds | % of Total | |||
| Mortgage Loan(1) | $79,500,000 | 56.9 | % | Purchase Price | $129,000,000 | 92.4 | % | |
| B-Note(1) | 14,350,000 | 10.3 | Upfront Reserves | 7,845,149 | 5.6 | |||
| Sponsor Equity | 41,679,690 | 29.9 | Closing Costs | 2,773,768 | 2.0 | |||
| Other Sources(6) | 4,089,227 | 2.9 | ||||||
| Total Sources | $139,618,917 | 100.0 | % | Total Uses | $139,618,917 | 100.0 | % | |
| (1) | The Central Park of Lisle loan is part of a whole loan evidenced by one senior note, with an outstanding principal balance as of the Cut-off Date of $79.5 million (the “Central Park of Lisle A-Note”) and one subordinate note, with an outstanding principal balance as of the Cut-off Date of $14.35 million (the “Central Park of Lisle B-Note”). The A-Note Financial Information presented in the chart above reflects the Cut-off Date balance and Maturity Date balance of the Central Park of Lisle A-Note, but excludes the Central Park of Lisle B-Note. The Whole Loan Financial Information presented in the chart above reflects the Cut-off Date balance and Maturity Date balance of the Central Park of Lisle A-Note and Central Park of Lisle B-Note. |
| (2) | Interest Rate reflects the interest rate with respect to the Central Park of Lisle A-Note. The interest rate on the Central Park of Lisle B-Note is 7.60000%. |
| (3) | The increase in NOI from 2014 to 2015 is primarily due to free rent and abated reimbursements during 2014 on newly executed leases related to 64,568 square feet for Armour-Eckrich and 20,264 square feet for Glory Global Solutions. |
(4) The lockout period will be at least 25 payment dates beginning with and including the payment date of February 6, 2018. Defeasance of the full $93.85 million Central Park of Lisle Whole Loan (as defined below) is permitted after the earlier of (x) December 14, 2020 and (y) the date that is two years from the closing date of the securitization of the last portion of the Central Park of Lisle Whole Loan. The assumed lockout period of 25 payments is based on the expected Benchmark 2018-B2 securitization closing date in February 2018. The actual lockout period may be longer.
| (5) | For a full description of Escrows and Reserves, please refer to “Escrows and Reserves” below. |
| (6) | Other Sources consists primarily of credits from the seller of the Central Park of Lisle Property (as defined below) for the cost of unfunded tenant improvements, free rent, transfer of tenant security deposits, partial month December rent payments and other miscellaneous seller credits. |
THE INFORMATION IN THIS STRUCTURAL AND COLLATERAL TERM SHEET IS NOT COMPLETE AND MAY BE AMENDED PRIOR TO THE TIME OF SALE. THIS TERM SHEET IS NOT AN OFFER TO SELL THESE SECURITIES AND IT IS NOT A SOLICITATION OF AN OFFER TO BUY THESE SECURITIES IN ANY JURISDICTION WHERE THE OFFER OR SALE IS NOT PERMITTED.
| | |
37 of 151
| Structural and Collateral Term Sheet | Benchmark 2018-B2 | |
| Central Park of Lisle | ||
The Loan.The Central Park of Lisle loan is secured by a first mortgage lien on the borrower’s fee interest in a 693,606 square foot suburban office property located in Lisle, Illinois (the “Central Park of Lisle Property”). The loan is part of a whole loan that has an outstanding principal balance as of the Cut-off Date of $93.85 million (the “Central Park of Lisle Whole Loan”) and is comprised of one senior note, with an outstanding principal balance as of the Cut-off Date of $79.5 million (the “Central Park of Lisle A-Note”), and one subordinate B-Note with an aggregate outstanding principal balance as of the Cut-off Date of $14.35 million (the “Central Park of Lisle B-Note”). The Central Park of Lisle loan is evidenced by the Central Park of Lisle A-Note, which is the non-controlling note, with an outstanding principal balance as of the Cut-off Date of $79.5 million and is being contributed to the Benchmark 2018-B2 Trust. The controlling Central Park of Lisle B-Note is held by a third party investor. The relationship between the holders of the Central Park of Lisle Whole Loan will be governed by a co-lender agreement as described under the “Description of the Mortgage Pool—The Whole Loans—The Serviced AB Whole Loans” in the Preliminary Prospectus. The Central Park of Lisle Whole Loan has a five-year term and will be interest-only for the entire loan term.
| Whole Loan Summary(1) | |||||
| Note | Original Balance | Cut-off Date Balance | Note Holder | Controlling Piece | |
| A | $79,500,000 | $79,500,000 | Benchmark 2018-B2 | No | |
| B | 14,350,000 | 14,350,000 | RCG Longview(2) | Yes | |
| Total | $93,850,000 | $93,850,000 | |||
| (1) | The Central Park of Lisle Whole Loan will be serviced pursuant to the Benchmark 2018-B2 pooling and servicing agreement. |
| (2) | The Central Park of Lisle B-Note is held by Safety National Casualty Corporation, which is managed by RCG Longview Management, LLC. |
The Borrower. The borrowing entity for the Central Park of Lisle Whole Loan is CP Lisle SPV, LLC, a Delaware limited liability company and special purpose entity.
The Loan Sponsor.The loan sponsor and nonrecourse carve-out guarantor for the Central Park of Lisle Whole Loan is Lincoln Property Company Commercial, Inc. (“Lincoln Property Company”). Headquartered in Dallas, Texas, Lincoln Property Company develops, manages and leases both residential communities and commercial real estate properties. Lincoln Property Company’s commercial real estate portfolio includes urban and suburban office properties, industrial facilities, neighborhood shopping and specialty retail center and mixed-used developments. Lincoln Property Company was founded in 1965 and currently employs over 6,800 people across 200 cities and 10 countries, has developed over 112 million square feet of commercial properties and manages over 140,000 residential units.
The Property.The Central Park of Lisle Property is a 693,606 square foot Class A suburban office complex located in Lisle, Illinois. The Central Park of Lisle Property consists of two connected buildings located on an approximately 25.1 acre site. 4225 Naperville Road is a seven-story building constructed in 1991 consisting of 381,694 square feet. 3333 Warrenville Road is an eight-story building constructed in 2001 consisting of 311,912 square feet. Amenities at the Central Park of Lisle Property include a full-service health and athletic club, Bright Horizon’s child care and early education center, a full-service cafeteria, a conference facility capable of accommodating up to 85 guests, and executive parking consisting of 125 private heated garage stalls. The health club located at the Central Park of Lisle Property is 37,137 square feet and contains a lap pool, sauna, indoor basketball room and yoga room along with member services such as next day laundry, personal training and group classes. The property features a total of 2,152 parking spaces across two surface lots and two covered deck parking garages, with a covered parking deck attached directly to each of the 4225 Naperville Road and 3333 Warrenville Road buildings. The 2,152 total parking spaces result in a parking ratio of approximately 3.1 per 1,000 square feet of space. In connection with the origination of the Central Park of Lisle Whole Loan, $3,672,605 for upfront capital expenditures was escrowed with the anticipation of being used for improvements to the landscaping, pavement, parking garages, health and athletic club, restrooms and common corridors at the Central Park of Lisle Property. Prior owners of the Central Park of Lisle Property have spent over $3.7 million on renovations since 2010, including construction of a conference center and management office in 2010 and a complete lobby renovation of the 3333 Warrenville Road building in 2015.
THE INFORMATION IN THIS STRUCTURAL AND COLLATERAL TERM SHEET IS NOT COMPLETE AND MAY BE AMENDED PRIOR TO THE TIME OF SALE. THIS TERM SHEET IS NOT AN OFFER TO SELL THESE SECURITIES AND IT IS NOT A SOLICITATION OF AN OFFER TO BUY THESE SECURITIES IN ANY JURISDICTION WHERE THE OFFER OR SALE IS NOT PERMITTED.
| | |
38 of 151
| Structural and Collateral Term Sheet | Benchmark 2018-B2 | |
| Central Park of Lisle | ||
As of October 18, 2017, the Central Park of Lisle Property was 84.2% leased to 37 tenants. The Central Park of Lisle Property has exhibited an average occupancy over the last 10 years of 86.0% with occupancy remaining at or above 80.0% since 2008. The largest tenant, Armour-Eckrich Meats LLC (“Armour-Eckrich”), leases 96,007 square feet (13.8% of the net rentable area) through November 2027 and the Central Park of Lisle Property has served as the company’s headquarters since 2007. Armour-Eckrich was founded in Chicago in 1867 and is a subsidiary of both Smithfield Foods, Inc. and WH Group Limited, a Chinese-based company and the largest pork company in the world. For the 12 months ended January 3, 2016, Smithfield Foods, Inc. reported sales of approximately $14.4 billion and net income of approximately $452.3 million. Armour-Eckrich accounts for approximately 16.5% of the underwritten base rent at the Central Park of Lisle Property with two, five-year renewal options remaining and an expansion option to expand by an additional 16,049 square feet with notice by May 31, 2018. The second largest tenant, CA Technologies (NASDAQ:CA), leases 72,925 square feet (10.5% of the net rentable area) with 61,787 square feet expiring in April 2025 and 11,138 square feet expiring on April 30, 2020. CA Technologies has been located at the Central Park of Lisle Property since 2012 and is a global software solutions company which enables its customers to plan, develop, manage and secure application and enterprise environments across distributed cloud, mobile and mainframe platforms. For the fiscal year ended March 31, 2017, CA Technologies reported total revenue of approximately $4.0 billion and income from continuing operations of $775.0 million. CA Technologies accounts for approximately 13.5% of the underwritten base rent at the Central Park of Lisle Property and has two, five-year renewal options remaining on the 61,787 square feet expiring in April 2025. CA Technologies subleases approximately 11,138 square feet to Chicago Tribune Company, LLC through March 31, 2020 at a rate of $19.87 per square foot. Chicago Tribune Company, LLC further sub-subleases the approximately 11,138 square feet of its space to HCL America, Inc. through March 31, 2020 at a rate of $19.87 per square foot. CA Technologies direct leases the 11,138 square foot suite at a rate of $20.39 per square foot. The third largest tenant, EMC Corporation (d/b/a Dell EMC), leases 43,879 square feet (6.3% of the net rentable area) through December 2023 and has been a tenant since March 2008. EMC Corporation provides infrastructure for organizations through hybrid cloud and big-data solutions. Dell Technologies acquired EMC Corporation in September 2016, creating the world’s largest privately controlled technology company and thus renaming EMC Corporation to Dell EMC. EMC Corporation accounts for approximately 8.0% of the underwritten base rent at the Central Park of Lisle Property and its lease contains two remaining five-year extension options.
The Central Park of Lisle Property is located approximately 25 miles west of the central business district of Chicago, Illinois. The Central Park of Lisle Property benefits from its location directly adjacent to Interstate 88, which runs east to west and is part of the Chicago-Kansas City Expressway. According to the appraisal, the 2016 estimated population within a one-, three- and five-mile radius of the Central Park of Lisle Property was 5,209, 74,904 and 225,334, respectively. According to the appraisal, the average household income within a one-, three- and five-mile radius of the Central Park of Lisle Property was $108,972, $122,380 and $120,855, respectively, which are higher than the 2016 United States median household income of $55,497.
According to the appraisal, the Central Park of Lisle Property is located in the East-West Corridor submarket of the Chicago office market. As of the third quarter of 2017, the East-West Corridor submarket had an office inventory of approximately 73.2 million square feet with average asking rents of $19.64 per square foot. As of the third quarter of 2017, the East-West Corridor submarket exhibited an overall vacancy rate of 14.6%, which is lower than the 15.2% vacancy rate as of the end of 2016 and average vacancy rate over the last 10 years of 16.5%. The East-West Corridor submarket has experienced a positive absorption rate of 0.3% over the last 10 years, which is in line with the submarket’s current absorption rate of 0.2% during the third quarter of 2017. The appraiser noted 52,800 square feet of new supply in the East-West Corridor submarket, however, the appraiser concluded the new supply will not directly impact the Central Park of Lisle Property. The appraiser identified 11 Class-A properties ranging in size from 146,754 to 1,562,599 square feet and built between 1981 and 2008 as directly competitive with the Central Park of Lisle Property. The directly competitive properties had a weighted average vacancy of 6.6% as of November 2017. The appraiser concluded a vacancy rate for the Central Park of Lisle Property of 7.0% which is less than the current vacancy rate of 15.8% as of October 18, 2017. The appraiser concluded a market rent of $21.50 per square foot for leases less than 10,000 square feet and $21.00 per square foot for leases greater than 10,000 square feet which are both greater than the weighted average in-place underwritten base rent at the Central Park of Lisle Property of $20.01 per square foot for office leases less than 10,000 square feet and $19.97 per square foot for office leases greater than 10,000 square feet.
| Historical and Current Occupancy(1) | |||
| 2014 | 2015 | 2016 | Current(2) |
| 90.5% | 90.1% | 89.7% | 84.2% |
| (1) | Historical Occupancies are as of December 31 of each respective year. |
| (2) | Current Occupancy is as of October 18, 2017. |
THE INFORMATION IN THIS STRUCTURAL AND COLLATERAL TERM SHEET IS NOT COMPLETE AND MAY BE AMENDED PRIOR TO THE TIME OF SALE. THIS TERM SHEET IS NOT AN OFFER TO SELL THESE SECURITIES AND IT IS NOT A SOLICITATION OF AN OFFER TO BUY THESE SECURITIES IN ANY JURISDICTION WHERE THE OFFER OR SALE IS NOT PERMITTED.
| | |
39 of 151
| Structural and Collateral Term Sheet | Benchmark 2018-B2 | |
| Central Park of Lisle | ||
| Tenant Summary(1) | ||||||
| Tenant | Ratings(2) Moody’s/S&P/Fitch | Net Rentable Area (SF) | % of Total NRA | Base Rent PSF | % of Total Base Rent | Lease Expiration Date |
| Armour-Eckrich(3) | Ba2 / BBB- / BBB | 96,007 | 13.8% | $19.40 | 16.5% | 11/30/2027 |
| CA Technologies(4)(5) | Baa2 / BBB+ / BBB+ | 72,925 | 10.5% | $20.87 | 13.5% | Various |
| EMC Corporation | Ba2 / BB- / BB+ | 43,879 | 6.3% | $20.46 | 8.0% | 12/31/2023 |
| Kantar LLC(6) | NA / BBB / BBB+ | 43,400 | 6.3% | $21.28 | 8.2% | Various |
| Lifestart(7) | NA / NA / NA | 37,137 | 5.4% | $0.81 | 0.3% | 4/30/2022 |
| Kone Inc(8) | NA / NA / NA | 32,916 | 4.7% | $21.14 | 6.2% | 2/28/2026 |
| Farmers Insurance Exchange(9) | A2 / A / NA | 29,351 | 4.2% | $21.66 | 5.6% | 5/31/2024 |
| Glory Global Solutions(10) | NA / NA / NA | 26,490 | 3.8% | $19.25 | 4.5% | 12/31/2024 |
| Regus | NA / NA / NA | 20,489 | 3.0% | $20.50 | 3.7% | 12/31/2020 |
| Cannon Cochran Management | NA / NA / NA | 20,278 | 2.9% | $23.50 | 4.2% | 10/31/2019 |
| (1) | Based on the underwritten rent roll dated October 18, 2017. |
| (2) | Ratings provided are for the parent company of the entity listed in the “Tenant” field whether or not the parent company guarantees the lease. |
| (3) | Armour-Eckrich has a one-time right to contract its space by 77,252 square feet on February 28, 2023 with 12 months’ notice and payment of a termination fee up to approximately $1.4 million, the unamortized portion of leasing costs and six months’ rent. Of its total 96,007 square feet, Armour-Eckrich leases 588 square feet of storage space which expires on November 30, 2023. |
| (4) | 61,787 square feet of the CA Technologies space expires April 30, 2025 with the remaining 11,138 square feet of space expiring April 30, 2020. The 11,138 square foot suite is currently subleased to Chicago Tribune Company, LLC through March 31, 2020 at a rate of $19.87 per square foot. Chicago Tribune Company, LLC further sub-subleases the 11,138 square feet to HCL America, Inc. through March 31, 2020 at a rate of $19.87 per square foot. |
| (5) | CA Technologies has a one-time right to contract its space by 24,641 square feet on April 30, 2020 with 12 months’ notice and payment of a contraction fee. |
| (6) | Kantar LLC leases 39,363 square feet on a lease expiring January 31, 2025 and 4,037 square feet expiring October 31, 2019. |
| (7) | Lifestart utilizes its space as the fitness center at the Central Park of Lisle Property. As this space is considered an amenity for the Central Park of Lisle Property, Lifestart pays below market rent. |
| (8) | Kone Inc has a one-time termination option related to its entire space on February 29, 2024 with 12 months’ notice and payment of a termination fee. The termination fee for 28,220 square feet of Kone Inc’s space is equal to seven months of rent. The termination fee for 4,696 square feet of Kone Inc’s space is equal to three months of rent and the unamortized portion (plus interest) of any free rent, tenant improvements and leasing commissions and legal fees. |
| (9) | Farmers Insurance Exchange has a one-time termination option on May 31, 2022 with 12 months’ notice and payment of a termination fee equal to three months of rent and the unamortized portion of tenant improvements. |
| (10) | Glory Global Solutions has a one-time termination option on December 31, 2021 with 12 months’ notice and payment of a termination fee of $669,734. |
| Lease Rollover Schedule(1)(2) | |||||||||||
| Year | Number of Leases Expiring | Net Rentable Area Expiring | % of NRA Expiring | Base Rent Expiring | % of Base Rent Expiring | Cumulative Net Rentable Area Expiring | Cumulative % of NRA Expiring | Cumulative Base Rent Expiring | Cumulative % of Base Rent Expiring | ||
| Vacant | NAP | 109,479 | 15.8 | % | NAP | NAP | 109,479 | 15.8% | NAP | NAP | |
| 2018 & MTM(3) | 3 | 12,222 | 1.8 | $198,197 | 1.8 | % | 121,701 | 17.5% | $198,197 | 1.8% | |
| 2019 | 6 | 41,985 | 6.1 | 907,225 | 8.1 | 163,686 | 23.6% | $1,105,422 | 9.8% | ||
| 2020 | 11 | 81,445 | 11.7 | 1,593,170 | 14.1 | 245,131 | 35.3% | $2,698,592 | 24.0% | ||
| 2021 | 2 | 13,766 | 2.0 | 312,678 | 2.8 | 258,897 | 37.3% | $3,011,270 | 26.7% | ||
| 2022 | 4 | 55,326 | 8.0 | 442,545 | 3.9 | 314,223 | 45.3% | $3,453,815 | 30.7% | ||
| 2023 | 6 | 77,419 | 11.2 | 1,582,756 | 14.1 | 391,642 | 56.5% | $5,036,571 | 44.7% | ||
| 2024 | 2 | 55,841 | 8.1 | 1,145,599 | 10.2 | 447,483 | 64.5% | $6,182,170 | 54.9% | ||
| 2025 | 2 | 101,150 | 14.6 | 2,161,449 | 19.2 | 548,633 | 79.1% | $8,343,619 | 74.1% | ||
| 2026 | 1 | 32,916 | 4.7 | 695,943 | 6.2 | 581,549 | 83.8% | $9,039,562 | 80.3% | ||
| 2027 | 1 | 95,419 | 13.8 | 1,853,064 | 16.5 | 676,968 | 97.6% | $10,892,625 | 96.7% | ||
| 2028 | 1 | 16,638 | 2.4 | 370,809 | 3.3 | 693,606 | 100.0% | $11,263,434 | 100.0% | ||
| 2029 & Beyond | 0 | 0 | 0.0 | 0 | 0.0 | 693,606 | 100.0% | $11,263,434 | 100.0% | ||
| Total | 39 | 693,606 | 100.0 | % | $11,263,434 | 100.0 | % | ||||
| (1) | Based on the underwritten rent roll dated October 18, 2017. |
| (2) | Certain tenants may have termination or contractions options (which may become exercisable prior to the originally stated expiration date of the tenant lease) that are not considered in the above Lease Rollover Schedule. |
| (3) | 2018 & MTM includes 2,727 square feet associated with a conference room with no attributable base rent. |
THE INFORMATION IN THIS STRUCTURAL AND COLLATERAL TERM SHEET IS NOT COMPLETE AND MAY BE AMENDED PRIOR TO THE TIME OF SALE. THIS TERM SHEET IS NOT AN OFFER TO SELL THESE SECURITIES AND IT IS NOT A SOLICITATION OF AN OFFER TO BUY THESE SECURITIES IN ANY JURISDICTION WHERE THE OFFER OR SALE IS NOT PERMITTED.
| | |
40 of 151
| Structural and Collateral Term Sheet | Benchmark 2018-B2 | |
| Central Park of Lisle | ||
| Operating History and Underwritten Net Cash Flow | ||||||||||||||
| 2014 | 2015 | 2016 | TTM(1) | Underwritten | Per Square Foot | %(2) | ||||||||
| Rents in Place(3) | $10,355,579 | $10,410,001 | $10,858,973 | $11,345,019 | $11,263,434 | $16.24 | 56.6 | % | ||||||
| Vacant Income | 0 | 0 | 0 | 0 | 2,534,913 | 3.65 | 12.7 | |||||||
| Gross Potential Rent | $10,355,579 | $10,410,001 | $10,858,973 | $11,345,019 | $13,798,347 | $19.89 | 69.4 | % | ||||||
| Total Reimbursements | 5,076,855 | 6,082,595 | 6,127,791 | 6,550,211 | 6,084,615 | 8.77 | 30.6 | |||||||
| Net Rental Income | $15,432,434 | $16,492,596 | $16,986,764 | $17,895,230 | $19,882,962 | $28.67 | 100.0 | % | ||||||
| (Vacancy/Credit Loss)(4) | (2,077,975) | (811,285) | (570,543) | (1,313,276) | (2,534,913) | (3.65 | ) | (12.7 | ) | |||||
| Other Income | 138,706 | 151,667 | 141,696 | 120,974 | 106,488 | 0.15 | 0.5 | |||||||
| Effective Gross Income | $13,493,166 | $15,832,978 | $16,557,917 | $16,702,928 | $17,454,537 | $25.16 | 87.8 | % | ||||||
| Total Expenses | $6,875,848 | $6,864,982 | $6,805,365 | $7,011,814 | $7,402,305 | $10.67 | 42.4 | % | ||||||
| Net Operating Income(4) | $6,617,319 | $8,967,996 | $9,752,552 | $9,691,114 | $10,052,232 | $14.49 | 57.6 | % | ||||||
| Total TI/LC, Capex/RR | 0 | 0 | 0 | 0 | 1,006,531 | 1.45 | 5.8 | |||||||
| Net Cash Flow | $6,617,319 | $8,967,996 | $9,752,552 | $9,691,114 | $9,045,701 | $13.04 | 51.8 | % | ||||||
| (1) | TTM reflects the trailing 12-month period ending October 31, 2017. |
| (2) | % column represents percent of Net Rental Income for all revenue lines and represents percent of Effective Gross Income for the remainder of the fields. |
| (3) | Underwritten Rents in Place includes $429,288 in contractual rent steps through November 2018 for non-credit tenants and the present value of all rent steps for seven credit tenants through the earlier of the loan term or the tenant’s expiration date. |
| (4) | The Increase in Net Operating Income from 2014 to 2015 is primarily due to free rent and abated reimbursements during 2014 on newly executed leases related to 64,568 square feet for Armour-Eckrich and 20,264 square feet for Glory Global Solutions. |
Property Management. The property is managed by Lincoln Property Company Commercial, Inc., a Texas corporation and the Central Park of Lisle Whole Loan sponsor.
Escrows and Reserves. At origination, the borrower deposited into escrow $3,672,605 for capital expenditures to be completed at the Central Park of Lisle Property, $2,301,992 for outstanding tenant improvements and leasing commissions related to seven tenants, $1,149,594 for real estate taxes, $622,274 for outstanding free rent related to six tenants, $74,750 related to deferred maintenance and $23,934 for insurance premiums. With regards to the $3,672,605 escrowed for capital expenditures, the Central Park of Lisle loan documents permit these funds to be used for future tenant improvement and leasing commission costs at the Central Park of Lisle Property.
Tax Escrows- On a monthly basis, the borrower is required to escrow 1/12 of the annual estimated tax payments, which currently equates to $191,599.
Insurance Escrows - On a monthly basis, the borrower is required to escrow 1/12 of the annual insurance premiums, which currently equates to $11,967. Monthly insurance reserves are provisionally waived so long as no event of default exists under the Central Park of Lisle loan documents and (A) the funds on deposit in the insurance reserve equal or exceed $23,934, (B) the related borrower pays all insurance premiums directly to the insurer, and (C) the related borrower submits to the lender proof of such payments. As of the origination of the Central Park of Lisle Whole Loan, the borrower satisfied the conditions for the monthly insurance reserve to be waived.
Replacement Reserves -On a monthly basis, the borrower is required to escrow $11,560 (approximately $0.20 per square foot annually) for replacement reserves. The reserve is subject to a cap of $277,442 (approximately $0.40 per square foot).
TI/LC Reserves- On a monthly basis, the borrower is required to escrow $72,277 (approximately $1.25 per square foot annually) for tenant improvement and leasing commission reserves. The reserve is not subject to a cap.
Lockbox / Cash Management.The Central Park of Lisle Whole Loan is structured with a hard lockbox and springing cash management. The borrower was required to (or to cause the master lessee to) send tenant direction letters to all tenants upon the origination of the loan instructing them to deposit all rents and payments directly into the lockbox account controlled by the lender. Prior to the occurrence of a Trigger Period (as defined below), on each business day all funds in the lockbox account are required to be transferred to or at the direction of the borrower. Upon the occurrence and during the continuance of a Trigger Period, all funds in the lockbox account are required to be swept each business day to a segregated cash management account under the control of the lender and disbursed on each payment date during the term of the loan in accordance with the loan documents. During a Trigger Period, except as described below, all excess cash flow after payment of mortgage debt service, required reserves and operating expenses is required to be held as additional collateral for the loan. The lender has been granted a first priority security interest in the cash management account.
THE INFORMATION IN THIS STRUCTURAL AND COLLATERAL TERM SHEET IS NOT COMPLETE AND MAY BE AMENDED PRIOR TO THE TIME OF SALE. THIS TERM SHEET IS NOT AN OFFER TO SELL THESE SECURITIES AND IT IS NOT A SOLICITATION OF AN OFFER TO BUY THESE SECURITIES IN ANY JURISDICTION WHERE THE OFFER OR SALE IS NOT PERMITTED.
| | |
41 of 151
| Structural and Collateral Term Sheet | Benchmark 2018-B2 | |
| Central Park of Lisle | ||
A “Trigger Period” means a period (A) commencing upon the earliest to occur of (i) an event of default, (ii) the debt yield falling below 7.5%, or (iii) a Specified Tenant Trigger Period (as defined below), and (B) expiring upon (x) if the Trigger Period is caused solely by clause (i) above, the acceptance by the lender of a cure of such event of default, if applicable; (y) if the Trigger Period is caused solely by clause (ii) above, the debt yield being equal to or greater than 7.75% for two consecutive calendar quarters; or (z) with respect to a Trigger Period caused by (iii) above, the lender’s receipt of reasonably acceptable evidence demonstrating the cure of the applicable event giving rise to the Specified Tenant Trigger Event in accordance with the Central Park of Lisle loan documents.
A “Specified Tenant Trigger Period” means a period commencing upon the first to occur of (i) the occurrence of a bankruptcy action with respect to a Specified Tenant, (ii) any termination or cancellation of a Specified Tenant lease (including, without limitation, rejection in any bankruptcy or similar insolvency proceeding), (iii) a Specified Tenant being in monetary or material non-monetary continuing default under its applicable lease, (iv) a Specified Tenant failing to be in actual, physical possession of its leased space or failing to be open to the public during customary hours, (v) a Specified Tenant giving notice that it is terminating its lease for all or any material portion of its lease or (vi) the failure of a Specified Tenant to provide written notice of renewal of its lease for a term of at least five years by the earlier to occur of (a) one year prior to its then current lease expiration or (b) the date required to exercise a renewal under such Specified Tenant’s lease.
A “Specified Tenant” means (a) Armour-Eckrich, (b) CA Technologies or (c) any replacement tenant of either Armour-Eckrich or CA Technologies.
Shari’ah Compliant.The Central Park of Lisle Property is owned by a special purpose entity borrower owned by a third party services company, and the borrower master leases the Central Park of Lisle Property to a special purpose entity that is indirectly owned by the related sponsors. The related rent under the master lease is equal to the debt service due to the related lender. The master lessee has collaterally assigned all tenant leases at the Central Park of Lisle Property to the related borrower (which has assigned its interest to the related lender), and the master lease is subordinate to the Central Park of Lisle Whole Loan.
THE INFORMATION IN THIS STRUCTURAL AND COLLATERAL TERM SHEET IS NOT COMPLETE AND MAY BE AMENDED PRIOR TO THE TIME OF SALE. THIS TERM SHEET IS NOT AN OFFER TO SELL THESE SECURITIES AND IT IS NOT A SOLICITATION OF AN OFFER TO BUY THESE SECURITIES IN ANY JURISDICTION WHERE THE OFFER OR SALE IS NOT PERMITTED.
| | |
42 of 151
| Structural and Collateral Term Sheet | Benchmark 2018-B2 |
[THIS PAGE INTENTIONALLY LEFT BLANK]
THE INFORMATION IN THIS STRUCTURAL AND COLLATERAL TERM SHEET IS NOT COMPLETE AND MAY BE AMENDED PRIOR TO THE TIME OF SALE. THIS TERM SHEET IS NOT AN OFFER TO SELL THESE SECURITIES AND IT IS NOT A SOLICITATION OF AN OFFER TO BUY THESE SECURITIES IN ANY JURISDICTION WHERE THE OFFER OR SALE IS NOT PERMITTED.
| | |
43 of 151
| Structural and Collateral Term Sheet | Benchmark 2018-B2 | |
| Promenade Shops at Aventura | ||
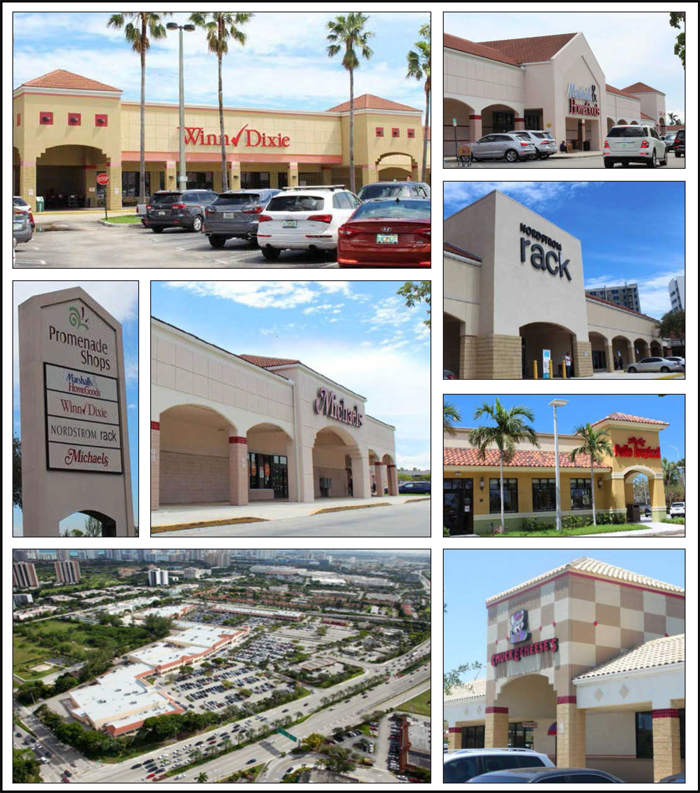
THE INFORMATION IN THIS STRUCTURAL AND COLLATERAL TERM SHEET IS NOT COMPLETE AND MAY BE AMENDED PRIOR TO THE TIME OF SALE. THIS TERM SHEET IS NOT AN OFFER TO SELL THESE SECURITIES AND IT IS NOT A SOLICITATION OF AN OFFER TO BUY THESE SECURITIES IN ANY JURISDICTION WHERE THE OFFER OR SALE IS NOT PERMITTED.
| | |
44 of 151
| Structural and Collateral Term Sheet | Benchmark 2018-B2 | |
| Promenade Shops at Aventura | ||
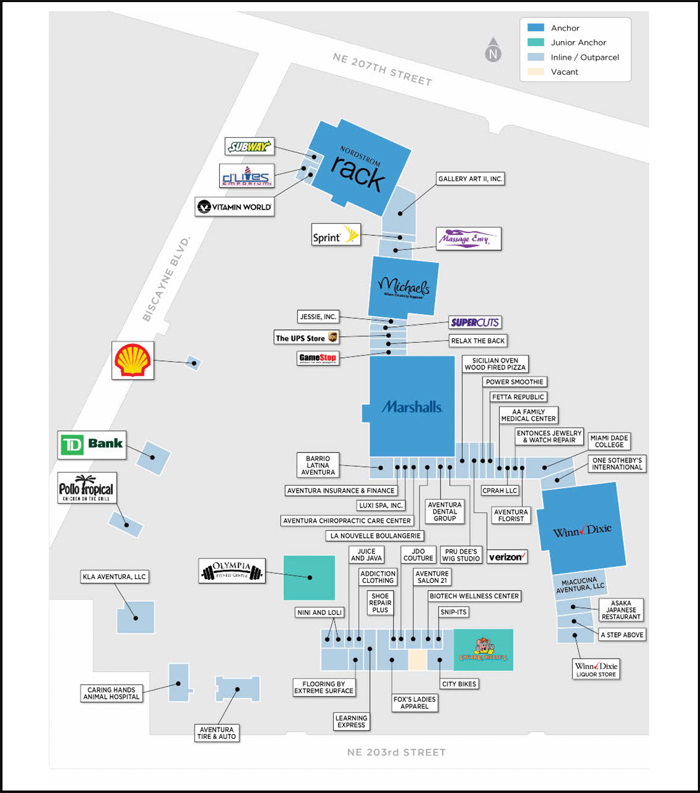
THE INFORMATION IN THIS STRUCTURAL AND COLLATERAL TERM SHEET IS NOT COMPLETE AND MAY BE AMENDED PRIOR TO THE TIME OF SALE. THIS TERM SHEET IS NOT AN OFFER TO SELL THESE SECURITIES AND IT IS NOT A SOLICITATION OF AN OFFER TO BUY THESE SECURITIES IN ANY JURISDICTION WHERE THE OFFER OR SALE IS NOT PERMITTED.
| | |
45 of 151
| Structural and Collateral Term Sheet | Benchmark 2018-B2 | |
| Promenade Shops at Aventura | ||
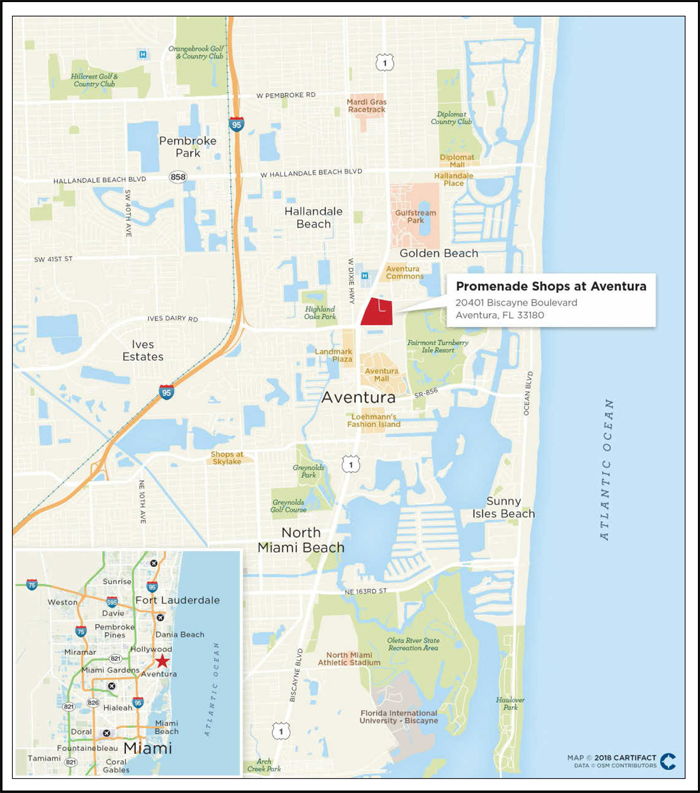
THE INFORMATION IN THIS STRUCTURAL AND COLLATERAL TERM SHEET IS NOT COMPLETE AND MAY BE AMENDED PRIOR TO THE TIME OF SALE. THIS TERM SHEET IS NOT AN OFFER TO SELL THESE SECURITIES AND IT IS NOT A SOLICITATION OF AN OFFER TO BUY THESE SECURITIES IN ANY JURISDICTION WHERE THE OFFER OR SALE IS NOT PERMITTED.
| | |
46 of 151
| Structural and Collateral Term Sheet | Benchmark 2018-B2 | |
| Promenade Shops at Aventura | ||
| Mortgage Loan Information | Property Information | |||
| Mortgage Loan Seller: | JPMCB | Single Asset / Portfolio: | Single Asset | |
| Original Principal Balance: | $70,000,000 | Title: | Fee | |
| Cut-off Date Principal Balance: | $70,000,000 | Property Type - Subtype: | Retail – Anchored | |
| % of Pool by IPB: | 4.6% | Net Rentable Area (SF): | 291,834 | |
| Loan Purpose: | Refinance | Location: | Aventura, FL | |
| Borrower: | Promventure Limited Partnership | Year Built / Renovated: | 1989 / N/A | |
| Sponsor: | Andrew D. Gumberg | Occupancy: | 99.2% | |
| Interest Rate: | 4.66900% | Occupancy Date: | 12/8/2017 | |
| Note Date: | 1/10/2018 | Number of Tenants: | 56 | |
| Maturity Date: | 2/1/2028 | 2014 NOI: | $5,097,263 | |
| Interest-only Period: | None | 2015 NOI: | $5,523,372 | |
| Original Term: | 120 months | 2016 NOI: | $5,885,859 | |
| Original Amortization: | 360 months | TTM NOI (as of 12/2017): | $6,168,400 | |
| Amortization Type: | Balloon | UW Economic Occupancy: | 95.0% | |
| Call Protection: | L(25),Grtr1%orYM(91),O(4) | UW Revenues: | $8,252,584 | |
| Lockbox / Cash Management: | Hard / In Place | UW Expenses: | $2,246,266 | |
| Additional Debt: | N/A | UW NOI: | $6,006,318 | |
| Additional Debt Balance: | N/A | UW NCF: | $5,609,782 | |
| Additional Debt Type: | N/A | Appraised Value / Per SF: | $108,250,000 / $371 | |
| Appraisal Date: | 12/1/2017 | |||
| Escrows and Reserves(1) | Financial Information | |||||||
| Initial | Monthly | Initial Cap | Cut-off Date Loan / SF: | $240 | ||||
| Taxes: | $261,235 | $65,309 | N/A | Maturity Date Loan / SF: | $195 | |||
| Insurance: | $127,205 | $42,402 | N/A | Cut-off Date LTV: | 64.7% | |||
| Replacement Reserves: | $3,648 | $3,648 | $131,325 | Maturity Date LTV: | 52.6% | |||
| TI/LC: | $24,320 | $24,320 | $875,502 | UW NCF DSCR: | 1.29x | |||
| Other: | $214,000 | Springing | $694,140 | UW NOI Debt Yield: | 8.6% | |||
| Sources and Uses | ||||||||
| Sources | Proceeds | % of Total | Uses | Proceeds | % of Total | |||
| Mortgage Loan | $70,000,000 | 100.0% | Payoff Existing Debt | $32,576,999 | 46.5% | |||
| Closing Costs | 1,431,624 | 2.0 | ||||||
| Upfront Reserves | 630,408 | 0.9 | ||||||
| Return of Equity | 35,360,969 | 50.5 | ||||||
| Total Sources | $70,000,000 | 100.0% | Total Uses | $70,000,000 | 100.0% | |||
| (1) | For a full description of Escrows and Reserves, please refer to “Escrows and Reserves” below. |
THE INFORMATION IN THIS STRUCTURAL AND COLLATERAL TERM SHEET IS NOT COMPLETE AND MAY BE AMENDED PRIOR TO THE TIME OF SALE. THIS TERM SHEET IS NOT AN OFFER TO SELL THESE SECURITIES AND IT IS NOT A SOLICITATION OF AN OFFER TO BUY THESE SECURITIES IN ANY JURISDICTION WHERE THE OFFER OR SALE IS NOT PERMITTED.
| | |
47 of 151
| Structural and Collateral Term Sheet | Benchmark 2018-B2 | |
| Promenade Shops at Aventura | ||
The Loan.The Promenade Shops at Aventura loan has an outstanding principal balance as of the Cut-off Date of $70.0 million and is secured by a first mortgage lien on the borrower’s fee interest in a 291,834 square foot retail center located in Aventura, Florida anchored by Marshalls, Winn Dixie, Nordstrom Rack and Michael’s Stores, Inc. (“Michaels”) (the “Promenade Shops at Aventura Property”). The Promenade Shops at Aventura loan has a ten-year term and will amortize on a 30-year schedule. The previously existing debt was securitized in JPMCC 2010-C2.
The Borrower.The borrowing entity for the Promenade Shops at Aventura loan is Promventure Limited Partnership, a Florida limited partnership and special purpose entity.
The Loan Sponsor. The loan sponsor and nonrecourse carve-out guarantor is Andrew D. Gumberg, who is the Chairman and CEO of Gumberg Asset Management Corp. (“Gumberg”). Gumberg has been involved with over 600 properties encompassing over 80 million square feet of retail space in 41 states, including over 15 million square feet of regional and super regional malls across the country. Currently, Gumberg owns and operates approximately 4.3 million square feet of retail space, predominately located in Pennsylvania, Florida, Maryland, and Ohio. Gumberg has owned the Promenade Shops at Aventura Property since 2001.
The Property. The Promenade Shops at Aventura Property is a 291,834 square foot retail center anchored by Marshalls, Winn Dixie, Nordstrom Rack and Michaels. The Promenade Shops at Aventura Property has maintained an average occupancy of 97.0% since 2011 and was 99.2% occupied as of December 8, 2017. Investment-grade tenants occupy 29.6% of the Promenade Shops at Aventura Property’s net rentable area (23.6% of underwritten rent). Marshalls, Winn Dixie and Michaels have been tenants at the property since it was built in 1988, while Nordstrom Rack was added to the property in 2011. Additionally, 66.5% of the Promenade Shops at Aventura Property’s tenancy has been in occupancy for more than ten years while 63.8% has been in occupancy for more than fifteen years. The property provides approximately 1,624 parking spaces, resulting in a parking ratio of approximately 5.6 spaces per 1,000 square feet of net rentable area. The weighted average sales for the Promenade Shops at Aventura Property are $459 per square foot and the weighted average occupancy cost was 5.2% for tenants that reported sales as of December 8, 2017.
The property is located in Aventura, Florida, which is approximately 15.0 miles north of downtown Miami. The Promenade Shops at Aventura Property benefits from its location at the intersection of Ives Dairy Road and Biscayne Boulevard which have average daily traffic counts of 65,500 and 73,500 vehicles per day, respectively. The Promenade Shops at Aventura Property is also located within 0.25 miles of the Simon Properties and Turnberry Associates owned Aventura Mall, which is an approximately 2.0 million square foot super-regional mall anchored by Nordstrom, Bloomingdale’s and Macy’s, featuring luxury retailers such as Gucci, Louis Vuitton, Cartier, Burberry and Fendi. Aventura Mall is one of the top ten grossing malls in the United States with average sales of $1,500 per square foot.
According to the appraisal, the 2017 estimated population within a one-, three- and five-mile radius is 16,703, 195,207 and 402,609, respectively. The 2017 estimated average income within a one-, three- and five-mile radius is $88,550, $75,105 and $68,180, respectively. According to the appraisal, the City of Aventura benefits from its proximity to the Miami metro area and has a healthy and stable economy along with a median household income which is significantly higher than that of the state and the country.
The Promenade Shops at Aventura Property is located in the Aventura retail submarket, which had a total retail inventory of approximately 6.3 million square feet, a vacancy rate of 1.0% and an average asking rental rate of $39.04 per square foot on a triple net basis as of the third quarter of 2017. The appraisal determined a stabilized vacancy rate of 3.6% and a market rent of $31.39 per square foot, which is approximately 39.6% above in-place rent of $22.49 per square foot for the Promenade Shops at Aventura Property.
| Historical and Current Occupancy(1) | |||
| 2014 | 2015 | 2016 | Current(2) |
| 97.6% | 97.9% | 98.5% | 99.2% |
| (1) | Historical Occupancies are as of December 31 of each respective year. |
| (2) | Current Occupancy is as of December 8, 2017. |
THE INFORMATION IN THIS STRUCTURAL AND COLLATERAL TERM SHEET IS NOT COMPLETE AND MAY BE AMENDED PRIOR TO THE TIME OF SALE. THIS TERM SHEET IS NOT AN OFFER TO SELL THESE SECURITIES AND IT IS NOT A SOLICITATION OF AN OFFER TO BUY THESE SECURITIES IN ANY JURISDICTION WHERE THE OFFER OR SALE IS NOT PERMITTED.
| | |
48 of 151
| Structural and Collateral Term Sheet | Benchmark 2018-B2 | |
| Promenade Shops at Aventura | ||
| Tenant Summary(1) | |||||||
| Tenant | Ratings(2)Moody’s/S&P/Fitch | Net Rentable Area (SF) | % of Total NRA | Base Rent PSF | Sales PSF(3) | Occupancy Costs(3) | Lease Expiration Date |
| Marshalls(4) | A2 / A+ / NA | 48,385 | 16.6% | $7.25 | $498.07 | 1.5% | 1/31/2019 |
| Winn Dixie(5) | NA / NA / NA | 35,922 | 12.3% | $6.75 | $588.99 | 1.1% | 3/31/2019 |
| Nordstrom Rack | Baa1 / BBB+ / BBB+ | 34,707 | 11.9% | $28.60 | NAV | NAV | 3/31/2021 |
| Michaels Stores, Inc. | NA / BB- / NA | 21,213 | 7.3% | $10.00 | $312.41 | 3.2% | 3/1/2020 |
| Olympia Gym | NA / NA / NA | 15,914 | 5.5% | $23.61 | NAV | NAV | 3/31/2025 |
| Chuck E. Cheese | NA / NA / NA | 14,000 | 4.8% | $17.36 | $186.10 | 9.3% | 5/31/2023 |
| Gallery Art II, Inc | NA / NA / NA | 7,871 | 2.7% | $16.96 | $174.92 | 9.7% | 12/31/2023 |
| Miacucina Aventura, LLC | NA / NA / NA | 7,500 | 2.6% | $24.38 | $460.91 | 5.3% | 7/31/2022 |
| Aventura Tire & Auto | NA / NA / NA | 6,500 | 2.2% | $31.30 | $176.52 | 17.7% | 8/31/2025 |
| KLA Aventura, LLC | NA / NA / NA | 6,500 | 2.2% | $19.35 | $256.81 | 7.5% | 5/31/2020 |
| (1) | Based on the underwritten rent roll dated December 8, 2017. |
| (2) | Ratings provided are for the parent company of the entity listed in the “Tenant” field, whether or not the parent company guarantees the lease. |
| (3) | Sales PSF and Occupancy Costs represent sales for the 12-month period ending December 8, 2017 for tenants that report sales. |
| (4) | Marshalls has been in occupancy at the Promenade Shops at Aventura Property since 1988 and has two five year extension options remaining. |
| (5) | Winn Dixie has been in occupancy at the Promenade Shops at Aventura Property since 1988 and has seven five year extension options remaining. |
Lease Rollover Schedule(1)
| |||||||||
Year | Number of Leases Expiring | Net Rentable Area Expiring | % of NRA Expiring | Base Rent Expiring | % of Base Rent Expiring | Cumulative Net Rentable Area Expiring | Cumulative % of NRA Expiring | Cumulative Base Rent Expiring | Cumulative % of Base Rent Expiring |
| Vacant | NAP | 2,285 | 0.8% | NAP | NAP | 2,285 | 0.8% | NAP | NAP |
| 2018 & MTM | 12 | 22,787 | 7.8% | $937,363 | 14.4% | 25,072 | 8.6% | $937,363 | 14.4% |
| 2019 | 8 | 97,649 | 33.5% | 1,007,615 | 15.5% | 122,721 | 42.1% | $1,944,977 | 29.9% |
| 2020 | 9 | 37,788 | 12.9% | 850,710 | 13.1% | 160,509 | 55.0% | $2,795,687 | 42.9% |
| 2021 | 8 | 47,152 | 16.2% | 1,468,235 | 22.5% | 207,661 | 71.2% | $4,263,923 | 65.5% |
| 2022 | 3 | 9,293 | 3.2% | 256,021 | 3.9% | 216,954 | 74.3% | $4,519,944 | 69.4% |
| 2023 | 5 | 27,536 | 9.4% | 608,220 | 9.3% | 244,490 | 83.8% | $5,128,164 | 78.7% |
| 2024 | 1 | 3,505 | 1.2% | 80,000 | 1.2% | 247,995 | 85.0% | $5,208,164 | 80.0% |
| 2025 | 3 | 25,414 | 8.7% | 665,423 | 10.2% | 273,409 | 93.7% | $5,873,588 | 90.2% |
| 2026 | 3 | 6,475 | 2.2% | 241,322 | 3.7% | 279,884 | 95.9% | $6,114,910 | 93.9% |
| 2027 | 3 | 10,250 | 3.5% | 303,670 | 4.7% | 290,134 | 99.4% | $6,418,580 | 98.6% |
| 2028 | 1 | 1,700 | 0.6% | 93,500 | 1.4% | 291,834 | 100.0% | $6,512,080 | 100.0% |
| 2029 & Beyond | 0 | 0 | 0.0% | 0 | 0.0% | 291,834 | 100.0% | $6,512,080 | 100.0% |
| Total | 56 | 291,834 | 100.0% | $6,512,080 | 100.0% | ||||
| (1) | Based on the underwritten rent roll dated December 8, 2017. |
THE INFORMATION IN THIS STRUCTURAL AND COLLATERAL TERM SHEET IS NOT COMPLETE AND MAY BE AMENDED PRIOR TO THE TIME OF SALE. THIS TERM SHEET IS NOT AN OFFER TO SELL THESE SECURITIES AND IT IS NOT A SOLICITATION OF AN OFFER TO BUY THESE SECURITIES IN ANY JURISDICTION WHERE THE OFFER OR SALE IS NOT PERMITTED.
| | |
49 of 151
| Structural and Collateral Term Sheet | Benchmark 2018-B2 | |
| Promenade Shops at Aventura | ||
Operating History and Underwritten Net Cash Flow
| ||||||||||
| 2014 | 2015 | 2016 | 2017 | Underwritten | Per Square Foot | %(1) | ||||
| Rents in Place | $5,508,209 | $5,735,504 | $6,080,219 | $6,222,837 | $6,512,080 | $22.31 | 75.1% | |||
| Vacant Income | 0 | 0 | 0 | 0 | 105,110 | 0.36 | 1.2% | |||
| Gross Potential Rent | $5,508,209 | $5,735,504 | $6,080,219 | $6,222,837 | $6,617,190 | $22.67 | 76.3% | |||
| CAM Reimbursements | 1,686,711 | 1,765,982 | 1,815,136 | 1,928,278 | 1,977,139 | 6.77 | 22.8% | |||
| Percentage Rent | 34,991 | 98,298 | 50,821 | 91,279 | 79,591 | 0.27 | 0.9% | |||
| Net Rental Income | $7,229,911 | $7,599,784 | $7,946,176 | $8,242,394 | $8,673,920 | $29.72 | 100.0% | |||
| (Vacancy/Credit Loss) | 0 | 0 | 0 | 0 | (433,696 | ) | (1.49 | ) | (5.0 | ) |
| Other Income | 8,971 | 18,706 | 28,141 | 59,308 | 12,360 | 0.04 | 0.1% | |||
| Effective Gross Income | $7,238,881 | $7,618,490 | $7,974,316 | $8,301,702 | $8,252,584 | $28.28 | 95.1% | |||
| Total Expenses | $2,141,619 | $2,095,118 | $2,088,457 | $2,133,301 | $2,246,266 | $7.70 | 27.2% | |||
| Net Operating Income | $5,097,263 | $5,523,372 | $5,885,859 | $6,168,400 | $6,006,318 | $20.58 | 72.8% | |||
| Total TI/LC, Capex/RR | 0 | 0 | 0 | 0 | 396,536 | 1.36 | 4.8% | |||
| Net Cash Flow | $5,097,263 | $5,523,372 | $5,885,859 | $6,168,400 | $5,609,782 | $19.22 | 68.0% | |||
| (1) | % column represents percent of Net Rental Income for all revenue lines and percent of Effective Gross Income for the remainder of fields. |
Property Management.The Promenade Shops at Aventura Property is managed by Gumberg Asset Management Corp., a Florida corporation and an affiliate of the borrower.
Escrows and Reserves.At origination, the borrower deposited approximately $261,235 for real estate taxes, $214,000 for an environmental reserve, $127,205 for insurance, $24,320 for tenant improvements and leasing commissions and $3,648 for replacement reserves.
Tax Escrows– On a monthly basis, the borrower is required to escrow 1/12 of the annual estimated tax payments, which currently equates to approximately $65,309.
Insurance Escrows– On a monthly basis, the borrower is required to escrow 1/12 of the annual estimated insurance premiums, which currently equates to approximately $42,402. To the extent that (i) there is no event of default continuing and (ii) the borrower provides the lender with satisfactory evidence that the Promenade Shops at Aventura Property is insured under a blanket policy acceptable to the lender, the requirement for the monthly deposits will be waived.
Replacement Reserves – On a monthly basis, the borrower is required to escrow approximately $3,648 (approximately $0.15 per square foot annually) for replacement reserves. The replacement reserve is subject to a cap of approximately $131,325 (approximately $0.45 per square foot).
TI/LC Reserves – On a monthly basis, the borrower is required to escrow approximately $24,320 (approximately $1.00 per square foot annually) for tenant improvements and leasing commissions. The tenant improvement and leasing commission reserve is subject to a cap of $875,502 (approximately $3.00 per square foot).
Major Tenant Reserve – During a Cash Sweep Event (as defined below) caused solely by a Tenant Trigger Event (as defined below), all excess cash flow after payment of debt service, required reserves and operating expenses is required to be deposited into a reserve for tenant improvement and leasing commission obligations related to the Nordstrom Rack space. The reserve is subject to a cap of $20.00 multiplied by the square footage leased by Nordstrom Rack at the Promenade Shops at Aventura Property. In lieu of the cash deposits, the borrower is permitted to deliver a letter of credit in an amount equal to the cap.
Environmental Reserve– The environmental assessment obtained at origination (the “ESA”) indicated that in 1994, there was a spill of hazardous materials related to a dry cleaning operation that was previously located at the Promenade Shops at Aventura Property. Subsequent investigations indicated that the Promenade Shops at Aventura Property was impacted with low levels of contamination as a result of the spill. Due to the potential for vapor encroachment at the Promenade Shops at Aventura Property, the ESA characterized the prior spill as a recognized environmental condition and recommended further investigation to determine if the impacts from the prior dry cleaning operations posed a vapor concern. At origination, the borrower was required to reserve $6,000 for a Phase II subsurface investigation and $208,000 for the potential installation of a sub-slab depressurization system in the event the Phase II recommended further remediation. The Phase II was completed in January 2018 and revealed concentrations of hazardous materials below applicableregulatory vapor intrusion screening levels. Accordingly, the Phase II did not recommend further action and the remaining portion of the reserve is in the process of being released to the borrower.
THE INFORMATION IN THIS STRUCTURAL AND COLLATERAL TERM SHEET IS NOT COMPLETE AND MAY BE AMENDED PRIOR TO THE TIME OF SALE. THIS TERM SHEET IS NOT AN OFFER TO SELL THESE SECURITIES AND IT IS NOT A SOLICITATION OF AN OFFER TO BUY THESE SECURITIES IN ANY JURISDICTION WHERE THE OFFER OR SALE IS NOT PERMITTED.
| | |
50 of 151
| Structural and Collateral Term Sheet | Benchmark 2018-B2 | |
| Promenade Shops at Aventura | ||
Lockbox / Cash Management.The Promenade Shops at Aventura loan is structured with a hard lockbox and in place cash management. The borrower was required to deliver tenant direction letters instructing all tenants to deposit all revenues directly into a lockbox account controlled by the lender. All funds in the lockbox account are required to be swept on each business day to a segregated cash management account under the control of the lender and disbursed on each payment date in accordance with the loan documents. To the extent a Cash Sweep Event is continuing, except as described above in “Major Tenant Reserve”, all excess cash flow on deposit in the cash management account is required to be held in the excess cash flow subaccount as additional collateral. The lender has been granted a first priority security interest in the cash management account.
A “Cash Sweep Event” means the occurrence of (i) an event of default, (ii) any bankruptcy or insolvency action of the borrower or property manager, (iii) the date that the debt service coverage ratio, as calculated in the loan documents based on the trailing three months, falls below 1.15x or (iv) a Tenant Trigger Event (as described below).
A “Tenant Trigger Event” means (i) Nordstrom Rack does not renew its lease prior to the date that is the earlier of the expiration of the period within which the tenant is required to provide notice to the borrower of its intent to renew (which is by March 31, 2020) or twelve months prior to the expiration date of the Nordstrom Rack lease, (ii) Nordstrom Rack “goes dark”, vacates or abandons the property or (iii) Nordstrom Rack is subject to a bankruptcy or insolvency action.
A Cash Sweep Event may be cured (a) with respect to clause (i) above, upon the acceptance by the lender of a cure of such event of default, (b) with respect to clause (ii) above solely with respect to the property manager, if the borrower replaces the property manager with a qualified manager under a replacement management agreement within 60 days of the date of such bankruptcy or insolvency action of the property manager, (c) with respect to clause (ii) above solely with respect to an involuntary bankruptcy or insolvency action in which none of the borrower, guarantor or their affiliates has colluded with, assisted or otherwise solicited creditors for any such filing, upon the dismissal of such action within 90 days without any adverse consequences to the loan or Promenade Shops at Aventura Property, (d) with respect to clause (iii) above, upon the achievement of a debt service coverage ratio of 1.15x or greater for two consecutive quarters based upon the trailing three months, (e) with respect to a Tenant Trigger Event, upon the unconditional renewal of such lease or replacement of such lease in accordance with the loan documents (or, if the Cash Sweep Event relates to the bankruptcy or insolvency of the tenant, if such tenant reaffirms its lease, remains in occupancy, open for business and pays unabated post-petition rent). Each cure is also subject to the following conditions: (1) no other event of default has occurred and is continuing; (2) a cure may occur no more than five times in the aggregate during the term of the loan; (3) the borrower pays all of the lender’s reasonable expenses incurred in connection with such cure (including reasonable attorney’s fees and expenses); and (4) in no event will be the borrower be permitted to cure a voluntary or collusive involuntary bankruptcy or insolvency action of the borrower.
THE INFORMATION IN THIS STRUCTURAL AND COLLATERAL TERM SHEET IS NOT COMPLETE AND MAY BE AMENDED PRIOR TO THE TIME OF SALE. THIS TERM SHEET IS NOT AN OFFER TO SELL THESE SECURITIES AND IT IS NOT A SOLICITATION OF AN OFFER TO BUY THESE SECURITIES IN ANY JURISDICTION WHERE THE OFFER OR SALE IS NOT PERMITTED.
| | |
51 of 151
| Structural and Collateral Term Sheet | Benchmark 2018-B2 | |
| Apple Campus 3 | ||
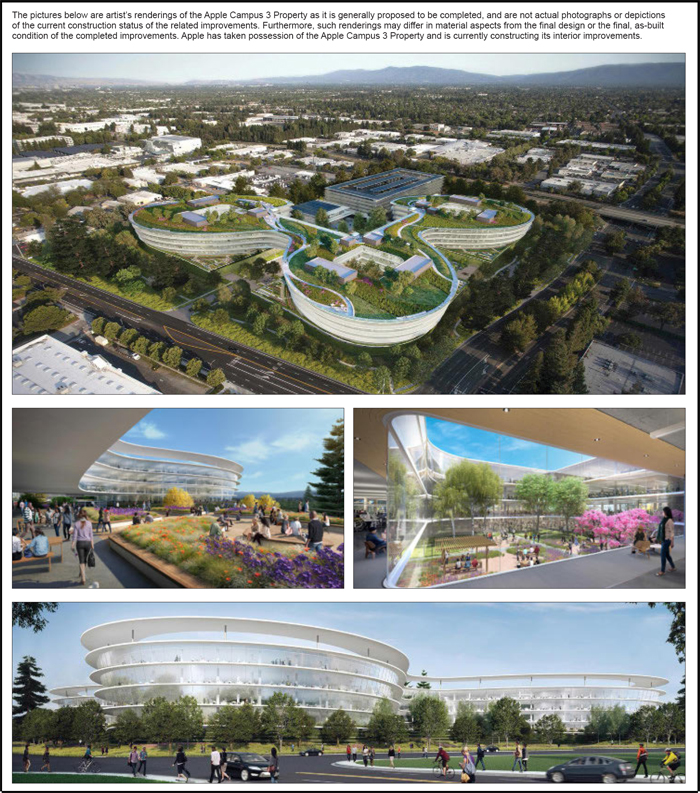
THE INFORMATION IN THIS STRUCTURAL AND COLLATERAL TERM SHEET IS NOT COMPLETE AND MAY BE AMENDED PRIOR TO THE TIME OF SALE. THIS TERM SHEET IS NOT AN OFFER TO SELL THESE SECURITIES AND IT IS NOT A SOLICITATION OF AN OFFER TO BUY THESE SECURITIES IN ANY JURISDICTION WHERE THE OFFER OR SALE IS NOT PERMITTED.
| | |
52 of 151
| Structural and Collateral Term Sheet | Benchmark 2018-B2 | |
| Apple Campus 3 | ||
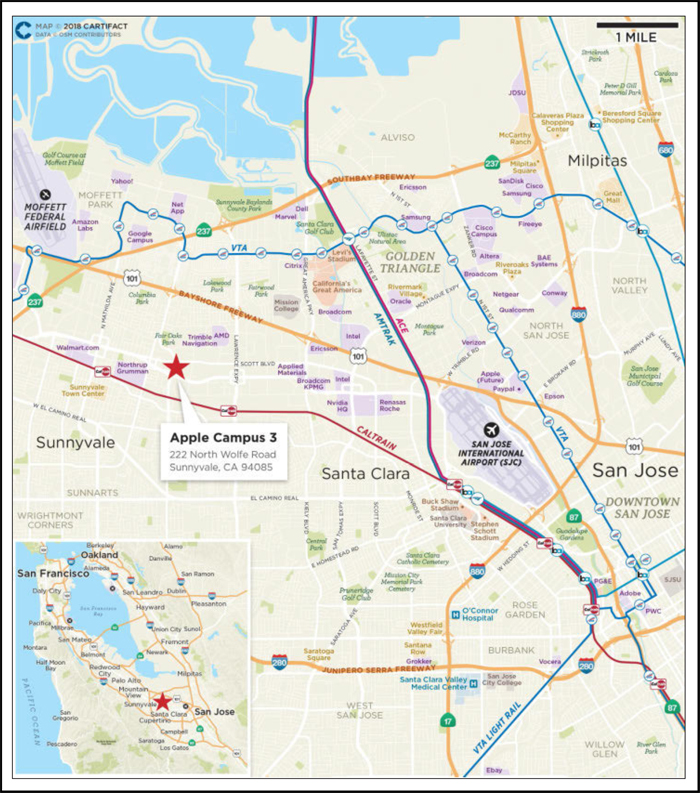
THE INFORMATION IN THIS STRUCTURAL AND COLLATERAL TERM SHEET IS NOT COMPLETE AND MAY BE AMENDED PRIOR TO THE TIME OF SALE. THIS TERM SHEET IS NOT AN OFFER TO SELL THESE SECURITIES AND IT IS NOT A SOLICITATION OF AN OFFER TO BUY THESE SECURITIES IN ANY JURISDICTION WHERE THE OFFER OR SALE IS NOT PERMITTED.
| | |
53 of 151
| Structural and Collateral Term Sheet | Benchmark 2018-B2 | |
| Apple Campus 3 | ||
| Mortgage Loan Information | Property Information | |||
| Mortgage Loan Seller(1): | GACC | Single Asset / Portfolio: | Single Asset | |
| Credit Assessment | Title: | Fee | ||
| (S&P/Fitch/KBRA)(2): | BBB/BBB-/BBB+ | Property Type - Subtype: | Office – Suburban | |
| Original Principal Balance(3): | $68,000,000 | Net Rentable Area (SF): | 882,657 | |
| Cut-off Date Principal Balance(3): | $68,000,000 | Location: | Sunnyvale, CA | |
| % of Pool by IPB: | 4.5% | Year Built / Renovated: | 2017 / N/A | |
| Loan Purpose: | Refinance | Occupancy(7): | 100.0% | |
| Borrower: | CW SPE LLC | Occupancy Date: | 2/6/2018 | |
| Sponsor(4): | Joseph K. Paul | Number of Tenants: | 1 | |
| Interest Rate: | 3.364978% | 2014 NOI(8): | N/A | |
| Note Date: | 12/14/2017 | 2015 NOI(8): | N/A | |
| Anticipated Repayment Date(5): | 1/6/2028 | 2016 NOI(8): | N/A | |
| Maturity Date(5): | 4/6/2031 | TTM NOI(8): | N/A | |
| Interest-only Period: | 120 months | UW Economic Occupancy: | 99.0% | |
| Original Term(5): | 120 months | UW Revenues: | $46,190,545 | |
| Original Amortization: | None | UW Expenses: | $4,804,932 | |
| Amortization Type: | ARD-Interest Only | UW NOI: | $41,385,613 | |
| Call Protection(6): | L(25),Def(88),O(7) | UW NCF: | $41,209,082 | |
| Lockbox / Cash Management: | Hard / In Place | Appraised Value / Per SF(9): | $773,600,000 / $876 | |
| Additional Debt: | Yes | Appraisal Date: | 6/1/2019 | |
| Additional Debt Balance: | $272,000,000 / $235,000,000 | |||
| Additional Debt Type: | Pari Passu / Mezzanine Loans | |||
| Escrows and Reserves(10) | Financial Information(3) | ||||||
| Initial | Monthly | Initial Cap | Cut-off Date Loan / SF: | $385 | |||
| Taxes: | $0 | $249,368 | N/A | Maturity Date Loan / SF: | $385 | ||
| Insurance: | $0 | Springing | N/A | Cut-off Date LTV(9): | 44.0% | ||
| Replacement Reserves: | $0 | Springing | N/A | Maturity Date LTV(9): | 44.0% | ||
| TI/LC: | $2,979,839 | $0 | N/A | UW NCF DSCR: | 3.55x | ||
| Other: | $42,800,076 | Springing | $30,892,995 | UW NOI Debt Yield: | 12.2% | ||
| Sources and Uses | ||||||||||||||||
| Sources | Proceeds | % of Total | Uses | Proceeds | % of Total | |||||||||||
Mortgage Loan | $340,000,000 | 59.1% | Payoff Existing Debt | $385,679,999 | 67.1% | |||||||||||
Mezzanine Loan | 235,000,000 | 40.9 | Reserves | 45,779,915 | 8.0 | |||||||||||
| Closing Costs | 2,636,016 | 0.5 | ||||||||||||||
| Return of Equity | 140,904,070 | 24.5 | ||||||||||||||
| Total Sources | $575,000,000 | 100.0% | Total Uses | $575,000,000 | 100.0% | |||||||||||
| (1) | The Apple Campus 3 Whole Loan (as defined in “The Loan” section below) was co-originated by Deutsche Bank AG, acting through its New York Branch, Goldman Sachs Mortgage Company and Wells Fargo Bank, National Association. |
| (2) | S&P, Fitch and KBRA have confirmed that the Apple Campus 3 loan has, in the context of its inclusion in the mortgage pool, credit characteristics consistent with an investment grade obligation. |
| (3) | The Apple Campus 3 loan is part of a whole loan evidenced by fivepari passu notes with an aggregate original principal balance as of the Cut-off Date of $340.0 million. The Financial Information presented in the chart above reflects the aggregate Cut-off Date balance of the $340.0 million Apple Campus 3 Whole Loan. |
| (4) | The nonrecourse carve-out guarantor is Paul Guarantor LLC as described in the “Loan Sponsor”section below. |
| (5) | The Apple Campus 3 Whole Loan has an anticipated repayment date of January 6, 2028 (the “Anticipated Repayment Date” or “ARD”) and a final maturity date of April 6, 2031. From and after the Anticipated Repayment Date, the Apple Campus 3 Whole Loan accrues interest at a fixed rate (the “Revised Interest Rate”) that is equal to the greater of (i) 3.364978% plus 1.50000% and (ii) the then 10-year swap rate plus 1.50000%per annum.On and after the ARD until the final maturity date, the Apple Campus 3 Whole Loan requires principal payments based on a 30-year amortization schedule assuming the initial interest rate. |
| (6) | The lockout period will be at least 25 payment dates beginning with and including the first payment date of February 6, 2018. Defeasance of the full $340.0 million Apple Campus 3 Whole Loan is permitted after the date that is the earlier to occur of (i) December 14, 2021 and (ii) two years from the closing date of the securitization that includes the last note to be securitized. The assumed lockout period of 25 payments is based on the expected Benchmark 2018-B2 securitization closing date in February 2018. The actual lockout period may be longer. |
| (7) | Apple has taken possession of its space, is currently constructing its interior improvements and is expected to begin taking occupancy in September 2018. |
| (8) | Historical NOI is not available because construction of the property was completed in 2017. |
THE INFORMATION IN THIS STRUCTURAL AND COLLATERAL TERM SHEET IS NOT COMPLETE AND MAY BE AMENDED PRIOR TO THE TIME OF SALE. THIS TERM SHEET IS NOT AN OFFER TO SELL THESE SECURITIES AND IT IS NOT A SOLICITATION OF AN OFFER TO BUY THESE SECURITIES IN ANY JURISDICTION WHERE THE OFFER OR SALE IS NOT PERMITTED.
| | |
54 of 151
| Structural and Collateral Term Sheet | Benchmark 2018-B2 | |
| Apple Campus 3 | ||
| (9) | The Appraised Value / Per SF represents the “as stabilized” appraised value which assumes that contractual tenant improvement and leasing commission (“TI/LC”) obligations have been fulfilled and there is no outstanding free rent. At origination, the borrower deposited upfront reserves totaling $45,779,915 for such contractual TI/LC obligations and free rent. The “as-is” appraised value is $624,600,000 as of November 7, 2017, equating to a Cut-off Date LTV and Maturity Date LTV of 54.4%. The appraiser also included a “go dark” value of $566,750,000 as of November 7, 2017. Based on the appraisal’s “go dark” value, the loan-to-dark value ratio is 60.0% based on the Apple Campus 3 loan amount of $340,000,000 and 101.5% based on the Apple Campus 3 total debt of $575,000,000. |
| (10) | For a full description of Escrows and Reserves, please refer to“Escrows and Reserves”below. |
The Loan.The Apple Campus 3 loan is secured by a first mortgage lien on the borrower’s fee interest in an 882,657 square foot Class A single-tenant office building located in Sunnyvale, California. The loan is part of a whole loan that has an outstanding principal balance as of the Cut-off Date of $340.0 million (the “Apple Campus 3 Whole Loan"), and is comprised of fivepari passu notes, each as described below. The non-controlling Note A-4, with an outstanding principal balance as of the Cut-off Date of $68.0 million is being contributed to the Benchmark 2018-B2 Trust. The controlling Note A-3 with an original principal balance of $94.0 million is expected to be contributed to the BANK 2018-BNK10 Trust. The remaining notes are currently held by the parties in theWhole Loan Summary chart below. The relationship between the holders of the Apple Campus 3 Whole Loan will be governed by a co-lender agreement as described under “Description of the Mortgage Pool—The Whole Loans—The Non-Serviced Pari Passu Whole Loans” in the Preliminary Prospectus. The Apple Campus 3 Whole Loan is structured with an ARD of January 6, 2028, a final maturity date of April 6, 2031 and will be interest-only until the ARD. From the first payment date after the ARD until the final maturity date, the Apple Campus 3 Whole Loan will amortize on a 30-year schedule.
| Whole Loan Summary | ||||||
| Note | Original Balance | Cut-off Date Balance | Note Holder | Controlling Piece | ||
| A-1 | $80,000,000 | $80,000,000 | Wells Fargo Bank, National Association | No | ||
| A-2 | $30,000,000 | $30,000,000 | Wells Fargo Bank, National Association | No | ||
| A-3 | $94,000,000 | $94,000,000 | BANK 2018-BNK10 | Yes | ||
| A-4 | $68,000,000 | $68,000,000 | Benchmark 2018-B2 | No | ||
| A-5 | $68,000,000 | $68,000,000 | Goldman Sachs Mortgage Company | No | ||
| Total | $340,000,000 | $340,000,000 | ||||
The Borrower. The borrowing entity for the Apple Campus 3 Whole Loan is CW SPE LLC, a Delaware limited liability company and single purpose entity with two independent directors.
The Loan Sponsor.The loan sponsor is Joseph K. Paul, the founder of Jay Paul Company. The nonrecourse carve-out guarantor is Paul Guarantor LLC, which is 100% directly owned by the Jay Paul Revocable Living Trust dated November 9, 1999, as amended and restated in its entirety on March 19, 2010, and as further amended from time to time, for which Joseph K. Paul a/k/a Jay Paul, is trustee. Jay Paul Company is a privately held real estate firm based in San Francisco, California. Founded in 1975, Jay Paul Company concentrates on the acquisition, development, and management of commercial properties throughout California. Jay Paul Company has developed over 11.0 million square feet of institutional-quality space.
The Property.The Apple Campus 3 property is a Class A LEED Platinum office campus totaling 882,657 square feet and located in Sunnyvale, California. Built in 2017 and situated on an approximately 17.8-acre site, the Apple Campus 3 property comprises three interconnected, four-story office buildings totaling approximately 849,000 square feet, an amenities facility, outdoor common area and a seven-story parking structure. The Apple Campus 3 property is 100.0% leased to Apple. (“Apple”; NYSE: AAPL) through February 2031, with two, seven-year extension options and no termination options. Apple took possession of the Apple Campus 3 property on December 1, 2017 and is currently constructing its interior improvements. As of January 2018, Apple is expected to begin taking occupancy of its space at the Apple Campus 3 property in September 2018. Apple is currently in a free rent period for (i) Phase I (approximately 69.4% of its space) through and including December 2018 (with full rent commencing in February 2019) and (ii) Phase II (approximately 30.6% of its space) through and including May 2019.
The interconnected office buildings within the Apple Campus 3 property consist of Building A (308,659 square feet), Building B (269,997 square feet) and Building C (270,002 square feet), and the combined office floorplates average approximately 180,000 square feet. The amenities facility at the Apple Campus 3 property totals approximately 34,000 square feet and is expected to serve as a cafeteria for Apple employees. Building A, Building B, the parking structure and the amenities building are collectively known as “Phase I” of the Apple Campus 3 property; and Building C is known as “Phase II”. Amenities at the Apple Campus 3 property include a fitness/wellness center, coffee bar, general store, barbershop, bike repair shop, dry cleaning/laundry service and a conference center. Additional outdoor amenities at the Apple Campus 3 property include a mini amphitheater situated in the center courtyard, outdoor seating, sport courts and athletic fields, bus/shuttle stops and green roof accessibility on the third floor of the office buildings.
THE INFORMATION IN THIS STRUCTURAL AND COLLATERAL TERM SHEET IS NOT COMPLETE AND MAY BE AMENDED PRIOR TO THE TIME OF SALE. THIS TERM SHEET IS NOT AN OFFER TO SELL THESE SECURITIES AND IT IS NOT A SOLICITATION OF AN OFFER TO BUY THESE SECURITIES IN ANY JURISDICTION WHERE THE OFFER OR SALE IS NOT PERMITTED.
| | |
55 of 151
| Structural and Collateral Term Sheet | Benchmark 2018-B2 | |
| Apple Campus 3 | ||
According to the appraisal, as of 2016, Apple was the largest employer in the county of Santa Clara and the second largest space user in Silicon Valley. The Apple Campus 3 property is situated approximately 3.5 miles north of both Apple Park and One Infinite Loop. Apple Park is Apple’s new 175-acre corporate headquarters campus, which consists of the 2.8 million square foot loop structure in addition to several associated research and development buildings. One Infinite Loop was originally developed as Apple’s headquarters in 1993 and totals approximately 850,000 square feet.
The Apple Campus 3 property is located in Sunnyvale, California near the intersection of Central Expressway and Wolfe Road. Sunnyvale is the seventh most populous city in the San Francisco Bay Area and one of the major cities comprising Silicon Valley. As of the third quarter of 2017, the San Jose-Sunnyvale-Santa Clara metropolitan statistical area had an unemployment rate of 3.2% and reported an 8.9% gross domestic product growth rate in 2015, compared to an overall 2.5% growth rate for the United States.
The Apple Campus 3 property is located within 1.4 miles of two Santa Clara Valley Transportation Authority light rail stations (the Sunnyvale station in the Heritage District downtown and the Lawrence Station in eastern Sunnyvale), 3.9 miles from the downtown Mountain View Caltrain station, and within close proximity to highways 101 (3.2 miles), 280 (7.8 miles), 237 (1.3 miles) and 85 (0.7 miles). According to a third-party market research report, the 2017 estimated population within a one-, three- and five-mile radius of the Apple Campus 3 property was 26,490, 193,228 and 466,901, respectively; while the 2017 estimated median household income within the same radii was $93,664, $103,399 and $104,780, respectively.
As of the third quarter of 2017, the Sunnyvale submarket contained approximately 10.9 million square feet of office space exhibiting a vacancy rate of approximately 3.1% and an average asking rental rate of $64.44 per square foot, gross. The appraiser identified 15 comparable class A office properties totaling approximately 2.4 million square feet, which reported an approximately 99.7% occupancy rate and average asking rents of $50.58 per square foot, triple net.
| Historical and Current Occupancy(1) | |||
| 2014 | 2015 | 2016 | Current(2) |
| N/A | N/A | N/A | 100.0% |
| (1) | Historical occupancy is not available as the Apple Campus 3 property was built in 2017. |
| (2) | Current Occupancy is as of February 6, 2018. Apple has taken possession of its space, is currently constructing its interior improvements and is expected to begin taking occupancy in September 2018. |
| Tenant Summary(1) | ||||||||
| Tenant | Ratings Moody’s/S&P/Fitch | Net Rentable Area (SF) | % of Total NRA | Base Rent PSF(2) | % of Total Base Rent(2) | Lease Expiration Date | ||
| Apple(3)(4) | Aa1/AA+/NA | 882,657 | 100.0% | $48.35 | 100.0% | 2/28/2031 | ||
| (1) | Based on the underwritten rent roll dated February 6, 2018. |
| (2) | Annual UW Base Rent PSF reflects the straight line average of contractual rent steps over the remaining lease term. Apple is currently in a free rent period, as outlined in the footnote below, and will begin paying rent of $41.28 per square foot on Phase I in February 2019 and Phase II in June 2019. |
| (3) | Apple has taken possession of its space and is currently constructing its interior improvements. Apple is currently in a free rent period for (i) Phase I (approximately 69.4% of its space) through and including December 2018 and (ii) Phase II (approximately 30.6% of its space) through and including May 2019. In January 2019, Apple will pay reduced rent of approximately $6.93 per square foot on Phase I only. Through and including February 2018, Apple is required to pay reimbursements for utilities only, and commencing March 2018, the tenant will be required to pay reimbursements for utilities, operating expenses, taxes and insurance. All future rent credits and abatements under the Apple lease were reserved at the origination of the Apple Campus 3 Whole Loan (see “Escrows and Reserves” section). |
| (4) | Apple has two, seven-year renewal options at 95% of fair market value with at least 360 days’ written notice. |
THE INFORMATION IN THIS STRUCTURAL AND COLLATERAL TERM SHEET IS NOT COMPLETE AND MAY BE AMENDED PRIOR TO THE TIME OF SALE. THIS TERM SHEET IS NOT AN OFFER TO SELL THESE SECURITIES AND IT IS NOT A SOLICITATION OF AN OFFER TO BUY THESE SECURITIES IN ANY JURISDICTION WHERE THE OFFER OR SALE IS NOT PERMITTED.
| | |
56 of 151
| Structural and Collateral Term Sheet | Benchmark 2018-B2 | |
| Apple Campus 3 | ||
| Lease Rollover Schedule(1) | |||||||||
| Year | Number of Leases Expiring | Net Rentable Area Expiring | % of NRA Expiring | Base Rent Expiring(2) | % of Base Rent Expiring | Cumulative Net Rentable Area Expiring | Cumulative % of NRA Expiring | Cumulative Base Rent Expiring | Cumulative % of Base Rent Expiring |
| Vacant | NAP | 0 | 0.0% | NAP | NAP | 0 | 0.0% | NAP | NAP |
| 2018 & MTM | 0 | 0 | 0.0 | $0 | 0.0% | 0 | 0.0% | $0 | 0.0% |
| 2019 | 0 | 0 | 0.0 | 0 | 0.0 | 0 | 0.0% | $0 | 0.0% |
| 2020 | 0 | 0 | 0.0 | 0 | 0.0 | 0 | 0.0% | $0 | 0.0% |
| 2021 | 0 | 0 | 0.0 | 0 | 0.0 | 0 | 0.0% | $0 | 0.0% |
| 2022 | 0 | 0 | 0.0 | 0 | 0.0 | 0 | 0.0% | $0 | 0.0% |
| 2023 | 0 | 0 | 0.0 | 0 | 0.0 | 0 | 0.0% | $0 | 0.0% |
| 2024 | 0 | 0 | 0.0 | 0 | 0.0 | 0 | 0.0% | $0 | 0.0% |
| 2025 | 0 | 0 | 0.0 | 0 | 0.0 | 0 | 0.0% | $0 | 0.0% |
| 2026 | 0 | 0 | 0.0 | 0 | 0.0 | 0 | 0.0% | $0 | 0.0% |
| 2027 | 0 | 0 | 0.0 | 0 | 0.0 | 0 | 0.0% | $0 | 0.0% |
| 2028 | 0 | 0 | 0.0 | 0 | 0.0 | 0 | 0.0% | $0 | 0.0% |
| 2029 & Beyond | 1 | 882,657 | 100.0 | $42,675,300 | 100.0 | 882,657 | 100.0% | $42,675,300 | 100.0% |
| Total | 1 | 882,657 | 100.0% | $42,675,300 | 100.0% | ||||
| (1) | Based on the underwritten rent roll dated February 6, 2018. |
| (2) | Base Rent reflects the straight line average of contractual rent steps over the lease term. |
| Underwritten Net Cash Flow(1) | |||
| Underwritten | Per Square Foot | %(2) | |
| Rents in Place(3) | $42,675,300 | $48.35 | 91.5% |
| Total Reimbursements | 3,981,816 | 4.51 | 8.5% |
| Net Rental Income | $46,657,116 | $52.86 | 100.0% |
| (Vacancy/Credit Loss)(4) | (466,571) | (0.53) | (1.0)-- |
| Effective Gross Income | $46,190,545 | $52.33 | 99.0% |
| Total Expenses | $4,804,932 | $5.44 | 10.4% |
| Net Operating Income | $41,385,613 | $46.89 | 89.6% |
| Total TI/LC, Capex/RR | 176,531 | 0.20 | 0.4% |
| Net Cash Flow | $41,209,082 | $46.69 | 89.2% |
| (1) | Historical financial information is not available because construction of the property was completed in 2017. |
| (2) | % column represents percent of Net Rental Income for all revenue lines and represents percent of Effective Gross Income for the remainder of the fields. |
| (3) | Rents in Place include $7,298,408 of rent steps, which represents the straight line average of the contractual rent steps over the remaining lease term. The initial rent following the end of the free rent period is $41.28 per square foot. See the“Tenant Summary”section. |
| (4) | The underwritten economic vacancy is 1.0%. The Apple Campus 3 property was 100.0% leased as of February 6, 2018. |
Property Management. The property is managed by Paul Holdings, Inc., an affiliate of the borrower.
Escrows and Reserves. At loan origination, the borrower deposited $42,706,326 into a free rent reserve, $2,979,839 into a TI/LC reserve and $93,750 for the estimated cost to complete outstanding punch list items. The Apple Campus 3 Whole Loan documents provide for additional reserves in the amount of 125% of any additional punch list items received from Apple (following origination, an additional $506,100 was deposited due to additional punch list items identified by Apple).
Tax Escrows – On a monthly basis, the borrower is required to deposit 1/12 of the estimated annual real estate taxes, which currently equates to $249,368, into a tax reserve account.
Insurance Escrows – In the event that an acceptable blanket insurance policy is no longer in place, the borrower is required on a monthly basis to deposit 1/12 of annual insurance premiums into an insurance reserve account.
THE INFORMATION IN THIS STRUCTURAL AND COLLATERAL TERM SHEET IS NOT COMPLETE AND MAY BE AMENDED PRIOR TO THE TIME OF SALE. THIS TERM SHEET IS NOT AN OFFER TO SELL THESE SECURITIES AND IT IS NOT A SOLICITATION OF AN OFFER TO BUY THESE SECURITIES IN ANY JURISDICTION WHERE THE OFFER OR SALE IS NOT PERMITTED.
| | |
57 of 151
| Structural and Collateral Term Sheet | Benchmark 2018-B2 | |
| Apple Campus 3 | ||
Replacement Reserves – The borrower is not required to make ongoing monthly escrows for replacement reserves so long as no Cash Trap Event Period (as defined below) has occurred and is continuing. In the event of a Cash Trap Event Period (as defined below), the borrower must deposit $14,711 on each monthly payment date into a replacement reserve account.
Lease Sweep Reserve – During a Lease Sweep Period (as defined below), the borrower is required to make minimum monthly deposits of $1,838,869 (the “Minimum Lease Sweep Deposit”) (regardless of the amount of available excess cash flow) into a leasing reserve (the “Lease Sweep Account”), until the aggregate amount transferred therein, after giving effect to such required deposit, any additional deposit from excess cash flow made as described below under “Lockbox/Cash Management” and any termination payment made with respect to a Lease Sweep Lease (as defined below), equals the Lease Sweep Reserve Threshold (as defined below).
A “Lease Sweep Period” will commence upon the earlier to occur of (i) a Lease Sweep Lease tenant canceling, terminating or giving notice of its intent to cancel or terminate its lease on at least 40,000 square feet, (ii) Apple no longer being an Investment Grade Entity (as defined below), (iii) a Lease Sweep Lease tenant going dark in 20% or more of its space; provided, however, that a Lease Sweep Period will not commence as long as the Lease Sweep Lease tenant remains an Investment Grade Entity or subleases the space that it has gone dark in to an Investment Grade Entity, (iv) a Lease Sweep Lease tenant or its direct or indirect parent company defaulting under its lease beyond any applicable notice and cure period or (v) a Lease Sweep tenant or its direct or indirect parent company becoming insolvent or filing for bankruptcy, and will end upon a Lease Sweep Cure Event (as defined below).
A “Lease Sweep Cure Event” will occur (A) with regard to clause (i) of the Lease Sweep Period definition above, upon a Qualified Re-Leasing Event (as defined below), (B) with regard to clauses (ii) and (iii) of the Lease Sweep Period definition above, upon (a) a Qualified Re-Leasing Event, (b) Apple restoring its status as an Investment Grade Entity or (c) the applicable space being subleased to an Investment Grade Entity which has accepted delivery of the space and is paying unabated rent in an amount no less than the contract rate of the primary lease, (C) with regard to clause (iv) of the Lease Sweep Period definition above, upon the cure of such event of default and no other default occurring for a period of three consecutive months, (D) with regard to clause (v) of the Lease Sweep Period definition above, upon the bankruptcy or insolvency proceedings having terminated and the lease having been affirmed or assigned in a manner satisfactory to the lender or (E) with regard to clauses (i), (ii), (iii) and (iv) of the Lease Sweep Period definition above, upon the aggregate amount of funds transferred into the Lease Sweep Reserve and the Debt Service Reserve (as defined below) equalling the applicable Lease Sweep and Debt Service Reserve Cap (as defined below).
The borrower has the option to prevent a Lease Sweep Period or terminate a Lease Sweep Period (other than a Lease Sweep Period arising due to a bankruptcy or insolvency of a Lease Sweep Lease tenant or its parent company) by delivering to the lender a letter of credit in the face amount of the applicable Lease Sweep and Debt Service Reserve Cap.
The “Lease Sweep Reserve Threshold” means (i) with respect to a Lease Sweep Period continuing pursuant to clauses (ii) and/or (iv) of the Lease Sweep Period definition above, $30,892,995 ($35.00 per rentable square foot that is leased pursuant to the Apple lease at loan closing), or (ii) with respect to a Lease Sweep Period continuing solely pursuant to clauses (i) and/or (iii) of the “Lease Sweep Period”, definition above, $35.00 per rentable square foot of dark space and/or terminated space, as applicable.
The “Lease Sweep And Debt Service Reserve Cap” means (i) with respect to a Lease Sweep Period continuing solely pursuant to clause (iv) of the Lease Sweep Period definition above, $30,892,995 ($35.00 per rentable square foot leased pursuant to the Apple lease at loan closing); (ii) with respect to a Lease Sweep Period continuing solely pursuant to clause (i) of the Lease Sweep Period definition above, $35.00 per rentable square foot of terminated space, (iii) with respect to a Lease Sweep Period continuing pursuant to clause (iii) of the Lease Sweep Period definition above, whether or not a Lease Sweep Period pursuant to clauses (i) and/or (iv) of the Lease Sweep Period definition above is concurrently continuing, $50.00 per rentable square foot of dark space or (iv) with respect to a Lease Sweep Period continuing pursuant to clause (ii) of the Lease Sweep Period definition above, whether or not a Lease Sweep Period pursuant to clauses (i), (iii) and/or (iv) is concurrently continuing, $44,132,850 ($50.00 per rentable square foot that is leased pursuant to the Apple lease at loan closing).
A “Lease Sweep Lease” means the lease with Apple or any replacement lease which, when taken together with other leases of the same tenant and its affiliates, leases space equal to or greater than 75% of the space leased by Apple at loan closing.
An “Investment Grade Entity” means (i) an entity that is rated “BBB-”, or equivalent, or higher by at least two of Fitch, Moody’s and S&P or (ii) an entity wholly owned by an entity described in clause (i) herein.
A “Qualified Re-Leasing Event” will occur upon one or more replacement tenants acceptable to the lender executing leases covering at least 75% of the space currently occupied by Apple with (i) terms extending at least three years beyond the final maturity date of the Apple Campus 3 Whole Loan; (ii) economic terms at least as favorable as those in the lease being replaced; (iii) such replacement
THE INFORMATION IN THIS STRUCTURAL AND COLLATERAL TERM SHEET IS NOT COMPLETE AND MAY BE AMENDED PRIOR TO THE TIME OF SALE. THIS TERM SHEET IS NOT AN OFFER TO SELL THESE SECURITIES AND IT IS NOT A SOLICITATION OF AN OFFER TO BUY THESE SECURITIES IN ANY JURISDICTION WHERE THE OFFER OR SALE IS NOT PERMITTED.
| | |
58 of 151
| Structural and Collateral Term Sheet | Benchmark 2018-B2 | |
| Apple Campus 3 | ||
tenants having accepted delivery of such space and paying full unabated rent or any abatement has been reserved and (vi) all tenant improvements and leasing commissions having been paid or reserved.
Lockbox / Cash Management.The Apple Campus 3 Whole Loan is structured with a hard lockbox and in place cash management. The Apple Campus 3 Whole Loan requires that the borrower direct the tenant to pay its rent directly into a lender-controlled lockbox account. The loan documents also require that all rents received by the borrower or the property manager be deposited into the lockbox account within one business day of receipt. Amounts on deposit in the lockbox account are required to be transferred daily to a cash management account controlled by the lender, and, provided no event of default exists under the Apple Campus 3 Whole Loan, applied on each payment date prior to the ARD to the payment of interest on the Apple Campus 3 Whole Loan, to the funding of required reserves, to pay, if a Cash Trap Event Period exists or a mezzanine loan is outstanding, budgeted monthly operating expenses and approved extraordinary operating expenses, to deposit, during a Lease Sweep Period, an amount equal to the Minimum Lease Sweep Deposit into the Lease Sweep Reserve until the aggregate funds transferred to the Lease Sweep Reserve during such Lease Sweep Period equals the Lease Sweep Reserve Threshold and then to a debt service reserve (the “Debt Service Reserve”) until the aggregate funds transferred to the Lease Sweep Reserve and the Debt Service Reserve during such Lease Sweep Period equals the Lease Sweep and Debt Service Reserve Cap, to pay debt service on the Apple Campus 3 Senior Mezzanine Loan (as defined below) and Apple Campus 3 Junior Mezzanine Loan (as defined below), and, during a Lease Sweep Period, to apply all remaining available cash to fund the Lease Sweep Reserve and then the Debt Service Reserve up to the Lease Sweep Reserve Threshold and the Lease Sweep and Debt Service Reserve Cap, respectively. Provided no Cash Trap Event Period is continuing, excess cash in the cash management account is required to be disbursed to the property manager (in respect of its fees, to the extent not paid as part of budgeted operating expenses) and then to the borrower. If a Cash Trap Event Period is continuing (other than a Cash Trap Event Period due to a Lease Sweep Period), excess cash in the cash management account is required to be transferred to an account held by the lender as additional collateral for the Apple Campus 3 Whole Loan during the continuance of such Cash Trap Event Period. On each monthly payment date on or after the ARD, provided no event of default exists under the Apple Campus 3 Whole Loan, funds in the cash management account are required to be applied to the payment of interest on the Apple Campus 3 Whole Loan at the initial interest rate and a monthly amount determined by the lender to be required to fully amortize the Apple Campus 3 Whole Loan over a 30-year period, using an assumed interest rate equal to the initial interest rate, to the payment of interest on the Apple Campus 3 Senior Mezzanine Loan and Apple Campus 3 Junior Mezzanine Loan, in each case at the initial interest rate thereon, to the funding of required reserves, to pay budgeted monthly operating expenses and approved extraordinary operating expenses, to repay the principal balance of the Apple Campus 3 Whole Loan and, after such repayment, to pay interest accrued at the excess of the Revised Interest Rate over the initial interest rate.
A “Cash Trap Event Period” will commence upon the earlier of (i) the occurrence of an event of default under the Apple Campus 3 Whole Loan, the Apple Campus 3 Senior Mezzanine Loan or the Apple Campus 3 Junior Mezzanine Loan, (ii) the occurrence of a Lease Sweep Period, (iii) the debt service coverage ratio based on the Apple Campus 3 Whole Loan falling below 1.85x (based on a hypothetical 30-year amortization period), or the debt service coverage ratio based on the Apple Campus 3 Total Debt (as defined below) falling below 1.10x (based on a hypothetical 30-year amortization period), in each case, at the end of any calendar quarter or (iv) the ARD. A Cash Trap Event Period will end upon the occurrence of (a) with regard to clause (i), the cure of such event of default, (b) with regard to clause (ii), a Lease Sweep Cure Event, (c) with regard to clause (iii), the debt service coverage ratio based on the Apple Campus 3 Whole Loan (based on a hypothetical 30-year amortization schedule) being equal to 1.85x or greater for two consecutive calendar quarters, and the debt service coverage ratio based on the Apple Campus 3 Total Debt (based on a hypothetical 30-year amortization schedule) being equal to 1.10x or greater for two consecutive calendar quarters and (d) with regard to clause (iv), upon the Apple Campus 3 Whole Loan being repaid in full.
Additional Debt.Wells Fargo Bank, National Association, Deutsche Bank AG, acting through its New York Branch, and Goldman Sachs Mortgage Company funded a $117,500,000 senior mezzanine loan to CW Mezz LLC, secured by 100% of the equity in the borrower (the “Apple Campus 3 Senior Mezzanine Loan”) and a $117,500,000 junior mezzanine loan to Central Wolfe LLC, secured by 100% of the equity in the senior mezzanine borrower (the “Apple Campus 3 Junior Mezzanine Loan”) (collectively, the Apple Campus 3 Whole Loan, Apple Campus 3 Senior Mezzanine Loan and Apple Campus 3 Junior Mezzanine Loan are referred to herein as the “Apple Campus 3 Total Debt”). The Apple Campus 3 Senior Mezzanine loan has since been sold to Athene Annuity and Life Company American Equity Investment Life Insurance Company, solely with respect to the Modco Account, and Midland National Life Insurance Company and the Apple Campus 3 Junior Mezzanine Loan has since been sold to CPPIB Credit Investments II Inc. The Apple Campus 3 Senior Mezzanine Loan and the Apple Campus 3 Junior Mezzanine Loan have the same anticipated repayment date and the same final maturity date as the Apple Campus 3 Whole Loan. The Apple Campus 3 Senior Mezzanine Loan initially accrues interest at a fixed interest rate equal to 4.62000%per annum (the “Senior Mezzanine Initial Interest Rate”), and the Apple Campus 3 Junior Mezzanine Loan initially accrues interest at a fixed interest rate equal to 6.00000%per annum (the “Junior Mezzanine Initial Interest Rate”). In the event the Apple Campus 3 Senior Mezzanine Loan and/or the Apple Campus 3 Junior Mezzanine Loan are not paid off in full on or before the ARD, the borrower will be required to make interest payments based on an interest rate equal to the greater of (i) the Senior Mezzanine Initial Interest Rate or the Junior Mezzanine Initial Interest Rate, as applicable, plus 1.50000%per annum, and (ii) the then
THE INFORMATION IN THIS STRUCTURAL AND COLLATERAL TERM SHEET IS NOT COMPLETE AND MAY BE AMENDED PRIOR TO THE TIME OF SALE. THIS TERM SHEET IS NOT AN OFFER TO SELL THESE SECURITIES AND IT IS NOT A SOLICITATION OF AN OFFER TO BUY THESE SECURITIES IN ANY JURISDICTION WHERE THE OFFER OR SALE IS NOT PERMITTED.
| | |
59 of 151
| Structural and Collateral Term Sheet | Benchmark 2018-B2 | |
| Apple Campus 3 | ||
10-year swap rate plus 1.50000%per annum. Based on the Apple Campus 3 Total Debt of $575.0 million, the Cut-off Date LTV, Maturity Date LTV, UW NCF DSCR and UW NOI Debt Yield are 74.3%, 74.3%, 1.70x and 7.2%, respectively. Based on the “as-is” appraised value, the Cut-off Date LTV and Maturity Date LTV of the Apple Campus Total Debt are 92.1% and 92.1%, respectively. An intercreditor agreement is in place with respect to the Apple Campus 3 Whole Loan, the Apple Campus 3 Senior Mezzanine Loan and the Apple Campus 3 Junior Mezzanine Loan.
THE INFORMATION IN THIS STRUCTURAL AND COLLATERAL TERM SHEET IS NOT COMPLETE AND MAY BE AMENDED PRIOR TO THE TIME OF SALE. THIS TERM SHEET IS NOT AN OFFER TO SELL THESE SECURITIES AND IT IS NOT A SOLICITATION OF AN OFFER TO BUY THESE SECURITIES IN ANY JURISDICTION WHERE THE OFFER OR SALE IS NOT PERMITTED.
| | |
60 of 151
| Structural and Collateral Term Sheet | Benchmark 2018-B2 |
[THIS PAGE INTENTIONALLY LEFT BLANK]
THE INFORMATION IN THIS STRUCTURAL AND COLLATERAL TERM SHEET IS NOT COMPLETE AND MAY BE AMENDED PRIOR TO THE TIME OF SALE. THIS TERM SHEET IS NOT AN OFFER TO SELL THESE SECURITIES AND IT IS NOT A SOLICITATION OF AN OFFER TO BUY THESE SECURITIES IN ANY JURISDICTION WHERE THE OFFER OR SALE IS NOT PERMITTED.
| | |
61 of 151
| Structural and Collateral Term Sheet | Benchmark 2018-B2 | |
| EOS 21 | ||
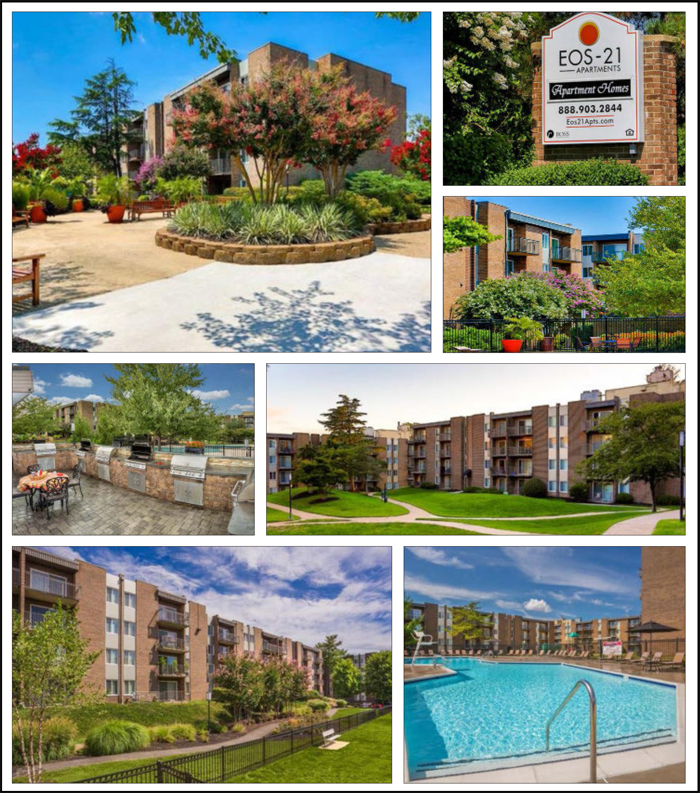
THE INFORMATION IN THIS STRUCTURAL AND COLLATERAL TERM SHEET IS NOT COMPLETE AND MAY BE AMENDED PRIOR TO THE TIME OF SALE. THIS TERM SHEET IS NOT AN OFFER TO SELL THESE SECURITIES AND IT IS NOT A SOLICITATION OF AN OFFER TO BUY THESE SECURITIES IN ANY JURISDICTION WHERE THE OFFER OR SALE IS NOT PERMITTED.
| | |
62 of 151
| Structural and Collateral Term Sheet | Benchmark 2018-B2 | |
| EOS 21 | ||
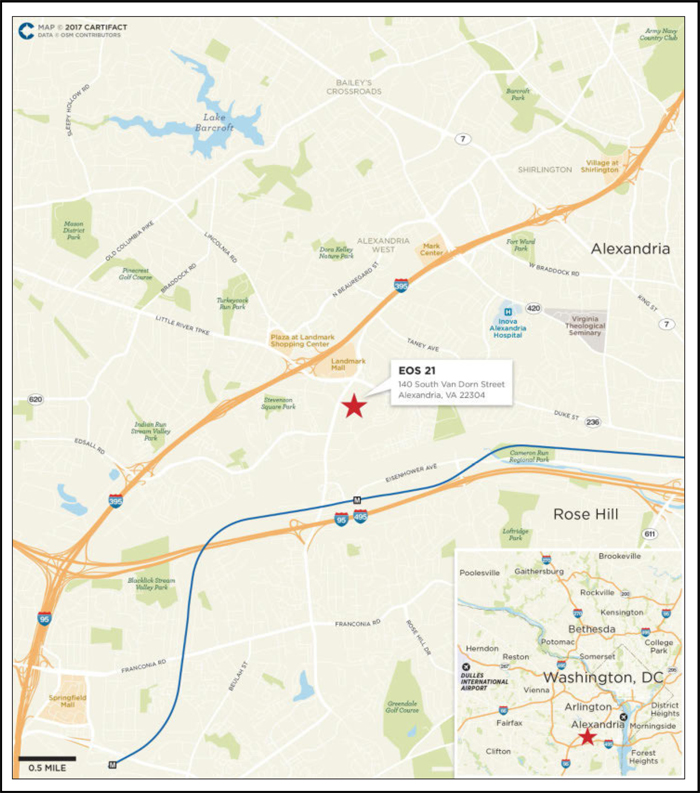
THE INFORMATION IN THIS STRUCTURAL AND COLLATERAL TERM SHEET IS NOT COMPLETE AND MAY BE AMENDED PRIOR TO THE TIME OF SALE. THIS TERM SHEET IS NOT AN OFFER TO SELL THESE SECURITIES AND IT IS NOT A SOLICITATION OF AN OFFER TO BUY THESE SECURITIES IN ANY JURISDICTION WHERE THE OFFER OR SALE IS NOT PERMITTED.
| | |
63 of 151
| Structural and Collateral Term Sheet | Benchmark 2018-B2 | |
| EOS 21 | ||
| Mortgage Loan Information | Property Information | |||||
| Mortgage Loan Seller: | JPMCB | Single Asset / Portfolio: | Single Asset | |||
| Original Principal Balance(1): | $60,000,000 | Title: | Fee | |||
| Cut-off Date Principal Balance(1): | $60,000,000 | Property Type - Subtype: | Multifamily – Mid-Rise | |||
| % of Pool by IPB: | 4.0% | Net Rentable Area (Units): | 1,180 | |||
| Loan Purpose: | Acquisition | Location: | Alexandria, VA | |||
| Borrower: | 140 South Van Dorn Street (VA) | Year Built / Renovated: | 1963, 1967 / 2012 | |||
| Owner, LLC | Occupancy: | 97.3% | ||||
| Sponsor: | CIM SMA I-B Investments, LLC | Occupancy Date: | 9/30/2017 | |||
| Interest Rate: | 3.88000% | Number of Tenants: | N/A | |||
| Note Date: | 11/30/2017 | 2014 NOI: | $9,463,724 | |||
| Maturity Date: | 12/1/2024 | 2015 NOI: | $10,646,525 | |||
| Interest-only Period: | 84 months | 2016 NOI: | $10,930,188 | |||
| Original Term: | 84 months | TTM NOI (as of 9/2017): | $11,141,538 | |||
| Original Amortization: | None | UW Economic Occupancy: | 93.8% | |||
| Amortization Type: | Interest Only | UW Revenues: | $20,888,540 | |||
| Call Protection(2): | L(26),Def(55),O(3) | UW Expenses: | $9,582,304 | |||
| Lockbox / Cash Management: | Soft / Springing | UW NOI: | $11,306,236 | |||
| Additional Debt: | Yes | UW NCF: | $11,008,876 | |||
| Additional Debt Balance: | $90,000,000 | Appraised Value / Per Unit: | $231,400,000 / $196,102 | |||
| Additional Debt Type: | Pari Passu | Appraisal Date: | 11/21/2017 | |||
| Escrows and Reserves(3) | Financial Information(1) | ||||||||
| Initial | Monthly | Initial Cap | Cut-off Date Loan / Unit: | $127,119 | |||||
| Taxes: | $0 | Springing | N/A | Maturity Date Loan / Unit: | $127,119 | ||||
| Insurance: | $0 | Springing | N/A | Cut-off Date LTV: | 64.8% | ||||
| Replacement Reserves: | $0 | $0 | N/A | Maturity Date LTV: | 64.8% | ||||
| TI/LC: | $0 | $0 | N/A | UW NCF DSCR: | 1.87x | ||||
| Other: | $186,208 | $0 | N/A | UW NOI Debt Yield: | 7.5% | ||||
| Sources and Uses | ||||||
| Sources | Proceeds | % of Total | Uses | Proceeds | % of Total | |
| Mortgage Loan(1) | $150,000,000 | 65.3% | Purchase Price | $227,750,000 | 99.1% | |
| Sponsor Equity | 79,774,092 | 34.7 | Closing Costs | 1,837,884 | 0.8 | |
| Upfront Reserves | 186,208 | 0.1 | ||||
| Total Sources | $229,774,092 | 100.0% | Total Uses | $229,774,092 | 100.0% | |
| (1) | The EOS 21 loan is part of a whole loan evidenced by twopari passu promissory notes with an aggregate original principal balance of $150.0 million. The Financial Information presented in the chart above reflects a Cut-off Date balance of the $150.0 million EOS 21 Whole Loan (as defined below). |
| (2) | The lockout period will be at least 26 payments beginning with and including the first payment date of January 1, 2018. Defeasance of the full $150.0 million EOS 21 Whole Loan is permitted at any time prior to the commencement of the open period and after the date that is two years from the closing date of the securitization that holds the last portion of the EOS 21 Whole Loan to be securitized (the “Permitted Defeasance Date”). If the Permitted Defeasance Date has not occurred by January 1, 2021, the borrower is permitted to prepay the EOS 21 Whole Loan with the payment of a yield maintenance premium prior to the Permitted Defeasance Date. |
| (3) | For a full description of Escrows and Reserves, please refer to “Escrows and Reserves” below. |
THE INFORMATION IN THIS STRUCTURAL AND COLLATERAL TERM SHEET IS NOT COMPLETE AND MAY BE AMENDED PRIOR TO THE TIME OF SALE. THIS TERM SHEET IS NOT AN OFFER TO SELL THESE SECURITIES AND IT IS NOT A SOLICITATION OF AN OFFER TO BUY THESE SECURITIES IN ANY JURISDICTION WHERE THE OFFER OR SALE IS NOT PERMITTED.
| | |
64 of 151
| Structural and Collateral Term Sheet | Benchmark 2018-B2 | |
| EOS 21 | ||
The Loan.The EOS 21 loan is secured by a first mortgage lien on the borrower’s fee interest in a 1,180-unit, multifamily property located in Alexandria, Virginia (the “EOS 21 Property”). The loan is part of a whole loan (the “EOS 21 Whole Loan”) that has an outstanding principal balance as of the Cut-off Date of $150.0 million and is comprised of twopari passunotes, each as described below. The controlling Note A-1, with an outstanding principal balance as of the Cut-off Date of $60.0 million, is being contributed to the Benchmark 2018-B2 Trust. The non-controlling Note A-2, with an outstanding principal balance as of the Cut-off Date of $90.0 million, is currently held by JPMCB and is expected to be contributed to one or more future securitization trusts. The relationship between the holders of the EOS 21 Whole Loan will be governed by a co-lender agreement as described under the “Description of the Mortgage Pool—The Whole Loans—The Serviced Pari Passu WholeLoans” in the Preliminary Prospectus. The EOS 21 Whole Loan has a seven-year term and will be interest only for the entire term.
| Whole Loan Summary | |||||
| Note | Original Balance | Cut-off Date Balance | Note Holder | Controlling Piece | |
| A-1 | $60,000,000 | $60,000,000 | Benchmark 2018-B2 | Yes | |
| A-2 | 90,000,000 | 90,000,000 | JPMCB | No | |
| Total | $150,000,000 | $150,000,000 | |||
The Borrower. The borrowing entity for the EOS 21 Whole Loan is 140 South Van Dorn Street (VA) Owner, LLC, a Delaware limited liability company and special purpose entity.
The Loan Sponsor.The loan sponsor and nonrecourse carve-out guarantor is CIM SMA I-B Investments, LLC, an affiliate of CIM Group (“CIM”). Headquartered in Los Angeles and founded in 1994, CIM is a full-service real estate investment firm which specializes in urban real estate. With approximately $25.7 billion of assets under management, CIM focuses on strategies in opportunistic, stabilized, and value-add real estate, real estate debt, and infrastructure.
The loan sponsor has budgeted approximately $20.0 million to upgrade and reposition the EOS 21 Property over the next six years. The loan sponsor plans to renovate all 1,180 units as they become vacant and upgrade common areas and mechanical systems. According to the loan sponsor, renovations are expected to commence in February 2018 with $12.2 million to be invested within the first two years of the loan term. The loan sponsor anticipates that renovations to units will include new kitchen finishes with stainless steel appliances, new lighting, new washers and dryers and faux wood flooring in all kitchens, which will replace carpets, tile or linoleum. The loan sponsor plans to renovate all common areas and hallways, upgrade elevator cabs, replace boilers and chillers and replace roofs. According to the loan sponsor, updates to the EOS 21 Property’s amenity package are anticipated to include the addition of a yoga studio and a pet washing station along with upgrades to the pool area, barbeque area, dog park area and business center. In addition, the loan sponsor plans to add a bedroom to approximately 118 of the EOS 21 Property’s corner one- and two-bedroom units which it anticipates will cost approximately $1.2 million.
Further, according to the loan sponsor, the previous owner of the EOS 21 Property invested nearly $11.0 million of capital improvements into the EOS 21 Property from 2012 to September 2017, including approximately $2.4 million of unit renovations and an approximately $1.6 million carpet replacement.
The Property. The EOS 21 Property is a 1,180-unit multifamily complex built in 1963 and 1967 and most recently renovated in 2012 and is located in Alexandria, Virginia. The EOS 21 Property consists of three five-story buildings and 11 four-story buildings along with a clubhouse and is comprised of 236 studio units, 604 one-bedroom units and 340 two-bedroom units. As of September 30, 2017, the EOS 21 Property was 97.3% occupied and features an amenity package that includes two swimming pools, four tennis courts, a business center, an on-site day care center, a theater room, three children’s playgrounds, a deli, a dog park, a barbecue and picnic area, a coffee center, a game room, a billiards table and a complimentary shuttle service to the Van Dorn Metro Station, which is located approximately 1.0 mile from the EOS 21 Property. The EOS 21 Property has 1,496 parking spaces, resulting in a parking ratio of approximately 1.3 spaces per unit. Renovated units have experienced an average rent per unit increase of $108 per month.
The EOS 21 Property is located inside the Capital Beltway (I-495), close to I-395 and within 2.6 miles of the Mark Center Building (which contains the Department of Defense’s Washington Headquarters Services), 4.0 miles west of Old Town Alexandria and 8.0 miles southwest of the Washington D.C. central business district. The EOS 21 Property is within 15.0 miles of many of Washington D.C.’s major employers including Fannie Mae, Freddie Mac, Northrop Grumman, Booz Allen Hamilton, Lockheed Martin and General Dynamics, as well as the Pentagon, the White House and Capitol Hill. The EOS 21 Property is also located within 8.0 miles of a variety of dining and entertainment attractions located in Old Town Alexandria, Shirlington, the Rosslyn-Ballston Corridor, Crystal City, Pentagon City, and Washington, D.C. In addition, the EOS 21 Property is less than 1.0 mile from the Landmark Mall, which the Howard Hughes Corporation plans to redevelop into a walkable, mixed-used urban village and include new residences, plazas, green spaces for community events, shops, restaurants and a 10-screen movie theater. The project is expected to break ground in the summer of 2018.
THE INFORMATION IN THIS STRUCTURAL AND COLLATERAL TERM SHEET IS NOT COMPLETE AND MAY BE AMENDED PRIOR TO THE TIME OF SALE. THIS TERM SHEET IS NOT AN OFFER TO SELL THESE SECURITIES AND IT IS NOT A SOLICITATION OF AN OFFER TO BUY THESE SECURITIES IN ANY JURISDICTION WHERE THE OFFER OR SALE IS NOT PERMITTED.
| | |
65 of 151
| Structural and Collateral Term Sheet | Benchmark 2018-B2 | |
| EOS 21 | ||
According to the appraisal, Alexandria has recently undergone a revitalization spurred by its proximity to Washington, D.C., Washington Reagan National Airport, several Metrorail stations, I-95 and the Capital Beltway (I-495). Further, according to the appraisal, Alexandria is one of the best-connected communities from a transportation perspective in the Washington D.C. area as it is served by seven stations on Washington, D.C.’s Metrorail transit system. The EOS 21 Property is located within 1.0 mile of the Van Dorn Street Metrorail, providing access to the Metrorail’s Blue Line, which provides rail travel from Springfield, Virginia through downtown Washington, DC, eastward to Largo, Maryland. MetroBus and DASH service is available throughout the area, with links to the District of Columbia, as well as the MetroRail. According to the appraisal, the 2017 estimated population within a one-, three- and five-mile radius of the EOS 21 Property was 43,496, 205,207, and 548,163, respectively; while the 2017 estimated average household income within a one-, three- and five-mile radius was $100,149, $122,788 and $131,490, respectively.
The appraisal identified seven comparable multifamily properties proximate to the EOS 21 Property. The EOS 21 Property comparables range from 189 to 2,113 units with an average of 527 units, and indicate a quoted rental range of $1,109 to $2,455 per month, with an average market rent of $1,598 per month, which is approximately 14.1% above the EOS 21 Property’s weighted average in-place rents. The comparable properties had occupancies ranging from 90.0% to 97.0% with an average occupancy of approximately 94.4%. According to the appraisal, there is no competitive supply under construction that is expected to compete with the EOS 21 Property.
| Historical and Current Occupancy | |||
| 2014(1) | 2015(2) | 2016(2) | Current(3) |
| N/A | 94.9% | 96.6% | 97.3% |
| (1) | According to the loan sponsor, 2014 Historical Occupancy was not available from the previous owner of the EOS 21 Property. |
| (2) | 2015 and 2016 Historical Occupancies are as of December 31 of each respective year. |
| (3) | Current Occupancy is as of September 30, 2017. |
| Multifamily Unit Mix(1) | ||||||
| Unit Type | # of Units | % of Total Units | Occupancy(2) | Average Unit Size (SF)(2) | Average Market Rent Per Unit(3) | Average Monthly In- Place Rents(2) |
| Studio | 236 | 20.0% | 97.9% | 496 | $1,335 | $1,105 |
| 1 BR | 604 | 51.2 | 97.5% | 734 | $1,604 | $1,341 |
| 2 BR | 340 | 28.8 | 96.5% | 1,095 | $1,856 | $1,709 |
| Total / Wtd. Avg. | 1,180 | 100.0% | 97.3% | 790 | $1,598 | $1,400 |
| (1) | Based on the rent roll dated September 30, 2017 provided by the borrower. |
| (2) | Occupancy, Average Unit Size (SF), and Average Monthly In-Place Rents represent a weighted average of the various unit type layouts. |
| (3) | Average Market Rent Per Unit represents the midpoint of the range of comparable market rents indicated by the appraisal. |
THE INFORMATION IN THIS STRUCTURAL AND COLLATERAL TERM SHEET IS NOT COMPLETE AND MAY BE AMENDED PRIOR TO THE TIME OF SALE. THIS TERM SHEET IS NOT AN OFFER TO SELL THESE SECURITIES AND IT IS NOT A SOLICITATION OF AN OFFER TO BUY THESE SECURITIES IN ANY JURISDICTION WHERE THE OFFER OR SALE IS NOT PERMITTED.
| | |
66 of 151
| Structural and Collateral Term Sheet | Benchmark 2018-B2 | |
| EOS 21 | ||
| Operating History and Underwritten Net Cash Flow | |||||||
| 2014 | 2015 | 2016 | TTM(1) | Underwritten | Per Unit | %(2) | |
| Rents in Place | $19,334,292 | $19,703,169 | $19,813,948 | $19,860,298 | $19,860,298 | $16,831 | 92.4% |
| Vacant Income | 0 | 0 | 0 | 0 | 0 | 0 | 0.0 |
| Gross Potential Rent | $19,334,292 | $19,703,169 | $19,813,948 | $19,860,298 | $19,860,298 | $16,831 | 92.4% |
| Total Reimbursements | 1,371,997 | 1,574,004 | 1,576,022 | 1,624,937 | 1,624,937 | 1,377 | 7.6 |
| Net Rental Income | $20,706,288 | $21,277,173 | $21,389,970 | $21,485,235 | $21,485,235 | $18,208 | 100.0% |
| (Vacancy/Credit Loss) | (2,142,276) | (1,940,940) | (1,517,386) | (1,331,027) | (1,331,027) | (1,128) | (6.2) |
| Other Income(3) | 736,332 | 766,460 | 741,085 | 734,333 | 734,333 | 622 | 3.4 |
| Effective Gross Income | $19,300,345 | $20,102,693 | $20,613,669 | $20,888,540 | $20,888,540 | $17,702 | 97.2% |
| Total Expenses | $9,836,620 | $9,456,168 | $9,683,481 | $9,747,002 | $9,582,304 | $8,121 | 45.9% |
| Net Operating Income | $9,463,724 | $10,646,525 | $10,930,188 | $11,141,538 | $11,306,236 | $9,582 | 54.1% |
| Replacement Reserves | 0 | 0 | 0 | 0 | 297,360 | 252 | 1.4 |
| Net Cash Flow | $9,463,724 | $10,646,525 | $10,930,188 | $11,141,538 | $11,008,876 | $9,330 | 52.7% |
| (1) | TTM column represents the trailing 12-month period ending on September 30, 2017. |
| (2) | % column represents percent of Net Rental Income for all revenue lines and represents percent of Effective Gross Income for the remainder of fields. |
| (3) | Other Income represents administrative fees, application fees, month to month charges, pet rent, parking income, late fees and laundry income among others. |
Property Management. The EOS 21 Property is managed byCIM Management, Inc., an affiliate of the loan sponsor.
Escrows and Reserves.At origination, the borrower deposited $186,208 for a deferred maintenance reserve.
Tax Escrows- The requirement for the borrower to make monthly deposits into the tax escrow is waived so long as (a) no event of default under the loan documents is continuing and (b) the borrower has provided the lender with satisfactory evidence that all taxes have been paid on or prior to the due date.
Insurance Escrows- The requirement for the borrower to make monthly deposits into the insurance escrow is waived so long as (a) no event of default has occurred and is continuing, and (b) the borrower has provided the lender with reasonably satisfactory evidence that the EOS 21 Property is insured under a blanket insurance policy in accordance with the loan agreement.
Lockbox / Cash Management. The loan is structured with a soft lockbox and springing cash management. The borrower is required to cause the property manager to deposit all revenues from the residential portion of the property, and the commercial tenants are required to deposit all rents directly into the lockbox account controlled by the lender within three business days of receipt. Prior to the occurrence of a Cash Sweep Event (as defined below), funds deposited into the lockbox account in excess of the required balance of $5,000 are required to be disbursed to the borrower’s operating account on a daily basis. During a Cash Sweep Event, the funds in the lockbox account are required to be swept to a segregated cash management account under the control of the lender and all excess cash flow after payment of debt service, required reserves and operating expenses are required to be held as additional collateral for the EOS 21 Whole Loan. The lender has been granted a first priority security interest in the cash management account. In the event the owners of the borrower incur mezzanine debt in accordance with the loan documents, the borrower is required to implement in-place cash management.
A “Cash Sweep Event” means the occurrence of: (i) an event of default; (ii) any bankruptcy or insolvency action of the borrower; or (iii) a Property Manager Trigger (as defined below).
A Cash Sweep Event may be cured (a) with respect to clause (i) above, upon the acceptance by the lender of a cure of such event of default, (b) with respect to clause (ii) above, solely to the extent caused by an involuntary bankruptcy or insolvency action in which none of the borrower or guarantor or their affiliates has colluded with any party in connection with such action, the dismissal of such action within 90 days without any adverse consequences to the borrower, the EOS 21 Whole Loan or the EOS 21 Property (as determined by the lender in its reasonable discretion) or (c) with respect to clause (iii) above, if the borrower replaces the property manager with a qualified manager under a replacement management agreement. Each cure is also subject to the following conditions: (1) no other event of default has occurred and is continuing; (2) the borrower pays all of the lender’s reasonable out-of-pocket non-de minimis expenses incurred in connection with such cure (including reasonable attorney’s fees and expenses); and (3) in no event will the borrower be permitted to cure a voluntary or collusive involuntary bankruptcy or insolvency action of the borrower.
THE INFORMATION IN THIS STRUCTURAL AND COLLATERAL TERM SHEET IS NOT COMPLETE AND MAY BE AMENDED PRIOR TO THE TIME OF SALE. THIS TERM SHEET IS NOT AN OFFER TO SELL THESE SECURITIES AND IT IS NOT A SOLICITATION OF AN OFFER TO BUY THESE SECURITIES IN ANY JURISDICTION WHERE THE OFFER OR SALE IS NOT PERMITTED.
| | |
67 of 151
| Structural and Collateral Term Sheet | Benchmark 2018-B2 | |
| EOS 21 | ||
“Property Manager Trigger” means either (i) any bankruptcy or insolvency action of an unaffiliated property manager and either (x) the borrower has not replaced the manager with a qualified manager under a replacement management agreement within 60 days following the borrower’s knowledge of such action or (y) such action has not been discharged or dismissed within 30 days following its filing or (ii) any bankruptcy or insolvency action of an affiliated manager, if the borrower has not replaced the manager with a qualified manager within 15 days following the borrower’s knowledge of such action, provided that in either case, the borrower will have an additional 30 day period to replace the manager to the extent that it has diligently found an otherwise reasonably acceptable replacement manager and the failure to finalize such replacement is solely due to a delay in the lender or servicer approval or rating agency confirmation.
Permitted Mezzanine Debt. The loan documents permit one or more of the owners of direct or indirect ownership interests in the borrower to obtain one or more loans secured by such ownership interest upon satisfaction of certain terms and conditions including, without limitation, the following: (i) the combined loan-to-value ratio does not exceed 65.0%, (ii) the combined debt service coverage ratio (as calculated in the loan documents) is not less than 1.89x, (iii) the lenders execute a customary intercreditor agreement acceptable to the lender in its reasonable discretion, (iv) receipt of a rating agency confirmation, and (v) the restructuring of the cash management such that the funds are swept daily from the lockbox account to the cash management account and payments on the mezzanine loan are made only after payment of all operating expenses and amounts then due under the EOS 21 Whole Loan.
THE INFORMATION IN THIS STRUCTURAL AND COLLATERAL TERM SHEET IS NOT COMPLETE AND MAY BE AMENDED PRIOR TO THE TIME OF SALE. THIS TERM SHEET IS NOT AN OFFER TO SELL THESE SECURITIES AND IT IS NOT A SOLICITATION OF AN OFFER TO BUY THESE SECURITIES IN ANY JURISDICTION WHERE THE OFFER OR SALE IS NOT PERMITTED.
| | |
68 of 151
| Structural and Collateral Term Sheet | Benchmark 2018-B2 |
[THIS PAGE INTENTIONALLY LEFT BLANK]
THE INFORMATION IN THIS STRUCTURAL AND COLLATERAL TERM SHEET IS NOT COMPLETE AND MAY BE AMENDED PRIOR TO THE TIME OF SALE. THIS TERM SHEET IS NOT AN OFFER TO SELL THESE SECURITIES AND IT IS NOT A SOLICITATION OF AN OFFER TO BUY THESE SECURITIES IN ANY JURISDICTION WHERE THE OFFER OR SALE IS NOT PERMITTED.
| | |
69 of 151
| Structural and Collateral Term Sheet | Benchmark 2018-B2 | |
| Rochester Hotel Portfolio | ||
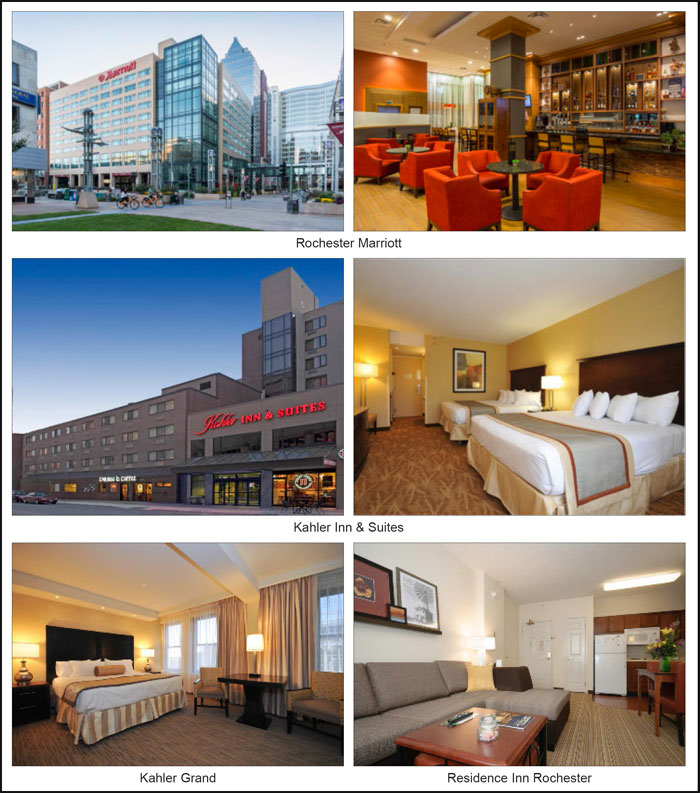
THE INFORMATION IN THIS STRUCTURAL AND COLLATERAL TERM SHEET IS NOT COMPLETE AND MAY BE AMENDED PRIOR TO THE TIME OF SALE. THIS TERM SHEET IS NOT AN OFFER TO SELL THESE SECURITIES AND IT IS NOT A SOLICITATION OF AN OFFER TO BUY THESE SECURITIES IN ANY JURISDICTION WHERE THE OFFER OR SALE IS NOT PERMITTED.
| | |
70 of 151
| Structural and Collateral Term Sheet | Benchmark 2018-B2 | |
| Rochester Hotel Portfolio | ||
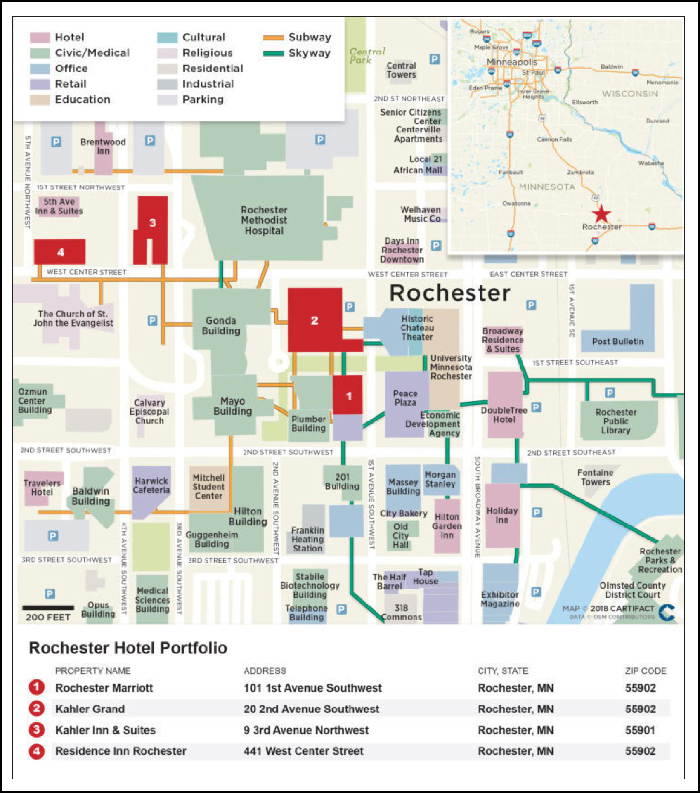
THE INFORMATION IN THIS STRUCTURAL AND COLLATERAL TERM SHEET IS NOT COMPLETE AND MAY BE AMENDED PRIOR TO THE TIME OF SALE. THIS TERM SHEET IS NOT AN OFFER TO SELL THESE SECURITIES AND IT IS NOT A SOLICITATION OF AN OFFER TO BUY THESE SECURITIES IN ANY JURISDICTION WHERE THE OFFER OR SALE IS NOT PERMITTED.
| | |
71 of 151
| Structural and Collateral Term Sheet | Benchmark 2018-B2 | |
| Rochester Hotel Portfolio | ||
| Mortgage Loan Information | Property Information | |||
| Mortgage Loan Seller: | GACC | Single Asset / Portfolio: | Portfolio | |
| Original Principal Balance(1): | $60,000,000 | Title: | Fee | |
| Cut-off Date Principal Balance(1): | $60,000,000 | Property Type - Subtype: | Hotel – Various | |
| % of Pool by IPB: | 4.0% | Net Rentable Area (Rooms)(3): | 1,222 | |
| Loan Purpose: | Refinance | Location: | Rochester, MN | |
| Borrowers: | KAH 20 2nd Avenue LLC, KINN 9 | Year Built / Renovated: | Various / Various | |
| 3rd Avenue LLC, MAR 1st Avenue | Occupancy/ADR/RevPAR(3): | 58.4% / $152.43 / $88.99 | ||
| SW LLC, RES 441 Center Street LLC | Occupancy/ADR/RevPAR Date: | 10/31/2017 | ||
| Loan Sponsors: | Javon R. Bea, Vita E. Bea | Number of Tenants: | N/A | |
| Interest Rate: | 4.74100% | 2014 NOI: | $18,034,542 | |
| Note Date: | 11/6/2017 | 2015 NOI: | $18,230,427 | |
| Maturity Date: | 11/6/2027 | 2016 NOI(4): | $16,602,150 | |
| Interest-only Period: | 36 months | TTM NOI (as of 10/2017)(4): | $16,830,937 | |
| Original Term: | 120 months | UW Occupancy/ADR/RevPAR(3): | 58.4% / $152.43 / $88.99 | |
| Original Amortization: | 300 months | UW Revenues: | $53,040,505 | |
| Amortization Type: | IO-Balloon | UW Expenses: | $36,019,617 | |
| Call Protection(2): | L(27),Def(88),O(5) | UW NOI: | $17,020,888 | |
| Lockbox / Cash Management: | Hard / Springing | UW NCF: | $14,368,863 | |
| Additional Debt: | Yes | Appraised Value / Per Room(3): | $210,000,000 / $171,849 | |
| Additional Debt Balance(1): | $80,000,000 | Appraisal Date: | 11/1/2017 | |
| Additional Debt Type(1): | Pari Passu | |||
| Escrows and Reserves(5) | Financial Information(1) | |||||
| Initial | Monthly | Initial Cap | Cut-off Date Loan / Room(3): | $114,566 | ||
| Taxes: | $496,816 | $248,408 | N/A | Maturity Date Loan / Room(3): | $95,285 | |
| Insurance: | $335,774 | $33,894 | N/A | Cut-off Date LTV: | 66.7% | |
| FF&E: | $0 | 5.0% of gross revenues | N/A | Maturity Date LTV: | 55.4% | |
| Other: | $345,563 | $500,000 | $2,100,000 | UW NCF DSCR(6): | 1.50x | |
| UW NOI Debt Yield: | 12.2% | |||||
| Sources and Uses | ||||||
| Sources | Proceeds | % of Total | Uses | Proceeds | % of Total | |
| Mortgage Loan(1) | $140,000,000 | 91.1% | Loan Payoff | $137,485,356 | 89.5% | |
| Sponsor Equity | 13,628,938 | 8.9 | Reimbursement of Preferred Equity | 13,346,438 | 8.7 | |
| Reserves | 1,178,152 | 0.8 | ||||
| Closing Costs | 1,618,992 | 1.1 | ||||
| Total Sources | $153,628,938 | 100.0% | Total Uses | $153,628,938 | 100.0% |
| (1) | The Rochester Hotel Portfolio loan is part of a whole loan evidenced by fivepari passu notes with an aggregate original principal balance of $140.0 million. The Financial Information presented in the chart above reflects the aggregate Cut-off Date balance of the $140.0 million Rochester Hotel Portfolio Whole Loan (as defined below). |
| (2) | The lockout period will be at least 27 payments beginning with and including the first payment date in December 2017. Defeasance of the full $140.0 million Rochester Hotel Portfolio Whole Loan is permitted after the date that is the earlier to occur of (i) two years from the closing date of the securitization that includes the lastpari passunote to be securitized and (ii) the third anniversary of the origination date. The assumed lockout period of 27 payments is based on the expected Benchmark 2018-B2 securitization closing date in February 2018. The actual lockout period may be longer. |
| (3) | The total number of rooms is projected to decrease by 100 rooms by May 2022 following the conversion of 184 small rooms at the Kahler Grand property to 84 larger rooms. The calculations reflect the current 1,222 rooms unless otherwise noted. See “Preliminary Renovation Budget” herein. |
| (4) | The Mayo Civic Center, a demand generator for the Rochester Hotel Portfolio properties, was renovated during March 2015 through April 2017, thereby impacting in part the 2016 NOI and TTM NOI. |
| (5) | For a full description of Escrows and Reserves, please refer to “Escrows and Reserves” below. |
| (6) | Based on amortizing payments. Based on the current interest only debt service payments, the Underwritten NCF DSCR is 2.14x. |
THE INFORMATION IN THIS STRUCTURAL AND COLLATERAL TERM SHEET IS NOT COMPLETE AND MAY BE AMENDED PRIOR TO THE TIME OF SALE. THIS TERM SHEET IS NOT AN OFFER TO SELL THESE SECURITIES AND IT IS NOT A SOLICITATION OF AN OFFER TO BUY THESE SECURITIES IN ANY JURISDICTION WHERE THE OFFER OR SALE IS NOT PERMITTED.
| | |
72 of 151
| Structural and Collateral Term Sheet | Benchmark 2018-B2 | |
| Rochester Hotel Portfolio | ||
The Loan.The Rochester Hotel Portfolio loanissecured by a first mortgage lien on the borrowers’ applicable fee interests in a portfolio of four hotel properties totaling 1,222 rooms and physically connected to the Mayo Clinic in downtown Rochester, Minnesota. The loan is part of a whole loan which has an outstanding principal balance as of the Cut-off Date of $140.0 million (the “Rochester Hotel Portfolio Whole Loan”) and is comprised of fivepari passu notes, each as described below. The controlling Note A-1, with an outstanding principal balance as of the Cut-off Date of $60.0 million is being contributed to the Benchmark 2018-B2 Trust. The remaining notes are currently held by the parties described in the “Whole Loan Summary” chart below. The remaining notes are expected to be contributed to one or more future securitization trusts.The relationship between the holders of the Rochester Hotel Portfolio Whole Loan will be governed by a co-lender agreement as described under the “Description of the Mortgage Pool—The Whole Loans—The Serviced Pari Passu Whole Loans” in the Preliminary Prospectus.
The Rochester Hotel Portfolio Whole Loan has a 10-year term and subsequent to a three-year interest only period, will amortize on a 25-year schedule. The most recent prior financing of the Rochester Hotel Portfolio properties was included in the COMM 2013-CCRE6 securitization.
| Whole Loan Summary | |||||
| Note | Original Balance | Cut-off Date Balance | Note Holder | Controlling Piece | |
| A-1 | $60,000,000 | $60,000,000 | Benchmark 2018-B2 | Yes | |
| A-2, A-4-A | $40,000,000 | $40,000,000 | Benchmark 2018-B1 | No | |
| A-3, A-4-B | $40,000,000 | $40,000,000 | DBNY | No | |
| Total | $140,000,000 | $140,000,000 | |||
The Borrowers. The borrowing entities for the Rochester Hotel Portfolio Whole Loan are KAH 20 2nd Avenue LLC, KINN 9 3rd Avenue LLC, RES 441 Center Street LLC and MAR 1st Avenue SW LLC, each a Delaware limited liability company and special purpose entity with two independent directors in its organizational structure.
The borrowers, through their hotel management company (the “Agent”), employ approximately 400 employees who are members of UNITE HERE Local 21, AFL-CIO (the “Union”). The Union filed unfair labor practice charges against the borrowers, two of which have resulted in complaints and hearings before administrative law judges of the National Labor Relations Board (the “NLRB”). The two cases are pending on appeal before the NLRB. See “Description of the Mortgage Pool—Litigation and Other Considerations” in the Preliminary Prospectus.
The Loan Sponsors.The loan sponsors and nonrecourse carve-outguarantors for the Rochester Hotel Portfolio Loan are Javon R. Bea and Vita E. Bea, on a joint and several basis. Javon R. Bea is the president and CEO of Mercy Health, where he started in 1989. Since then Mercy Health has grown to a multi-regional system with five hospitals, over 650 physician partners and over 8,000 employees, 85 primary and specialty care locations, a home health hospice division and a wholly owned and operated insurance company.
In August 2012, the borrower sponsors purchased the Rochester Hotel Portfolio for $210.0 million (approximately $172,000 per room) and have since invested a total of approximately $15.4 million ($12,571 per room). The majority of the capital improvements (approximately $8.1 million) are related to a power plant project, which involved the installation of proprietary central plant equipment to utilize public utilities for electrical service, building heating, building cooling and domestic/process hot water. The project concluded in October 2017 and resulted in cost savings from lower utility costs as the Rochester Hotel Portfolio properties converted to their own central plant equipment and public utilities. The cost savings projected by the borrower sponsors include fixed annual savings of approximately $478,000 that will no longer be required for annual connection and usage fees to Mayo Franklin. Additionally, the borrower sponsors project an additional approximately 20% decrease in utility cost through the use of newly installed energy efficient equipment. The total estimated projected annual savings in 2018 is approximately $792,000.
The borrower sponsors are expected to commence an approximate $18.6 million (approximately $16,578 per room based on the expected 1,122 room count at the end of the renovation) renovation on the Kahler Grand property and Kahler Inn & Suites property. Work on each individual component is expected to commence upon funding of at least 110% of the budgeted amount for such component, except with respect to the room conversion project, which requires funding of 115% of the budgeted amount for such component; provided, the first component is required to commence no later than the 15th month after the Rochester Portfolio Whole Loan closing. The borrower is required to make monthly deposits of $500,000 into the renovation reserve account on each of the first 30 monthly payment dates, which equates to a total of $15,000,000.
THE INFORMATION IN THIS STRUCTURAL AND COLLATERAL TERM SHEET IS NOT COMPLETE AND MAY BE AMENDED PRIOR TO THE TIME OF SALE. THIS TERM SHEET IS NOT AN OFFER TO SELL THESE SECURITIES AND IT IS NOT A SOLICITATION OF AN OFFER TO BUY THESE SECURITIES IN ANY JURISDICTION WHERE THE OFFER OR SALE IS NOT PERMITTED.
| | |
73 of 151
| Structural and Collateral Term Sheet | Benchmark 2018-B2 | |
| Rochester Hotel Portfolio | ||
The renovation is expected to be split into eight components as shown in the below chart:
| Preliminary Renovation Budget(1) | ||||||||
| # | Property | Project | Current Room | Revised Room | Change in Rooms | Required Completion Date | Amount | Amount/ Room |
| 1 | Kahler Grand | Regular Rooms Renovation | 280 | 280 | 0 | 12/2020 | $5,600,000 | $20,000 |
| 2 | Kahler Grand | Bathroom Renovation | 92 | 92 | 0 | 12/2020 | 920,000 | $10,000 |
| 3 | Kahler Grand | Exterior Work & Lobby Upgrades | - | - | - | 12/2020 | 800,000 | - |
| 4 | Kahler Grand | Towers Room Renovation | 44 | 44 | 0 | 12/2020 | 440,000 | $10,000 |
| 5 | Kahler Grand | Extended Stay Room Conversions | 140 | 66 | -74 | 5/2022 | 4,950,000 | $75,000 |
| 6 | Kahler Inn & Suites | Room Renovation | 271 | 271 | 0 | 5/2022 | 2,439,000 | $9,000 |
| 7 | Kahler Grand and Kahler Inn & Suites | Public Space Renovation | - | - | - | 5/2022 | 1,851,000 | - |
| 8 | Kahler Grand | ADA Room Conversions | 44 | 18 | -26 | 5/2022 | 1,620,000 | $90,000 |
| Project Total | $18,620,000 | |||||||
| (1) | Source: Rochester Hotel Portfolio loan agreement. |
The Properties. The Rochester Hotel Portfolio is comprised of four hotels totaling 1,222 rooms located in downtown Rochester, Minnesota, each of which is connected to the Mayo Clinic via climate controlled pedestrian tunnels and is within a three-block radius of each other. The Rochester Hotel Portfolio properties offer various stay options and price points including two full service, one select service and one extended stay offering.
| Portfolio Summary | ||||||||
| Property Name | Rooms(1) | Year Built / Renovated | Property | Cut-off Date Allocated Whole Loan Amount | % of Allocated Whole Loan Amount | Appraised Value(1) | UW NCF | % of |
| Rochester Marriott | 202 | 1989 / 2016 | Full Service | $53,250,000 | 38.0% | $71,000,000 | $5,368,717 | 37.4% |
| Kahler Grand | 660 | 1926-1968 / 2010 | Full Service | 50,500,000 | 36.1% | 83,000,000 | 4,979,928 | 34.7 |
| Kahler Inn & Suites | 271 | 1971, 1979, 1988 / 2010 | Select Service | 21,250,000 | 15.2% | 35,000,000 | 2,565,704 | 17.9 |
| Residence Inn Rochester | 89 | 2004 / 2013 | Extended Stay | 15,000,000 | 10.7% | 21,000,000 | 1,454,513 | 10.1 |
| Total | 1,222 | $140,000,000 | 100.0% | $210,000,000 | $14,368,863 | 100.0% | ||
| (1) | The number of rooms at the Kahler Grand is projected to decrease by 100 by May 2022 following the conversion of 184 small rooms to 84 larger rooms. See “Preliminary Renovation Budget” herein. |
| Historical Occupancy, ADR and RevPAR(1) | ||||||||||||
| Occupancy | ADR | RevPAR | ||||||||||
| Property | 2014 | 2015 | 2016 | TTM(2) | 2014 | 2015 | 2016 | TTM(2) | 2014 | 2015 | 2016 | TTM(2) |
| Rochester Marriott | 68.9% | 67.5% | 66.8% | 71.0% | $227.62 | $231.88 | $229.20 | $241.32 | $156.79 | $156.46 | $153.18 | $171.41 |
| Kahler Grand | 58.7% | 52.8% | 49.8% | 49.4% | $129.07 | $127.58 | $126.51 | $127.51 | $75.75 | $67.40 | $63.01 | $62.94 |
| Kahler Inn & Suites | 70.0% | 69.3% | 62.7% | 65.9% | $121.06 | $124.46 | $125.82 | $122.85 | $84.72 | $86.21 | $78.94 | $80.99 |
| Residence Inn Rochester | 81.1% | 77.2% | 73.0% | 73.6% | $148.96 | $156.74 | $161.41 | $162.35 | $120.84 | $120.99 | $117.78 | $119.49 |
| Weighted Average(3) | 64.5% | 60.7% | 57.2% | 58.4% | $145.03 | $146.25 | $145.87 | $147.83 | $94.42 | $90.20 | $85.44 | $88.99 |
| (1) | Based on operating statements provided by the borrowers. |
| (2) | TTM as of October 31, 2017. |
| (3) | Weighted by room count as of the Cut-off Date. The total number of rooms is projected to decrease by 100 rooms by May 2022 following the conversion of 184 small rooms at the Kahler Grand property to 84 larger rooms. The calculations reflect the current 1,222 rooms unless otherwise noted. See the “Preliminary Renovation Budget” chart herein. |
THE INFORMATION IN THIS STRUCTURAL AND COLLATERAL TERM SHEET IS NOT COMPLETE AND MAY BE AMENDED PRIOR TO THE TIME OF SALE. THIS TERM SHEET IS NOT AN OFFER TO SELL THESE SECURITIES AND IT IS NOT A SOLICITATION OF AN OFFER TO BUY THESE SECURITIES IN ANY JURISDICTION WHERE THE OFFER OR SALE IS NOT PERMITTED.
| | |
74 of 151
| Structural and Collateral Term Sheet | Benchmark 2018-B2 | |
| Rochester Hotel Portfolio | ||
| Historical Occupancy, ADR and RevPAR Penetration Rates(1) | ||||||||||||
| Occupancy | ADR | RevPAR | ||||||||||
| Property | 2014(2) | 2015(3) | 2016(3) | TTM(3)(4) | 2014(2) | 2015(3) | 2016(3) | TTM(3)(4) | 2014(2) | 2015(3) | 2016(3) | TTM(3)(4) |
| Rochester Marriott | 98.2% | 93.7% | 94.3% | 97.7% | 175.6% | 176.7% | 159.9% | 163.8% | 172.5% | 165.6% | 150.7% | 160.1% |
| Kahler Grand | 86.7% | 76.8% | 75.4% | 71.8% | 108.9% | 101.3% | 96.0% | 94.8% | 94.4% | 77.8% | 72.4% | 68.1% |
| Kahler Inn & Suites | 106.2% | 104.9% | 94.1% | 96.3% | 106.6% | 105.7% | 101.5% | 93.4% | 113.2% | 110.8% | 95.5% | 90.0% |
| Residence Inn Rochester | 112.6% | 115.1% | 101.8% | 95.7% | 124.1% | 135.8% | 135.3% | 136.1% | 139.7% | 156.3% | 137.7% | 130.2% |
| Weighted Average(5) | 94.8% | 88.6% | 84.6% | 83.3% | 120.5% | 117.2% | 110.6% | 108.9% | 114.8% | 105.3% | 95.2% | 92.7% |
| (1) | Penetration Rates are from reports provided by a third party data provider. |
| (2) | Based on the 2016 industry market report. |
| (3) | Based on the October 2017 industry market report. TTM as of October 31, 2017. |
| (4) | The October 2017 industry market report identified the following competitive sets for the Rochester Hotel Portfolio: (i) Rochester Marriott property: Holiday Inn Rochester Downtown, Doubletree Rochester Mayo Clinic Area, Hilton Garden Inn Rochester Downtown and Courtyard Rochester Mayo Clinic Area St Marys; (ii) Kahler Grand: Holiday Inn Rochester Downtown, Kahler Apache, Doubletree Rochester Mayo Clinic Arena, Hampton Inn Rochester, Hilton Garden Inn Rochester Downtown and Courtyard Rochester Mayo Clinic Area St Marys; (iii) Kahler Inn & Suites: Holiday Inn Rochester Downtown, Kahler Apache, Doubletree Rochester Mayo Clinic Area, Centerstone Plaza Hotel Soldiers Field Mayo Clinic, Hampton Inn Rochester, Springhill Suites Rochester Mayo Clinic Area St Marys, Hilton Garden Inn Rochester Downtown and Courtyard Rochester Mayo Clinic Area St Marys; (iv) Residence Inn Rochester: Country Inn & Suites Rochester, Springhill Suites Rochester Mayo Clinic Area St Marys, Aspen Suites, Homewood Suites Rochester Mayo Clinic Area Saint Marys, Staybridge Suites Rochester Commerce Drive Northwest and Fairfield Inn & Suites Rochester Mayo Clinic Area St Marys. The sponsor owns the 149-room Kahler Apache hotel which is located approximately 2.0 miles from downtown Rochester and the Rochester Hotel Portfolio and is not considered to be directly competitive with the Kahler hotels due to its distance from the downtown area and subject properties. |
| (5) | Weighted by room count as of the Cut-off Date. The total number of rooms is projected to decrease by 100 rooms by May 2022 following the conversion of 184 small rooms at the Kahler Grand property to 84 larger rooms. The calculations reflect the current 1,222 rooms unless otherwise noted. See the “Preliminary Renovation Budget” chart herein. |
Kahler Grand Property.The 660-room Kahler Grand property(54.0% of portfolio rooms, 34.7% of UW NCF) is an 11-story, full-service hotel that houses approximately 62,200 square feet of retail space within the underground walkway system and first floor. The building, which is connected to a six-level parking garage with 290 parking spaces, was constructed in phases between 1926 and 1968 on a 1.90-acre site. Between 2003 and 2012, prior ownership spent approximately $30.2 million ($45,757 per room) on capital improvements at the Kahler Grand property. Subsequently, the borrower sponsors invested approximately $2.5 million ($3,734 per room) since acquisition in 2012 and are expected to invest an additional approximately $14.3 million ($21,712 per room) on capital improvements at the Kahler Grand property, subject to the loan documents. See the “Preliminary Renovation Budget” chart above.
Amenities at the Kahler Grand property include 19,524 square feet of meeting space, an indoor pool, an indoor whirlpool, two saunas, a fitness center, a lobby workstation and a guest laundry room. The Kahler Grand property features a variety of economy, standard, deluxe, executive and suite-style guestroom configurations. The economy rooms (130 square feet) are also used as student housing for residents at the Mayo Clinic. In-room amenities include flat panel televisions, work desk and chair, coffee maker, hairdryer, iron and ironing board.
The Kahler Grand property is not subject to a franchise agreement. It is operated under the Kahler brand, which is a trademark owned by the borrower which owns the Kahler Grand property.
Rochester Marriott Property. The 202-room Rochester Marriott property(16.5% of portfolio rooms, 37.4% of UW NCF) is a nine-story, full-service hotel that houses approximately 16,351 square feet of retail and office space with 23 tenants within the underground walkway system and first floor. The Rochester Marriott property was developed in 1989 on a 0.85-acre site. Between 2003 and 2012, prior ownership spent approximately $15.3 million ($75,800 per room) on capital improvements. Subsequently, the borrower sponsors invested approximately $3.7 million ($18,334 per room) since acquisition in 2012. The Rochester Marriott property is subject to a franchise agreement with Marriott International, Inc. that expires on November 6, 2030.
Amenities at the Rochester Marriott property include 5,157 square feet of meeting space, an indoor pool, an indoor whirlpool, a fitness center, a market pantry, a coffee station, a lobby workstation, leased retail spaces and vending areas. In-room amenities include flat panel televisions, work desk and chair, coffee maker, hairdryer, iron and ironing board.
A subterranean portion located at the subway level of the Rochester Marriott property (the “Foundation Parcel”) was conveyed to the Mayo Foundation in connection with a vertical subdivision accomplished pursuant to and governed by (i) a declaration of air and subsurface rights (the “Declaration”), (ii) a deed and (iii) a first refusal and option agreement (the “ROFR Agreement”). The Declaration provides that the Mayo Foundation is responsible for 5% of the real estate taxes. The ROFR Agreement contains a number of purchase options and rights of first refusal in favor of the owner of the Rochester Marriott property affecting the Foundation Parcel. See “Description of the Mortgage Pool—Condominium Interests” in the Preliminary Prospectus.
THE INFORMATION IN THIS STRUCTURAL AND COLLATERAL TERM SHEET IS NOT COMPLETE AND MAY BE AMENDED PRIOR TO THE TIME OF SALE. THIS TERM SHEET IS NOT AN OFFER TO SELL THESE SECURITIES AND IT IS NOT A SOLICITATION OF AN OFFER TO BUY THESE SECURITIES IN ANY JURISDICTION WHERE THE OFFER OR SALE IS NOT PERMITTED.
| | |
75 of 151
| Structural and Collateral Term Sheet | Benchmark 2018-B2 | |
| Rochester Hotel Portfolio | ||
Kahler Inn & Suites Property.The 271-room Kahler Inn & Suites property(22.2% of portfolio rooms, 17.9% of UW NCF)is a nine-story, select-service hotel that houses approximately 3,562 square feet of retail space. The Kahler Inn & Suites property was constructed in 1971, and expanded in 1979 and 1988 on a 1.00-acre site. Between 2003 and 2012, prior ownership spent approximately $11.3 million ($41,861 per room). Subsequently, the borrower sponsors invested an additional approximately $727,972 ($2,686 per room) since acquisition in 2012 and are expected to invest an additional approximately $2.4 million ($8,856 per room) on capital improvements at the Kahler Inn & Suites property, subject to the loan documents. See the “Primary Renovation Budget” chart herein.
Amenities at the Kahler Inn & Suites property include a breakfast dining area, a restaurant, an indoor swimming pool and whirlpool, a fitness room, a game room, a gift shop, a guest laundry room and vending areas. The Kahler Inn & Suites property offers 111 parking spaces contained in a two-level parking garage and 37 parking spaces contained in a small surface parking lot across from the hotel. In-room amenities include flat panel televisions, dresser, dining room table, a pull-out sofa bed, hairdryer, iron and ironing board.
The Kahler Inn & Suites property is not subject to a franchise agreement. It is operated under the Kahler brand, which is a trademark owned by the borrower which owns the Kahler Grand property.
Residence Inn Rochester Property.The 89-room Residence Inn Rochester property(7.3% of portfolio rooms, 10.1% of UW NCF) is a seven-story extended stay hotel that was constructed in 2004 on a 0.36 acre site. Between 2003 and 2012, prior ownership spent approximately $12.5 million ($139,952 per room) on capital improvements. Subsequently, the borrower sponsors invested an additional approximately $386,136 ($4,339 per room) since acquisition in 2012. The Residence Inn Rochester property is subject to a franchise agreement with Marriott International, Inc. that expires on October 26, 2024 with one 10-year extension, at the franchisee’s option provided the following conditions are satisfied, (i) the franchisee is not in default, (ii) the franchisee met all monetary obligations during the term, (iii) the franchisee delivers a renewal application not less than 24 months or more than 36 months prior to the end of the current term along with an application fee and (iv) the franchisee signs the franchisor’s then-current form of franchise agreement not less than 12 months prior to the end of the current term, which will require satisfaction of various conditions precedent (including upgrading to then-current standards and specifications of the franchisor).
Amenities at the Residence Inn Rochester property include a fitness room, a guest laundry room and vending areas. The Residence Inn Rochester property offers 63 parking spaces contained in a surface lot and subterranean parking garage.
The Rochester Hotel Portfolio properties are located in downtown Rochester. The Rochester Hotel Portfolio properties are connected to and are located around the Mayo Clinic, which, in addition to being the largest employer in the city of Rochester, provides for the largest lodging demand segmentation in the market. The Mayo Clinic is a medical complex and was ranked number one on the list of “America’s Best Hospitals” by a magazine survey in 2016. The Mayo Clinic is visited by over 1.3 million patients per year according to the appraisal. Its campus has grown significantly over the past several years, and in June 2017, the Mayo Clinic started on a five-year, $217 million expansion that calls for a three-story, 150,000 square foot addition, among other things. Additionally, the Rochester International Airport is located approximately eight miles south of the Rochester Hotel Portfolio properties.
In addition to the Mayo Clinic, the Rochester Hotel Portfolio properties are impacted by the room demand generated from the Mayo Civic Center, the largest event facility in southern Minnesota. The Mayo Civic Center underwent an $84.0 million renovation between March 2015 and April 2017, during which time hotel demand in Rochester was impacted. The Minnesota state legislature funded $35.0 million of the renovation costs, while the city of Rochester raised the remaining funds via a lodging tax. The facility now has over 200,000 square feet of meeting space and has the ability to host two conventions of 1,000 delegates each simultaneously; furthermore, it is expected to boost lodging demand for city hotels, particularly on the weekends, according to the appraisals. Other demand drivers consist of the University of Minnesota Rochester, located two blocks from the Rochester Hotel portfolio and IBM’s Rochester facility with approximately 2,500 employees, making it one of the largest employers in the area.
The appraiser noted that there is one 264-room Hilton under construction, slated for delivery in the second quarter of 2018 and three additional hotels totaling 463 rooms in the speculative stage. The Hilton is expected to be located two blocks from the Kahler Grand and further from the Mayo Clinic but closer to the Mayo Civic Center. According to the appraisals, the proposed Hilton is expected to be 100% competitive with both the Kahler Grand property and the Rochester Marriott property, 60% competitive with the Kahler Inn & Suites property and 50% competitive with the Residence Inn Rochester property. Of the three speculative hotels, only one is expected to be located proximate to the Rochester Hotel Portfolio properties and the center of downtown Rochester.
THE INFORMATION IN THIS STRUCTURAL AND COLLATERAL TERM SHEET IS NOT COMPLETE AND MAY BE AMENDED PRIOR TO THE TIME OF SALE. THIS TERM SHEET IS NOT AN OFFER TO SELL THESE SECURITIES AND IT IS NOT A SOLICITATION OF AN OFFER TO BUY THESE SECURITIES IN ANY JURISDICTION WHERE THE OFFER OR SALE IS NOT PERMITTED.
| | |
76 of 151
| Structural and Collateral Term Sheet | Benchmark 2018-B2 | |
| Rochester Hotel Portfolio | ||
| Operating History and Underwritten Net Cash Flow | ||||||||||||||
| 2014 | 2015 | 2016(1) | TTM(1)(2) | Underwritten | Per Room(3) | % of Total Revenue(4) | ||||||||
| Occupancy | 64.5% | 60.7% | 57.2% | 58.4% | 58.4% | |||||||||
| ADR | $146.36 | $148.67 | $149.43 | $152.43 | $152.43 | |||||||||
| RevPAR | $94.42 | $90.20 | $85.44 | $88.99 | $88.99 | |||||||||
| Room Revenue | $42,114,377 | $40,231,023 | $38,211,016 | $39,693,021 | $39,693,021 | $32,482 | 74.8 | % | ||||||
| Food & Beverage Revenue | 8,727,793 | 8,034,704 | 7,395,970 | 7,773,674 | 7,773,674 | 6,361 | 14.7 | |||||||
| Retail Revenue | 2,528,163 | 2,798,844 | 2,947,073 | 3,069,304 | 2,926,496 | 2,395 | 5.5 | |||||||
| Parking Revenue | 927,011 | 1,444,424 | 1,393,876 | 1,755,474 | 1,755,474 | 1,437 | 3.3 | |||||||
| Other Departmental Revenue | 976,541 | 892,678 | 837,042 | 891,840 | 891,840 | 730 | 1.7 | |||||||
| Total Revenue | $55,273,885 | $53,401,673 | $50,784,977 | $53,183,313 | $53,040,505 | $43,405 | 100.0 | % | ||||||
| Room Expense | $10,065,057 | $9,125,517 | $9,123,975 | $9,911,253 | $9,911,253 | $8,111 | 25.0 | % | ||||||
| Food & Beverage Expense | 7,979,541 | 7,579,839 | 6,919,689 | 7,260,309 | 7,260,309 | 5,941 | 93.4 | |||||||
| Retail Expense | 0 | 0 | 0 | 0 | 0 | 0 | 0.0 | |||||||
| Parking Expense | 337,672 | 306,720 | 319,907 | 351,520 | 351,520 | 288 | 20.0 | |||||||
| Other Departamental Expenses | 350,012 | 315,402 | 239,199 | 234,603 | 234,603 | 192 | 26.3 | |||||||
| Departmental Expenses | $18,732,282 | $17,327,478 | $16,602,770 | $17,757,685 | $17,757,685 | $14,532 | 33.5 | % | ||||||
| Departmental Profit | $36,541,603 | $36,074,195 | $34,182,207 | $35,425,628 | $35,282,820 | $28,873 | 66.5 | % | ||||||
| Management Fees | $1,658,217 | $1,602,050 | $1,523,549 | $1,595,499 | $1,591,215 | $1,302 | 3.0 | |||||||
| Franchise Fees | 1,162,464 | 1,189,398 | 1,138,408 | 1,246,514 | 1,247,991 | 1,021 | 2.4 | |||||||
| Property Taxes | 2,395,606 | 2,567,999 | 2,750,120 | 2,887,825 | 3,071,370 | 2,513 | 5.8 | |||||||
| Property Insurance | 417,393 | 442,202 | 465,701 | 447,866 | 394,878 | 323 | 0.7 | |||||||
| Other Expenses | 12,873,381 | 12,042,119 | 11,702,279 | 12,416,987 | 11,956,478 | 9,784 | 22.5 | |||||||
| Total Expenses | $18,507,061 | $17,843,768 | $17,580,057 | $18,594,691 | $18,261,932 | $14,944 | 34.4 | % | ||||||
| Net Operating Income | $18,034,542 | $18,230,427 | $16,602,150 | $16,830,937 | $17,020,888 | $13,929 | 32.1 | % | ||||||
| FF&E | 2,763,694 | 2,670,084 | 2,539,249 | 2,659,166 | 2,652,025 | 2,170 | 5.0 | |||||||
| Net Cash Flow | $15,270,848 | $15,560,343 | $14,062,901 | $14,171,771 | $14,368,863 | $11,758 | 27.1 | % | ||||||
| (1) | The Mayo Civic Center, a demand generator for the Rochester Hotel Portfolio properties, was renovated during March 2015 through April 2017, thereby impacting in part the 2016 and TTM Net Operating Income. |
| (2) | TTM column represents the trailing 12-month period ending on October 31, 2017. |
| (3) | Per Room values are based on 1,222 guest rooms. The total number of rooms is projected to decrease by 100 rooms by May 2022 following the conversion of 184 small rooms at the Kahler Grand property to 84 larger rooms. See the “Primary Renovation Budget” herein. |
| (4) | % of Total Revenue for Room Expense, Food & Beverage Expense and Other Departmental Expenses are based on their corresponding revenue line items. |
Property Management. The Rochester Hotel Portfolio properties are managed by Richfield Hospitality, Inc., an unaffiliated third party hotel management company. The Rochester Marriott and Residence Inn Rochester are each operated under a franchise agreement.
Escrows and Reserves. At loan origination, the borrowers deposited $496,816 into a tax reserve account, $335,774 into an insurance reserve account, $300,000 into a seasonality reserve and $45,563 (125% of estimated costs) into a required repairs reserve account.
Tax Escrows- On a monthly basis, the borrowers are required to deposit 1/12 of the annual estimated real estate taxes, which is $248,408 initially, into the tax reserve account.
Insurance Escrows - On a monthly basis, the borrowers are required to deposit 1/12 of the annual estimated insurance premiums, which is $33,894 initially, into the insurance premium reserve account.
Seasonality Reserve- On each monthly payment date in June, July, August, September, October, and November, the borrowers are required to deposit $50,000 into a seasonality reserve for potential shortfalls in the payment of the monthly interest payment amount, monthly debt service payment amount, other amounts payable under the loan documents and other operating expenses on each monthly payment date in January, February and March (provided, if no Trigger Period (as defined below) exists, the lender is required to disburse available funds in an amount equal to $100,000 to the borrowers on each such monthly payment date). The seasonality reserve is subject to a cap of $300,000.
THE INFORMATION IN THIS STRUCTURAL AND COLLATERAL TERM SHEET IS NOT COMPLETE AND MAY BE AMENDED PRIOR TO THE TIME OF SALE. THIS TERM SHEET IS NOT AN OFFER TO SELL THESE SECURITIES AND IT IS NOT A SOLICITATION OF AN OFFER TO BUY THESE SECURITIES IN ANY JURISDICTION WHERE THE OFFER OR SALE IS NOT PERMITTED.
| | |
77 of 151
| Structural and Collateral Term Sheet | Benchmark 2018-B2 | |
| Rochester Hotel Portfolio | ||
Renovation Reserves - The borrowers are required to establish an account for renovation reserve escrows (the “Renovation Reserve Account”), and, on each of the first 30 monthly payment dates, deposit $500,000 (the “Renovation Reserve Fixed Payment Amount”) plus the Kahler Renovation FF&E Funds (as defined below). The monthly renovation reserve deposits may be reduced by a proportionate amount if the borrowers deposit an amount in excess of the Renovation Reserve Fixed Payment Amount in a prior month.
FF&E Reserves- On a monthly basis, the borrowers are required to deposit into a furniture, fixtures and equipment (“FF&E”) reserve an amount equal to the greater of (i) 5.0% of individual gross revenues of the prior month for each of the Rochester Hotel Portfolio properties (excluding revenue from the retail leases) as set forth in the most recent approved annual budget, (ii) the then-current amount required by the management agreement for approved capital expenditures and the repair and replacement of the FF&E and (iii) the sum of (a) the then-current amount required by the franchise agreement for approved capital expenditures and the repair and replacement of the FF&E and (b) 5.0% of the individual gross revenues of the prior month (excluding revenue from the retail leases) of each of the Kahler Grand property and the Kahler Inn & Suites property as set forth in the most recent approved annual budget; provided, however through and including the May 2020 payment date (i.e. the first 30 monthly payment dates), FF&E reserve funds for the Kahler Grand property and Kahler Inn & Suites property (“Kahler Renovation FF&E Funds”) are required to instead be deposited into the Renovation Reserve Account.
PIP Reserve -During a Franchise Agreement Sweep Period (as defined below), excess cash flow on deposit in the clearing account is required to be swept on each monthly payment date into a property improvement plan (“PIP”) reserve account until such funds equal to the greater of (i) $1,800,000 (which may be reduced by the lender in its reasonable discretion to 110% of the anticipated costs required to comply with all PIP requirements under any replacement franchise agreement or renewal or extension of any existing franchise agreement, if less than $1,800,000) and (ii) in the lender’s reasonable discretion, 110% of the anticipated costs required to comply with all PIP requirements under any replacement franchise agreement or renewal or extension of any existing franchise agreement.
Lockbox / Cash Management.The Rochester Hotel Portfolio Loan is structured with a hard lockbox and springing cash management. All credit card receipts are required to be deposited directly into a clearing account controlled by the lender and the borrowers and property manager are required to deposit all other rent and payments into the clearing account within one business day of receipt. Unless a Trigger Period is ongoing, all amounts on deposit in the clearing account are required to be swept daily into the borrowers’ operating account. During a Trigger Period, all amounts on deposit in the clearing account are required to be swept daily into a cash management account controlled by the lender and, provided no event of default exists, applied to make required monthly deposits into reserve funds (as described above under “Escrows and Reserves”), to pay monthly debt service and other amounts due under the loan documents, to pay monthly operating expenses set forth in the approved annual budget and extraordinary expenses approved by the lender (if more than 5.0% of the budgeted amount for any individual expenditure or if all such extraordinary expenses are in excess of 2.0% of budgeted operating expenses), and to pay any remainder, (i) if the Trigger Period exists solely due to a Franchise Agreement Sweep Period, into the PIP Reserve until the funds therein equal the required amount (as described below), (ii) if the Trigger Period exists solely due to a Renovation Reserve Sweep Period (as defined below), into the Renovation Reserve Account until the funds therein equal the required amount (as described below), (iii) if both a Franchise Agreement Sweep Period and Renovation Reserve Sweep Period exist, first into the PIP Reserve until the required amount is deposited therein as described below and then into the Renovation Reserve Account until the required amount is deposited therein as described below, (iv) if the Trigger Period is for any other reason, into an account to be held as additional security for the Rochester Hotel Portfolio Loan (or used to fund other reserves if a shortfall exists) during the existence of such Trigger Period and (v) if a Trigger Period no longer exists, to the borrowers.
A “Trigger Period” will commence upon (i) an event of default under the loan documents, (ii) the occurrence of a Low Debt Yield Period (as defined below), (iii) a Franchise Agreement Sweep Period or (iv) a Renovation Reserve Sweep Period and will end (a) with respect to a Trigger Period caused by an event of default, if the lender accepts a cure of such event of default and (b) with respect to a Trigger Period caused by a Low Debt Yield Period, Franchise Agreement Sweep Period or Renovation Reserve Sweep Period, when such period ends in accordance with the definition thereof.
A “Low Debt Yield Period” will occur as of the last day of each calendar quarter if the debt yield for the trailing 12-month period is (i) less than 8.50% on the last day of any calendar quarter any time on or prior to November 2020, (ii) less than 9.00% on the last day of any calendar quarter any time after November 2020 and on or prior to November 2023 or (iii) less than 9.50% on the last day of any calendar quarter any time after November 2023 and prior to loan maturity and will end if the debt yield on the last day of two consecutive calendar quarters is above the applicable low debt yield thresholds described above.
THE INFORMATION IN THIS STRUCTURAL AND COLLATERAL TERM SHEET IS NOT COMPLETE AND MAY BE AMENDED PRIOR TO THE TIME OF SALE. THIS TERM SHEET IS NOT AN OFFER TO SELL THESE SECURITIES AND IT IS NOT A SOLICITATION OF AN OFFER TO BUY THESE SECURITIES IN ANY JURISDICTION WHERE THE OFFER OR SALE IS NOT PERMITTED.
| | |
78 of 151
| Structural and Collateral Term Sheet | Benchmark 2018-B2 | |
| Rochester Hotel Portfolio | ||
A “Franchise Agreement Sweep Period” will commence on the earlier to occur of (i) 24 months prior to the expiration date of the applicable franchise agreement and (ii) any borrower’s written notice to the lender of a borrower’s intent to commence the process of replacing an applicable existing franchise agreement and shall end upon the occurrence of (x) borrowers delivering a replacement franchise agreement or renewal or other extension of an existing franchise agreement and having an initial term (with respect to a replacement franchise agreement) or a remaining term (with respect to an existing franchise agreement, after giving effect to such renewal or extension), in either case, of at least 10 years and (y) the amount in the PIP account equaling 110% of the anticipated costs required to comply with all PIP requirements under any such replacement franchise agreement (or renewal or extension of any existing franchise agreement).
The “Renovation Reserve Sweep Period” will commence at any time that the amount in the Renovation Reserve Account does not equal the sum of 110% (or, with respect to the Kahler Grand property extended stay room renovations and/or Kahler Grand ADA room conversions, 115%), of the total remaining renovation costs set forth in the renovation project budgets for all renovation projects for which work is then being performed, as determined based on lender’s estimate of costs.
Partial Release. Not permitted.
THE INFORMATION IN THIS STRUCTURAL AND COLLATERAL TERM SHEET IS NOT COMPLETE AND MAY BE AMENDED PRIOR TO THE TIME OF SALE. THIS TERM SHEET IS NOT AN OFFER TO SELL THESE SECURITIES AND IT IS NOT A SOLICITATION OF AN OFFER TO BUY THESE SECURITIES IN ANY JURISDICTION WHERE THE OFFER OR SALE IS NOT PERMITTED.
| | |
79 of 151
| Structural and Collateral Term Sheet | Benchmark 2018-B2 |
| InterContinental San Francisco |

THE INFORMATION IN THIS STRUCTURAL AND COLLATERAL TERM SHEET IS NOT COMPLETE AND MAY BE AMENDED PRIOR TO THE TIME OF SALE. THIS TERM SHEET IS NOT AN OFFER TO SELL THESE SECURITIES AND IT IS NOT A SOLICITATION OF AN OFFER TO BUY THESE SECURITIES IN ANY JURISDICTION WHERE THE OFFER OR SALE IS NOT PERMITTED.
| | |
80 of 151
| Structural and Collateral Term Sheet | Benchmark 2018-B2 |
| InterContinental San Francisco |
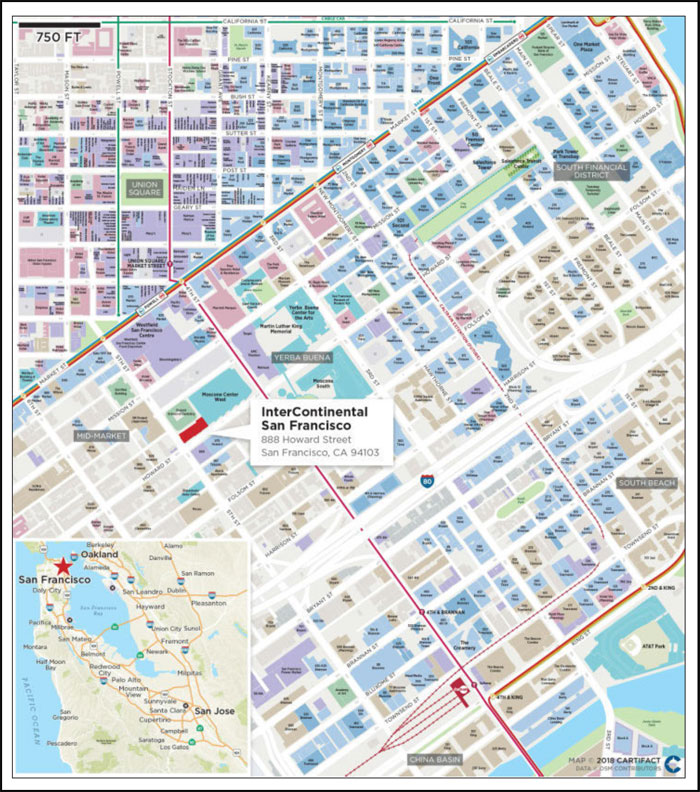
THE INFORMATION IN THIS STRUCTURAL AND COLLATERAL TERM SHEET IS NOT COMPLETE AND MAY BE AMENDED PRIOR TO THE TIME OF SALE. THIS TERM SHEET IS NOT AN OFFER TO SELL THESE SECURITIES AND IT IS NOT A SOLICITATION OF AN OFFER TO BUY THESE SECURITIES IN ANY JURISDICTION WHERE THE OFFER OR SALE IS NOT PERMITTED.
| | |
81 of 151
| Structural and Collateral Term Sheet | Benchmark 2018-B2 |
| InterContinental San Francisco |
| Mortgage Loan Information | Property Information | |||
| Mortgage Loan Seller: | GACC | Single Asset / Portfolio: | Single Asset | |
| Original Principal Balance(1): | $60,000,000 | Title: | Fee | |
| Cut-off Date Principal Balance(1): | $59,922,671 | Property Type - Subtype: | Hotel – Full Service | |
| % of Pool by IPB: | 4.0% | Net Rentable Area (Rooms): | 550 | |
| Loan Purpose: | Refinance | Location: | San Francisco, CA | |
| Borrower: | CDC San Francisco LLC | Year Built / Renovated: | 2008 / 2017-2018 | |
| Sponsor(2): | CDC San Francisco LLC | Occupancy / ADR / RevPAR: | 87.0% / $296.19 / $257.77 | |
| Interest Rate: | 4.14500% | Occupancy / ADR / RevPAR Date: | 10/31/2017 | |
| Note Date: | 12/22/2017 | Number of Tenants: | N/A | |
| Maturity Date: | 1/6/2028 | 2014 NOI: | $17,122,801 | |
| Interest-only Period: | None | 2015 NOI: | $19,851,892 | |
| Original Term: | 120 months | 2016 NOI(3): | $19,929,248 | |
| Original Amortization: | 360 months | TTM NOI (as of 10/2017)(3): | $17,786,292 | |
| Amortization Type: | Balloon | UW Occupancy/ADR/RevPAR: | 87.0% / $296.19 / $257.77 | |
| Call Protection: | L(24),Grtr1%orYM(92),O(4) | UW Revenues: | $73,981,123 | |
| Lockbox / Cash Management: | Springing / Springing | UW Expenses: | $56,353,105 | |
| Additional Debt: | Yes | UW NOI: | $17,628,017 | |
| Additional Debt Balance: | $49,935,559 | UW NCF: | $14,668,773 | |
| Additional Debt Type: | Pari Passu | Appraised Value / Per Room: | $261,900,000 / $476,182 | |
| Appraisal Date: | 7/17/2017 | |||
| Escrows and Reserves(4) | Financial Information(1) | ||||||
| Initial | Monthly | Initial Cap | Cut-off Date Loan / Room: | $199,742 | |||
| Taxes: | $0 | Springing | N/A | Maturity Date Loan / Room: | $159,678 | ||
| Insurance: | $44,350 | Springing | N/A | Cut-off Date LTV: | 41.9% | ||
| FF&E Reserves: | $0 | Springing | N/A | Maturity Date LTV: | 33.5% | ||
| Other: | $10,000,000 | $0 | N/A | UW NCF DSCR: | 2.29x | ||
| UW NOI Debt Yield: | 16.0% | ||||||
| Sources and Uses | ||||||
| Sources | Proceeds | % of Total | Uses | Proceeds | % of Total | |
| Mortgage Loan(1) | $110,000,000 | 100.0% | Payoff Existing Debt | $80,409,449 | 73.1% | |
| Upfront Reserves | 10,044,350 | 9.1 | ||||
| Closing Costs | 1,106,543 | 1.0 | ||||
| Return of Equity | 18,439,658 | 16.8 | ||||
| Total Sources | $110,000,000 | 100.0% | Total Uses | $110,000,000 | 100.0% | |
| (1) | The InterContinental San Francisco loan is part of a whole loan evidenced by fivepari passu notes with an aggregate original principal balance of $110.0 million. The Financial Information presented in the chart above reflects the aggregate Cut-off Date balance of approximately $109.9 million of the InterContinental San Francisco Whole Loan (as defined in “The Loan” below). |
| (2) | There is no nonrecourse carve-out guarantor or environmental indemnitor, other than the borrower, for the InterContinental San Francisco Whole Loan. |
| (3) | During part of 2017, portions of the Moscone Convention Center, a main driver for the InterContinental San Francisco hotel, were closed as part of a renovation and expansion that is estimated to be complete in the fall of 2018. |
| (4) | For a full description of Escrows and Reserves, please refer to “Escrows and Reserves” below. |
THE INFORMATION IN THIS STRUCTURAL AND COLLATERAL TERM SHEET IS NOT COMPLETE AND MAY BE AMENDED PRIOR TO THE TIME OF SALE. THIS TERM SHEET IS NOT AN OFFER TO SELL THESE SECURITIES AND IT IS NOT A SOLICITATION OF AN OFFER TO BUY THESE SECURITIES IN ANY JURISDICTION WHERE THE OFFER OR SALE IS NOT PERMITTED.
| | |
82 of 151
| Structural and Collateral Term Sheet | Benchmark 2018-B2 |
| InterContinental San Francisco |
The Loan.The InterContinental San Francisco loanissecured by a first mortgage lien on the borrower’s fee interest in a full service hotel totaling 550 rooms. The whole loan has an outstanding principal balance as of the Cut-off Date of approximately $109.9 million (the “InterContinental San Francisco Whole Loan”) and is comprised of fivepari passu notes, each as described below. The controlling Note A-1 and the non-controlling Note A-3, with an aggregate outstanding principal balance as of the Cut-off Date of approximately $59.9 million are being contributed to the Benchmark 2018-B2 Trust. The remaining notes are held by the parties described in the “Whole Loan Summary” chart below and are expected to be contributed to one or more future securitization transactions. The relationship between the holders of the InterContinental San Francisco Whole Loan will be governed by a co-lender agreement as described under “Description of the Mortgage Pool—The Whole Loans—The Serviced Pari Passu Whole Loans” in the Preliminary Prospectus. The InterContinental San Francisco Whole Loan has a 10-year term and amortizes on a 30-year schedule.
| Whole Loan Summary | |||||
| Note | Original Balance | Cut-off Date Balance | Note Holder | Controlling Piece | |
| A-1, A-3 | $60,000,000 | $59,922,671 | Benchmark 2018-B2 | Yes | |
| A-2, A-4, A-5 | 50,000,000 | 49,935,559 | DBNY | No | |
| Total | $110,000,000 | $109,858,230 | |||
The Borrower. The borrowing entity for the InterContinental San Francisco loan is CDC San Francisco LLC, a Delaware limited liability company and special purpose entity with two independent directors in its organizational structure.
The Loan Sponsor.The loan sponsor is the borrowing entity, CDC San Francisco LLC. CDC San Francisco LLC is owned by 888 Howard Street Associates, LLC, a California limited liability company and managing member with 83.04% ownership interest, and IHG Management (Maryland), LLC, a Maryland limited liability company (“IHG Management”) with 16.96% ownership interest. IHG Management is the hotel manager for the InterContinental San Francisco property. 888 Howard Street Associates, LLC is ultimately owned by Richard C. Lundquist and Melanie F. Lundquist, as trustees of the Richard and Melanie Lundquist Family Trust. There is no separate nonrecourse carve-out guarantor, and the borrower is the sole party to the environmental indemnity.
Richard C. Lundquist is the owner and president of Continental Development Corporation (”CDC”). CDC is one of California’s largest commercial real estate developers and owners. CDC is privately owned and has over 45 years of real estate development, ownership and management experience. The company is primarily involved in the development of commercial income-producing properties for long-term investment. CDC has developed over 4.0 million square feet of commercial space in Southern and Northern California, comprised of Class-A office, medical/dental, research and development, commercial, retail, restaurant, entertainment and mixed-use properties.
The InterContinental San Francisco property was developed by the borrower in 2008 and an additional approximately $8.9 million ($16,194 per room) in capital expenditures has been invested into the property since 2010, which consisted mostly of operational equipment replacement and infrastructure improvements. In 2018 and 2019, the borrower has indicated it plans to invest an additional approximately $36.7 million ($66,742 per room), which is expected to largely include soft good renovation to the lobby, meeting space and guestrooms. However, this work is not required by the hotel management agreement and is not required or reserved for under the loan documents.
The Property. The InterContinental San Francisco property is a full service hotel located in the South of Market district (“SoMA”) of downtown San Francisco, California. The InterContinental San Francisco property is LEED Gold certified and features 550 guestrooms, including 42 suites. The guestrooms feature floor-to-ceiling windows and typical furnishings include dark wood dressers, a work desk with an ergonomic leather chair, and a 60” LCD HDTV. The hotel offers approximately 43,000 square feet of meeting, banquet and pre-function space, a 150-seat restaurant, lobby bar and lounge, business center, fitness center, gift shop, indoor swimming pool and on-site subterranean parking for 96 cars.
Food and beverage is provided by Luce, a Michelin-starred 150-seat restaurant which can be accessed from both the hotel and Howard Street, and Bar 888, which is located adjacent to Luce and offers beer, wine, spirits, and a light lunch and dinner menu. Luce is open daily serving breakfast, lunch and dinner, as well as 24-hour room service. Luce also offers a special spa menu and has a 15-seat private dining room. Luce has been recognized with a Michelin star since 2010.
Meeting space is located on the third through sixth floors. The largest meeting room, the Grand Ballroom, is located on the third floor and features approximately 6,800 square feet with a 20-foot high ceiling and can seat approximately 540 people banquet-style. The InterContinental Ballroom is located on the fifth floor and features approximately 5,600 square feet and can seat 480 people banquet-style. Both ballrooms benefit from large floor-to-ceiling glass windows which allow for ample natural light. The hotel also features two outdoor meeting spaces on the sixth floor: the Bay Terrace, which is approximately 5,000 square feet, and the Spa Terrace, which is approximately 1,200 square feet. The remaining approximately 24,331 square feet of meeting space is located throughout 25 additional meeting rooms and foyers.
THE INFORMATION IN THIS STRUCTURAL AND COLLATERAL TERM SHEET IS NOT COMPLETE AND MAY BE AMENDED PRIOR TO THE TIME OF SALE. THIS TERM SHEET IS NOT AN OFFER TO SELL THESE SECURITIES AND IT IS NOT A SOLICITATION OF AN OFFER TO BUY THESE SECURITIES IN ANY JURISDICTION WHERE THE OFFER OR SALE IS NOT PERMITTED.
| | |
83 of 151
| Structural and Collateral Term Sheet | Benchmark 2018-B2 |
| InterContinental San Francisco |
The InterContinental San Francisco property is located on the corner of Howard Street and 5th Street, within the SoMA district of downtown San Francisco, California. The neighborhood also includes the Yerba Buena Gardens and the Moscone Convention Center, and numerous museums and galleries, entertainment venues, retail centers, restaurants and hotels. Yerba Buena Gardens encompasses three blocks and is located between 3rd and 4th streets, and Mission and Folsom Streets. The Moscone Convention Center is one of the largest convention and exhibition centers in San Francisco. The facility features over 2.0 million square feet of building area, including over 700,000 square feet of exhibit space, up to 106 meeting rooms and approximately 123,000 square feet of pre-function lobbies. The Moscone Center consists of three main halls that were developed over the last 30 years. Two underground halls were built first, Moscone South, completed in 1981 and Moscone North, completed in 1992. The third hall, Moscone West, was completed in 2003, and is contiguous with the InterContinental San Francisco property. Moscone West is a three story standalone building with 99,616 square feet of dedicated exhibit space on level one, with an additional 199,432 square feet of flexible swing space on levels two and three. The main portion of the Moscone Convention Center is located within one block of the InterContinental San Francisco property and is within walking distance to multiple hotels. The Moscone Convention Center is currently undergoing an approximately $500 million renovation and expansion of Moscone North and Moscone South, which is expected to add more than 500,000 square feet of contiguous exhibition space and improve landscaping. In early September 2017, the second phase of renovations was completed and encompassed approximately 200,000 square feet, including a new ballroom, expansion to exhibition halls, and flexible meeting rooms. The final phase of the renovation project is expected to be completed by late 2018. Based on information provided by the sponsor, as of October 13, 2017, the number of room nights and revenue from the property’s forward guestrooms bookings for 2017 decreased by 7.6% and 6.9%, respectively, from the prior year.
The Bay Area Rapid Transit (“BART”), a high-speed rail commuter transportation system that links 43 stations throughout the Bay Area, has three stops within approximately five blocks of the InterContinental San Francisco hotel. The CalTrain commuter rail service, which provides commuter rail service to Peninsula cities, has a station approximately 0.8 miles to the south of the InterContinental San Francisco hotel. MUNI, which provides light rail and bus service throughout the city, has numerous stops within walking distance to the hotel, including two stops located approximately one block away.
Additionally, the InterContinental San Francisco hotel is located approximately two blocks south of the Westfield San Francisco Centre, approximately four blocks south of Union Square, which includes San Francisco’s Theater District, approximately seven blocks from the Financial District, which includes a large concentration of corporate headquarters, law firms, banks and other financial institutions, approximately six blocks from the Embarcadero bay-waterfront and approximately seven blocks from AT&T Park, home to Major League Baseball’s San Francisco Giants. San Francisco International Airport (“SFO”) is located approximately 13 miles south of the InterContinental San Francisco hotel. SFO is the largest airport in the San Francisco Bay Area and the second busiest in California, after Los Angeles International Airport.
The demand segmentation at the InterContinental San Francisco property consists of 38.0% meeting and group, 32.0% commercial and 30.0% leisure. The primary competitive set for the InterContinental San Francisco property consists of seven full service hotels located in the SoMa, Financial District and Embarcadero neighborhoods, ranging in size from 532 to 1,500 rooms, and containing an aggregate of 5,928 rooms, excluding the InterContinental San Francisco hotel. The appraisal noted several hotels that came online in 2017 or are proposed in the near future within the InterContinental San Francisco property’s general area. The property’s competitive set and historical performance relative to its competitive set are detailed below:
| Historical Occupancy, ADR, RevPAR(1)(2) | |||||||||
| Competitive Set | InterContinental San Francisco(3) | Penetration Factor | |||||||
| Year | Occupancy | ADR | RevPAR | Occupancy | ADR | RevPAR | Occupancy | ADR | RevPAR |
| 2014 | 86.6% | $266.94 | $231.04 | 86.1% | $287.77 | $247.69 | 99.4% | 107.8% | 107.2% |
| 2015 | 86.8% | $280.44 | $243.35 | 87.7% | $299.96 | $263.04 | 101.1% | 107.0% | 108.1% |
| 2016 | 89.3% | $289.61 | $258.66 | 88.3% | $301.07 | $265.85 | 98.9% | 104.0% | 102.8% |
| TTM(4) | 88.9% | $285.10 | $253.39 | 87.0% | $296.19 | $257.77 | 97.9% | 103.9% | 101.7% |
| (1) | The minor variances between the underwriting, appraisal and above table with respect to Occupancy, ADR and RevPAR at the InterContinental San Francisco property are attributable to variances in reporting methodologies and/or timing differences. |
| (2) | Data provided by a third party travel research report. The competitive set contains the following properties: Luxury Collection Palace Hotel San Francisco, Grand Hyatt San Francisco, Hyatt Regency San Francisco, The Park Central San Francisco, Westin St Francis, Marriott San Francisco Marquis and Hotel Nikko San Francisco. |
| (3) | Based on operating statements provided by the borrower. |
| (4) | TTM represents the trailing 12-month period ending on October 31, 2017. |
THE INFORMATION IN THIS STRUCTURAL AND COLLATERAL TERM SHEET IS NOT COMPLETE AND MAY BE AMENDED PRIOR TO THE TIME OF SALE. THIS TERM SHEET IS NOT AN OFFER TO SELL THESE SECURITIES AND IT IS NOT A SOLICITATION OF AN OFFER TO BUY THESE SECURITIES IN ANY JURISDICTION WHERE THE OFFER OR SALE IS NOT PERMITTED.
| | |
84 of 151
| Structural and Collateral Term Sheet | Benchmark 2018-B2 |
| InterContinental San Francisco |
| Competitive Hotels Profile(1) | |||||||||
| 2016 Estimated Market Mix | 2016 Estimated Operating Statistics | ||||||||
| Property | Rooms | Year Opened | Meeting Space (SF) | Commercial | Meeting and Group | Leisure | Occupancy | ADR | RevPAR |
| InterContinental San Francisco(2) | 550 | 2008 | 43,000 | 32% | 38% | 30% | 88.5% | $300.43 | $265.85 |
| Luxury Collection Palace Hotel San Fran | 556 | 1875 | 44,000 | 40% | 25% | 35% | 90.0% | $323.00 | $290.70 |
| Grand Hyatt San Francisco | 660 | 1973 | 27,000 | 40% | 30% | 30% | 89.0% | $292.00 | $259.88 |
| Hyatt Regency San Francisco | 804 | 1973 | 72,000 | 25% | 50% | 25% | 90.0% | $299.00 | $269.10 |
| The Park Central San Francisco | 681 | 1983 | 23,000 | 35% | 30% | 35% | 91.0% | $278.00 | $252.98 |
| Westin St Francis | 1,195 | 1904 | 55,000 | 30% | 35% | 35% | 88.0% | $292.00 | $256.96 |
| Marriott San Francisco Marquis | 1,500 | 1989 | 117,000 | 35% | 35% | 30% | 90.0% | $283.00 | $254.70 |
| Hotel Nikko San Francisco | 532 | 1987 | 18,400 | 30% | 30% | 40% | 88.0% | $275.00 | $242.00 |
| Total(3) | 5,928 | ||||||||
| (1) | Based on the appraisal. |
| (2) | The appraisal only provided 2016 estimated market mix and 2016 estimated operating statistics for the competitive set. The InterContinental San Francisco 2016 Occupancy, ADR and RevPAR are based on operating statements provided by the borrower. |
| (3) | Excludes the InterContinental San Francisco property. |
| Operating History and Underwritten Net Cash Flow | |||||||
| 2014 | 2015 | 2016 | TTM(1) | Underwritten | Per Room(2) | % of Total Revenue(3) | |
| Occupancy | 87.0% | 87.7% | 88.5% | 87.0% | 87.0% | ||
| ADR | $284.77 | $299.96 | $300.43 | $296.19 | $296.19 | ||
| RevPAR | $247.69 | $263.04 | $265.85 | $257.77 | $257.77 | ||
| Room Revenue | $49,724,242 | $52,805,028 | $53,516,126 | $51,746,705 | $51,747,328 | $94,086 | 69.9% |
| Food & Beverage Revenue | 5,666,737 | 6,145,037 | 6,497,649 | 9,659,450 | 9,659,450 | 17,563 | 13.1% |
| Banquet Revenue | 12,962,835 | 13,378,444 | 13,573,907 | 10,419,921 | 10,419,921 | 18,945 | 14.1% |
| Other Departmental Revenue | 2,046,475 | 2,966,552 | 2,380,135 | 2,154,424 | 2,154,424 | 3,917 | 2.9% |
| Total Revenue | $70,400,289 | $75,295,061 | $75,967,817 | $73,980,500 | $73,981,123 | $134,511 | 100.0% |
| Room Expense | $13,929,223 | $14,142,217 | $16,310,916 | $16,456,083 | $16,456,281 | $29,921 | 31.8% |
| Food & Beverage Expense | 7,639,867 | 8,396,889 | 8,918,947 | 10,417,420 | 10,417,420 | 18,941 | 107.8% |
| Banquet Expense | 8,764,230 | 8,464,408 | 8,297,088 | 7,284,142 | 7,284,142 | 13,244 | 69.9% |
| Other Departmental Expenses | 738,307 | 1,308,700 | 1,253,382 | 1,270,640 | 1,270,655 | 2,310 | 59.0% |
| Departmental Expenses | $31,071,627 | $32,312,214 | $34,780,334 | $35,428,285 | $35,428,498 | $64,415 | 47.9% |
| Departmental Profit | $39,328,662 | $42,982,847 | $41,187,483 | $38,552,215 | $38,552,624 | $70,096 | 52.1% |
| Management Fees | $2,618,842 | $2,691,715 | $2,842,092 | $2,781,160 | $2,819,375 | $5,126 | 3.8% |
| Property Taxes | 2,657,877 | 2,672,418 | 3,163,835 | 3,141,522 | 3,138,142 | 5,706 | 4.2% |
| Property Insurance | 1,215,301 | 1,222,610 | 1,123,033 | 1,043,885 | 1,167,567 | 2,123 | 1.6% |
| Other Expenses | 15,713,841 | 16,544,212 | 14,129,276 | 13,799,356 | 13,799,522 | 25,090 | 18.7% |
| Total General/Unallocated Expenses | $22,205,861 | $23,130,955 | $21,258,235 | $20,765,923 | $20,924,607 | $38,045 | 28.3% |
| Net Operating Income(4) | $17,122,801 | $19,851,892 | $19,929,248 | $17,786,292 | $17,628,017 | $32,051 | 23.8% |
| FF&E | 2,741,486 | 2,936,877 | 2,964,790 | 2,882,814 | 2,959,245 | 5,380 | 4.0% |
| Net Cash Flow | $14,381,315 | $16,915,015 | $16,964,458 | $14,903,478 | $14,668,773 | $26,670 | 19.8% |
| (1) | TTM column represents the trailing 12-month period ending on October 31, 2017. |
| (2) | Per Room values are based on 550 guest rooms. |
| (3) | % of Total Revenue for Room Expense, Food & Beverage Expense, Banquet Expense and Other Departmental Expenses are based on their corresponding revenue line items. |
| (4) | During part of 2017, portions of the Moscone Convention Center, a main driver for the InterContinental San Francisco hotel, were closed as part of a renovation and expansion that is estimated to be complete in the fall of 2018. |
THE INFORMATION IN THIS STRUCTURAL AND COLLATERAL TERM SHEET IS NOT COMPLETE AND MAY BE AMENDED PRIOR TO THE TIME OF SALE. THIS TERM SHEET IS NOT AN OFFER TO SELL THESE SECURITIES AND IT IS NOT A SOLICITATION OF AN OFFER TO BUY THESE SECURITIES IN ANY JURISDICTION WHERE THE OFFER OR SALE IS NOT PERMITTED.
| | |
85 of 151
| Structural and Collateral Term Sheet | Benchmark 2018-B2 |
| InterContinental San Francisco |
Property Management. The InterContinental San Francisco property is managed by IHG Management, a borrower affiliate, pursuant to a management agreement expiring February 29, 2028 (the “IHG Management Agreement”).
Escrows and Reserves. At loan origination, the borrower deposited $10,000,000 into a window repair reserve account (see “Window Repairs” below) and $44,350 into a static insurance reserve account.
Tax Escrows– Monthly reserves for real estate taxes are suspended so long as IHG Management, or an unaffiliated replacement manager, is managing the InterContinental San Francisco property and paying taxes directly. If such conditions are no longer satisfied, the borrower will be required to deposit monthly into a tax reserve an amount equal to 1/12 of the estimated annual taxes.
Insurance Escrows– Monthly reserves for insurance are suspended so long as IHG Management is managing the InterContinental San Francisco property and paying insurance directly; provided that if such condition is no longer satisfied or if the borrower or hotel manager fails to make timely payments under its insurance premium finance agreement with respect to any insurance policies, the borrower will be required to deposit monthly into an insurance reserve an amount equal to 1/12 of the estimated annual insurance premiums.
FF&E Reserves– Monthly reserves for furniture, fixtures and equipment (“FF&E”) are suspended so long as IHG Management, or an unaffiliated replacement manager, is managing the InterContinental San Francisco property and reserving for FF&E directly. If such conditions are not satisfied, the borrower will be required to deposit monthly into an FF&E reserve the greatest of (i) 4.0% of the projected rents for the property for the prior month as set forth in the most recent approved annual budget, (ii) the then-current amount required by the property management agreement and (iii) the then-current amount required by any franchise agreement for approved capital expenditures and FF&E (in each case excluding window replacements).
Window Repairs.Soon after the hotel opened in 2008, an issue was noted on some of the insulated glass units comprising the glass exterior or “curtainwall” of the InterContinental San Francisco property, relating to a run down within the air space of the primary gray seal that occurs between the outer and inner panes of glass along the spacer. The sponsor filed a lawsuit against the general contractor, its subcontractors and suppliers in 2016. The lawsuit was settled in 2017 and the sponsor was paid an undisclosed sum of money for the future repair and replacement of the glass exterior, if necessary. Such sum is not included in the collateral.
In connection with origination of the InterContinental San Francisco Whole Loan, a glass curtainwall consulting firm was engaged to review and make recommendations as it relates to the glass curtainwall issues at the property. Following a limited review of the glass installed on the building, the consultant determined that there was no reasonable risk of any glass plate falling from the building as a condition associated with the issues in reference. However, the borrower is required to replace all glass on floors one through six, which is estimated by the consultant to cost approximately $6.9 million.
At loan origination, $10,000,000 was reserved in a lender-controlled reserve account, which represents over 140% of the consultant’s $6.9 million estimated cost to replace the glass exterior on floors one through six. Such replacement is required under the loan documents to be completed on or prior to August 22, 2019. Floors one through five consist mostly of lobby, restaurant and meeting space, and no guestrooms. Floor six mostly includes the spa and fitness center, and only a small number of rooms.
The consultant also recommended the borrower monitor the remaining glass panes at the InterContinental San Francisco property. On or about each of December 6, 2019, June 6, 2022, December 6, 2024 and June 6, 2027, the borrower is required under the loan documents to engage a consulting firm selected by the lender in its reasonable discretion to complete an inspection and issue a report. The borrower will be required to replace any glass identified in the report as needing to be replaced within 120 days after notice of the same from the lender, which may be extended by the lender, in the lender’s reasonable discretion. Failure to complete the glass replacement within the time frame outlined in the loan documents (beyond applicable notice and cure periods), will be an event of default under the InterContinental San FranciscoWholeLoan documents. The consultant estimated the additional cost of replacing the remaining glass panes (i.e. on the floors above the 6th floor), if needed, would be $25,000,000. Such cost has not been escrowed for. See “Description of the Mortgage Pool—Redevelopment, Renovation and Expansion” in the Preliminary Prospectus.
THE INFORMATION IN THIS STRUCTURAL AND COLLATERAL TERM SHEET IS NOT COMPLETE AND MAY BE AMENDED PRIOR TO THE TIME OF SALE. THIS TERM SHEET IS NOT AN OFFER TO SELL THESE SECURITIES AND IT IS NOT A SOLICITATION OF AN OFFER TO BUY THESE SECURITIES IN ANY JURISDICTION WHERE THE OFFER OR SALE IS NOT PERMITTED.
| | |
86 of 151
| Structural and Collateral Term Sheet | Benchmark 2018-B2 |
| InterContinental San Francisco |
Lockbox / Cash Management.The InterContinental San Francisco Whole Loan is structured with a springing lockbox and springing cash management. From and after the first occurrence of a Lockbox Event (as defined below), (i) a clearing account is required to be established, (ii) either (a) if the IHG Management Agreement is in full force and effect and there has not been an IHG Control Event (as defined below), all rents, revenues and receipts payable to the hotel owner under the IHG Management Agreement (which are net of management fees, operating costs and reserves maintained under the IHG Management Agreement) are required to be deposited by IHG Management into the clearing account, or (b) if the IHG Management Agreement is no longer in full force and effect or there has been an IHG Control Event, the borrower is required to direct the credit card processing companies to deposit all credit card receipts directly into the clearing account, and all non-credit card receipts are required to be directly deposited by the hotel manager into the clearing account within two business days of receipt and (iii) either (x) if no Trigger Period exists, all sums on deposit in the clearing account are required to be transferred on a daily basis to an account controlled by the borrower, or (y) if a Trigger Period exists, all sums on deposit in the clearing account are required to be transferred on a daily basis to a cash management account controlled by the lender, to be applied to payment of all monthly amounts due under the loan documents (including, without limitation, any required reserves for taxes and insurance, debt service and operating expenses in accordance with the annual budget (which must be approved by the lender during a Trigger Period) (“Approved Operating Expenses”)), any other required reserves and mezzanine debt service, if a mezzanine loan is outstanding, with any excess funds to be held as additional security for the InterContinental San Francisco Whole Loan during such Trigger Period. However, if an IHG Control Event exists, the funds in the cash management account are required to instead be first applied to pay Approved Operating Expenses to IHG Management, to be disbursed by IHG Management as provided in the IHG Management Agreement, prior to application to debt service or other amounts.
A “Lockbox Event” means either a Trigger Period exists or a mezzanine loan is outstanding.
A “Trigger Period” means a period that commences (i) upon an event of default and continues until a cure of such event of default has been accepted by the lender, (ii) upon the debt yield falling below 9.0% as of the end of any calendar quarter and continues until the debt yield has been at least 9.25% for two consecutive calendar quarters or (iii) if a mezzanine loan is outstanding and there is an event of default thereunder until the lender receives notice from the mezzanine lender that such mezzanine loan event of default has been cured or waived.
An “IHG Control Event” means a transfer that results in IHG Management owning 100% of the direct or indirect ownership interest in the borrower.
Subordinate Indebtedness. None.
Future Mezzanine or Subordinate Indebtedness Permitted. From and after the securitization of the InterContinental San Francisco Whole Loan, the holder of 100% of the direct or indirect ownership interest in the borrower is permitted, one time only during the term of the InterContinental San Francisco Whole Loan, to obtain a mezzanine loan secured by the equity interests in the borrower upon satisfaction of the following conditions, among others: (i) no event of default is continuing; (ii) the mezzanine loan does not exceed $75,000,000; (iii) the combined loan-to-value ratio does not exceed 55.0%; (iv) the combined underwritten net cash flow debt service coverage ratio is not less than 1.50x; (v) the combined underwritten net cash flow debt yield is no less than 10.5%; (vi) the mezzanine loan is co-terminous with the InterContinental San Francisco Whole Loan; (vii) the mezzanine lender enters into an intercreditor agreement in form and substance acceptable to the lender in its reasonable discretion and (viii) the sponsor or a reasonably acceptable guarantor delivers a guaranty of recourse obligations on lender’s then-standard form of guaranty of recourse obligations and an environmental indemnity agreement on the form delivered by borrower in connection with the closing of the InterContinental San Francisco Whole Loan. The mezzanine loan may be made by CDC or an affiliate if in connection with a bona fide arm’s length sale of the property, there has been no change in control of CDC since the loan origination date and rating agency confirmation is obtained.
Additionally, pursuant to a side letter between the borrower and IHG Management, IHG Management is required to, over a two-year period, purchase up to $2,500,000 (the “Aggregate Amount”) worth of certain qualifying personal property to be used for the hotel, which personal property will be owned by IHG Management, but kept at the InterContinental San Francisco property, with a revocable license to the borrower. If the management agreement is terminated, the borrower must pay IHG Management the Aggregate Amount, which amount will be reduced by $250,000 on each anniversary of the date IHG Management first incurs any such expense. At the end of the two-year period, IHG Management may fund any unused portion of the Aggregate Amount into the FF&E reserve held by IHG Management. Pursuant to a subordination, non-disturbance and attornment agreement between IHG Management and the lender, if the lender forecloses on the InterContinental San Francisco property and there is a termination event under the IHG Management Agreement, the lender may, but is not obligated to, purchase such personal property from IHG Management for an amount equal to the amount IHG Management spent on such personal property, as reduced on each anniversary of the first purchase as described above. If the lender chooses not to purchase such personal property, IHG Management will have the right to remove such personal property from the InterContinental San Francisco hotel.
THE INFORMATION IN THIS STRUCTURAL AND COLLATERAL TERM SHEET IS NOT COMPLETE AND MAY BE AMENDED PRIOR TO THE TIME OF SALE. THIS TERM SHEET IS NOT AN OFFER TO SELL THESE SECURITIES AND IT IS NOT A SOLICITATION OF AN OFFER TO BUY THESE SECURITIES IN ANY JURISDICTION WHERE THE OFFER OR SALE IS NOT PERMITTED.
| | |
87 of 151
| Structural and Collateral Term Sheet | Benchmark 2018-B2 | |
| Sentinel Square II | ||
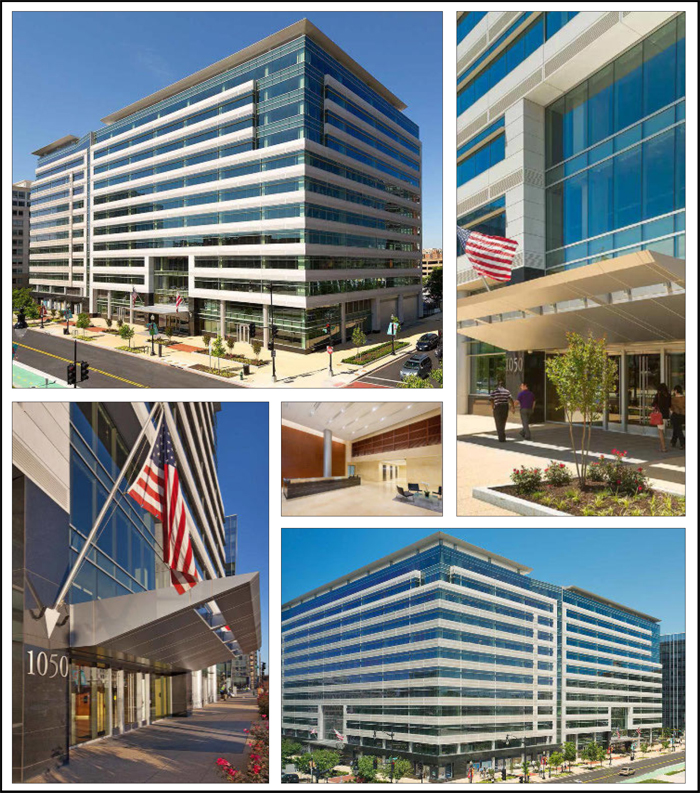
THE INFORMATION IN THIS STRUCTURAL AND COLLATERAL TERM SHEET IS NOT COMPLETE AND MAY BE AMENDED PRIOR TO THE TIME OF SALE. THIS TERM SHEET IS NOT AN OFFER TO SELL THESE SECURITIES AND IT IS NOT A SOLICITATION OF AN OFFER TO BUY THESE SECURITIES IN ANY JURISDICTION WHERE THE OFFER OR SALE IS NOT PERMITTED.
| | |
88 of 151
| Structural and Collateral Term Sheet | Benchmark 2018-B2 | |
| Sentinel Square II | ||
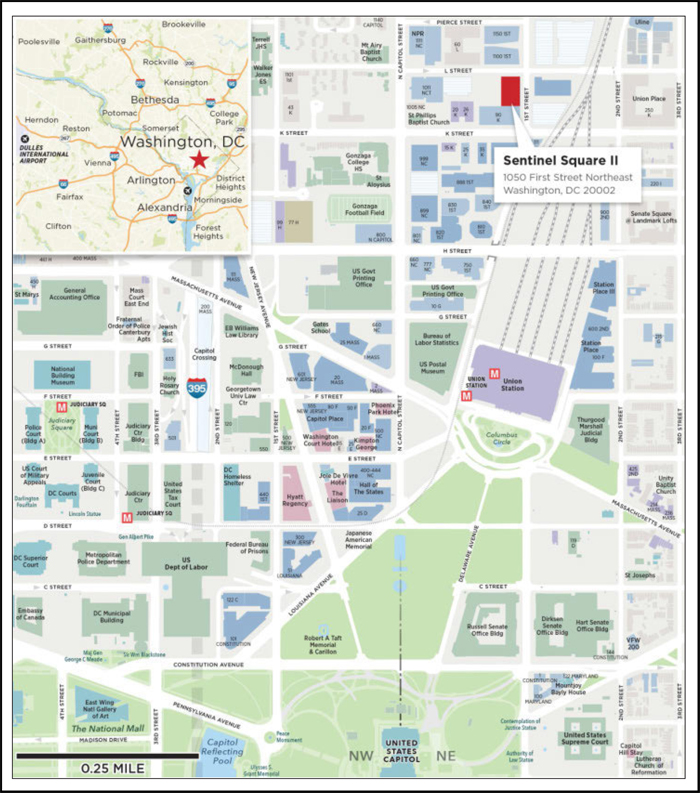
THE INFORMATION IN THIS STRUCTURAL AND COLLATERAL TERM SHEET IS NOT COMPLETE AND MAY BE AMENDED PRIOR TO THE TIME OF SALE. THIS TERM SHEET IS NOT AN OFFER TO SELL THESE SECURITIES AND IT IS NOT A SOLICITATION OF AN OFFER TO BUY THESE SECURITIES IN ANY JURISDICTION WHERE THE OFFER OR SALE IS NOT PERMITTED.
| | |
89 of 151
| Structural and Collateral Term Sheet | Benchmark 2018-B2 | |
| Sentinel Square II | ||
| Mortgage Loan Information | Property Information | |||
| Mortgage Loan Seller: | GACC | Single Asset / Portfolio: | Single Asset | |
| Original Principal Balance(1): | $57,660,000 | Title: | Fee | |
| Cut-off Date Principal Balance(1): | $57,660,000 | Property Type - Subtype: | Office – CBD | |
| % of Pool by IPB: | 3.8% | Net Rentable Area (SF): | 280,363 | |
| Loan Purpose: | Acquisition | Location: | Washington, DC | |
| Borrower: | Sentinel Square Hana OW, LLC | Year Built / Renovated: | 2017 / N/A | |
| Sponsor(2): | Hana Alternative Asset | Occupancy(3): | 94.1% | |
| Management Co., Ltd. | Occupancy Date: | 12/31/2017 | ||
| Interest Rate: | 3.24200% | Number of Tenants: | 2 | |
| Note Date: | 12/29/2017 | 2014 NOI(4): | N/A | |
| Maturity Date: | 1/6/2023 | 2015 NOI(4): | N/A | |
| Interest-only Period: | 60 months | 2016 NOI(4): | N/A | |
| Original Term: | 60 months | TTM NOI(4): | N/A | |
| Original Amortization: | None | UW Economic Occupancy: | 94.3% | |
| Amortization Type: | Interest Only | UW Revenues: | $13,947,826 | |
| Call Protection: | L(25),Def(31),O(4) | UW Expenses: | $4,756,435 | |
| Lockbox / Cash Management: | Hard / In Place | UW NOI: | $9,191,391 | |
| Additional Debt: | Yes | UW NCF: | $9,121,300 | |
| Additional Debt Balance(1): | $45,000,000 | Appraised Value / Per SF(5): | $172,000,000 / $613 | |
| Additional Debt Type(1): | Pari Passu | Appraisal Date(5): | 4/1/2019 | |
| Escrows and Reserves(6) | Financial Information(1) | ||||||||
| Initial | Monthly | Initial Cap | Cut-off Date Loan / SF: | $366 | |||||
| Taxes: | $0 | Springing | N/A | Maturity Date Loan / SF: | $366 | ||||
| Insurance: | $0 | Springing | N/A | Cut-off Date LTV: | 59.7% | ||||
| Replacement: | $0 | Springing | N/A | Maturity Date LTV: | 59.7% | ||||
| TI/LC: | $0 | Springing | N/A | UW NCF DSCR: | 2.70x | ||||
Other: | $19,093,311 | $0 | N/A | UW NOI Debt Yield: | 9.0% | ||||
| Sources and Uses | ||||||
| Sources | Proceeds | % of Total | Uses | Proceeds | % of Total | |
| Mortgage Loan | $102,660,000 | 55.5% | Purchase Price | $147,012,388 | 79.4% | |
| Borrower Sponsor Equity | 82,475,831 | 44.5 | Upfront Reserves | 19,093,311 | 10.3 | |
| Closing Costs(7) | 19,030,132 | 10.3 | ||||
| Total Sources | $185,135,831 | 100.0% | Total Uses | $185,135,831 | 100.0% | |
| (1) | The Sentinel Square II loan is part of a whole loan evidenced by two pari passu notes with an aggregate original principal balance of $102.66 million. The Financial Information presented in the chart above reflects the Cut-off Date balance of the $102.66 million Sentinel Square II Whole Loan, as defined below. |
| (2) | There is no recourse carve-out guarantor or environmental indemnitor, other than the borrower, for the Sentinel Square II Whole Loan. |
| (3) | Occupancy includes the Federal Election Commission (35.6% of NRA), which has yet to take occupancy and is anticipated to take occupancy in or around the end of March 2018. |
| (4) | The Sentinel Square II property was built in 2017. As such, historical occupancy and historical NOI are not available. |
| (5) | Represents the appraiser’s “as-stabilized” appraised value which assumes that the borrower’s contractual tenant improvement and leasing commission obligations have been fulfilled, that there is no outstanding free rent and that rent has commenced. At closing, the borrower reserved approximately $18.5 million in free rent associated with the District of Columbia and Federal Election Commission leases and $600,000 related to approved leasing expenses under the Federal Election Commission lease. The “as-is” appraised value is $149.3 million, which represents a Cut-off Date LTV and Maturity Date LTV of 68.8% and 68.8%, respectively. |
| (6) | For a full description of Escrows and Reserves, please refer to“Escrows and Reserves”below. |
| (7) | Closing costs include a $14.0 million repayment of an unsecured loan from Korea Investment and Securities for the initial deposit and working capital. |
THE INFORMATION IN THIS STRUCTURAL AND COLLATERAL TERM SHEET IS NOT COMPLETE AND MAY BE AMENDED PRIOR TO THE TIME OF SALE. THIS TERM SHEET IS NOT AN OFFER TO SELL THESE SECURITIES AND IT IS NOT A SOLICITATION OF AN OFFER TO BUY THESE SECURITIES IN ANY JURISDICTION WHERE THE OFFER OR SALE IS NOT PERMITTED.
| | |
90 of 151
| Structural and Collateral Term Sheet | Benchmark 2018-B2 | |
| Sentinel Square II | ||
The Loan.The Sentinel Square II loan is secured by a first mortgage lien on the borrower’s fee interest in a 280,363 square foot, newly-constructed Class A office building located in Washington, District of Columbia. The loan is part of a whole loan which has an outstanding principal balance as of the Cut-off Date of $102.66 million (the “Sentinel Square II Whole Loan”), and is comprised of twopari passu notes, each as described below. The controlling Note A-1, with an outstanding principal balance as of the Cut-off Date of $57.66 million is being contributed to the Benchmark 2018-B2 Trust. The non-controlling Note A-2, with an outstanding principal balance as of the Cut-off Date of $45.0 million, was contributed to the Benchmark 2018-B1 Trust. The relationship between the holders of the Sentinel Square II Whole Loan will be governed by a co-lender agreement as described under“Description of the Mortgage Pool—The Whole Loans—The Serviced Pari Passu Whole Loans” in the Preliminary Prospectus. The Sentinel Square II Whole Loan has a five-year term and is interest only for the term of the loan.
| Whole Loan Summary | |||||
| Note | Original Balance | Cut-off Date Balance | Note Holder | Controlling Piece | |
| A-1 | $57,660,000 | $57,660,000 | Benchmark 2018-B2 | Yes | |
| A-2 | $45,000,000 | $45,000,000 | Benchmark 2018-B1 | No | |
| Total | $102,660,000 | $102,660,000 | |||
The Borrower. The borrowing entity for the Sentinel Square II Whole Loan is Sentinel Square Hana OW, LLC, a Delaware limited liability company and single purpose entity with two independent directors.
The Loan Sponsor.The loan sponsor of the Sentinel Square II loan is Hana Alternative Asset Management Co., Ltd. There is no non-recourse carveout guarantor and no environmental indemnitor, other than the borrower. The loan sponsor acts as asset manager on behalf of certain Korean institutional investors and, as such, controls the borrower, but has no direct or indirect ownership interest in the borrower.
Based in Seoul, Republic of Korea, the borrower sponsor is a private subsidiary of Hana Financial Group, Inc. The firm specializes in real estate investments, including direct investments in domestic and offshore real estate, plus asset and real estate backed securities. In 2013, the company also expanded to incorporate special asset fund management. Hana Asset Management has closed and currently manages over 30 projects in 15 countries.
Hana Financial Group, Inc. (“Hana”) was established in 1971 as Korea Investment & Finance and was converted to a holding company in 2005. Hana is one of the largest bank holding companies in the Republic of Korea and is publicly traded on the Korean Stock Exchange. Hana is headquartered in Seoul, Republic of Korea and has over 20,000 employees and over 100 offices in 24 countries.
The borrower sponsor is being advised by Ocean West Capital Partners (“Ocean West”), which will serve as the asset and property manager for the Sentinel Square II property. Based in Los Angeles, Ocean West is a full-service real estate investment, operations and management platform. Ocean West’s principals have over 100 years of combined experience. Ocean West has acquired and operated office and multifamily residential investments, including the NASA Headquarters in Washington, District of Columbia. Furthermore, Ocean West has managed over 55 million square feet of commercial real estate.
The Property.The Sentinel Square II property is a newly-constructed 12-story building totaling 280,363 square feet of Class A office space in Washington, District of Columbia (“Washington DC”). Built in 2017, Sentinel Square II is part of the larger Sentinel Square project, which is expected to consist of a three-building, 1.2 million square foot Class A office development located in the north of Massachusetts Avenue (“NoMa”) submarket of downtown Washington, DC. The 12-story, 412,661 square foot Sentinel Square I was delivered in 2010 and is currently 98.7% occupied, according to the appraisal. The final phase, Sentinel Square III, is expected to be completed in November 2019.
As of December 31, 2017, the Sentinel Square II property is leased to two government tenants with a 12.6-year weighted average lease term remaining. The Sentinel Square II property was specifically designed to meet the government’s advanced security and force protection needs while still integrating the type of finishes typically used in Class A office buildings.
THE INFORMATION IN THIS STRUCTURAL AND COLLATERAL TERM SHEET IS NOT COMPLETE AND MAY BE AMENDED PRIOR TO THE TIME OF SALE. THIS TERM SHEET IS NOT AN OFFER TO SELL THESE SECURITIES AND IT IS NOT A SOLICITATION OF AN OFFER TO BUY THESE SECURITIES IN ANY JURISDICTION WHERE THE OFFER OR SALE IS NOT PERMITTED.
| | |
91 of 151
| Structural and Collateral Term Sheet | Benchmark 2018-B2 | |
| Sentinel Square II | ||
The largest tenant, District of Columbia (rated AA/Aa1/AA by Fitch/Moody’s/S&P) leases 164,110 square feet (58.5% of NRA) and accounts for 62.6% of U/W Base Rent. The District of Columbia space is currently occupied by two separate entities, the Office of the State Superintendent of Education (the “OSSE”) and the Department of Insurance, Securities and Banking (the “DISB”). The OSSE is the state education agency for Washington DC. OSSE serves as the District of Columbia’s liaison to the U.S. Department of Education and works with the District of Columbia’s traditional and public charter schools to achieve its key functions, which include overseeing all federal education programs and related grants administered in Washington DC, developing state-level standards and ensuring access to child care and pre-kindergarten for eligible Washington DC families, among other objectives. The DISB regulates financial-service businesses in Washington DC by administering DC’s insurance, securities and banking laws, rules and regulations. In addition, DISB enforces relevant consumer protection laws. The District of Columbia lease expires in February 2029 and the tenant has one, five-year renewal option. The District of Columbia has the right to terminate its lease if sufficient funds are not appropriated to cover the cost of fixed and additional rent. The District of Columbia is in a free rent period through February 2019, all of which free rent has been reserved for.
The second largest tenant, Federal Election Commission (rated AAA/Aaa/AA+ by Fitch/Moody’s/S&P), leases 99,677 square feet (35.6% of NRA) and accounts for 37.4% of the U/W Base Rent. The FEC is an independent regulatory agency charged with administering and enforcing the federal campaign finance laws. The FEC has jurisdiction over the financing of campaigns for the U.S. House of Representatives, Senate, Presidency and the Vice Presidency. Established in 1975, the FEC is composed of six commissioners who are appointed by the President and confirmed by the Senate. By law, no more than three can represent the same political party. In 2016, the FEC announced its plan to relocate its headquarters to the Sentinel Square II property after occupying its current East End location since 1985. The FEC lease expires in November 2032 and the tenant does not have any renewal options. The FEC is not yet in occupancy of its space, and is anticipated to take occupancy in or around the end of March 2018. The FEC is in a free rent period through January 2020, all of which free rent has been reserved for. In addition, the FEC is entitled to a $600,000 allowance that may be used for improvements through September 1, 2018, and thereafter any remainder may be treated as additional free rent funds and disbursed in accordance with the standard free rent reserve provisions under the loan agreement.
The Sentinel Square II property shares a courtyard and landscaping, including granite tree planters, flower beds, decorative metal railings and an irrigation system with the larger Sentinel Square development. The Sentinel Square II property has a LEED Silver certification and features the General Services Administration (“GSA”) advanced security measures for force-protection with blast-resistant glass, progressive-collapse avoidance, and space for various secure access control measures. The two-story lobby includes Jerusalem Gold marble and louvered millwork and the building features 30’ by 30’ column spacing.
The Sentinel Square II property is located in Washington, DC, just west of the Amtrak train tracks and within the NoMa submarket. The Sentinel Square II property is within walking distance to a number of amenities including Union Station, a mixed-use, intermodal transportation and shopping center that caters to over 32 million commuters annually and provides access to the Metrorail (Red Line), MARC, VRE, Amtrak, Acela, Metrobus and Circulator bus service. Sentinel Square II is also within a one-mile radius of the H Street Corridor, which is known for its nightlife, restaurants, pop-ups, festivals and communal atmosphere as well as more than 65,000 square feet of planned retail space at Storey Park located across the street from the Sentinel Square II property. Additionally, the Sentinel Square II property benefits from its location near the United States (“U.S.”) Capitol, Securities and Exchange Commission (“SEC”) headquarters, Department of Justice, Department of Education and numerous other federal agencies.
As of the third quarter of 2017 the NoMA office submarket consisted of approximately 11.0 million square feet of office space with an overall vacancy rate of approximately 12.2%. The appraisal identified six properties as directly competitive with the Sentinel Square II property with a weighted average vacancy of approximately 3.1%.
The appraisal identified six comparable office leases in the NoMA office submarket ranging in size from approximately 25,000 square feet to 493,620 square feet. Gross rents for the comparable leases ranged from $42.00 per square foot to $57.00 per square foot. The appraiser’s concluded gross market rent for office space is $50.00 per square foot, which is in-line with the underwritten base rent of $48.17 per square foot for the office tenants at the Sentinel Square II property.
| Historical and Current Occupancy(1) | |||
| 2014 | 2015 | 2016 | Current(2) |
| N/A | N/A | N/A | 94.1% |
| (1) | The Sentinel Square II property was built in 2017. As such, historical occupancy is not available. |
| (2) | Current Occupancy is as of December 31, 2017. |
THE INFORMATION IN THIS STRUCTURAL AND COLLATERAL TERM SHEET IS NOT COMPLETE AND MAY BE AMENDED PRIOR TO THE TIME OF SALE. THIS TERM SHEET IS NOT AN OFFER TO SELL THESE SECURITIES AND IT IS NOT A SOLICITATION OF AN OFFER TO BUY THESE SECURITIES IN ANY JURISDICTION WHERE THE OFFER OR SALE IS NOT PERMITTED.
| | |
92 of 151
| Structural and Collateral Term Sheet | Benchmark 2018-B2 | |
| Sentinel Square II | ||
The following table presents certain information relating to recent office leasing activity for the Sentinel Square II property’s office market:
| Competitive Property Summary(1) | ||||||
| Property Name/Address | Distance (miles) | Tenant Name | Lease Size (SF) | Lease Date | Lease Term (Yrs.) | Initial Rent Per Square Foot |
| Sentinel Square II(2) | Various | 263,787 | Various-17 | 12.7 | $48.17 | |
| Alexander Court North Building | 2.4 west | Akin Gump, LLC. | 220,000 | Nov-16 | 15.0 | $57.00 |
| 600 Massachusetts Ave Northwest | 0.9 west | Barbour, Griffith and Rogers, Inc. | 25,000 | Oct-16 | 14.0 | $55.00 |
| International Trade Commission Building | 1.8 southwest | GSA | 206,035 | Oct-16 | 15.8 | $42.00 |
| 1101 New York Ave Northwest | 1.3 west | Bloomberg | 45,930 | Jun-16 | 10.7 | $57.00 |
| 601 Massachusetts Ave Northwest | 0.9 west | Brunswick Group | 25,000 | Mar-16 | 14.0 | $54.00 |
| Three and Four Constitution Square | 0.2 north | U.S. Dept. of Justice | 493,620 | Oct-15 | 15.0 | $49.00 |
| (1) | Source: Appraisal |
| (2) | Based on the underwritten rent roll dated December 31, 2017 and only reflectsoccupied space. |
The following table represents the comparable sales identified in the appraisal.
| Competitive Property Summary(1) | ||||
Tenant | Distance (miles) | Net Rentable Area (SF) | Sale Date | Sale Price |
| Sentinel Square II | N/A | 280,363 | $172,000,000(2) | |
| International Trade Commission Building | 1.7 Southwest | 262,959 | Aug-17 | $145,000,000 |
| Two Independence Square | 2.1 West | 605,897 | Jul-17 | $359,600,000 |
| 1875 K Street Northwest | 0.6 South | 190,000 | Jan-17 | $151,404,869 |
| McDermott Building | 0.2 Northeast | 231,341 | Oct-16 | $160,800,000 |
| Three and Four Constitution Square | Across the street | 842,464 | Sep-16 | $495,329,462 |
| 1100 1st Street, Northeast | 1.8 Southwest | 348,967 | Aug-16 | $217,500,000 |
| (1) | Source: Appraisal. |
| (2) | Based on the “as stabilized” appraised value. The actual sale price for the acquisition of the Sentinel Square II property was $147,012,388 or $524.36 per square foot. See the “Sources and Uses” table above. |
| Tenant Summary(1) | ||||||||
| Tenant | Ratings(2) Moody’s/S&P/Fitch | Net Rentable Area (SF) | % of Total NRA | Base Rent PSF | % of Total Base Rent | Lease Expiration Date | ||
| District of Columbia(3) | AA/Aa1/AA | 164,110 | 58.5% | $48.85 | 63.1% | 2/28/2029 | ||
| Federal Election Commission | Aaa/AA+/AAA | 99,677 | 35.6% | $47.06 | 36.9% | 11/30/2032 | ||
| (1) | Based on the underwritten rent roll as of December 31, 2017. |
| (2) | Certain ratings are those of the District of Columbia government or United States Government whether or not such government entity guarantees the lease. |
| (3) | The District of Columbia has the right to terminate its lease if sufficient funds are not appropriated to cover the cost of fixed and additional rent. |
THE INFORMATION IN THIS STRUCTURAL AND COLLATERAL TERM SHEET IS NOT COMPLETE AND MAY BE AMENDED PRIOR TO THE TIME OF SALE. THIS TERM SHEET IS NOT AN OFFER TO SELL THESE SECURITIES AND IT IS NOT A SOLICITATION OF AN OFFER TO BUY THESE SECURITIES IN ANY JURISDICTION WHERE THE OFFER OR SALE IS NOT PERMITTED.
| | |
93 of 151
| Structural and Collateral Term Sheet | Benchmark 2018-B2 | |
| Sentinel Square II | ||
Lease Rollover Schedule(1)(2) | |||||||||
| Year | Number of Leases Expiring | Net Rentable Area Expiring | % of NRA Expiring | Base Rent Expiring | % of Base Rent Expiring | Cumulative Net Rentable Area Expiring | Cumulative % of NRA Expiring | Cumulative Base Rent Expiring | Cumulative % of Base Rent Expiring |
| Vacant | NAP | 16,576 | 5.9% | NAP | NAP | 16,576 | 5.9% | NAP | NAP |
| 2018 & MTM | 0 | 0 | 0.0 | 0 | 0.0% | 16,576 | 5.9% | $0.00 | 0.0% |
| 2019 | 0 | 0 | 0.0 | 0 | 0.0 | 16,576 | 5.9% | $0.00 | 0.0% |
| 2020 | 0 | 0 | 0.0 | 0 | 0.0 | 16,576 | 5.9% | $0.00 | 0.0% |
| 2021 | 0 | 0 | 0.0 | 0 | 0.0 | 16,576 | 5.9% | $0.00 | 0.0% |
| 2022 | 0 | 0 | 0.0 | 0 | 0.0 | 16,576 | 5.9% | $0.00 | 0.0% |
| 2023 | 0 | 0 | 0.0 | 0 | 0.0 | 16,576 | 5.9% | $0.00 | 0.0% |
| 2024 | 0 | 0 | 0.0 | 0 | 0.0 | 16,576 | 5.9% | $0.00 | 0.0% |
| 2025 | 0 | 0 | 0.0 | 0 | 0.0 | 16,576 | 5.9% | $0.00 | 0.0% |
| 2026 | 0 | 0 | 0.0 | 0 | 0.0 | 16,576 | 5.9% | $0.00 | 0.0% |
| 2027 | 0 | 0 | 0.0 | 0 | 0.0 | 16,576 | 5.9% | $0.00 | 0.0% |
| 2028 | 0 | 0 | 0.0 | 0 | 0.0 | 16,576 | 5.9% | $0.00 | 0.0% |
| 2029 & Beyond | 2 | 263,787 | 94.1 | 12,707,466 | 100.0 | 280,363 | 100.0% | $12,707,466 | 100.0% |
| Total | 2 | 280,363 | 100.0% | $12,707,466 | 100.0% | ||||
| (1) | Based on the underwritten rent roll dated December 31, 2017. |
| (2) | Certain tenants may have termination or contraction options (which may become exercisable prior to the originally stated expiration date of the tenant lease) that are not considered in the above Lease Rollover Schedule. |
| Operating History and Underwritten Net Cash Flow(1) | |||
| Underwritten | Per Square Foot | %(2) | |
| Rents in Place(3) | $12,707,466 | $45.33 | 90.7% |
| Vacant Income | 849,027 | 3.03 | 6.1% |
| Step Rents(4) | 260,607 | 0.93 | 1.9% |
| Gross Potential Rent | $13,817,100 | $49.28 | 98.7% |
| Total Reimbursements | 185,926 | 0.66 | 1.3% |
| Net Rental Income | $14,003,026 | $49.95 | 100.0% |
| Other Income | 793,827 | 2.83 | 5.7% |
| (Vacancy/Credit Loss) | (849,027) | (3.03) | (6.1%) |
| Effective Gross Income | $13,947,826 | $49.75 | 99.6% |
| Total Expenses | 4,756,435 | 16.97 | 34.0% |
| Net Operating Income | $9,191,391 | $32.78 | 65.6% |
| Total TI/LC, Capex/RR | 70,091 | 0.25 | 0.5% |
| Net Cash Flow | $9,121,300 | $32.53 | 65.1% |
| (1) | The Sentinel Square II property was built in 2017. As such, historical operating statements are not available. |
| (2) | % column represents percent of Net Rental Income for all revenue lines and represents percent of Effective Gross Income for the remainder of the fields. |
| (3) | Based on the underwritten rent roll dated December 31, 2017. |
| (4) | Step Rents are the straight line average of contractual rent steps through lease expiration for the District of Columbia. |
Property Management. The Sentinel Square II property is managed by OW Management Services, Inc., a third party management company.
THE INFORMATION IN THIS STRUCTURAL AND COLLATERAL TERM SHEET IS NOT COMPLETE AND MAY BE AMENDED PRIOR TO THE TIME OF SALE. THIS TERM SHEET IS NOT AN OFFER TO SELL THESE SECURITIES AND IT IS NOT A SOLICITATION OF AN OFFER TO BUY THESE SECURITIES IN ANY JURISDICTION WHERE THE OFFER OR SALE IS NOT PERMITTED.
| | |
94 of 151
| Structural and Collateral Term Sheet | Benchmark 2018-B2 | |
| Sentinel Square II | ||
Escrows and Reserves. At loan origination, the borrower deposited (i) $18,493,311 into a free rent reserve account and (ii) $600,000 into a GSA funds reserve account. The GSA funds are reserved for the payment of an additional cash allowance to the FEC that can be used for additional post-occupancy improvements through September 1, 2018, after which time any remaining balance may be treated as free rent funds and disbursed in accordance with the standard free rent reserve provisions.
At closing, Sentinel Square II, L.L.C. (the “Seller”) deposited $6,709,145 (the “Escrow Funds”) into escrow with Commonwealth Title of Dallas (the “Escrow Agent”) pursuant to an escrow agreement by and among the Escrow Agent, the Seller and the borrower (the “Escrow Agreement”), which provides that the Escrow Funds may be disbursed from escrow to pay for: (i) the cost of certain tenant improvement work at the Sentinel Square II property that has been completed but not yet invoiced or paid for, (ii) the amount due and owing to the Seller’s construction manager for construction management fees, (iii) the cost of the remaining punch list items (as of the closing) that are required to be completed by the landlord pursuant to the terms of the District of Columbia lease and (iv) the amount needed to pay for all costs and expenses the Seller may incur in order to induce the District of Columbia to deliver a declaration of delivery for the second phase as required pursuant to the District of Columbia lease, including, without limitation, the cost of any additional post-closing work identified in the declaration of delivery for the second phase. The lender is a third-party beneficiary of the Escrow Agreement and both the Escrow Agent and the Seller agree that (a) no notice sent to the borrower under the Escrow Agreement will be effective unless a copy is delivered to the lender and (b) the Escrow Agreement cannot be modified without the lender’s prior written consent. Additionally, the borrower represents in the loan agreement that, to its knowledge, no other outstanding costs or expenses are due and owing with respect to the Sentinel Square II property (other than the aforementioned costs in clauses (i)-(iii)). Because such funds are not held under the loan agreement (all funds were provided by the Seller and there is no provision under the Escrow Agreement for any such funds to be disbursed to the borrower), the lender does not have the same rights or control with respect to such funds that it would have if such funds were loan reserves. In particular, such funds may be used only for the purposes specified in the Escrow Agreement, and may not be applied to repay the Sentinel Square II Loan upon an event of default.
Tax Escrows- On each monthly payment date during a Trigger Period (as described below), the borrower is required to deposit a monthly amount that the lender estimates will be payable during the then-current tax period, in order to accumulate sufficient funds to pay all such real estate taxes at least 30 days prior to their respective due dates.
Insurance Escrows - If an acceptable blanket insurance policy is no longer in place and a Trigger Period has occurred and is continuing, the borrower is required to deposit on each monthly payment date a monthly amount that the lender estimates will be payable to pay all such insurance premiums at least 30 days prior to the expiration of the insurance policies.
Replacement Reserves - On each monthly payment date during a Trigger Period, the borrower is required to deposit $3,505 for capital expenditures.
TI/LC Reserves - On each monthly payment date during a Trigger Period, the borrower is required to deposit $35,045 for tenant improvements and leasing commissions.
Lease Sweep Reserve - On each monthly payment date during a Lease Sweep Period (as defined below), the borrower is required to deposit all excess cash into the Lease Sweep Reserve.
A “Trigger Period” will commence upon the occurrence of (i) an event of default, (ii) a Low Debt Service Period (as defined below) or (iii) a Lease Sweep Period and will end upon (a) with respect to clause (i), the date on which such event of default is cured and such cure has been accepted by the lender, (b) with respect to clause (ii), the date on which such Low Debt Service Period has ended and (c) with respect to clause (iii) the date on which such Lease Sweep Period has ended.
A “Low Debt Service Period” (i) will commence if, as of the last day of each calendar quarter, the debt service coverage ratio falls below 1.20x, and (ii) will end when the debt service coverage ratio is at least 1.25x (the “DSCR Threshold”) for two consecutive calendar quarters or the borrower has delivered to the lender funds for deposit into the cash collateral account or a letter of credit in an amount which, if applied to repay the then outstanding principal balance, would cause the DSCR Threshold to be satisfied. Such cash collateral or letter of credit is required to be released to the borrower if the DSCR Threshold is satisfied for two consecutive calendar quarters without regard to such cash collateral or letter of credit.
THE INFORMATION IN THIS STRUCTURAL AND COLLATERAL TERM SHEET IS NOT COMPLETE AND MAY BE AMENDED PRIOR TO THE TIME OF SALE. THIS TERM SHEET IS NOT AN OFFER TO SELL THESE SECURITIES AND IT IS NOT A SOLICITATION OF AN OFFER TO BUY THESE SECURITIES IN ANY JURISDICTION WHERE THE OFFER OR SALE IS NOT PERMITTED.
| | |
95 of 151
| Structural and Collateral Term Sheet | Benchmark 2018-B2 | |
| Sentinel Square II | ||
A “Lease Sweep Period” will commence, with respect to any Lease Sweep Lease (as defined below) upon the first monthly payment date following the earliest to occur of (a) (1) 12 months prior to the earliest stated expiration of such Lease Sweep Lease or (2) the date a tenant under a Lease Sweep Lease is required to give notice of its exercise of a renewal option (and such renewal has not been exercised), (b) the date on which the tenant surrenders, cancels, terminates or delivers notice of its intent to surrender, cancel or terminate its Lease Sweep Lease (or any material portion thereof) prior to the then current expiration date, (c) the date on which the tenant goes dark in 50% or more of its space (the “Dark Premises”) or gives notice of its intent to do so, (d) a monetary or material non-monetary default by the tenant that continues beyond any applicable notice and cure period or (e) the occurrence of an insolvency proceeding of a tenant. A Lease Sweep Period will end on the date upon which: (A) in the case of clause (a), (b), (c) and (d) above, either at least 90% of the Lease Sweep Space (as defined below) is leased pursuant to one or more Qualified Leases (as defined in the loan documents ), which results in a debt yield of at least 7.75% or the entirety of the Lease Sweep Space (or applicable portion thereof) is leased pursuant to one or more Qualified Leases and, in either case, the lender has determined that sufficient funds have accumulated in the lease sweep reserve account to cover all anticipated re-tenanting costs, (B) in the case of clause (a) above, the subject tenant has renewed its lease and the lender has determined that sufficient funds have accumulated in the lease sweep reserve account to cover all anticipated re-tenanting costs, (C) in the case of clause (b) above, the subject tenant revokes its notice of intention to surrender or terminate its lease, (D) in the case of clause (d) above, the subject default has been cured, and no other monetary or material non-monetary default under such lease occurs for three consecutive months thereafter, (E) in the case of clause (e) above, (1) the applicable insolvency proceeding has terminated and the applicable Lease Sweep Lease has been affirmed, assumed or assigned in a manner reasonably satisfactory to the lender, (2) in the event the Lease Sweep Lease is rejected in the applicable insolvency proceeding, substantially all of the Lease Sweep Space is leased pursuant to one or more Qualified Leases, the leasing of which results in a debt yield of at least 7.75% or (3) the applicable Lease Sweep Lease has been assumed and assigned to a third party in the applicable insolvency proceeding pursuant to a final non-appealable order of the applicable bankruptcy court, an effective plan of reorganization or otherwise in a manner reasonably satisfactory to the lender or (F) in the case of clause (c) above, (1) the tenant has recommenced its business in 50% or more of its Lease Sweep Space at the Sentinel Square II property for a period of at least 30 consecutive days, (2) the tenant that gave notice of its intent to go dark subsequently retracts such notice or (3) the entirety of the Lease Sweep Space (or applicable portion thereof) is leased pursuant to one or more Qualified Leases, and the lender has determined that sufficient funds have accumulated in the lease sweep reserve account to cover all anticipated re-tenanting costs.
A “Lease Sweep Lease” means the (a) District of Columbia lease, (b) Federal Election Commission lease or (c) any replacement lease that, either individually, or when taken together with any other lease with the same tenant or its affiliates covers the majority of the applicable lease sweep space.
A “Lease Sweep Space” means the space demised under the applicable Lease Sweep Lease.
Lockbox / Cash Management.The Sentinel Square II Whole Loan is structured with a hard lockbox with in place cash management. All rents are required to be directly deposited by the tenants of the Sentinel Square II property into a lockbox account controlled by the lender. All amounts in the lockbox account are required to be swept to a lender-controlled cash management account every business day and applied on each payment date to pay debt service and fund required reserves, after which (x) to the extent a Trigger Period has occurred and is continuing, all excess cash flow is required to be applied to pay operating expenses set forth in the annual budget (which is required to be approved by the lender solely during a Trigger Period, and is subject to permitted variances for increases in taxes, insurance premiums and utilities and up to 5% per line item for other items) and extraordinary expenses approved by the lender, with any remainder (i) if a Lease Sweep Period exists, deposited into the lease sweep reserve or (ii) otherwise, held as additional collateral for the Sentinel Square II Whole Loan, and (y) to the extent no Trigger Period is continuing, all excess cash flow is required to be disbursed to the borrower.
THE INFORMATION IN THIS STRUCTURAL AND COLLATERAL TERM SHEET IS NOT COMPLETE AND MAY BE AMENDED PRIOR TO THE TIME OF SALE. THIS TERM SHEET IS NOT AN OFFER TO SELL THESE SECURITIES AND IT IS NOT A SOLICITATION OF AN OFFER TO BUY THESE SECURITIES IN ANY JURISDICTION WHERE THE OFFER OR SALE IS NOT PERMITTED.
| | |
96 of 151
| Structural and Collateral Term Sheet | Benchmark 2018-B2 |
[THIS PAGE INTENTIONALLY LEFT BLANK]
THE INFORMATION IN THIS STRUCTURAL AND COLLATERAL TERM SHEET IS NOT COMPLETE AND MAY BE AMENDED PRIOR TO THE TIME OF SALE. THIS TERM SHEET IS NOT AN OFFER TO SELL THESE SECURITIES AND IT IS NOT A SOLICITATION OF AN OFFER TO BUY THESE SECURITIES IN ANY JURISDICTION WHERE THE OFFER OR SALE IS NOT PERMITTED.
| | |
97 of 151
| Structural and Collateral Term Sheet | Benchmark 2018-B2 | |
| The Woods | ||
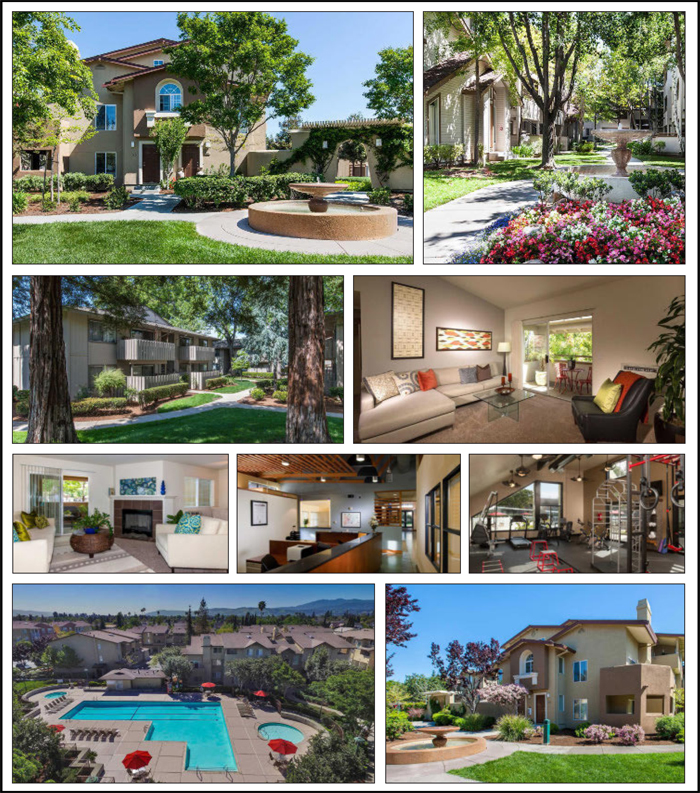
THE INFORMATION IN THIS STRUCTURAL AND COLLATERAL TERM SHEET IS NOT COMPLETE AND MAY BE AMENDED PRIOR TO THE TIME OF SALE. THIS TERM SHEET IS NOT AN OFFER TO SELL THESE SECURITIES AND IT IS NOT A SOLICITATION OF AN OFFER TO BUY THESE SECURITIES IN ANY JURISDICTION WHERE THE OFFER OR SALE IS NOT PERMITTED.
| | |
98 of 151
| Structural and Collateral Term Sheet | Benchmark 2018-B2 | |
| The Woods | ||
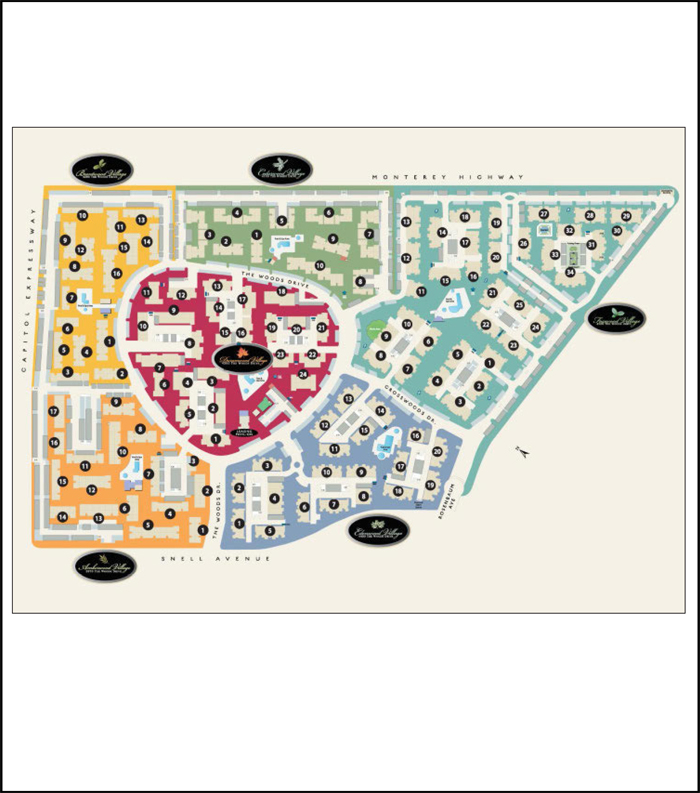
THE INFORMATION IN THIS STRUCTURAL AND COLLATERAL TERM SHEET IS NOT COMPLETE AND MAY BE AMENDED PRIOR TO THE TIME OF SALE. THIS TERM SHEET IS NOT AN OFFER TO SELL THESE SECURITIES AND IT IS NOT A SOLICITATION OF AN OFFER TO BUY THESE SECURITIES IN ANY JURISDICTION WHERE THE OFFER OR SALE IS NOT PERMITTED.
| | |
99 of 151
| Structural and Collateral Term Sheet | Benchmark 2018-B2 | |
| The Woods | ||
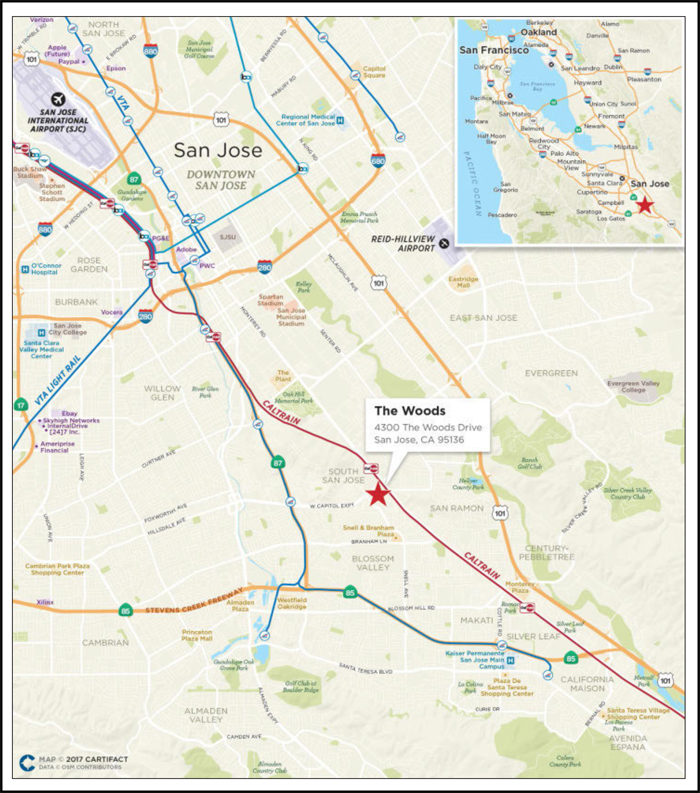
THE INFORMATION IN THIS STRUCTURAL AND COLLATERAL TERM SHEET IS NOT COMPLETE AND MAY BE AMENDED PRIOR TO THE TIME OF SALE. THIS TERM SHEET IS NOT AN OFFER TO SELL THESE SECURITIES AND IT IS NOT A SOLICITATION OF AN OFFER TO BUY THESE SECURITIES IN ANY JURISDICTION WHERE THE OFFER OR SALE IS NOT PERMITTED.
| | |
100 of 151
| Structural and Collateral Term Sheet | Benchmark 2018-B2 | |
| The Woods | ||
| Mortgage Loan Information | Property Information | |||
| Mortgage Loan Seller: | CREFI | Single Asset / Portfolio: | Single Asset | |
| Credit Assessment | AAA(sf)/Asf/AA+(sf) | Title: | Fee | |
| (S&P/Fitch/KBRA)(1): | Property Type - Subtype: | Multifamily – Garden | ||
| Original Principal Balance(2): | $57,500,000 | Net Rentable Area (Units): | 1,841 | |
| Cut-off Date Principal Balance(2): | $57,500,000 | Location: | San Jose, CA | |
| % of Pool by IPB: | 3.8% | Year Built / Renovated: | 1981-2003 / 2017 | |
| Loan Purpose: | Refinance �� | Occupancy: | 94.7% | |
| Borrower: | The Woods of San Jose LLC | Occupancy Date: | 10/1/2017 | |
| Sponsor: | Arcadia Development Co. | Number of Tenants: | N/A | |
| Interest Rate: | 2.94050% | 2014 NOI: | $25,138,025 | |
| Note Date: | 12/1/2017 | 2015 NOI: | $27,615,634 | |
| Maturity Date: | 12/6/2022 | 2016 NOI: | $29,881,343 | |
| Interest-only Period: | 60 months | TTM NOI (as of 9/2017): | $29,844,064 | |
| Original Term: | 60 months | UW Economic Occupancy: | 91.6% | |
| Original Amortization: | None | UW Revenues: | $45,252,611 | |
| Amortization Type: | Interest Only | UW Expenses: | $14,939,344 | |
| Call Protection: | L(26),DeforGrtr1%orYM(27),O(7) | UW NOI: | $30,313,267 | |
| Lockbox / Cash Management: | Springing / Springing | UW NCF: | $29,853,017 | |
| Additional Debt: | Yes | Appraised Value / Per Unit: | $675,500,000 / $366,920 | |
| Additional Debt Balance: | $142,500,000 | Appraisal Date: | 10/10/2017 | |
| Additional Debt Type: | Pari Passu | |||
| Escrows and Reserves(3) | Financial Information(2) | |||||||
| Initial | Monthly | Initial Cap | Cut-off Date Loan / Unit: | $108,637 | ||||
| Taxes: | $0 | Springing | N/A | Maturity Date Loan / Unit: | $108,637 | |||
| Insurance: | $0 | Springing | N/A | Cut-off Date LTV: | 29.6% | |||
| Replacement Reserves: | $0 | Springing | N/A | Maturity Date LTV: | 29.6% | |||
| TI/LC: | $0 | $0 | N/A | UW NCF DSCR: | 5.01x | |||
| Other: | $0 | $0 | N/A | UW NOI Debt Yield: | 15.2% | |||
| Sources and Uses | ||||||||||
| Sources | Proceeds | % of Total | Uses | Proceeds | % of Total | |||||
| Mortgage Loan | $200,000,000 | 99.3 | % | Loan Payoff | $200,000,000 | 99.3 | % | |||
| Sponsor Equity | 1,323,235 | 0.7 | Closing Costs | 1,323,235 | 0.7 | |||||
| Total Sources | $201,323,235 | 100.0 | % | Total Uses | $201,323,235 | 100.0 | % | |||
| (1) | S&P, Fitch and KBRA have confirmed that The Woods Mortgage Loan (as defined below) has, in the context of its inclusion in the mortgage pool, credit characteristics consistent with an investment grade obligation. |
| (2) | The Woods Mortgage Loan is part of a whole loan evidenced by threepari passu notes, with an aggregate outstanding principal balance as of the Cut-off Date of $200.0 million. The Financial Information presented in the chart above reflects the aggregate Cut-off Date balance of the $200.0 million The Woods Whole Loan, as defined in“The Loan” below. |
| (3) | For a full description of Escrows and Reserves, please refer to “Escrows and Reserves” below. |
THE INFORMATION IN THIS STRUCTURAL AND COLLATERAL TERM SHEET IS NOT COMPLETE AND MAY BE AMENDED PRIOR TO THE TIME OF SALE. THIS TERM SHEET IS NOT AN OFFER TO SELL THESE SECURITIES AND IT IS NOT A SOLICITATION OF AN OFFER TO BUY THESE SECURITIES IN ANY JURISDICTION WHERE THE OFFER OR SALE IS NOT PERMITTED.
| | |
101 of 151
| Structural and Collateral Term Sheet | Benchmark 2018-B2 | |
| The Woods | ||
The Loan. The Woods loan is secured by a first mortgage lien on the borrower’s fee interest in a 1,841-unit, garden-style multifamily property located in San Jose, California (“The Woods Property”). The whole loan has an aggregate outstanding principal balance as of the Cut-off Date of $200.0 million (“The Woods Whole Loan”), and is comprised of threepari passu notes, each as described below. The non-controlling Note A-3, with an outstanding principal balance as of the Cut-off Date of $57.5 million (“The Woods Mortgage Loan”), is being contributed to the Benchmark 2018-B2 Trust. The remaining notes are currently held by the parties described in the “Whole Loan Summary” chart below. The relationship between the holders of The Woods Whole Loan will be governed by a co-lender agreement as described under“Description of the Mortgage Pool—The Whole Loans—The Non-Serviced Pari Passu Whole Loans” in the Preliminary Prospectus. The Woods Whole Loan has a five-year term and is interest only for the entire term.
| Whole Loan Summary | ||||
| Note | Original Balance | Cut-off Date Balance | Note Holder | Controlling Piece |
| A-1 | $85,000,000 | $85,000,000 | MSC 2017-HR2 | Yes |
| A-2 | 57,500,000 | 57,500,000 | Benchmark 2018-B1 | No |
| A-3 | 57,500,000 | 57,500,000 | Benchmark 2018-B2 | No |
| Total | $200,000,000 | $200,000,000 | ||
The Borrower. The borrowing entity for The Woods Whole Loan is The Woods of San Jose LLC, a Delaware limited liability company (“The Woods Borrower”) and special purpose entity with two independent directors that is indirectly 100.0% owned by Eli Reinhard and Eli Reinhard’s immediate family.
The Loan Sponsor.There is no nonrecourse carve-out guarantor with respect to The Woods Whole Loan. Both The Woods Borrower and the borrower sponsor, Arcadia Development Co. (“Arcadia”), delivered the related environmental indemnity. Eli Reinhard is the President and sole owner of Arcadia. Founded by Mr. Reinhard in 1952, Arcadia has since built approximately 10,000 homes and apartment units. Arcadia engages in the acquisition, development, building and marketing of new home communities. The company is also involved in the management of residential and commercial properties. Arcadia’s real estate portfolio includes new home communities in California and Virginia as well as apartments in San Jose, California. Mr. Reinhard is an experienced builder in the San Jose Bay Area and has been a developer of single-family, multifamily, and commercial properties, over the past 45 years. In addition to The Woods Property, Mr. Reinhard owns a 529-unit apartment community called Cherrywood which is located approximately four miles southwest of The Woods Property. Mr. Reinhard also owns apartment communities and commercial properties on the East Coast. Arcadia is the original developer of The Woods Property and has owned the subject since construction began in 1981.
The Property. The Woods Property is comprised of six separate “villages” referred to as Amberwood, Brentwood, Cedarwood, Duramwood, Edenwood and Foxwood, totaling 1,841 units with an average unit size of approximately 842 square feet within 45 separate floor plans. The leasing office is in the center of The Woods Property. The units include apartment-style residences and townhouses and feature electric appliances including a range/oven, a frost-free refrigerator, a garbage disposal, a dishwasher, in-unit laundry and microwave ovens in certain new units. All units feature private patios or balcony areas, with select units offering fireplaces and an exterior storage room. According to the property manager, The Woods Property is undergoing an ongoing replacement program for all appliances. The Woods Property has 3,218 parking spaces (approximately 1.75 spaces per unit) and gate-controlled vehicular access. The parking spaces at The Woods Property are comprised of 1,181 open spaces, 1,072 carport spaces, 702 garage spaces, and 263 tandem spaces.
The Woods Property has undergone over $21.9 million (approximately $11,900 per unit) of capital improvements since 2013, including over $1,000 per unit per year for the last six years. The Woods Property has experienced stable occupancy and has averaged approximately 95.4% physical occupancy since 2007. Floor plans comprising the apartments include: studios, one bedroom/one bathroom units, two bedroom/two bathroom units and three bedroom/two bathroom units. Floor plans comprising the townhouse units include one bedroom/1.5 bathroom units, two bedroom/two or 2.5 bathroom units and three bedroom/two bathroom units. In addition to specific village and/or unit amenities, all residents of The Woods Property have access to numerous amenities including a total of six swimming pools and spas located throughout the community, a resident lounge with a flat screen TV, fireplace and Wi-Fi, a lit basketball court and putting green, five fitness complexes with new cardio, aerobic and weight training equipment, children’s play areas, 24-hour on-site maintenance, professional on site management and maintenance teams, resident events, and access to the resident portal which allows tenants to make monthly rental payments on-line.
THE INFORMATION IN THIS STRUCTURAL AND COLLATERAL TERM SHEET IS NOT COMPLETE AND MAY BE AMENDED PRIOR TO THE TIME OF SALE. THIS TERM SHEET IS NOT AN OFFER TO SELL THESE SECURITIES AND IT IS NOT A SOLICITATION OF AN OFFER TO BUY THESE SECURITIES IN ANY JURISDICTION WHERE THE OFFER OR SALE IS NOT PERMITTED.
| | |
102 of 151
| Structural and Collateral Term Sheet | Benchmark 2018-B2 | |
| The Woods | ||
| Historical and Current Occupancy(1)(2) | |||
| 2014 | 2015 | 2016 | Current(3) |
| 95.6% | 95.2% | 92.4% | 94.7% |
| (1) | Represents the economic occupancy at The Woods Property which treats administrative and model units as vacant. |
| (2) | 2014, 2015 and 2016 historical occupancies are as of December 31 of each respective year. |
| (3) | Current Occupancy is as of October 1, 2017. |
The Woods – Village Summary(1)(2) | ||||||||||||||||||||
| Village | Year Built | # of Units | % of Units | Occupied Units | % Occupied | Renovated Units | % Renovated | |||||||||||||
| Amberwood | 1981 | 294 | 16.0 | % | 282 | 95.9 | % | 276 | 93.9 | % | ||||||||||
| Brentwood | 1984 | 262 | 14.2 | 252 | 96.2 | 245 | 93.5 | % | ||||||||||||
| Cedarwood | 1985 | 228 | 12.4 | 217 | 95.2 | 204 | 89.5 | % | ||||||||||||
| Duramwood | 1991 | 359 | 19.5 | 328 | 91.4 | 60 | 16.7 | % | ||||||||||||
| Edenwood | 1999 | 222 | 12.1 | 208 | 93.7 | 32 | 14.4 | % | ||||||||||||
| Foxwood | 2003 | 476 | 25.9 | 456 | 95.8 | 0 | 0.0 | % | ||||||||||||
| Total / Wtd. Avg. | 1,841 | 100.0 | % | 1,743 | 94.7 | % | 817 | 44.4 | % | |||||||||||
| (1) | Based on the underwritten rent roll dated October 1, 2017. |
| (2) | Occupied Units treats administrative and model units as vacant, as no revenue is contributed by the units. |
| Multifamily Unit Mix(1)(2) | |||||||||||||||||||||
| Unit Type | # of Units | % of Units | Occupied Units | % Occupied | Average Unit Size (SF) | Average Market Rent per Month | In-Place Average Rent per Month | ||||||||||||||
| Studio | 169 | 9.2 | % | 158 | 93.5 | % | 448 | $1,893 | $1,796 | ||||||||||||
| 1 BR | 928 | 50.4 | 885 | 95.4 | 711 | $2,100 | $1,997 | ||||||||||||||
| 1 BR Townhouse | 119 | 6.5 | 111 | 93.3 | 960 | $2,380 | $2,292 | ||||||||||||||
| 2 BR Townhouse | 257 | 14.0 | 247 | 96.1 | 1,232 | $2,671 | $2,658 | ||||||||||||||
| 3 BR Townhouse | 120 | 6.5 | 109 | 90.8 | 1,295 | $3,123 | $2,938 | ||||||||||||||
| 2 BR Garden-style Apartment | 222 | 12.1 | 210 | 94.6 | 936 | $2,671 | $2,421 | ||||||||||||||
| 3 BR Garden-style Apartment | 14 | 0.8 | 11 | 78.6 | 956 | $3,123 | $2,747 | ||||||||||||||
| Junior 1 BR | 12 | 0.7 | 12 | 100.0 | 635 | $2,145 | $1,975 | ||||||||||||||
| Total / Wtd. Avg. | 1,841 | 100.0 | % | 1,743 | 94.7 | % | 842 | $2,322 | $2,206 | ||||||||||||
| (1) | Based on the underwritten rent roll dated October 1, 2017. |
| (2) | Occupied Units treats administrative and model units as vacant, as no revenue is contributed by the units. |
The Woods Property is located in southern San Jose, California, in central Santa Clara County, and is part of the San Jose-Sunnyvale-Santa Clara metropolitan statistical area. San Jose is located at the southern end of San Francisco Bay, approximately 48 miles southeast of San Francisco. San Jose is generally bordered by the San Francisco Bay and the city of Milpitas to the north, the cities of Santa Clara and Campbell to the west, the foothills of the Diablo Mountain Range to the east and Morgan Hill to the south. The large concentration of high-technology engineering, computer and microprocessor companies around San Jose has led the area to be known as Silicon Valley. San Jose is the largest city in Silicon Valley and is also the largest city in the San Francisco Bay Area, in terms of population. San Jose is home to many of the world’s largest technology companies including Alphabet Inc., Apple Inc., Intel, Cisco Systems Inc., Facebook Inc., Hewlett-Packard, Oracle, Yahoo! and eBay.
The Woods Property is located in southern San Jose, in the area generally encompassed by Capitol Expressway, Monterey Highway and Highway 85. The Woods Property is immediately south of Capitol Expressway between Snell Avenue and Monterey Highway and is visible from these major thoroughfares. Both State Highways 87 and 85 connect with Interstate 280 and US Highway 101 to the north providing access to the greater Bay Area. Access to State Highway 87 is located approximately one mile west of The Woods Property along Capitol Expressway, and access to State Highway 85 is located approximately two miles south of The Woods Property along Blossom Hill Road. The drive time to Cupertino, California (Apple Inc.’s headquarters) is less than 20 minutes, Mountainview (Alphabet Inc.’s headquarters) is less than 25 minutes and Palo Alto is less than 30 minutes.
THE INFORMATION IN THIS STRUCTURAL AND COLLATERAL TERM SHEET IS NOT COMPLETE AND MAY BE AMENDED PRIOR TO THE TIME OF SALE. THIS TERM SHEET IS NOT AN OFFER TO SELL THESE SECURITIES AND IT IS NOT A SOLICITATION OF AN OFFER TO BUY THESE SECURITIES IN ANY JURISDICTION WHERE THE OFFER OR SALE IS NOT PERMITTED.
| | |
103 of 151
| Structural and Collateral Term Sheet | Benchmark 2018-B2 | |
| The Woods | ||
Land use in the immediate area consists of a mixture of residential and commercial, with retail mostly situated on Capitol Expressway and the Monterey Highway, both of which are approximately four miles from The Woods Property. According to the appraisal, the area is considered to be substantially built-out with limited opportunities for new supply. The Woods Property is located near schools, shops and grocery stores, restaurants, parks, libraries and other community services. The major retail development in the neighborhood is Westfield Oakridge Mall, which is located approximately three miles southwest of The Woods Property. Almaden Plaza Shopping Center, a Trader Joe’s-anchored community center, is located four miles southwest of The Woods Property; while Downtown San Jose is approximately seven miles from The Woods Property. The Woods Property is in close proximity to Highways 85, 87, 280 and 101, Capitol Expressway, Monterey Highway, and light rail transit and the Cal Train with service to San Francisco. According to the appraisal, the estimated 2017 population within a one-, three- and five-mile radius is 34,366, 241,996 and 584,477, respectively. Additionally, per the appraisal, the estimated average household income for the same period, within a one-, three- and five-mile radius is $98,177, $106,918 and $120,520. The top 10 employers in the area are: Apple Inc., Alphabet Inc., Stanford University, Cisco Systems Inc., Kaiser Permanente, Intel Corp., Stanford University, Hospital & Clinics, Tesla Motors Inc., Facebook Inc. and University of California, Santa Cruz.
According to the appraisal, The Woods Property is part of the South San Jose multifamily submarket which is part of the greater San Jose multifamily market. As of the second quarter of 2017, the overall San Jose multifamily market had an inventory of 126,911 units and average vacancy was 2.8% with average asking rents of $2,115 per unit. During the same period, the South San Jose submarket, where The Woods Property is located, had an inventory of 11,725 units, a vacancy rate of 4.8% and an average asking rent of $2,162 per unit. The appraisal identified eight comparable multifamily properties proximate to The Woods Property. The Woods Property comparables range from 108 to 456 units with an average of 287 units, and indicate a quoted rental range of $2,304 to $2,856 per month, with an average market rent of $2,505 per month, which is approximately 13.6% above The Woods Property’s weighted average in-place rents. The comparable properties had occupancies ranging from 87.0% to 99.0% with a weighted average occupancy of approximately 94.6%.
| Operating History and Underwritten Net Cash Flow | |||||||||||||||||||||
| 2014 | 2015 | 2016 | TTM(1) | Underwritten | Per Unit | %(2) | |||||||||||||||
| Rents in Place(3) | $39,393,192 | $43,103,435 | $46,876,612 | $48,037,645 | $46,132,248 | $25,058 | 94.3 | % | |||||||||||||
| Vacant Income | 0 | 0 | 0 | 0 | 2,791,778 | 1,516 | 5.7 | ||||||||||||||
| Gross Potential Rent | $39,393,192 | $43,103,435 | $46,876,612 | $48,037,645 | $48,924,026 | $26,575 | 100.0 | % | |||||||||||||
| (Vacancy/Credit Loss)(4) | (1,738,307) | (2,084,554) | (3,576,702) | (3,243,631) | (4,130,012) | (2,243) | (8.4 | ) | |||||||||||||
| Other Income(5) | 374,320 | 331,813 | 463,355 | 458,597 | 458,597 | 249 | 0.9 | ||||||||||||||
| Effective Gross Income | $38,029,205 | $41,350,694 | $43,763,265 | $45,252,611 | $45,252,611 | $24,580 | 92.5 | % | |||||||||||||
| Total Expenses(6) | $12,891,180 | $13,735,060 | $13,881,922 | $15,408,547 | $14,939,344 | $8,115 | 33.0 | % | |||||||||||||
| Net Operating Income(6) | $25,138,025 | $27,615,634 | $29,881,343 | $29,844,064 | $30,313,267 | $16,466 | 67.0 | % | |||||||||||||
| Total TI/LC, CapEx/RR | 0 | 0 | 0 | 0 | 460,250 | 250 | 1.0 | ||||||||||||||
| Net Cash Flow | $25,138,025 | $27,615,634 | $29,881,343 | $29,844,064 | $29,853,017 | $16,216 | 66.0 | % | |||||||||||||
| (1) | TTM column represents the trailing 12-month period ending on September 30, 2017. |
| (2) | Percentage column represents percent of Gross Potential Rent for all revenue lines and represents percent of Effective Gross Income for the remainder of fields. |
| (3) | Rents in Place was underwritten per the rent roll dated October 1, 2017. |
| (4) | Vacancy/Credit Loss represents the appraisal’s estimated market rents of $1,893 for studio units, $2,100 for one-bedroom units, $2,380 for one-bedroom townhouse units, $2,145 for junior one-bedroom units, $2,671 for two-bedroom units and $3,123 for three-bedroom units. |
| (5) | Other Income is comprised of laundry, storage, vending machine, late charges, and other miscellaneous income. |
| (6) | The difference between TTM Net Operating Income and Underwritten Net Operating Income is attributable to the management fee being underwritten as $1,000,000. Per the management agreement, the management fee is 3.0% of the total monthly gross receipts from The Woods Property with anything above a $1,000,000 management fee only due to the extent there is sufficient cash flow following payment of amounts due under The Woods Whole Loan documents and other expenses of The Woods Property. |
Property Management. The Woods Property is managed by Arcadia Management Services Co., an affiliate of the borrower sponsor.
THE INFORMATION IN THIS STRUCTURAL AND COLLATERAL TERM SHEET IS NOT COMPLETE AND MAY BE AMENDED PRIOR TO THE TIME OF SALE. THIS TERM SHEET IS NOT AN OFFER TO SELL THESE SECURITIES AND IT IS NOT A SOLICITATION OF AN OFFER TO BUY THESE SECURITIES IN ANY JURISDICTION WHERE THE OFFER OR SALE IS NOT PERMITTED.
| | |
104 of 151
| Structural and Collateral Term Sheet | Benchmark 2018-B2 | |
| The Woods | ||
Escrows and Reserves.
Tax Escrows- The requirement for the borrower to make monthly deposits into the tax escrow is waived so long as no event of default under the loan documents is continuing.
Insurance Escrows- The requirement for the borrower to make monthly deposits into the insurance escrow is waived so long as no event of default has occurred and is continuing.
Replacement Reserves -The requirement for the borrower to make monthly deposits equal to $38,355 into the replacement reserve is waived so long as no event of default has occurred and is continuing.
Lockbox / Cash Management. The Woods Whole Loan is structured with a springing lockbox and springing cash management which are required to be put in place upon the first occurrence of an event of default under The Woods Whole Loan documents. Following an event of default under The Woods Whole Loan documents until its cure, if applicable, the lender may apply all sums in such order of priority as it may determine, or may permit funds in the lockbox account to be swept each business day to a lender-controlled cash management account and to be disbursed in accordance with The Woods Whole Loan documents. All excess cash flow is required to be held as additional security for The Woods Whole Loan (or otherwise applied as the lender chooses) until such event of default is cured, if applicable. Upon a cure of an event of default, the lockbox and cash management (and related) accounts are required to be closed at the request of The Woods Borrower and amounts held in such accounts are required to be disbursed to The Woods Borrower.
THE INFORMATION IN THIS STRUCTURAL AND COLLATERAL TERM SHEET IS NOT COMPLETE AND MAY BE AMENDED PRIOR TO THE TIME OF SALE. THIS TERM SHEET IS NOT AN OFFER TO SELL THESE SECURITIES AND IT IS NOT A SOLICITATION OF AN OFFER TO BUY THESE SECURITIES IN ANY JURISDICTION WHERE THE OFFER OR SALE IS NOT PERMITTED.
| | |
105 of 151
| Structural and Collateral Term Sheet | Benchmark 2018-B2 | |
| 600 Clipper | ||
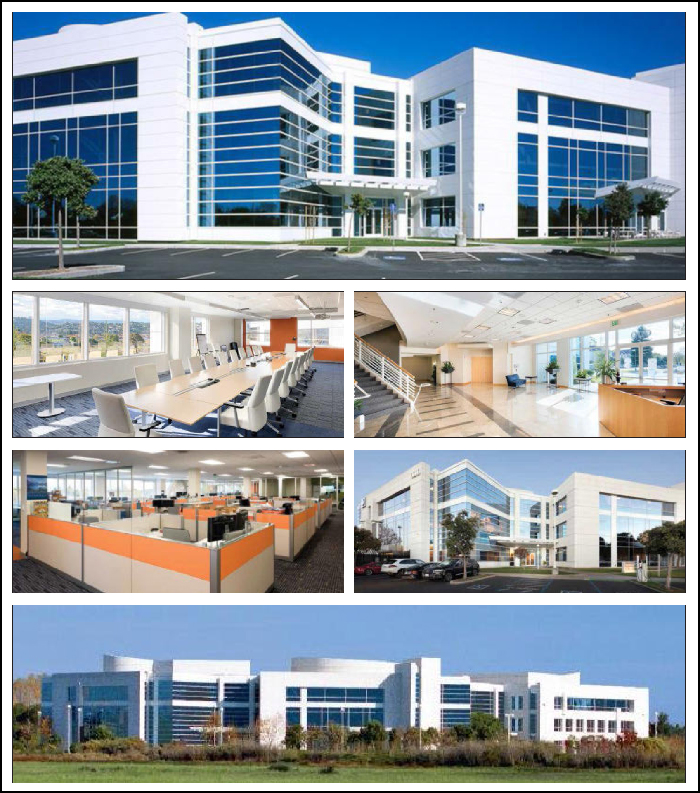
THE INFORMATION IN THIS STRUCTURAL AND COLLATERAL TERM SHEET IS NOT COMPLETE AND MAY BE AMENDED PRIOR TO THE TIME OF SALE. THIS TERM SHEET IS NOT AN OFFER TO SELL THESE SECURITIES AND IT IS NOT A SOLICITATION OF AN OFFER TO BUY THESE SECURITIES IN ANY JURISDICTION WHERE THE OFFER OR SALE IS NOT PERMITTED.
| | |
106 of 151
| Structural and Collateral Term Sheet | Benchmark 2018-B2 | |
| 600 Clipper | ||
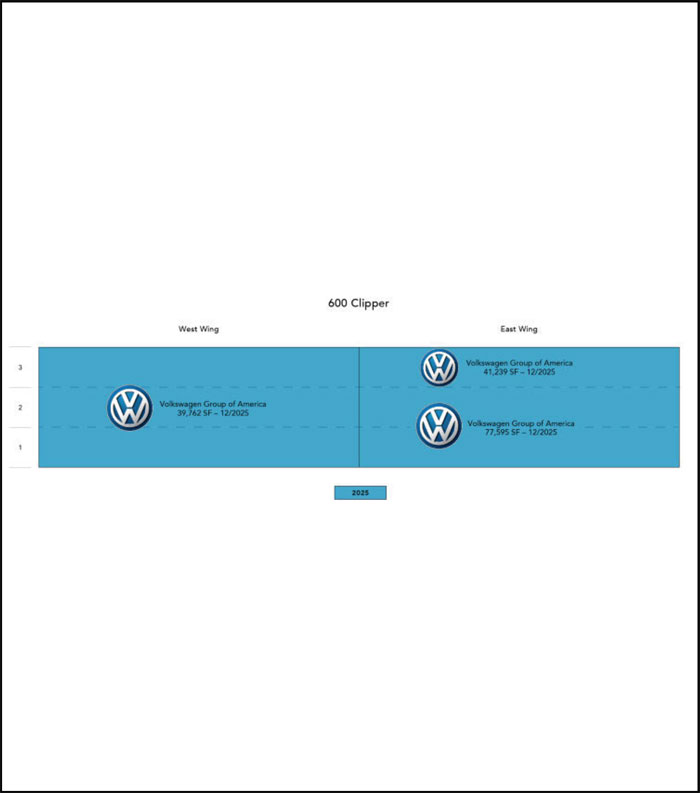
THE INFORMATION IN THIS STRUCTURAL AND COLLATERAL TERM SHEET IS NOT COMPLETE AND MAY BE AMENDED PRIOR TO THE TIME OF SALE. THIS TERM SHEET IS NOT AN OFFER TO SELL THESE SECURITIES AND IT IS NOT A SOLICITATION OF AN OFFER TO BUY THESE SECURITIES IN ANY JURISDICTION WHERE THE OFFER OR SALE IS NOT PERMITTED.
| | |
107 of 151
| Structural and Collateral Term Sheet | Benchmark 2018-B2 | |
| 600 Clipper | ||
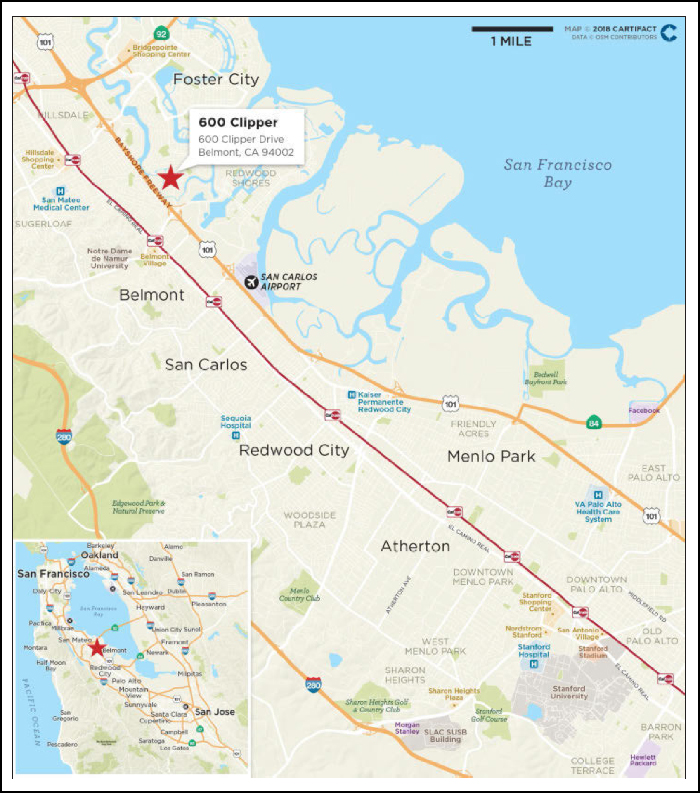
THE INFORMATION IN THIS STRUCTURAL AND COLLATERAL TERM SHEET IS NOT COMPLETE AND MAY BE AMENDED PRIOR TO THE TIME OF SALE. THIS TERM SHEET IS NOT AN OFFER TO SELL THESE SECURITIES AND IT IS NOT A SOLICITATION OF AN OFFER TO BUY THESE SECURITIES IN ANY JURISDICTION WHERE THE OFFER OR SALE IS NOT PERMITTED.
| | |
108 of 151
| Structural and Collateral Term Sheet | Benchmark 2018-B2 | |
| 600 Clipper | ||
| Mortgage Loan Information | Property Information | |||
| Mortgage Loan Seller: | JPMCB | Single Asset / Portfolio: | Single Asset | |
| Original Principal Balance: | $54,300,000 | Title: | Fee | |
| Cut-off Date Principal Balance: | $54,300,000 | Property Type - Subtype: | Office – Suburban | |
| % of Pool by IPB: | 3.6% | Net Rentable Area (SF): | 158,596 | |
| Loan Purpose: | Acquisition | Location: | Belmont, CA | |
| Borrower: | 600 Clipper Operating LLC | Year Built / Renovated: | 1995, 2000 / 2017 | |
| Sponsor: | Gemini-Rosemont Realty LLC | Occupancy: | 100.0% | |
| Interest Rate: | 3.71700% | Occupancy Date: | 2/1/2018 | |
| Note Date: | 12/28/2017 | Number of Tenants: | 1 | |
| Maturity Date: | 1/1/2028 | 2014 NOI(1): | N/A | |
| Interest-only Period: | 120 months | 2015 NOI(1): | N/A | |
| Original Term: | 120 months | 2016 NOI(1): | N/A | |
| Original Amortization: | None | TTM NOI(1): | N/A | |
| Amortization Type: | Interest Only | UW Economic Occupancy: | 95.0% | |
| Call Protection: | L(24),Grtr1%orYM(89),O(7) | UW Revenues(2): | $9,842,561 | |
| Lockbox / Cash Management: | Hard / Springing | UW Expenses: | $2,952,768 | |
| Additional Debt: | N/A | UW NOI(2): | $6,889,793 | |
| Additional Debt Balance: | N/A | UW NCF: | $6,491,015 | |
| Additional Debt Type: | N/A | Appraised Value / Per SF(3): | $94,020,000 / $593 | |
| Appraised Go Dark Value / Per SF(4): | $72,390,000 / $456 | |||
| Appraisal Date: | 11/13/2017 | |||
| Escrows and Reserves(5) | Financial Information | |||||||
| Initial | Monthly | Initial Cap | Cut-off Date Loan / SF: | $342 | ||||
| Taxes: | $0 | Springing | N/A | Maturity Date Loan / SF: | $342 | |||
| Insurance: | $0 | Springing | N/A | Cut-off Date LTV(3): | 57.8% | |||
| Replacement Reserves: | $4,626 | $4,626 | N/A | Maturity Date LTV(3): | 57.8% | |||
| TI/LC(3): | $4,147,500 | $0 | N/A | UW NCF DSCR: | 3.17x | |||
| Other(3): | $5,098,460 | $0 | N/A | UW NOI Debt Yield: | 12.7% | |||
| Sources and Uses | ||||||
| Sources | Proceeds | % of Total | Uses | Proceeds | % of Total | |
| Mortgage Loan | $54,300,000 | 54.4% | Purchase Price | $89,603,786 | 89.7% | |
| Sponsor Equity | 45,602,406 | 45.6 | Upfront Reserves | 9,250,586 | 9.3 | |
| Closing Costs | 1,048,034 | 1.0 | ||||
| Total Sources | $99,902,406 | 100.0% | Total Uses | $99,902,406 | 100.0% | |
| (1) | The property was acquired in October 2017, and therefore, historical financial information is not available. |
| (2) | UW Revenues and UW NOI reflect the weighted average underwritten base rent of the sole tenant over the lease term. |
| (3) | Appraised Value / Per SF, Cut-off Date LTV and Maturity Date LTV are based on the “Hypothetical As If Funded” appraised value set forth in the appraisal, which assumes approximately $9.6 million of outstanding tenant improvements, rent/expense reimbursement loss and below-market rents have been funded or escrowed. At origination, the borrower reserved approximately $5.1 million for free rent with the lender and the seller reserved approximately $4.1 million for outstanding tenant improvements, which is held by Chicago Title Insurance Company. The lender received a pledge of the borrower’s interest in the escrow account being held by Chicago Title Insurance Company. The Cut-off Date LTV based on the “as-is” appraised value of $84.46 million as of November 13, 2017 is 64.3%. |
| (4) | The appraisal provided a “Hypothetical – Go Dark” value of $72.39 million, which assumes the property is 100.0% vacant and available for lease. The Cut-off Date LTV based on the “Hypothetical – Go Dark” value is 75.0%. |
| (5) | For a full description of Escrows and Reserves, please refer to “Escrows and Reserves” below. |
THE INFORMATION IN THIS STRUCTURAL AND COLLATERAL TERM SHEET IS NOT COMPLETE AND MAY BE AMENDED PRIOR TO THE TIME OF SALE. THIS TERM SHEET IS NOT AN OFFER TO SELL THESE SECURITIES AND IT IS NOT A SOLICITATION OF AN OFFER TO BUY THESE SECURITIES IN ANY JURISDICTION WHERE THE OFFER OR SALE IS NOT PERMITTED.
| | |
109 of 151
| Structural and Collateral Term Sheet | Benchmark 2018-B2 | |
| 600 Clipper | ||
The Loan. The 600 Clipper loan has an outstanding principal balance as of the Cut-off Date of $54.3 million and is secured by a first mortgage lien on the borrower’s fee interest in an approximately 158,596 square foot Class A office building located in Belmont, California. The 600 Clipper loan has a 10-year term and is interest only for the entire term.
The Borrower.The borrowing entity for the 600 Clipper loan is 600 Clipper Operating LLC, a Delaware limited liability company and special purpose entity.
The Loan Sponsor.The loan sponsor and nonrecourse carve-out guarantor for the 600 Clipper loan is Gemini-Rosemont Realty LLC (“Gemini Rosemont”). Founded in 1992, Gemini Rosemont invests in and manages commercial office properties throughout the U.S. with total assets under management of approximately $1.8 billion. Since 2010, Gemini Rosemont’s leadership has been responsible for acquiring approximately 7.6 million square feet of high-quality office properties valued at approximately $1.0 billion. Gemini Rosemont’s real estate portfolio consists of more than 100 office buildings spanning approximately 13.0 million square feet in over 20 states. Headquartered in Santa Fe, New Mexico, Gemini Rosemont has approximately 200 employees.
The Property.The 600 Clipper property is a three-story, approximately 158,596 square foot, Class A office building located on an approximately 8.2 acre site in Belmont, California. The property was constructed in two phases in 1995 and 2000, a portion of the building was renovated in 2017 and the remaining renovations are expected to be completed by August 2018. The property has two wings that are connected by a central lobby and features expansive window lines, institutional quality finishes, a 100 kilowatt backup power generator, a new security system with proximity card readers and a roll-up loading dock. The property is located approximately 0.5 miles from Oracle’s headquarters in Redwood Shores, where employees at the 600 Clipper property have access to the Oracle international food court, several nearby walking trails, and amenities at the Bay Club Redwood Shores. Additionally, the property features on-site surface parking with 475 parking spaces, resulting in a parking ratio of approximately 3.00 spaces per 1,000 square feet of space.
As of February 1, 2018, the property was 100.0% leased to Volkswagen Group of America (“Volkswagen”) (Volkswagen AG is listed in NASDAQ under VLKAY) and serves as Volkswagen’s only US-based Electronics Research Laboratory, where the company develops mission-critical technology for its next generation automobiles. Volkswagen has been a tenant since February 2011 and initially occupied 39,762 square feet at the property. Volkswagen has expanded twice at the property, first leasing an additional 77,595 square feet in August 2016 and subsequently signing a lease amendment in December 2017 to occupy the remaining portion of the property commencing in August 2018. Volkswagen extended its original lease to be coterminous with the expansion leases and is now on a triple net lease through December 2025, with two five-year extension options. Volkswagen pays monthly rent of $555,087 and currently has monthly rent abatements of approximately $321,515. This amount is scheduled to decrease to approximately $77,138 by February 2019 and approximately $75,150 by January 2020, and the rent abatements are scheduled to end completely by February 2021. Volkswagen is expected to spend approximately $11.0 million (approximately $69.36 per square foot) on further renovations.
The Market.The 600 Clipper property is located in the Bay Area on the San Francisco Peninsula, approximately 18.6 miles southeast of San Francisco and approximately 9.6 miles northwest of Palo Alto. The property is situated on the north line of Clipper Drive with visibility along Highway 101. Access to the property is provided by Highway 101, which provides direct access to San Francisco to the north and Silicon Valley and Los Angeles to the south, and Interstate 280, which provides direct access to San Francisco to the north and San Jose to the south. The property is close to the East Bay between Foster City and Redwood Shores, a short distance from two major road arteries in the area, CA-92 and CA-84. The San Francisco International Airport is approximately 8.2 miles northwest of the property, along with other regional and international airports in the area including the San Carlos Airport, the Palo Alto Airport and the Norman Y. Mineta San Jose International Airport, which are approximately 1.9, 10.1 and 22.2 miles southwest of the property, respectively. The property is close to a number of employers in Silicon Valley and San Francisco including the Facebook headquarters, Visa, Electronic Arts, Gilead, GoPro, Fisher Investments and Franklin Templeton Investments. Other demand drivers include Stanford University, a private research university with a total enrollment of 16,914 students during the 2016-2017 school year and Hillsdale Shopping Center, which offers over 100 retailers and is expecting to open entertainment options including a Cinema-Cinepolis luxury movie theater, a Pinstripes bowling alley and a new dining terrace, which are expected to be completed by summer 2018.
The 600 Clipper property is located in the Belmont submarket of San Mateo County. According to the appraisal, the estimated 2017 population within a one-, three- and five-mile radius was 22,744, 147,499 and 267,923, respectively, with average estimated household income of $133,580, $152,036 and $149,379, respectively. Additionally, CoStar concluded a San Mateo South County Class A office market vacancy of 4.0% in the third quarter of 2017 with quoted rates of $81.04 per square foot. The appraisal identified five directly competitive office leases at properties built between 2002 and 2018 and ranging in size from 82,603 square feet to 350,633 square feet. These office properties reported occupancies ranging from 90.0% to 100.0%, with a weighted average occupancy of approximately 99.2% weighted by lease area square footage. There were seven building completions during the third quarter of 2017, adding approximately 800,000 square feet of office space to the market. Two recent completions are 100 Independence Drive in Menlo Park (206,000 square feet) and 450 Concar Drive in San Mateo (210,000 square feet). Another 500,000 square feet is expected to come online by the end of 2017; however, over 77% of this space is preleased, according to the appraisal.
THE INFORMATION IN THIS STRUCTURAL AND COLLATERAL TERM SHEET IS NOT COMPLETE AND MAY BE AMENDED PRIOR TO THE TIME OF SALE. THIS TERM SHEET IS NOT AN OFFER TO SELL THESE SECURITIES AND IT IS NOT A SOLICITATION OF AN OFFER TO BUY THESE SECURITIES IN ANY JURISDICTION WHERE THE OFFER OR SALE IS NOT PERMITTED.
| | |
110 of 151
| Structural and Collateral Term Sheet | Benchmark 2018-B2 | |
| 600 Clipper | ||
| Historical and Current Occupancy(1) | |||
| 2014 | 2015 | 2016 | Current(2) |
| N/A | N/A | N/A | 100.0% |
| (1) | The property was acquired in October 2017, and therefore, historical financial information is not available. |
| (2) | Current Occupancy is as of February 1, 2018. |
Tenant Summary(1) | |||||||
| Tenant | Ratings(2) Moody’s/S&P/Fitch | Net Rentable Area (SF) | % of Total NRA | Base Rent PSF(3) | % of Total Base Rent | Lease Expiration Date | |
| Volkswagen Group of America | A3 / BBB+ / BBB+ | 158,596 | 100.0% | $46.71 | 100.0% | 12/31/2025 | |
| (1) | Based on the underwritten rent roll dated February 1, 2018. |
| (2) | Ratings provided are for the parent company of the entity listed in the “Tenant” field whether or not the parent company guarantees the lease. |
| (3) | Base Rent PSF represents the weighted average underwritten base rent for Volkswagen through its lease expiration, excluding months with abated rent. The current in-place rent is $42.00 per square foot. |
| Lease Rollover Schedule(1) | |||||||||||||||||
| Year | Number of Leases Expiring | Net Rentable Area Expiring | % of NRA Expiring | Base Rent Expiring(2) | % of Base Rent Expiring | Cumulative Net Rentable Area Expiring | Cumulative % of NRA Expiring | Cumulative Base Rent Expiring(2) | Cumulative % of Base Rent Expiring(2) | ||||||||
| Vacant | NAP | 0 | 0.0% | NAP | NAP | 0 | 0.0% | NAP | NAP | ||||||||
| 2018 & MTM | 0 | 0 | 0.0 | $0 | 0.0% | 0 | 0.0% | $0 | 0.0% | ||||||||
| 2019 | 0 | 0 | 0.0 | 0 | 0.0 | 0 | 0.0% | $0 | 0.0% | ||||||||
| 2020 | 0 | 0 | 0.0 | 0 | 0.0 | 0 | 0.0% | $0 | 0.0% | ||||||||
| 2021 | 0 | 0 | 0.0 | 0 | 0.0 | 0 | 0.0% | $0 | 0.0% | ||||||||
| 2022 | 0 | 0 | 0.0 | 0 | 0.0 | 0 | 0.0% | $0 | 0.0% | ||||||||
| 2023 | 0 | 0 | 0.0 | 0 | 0.0 | 0 | 0.0% | $0 | 0.0% | ||||||||
| 2024 | 0 | 0 | 0.0 | 0 | 0.0 | 0 | 0.0% | $0 | 0.0% | ||||||||
| 2025 | 1 | 158,596 | 100.0 | 7,407,823 | 100.0 | 158,596 | 100.0% | $7,407,823 | 100.0% | ||||||||
| 2026 | 0 | 0 | 0.0 | 0 | 0.0 | 158,596 | 100.0% | $7,407,823 | 100.0% | ||||||||
| 2027 | 0 | 0 | 0.0 | 0 | 0.0 | 158,596 | 100.0% | $7,407,823 | 100.0% | ||||||||
| 2028 & Beyond | 0 | 0 | 0.0 | 0 | 0.0 | 158,596 | 100.0% | $7,407,823 | 100.0% | ||||||||
| Total | 1 | 158,596 | 100.0% | $7,407,823 | 100.0% | ||||||||||||
| (1) | Based on the underwritten rent roll dated February 1, 2018. |
| (2) | Base Rent Expiring, Cumulative Base Rent Expiring and Cumulative % of Base Rent Expiring reflects the weighted average underwritten base rent over the lease term. |
THE INFORMATION IN THIS STRUCTURAL AND COLLATERAL TERM SHEET IS NOT COMPLETE AND MAY BE AMENDED PRIOR TO THE TIME OF SALE. THIS TERM SHEET IS NOT AN OFFER TO SELL THESE SECURITIES AND IT IS NOT A SOLICITATION OF AN OFFER TO BUY THESE SECURITIES IN ANY JURISDICTION WHERE THE OFFER OR SALE IS NOT PERMITTED.
| | |
111 of 151
| Structural and Collateral Term Sheet | Benchmark 2018-B2 | |
| 600 Clipper | ||
| Operating History and Underwritten Net Cash Flow(1) | ||||
| Underwritten | Per Square Foot | %(2) | ||
| Rents in Place(3) | $7,407,823 | $46.71 | 71.5% | |
| Vacant Income | 0 | 0.00 | 0.0 | |
| Gross Potential Rent | $7,407,823 | $46.71 | 71.5% | |
| Total Reimbursements | 2,952,768 | 18.62 | 28.5 | |
| Net Rental Income | $10,360,591 | $65.33 | 100.0% | |
| (Vacancy/Credit Loss) | (518,030) | (3.27) | (5.0) | |
| Effective Gross Income | $9,842,561 | $62.06 | 95.0% | |
| Total Expenses | $2,952,768 | $18.62 | 30.0% | |
| Net Operating Income | $6,889,793 | $43.44 | 70.0% | |
| Total TI/LC, Capex/RR | 398,778 | 2.51 | 4.1 | |
| Net Cash Flow | $6,491,015 | $40.93 | 65.9% | |
| (1) | The property was acquired in October 2017 and, therefore, historical financial information is not available. |
| (2) | % column represents percent of Net Rental Income for all revenue lines and represents percent of Effective Gross Income for the remainder of the fields. |
| (3) | Rents in Place represents the weighted average underwritten base rent for Volkswagen through its lease expiration, excluding months with abated rent. The current in-place rent is $42.00 per square foot. |
Property Management. The property is managed by Gemini-Rosemont Property Management LLC, a New Mexico limited liability company and an affiliate of the borrower sponsor.
Escrows and Reserves. At origination, the borrower deposited into escrow approximately $5,071,085 for outstanding rent abatements pursuant to the Volkswagen lease, $27,375 for deferred maintenance items (which includes $625 for an environmental reserve to provide secondary containment for several containers of hazardous materials at the property) and approximately $4,626 for replacement reserves. In addition, as part of the acquisition of the property by the borrower, the former owner and seller of the property escrowed $4,147,500 for outstanding tenant improvements with Chicago Title Insurance Company. The lender has received an assignment of the borrower’s interest in the escrow account being held by the Chicago Title Insurance Company.
Tax Escrows - The requirement for the borrower to make monthly deposits to the tax escrow is waived provided that (i) no event of default is then continuing and (ii) the borrower provides the lender with satisfactory evidence that taxes and other charges have been paid on or before the applicable due date.
Insurance Escrows- The requirement for the borrower to make monthly deposits to the insurance escrow is waived provided that (i) no event of default is then continuing and (ii) the borrower provides the lender with satisfactory evidence that the property is insured pursuant to a blanket insurance policy meeting the requirements specified in the loan agreement.
Replacement Reserves- On a monthly basis, the borrower is required to escrow approximately $4,626 (approximately $0.35 per square foot annually) for replacement reserves.
Lockbox / Cash Management.The loan is structured with a hard lockbox and springing cash management. The borrower was required at origination to deliver instruction letters to the tenant at the property directing the tenant to deposit all rents into a lockbox account. If there is no Cash Sweep Period (as defined below) continuing, all funds in the lockbox account are required to be transferred to or at the direction of the borrower. During the continuance of a Cash Sweep Period, all funds in the lockbox account are required to be swept into a cash management account controlled by the lender and disbursed in accordance with the loan documents. To the extent there is a Cash Sweep Period continuing, all excess cash flow after payment of debt service, required reserves and operating expenses is required to be held as additional collateral for the loan. The lender has been granted a security interest in the cash management account.
THE INFORMATION IN THIS STRUCTURAL AND COLLATERAL TERM SHEET IS NOT COMPLETE AND MAY BE AMENDED PRIOR TO THE TIME OF SALE. THIS TERM SHEET IS NOT AN OFFER TO SELL THESE SECURITIES AND IT IS NOT A SOLICITATION OF AN OFFER TO BUY THESE SECURITIES IN ANY JURISDICTION WHERE THE OFFER OR SALE IS NOT PERMITTED.
| | |
112 of 151
| Structural and Collateral Term Sheet | Benchmark 2018-B2 | |
| 600 Clipper | ||
A “Cash Sweep Period” means each period commencing on the occurrence of a Cash Sweep Event (as defined below) and continuing until the earlier of (a) the payment date next occurring following the related Cash Sweep Event Cure (as defined below) or (b) payment in full of all principal and interest on the loan and all other amounts payable under the loan documents in accordance with the terms and provisions of the loan documents.
A “Cash Sweep Event” means the occurrence of (i) an event of default, (ii) any bankruptcy or insolvency action of the borrower or property manager, (iii) the date that the debt service coverage ratio (as calculated in the loan documents) based on the trailing three-month period immediately preceding the date of determination is less than (a) 1.50x for the period from December 28, 2017 through but excluding the payment date occurring in January 2019 and (b) 1.95x for the period from and after the payment date occurring in January 2019 (a “DSCR Trigger Event”), (iv) the date that Volkswagen “goes dark,” vacates or abandons its premises, is the subject of a bankruptcy action, terminates the Volkswagen lease or provides notice that it intends to terminate the Volkswagen lease or vacate its premises (a “Tenant Termination Trigger Event”), (v) the date that is 15 months prior to the scheduled expiration of the Volkswagen lease (currently December 31, 2025) (a “Lease Expiration Trigger Event” ) or (vi) the date that the long-term unsecured credit rating of Volkswagen AG from S&P, Moody’s, Fitch, Morningstar or any other nationally recognized statistical rating agency which has assigned a rating to the securities, is less than “BBB-” or its equivalent (a “Tenant Downgrade Trigger Event”).
A “Cash Sweep Event Cure” means (a) if the Cash Sweep Event is caused solely by the occurrence of a DSCR Trigger Event, the achievement of a debt service coverage ratio, based on the trailing three month period immediately preceding the date of determination, of at least (1) 1.50x for the period from December 28, 2017 through but excluding the payment date occurring in January 2019 and (2) 1.95x for the period from and after the payment date occurring in January 2019, (b) if the Cash Sweep Event is caused by an event of default, the acceptance by the lender of a cure of such event of default (which the lender is not obligated to accept and may reject or accept in its sole and absolute discretion), (c) if the Cash Sweep Event is caused by any bankruptcy or insolvency action of the property manager, the borrower replacing the manager with a qualified manager under a replacement management agreement within 60 days or the dismissal of such bankruptcy or insolvency action without any material adverse consequences to the loan or the property (as determined by the lender in its reasonable discretion), (d) if the Cash Sweep Event is caused by a Tenant Termination Trigger Event, the occurrence of a Tenant Termination Cure (as defined below), (e) if the Cash Sweep Event is caused by Lease Expiration Trigger Event, the occurrence of either (1) the extension of the Volkswagen lease for an additional five-year period in accordance with its terms or (2) the occurrence of a Tenant Termination Cure or (f) if the Cash Sweep Event is caused by a Tenant Downgrade Trigger Event, the date the long-term unsecured credit rating of Volkswagen AG from S&P, Moody’s, Fitch, Morningstar or any other nationally recognized statistical rating agency which has assigned a rating to the securities, is at least “BBB-” or its equivalent. Each Cash Sweep Event Cure is also subject to the following conditions: (1) no event of default has occurred and is continuing, (2) a Cash Sweep Event Cure may occur no more than a total of two times in the aggregate during the term of the loan and (3) the borrower pays the lender’s reasonable expenses incurred in connection with the Cash Sweep Event Cure. The borrower does not have the right to cure a Cash Sweep Event triggered by the occurrence of a bankruptcy or insolvency action of the borrower.
A “Tenant Termination Cure” means the re-tenanting of no less than 75% of the space demised to Volkswagen with one or more replacement tenants pursuant to executed lease(s) approved by lender (which lease(s) are required to extend no less than three years beyond the maturity date of January 1, 2028 and provide for rents that result in a debt service coverage ratio of not less than 1.95x), and providing that for any tenants that have yet taken occupancy, such tenants have no rights to terminate the applicable replacement leases and amounts sufficient to satisfy any free rent, tenant improvement and leasing commission costs with respect to such replacement leases have been reserved with the lender.
THE INFORMATION IN THIS STRUCTURAL AND COLLATERAL TERM SHEET IS NOT COMPLETE AND MAY BE AMENDED PRIOR TO THE TIME OF SALE. THIS TERM SHEET IS NOT AN OFFER TO SELL THESE SECURITIES AND IT IS NOT A SOLICITATION OF AN OFFER TO BUY THESE SECURITIES IN ANY JURISDICTION WHERE THE OFFER OR SALE IS NOT PERMITTED.
| | |
113 of 151
| Structural and Collateral Term Sheet | Benchmark 2018-B2 |
| Worldwide Plaza | |
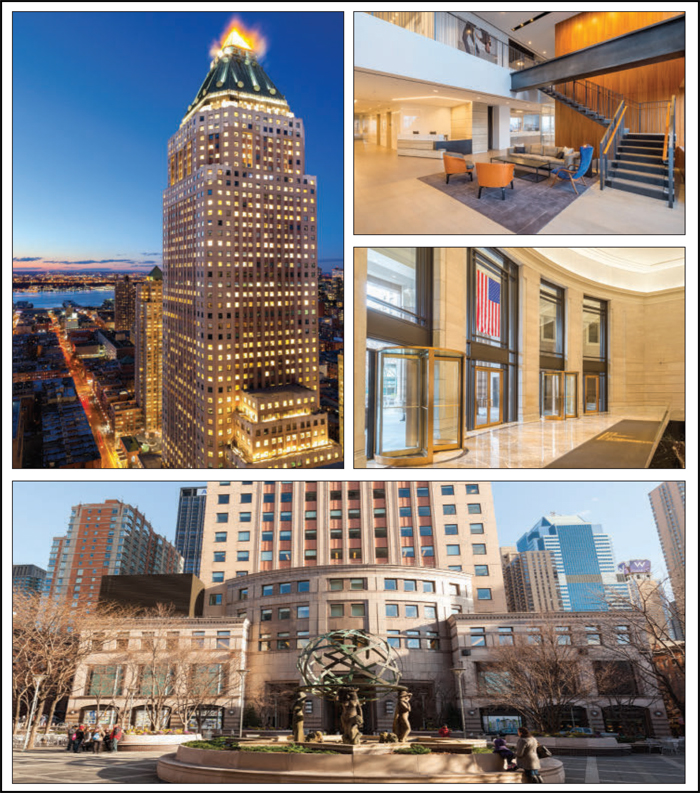
THE INFORMATION IN THIS STRUCTURAL AND COLLATERAL TERM SHEET IS NOT COMPLETE AND MAY BE AMENDED PRIOR TO THE TIME OF SALE. THIS TERM SHEET IS NOT AN OFFER TO SELL THESE SECURITIES AND IT IS NOT A SOLICITATION OF AN OFFER TO BUY THESE SECURITIES IN ANY JURISDICTION WHERE THE OFFER OR SALE IS NOT PERMITTED.
| | |
114 of 151
| Structural and Collateral Term Sheet | Benchmark 2018-B2 |
| Worldwide Plaza | |
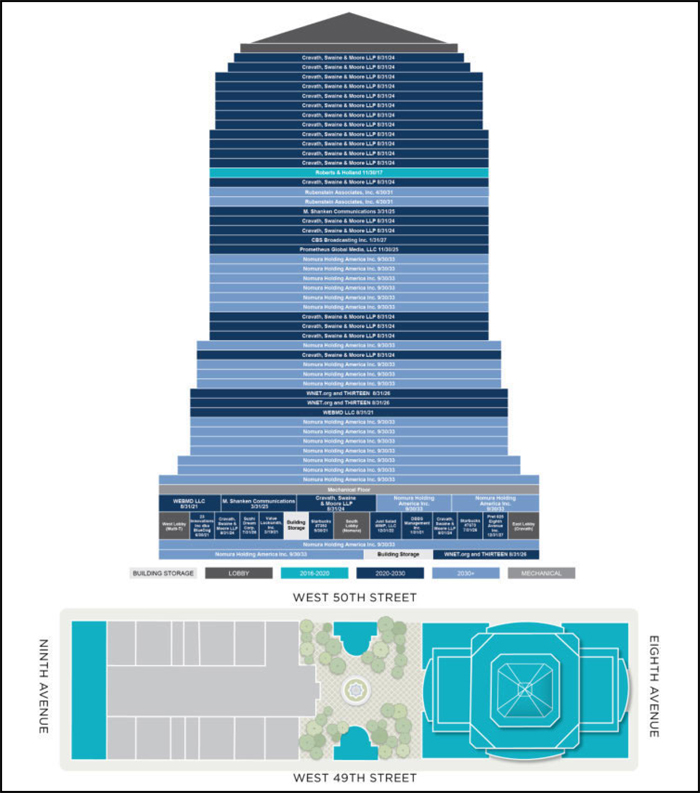
THE INFORMATION IN THIS STRUCTURAL AND COLLATERAL TERM SHEET IS NOT COMPLETE AND MAY BE AMENDED PRIOR TO THE TIME OF SALE. THIS TERM SHEET IS NOT AN OFFER TO SELL THESE SECURITIES AND IT IS NOT A SOLICITATION OF AN OFFER TO BUY THESE SECURITIES IN ANY JURISDICTION WHERE THE OFFER OR SALE IS NOT PERMITTED.
| | |
115 of 151
| Structural and Collateral Term Sheet | Benchmark 2018-B2 |
| Worldwide Plaza | |
THE INFORMATION IN THIS STRUCTURAL AND COLLATERAL TERM SHEET IS NOT COMPLETE AND MAY BE AMENDED PRIOR TO THE TIME OF SALE. THIS TERM SHEET IS NOT AN OFFER TO SELL THESE SECURITIES AND IT IS NOT A SOLICITATION OF AN OFFER TO BUY THESE SECURITIES IN ANY JURISDICTION WHERE THE OFFER OR SALE IS NOT PERMITTED.
| | |
116 of 151
| Structural and Collateral Term Sheet | Benchmark 2018-B2 |
| Worldwide Plaza | |
| Mortgage Loan Information | Property Information | |||
| Mortgage Loan Seller(1): | GACC | Single Asset / Portfolio: | Single Asset | |
| Credit Assessment | Title: | Fee | ||
| (S&P/Fitch/KBRA)(2): | A/BBB+/A- | Property Type - Subtype: | Office - CBD | |
| Original Principal Balance(3): | $50,000,000 | Net Rentable Area (SF)(6): | 2,049,553 | |
| Cut-off Date Principal Balance(3): | $50,000,000 | Location: | New York, NY | |
| % of Pool by IPB: | 3.3% | Year Built / Renovated: | 1987 / 1996 | |
| Loan Purpose: | Refinance | Occupancy(7): | 98.4% | |
| Borrowers: | WWP Office, LLC, WWP Amenities | Occupancy Date: | 6/30/2017 | |
| Holdings, LLC | Number of Tenants: | 35 | ||
| Sponsors(4): | SLGOP, RXR Fund III | 2014 NOI(6): | $68,075,807 | |
| Interest Rate: | 3.6045425532% | 2015 NOI(6): | $72,722,303 | |
| Note Date: | 10/18/2017 | 2016 NOI(6): | $83,174,046 | |
| Maturity Date: | 11/6/2027 | TTM NOI (as of 6/2017)(6): | $80,997,253 | |
| Interest-only Period: | 120 months | UW Economic Occupancy: | 95.0% | |
| Original Term: | 120 months | UW Revenues: | $141,343,932 | |
| Original Amortization: | None | UW Expenses: | $54,051,285 | |
| Amortization Type: | Interest Only | UW NOI(6): | $87,292,647 | |
| Call Protection(5): | L(27),Def(88),O(5) | UW NCF(6): | $85,021,775 | |
| Lockbox / Cash Management: | Hard / Springing | Appraised Value / Per SF(8): | $1,740,000,000 / $849 | |
| Additional Debt: | Yes | Appraisal Date: | 10/1/2017 | |
| Additional Debt Balance: | $566,286,000 / $323,714,000 / $260,000,000 | |||
| Additional Debt Type: | Pari Passu / Subordinate Loans / Mezzanine Loans | |||
| Escrows and Reserves(9) | Financial Information(3) | ||||||
| Initial | Monthly | Initial Cap | Senior Notes | Whole Loan | |||
| Taxes: | $0 | Springing | N/A | Cut-off Date Loan / SF: | $301 | $459 | |
| Insurance: | $0 | Springing | N/A | Maturity Date Loan / SF: | $301 | $459 | |
| Replacement Reserves: | $0 | Springing | $2,500,000 | Cut-off Date LTV(8): | 35.4% | 54.0% | |
| TI/LC: | $0 | Springing | $10,000,000 | Maturity Date LTV(8): | 35.4% | 54.0% | |
| Other: | $0 | Springing | $42,286,860 | UW NCF DSCR(6): | 3.77x | 2.47x | |
| UW NOI Debt Yield(6): | 14.2% | 9.3% | |||||
| Sources and Uses | ||||||
| Sources | Proceeds | % of Total | Uses | Proceeds | % of Total | |
| Senior Notes | $616,286,000 | 42.0% | Loan Payoff | $983,098,561 | 67.0% | |
| Subordinate Notes | 323,714,000 | 22.1 | Closing Costs | 33,991,488 | 2.3% | |
| Mezzanine Loans | 260,000,000 | 17.7 | Return of Equity(10) | 449,536,079 | 30.7% | |
| RXR Equity | 133,069,504 | 9.1 | ||||
| SL Green Equity | 133,061,700 | 9.1 | ||||
| Third Party Expense Deposit | 494,924 | 0.0 | ||||
| Total Sources | $1,466,626,128 | 100.0% | Total Uses | $1,466,626,128 | 100.0% | |
| (1) | The Worldwide Plaza Whole Loan (as defined in “The Loan” section below) was originated by Goldman Sachs Mortgage Company (“GSMC”) on October 18, 2017. Subsequent to the origination date, 25% of the Worldwide Plaza Whole Loan was transferred to Deutsche Bank AG, acting through its New York Branch (“DBNY”), which has re-underwritten such mortgage loan in accordance with the procedures described under “Transaction Parties—The Sponsors and Mortgage Loan Sellers—German American Capital Corporation—DBNY’s Underwriting Guidelines and Processes” in the Preliminary Prospectus. |
| (2) | S&P, Fitch and KBRA have confirmed that the Worldwide Plaza mortgage loan has, in its context of its inclusion in the mortgage pool, credit characteristics consistent with an investment grade obligation. |
| (3) | The Worldwide Plaza mortgage loan is part of a whole loan evidenced by eight seniorpari passu notes, with an aggregate outstanding principal balance as of the Cut-off Date of $616.286 million and two subordinate notes, with an aggregate outstanding principal balance as of the Cut-off Date of $323.714 million. The Senior Notes Financial Information presented in the chart above reflects the Cut-off Date balance of the senior notes, but excludes the related subordinate notes and mezzanine loans. The Whole Loan Financial Information presented in the chart above reflects the Cut-off Date balance of the senior notes and subordinate notes evidencing the Worldwide Plaza Whole Loan, but excludes the mezzanine loans. |
THE INFORMATION IN THIS STRUCTURAL AND COLLATERAL TERM SHEET IS NOT COMPLETE AND MAY BE AMENDED PRIOR TO THE TIME OF SALE. THIS TERM SHEET IS NOT AN OFFER TO SELL THESE SECURITIES AND IT IS NOT A SOLICITATION OF AN OFFER TO BUY THESE SECURITIES IN ANY JURISDICTION WHERE THE OFFER OR SALE IS NOT PERMITTED.
| | |
117 of 151
| Structural and Collateral Term Sheet | Benchmark 2018-B2 |
| Worldwide Plaza | |
| (4) | The sponsors and nonrecourse carve-out guarantors are SLGOP (as defined below) and RXR Fund III (consisting of RXR Real Estate Value Added Fund – Fund III LP, RXR RE VAF – Fund III Parallel A LP, RXR RE VAF – Fund III Parallel B LP, RXR RE VAF – Fund III Parallel B (REIT) LP, RXR RE VAF – Fund III Parallel C LP, and RXR RE VAF – Fund III Parallel D LP). |
| (5) | The lockout period will be at least 27 payment dates beginning with and including the first payment date of December 6, 2017. Defeasance of the full $940.0 million Worldwide Plaza Whole Loan is permitted after the date that is the earlier to occur of (i) October 18, 2020 and (ii) two years from the closing date of the securitization that includes the last note to be securitized. The assumed lockout period of 27 months is based on the expected Benchmark 2018-B2 securitization closing date in February 2018. The actual lockout period may be longer. |
| (6) | UW NOI, UW NCF, the related debt service coverage ratios and debt yields, and historical NOI all include net operating income from the Amenity Parcel (as defined below) and Net Rentable Area (SF) includes square feet of the Amenity Parcel. |
| (7) | As of June 30, 2017, the Worldwide Plaza property had an underwritten occupancy of 98.4% and a physical occupancy of 100.0%. |
| (8) | The Cut-off Date LTV and Maturity Date LTV are based on an appraised value of $1.74 billion that includes separate appraised values for the Office Tower ($1.62 billion) and Amenity Parcel ($120.0 million). As described below under “The Property” the Amenity Parcel does not secure the Worldwide Plaza mortgage loan. Based solely on the appraised value of the Office Tower, the Cut-off Date LTV and Maturity Date LTV of the Senior Notes, the Worldwide Plaza Whole Loan and the total debt (including the mezzanine loans) are 38.0%, 58.0% and 74.1% respectively. |
| (9) | For a full description of Escrows and Reserves, please refer to“Escrows and Reserves”below. |
| (10) | The equity was returned to NY REIT & an affiliate of George Comfort & Sons. |
The Loan. The Worldwide Plaza loan is secured by a first mortgage lien on the borrowers’ fee interest in an office building in New York, New York (the “Office Tower”) and the pledge of certain loans, together with a collateral assignment of the mortgages securing such loans, held by an indirect subsidiary of Amenity Parcel Borrower (as defined below) relating to an adjacent amenities parcel (the “Amenity Parcel”) and the pledge of 100% of the indirect membership interests in such indirect subsidiary and in another indirect subsidiary of the Amenity Parcel Borrower which owns a 1% general partnership interest in the Amenity Parcel owner. The loan is part of a whole loan that has an outstanding principal balance as of the Cut-off Date of $940.0 million (the “Worldwide Plaza Whole Loan”). The Worldwide Plaza Whole Loan is comprised of (i) a senior loan, comprised of eightpari passu notes with an aggregate principal balance as of the Cut-off Date of $616.286 million, two of which, Note A-2-C2 and Note A-2-C4, with an outstanding principal balance as of the Cut-off Date of $50.0 million, are being contributed to the Benchmark 2018-B2 Trust, and the remaining notes have been or are expected to be contributed to other securitization trusts and (ii) a subordinate companion loan, comprised of twopari passu notes, with an aggregate outstanding principal balance as of the Cut-off Date of $323.714 million (collectively, the “Worldwide Plaza Subordinate Companion Loan”), each as described below. The relationship between the holders of the Worldwide Plaza Whole Loan will be governed by a co-lender agreement as described under the “Description of the Mortgage Pool—The Whole Loans—The Non-Serviced AB Whole Loans—The Worldwide Plaza Whole Loan” in the Preliminary Prospectus. The Worldwide Plaza Whole Loan has a 10-year term and will be interest-only for the term of the loan. The most recent prior financing of the Worldwide Plaza property was included in the COMM 2013-WWP securitization.
| Whole Loan Summary | |||||
| Note | Original Balance | Cut-off Date Balance | Note Holder | Controlling Piece | |
| A-1-S, A-2-S | $381,286,000 | $381,286,000 | WPT 2017-WWP | Yes | |
| A-2-C1, A-2-C3 | $50,000,000 | $50,000,000 | Benchmark 2018-B1 | No | |
| A-1-C1 | $100,000,000 | $100,000,000 | GSMS 2017-GS8 | No | |
| A-2-C2, A-2-C4 | $50,000,000 | $50,000,000 | Benchmark 2018-B2 | No | |
| A-1-C2 | $35,000,000 | $35,000,000 | GSMC | No | |
| B-1-S, B-2-S | $323,714,000 | $323,714,000 | WPT 2017-WWP | No | |
| Total | $940,000,000 | $940,000,000 | |||
The Borrowers.The borrowing entities for the Worldwide Plaza Whole Loan are WWP Office, LLC (“Office Tower Borrower”) and WWP Amenities Holdings, LLC (“Amenity Parcel Borrower”), both of which are single purpose entities and Delaware limited liability companies structured to be bankruptcy-remote with two independent directors in each organizational structure.
The Sponsors. The loan sponsors and non-recourse carveout guarantors of the Worldwide Plaza Whole Loan are SL Green Operating Partnership, L.P. (“SLGOP”) and RXR Fund III (consisting of RXR Real Estate Value Added Fund – Fund III LP, RXR RE VAF – Fund III Parallel A LP, RXR RE VAF – Fund III Parallel B LP, RXR RE VAF – Fund III Parallel B (REIT) LP, RXR RE VAF – Fund III Parallel C LP, and RXR RE VAF – Fund III Parallel D LP), on a joint and several basis (except as to events caused solely by SL Green Operating Partnership L.P. or its affiliates or caused solely by RXR Fund III or its affiliates, in which case solely the related guarantor or group of guarantors is liable). The nonrecourse carve-out guarantee is limited to certain carveouts, including (i) loss recourse for any violation of the transfer restrictions contained in the loan documents (other than those that are full recourse) and any unsecured, unpermitted additional debt and (ii) full recourse for insolvency events (capped at $94,000,000), unpermitted transfers of all or substantially all of the Office Tower, the Amenity Parcel, the collateral related to the Amenity Parcel or the equity interests in the borrowers or certain entities related to the Amenity Parcel owned by the borrowers and unpermitted additional debt secured by the collateral. There is no environmental indemnitor for the Worldwide Plaza Whole Loan, other than the borrowers.
THE INFORMATION IN THIS STRUCTURAL AND COLLATERAL TERM SHEET IS NOT COMPLETE AND MAY BE AMENDED PRIOR TO THE TIME OF SALE. THIS TERM SHEET IS NOT AN OFFER TO SELL THESE SECURITIES AND IT IS NOT A SOLICITATION OF AN OFFER TO BUY THESE SECURITIES IN ANY JURISDICTION WHERE THE OFFER OR SALE IS NOT PERMITTED.
| | |
118 of 151
| Structural and Collateral Term Sheet | Benchmark 2018-B2 |
| Worldwide Plaza | |
SL Green Realty Corp. (“SL Green”), the sole general partner of SLGOP, is an S&P 500 company and a large New York City office landlord and a fully integrated real estate investment trust, or “REIT” with a market capitalization of $10.8 billion (as of 2016) that is focused primarily on acquiring and managing Manhattan commercial properties. As of September 30, 2017, SL Green held interests in 118 Manhattan buildings totaling 47.8 million square feet. This included ownership interests in 27.5 million square feet of Manhattan buildings and debt and preferred equity investments secured by 20.3 million square feet of buildings. In addition, as of September 30, 2017, SL Green held ownership interests in 27 suburban buildings totaling 4.3 million square feet in Brooklyn, Long Island, Westchester County, Connecticut and New Jersey.
RXR Realty LLC (“RXR”), which directly or indirectly controls RXR Fund III, is a New York-based, approximately 470-person, vertically integrated real estate owner/operator and investment manager in the New York metropolitan market. RXR is comprised of members of the former senior management and operating team of Reckson Associates (“Reckson”), a NYSE-listed REIT which was acquired by SL Green in January 2007. RXR re-entered the New York City market in August 2009. RXR’s platform manages 75 commercial properties and investments with an aggregate gross asset value of approximately $17.4 billion as of June 30, 2017, consisting of approximately 24.2 million square feet of commercial operating properties and approximately 5,200 multi-family rental and for sale units under active development in the New York metropolitan area (amounts above adjusted to include the assumption of operations of Worldwide Plaza property in October 2017. Gross asset value compiled by RXR in accordance with company fair value measurement policy and is comprised of capital invested by RXR and its partners, as well as leverage).
The Property.The Worldwide Plaza property consists of the Office Tower, a 49-story Class A office property with 1,807,231 square feet located in New York, New York, and the Amenity Parcel (and the related mortgages). The Amenity Parcel consists of multi-tenant retail, a 473-space underground parking garage, a theater space and a health club. The Amenity Parcel does not itself constitute collateral for the Worldwide Plaza Whole Loan. Instead, the collateral relating to the Amenity Parcel includes (i) a pledge by Amenity Parcel Borrower of its indirect 100% ownership interest in a subsidiary which owns a 1% general partnership interest in the owner of the Amenity Parcel, (ii) a pledge by the Amenity Parcel Borrower of its 100% indirect interest in a subsidiary (the “Amenities Lender”) which has made certain loans to the owner of the Amenity Parcel secured by the Amenity Parcel and (iii) a pledge by Amenities Lender of its loans on the Amenity Parcel and the collateral assignment of the related mortgages. Worldwide Plaza (which also includes a residential tower that is not part of the collateral) occupies an entire block bounded by Eighth Avenue and Ninth Avenue and offers 360-degree panoramic views of New York City. The retail, parking garage and health club portions of the Amenity Parcel are part of a condominium which also includes the non-collateral residential tower. The Worldwide Plaza property features a copper tower top known as “David’s Diamond”.
As of June 30, 2017, the Worldwide Plaza property had an underwritten occupancy of 98.4% and a physical occupancy of 100.0%. The Worldwide Plaza property is anchored by Nomura Holding America Inc. (“Nomura”) (Fitch: A- / Moody’s: Baa1 / S&P: A-) and Cravath, Swaine & Moore LLP (“Cravath”) (#46 in an industry publication listing of the top 100 law firms based on 2016 revenue) under long term leases until 2033 and 2024, respectively. Cravath and Nomura have invested over $280 million of their own capital on build-outs including cafeterias with full kitchens, internal staircases, executive dining rooms, media rooms, conference rooms, rooftop (setback) terraces, as well as details and finishes throughout. Cravath has been headquartered at the Worldwide Plaza property since 1989. Nomura signed a lease in June 2011 to locate its North American headquarters in the Worldwide Plaza property.
According to the appraisal, the property is located in the West Side submarket. As of the second quarter of 2017, the overall average rent reached $76.05 per square foot, an increase of $0.85 quarter-over quarter. Class A asking rents increased $1.88 per square foot to $82.28. Class A vacancy fell to 7.7%, a 1.5% decline year-over-year.
THE INFORMATION IN THIS STRUCTURAL AND COLLATERAL TERM SHEET IS NOT COMPLETE AND MAY BE AMENDED PRIOR TO THE TIME OF SALE. THIS TERM SHEET IS NOT AN OFFER TO SELL THESE SECURITIES AND IT IS NOT A SOLICITATION OF AN OFFER TO BUY THESE SECURITIES IN ANY JURISDICTION WHERE THE OFFER OR SALE IS NOT PERMITTED.
| | |
119 of 151
| Structural and Collateral Term Sheet | Benchmark 2018-B2 |
| Worldwide Plaza | |
The following table provides a detailed breakout of the Worldwide Plaza property between the Office Tower and Amenity Parcel:
| Office Tower | Square Feet | Occupied Square Feet | % of Sq. Ft. | Occupancy | U/W Base Rent | U/W Base Rent PSF | U/W Total Rental Income | U/W Total Rental Income PSF | % of U/W Total Rent |
| Office | 1,793,695 | 1,763,177 | 87.5% | 98.3% | $115,660,807 | $65.60 | $123,936,609 | $70.29 | 89.1% |
| Retail - Office | 10,592 | 10,592 | 0.5% | 100.0% | 1,288,114 | $121.61 | 1,406,162 | $132.76 | 1.0% |
| Telecom | 16 | 16 | 0.0% | 100.0% | 106,290 | $6,643.15 | 106,290 | $6,643.15 | 0.1% |
| Other | 2,928 | 0 | 0.1% | 0.0% | 0 | $0.00 | 0 | $0.00 | 0.0% |
| Utility Reimbursements | 4,078,317 | 2.9% | |||||||
| Total / Wtd. Avg. | 1,807,231 | 1,773,785 | 88.2% | 98.1% | $117,055,212 | $65.99 | $129,527,379 | $73.02 | 93.1% |
| Amenity Parcel | Square Feet | Occupied Square Feet | % of Sq. Ft. | Occupancy | U/W Base Rent | U/W Base Rent PSF | U/W Total Rental Income | U/W Total Rental Income PSF | % of U/W Total Rent |
| Theater | 56,934 | 56,934 | 2.8% | 100.0% | $2,205,268 | $38.73 | $2,715,201 | $47.69 | 2.0% |
| Parking Garage | 131,971 | 131,971 | 6.4% | 100.0% | 2,686,244 | $20.35 | 2,686,244 | $20.35 | 1.9% |
| Health Club | 35,241 | 35,241 | 1.7% | 100.0% | 1,800,000 | $51.08 | 1,865,614 | $52.94 | 1.3% |
| Retail - Amenities | 18,176 | 18,176 | 0.9% | 100.0% | 2,109,680 | $116.07 | 2,127,336 | $117.04 | 1.5% |
| Utility Reimbursements | 179,553 | 0.1% | |||||||
| Total / Wtd. Avg. | 242,322 | 242,322 | 11.8% | 100.0% | $8,801,192 | $36.32 | $9,573,948 | $39.51 | 6.9% |
| Total / Wtd. Avg. Worldwide Plaza | 2,049,553 | 2,016,107 | 100.0% | 98.4% | $125,856,404 | $62.43 | $139,101,326 | $69.00 | 100.0% |
According to the appraisal, the property is located in the West Side submarket. As of the second quarter of 2017, the overall average rent reached $76.05 per square foot, an increase of $0.85 quarter-over quarter. Class A asking rents increased $1.88 per square foot to $82.28. Class A vacancy fell to 7.7%, a 1.5% decline year-over-year.
The following table details certain information related to the competitive property set for the Worldwide Plaza property.
| Competitive Property Summary(1) | |||||||
| Property Name | Office | Direct Available Square Feet | Sublease Available Square Feet | Occupancy (Direct) | Occupancy (Total) | Direct Asking Rent | |
| NRA | Low | High | |||||
| 1515 Broadway | 1,721,858 | 0 | 0 | 100.0% | 100.0% | N/A | N/A |
| 1585 Broadway | 1,220,732 | 0 | 0 | 100.0% | 100.0% | N/A | N/A |
| 1633 Broadway | 2,240,000 | 168,355 | 57,845 | 92.5% | 89.9% | $74.00 | $95.00 |
| 1675 Broadway | 747,546 | 78,255 | 0 | 89.5% | 89.5% | $75.00 | $75.00 |
| 750 Seventh Avenue | 533,076 | 0 | 0 | 100.0% | 100.0% | N/A | N/A |
| 787 Seventh Avenue | 1,429,610 | 0 | 0 | 100.0% | 100.0% | N/A | N/A |
| Average / Total / Wtd. Avg. | 1,315,470 | 246,610 | 57,845 | 96.9% | 96.1% | $74.50 | $85.00 |
| (1) | Source: Appraisal. |
| Historical and Current Occupancy(1) | |||
| 2014 | 2015 | 2016 | Current(2) |
| 93.4% | 100.0% | 100.0% | 98.4% |
| (1) | Historical Occupancies are as of December 31 of eachrespective year. |
| (2) | Current Occupancy is as of June 30, 2017.As of June 30, 2017, the Worldwide Plaza property had an underwritten occupancy of 98.4% and a physical occupancy of 100.0%. |
THE INFORMATION IN THIS STRUCTURAL AND COLLATERAL TERM SHEET IS NOT COMPLETE AND MAY BE AMENDED PRIOR TO THE TIME OF SALE. THIS TERM SHEET IS NOT AN OFFER TO SELL THESE SECURITIES AND IT IS NOT A SOLICITATION OF AN OFFER TO BUY THESE SECURITIES IN ANY JURISDICTION WHERE THE OFFER OR SALE IS NOT PERMITTED.
| | |
120 of 151
| Structural and Collateral Term Sheet | Benchmark 2018-B2 |
| Worldwide Plaza | |
| Tenant Summary(1) | ||||||
| Tenant | Ratings(2) Moody’s/S&P/Fitch | Net Rentable Area (SF) | % of Total NRA | Base Rent PSF(3) | % of Total Base Rent | Lease Expiration Date |
| Nomura Holding America Inc.(3)(4) | A- / Baa1 / A- | 819,906 | 40.0% | $49.10 | 32.0% | 9/30/2033 |
| Cravath, Swaine & Moore LLP(5) | NA / NA / NA | 617,135 | 30.1% | $92.80 | 45.5% | 8/31/2024 |
| Mercury Parking LLC(6) | NA / NA / NA | 131,971 | 6.4% | $20.35 | 2.1% | 11/30/2027 |
| WNET.ORG and THIRTEEN | NA / NA / NA | 102,709 | 5.0% | $48.54 | 4.0% | 8/31/2026 |
| Rubenstein Associates, Inc. | NA / NA / NA | 68,432 | 3.3% | $62.00 | 3.4% | 4/30/2031 |
| New World Stages Holding Co.(6) | NA / NA / NA | 56,934 | 2.8% | $38.73 | 1.8% | 5/31/2024 |
| WEBMD LLC. | NA / NA / NA | 50,798 | 2.5% | $54.07 | 2.2% | 8/31/2021 |
| M. Shanken Communications | NA / NA / NA | 38,418 | 1.9% | $58.63 | 1.8% | 3/31/2025 |
| 99th Avenue Holdings LLC(6) | NA / NA / NA | 35,241 | 1.7% | $51.08 | 1.4% | 12/31/2030 |
| Prometheus Global Media, LLC | NA / NA / NA | 33,181 | 1.6% | $57.75 | 1.5% | 11/30/2025 |
| (1) | Based on the underwritten rent roll dated June 30, 2017. |
| (2) | Certain ratings are those of the parent company whether or not the parent guarantees the lease. |
| (3) | Nomura has the right to reduce its space upon 15 months’ notice prior to January 1, 2022 (if it has not exercised an expansion option in the prior 12 months) by a single contiguous block of space and/or any full or partial floor of its space that is not contiguous to any other space then leased by Nomura so long as the total contraction space includes no more than 10% of its rentable square footage. Nomura may also reduce its space in the same manner once after January 1, 2022 and prior to January 1, 2027. Both contraction options are subject to certain payments associated with the option. Nomura also has a one-time right to terminate its lease, in whole or in part, as of January 1, 2027 upon 18 months’ notice upon payment of a termination fee equal to six months fixed rent on the terminated space and certain costs associated with the termination. |
| (4) | Nomura has three, five or ten-year extension options and a fourth five-year option, which may be exercised to extend the term of the lease for no more than a total of 20 years. |
| (5) | Cravath subleases approximately 29,688 square feet on the 18th floor to AMA Consulting Engineers, P.C. at a base rent of approximately $54.65 per square foot. Cravath subleases 34,210 square feet on the 31st floor to McCarter & English LLP at a base rent of $51.00 per square foot. Cravath defined these spaces as non-attorney spaces and, as their space needs changed over time, decided to sublease the space. The subleases are structured to be coterminous with the rest of the Cravath space. |
| (6) | Mercury Parking LLC, New World Stages Holding Co. and 99th Avenue Holdings LLC are located in the Amenity Parcel, the other top ten tenants are located in the Office Tower. |
| Lease Rollover Schedule(1)(2) | |||||||||
| Year | Number of Leases Expiring(3) | Net Rentable Area Expiring | % of NRA Expiring | Base Rent Expiring | % of Base Rent Expiring | Cumulative Net Rentable Area Expiring | Cumulative % of NRA Expiring(4) | Cumulative Base Rent Expiring | Cumulative % of Base Rent Expiring |
| Vacant(3) | NAP | 33,446 | 1.6% | NAP | NAP | 33,446 | 1.6% | NAP | NAP |
| 2018 & MTM(4) | 7 | 4,703 | 0.2 | $613,453 | 0.5% | 38,149 | 1.8% | $613,453 | 0.5% |
| 2019 | 2 | 2 | 0.0 | 29,400 | 0.0 | 38,151 | 1.8% | $642,853 | 0.5% |
| 2020 | 2 | 2,343 | 0.1 | 367,843 | 0.3 | 40,494 | 1.9% | $1,010,696 | 0.8% |
| 2021 | 7 | 59,759 | 2.9 | 3,694,878 | 2.9 | 100,253 | 4.8% | $4,705,574 | 3.7% |
| 2022 | 1 | 1,819 | 0.1 | 171,944 | 0.1 | 102,072 | 4.9% | $4,877,517 | 3.8% |
| 2023 | 0 | 0 | 0.0 | 0 | 0.0 | 102,072 | 4.9% | $4,877,517 | 3.8% |
| 2024 | 2 | 674,069 | 32.9 | 59,474,650 | 47.3 | 776,141 | 37.8% | $64,352,167 | 51.1% |
| 2025 | 3 | 71,609 | 3.5 | 4,186,758 | 3.3 | 847,750 | 41.3% | $68,538,925 | 54.4% |
| 2026 | 4 | 105,580 | 5.2 | 5,510,721 | 4.4 | 953,330 | 46.5% | $74,049,646 | 58.8% |
| 2027 | 4 | 167,071 | 8.2 | 5,125,578 | 4.1 | 1,120,401 | 54.7% | $79,175,225 | 62.9% |
| 2028 | 0 | 0 | 0.0 | 0 | 0.0 | 1,120,401 | 54.7% | $79,175,225 | 62.9% |
| 2029 & Beyond | 4 | 929,152 | 45.3 | 46,681,179 | 37.1 | 2,049,553 | 100.0% | $125,856,404 | 100.0% |
| Total | 36 | 2,049,553 | 100.0% | $125,856,404 | 100.0% | ||||
| (1) | Based on the underwritten rent roll dated June 30, 2017. |
| (2) | Certain tenants may have termination or contraction options (which may become exercisable prior to the originally stated expiration date of the tenant lease) that are not considered in the above Lease Rollover Schedule. |
| (3) | Vacant space includes a storage space in the Office Tower, with no associated Base Rent. |
| (4) | Includes telecommunications services at the Worldwide Plaza property. |
THE INFORMATION IN THIS STRUCTURAL AND COLLATERAL TERM SHEET IS NOT COMPLETE AND MAY BE AMENDED PRIOR TO THE TIME OF SALE. THIS TERM SHEET IS NOT AN OFFER TO SELL THESE SECURITIES AND IT IS NOT A SOLICITATION OF AN OFFER TO BUY THESE SECURITIES IN ANY JURISDICTION WHERE THE OFFER OR SALE IS NOT PERMITTED.
| | |
121 of 151
| Structural and Collateral Term Sheet | Benchmark 2018-B2 |
| Worldwide Plaza | |
Operating History and Underwritten Net Cash Flow
| |||||||
| 2014 | 2015 | 2016 | TTM(1) | Underwritten | Per Square Foot | %(2) | |
| Rents in Place(3) | $109,386,364 | $112,900,860 | $121,265,796 | $121,285,946 | $125,856,404 | $61.41 | 85.0% |
| Credit Tenant Rent Steps(4) | 0 | 0 | 0 | 0 | 6,534,145 | 3.19 | 4.4 |
| Vacant Income | 0 | 0 | 0 | 0 | 2,441,440 | 1.19 | 1.6 |
| Gross Potential Rent | $109,386,364 | $112,900,860 | $121,265,796 | $121,285,946 | $134,831,989 | $65.79 | 91.1% |
| Total Reimbursements | 7,973,726 | 10,495,072 | 13,378,603 | 12,076,066 | 13,244,922 | 6.46 | 8.9 |
| Net Rental Income | 117,360,090 | 123,395,933 | 134,644,398 | 133,362,012 | 148,076,911 | 72.25 | 100.0% |
| Other Income | 610,797 | 729,513 | 805,522 | 583,491 | 706,175 | 0.34 | 0.5 |
| (Vacancy/Credit Loss) | 0 | 0 | 0 | 0 | (7,439,154) | (3.63) | (5.0) |
| Effective Gross Income | $117,970,886 | $124,125,445 | $135,449,920 | $133,945,503 | $141,343,932 | $68.96 | 95.5% |
| Total Expenses | 49,895,080 | 51,403,142 | 52,275,875 | 52,948,250 | 54,051,285 | 26.37 | 38.2% |
| Net Operating Income(5) | $68,075,807 | $72,722,303 | $83,174,046 | $80,997,253 | $87,292,647 | $42.59 | 61.8% |
| Total TI/LC, Capex/RR | 0 | 0 | 0 | 0 | 2,270,872 | 1.11 | 1.6 |
| Net Cash Flow | $68,075,807 | $72,722,303 | $83,174,046 | $80,997,253 | $85,021,775 | $41.48 | 60.2% |
| (1) | TTM reflects the trailing 12-month period ending June 30, 2017. |
| (2) | % column represents percent of Net Rental Income for all revenue lines and represents percent of Effective Gross Income for the remainder of the fields. |
| (3) | Underwritten Rents in Place include rent steps through November 30, 2018. |
| (4) | Underwritten Credit Tenant Rent Steps includes the present value of rent steps for Cravath, as well as credit tenants Nomura and Starbucks, discounted at 7% over the respective lease terms. |
| (5) | The increase in Underwritten Net Operating Income from TTM Net Operating Income is primarily driven by the inclusion of underwritten rent steps, which equate to (i) for non-investment grade tenants, base rent steps through November 2018 (an aggregate of $3,206,217), and (ii) for investment grade tenants as described above, the present value of rent steps discounted at 7% over the respective lease terms. |
Property Management.The Office Tower portion of the collateral is managed by WWP Manager JV LLC, an affiliate of the borrowers. The Amenities Parcel is also managed by WWP Manager JV LLC.
Escrows and Reserves.
Tax and Insurance Reserves - On each monthly payment date during the continuance of a Trigger Period (as defined below), the borrowers are required to deposit an amount equal to (i) 1/12 of the estimated annual taxes and (ii) 1/12 of the estimated annual insurance premiums, each into the basic carrying costs escrow account.
Replacement Reserve - On each monthly payment date during the continuance of a Trigger Period, the borrowers are required to deposit an amount equal to approximately $42,699 (approximately $0.25 per square footper annum on the gross square feet of 2,049,533), subject to a cap of $2,500,000.
TI/LC Reserve - On each monthly payment date during the continuance of a Trigger Period, the borrowers are required to deposit an amount equal to approximately $282,230 (approximately $2.00 per square footper annum on the rentable square feet of 1,693,382), subject to a cap of $10,000,000.
The borrowers are permitted at their election to substitute one or more Qualifying Guaranties (as defined below) or letters of credit meeting the requirements of the loan documents in lieu of cash reserves (other than for the excess cash flow reserve). The aggregate letters of credit and Qualifying Guaranties in lieu of reserves as described above and under “Lockbox/Cash Management” may not exceed $120,000,000 (the “Affiliate Support Limit”).
Cravath Reserve – A “Cravath Reserve Period” will commence 12 months prior to the lease expiration of Cravath in August 2024, if a new or renewed Cravath lease has not been executed for all or substantially all of such space, or all or substantially all of the space leased by Cravath has not been re-leased, in each case in accordance with the terms of the loan agreement, and in each case all associated expenses have been paid and all associated free rent periods have expired (a “Cravath Renewal Event”) the lender will trap all excess cash flow after operating expenses and capital expenditures (and, during a Trigger Period, debt service and required reserves) into a reserve for tenant improvements and leasing commissions incurred in reletting the Cravath space (the “Cravath Rollover Reserve”) until the earlier of (i) a Cravath Renewal Event occurs and (ii) a reserve equal to $42,286,860 (the “Cravath Reserve Amount”) has been accumulated.
THE INFORMATION IN THIS STRUCTURAL AND COLLATERAL TERM SHEET IS NOT COMPLETE AND MAY BE AMENDED PRIOR TO THE TIME OF SALE. THIS TERM SHEET IS NOT AN OFFER TO SELL THESE SECURITIES AND IT IS NOT A SOLICITATION OF AN OFFER TO BUY THESE SECURITIES IN ANY JURISDICTION WHERE THE OFFER OR SALE IS NOT PERMITTED.
| | |
122 of 151
| Structural and Collateral Term Sheet | Benchmark 2018-B2 |
| Worldwide Plaza | |
The borrowers are permitted to substitute a letter of credit or Qualifying Guaranty in lieu of cash reserves in an amount up to the amount that would not violate the Affiliate Support Limit. Upon the borrowers reletting of at least 75% of the rentable square footage of the Cravath space, provided no event of default exists, amounts in the Cravath Rollover Reserve in excess of the sum of (x) $100 PSF of Cravath space that has not been relet in accordance with the loan agreement plus (y) any unpaid tenant improvement costs, leasing commissions and free rent obligations under the replacement leases is required to be released to the borrowers (or if a Trigger Event then exists, to the excess cash flow reserve).
“Qualifying Guaranty” means a guaranty in form and substance reasonably satisfactory to the lender from one or more Qualified Guarantors (as defined below) (jointly and severally) reasonably satisfactory to the lender that at all times (i) have and maintain a collective net worth of at least $250,000,000 (excluding the Office Tower, the Amenity Parcel and the collateral relating to the Amenity Parcel) and (ii) at least one of which is rated at least “BBB-” by S&P, “Baa3” by Moody’s, and the equivalent rating by each of the other rating agencies engaged to rate the securities issued in connection with a securitization of the Worldwide Plaza Whole Loan that maintains a rating for such entity.
“Qualified Guarantor” means a person or entity that (a) maintains a place of business in, and is subject to service of process in, the United States, (b) has all or substantially all of its assets in the United States, or otherwise has assets in the United States of substantially greater net value than its aggregate obligations under the loan documents and (c) satisfies certain anti-terrorism law requirements.
Lockbox / Cash Management. The Office Tower portion of the collateral securing the Worldwide Plaza Whole Loan is structured with a hard lockbox and springing cash management. The borrowers are required to direct Office Tower tenants to pay rent directly to a lender-controlled lockbox account and all rents and other payments received by the borrowers or the property manager with respect to the Office Tower to be deposited into the lockbox account by the end of the first business day following receipt. If no event of default, Cravath Reserve Period or Trigger Period is continuing, on each business day, all amounts in the lender-controlled lockbox account will be released to the borrowers’ operating account. On each business day during the continuance of an event of default under the Worldwide Plaza Whole Loan, a Cravath Reserve Period or a Trigger Period, all funds in the lockbox account (less any required minimum balance) are required to be swept into a lender controlled cash management account. During the continuance of a Trigger Period, (or at the lender’s discretion, during an event of default under the Worldwide Plaza Whole Loan until the Worldwide Plaza Whole Loan has been accelerated), the loan documents require that all amounts on deposit in the cash management account be used to pay debt service, required reserves and operating expenses, and that all remaining amounts be reserved in an excess cash flow reserve account. During the continuance of a Cravath Reserve Period, if no Trigger Period or event of default is then continuing, the loan documents require that all amounts on deposit in the cash management account be applied to pay debt service, operating expenses, then to the Cravath Rollover Reserve until the amount therein equals the Cravath Reserve Amount (as defined below), minus the amount of any guaranty or letter of credit provided in lieu of such reserve, and then to the borrowers’ operating account.
The Amenity Parcel Borrower, the pledgor of the collateral related to the Amenity Parcel, has caused the Amenities Lender to establish a springing lockbox account to which cash and revenue related to the Amenity Parcel are deposited. During the continuance of a Trigger Period, the Amenity Parcel Borrower is required to cause the Amenities Lender not to make any remittances from the amenities lockbox account except generally to pay expenses of the Worldwide Plaza property, to the lockbox account or cash management account or certain other specified payments not to exceed $300,000 a year.
A “Trigger Period” will commence (a) when the aggregate debt yield (based on the sum of the Worldwide Plaza Whole Loan, and all outstanding mezzanine loans and/or permitted debt-like preferred equity) as of the first day of any fiscal quarter based on the net operating income is less than 5.50% and will continue until the aggregate debt yield as of the first day of any fiscal quarter is at least 5.50%, (b) at the lender’s option, if certain financial statements required to be delivered by the borrowers are not delivered until such financial statements are delivered and reflect that no Trigger Period pursuant to clause (a) is ongoing or (c) upon any event of default under a mezzanine loan and will continue until cured. The borrowers may cure a Trigger Period under clause (a) by delivering as additional collateral cash, a letter of credit meeting certain requirements or a Qualifying Guaranty, in each case in an aggregate amount that when subtracted from principal for purposes of determining the debt yield, would cause the debt yield to exceed 5.50%. Such collateral is required to be released to the borrowers if the debt yield exceeds 5.50% without giving effect to such collateral.
THE INFORMATION IN THIS STRUCTURAL AND COLLATERAL TERM SHEET IS NOT COMPLETE AND MAY BE AMENDED PRIOR TO THE TIME OF SALE. THIS TERM SHEET IS NOT AN OFFER TO SELL THESE SECURITIES AND IT IS NOT A SOLICITATION OF AN OFFER TO BUY THESE SECURITIES IN ANY JURISDICTION WHERE THE OFFER OR SALE IS NOT PERMITTED.
| | |
123 of 151
| Structural and Collateral Term Sheet | Benchmark 2018-B2 |
| Worldwide Plaza | |
Additional Debt.The Worldwide Plaza Whole Loan includes the Worldwide Plaza Subordinate Companion Loan with an original principal balance of $323,714,000, which notes were contributed to the Worldwide Plaza Trust 2017-WWP securitization trust. In addition to the Worldwide Plaza Whole Loan, a $190,000,000 mezzanine loan (the “Worldwide Plaza Mezzanine Loan (First)”), and a $70,000,000 second mezzanine loan (the “Worldwide Plaza Mezzanine Loan (Second)”) (collectively the, “Worldwide Plaza Mezzanine Loans”) were originated to provide financing to the parent of the borrowers and its parent secured by a pledge of 100% of the direct equity interests in the borrowers and the parent of the borrowers, respectively. The Worldwide Plaza Mezzanine Loan (First) carries an interest rate of 5.1170%per annumand the Worldwide Plaza Mezzanine Loan (Second) carries an interest rate of 6.000%per annumand both are coterminous with the Worldwide Plaza Whole Loan. The lenders of the Worldwide Plaza Whole Loan and the Worldwide Plaza Mezzanine Loans entered into intercreditor agreements that provide for consent rights, cure rights and the right to purchase defaulted loans. The Worldwide Plaza Mezzanine Loans were originated by Goldman Sachs Mortgage Company, which subsequently sold a 25% interest therein to DBNY. Thereafter the mezzanine loans were sold to third party purchasers. Based on the total combined debt of $1.2 billion, the Cut-off Date LTV, Maturity Date LTV, UW NCF DSCR and UW NOI Debt Yield are 69.0%, 69.0%, 1.75x and 7.3%, respectively.
Permitted Mezzanine Debt. The loan documents permit additional mezzanine debt (or equivalent debt-like preferred equity) that is structurally subordinate to the Worldwide Plaza Whole Loan and the existing Worldwide Plaza Mezzanine Loans, subject to certain conditions, including without limitation (a) such debt is provided by an institutional lender meeting certain requirements, (b) such debt is subject to an intercreditor agreement (or recognition agreement, as applicable) on substantially the same terms as the intercreditor agreement among the lender, the mezzanine lenders or otherwise on terms reasonably acceptable to the lender, (c) such debt is coterminous with the Worldwide Plaza Whole Loan (provided however, there shall be no restriction on the related borrower’s right to prepay, defease or redeem such debt prior to the applicable maturity or redemption date), (d) immediately after giving effect to the additional debt, the aggregate debt yield (based on the aggregate of the principal balances of the Worldwide Plaza Whole Loan, the Worldwide Plaza Mezzanine Loans and the principal balance of the proposed mezzanine loan or preferred equity) as calculated under the loan documents may not be less than 7.45% and the aggregate loan-to-value ratio (based on the ratio of (i) the aggregate of the principal balances of the Worldwide Plaza Whole Loan, the Worldwide Plaza Mezzanine Loans and the maximum principal balance of the proposed mezzanine loan or preferred equity to (ii) the appraised value of the Office Tower and Amenity Parcel) does not exceed 65.5%, (e) the lease with Cravath or a lease with an acceptable replacement tenants meeting certain requirements has been extended at least two years beyond the loan term, (f) such debt does not at any time have an outstanding principal amount in excess of $120 million, (g) such debt is current-pay only, with no payment in kind or similar accrual features, (h) rating agency confirmation has been received, (i) such debt may not be obtained prior to April 18, 2018 and (j) the prior written approval of each mezzanine lender (which may not be withheld if such mezzanine lender reasonably determines that the foregoing conditions have been satisfied) is obtained. Goldman Sachs Mortgage Company (or its designee) has a right of first offer to provide any such permitted financing.
THE INFORMATION IN THIS STRUCTURAL AND COLLATERAL TERM SHEET IS NOT COMPLETE AND MAY BE AMENDED PRIOR TO THE TIME OF SALE. THIS TERM SHEET IS NOT AN OFFER TO SELL THESE SECURITIES AND IT IS NOT A SOLICITATION OF AN OFFER TO BUY THESE SECURITIES IN ANY JURISDICTION WHERE THE OFFER OR SALE IS NOT PERMITTED.
| | |
124 of 151
| Structural and Collateral Term Sheet | Benchmark 2018-B2 |
[THIS PAGE INTENTIONALLY LEFT BLANK]
THE INFORMATION IN THIS STRUCTURAL AND COLLATERAL TERM SHEET IS NOT COMPLETE AND MAY BE AMENDED PRIOR TO THE TIME OF SALE. THIS TERM SHEET IS NOT AN OFFER TO SELL THESE SECURITIES AND IT IS NOT A SOLICITATION OF AN OFFER TO BUY THESE SECURITIES IN ANY JURISDICTION WHERE THE OFFER OR SALE IS NOT PERMITTED.
| | |
125 of 151
| Structural and Collateral Term Sheet | Benchmark 2018-B2 | |
| 64 Wooster Street | ||
| Mortgage Loan Information | Property Information | |||
| Mortgage Loan Seller: | CREFI | Single Asset / Portfolio: | Single Asset | |
| Original Principal Balance: | $48,000,000 | Title: | Fee | |
| Cut-off Date Principal Balance: | $48,000,000 | Property Type - Subtype: | Mixed Use – Office/Retail | |
| % of Pool by IPB: | 3.2% | Net Rentable Area (SF): | 55,500 | |
| Loan Purpose: | Refinance | Location: | New York, NY | |
| Borrower: | Wooster LLC | Year Built / Renovated: | 1900 / 2014 | |
| Sponsor: | Esshagh Dario Zar | Occupancy: | 100.0% | |
| Interest Rate: | 4.39000% | Occupancy Date: | 12/13/2017 | |
| Note Date: | 12/13/2017 | Number of Tenants: | 10 | |
| Maturity Date: | 1/6/2028 | 2014 NOI: | $2,641,356 | |
| Interest-only Period: | 120 months | 2015 NOI: | $2,744,158 | |
| Original Term: | 120 months | 2016 NOI: | $3,267,933 | |
| Original Amortization: | None | TTM NOI (as of 9/2017): | $3,214,260 | |
| Amortization Type: | Interest Only | UW Economic Occupancy: | 95.0% | |
| Call Protection: | L(25),Def(90),O(5) | UW Revenues: | $3,986,351 | |
| Lockbox / Cash Management: | Hard / Springing | UW Expenses: | $733,591 | |
| Additional Debt: | N/A | UW NOI: | $3,252,760 | |
| Additional Debt Balance: | N/A | UW NCF: | $3,073,875 | |
| Additional Debt Type: | N/A | Appraised Value / Per SF: | $80,000,000 / $1,441 | |
| Appraisal Date: | 11/1/2017 | |||
| Escrows and Reserves | Financial Information | |||||||
| Initial | Monthly | Initial Cap | Cut-off Date Loan / SF: | $865 | ||||
| Taxes: | $85,369 | $42,685 | N/A | Maturity Date Loan / SF: | $865 | |||
| Insurance: | $53,304 | $4,846 | N/A | Cut-off Date LTV: | 60.0% | |||
| Replacement Reserves: | $0 | $925 | N/A | Maturity Date LTV: | 60.0% | |||
| TI/LC(1): | $300,000 | Springing | $300,000 | UW NCF DSCR: | 1.44x | |||
| Free Rent: | $257,409 | $0 | N/A | UW NOI Debt Yield: | 6.8% | |||
| Sources and Uses | ||||||
| Sources | Proceeds | % of Total | Uses | Proceeds | % of Total | |
| Mortgage Loan | $48,000,000 | 100.0% | Payoff Existing Debt | $37,037,194 | 77.2% | |
| Closing Costs | 1,142,016 | 2.4 | ||||
| Upfront Reserves | 696,083 | 1.5 | ||||
| Return of Equity(2) | 9,124,707 | 19.0 | ||||
| Total Sources | $48,000,000 | 100.0% | Total Uses | $48,000,000 | 100.0% | |
| (1) | On each monthly payment date in which the TI/LC reserve balance is less than $300,000, the borrower is required to make monthly deposits equal to $12,500. |
| (2) | Return of Equity includes $3,750,000 used to buy out a minority limited partner of the sponsor. |
The Loan. The 64 Wooster Street loan has an outstanding principal balance as of the Cut-off Date of $48.0 million (the “64 Wooster Street Loan”) and is secured by a first mortgage lien on the borrower’s fee interest in two conjoined eight-story buildings consisting of 55,500 square feet of mixed use office and retail space, as well as four residential apartments, located in New York, New York.
The borrowing entity for the 64 Wooster Street Loan is Wooster LLC, a Delaware limited liability company and special purpose entity. The loan sponsor and nonrecoursecarve-out guarantor for the 64 Wooster Street Loan is Esshagh Dario Zar, the President and one of the principals of Zar Property NY. Zar Property NY, located in Midtown Manhattan, and its principals, Esshagh Dario Zar, his brother and his nephew, have been owners and operators of residential, retail and office properties in New York City for over 20 years. Their current portfolio consists of approximately 500 residential apartments and over two million square feet of office and retail space.
The Property.The 64 Wooster Street property is a 55,500 square foot mixed use office and retail property located in the SoHo neighborhood of New York City. Constructed in 1900, the 64 Wooster Street property consists of two conjoined eight-story loft-style buildings that share a common elevator and are currently 100.0% occupied by ten tenants. The tenant mix at the 64 Wooster Street
THE INFORMATION IN THIS STRUCTURAL AND COLLATERAL TERM SHEET IS NOT COMPLETE AND MAY BE AMENDED PRIOR TO THE TIME OF SALE. THIS TERM SHEET IS NOT AN OFFER TO SELL THESE SECURITIES AND IT IS NOT A SOLICITATION OF AN OFFER TO BUY THESE SECURITIES IN ANY JURISDICTION WHERE THE OFFER OR SALE IS NOT PERMITTED.
| | |
126 of 151
| Structural and Collateral Term Sheet | Benchmark 2018-B2 | |
| 64 Wooster Street | ||
property consists of five office tenants, four Interim Multiple Dwelling (“IMD”) tenants and Glasgow Caledonian University New York (“GCU New York”) which occupies the ground floor retail space and basement for use as a school. The IMD tenants are rent stabilized and have the right to occupy their respective apartments in perpetuity if not in default. The “Loft Law”, which covers the IMD tenants, is a New York state law designed to protect residential tenants who are living in commercial buildings by requiring the buildings to meet residential fire and safety codes, and providing certain rent protections to such residential tenants. The 64 Wooster Street property features ground retail ceiling heights ranging from 18 to 20 feet and ceiling heights ranging from 12 to 16 feet for the upper floors.
The largest tenant, GCU New York, currently occupies 13,500 square feet of retail space (24.3% of net rentable area and 45.2% of underwritten base rent) through March 2029 with no renewal options. Glasgow Caledonian University is a public, non-profit university in Glasgow, Scotland which was formed in 1993 by the merger of The Queen’s College, Glasgow and Glasgow Polytechnic. In September 2013 Glasgow Caledonian University launched a campus in New York and took occupancy of 6,500 square feet of ground floor retail space and 7,000 square feet of space located in the basement at the 64 Wooster Street property. GCU New York utilizes its entire 13,500 square feet of space for use as a school and is currently operating as the British School of Fashion. In 2014, GCU New York invested approximately $2.5 million to complete the build out of its space.
The office portion of the 64 Wooster Street property consists of 27,000 square feet and is currently 100% occupied by five tenants. The largest office tenant, Harbinger Group (“HRG Group”), currently subleases 6,000 square feet located on the second floor to TodayTix, Inc. (10.8% of net rentable area and approximately 12.6% of underwritten base rent) and subleases 6,000 square feet located on the third floor to Keystone Strategy, LLC (10.8% of net rentable area and approximately 11.7% of underwritten base rent). The HRG Group is a diversified holding company which is publicly traded on the New York Stock Exchange, headquartered in New York, New York, and, through its subsidiaries, provides various branded consumer products and services in over 160 countries. TodayTix, Inc. sells theater tickets to Broadway and Off-Broadway shows through a mobile application and provides hand-delivery to buyers outside the show venue. The current sublease with TodayTix, Inc. on the second floor expires on November 29, 2018. Keystone Strategy, LLC, a strategy and economics consulting firm, has signed a direct lease to take over the 6,000 square feet of space that it is currently subleasing on the third floor. The direct lease will commence upon expiration of the current sublease with HRG Group in November 2018 and expire on November 30, 2022. No office tenant at the 64 Wooster Street property has a renewal option under its respective lease.
Four IMD tenants, located on the fifth, seventh and eighth floors, occupy 15,000 square feet of space at the 64 Wooster Street property (27.0% of net rentable area and 1.4% of underwritten base rent). The four IMD tenants have been in occupancy since the 1970’s and are currently paying rent from $2.98 per square foot to $4.66 per square foot, which is substantially below the appraisal’s concluded market rent of $84.00 per square foot.
The Market. The 64 Wooster Street property is located on the east side of Wooster Street between Broome Street and Spring Street in the SoHo neighborhood of Manhattan, a 26-block area bound by Houston Street to the north, Crosby Street to the east, Canal Street to the south and West Broadway to the west. The 64 Wooster Street property benefits from its location within walking distance of the A, B, C, D, F, M, E, No. 1 and No. 6 subway lines as well as several bus stops. According to the appraisal, the 2016 estimated population in New York City was 8.5 million and the average and median household incomes were $84,794 and $52,185, respectively.
As of year-end 2017, the SoHo retail submarket had a direct vacancy rate of 4.4%. The appraisal concluded to a market rent for retail space on Wooster Street equal to $225.00 per square foot on the grade level and $60.00 per square foot for basement level space. Both of the appraisal’s concluded market rents mentioned above are based on modified gross reimbursements and 3.0% annual rent escalations. Based on the appraisal’s concluded market retail rents, the blended market rent for the GCU New York space is $139.44 per square foot. The blended underwritten base rent for GCU New York’s space of $128.81 per square foot is below the appraisal’s market conclusion.
As of the third quarter of 2017, the SoHo office submarket had a total office inventory of approximately 3.9 million square feet and a direct vacancy rate of 9.5%. The appraisal concluded to a submarket rent for office space in SoHo of $84.00 per square foot. The appraisal’s concluded submarket rent mentioned above is based on modified gross reimbursements, free rent concessions equal to eight months and 3.0% annual rent escalations. The weighted average underwritten base rent for office space at the 64 Wooster Street property of $76.19 per square foot is below the appraisal’s concluded submarket rent.
THE INFORMATION IN THIS STRUCTURAL AND COLLATERAL TERM SHEET IS NOT COMPLETE AND MAY BE AMENDED PRIOR TO THE TIME OF SALE. THIS TERM SHEET IS NOT AN OFFER TO SELL THESE SECURITIES AND IT IS NOT A SOLICITATION OF AN OFFER TO BUY THESE SECURITIES IN ANY JURISDICTION WHERE THE OFFER OR SALE IS NOT PERMITTED.
| | |
127 of 151
| Structural and Collateral Term Sheet | Benchmark 2018-B2 | |
| 64 Wooster Street | ||
| Tenant Summary(1) | |||||||
| Tenant | Ratings(2) Moody’s/S&P/Fitch | Net Rentable Area (SF) | % of Total NRA | Base Rent PSF(3) | % of Total Base Rent(3) | Lease Expiration Date | |
| GCU New York(4) | NA / NA / NA | 13,500 | 24.3% | $128.81 | 45.2% | 3/31/2029 | |
| Harbinger Group(5) | Caa1 / B+ / NA | 12,000 | 21.6% | $78.04 | 24.3% | 11/30/2018 | |
| Steven Meisel | NA / NA / NA | 6,000 | 10.8% | $77.90 | 12.1% | 11/30/2023 | |
| Kaleidoscope | NA / NA / NA | 6,000 | 10.8% | $70.02 | 10.9% | 7/31/2026 | |
| Moulton Dermatology | NA / NA / NA | 3,000 | 5.4% | $77.70 | 6.1% | 1/31/2027 | |
| IMD Tenants(6) | NA / NA / NA | 15,000 | 27.0% | $3.67 | 1.4% | Various | |
| (1) | Based on the underwritten rent roll dated December 13, 2017. |
| (2) | Ratings provided are for the parent company of the entity listed in the “Tenant” field whether or not the parent company guarantees the lease. |
| (3) | Base Rent PSF and % of Total Base Rent include $96,400 of contractual rent steps through December 2018. |
| (4) | GCU New York leases 6,500 square feet of ground level retail space and 7,000 square feet of basement space. |
| (5) | HRG Group currently subleases 6,000 square feet of its space on the second floor to TodayTix, Inc. and 6,000 square feet of its space on the third floor to Keystone Strategy, LLC, each through November 2018. Keystone Strategy, LLC has executed a lease commencing on December 1, 2018 and expiring on November 30, 2022 for the third floor space. |
| (6) | Four residential IMD tenants currently occupy space on the fifth, seventh and eighth floors at the 64 Wooster Street property. Rent for these tenants is stabilized and they have the right to occupy their space in perpetuity if not in default. |
| Lease Rollover Schedule(1)(2) | |||||||||
| Year | Number of Leases Expiring | Net Rentable Area Expiring | % of NRA Expiring | Base Rent Expiring(3) | % of Base Rent Expiring(3) | Cumulative Net Rentable Area Expiring | Cumulative % of NRA Expiring | Cumulative Base Rent Expiring(3) | Cumulative % of Base Rent Expiring(3) |
| Vacant | NAP | 0 | 0.0% | NAP | NAP | 0 | 0.0% | NAP | NAP |
| 2018 & MTM(4) | 1 | 6,000 | 10.8 | 486,220 | 12.6 | 6,000 | 10.8% | $486,220 | 12.6% |
| 2019 | 0 | 0 | 0.0 | 0 | 0.0 | 6,000 | 10.8% | $486,220 | 12.6% |
| 2020 | 0 | 0 | 0.0 | 0 | 0.0 | 6,000 | 10.8% | $486,220 | 12.6% |
| 2021 | 0 | 0 | 0.0 | 0 | 0.0 | 6,000 | 10.8% | $486,220 | 12.6% |
| 2022(5) | 1 | 6,000 | 10.8 | 450,204 | 11.7 | 12,000 | 21.6% | $936,423 | 24.3% |
| 2023 | 1 | 6,000 | 10.8 | 467,419 | 12.1 | 18,000 | 32.4% | $1,403,843 | 36.5% |
| 2024 | 0 | 0 | 0.0 | 0 | 0.0 | 18,000 | 32.4% | $1,403,843 | 36.5% |
| 2025 | 0 | 0 | 0.0 | 0 | 0.0 | 18,000 | 32.4% | $1,403,843 | 36.5% |
| 2026 | 1 | 6,000 | 10.8 | 420,116 | 10.9 | 24,000 | 43.2% | $1,823,959 | 47.4% |
| 2027 | 1 | 3,000 | 5.4 | 233,089 | 6.1 | 27,000 | 48.6% | $2,057,048 | 53.4% |
| 2028 | 0 | 0 | 0.0 | 0 | 0.0 | 27,000 | 48.6% | $2,057,048 | 53.4% |
| 2029 & Beyond(6) | 5 | 28,500 | 51.4 | 1,793,911 | 46.6 | 55,500 | 100.0% | $3,850,959 | 100.0% |
| Total | 10 | 55,500 | 100.0% | $3,850,959 | 100.0% | ||||
| (1) | Based on the underwritten rent roll dated December 13, 2017. |
| (2) | Certain tenants may have termination or contractions options (which may become exercisable prior to the originally stated expiration date of the tenant lease) that are not considered in the above Lease Rollover Schedule. |
| (3) | Base Rent includes $96,400 of contractual rent steps through December 2018. |
| (4) | Represents the 6,000 square feet of space HRG Group currently subleases to TodayTix, Inc. |
| (5) | Represents the executed direct lease by Keystone Strategy, LLC for its current 6,000 square feet of subleased space which commences on December 1, 2018 and expires on November 30, 2022. The initial annual base rent under the Keystone Strategy, LLC direct lease is $450,000. |
| (6) | Four residential IMD tenants currently occupy space on the fifth, seventh and eighth floors at the 64 Wooster Street property. Rent for these tenants is stabilized and they have the right to occupy their space in perpetuity. |
THE INFORMATION IN THIS STRUCTURAL AND COLLATERAL TERM SHEET IS NOT COMPLETE AND MAY BE AMENDED PRIOR TO THE TIME OF SALE. THIS TERM SHEET IS NOT AN OFFER TO SELL THESE SECURITIES AND IT IS NOT A SOLICITATION OF AN OFFER TO BUY THESE SECURITIES IN ANY JURISDICTION WHERE THE OFFER OR SALE IS NOT PERMITTED.
| | |
128 of 151
| Structural and Collateral Term Sheet | Benchmark 2018-B2 | |
| 64 Wooster Street | ||
| Operating History and Underwritten Net Cash Flow | |||||||
| 2014 | 2015 | 2016 | TTM(1) | Underwritten | Per Square Foot | %(2) | |
| Rents in Place(3) | $3,041,515 | $3,156,915 | $3,665,267 | $3,585,069 | $3,850,959 | $69.39 | 92.0% |
| Vacant Income | 0 | 0 | 0 | 0 | 0 | 0.0 | 0.0% |
| Gross Potential Rent | $3,041,515 | $3,156,915 | $3,665,267 | $3,585,069 | $3,850,959 | $69.39 | 92.0% |
| Total Reimbursements | 58,438 | 113,368 | 213,575 | 265,678 | 332,877 | 6.00 | 8.0% |
| Net Rental Income | $3,099,953 | $3,270,283 | $3,878,842 | $3,850,747 | $4,183,836 | $75.38 | 100.0% |
| (Vacancy/Credit Loss) | 0 | 0 | 0 | 0 | (209,808) | (3.78) | (5.0) |
| Other Income | 5,467 | 8,471 | 10,971 | 9,814 | 12,324 | 0.22 | 0.3% |
| Effective Gross Income | $3,105,420 | $3,278,754 | $3,889,813 | $3,860,561 | $3,986,351 | $71.83 | 95.3% |
| Total Expenses | $464,064 | $534,596 | $621,880 | $646,301 | $733,591 | $13.22 | 18.4% |
| Net Operating Income | $2,641,356 | $2,744,158 | $3,267,933 | $3,214,260 | $3,252,760 | $58.61 | 81.6% |
| Total TI/LC, Capex/RR | 0 | 0 | 0 | 0 | 178,885 | 3.22 | 4.5% |
| Net Cash Flow | $2,641,356 | $2,744,158 | $3,267,933 | $3,214,260 | $3,073,875 | $55.39 | 77.1% |
| Occupancy(4) | N/A | 95.5% | 100.0% | 100.0% | 95.0% | ||
| (1) | TTM reflects the trailing 12-month period ending September 30, 2017. |
| (2) | % column represents percent of Net Rental Income for all revenue lines and represents percent of Effective Gross Income for the remainder of the fields. |
| (3) | Underwritten Rents in Place includes $96,400 of contractual rent steps through December 2018. |
| (4) | The borrower sponsor was unable to provide historical occupancy information for 2014. TTM occupancy is as of December 13, 2017. The Underwritten Occupancy represents economic occupancy. |
Property Management.The 64 Wooster Street property is managed by Zar Property NY, an affiliate of the 64 Wooster Street borrower.
THE INFORMATION IN THIS STRUCTURAL AND COLLATERAL TERM SHEET IS NOT COMPLETE AND MAY BE AMENDED PRIOR TO THE TIME OF SALE. THIS TERM SHEET IS NOT AN OFFER TO SELL THESE SECURITIES AND IT IS NOT A SOLICITATION OF AN OFFER TO BUY THESE SECURITIES IN ANY JURISDICTION WHERE THE OFFER OR SALE IS NOT PERMITTED.
| | |
129 of 151
| Structural and Collateral Term Sheet | Benchmark 2018-B2 | |
| Hotel Indigo & Austin | ||
| Mortgage Loan Information | Property Information | |||
| Mortgage Loan Seller: | GACC | Single Asset / Portfolio: | Single Asset | |
| Original Principal Balance: | $45,000,000 | Title: | Fee | |
| Cut-off Date Principal Balance: | $45,000,000 | Property Type - Subtype(1): | Hotel – Select Service | |
| % of Pool by IPB: | 3.0% | Net Rentable Area (Rooms): | 305 | |
| Loan Purpose: | Acquisition | Location: | Austin, TX | |
| Borrower: | NRE Red River Property Owner, LLC | Year Built / Renovated: | 2016 / N/A | |
| Sponsors: | The David and Angella Nazarian | Occupancy / ADR / RevPAR: | 64.2% / $173.64 / $111.42 | |
| Family Trust, dated May 18, 1994, | Occupancy / ADR / RevPAR Date: | 10/31/2017 | ||
| David Nazarian | Number of Tenants: | N/A | ||
| Interest Rate: | 4.92000% | 2014 NOI(2): | N/A | |
| Note Date: | 8/1/2017 | 2015 NOI(2): | N/A | |
| Maturity Date: | 8/1/2027 | 2016 NOI(2): | N/A | |
| Interest-only Period: | 24 months | TTM NOI (as of 10/2017): | $5,607,147 | |
| Original Term: | 120 months | UW Occupancy / ADR / RevPAR: | 64.2% / $173.64 / $111.42 | |
| Original Amortization: | 360 months | UW Revenues: | $13,664,147 | |
| Amortization Type: | IO - Balloon | UW Expenses: | $8,144,924 | |
| Call Protection: | L(30),Def(86),O(4) | UW NOI: | $5,519,223 | |
| Lockbox / Cash Management: | Hard / Springing | UW NCF: | $4,972,657 | |
| Additional Debt: | N/A | Appraised Value / Per Room(3): | $66,000,000 / $216,393 | |
| Additional Debt Balance: | N/A | Appraisal Date: | 4/25/2018 | |
| Additional Debt Type: | N/A | |||
| Escrows and Reserves | Financial Information | |||||
| Initial | Monthly(4) | Initial Cap | Cut-off Date Loan / Room: | $147,541 | ||
| Taxes: | $365,188 | $52,170 | N/A | Maturity Date Loan / Room: | $127,409 | |
| Insurance(5): | $0 | $8,875 | N/A | Cut-off Date LTV(3): | 68.2% | |
| FF&E(6): | $2,700,000 | 2.0% of Gross Revenues | N/A | Maturity Date LTV(3): | 58.9% | |
| Other(7)(8): | $300,000 | Springing | See below | UW NCF DSCR: | 1.73x | |
| UW NOI Debt Yield: | 12.3% | |||||
| Sources and Uses | ||||||
| Sources | Proceeds | % of Total | Uses | Proceeds | % of Total | |
| Mortgage Loan | $45,000,000 | 68.0% | Purchase Price | $62,050,000 | 93.8% | |
| Sponsor Equity | 21,153,037 | 32.0 | Upfront Reserves | 3,365,188 | 5.1 | |
| Closing Costs | 737,849 | 1.1 | ||||
| Total Sources | $66,153,037 | 100.0% | Total Uses | $66,153,037 | 100.0% | |
| (1) | The Hotel Indigo & Austin is a dual-branded hotel consisting of a 134-room select-service hotel (Hotel Indigo Austin) and a 171-room limited-service hotel (Holiday Inn Express & Suites Austin). |
| (2) | The Historical NOI is not available because the construction of the property was completed in 2016. |
| (3) | The Appraised Value / Per Room, Cut-off Date LTV and Maturity LTV are based on the “prospective upon completion” value, which assumes completion of the franchise required PIP, which is estimated to cost $300,000 and the borrower’s anticipated discretionary capital expenditures, which are estimated to cost $2.7 million. The “as-is” value as of April 25, 2017 was $62.0 million and results in a corresponding Cut-off Date LTV and Maturity Date LTV of 72.6% and 62.7%, respectively. At closing the borrower deposited $300,000 into a PIP reserve for a mandated PIP required by IHG and an additional $2.7 million for borrower’s anticipated additional capital expenditures. Please see “The Property” section below. |
| (4) | The borrower will not be required to make monthly payments into the tax, insurance or FF&E reserve accounts on any monthly payment date occurring immediately after a seasonal month, as described in footnote (7) below (initially, the monthly payment date in January) to the extent, and only to the extent, that sufficient funds are on deposit in the seasonal working capital reserve account and the lender is obligated to disburse funds therein to pay the same. |
| (5) | On a monthly basis, the borrower is required to deposit 1/12 of the annual insurance premium payable for the renewal of the coverage under a blanket insurance policy maintained by the property manager, which currently equates to $8,875. Amounts will be released annually upon receipt of evidence that the insurance is in place and has been paid for. If an acceptable blanket insurance policy maintained by the borrower or an affiliate (as opposed to the property manager) is in place, the borrower’s obligation to make such deposits will be suspended. If an acceptable blanket insurance policy is no longer in place, the borrower is required to deposit 1/12 of the annual insurance premiums into the insurance reserve account. |
THE INFORMATION IN THIS STRUCTURAL AND COLLATERAL TERM SHEET IS NOT COMPLETE AND MAY BE AMENDED PRIOR TO THE TIME OF SALE. THIS TERM SHEET IS NOT AN OFFER TO SELL THESE SECURITIES AND IT IS NOT A SOLICITATION OF AN OFFER TO BUY THESE SECURITIES IN ANY JURISDICTION WHERE THE OFFER OR SALE IS NOT PERMITTED.
| | |
130 of 151
| Structural and Collateral Term Sheet | Benchmark 2018-B2 | |
| Hotel Indigo & Austin | ||
| (6) | The borrower is required to deposit the greatest of (i) 2.0% of the prior month’s gross revenues (as set forth in the most recent approved annual budget) through and including the payment date in August 2018, 3.0% of the prior month’s gross revenues (as set forth in the most recent approved annual budget) beginning on the payment date in September 2018 through and including the payment date in August 2019 and 4.0% of the prior month’s gross revenues (as set forth in the most recent approved annual budget) thereafter, (ii) the amount required under the management agreement and (iii) the amount required under the franchise agreement for FF&E. |
| (7) | Other Reserves represent $300,000 for a mandatory property improvement plan (“PIP”) required by the franchisor. |
| (8) | On each monthly payment date from September 2017 through December 2017, the borrower was required to make deposits equal to $61,386 for the purpose of funding a seasonal working capital reserve to cover shortfalls during seasonal periods when rents may be reduced. On each monthly payment date occurring during the term of the loan commencing in February 2018, other than the monthly payment date occurring in January, to the extent the balance of the seasonal working capital reserve account is less than the seasonal working capital reserve annual deposit amount (as described below), the borrower will be required to deposit an amount equal to the seasonal working capital reserve account monthly deposit (as defined in the loan documents) until the seasonal working capital reserve account equals the seasonal working capital reserve annual deposit amount. The seasonal working capital reserve annual deposit amount is generally equal to the debt service, reserves, and if a cash management period exists, budgeted and projected extraordinary operating expenses, due in each month of the applicable year that follows a month that is in a seasonal period when hotel rents may be reduced. The seasonal working capital reserve account monthly deposit is generally equal to the annual amount divided by the number of non-seasonal months. |
The Loan.The Hotel Indigo & Austin loan has an outstanding principal balance as of the Cut-off Date of $45.0 million and is secured by a first mortgage lien on the borrower’s fee interest in a dual-branded 305-room hotel, located in Austin, Texas. The loan has a 10-year term and following a two-year interest-only period, will amortize on a 30-year schedule.
The borrowing entity for the Hotel Indigo & Austin loan is NRE Red River Property Owner, LLC, a Delaware limited liability company and special purpose entity. The loan sponsors and nonrecourse carve-out guarantors are David Nazarian and The David and Angella Nazarian Family Trust, dated May 18, 1994. The David and Angella Nazarian Family Trust, dated May 18, 1994 is a related entity to Nimes Real Estate, LLC and Nimes Capital, the private investment arm of Nazarian Enterprises. Within the real estate industry, the sponsor has over 20 years of direct experience investing in commercial real estate, including thousands of multifamily units, two million square feet of industrial space and several thousand hotel keys in more than 20 hotels.
The Property.The Hotel Indigo & Austin property is a dual-branded hotel located in Austin, Texas. The improvements are situated on a 0.81-acre site and consist of two hotels within a single structure, the 134-room Hotel Indigo Austin and the 171-room Holiday Inn Express & Suites Austin. The property offers a restaurant and a lounge, approximately 3,140 square feet of total meeting space, an outdoor pool and a typical complement of back-of-the-house facilities. The property has a five-level underground parking garage with a total of 234 parking spaces, which equates to approximately 0.77 spaces per room. Both the Hotel Indigo Austin and Holiday Inn Express & Suites Austin operate under the InterContinental Hotels Group (“IHG”) franchise. Each of the Hotel Indigo Austin and the Holiday Inn Express & Suites Austin are subject to separate 20-year franchise agreements (one for each flag) which will expire in August 1, 2037.
The entrance for the Hotel Indigo Austin is on the eastern end of the site on Red River Street and the entrance for the Holiday Inn Express & Suites Austin is on the western side of the site on Neches Street. The two hotels are connected by an interior service corridor and the exterior pool area. All of the Holiday Inn Express & Suites Austin’s public space is on its first floor, while Hotel Indigo Austin’s public space, including the restaurant, lounge, guest registration and lobby, meeting space, and sales and administrative offices, are located on its first two floors. Each of the guestrooms features flat-screen television with premium channels, telephone, desk with chair, dresser, nightstands, lamps, and lounge chair. The sizes of the standard guestrooms range from 311 to 398 square feet, with suites ranging up to 588 square feet. Each hotel has a fitness center, located on the first level of the Holiday Inn Express & Suites Austin and the second level of the Hotel Indigo Austin. The hotels share the outdoor pool, fire pit and pool bar.
The Hotel Indigo Austin is a 134-room, select-service hotel with guest rooms located on floors 3 through 11. The Hotel Indigo Austin consists of 64 king standard rooms, 54 double queen standard rooms and 16 king suites. The Hotel Indigo Austin has a two-meal restaurant and lounge (Red River Tavern) adjacent to its lobby. The hotel has five meeting rooms on the second floor totaling approximately 2,830 square feet. According to the appraisal, the overall demand segmentation for the Hotel Indigo Austin was estimated to be 60% commercial, 20% leisure and 20% meeting and group.
The Holiday Inn Express & Suites Austin is a 171-room, limited service hotel with guest rooms located on floors 2 through 5. The Holiday Inn Express & Suites Austin has 91 king standard rooms, 68 double queen standard rooms and 12 king suites. The property has a dining area adjacent to the lobby for complimentary breakfast. The hotel has one meeting room totaling 310 square feet. According to the appraisal, the overall demand segmentation for the Holiday Inn Express & Suites Austin was estimated to be 60% commercial, 25% leisure and 15% meeting and group.
THE INFORMATION IN THIS STRUCTURAL AND COLLATERAL TERM SHEET IS NOT COMPLETE AND MAY BE AMENDED PRIOR TO THE TIME OF SALE. THIS TERM SHEET IS NOT AN OFFER TO SELL THESE SECURITIES AND IT IS NOT A SOLICITATION OF AN OFFER TO BUY THESE SECURITIES IN ANY JURISDICTION WHERE THE OFFER OR SALE IS NOT PERMITTED.
| | |
131 of 151
| Structural and Collateral Term Sheet | Benchmark 2018-B2 | |
| Hotel Indigo & Austin | ||
The borrower has indicated that it currently has approximately $3.0 million in capital improvements planned for the property, which include HVAC maintenance, interior renovations, building envelope repair and maintenance, and ADA-related costs. Of the approximately $3.0 million, $300,000 of the planned improvements were required by IHG as a mandated PIP. For Holiday Inn Express & Suites Austin, the PIP includes renovations to the lobby, front desk area, business center, meeting space, recreational areas and guest rooms. For the Hotel Indigo Austin, the PIP includes, among other items, renovations to the parking garage, landscaping, lobby, business center, pool bar, restaurant, meeting rooms, guest room and guest suites. In addition to the mandated PIP, the borrower has indicated that it expects to perform $2.7 million in discretionary capital improvements planned for the property. At loan origination, the borrower reserved $300,000 for the PIP and an additional $2.7 million for the discretionary capital expenditure work. The borrower has indicated that it currently anticipates to begin the discretionary capital expenditure work in the spring of 2018 with an expected completion date by the end of summer of 2018. The borrower is not required to perform such discretionary work on any particular schedule, or at all, and the borrower has the right to revise the scope and identity of such work with the lender’s reasonable consent.
The Market.The property is located in downtown Austin, approximately 0.6 miles from the Texas Capitol. According to the appraisal, the Austin central business district office submarket is an employment center for the central Texas region serving a daytime population exceeding 115,000 employees. Austin’s central business district also serves as a tourist destination, drawing upwards of 12 million visitors per year. The University of Texas at Austin’s primary campus is located 1.5 miles north of the property. At an enrollment of approximately 51,000 students, the University of Texas at Austin is one of the largest public universities in the nation.
According to the appraisal, the primary competitive set for the Hotel Indigo Austin and Holiday Inn Express & Suites Austin (which differs from the competitive sets identified in the tables below) consists of six hotels, which range from 149 to 296 rooms, and contain an aggregate of 1,329 rooms. The appraisal identified two future hotels that are anticipated to compete directly with the property. The first is a 190-room Hyatt House which is under construction across 9th Street from the property, and was completed in 2017. The second is a 278-room Aloft which is six blocks west of the property at the intersection of Congress Street and 7th Street. It will be part of a dual-branded building along with an Element hotel which was completed in 2017.
| Historical Occupancy, ADR, RevPAR(1)(2) | |||||||||
| Competitive Set | Hotel Indigo Austin | Penetration Factor(2) | |||||||
| Year | Occupancy | ADR | RevPAR | Occupancy | ADR | RevPAR | Occupancy | ADR | RevPAR |
| 2016(3) | 77.4% | $203.42 | $157.51 | 44.4% | $177.53 | $78.75 | 57.3% | 87.3% | 50.0% |
| TTM(4) | 77.7% | $205.05 | $159.36 | 63.2% | $180.24 | $113.92 | 81.3% | 87.9% | 71.5% |
| (1) | The variances between the underwriting, appraisal and above table with respect to Occupancy, ADR and RevPAR at the Hotel Indigo property are attributable to variances in reporting methodologies and/or timing differences. |
| (2) | Data provided by a third party travel research report. The competitive set contains the following properties: Hilton Garden Inn Austin Downtown Convention Center (open date: June 1985), Doubletree Austin University Area (open date: September 1997), Courtyard Austin Downtown Convention Center (open date: September 2006) and Hyatt Place Austin Downtown (open date: March 2013). |
| (3) | The Hotel Indigo Austin opened in March 2016, therefore historical occupancy, ADR and RevPAR information prior to the hotel opening is not available. Additionally, as a result, the Hotel Indigo Austin was in a stabilization period. |
| (4) | TTM represents the trailing 12-month period ending on October 31, 2017. |
| Historical Occupancy, ADR, RevPAR(1)(2) | |||||||||
| Competitive Set | Holiday Inn Express & Suites Austin | Penetration Factor(2) | |||||||
| Year | Occupancy | ADR | RevPAR | Occupancy | ADR | RevPAR | Occupancy | ADR | RevPAR |
| 2016(3) | 74.9% | $181.83 | $136.27 | 54.6% | $175.58 | $95.81 | 72.8% | 96.6% | 70.3% |
| TTM(4) | 75.1% | $184.95 | $138.98 | 65.2% | $167.75 | $109.37 | 86.8% | 90.7% | 78.7% |
| (1) | The variances between the underwriting, appraisal and above table with respect to Occupancy, ADR and RevPAR at the Holiday Inn Express & Suites Austin property are attributable to variances in reporting methodologies and/or timing differences. |
| (2) | Data provided by a third party travel research report. The competitive set contains the following properties: Hilton Garden Inn Austin Downtown Convention Center (open date: June 1985), Best Western Plus Austin City Hotel (open date: September 1973), La Quinta Inns & Suites Austin Capitol Downtown (open date: June 1965), Hampton Inn & Suites Austin Downtown Convention Center (open date: December 2002) and Courtyard Austin Downtown Convention Center (open date: September 2006). |
| (3) | The Holiday Inn Express & Suites Austin opened in March 2016, therefore historical occupancy, ADR and RevPAR information prior to the hotel opening is not available. Additionally, as a result, the Holiday Inn Express & Suites Austin was in a stabilization period. |
| (4) | TTM represents the trailing 12-month period ending on October 31, 2017. |
THE INFORMATION IN THIS STRUCTURAL AND COLLATERAL TERM SHEET IS NOT COMPLETE AND MAY BE AMENDED PRIOR TO THE TIME OF SALE. THIS TERM SHEET IS NOT AN OFFER TO SELL THESE SECURITIES AND IT IS NOT A SOLICITATION OF AN OFFER TO BUY THESE SECURITIES IN ANY JURISDICTION WHERE THE OFFER OR SALE IS NOT PERMITTED.
| | |
132 of 151
| Structural and Collateral Term Sheet | Benchmark 2018-B2 | |
| Hotel Indigo & Austin | ||
| Operating History and Underwritten Net Cash Flow(1) | ||||
| TTM(2) | Underwritten | Per Room(3) | % of Total Revenue(4) | |
| Occupancy | 64.17% | 64.17% | ||
| ADR | $173.64 | $173.64 | ||
| RevPAR | $111.42 | $111.42 | ||
| Room Revenue | $12,404,147 | $12,404,147 | $40,669 | 90.8% |
| Food & Beverage Revenue | 0 | 0 | 0 | 0.0 |
| Other Departmental Revenue | 1,260,000 | 1,260,000 | 4,131 | 9.2 |
| Total Revenue | $13,664,147 | $13,664,147 | $44,800 | 100.0% |
| Departmental Expenses(5) | $3,425,000 | $3,425,000 | $11,230 | 25.1% |
| Departmental Profit | $10,239,147 | $10,239,147 | $33,571 | 74.9% |
| Operating Expenses(5) | $3,520,000 | $3,520,000 | $11,541 | 25.8% |
| Gross Operating Profit | $6,719,147 | $6,719,147 | $22,030 | 49.2% |
| Management Fees | 322,000 | 409,924 | 1,344 | 3.0 |
| Fixed Expenses | 790,000 | 790,000 | 2,590 | 5.8 |
| Total Other Expenses | $1,112,000 | $1,199,924 | $3,934 | 8.8% |
| Net Operating Income | $5,607,147 | $5,519,223 | $18,096 | 40.4% |
| FF&E | 142,000 | 546,566 | 1,792 | 4.0 |
| Net Cash Flow | $5,465,147 | $4,972,657 | $16,304 | 36.4% |
| (1) | Historical financial information is not available because the construction of the property was completed in 2016. |
| (2) | TTM column represents the trailing 12-month period ending on October 31, 2017. |
| (3) | Per Room values are based on 305 guest rooms. |
| (4) | % of Total Revenue for Room Expense, Food & Beverage Expense and Other Departmental Expenses are based on their corresponding revenue line items. |
| (5) | Due to the acquisition of the Hotel Indigo & Austin property in August 2017 and subsequent replacement of the property manager, a full breakout of Departmental Expenses and Operating Expenses was not provided. |
Property Management. The property is managed by SSH Red River Austin LLC, a third-party management company.
Permitted Mezzanine Debt. The loan documents permit the owners of the borrower to obtain a mezzanine loan secured by the direct ownership interests in the borrower upon satisfaction of certain terms and conditions including, among others, (i) the combined loan-to-value ratio (using the “as-is” appraised value) does not exceed 75.0%, (ii) the combined debt service coverage ratio, calculated based on a 30-year amortization schedule, is not less than 1.59x, (iii) the combined debt yield is not less than 10.12%, (iv) the mezzanine loan is interest-only and is coterminous with the mortgage loan, (v) the mezzanine lender enters into an intercreditor agreement reasonably acceptable to the mortgage lender and (vi) delivery of a rating agency confirmation.
THE INFORMATION IN THIS STRUCTURAL AND COLLATERAL TERM SHEET IS NOT COMPLETE AND MAY BE AMENDED PRIOR TO THE TIME OF SALE. THIS TERM SHEET IS NOT AN OFFER TO SELL THESE SECURITIES AND IT IS NOT A SOLICITATION OF AN OFFER TO BUY THESE SECURITIES IN ANY JURISDICTION WHERE THE OFFER OR SALE IS NOT PERMITTED.
| | |
133 of 151
| Structural and Collateral Term Sheet | Benchmark 2018-B2 |
| Braddock Metro Center |
| Mortgage Loan Information | Property Information | |||
| Mortgage Loan Seller: | CREFI | Single Asset / Portfolio: | Single Asset | |
| Original Principal Balance(1): | $44,200,000 | Title: | Fee | |
| Cut-off Date Principal Balance(1): | $44,200,000 | Property Type - Subtype: | Office – Suburban | |
| % of Pool by IPB: | 2.9% | Net Rentable Area (SF): | 315,589 | |
| Loan Purpose: | Acquisition | Location: | Alexandria, VA | |
| Borrower: | WRIT Braddock Office LLC | Year Built / Renovated: | 1986 / N/A | |
| Sponsors(2): | Kawa Capital Partners LLC, | Occupancy: | 92.4% | |
| Kawa Investments LLC | Occupancy Date: | 11/1/2017 | ||
| Interest Rate: | 4.57000% | Number of Tenants: | 20 | |
| Note Date: | 1/19/2018 | 2014 NOI: | $5,927,215 | |
| Maturity Date: | 2/6/2028 | 2015 NOI: | $6,777,967 | |
| Interest-only Period: | 60 months | 2016 NOI: | $7,301,701 | |
| Original Term: | 120 months | TTM NOI: (as of 10/2017) | $7,395,475 | |
| Original Amortization: | 360 months | UW Economic Occupancy: | 92.6% | |
| Amortization Type: | IO-Balloon | UW Revenues: | $10,490,116 | |
| Call Protection(3): | L(24),DeforGrtr1%orYM(92),O(4) | UW Expenses: | $3,420,015 | |
| Lockbox / Cash Management: | Hard / Springing | UW NOI: | $7,070,100 | |
| Additional Debt: | Yes | UW NCF: | $6,760,253 | |
| Additional Debt Balance: | $30,000,000 | Appraised Value / Per SF: | $111,140,000 / $352 | |
| Additional Debt Type: | Pari Passu | Appraisal Date: | 11/3/2017 | |
| Escrows and Reserves | Financial Information(1) | |||||||
| Initial | Monthly | Initial Cap | Cut-off Date Loan / SF: | $235 | ||||
| Taxes: | $381,274 | $95,318 | N/A | Maturity Date Loan / SF: | $215 | |||
| Insurance: | $0 | Springing | N/A | Cut-off Date LTV: | 66.8% | |||
| Replacement Reserves: | $0 | $6,049 | N/A | Maturity Date LTV: | 61.2% | |||
| TI/LC: | $0 | $19,724 | N/A | UW NCF DSCR: | 1.49x | |||
| Other(4): | $27,805,730 | $0 | N/A | UW NOI Debt Yield: | 9.5% | |||
| Sources and Uses | ||||||
| Sources | Proceeds | % of Total | Uses | Proceeds | % of Total | |
| Mortgage Loan(1) | $74,200,000 | 63.9% | Purchase Price | $87,000,000 | 75.0% | |
| Sponsor Equity | 27,363,225 | 23.6 | Upfront Reserves | 28,187,004 | 24.3 | |
| Other Sources(5) | 14,483,219 | 12.5 | Closing Costs | 859,440 | 0.7 | |
| Total Sources | $116,046,444 | 100.0% | Total Uses | $116,046,444 | 100.0% | |
| (1) | The Braddock Metro Center loan is part of a whole loan evidenced by twopari passunotes, with an aggregate outstanding principal balance as of the Cut-off Date of $74.2 million. The Financial Information presented in the chart above reflects the aggregate Cut-off Date balance of the $74.2 million Braddock Metro Center Whole Loan, as defined below. |
| (2) | The loan sponsor is Kawa Capital Partners LLC, while the two nonrecourse carve-out guarantors are Kawa Capital Partners LLC and Kawa Investments LLC. |
| (3) | The lockout period will be at least 24 payments beginning with and including the first payment date of March 6, 2018. Defeasance of the full $74.2 million Braddock Metro Center Whole Loan is permitted at any time after the earlier to occur of (i) two years after the closing date of the securitization that includes the last promissory note to be securitized and (ii) three years from the origination of the loan. The assumed lockout period of 24 months is based on the expected Benchmark 2018-B2 securitization closing date in February 2018. The actual lockout period may be longer. |
| (4) | The Initial Other Escrows and Reserves consists of a $27,805,730 USDA lease reserve which represents USDA gap rent, USDA tenant allowances, USDA improvement costs and USDA leasing commissions. |
| (5) | Other sources consists of security deposits ($315,106), rents ($239,014), property taxes ($53,722), tenant inducements ($6,992,531) and a shell format cost ($6,930,119) that were credited to the purchaser on the date of the acquisition, net off with expenses ($45,136) and interest from deposits ($2,137). |
THE INFORMATION IN THIS STRUCTURAL AND COLLATERAL TERM SHEET IS NOT COMPLETE AND MAY BE AMENDED PRIOR TO THE TIME OF SALE. THIS TERM SHEET IS NOT AN OFFER TO SELL THESE SECURITIES AND IT IS NOT A SOLICITATION OF AN OFFER TO BUY THESE SECURITIES IN ANY JURISDICTION WHERE THE OFFER OR SALE IS NOT PERMITTED.
| | |
134 of 151
| Structural and Collateral Term Sheet | Benchmark 2018-B2 |
| Braddock Metro Center |
The Loan.The Braddock Metro Center loan is secured by a first mortgage lien on the borrower’s fee interest in a three-building, 315,589 square foot Class A office complex located in Alexandria, Virginia (the “Braddock Metro Center Property”). The borrowing entity for the Braddock Metro Center Whole Loan is WRIT Braddock Office LLC, a Delaware limited liability company and special purpose entity. The loan sponsor and one of the nonrecourse carve-out guarantor for the Braddock Metro Center Whole Loan is Kawa Capital Partners LLC, a Florida limited liability company, which operates as Kawa Capital Management. Kawa Capital Management is an independent asset management firm headquartered in Miami, Florida that focuses primarily on credit hedge fund and commercial and industrial real estate deals. Through its commercial and industrial real estate investment platform, Kawa Capital Management has invested $360.0 million of equity since its inception and currently has over six million square feet under management. As of December 31, 2016, Kawa Capital Management reported total assets of approximately $82.9 million and a net worth and liquidity of approximately $37.2 million and approximately $10.4 million, respectively. Kawa Investments LLC serves as an additional nonrecourse carve-out guarantor for the Braddock Metro Center Whole Loan. Under the Braddock Metro Center loan documents, the guarantors are required to maintain a combined net worth of $30.0 million and liquidity of $6.0 million throughout the loan term. The loan is part of a whole loan with an outstanding principal balance as of the Cut-off Date of $74.2 million (the “Braddock Metro Center Whole Loan”) and is comprised of twopari passu notes, each as described below. The controlling Note A-1, with an outstanding principal balance as of the Cut-off Date of $44.2 million, is being contributed to the Benchmark 2018-B2 Trust. The non-controlling Note A-2, with an outstanding principal balance as of the Cut-off Date of $30.0 million, is currently held by Citi Real Estate Funding, Inc. and is expected to be contributed to a future securitization. The relationship between the holders of the Braddock Metro Center Whole Loan will be governed by a co-lender agreement as described under the“Description of the Mortgage Pool—The Whole Loans—The Non-Serviced Pari Passu Whole Loans” in the Preliminary Prospectus. The Braddock Metro Center Whole Loan has a 10-year term and, subsequent to a five-year interest-only period, will amortize on a 30-year schedule.
| Whole Loan Summary | |||||
| Note | Original Balance | Cut-off Date Balance | Note Holder | Controlling Piece | |
| A-1 | $44,200,000 | $44,200,000 | Benchmark 2018-B2 | Yes | |
| A-2 | 30,000,000 | 30,000,000 | CREFI | No | |
| Total | $74,200,000 | $74,200,000 | |||
The Property.The Braddock Metro Center Property is a three-building, 315,589 square foot Class A office complex located in Alexandria, Virginia. The Braddock Metro Center property consists of a total of four buildings: 1310, 1320, 1330 and 1340 Braddock Place, and an underground parking garage, however, only 1320, 1330 and 1340 Braddock Place, as well as the underground parking garage, will serve as collateral for the Braddock Metro Center Whole Loan. Each of the three buildings features a tenant lounge, conference centers, an on-site fitness center and underground parking. The campus has landscaped plazas and walkways, a tenant-only shuttle service and a shared courtyard with an outdoor fireplace. As of November 1, 2017, the Braddock Metro Center Property was 92.4% leased to 20 tenants.
The 1320 Braddock Place building consists of 143,378 square feet and, as of November 1, 2017, was 91.4% occupied by one office tenant and four communications tenants with roof antennas. The largest tenant at the 1320 Braddock Place building is the GSA (United States Department of Agriculture) (“USDA”) which recently executed a 15-year lease commencing June 2018 and expiring May 2033. The USDA lease has no contraction or termination options through the term and has one, five-year renewal option. The USDA is the federal executive department responsible for providing leadership on food, agriculture, natural resources, rural development and nutrition. The 1330 Braddock Place building is 87,518 square feet and is 86.6% occupied, as of November 1, 2017, by 12 office tenants and one communications tenant with a roof antenna. The three largest tenants at the subject include: Close Up Foundation, Gifts In Kind International/Good360 and Phase2 Technology. The Close Up Foundation executed an 11-year lease commencing in January 2011 and expiring in December 2021. Upon expiration, the tenant has one, five-year renewal option. Gifts In Kind International/Good360 executed a 10-year, eight month lease in April 2011. Phase2 Technology, LLC executed an approximate 10-year, eight month lease in May 2011. Upon expiration, the tenant has one, five-year renewal option. The 1340 Braddock Place building is 84,693 square feet and 100% occupied by the Alexandria City School Board which utilizes the property as its headquarters. The Alexandria City School Board executed a 15-year lease in April 2014 with an expiration date of May 2029 and two, five-year renewal options. The lease is firm through the term however it has an appropriation clause tied to the funding of the School Board, which is provided by the City of Alexandria.
The Braddock Metro Center Property is situated one block west of Route 1, approximately 7.5 miles south of downtown Washington D.C. The property is located in close proximity to three major interstates: I-495, I-395 and I-95. Additionally, the Braddock Metro Center Property is approximately 2.5 miles south of Ronald Reagan Washington National Airport. Furthermore, the Braddock Metro Center Property is adjacent to the Braddock Road station of the Washington Metro, which has both the Blue Line and Yellow Line service; both metro lines provide direct access to Ronald Reagan Washington National Airport, downtown Washington D.C., the U.S. Capitol, the Pentagon and various surrounding neighborhoods.
THE INFORMATION IN THIS STRUCTURAL AND COLLATERAL TERM SHEET IS NOT COMPLETE AND MAY BE AMENDED PRIOR TO THE TIME OF SALE. THIS TERM SHEET IS NOT AN OFFER TO SELL THESE SECURITIES AND IT IS NOT A SOLICITATION OF AN OFFER TO BUY THESE SECURITIES IN ANY JURISDICTION WHERE THE OFFER OR SALE IS NOT PERMITTED.
| | |
135 of 151
| Structural and Collateral Term Sheet | Benchmark 2018-B2 |
| Braddock Metro Center |
The Market. The Braddock Metro Center Property is located in the northeastern section of Alexandria, Virginia. The city is largely populated by professionals working in the federal civil service, the U.S. military or for one of the private companies that provide services to the federal government. As of September 2017, unemployment in the city of Alexandria was reported at 3.6%, the same as Virginia’s and 0.5% lower than the national average of 4.1%. The five largest employers in the area are the U.S. Department of Commerce, U.S. Department of Defense, Alexandria Public Schools, City of Alexandria and the Washington Metropolitan Area Transit Authority.
The City of Alexandria is known for its Old Town neighborhood, a nationally designated historic district with more than 200 restaurants, boutiques and museums. Old Town is centered on King Street and located eight blocks south of the Braddock Metro Center Property. In June 2017, the City of Alexandria approved the Old Town North Small Area Plan after a two-year planning and community engagement process. The area to be redeveloped is located approximately six blocks from the Braddock Metro Center Property and includes over 200 acres of land and a former power plant along the Potomac River. The mixed-use development is expected to include over two million square feet of office, retail and housing as well as an innovation district with public open space to enhance access to and provide views of the Potomac River.
The Braddock Metro Center Property is situated in the Old Town Alexandria submarket within the overall Washington-Arlington-Alexandria office market. At approximately 10.3 million square feet across 574 buildings, the submarket is the 15th largest in terms of inventory (within the District of Columbia’s 78 office submarkets) and accounts for 2.1% of the total market. As of the second quarter of 2017, the submarket reported average rents and vacancy of $38.61 per square foot and 10.9%, respectively. According to the appraiser, there are six comparable full-service gross leases, all of which have been executed since October 2016 and are all within one mile of the Braddock Metro Center Property. The comparable leases indicate an adjusted rental range of $30.00 to $39.00 per square foot, with a median of $32.55 per square foot and an average of $33.10 per square foot. The appraiser determined a market rent for the Braddock Metro Center Property of $33.00 per square foot gross. In-place average base rent across the three buildings is $29.21 per square foot, which implies that rental rates at the Braddock Metro Center Property are approximately 11.5% below the appraiser’s concluded market rent.
| Historical and Current Occupancy(1) | |||
| 2014 | 2015 | 2016 | Current(2) |
| 96.9% | 97.8% | 98.3% | 92.4% |
| (1) | Historical Occupancies are as of December 31 of each respective year. |
| (2) | Current Occupancy is as of November 1, 2017. |
| Tenant Summary(1) | ||||||
| Tenant | Ratings(2) Moody’s/S&P/Fitch | Net Rentable Area (SF) | % of Total NRA | Base Rent PSF | % of Total Base Rent | Lease Expiration Date |
| GSA (US Department of Agriculture) | Aaa/AA+/NA | 131,000 | 41.5% | $30.00 | 40.1% | 5/31/2033 |
| Alexandria City School Board | Aaa/AAA/NA | 84,693 | 26.8% | $35.31 | 30.5% | 5/31/2029 |
| Close Up Foundation | NA/NA/NA | 13,594 | 4.3% | $35.84 | 5.0% | 12/31/2021 |
| Gifts in Kind International / Good360 | NA/NA/NA | 12,968 | 4.1% | $37.49 | 5.0% | 12/31/2021 |
| Phase2 Technology, LLC | NA/NA/NA | 11,348 | 3.6% | $36.89 | 4.3% | 12/31/2021 |
| Oak Grove Technologies, LLC | NA/NA/NA | 8,292 | 2.6% | $35.45 | 3.0% | 12/31/2019 |
| American Chamber of Commerce Executives | NA/NA/NA | 6,236 | 2.0% | $33.91 | 2.2% | 11/30/2023 |
| International Parking Institute, Inc. | NA/NA/NA | 4,103 | 1.3% | $30.95 | 1.3% | 1/31/2023 |
| World Hope International, Inc.(3) | NA/NA/NA | 3,888 | 1.2% | $33.94 | 1.3% | 4/30/2023 |
| National Society of Public Accountants | NA/NA/NA | 3,446 | 1.1% | $32.54 | 1.1% | 1/31/2026 |
| (1) | Based on the underwritten rent roll dated November 1, 2017. |
| (2) | Ratings provided are for the parent company or government entity of the entity listed in the “Tenant” field whether or not the parent company or government entity guarantees the lease. |
| (3) | World Hope International Inc. has the right to terminate its lease on or after January 31, 2021 with 12 months’ notice and payment of a termination of the unamortized portion of any improvement costs, legal fees, rental abatement and leasing commissions amortized at 8% interest. |
THE INFORMATION IN THIS STRUCTURAL AND COLLATERAL TERM SHEET IS NOT COMPLETE AND MAY BE AMENDED PRIOR TO THE TIME OF SALE. THIS TERM SHEET IS NOT AN OFFER TO SELL THESE SECURITIES AND IT IS NOT A SOLICITATION OF AN OFFER TO BUY THESE SECURITIES IN ANY JURISDICTION WHERE THE OFFER OR SALE IS NOT PERMITTED.
| | |
136 of 151
| Structural and Collateral Term Sheet | Benchmark 2018-B2 |
| Braddock Metro Center |
| Lease Rollover Schedule(1) | |||||||||
| Year | Number of Leases Expiring | Net Rentable Area Expiring | % of NRA Expiring | Base Rent Expiring | % of Base Rent Expiring | Cumulative Net Rentable Area Expiring | Cumulative % of NRA Expiring | Cumulative Base Rent Expiring | Cumulative % of Base Rent Expiring |
| Vacant | NAP | 24,077 | 7.6% | NAP | NAP | 24,077 | 7.6% | NAP | NAP |
| 2018 & MTM | 2 | 0 | 0.0 | $44,175 | 0.5% | 24,077 | 7.6% | $44,175 | 0.5% |
| 2019 | 3 | 11,557 | 3.7 | 412,028 | 4.2 | 35,634 | 11.3% | $456,203 | 4.7% |
| 2020 | 1 | 0 | 0.0 | 18,241 | 0.2 | 35,634 | 11.3% | $474,444 | 4.8% |
| 2021 | 6 | 40,966 | 13.0 | 1,568,889 | 16.0 | 76,600 | 24.3% | $2,043,333 | 20.8% |
| 2022 | 1 | 1 | 0.0 | 79,574 | 0.8 | 76,601 | 24.3% | $2,122,907 | 21.6% |
| 2023 | 3 | 14,227 | 4.5 | 470,423 | 4.8 | 90,828 | 28.8% | $2,593,330 | 26.4% |
| 2024 | 1 | 5,622 | 1.8 | 184,463 | 1.9 | 96,450 | 30.6% | $2,777,793 | 28.3% |
| 2025 | 0 | 0 | 0.0 | 0 | 0.0 | 96,450 | 30.6% | $2,777,793 | 28.3% |
| 2026 | 1 | 3,446 | 1.1 | 112,146 | 1.1 | 99,896 | 31.7% | $2,889,938 | 29.5% |
| 2027 | 0 | 0 | 0.0 | 0 | 0.0 | 99,896 | 31.7% | $2,889,938 | 29.5% |
| 2028 | 0 | 0 | 0.0 | 0 | 0.0 | 99,896 | 31.7% | $2,889,938 | 29.5% |
| 2029 & Beyond | 2 | 215,693 | 68.3 | 6,920,607 | 70.5 | 315,589 | 100.0% | $9,810,545 | 100.0% |
| Total | 20 | 315,589 | 100.0% | $9,810,545 | 100.0% | ||||
| (1) | Based on the underwritten rent roll dated November 1, 2017. |
| Operating History and Underwritten Net Cash Flow | |||||||
| 2014 | 2015 | 2016 | TTM(1) | Underwritten | Per Square Foot | %(2) | |
| Rents in Place | $9,065,314 | $10,029,793 | $10,395,546 | $10,248,302 | $9,218,704 | $29.21 | 85.9% |
| Contractual Rent Steps | 0 | 0 | 0 | 0 | 591,841 | 1.88 | 5.5 |
| Vacant Income | 0 | 0 | 0 | 0 | 794,541 | 2.52 | 7.4 |
| Total Reimbursements | 134,411 | 70,650 | 180,131 | 220,780 | 99,938 | 0.32 | 0.9 |
| Other Income | 30,344 | 36,315 | 36,840 | 27,285 | 27,285 | 0.09 | 0.3 |
| Net Rental Income | $9,230,069 | $10,136,758 | $10,612,518 | $10,496,367 | $10,732,310 | $34.01 | 100.0% |
| (Vacancy/Credit Loss) | (462,741) | (525,989) | (515,479) | (454,134) | (794,541) | (2.52) | (7.4) |
| EGI Before Other Income | $8,767,328 | 9,610,769 | $10,097,039 | $10,042,233 | $9,937,769 | $31.49 | 92.6% |
| Parking | 436,611 | 462,062 | 486,192 | 544,918 | 544,918 | 1.73 | 5.1 |
| Other Income | 3,797 | 199 | 262 | 7,429 | 7,429 | 0.02 | 0.1 |
| Effective Gross Income | $9,207,736 | $10,073,030 | $10,583,492 | $10,594,580 | $10,490,116 | $33.24 | 97.7% |
| Total Expenses | $3,280,521 | $3,295,063 | $3,281,792 | $3,199,105 | $3,420,015 | $10.84 | 32.6% |
| Net Operating Income(3) | $5,927,215 | $6,777,967 | $7,301,701 | $7,395,475 | $7,070,100 | $22.40 | 67.4% |
| Total TI/LC, Capex/RR | 0 | 0 | 0 | 0 | 309,848 | 0.98 | 3.0 |
| Net Cash Flow | $5,927,215 | $6,777,967 | $7,301,701 | $7,395,475 | $6,760,253 | $21.42 | 64.4% |
| (1) | TTM reflects the trailing 12-month period ending October 31, 2017. |
| (2) | % column represents percent of Net Rental Income for all revenue lines and represents percent of Effective Gross Income for the remainder of the fields. |
| (3) | The increase in Net Operating Income is attributable to the signing of new leases as detailed in“The Property” section above. |
Property Management. The property is managed by Cushman & Wakefield U.S., Inc.
THE INFORMATION IN THIS STRUCTURAL AND COLLATERAL TERM SHEET IS NOT COMPLETE AND MAY BE AMENDED PRIOR TO THE TIME OF SALE. THIS TERM SHEET IS NOT AN OFFER TO SELL THESE SECURITIES AND IT IS NOT A SOLICITATION OF AN OFFER TO BUY THESE SECURITIES IN ANY JURISDICTION WHERE THE OFFER OR SALE IS NOT PERMITTED.
| | |
137 of 151
| Structural and Collateral Term Sheet | Benchmark 2018-B2 |
| Braddock Metro Center |
Non-Collateral Property. The 1310 Braddock Place building is not collateral for the Braddock Metro Center Whole Loan. The 1310 Braddock Place building, totaling 41,470 square feet, is 100% occupied by a single tenant, National Industries for the Blind, which intends to vacate its space at lease maturity in September 2018. The 1310 Braddock Place building is not separately assessed and will constitute a portion of the tax parcel that includes the Braddock Metro Center Property until January 1, 2019. A reserve to cover the full jointly assessed taxes of the Braddock Metro Center Property was established at origination of the Braddock Metro Center loan, and the borrower will be required to fund the tax liability with respect to the entire tax parcel (including 1310 Braddock Place building) until the 1310 Braddock Place building is separately assessed. After the 1310 Braddock Place building is separately assessed, the monthly tax deposit will no longer include taxes on the 1310 Braddock Place building. At loan closing, the sponsor entered into a condominium arrangement to separately plat the 1310 Braddock Place building for real estate tax purposes. The Braddock Metro Center Property is subject to a “Virginia land condominium”. There are two units: (i) Braddock Metro Center Property (consisting of 1320, 1330 and 1340 Braddock Place, as well as the underground parking garage), and (ii) the 1310 Braddock Place building, which is not collateral for the Braddock Metro Center Whole Loan. There is no board of directors for the unit owner’s association. Each unit owner is entitled to a vote equal to its percentage interest. The borrower’s percentage interest is 88.5%. The condominium documents do not govern casualty or condemnation, insurance proceeds, or provide for any assessments against the unit owners. Since the 1310 Braddock Place building is not part of the collateral, none of the cash flow attributable to the 1310 Braddock Place building was included in the cash flow analysis in the Operating History and Underwritten Net Cash Flow chart above. Additionally, the sponsors are not permitted to release the 1320, 1330 or 1340 Braddock Place buildings during the loan term.
THE INFORMATION IN THIS STRUCTURAL AND COLLATERAL TERM SHEET IS NOT COMPLETE AND MAY BE AMENDED PRIOR TO THE TIME OF SALE. THIS TERM SHEET IS NOT AN OFFER TO SELL THESE SECURITIES AND IT IS NOT A SOLICITATION OF AN OFFER TO BUY THESE SECURITIES IN ANY JURISDICTION WHERE THE OFFER OR SALE IS NOT PERMITTED.
| | |
138 of 151
| Structural and Collateral Term Sheet | Benchmark 2018-B2 |
[THIS PAGE INTENTIONALLY LEFT BLANK]
THE INFORMATION IN THIS STRUCTURAL AND COLLATERAL TERM SHEET IS NOT COMPLETE AND MAY BE AMENDED PRIOR TO THE TIME OF SALE. THIS TERM SHEET IS NOT AN OFFER TO SELL THESE SECURITIES AND IT IS NOT A SOLICITATION OF AN OFFER TO BUY THESE SECURITIES IN ANY JURISDICTION WHERE THE OFFER OR SALE IS NOT PERMITTED.
| | |
139 of 151
| Structural and Collateral Term Sheet | Benchmark 2018-B2 | |
| BlueLinx Portfolio | ||
| Mortgage Loan Information | Property Information | |||
| Mortgage Loan Seller(1): | CREFI | Single Asset / Portfolio: | Portfolio | |
| Original Principal Balance(2): | $42,900,000 | Title: | Fee | |
| Cut-off Date Principal Balance(2): | $42,900,000 | Property Type - Subtype: | Industrial – Warehouse/Distribution | |
| % of Pool by IPB: | 2.8% | Net Rentable Area (SF): | 2,307,835 | |
| Loan Purpose: | Acquisition | Location: | Various | |
| Borrowers: | BIP Frederick, LLC, BIP Bellingham, | Year Built / Renovated: | Various / Various | |
| LLC, BIP Lawrenceville, LLC, BIP | Occupancy: | 100.0% | ||
| Butner, LLC | Occupancy Date: | 2/6/2018 | ||
| Sponsors(3): | Various | Number of Tenants(5): | 4 | |
| Interest Rate: | 4.47000% | 2014 NOI(6): | N/A | |
| Note Date: | 1/10/2018 | 2015 NOI(6): | N/A | |
| Maturity Date: | 2/6/2023 | 2016 NOI(6): | N/A | |
| Interest-only Period: | 60 months | TTM NOI(6): | N/A | |
| Original Term: | 60 months | UW Economic Occupancy: | 92.5% | |
| Original Amortization: | None | UW Revenues: | $12,023,790 | |
| Amortization Type: | Interest Only | UW Expenses: | $3,373,690 | |
| Call Protection(4): | L(24),Def(32),O(4) | UW NOI: | $8,650,101 | |
| Lockbox / Cash Management: | Springing / Springing | UW NCF: | $7,959,979 | |
| Additional Debt: | Yes | Appraised Value / Per SF: | $111,450,000 / $48 | |
| Additional Debt Balance: | $28,600,000 | Appraisal Date: | Various | |
| Additional Debt Type: | Pari Passu | |||
| Escrows and Reserves | Financial Information(2) | ||||||
| Initial | Monthly | Initial Cap | Cut-off Date Loan / SF: | $31 | |||
| Taxes(7): | $0 | Springing | N/A | Maturity Date Loan / SF: | $31 | ||
| Insurance(7): | $0 | Springing | N/A | Cut-off Date LTV: | 64.2% | ||
| Replacement Reserves(7): | $0 | Springing | N/A | Maturity Date LTV: | 64.2% | ||
| TI/LC(8): | $0 | Springing | N/A | UW NCF DSCR: | 2.46x | ||
| Other(9): | $213,750 | $0 | N/A | UW NOI Debt Yield: | 12.1% | ||
| Sources and Uses | |||||||
| Sources | Proceeds | % of Total | Uses | Proceeds | % of Total | ||
| Mortgage Loan | $71,500,000 | 63.0% | Purchase Price | $110,000,000 | 96.9% | ||
| Sponsor Equity | 39,395,248 | 34.7 | Closing Costs | 3,362,861 | 3.0 | ||
| Other Sources(10) | 2,681,362 | 2.4 | Upfront Reserves | 213,750 | 0.2 | ||
| Total Sources | $113,576,611 | 100.0% | Total Uses | $113,576,611 | 100.0% | ||
| (1) | The BlueLinx Portfolio Whole Loan was co-originated by Citi Real Estate Funding Inc. and Société Générale. |
| (2) | The BlueLinx Portfolio loan is part of a whole loan evidenced by fourpari passu notes, with an aggregate outstanding principal balance as of the Cut-off Date of $71.5 million. The Financial Information presented in the chart above reflects the Cut-off Date balance of the $71.5 million BlueLinx Portfolio Whole Loan, as defined in “The Loan”below. |
| (3) | The sponsors for the BlueLinx Portfolio loan are Michael W. Brennan, Scott D. McKibben, Samuel A. Mandarino, Robert G. Vanecko, Eduardo E. Paneque, Allen Crosswell, Greenwood Holding Company LLC, William T. MacMane and Brad O’Halloran. |
| (4) | The BlueLinx Portfolio Loan lockout period will be at least 24 payments beginning with and including the first payment date of March 6, 2018. Defeasance of the full $71.5 million whole loan is permitted at any time after the earlier to occur of (i) two years after the closing date of the securitization that includes the last promissory note to be securitized and (ii) three years from the note date. The assumed lockout period of 24 months is based on the expected Benchmark 2018-B2 securitization closing date in February 2018. The actual lockout period may be longer. |
| (5) | The BlueLinx Corporation tenant at the Frederick property currently subleases 100,000 square feet to Carter-Jones Lumber Company through June 2024 and the BlueLinx Corporation tenant at the Butner property currently subleases 104,000 square feet to Cormetech, Inc. through November 2021. |
| (6) | Due to the nature of the sale leaseback acquisition, no historical cash flow information is available. |
| (7) | The requirement to make monthly deposits for taxes, insurance and replacement reserves is provisionally waived so long as the related borrower delivers evidence to the lender that (i) no trigger period under the BlueLinx Portfolio loan documents has occurred and is continuing, (ii) certain tenant leases are in full force and effect, and (iii) with respect to (a) taxes, the applicable tenant is obligated pursuant to its lease to pay for all taxes imposed against such property, (b) insurance, the applicable tenant is obligated pursuant to its lease to pay for all insurance premiums for the insurance required pursuant to the BlueLinx Portfolio loan documents and (c) replacement reserves, certain tenants at the BlueLinx Portfolio properties are obligated to make the replacements for which the replacement reserves are intended. |
| (8) | During the continuance of a trigger period under the BlueLinx Portfolio loan documents, the borrowers are required to deposit $28,662 for TI/LC reserves on each monthly payment date. |
THE INFORMATION IN THIS STRUCTURAL AND COLLATERAL TERM SHEET IS NOT COMPLETE AND MAY BE AMENDED PRIOR TO THE TIME OF SALE. THIS TERM SHEET IS NOT AN OFFER TO SELL THESE SECURITIES AND IT IS NOT A SOLICITATION OF AN OFFER TO BUY THESE SECURITIES IN ANY JURISDICTION WHERE THE OFFER OR SALE IS NOT PERMITTED.
| | |
140 of 151
| Structural and Collateral Term Sheet | Benchmark 2018-B2 | |
| BlueLinx Portfolio | ||
| (9) | The Initial Other reserve consists of a $206,875 Additional Property Reserve which represents 125% of the estimated costs for various outstanding environmental and zoning compliance items across the BlueLinx Portfolio properties and a $6,875 Immediate Repairs Reserve representing 125% of the estimated costs for immediate repairs. |
| (10) | Other Sources consists of security ($1,604,167), rent ($569,220), real estate tax ($447,000) and insurance ($60,975) deposits that were credited to the purchaser on the date of the acquisition. |
The Loan.The BlueLinx Portfolio loan is secured by a first mortgage lien on the borrowers’ fee interests in four industrial warehouse/distribution properties located in Maryland, Massachusetts, Georgia and North Carolina. The borrowing entities for the BlueLinx Portfolio Whole Loan are BIP Frederick, LLC, BIP Bellingham, LLC, BIP Lawrenceville, LLC, and BIP Butner, LLC, each a Delaware limited liability company and special purpose entity. The BlueLinx Portfolio Whole loan is structured to be Shari’ah compliant and to facilitate such compliance, the borrowers have entered into a master lease with each master lessee and the master lessees have further subleased their interests to an operating tenant pursuant to an operating lease. The operating lease passes through all of the rights and obligations with respect to the BlueLinx Portfolio properties and the tenant leases to the master lessee, and the master lessees pay rent under the master lease to the borrowers, which covers the debt service under the BlueLinx Portfolio loan and other required payments under the mortgage loan documents. The master lease also provides that the master lessees operate and maintain the BlueLinx Portfolio properties and include certain prohibitions on transfers, leasing, alterations, among others, which replicate the terms under the BlueLinx Portfolio loan documents. The BlueLinx Portfolio Whole Loan’s sponsors and nonrecourse carve-out guarantors are Michael W. Brennan, Scott D. McKibben, Samuel A. Mandarino, Robert G. Vanecko, Eduardo E. Paneque, Allen Crosswell, Greenwood Holding Company LLC, William T. MacMane and Brad O’Halloran. All carve-out guarantors are principals and/or employees of Brennan Investment Group. Brennan Investment Group is an industrial property owner that operates a portfolio spanning 25 states and totaling more than 35.0 million square feet. The loan is part of a whole loan that has an outstanding principal balance as of the Cut-off Date of $71.5 million (the“BlueLinx Portfolio Whole Loan”) and is comprised of fourpari passu notes, each as described below. The controlling Note A-1 and non-controlling Note A-2, with an aggregate outstanding principal balance as of the Cut-off Date of $42.9 million, are being contributed to the Benchmark 2018-B2 Trust. The remaining notes are held by the parties described in the “Whole Loan Summary” chart below. The relationship between the holders of the BlueLinx Portfolio Whole Loan will be governed by a co-lender agreement as described under “Description of the Mortgage Pool—The Whole Loans—The Serviced Pari Passu Whole Loans” in the Preliminary Prospectus. The BlueLinx Portfolio Whole Loan has a five-year term and is interest-only for the full term. At the time of the acquisition, a prior loan, which was secured in part by the BlueLinx Portfolio properties, had been modified to extend the maturity date. Please see “Litigation and Other Considerations” in the Preliminary Prospectus.
| Whole Loan Summary | ||||
| Notes | Original Balance | Cut-off Date Balance | Note Holder | Controlling Piece |
| A-1, A-2 | $42,900,000 | $42,900,000 | Benchmark 2018-B2 | Yes |
| A-3 | $18,600,000 | $18,600,000 | Société Générale | No |
| A-4 | $10,000,000 | $10,000,000 | Société Générale | No |
| Total | $71,500,000 | $71,500,000 | ||
| Portfolio Summary(1) | |||||||
| Property | Location | Net Rentable Area (SF) | Year Built/ Renovated | Allocated Whole Loan Amount | % of Allocated Whole Loan Amount | Appraised Value | % of Appraised Value |
| BlueLinx Frederick | Frederick, MD | 680,252 | 1996/NAP | $24,700,000 | 34.5% | $38,000,000 | 34.1% |
| BlueLinx Bellingham | Bellingham, MA | 489,950 | 1988/2006 | 23,318,750 | 32.6% | 36,900,000 | 33.1% |
| BlueLinx Lawrenceville | Lawrenceville, GA | 585,637 | 1996/NAP | 14,300,000 | 20.0% | 22,400,000 | 20.1% |
| BlueLinx Butner | Butner, NC | 551,996 | 1996/NAP | 9,181,250 | 12.8% | 14,150,000 | 12.7% |
| Total/Wtd. Avg. | 2,307,835 | $71,500,000 | 100.0% | $111,450,000 | 100.0% | ||
| (1) | Based on the appraisals and underwritten rent roll dated February 6, 2018. |
THE INFORMATION IN THIS STRUCTURAL AND COLLATERAL TERM SHEET IS NOT COMPLETE AND MAY BE AMENDED PRIOR TO THE TIME OF SALE. THIS TERM SHEET IS NOT AN OFFER TO SELL THESE SECURITIES AND IT IS NOT A SOLICITATION OF AN OFFER TO BUY THESE SECURITIES IN ANY JURISDICTION WHERE THE OFFER OR SALE IS NOT PERMITTED.
| | |
141 of 151
| Structural and Collateral Term Sheet | Benchmark 2018-B2 | |
| BlueLinx Portfolio | ||
The Properties.The BlueLinx Portfolio properties are 100.0% leased to BlueLinx Corporation, a wholly owned subsidiary of BlueLinx Holdings, Inc. (“BlueLinx”) and are comprised of 2,307,835 square feet of industrial distribution warehouse space across four locations in Maryland, Massachusetts, Georgia and North Carolina. The BlueLinx Frederick, BlueLinx Lawrenceville and BlueLinx Butner properties were each built in 1996. The BlueLinx Bellingham property was built in 1988 and renovated in 2006. BlueLinx Holdings Inc. is a U.S. distributor of building and industrial products that operates through BlueLinx Corporation. Headquartered in Atlanta, Georgia, BlueLinx is a Fortune 1000 company that employs approximately 1,600 people and offers a wide variety of products to service customers nationwide, including dealers, industrial manufacturers, manufactured housing producers and home improvement retailers. BlueLinx also provides a range of services and solutions, such as intermodal distribution services, inventory stocking and backhaul service. BlueLinx operates their distribution business through a network of 39 distribution centers located across the United States.
The largest property by allocated loan amount, BlueLinx Frederick, is a 680,252 square foot industrial distribution warehouse located at 4300 Georgia Pacific Boulevard in Frederick, Maryland. The BlueLinx Frederick property is located in Frederick County, approximately 53 miles west of Baltimore and 48 miles north of Washington, D.C. Built in 1996, the BlueLinx Frederick property, which consists of one, single story warehouse building and also includes 953 square feet of office space along with an internal rail offloading bay, is situated on 54.0 acres of land. The BlueLinx Frederick property offers 206 surface parking spaces, yielding a parking ratio of 0.30 spaces per 1,000 square feet. Additionally, the property has six loading docks, 30 drive-in docks, 12 interior garage doors, and up to 30-foot ceilings. The BlueLinx Frederick property is 100% leased to BlueLinx Corporation under a 15-year absolute net lease through December 2032 with a base rental rate of $4.89 per square foot. The tenant has two, five-year renewal options, exercisable with 12 months’ notice, with 2.5% annual increases beginning on the first day of the second year of each renewal term. The tenant has subleased approximately 100,000 square feet to Carter-Jones Lumber Company, a national building materials retailer which has 146 locations across 12 states. The base rent for the sublease is $5.20 per square foot. The subtenant has exercised its renewal option with a current lease term expiring on June 30, 2024. The subtenant has two, six-year renewal options remaining.
The BlueLinx Frederick property is located within the Washington-Arlington-Alexandria Metropolitan Statistical Area (“Washington D.C. MSA”). According to the appraisal, the average and median annual household incomes within the Washington D.C. MSA are $130,617 and $95,941, respectively, and the estimated 2017 populations for the Washington D.C. MSA and Frederick County were approximately 6.2 million and 249,700, respectively. The Frederick industrial submarket has approximately 5.9 million square feet of Class A/B industrial space with an overall vacancy rate of 11.0% and direct asking rent of $6.31 per square foot on a triple net basis. Underwritten annual base rent per square foot at the BlueLinx Frederick property is $4.89 per square foot.
The second largest property by allocated loan amount, BlueLinx Bellingham, is a 489,950 square foot industrial distribution warehouse located at 419 Maple Street in Bellingham, Massachusetts. The BlueLinx Bellingham property is located in Norfolk county, within the Interstate 495 South section of the greater Boston market area, approximately two miles east of downtown Bellingham. Built in 1988 and renovated in 2006, the BlueLinx Bellingham property consists of two, two-story warehouse buildings including office space, internal rail access, storage space and covered canopies. The two buildings contain approximately 465,453 square feet of industrial space (95.0% of net rentable area) and approximately 24,498 square feet of office space (5.0% of net rentable area). The BlueLinx Bellingham property offers 164 surface parking spaces and yields a parking ratio of approximately 0.33 spaces per 1,000 square feet. The property has 6 loading docks, 16 drive-in docks and a ceiling height of 36 feet. The BlueLinx Bellingham property is 100% leased to Bluelinx Corporation, under a 15-year absolute net lease through December 2032. The tenant, BlueLinx Corporation, has a base rental rate of $6.41 per square foot and two, five-year renewal options, exercisable with 12 months’ notice, with 2.5% annual increases beginning on the first day of the second year of such renewal term.
The BlueLinx Bellingham property is located within the Boston-Cambridge-Newton, Massachusetts-New Hampshire Metropolitan Statistical Area (“Boston MSA”) with close proximity to Interstate 495 and State Route’s 140 and 126. According to the appraisal, the average and median annual household incomes within the Boston MSA are $108,776 and $76,510, respectively, and the estimated 2017 populations for the Boston MSA and Norfolk county were approximately 4.8 million and 700,000, respectively. The Boston industrial market has approximately 131.6 million square feet of industrial space with a direct vacancy rate of 5.9% and direct asking rent of $6.37 per square foot on a triple net basis for warehouse-distribution space. Underwritten annual base rent per square foot at the BlueLinx Bellingham property is $6.41 per square foot.
THE INFORMATION IN THIS STRUCTURAL AND COLLATERAL TERM SHEET IS NOT COMPLETE AND MAY BE AMENDED PRIOR TO THE TIME OF SALE. THIS TERM SHEET IS NOT AN OFFER TO SELL THESE SECURITIES AND IT IS NOT A SOLICITATION OF AN OFFER TO BUY THESE SECURITIES IN ANY JURISDICTION WHERE THE OFFER OR SALE IS NOT PERMITTED.
| | |
142 of 151
| Structural and Collateral Term Sheet | Benchmark 2018-B2 | |
| BlueLinx Portfolio | ||
The third largest property by allocated loan amount, BlueLinx Lawrenceville, is a 585,637 square foot industrial distribution warehouse located at 200 Hosea Road in Lawrenceville, Georgia. The building contains approximately 570,996 square feet of industrial space (97.5% of net rentable area) and approximately 14,641 square feet of office space (2.5% of net rentable area).The property is located in Gwinnett County, within the Interstate 85 North East section of the Atlanta market, approximately 1.7 miles northeast of downtown Lawrenceville and 33.2 miles northeast of downtown Atlanta. Built in 1996, the BlueLinx Lawrenceville property consists of a single-story warehouse building that includes office and warehouse space, 22 open storage structures and external CSX railroad access situated on 64.7 acres of land. The BlueLinx Lawrenceville property offers 328 surface parking spaces, which yields a parking ratio of 0.56 spaces per 1,000 square feet. The Lawrenceville property has eight loading docks and a ceiling height of 28 feet. The BlueLinx Lawrenceville property is 100% leased to BlueLinx Corporation under a 15-year, absolute net lease through December 2032 with a base rental rate of $3.29 per square foot. The tenant has one, 10-year renewal option, exercisable with 12 months’ notice, with 2.5% annual increases beginning on the first day of the second year of each renewal term.
The BlueLinx Lawrenceville property is located within the Atlanta-Sandy Springs-Marietta Core Based Statistical Area (“Atlanta CBSA”). According to the appraisal, the average and median annual household incomes within the Atlanta CBSA are $83,723 and $58,509, respectively, and the estimated 2017 populations for the Atlanta CBSA and Gwinnett County were approximately 5.9 million and 927,000, respectively. The Atlanta industrial market has approximately 489.5 million square feet of industrial warehouse and distribution space with a direct vacancy rate of 7.9% and direct asking rent of $3.84 per square foot on a triple net basis for the third quarter of 2017. Underwritten annual base rent per square foot at the BlueLinx Lawrenceville property is $3.29 per square foot.
The fourth largest property by allocated loan amount, BlueLinx Butner, is a 551,996 square foot industrial distribution warehouse located at 1712 East D Street in Butner, North Carolina. The BlueLinx Butner property contains 541,508 square feet of industrial space (98.1% of net rentable area) and 10,488 square feet of office space (1.9% of net rentable area). The BlueLinx Butner property is located in Granville County on the east side of East D Street, approximately 17 miles northeast of Durham and 30 miles north of Raleigh. Built in 1996, the BlueLinx Butner property consists of 10 single-story buildings including one warehouse with office space, one distribution building, and eight open pole barns situated on 55.0 acres of land. The property offers 212 surface parking spaces and yields a parking ratio of 0.38 spaces per 1,000 square feet. The BlueLinx Butner property has five loading docks, 17 drive-in docks, and ceiling heights of 30 feet for the distribution and warehouse buildings and 24 feet for the eight open pole barns. The property is 100% leased to BlueLinx Corporation under a 15-year lease through December 2032 with a base rental rate of $2.24 per square foot. The tenant has two, five year renewal options, exercisable with 12 months’ notice, with 2.5% annual increases beginning on the first day of the second year of each renewal term. BlueLinx Corporation has further subleased approximately 104,000 square feet to Cormetech, Inc., a manufacturer of environmental catalysts and a service provider for power, marine, industrial, refinery, and petrochemical markets. The sub-tenant has exercised a five-year renewal option with a current lease term expiring in November 2021.
The BlueLinx Butner property is located within the Raleigh-Durham-Chapel Hill Core Based Statistical Area (“Raleigh CBSA”). According to the appraisal, the average and median annual household incomes within the Raleigh CBSA are $84,056 and $59,114, respectively, and the estimated 2017 populations for the Raleigh CBSA and Granville County were approximately 2.2 million and 59,600, respectively. The Granville and Franklin counties industrial market has approximately 8.9 million square feet of industrial space with a direct vacancy rate of 8.1% and average asking rents of $3.46 per square foot on a triple net basis over the past five years. Underwritten annual base rent per square foot at the BlueLinx Butner property is $2.24 per square foot.
| Tenant Summary(1) | |||||||
| Tenant | Property | Ratings Moody’s/S&P/Fitch | Net Rentable Area (SF) | % of Total NRA | Base Rent PSF | % of Total Base Rent | Lease Expiration Date |
| BlueLinx Corporation(2) | Frederick | NA / NA / NA | 680,252 | 29.5% | $4.89 | 34.5% | 12/31/2032 |
| BlueLinx Corporation | Bellingham | NA / NA / NA | 489,950 | 21.2% | $6.41 | 32.6% | 12/31/2032 |
| BlueLinx Corporation | Lawrenceville | NA / NA / NA | 585,637 | 25.4% | $3.29 | 20.0% | 12/31/2032 |
| BlueLinx Corporation(3) | Butner | NA / NA / NA | 551,996 | 23.9% | $2.24 | 12.8% | 12/31/2032 |
| (1) | Based on the underwritten rent roll dated February 6, 2018. |
| (2) | The BlueLinx Corporation tenant at the Frederick property currently subleases 100,000 square feet to Carter-Jones Lumber Company through June 2024. |
| (3) | The BlueLinx Corporation tenant at the Butner property currently subleases 104,000 square feet to Cormetech, Inc. through November 2021. |
THE INFORMATION IN THIS STRUCTURAL AND COLLATERAL TERM SHEET IS NOT COMPLETE AND MAY BE AMENDED PRIOR TO THE TIME OF SALE. THIS TERM SHEET IS NOT AN OFFER TO SELL THESE SECURITIES AND IT IS NOT A SOLICITATION OF AN OFFER TO BUY THESE SECURITIES IN ANY JURISDICTION WHERE THE OFFER OR SALE IS NOT PERMITTED.
| | |
143 of 151
| Structural and Collateral Term Sheet | Benchmark 2018-B2 | |
| BlueLinx Portfolio | ||
| Lease Rollover Schedule(1) | |||||||||
| Year | Number of Leases Expiring | Net Rentable Area Expiring | % of NRA Expiring | Base Rent Expiring | % of Base Rent Expiring | Cumulative Net Rentable Area Expiring | Cumulative % of NRA Expiring | Cumulative Base Rent Expiring | Cumulative % of Base Rent Expiring |
| Vacant | NAP | 0 | 0.0% | NAP | NAP | 0 | 0.0% | NAP | NAP |
| 2018 & MTM | 0 | 0 | 0.0 | $0 | 0.0% | 0 | 0.0% | $0 | 0.0% |
| 2019 | 0 | 0 | 0.0 | 0 | 0.0 | 0 | 0.0% | $0 | 0.0% |
| 2020 | 0 | 0 | 0.0 | 0 | 0.0 | 0 | 0.0% | $0 | 0.0% |
| 2021 | 0 | 0 | 0.0 | 0 | 0.0 | 0 | 0.0% | $0 | 0.0% |
| 2022 | 0 | 0 | 0.0 | 0 | 0.0 | 0 | 0.0% | $0 | 0.0% |
| 2023 | 0 | 0 | 0.0 | 0 | 0.0 | 0 | 0.0% | $0 | 0.0% |
| 2024 | 0 | 0 | 0.0 | 0 | 0.0 | 0 | 0.0% | $0 | 0.0% |
| 2025 | 0 | 0 | 0.0 | 0 | 0.0 | 0 | 0.0% | $0 | 0.0% |
| 2026 | 0 | 0 | 0.0 | 0 | 0.0 | 0 | 0.0% | $0 | 0.0% |
| 2027 | 0 | 0 | 0.0 | 0 | 0.0 | 0 | 0.0% | $0 | 0.0% |
| 2028 | 0 | 0 | 0.0 | 0 | 0.0 | 0 | 0.0% | $0 | 0.0% |
| 2029 & Beyond | 4 | 2,307,835 | 100.0 | 9,625,002 | 100.0 | 2,307,835 | 100.0% | $9,625,002 | 100.0% |
| Total | 4 | 2,307,835 | 100.0% | $9,625,002 | 100.0% | ||||
| (1) | Based on the underwritten rent roll dated February 6, 2018. |
| Underwritten Net Cash Flow(1) | |||||
| Underwritten | Per Square Foot | %(2) | |||
| Rents in Place | $9,625,002 | $4.17 | 74.0% | ||
| Vacant Income | 0 | 0.0 | 0.0 | ||
| Gross Potential Rent | $9,625,002 | $4.17 | 74.0% | ||
| Reimbursements | 3,373,690 | 1.46 | 26.0 | ||
| Net Rental Income | $12,998,692 | $5.63 | 100.0% | ||
| (Vacancy/Credit Loss) | (974,902) | (0.42 | ) | (7.5) | |
| Effective Gross Income | $12,023,790 | $5.21 | 92.5% | ||
| Total Expenses | $3,373,690 | $1.46 | 28.1% | ||
| Net Operating Income | $8,650,101 | $3.75 | 71.9% | ||
| Total TI/LC, Capex/RR | 690,121 | 0.30 | 5.7 | ||
| Net Cash Flow | $7,959,979 | $3.45 | 66.2% | ||
| (1) | Due to the nature of the sale leaseback transaction, no historical cash flow information is available. |
| (2) | % column represents percent of Net Rental Income for all revenue lines and represents percent of Effective Gross Income for the remainder of the fields. |
Property Management. The property is managed by Brennan Management LLC, an affiliate of the borrowers.
THE INFORMATION IN THIS STRUCTURAL AND COLLATERAL TERM SHEET IS NOT COMPLETE AND MAY BE AMENDED PRIOR TO THE TIME OF SALE. THIS TERM SHEET IS NOT AN OFFER TO SELL THESE SECURITIES AND IT IS NOT A SOLICITATION OF AN OFFER TO BUY THESE SECURITIES IN ANY JURISDICTION WHERE THE OFFER OR SALE IS NOT PERMITTED.
| | |
144 of 151
| Structural and Collateral Term Sheet | Benchmark 2018-B2 |
[THIS PAGE INTENTIONALLY LEFT BLANK]
THE INFORMATION IN THIS STRUCTURAL AND COLLATERAL TERM SHEET IS NOT COMPLETE AND MAY BE AMENDED PRIOR TO THE TIME OF SALE. THIS TERM SHEET IS NOT AN OFFER TO SELL THESE SECURITIES AND IT IS NOT A SOLICITATION OF AN OFFER TO BUY THESE SECURITIES IN ANY JURISDICTION WHERE THE OFFER OR SALE IS NOT PERMITTED.
| | |
145 of 151
| Structural and Collateral Term Sheet | Benchmark 2018-B2 | |
| Marina Heights State Farm | ||
| Mortgage Loan Information | Property Information | |||
| Mortgage Loan Seller(1): | GACC | Single Asset / Portfolio: | Single Asset | |
| Original Principal Balance(2): | $41,000,000 | Title: | Leasehold | |
| Cut-off Date Principal Balance(2): | $41,000,000 | Property Type - Subtype: | Office – Suburban | |
| % of Pool by IPB: | 2.7% | Net Rentable Area (SF): | 2,031,293 | |
| Loan Purpose: | Acquisition | Location: | Tempe, AZ | |
| Borrower: | Corporate Properties Tempe SPE, | Year Built / Renovated: | 2015-2017 / N/A | |
| L.L.C. | Occupancy: | 99.5% | ||
| Sponsor(3): | Transwestern Investment Group, | Occupancy Date: | 12/7/2017 | |
| Corporate Properties Trust III, L.P. | Number of Tenants: | 4 | ||
| Interest Rate: | 3.55950% | 2014 NOI(5): | N/A | |
| Note Date: | 12/7/2017 | 2015 NOI(5): | N/A | |
| Anticipated Repayment Date(4): | 1/6/2028 | 2016 NOI(5): | N/A | |
| Final Maturity Date(4): | 1/6/2033 | TTM NOI(5): | N/A | |
| Interest-only Period: | 120 months | UW Economic Occupancy: | 98.7% | |
| Original Term(4): | 120 months | UW Revenues: | $83,160,015 | |
| Original Amortization: | None | UW Expenses: | $19,826,859 | |
| Amortization Type: | ARD-Interest Only | UW NOI(6): | $63,333,156 | |
| Call Protection: | L(11),Gtr1%orYM(102),O(7) | UW NCF(6): | $63,137,233 | |
| Lockbox / Cash Management: | Hard / Springing | Appraised Value / Per SF: | $960,000,000 / $473 | |
| Additional Debt: | Yes | Appraisal Date: | 11/20/2017 | |
| Additional Debt Balance: | $519,000,000 | |||
| Additional Debt Type: | Pari Passu | |||
| Escrows and Reserves | Financial Information(2) | |||||||
| Initial | Monthly | Initial Cap | Cut-off Date Loan / SF: | $276 | ||||
| Taxes: | $0 | Springing | N/A | Maturity Date Loan / SF: | $276 | |||
| Insurance: | $0 | Springing | N/A | Cut-off Date LTV: | 58.3% | |||
| Replacement Reserves | $0 | Springing | N/A | Maturity Date LTV: | 58.3% | |||
| TI/LC: | $0 | Springing | N/A | UW NCF DSCR(6): | 3.12x | |||
| Other: | $0 | $0 | N/A | UW NOI Debt Yield(6): | 11.3% | |||
| Sources and Uses(7) | ||||||||
| Sources | Proceeds | % of Total | Uses | Proceeds | % of Total | |||
| Mortgage Loan | $560,000,000 | 58.5% | Purchase Price(9) | $930,000,000 | 97.1% | |||
| Principal Cash Equity Contribution | 375,736,548 | 39.2 | Imputed Equity Purchase | 22,500,000 | 2.3 | |||
| Imputed Equity Contribution(8) | 22,500,000 | 2.3 | Closing Costs(10) | 5,736,548 | 0.6 | |||
| Total Sources | $958,236,548 | 100.0% | Total Uses | $958,236,548 | 100.0% | |||
| 1) | The Marina Heights State Farm Whole Loan (as defined in “The Loan” below) was originated by Goldman Sachs Mortgage Company (“GSMC”) on December 7, 2017. Subsequent to the origination date, notes representing 35% of the Marina Heights State Farm Whole Loan were transferred to Deutsche Bank AG, acting through its New York Branch (“DBNY”), an affiliate of GACC, which has re-underwritten such mortgage loan in accordance with the procedures described under “Transaction Parties—The Sponsors and Mortgage Loan Sellers—German American Capital Corporation—DBNY’s Underwriting Guidelines and Processes”in the Preliminary Prospectus. |
| (2) | The Marina Heights State Farm loan is part of a whole loan evidenced by eightpari passunotes with an aggregate outstanding principal balance of $560.0 million. The Financial Information presented in the chart above reflects the $560.0 million aggregate Cut-off Date balance of the Marina Heights State Farm Whole Loan. |
| (3) | There is no nonrecourse carve-out guarantor or environmental indemnitor, other than the borrower, for the Marina Heights State Farm Whole Loan. |
| (4) | The Marina Heights State Farm Whole Loan has an anticipated repayment date of January 6, 2028 (the “Anticipated Repayment Date” or “ARD”) and a final maturity date of January 6, 2033. From and after the Anticipated Repayment Date, (a) the Marina Heights State Farm Whole Loan accrues interest at a fixed rate that is equal to the greater of (i) 3.55950% plus 3.00000% and (ii) the then 10-year swap rate plus 3.00000% and (b) on each payment date after the ARD, requires principal payments based on a 30-year amortization schedule assuming the initial interest rate. |
| (5) | Historical NOI is not available because construction of the property was completed between 2015 and 2017. |
| (6) | The UW NCF DSCR and UW NOI Debt Yield are based on the adjusted underwritten net operating income and net cash flow (as set forth under the “Underwritten Net Cash Flow” chart below), and include the net present value of future contractual rent increases in the amount of $11,242,393, as well as other adjustments. The UW NCF DSCR and UW NOI Debt Yield absent such adjustments are 2.62x and 9.4%, respectively. |
| (7) | The Marina Heights State Farm Whole Loan was used to finance the purchase of the Marina Heights State Farm property by a wholly-owned subsidiary of a joint venture between JDM Partners, LLC (“JDM”) and Transwestern Investment Group, LLC (“Transwestern”) in a sale lease-back transaction from State Farm Mutual Automobile Insurance Company and its affiliates (collectively, “State Farm”). |
| (8) | Represents the value of Transwestern’s equity interest in partnership based on borrower’s purchase price. |
| (9) | Represents the contractual purchase price. |
| (10) | Closing Costs includes costs associated with the purchase and sale transaction. |
THE INFORMATION IN THIS STRUCTURAL AND COLLATERAL TERM SHEET IS NOT COMPLETE AND MAY BE AMENDED PRIOR TO THE TIME OF SALE. THIS TERM SHEET IS NOT AN OFFER TO SELL THESE SECURITIES AND IT IS NOT A SOLICITATION OF AN OFFER TO BUY THESE SECURITIES IN ANY JURISDICTION WHERE THE OFFER OR SALE IS NOT PERMITTED.
| | |
146 of 151
| Structural and Collateral Term Sheet | Benchmark 2018-B2 | |
| Marina Heights State Farm | ||
The Loan.The Marina Heights State Farm loan is secured by a first mortgage lien on the borrower’s leasehold interest in a five building office complex with retail space. The borrowing entity is Corporate Properties Tempe SPE, L.L.C., a Delaware limited liability company. There is no nonrecourse carve-out guarantor or environmental indemnitor, other than the borrower, for the Marina Heights State Farm Whole Loan.
The loan sponsor is Transwestern and Corporate Properties Trust III, L.P. (a joint venture between JDM and Transwestern). JDM is a Phoenix-based real estate development and equity fund management firm. JDM sponsors multiple real estate funds and a JDM managed fund is the limited partner and majority equity holder or joint venturer. As of December 31, 2016, JDM’s fund assets consist of office, commercial, and resort assets, including 23 commercial and office buildings in 16 states, totaling over six million square feet (not including the Marina Heights State Farm property). JDM has an existing relationship with State Farm as State Farm is the tenant in 20 of the 23 commercial and office buildings referenced above and accounts for over 4.8 million of the over six million square feet. Transwestern, an investment advisor, is the general partner and a minority equity holder of the joint venture. Transwestern has an existing relationship with State Farm, including acting as general partner, minority equityholder and property manager of State Farm’s two other super-regional headquarters in Richardson, Texas and Dunwoody, Georgia.
The whole loan has an outstanding principal balance as of the Cut-off Date of $560.0 million (the “Marina Heights State Farm Whole Loan”), and is comprised of eightpari passu notes, each as described below. The non-controlling Note A-2-C4 and Note A-2-C5, with an aggregate outstanding principal balance as of the Cut-off Date of $41.0 million, will be contributed to the Benchmark 2018-B2 Trust. The remaining notes are currently held by the parties described in the “Whole Loan Summary” chart below and have been or are expected to be contributed to one or more securitization trusts. The relationship between the holders of the Marina Heights State Farm Whole Loan will be governed by a co-lender agreement as described under “Description of the Mortgage Pool—The Whole Loans—The Non-Serviced Pari Passu Whole Loans” in the Preliminary Prospectus. The Marina Heights State Farm Whole Loan is structured with an ARD of January 6, 2028, a final maturity date of January 6, 2033 and will be interest only for the entire term until the ARD. From the first payment date after the ARD until the final maturity date, the Marina Heights State Farm Whole Loan will amortize on a 30-year schedule.
| Whole Loan Summary | |||||
| Note | Original Balance | Cut-off Date Balance | Note Holder | Controlling Piece | |
| A-1-S | $264,000,000 | $264,000,000 | GSMS 2017-FARM | Yes | |
| A-1-C1, A-1-C2 | $100,000,000 | $100,000,000 | GSMC | No | |
| A-2-C4, A-2-C5 | $41,000,000 | $41,000,000 | Benchmark 2018-B2 | No | |
| A-2-C1, A-2-C2, A-2-C3 | $155,000,000 | $155,000,000 | DBNY | No | |
| Total | $560,000,000 | $560,000,000 | |||
The Property.The Marina Heights State Farm property is an approximately 2.03 million square foot office campus consisting of approximately (i) 1.97 million square feet of office space, (ii) approximately 58,000 square feet of dining, retail, and wellness space and (iii) approximately 8,000 square feet of management office space, located on an approximately 20-acre site. The Marina Heights State Farm property consists of five regional headquarters office buildings and was delivered to State Farm in 2015 through 2017 to meet the company’s need for a campus to accommodate the consolidation of approximately 10,000 employees from across the southwest region. As part of this strategy, the Marina Heights State Farm property was developed as a Class A, office campus offering modern finishes and flexible office configurations for office, conference and training needs. The Marina Heights State Farm property also offers 7,991 parking spaces (3.9 spaces per 1,000 square feet). The Marina Heights State Farm property has large, raised floor plates, raised ceilings, modern building systems, along with marble and natural hardwood lobby accents and ground floor café and restaurant tenants. Furthermore, the campus offers access to Loop 202 and is approximately four miles from the Phoenix Sky Harbor International Airport. The Marina Heights State Farm property is also expected to be a future stop for the Tempe Streetcar (which is in an initial construction phase and is not expected to be completed prior to 2020), which is anticipated to provide access to the airport, downtown and central Phoenix, and west Mesa via the Valley Metro Light Rail.
THE INFORMATION IN THIS STRUCTURAL AND COLLATERAL TERM SHEET IS NOT COMPLETE AND MAY BE AMENDED PRIOR TO THE TIME OF SALE. THIS TERM SHEET IS NOT AN OFFER TO SELL THESE SECURITIES AND IT IS NOT A SOLICITATION OF AN OFFER TO BUY THESE SECURITIES IN ANY JURISDICTION WHERE THE OFFER OR SALE IS NOT PERMITTED.
| | |
147 of 151
| Structural and Collateral Term Sheet | Benchmark 2018-B2 | |
| Marina Heights State Farm | ||
State Farm is the largest tenant at the Marina Heights State Farm property, occupying 97.1% of the total square feet, 100.0% of the office space and accounts for 98.8% of UW Total Rent. In addition to State Farm, the Marina Heights State Farm property is leased to Mountainside Fitness, Compass, Honor Health, and Transwestern’s management office (in the aggregate representing 2.3% of the total square feet and 1.2% of UW Total Rent). Founded in 1922 and based in Bloomington, Illinois, State Farm has approximately $148 billion in total assets as of December 2016. State Farm generated a net loss of $2.6 billion in 2016, with net written premiums of $39.6 billion and net investment income of $3.4 billion. A.M. Best Co. gives an A++ rating to State Farm Mutual Automobile Insurance Company. State Farm operates in every state and Washington, D.C. through its independent field agents that operate through localized offices. In January 2015, State Farm sold all of its Canadian businesses to the Desjardins Group.
The Marina Heights State Farm property represents an operations center that houses approximately 10,000 employees in various roles including regional managers, claims processing and field agents serving State Farm’s Southwestern markets. The five office buildings are leased to State Farm pursuant to five separate long-term leases averaging more than 20 years across the five buildings, with the option to renew each lease for up to 20 additional years. The State Farm leases are triple net, allowing the pass through of Marina Heights State Farm property operating expenses, and provide for annual rent escalations of 2.0%. The buildings were designed and built to accommodate the consolidation of approximately 10,000 employees from across the region. There are two additional buildings on the campus for retail and wellness facilities.
The Marina Heights State Farm property is located in Tempe, Arizona. The Tempe office submarket had a vacancy rate of 6.7% for Class A office properties as of third quarter 2017 which has remained near or below the historical average since 2013. The gross market rents for Class A office leases were $34.46 per square foot as of the third quarter of 2017. Seven office lease comparables have asking rents ranging from $21.06 per square foot to $27.56 per square foot on a triple-net basis and $31.50 per square foot to $44.00 per square foot on a gross rent basis.
| Historical and Current Occupancy(1) | |||
| 2014 | 2015 | 2016 | Current(2) |
| N/A | N/A | N/A | 99.5% |
| (1) | Historical occupancy is not available as the Marina Heights State Farm property was constructed from 2015 to 2017. |
| (2) | Current Occupancy is as of December 7, 2017. |
| Tenant Summary(1) | |||||||||||||||
| Tenant | Ratings(2) Moody’s/S&P/Fitch | Net Rentable Area (SF) | % of Total NRA | Base Rent PSF | % of Base Rent | Lease Expiration Date | |||||||||
| State Farm Building B | NA / AA / NA | 575,639 | 28.3 | % | $26.52 | 28.9 | % | 12/31/2042 | |||||||
| State Farm Building E | NA / AA / NA | 426,902 | 21.0 | 26.52 | 21.4 | 12/31/2032 | |||||||||
| State Farm Building D | NA / AA / NA | 370,332 | 18.2 | 26.52 | 18.6 | 12/31/2035 | |||||||||
| State Farm Building A | NA / AA / NA | 347,851 | 17.1 | 26.52 | 17.5 | 12/31/2037 | |||||||||
| State Farm Building C | NA / AA / NA | 245,370 | 12.1 | 26.52 | 12.3 | 12/31/2039 | |||||||||
| Mountainside Fitness | NA / NA / NA | 17,485 | 0.9 | 10.00 | 0.3 | 3/31/2027 | |||||||||
| MarinaLink (State Farm) | NA / AA / NA | 7,154 | 0.4 | 25.50 | 0.3 | 3/31/2027 | |||||||||
| Compass - Cafe 450 | NA / NA / NA | 6,610 | 0.3 | 10.51 | 0.1 | 12/31/2031 | |||||||||
| Honor Health | NA / NA / NA | 5,736 | 0.3 | 21.53 | 0.2 | 7/31/2027 | |||||||||
| Compass - Matt’s Big Breakfast | NA / NA / NA | 5,007 | 0.2 | 10.51 | 0.1 | 12/31/2031 | |||||||||
| (1) | Based on the underwritten rent roll dated December 7, 2017. |
| (2) | Ratings for State Farm leases are those for State Farm Mutual Automobile Insurance Company, the tenant on each State Farm lease. |
THE INFORMATION IN THIS STRUCTURAL AND COLLATERAL TERM SHEET IS NOT COMPLETE AND MAY BE AMENDED PRIOR TO THE TIME OF SALE. THIS TERM SHEET IS NOT AN OFFER TO SELL THESE SECURITIES AND IT IS NOT A SOLICITATION OF AN OFFER TO BUY THESE SECURITIES IN ANY JURISDICTION WHERE THE OFFER OR SALE IS NOT PERMITTED.
| | |
148 of 151
| Structural and Collateral Term Sheet | Benchmark 2018-B2 | |
| Marina Heights State Farm | ||
| Lease Rollover Schedule(1) | |||||||||||||
| Year | Number of Leases Expiring | Net Rentable Area Expiring | % of NRA Expiring | Base Rent Expiring | % of Base Rent Expiring | Cumulative Net Rentable Area Expiring | Cumulative % of NRA Expiring | Cumulative Base Rent Expiring | Cumulative % of Base Rent Expiring | ||||
| Vacant | NAP | 10,488 | 0.5 | % | NAP | NAP | 10,488 | 0.5 | % | NAP | NAP | ||
| 2018 & MTM | 0 | 0 | 0.0 | 0 | 0.0 | % | 10,488 | 0.5 | % | 0 | 0.0 | % | |
| 2019 | 0 | 0 | 0.0 | 0 | 0.0 | 10,488 | 0.5 | % | 0 | 0.0 | % | ||
| 2020 | 0 | 0 | 0.0 | 0 | 0.0 | 10,488 | 0.5 | % | 0 | 0.0 | % | ||
| 2021 | 0 | 0 | 0.0 | 0 | 0.0 | 10,488 | 0.5 | % | 0 | 0.0 | % | ||
| 2022 | 0 | 0 | 0.0 | 0 | 0.0 | 10,488 | 0.5 | % | 0 | 0.0 | % | ||
| 2023 | 0 | 0 | 0.0 | 0 | 0.0 | 10,488 | 0.5 | % | 0 | 0.0 | % | ||
| 2024 | 0 | 0 | 0.0 | 0 | 0.0 | 10,488 | 0.5 | % | 0 | 0.0 | % | ||
| 2025(2) | 1 | 915 | 0.0 | 0 | 0.0 | 11,403 | 0.6 | % | 0 | 0.0 | % | ||
| 2026(2) | 3 | 6,621 | 0.3 | 0 | 0.0 | 18,024 | 0.9 | % | 0 | 0.0 | % | ||
| 2027 | 3 | 30,375 | 1.5 | 480,773 | 0.9 | 48,399 | 2.4 | % | 480,773 | 0.9 | % | ||
| 2028 | 0 | 0 | 0.0 | 0 | 0.0 | 48,399 | 2.4 | % | 480,773 | 0.9 | % | ||
| 2029 & Beyond | 11 | 1,982,894 | 97.6 | % | 52,317,710 | 99.1 | 2,031,293 | 100.0 | % | 52,798,483 | 100.0 | % | |
| Total | 18 | 2,031,293 | 100.0 | % | $52,798,483 | 100.0 | % | ||||||
| (1) | Based on the underwritten rent roll dated December 7, 2017. |
| (2) | Includes a total of 7,536 square feet which pertains to the management office, which does not pay rent or reimbursements at the Marina Heights State Farm property. |
| Underwritten Net Cash Flow(1) | |||||
| Underwritten In-Place | Adjusted Underwritten | Per Square Foot | %(2) | ||
| Rents in Place(3) | $52,798,483 | $52,798,483 | $25.99 | 62.7 | % |
| Credit Tenant Rent Steps(4) | 0 | 11,242,393 | 5.53 | 13.3 | |
| Vacant Income | 0 | 300,493 | 0.15 | 0.4 | |
| Gross Potential Rent | $52,798,483 | $64,341,369 | $31.68 | 76.4 | % |
| Total Reimbursements(5) | 17,819,370 | 19,919,069 | 9.81 | 23.6 | |
| Net Rental Income | 70,617,853 | 84,260,438 | $41.48 | 100.0 | % |
| (Vacancy/Credit Loss)(6) | 0 | (1,100,423) | (0.54) | (1.3 | ) |
| Effective Gross Income | $70,617,853 | $83,160,015 | $40.94 | 98.7 | % |
| Total Expenses(7) | $17,716,262 | $19,826,859 | $9.76 | 23.8 | % |
| Net Operating Income | $52,901,590 | $63,333,156 | $31.18 | 76.2 | % |
| Total TI/LC, Capex/RR | 0 | 195,923 | 0.10 | 0.2 | |
| Net Cash Flow | $52,901,590 | $63,137,233 | $31.08 | 75.9 | % |
| (1) | Historical financial information is not available as the Marina Heights State Farm property was constructed from 2015 to 2017. |
| (2) | % column represents percent of Net Rental Income for all revenue lines and represents percent of Effective Gross Income for the remainder of the fields. |
| (3) | Rents in Place include rent steps through January 1, 2019. |
| (4) | Credit Tenant Rent Steps reflect the net present value of future contractual rent steps for State Farm leases (office and Marina Link space) through the lease term (excluding any rent steps already captured in Rents in Place), using a discount rate of 7.0%. |
| (5) | Underwritten In-Place Total Reimbursements reflect contractual expense reimbursements for all tenants at the property, based on a pro-rata share of budgeted expenses and management office rent and reimbursements. Adjusted Underwritten Total Reimbursements are calculated the same as Underwritten In-Place, however the additional management fee and ground rent expense is passed through to occupied tenants. |
| (6) | Vacancy/Credit Loss reflects 1.0% vacancy for State Farm space, in-place economic vacancy for retail space of 21.2% and 0% vacancy on management office space. |
| (7) | Adjusted Underwritten Total Expenses includes the average of ground rent expense over the Marina Heights State Farm Whole Loan term, which is required to be reimbursed by the tenants (other than the tenant under the space used for management). |
Property Management.The property is managed by Transwestern Commercial Services Arizona, L.L.C, an affiliate of the borrower.
THE INFORMATION IN THIS STRUCTURAL AND COLLATERAL TERM SHEET IS NOT COMPLETE AND MAY BE AMENDED PRIOR TO THE TIME OF SALE. THIS TERM SHEET IS NOT AN OFFER TO SELL THESE SECURITIES AND IT IS NOT A SOLICITATION OF AN OFFER TO BUY THESE SECURITIES IN ANY JURISDICTION WHERE THE OFFER OR SALE IS NOT PERMITTED.
| | |
149 of 151
| Structural and Collateral Term Sheet | Benchmark 2018-B2 | |
| Marina Heights State Farm | ||
Ground Lease.The borrower’s interest with respect to the property is through a ground lease with the Arizona Board of Regents, a body corporate, for and on behalf of Arizona State University (the “Ground Lessor”) that commenced on August 16, 2013 and expires on August 16, 2112 (the “Ground Lease”). The borrower has one option to renew for a period of no fewer than 25 and no more than 99 years. The ground lease is structured with seven separate phases corresponding to the seven buildings. No rent payments are due with respect to any phase under the ground lease until the 8th anniversary of the day the first certificate of occupancy was issued for such phase. The rent commencement dates for the phases begin on October 13, 2023 and the final phase rent commences March 3, 2025. The maximum ground rent expense once rent commences for all phases is $4,375,033per annum. There are no contractual ground lease increases. $30,905,569 of rent was prepaid to the Ground Lessor. In addition to ground rent, the Ground Lease requires the tenant to cover certain additional costs and expenses, including but not limited to (i) annual payments to the city of Tempe, which includes a set of annual payments calculated on gross building space and number of office floors (a portion of these payments fund K-12 city schools) and a $309,315 annual municipal services fee, (ii) annual payments to the Rio Salado Community Facilities District equal to the Ground Lessor’s proportionate share of maintaining the adjacent public lake and park and (iii) all taxes, assessments, utility fees or other charges imposed upon or that are a lien on the property or the improvements. For example, pending the execution of the Streetcar Development Agreement in order to develop the Streetcar project, the borrower will be required to pay annual payments of $210,125.30 for 20 years, totaling an aggregate payment of $4,202,506. The property is exempt from property taxes because the Ground Lessor is a tax exempt government agency. The Ground Lease prohibits the Ground Lessor from transferring the fee to any entity that is not the State of Arizona or a political subdivision thereof that is exempt from property taxes. The Marina Heights State Farm loan was underwritten assuming no property taxes are paid.
THE INFORMATION IN THIS STRUCTURAL AND COLLATERAL TERM SHEET IS NOT COMPLETE AND MAY BE AMENDED PRIOR TO THE TIME OF SALE. THIS TERM SHEET IS NOT AN OFFER TO SELL THESE SECURITIES AND IT IS NOT A SOLICITATION OF AN OFFER TO BUY THESE SECURITIES IN ANY JURISDICTION WHERE THE OFFER OR SALE IS NOT PERMITTED.
| | |
150 of 151
| Structural and Collateral Term Sheet | Benchmark 2018-B2 | |
| Contacts | ||
| J.P. Morgan CMBS Capital Markets & Banking | ||
| Contact | Phone Number | |
Kunal Singh Managing Director | kunal.k.singh@jpmorgan.com | (212) 834-5467 |
Brad Horn Executive Director | bradley.j.horn@jpmorgan.com | (212) 834-9708 |
John Miller Vice President | john.miller@jpmorgan.com | (212) 272-8363 |
| J.P. Morgan CMBS Trading | ||
| Contact | Phone Number | |
Andy Taylor Managing Director | andrew.b.taylor@jpmorgan.com | (212) 834-3111 |
Avinash Sharma Executive Director | avinash.sharma@jpmorgan.com | (212) 834-3111 |
| J.P. Morgan Securitized Products Syndicate | ||
| Contact | Phone Number | |
Andy Cherna Managing Director | andy.cherna@jpmorgan.com | (212) 834-4154 |
Anusha Joly Vice President | anusha.joly@jpmorgan.com | (212) 834-4154 |
| Deutsche Bank CMBS Capital Markets & Banking | ||
| Contact | Phone Number | |
Lainie Kaye Managing Director | lainie.kaye@db.com | (212) 250-5270 |
Natalie Grainger Director | natalie.grainger@db.com | (212) 250-1254 |
| Deutsche Bank CMBS Trading | ||
| Contact | Phone Number | |
Ryan Horvath Vice President | ryan.horvath@db.com | (212) 250-5149 |
| Deutsche Bank CMBS Structuring | ||
| Contact | Phone Number | |
Shaishav Agarwal Managing Director | shaishav.agarwal@db.com | (212) 250-6290 |
Dan Penn Director | daniel.penn@db.com | (212) 250-5149 |
| Citigroup CMBS Capital Markets & Securitization | ||
| Contact | Phone Number | |
Rick Simpson Director | richard.simpson@citi.com | (212) 816-5343 |
Sana Petersen Director | sana.petersen@citi.com | (212) 816-3852 |
| Citigroup Structuring, Trading & Syndicate | ||
| Contact | Phone Number | |
Paul Vanderslice Managing Director | paul.t.vanderslice@citi.com | (212) 723-1295 |
Raul Orozco Director | raul.d.orozco@citi.com | (212) 723-1295 |
THE INFORMATION IN THIS STRUCTURAL AND COLLATERAL TERM SHEET IS NOT COMPLETE AND MAY BE AMENDED PRIOR TO THE TIME OF SALE. THIS TERM SHEET IS NOT AN OFFER TO SELL THESE SECURITIES AND IT IS NOT A SOLICITATION OF AN OFFER TO BUY THESE SECURITIES IN ANY JURISDICTION WHERE THE OFFER OR SALE IS NOT PERMITTED.
| | |
151 of 151