Q1 Segment Supplemental Information

Q1 Segment Performance(1) ($ in thousands) Three months ended December 31, Period over 2018 2017 period growth Adjusted Net Revenue(2) Merchant Services, excluding Purchased Portfolios $ 21,301 $ 18,788 13% Purchased Portfolios 2,037 2,844 (28)% Merchant Services 23,338 21,632 8% Proprietary Software and Payments 6,232 3,353 86% Other — (2) nm Total $ 29,570 $ 24,983 18% Adjusted EBITDA(2) Merchant Services $ 7,851 $ 7,603 3% Proprietary Software and Payments 2,851 1,248 128% Other (2,124) (2,002) (6)% Total $ 8,578 $ 6,849 25% Adjusted EBITDA as a percentage of Net Revenue 29% 27% Volume Merchant Services 2,804,139 2,705,780 4% Proprietary Software and Payments 139,710 122,149 14% Total 2,943,849 2,827,929 4% 1. i3 Verticals has two segments, “Merchant Services,” which includes Purchased Portfolios (a subset of merchant contracts purchased in 2014 and 2017) and "Proprietary Software and Payments." i3 Verticals also has an “Other” category, which includes corporate overhead. 2. Adjusted Net Revenue and Adjusted EBITDA are non-GAAP financial measures. Refer to the following slides for the reconciliation of non-GAAP financial measures.

Reconciliation of Non-GAAP Financial Measures The reconciliation of our revenue to non-GAAP adjusted net revenue is as follows: ($ in thousands) Three Months Ended December 31, 2018 Proprietary Software Merchant Services(1) and Payments Other Total Revenue $ 77,702 $ 7,166 $ — $ 84,868 Acquisition revenue adjustments — 531 — 531 Interchange and network fees (54,364) (1,465) — (55,829) Adjusted Net Revenue $ 23,338 $ 6,232 $ — $ 29,570 ($ in thousands) Three Months Ended December 31, 2017 Proprietary Software Merchant Services(1) and Payments Other Total Revenue $ 72,679 $ 4,545 $ (3) $ 77,221 Interchange and network fees (51,047) (1,192) 1 (52,238) Adjusted Net Revenue $ 21,632 $ 3,353 $ (2) $ 24,983 1. Merchant Services includes purchased portfolios which had revenue of $3,846, acquisition revenue adjustments of $0 and interchange and network fees of $1,809 for the three months ended December 31, 2018. 2. Merchant Services includes purchased portfolios which had revenue of $5,335 and interchange and network fees of $2,491 for the three months ended December 31, 2017.

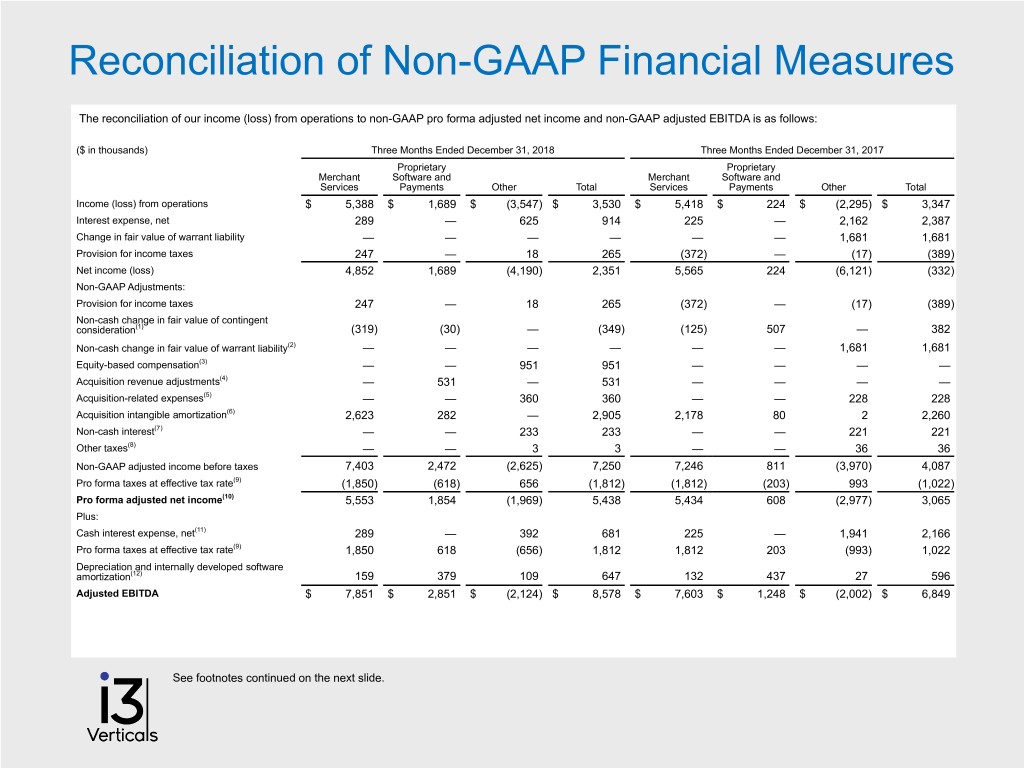
Reconciliation of Non-GAAP Financial Measures The reconciliation of our income (loss) from operations to non-GAAP pro forma adjusted net income and non-GAAP adjusted EBITDA is as follows: ($ in thousands) Three Months Ended December 31, 2018 Three Months Ended December 31, 2017 Proprietary Proprietary Merchant Software and Merchant Software and Services Payments Other Total Services Payments Other Total Income (loss) from operations $ 5,388 $ 1,689 $ (3,547) $ 3,530 $ 5,418 $ 224 $ (2,295) $ 3,347 Interest expense, net 289 — 625 914 225 — 2,162 2,387 Change in fair value of warrant liability — — — — — — 1,681 1,681 Provision for income taxes 247 — 18 265 (372) — (17) (389) Net income (loss) 4,852 1,689 (4,190) 2,351 5,565 224 (6,121) (332) Non-GAAP Adjustments: Provision for income taxes 247 — 18 265 (372) — (17) (389) Non-cash change in fair value of contingent consideration(1) (319) (30) — (349) (125) 507 — 382 Non-cash change in fair value of warrant liability(2) — — — — — — 1,681 1,681 Equity-based compensation(3) — — 951 951 — — — — Acquisition revenue adjustments(4) — 531 — 531 — — — — Acquisition-related expenses(5) — — 360 360 — — 228 228 Acquisition intangible amortization(6) 2,623 282 — 2,905 2,178 80 2 2,260 Non-cash interest(7) — — 233 233 — — 221 221 Other taxes(8) — — 3 3 — — 36 36 Non-GAAP adjusted income before taxes 7,403 2,472 (2,625) 7,250 7,246 811 (3,970) 4,087 Pro forma taxes at effective tax rate(9) (1,850) (618) 656 (1,812) (1,812) (203) 993 (1,022) Pro forma adjusted net income(10) 5,553 1,854 (1,969) 5,438 5,434 608 (2,977) 3,065 Plus: Cash interest expense, net(11) 289 — 392 681 225 — 1,941 2,166 Pro forma taxes at effective tax rate(9) 1,850 618 (656) 1,812 1,812 203 (993) 1,022 Depreciation and internally developed software amortization(12) 159 379 109 647 132 437 27 596 Adjusted EBITDA $ 7,851 $ 2,851 $ (2,124) $ 8,578 $ 7,603 $ 1,248 $ (2,002) $ 6,849 See footnotes continued on the next slide.

Reconciliation of Non-GAAP Financial Measures 1. Non-cash change in fair value of contingent consideration reflects the changes in management’s estimates of future cash consideration to be paid in connection with prior acquisitions from the amount estimated as of the later of the most recent balance sheet date forming the beginning of the income statement period or the original estimates made at the closing of the applicable acquisition. 2. Non-cash change in warrant liability reflects the fair value change in certain warrants for our common units associated with our mezzanine notes in the aggregate principal amount of $10.5 million. These warrants are accounted for as liabilities on our consolidated balance sheets. 3. Equity-based compensation expense consisted of $951 related to stock options issued under the Company's 2018 Equity Incentive Plan during the three months ended December 31, 2018. 4. Under GAAP, companies must adjust, as necessary, beginning balances of acquired deferred revenue to fair value as part of acquisition accounting as defined by GAAP. Acquisition revenue adjustments remove the effect of these adjustments to acquisition date fair value from acquisitions that have closed as of the date of the earnings release. 5. Acquisition-related expenses are the professional service and related costs directly related to our acquisitions and are not part of our core performance. 6. Acquisition intangible amortization reflects amortization of intangible assets and software acquired through business combinations, acquired customer portfolios, acquired referral agreements and related asset acquisitions. 7. Non-cash interest expense reflects amortization of deferred financing costs. 8. Other taxes consist of franchise taxes, commercial activity taxes and other non-income based taxes. Taxes related to salaries or employment are not included. 9. Pro forma corporate income tax expense is based on Non-GAAP adjusted income before taxes and is calculated using a tax rate of 25.0% for both 2018 and 2017, based on blended federal and state tax rates, considering the Tax Reform Act for 2018. 10. Pro forma adjusted diluted earnings per share assumes that all Common Units in i3 Verticals, LLC and the associated non-voting Class B common stock were exchanged for Class A common stock at the beginning of the period on a one for one basis. 11. Cash interest expense, net represents all interest expense recorded on the Company's statement of operations other than non-cash interest expense, which represents amortization of deferred financing costs. 12. Depreciation and internally developed software amortization reflects depreciation on the Company's property, plant and equipment, net, and amortization expense on its internally developed capitalized software.


