1 Supplemental Information Q3 FISCAL YEAR 2024

2 ($ in thousands) Quarter Ended June 30, 2024 March 31, 2024 December 31, 2023 September 30, 2023 June 30, 2023 March 31, 2023 December 31, 2022 September 30, 2022 June 30, 2022 Software and related service revenue SaaS(2) $ 8,834 $ 8,809 $ 8,742 $ 8,977 $ 8,523 $ 8,244 $ 7,713 $ 7,438 $ 7,001 Transaction-based(3) 3,928 3,538 3,651 3,706 3,291 3,174 3,150 3,007 3,171 Maintenance(4) 8,433 8,125 8,207 7,970 8,336 8,039 7,310 5,459 5,592 Recurring software services(5) 10,913 11,263 10,205 10,303 11,127 10,567 9,449 10,204 10,028 Professional services(6) 8,906 9,199 8,881 10,777 10,039 10,634 9,369 7,780 8,034 Software licenses 405 963 417 2,714 2,380 3,193 884 3,085 1,648 Total $ 41,419 $ 41,897 $ 40,103 $ 44,447 $ 43,696 $ 43,851 $ 37,875 $ 36,973 $ 35,474 Year-over-year growth (5) % (4) % 6 % 20 % 23 % Payments revenue $ 11,867 $ 13,572 $ 12,677 $ 11,297 $ 10,895 $ 12,903 $ 11,522 $ 10,432 $ 8,235 Year-over-year growth 9 % 5 % 10 % 8 % 32 % Other revenue Recurring(7) $ 1,343 $ 1,405 $ 1,423 $ 1,526 $ 1,445 $ 1,363 $ 1,512 $ 1,539 $ 1,328 Other 1,408 1,093 852 1,314 1,224 1,050 803 1,500 1,305 Total $ 2,751 $ 2,498 $ 2,275 $ 2,840 $ 2,669 $ 2,413 $ 2,315 $ 3,039 $ 2,633 Year-over-year growth 3 % 4 % (2) % (7) % 1 % Total revenue $ 56,037 $ 57,967 $ 55,055 $ 58,584 $ 57,260 $ 59,167 $ 51,712 $ 50,444 $ 46,342 Recurring revenue(8) $ 45,318 $ 46,712 $ 44,905 $ 43,779 $ 43,617 $ 44,290 $ 40,656 $ 38,079 $ 35,355 Annualized Recurring Revenue “ARR”(9) Software and related service revenue $ 128,432 $ 126,940 $ 123,220 $ 123,824 $ 125,108 $ 120,096 $ 110,488 $ 104,432 $ 103,168 Payments revenue 47,468 54,288 50,708 45,188 43,580 51,612 46,088 41,728 32,940 Other revenue 5,372 5,620 5,692 6,104 5,780 5,452 6,048 6,156 5,312 Total ARR $ 181,272 $ 186,848 $ 179,620 $ 175,116 $ 174,468 $ 177,160 $ 162,624 $ 152,316 $ 141,420 Year-over-year growth 4 % 5 % 10 % 15 % 23 % Revenue Composition - Continuing Operations(1) See footnotes continued on the next slide.
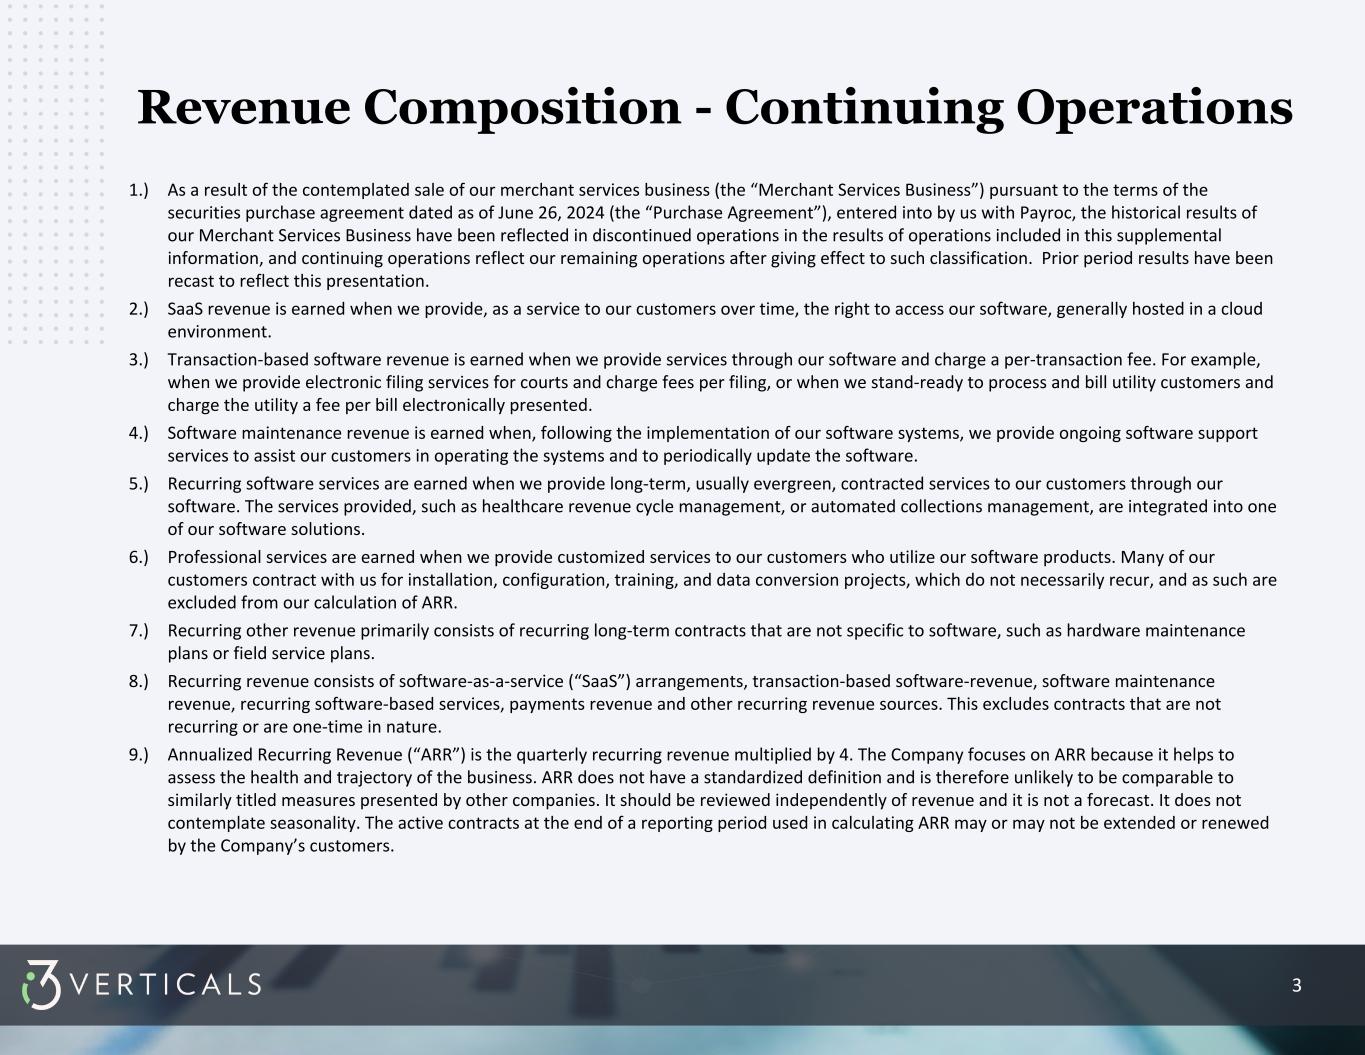
3 1.) As a result of the contemplated sale of our merchant services business (the “Merchant Services Business”) pursuant to the terms of the securities purchase agreement dated as of June 26, 2024 (the “Purchase Agreement”), entered into by us with Payroc, the historical results of our Merchant Services Business have been reflected in discontinued operations in the results of operations included in this supplemental information, and continuing operations reflect our remaining operations after giving effect to such classification. Prior period results have been recast to reflect this presentation. 2.) SaaS revenue is earned when we provide, as a service to our customers over time, the right to access our software, generally hosted in a cloud environment. 3.) Transaction-based software revenue is earned when we provide services through our software and charge a per-transaction fee. For example, when we provide electronic filing services for courts and charge fees per filing, or when we stand-ready to process and bill utility customers and charge the utility a fee per bill electronically presented. 4.) Software maintenance revenue is earned when, following the implementation of our software systems, we provide ongoing software support services to assist our customers in operating the systems and to periodically update the software. 5.) Recurring software services are earned when we provide long-term, usually evergreen, contracted services to our customers through our software. The services provided, such as healthcare revenue cycle management, or automated collections management, are integrated into one of our software solutions. 6.) Professional services are earned when we provide customized services to our customers who utilize our software products. Many of our customers contract with us for installation, configuration, training, and data conversion projects, which do not necessarily recur, and as such are excluded from our calculation of ARR. 7.) Recurring other revenue primarily consists of recurring long-term contracts that are not specific to software, such as hardware maintenance plans or field service plans. 8.) Recurring revenue consists of software-as-a-service (“SaaS”) arrangements, transaction-based software-revenue, software maintenance revenue, recurring software-based services, payments revenue and other recurring revenue sources. This excludes contracts that are not recurring or are one-time in nature. 9.) Annualized Recurring Revenue (“ARR”) is the quarterly recurring revenue multiplied by 4. The Company focuses on ARR because it helps to assess the health and trajectory of the business. ARR does not have a standardized definition and is therefore unlikely to be comparable to similarly titled measures presented by other companies. It should be reviewed independently of revenue and it is not a forecast. It does not contemplate seasonality. The active contracts at the end of a reporting period used in calculating ARR may or may not be extended or renewed by the Company’s customers. Revenue Composition - Continuing Operations
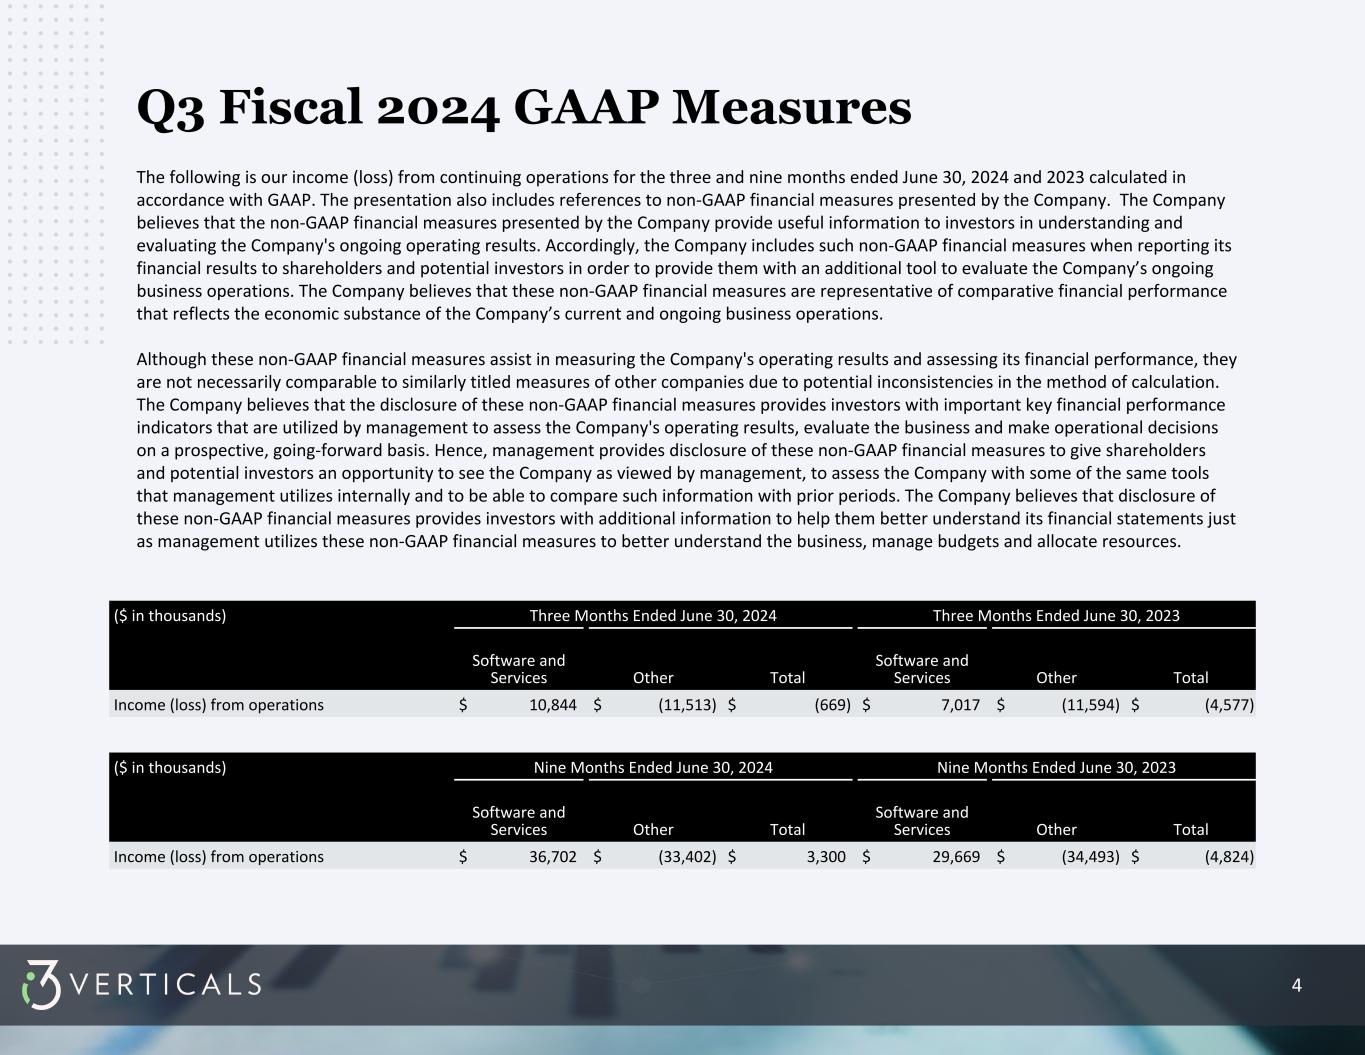
4 Q3 Fiscal 2024 GAAP Measures ($ in thousands) Three Months Ended June 30, 2024 Three Months Ended June 30, 2023 Software and Services Other Total Software and Services Other Total Income (loss) from operations $ 10,844 $ (11,513) $ (669) $ 7,017 $ (11,594) $ (4,577) The following is our income (loss) from continuing operations for the three and nine months ended June 30, 2024 and 2023 calculated in accordance with GAAP. The presentation also includes references to non-GAAP financial measures presented by the Company. The Company believes that the non-GAAP financial measures presented by the Company provide useful information to investors in understanding and evaluating the Company's ongoing operating results. Accordingly, the Company includes such non-GAAP financial measures when reporting its financial results to shareholders and potential investors in order to provide them with an additional tool to evaluate the Company’s ongoing business operations. The Company believes that these non-GAAP financial measures are representative of comparative financial performance that reflects the economic substance of the Company’s current and ongoing business operations. Although these non-GAAP financial measures assist in measuring the Company's operating results and assessing its financial performance, they are not necessarily comparable to similarly titled measures of other companies due to potential inconsistencies in the method of calculation. The Company believes that the disclosure of these non-GAAP financial measures provides investors with important key financial performance indicators that are utilized by management to assess the Company's operating results, evaluate the business and make operational decisions on a prospective, going-forward basis. Hence, management provides disclosure of these non-GAAP financial measures to give shareholders and potential investors an opportunity to see the Company as viewed by management, to assess the Company with some of the same tools that management utilizes internally and to be able to compare such information with prior periods. The Company believes that disclosure of these non-GAAP financial measures provides investors with additional information to help them better understand its financial statements just as management utilizes these non-GAAP financial measures to better understand the business, manage budgets and allocate resources. ($ in thousands) Nine Months Ended June 30, 2024 Nine Months Ended June 30, 2023 Software and Services Other Total Software and Services Other Total Income (loss) from operations $ 36,702 $ (33,402) $ 3,300 $ 29,669 $ (34,493) $ (4,824)
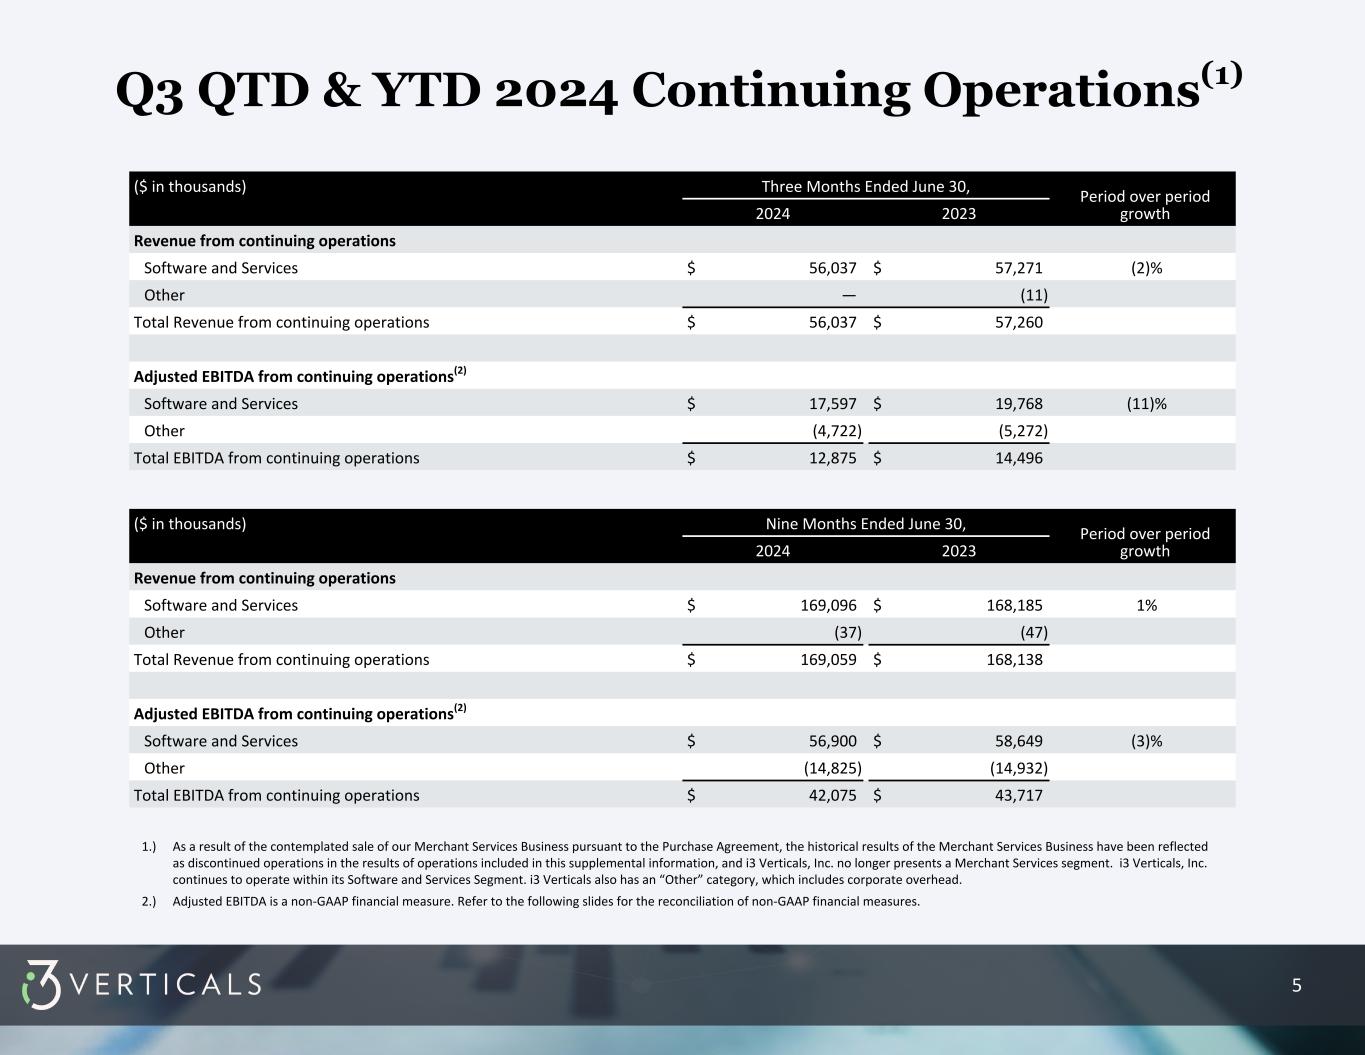
5 Q3 QTD & YTD 2024 Continuing Operations(1) ($ in thousands) Three Months Ended June 30, Period over period growth2024 2023 Revenue from continuing operations Software and Services $ 56,037 $ 57,271 (2)% Other — (11) Total Revenue from continuing operations $ 56,037 $ 57,260 Adjusted EBITDA from continuing operations(2) Software and Services $ 17,597 $ 19,768 (11)% Other (4,722) (5,272) Total EBITDA from continuing operations $ 12,875 $ 14,496 1.) As a result of the contemplated sale of our Merchant Services Business pursuant to the Purchase Agreement, the historical results of the Merchant Services Business have been reflected as discontinued operations in the results of operations included in this supplemental information, and i3 Verticals, Inc. no longer presents a Merchant Services segment. i3 Verticals, Inc. continues to operate within its Software and Services Segment. i3 Verticals also has an “Other” category, which includes corporate overhead. 2.) Adjusted EBITDA is a non-GAAP financial measure. Refer to the following slides for the reconciliation of non-GAAP financial measures. ($ in thousands) Nine Months Ended June 30, Period over period growth2024 2023 Revenue from continuing operations Software and Services $ 169,096 $ 168,185 1% Other (37) (47) Total Revenue from continuing operations $ 169,059 $ 168,138 Adjusted EBITDA from continuing operations(2) Software and Services $ 56,900 $ 58,649 (3)% Other (14,825) (14,932) Total EBITDA from continuing operations $ 42,075 $ 43,717
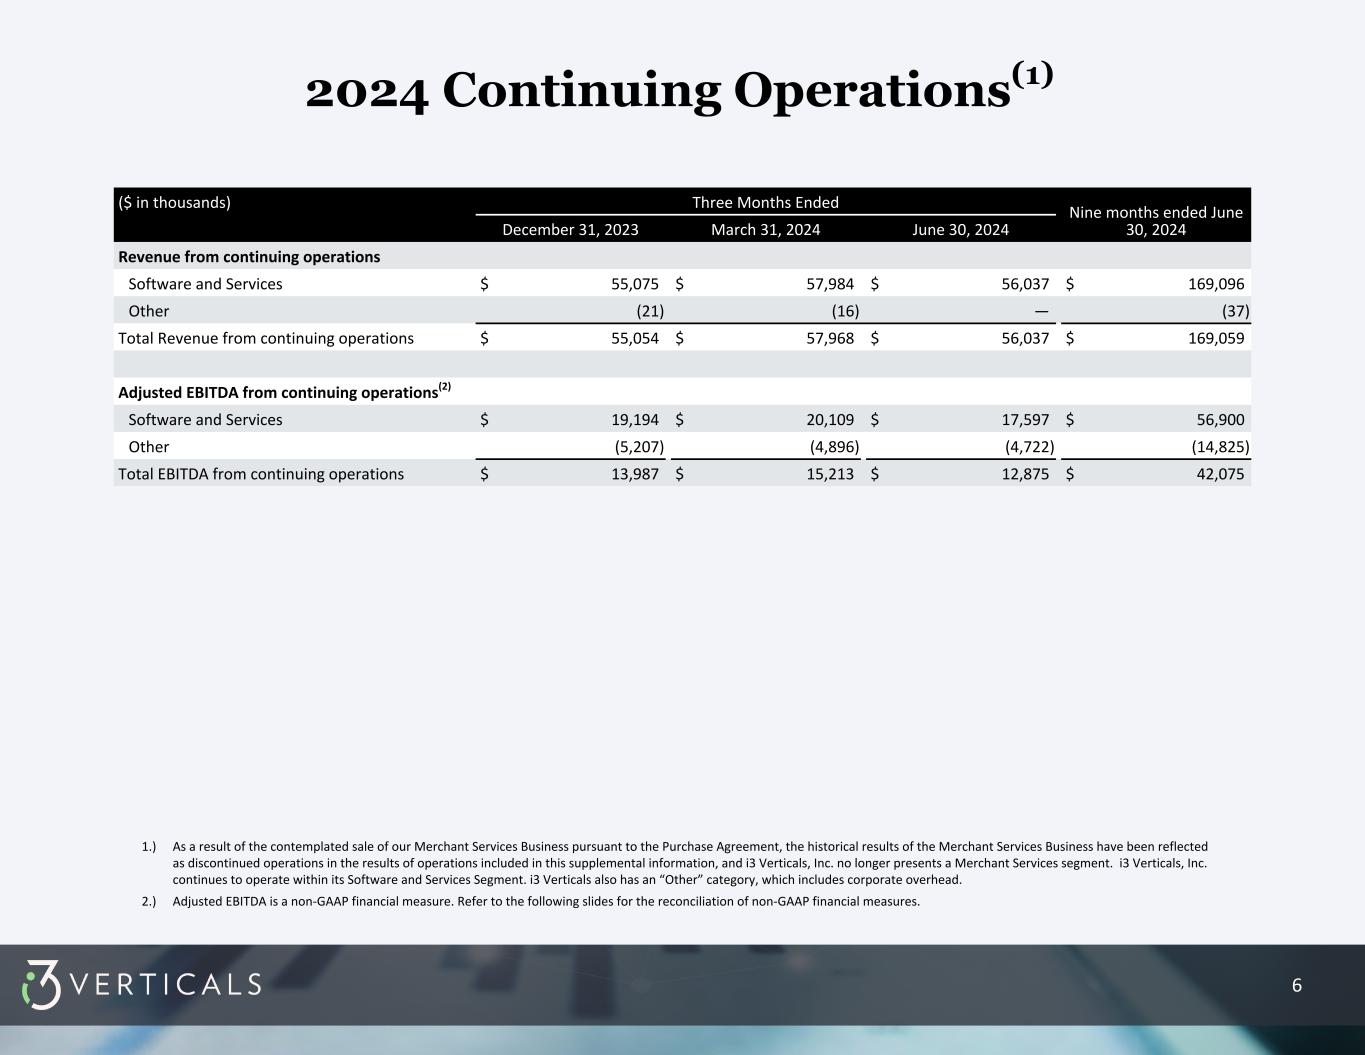
6 2024 Continuing Operations(1) ($ in thousands) Three Months Ended Nine months ended June 30, 2024December 31, 2023 March 31, 2024 June 30, 2024 Revenue from continuing operations Software and Services $ 55,075 $ 57,984 $ 56,037 $ 169,096 Other (21) (16) — (37) Total Revenue from continuing operations $ 55,054 $ 57,968 $ 56,037 $ 169,059 Adjusted EBITDA from continuing operations(2) Software and Services $ 19,194 $ 20,109 $ 17,597 $ 56,900 Other (5,207) (4,896) (4,722) (14,825) Total EBITDA from continuing operations $ 13,987 $ 15,213 $ 12,875 $ 42,075 1.) As a result of the contemplated sale of our Merchant Services Business pursuant to the Purchase Agreement, the historical results of the Merchant Services Business have been reflected as discontinued operations in the results of operations included in this supplemental information, and i3 Verticals, Inc. no longer presents a Merchant Services segment. i3 Verticals, Inc. continues to operate within its Software and Services Segment. i3 Verticals also has an “Other” category, which includes corporate overhead. 2.) Adjusted EBITDA is a non-GAAP financial measure. Refer to the following slides for the reconciliation of non-GAAP financial measures.
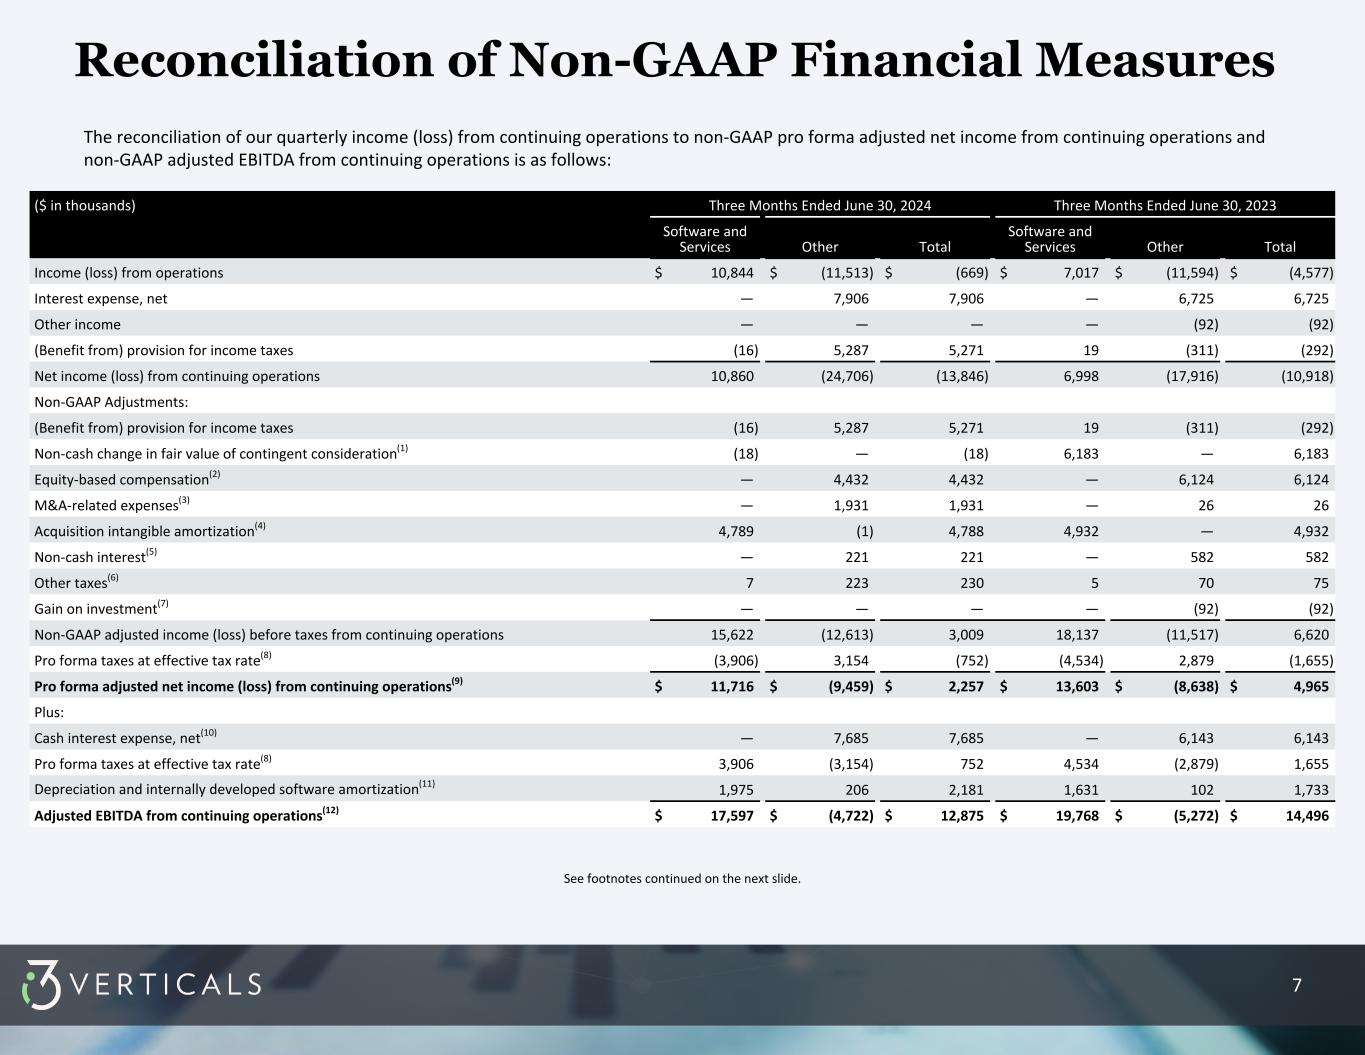
7 Reconciliation of Non-GAAP Financial Measures The reconciliation of our quarterly income (loss) from continuing operations to non-GAAP pro forma adjusted net income from continuing operations and non-GAAP adjusted EBITDA from continuing operations is as follows: See footnotes continued on the next slide. ($ in thousands) Three Months Ended June 30, 2024 Three Months Ended June 30, 2023 Software and Services Other Total Software and Services Other Total Income (loss) from operations $ 10,844 $ (11,513) $ (669) $ 7,017 $ (11,594) $ (4,577) Interest expense, net — 7,906 7,906 — 6,725 6,725 Other income — — — — (92) (92) (Benefit from) provision for income taxes (16) 5,287 5,271 19 (311) (292) Net income (loss) from continuing operations 10,860 (24,706) (13,846) 6,998 (17,916) (10,918) Non-GAAP Adjustments: (Benefit from) provision for income taxes (16) 5,287 5,271 19 (311) (292) Non-cash change in fair value of contingent consideration(1) (18) — (18) 6,183 — 6,183 Equity-based compensation(2) — 4,432 4,432 — 6,124 6,124 M&A-related expenses(3) — 1,931 1,931 — 26 26 Acquisition intangible amortization(4) 4,789 (1) 4,788 4,932 — 4,932 Non-cash interest(5) — 221 221 — 582 582 Other taxes(6) 7 223 230 5 70 75 Gain on investment(7) — — — — (92) (92) Non-GAAP adjusted income (loss) before taxes from continuing operations 15,622 (12,613) 3,009 18,137 (11,517) 6,620 Pro forma taxes at effective tax rate(8) (3,906) 3,154 (752) (4,534) 2,879 (1,655) Pro forma adjusted net income (loss) from continuing operations(9) $ 11,716 $ (9,459) $ 2,257 $ 13,603 $ (8,638) $ 4,965 Plus: Cash interest expense, net(10) — 7,685 7,685 — 6,143 6,143 Pro forma taxes at effective tax rate(8) 3,906 (3,154) 752 4,534 (2,879) 1,655 Depreciation and internally developed software amortization(11) 1,975 206 2,181 1,631 102 1,733 Adjusted EBITDA from continuing operations(12) $ 17,597 $ (4,722) $ 12,875 $ 19,768 $ (5,272) $ 14,496
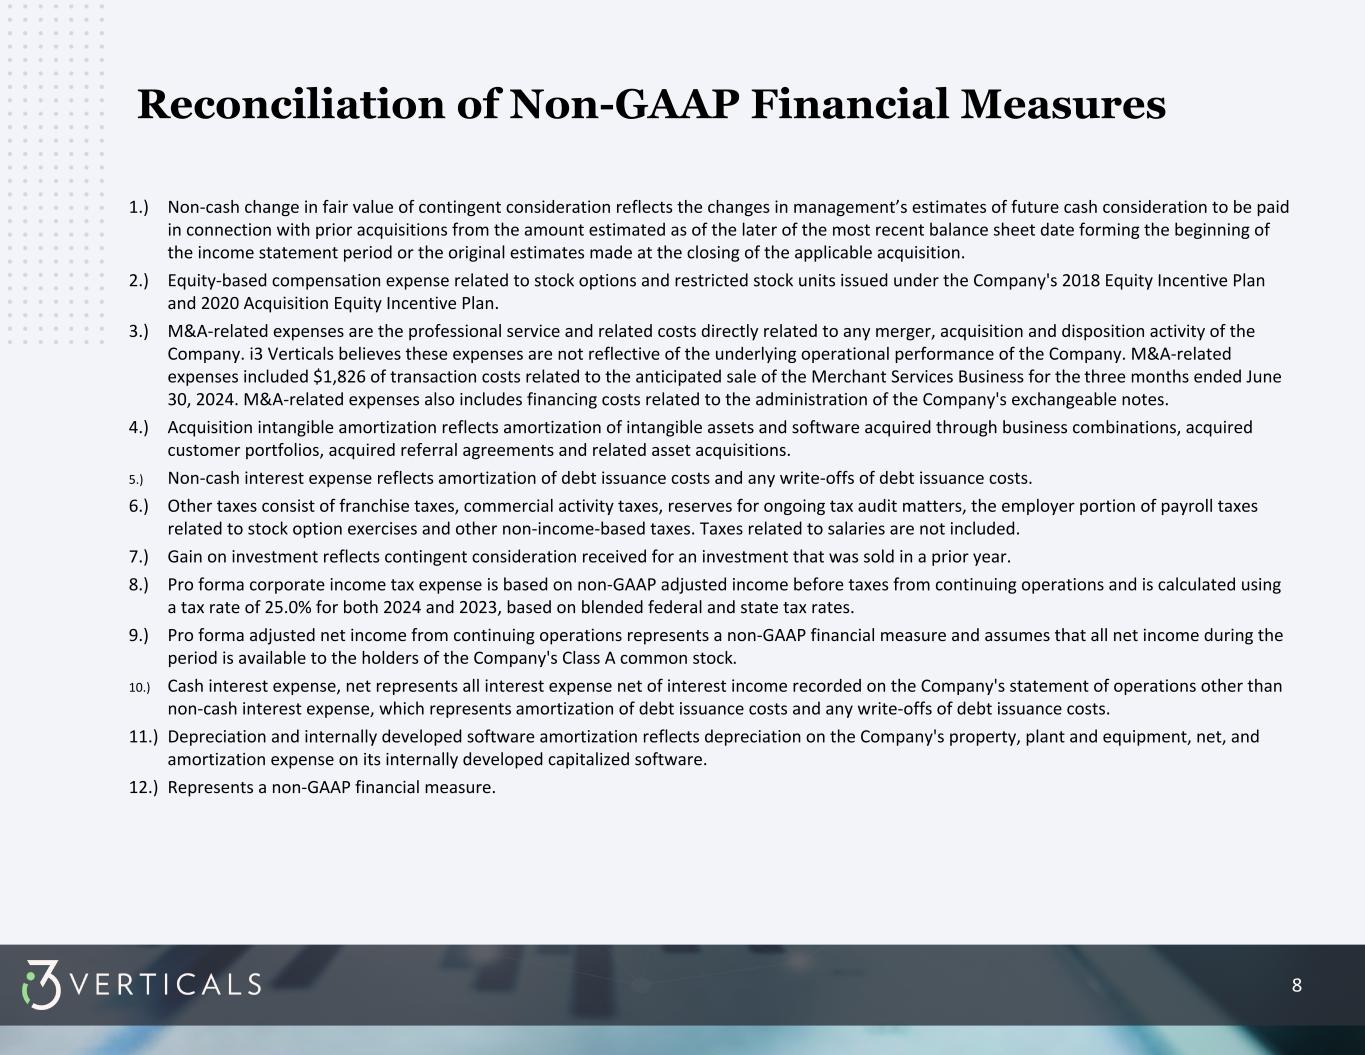
8 1.) Non-cash change in fair value of contingent consideration reflects the changes in management’s estimates of future cash consideration to be paid in connection with prior acquisitions from the amount estimated as of the later of the most recent balance sheet date forming the beginning of the income statement period or the original estimates made at the closing of the applicable acquisition. 2.) Equity-based compensation expense related to stock options and restricted stock units issued under the Company's 2018 Equity Incentive Plan and 2020 Acquisition Equity Incentive Plan. 3.) M&A-related expenses are the professional service and related costs directly related to any merger, acquisition and disposition activity of the Company. i3 Verticals believes these expenses are not reflective of the underlying operational performance of the Company. M&A-related expenses included $1,826 of transaction costs related to the anticipated sale of the Merchant Services Business for the three months ended June 30, 2024. M&A-related expenses also includes financing costs related to the administration of the Company's exchangeable notes. 4.) Acquisition intangible amortization reflects amortization of intangible assets and software acquired through business combinations, acquired customer portfolios, acquired referral agreements and related asset acquisitions. 5.) Non-cash interest expense reflects amortization of debt issuance costs and any write-offs of debt issuance costs. 6.) Other taxes consist of franchise taxes, commercial activity taxes, reserves for ongoing tax audit matters, the employer portion of payroll taxes related to stock option exercises and other non-income-based taxes. Taxes related to salaries are not included. 7.) Gain on investment reflects contingent consideration received for an investment that was sold in a prior year. 8.) Pro forma corporate income tax expense is based on non-GAAP adjusted income before taxes from continuing operations and is calculated using a tax rate of 25.0% for both 2024 and 2023, based on blended federal and state tax rates. 9.) Pro forma adjusted net income from continuing operations represents a non-GAAP financial measure and assumes that all net income during the period is available to the holders of the Company's Class A common stock. 10.) Cash interest expense, net represents all interest expense net of interest income recorded on the Company's statement of operations other than non-cash interest expense, which represents amortization of debt issuance costs and any write-offs of debt issuance costs. 11.) Depreciation and internally developed software amortization reflects depreciation on the Company's property, plant and equipment, net, and amortization expense on its internally developed capitalized software. 12.) Represents a non-GAAP financial measure. Reconciliation of Non-GAAP Financial Measures
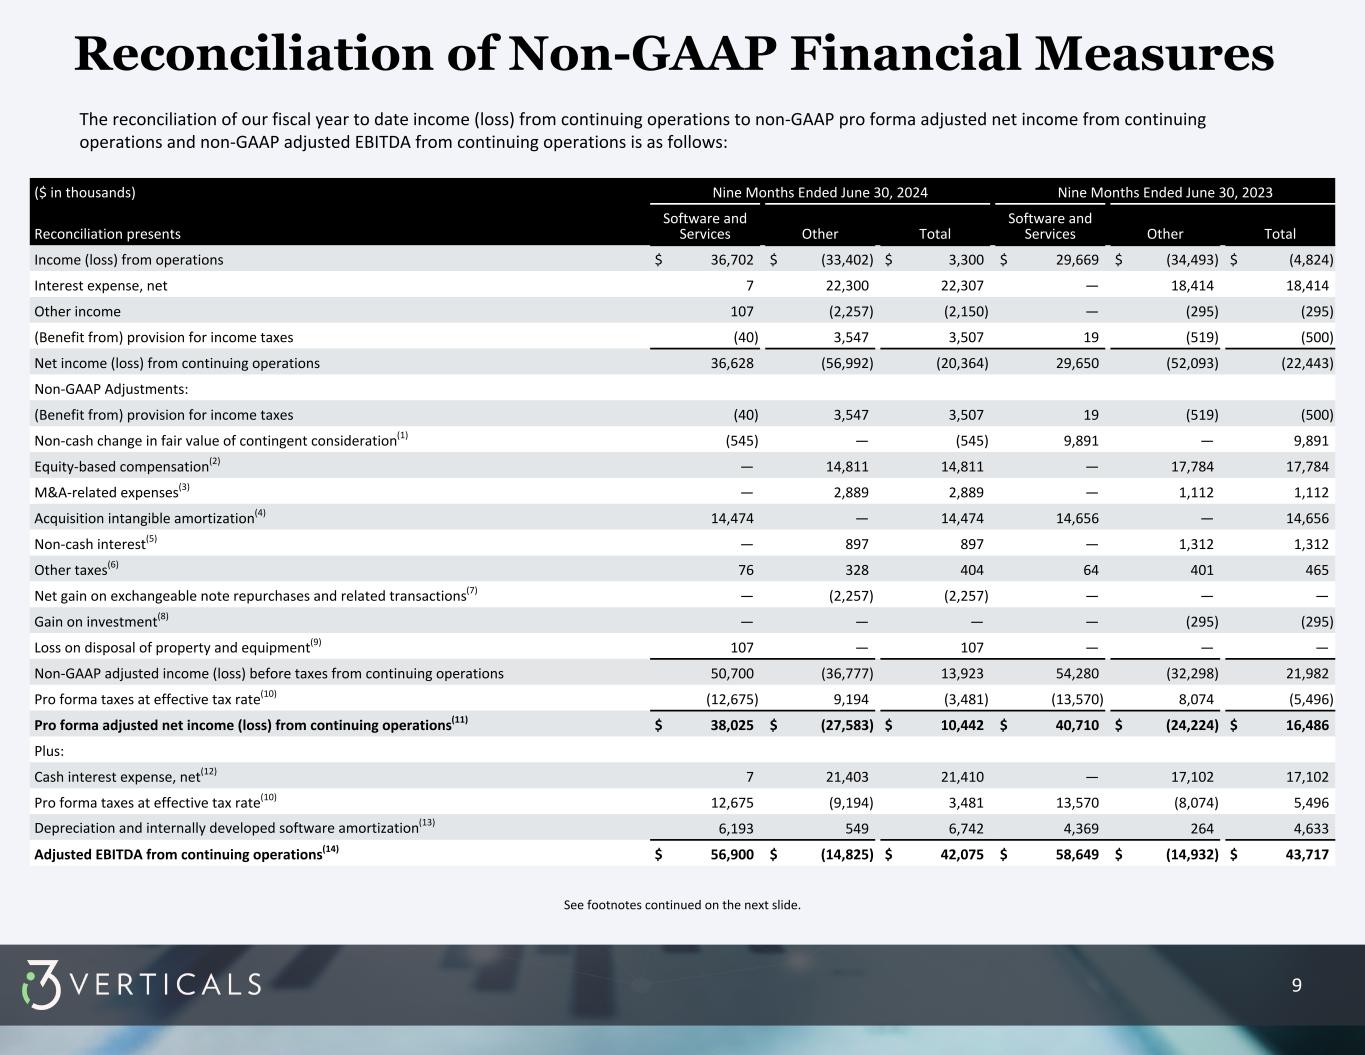
9 ($ in thousands) Nine Months Ended June 30, 2024 Nine Months Ended June 30, 2023 Reconciliation presents Software and Services Other Total Software and Services Other Total Income (loss) from operations $ 36,702 $ (33,402) $ 3,300 $ 29,669 $ (34,493) $ (4,824) Interest expense, net 7 22,300 22,307 — 18,414 18,414 Other income 107 (2,257) (2,150) — (295) (295) (Benefit from) provision for income taxes (40) 3,547 3,507 19 (519) (500) Net income (loss) from continuing operations 36,628 (56,992) (20,364) 29,650 (52,093) (22,443) Non-GAAP Adjustments: (Benefit from) provision for income taxes (40) 3,547 3,507 19 (519) (500) Non-cash change in fair value of contingent consideration(1) (545) — (545) 9,891 — 9,891 Equity-based compensation(2) — 14,811 14,811 — 17,784 17,784 M&A-related expenses(3) — 2,889 2,889 — 1,112 1,112 Acquisition intangible amortization(4) 14,474 — 14,474 14,656 — 14,656 Non-cash interest(5) — 897 897 — 1,312 1,312 Other taxes(6) 76 328 404 64 401 465 Net gain on exchangeable note repurchases and related transactions(7) — (2,257) (2,257) — — — Gain on investment(8) — — — — (295) (295) Loss on disposal of property and equipment(9) 107 — 107 — — — Non-GAAP adjusted income (loss) before taxes from continuing operations 50,700 (36,777) 13,923 54,280 (32,298) 21,982 Pro forma taxes at effective tax rate(10) (12,675) 9,194 (3,481) (13,570) 8,074 (5,496) Pro forma adjusted net income (loss) from continuing operations(11) $ 38,025 $ (27,583) $ 10,442 $ 40,710 $ (24,224) $ 16,486 Plus: Cash interest expense, net(12) 7 21,403 21,410 — 17,102 17,102 Pro forma taxes at effective tax rate(10) 12,675 (9,194) 3,481 13,570 (8,074) 5,496 Depreciation and internally developed software amortization(13) 6,193 549 6,742 4,369 264 4,633 Adjusted EBITDA from continuing operations(14) $ 56,900 $ (14,825) $ 42,075 $ 58,649 $ (14,932) $ 43,717 Reconciliation of Non-GAAP Financial Measures See footnotes continued on the next slide. The reconciliation of our fiscal year to date income (loss) from continuing operations to non-GAAP pro forma adjusted net income from continuing operations and non-GAAP adjusted EBITDA from continuing operations is as follows:
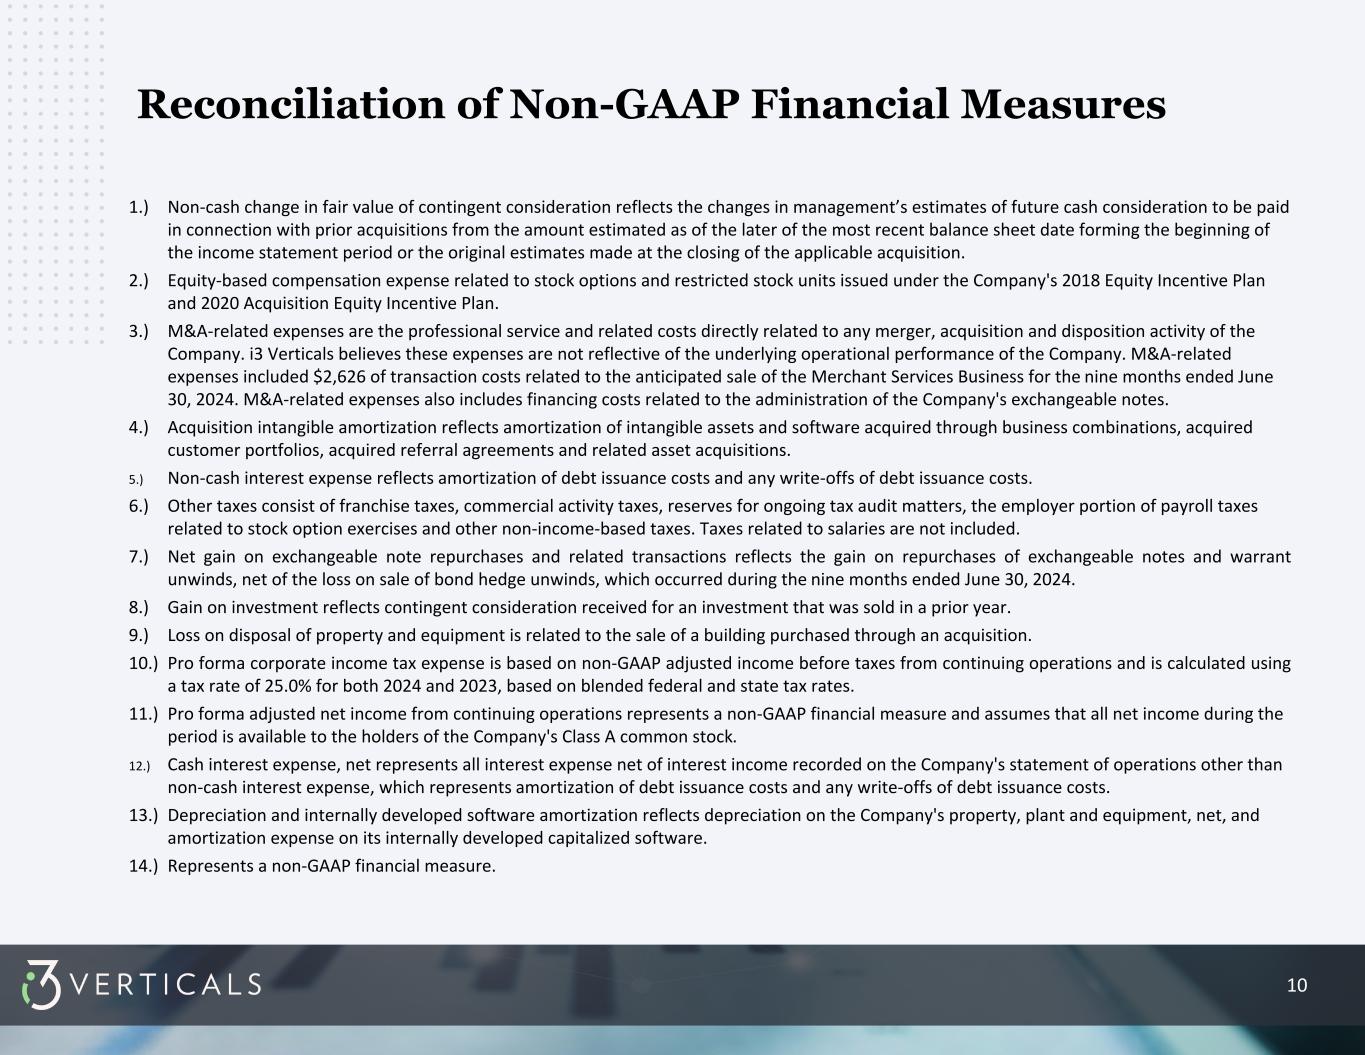
10 1.) Non-cash change in fair value of contingent consideration reflects the changes in management’s estimates of future cash consideration to be paid in connection with prior acquisitions from the amount estimated as of the later of the most recent balance sheet date forming the beginning of the income statement period or the original estimates made at the closing of the applicable acquisition. 2.) Equity-based compensation expense related to stock options and restricted stock units issued under the Company's 2018 Equity Incentive Plan and 2020 Acquisition Equity Incentive Plan. 3.) M&A-related expenses are the professional service and related costs directly related to any merger, acquisition and disposition activity of the Company. i3 Verticals believes these expenses are not reflective of the underlying operational performance of the Company. M&A-related expenses included $2,626 of transaction costs related to the anticipated sale of the Merchant Services Business for the nine months ended June 30, 2024. M&A-related expenses also includes financing costs related to the administration of the Company's exchangeable notes. 4.) Acquisition intangible amortization reflects amortization of intangible assets and software acquired through business combinations, acquired customer portfolios, acquired referral agreements and related asset acquisitions. 5.) Non-cash interest expense reflects amortization of debt issuance costs and any write-offs of debt issuance costs. 6.) Other taxes consist of franchise taxes, commercial activity taxes, reserves for ongoing tax audit matters, the employer portion of payroll taxes related to stock option exercises and other non-income-based taxes. Taxes related to salaries are not included. 7.) Net gain on exchangeable note repurchases and related transactions reflects the gain on repurchases of exchangeable notes and warrant unwinds, net of the loss on sale of bond hedge unwinds, which occurred during the nine months ended June 30, 2024. 8.) Gain on investment reflects contingent consideration received for an investment that was sold in a prior year. 9.) Loss on disposal of property and equipment is related to the sale of a building purchased through an acquisition. 10.) Pro forma corporate income tax expense is based on non-GAAP adjusted income before taxes from continuing operations and is calculated using a tax rate of 25.0% for both 2024 and 2023, based on blended federal and state tax rates. 11.) Pro forma adjusted net income from continuing operations represents a non-GAAP financial measure and assumes that all net income during the period is available to the holders of the Company's Class A common stock. 12.) Cash interest expense, net represents all interest expense net of interest income recorded on the Company's statement of operations other than non-cash interest expense, which represents amortization of debt issuance costs and any write-offs of debt issuance costs. 13.) Depreciation and internally developed software amortization reflects depreciation on the Company's property, plant and equipment, net, and amortization expense on its internally developed capitalized software. 14.) Represents a non-GAAP financial measure. Reconciliation of Non-GAAP Financial Measures
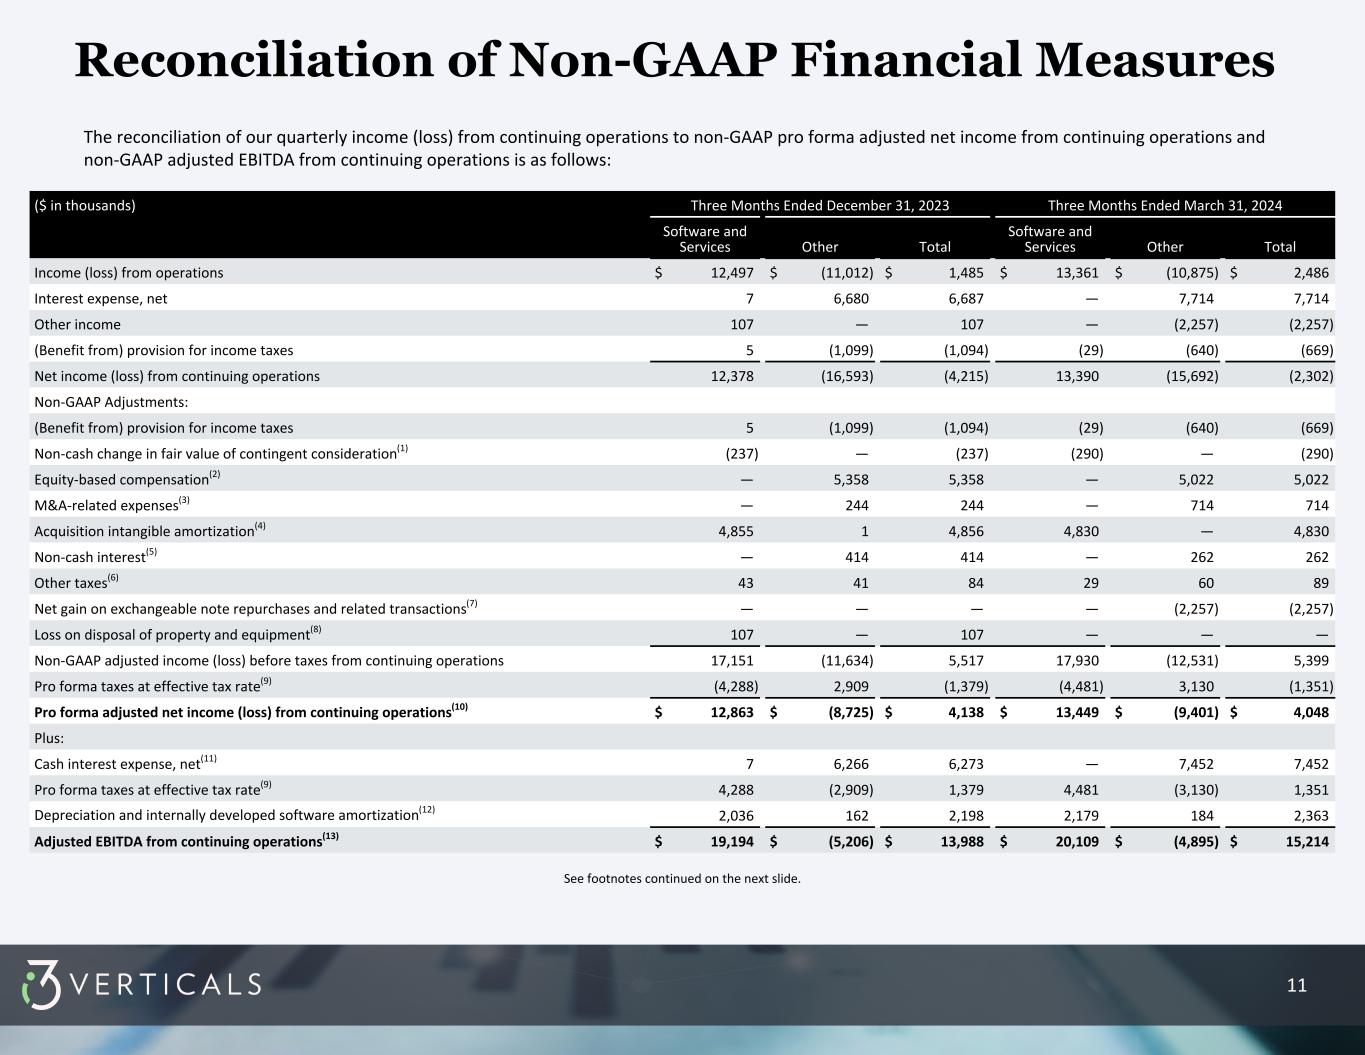
11 Reconciliation of Non-GAAP Financial Measures The reconciliation of our quarterly income (loss) from continuing operations to non-GAAP pro forma adjusted net income from continuing operations and non-GAAP adjusted EBITDA from continuing operations is as follows: See footnotes continued on the next slide. ($ in thousands) Three Months Ended December 31, 2023 Three Months Ended March 31, 2024 Software and Services Other Total Software and Services Other Total Income (loss) from operations $ 12,497 $ (11,012) $ 1,485 $ 13,361 $ (10,875) $ 2,486 Interest expense, net 7 6,680 6,687 — 7,714 7,714 Other income 107 — 107 — (2,257) (2,257) (Benefit from) provision for income taxes 5 (1,099) (1,094) (29) (640) (669) Net income (loss) from continuing operations 12,378 (16,593) (4,215) 13,390 (15,692) (2,302) Non-GAAP Adjustments: (Benefit from) provision for income taxes 5 (1,099) (1,094) (29) (640) (669) Non-cash change in fair value of contingent consideration(1) (237) — (237) (290) — (290) Equity-based compensation(2) — 5,358 5,358 — 5,022 5,022 M&A-related expenses(3) — 244 244 — 714 714 Acquisition intangible amortization(4) 4,855 1 4,856 4,830 — 4,830 Non-cash interest(5) — 414 414 — 262 262 Other taxes(6) 43 41 84 29 60 89 Net gain on exchangeable note repurchases and related transactions(7) — — — — (2,257) (2,257) Loss on disposal of property and equipment(8) 107 — 107 — — — Non-GAAP adjusted income (loss) before taxes from continuing operations 17,151 (11,634) 5,517 17,930 (12,531) 5,399 Pro forma taxes at effective tax rate(9) (4,288) 2,909 (1,379) (4,481) 3,130 (1,351) Pro forma adjusted net income (loss) from continuing operations(10) $ 12,863 $ (8,725) $ 4,138 $ 13,449 $ (9,401) $ 4,048 Plus: Cash interest expense, net(11) 7 6,266 6,273 — 7,452 7,452 Pro forma taxes at effective tax rate(9) 4,288 (2,909) 1,379 4,481 (3,130) 1,351 Depreciation and internally developed software amortization(12) 2,036 162 2,198 2,179 184 2,363 Adjusted EBITDA from continuing operations(13) $ 19,194 $ (5,206) $ 13,988 $ 20,109 $ (4,895) $ 15,214
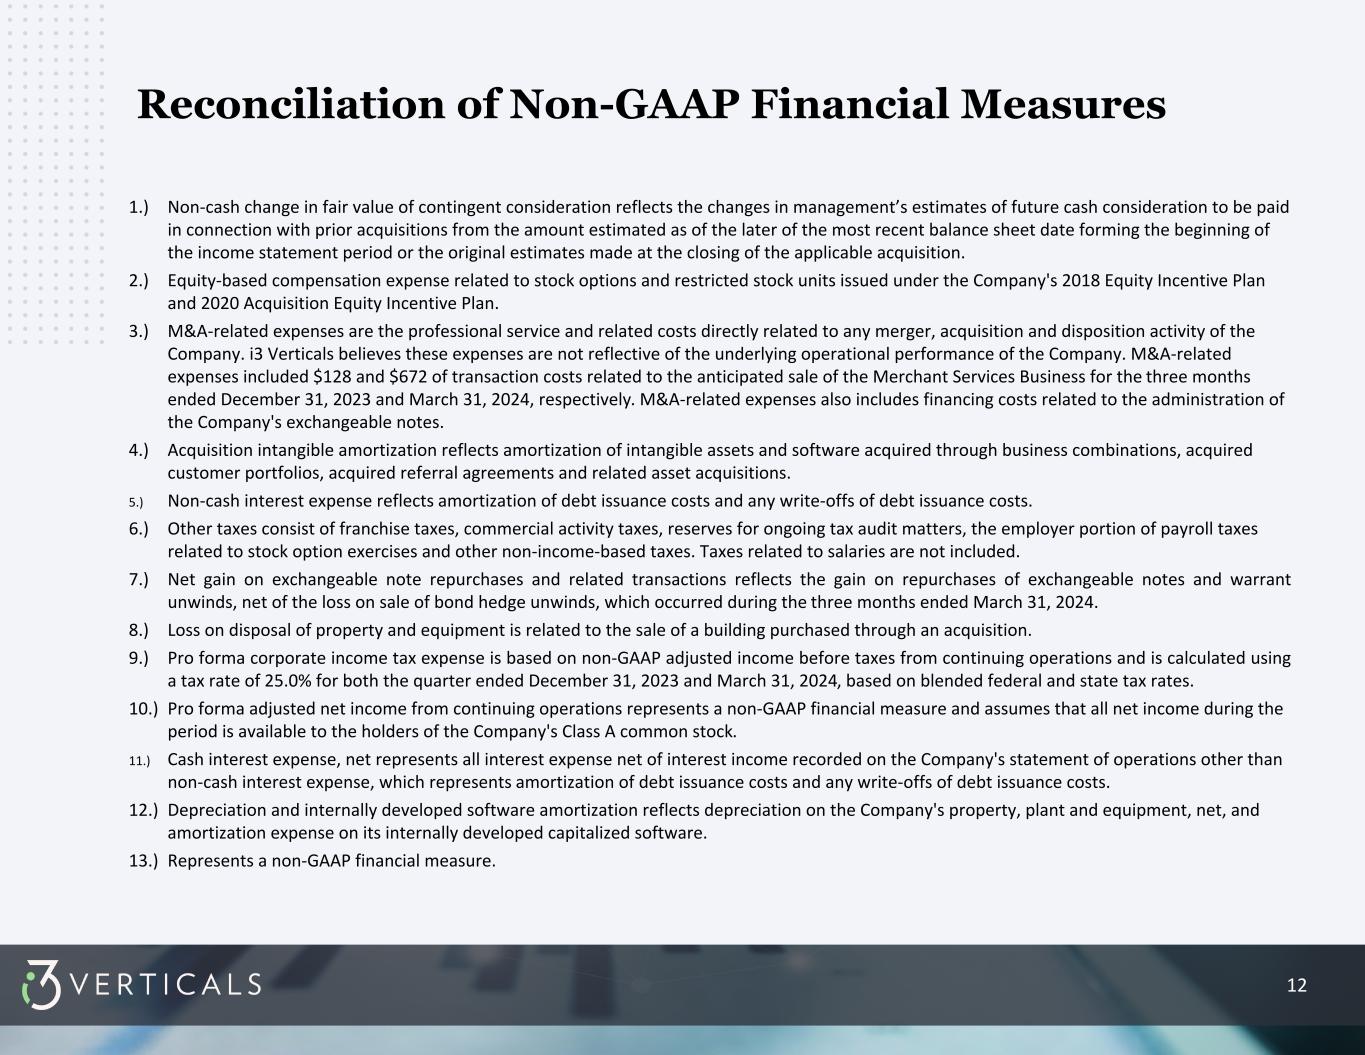
12 1.) Non-cash change in fair value of contingent consideration reflects the changes in management’s estimates of future cash consideration to be paid in connection with prior acquisitions from the amount estimated as of the later of the most recent balance sheet date forming the beginning of the income statement period or the original estimates made at the closing of the applicable acquisition. 2.) Equity-based compensation expense related to stock options and restricted stock units issued under the Company's 2018 Equity Incentive Plan and 2020 Acquisition Equity Incentive Plan. 3.) M&A-related expenses are the professional service and related costs directly related to any merger, acquisition and disposition activity of the Company. i3 Verticals believes these expenses are not reflective of the underlying operational performance of the Company. M&A-related expenses included $128 and $672 of transaction costs related to the anticipated sale of the Merchant Services Business for the three months ended December 31, 2023 and March 31, 2024, respectively. M&A-related expenses also includes financing costs related to the administration of the Company's exchangeable notes. 4.) Acquisition intangible amortization reflects amortization of intangible assets and software acquired through business combinations, acquired customer portfolios, acquired referral agreements and related asset acquisitions. 5.) Non-cash interest expense reflects amortization of debt issuance costs and any write-offs of debt issuance costs. 6.) Other taxes consist of franchise taxes, commercial activity taxes, reserves for ongoing tax audit matters, the employer portion of payroll taxes related to stock option exercises and other non-income-based taxes. Taxes related to salaries are not included. 7.) Net gain on exchangeable note repurchases and related transactions reflects the gain on repurchases of exchangeable notes and warrant unwinds, net of the loss on sale of bond hedge unwinds, which occurred during the three months ended March 31, 2024. 8.) Loss on disposal of property and equipment is related to the sale of a building purchased through an acquisition. 9.) Pro forma corporate income tax expense is based on non-GAAP adjusted income before taxes from continuing operations and is calculated using a tax rate of 25.0% for both the quarter ended December 31, 2023 and March 31, 2024, based on blended federal and state tax rates. 10.) Pro forma adjusted net income from continuing operations represents a non-GAAP financial measure and assumes that all net income during the period is available to the holders of the Company's Class A common stock. 11.) Cash interest expense, net represents all interest expense net of interest income recorded on the Company's statement of operations other than non-cash interest expense, which represents amortization of debt issuance costs and any write-offs of debt issuance costs. 12.) Depreciation and internally developed software amortization reflects depreciation on the Company's property, plant and equipment, net, and amortization expense on its internally developed capitalized software. 13.) Represents a non-GAAP financial measure. Reconciliation of Non-GAAP Financial Measures

13 ($ in millions) As of June 30, 2024 Revolving lines of credit to banks under the 2023 Senior Secured Credit Facility $ 351.4 1% Exchangeable Senior Notes due 2025 26.2 Less: Cash and Cash Equivalents (9.7) Total debt for use in our Total Leverage Ratio $ 367.9 Reconciliation Between GAAP Debt and Covenant Debt The reconciliation of our GAAP debt, before issuance costs, and the debt balance used in our Total Leverage Ratio is as follows:


