
Exhibit 99.2 Q4 and Full Year 2018 Financial Results Supplement March 27, 2019Exhibit 99.2 Q4 and Full Year 2018 Financial Results Supplement March 27, 2019
Forward Looking Statements Forward Looking Statements This presentation and our accompanying comments include “forward-looking statements” within the meaning of the Private Securities Litigation Reform Act of 1995. These forward- looking statements may be identified by words such as “may,” “will,” “expect,” “intend,” “anticipate,” “believe,” “estimate,” “plan,” “project,” “could,” “should,” “would,” “continue,” “seek,” “target,” “guidance,” “outlook,” “if current trends continue,” “optimistic,” “forecast” and other similar words. Such statements include, but are not limited to, statements about future financial and operating results, the Company’s plans, objectives, estimates, expectations, and intentions, estimates and strategies for the future, and other statements that are not historical facts. These forward-looking statements are based on our current objectives, beliefs and expectations, and they are subject to significant risks and uncertainties that may cause actual results and financial position and timing of certain events to differ materially from the information in the forward-looking statements. These risks and uncertainties include, but are not limited to, those set forth in the Company’s Registration Statement on Form S-1 filed on June 4, 2018 with the Securities and Exchange Commission (“SEC”) and in our other reports filed from time to time with the SEC. There may be other factors of which we are not currently aware that may affect matters discussed in the forward-looking statements and may also cause actual results to differ materially from those discussed. We do not assume any obligation to publicly update or supplement any forward-looking statement to reflect actual results, changes in assumptions or changes in other factors affecting these forward-looking statements other than as required by law. Any forward-looking statements speak only as of the date hereof or as of the dates indicated in the statements. Non-GAAP Financial Measures Included in this presentation are certain non-GAAP financial measures designed to complement the financial information presented in accordance with GAAP because management believes such measures are useful to investors. The non-GAAP financial measures are not determined in accordance with GAAP and should not be considered a substitute for performance measures determined in accordance with GAAP. The calculations of the non-GAAP financial measures are subjective, based on management’s belief as to which items should be included or excluded in order to provide the most reasonable and comparable view of the underlying operating performance of the business. We may, from time to time, modify the amounts used to determine our non-GAAP financial measures. When applicable, management’s discussion and analysis includes specific consideration for items that comprise the reconciliations of its non-GAAP financial measures. Reconciliation of non-GAAP financial measures are included in the Supplemental Slides in the Appendix of this presentation. Market & Industry Data This presentation includes industry and trade data, forecasts and information that was prepared based, in part, upon data, forecasts and information obtained from independent trade associations, industry publications and surveys and other independent sources available to the Company. Some data also are based on the Company’s good faith estimates, which are derived from management’s knowledge of the industry and from independent sources. These third-party publications and surveys generally state that the information included therein has been obtained from sources believed to be reliable, but that the publications and surveys can give no assurance as to the accuracy or completeness of such information. The Company has not independently verified any of the data from third-party sources nor has it ascertained the underlying economic assumptions on which such data are based. 2Forward Looking Statements Forward Looking Statements This presentation and our accompanying comments include “forward-looking statements” within the meaning of the Private Securities Litigation Reform Act of 1995. These forward- looking statements may be identified by words such as “may,” “will,” “expect,” “intend,” “anticipate,” “believe,” “estimate,” “plan,” “project,” “could,” “should,” “would,” “continue,” “seek,” “target,” “guidance,” “outlook,” “if current trends continue,” “optimistic,” “forecast” and other similar words. Such statements include, but are not limited to, statements about future financial and operating results, the Company’s plans, objectives, estimates, expectations, and intentions, estimates and strategies for the future, and other statements that are not historical facts. These forward-looking statements are based on our current objectives, beliefs and expectations, and they are subject to significant risks and uncertainties that may cause actual results and financial position and timing of certain events to differ materially from the information in the forward-looking statements. These risks and uncertainties include, but are not limited to, those set forth in the Company’s Registration Statement on Form S-1 filed on June 4, 2018 with the Securities and Exchange Commission (“SEC”) and in our other reports filed from time to time with the SEC. There may be other factors of which we are not currently aware that may affect matters discussed in the forward-looking statements and may also cause actual results to differ materially from those discussed. We do not assume any obligation to publicly update or supplement any forward-looking statement to reflect actual results, changes in assumptions or changes in other factors affecting these forward-looking statements other than as required by law. Any forward-looking statements speak only as of the date hereof or as of the dates indicated in the statements. Non-GAAP Financial Measures Included in this presentation are certain non-GAAP financial measures designed to complement the financial information presented in accordance with GAAP because management believes such measures are useful to investors. The non-GAAP financial measures are not determined in accordance with GAAP and should not be considered a substitute for performance measures determined in accordance with GAAP. The calculations of the non-GAAP financial measures are subjective, based on management’s belief as to which items should be included or excluded in order to provide the most reasonable and comparable view of the underlying operating performance of the business. We may, from time to time, modify the amounts used to determine our non-GAAP financial measures. When applicable, management’s discussion and analysis includes specific consideration for items that comprise the reconciliations of its non-GAAP financial measures. Reconciliation of non-GAAP financial measures are included in the Supplemental Slides in the Appendix of this presentation. Market & Industry Data This presentation includes industry and trade data, forecasts and information that was prepared based, in part, upon data, forecasts and information obtained from independent trade associations, industry publications and surveys and other independent sources available to the Company. Some data also are based on the Company’s good faith estimates, which are derived from management’s knowledge of the industry and from independent sources. These third-party publications and surveys generally state that the information included therein has been obtained from sources believed to be reliable, but that the publications and surveys can give no assurance as to the accuracy or completeness of such information. The Company has not independently verified any of the data from third-party sources nor has it ascertained the underlying economic assumptions on which such data are based. 2

Agenda ▪ Financial Highlights ▪ Business Update – Scott Sewell, President and CEO ▪ Financial Results for 2018 ▪ 2019 Guidance – Nick Jacoby, Interim CFO and Treasurer 3Agenda ▪ Financial Highlights ▪ Business Update – Scott Sewell, President and CEO ▪ Financial Results for 2018 ▪ 2019 Guidance – Nick Jacoby, Interim CFO and Treasurer 3
2018 Accomplishments ▪ Initial public offering on NYSE in June 2018 ▪ Significant market share gains across our businesses ▪ Successfully integrated the acquisition of SCB ▪ Rolled out proprietary ash recycling and slag grinding technologies ▪ Expanded robust pipeline of opportunities, exceeding $3B of pending bids ▪ Refinanced term loan on improved terms ▪ Finished the year with an outstanding safety record ▪ Recruited exceptional talent to our Company ▪ Achieved record levels of Revenue and Adjusted EBITDA, exceeding expectations at the IPO 42018 Accomplishments ▪ Initial public offering on NYSE in June 2018 ▪ Significant market share gains across our businesses ▪ Successfully integrated the acquisition of SCB ▪ Rolled out proprietary ash recycling and slag grinding technologies ▪ Expanded robust pipeline of opportunities, exceeding $3B of pending bids ▪ Refinanced term loan on improved terms ▪ Finished the year with an outstanding safety record ▪ Recruited exceptional talent to our Company ▪ Achieved record levels of Revenue and Adjusted EBITDA, exceeding expectations at the IPO 4

Fourth Quarter and Full Year 2018 Highlights ($ in millions) Full Year 2018 Q4 2018 1 1 Revenue Gross Profit Adjusted EBITDA Revenue Gross Profit Adjusted EBITDA $203 $740 $169 $430 $23 $23 $21 $20 $98 $99 $84 $76 Q4 2017 Q4 2018 Q4 2017 Q4 2018 Q4 2017 Q4 2018 2017 2018 2017 2018 2017 2018 13.6% 10.5% 12.1% 11.2% 19.6% 13.2% 17.7% 13.3% ▪ Revenue growth of 20% driven by early completion of Brickhaven▪ Revenue growth 72%; exceeded guidance of $720 to $730 1 1 ▪ Adjusted EBITDA growth of 12%▪ Adjusted EBITDA within guidance range of $98 to $105 ▪ Comparable year-over-year EBITDA margins▪ Adverse weather impacts Q4 and FY (wet) 5 1. Please refer to the supplemental slides in the Appendix for further Adjusted EBITDA reconciliation to GAAPFourth Quarter and Full Year 2018 Highlights ($ in millions) Full Year 2018 Q4 2018 1 1 Revenue Gross Profit Adjusted EBITDA Revenue Gross Profit Adjusted EBITDA $203 $740 $169 $430 $23 $23 $21 $20 $98 $99 $84 $76 Q4 2017 Q4 2018 Q4 2017 Q4 2018 Q4 2017 Q4 2018 2017 2018 2017 2018 2017 2018 13.6% 10.5% 12.1% 11.2% 19.6% 13.2% 17.7% 13.3% ▪ Revenue growth of 20% driven by early completion of Brickhaven▪ Revenue growth 72%; exceeded guidance of $720 to $730 1 1 ▪ Adjusted EBITDA growth of 12%▪ Adjusted EBITDA within guidance range of $98 to $105 ▪ Comparable year-over-year EBITDA margins▪ Adverse weather impacts Q4 and FY (wet) 5 1. Please refer to the supplemental slides in the Appendix for further Adjusted EBITDA reconciliation to GAAP
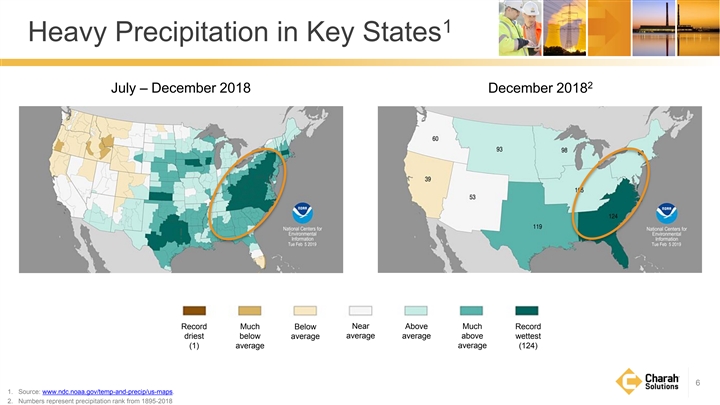
1 Heavy Precipitation in Key States 2 July – December 2018 December 2018 Record Much Below Near Above Much Record driest below average average average above wettest (1) average (124) average 6 1. Source: www.ndc.noaa.gov/temp-and-precip/us-maps. 2. Numbers represent precipitation rank from 1895-20181 Heavy Precipitation in Key States 2 July – December 2018 December 2018 Record Much Below Near Above Much Record driest below average average average above wettest (1) average (124) average 6 1. Source: www.ndc.noaa.gov/temp-and-precip/us-maps. 2. Numbers represent precipitation rank from 1895-2018
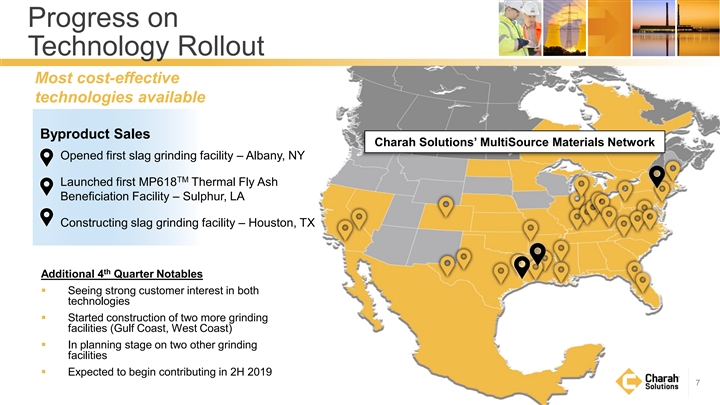
Progress on Technology Rollout Most cost-effective technologies available Byproduct Sales Charah Solutions’ MultiSource Materials Network Opened first slag grinding facility – Albany, NY TM Launched first MP618 Thermal Fly Ash Beneficiation Facility – Sulphur, LA Constructing slag grinding facility – Houston, TX th Additional 4 Quarter Notables ▪ Seeing strong customer interest in both technologies ▪ Started construction of two more grinding facilities (Gulf Coast, West Coast) ▪ In planning stage on two other grinding facilities ▪ Expected to begin contributing in 2H 2019 7Progress on Technology Rollout Most cost-effective technologies available Byproduct Sales Charah Solutions’ MultiSource Materials Network Opened first slag grinding facility – Albany, NY TM Launched first MP618 Thermal Fly Ash Beneficiation Facility – Sulphur, LA Constructing slag grinding facility – Houston, TX th Additional 4 Quarter Notables ▪ Seeing strong customer interest in both technologies ▪ Started construction of two more grinding facilities (Gulf Coast, West Coast) ▪ In planning stage on two other grinding facilities ▪ Expected to begin contributing in 2H 2019 7
Other Business Updates ▪ Brickhaven update – Riverbend project completed March 2019 – In process of finalizing costs; expect termination payment from customer in 2H 2019 – To close Brickhaven site over following 12 to 18 months ▪ Diversified our maintenance services, previously limited to nuclear, to a broader mix of plants – New contract with APS – six gas and two coal plants in AZ and NM – New contract with Exelon – four gas plants in TX and AL and a biomass plant in GA ▪ Signed other significant new business in our byproduct sales, remediation and fossil services businesses 8Other Business Updates ▪ Brickhaven update – Riverbend project completed March 2019 – In process of finalizing costs; expect termination payment from customer in 2H 2019 – To close Brickhaven site over following 12 to 18 months ▪ Diversified our maintenance services, previously limited to nuclear, to a broader mix of plants – New contract with APS – six gas and two coal plants in AZ and NM – New contract with Exelon – four gas plants in TX and AL and a biomass plant in GA ▪ Signed other significant new business in our byproduct sales, remediation and fossil services businesses 8
Recent Regulatory Developments U.S. Court of Appeals for the D.C. Circuit Virginia Clean Closure Legislation ▪ March 2019 ruling allowed EPA CCR Phase 1 Part 1 ▪ Signed into law in March 2019 regulations to stand pending EPA’s consideration and ▪ Affects more than 27M tons of ash stored in issuance of Part 2 regulations (expected in 2020) CCR lagoons for four Dominion Energy ▪ Part 2 (Final) regulations must address August 2018 power plants; requires beneficiation of at D.C. Circuit Court ruling that all unlined coal ash least 25% and clean closure of remainder ponds must be closed, including clay-lined and legacy ▪ Represents significant opportunities for our inactive ponds, which were previously excluded from beneficiation and remediation businesses the EPA CCR regulations over 15+ years ▪ Significantly increases the addressable market and further validates the requirement for remediation 9Recent Regulatory Developments U.S. Court of Appeals for the D.C. Circuit Virginia Clean Closure Legislation ▪ March 2019 ruling allowed EPA CCR Phase 1 Part 1 ▪ Signed into law in March 2019 regulations to stand pending EPA’s consideration and ▪ Affects more than 27M tons of ash stored in issuance of Part 2 regulations (expected in 2020) CCR lagoons for four Dominion Energy ▪ Part 2 (Final) regulations must address August 2018 power plants; requires beneficiation of at D.C. Circuit Court ruling that all unlined coal ash least 25% and clean closure of remainder ponds must be closed, including clay-lined and legacy ▪ Represents significant opportunities for our inactive ponds, which were previously excluded from beneficiation and remediation businesses the EPA CCR regulations over 15+ years ▪ Significantly increases the addressable market and further validates the requirement for remediation 9

2018 Financial Review 102018 Financial Review 10
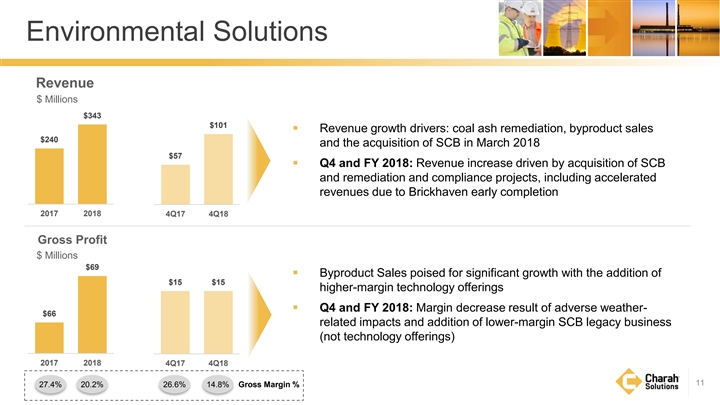
Environmental Solutions Revenue $ Millions $343 $101 ▪ Revenue growth drivers: coal ash remediation, byproduct sales $240 and the acquisition of SCB in March 2018 $57 ▪ Q4 and FY 2018: Revenue increase driven by acquisition of SCB and remediation and compliance projects, including accelerated revenues due to Brickhaven early completion 2017 2018 4Q17 4Q18 Gross Profit $ Millions $69 ▪ Byproduct Sales poised for significant growth with the addition of $15 $15 higher-margin technology offerings ▪ Q4 and FY 2018: Margin decrease result of adverse weather- $66 related impacts and addition of lower-margin SCB legacy business (not technology offerings) 2017 2018 4Q17 4Q18 11 27.4% 20.2% 26.6% 14.8% Gross Margin %Environmental Solutions Revenue $ Millions $343 $101 ▪ Revenue growth drivers: coal ash remediation, byproduct sales $240 and the acquisition of SCB in March 2018 $57 ▪ Q4 and FY 2018: Revenue increase driven by acquisition of SCB and remediation and compliance projects, including accelerated revenues due to Brickhaven early completion 2017 2018 4Q17 4Q18 Gross Profit $ Millions $69 ▪ Byproduct Sales poised for significant growth with the addition of $15 $15 higher-margin technology offerings ▪ Q4 and FY 2018: Margin decrease result of adverse weather- $66 related impacts and addition of lower-margin SCB legacy business (not technology offerings) 2017 2018 4Q17 4Q18 11 27.4% 20.2% 26.6% 14.8% Gross Margin %
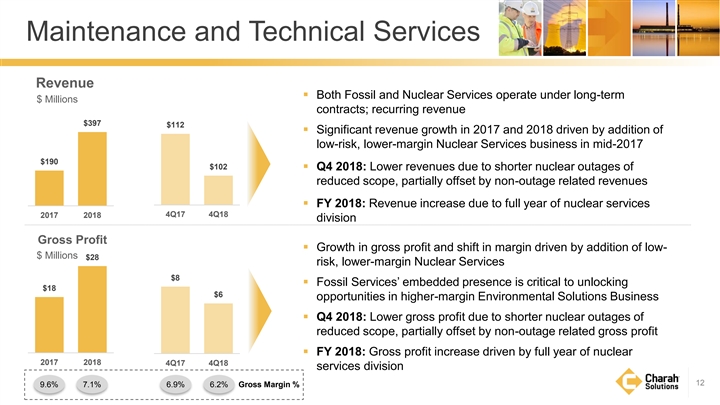
Maintenance and Technical Services Revenue ▪ Both Fossil and Nuclear Services operate under long-term $ Millions contracts; recurring revenue $397 $112 ▪ Significant revenue growth in 2017 and 2018 driven by addition of low-risk, lower-margin Nuclear Services business in mid-2017 $190 $102 ▪ Q4 2018: Lower revenues due to shorter nuclear outages of reduced scope, partially offset by non-outage related revenues ▪ FY 2018: Revenue increase due to full year of nuclear services 4Q17 4Q18 2017 2018 division Gross Profit ▪ Growth in gross profit and shift in margin driven by addition of low- $ Millions $28 risk, lower-margin Nuclear Services $8 ▪ Fossil Services’ embedded presence is critical to unlocking $18 $6 opportunities in higher-margin Environmental Solutions Business ▪ Q4 2018: Lower gross profit due to shorter nuclear outages of reduced scope, partially offset by non-outage related gross profit ▪ FY 2018: Gross profit increase driven by full year of nuclear 2017 2018 4Q17 4Q18 services division 12 9.6% 7.1% 6.9% 6.2% Gross Margin %Maintenance and Technical Services Revenue ▪ Both Fossil and Nuclear Services operate under long-term $ Millions contracts; recurring revenue $397 $112 ▪ Significant revenue growth in 2017 and 2018 driven by addition of low-risk, lower-margin Nuclear Services business in mid-2017 $190 $102 ▪ Q4 2018: Lower revenues due to shorter nuclear outages of reduced scope, partially offset by non-outage related revenues ▪ FY 2018: Revenue increase due to full year of nuclear services 4Q17 4Q18 2017 2018 division Gross Profit ▪ Growth in gross profit and shift in margin driven by addition of low- $ Millions $28 risk, lower-margin Nuclear Services $8 ▪ Fossil Services’ embedded presence is critical to unlocking $18 $6 opportunities in higher-margin Environmental Solutions Business ▪ Q4 2018: Lower gross profit due to shorter nuclear outages of reduced scope, partially offset by non-outage related gross profit ▪ FY 2018: Gross profit increase driven by full year of nuclear 2017 2018 4Q17 4Q18 services division 12 9.6% 7.1% 6.9% 6.2% Gross Margin %

Early Completion of Brickhaven Contract ▪ Accelerated Brickhaven revenues, depreciation, gross profit and EBITDA into 2018 – Depreciation expense of $38M in 2018; minimal depreciation in 2019 – G&A expense includes amortization of the purchase option liability o $15M credit in 2018; $3M credit in 2019 – Adjusted EBITDA significantly positive in 2018, minimal impact from Brickhaven in 2019 ▪ Buildup of Costs and Estimated Earnings in Excess of Billings (“CIE”) – Increase of $79M in 2018, nearly all related to Brickhaven; reduced operating cash flow – Brickhaven CIE to convert to A/R and then cash in 2019; become significantly cash flow positive ▪ No additional feeder sites after Riverbend – Lower revenues, gross profit and EBITDA than previously expected – Modest impact on 2018; more significant in 2019 and 2020 13Early Completion of Brickhaven Contract ▪ Accelerated Brickhaven revenues, depreciation, gross profit and EBITDA into 2018 – Depreciation expense of $38M in 2018; minimal depreciation in 2019 – G&A expense includes amortization of the purchase option liability o $15M credit in 2018; $3M credit in 2019 – Adjusted EBITDA significantly positive in 2018, minimal impact from Brickhaven in 2019 ▪ Buildup of Costs and Estimated Earnings in Excess of Billings (“CIE”) – Increase of $79M in 2018, nearly all related to Brickhaven; reduced operating cash flow – Brickhaven CIE to convert to A/R and then cash in 2019; become significantly cash flow positive ▪ No additional feeder sites after Riverbend – Lower revenues, gross profit and EBITDA than previously expected – Modest impact on 2018; more significant in 2019 and 2020 13

Additional Detail on Key Expense Items in 2018 ($ in millions) General & Administrative expense Depreciation & amortization expense Interest expense Reported G&A expense $76.8 Depreciation $49.2 Reported Interest expense $32.2 Add back: Amortization of purchase option 15.2 Amortization of intangible assets 8.3 Less: Refinancing costs 12.5 liability Interest expense excluding refinancing Less: Amortization of purchase option liability (15.2) 19.8 costs Non-recurring and non-operating legal costs 25.4 Total D&A (per Statement of Cash Flows) 42.3 and accruals Non-recurring startup costs 1.5 Cash interest 22.8 Transaction related expenses and other items 4.5 Adjusted G&A expense 60.5 ▪ Depreciation includes $38M related to ▪ Reported and Adjusted G&A expense ▪ Refinancing costs consists of a $10.4M Brickhaven, including accelerated includes: non-cash write-off of debt issuance amount (booked to COGS); most will costs and a $2.1M prepayment penalty – $4.1M of non-cash stock not continue in 2019 compensation expense; will ▪ 2019 interest expense and cash interest ▪ Amortization of intangible assets is vary from year to year payments expected to be lower due to expected to continue in 2019 at similar term loan refinancing in Q3 2018 – $8.3M of non-cash amortization levels (booked G&A expense) of intangible assets ▪ Amortization of purchase option liability is expected to decrease in 2019 to 14 ~$3.0M (booked G&A credit)Additional Detail on Key Expense Items in 2018 ($ in millions) General & Administrative expense Depreciation & amortization expense Interest expense Reported G&A expense $76.8 Depreciation $49.2 Reported Interest expense $32.2 Add back: Amortization of purchase option 15.2 Amortization of intangible assets 8.3 Less: Refinancing costs 12.5 liability Interest expense excluding refinancing Less: Amortization of purchase option liability (15.2) 19.8 costs Non-recurring and non-operating legal costs 25.4 Total D&A (per Statement of Cash Flows) 42.3 and accruals Non-recurring startup costs 1.5 Cash interest 22.8 Transaction related expenses and other items 4.5 Adjusted G&A expense 60.5 ▪ Depreciation includes $38M related to ▪ Reported and Adjusted G&A expense ▪ Refinancing costs consists of a $10.4M Brickhaven, including accelerated includes: non-cash write-off of debt issuance amount (booked to COGS); most will costs and a $2.1M prepayment penalty – $4.1M of non-cash stock not continue in 2019 compensation expense; will ▪ 2019 interest expense and cash interest ▪ Amortization of intangible assets is vary from year to year payments expected to be lower due to expected to continue in 2019 at similar term loan refinancing in Q3 2018 – $8.3M of non-cash amortization levels (booked G&A expense) of intangible assets ▪ Amortization of purchase option liability is expected to decrease in 2019 to 14 ~$3.0M (booked G&A credit)

2018 Cash Flow ($ in millions) Cash flow from operations (pre-changes in $48.6 W/C) Change in working capital inclusive of $79M increase in CIE primarily driven by the early completion of the Brickhaven Change in W/C (62.2) contract; expect to substantially collect in 2019 Operating cash flow (13.6) Maintenance and growth capex excludes seller-financed Maintenance and growth capex (18.5) equipment of $13.5M Technology capex (3.5) Free cash flow before SCB acquisition (35.7) 152018 Cash Flow ($ in millions) Cash flow from operations (pre-changes in $48.6 W/C) Change in working capital inclusive of $79M increase in CIE primarily driven by the early completion of the Brickhaven Change in W/C (62.2) contract; expect to substantially collect in 2019 Operating cash flow (13.6) Maintenance and growth capex excludes seller-financed Maintenance and growth capex (18.5) equipment of $13.5M Technology capex (3.5) Free cash flow before SCB acquisition (35.7) 15
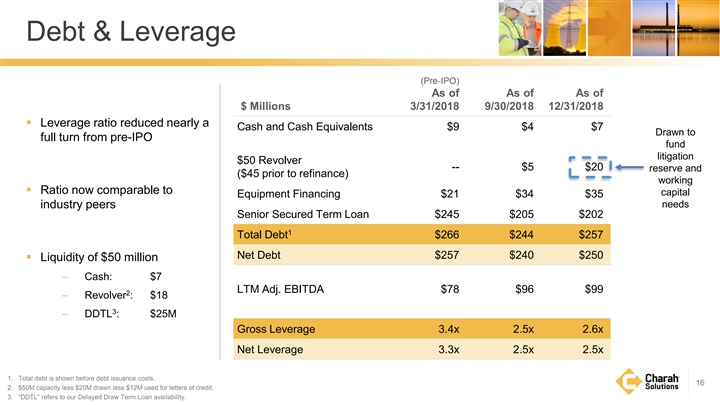
Debt & Leverage (Pre-IPO) As of As of As of $ Millions 3/31/2018 9/30/2018 12/31/2018 ▪ Leverage ratio reduced nearly a Cash and Cash Equivalents $9 $4 $7 Drawn to full turn from pre-IPO fund litigation $50 Revolver -- $5 $20 reserve and ($45 prior to refinance) working ▪ Ratio now comparable to capital Equipment Financing $21 $34 $35 industry peers needs Senior Secured Term Loan $245 $205 $202 1 Total Debt $266 $244 $257 Net Debt $257 $240 $250 ▪ Liquidity of $50 million – Cash: $7 LTM Adj. EBITDA $78 $96 $99 2 – Revolver : $18 3 – DDTL : $25M Gross Leverage 3.4x 2.5x 2.6x Net Leverage 3.3x 2.5x 2.5x 1. Total debt is shown before debt issuance costs. 16 2. $50M capacity less $20M drawn less $12M used for letters of credit. 3. “DDTL” refers to our Delayed Draw Term Loan availability.Debt & Leverage (Pre-IPO) As of As of As of $ Millions 3/31/2018 9/30/2018 12/31/2018 ▪ Leverage ratio reduced nearly a Cash and Cash Equivalents $9 $4 $7 Drawn to full turn from pre-IPO fund litigation $50 Revolver -- $5 $20 reserve and ($45 prior to refinance) working ▪ Ratio now comparable to capital Equipment Financing $21 $34 $35 industry peers needs Senior Secured Term Loan $245 $205 $202 1 Total Debt $266 $244 $257 Net Debt $257 $240 $250 ▪ Liquidity of $50 million – Cash: $7 LTM Adj. EBITDA $78 $96 $99 2 – Revolver : $18 3 – DDTL : $25M Gross Leverage 3.4x 2.5x 2.6x Net Leverage 3.3x 2.5x 2.5x 1. Total debt is shown before debt issuance costs. 16 2. $50M capacity less $20M drawn less $12M used for letters of credit. 3. “DDTL” refers to our Delayed Draw Term Loan availability.

2019 Guidance 172019 Guidance 17
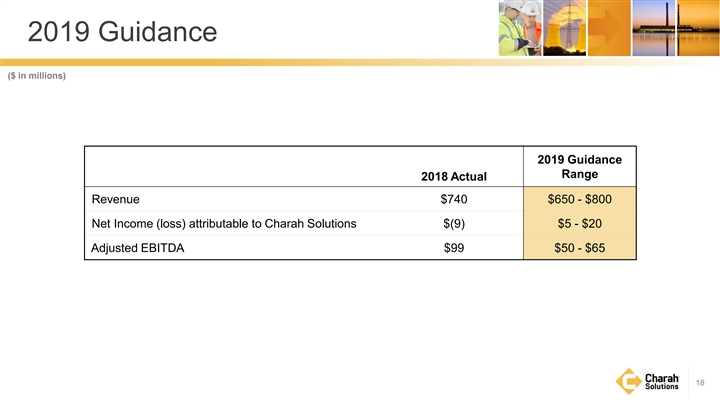
2019 Guidance ($ in millions) 2019 Guidance Range 2018 Actual Revenue $740 $650 - $800 Net Income (loss) attributable to Charah Solutions $(9) $5 - $20 Adjusted EBITDA $99 $50 - $65 182019 Guidance ($ in millions) 2019 Guidance Range 2018 Actual Revenue $740 $650 - $800 Net Income (loss) attributable to Charah Solutions $(9) $5 - $20 Adjusted EBITDA $99 $50 - $65 18
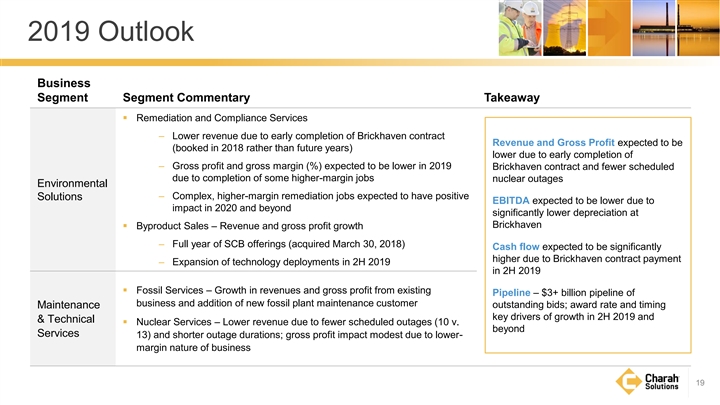
2019 Outlook Business Segment Segment Commentary Takeaway ▪ Remediation and Compliance Services ‒ Lower revenue due to early completion of Brickhaven contract Revenue and Gross Profit expected to be (booked in 2018 rather than future years) lower due to early completion of ‒ Gross profit and gross margin (%) expected to be lower in 2019 Brickhaven contract and fewer scheduled due to completion of some higher-margin jobs nuclear outages Environmental ‒ Complex, higher-margin remediation jobs expected to have positive Solutions EBITDA expected to be lower due to impact in 2020 and beyond significantly lower depreciation at Brickhaven ▪ Byproduct Sales – Revenue and gross profit growth ‒ Full year of SCB offerings (acquired March 30, 2018) Cash flow expected to be significantly higher due to Brickhaven contract payment ‒ Expansion of technology deployments in 2H 2019 in 2H 2019 ▪ Fossil Services – Growth in revenues and gross profit from existing Pipeline – $3+ billion pipeline of business and addition of new fossil plant maintenance customer outstanding bids; award rate and timing Maintenance key drivers of growth in 2H 2019 and & Technical ▪ Nuclear Services – Lower revenue due to fewer scheduled outages (10 v. beyond Services 13) and shorter outage durations; gross profit impact modest due to lower- margin nature of business 192019 Outlook Business Segment Segment Commentary Takeaway ▪ Remediation and Compliance Services ‒ Lower revenue due to early completion of Brickhaven contract Revenue and Gross Profit expected to be (booked in 2018 rather than future years) lower due to early completion of ‒ Gross profit and gross margin (%) expected to be lower in 2019 Brickhaven contract and fewer scheduled due to completion of some higher-margin jobs nuclear outages Environmental ‒ Complex, higher-margin remediation jobs expected to have positive Solutions EBITDA expected to be lower due to impact in 2020 and beyond significantly lower depreciation at Brickhaven ▪ Byproduct Sales – Revenue and gross profit growth ‒ Full year of SCB offerings (acquired March 30, 2018) Cash flow expected to be significantly higher due to Brickhaven contract payment ‒ Expansion of technology deployments in 2H 2019 in 2H 2019 ▪ Fossil Services – Growth in revenues and gross profit from existing Pipeline – $3+ billion pipeline of business and addition of new fossil plant maintenance customer outstanding bids; award rate and timing Maintenance key drivers of growth in 2H 2019 and & Technical ▪ Nuclear Services – Lower revenue due to fewer scheduled outages (10 v. beyond Services 13) and shorter outage durations; gross profit impact modest due to lower- margin nature of business 19
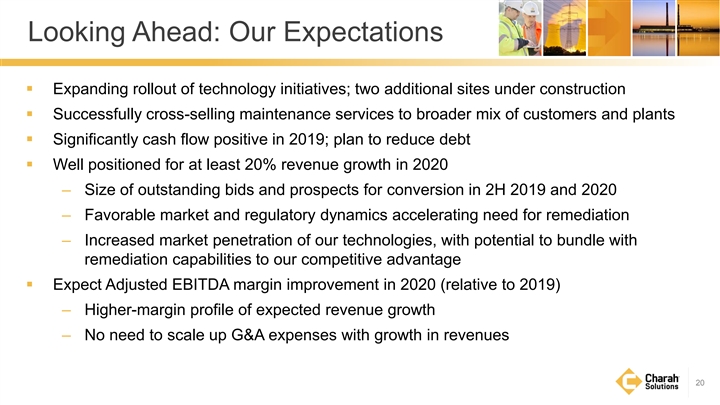
Looking Ahead: Our Expectations ▪ Expanding rollout of technology initiatives; two additional sites under construction ▪ Successfully cross-selling maintenance services to broader mix of customers and plants ▪ Significantly cash flow positive in 2019; plan to reduce debt ▪ Well positioned for at least 20% revenue growth in 2020 – Size of outstanding bids and prospects for conversion in 2H 2019 and 2020 – Favorable market and regulatory dynamics accelerating need for remediation – Increased market penetration of our technologies, with potential to bundle with remediation capabilities to our competitive advantage ▪ Expect Adjusted EBITDA margin improvement in 2020 (relative to 2019) – Higher-margin profile of expected revenue growth – No need to scale up G&A expenses with growth in revenues 20Looking Ahead: Our Expectations ▪ Expanding rollout of technology initiatives; two additional sites under construction ▪ Successfully cross-selling maintenance services to broader mix of customers and plants ▪ Significantly cash flow positive in 2019; plan to reduce debt ▪ Well positioned for at least 20% revenue growth in 2020 – Size of outstanding bids and prospects for conversion in 2H 2019 and 2020 – Favorable market and regulatory dynamics accelerating need for remediation – Increased market penetration of our technologies, with potential to bundle with remediation capabilities to our competitive advantage ▪ Expect Adjusted EBITDA margin improvement in 2020 (relative to 2019) – Higher-margin profile of expected revenue growth – No need to scale up G&A expenses with growth in revenues 20
APPENDIX 21APPENDIX 21
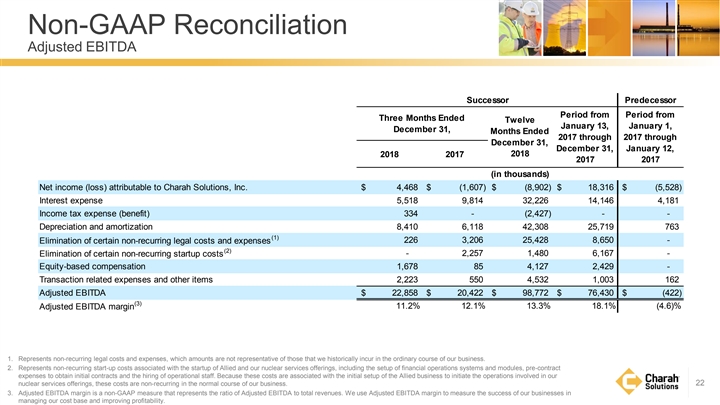
Non-GAAP Reconciliation Adjusted EBITDA Successor Predecessor Period from Period from Three Months Ended Twelve January 13, January 1, December 31, Months Ended 2017 through 2017 through December 31, December 31, January 12, 2018 2017 2018 2017 2017 (in thousands) Net income (loss) attributable to Charah Solutions, Inc. $ 4,468 $ (1,607) $ (8,902) $ 1 8,316 $ (5,528) Interest expense 5,518 9,814 32,226 14,146 4,181 Income tax expense (benefit) 334 - (2,427) - - Depreciation and amortization 8,410 6,118 42,308 25,719 763 (1) 226 3,206 25,428 8,650 - Elimination of certain non-recurring legal costs and expenses (2) - 2,257 1,480 6,167 - Elimination of certain non-recurring startup costs Equity-based compensation 1,678 85 4,127 2,429 - Transaction related expenses and other items 2,223 550 4,532 1,003 162 Adjusted EBITDA $ 22,858 $ 20,422 $ 9 8,772 $ 76,430 $ (422) (3) 11.2% 12.1% 13.3% 18.1% (4.6)% Adjusted EBITDA margin 1. Represents non-recurring legal costs and expenses, which amounts are not representative of those that we historically incur in the ordinary course of our business. 2. Represents non-recurring start-up costs associated with the startup of Allied and our nuclear services offerings, including the setup of financial operations systems and modules, pre-contract expenses to obtain initial contracts and the hiring of operational staff. Because these costs are associated with the initial setup of the Allied business to initiate the operations involved in our nuclear services offerings, these costs are non-recurring in the normal course of our business. 22 3. Adjusted EBITDA margin is a non-GAAP measure that represents the ratio of Adjusted EBITDA to total revenues. We use Adjusted EBITDA margin to measure the success of our businesses in managing our cost base and improving profitability. Non-GAAP Reconciliation Adjusted EBITDA Successor Predecessor Period from Period from Three Months Ended Twelve January 13, January 1, December 31, Months Ended 2017 through 2017 through December 31, December 31, January 12, 2018 2017 2018 2017 2017 (in thousands) Net income (loss) attributable to Charah Solutions, Inc. $ 4,468 $ (1,607) $ (8,902) $ 1 8,316 $ (5,528) Interest expense 5,518 9,814 32,226 14,146 4,181 Income tax expense (benefit) 334 - (2,427) - - Depreciation and amortization 8,410 6,118 42,308 25,719 763 (1) 226 3,206 25,428 8,650 - Elimination of certain non-recurring legal costs and expenses (2) - 2,257 1,480 6,167 - Elimination of certain non-recurring startup costs Equity-based compensation 1,678 85 4,127 2,429 - Transaction related expenses and other items 2,223 550 4,532 1,003 162 Adjusted EBITDA $ 22,858 $ 20,422 $ 9 8,772 $ 76,430 $ (422) (3) 11.2% 12.1% 13.3% 18.1% (4.6)% Adjusted EBITDA margin 1. Represents non-recurring legal costs and expenses, which amounts are not representative of those that we historically incur in the ordinary course of our business. 2. Represents non-recurring start-up costs associated with the startup of Allied and our nuclear services offerings, including the setup of financial operations systems and modules, pre-contract expenses to obtain initial contracts and the hiring of operational staff. Because these costs are associated with the initial setup of the Allied business to initiate the operations involved in our nuclear services offerings, these costs are non-recurring in the normal course of our business. 22 3. Adjusted EBITDA margin is a non-GAAP measure that represents the ratio of Adjusted EBITDA to total revenues. We use Adjusted EBITDA margin to measure the success of our businesses in managing our cost base and improving profitability.
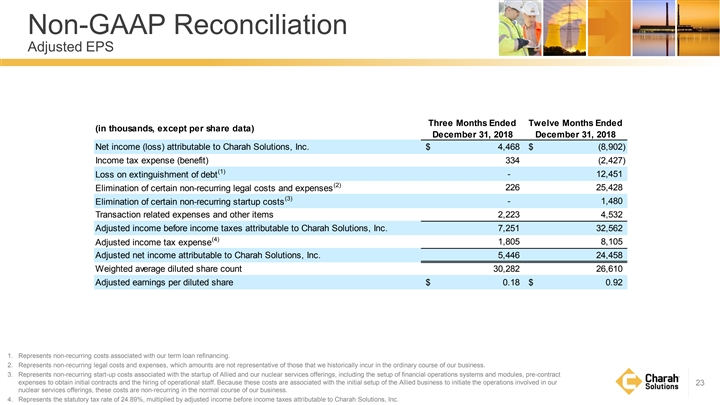
Non-GAAP Reconciliation Adjusted EPS Three Months Ended Twelve Months Ended (in thousands, except per share data) December 31, 2018 December 31, 2018 Net income (loss) attributable to Charah Solutions, Inc. $ 4,468 $ (8,902) Income tax expense (benefit) 334 (2,427) (1) - 1 2,451 Loss on extinguishment of debt (2) Elimination of certain non-recurring legal costs and expenses 226 25,428 (3) - 1,480 Elimination of certain non-recurring startup costs Transaction related expenses and other items 2,223 4,532 Adjusted income before income taxes attributable to Charah Solutions, Inc. 7,251 32,562 (4) Adjusted income tax expense 1,805 8,105 Adjusted net income attributable to Charah Solutions, Inc. 5,446 24,458 Weighted average diluted share count 30,282 26,610 Adjusted earnings per diluted share $ 0.18 $ 0.92 1. Represents non-recurring costs associated with our term loan refinancing. 2. Represents non-recurring legal costs and expenses, which amounts are not representative of those that we historically incur in the ordinary course of our business. 3. Represents non-recurring start-up costs associated with the startup of Allied and our nuclear services offerings, including the setup of financial operations systems and modules, pre-contract expenses to obtain initial contracts and the hiring of operational staff. Because these costs are associated with the initial setup of the Allied business to initiate the operations involved in our 23 nuclear services offerings, these costs are non-recurring in the normal course of our business. 4. Represents the statutory tax rate of 24.89%, multiplied by adjusted income before income taxes attributable to Charah Solutions, Inc. Non-GAAP Reconciliation Adjusted EPS Three Months Ended Twelve Months Ended (in thousands, except per share data) December 31, 2018 December 31, 2018 Net income (loss) attributable to Charah Solutions, Inc. $ 4,468 $ (8,902) Income tax expense (benefit) 334 (2,427) (1) - 1 2,451 Loss on extinguishment of debt (2) Elimination of certain non-recurring legal costs and expenses 226 25,428 (3) - 1,480 Elimination of certain non-recurring startup costs Transaction related expenses and other items 2,223 4,532 Adjusted income before income taxes attributable to Charah Solutions, Inc. 7,251 32,562 (4) Adjusted income tax expense 1,805 8,105 Adjusted net income attributable to Charah Solutions, Inc. 5,446 24,458 Weighted average diluted share count 30,282 26,610 Adjusted earnings per diluted share $ 0.18 $ 0.92 1. Represents non-recurring costs associated with our term loan refinancing. 2. Represents non-recurring legal costs and expenses, which amounts are not representative of those that we historically incur in the ordinary course of our business. 3. Represents non-recurring start-up costs associated with the startup of Allied and our nuclear services offerings, including the setup of financial operations systems and modules, pre-contract expenses to obtain initial contracts and the hiring of operational staff. Because these costs are associated with the initial setup of the Allied business to initiate the operations involved in our 23 nuclear services offerings, these costs are non-recurring in the normal course of our business. 4. Represents the statutory tax rate of 24.89%, multiplied by adjusted income before income taxes attributable to Charah Solutions, Inc.