
Q4 2020 Earnings Call Presentation March 25, 2021 Exhibit 99.2
Forward-Looking Statements Forward-Looking Statements This presentation and our accompanying comments include “forward-looking statements” within the meaning of the Private Securities Litigation Reform Act of 1995. These forward-looking statements may be identified by words such as “may,” “will,” “expect,” “intend,” “anticipate,” “believe,” “estimate,” “plan,” “project,” “could,” “should,” “would,” “continue,” “seek,” “target,” “guidance,” “outlook,” “if current trends continue,” “optimistic,” “forecast” and other similar words. Such statements include, but are not limited to, statements about future financial and operating results, the Company’s plans, objectives, estimates, expectations, and intentions, estimates and strategies for the future, and other statements that are not historical facts. These forward-looking statements are based on our current objectives, beliefs and expectations, and they are subject to significant risks and uncertainties that may cause actual results and financial position and timing of certain events to differ materially from the information in the forward- looking statements. These risks and uncertainties include, but are not limited to, those set forth in the Company’s Annual Report on Form 10-K for the year ended December 31, 2020 filed on March 24, 2021 with the Securities and Exchange Commission (“SEC”) and in our other reports filed from time to time with the SEC including our Quarterly Report on Form 10-Q filed on November 10, 2020. There may be other factors of which we are not currently aware that may affect matters discussed in the forward-looking statements and may also cause actual results to differ materially from those discussed. We do not assume any obligation to publicly update or supplement any forward-looking statement to reflect actual results, changes in assumptions or changes in other factors affecting these forward-looking statements other than as required by law. Any forward-looking statements speak only as of the date hereof or as of the dates indicated in the statements. Non-GAAP Financial Measures Included in this presentation are certain non-GAAP financial measures designed to complement the financial information presented in accordance with GAAP because management believes such measures are useful to investors. The non-GAAP financial measures are not determined in accordance with GAAP and should not be considered a substitute for performance measures determined in accordance with GAAP. The calculations of the non-GAAP financial measures are subjective, based on management’s belief as to which items should be included or excluded in order to provide the most reasonable and comparable view of the underlying operating performance of the business. We may, from time to time, modify the amounts used to determine our non-GAAP financial measures. Reconciliation of non-GAAP financial measures are included in the supplemental slides in the Appendix of this presentation. Market & Industry Data This presentation includes industry and trade data, forecasts and information that was prepared based, in part, upon data, forecasts and information obtained from independent trade associations, industry publications and surveys and other independent sources available to the Company. Some data also are based on the Company’s good faith estimates, which are derived from management’s knowledge of the industry and from independent sources. These third-party publications and surveys generally state that the information included therein has been obtained from sources believed to be reliable, but that the publications and surveys can give no assurance as to the accuracy or completeness of such information. The Company has not independently verified any of the data from third-party sources nor has it ascertained the underlying economic assumptions on which such data are based. 2
Agenda Business Highlights (Scott Sewell, President and CEO) – 2020 & YTD 2021 New Awards – Environmental, Social and Governance (ESG) Report – EnviroSource™ ash beneficiation technology Financial Overview (Roger Shannon, CFO and Treasurer) – Fourth quarter and Full-year 2020 financial review o Revenue, gross profit, and Adjusted EBITDA comparison o Business segment performance – Balance Sheet, Cash Flow and Liquidity – 2021 guidance Conclusion (Scott Sewell) Appendix – Non-GAAP Reconciliations 3

Business Highlights 4
Significant Accomplishments Full-year 2020 $715 million in new awards in 2020, including $433 million of new awards in Q4 2020; Exceeded last year’s record of $430 million by 66% +$3 billion in pending bids with awards expected in the near-term and insight into additional $7 billion of project to be awarded between now and the end of 2022 Increased diversification of customer base and broadened geographic reach; Environmental Risk Transfer (ERT) projects Sustainability leadership and firm commitment to environmental, social and governance (ESG) responsibilities Successful disposition of our Allied Power subsidiary for $40 million - Charah Solutions is entirely focused on expanding remediation and compliance, byproduct sales, fossil operations and ERT growth Liquidity increased by $23 million while total debt was reduced by $39 million; continued reduction of Net Leverage multiple Continued our industry leading safety track record 5 Significant near-term pipeline conversion opportunities 1. Free cash flow is a non-GAAP measure. Please refer to the supplemental slides in the Appendix for a reconciliation of free cash flow to the nearest GAAP financial measure.
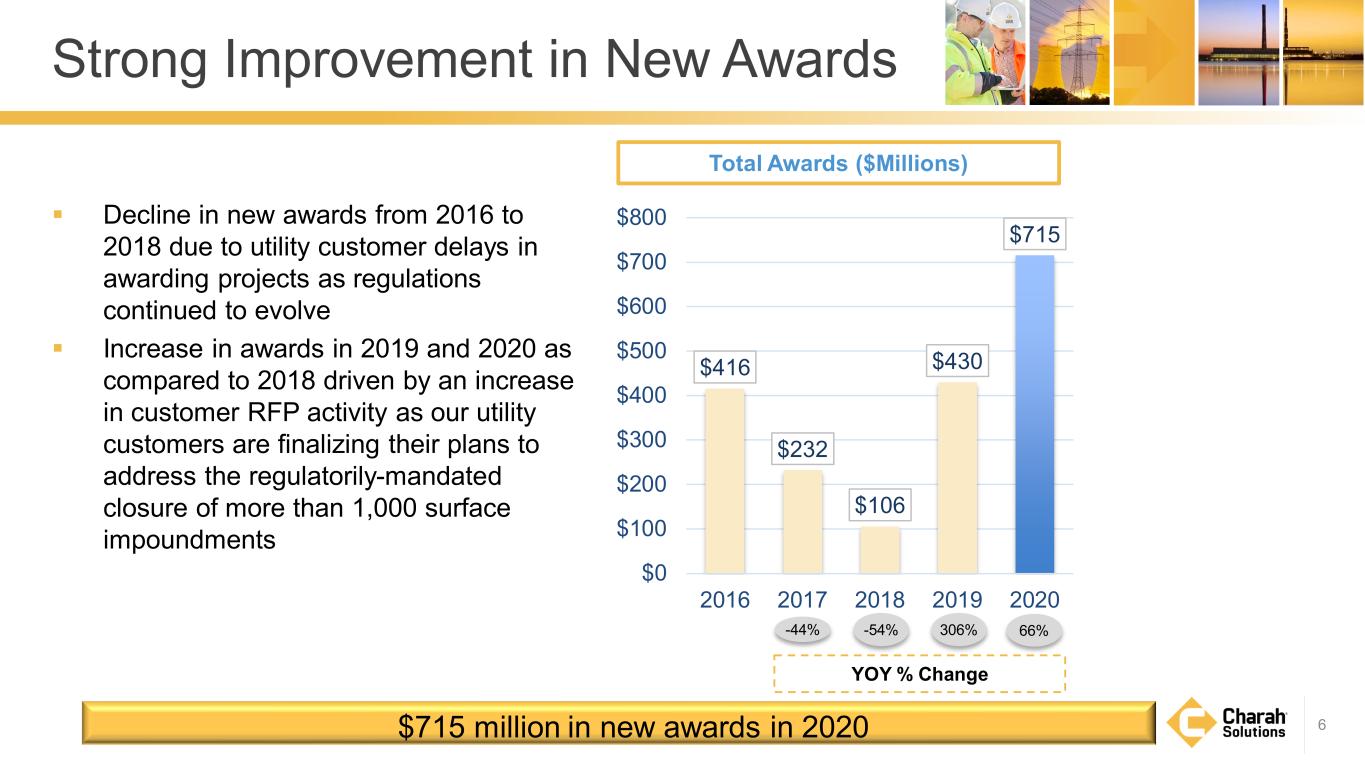
Strong Improvement in New Awards Decline in new awards from 2016 to 2018 due to utility customer delays in awarding projects as regulations continued to evolve Increase in awards in 2019 and 2020 as compared to 2018 driven by an increase in customer RFP activity as our utility customers are finalizing their plans to address the regulatorily-mandated closure of more than 1,000 surface impoundments 6 $416 $232 $106 $430 $715 $0 $100 $200 $300 $400 $500 $600 $700 $800 2016 2017 2018 2019 2020 Total Awards ($Millions) 306%-54% YOY % Change -44% 66% $715 million in new awards in 2020
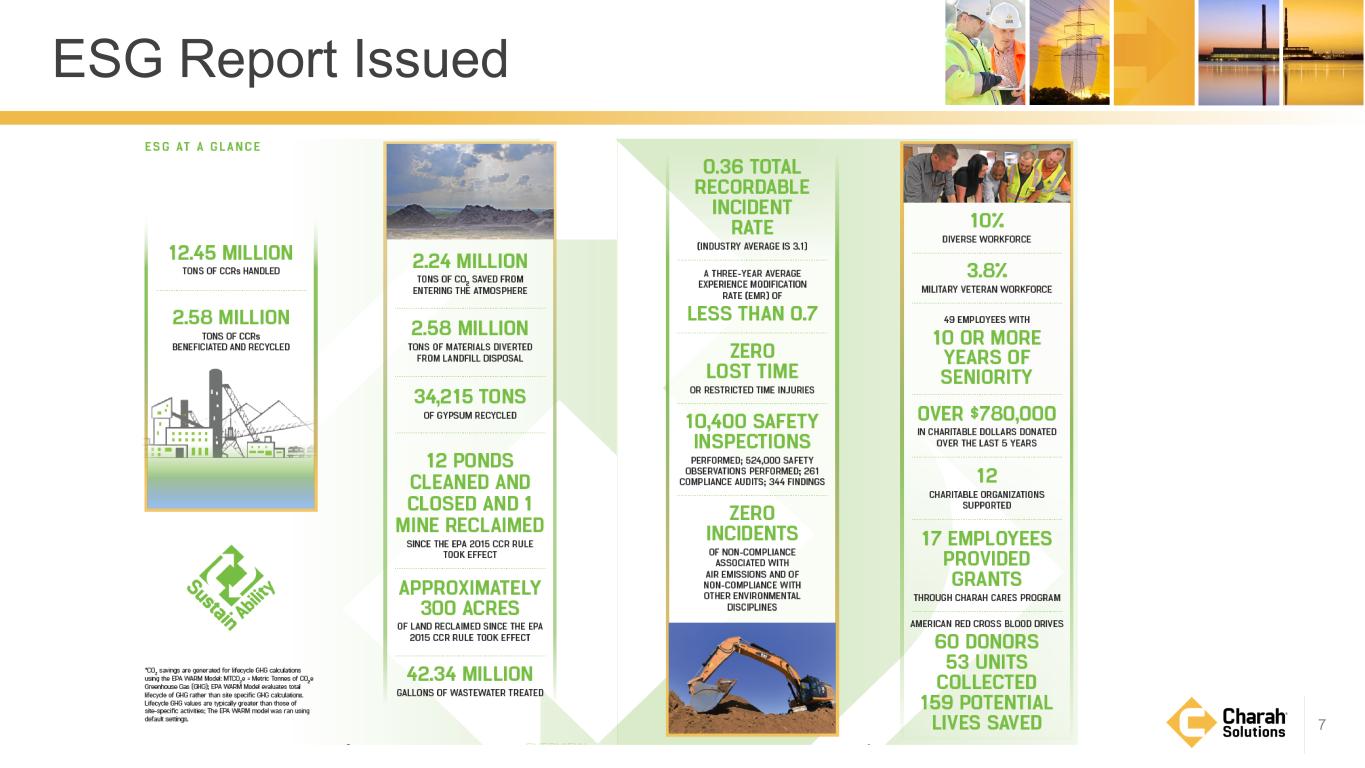
ESG Report Issued 7
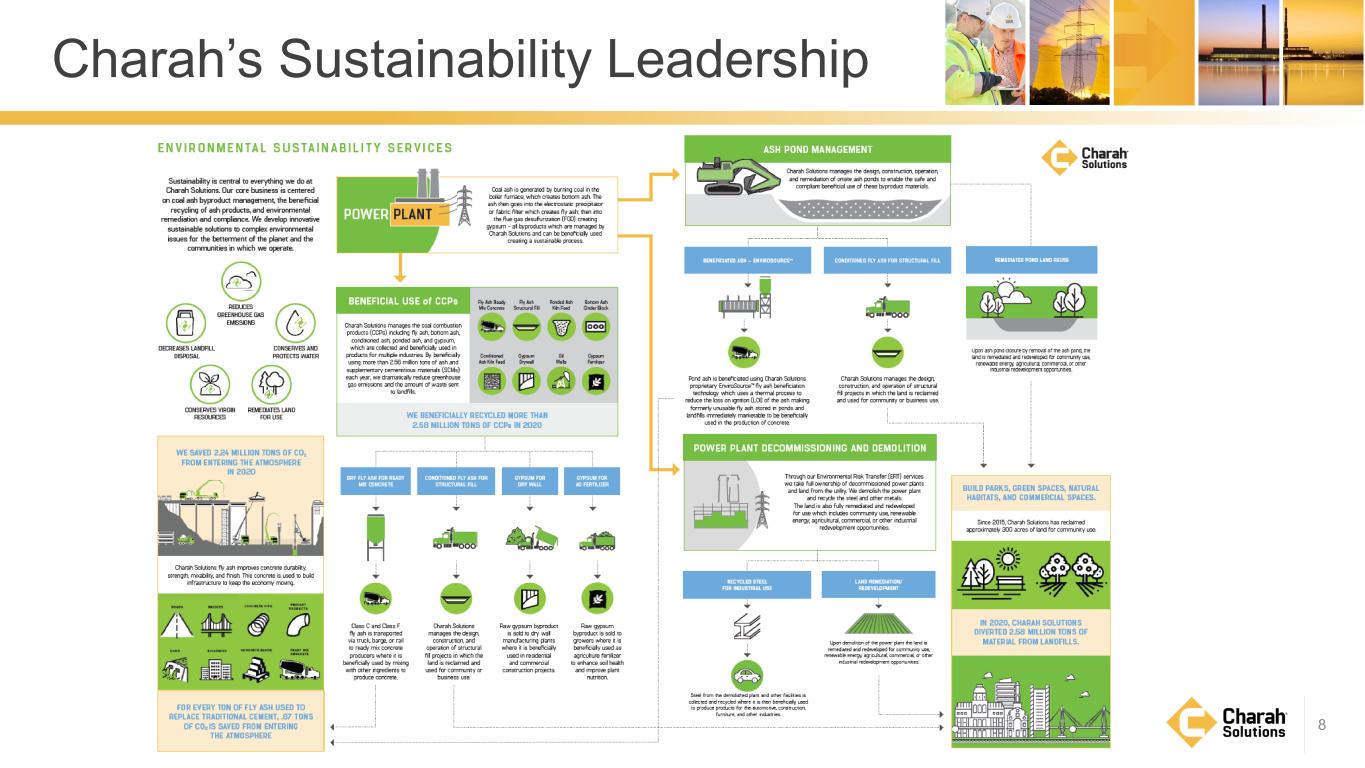
Charah’s Sustainability Leadership 8
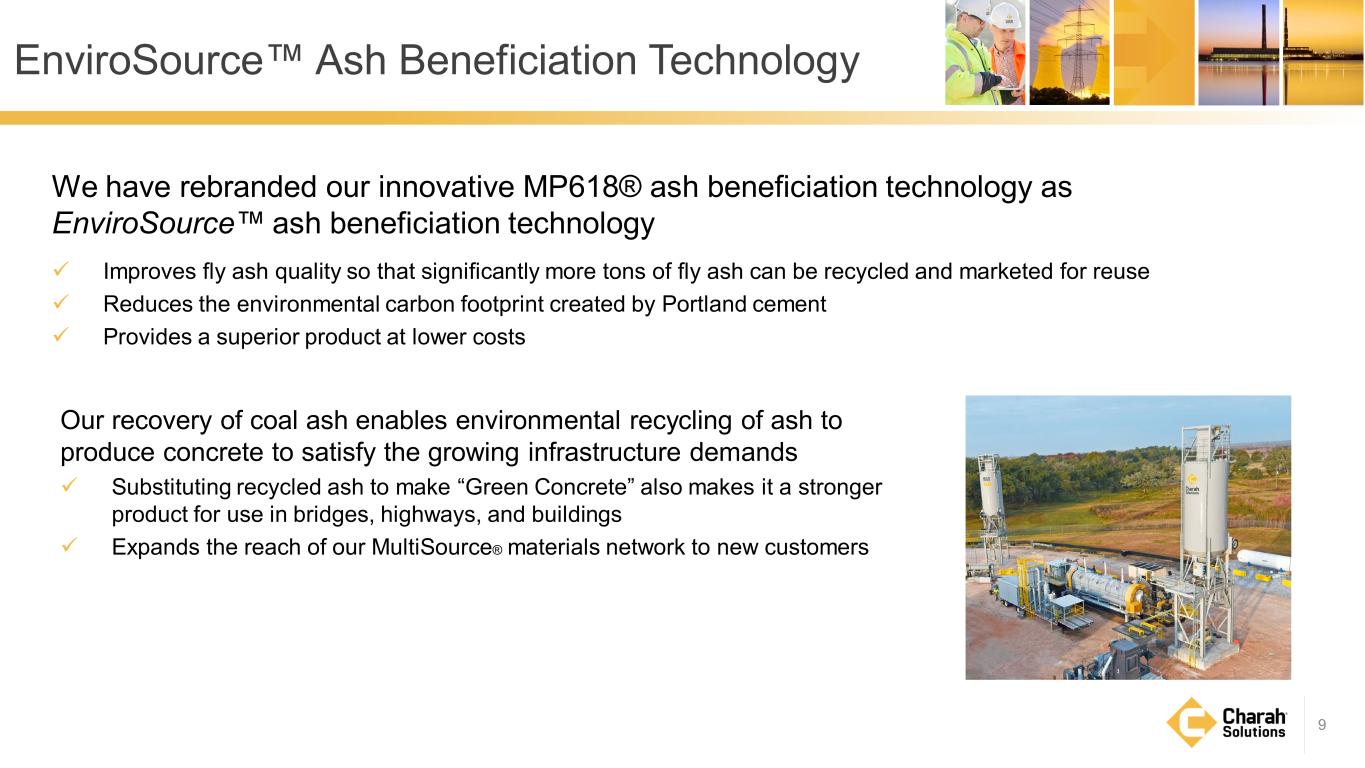
EnviroSource™ Ash Beneficiation Technology We have rebranded our innovative MP618® ash beneficiation technology as EnviroSource™ ash beneficiation technology Improves fly ash quality so that significantly more tons of fly ash can be recycled and marketed for reuse Reduces the environmental carbon footprint created by Portland cement Provides a superior product at lower costs 9 Our recovery of coal ash enables environmental recycling of ash to produce concrete to satisfy the growing infrastructure demands Substituting recycled ash to make “Green Concrete” also makes it a stronger product for use in bridges, highways, and buildings Expands the reach of our MultiSource® materials network to new customers

2020 Financial Overview 10
Q4 2020 Financial Highlights Revenues increased $10.7 million as compared to Q4 2019 – Driven by: (i) an increase in remediation and compliance revenue from new project work – Partially offset by lower byproduct sales revenue Gross profit decreased by $3.5 million as compared to Q4 2019 – Primarily due to: (i) an inventory reduction associated with slow-moving stockpiles at two of our locations; and (ii) lower byproduct sales revenue Net Loss attributable to Charah Solutions Inc. increased by $16.0 million as to compared to Q4 2019 – Primarily due to: (i) Non-cash impairment charges recorded in Q4 2020 Adjusted EBITDA1 decreased by $1.9 million as compared to Q4 2019 – Primarily due to: (i) lower gross profit 11 1. Please refer to the supplemental slides in the Appendix for a reconciliation of Adjusted EBITDA to the most directly comparable GAAP financial measure.
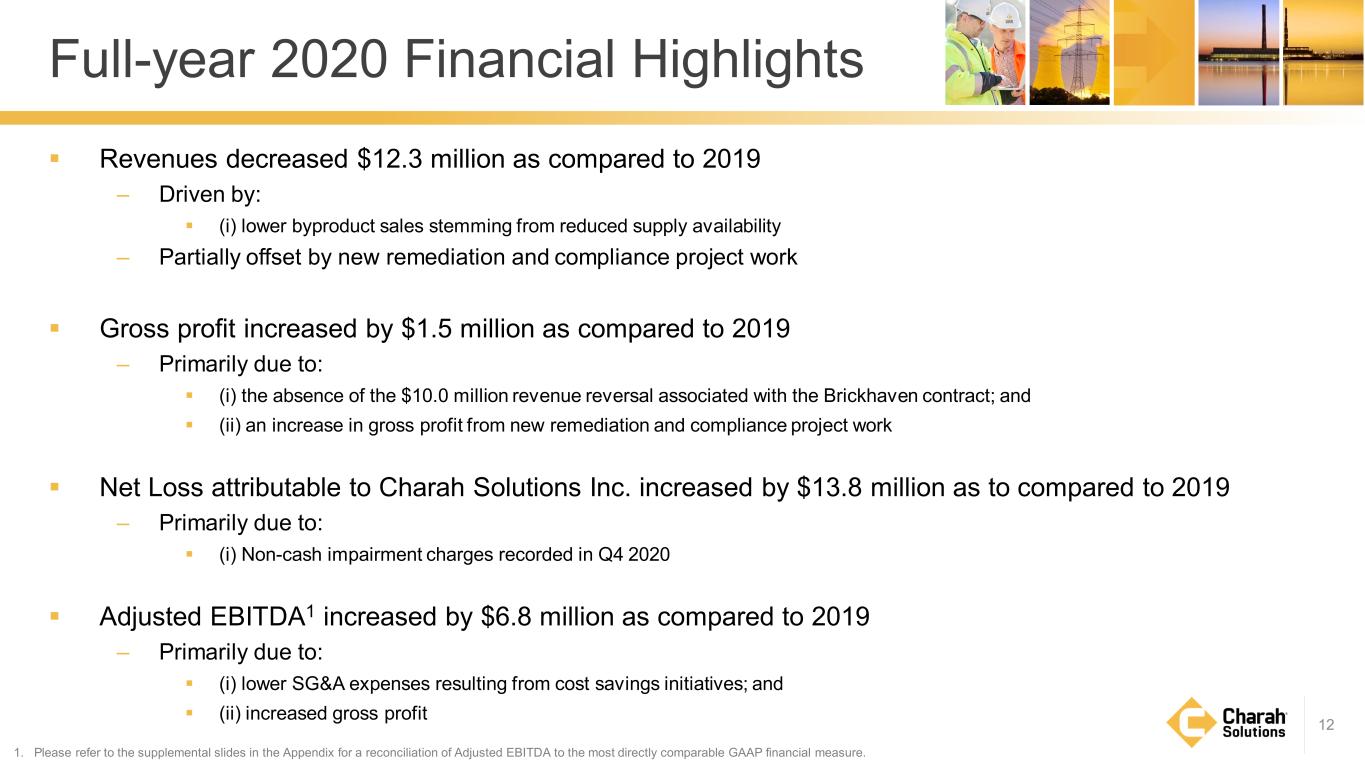
Full-year 2020 Financial Highlights Revenues decreased $12.3 million as compared to 2019 – Driven by: (i) lower byproduct sales stemming from reduced supply availability – Partially offset by new remediation and compliance project work Gross profit increased by $1.5 million as compared to 2019 – Primarily due to: (i) the absence of the $10.0 million revenue reversal associated with the Brickhaven contract; and (ii) an increase in gross profit from new remediation and compliance project work Net Loss attributable to Charah Solutions Inc. increased by $13.8 million as to compared to 2019 – Primarily due to: (i) Non-cash impairment charges recorded in Q4 2020 Adjusted EBITDA1 increased by $6.8 million as compared to 2019 – Primarily due to: (i) lower SG&A expenses resulting from cost savings initiatives; and (ii) increased gross profit 12 1. Please refer to the supplemental slides in the Appendix for a reconciliation of Adjusted EBITDA to the most directly comparable GAAP financial measure.
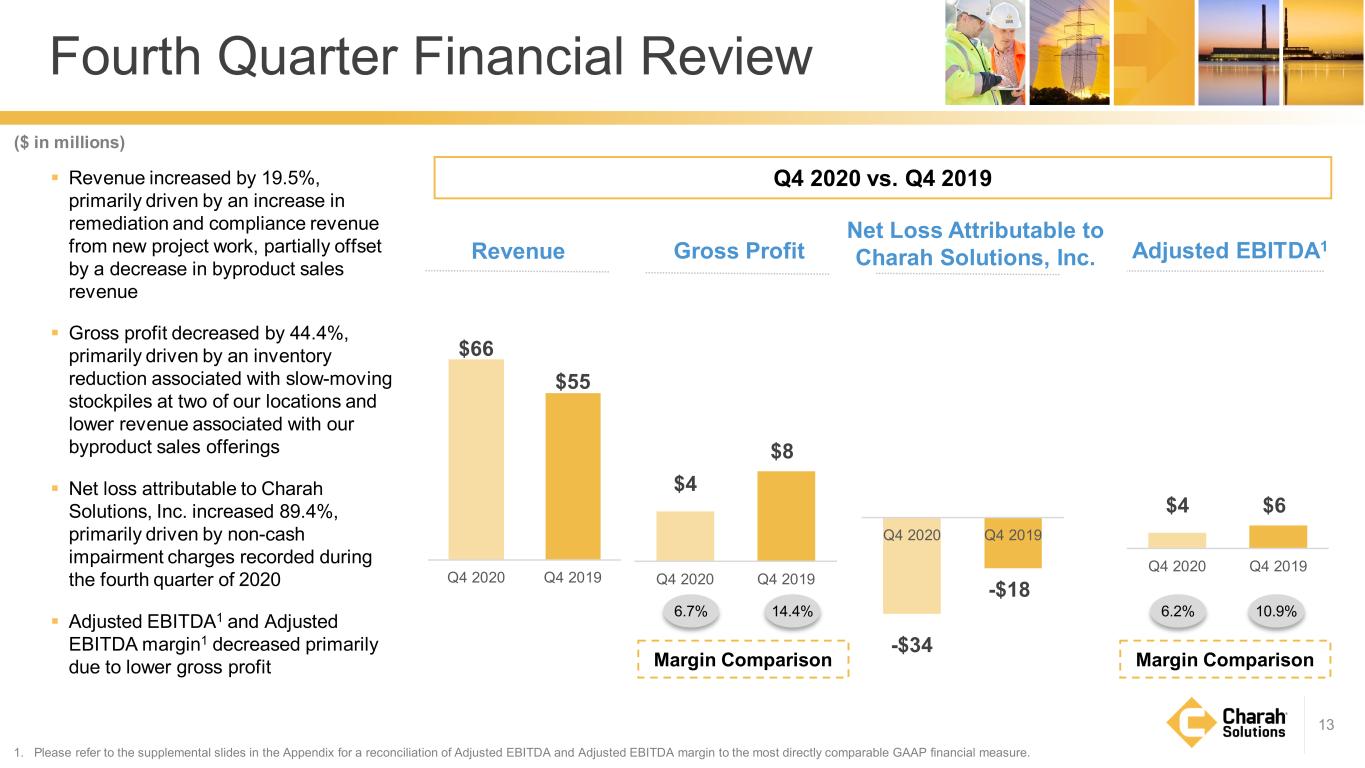
$66 $55 Q4 2020 Q4 2019 Revenue increased by 19.5%, primarily driven by an increase in remediation and compliance revenue from new project work, partially offset by a decrease in byproduct sales revenue Gross profit decreased by 44.4%, primarily driven by an inventory reduction associated with slow-moving stockpiles at two of our locations and lower revenue associated with our byproduct sales offerings Net loss attributable to Charah Solutions, Inc. increased 89.4%, primarily driven by non-cash impairment charges recorded during the fourth quarter of 2020 Adjusted EBITDA1 and Adjusted EBITDA margin1 decreased primarily due to lower gross profit 1. Please refer to the supplemental slides in the Appendix for a reconciliation of Adjusted EBITDA and Adjusted EBITDA margin to the most directly comparable GAAP financial measure. Revenue Fourth Quarter Financial Review 13 Adjusted EBITDA1 Q4 2020 vs. Q4 2019 10.9%6.2% Gross Profit 14.4%6.7% Margin Comparison ($ in millions) Net Loss Attributable to Charah Solutions, Inc. Margin Comparison $4 $8 Q4 2020 Q4 2019 -$34 -$18 Q4 2020 Q4 2019 $4 $6 Q4 2020 Q4 2019
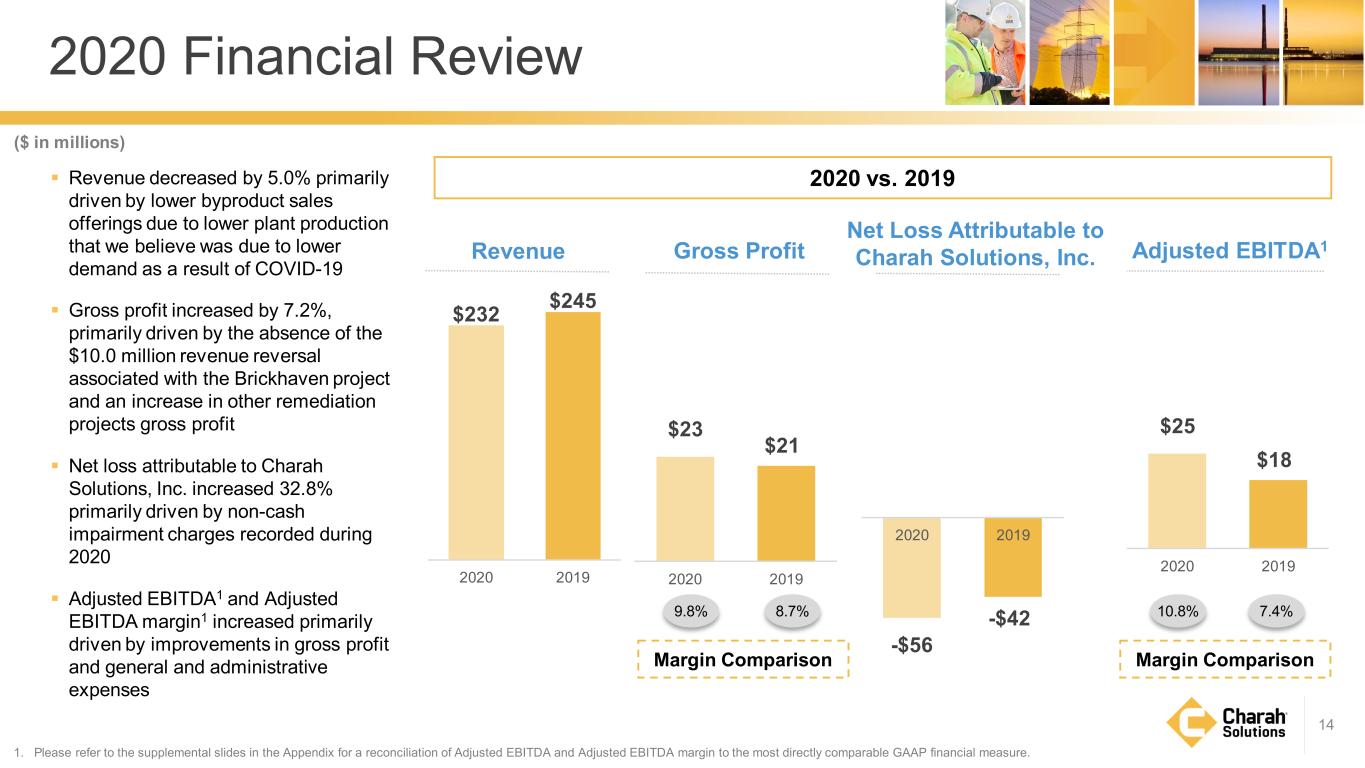
$232 $245 2020 2019 Revenue decreased by 5.0% primarily driven by lower byproduct sales offerings due to lower plant production that we believe was due to lower demand as a result of COVID-19 Gross profit increased by 7.2%, primarily driven by the absence of the $10.0 million revenue reversal associated with the Brickhaven project and an increase in other remediation projects gross profit Net loss attributable to Charah Solutions, Inc. increased 32.8% primarily driven by non-cash impairment charges recorded during 2020 Adjusted EBITDA1 and Adjusted EBITDA margin1 increased primarily driven by improvements in gross profit and general and administrative expenses 1. Please refer to the supplemental slides in the Appendix for a reconciliation of Adjusted EBITDA and Adjusted EBITDA margin to the most directly comparable GAAP financial measure. Revenue 2020 Financial Review 14 Adjusted EBITDA1 2020 vs. 2019 7.4%10.8% Gross Profit 8.7%9.8% Margin Comparison ($ in millions) Net Loss Attributable to Charah Solutions, Inc. Margin Comparison $23 $21 2020 2019 -$56 -$42 2020 2019 $25 $18 2020 2019
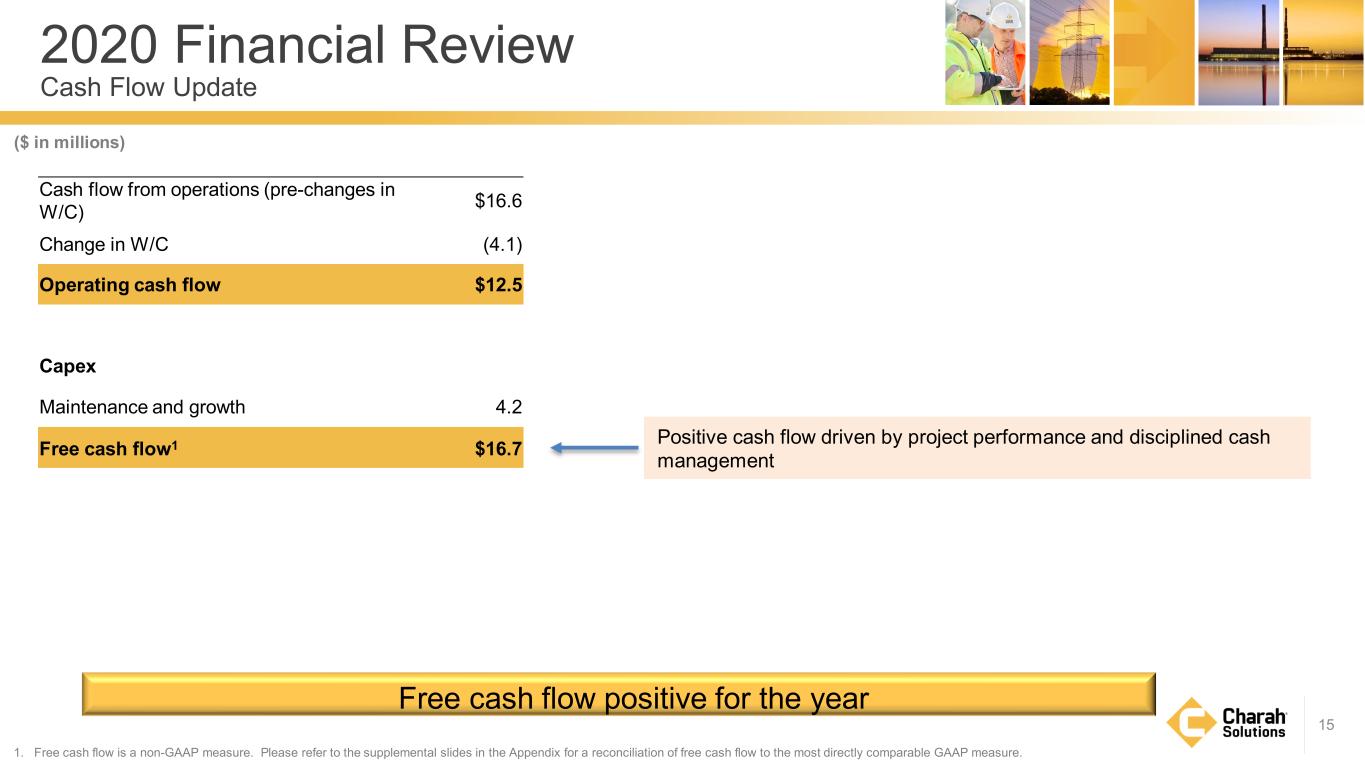
15 2020 Financial Review Cash Flow Update Cash flow from operations (pre-changes in W/C) $16.6 Change in W/C (4.1) Operating cash flow $12.5 Capex Maintenance and growth 4.2 Free cash flow1 $16.7 ($ in millions) 1. Free cash flow is a non-GAAP measure. Please refer to the supplemental slides in the Appendix for a reconciliation of free cash flow to the most directly comparable GAAP measure. Positive cash flow driven by project performance and disciplined cash management Free cash flow positive for the year
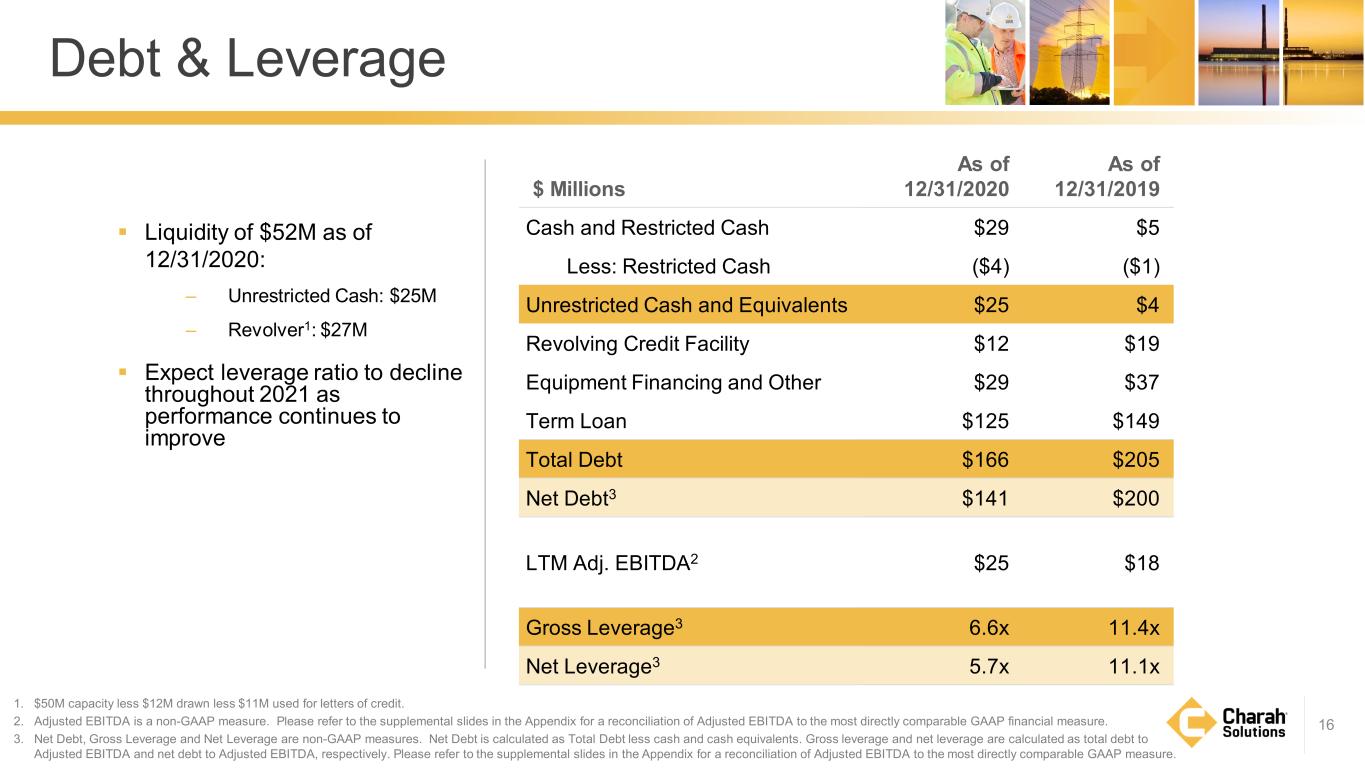
16 $ Millions As of 12/31/2020 As of 12/31/2019 Cash and Restricted Cash $29 $5 Less: Restricted Cash ($4) ($1) Unrestricted Cash and Equivalents $25 $4 Revolving Credit Facility $12 $19 Equipment Financing and Other $29 $37 Term Loan $125 $149 Total Debt $166 $205 Net Debt3 $141 $200 LTM Adj. EBITDA2 $25 $18 Gross Leverage3 6.6x 11.4x Net Leverage3 5.7x 11.1x Debt & Leverage 1. $50M capacity less $12M drawn less $11M used for letters of credit. 2. Adjusted EBITDA is a non-GAAP measure. Please refer to the supplemental slides in the Appendix for a reconciliation of Adjusted EBITDA to the most directly comparable GAAP financial measure. 3. Net Debt, Gross Leverage and Net Leverage are non-GAAP measures. Net Debt is calculated as Total Debt less cash and cash equivalents. Gross leverage and net leverage are calculated as total debt to Adjusted EBITDA and net debt to Adjusted EBITDA, respectively. Please refer to the supplemental slides in the Appendix for a reconciliation of Adjusted EBITDA to the most directly comparable GAAP measure. Liquidity of $52M as of 12/31/2020: – Unrestricted Cash: $25M – Revolver1: $27M Expect leverage ratio to decline throughout 2021 as performance continues to improve
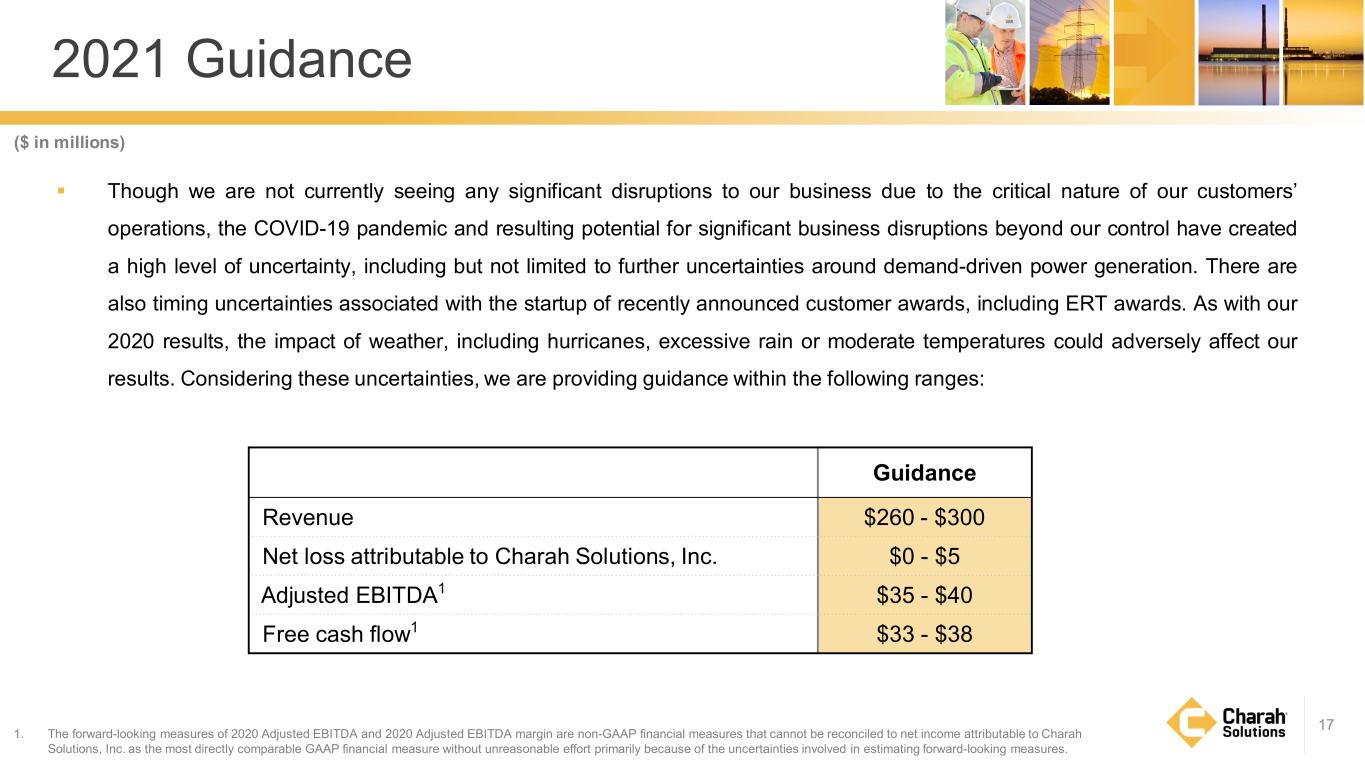
2021 Guidance 17 Guidance Revenue $260 - $300 Net loss attributable to Charah Solutions, Inc. $0 - $5 Adjusted EBITDA1 $35 - $40 Free cash flow1 $33 - $38 ($ in millions) Though we are not currently seeing any significant disruptions to our business due to the critical nature of our customers’ operations, the COVID-19 pandemic and resulting potential for significant business disruptions beyond our control have created a high level of uncertainty, including but not limited to further uncertainties around demand-driven power generation. There are also timing uncertainties associated with the startup of recently announced customer awards, including ERT awards. As with our 2020 results, the impact of weather, including hurricanes, excessive rain or moderate temperatures could adversely affect our results. Considering these uncertainties, we are providing guidance within the following ranges: 1. The forward-looking measures of 2020 Adjusted EBITDA and 2020 Adjusted EBITDA margin are non-GAAP financial measures that cannot be reconciled to net income attributable to Charah Solutions, Inc. as the most directly comparable GAAP financial measure without unreasonable effort primarily because of the uncertainties involved in estimating forward-looking measures.

APPENDIX 18

Non-GAAP Reconciliation Adjusted EBITDA and Adjusted EBITDA Margin 19 1. Represents non-recurring legal costs and expenses, which amounts are not representative of those that we historically incur in the ordinary course of our business. Negative amounts represent insurance recoveries related to these matters. 2. Represents expenses associated with the Amendment to the Credit Facility, SCB transaction expenses, executive severance costs, IPO-related costs, and other miscellaneous items. 3. Adjusted EBITDA margin is a non-GAAP financial measure that represents the ratio of Adjusted EBITDA to total revenue. We use Adjusted EBITDA margin to measure the success of our businesses in managing our cost base and improving profitability. Adjusted EBITDA and Adjusted EBITDA margin are non-GAAP financial measures. We define Adjusted EBITDA as net earnings attributable to Charah Solutions, Inc. before loss on extinguishment of debt, impairment expense, gain on change in contingent payment liability, interest expense, net, income taxes, depreciation and amortization, equity-based compensation, non-recurring legal costs and expenses, the Brickhaven contract deemed termination revenue reversal and transaction-related expenses and other items. Adjusted EBITDA margin represents the ratio of Adjusted EBITDA to total revenue. Adjusted EBITDA margin represents the ratio of Adjusted EBITDA to total revenue. We believe Adjusted EBITDA and Adjusted EBITDA margin are useful performance measures because they allow for an effective evaluation of our operating performance when compared to our peers, without regard to our financing methods or capital structure. The following represents a reconciliation of net loss attributable to Charah Solutions, Inc., our most directly comparable financial measure calculated and presented in accordance with GAAP, to Adjusted EBITDA.
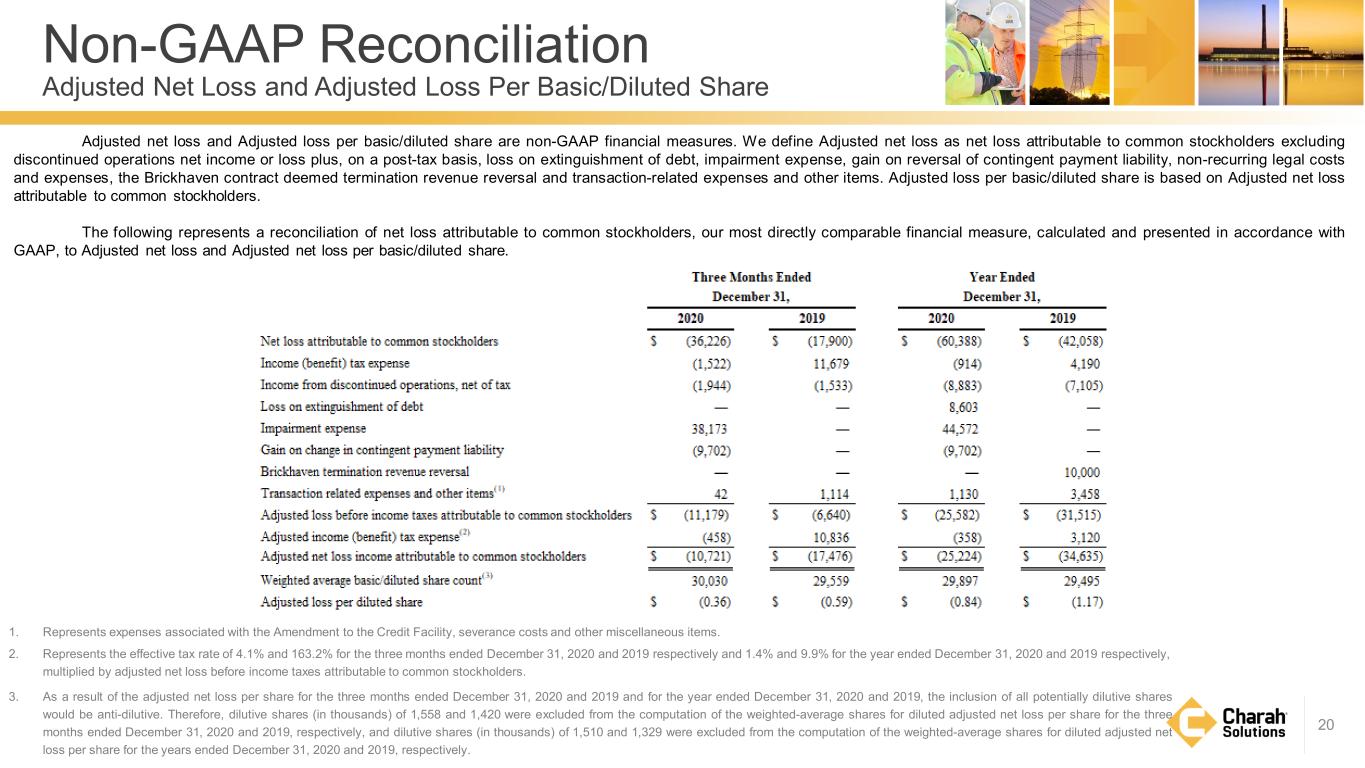
Non-GAAP Reconciliation Adjusted Net Loss and Adjusted Loss Per Basic/Diluted Share 20 1. Represents expenses associated with the Amendment to the Credit Facility, severance costs and other miscellaneous items. 2. Represents the effective tax rate of 4.1% and 163.2% for the three months ended December 31, 2020 and 2019 respectively and 1.4% and 9.9% for the year ended December 31, 2020 and 2019 respectively, multiplied by adjusted net loss before income taxes attributable to common stockholders. 3. As a result of the adjusted net loss per share for the three months ended December 31, 2020 and 2019 and for the year ended December 31, 2020 and 2019, the inclusion of all potentially dilutive shares would be anti-dilutive. Therefore, dilutive shares (in thousands) of 1,558 and 1,420 were excluded from the computation of the weighted-average shares for diluted adjusted net loss per share for the three months ended December 31, 2020 and 2019, respectively, and dilutive shares (in thousands) of 1,510 and 1,329 were excluded from the computation of the weighted-average shares for diluted adjusted net loss per share for the years ended December 31, 2020 and 2019, respectively. Adjusted net loss and Adjusted loss per basic/diluted share are non-GAAP financial measures. We define Adjusted net loss as net loss attributable to common stockholders excluding discontinued operations net income or loss plus, on a post-tax basis, loss on extinguishment of debt, impairment expense, gain on reversal of contingent payment liability, non-recurring legal costs and expenses, the Brickhaven contract deemed termination revenue reversal and transaction-related expenses and other items. Adjusted loss per basic/diluted share is based on Adjusted net loss attributable to common stockholders. The following represents a reconciliation of net loss attributable to common stockholders, our most directly comparable financial measure, calculated and presented in accordance with GAAP, to Adjusted net loss and Adjusted net loss per basic/diluted share.
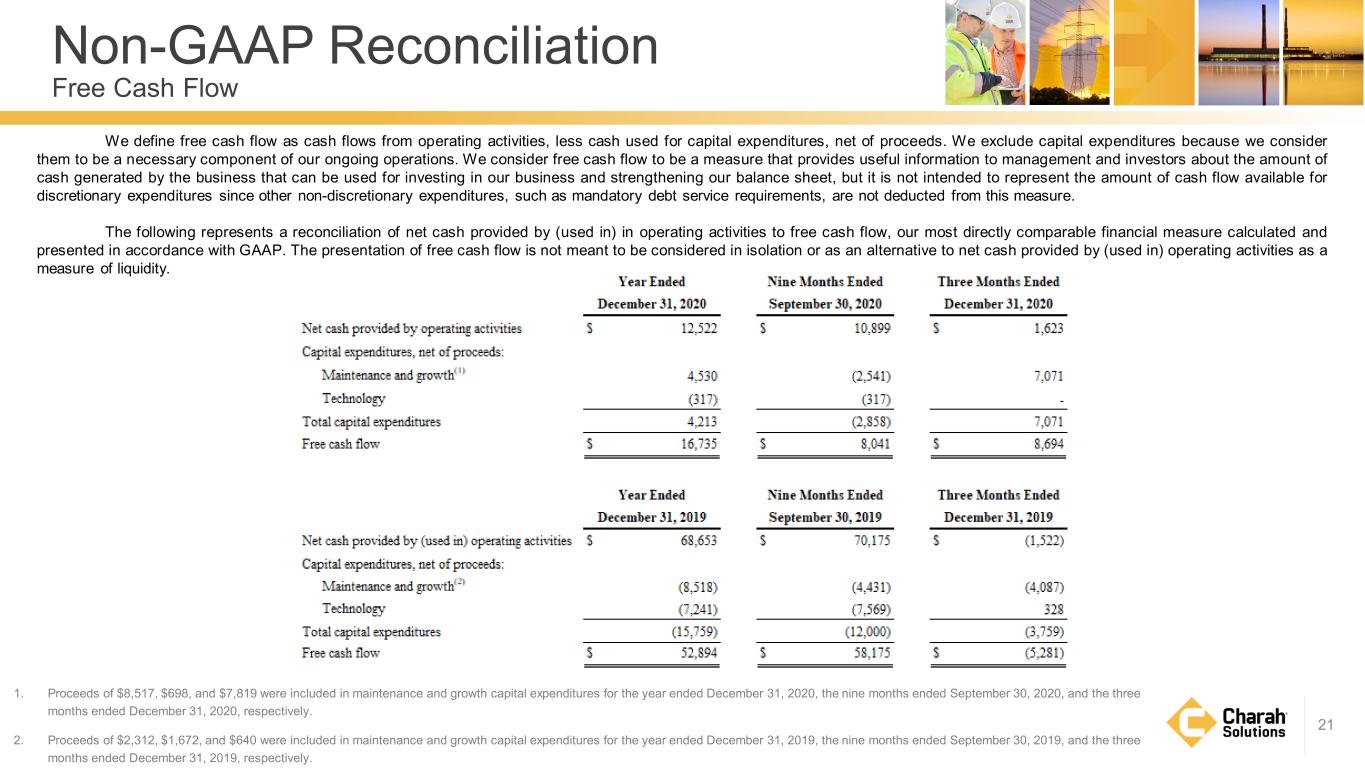
Non-GAAP Reconciliation Free Cash Flow 21 We define free cash flow as cash flows from operating activities, less cash used for capital expenditures, net of proceeds. We exclude capital expenditures because we consider them to be a necessary component of our ongoing operations. We consider free cash flow to be a measure that provides useful information to management and investors about the amount of cash generated by the business that can be used for investing in our business and strengthening our balance sheet, but it is not intended to represent the amount of cash flow available for discretionary expenditures since other non-discretionary expenditures, such as mandatory debt service requirements, are not deducted from this measure. The following represents a reconciliation of net cash provided by (used in) in operating activities to free cash flow, our most directly comparable financial measure calculated and presented in accordance with GAAP. The presentation of free cash flow is not meant to be considered in isolation or as an alternative to net cash provided by (used in) operating activities as a measure of liquidity. 1. Proceeds of $8,517, $698, and $7,819 were included in maintenance and growth capital expenditures for the year ended December 31, 2020, the nine months ended September 30, 2020, and the three months ended December 31, 2020, respectively. 2. Proceeds of $2,312, $1,672, and $640 were included in maintenance and growth capital expenditures for the year ended December 31, 2019, the nine months ended September 30, 2019, and the three months ended December 31, 2019, respectively.


