
Q4 and Year-End 2021 Earnings Call Presentation April 1, 2022 Exhibit 99.2
Forward-Looking Statements Forward-Looking Statements This presentation and our accompanying comments include “forward-looking statements” within the meaning of the Private Securities Litigation Reform Act of 1995. These forward-looking statements may be identified by words such as “may,” “will,” “expect,” “intend,” “anticipate,” “believe,” “estimate,” “plan,” “project,” “could,” “should,” “would,” “continue,” “seek,” “target,” “guidance,” “outlook,” “if current trends continue,” “optimistic,” “forecast” and other similar words. Such statements include, but are not limited to, statements about future financial and operating results, the Company’s plans, objectives, estimates, expectations, and intentions, estimates and strategies for the future, and other statements that are not historical facts. These forward-looking statements are based on our current objectives, beliefs and expectations, and they are subject to significant risks and uncertainties that may cause actual results and financial position and timing of certain events to differ materially from the information in the forward- looking statements. These risks and uncertainties include, but are not limited to, those set forth in the Company’s Annual Report on Form 10-K for the year ended December 31, 2021 filed on March 31, 2022 with the Securities and Exchange Commission (“SEC”) and in our other reports filed from time to time with the SEC. There may be other factors of which we are not currently aware that may affect matters discussed in the forward-looking statements and may also cause actual results to differ materially from those discussed. We do not assume any obligation to publicly update or supplement any forward-looking statement to reflect actual results, changes in assumptions or changes in other factors affecting these forward-looking statements other than as required by law. Any forward-looking statements speak only as of the date hereof or as of the dates indicated in the statements. Non-GAAP Financial Measures Included in this presentation are certain non-GAAP financial measures designed to complement the financial information presented in accordance with GAAP because management believes such measures are useful to investors. The non-GAAP financial measures are not determined in accordance with GAAP and should not be considered a substitute for performance measures determined in accordance with GAAP. The calculations of the non-GAAP financial measures are subjective, based on management’s belief as to which items should be included or excluded in order to provide the most reasonable and comparable view of the underlying operating performance of the business. We may, from time to time, modify the amounts used to determine our non-GAAP financial measures. Reconciliation of non-GAAP financial measures are included in the supplemental slides in the Appendix of this presentation. Market & Industry Data This presentation includes industry and trade data, forecasts and information that was prepared based, in part, upon data, forecasts and information obtained from independent trade associations, industry publications and surveys and other independent sources available to the Company. Some data also are based on the Company’s good faith estimates, which are derived from management’s knowledge of the industry and from independent sources. These third-party publications and surveys generally state that the information included therein has been obtained from sources believed to be reliable, but that the publications and surveys can give no assurance as to the accuracy or completeness of such information. The Company has not independently verified any of the data from third-party sources nor has it ascertained the underlying economic assumptions on which such data are based.

• Business Highlights (Scott Sewell, President and CEO) – Strong growth in new awards – Business update – ESG update • Financial Overview (Roger Shannon, CFO and Treasurer) – Fourth quarter and full-year 2021 financial review ▪ Revenue, gross profit, and Adjusted EBITDA ▪ Cash flow and Adjusted free cash flow – Balance sheet and Liquidity – 2022 guidance • Conclusion (Scott Sewell) • Appendix – Non-GAAP Reconciliations Agenda

Business Highlights
▪ $840 million in new awards for full-year 2021; exceeded full-year 2020 record of $715 million ▪ Currently have more than $3.1 billion of pending proposals and have identified nearly $7.5 billion of opportunities across our businesses ▪ The January 2022 EPA ruling and infrastructure legislation expand our addressable market, though the scope of the EPA ruling may delay the timing of bids expected to occur in the near-term ▪ Continued to grow our ERT business with the pending acquisitions of two additional projects ▪ Closed on the sale of nearly 80% of the real property acreage at our Gibbons Creek project in Texas for net cash proceeds of $23.6 million ▪ Successfully completed the first phase of the coal ash reclamation project for Dominion Energy ▪ In discussions for potential initial contract for EnviroSourceTM ash beneficiation technology ▪ Achieved substantially all our 1-year ESG objectives in the key areas of environmental performance, including sustainable land redevelopment, water, electricity and fuel consumption, and waste disposal as well as diversity and inclusion, and safety Business Highlights Full-year 2021
▪ Revenues increased $27.8 million as compared to Q4 2020 – Primarily due to: ▪ An increase in remediation and compliance services revenue from the commencement of new project work ▪ Partially offset by decreases in raw material sales and byproduct services ▪ Gross profit decreased $0.4 million as compared to Q4 2020 – Primarily due to a lower gross margin at certain remediation and compliance projects resulting from construction delays, supply chain issues and adverse weather ▪ Net income attributable to Charah Solutions, Inc. increased by $35.2 million as to compared to Q4 2020 – Primarily due to (i) non-recurrence of impairment expense; (ii) increases in gains on sales of real estate, property and equipment, net; and (iii) increased gain on ARO settlement at our Gibbons Creek ERT project – These positive drivers were partially offset by (i) the non-recurrence of a change in a contingent payment liability; (ii) other operating expenses from ERT services; (iii) increased interest expense from higher levels of debt; and (iv) increased general and administrative expense. ▪ Adjusted EBITDA1 increased by $11.6 million as compared to Q4 2020 Q4 2021 Financial Highlights 1. Please refer to the supplemental slides in the Appendix for a reconciliation of Adjusted EBITDA to the most directly comparable GAAP financial measure

▪ Revenues increased $60.8 million as compared to 2020 – Primarily due to: ▪ An increase in remediation and compliance services revenue from the commencement of new project work ▪ Partially offset by decreases in raw material sales driven by reduced supply from international sources and decreases in byproduct services revenue primarily due to the dissolution of our Ash Venture LLC joint venture ▪ Gross profit increased $3.1 million as compared to 2020 – Primarily due to increased revenues, partially offset by a lower gross profit margin percentage – Lower gross profit margin driven by issues at certain remediation and compliance projects ▪ Net loss attributable to Charah Solutions, Inc. decreased by $50.0 million as to compared to 2020 – Primarily due to (i) a decrease in impairment expense; (ii) gains on sales of real estate, property and equipment, net; (iii) gain on a sales-type lease; (iv) gain on ARO settlement; and (v) an increase in gross profit: – These positive drivers were partially offset by the non-recurrence of the gain on change in contingent payment liability and increases in general and administrative expenses and other operating expenses from ERT services ▪ Adjusted EBITDA1 increased by $25.8 million as compared to 2020 Full-year 2021 Financial Highlights 1. Please refer to the supplemental slides in the Appendix for a reconciliation of Adjusted EBITDA to the most directly comparable GAAP financial measure
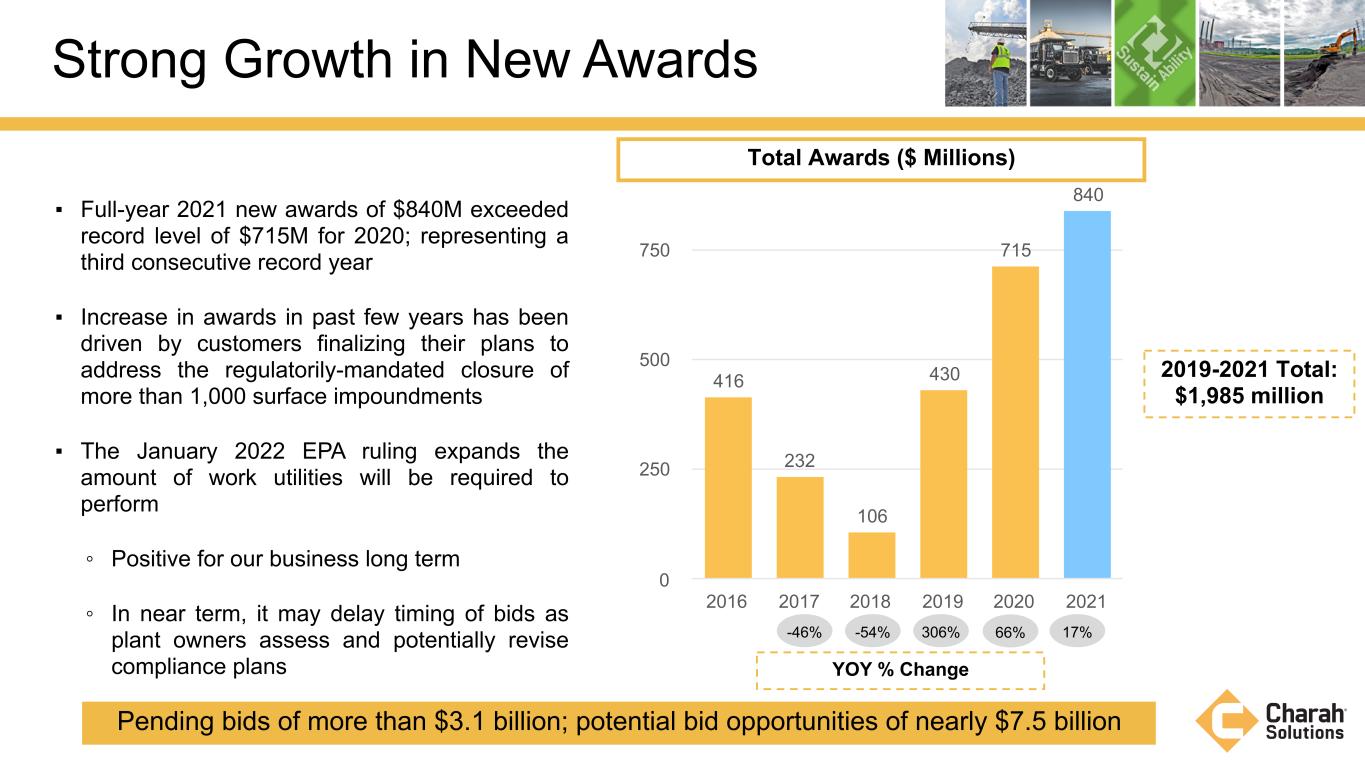
▪ Full-year 2021 new awards of $840M exceeded record level of $715M for 2020; representing a third consecutive record year ▪ Increase in awards in past few years has been driven by customers finalizing their plans to address the regulatorily-mandated closure of more than 1,000 surface impoundments ▪ The January 2022 EPA ruling expands the amount of work utilities will be required to perform ◦ Positive for our business long term ◦ In near term, it may delay timing of bids as plant owners assess and potentially revise compliance plans Strong Growth in New Awards Total Awards ($ Millions) 66% Pending bids of more than $3.1 billion; potential bid opportunities of nearly $7.5 billion 416 232 106 430 715 840 2016 2017 2018 2019 2020 2021 0 250 500 750 17%-46% -54% 306% YOY % Change 2019-2021 Total: $1,985 million

2021 Financial Overview
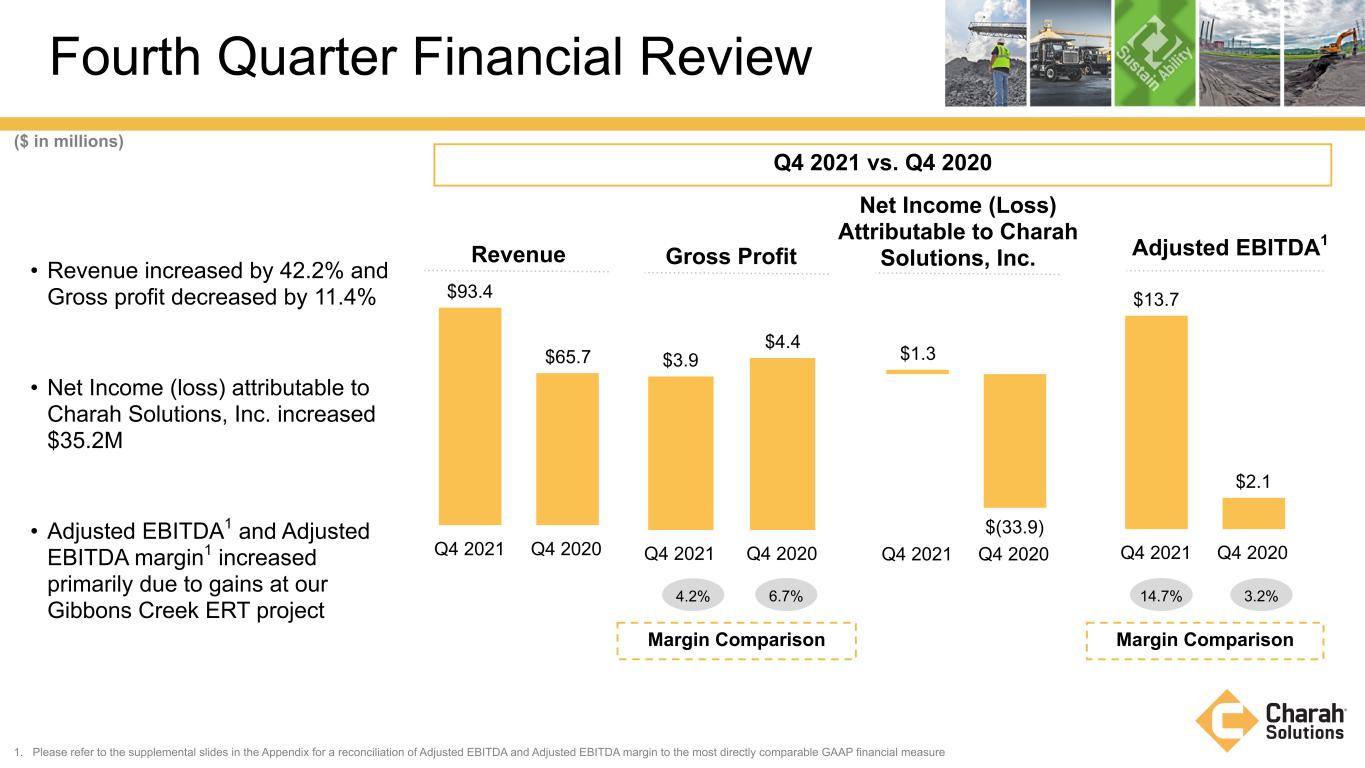
• Revenue increased by 42.2% and Gross profit decreased by 11.4% • Net Income (loss) attributable to Charah Solutions, Inc. increased $35.2M • Adjusted EBITDA1 and Adjusted EBITDA margin1 increased primarily due to gains at our Gibbons Creek ERT project 1. Please refer to the supplemental slides in the Appendix for a reconciliation of Adjusted EBITDA and Adjusted EBITDA margin to the most directly comparable GAAP financial measure Fourth Quarter Financial Review Q4 2021 vs. Q4 2020 3.2%14.7%6.7%4.2% Margin Comparison ($ in millions) Margin Comparison Adjusted EBITDA1 Revenue $93.4 $65.7 Q4 2021 Q4 2020 Gross Profit $3.9 $4.4 Q4 2021 Q4 2020 $1.3 $(33.9) Q4 2021 Q4 2020 Net Income (Loss) Attributable to Charah Solutions, Inc. $13.7 $2.1 Q4 2021 Q4 2020
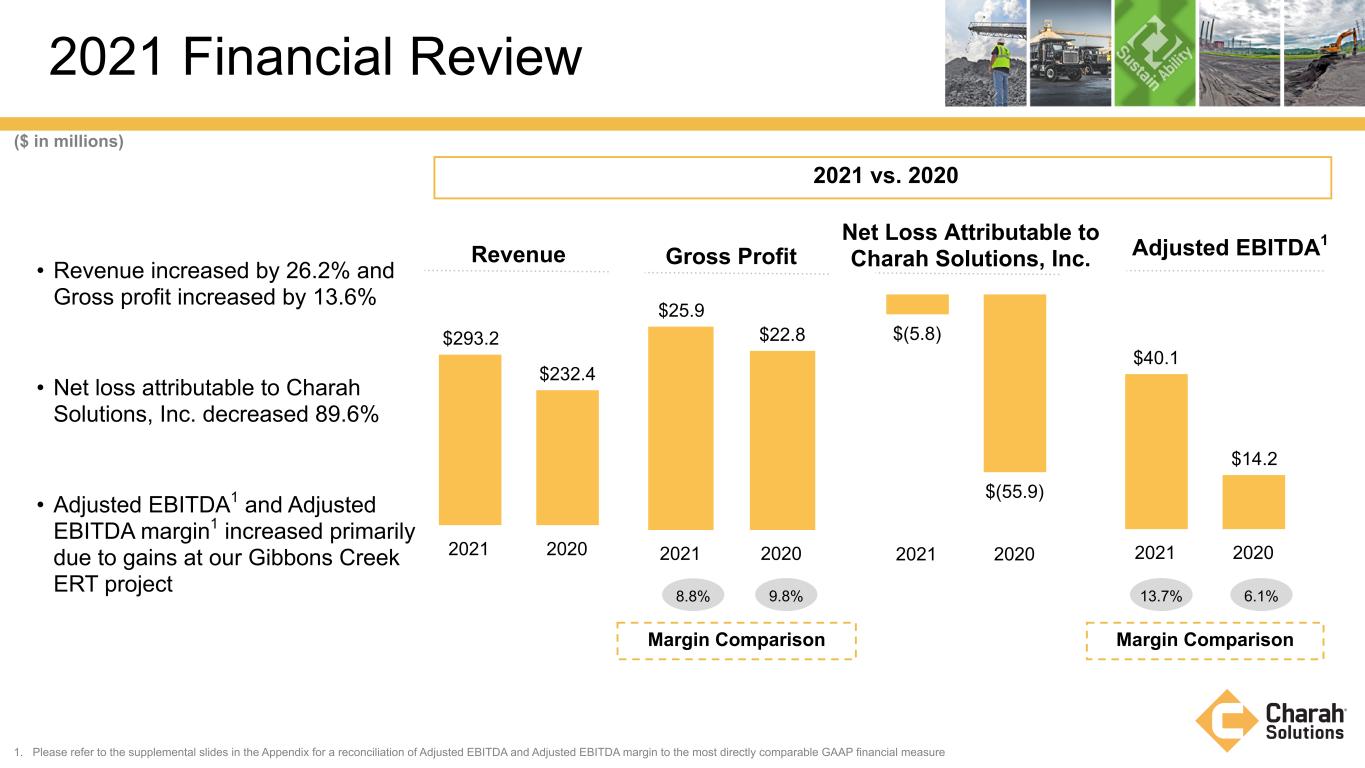
1. Please refer to the supplemental slides in the Appendix for a reconciliation of Adjusted EBITDA and Adjusted EBITDA margin to the most directly comparable GAAP financial measure 2021 Financial Review 2021 vs. 2020 6.1%13.7%9.8%8.8% Margin Comparison ($ in millions) Margin Comparison Adjusted EBITDA1 Revenue $293.2 $232.4 2021 2020 Gross Profit $25.9 $22.8 2021 2020 $(5.8) $(55.9) 2021 2020 Net Loss Attributable to Charah Solutions, Inc. $40.1 $14.2 2021 2020 • Revenue increased by 26.2% and Gross profit increased by 13.6% • Net loss attributable to Charah Solutions, Inc. decreased 89.6% • Adjusted EBITDA1 and Adjusted EBITDA margin1 increased primarily due to gains at our Gibbons Creek ERT project
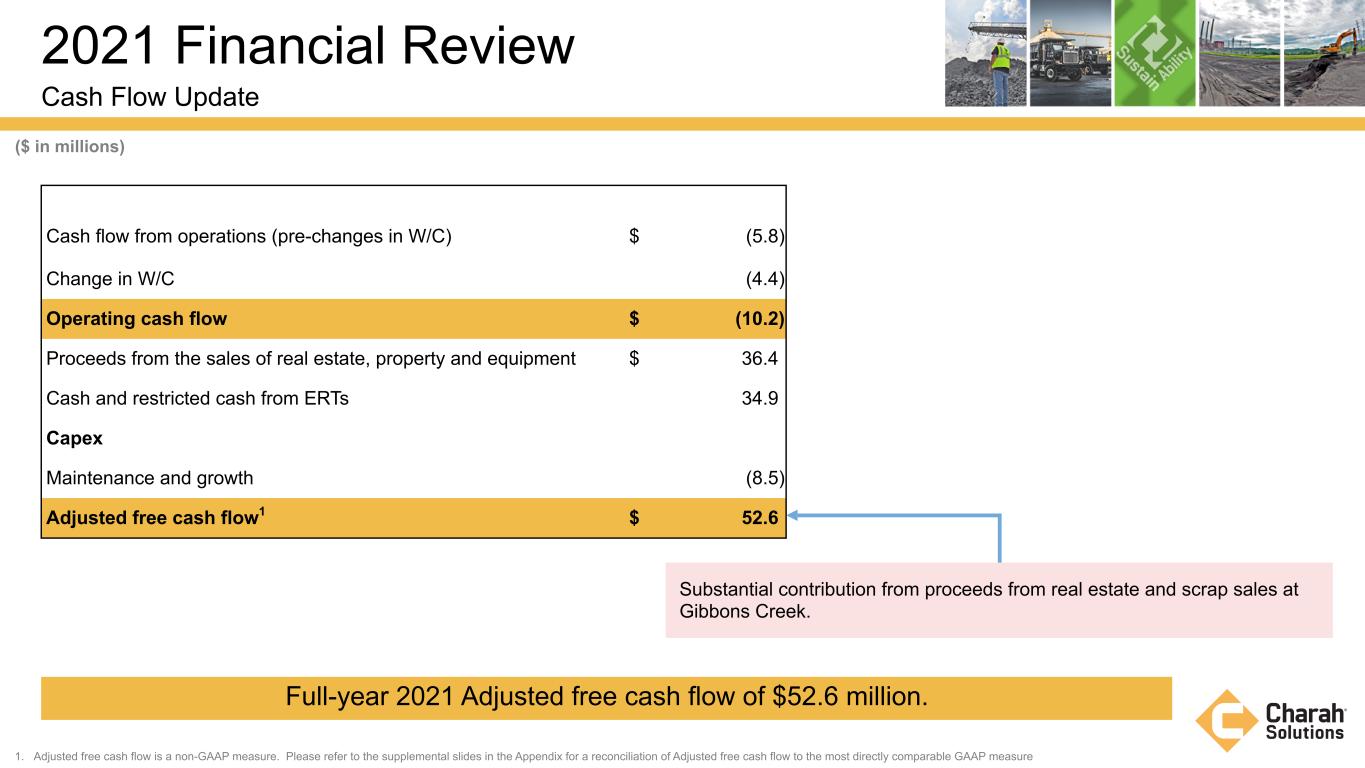
2021 Financial Review Cash Flow Update Cash flow from operations (pre-changes in W/C) $ (5.8) Change in W/C (4.4) Operating cash flow $ (10.2) Proceeds from the sales of real estate, property and equipment $ 36.4 Cash and restricted cash from ERTs 34.9 Capex Maintenance and growth (8.5) Adjusted free cash flow1 $ 52.6 ($ in millions) 1. Adjusted free cash flow is a non-GAAP measure. Please refer to the supplemental slides in the Appendix for a reconciliation of Adjusted free cash flow to the most directly comparable GAAP measure Full-year 2021 Adjusted free cash flow of $52.6 million. Substantial contribution from proceeds from real estate and scrap sales at Gibbons Creek.
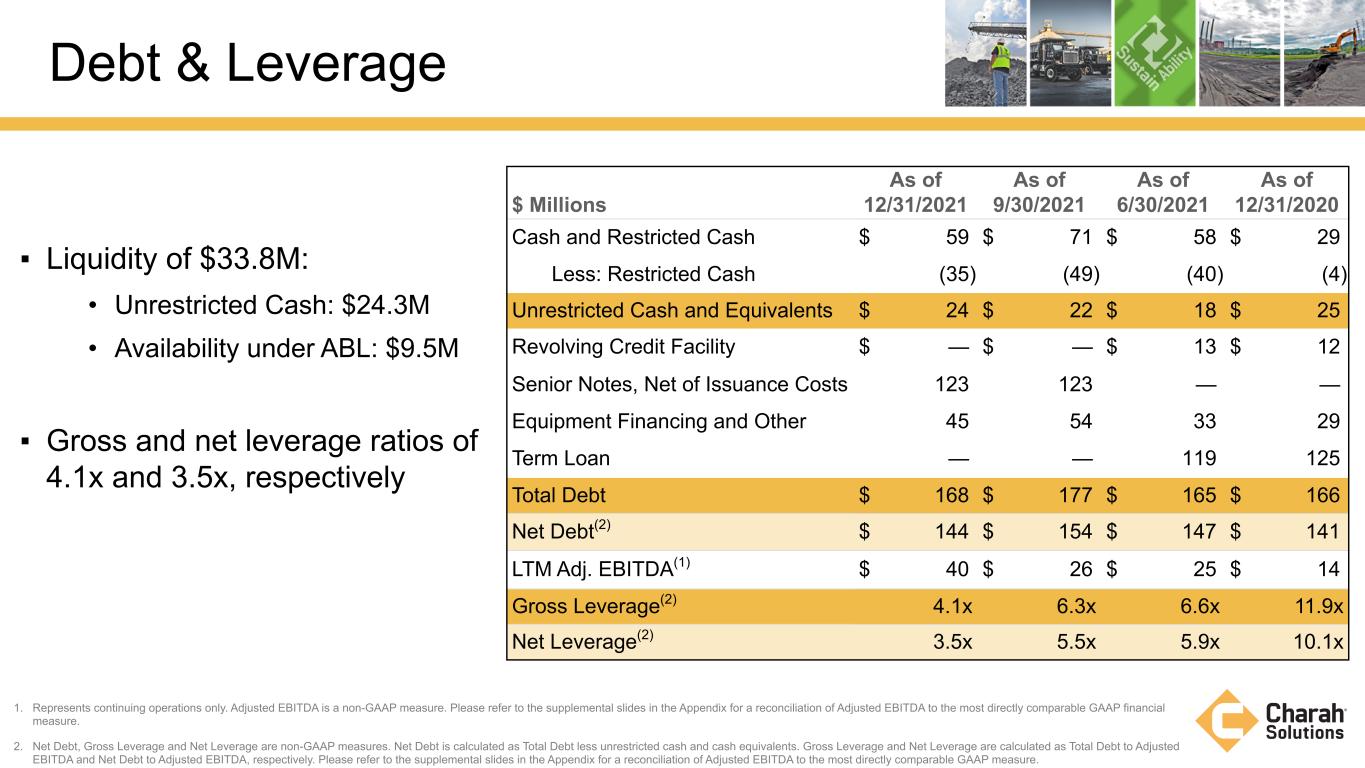
▪ Liquidity of $33.8M: • Unrestricted Cash: $24.3M • Availability under ABL: $9.5M ▪ Gross and net leverage ratios of 4.1x and 3.5x, respectively 1. Represents continuing operations only. Adjusted EBITDA is a non-GAAP measure. Please refer to the supplemental slides in the Appendix for a reconciliation of Adjusted EBITDA to the most directly comparable GAAP financial measure. 2. Net Debt, Gross Leverage and Net Leverage are non-GAAP measures. Net Debt is calculated as Total Debt less unrestricted cash and cash equivalents. Gross Leverage and Net Leverage are calculated as Total Debt to Adjusted EBITDA and Net Debt to Adjusted EBITDA, respectively. Please refer to the supplemental slides in the Appendix for a reconciliation of Adjusted EBITDA to the most directly comparable GAAP measure. $ Millions As of 12/31/2021 As of 9/30/2021 As of 6/30/2021 As of 12/31/2020 Cash and Restricted Cash $ 59 $ 71 $ 58 $ 29 Less: Restricted Cash (35) (49) (40) (4) Unrestricted Cash and Equivalents $ 24 $ 22 $ 18 $ 25 Revolving Credit Facility $ — $ — $ 13 $ 12 Senior Notes, Net of Issuance Costs 123 123 — — Equipment Financing and Other 45 54 33 29 Term Loan — — 119 125 Total Debt $ 168 $ 177 $ 165 $ 166 Net Debt(2) $ 144 $ 154 $ 147 $ 141 LTM Adj. EBITDA(1) $ 40 $ 26 $ 25 $ 14 Gross Leverage(2) 4.1x 6.3x 6.6x 11.9x Net Leverage(2) 3.5x 5.5x 5.9x 10.1x Debt & Leverage
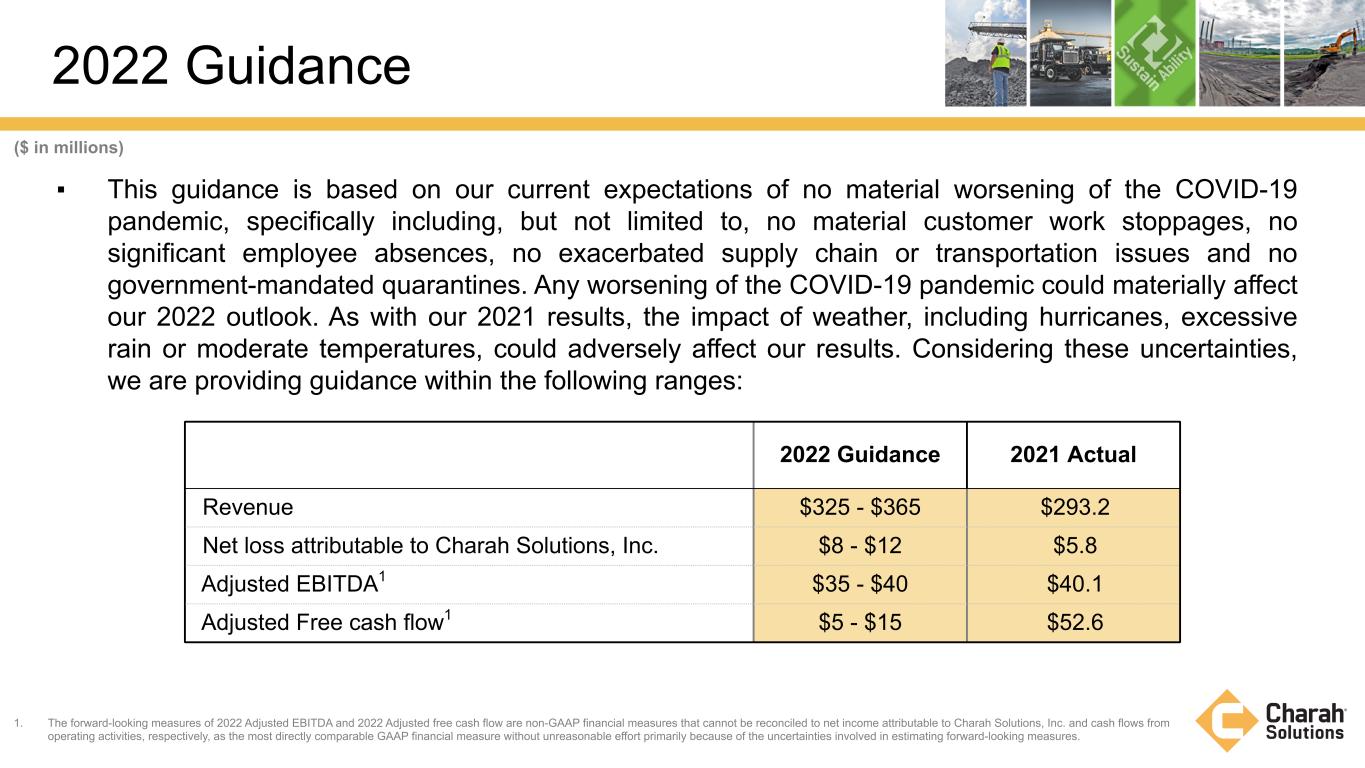
2022 Guidance 2022 Guidance 2021 Actual Revenue $325 - $365 $293.2 Net loss attributable to Charah Solutions, Inc. $8 - $12 $5.8 Adjusted EBITDA1 $35 - $40 $40.1 Adjusted Free cash flow1 $5 - $15 $52.6 ($ in millions) ▪ This guidance is based on our current expectations of no material worsening of the COVID-19 pandemic, specifically including, but not limited to, no material customer work stoppages, no significant employee absences, no exacerbated supply chain or transportation issues and no government-mandated quarantines. Any worsening of the COVID-19 pandemic could materially affect our 2022 outlook. As with our 2021 results, the impact of weather, including hurricanes, excessive rain or moderate temperatures, could adversely affect our results. Considering these uncertainties, we are providing guidance within the following ranges: 1. The forward-looking measures of 2022 Adjusted EBITDA and 2022 Adjusted free cash flow are non-GAAP financial measures that cannot be reconciled to net income attributable to Charah Solutions, Inc. and cash flows from operating activities, respectively, as the most directly comparable GAAP financial measure without unreasonable effort primarily because of the uncertainties involved in estimating forward-looking measures.
APPENDIX

Non-GAAP Reconciliation Adjusted EBITDA and Adjusted EBITDA Margin 1. Represents amounts for continuing operations only. 2. Represents expenses associated with the Amendment to the Credit Facility, non-recurring legal costs and expenses and other miscellaneous items. 3. Adjusted EBITDA margin is a non-GAAP financial measure that represents the ratio of Adjusted EBITDA to total revenue. We use Adjusted EBITDA margin to measure the success of our businesses in managing our cost base and improving profitability. Adjusted EBITDA and Adjusted EBITDA margin are not financial measures determined in accordance with GAAP. Charah Solutions defines Adjusted EBITDA as net earnings attributable to Charah Solutions, Inc. before income from discontinued operations, net of tax, loss on extinguishment of debt, impairment expense, gain on change in contingent payment liability, interest expense, income taxes, depreciation and amortization, equity-based compensation, and transaction-related expenses and other items. Adjusted EBITDA margin represents the ratio of Adjusted EBITDA to total revenue. The following represents a reconciliation of net loss attributable to Charah Solutions, Inc., our most directly comparable financial measure calculated and presented in accordance with GAAP, to Adjusted EBITDA. Three Months Ended December 31, Year Ended December 31, 2021 2020 2021 2020 (in thousands) Net income (loss) attributable to Charah Solutions, Inc. $ 1,316 $ (33,861) $ (5,814) $ (55,863) Income from discontinued operations, net of tax — (1,944) — (8,883) Interest expense, net(1) 5,137 3,732 15,227 13,774 Loss on extinguishment of debt(1) — — 638 8,603 Impairment expense(1) — 38,173 827 44,572 Gain on change in contingent payment liability(1) — (9,702) — (9,702) Income tax expense (benefit)(1) 229 (1,522) 661 (914) Depreciation and amortization(1) 6,034 6,568 24,612 19,131 Equity-based compensation(1)(2) 935 593 2,702 2,394 Transaction-related expenses and other items(1) 45 42 1,219 1,130 Adjusted EBITDA $ 13,696 $ 2,079 $ 40,072 $ 14,242 Adjusted EBITDA margin(3) 14.7 % 3.8 % 13.7 % 6.1 %
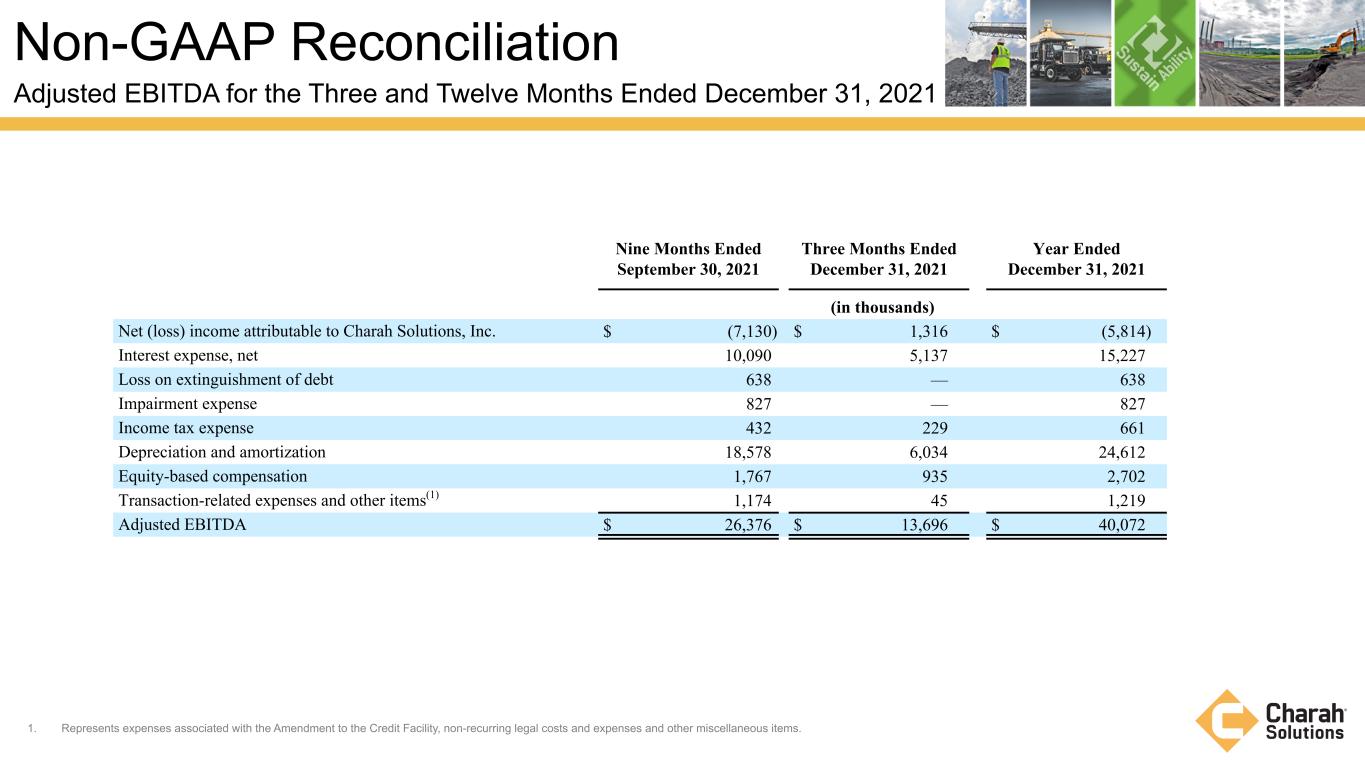
Non-GAAP Reconciliation Adjusted EBITDA for the Three and Twelve Months Ended December 31, 2021 Nine Months Ended September 30, 2021 Three Months Ended December 31, 2021 Year Ended December 31, 2021 (in thousands) Net (loss) income attributable to Charah Solutions, Inc. $ (7,130) $ 1,316 $ (5,814) Interest expense, net 10,090 5,137 15,227 Loss on extinguishment of debt 638 — 638 Impairment expense 827 — 827 Income tax expense 432 229 661 Depreciation and amortization 18,578 6,034 24,612 Equity-based compensation 1,767 935 2,702 Transaction-related expenses and other items(1) 1,174 45 1,219 Adjusted EBITDA $ 26,376 $ 13,696 $ 40,072 1. Represents expenses associated with the Amendment to the Credit Facility, non-recurring legal costs and expenses and other miscellaneous items.

Non-GAAP Reconciliation Adjusted Net Loss and Adjusted Loss Per Basic/Diluted Share 1. Represents expenses associated with the Amendment to the Credit Facility, severance costs and other miscellaneous items. 2. Represents the effective tax rate of 14.9% and 4.1% for the three months ended December 31, 2021 and 2020 respectively and (12.9)% and 1.4% for the year ended December 31, 2021 and 2020, respectively, multiplied by adjusted net loss before income taxes attributable to common stockholders. 3. As a a result of the adjusted net loss per share for the three months and year ended December 31, 2021 and 2020, the inclusion of all potentially dilutive shares would be anti-dilutive. Therefore, dilutive shares (in thousands) of 12,740 and 1,558 were excluded from the computation of the weighted-average shares for diluted adjusted net loss per share for the three months ended December 31, 2021 and 2020, respectively, and dilutive shares (in thousands) of 12,234 and 1,510 were excluded from the computation of the weighted-average shares for diluted adjusted net loss per share for the years ended, December 31, 2021 and 2020, respectively. Adjusted net loss attributable to common stockholders and Adjusted loss per basic/diluted share are not financial measures determined in accordance with GAAP. Charah Solutions defines Adjusted net loss attributable to common stockholders as net loss as net loss attributable to common stockholders less, on a post-tax basis, income from discontinued operations, net of tax, and gain on change in contingent payment liability and plus, on a post-tax basis, loss on extinguishment of debt, impairment expense, and transaction-related expenses and other items. The following represents a reconciliation of net loss attributable to common stockholders, our most directly comparable financial measure calculated and presented in accordance with GAAP, to Adjusted net loss attributable to common stockholders and Adjusted loss per basic/diluted share. Three Months Ended Year Ended December 31, December 31, 2021 2020 2021 2020 Net loss attributable to common stockholders $ (828) $ (36,226) $ (14,562) $ (60,388) Income from discontinued operations, net of tax — (1,944) — (8,883) Income tax expense (benefit) 229 (1,522) 661 (914) Loss on extinguishment of debt — — 638 8,603 Impairment expense — 38,173 827 44,572 Gain on change in contingent payment liability — (9,702) — (9,702) Transaction-related expenses and other items(1) 45 42 1,219 1,130 Adjusted loss before income taxes attributable to common stockholders (554) (11,179) (11,217) (25,582) Adjusted income tax (expense) benefit(2) (83) 458 (1,444) 358 Adjusted net loss attributable to common stockholders (637) (10,721) (12,661) (25,224) Weighted average basic/diluted share count(3) 33,408 30,030 31,573 29,897 Adjusted loss per diluted share $ (0.02) $ (0.36) $ (0.40) $ (0.84)
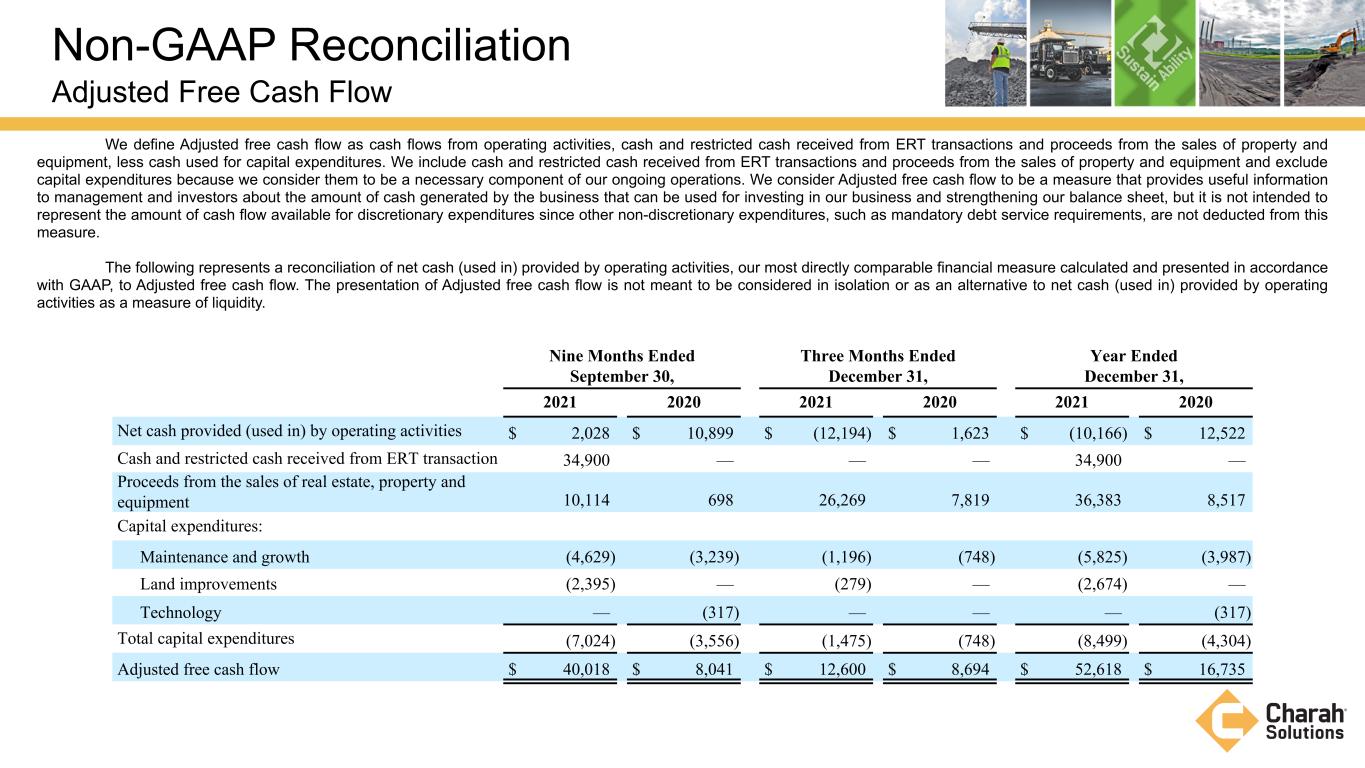
Non-GAAP Reconciliation Adjusted Free Cash Flow We define Adjusted free cash flow as cash flows from operating activities, cash and restricted cash received from ERT transactions and proceeds from the sales of property and equipment, less cash used for capital expenditures. We include cash and restricted cash received from ERT transactions and proceeds from the sales of property and equipment and exclude capital expenditures because we consider them to be a necessary component of our ongoing operations. We consider Adjusted free cash flow to be a measure that provides useful information to management and investors about the amount of cash generated by the business that can be used for investing in our business and strengthening our balance sheet, but it is not intended to represent the amount of cash flow available for discretionary expenditures since other non-discretionary expenditures, such as mandatory debt service requirements, are not deducted from this measure. The following represents a reconciliation of net cash (used in) provided by operating activities, our most directly comparable financial measure calculated and presented in accordance with GAAP, to Adjusted free cash flow. The presentation of Adjusted free cash flow is not meant to be considered in isolation or as an alternative to net cash (used in) provided by operating activities as a measure of liquidity. Nine Months Ended Three Months Ended Year Ended September 30, December 31, December 31, 2021 2020 2021 2020 2021 2020 Net cash provided (used in) by operating activities $ 2,028 $ 10,899 $ (12,194) $ 1,623 $ (10,166) $ 12,522 Cash and restricted cash received from ERT transaction 34,900 — — — 34,900 — Proceeds from the sales of real estate, property and equipment 10,114 698 26,269 7,819 36,383 8,517 Capital expenditures: Maintenance and growth (4,629) (3,239) (1,196) (748) (5,825) (3,987) Land improvements (2,395) — (279) — (2,674) — Technology — (317) — — — (317) Total capital expenditures (7,024) (3,556) (1,475) (748) (8,499) (4,304) Adjusted free cash flow $ 40,018 $ 8,041 $ 12,600 $ 8,694 $ 52,618 $ 16,735

1. Represents amounts for continuing operations only. Q1 2021 Q2 2021 Q3 2021 Q4 2021 Full-year 2021 (in thousands) Byproduct services $ 26,473 $ 23,392 $ 26,878 $ 24,612 $ 101,355 Construction contracts 19,939 31,713 48,176 60,804 160,632 Raw material sales 5,695 8,413 9,107 8,017 31,232 Total revenue $ 52,107 $ 63,518 $ 84,161 $ 93,433 $ 293,219 Total gross profit $ 5,585 $ 6,920 $ 9,449 $ 3,944 $ 25,898 Q1 2020 Q2 2020 Q3 2020 Q4 2020 Full-year 2020 (in thousands) Byproduct services $ 22,870 $ 23,950 $ 31,220 $ 28,663 $ 106,703 Construction contracts 14,847 15,347 21,590 29,021 80,805 Raw material sales 13,560 13,007 10,306 7,996 44,869 Total revenue $ 51,277 $ 52,304 $ 63,116 $ 65,680 $ 232,377 Total gross profit $ 4,895 $ 5,206 $ 8,334 $ 4,372 $ 22,807 Revenue(1) and Gross Profit(1) by Quarter
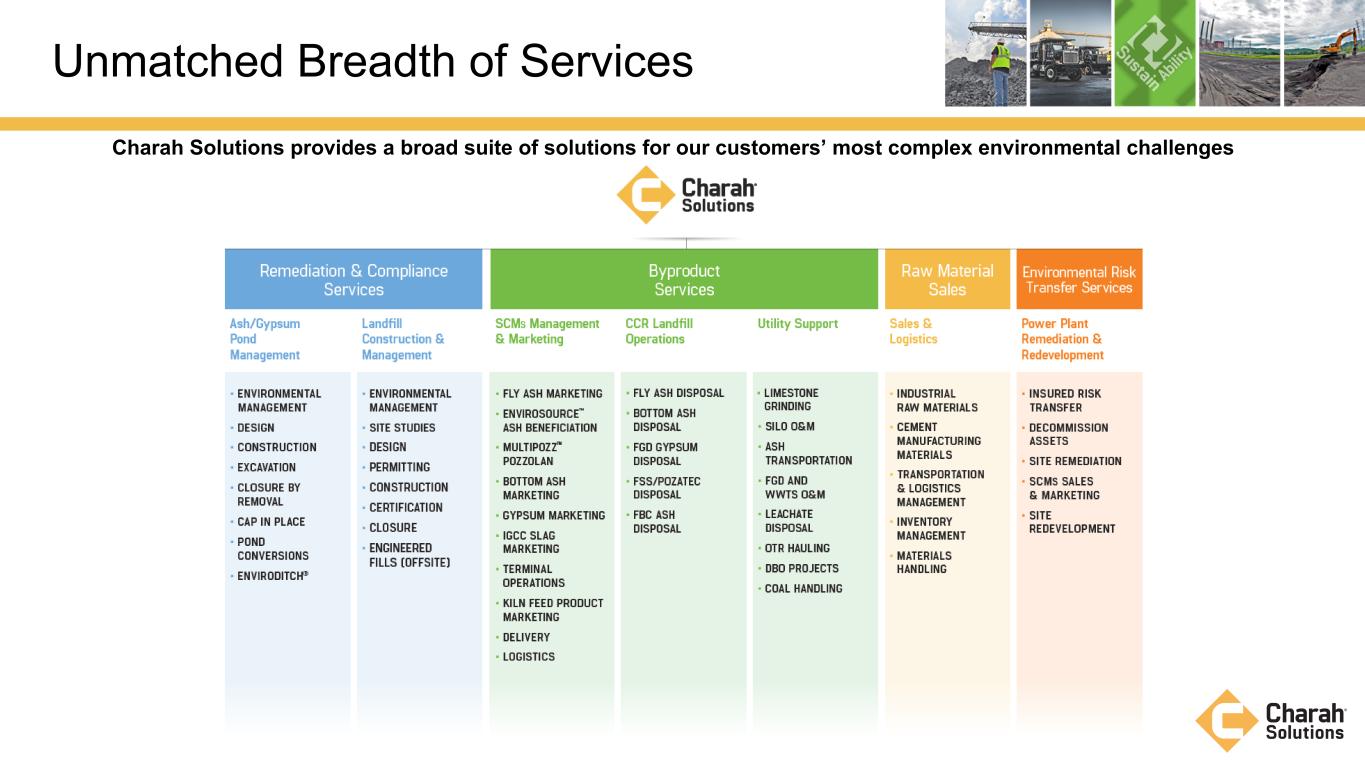
Unmatched Breadth of Services Charah Solutions provides a broad suite of solutions for our customers’ most complex environmental challenges


