
Q3 2022 Investor Presentation As of November 15, 2022 Exhibit 99.2
Forward-Looking Statements Forward-Looking Statements This presentation and our accompanying comments include “forward-looking statements” within the meaning of the Private Securities Litigation Reform Act of 1995. These forward-looking statements may be identified by words such as “may,” “will,” “expect,” “intend,” “anticipate,” “believe,” “estimate,” “plan,” “project,” “could,” “should,” “would,” “continue,” “seek,” “target,” “guidance,” “outlook,” “if current trends continue,” “optimistic,” “forecast” and other similar words. Such statements include, but are not limited to, statements about future financial and operating results, the Company’s plans, objectives, estimates, expectations, and intentions, estimates and strategies for the future, and other statements that are not historical facts. These forward-looking statements are based on our current objectives, beliefs and expectations, and they are subject to significant risks and uncertainties that may cause actual results and financial position and timing of certain events to differ materially from the information in the forward-looking statements. These risks and uncertainties include, but are not limited to, those set forth in the Company’s Annual Report on Form 10-K for the year ended December 31, 2021 filed on March 31, 2022 with the Securities and Exchange Commission (“SEC”) and in our other reports filed from time to time with the SEC. There may be other factors of which we are not currently aware that may affect matters discussed in the forward-looking statements and may also cause actual results to differ materially from those discussed. We do not assume any obligation to publicly update or supplement any forward-looking statement to reflect actual results, changes in assumptions or changes in other factors affecting these forward-looking statements other than as required by law. Any forward-looking statements speak only as of the date hereof or as of the dates indicated in the statements. Non-GAAP Financial Measures Included in this presentation are certain non-GAAP financial measures designed to complement the financial information presented in accordance with GAAP because management believes such measures are useful to investors. The non-GAAP financial measures are not determined in accordance with GAAP and should not be considered a substitute for performance measures determined in accordance with GAAP. The calculations of the non-GAAP financial measures are subjective, based on management’s belief as to which items should be included or excluded in order to provide the most reasonable and comparable view of the underlying operating performance of the business. We may, from time to time, modify the items used to determine our non-GAAP financial measures. Reconciliation of non-GAAP financial measures are included in the supplemental slides in the Appendix of this presentation. Market & Industry Data This presentation includes industry and trade data, forecasts and information that was prepared based, in part, upon data, forecasts and information obtained from independent trade associations, industry publications and surveys and other independent sources available to the Company. Some data also are based on the Company’s good faith estimates, which are derived from management’s knowledge of the industry and from independent sources. These third-party publications and surveys generally state that the information included therein has been obtained from sources believed to be reliable, but that the publications and surveys can give no assurance as to the accuracy or completeness of such information. The Company has not independently verified any of the data from third-party sources nor has it ascertained the underlying economic assumptions on which such data are based.
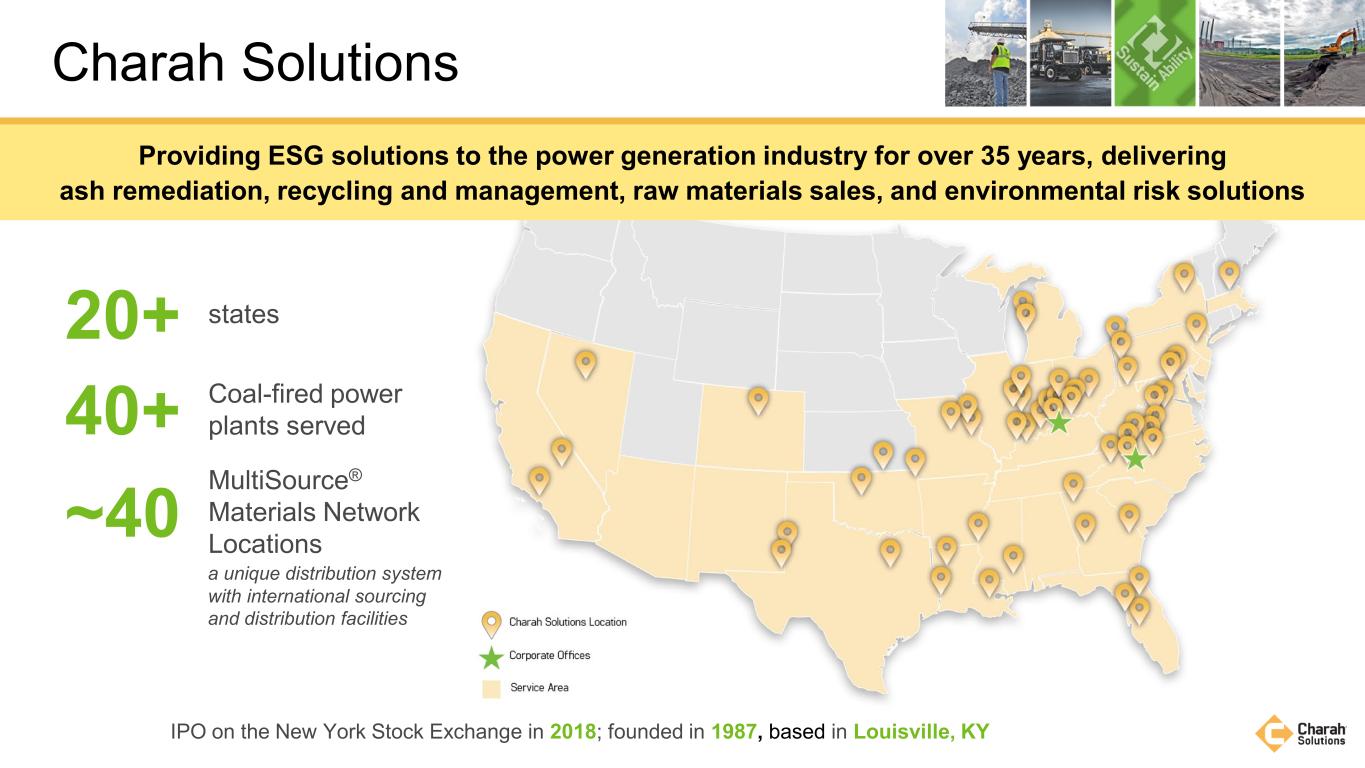
Charah Solutions Providing ESG solutions to the power generation industry for over 35 years, delivering ash remediation, recycling and management, raw materials sales, and environmental risk solutions IPO on the New York Stock Exchange in 2018; founded in 1987, based in Louisville, KY 20+ states 40+ Coal-fired power plants served ~40 MultiSource® Materials Network Locations a unique distribution system with international sourcing and distribution facilities

ESG Solutions for Utilities Remediation & Compliance Environmental Risk Transfer (ERT) Byproduct Services Raw Material Sales Ash pond and landfill design and other multi-year environmental improvement and sustainability initiatives driven by regulators, customers or consumer expectations Coal ash management solutions for coal plants, including sales and marketing of coal ash as an environmentally-sustainable replacement for Portland cement EnviroSourceSM fly ash beneficiation technology Sale of derivative raw materials from generation asset operations; includes sourcing, logistics and materials management to facilitate delivery of raw materials worldwide Addresses environmental remediation and compliance requirements associated with customer plant decommissioning and closure; results in formerly unusable land being made ready for redevelopment and sale Providing a Broad Suite of Solutions to Address Our Customers Most Complex Environmental Challenges
Fortified balance sheet to support future growth Completed certain legacy loss projects Implementing processes to improve commercial and operational rigor and oversight Increased new contract awards by $42M from mid-August to mid-November Strengthened leadership team Chair Bob Decensi: BHI Energy, Northeast Utilities, Dominion Energy, Connecticut L&P, Entergy and more Director Bill Varner: Select Interior Concepts, United Subcontractors, Inc., Aquilex Corporation, and more CEO Jonathan Batarseh: Brown & Root Industrial Services, KBR, The Shaw Group, Atkins and KPMG CFO Joe Skidmore: Charah Solutions and KPMG Recent Highlights
Financing & Liquidity On Nov. 14, 2022, entered agreements: $30M in gross proceeds private placement Selling 30,000 Series B Preferred Stock, par value $0.01 per share $28.8M net proceeds with 4% Original Issue Discount Investment fund affiliated with Bernhard Capital Partners Binding agreement to convert outstanding loans of $20M and applicable fees and accrued interest under the Term Loan Agreement into equity interests in the remaining real estate associated with Cheswick and Gibbons Creek

ESG: Core to Our Business Reducing Our Customers’ Environmental Impact and Increasing Their Sustainability of Operations Are Central to Everything Charah Solutions Does Class C and Class F fly ash is beneficially used by ready mix concrete producers to make concrete. Structural fill projects in which the land is reclaimed for reuse. Raw gypsum byproduct is beneficially used in the production of drywall. Raw gypsum byproduct beneficially used by growers as agriculture fertilizer. Dry Fly Ash for Ready Mix Concrete Conditioned Fly Ash for Structural Fill Gypsum For Ag Fertilizer Byproducts Recycle/Reuse Remediation Recycled Steel for Industrial Use Remediating Pond Land Reuse Land Remediating Redevelopment Ash Pond Management Steel from the plant is recycled and beneficially used to produce products for the automotive, construction, and other industries. Upon ash pond closure by removal of the ash pond, the land is remediated and redeveloped for community use or other industrial redevelopment opportunities. Design, construction, operation, and remediation of onsite ash ponds to enable the safe and compliant beneficial use of these byproduct materials. Upon demolition of the plant, the land is remediated and redeveloped for community use or other industrial redevelopment opportunities. Gypsum For Drywall
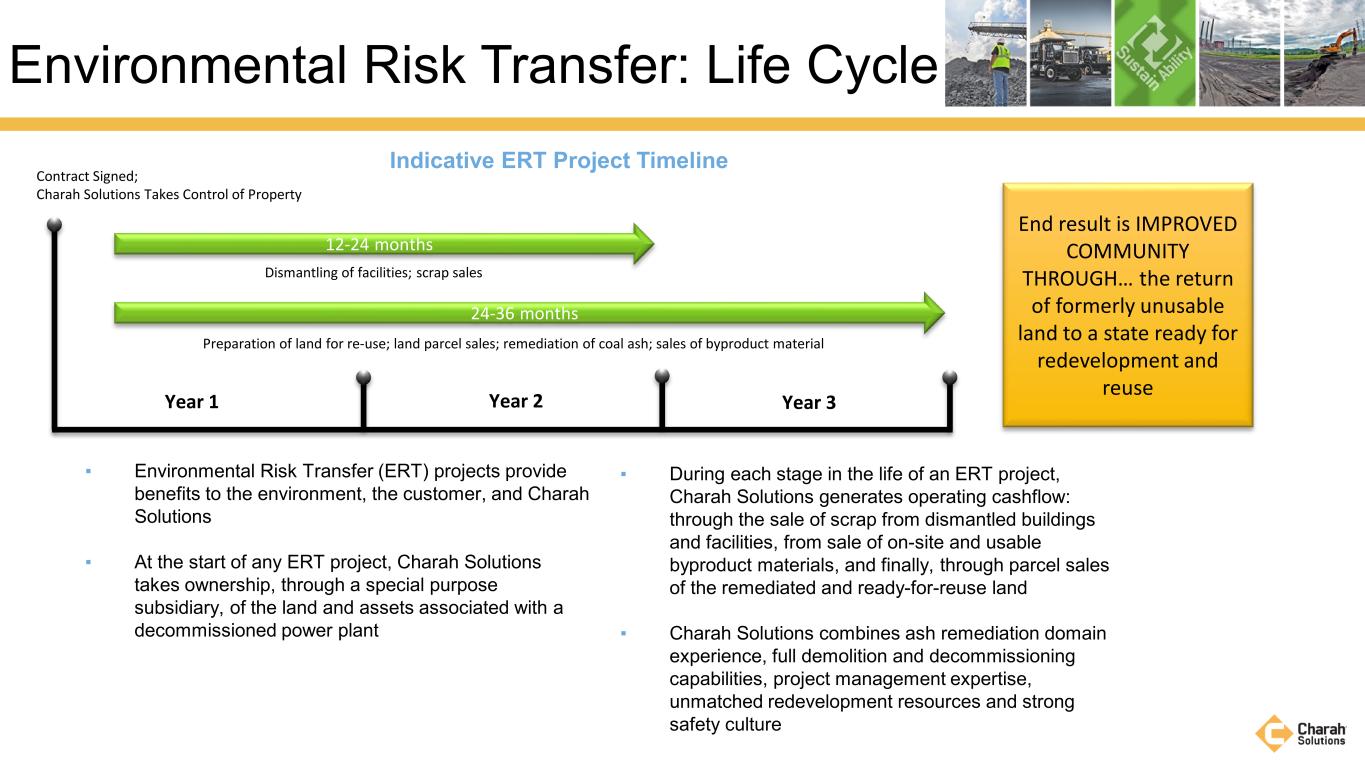
▪ Environmental Risk Transfer (ERT) projects provide benefits to the environment, the customer, and Charah Solutions ▪ At the start of any ERT project, Charah Solutions takes ownership, through a special purpose subsidiary, of the land and assets associated with a decommissioned power plant Environmental Risk Transfer: Life Cycle Indicative ERT Project Timeline ▪ During each stage in the life of an ERT project, Charah Solutions generates operating cashflow: through the sale of scrap from dismantled buildings and facilities, from sale of on-site and usable byproduct materials, and finally, through parcel sales of the remediated and ready-for-reuse land ▪ Charah Solutions combines ash remediation domain experience, full demolition and decommissioning capabilities, project management expertise, unmatched redevelopment resources and strong safety culture 12-24 months Contract Signed; Charah Solutions Takes Control of Property Dismantling of facilities; scrap sales 24-36 months Preparation of land for re-use; land parcel sales; remediation of coal ash; sales of byproduct material End result is IMPROVED COMMUNITY THROUGH… the return of formerly unusable land to a state ready for redevelopment and reuse Year 1 Year 2 Year 3
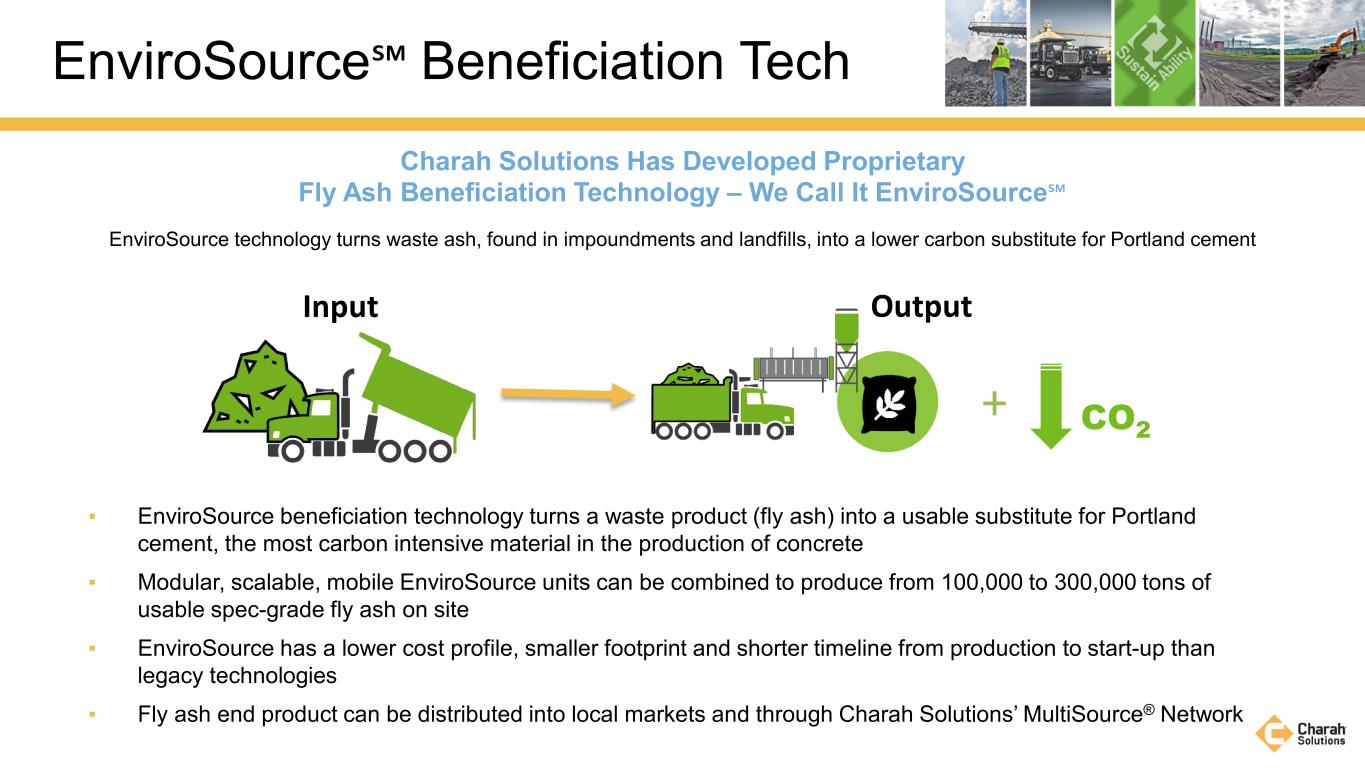
▪ EnviroSource beneficiation technology turns a waste product (fly ash) into a usable substitute for Portland cement, the most carbon intensive material in the production of concrete ▪ Modular, scalable, mobile EnviroSource units can be combined to produce from 100,000 to 300,000 tons of usable spec-grade fly ash on site ▪ EnviroSource has a lower cost profile, smaller footprint and shorter timeline from production to start-up than legacy technologies ▪ Fly ash end product can be distributed into local markets and through Charah Solutions’ MultiSource® Network EnviroSource℠ Beneficiation Tech EnviroSource technology turns waste ash, found in impoundments and landfills, into a lower carbon substitute for Portland cement Charah Solutions Has Developed Proprietary Fly Ash Beneficiation Technology – We Call It EnviroSource℠ Input Output CO2 +

• Charah Solutions’ EnviroSource testing unit has been operational and in use for proof of concept and customer ash testing in Louisiana since 2018 EnviroSource℠ Technology In Action EnviroSource Technology Is “Deployment Ready”
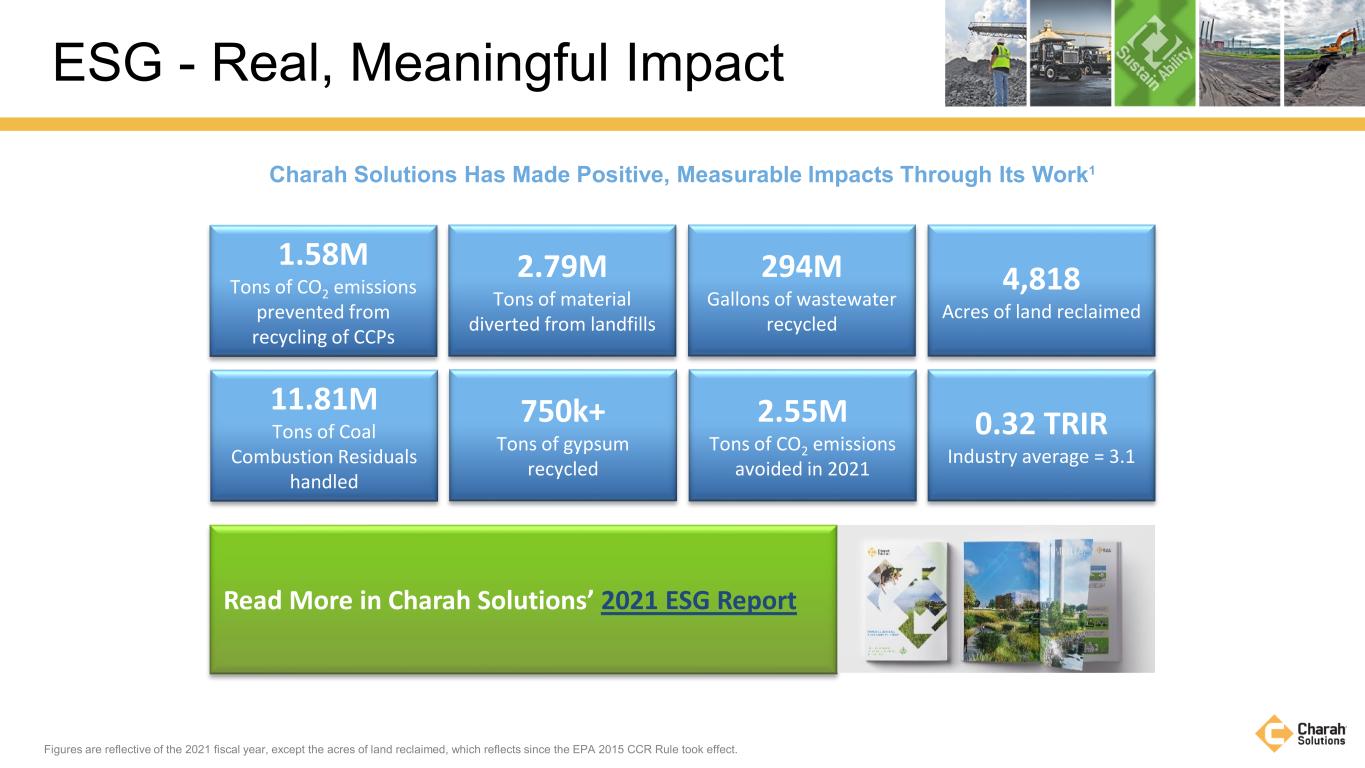
ESG - Real, Meaningful Impact Charah Solutions Has Made Positive, Measurable Impacts Through Its Work1 1.58M Tons of CO2 emissions prevented from recycling of CCPs 2.79M Tons of material diverted from landfills 294M Gallons of wastewater recycled 4,818 Acres of land reclaimed 11.81M Tons of Coal Combustion Residuals handled 750k+ Tons of gypsum recycled 2.55M Tons of CO2 emissions avoided in 2021 0.32 TRIR Industry average = 3.1 Read More in Charah Solutions’ 2021 ESG Report Figures are reflective of the 2021 fiscal year, except the acres of land reclaimed, which reflects since the EPA 2015 CCR Rule took effect.
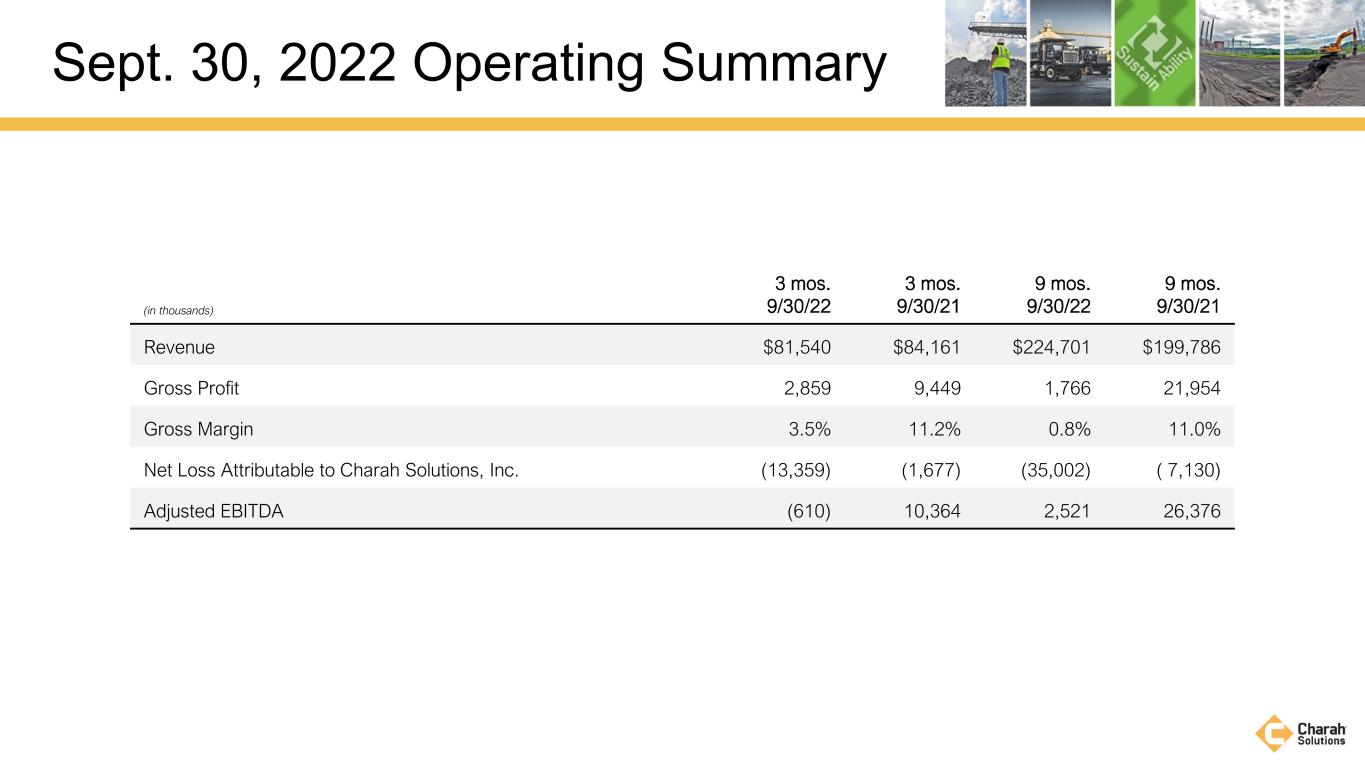
Sept. 30, 2022 Operating Summary (in thousands) 3 mos. 9/30/22 3 mos. 9/30/21 9 mos. 9/30/22 9 mos. 9/30/21 Revenue $81,540 $84,161 $224,701 $199,786 Gross Profit 2,859 9,449 1,766 21,954 Gross Margin 3.5% 11.2% 0.8% 11.0% Net Loss Attributable to Charah Solutions, Inc. (13,359) (1,677) (35,002) ( 7,130) Adjusted EBITDA (610) 10,364 2,521 26,376
APPENDIX
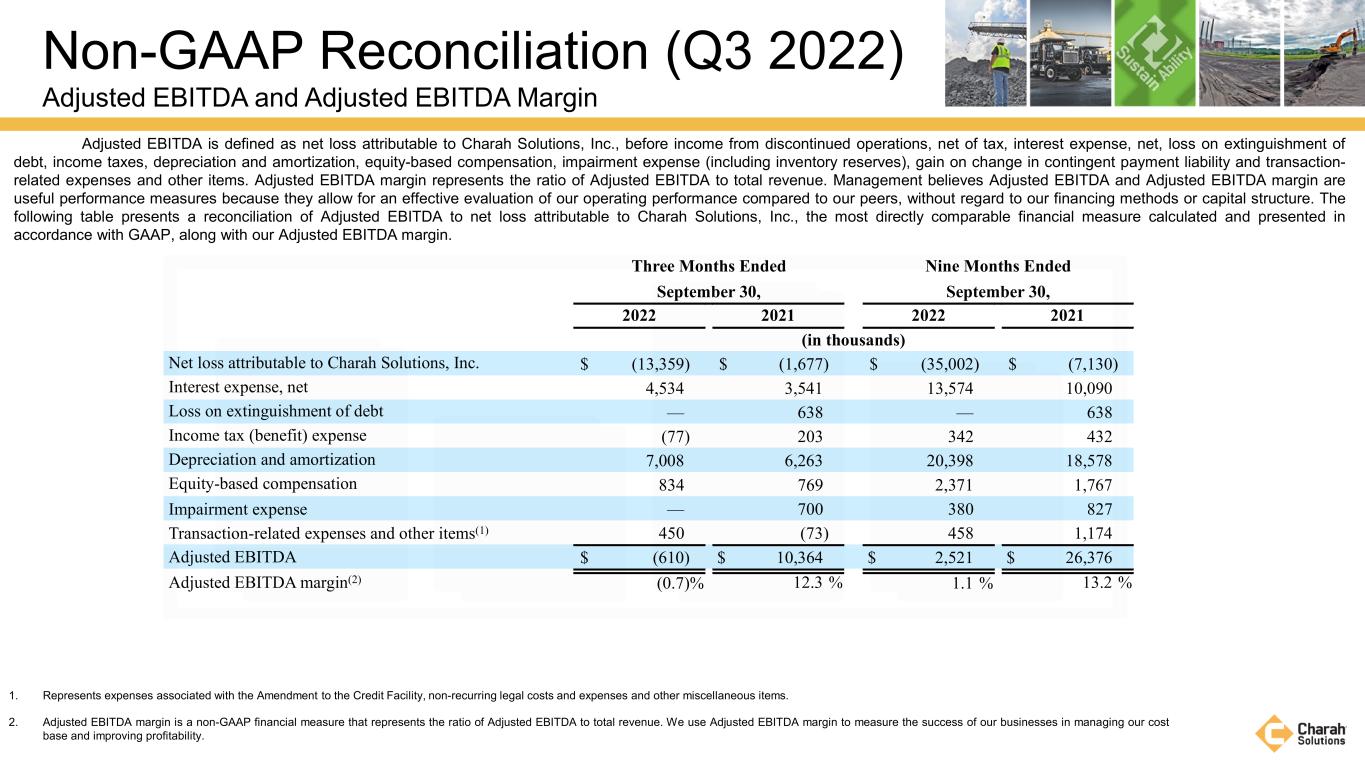
Non-GAAP Reconciliation (Q3 2022) Adjusted EBITDA and Adjusted EBITDA Margin 1. Represents expenses associated with the Amendment to the Credit Facility, non-recurring legal costs and expenses and other miscellaneous items. 2. Adjusted EBITDA margin is a non-GAAP financial measure that represents the ratio of Adjusted EBITDA to total revenue. We use Adjusted EBITDA margin to measure the success of our businesses in managing our cost base and improving profitability. Adjusted EBITDA is defined as net loss attributable to Charah Solutions, Inc., before income from discontinued operations, net of tax, interest expense, net, loss on extinguishment of debt, income taxes, depreciation and amortization, equity-based compensation, impairment expense (including inventory reserves), gain on change in contingent payment liability and transaction- related expenses and other items. Adjusted EBITDA margin represents the ratio of Adjusted EBITDA to total revenue. Management believes Adjusted EBITDA and Adjusted EBITDA margin are useful performance measures because they allow for an effective evaluation of our operating performance compared to our peers, without regard to our financing methods or capital structure. The following table presents a reconciliation of Adjusted EBITDA to net loss attributable to Charah Solutions, Inc., the most directly comparable financial measure calculated and presented in accordance with GAAP, along with our Adjusted EBITDA margin. Three Months Ended Nine Months Ended September 30, September 30, 2022 2021 2022 2021 (in thousands) Net loss attributable to Charah Solutions, Inc. $ (13,359) $ (1,677) $ (35,002) $ (7,130) Interest expense, net 4,534 3,541 13,574 10,090 Loss on extinguishment of debt — 638 — 638 Income tax (benefit) expense (77) 203 342 432 Depreciation and amortization 7,008 6,263 20,398 18,578 Equity-based compensation 834 769 2,371 1,767 Impairment expense — 700 380 827 Transaction-related expenses and other items(1) 450 (73) 458 1,174 Adjusted EBITDA $ (610) $ 10,364 $ 2,521 $ 26,376 Adjusted EBITDA margin(2) (0.7) % 12.3 % 1.1 % 13.2 %
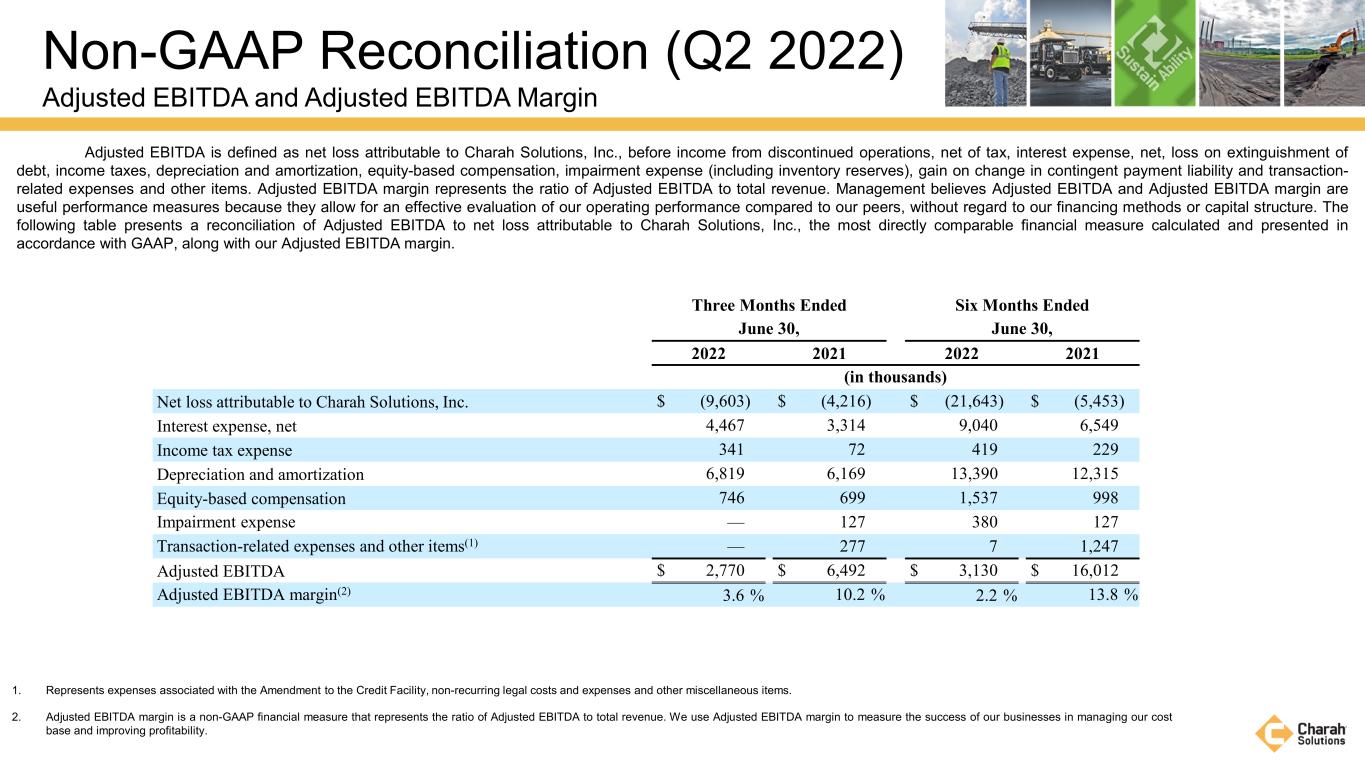
Non-GAAP Reconciliation (Q2 2022) Adjusted EBITDA and Adjusted EBITDA Margin Three Months Ended Six Months Ended June 30, June 30, 2022 2021 2022 2021 (in thousands) Net loss attributable to Charah Solutions, Inc. $ (9,603) $ (4,216) $ (21,643) $ (5,453) Interest expense, net 4,467 3,314 9,040 6,549 Income tax expense 341 72 419 229 Depreciation and amortization 6,819 6,169 13,390 12,315 Equity-based compensation 746 699 1,537 998 Impairment expense — 127 380 127 Transaction-related expenses and other items(1) — 277 7 1,247 Adjusted EBITDA $ 2,770 $ 6,492 $ 3,130 $ 16,012 Adjusted EBITDA margin(2) 3.6 % 10.2 % 2.2 % 13.8 % Adjusted EBITDA is defined as net loss attributable to Charah Solutions, Inc., before income from discontinued operations, net of tax, interest expense, net, loss on extinguishment of debt, income taxes, depreciation and amortization, equity-based compensation, impairment expense (including inventory reserves), gain on change in contingent payment liability and transaction- related expenses and other items. Adjusted EBITDA margin represents the ratio of Adjusted EBITDA to total revenue. Management believes Adjusted EBITDA and Adjusted EBITDA margin are useful performance measures because they allow for an effective evaluation of our operating performance compared to our peers, without regard to our financing methods or capital structure. The following table presents a reconciliation of Adjusted EBITDA to net loss attributable to Charah Solutions, Inc., the most directly comparable financial measure calculated and presented in accordance with GAAP, along with our Adjusted EBITDA margin. 1. Represents expenses associated with the Amendment to the Credit Facility, non-recurring legal costs and expenses and other miscellaneous items. 2. Adjusted EBITDA margin is a non-GAAP financial measure that represents the ratio of Adjusted EBITDA to total revenue. We use Adjusted EBITDA margin to measure the success of our businesses in managing our cost base and improving profitability.


