Exhibit 99.2

Investor PresentationAugust 2019 Broadmark realty Capital
Disclaimer This presentation contemplates the business combination (the “Business Combination”) pursuant to an Agreement and Plan of Merger (the “Merger Agreement”) among Trinity Merger Corporation, a Delaware corporation (“Trinity”), Trinity Sub Inc., a Maryland corporation and wholly-owned subsidiary of Trinity (“PubCo”), Trinity Merger Sub I, Inc., a Delaware corporation and wholly-owned subsidiary of PubCo (“Merger Sub I”), Trinity Merger Sub II, LLC, a Delaware limited liability company and wholly-owned subsidiary of PubCo (“Merger Sub II” and, together with Trinity, PubCo and Merger Sub I, the “Trinity Parties”), PBRELF I, LLC, a Washington limited liability company (“PBRELF I”), BRELF II, LLC, a Washington limited liability company (“BRELF II”), BRELF III, LLC, a Washington limited liability company (“BRELF III”), and BRELF IV, LLC, a Washington limited liability company (“BRELF IV” and, together with PBRELF I, BRELF II and BRELF III, the “Companies” and each a “Company”), Pyatt Broadmark Management, LLC, a Washington limited liability company (“MgCo I”), Broadmark Real Estate Management II, LLC, a Washington limited liability company (“MgCo II”), Broadmark Real Estate Management III, LLC, a Washington limited liability company (“MgCo III”), and Broadmark Real Estate Management IV, LLC, a Washington limited liability company (“MgCo IV” and, together with MgCo I, MgCo II and MgCo III, the “Management Companies” and each a “Management Company” and, together with the Companies, “Broadmark” or the “Company Group”).This presentation does not constitute (i) a solicitation of a proxy, consent or authorization with respect to any securities or in respect of the proposed Business Combination or (ii) an offer to sell, a solicitation of an offer to buy, or a recommendation to buy any security of Trinity, any company forming a part of Broadmark or any of their respective affiliates. You should not construe the contents of this presentation as legal, tax, accounting or investment advice or as a recommendation with respect to the voting, purchase or sale of any security or as to any other matter.Each Company originates private loans secured exclusively by real estate located in certain geographic areas, and the company resulting from the proposed business combination discussed herein expects to elect to be taxed as a real estate investment trust (“REIT”) for U.S. federal income tax purposes. The private real estate lending business of the Companies is speculative and involves substantial risks, including but not limited to, illiquidity, interest rate, reinvestment, prepayment and default risks. Investors should make their own independent investigation of Trinity and the Company Group before investing in any securities. The information presented herein is not a complete description and is not an offer to buy or sell any securities of any Company. Broadmark Capital, LLC (“Broadmark Capital”) is a registered broker-dealer and FINRA/SIPC member. Broadmark Capital’s owners and executives are also owners of the management companies of the Companies. Broadmark Capital and its affiliated entities receive fees for originating, underwriting and servicing mortgage loans and other fees that could result in certain conflicts of interest. Certain terms not defined in the presentation have the definitions given to them in the Merger Agreement or the S-4, as the case may be.PAST PERFORMANCE IS NO GUARANTEE OF FUTURE PERFORMANCE.

Disclaimer Cautionary Statement Concerning Forward-Looking Statements This presentation contains forward-looking statements within the meaning of Section 27A of the Securities Act of 1933, as amended, and Section 21E of the Securities Exchange Act of 1934, as amended, conveying the expectations of management of Trinity and/or the Company Group as to the future based on plans, estimates and projections at the time Trinity and/or the Company Group makes the statements. Forward-looking statements involve inherent significant risks and uncertainties and Trinity and the Company Group caution you that a number of important factors could cause actual results to differ materially from those contained in any such forward-looking statement. The forward-looking statements contained in this presentation include, but are not limited to, statements related to the proposed business combination between Trinity and the Company Group and the proposed terms thereof, the Company Group’s business, industry, strategy and ability to grow, the anticipated future business and financial performance of the combined company following the Business Combination, the anticipated timing of the transactions described herein, the ability to complete the transactions on the terms and within the timeframe contemplated herein, the ability to finance the Business Combination and any investor redemptions, the ability of the parties to the transaction to satisfy the closing conditions to the transaction, and the potential impact the transactions contemplated hereby will have on Trinity and the Company Group and their respective businesses. Forward looking statements can be identified by terms such as “believes,” “plans,” “intends,” “targets,” “will,” “expects,” “suggests,” “anticipates,” “outlook,” “continues,” “projects,” “forecasts” and similar expressions. The forward-looking statements contained in this presentation are based on Trinity’s and/or the Company Group’s current expectations about future events and trends that it believes may affect Trinity’s, the Company Group’s or the combined company’s financial condition, results of operations, strategy, short-term and long-term business operations and objectives and financial needs. You should not place undue reliance upon forward-looking statements as predictions of future events. Although Trinity and the Company Group believe that the expectations reflected in the forward-looking statements contained herein are reasonable, no guarantee can be made as to future results, performance or achievements. Factors that could cause Trinity’s actual results to differ materially from those expressed or implied in such forward-looking statements include, but are not limited to, the level of redemptions by Trinity’s and/ or the Company Group’s investors in connection with the proposed transaction; the ability to complete the private placement financing contemplated to occur concurrently with the closing of the business combination, the ability of Trinity to obtain the contemplated amendment to the terms of its outstanding warrants, changes in estimates regarding the future business and financial performance of the Company Group or the combined company; changes in expectations with respect to the closing of the business combination transaction or the timing thereof; the ability to retain Company Group’s customers and financing sources following any business combination; and unanticipated changes in laws, regulations, or other industry standards affecting Trinity or the Target. The forward-looking statements included in this document are made as of the date of this presentation. Trinity and the Target disclaim any duty to update any of these forward-looking statements after the date of this presentation.

Disclaimer Use of Projections This presentation contains financial forecasts and projections relating to the anticipated future financial performance of Trinity, the Target and the combined company. Such financial forecasts and projections constitute forward looking information, are for illustrative purposes only and should not be relied upon as necessarily being indicative of future results. The significant assumptions and estimates underlying such financial forecasts and projections are inherently uncertain and are subject to a wide variety of significant business, economic, competitive and other risks and uncertainties. See “Cautionary Statement Concerning Forward-Looking Statements” above. Actual results may differ materially from the results contemplated by the financial forecasts and projections contained in this presentation, and the inclusion of such information in this presentation should not be regarded as a representation by any person that the results reflected in such forecasts and projections will be achieved. Non-GAAP Financial Information This presentation includes financial measures and other non-GAAP financial information that is calculated and presented on the basis of methodologies other than in accordance with generally accepted accounting principles in the United States of America (“GAAP”). Any non-GAAP financial measures and other non-GAAP financial information used in this presentation are in addition to, and should not be considered superior to, or a substitute for, financial statements prepared in accordance with GAAP. Non-GAAP financial measures and other non-GAAP financial information is subject to significant inherent limitations. The non-GAAP financial measures and other non-GAAP financial information presented herein may not be comparable to similar non-GAAP measures presented by other companies. Market and Industry Data Market data and industry data used throughout this presentation is based on information derived from third party sources, Trinity and Target management’s knowledge of their respective industries and businesses and good faith estimates of Trinity and Target management. While Trinity and Target management believe that the third party sources from which market and industry data has been derived are reputable, Trinity and Target have not independently verified such market and industry data, and you are cautioned not to give undue weight to such market and industry data. Important Information About the Proposed Transaction and Where to Find It In connection with the proposed business combination transaction, PubCo intends to file a Registration Statement on Form S-4, which will include a preliminary joint proxy and consent solicitation statement/prospectus. A definitive joint proxy and consent solicitation statement/prospectus and other relevant documents will be mailed to security holders of Trinity and Broadmark. Security holders of Trinity and Broadmark are advised to read, when available, the preliminary proxy and consent solicitation statement, and amendments thereto, in connection with the solicitation of proxies and consents to approve the proposed transaction and related matters because the proxy and consent solicitation statement/prospectus will contain important information about the proposed transaction and the parties to the proposed transaction. The definitive proxy and solicitation statement/prospectus will be mailed to security holders as of a record date to be established for voting on the proposed transaction or delivering consents, as applicable. Security holders will also be able to obtain copies of the Registration Statement and joint proxy and consent solicitation statement/prospectus, without charge, once available, at the Securities and Exchange Commission’s (“SEC”) website at www.sec.gov or by directing a request to: Trinity Merger Corp., 55 Merchant Street, Suite 1500, Honolulu, HI 96813 or c/o Broadmark Capital, LLC, 1420 5th Avenue, Suite 2000, Seattle, WA 98101, as the case may be. Participants in Solicitation Trinity and Broadmark and their respective directors, executive officers, other members of management, and employees, under SEC rules, may be deemed to be participants in the solicitation of proxies and consents of Trinity’s and Broadmark’s security holders in connection with the proposed transaction. Investors and security holders may obtain more detailed information regarding the names and interests in the proposed transaction of Trinity directors and officers in Trinity’s filings with the SEC, including Trinity’s Annual Report on Form 10-K for the fiscal year ended December 31, 2018, which was filed with the SEC on March 15, 2019, and such information and information regarding Broadmark’s directors and officers will also be included in the Registration Statement to be filed with the SEC by PubCo, which will include the joint proxy and consent solicitation statement/prospectus for the proposed transaction. INVESTMENT IN ANY SECURITIES DESCRIBED HEREIN HAS NOT BEEN APPROVED OR DISAPPROVED BY THE SECURITIES AND EXCHANGE COMMISSION OR ANY OTHER REGULATORY AUTHORITY NOR HAS ANY REGULATORY AUTHORITY PASSED UPON OR ENDORSED THE MERITS OF ANY OFFERING OR THE ACCURACY OR ADEQUACY OF THE INFORMATION CONTAINED HEREIN. ANY REPRESENTATION TO THE CONTRARY IS A CRIMINAL OFFENSE. THIS PRESENTATION DOES NOT CONSTITUTE AN OFFER OR SOLICITATION OF ANY SECURITIES OR SOLICITATION OF ANY PROXY, CONSENT OR AUTHORIZATION WITH RESPECT TO ANY SECURITIES OR THE PROPOSED BUSINESS COMBINATION

Transaction Summary Overview $358 million SPAC(1) with real estate industry focusDeep knowledge of credit and mortgage marketsHighly experienced transactional executive team ~$25 billion global institutional asset management firm with core investment strategies including credit and real estate$75 million PIPE investment into Broadmark Realty Capital at Reference Price estimated to be $10.47 per share(2)(3) Total assets held in trust as of March 31, 2019Option to increase total investment size to $100 million within 12 months following transaction close. Farallon will also receive 7.2 million of newly issued warrants on the same terms as existing outstanding public warrants in connection with their investment and the Trinity Sponsor will forfeit an equal number of private placement warrantsReference Price equals to Trust Value per Share of $10.47 based on $357.6 million cash and marketable securities in Trust Account as of March 31, 2019 plus $3.6 million of interest income (based on 30-day T-Bills rate) received until estimated closing date divided by 34.5 million sharesAs of March 31, 2019, there are $967 million in outstanding loan commitments, net of repayments. Of the $967 million, $661 million has been drawn or funded to borrowersAs of March 31, 2019. Comprised of origination fees (3.0% to 5.0% per annum) and interest rates (11.0% to 13.0% per annum) Short-term, secured real estate lender since 2010$967 million active loan portfolio comprised of 263 loans in nine states(4)16%+ weighted average all-in unlevered cash yield(5)No debt The transaction creates scalable public platform with growth potential that is well positioned to create shareholder value

Formation of a publicly-traded unlevered internally managed mortgage REIT through the acquisition of Broadmark’s four real estate lending Companies and internalization of its four Management CompaniesExpected equity value of $1.5 billion(1)Expect to target initial annual dividend of $1.25-$1.30 per share (11.9%-12.4% yield at Reference Price of $10.47 per share)(2)$75 million PIPE investment from Farallon at Reference Price(3)Total consideration to Broadmark of $1,163 million$162.5 million purchase price of Management Companies (5.4x estimated March 2019 TTM Adjusted Net Income equal to $30.1 million(4), significant discount to 10-15x valuation of publicly traded asset managers(5))~60% / 40% cash to stock consideration$1.0 billion of Combined Companies Members’ Equity(1)(6) Trinity Sponsor will forfeit 3.8 million, or 44.1%, of its 8.6 million founder shares and 7.2 million, or 58.0%, of its 12.4 million private placement warrantsInternalization offers REIT significant economies of scale going forward Transaction structure expected to provide opportunity to receive additional fees from future private capital managed by the mortgage REITExpected close: 4Q 2019 Business combination creates scalable public platform with growth potential that is well positioned to create shareholder value transaction OVERVIEW TRANSACTION SUMMARY USE OF PROCEEDS MANAGEMENT AND BOARD Current Broadmark management to continue to run the businessJoseph Schocken and Jeffrey Pyatt will serve on the board of directors of the combined company; Trinity to appoint 2 out of 7 directors Note: All information presented is on an unaudited and cash basis. Forward looking statements ate subject to significant risks and uncertainties. See “Disclaimer” and ‘Appendix II”. Financial information was not prepared in accordance with SEC rules and GAAP. Assumes no Trinity’s Public Shareholders and no existing Broadmark Company Members redeem. See ‘Transaction Summary’ on slide 32 for further detail Assumes post transaction shares outstanding of 148.4 millionOption to increase total investment size to $100 million within 12 months following transaction close. Farallon will also receive 7.2 million of newly issued warrants on the same terms as currently outstanding public warrants in connection with their share purchase and the Trinity Sponsor will forfeit an equal number of private placement warrantsEqual to $26.6 million combined Management Companies TTM March 31’19 Net Income adjusted for elimination of commissions expense paid to Broadmark Capital under four financial advisory / investments banking agreements with the Company Group terminating at closing, and the addition of general and administrative expenses related to expenses currently paid by Broadmark Capital which will be incurred by Broadmark Realty post-closing. Unaudited and presented on a non-GAAP cash basis and combined for all Broadmark entities contemplated to be acquired as part of business combination. See “Disclaimer”. See “Appendix IV” for further detailsConsists of $756 million Companies Members’ equity as of March 31, 2019 + $244 million net inflow of capital prior to transaction closing TRANSACTION RATIONALE Transaction proceeds will be used to pay portion of Management Companies’ purchase price, investor redemptions, if any, and transaction fees and expensesRemaining proceeds, currently estimated to be $283 million, will be invested into new loans(1)

Broadmark Overview Section 1
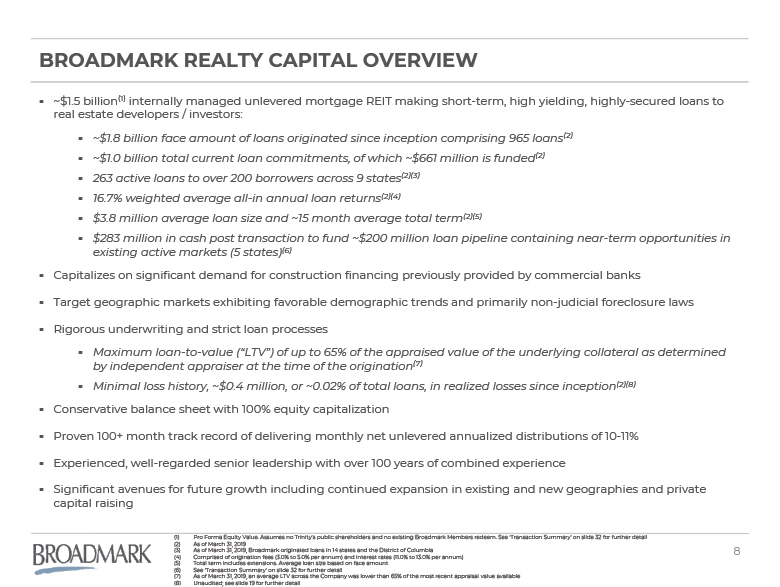
Broadmark REALTY CAPITAL Overview ~$1.5 billion(1) internally managed unlevered mortgage REIT making short-term, high yielding, highly-secured loans to real estate developers / investors:~$1.8 billion face amount of loans originated since inception comprising 965 loans(2)~$1.0 billion total current loan commitments, of which ~$661 million is funded(2)263 active loans to over 200 borrowers across 9 states(2)(3)16.7% weighted average all-in annual loan returns(2)(4)$3.8 million average loan size and ~15 month average total term(2)(5)$283 million in cash post transaction to fund ~$200 million loan pipeline containing near-term opportunities in existing active markets (5 states)(6)Capitalizes on significant demand for construction financing previously provided by commercial banksTarget geographic markets exhibiting favorable demographic trends and primarily non-judicial foreclosure laws Rigorous underwriting and strict loan processesMaximum loan-to-value (“LTV”) of up to 65% of the appraised value of the underlying collateral as determined by independent appraiser at the time of the origination(7)Minimal loss history, ~$0.4 million, or ~0.02% of total loans, in realized losses since inception(2)(8)Conservative balance sheet with 100% equity capitalization Proven 100+ month track record of delivering monthly net unlevered annualized distributions of 10-11% Experienced, well-regarded senior leadership with over 100 years of combined experienceSignificant avenues for future growth including continued expansion in existing and new geographies and private capital raising Pro Forma Equity Value. Assumes no Trinity’s public shareholders and no existing Broadmark Members redeem. See ‘Transaction Summary’ on slide 32 for further detailAs of March 31, 2019As of March 31, 2019, Broadmark originated loans in 14 states and the District of ColumbiaComprised of origination fees (3.0% to 5.0% per annum) and interest rates (11.0% to 13.0% per annum)Total term includes extensions. Average loan size based on face amountSee ‘Transaction Summary’ on slide 32 for further detailAs of March 31, 2019, an average LTV across the Company was lower than 65% of the most recent appraisal value availableUnaudited; see slide 19 for further detail
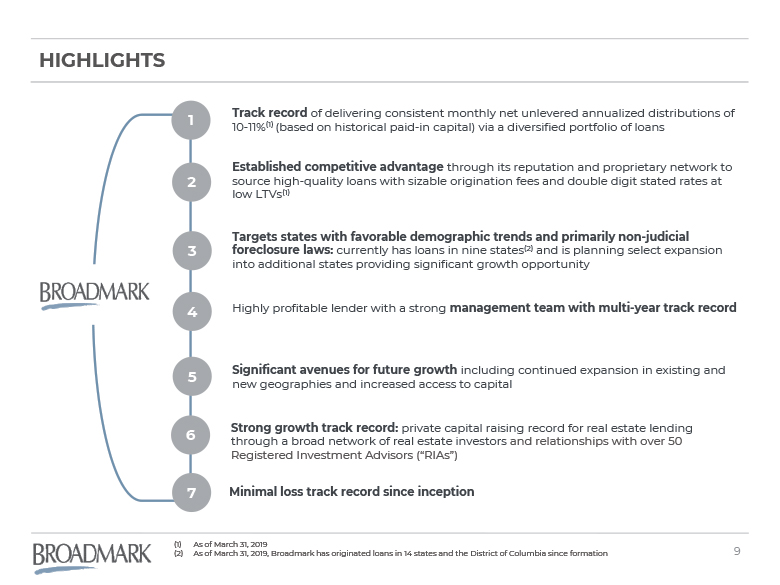
As of March 31, 2019As of March 31, 2019, Broadmark has originated loans in 14 states and the District of Columbia since formation Track record of delivering consistent monthly net unlevered annualized distributions of 10-11%(1) (based on historical paid-in capital) via a diversified portfolio of loans Significant avenues for future growth including continued expansion in existing and new geographies and increased access to capital Strong growth track record: private capital raising record for real estate lending through a broad network of real estate investors and relationships with over 50 Registered Investment Advisors (“RIAs”) Targets states with favorable demographic trends and primarily non-judicial foreclosure laws: currently has loans in nine states(2) and is planning select expansion into additional states providing significant growth opportunity Highlights 7 Highly profitable lender with a strong management team with multi-year track record Established competitive advantage through its reputation and proprietary network to source high-quality loans with sizable origination fees and double digit stated rates at low LTVs(1) 1 2 3 4 5 6 Minimal loss track record since inception
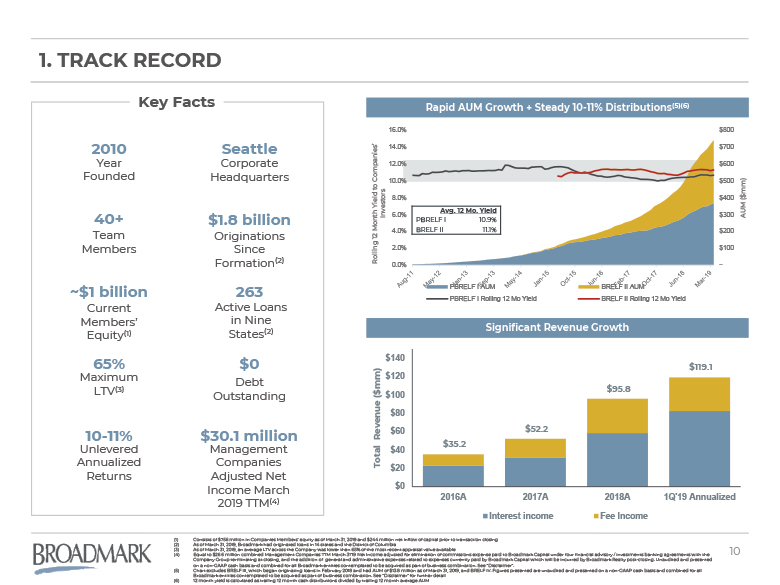
1. Track record Rapid AUM Growth + Steady 10-11% Distributions(5)(6) Consists of $756 million in Companies Members’ equity as of March 31, 2019 and $244 million net inflow of capital prior to transaction closingAs of March 31, 2019, Broadmark had originated loans in 14 states and the District of ColumbiaAs of March 31, 2019, an average LTV across the Company was lower than 65% of the most recent appraisal value availableEqual to $26.6 million combined Management Companies TTM March 31’19 Net Income adjusted for elimination of commissions expense paid to Broadmark Capital under four financial advisory / investments banking agreements with the Company Group terminating at closing, and the addition of general and administrative expenses related to expenses currently paid by Broadmark Capital which will be incurred by Broadmark Realty post-closing. Unaudited and presented on a non-GAAP cash basis and combined for all Broadmark entities contemplated to be acquired as part of business combination. See “Disclaimer”. Chart excludes BRELF III, which began originating loans in February 2018 and had AUM of $13.8 million as of March 31, 2019, and BRELF IV. Figures presented are unaudited and presented on a non-GAAP cash basis and combined for all Broadmark entities contemplated to be acquired as part of business combination. See “Disclaimer” for further detail 12 month yield is calculated as trailing 12 month cash distributions divided by trailing 12 month average AUM 2010 Year Founded ~$1 billion Current Members’ Equity(1) 65% Maximum LTV(3) 10-11% Unlevered Annualized Returns 263 Active Loans in Nine States(2) Seattle Corporate Headquarters Key Facts 40+ Team Members $1.8 billion Originations Since Formation(2) $0 DebtOutstanding Significant Revenue Growth $30.1 million Management Companies Adjusted Net Income March 2019 TTM(4) Avg. 12 Mo. Yield PBRELF I 10.9% BRELF II 11.1%
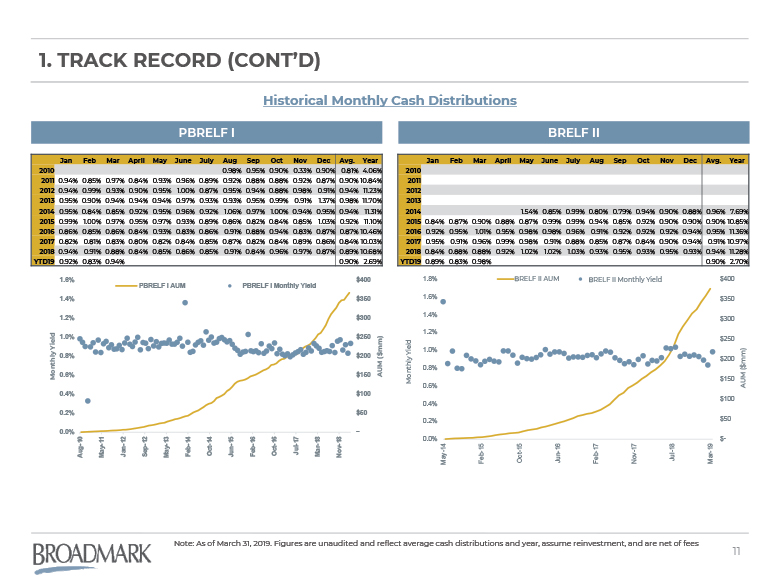
1. Track record (Cont’d) Note: As of March 31, 2019. Figures are unaudited and reflect average cash distributions and year, assume reinvestment, and are net of fees PBRELF I BRELF II Historical Monthly Cash Distributions Jan Feb Mar April May June July Aug Sep Oct Nov Dec Avg. Year 2010 0.98% 0.95% 0.90% 0.33% 0.90% 0.81% 4.06% 2011 0.94% 0.85% 0.97% 0.84% 0.93% 0.96% 0.89% 0.92% 0.88% 0.88% 0.92% 0.87% 0.90% 10.84% 2012 0.94% 0.99% 0.93% 0.90% 0.95% 1.00% 0.87% 0.95% 0.94% 0.88% 0.98% 0.91% 0.94% 11.23% 2013 0.95% 0.90% 0.94% 0.94% 0.94% 0.97% 0.93% 0.93% 0.95% 0.99% 0.91% 1.37% 0.98% 11.70% 2014 0.95% 0.84% 0.85% 0.92% 0.95% 0.96% 0.92% 1.06% 0.97% 1.00% 0.94% 0.95% 0.94% 11.31% 2015 0.99% 1.00% 0.97% 0.95% 0.97% 0.93% 0.89% 0.86% 0.82% 0.84% 0.85% 1.03% 0.92% 11.10% 2016 0.86% 0.85% 0.86% 0.84% 0.93% 0.83% 0.86% 0.91% 0.88% 0.94% 0.83% 0.87% 0.87% 10.46% 2017 0.82% 0.81% 0.83% 0.80% 0.82% 0.84% 0.85% 0.87% 0.82% 0.84% 0.89% 0.86% 0.84% 10.03% 2018 0.94% 0.91% 0.88% 0.84% 0.85% 0.86% 0.85% 0.91% 0.84% 0.96% 0.97% 0.87% 0.89% 10.68% YTD19 0.92% 0.83% 0.94% 0.90% 2.69% Jan Feb Mar April May June July Aug Sep Oct Nov Dec Avg. Year 2010 2011 2012 2013 2014 1.54% 0.85% 0.99% 0.80% 0.79% 0.94% 0.90% 0.88% 0.96% 7.69% 2015 0.84% 0.87% 0.90% 0.88% 0.87% 0.99% 0.99% 0.94% 0.85% 0.92% 0.90% 0.90% 0.90% 10.85% 2016 0.92% 0.95% 1.01% 0.95% 0.98% 0.98% 0.96% 0.91% 0.92% 0.92% 0.92% 0.94% 0.95% 11.36% 2017 0.95% 0.91% 0.96% 0.99% 0.98% 0.91% 0.88% 0.85% 0.87% 0.84% 0.90% 0.94% 0.91% 10.97% 2018 0.84% 0.88% 0.88% 0.92% 1.02% 1.02% 1.03% 0.93% 0.95% 0.93% 0.95% 0.93% 0.94% 11.28% YTD19 0.89% 0.83% 0.98% 0.90% 2.70% BRELF II AUM BRELF II Monthly Yield

2. ESTABLISHED COMPETITIVE ADVANTAGE Deep market intelligence cultivated over many yearsConsistent availability of capital has underscored borrower trust as a reliable funding sourceExtensive network of developer relationships with over 500 borrowers since inceptionSignificant repeat business – approximately 65% of loans in PBRELF I and BRELF II have been to repeat borrowers(1)Borrowers willing to pay premium loan pricing in return for certainty of executionRigid but predictable loan funding processBorrowers that meet loan deliverables have high confidence in accessing capitalAbility to fund draws expeditiously is a key competitive factorNo leverage (1) Approximately 30% of BRELF III, which is still in ramp-up, has been repeat business
2. …And Differentiated High-Yielding Growth Opportunity Alternative unlevered credit-focused strategy generating a double digit dividend yield with limited correlation to broader equity capital marketsProvides significant growth opportunity to generate additional fee incomeSuccessful track record of raising capital privately for real estate lendingHigh quality unlevered double digit yielding portfolio supports book valueAttractive 16%+ all-in unlevered portfolio (fixed rate) provides earnings stability(1)Targeting fixed-rate loans with short-term maturities provides multiple benefitsMitigates interest rate risk due to faster re-pricing ability for shifts in market interest ratesUnlike Commercial Real Estate (“CRE”) Mortgage REIT comparables’ LIBOR-based lending programs, fixed-rate loans avoid exposure to moves in LIBOR which is forecasted to decrease ~0.70% during the next two years resulting in Net Interest Margin compression for comparables(2)Superior buffer on any collateral price declines versus long-dated loans Weighted average yield as of March 31, 2019. Comprised of origination fees (3.0% to 5.0% per annum) and interest rates (11.0% to 13.0% per annum)Source: Bloomberg. Represents 1-month LIBOR basis adjusted forward rate as of August 1, 2019
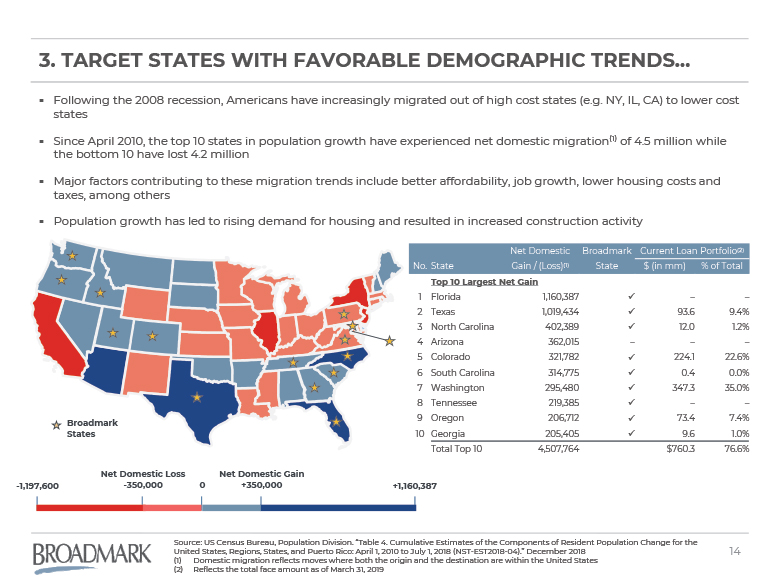
Net Domestic Broadmark Current Loan Portfolio(2) No. State Gain / (Loss)(1) State $ (in mm) % of Total Top 10 Largest Net Gain 1 Florida 1,160,387 ü – – 2 Texas 1,019,434 ü 93.6 9.4% 3 North Carolina 402,389 ü 12.0 1.2% 4 Arizona 362,015 – – – 5 Colorado 321,782 ü 224.1 22.6% 6 South Carolina 314,775 ü 0.4 0.0% 7 Washington 295,480 ü 347.3 35.0% 8 Tennessee 219,385 ü – – 9 Oregon 206,712 ü 73.4 7.4% 10 Georgia 205,405 ü 9.6 1.0% Total Top 10 4,507,764 $760.3 76.6% 3. target states with favorable demographic trends… Following the 2008 recession, Americans have increasingly migrated out of high cost states (e.g. NY, IL, CA) to lower cost statesSince April 2010, the top 10 states in population growth have experienced net domestic migration(1) of 4.5 million while the bottom 10 have lost 4.2 millionMajor factors contributing to these migration trends include better affordability, job growth, lower housing costs and taxes, among othersPopulation growth has led to rising demand for housing and resulted in increased construction activity Source: US Census Bureau, Population Division. “Table 4. Cumulative Estimates of the Components of Resident Population Change for the United States, Regions, States, and Puerto Rico: April 1, 2010 to July 1, 2018 (NST-EST2018-04).” December 2018Domestic migration reflects moves where both the origin and the destination are within the United StatesReflects the total face amount as of March 31, 2019 Net Domestic Loss-350,000 Net Domestic Gain+350,000 -1,197,600 +1,160,387 0 Broadmark States

Current Loan Portfolio(1) State $ (in mm) % of Total Primarily Non-Judicial Washington $347.3 35.0% Colorado 224.1 22.6% Utah 206.4 20.8% Texas 93.6 9.4% Oregon 73.4 7.4% Idaho 25.5 2.6% North Carolina 12.0 1.2% Georgia 9.6 1.0% Other (MD, TN, VA) – – Total Primarily Non-Judicial $991.8 100.0% Primarily Judicial South Carolina $0.4 0.0% Other (DC, FL, PA) – – Total Primarily Judicial $0.4 0.0% Total $992.2 100.0% 3. …and STATES WITH non-judicial FORECLOSURE LAWS Primarily Non-Judicial Foreclosures Primarily Judicial Foreclosures Broadmark has strategically expanded its footprint primarily to states that have non-judicial foreclosures statutesEfficient access to collateral real estate is key to preserving value and timely access to eventual liquidity Source: Nolo.com. “Chart: Judicial v. Non-judicial Foreclosures.” Note: Not shown in the map above are Alaska and Hawaii, which are primarily non-judicial and judicial, respectivelyReflects the total face amount as of March 31, 2019 Broadmark States

4. management team WITH MULTI-YEAR TRACK RECORD Broadmark’s principals have over 100 years of combined real estate & financial services experience Years in Industry Experience Joseph SchockenChairman 40 Founder and President of Broadmark Capital, LLCCo-Founder of Broadmark Real Estate Lending Companies Jeffrey PyattChief Executive Officer 30 Co-Founder of Broadmark Real Estate Lending CompaniesPrivate Lenders GroupMoss Adams LLP Adam FountainExecutive Vice President 20 Broadmark Capital, LLCBroadmark Real Estate Lending CompaniesL.E.K. Consulting Joanne Van SickleController 36 Private Lenders GroupTouche Ross Bryan GrafSenior Vice President – Pacific Northwest 10 Ewing and Clark, Inc. Tom GunnisonSenior Vice President – Mountain West 10 Re/Solve FundingThe Hustead Law Firm Jordan SiaoSenior Vice President – Southeast 6 Colony American Homes Brian DubinSenior Vice President – Mid-Atlantic 13 BlueWater Financial PartnersFirst Madison Mortgage Corporation

Increase market share in current geographiesSelect expansion into new markets Grow Loan Portfolio Opportunistic Tactics Fund ~$200 million loan pipeline containing near-term opportunities in existing active markets (5 states)Expand into cash constrained new markets (9 states and D.C.) Excess Cash 2 Quarters Post Close Target accretive public company equity issuances through potential follow-on offerings or at-the-market offerings Additional Capital Opportunistic Expected Timing 5. SIGNIFICANT AVENUES FOR FUTURE GROWTH Strategy Capital Sources Capital Use Pursue opportunistic private capital raises for real estate lendingAccretive management fee income to Broadmark Realty Private REITs Q1 2020

Strong Growth Track Record 6. Strong Growth Track Record PBRELF IEstablished in 2010Focus on Pacific Northwest (WA, OR, ID)$367 million members’ equity(4)$446 million current total face amount of loans(4)(5) BRELF IIEstablished in 2014Focus on Mountain West (CO, TX, UT)$375 million members’ equity(4)$524 million current total face amount of loans(4)(5) BRELF III Established in 2018Focus on Southeast (FL, GA, NC, SC, TN)$14 million members’ equity(4)$22 million current total face amount of loans(4)(5) As of March 31, 2019. Gross amount excluding any redemptionsAs of March 31, 2019. In addition, ~$275 million gross inflow of capital prior to expected transaction closing since March 31, 2019 Based on the last twelve months as of March 31, 2019As of March 31, 2019Reflects the total face amount BRELF IV Established in 2019Focus on Mid-Atlantic (DC, MD, PA, VA) Broadmark is a leading provider of construction, land and development loansBroadmark has a long track record of raising private capital for real estate lending:Raised an average of ~$28 million per month in new capital during the last 12 months(1)Over $820 million raised since inception(2)Over 35% of cumulative distributions reinvested(3)Cumulative redemptions <8% of total capital raised(4)Broadmark currently has a broad network of real estate investors and relationships with over 50 RIAs(4)Going forward, in addition to maintaining an internally managed REIT, Broadmark intends to use its network to launch a private real estate company “Private REIT” that will generate management fees
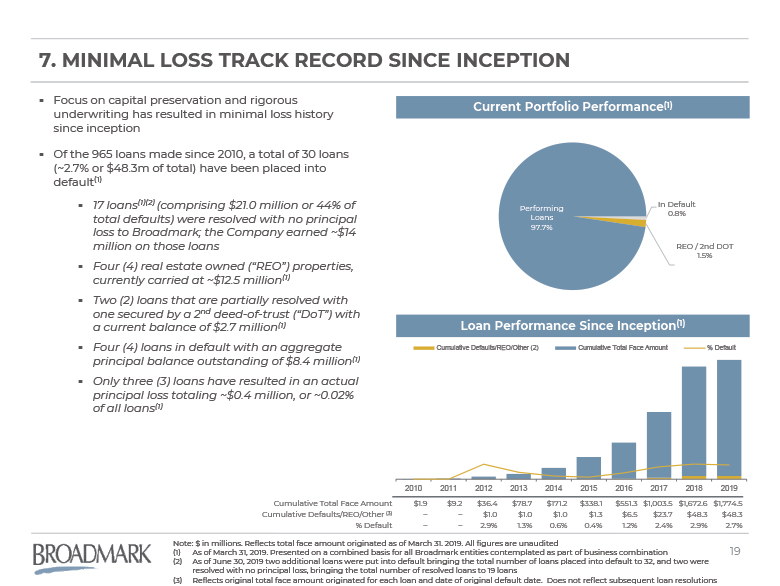
7. Minimal loss Track Record Since Inception Note: $ in millions. Reflects total face amount originated as of March 31. 2019. All figures are unauditedAs of March 31, 2019. Presented on a combined basis for all Broadmark entities contemplated as part of business combinationAs of June 30, 2019 two additional loans were put into default bringing the total number of loans placed into default to 32, and two were resolved with no principal loss, bringing the total number of resolved loans to 19 loansReflects original total face amount originated for each loan and date of original default date. Does not reflect subsequent loan resolutions Focus on capital preservation and rigorous underwriting has resulted in minimal loss history since inceptionOf the 965 loans made since 2010, a total of 30 loans (~2.7% or $48.3m of total) have been placed into default(1)17 loans(1)(2) (comprising $21.0 million or 44% of total defaults) were resolved with no principal loss to Broadmark; the Company earned ~$14 million on those loansFour (4) real estate owned (“REO”) properties, currently carried at ~$12.5 million(1)Two (2) loans that are partially resolved with one secured by a 2nd deed-of-trust (“DoT”) with a current balance of $2.7 million(1)Four (4) loans in default with an aggregate principal balance outstanding of $8.4 million(1)Only three (3) loans have resulted in an actual principal loss totaling ~$0.4 million, or ~0.02% of all loans(1) Current Portfolio Performance(1) Loan Performance Since Inception(1) Cumulative Total Face Amount $1.9 $9.2 $36.4 $78.7 $171.2 $338.1 $551.3 $1,003.5 $1,672.6 $1,774.5 Cumulative Defaults/REO/Other (3) – – $1.0 $1.0 $1.0 $1.3 $6.5 $23.7 $48.3 $48.3 % Default – – 2.9% 1.3% 0.6% 0.4% 1.2% 2.4% 2.9% 2.7%
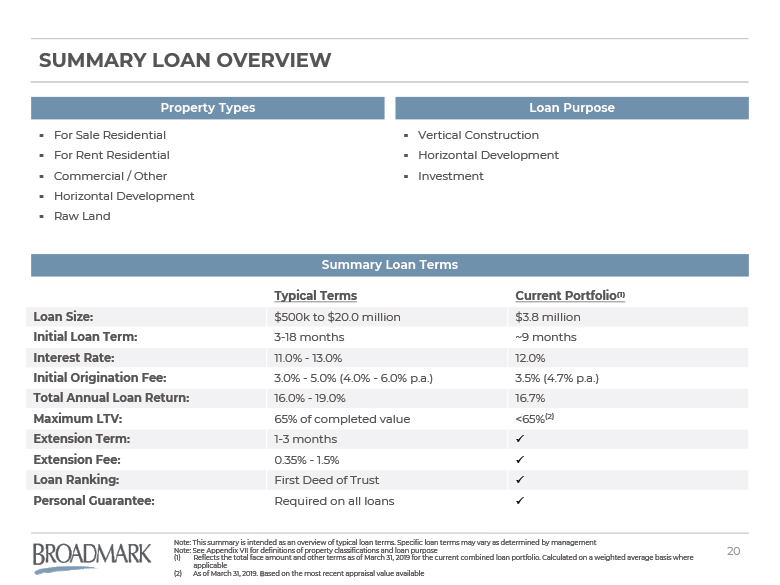
Summary loan overview Property Types Loan Purpose Summary Loan Terms For Sale ResidentialFor Rent ResidentialCommercial / OtherHorizontal DevelopmentRaw Land Vertical ConstructionHorizontal DevelopmentInvestment Note: This summary is intended as an overview of typical loan terms. Specific loan terms may vary as determined by management Note: See Appendix VII for definitions of property classifications and loan purposeReflects the total face amount and other terms as of March 31, 2019 for the current combined loan portfolio. Calculated on a weighted average basis where applicableAs of March 31, 2019. Based on the most recent appraisal value available Typical Terms Current Portfolio(1) Loan Size: $500k to $20.0 million $3.8 million Initial Loan Term: 3-18 months ~9 months Interest Rate: 11.0% - 13.0% 12.0% Initial Origination Fee: 3.0% - 5.0% (4.0% - 6.0% p.a.) 3.5% (4.7% p.a.) Total Annual Loan Return: 16.0% - 19.0% 16.7% Maximum LTV: 65% of completed value <65%(2) Extension Term: 1-3 months ü Extension Fee: 0.35% - 1.5% ü Loan Ranking: First Deed of Trust ü Personal Guarantee: Required on all loans ü

Rigorous and responsive Underwriting process Credit ApplicationOperating AgreementBusiness FinancialsBusiness Tax ReturnsGuarantor FinancialsGuarantor Tax ReturnsBackground Check Site visit by a Broadmark team memberIndependent Appraisal ReportPreliminary Title ReportPurchase & Sale AgreementItemized Budget ReviewBuilding Permit, Plans, SpecsBorrower’s Marketing PlansTax Records & Property InfoTitle Insurance Borrower Provided Information Loan Request Received Loan Approval Process Regional Office Commences Underwriting Preliminary Term Sheet(Within 48 Hours of Receipt of All Underwriting Information) Review and Approval by Loan Review Committee Loan Approval and Funding(Within 5 Days of Preliminary Term Sheet) Collateral Confirmation Strict underwriting process to manage downside risk exposureAll loans hold first position deeds of trust, have personal guarantees and are subject to a maximum of 65% LTVAll loans are discussed and approved unanimously by the Loan Review Committee A sample list of materials required for underwriting:

Collection Receivable Accounting Customer Service Loan servicing overview The Loan Servicing Department comprises three functions: Company and Borrower Agree on Construction Budget Construction Loan Servicing Process Interest & Construction Reserve is Held Back Each Construction Milestone Achieved Leads to an In-Person Inspection Executed County and City Inspections Required Collected Lien Releases From All Vendors and Sub-Contractors Construction Holdback Reviewed and Discretionary Funds are Disbursed Total Loan Commitments(1)(2) $ in millionsReflects total loan commitment, net of repayments, as of March 31, 2019Unaudited and presented on a combined basis for all Broadmark entities contemplated to be acquired as part of business combination

Loan overview by property Classification Current Portfolio(1) Total Annual Originations - Past 5 Years(1) Retired Portfolio(1) $ in millionsNote: Reflects the total face amount. As of March 31, 2019, Broadmark has originated loans in 14 states and the District of Columbia since formation. Includes loans in default (4) and excludes REO (4) and (2) partially resolved loans including (1) secured by 2nd DoTNote: See Appendix VII for definitions of property classifications and loan purposeUnaudited and presented on a combined basis for all Broadmark entities contemplated to be acquired as part of business combination #Loans Face Amount For Sale Residential 141 $379.4 For Rent Residential 25 206.1 Commercial/Other 25 133.5 Horizontal Development 41 197.8 Raw Land 31 75.4 Total 263 $992.2 #Loans Face Amount For Sale Residential 440 $359.5 For Rent Residential 78 208.5 Commercial/Other 65 85.0 Horizontal Development 69 65.9 Raw Land 44 47.8 Total 696 $766.7

#Loans Face Amount Vertical Construction 172 $678.4 Horizontal Development 33 179.0 Investment 58 134.8 Total 263 $992.2 Loan overview BY loan purpose Current Portfolio(1) Total Annual Originations - Past 5 Years(1) Retired Portfolio(1) $ in millionsNote: Reflects the total face amount. As of March 31, 2019, Broadmark has originated loans in 14 states and the District of Columbia since formation. Includes loans in default (4) and excludes REO (4) and (2) partially resolved loans including (1) secured by 2nd DoTNote: See Appendix VII for definitions of property classifications and loan purposeUnaudited and presented on a combined basis for all Broadmark entities contemplated to be acquired as part of business combination #Loans Face Amount Vertical Construction 468 $552.1 Horizontal Development 32 40.0 Investment 196 174.6 Total 696 $766.7

#Loans Face Amount WA 443 $499.8 CO 135 112.7 UT 49 54.0 TX 4 21.9 Other (5 state) 65 78.2 Total 696 $766.7 Loan overview BY state Retired Portfolio(1) Current Portfolio(1) Total Annual Originations - Past 5 Years(1) $ in millionsNote: Reflects the total face amount. As of March 31, 2019, Broadmark has originated loans in 14 states and the District of Columbia since formation. Includes loans in default (4) and excludes REO (4) and (2) partially resolved loans including (1) secured by 2nd DoTUnaudited and presented on a combined basis for all Broadmark entities contemplated to be acquired as part of business combination #Loans Face Amount WA 96 $347.3 CO 61 224.1 UT 31 206.4 TX 16 93.6 Other (5 state) 59 120.8 Total 263 $992.2
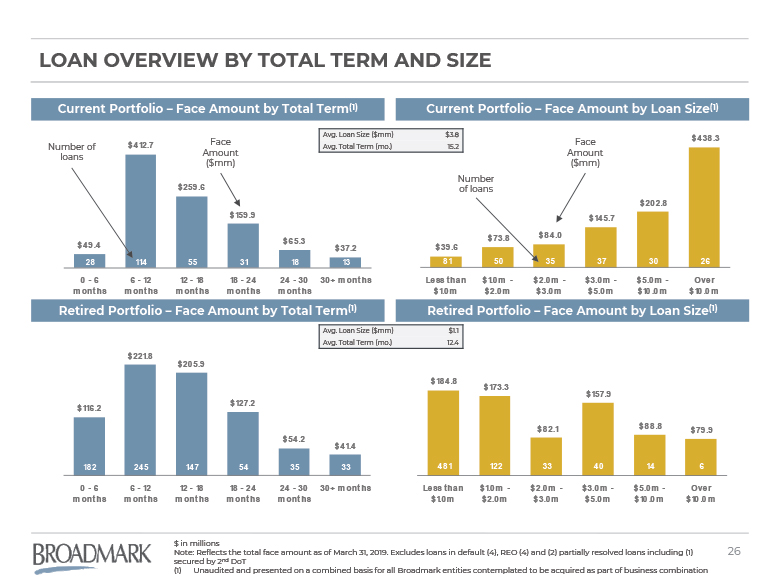
Loan overview BY Total Term and SIZE Current Portfolio – Face Amount by Total Term(1) Retired Portfolio – Face Amount by Total Term(1) Number of loans Face Amount ($mm) Current Portfolio – Face Amount by Loan Size(1) Retired Portfolio – Face Amount by Loan Size(1) Face Amount ($mm) Number of loans $ in millionsNote: Reflects the total face amount as of March 31, 2019. Excludes loans in default (4), REO (4) and (2) partially resolved loans including (1) secured by 2nd DoTUnaudited and presented on a combined basis for all Broadmark entities contemplated to be acquired as part of business combination Avg. Loan Size ($mm) $3.8 Avg. Total Term (mo.) 15.2 Avg. Loan Size ($mm) $1.1 Avg. Total Term (mo.) 12.4

Financial Overview Section 2
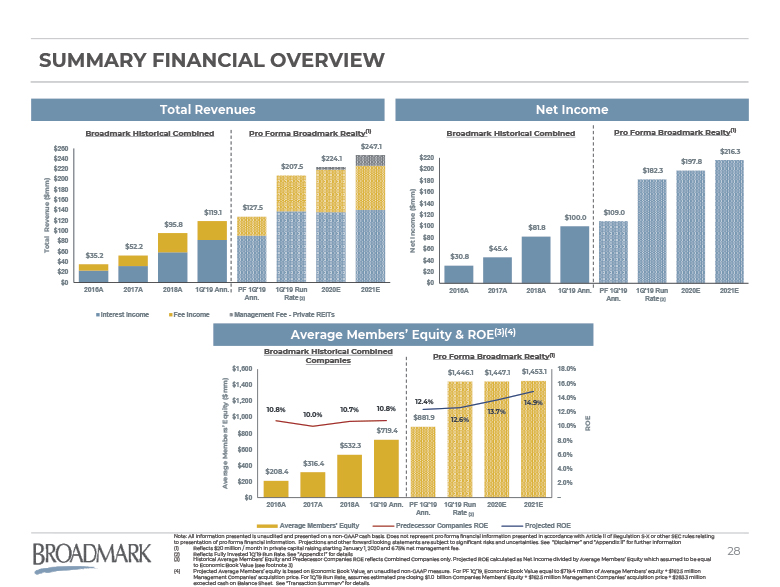
Summary Financial Overview Total Revenues Net Income Broadmark Historical Combined Broadmark Historical Combined Note: All information presented is unaudited and presented on a non-GAAP cash basis. Does not represent pro forma financial information presented in accordance with Article II of Regulation S-X or other SEC rules relating to presentation of pro forma financial information. Projections and other forward looking statements are subject to significant risks and uncertainties. See “Disclaimer” and “Appendix II” for further informationReflects $20 million / month in private capital raising starting January 1, 2020 and 6.75% net management fee. Reflects Fully Invested 1Q’19 Run Rate. See “Appendix I” for detailsHistorical Average Members’ Equity and Predecessor Companies ROE reflects Combined Companies only. Projected ROE calculated as Net Income divided by Average Members’ Equity which assumed to be equal to Economic Book Value (see footnote 3)Projected Average Members’ equity is based on Economic Book Value, an unaudited non-GAAP measure. For PF 1Q’19, Economic Book Value equal to $719.4 million of Average Members’ equity + $162.5 million Management Companies’ acquisition price. For 1Q’19 Run Rate, assumes estimated pre closing $1.0 billion Companies Members’ Equity + $162.5 million Management Companies’ acquisition price + $283.3 million expected cash on Balance Sheet. See “Transaction Summary” for details. Pro Forma Broadmark Realty(1) Pro Forma Broadmark Realty(1) Average Members’ Equity & ROE(3)(4) Broadmark Historical Combined Companies Pro Forma Broadmark Realty(1) (2) (2) (2)
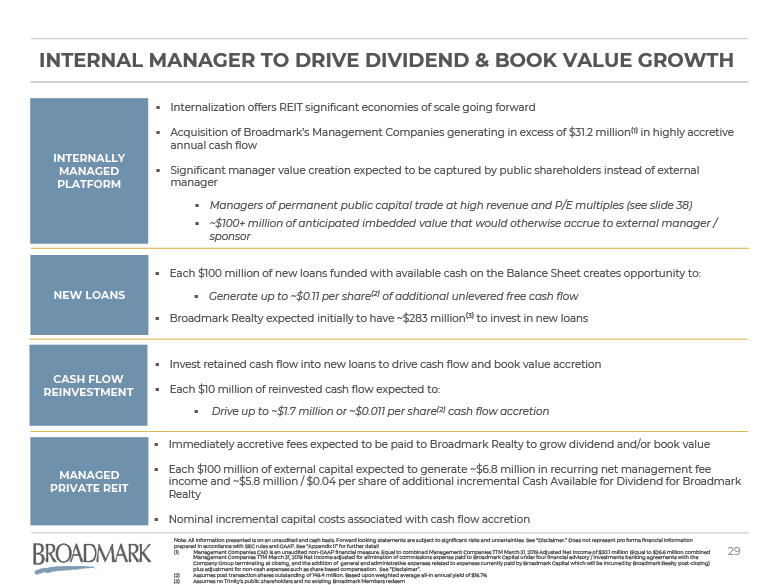
Invest retained cash flow into new loans to drive cash flow and book value accretionEach $10 million of reinvested cash flow expected to: Drive up to ~$1.7 million or ~$0.011 per share(2) cash flow accretion INTERNAL Manager to DRIVE Dividend & Book Value growth NEW LOANS Each $100 million of new loans funded with available cash on the Balance Sheet creates opportunity to:Generate up to ~$0.11 per share(2) of additional unlevered free cash flowBroadmark Realty expected initially to have ~$283 million(3) to invest in new loans MANAGED PRIVATE REIT INTERNALLY MANAGEDPLATFORM Note: All information presented is on an unaudited and cash basis. Forward looking statements are subject to significant risks and uncertainties. See “Disclaimer.” Does not represent pro forma financial information prepared in accordance with SEC rules and GAAP. See “Appendix II” for further detailManagement Companies CAD is an unaudited non-GAAP financial measure. Equal to combined Management Companies TTM March 31, 2019 Adjusted Net Income of $30.1 million (Equal to $26.6 million combined Management Companies TTM March 31, 2019 Net Income adjusted for elimination of commissions expense paid to Broadmark Capital under four financial advisory / investments banking agreements with the Company Group terminating at closing, and the addition of general and administrative expenses related to expenses currently paid by Broadmark Capital which will be incurred by Broadmark Realty post-closing) plus adjustment for non-cash expenses such as share based compensation. See “Disclaimer”. Assumes post transaction shares outstanding of 148.4 million. Based upon weighted average all-in annual yield of $16.7% Assumes no Trinity’s public shareholders and no existing Broadmark Members redeem Immediately accretive fees expected to be paid to Broadmark Realty to grow dividend and/or book valueEach $100 million of external capital expected to generate ~$6.8 million in recurring net management fee income and ~$5.8 million / $0.04 per share of additional incremental Cash Available for Dividend for Broadmark Realty Nominal incremental capital costs associated with cash flow accretion CASH FLOW REINVESTMENT Internalization offers REIT significant economies of scale going forward Acquisition of Broadmark’s Management Companies generating in excess of $31.2 million(1) in highly accretive annual cash flowSignificant manager value creation expected to be captured by public shareholders instead of external managerManagers of permanent public capital trade at high revenue and P/E multiples (see slide 38)~$100+ million of anticipated imbedded value that would otherwise accrue to external manager / sponsor

Transaction Overview Section 3

Transaction structure Transaction structure is expected to provide opportunity to raise future private REITs, outside of the mortgage REIT, through a new subsidiary of the mortgage REIT that would realize management fee revenueBroadmark Realty is expected to have a public market capitalization of over $1.5 billion(1), no debt and to target initial annual dividend of $1.25-$1.30 per share(2)Broadmark Realty will be organized as a Maryland REIT Note: Forward looking statements are subject to significant risks and uncertainties. See “Disclaimer”Excludes 46.9 million warrants expected to be outstanding at a strike price of $11.50 per shareAssumes post transaction shares outstanding of 148.4 millionPBRELF I, LLC, BRELF II, LLC, BRELF III, LLC, BRELF IV, LLC Former Preferred Unitholders of the Companies I-IV(3) Trinity Sub Inc. / Broadmark Realty Capital Former Trinity Public Shareholders Trinity Merger Corp.(TRS) Trinity Merger Sub II (Companies I-IV)(3) Trinity Sponsor Future Private Real Estate Lending Cos Management Fees Management Agreements Future Preferred Members Investors in the Private Placement (Farallon) Broadmark Officers, Directors and Employees

transaction summary Anticipated Post-Business Combination Capitalization Projected Summary Financials Q1’19 Annualized Fully Invested Initial Economic Market Run Rate(5) CY 2020E CY 2021E Book Value(1) Value Revenue $207.5 $224.1 $247.1 Shares (millions) 148.4 Net Income 182.3 197.8 216.3 Reference Price / Trust Value per Share(2) $10.47 Per Share $1.23 $1.33 $1.46 Equity Value $1,446.1 $1,553.9 Price / Economic Book Value(1) 1.07x Cash Available for Distribution ("CAD")(6) $188.3 $203.9 $223.1 Per Share $1.27 $1.37 $1.50 plus: Debt - - less: Cash (283.3) (283.3) Illustrative Dividend per Share(7) $1.21 $1.31 $1.43 plus: Net Debt ($283.3) ($283.3) At Reference Price ($10.47 per Share) Enterprise Value $1,162.8 $1,270.7 Implied Dividend Yield 11.5% 12.5% 13.6% Implied P/E Ratio 8.5x 7.9x 7.2x Anticipated Sources & Uses Anticipated Post-Business Combination Ownership(8) Sources Shares % of Total SPAC Cash(2) $361.2 Company Group’s Unitholders 95.5 64.4% PIPE from Farallon 75.0 Trinity’s Public Shareholders 34.5 23.2% Equity Consideration 1,064.7 Trinity Sponsor 4.8 3.3% Total Sources $1,500.9 PIPE from Farallon 7.2 4.8% Management Companies’ Unitholders 6.4 4.3% Uses Total Uses 148.4 100.0% Company Consideration – Equity(3) $1,000.3 Manager Consideration – Equity 64.3 Manager Consideration – Cash 98.2 August 2019 Announce transaction Cash to Balance Sheet 283.3 Expected November 2019 Shareholder Vote and Closing Estimated Transaction Expenses(4) 54.8 Total Uses $1,500.9 Initial Economic Book Value is a non-GAAP measure. Assumes capitalization of Management Companies’ acquisition price. Consists of estimated pre transaction closing $1,000.3 million Companies Members’ equity + $162.5 million Management Companies’ acquisition price + $283.3 million expected cash to the Balance Sheet Reference Price equals to Trust Value per Share of $10.47 based on $357.6 million cash and marketable securities in Trust Account as of March 31, 2019 plus $3.6 million of interest income (based on 30-day T-Bills rate) received until estimated closing date divided by 34.5 million sharesConsists of $756 million Companies Members’ equity as of March 31, 2019 + $244 million net inflow of capital prior to transaction closingEstimated transaction expenses include warrant consent fee, banking fees, legal, accounting and closing costsSee “Appendix I” for detailsCAD is a Non-GAAP measure. See slide 36 for details Assumes illustrative 95% payout ratio of CADAssumes no Trinity’s public shareholders and no existing Broadmark Members redeem. Anticipated Post-Business Combination Ownership does not include 34.5 million public warrants and 12.4 million private placement Sponsor warrants (PIPE Investor will receive 7.2 million of newly issued warrants on the same terms as currently outstanding public warrants and the Trinity Sponsor will forfeit an equal number of private placement warrants) that are exercisable to purchase 1 share of common stock at an $11.50 strike price and expected to be outstanding following completion of the business combination Note: $ in millions, except per share amounts. Assumes no Trinity’s Public Shareholders and no existing Broadmark Company Members redeem Note: All information presented is unaudited and includes non-GAAP financial measures. Does not represent pro forma financial information presented in accordance with Article II of Regulation S-X or other SEC rules relating to presentation of pro forma financial information. Projections and forward looking statements subject to significant risks and uncertainties. See “Disclaimer” and “Appendix II” for further information
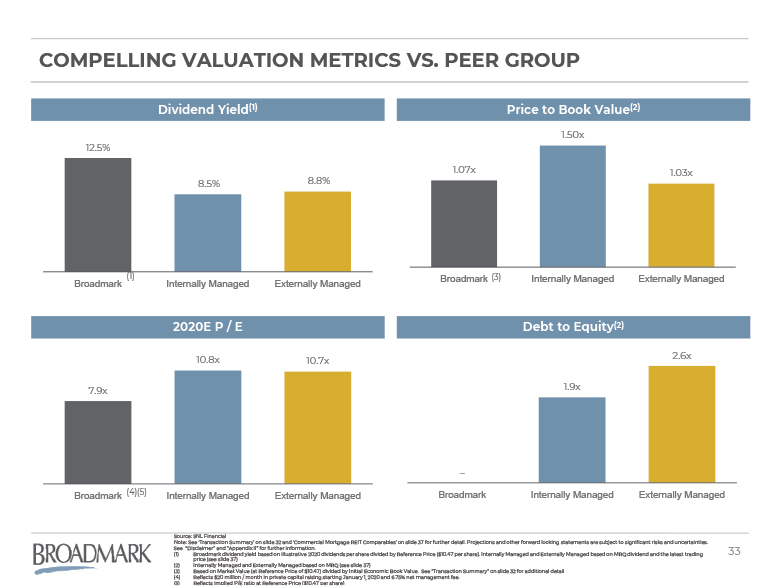
Compelling Valuation Metrics vs. PEER Group Dividend Yield(1) Source: SNL FinancialNote: See ‘Transaction Summary’ on slide 32 and ‘Commercial Mortgage REIT Comparables’ on slide 37 for further detail. Projections and other forward looking statements are subject to significant risks and uncertainties. See “Disclaimer” and “Appendix II” for further information. Broadmark dividend yield based on illustrative 2020 dividends per share divided by Reference Price ($10.47 per share). Internally Managed and Externally Managed based on MRQ dividend and the latest trading price (see slide 37)Internally Managed and Externally Managed based on MRQ (see slide 37)Based on Market Value (at Reference Price of $10.47) divided by Initial Economic Book Value. See “Transaction Summary” on slide 32 for additional detailReflects $20 million / month in private capital raising starting January 1, 2020 and 6.75% net management fee. Reflects implied P/E ratio at Reference Price ($10.47 per share) Price to Book Value(2) Debt to Equity(2) 2020E P / E (3)

Appendix Section 4
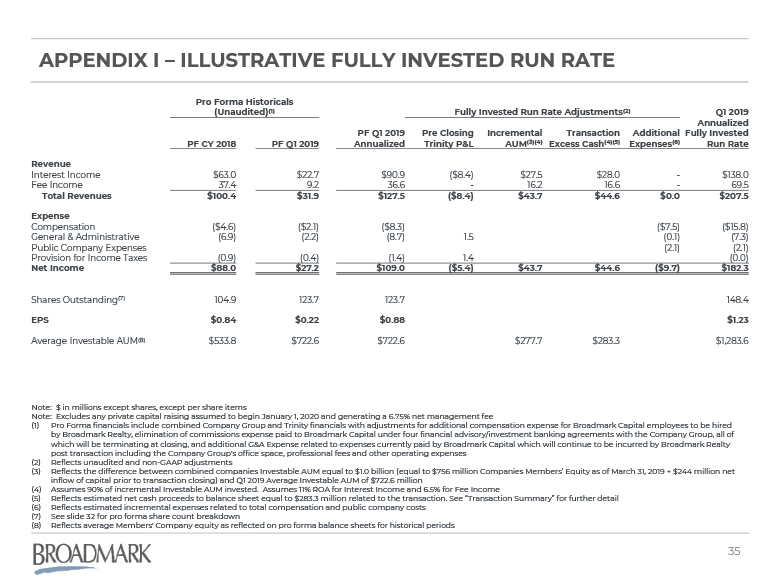
Appendix I – Illustrative Fully Invested Run Rate Note: $ in millions except shares, except per share itemsNote: Excludes any private capital raising assumed to begin January 1, 2020 and generating a 6.75% net management feePro Forma financials include combined Company Group and Trinity financials with adjustments for additional compensation expense for Broadmark Capital employees to be hired by Broadmark Realty, elimination of commissions expense paid to Broadmark Capital under four financial advisory/investment banking agreements with the Company Group, all of which will be terminating at closing, and additional G&A Expense related to expenses currently paid by Broadmark Capital which will continue to be incurred by Broadmark Realty post transaction including the Company Group's office space, professional fees and other operating expensesReflects unaudited and non-GAAP adjustments Reflects the difference between combined companies Investable AUM equal to $1.0 billion (equal to $756 million Companies Members’ Equity as of March 31, 2019 + $244 million net inflow of capital prior to transaction closing) and Q1 2019 Average Investable AUM of $722.6 million Assumes 90% of incremental Investable AUM invested. Assumes 11% ROA for Interest Income and 6.5% for Fee IncomeReflects estimated net cash proceeds to balance sheet equal to $283.3 million related to the transaction. See “Transaction Summary” for further detailReflects estimated incremental expenses related to total compensation and public company costsSee slide 32 for pro forma share count breakdownReflects average Members' Company equity as reflected on pro forma balance sheets for historical periods Pro Forma Historicals (Unaudited)(1) Fully Invested Run Rate Adjustments(2) Q1 2019 PF Q1 2019 Pre Closing Incremental Transaction Additional AnnualizedFully Invested PF CY 2018 PF Q1 2019 Annualized Trinity P&L AUM(3)(4) Excess Cash(4)(5) Expenses(6) Run Rate Revenue Interest Income $63.0 $22.7 $90.9 ($8.4) $27.5 $28.0 - $138.0 Fee Income 37.4 9.2 36.6 - 16.2 16.6 - 69.5 Total Revenues $100.4 $31.9 $127.5 ($8.4) $43.7 $44.6 $0.0 $207.5 Expense Compensation ($4.6) ($2.1) ($8.3) ($7.5) ($15.8) General & Administrative (6.9) (2.2) (8.7) 1.5 (0.1) (7.3) Public Company Expenses (2.1) (2.1) Provision for Income Taxes (0.9) (0.4) (1.4) 1.4 (0.0) Net Income $88.0 $27.2 $109.0 ($5.4) $43.7 $44.6 ($9.7) $182.3 Shares Outstanding(7) 104.9 123.7 123.7 148.4 EPS $0.84 $0.22 $0.88 $1.23 Average Investable AUM(8) $533.8 $722.6 $722.6 $277.7 $283.3 $1,283.6
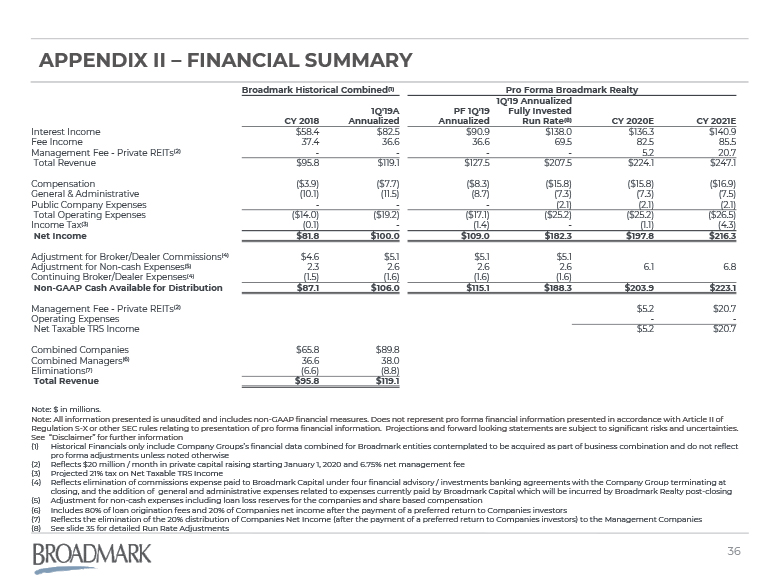
Appendix II – Financial summary Note: $ in millions. Note: All information presented is unaudited and includes non-GAAP financial measures. Does not represent pro forma financial information presented in accordance with Article II of Regulation S-X or other SEC rules relating to presentation of pro forma financial information. Projections and forward looking statements are subject to significant risks and uncertainties. See “Disclaimer” for further information Historical Financials only include Company Groups’s financial data combined for Broadmark entities contemplated to be acquired as part of business combination and do not reflect pro forma adjustments unless noted otherwiseReflects $20 million / month in private capital raising starting January 1, 2020 and 6.75% net management feeProjected 21% tax on Net Taxable TRS IncomeReflects elimination of commissions expense paid to Broadmark Capital under four financial advisory / investments banking agreements with the Company Group terminating at closing, and the addition of general and administrative expenses related to expenses currently paid by Broadmark Capital which will be incurred by Broadmark Realty post-closingAdjustment for non-cash expenses including loan loss reserves for the companies and share based compensationIncludes 80% of loan origination fees and 20% of Companies net income after the payment of a preferred return to Companies investorsReflects the elimination of the 20% distribution of Companies Net Income (after the payment of a preferred return to Companies investors) to the Management CompaniesSee slide 35 for detailed Run Rate Adjustments Broadmark Historical Combined(1) Pro Forma Broadmark Realty 1Q'19 Annualized 1Q'19A PF 1Q'19 Fully Invested CY 2018 Annualized Annualized Run Rate(8) CY 2020E CY 2021E Interest Income $58.4 $82.5 $90.9 $138.0 $136.3 $140.9 Fee Income 37.4 36.6 36.6 69.5 82.5 85.5 Management Fee - Private REITs(2) - - - - 5.2 20.7 Total Revenue $95.8 $119.1 $127.5 $207.5 $224.1 $247.1 Compensation ($3.9) ($7.7) ($8.3) ($15.8) ($15.8) ($16.9) General & Administrative (10.1) (11.5) (8.7) (7.3) (7.3) (7.5) Public Company Expenses - - - (2.1) (2.1) (2.1) Total Operating Expenses ($14.0) ($19.2) ($17.1) ($25.2) ($25.2) ($26.5) Income Tax(3) (0.1) - (1.4) - (1.1) (4.3) Net Income $81.8 $100.0 $109.0 $182.3 $197.8 $216.3 Adjustment for Broker/Dealer Commissions(4) $4.6 $5.1 $5.1 $5.1 Adjustment for Non-cash Expenses(5) 2.3 2.6 2.6 2.6 6.1 6.8 Continuing Broker/Dealer Expenses(4) (1.5) (1.6) (1.6) (1.6) Non-GAAP Cash Available for Distribution $87.1 $106.0 $115.1 $188.3 $203.9 $223.1 Management Fee - Private REITs(2) $5.2 $20.7 Operating Expenses - - Net Taxable TRS Income $5.2 $20.7 Combined Companies $65.8 $89.8 Combined Managers(6) 36.6 38.0 Eliminations(7) (6.6) (8.8) Total Revenue $95.8 $119.1

Annualized 2019E Div. Prem./ Price Market Ent. Dividend (MRQ) Payout BV / (Disc.) P/E Multiple Debt / Name Ticker 8/09/2019 Cap Value $ Yield Ratio Share to BV 2019E 2020E Equity Internally Managed Ladder Capital Corp LADR $16.79 $1,806 $6,382 $1.36 8.1% 81.7% $13.63 1.23x 10.1x 9.7x 2.8x Arbor Realty Trust, Inc. ABR 12.61 1,190 5,682 1.12 8.9% 88.2% 9.83 1.28x 9.9x 10.2x 3.6x Sachem Capital Corp.(1) SACH 5.11 110 142 0.48 9.4% 100.0% 3.02 1.69x 10.6x 10.2x 0.5x Manhattan Bridge Capital, Inc LOAN 6.20 60 83 0.48 7.7% 106.7% 3.43 1.81x 13.8x 12.9x 0.7x Internal Average 4 8.5% 94.1% 1.50x 11.1x 10.8x 1.9x Externally Managed Starwood Property Trust, Inc. STWD $23.68 $6,666 $17,806 $1.92 8.1% 102.7% $16.49 1.44x 12.7x 10.8x 2.3x Blackstone Mortgage Trust, Inc. BXMT 35.48 4,765 15,361 2.48 7.0% 92.2% 27.91 1.27x 13.2x 13.3x 2.8x Colony Credit Real Estate, Inc. CLNC 15.13 1,945 7,639 1.74 11.5% NM 19.70 0.77x 12.6x 8.4x 2.0x Apollo Commercial Real Estate Finance, Inc. ARI 18.95 2,909 5,795 1.84 9.7% 97.9% 17.40 1.09x �� 10.1x 10.1x 1.1x KKR Real Estate Finance Trust Inc. KREF 19.39 1,113 5,950 1.72 8.9% 102.7% 19.54 0.99x 11.6x 11.1x 4.5x TPG RE Finance Trust, Inc. TRTX 19.65 1,456 5,690 1.72 8.8% 98.9% 20.08 0.98x 11.3x 11.1x 2.9x Granite Point Mortgage Trust Inc. GPMT 18.68 1,025 3,664 1.68 9.0% 111.2% 18.74 1.00x 12.4x 11.0x 2.7x Ready Capital Corporation RC 15.03 668 3,585 1.60 10.6% 104.6% 16.35 0.92x 9.8x 8.4x 3.8x Exantas Capital Corp. XAN 11.40 358 2,367 0.90 7.9% 83.3% 14.06 0.81x 10.6x 9.3x 3.5x Ares Commercial Real Estate Corporation ACRE 15.20 435 1,654 1.32 8.7% 99.3% 14.75 1.03x 11.4x 10.9x 2.9x Jernigan Capital, Inc. JCAP 19.68 434 695 1.40 7.1% 73.7% 19.03 1.03x 10.4x 13.8x 0.4x External Average 11 8.8% 96.6% 1.03x 11.4x 10.7x 2.6x Appendix III - Commercial Mortgage REIT Comparables Source SNL FinancialNote: $ in millions, except per share items. Balance Sheet data and Income Statement data as of June 30, 2019 unless otherwise notedBalance Sheet data and Income Statement data as of March 31, 2019

Appendix IV – Asset Manager Comparables Source SNL FinancialNote: $ in millions, except per share items. Balance Sheet data and Income Statement data as of June 30, 2019 unless otherwise notedBalance Sheet data and Income Statement data as of April 30, 2019Balance Sheet data and Income Statement data as of March 31, 2019 Dividend Price Market Ent. Yield Revenue Multiple P/E Multiple Name Ticker 8/09/2019 Cap Value AUM MRQ MRQ 2019E 2020E 2019E 2020E Traditional Asset Managers BlackRock, Inc. BLK $426.33 $67,521 $71,125 $6,842,482 3.1% 4.9x 4.5x 15.5x 13.9x T. Rowe Price Group, Inc. TROW 108.65 25,594 24,848 1,125,000 2.8% 4.4x 4.2x 13.9x 13.2x Invesco Ltd. IVZ 16.37 7,691 18,549 1,197,800 11.0% 4.2x 3.7x 6.6x 6.0x Franklin Resources, Inc. BEN 29.32 14,768 11,200 715,200 3.5% 1.9x 1.9x NM 10.5x Affiliated Managers Group, Inc. AMG 80.02 4,052 6,999 772,200 1.6% 3.1x 3.2x 5.9x 5.5x SEI Investments Company SEIC 57.51 8,685 8,051 945,045 2.3% 4.9x 4.6x NM 16.0x Eaton Vance Corp.(1) EV 41.30 4,523 5,906 469,938 3.4% 3.5x 3.3x 12.3x 11.6x Legg Mason, Inc. LM 37.64 3,265 5,927 780,200 4.3% 2.0x 2.0x 13.4x 10.3x Hamilton Lane Incorporated HLNE 56.32 3,048 3,133 64,304 2.0% 10.8x 9.3x 29.0x 28.2x Federated Investors, Inc. FII 32.48 3,158 3,432 502,247 3.3% 2.6x 2.5x 13.1x 11.9x AllianceBernstein Holding L.P. AB 27.73 2,679 2,681 539,800 7.1% 0.8x 0.8x 11.5x 9.7x Virtus Investment Partners, Inc. VRTS 94.97 660 2,376 105,007 2.3% 4.2x 4.1x 6.8x 6.2x Artisan Partners Asset Management Inc. APAM 27.75 2,159 2,346 113,843 7.9% 2.9x 2.8x 10.4x 9.6x Cohen & Steers, Inc. CNS 52.96 2,502 2,487 62,393 2.7% 6.2x 5.7x 21.8x 20.4x Victory Capital Holdings, Inc.(2) VCTR 17.23 1,164 1,368 58,119 NM 2.2x 1.5x 6.7x 4.3x WisdomTree Investments, Inc. WETF 5.38 817 1,090 60,387 2.2% 4.0x 3.8x 25.6x 21.5x Waddell & Reed Financial, Inc. WDR 16.51 1,206 1,176 71,876 6.1% 1.1x 1.1x 9.7x 10.3x Pzena Investment Management, Inc. PZN 7.41 519 565 37,300 NM 3.6x 3.3x 10.2x 9.5x GAMCO Investors, Inc. GBL 17.98 486 451 37,273 NM NA NA NA NA Diamond Hill Investment Group, Inc. DHIL 137.60 442 367 21,612 NA NA NA NA NA Westwood Holdings Group, Inc. WHG 30.36 256 210 15,388 NM NA NM NM NA Hennessy Advisors, Inc. HNNA 9.60 72 68 5,136 4.6% NA NA NA NA Average: 22 4.1% 3.7x 3.5x 13.3x 12.1x Alternative Asset Managers KKR & Co. Inc. KKR $25.17 $21,250 $62,883 $205,659 2.0% NM NM 9.2x 12.9x Blackstone Group Inc. BX 47.56 56,821 74,552 545,482 3.1% 14.2x 10.8x 26.1x 15.3x Carlyle Group L.P. CG 22.50 7,678 15,915 222,658 3.4% 7.6x 5.6x 8.7x 8.9x Apollo Global Management, LLC APO 32.84 13,236 17,275 311,862 5.6% 10.8x 9.8x 27.4x 10.9x Oaktree Capital Group, LLC OAK 51.62 8,241 15,773 120,368 8.1% 9.2x 9.5x 17.2x 14.3x Ares Management Corporation ARES 28.20 6,322 14,878 142,108 4.5% 12.3x 9.6x 37.7x 14.8x Och-Ziff Capital Management Group Inc. OZM 23.91 878 1,919 33,659 5.4% 3.0x 2.7x 36.9x 5.4x Average: 7 4.6% 9.5x 8.0x 23.3x 11.8x Total Average: 29 4.3% 5.2x 4.6x 16.3x 12.0x
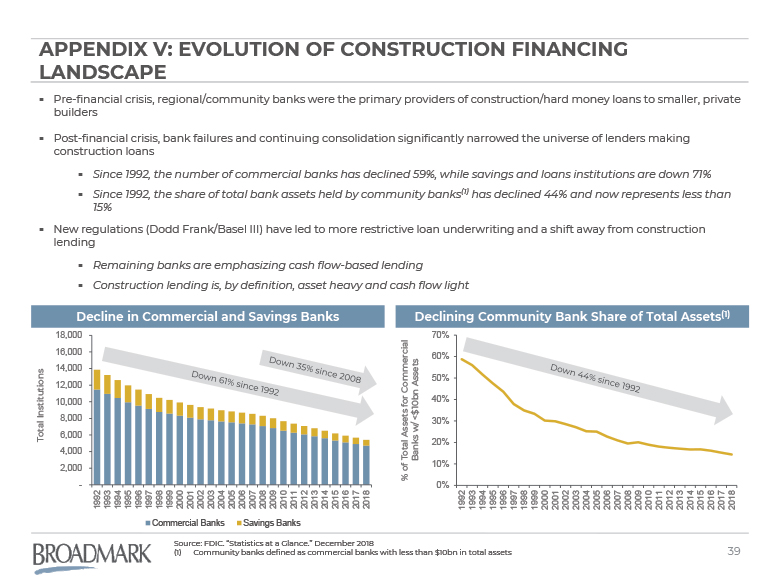
Pre-financial crisis, regional/community banks were the primary providers of construction/hard money loans to smaller, private buildersPost-financial crisis, bank failures and continuing consolidation significantly narrowed the universe of lenders making construction loansSince 1992, the number of commercial banks has declined 59%, while savings and loans institutions are down 71%Since 1992, the share of total bank assets held by community banks(1) has declined 44% and now represents less than 15%New regulations (Dodd Frank/Basel III) have led to more restrictive loan underwriting and a shift away from construction lending Remaining banks are emphasizing cash flow-based lendingConstruction lending is, by definition, asset heavy and cash flow light Appendix V: EVOLUTION OF construction FINANCING LANDSCAPE Decline in Commercial and Savings Banks Source: FDIC. “Statistics at a Glance.” December 2018Community banks defined as commercial banks with less than $10bn in total assets Down 61% since 1992 Down 35% since 2008 Declining Community Bank Share of Total Assets(1) Down 44% since 1992

Private Residential Construction Spending ($mm)(3) Appendix VI: Steady recovery in Housing CONSTRUCTION TRENDS Private residential construction spending and housing starts have largely recovered from the post financial crisis lowsTotal housing starts remain below historical averagesAccording to Freddie Mac, 1.62 million new housing units are needed annually to meet current demand:more than 370k additional units more per year than current housing starts~2.5 million housing units cumulative shortage The reduction in new supply is evidenced by the median home age having risen to 39 years Private Housing Starts(1)(2) U.S. Census Bureau and U.S. Department of Housing and Urban Development, Housing Starts: Total: New Privately Owned Housing Units Started, retrieved from FRED, Federal Reserve Bank of St. LouisFreddie Mac. “The Major Challenge of Inadequate U.S. Housing Supply.” December 5, 2018U.S. Census Bureau, Total Private Construction Spending: Residential, retrieved from FRED, Federal Reserve Bank of St. LouisReflects additional housing units needed to maintain an efficient marketplace, according to Freddie Mac Annual Housing Need Composition(2)

Appendix VII: definitions of property classifications and loan purpose Property Classification:For Sale Residential - All for sale residential product including single family homes, townhomes, condominiums and other attached product.For Rent Residential - All rental residential product including multifamily rental apartments and senior housing. Commercial/Other - Non-residential real estate including retail, office, industrial and hotels. Horizontal Development - Vertical construction ready sites with improvements including finished single-family lots, finished townhome lots and multifamily and commercial development sites.Raw Land - Undeveloped land prior to horizontal development.Loan Purpose:Vertical Construction - Loans which utilize at least 20% of face amount to fund vertical construction of residential, commercial and mixed-use properties.Horizontal Development - Loans which do not fund vertical construction and utilize at least 20% of face amount to fund horizontal improvements including: initial site preparation, ground clearing, installing utilities, and road, sidewalk and gutter paving. Investment - Loans which do not fund vertical or horizontal construction including financings of built real estate properties or raw land.