Exhibit 99.2
Q4 FY19 Results November 7, 2019 Ward Dickson Chief Financial Officer Jeff Chalovich Chief Commercial Officer and President, Corrugated Packaging Pat Lindner Chief Innovation Officer and President, Consumer Packaging Steve Voorhees Chief Executive Officer
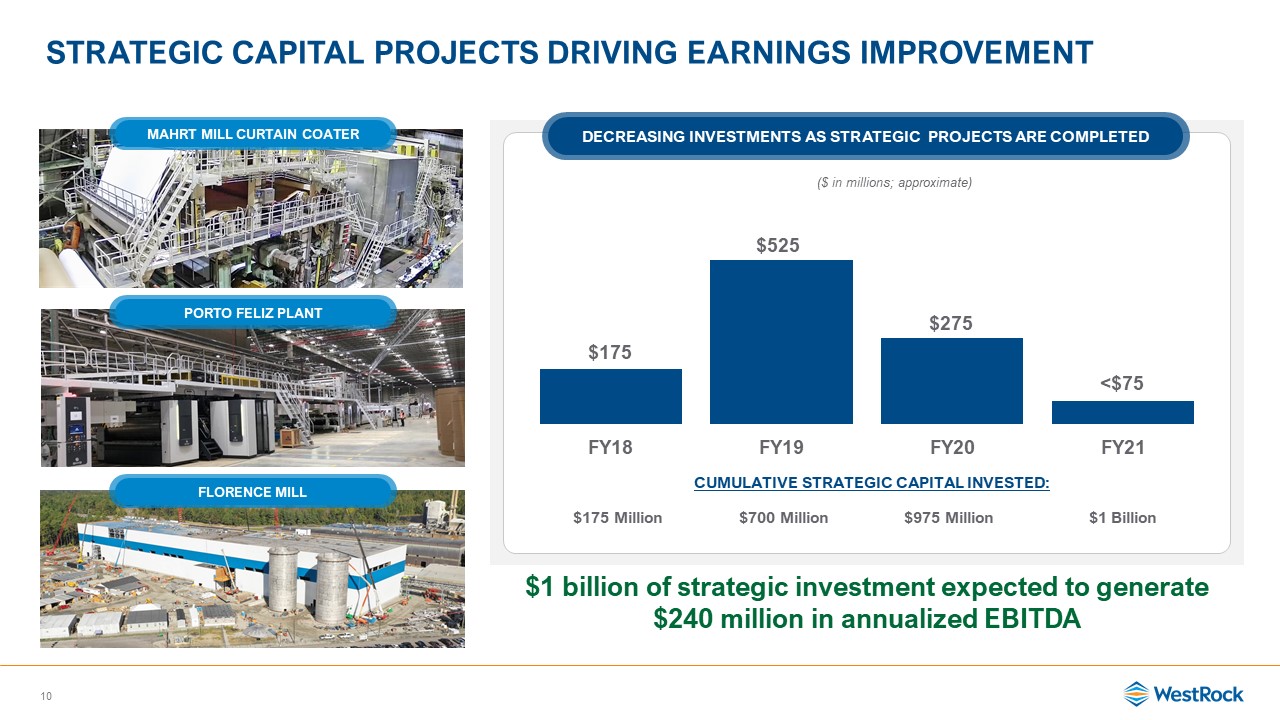
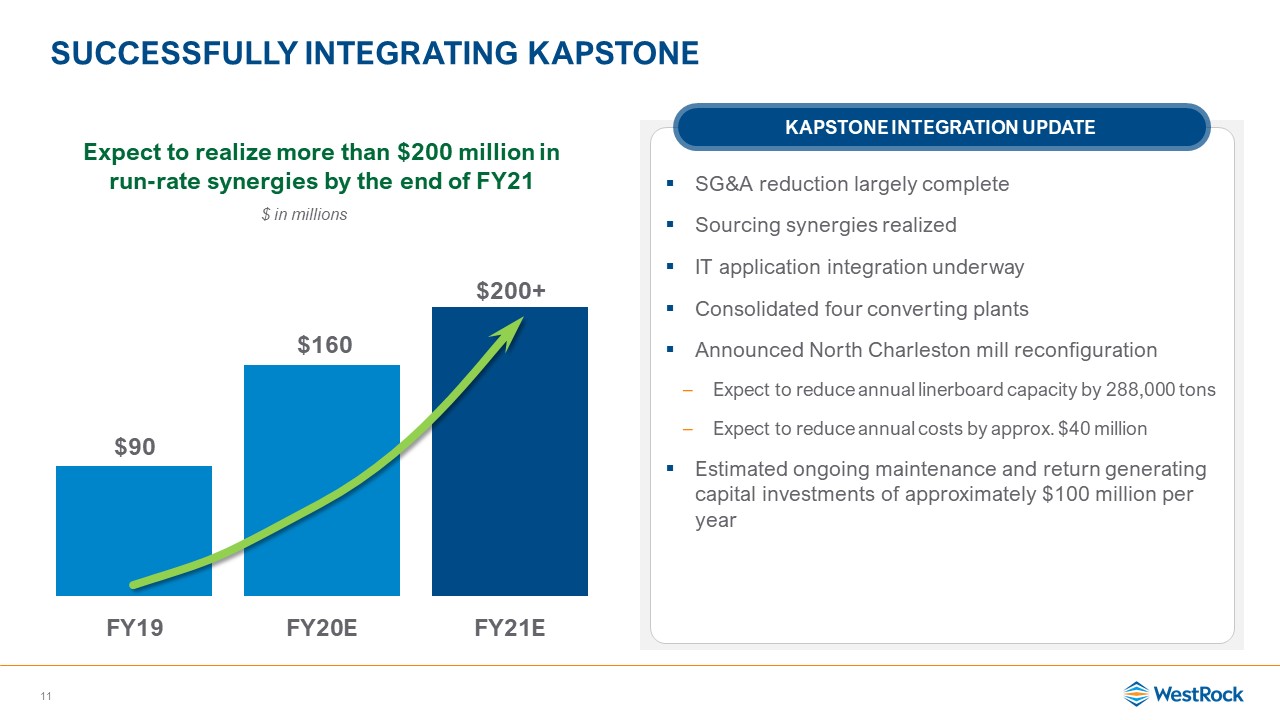
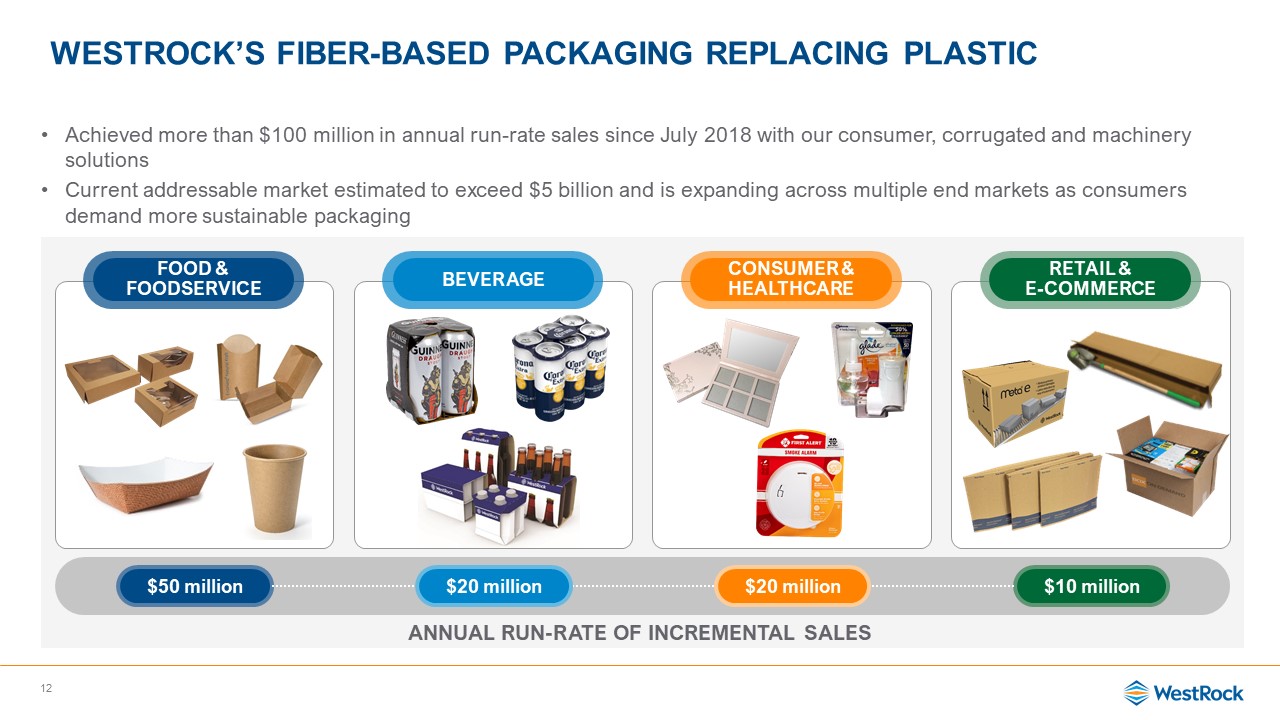
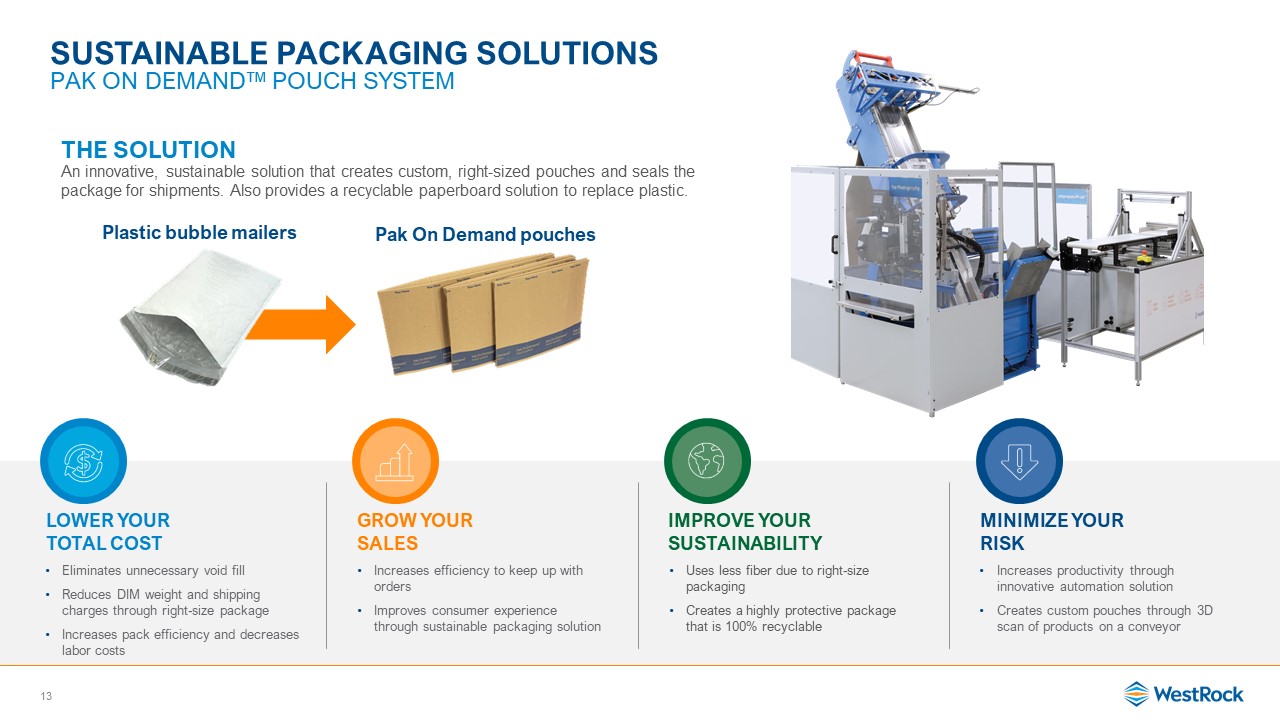
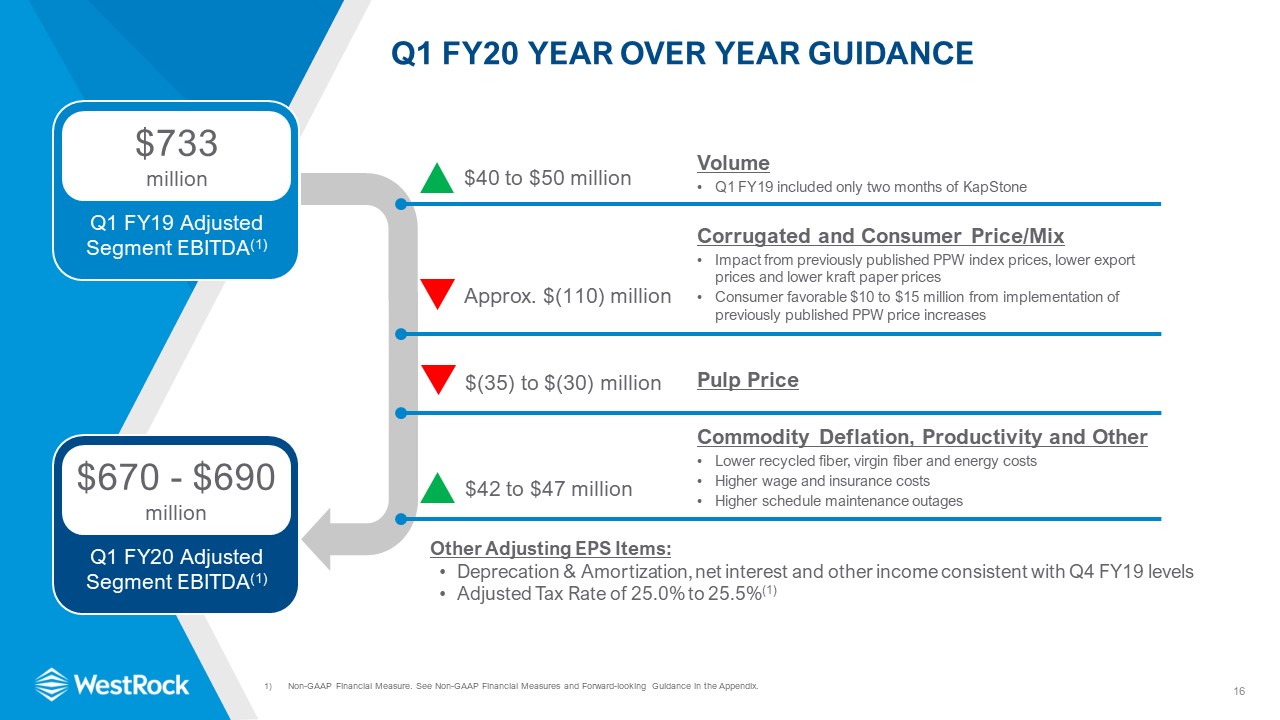
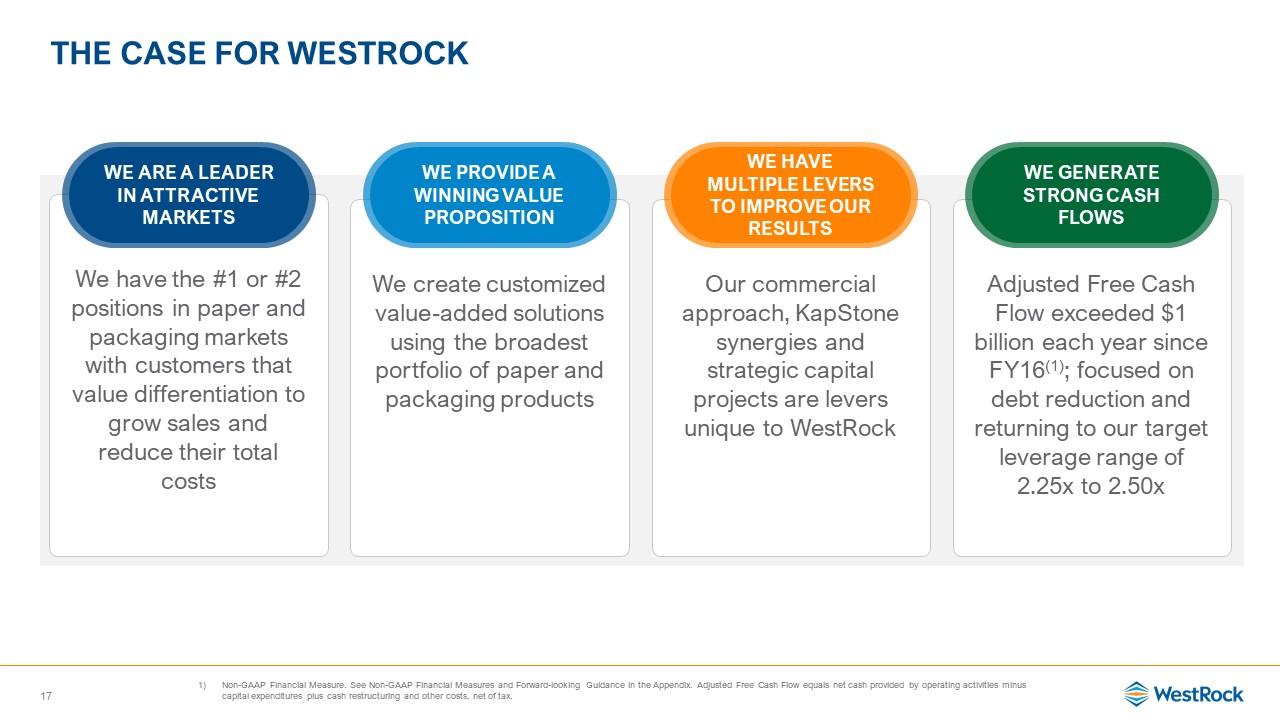
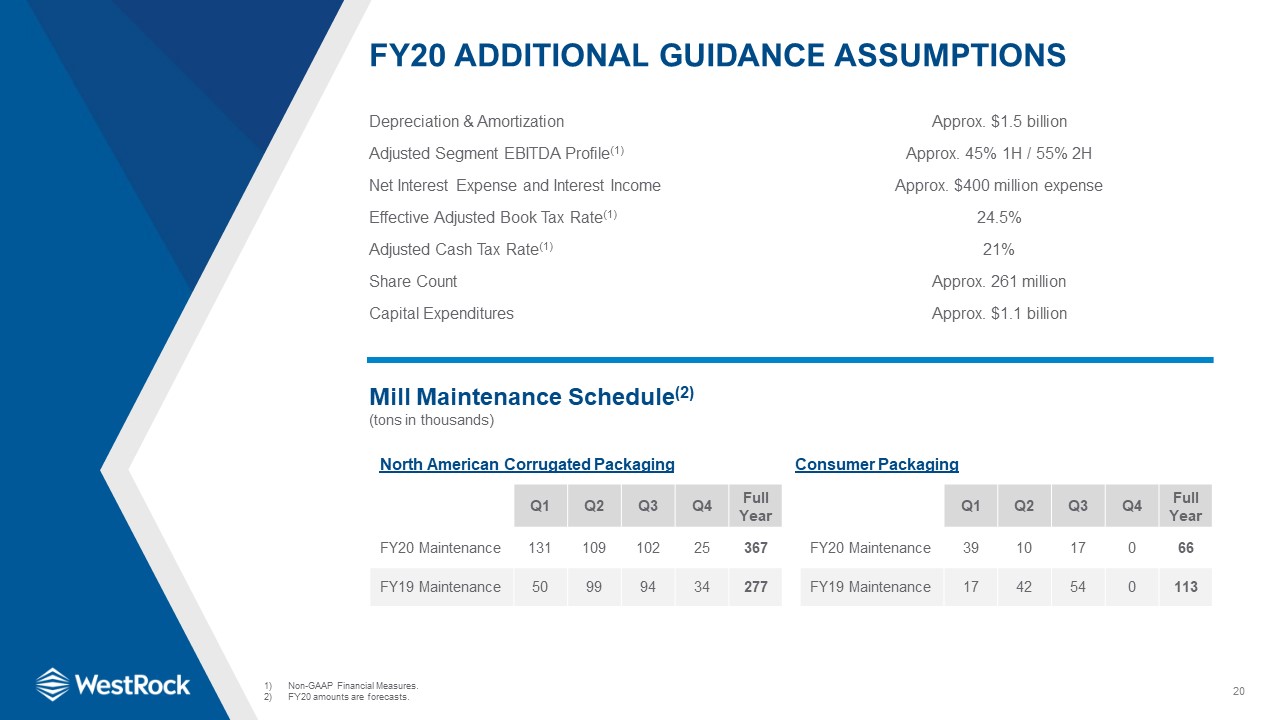
Forward Looking Statements:This presentation contains forward-looking statements within the meaning of the Private Securities Litigation Reform Act of 1995, including but not limited to the statements on the slides entitled “FY19 WestRock Results”, “Q4 FY19 Key Highlights”, “Strategic Capital Projects Driving Earnings Improvement”, “Successfully Integrating KapStone”, “WestRock’s Fiber-Based Packaging is Replacing Plastic”, “Sustainable Packaging Solutions: Pak On Demand™ Pouch System”, “Award-Winning Sustainable Packaging Solution: First Alert Smoke Detector”, “FY20 Financial Guidance”, “Q1 FY20 Year Over Year Guidance”, “The Case for WestRock”, “FY20 Additional Guidance Assumptions”, “Key Commodity Annual Consumption Volumes” and “WestRock Since the Merger” that give guidance or estimates for future periods as well as statements regarding, among other things, that (1) the Florence strategic capital project is on track to start production in Spring 2020; (2) we are focused on debt reduction and returning to our targeted leverage range of 2.25x to 2.50x; (3) our forecasted strategic capital investments for fiscal 2020 and 2021, and our expectation that these projects will generate $240 million in annualized EBITDA; (4) we expect to realize more than $200 million in run-rate synergies from the KapStone acquisition by the end of fiscal 2021; (5) we expect that the North Charleston mill reconfiguration will reduce annual linerboard capacity by 288,000 tons and our annual costs by approximately $40 million; (6) we estimate ongoing maintenance and return generating capital investments at KapStone of approximately $100 million per year; (7) the current addressable market for plastic replacement is estimated to exceed $5 billion; (8) statements we make with respect to the potential benefits of the Pak On Demand™ pouch system on slide 13 and the First Alert home safety solutions on slide 14; (9) the financial guidance on slides 15 and 16; (10) the FY20 additional guidance assumptions and mill maintenance schedule presented on slide 20; and (11) the key commodity annual consumption volumes presented on slide 21.Forward-looking statements are based on our current expectations, beliefs, plans or forecasts and are typically identified by words or phrases such as "may," "will," "could," "should," "would," "anticipate," "estimate," "expect," "project," "intend," "plan," "believe," "target," "prospects," "potential" and "forecast," and other words, terms and phrases of similar meaning. Forward-looking statements involve estimates, expectations, projections, goals, forecasts, assumptions, risks and uncertainties. WestRock cautions readers that a forward-looking statement is not a guarantee of future performance and that actual results could differ materially from those contained in the forward-looking statement. WestRock’s businesses are subject to a number of general risks that would affect any such forward-looking statements, including, among others, decreases in demand for their products; increases in energy, raw materials, shipping and capital equipment costs; reduced supply of raw materials; fluctuations in selling prices and volumes; intense competition; the potential loss of certain customers; the scope, costs, timing and impact of any restructuring of our operations and corporate and tax structure; the occurrence of a natural disaster, such as hurricanes or other unanticipated problems, such as labor difficulties, equipment failure or unscheduled maintenance and repair; our desire or ability to continue to repurchase our stock; risks associated with integrating KapStone’s operations into our operations and our ability to realize anticipated synergies and productivity improvements; risks associated with completing our strategic capital projects on the anticipated timelines and realizing our anticipated EBITDA improvements; and adverse changes in general market and industry conditions. Such risks and other factors that may impact management's assumptions are more particularly described in our filings with the Securities and Exchange Commission, including in Item 1A under the caption "Risk Factors" in our Annual Report on Form 10-K for the year ended September 30, 2018. The information contained herein speaks as of the date hereof and WestRock does not have or undertake any obligation to update or revise its forward-looking statements, whether as a result of new information, future events or otherwise.Non-GAAP Financial Measures:We may from time to time be in possession of certain information regarding WestRock that applicable law would not require us to disclose to the public in the ordinary course of business, but would require us to disclose if we were engaged in the purchase or sale of our securities. This presentation shall not be considered to be part of any solicitation of an offer to buy or sell WestRock securities. This presentation also may not include all of the information regarding WestRock that you may need to make an investment decision regarding WestRock securities. Any investment decision should be made on the basis of the total mix of information regarding WestRock that is publicly available as of the date of the investment decision.We report our financial results in accordance with accounting principles generally accepted in the United States ("GAAP"). However, management believes certain non-GAAP financial measures provide users with additional meaningful financial information that should be considered when assessing our ongoing performance. Management also uses these non-GAAP financial measures in making financial, operating and planning decisions and in evaluating our performance. Non-GAAP financial measures should be viewed in addition to, and not as an alternative for, our GAAP results. The non-GAAP financial measures we present may differ from similarly captioned measures presented by other companies. Forward Looking Statements; Non-GAAP Financial Measures 2
FULL YEAR FY19 FY18 Net Sales(1) $18,289 $15,847 Adjusted Segment Income(2) $1,772 $1,649 Adjusted Segment EBITDA(2) $3,238 $2,872 % Margin(2) 17.7% 18.1% Adjusted Earnings Per Diluted Share(3) $3.98 $4.09 Adjusted Operating Cash Flow(2) $2,413 $2,462 Capital Expenditures $1,369 $1,000 Adjusted Free Cash Flow(2) $1,044 $1,462 $ in millions, except for per share items FY19 WestRock Results FY19 Financial Highlights 3 Excludes Recycling sales in FY18. See Reconciliations in the Appendix.Non-GAAP Financial Measure. See Non-GAAP Financial Measures and Reconciliations in the Appendix.Non-GAAP Financial Measure. On a GAAP basis, earnings per diluted share were $3.33 in FY19 and $7.34 in FY18. See Non-GAAP Financial Measures and Reconciliations in the Appendix. Differentiated Strategy Drove Results Debt Reduction Remains Priority Reduced total debt by $757 million since December 2018; Net Leverage of 2.92x(2) Invested to Further Optimize System Mahrt, Covington and Porto Feliz investments complete; ramping to achieve expected benefitsFlorence on track to start production in Spring 2020 Sales and EBITDA growth driven by successful ongoing integration of KapStonePer-day organic box shipment growth of 2.5%; grew faster than the industryGenerated $1.044 billion of Adjusted Free Cash Flow(2); fourth consecutive year of more than $1 billionAchieved $7.3 billion of annual sales from customers buying more than $1 million from each segmentAchieved more than $100 million annual run-rate of plastic replacement sales
Q4 FY19 Key Highlights Net sales of $4.65 billion, up 13% year-over-year(1)Adjusted Segment EBITDA of $891 million, up 11% year-over-year(2); Adjusted Segment EBITDA margin of 19.1%(2)North American Corrugated Packaging Adjusted Segment EBITDA margin of 23.2%(2)Consumer Packaging Adjusted Segment EBITDA margin of 16.1%, up 100 basis points from prior year(2)Adjusted EPS of $1.24(3)Adjusted Operating Cash Flow of $942 million(2) North American Corrugated Packaging organic box shipment growth of 2.2% on per day basis131,000 tons of maintenance and economic downtime across North American Corrugated mill systemAdditional costs associated with Hurricane Dorian impacted quarter by $8 million pre-taxConsumer Packaging converting shipments up less than 1%Consumer Packaging backlogs of 3 to 6 weeks Invested approximately $700 million in strategic projects through Q4 FY19 of the targeted $1 billionKapStone annual run-rate synergies of $90 million; announced North Charleston mill reconfiguration Net Leverage ratio of 2.92x(2); focused on returning to targeted leverage range of 2.25x to 2.50xIncreased dividend by 2.2% to annualized rate of $1.86 per share Excludes Recycling sales in Q4 FY18. See Reconciliations in the Appendix.Non-GAAP Financial Measure. See Non-GAAP Financial Measures and Reconciliations in the Appendix.Non-GAAP Financial Measure. On a GAAP basis, earnings per diluted share were $1.20 in Q4 FY19 and $1.08 in Q4 FY18. See Non-GAAP Financial Measures and Reconciliations in the Appendix. 4 Financial Performance Markets and Operations Capital allocation
Q4 FY19 WestRock Results 5 +$89 Excludes Recycling sales in Q4 FY18. See Reconciliations in the Appendix.Non-GAAP Financial Measure. See Non-GAAP Financial Measures and Reconciliations in the Appendix.Non-GAAP Financial Measure. On a GAAP basis, earnings per diluted share were $1.20 in Q4 FY19 and $1.08 in Q4 FY18. See Non-GAAP Financial Measures and Reconciliations in the Appendix. Sales and EBITDA growth reflect acquisition of KapStoneDeclines in external containerboard, kraft paper and paperboard shipments partially offset by growth in converting shipments Productivity and cost deflation more than offset year-over-year decline in containerboard, kraft and pulp pricesStrong operating cash flow generation FOURTH QUARTER $ in millions, EXCEPT PER SHARE ITEMS FY19 FY18 Net Sales(1) $4,652 $4,131 Adjusted Segment Income(2) $523 $495 Adjusted Segment EBITDA(2) $891 $802 % Margin(2) 19.1% 19.4% Adjusted Earnings Per Diluted Share(3) $1.24 $1.29 Adjusted Operating Cash Flow(2) $942 $926 +11% Adjusted Segment EBITDA(2) ($ in millions) Adjusted segment ebitda(2) Highlights
Q4 FY19 Corrugated Packaging Results 6 Excludes Recycling sales in Q4 FY18. See Reconciliations in the Appendix.Non-GAAP Financial Measure. See Non-GAAP Financial Measures and Reconciliations in the Appendix. FOURTH QUARTER $ in millions FY19 FY18 Net Sales(1) $3,019 $2,425 Adjusted Segment Income(2) $408 $394 Adjusted Segment EBITDA(2) $640 $562 % Margin(2) 22.0% 24.4% North American Adjusted Segment EBITDA Margin(2) 23.2% 24.3% Brazil Adjusted Segment EBITDA Margin(2) 34.3% 27.1% +14% Adjusted segment ebitda(2) Segment Highlights North American Adjusted Segment EBITDA margins 20% or greater for eight consecutive quarters(2) North American box shipments up 19% year-over-year; 2.2% organic growth, excluding KapStoneGrowth in agriculture, bakery, e-commerce, pizza, protein and retail slightly offset by declines in beverageLower year-over-year external containerboard and kraft paper shipments, excluding KapStoneLower domestic and export containerboard, kraft paper and pulp pricingEconomic downtime of 97,000 tons and maintenance downtime of 34,000 tonsReceived $10 million of business interruption insurance recovery +$78 Adjusted Segment EBITDA(2) ($ in millions)
Westrock Driving box shipment growth and EBITDA Improvement 7 Consistently focusing on quality, performance, on-time delivery and service to our customersDriving value through differentiated portfolio and innovative solutionsUnparalleled machinery and automation platform; approximately 35% of our corrugated packaging sales are to customers that use our machinery and automationDesign and engineering capabilities that meet customers’ protection, branding, performance and sustainability requirements with the lightest weight and optimal fiber mixScale, assets and enterprise portfolio that meet local, national and global customers’ needsSolving critical customer challenges through innovation, supply chain optimization, sustainability, e-commerce, shelf-ready and retail-ready packaging solutions FY16-FY18 North American Corrugated Adjusted Segment EBITDA margins have been recast to account for the move of the displays business from the Consumer Packaging segment to the Corrugated Packaging segment. Non-GAAP Financial Measure. See Non-GAAP Financial Measures and Reconciliations in the Appendix. WestRock North American Corrugated Containers Per Shipping Day (MMSF) FY16 FY17 FY18 FY19 17.5% 17.3% 21.8% 21.9% North American Corrugated Adjusted Segment EBITDA Margin(1)
Q4 FY19 Consumer Packaging Results 8 FOURTH QUARTER $ in millions FY19 FY18 Net Sales(1) $1,669 $1,709 Adjusted Segment Income(1) $135 $121 Adjusted Segment EBITDA(1) $269 $258 % Margin(1) 16.1% 15.1% +4% Adjusted Segment EBITDA(1) ($ in millions) +$11 Price/mix primarily from the flow through of previously announced PPW price changes Converting shipments up less than 1%Lower paperboard shipments due primarily to restoration of SBS and CNK inventories following strategic outagesBacklogs of 3 to 6 weeks across SBS, CNK and CRBCost deflation driven by lower energy, recycled fiber and chemicals costs Non-GAAP Financial Measure. See Non-GAAP Financial Measures and Reconciliations in the Appendix. Adjusted Segment EBITDA(1) Segment Highlights
Industry’s Most Comprehensive Product Portfolio Driving Growth 9 Broadest Portfolio of Differentiated Paper Grades and Packaging Solutions SBS URB CRB CNK® White Top Linerboard Recycled Linerboard / Medium Semi-Chemical Medium Kraft Paper Virgin Linerboard / Medium Customers buying more than $1 million from each segment 102 152 Net Sales to Customers Buying More than $1 Million from Each Segment $4.7 $7.3
Strategic Capital Projects Driving Earnings Improvement 10 $1 billion of strategic investment expected to generate $240 million in annualized EBITDA Decreasing Investments as Strategic Projects are Completed $175 Million $700 Million $975 Million $1 Billion Mahrt mill curtain coater Porto Feliz plant Florence mill
Successfully Integrating KapStone 11 SG&A reduction largely completeSourcing synergies realizedIT application integration underwayConsolidated four converting plantsAnnounced North Charleston mill reconfigurationExpect to reduce annual linerboard capacity by 288,000 tonsExpect to reduce annual costs by approx. $40 millionEstimated ongoing maintenance and return generating capital investments of approximately $100 million per year KapStone Integration Update Expect to realize more than $200 million in run-rate synergies by the end of FY21 $ in millions
WestRock’s Fiber-based Packaging Replacing Plastic $50 million $10 million $20 million $20 million Annual Run-rate of Incremental Sales Achieved more than $100 million in annual run-rate sales since July 2018 with our consumer, corrugated and machinery solutionsCurrent addressable market estimated to exceed $5 billion and is expanding across multiple end markets as consumers demand more sustainable packaging FOOD & FOODSERVICE beverage Retail & e-commerce Consumer & healthcare 12
Sustainable Packaging SolutionsPak On Demand™ Pouch System Eliminates unnecessary void fill Reduces DIM weight and shipping charges through right-size packageIncreases pack efficiency and decreases labor costs Increases efficiency to keep up with ordersImproves consumer experience through sustainable packaging solution Grow your sales Uses less fiber due to right-size packagingCreates a highly protective package that is 100% recyclable Improve your sustainability Increases productivity through innovative automation solutionCreates custom pouches through 3D scan of products on a conveyor Minimize your risk The Solution An innovative, sustainable solution that creates custom, right-sized pouches and seals the package for shipments. Also provides a recyclable paperboard solution to replace plastic. Lower your Total Cost 13 Plastic bubble mailers Pak On Demand pouches
Award-Winning Sustainable Packaging Solutionfirst alert home safety solutions Consolidated SKUs through common card sizes and blistersUse of blister packaging streamlines the filling and sealing processes Improves consumer experience through a sustainable packaging solution and easier-to-open packageHeightened product visibility, protection and security Grow your sales Reduced plastic consumption and overall package weight with NatraLock® paperboard Minimize waste and improve efficiency through use of WestRock’s machinery Improve your sustainability Eliminated any tooling change-over time between SKUsKept the same overall footprint to minimize the impact on existing secondary packaging & SRPs Minimize your risk The Solution Replacing a fully enclosed plastic clamshell package with a more sustainable, efficient and economical blister and carded solution. The redesigned package is more aligned with First Alert’s sustainability goals, streamlines the manufacturing and fulfillment processes and is easier for consumers to open. Lower your Total Cost 14 Before After
Year-over-year price declinesWage, benefit and other cost inflation partially offset by lower year-over-year recycled fiberPositive impact from productivity, KapStone synergies and strategic projectsOperational impacts of Florence and Tres Barras paper machine projects FY20 Financial Guidance Full year impact of previously published PPW indices and declines in external containerboard, kraft paper and pulp pricesBox volumes grow 1% to 2% on a per day basis; Consumer Packaging volumes up 1%Additional month of KapStone sales 15 Adjusted Operating Cash Flow of greater than $2.1 billion(1)Higher cash tax rate and higher working capitalCapex of approximately $1.1 billionExpect to return to $900 million to $1 billion in FY21Annual dividend of $1.86 per share $18.0 to $18.5billion $3.0 to $3.2 billion Adj.Segment EBITDA(1) Net Sales $1.0+ billion Adj. Free Cash Flow(1) Non-GAAP Financial Measure. See Non-GAAP Financial Measures and Forward-looking Guidance in the Appendix.
16 Non-GAAP Financial Measure. See Non-GAAP Financial Measures and Forward-looking Guidance in the Appendix. Q1 FY19 Adjusted Segment EBITDA(1) $733million $40 to $50 million VolumeQ1 FY19 included only two months of KapStone Approx. $(110) million Corrugated and Consumer Price/MixImpact from previously published PPW index prices, lower export prices and lower kraft paper pricesConsumer favorable $10 to $15 million from implementation of previously published PPW price increases Other Adjusting EPS Items: Deprecation & Amortization, net interest and other income consistent with Q4 FY19 levelsAdjusted Tax Rate of 25.0% to 25.5%(1) Q1 FY20 Adjusted Segment EBITDA(1) $670 - $690million Q1 FY20 Year Over Year Guidance $(35) to $(30) million Pulp Price $42 to $47 million Commodity Deflation, Productivity and OtherLower recycled fiber, virgin fiber and energy costsHigher wage and insurance costsHigher schedule maintenance outages
The Case for WESTROCK 17 Non-GAAP Financial Measure. See Non-GAAP Financial Measures and Forward-looking Guidance in the Appendix. Adjusted Free Cash Flow equals net cash provided by operating activities minus capital expenditures plus cash restructuring and other costs, net of tax. We have the #1 or #2 positions in paper and packaging markets with customers that value differentiation to grow sales and reduce their total costs We Are a Leader in Attractive Markets Our commercial approach, KapStone synergies and strategic capital projects are levers unique to WestRock We Have Multiple Levers to Improve Our Results We create customized value-added solutions using the broadest portfolio of paper and packaging products We Provide a Winning Value Proposition Adjusted Free Cash Flow exceeded $1 billion each year since FY16(1); focused on debt reduction and returning to our target leverage range of 2.25x to 2.50x We Generate Strong Cash Flows
Appendix 18
Non-GAAP Financial Measures Adjusted Earnings Per Diluted ShareWe use the non-GAAP financial measure “adjusted earnings per diluted share,” also referred to as “adjusted earnings per share” or “Adjusted EPS”, because we believe this measure provides our board of directors, investors, potential investors, securities analysts and others with useful information to evaluate our performance since it excludes restructuring and other costs, net, and other specific items that we believe are not indicative of our ongoing operating results. Our management and board of directors use this information to evaluate our performance relative to other periods. We believe the most directly comparable GAAP measure is Earnings per diluted share.Adjusted Operating Cash Flow and Adjusted Free Cash FlowWe use the non-GAAP financial measures “adjusted operating cash flow” and “adjusted free cash flow” because we believe these measures provide our board of directors, investors, potential investors, securities analysts and others with useful information to evaluate our performance relative to other periods because they exclude restructuring and other costs, net of tax, that we believe are not indicative of our ongoing operating results. While these measures are similar to adjusted free cash flow, we believe they provide greater comparability across periods when capital expenditures are changing since they exclude an adjustment for capital expenditures. We believe adjusted free cash flow is also a useful measure as it reflects our cash flow inclusive of capital expenditures. We believe the most directly comparable GAAP measure is net cash provided by operating activities. Adjusted Segment EBITDA and Adjusted Segment EBITDA MarginsWe use the non-GAAP financial measures “adjusted segment EBITDA” and “adjusted segment EBITDA margins”, along with other factors, to evaluate our segment performance against our peers. We believe that investors use these measures to evaluate our performance relative to our peers. We calculate adjusted segment EBITDA for each segment by adding that segment’s adjusted segment income to its depreciation, depletion and amortization. We calculate adjusted segment EBITDA margin for each segment by dividing that segment’s adjusted segment EBITDA by its adjusted segment sales. Leverage Ratio and Net Leverage RatioWe use the non-GAAP financial measures “leverage ratio” and “net leverage ratio” as measurements of our operating performance and to compare to our publicly disclosed target leverage ratio. We believe investors use each measure to evaluate our available borrowing capacity – in the case of “net leverage ratio”, adjusted for cash and cash equivalents. We define leverage ratio as our Total Funded Debt divided by our Credit Agreement EBITDA, each of which term is defined in our credit agreement, dated July 1, 2015. Borrowing capacity under our credit agreement depends on, in addition to other measures, the Credit Agreement Debt/EBITDA ratio or the leverage ratio. As of September 30, 2019, our leverage ratio was 2.96 times. While the leverage ratio under our credit agreement determines the credit spread on our debt, we are not subject to a leverage ratio cap. Our credit agreement is subject to a Debt to Capitalization and Consolidated Interest Coverage Ratio, as defined therein. We define net leverage ratio as the product of our Total Funded Debt minus cash and cash equivalents divided by our Credit Agreement EBITDA. As of September 30, 2019, our net leverage ratio was 2.92 times. Forward-looking GuidanceWe are not providing a reconciliation of forward-looking non-GAAP financial measures to the most directly comparable U.S. GAAP measure because we are unable to predict with reasonable certainty the ultimate outcome of certain significant items without unreasonable effort. These items include, but are not limited to, merger and acquisition-related expenses, restructuring expenses, asset impairments, litigation settlements, changes to contingent consideration and certain other gains or losses. These items are uncertain, depend on various factors, and could have a material impact on U.S. GAAP reported results for the guidance period.Adjusted Tax RateWe use the non-GAAP financial measure “Adjusted Tax Rate”. We believe this non-GAAP financial measure is useful because it adjusts our GAAP effective tax rate to exclude the impact of restructuring and other costs, net, and other specific items that management believes are not indicative of the ongoing operating results of the business. “Adjusted Tax Rate” is calculated as “Adjusted Tax Expense” divided by “Adjusted Pre-Tax Income”. We believe that the most directly comparable GAAP measures to Adjusted Tax Expense and Adjusted Pre-Tax Income are “Income tax (expense) benefit” and “Income before income taxes”, respectively. 19
20 FY20 Additional Guidance Assumptions Non-GAAP Financial Measures.FY20 amounts are forecasts. Depreciation & Amortization Approx. $1.5 billion Adjusted Segment EBITDA Profile(1) Approx. 45% 1H / 55% 2H Net Interest Expense and Interest Income Approx. $400 million expense Effective Adjusted Book Tax Rate(1) 24.5% Adjusted Cash Tax Rate(1) 21% Share Count Approx. 261 million Capital Expenditures Approx. $1.1 billion Mill Maintenance Schedule(2) (tons in thousands) Q1 Q2 Q3 Q4 Full Year FY20 Maintenance 131 109 102 25 367 FY19 Maintenance 50 99 94 34 277 North American Corrugated Packaging Q1 Q2 Q3 Q4 Full Year FY20 Maintenance 39 10 17 0 66 FY19 Maintenance 17 42 54 0 113 Consumer Packaging
21 Key Commodity Annual Consumption Volumes Commodity Category Volume Recycled Fiber (tons millions) 5.2 Wood (tons millions) 40 Natural Gas (cubic feet billions) 84 Electricity (kwh billions) 6.1 Polyethylene (lbs millions) 55 Caustic Soda (tons thousands) 240 Starch (lbs millions) 585 Approx. FY20 Annual Consumption Volumes Sensitivity Analysis Category Increase in Spot Price Approx. Annual EPS Impact Recycled Fiber (tons millions) +$10.00 / ton ($0.16) Natural Gas (cubic feet billions) +$0.25 / MMBTU ($0.06) FX Translation Impact +10% USD Appreciation ($0.06)
22 Shipment Data Includes 59 days of KapStone.Combined North America, Brazil and India shipments.
WestRock Since the Merger 23 Spun off IngevitySold Home, Health and Beauty businessMonetization of Land & Development nearly completeCompleted 19 acquisitions / investments Increased vertical integrationExpanded end market and geographic reachProvided meaningful synergy opportunities Adjusted Free Cash Flow exceeded $1 billion each year since FY16(1)Returned $2.8 billion to stockholders$1 billion of share repurchases$1.8 billion in dividendsConsistent track record of growing dividendAnnounced $0.04 per share annual increase24% increase since inceptionIncreased every year since the merger Generated more than $1.2 billion of productivityNorth American Corrugated Packaging Adjusted EBITDA margins have been 20% or higher for last 2 yearsInvested $4.2 billion in capital to maintain and transform our systemStrategic capital project investments nearly complete with approximately $700 million of $1 billion investedStrategic capital projects expected to generate $240 million in incremental EBITDAOn track to achieve more than $200 million in KapStone synergies by end of FY21Reduced costsHave closed 44 facilitiesAnnounced Charleston mill reconfiguration Portfolio Actions Returning Capital to Stockholders Operational Improvements
24 Adjusted Net Income and Adjusted Earnings Per Diluted Share Reconciliation The GAAP results for Pre-Tax, Tax, Net of Tax and EPS are equivalent to the line items "Income before income taxes", "Income tax (expense) benefit“, "Consolidated net income“ and “Earnings per Diluted Share”, respectively, as reported on the statements of operations.
25 The GAAP results for Pre-Tax, Tax, Net of Tax and EPS are equivalent to the line items "Income before income taxes", "Income tax (expense) benefit“, "Consolidated net income“ and “Earnings per Diluted Share”, respectively, as reported on the statements of operations. Adjusted Net Income and Adjusted Earnings Per Diluted Share Reconciliation
26 The GAAP results for Pre-Tax, Tax, Net of Tax and EPS are equivalent to the line items "Income before income taxes", "Income tax (expense) benefit“, "Consolidated net income“ and “Earnings per Diluted Share”, respectively, as reported on the statements of operations. Adjusted Net Income and Adjusted Earnings Per Diluted Share Reconciliation
27 The GAAP results for Pre-Tax, Tax, Net of Tax and EPS are equivalent to the line items "Income before income taxes", "Income tax (expense) benefit“, "Consolidated net income“ and “Earnings per Diluted Share”, respectively, as reported on the statements of operations. Adjusted Net Income and Adjusted Earnings Per Diluted Share Reconciliation
28 Adjusted Operating Cash Flow and Free Cash Flow Reconciliation
29 Adjusted Segment Sales, Adjusted Segment EBITDA and Adjusted Segment Income(1) Segment EBITDA Margins are calculated using Segment / Net sales, Corrugated Packaging and Consumer Packaging Adjusted Segment EBITDA Margins are calculated using Adjusted Segment Sales; the Consolidated Adjusted Segment EBITDA Margin is calculated using Segment / Net sales.
30 Corrugated Packaging Adjusted Segment EBITDA(1) Segment EBITDA Margins are calculated using Segment sales and Adjusted Segment EBITDA Margins are calculated using Adjusted Segment Sales.The “Other” column includes our Victory Packaging and India corrugated operations.
31 Adjusted Segment Sales, Adjusted Segment EBITDA and Adjusted Segment Income(1) Segment EBITDA Margins are calculated using Segment / Net sales, Corrugated Packaging and Consumer Packaging Adjusted Segment EBITDA Margins are calculated using Adjusted Segment Sales; the Consolidated Adjusted Segment EBITDA Margin is calculated using Segment / Net sales less Recycling sales.
32 Corrugated Packaging Adjusted Segment EBITDA(1) Segment EBITDA Margins are calculated using Segment sales and Adjusted Segment EBITDA Margins are calculated using Adjusted Segment Sales.The “Other” column includes our Recycling and India corrugated operations.
33 Adjusted Segment Sales, Adjusted Segment EBITDA and Adjusted Segment Income(1) Segment EBITDA Margins are calculated using Segment / Net sales, Corrugated Packaging and Consumer Packaging Adjusted Segment EBITDA Margins are calculated using Adjusted Segment Sales; the Consolidated Adjusted Segment EBITDA Margin is calculated using Segment / Net sales.
34 Corrugated Packaging Adjusted Segment EBITDA(1) Segment EBITDA Margins are calculated using Segment sales and Adjusted Segment EBITDA Margins are calculated using Adjusted Segment Sales.The “Other” column includes our Victory Packaging and India corrugated operations.
35 Adjusted Segment Sales, Adjusted Segment EBITDA and Adjusted Segment Income(1) Segment EBITDA Margins are calculated using Segment / Net sales, Corrugated Packaging and Consumer Packaging Adjusted Segment EBITDA Margins are calculated using Adjusted Segment Sales; the Consolidated Adjusted Segment EBITDA Margin is calculated using Segment / Net sales less Recycling sales.
36 Corrugated Packaging Adjusted Segment EBITDA(1) Segment EBITDA Margins are calculated using Segment sales and Adjusted Segment EBITDA Margins are calculated using Adjusted Segment Sales.The “Other” column includes our Recycling and India corrugated operations.
37 Adjusted Segment Sales, Adjusted Segment EBITDA and Adjusted Segment Income(1) Segment EBITDA Margins are calculated using Segment / Net sales, Corrugated Packaging and Consumer Packaging Adjusted Segment EBITDA Margins are calculated using Adjusted Segment Sales; the Consolidated Adjusted Segment EBITDA Margin is calculated using Segment / Net sales less Recycling sales.
38 Corrugated Packaging Adjusted Segment EBITDA(1) Segment EBITDA Margins are calculated using Segment sales and Adjusted Segment EBITDA Margins are calculated using Adjusted Segment Sales.The “Other” column includes our Recycling and India corrugated operations.
39 Adjusted Segment Sales, Adjusted Segment EBITDA and Adjusted Segment Income(1) Segment EBITDA Margins are calculated using Segment / Net sales, Corrugated Packaging and Consumer Packaging Adjusted Segment EBITDA Margins are calculated using Adjusted Segment Sales; the Consolidated Adjusted Segment EBITDA Margin is calculated using Segment / Net sales less Recycling sales.
40 Corrugated Packaging Adjusted Segment EBITDA(1) Segment EBITDA Margins are calculated using Segment sales and Adjusted Segment EBITDA Margins are calculated using Adjusted Segment Sales.The “Other” column includes our Recycling and India corrugated operations.
41 Reconciliation of Net Income to Adjusted Segment EBITDA Schedule adds back expense or subtracts income for certain financial statement and segment footnote items to compute segment income, Segment EBITDA and Adjusted Segment EBITDA.
42 Reconciliation of Adjusted Free Cash Flow
43 Reconciliation of Total Debt
44 LTM Credit Agreement EBITDA Additional Permitted Charges includes among other items, $60 million of EBITDA of acquired companies and $174 million of restructuring and other costs. Total Debt, Funded Debt and Leverage Ratio