Exhibit 99.2
Florence, south carolina containerboard mill Westrock Q2 fy2021 resultsMay 5, 2021

Forward Looking Statements:This presentation contains forward-looking statements within the meaning of the Private Securities Litigation Reform Act of 1995, including but not limited to the statements on the slides entitled “Florence Containerboard Mill”, “Q2 FY21 WestRock Results”, “FY21 Guidance”, “Productivity Improvements”, “Additional Guidance”, and “Key Commodity Annual Consumption Volumes” that give guidance or estimates for future periods as well as statements regarding, among other things, (i) that the Florence mill will be one of the lowest cost virgin mills in North America and is expected to ramp up to full production by the end of fiscal fourth quarter; (ii) that we expect to recover insured losses in future periods, (iii) the guidance listed on slide 10; (iv) our expectation that (A) the Florence, SC mill capital project will generate $30 million in EBITDA improvement in FY21 with a run rate of $55 million at full ramp up, (B) our expectation that the Porto Feliz project will generate $10 million in EBITDA improvement in FY21 with a run rate of $30 million at full ramp up, (C) that, with respect to Tres Barras, production will increase to approximately 750,000 tons a year, fiber mix will improve to 100% virgin fiber and we expect annual EBITDA benefit of $70 million when fully ramped up in FY22 and (D) our expectation that run rate synergies from the KapStone acquisition, including North Charleston, will grow to more than $240 million by the end of FY21; (v) that we expect to add $125 million of EBITDA in FY21 as a result of the productivity improvement projects listed on slide 17; (vi) the additional guidance listed on slide 19; and (vii) the key commodity annual consumption volumes on slide 20. Forward-looking statements are based on our current expectations, beliefs, plans or forecasts and are typically identified by words or phrases such as “may,” “will,” “could,” “should,” “would,” “anticipate,” “estimate,” “expect,” “project,” “intend,” “plan,” “believe,” “target,” “prospects,” “potential” and “forecast,” and other words, terms and phrases of similar meaning. Forward-looking statements involve estimates, expectations, projections, goals, forecasts, assumptions, risks and uncertainties. WestRock cautions readers that a forward-looking statement is not a guarantee of future performance and that actual results could differ materially from those contained in the forward-looking statement. WestRock’s businesses are subject to a number of risks that would affect any such forward-looking statements, including, among others, developments related to the COVID-19 pandemic, including the severity, magnitude and duration of the pandemic, negative global economic conditions arising from the pandemic, impacts of governments’ responses to the pandemic on our operations, impacts of the pandemic on commercial activity, our customers and consumer preferences and demand, supply chain disruptions, and disruptions in the credit or financial markets; decreases in demand for their products; increases in energy, raw materials, shipping and capital equipment costs; reduced supply of raw materials; our ongoing assessment of the recent ransomware incident, adverse legal, reputational and financial effects on us resulting from the incident or additional cyber incidents and the effectiveness of our business continuity plans during the ransomware incident; fluctuations in selling prices and volumes; intense competition; the potential loss of certain customers; the scope, costs, timing and impact of any restructuring of our operations and corporate and tax structure; the occurrence of a natural disaster, such as hurricanes or other unanticipated problems, such as labor difficulties, equipment failure or unscheduled maintenance and repair; risks associated with integrating KapStone’s operations into our operations and our ability to realize anticipated synergies and productivity improvements; risks associated with completing our strategic capital projects on the anticipated timelines and realizing our anticipated EBITDA improvements; benefits that we expect to realize from actions that we are taking and plan to take in response to COVID-19; and adverse changes in general market and industry conditions. Such risks and other factors that may impact management’s assumptions are more particularly described in our filings with the Securities and Exchange Commission, including in Item 1A under the caption “Risk Factors” in our Annual Report on Form 10-K for the year ended September 30, 2020. The information contained herein speaks as of the date hereof and WestRock does not have or undertake any obligation to update or revise its forward-looking statements, whether as a result of new information, future events or otherwise.Non-GAAP Financial Measures:We report our financial results in accordance with accounting principles generally accepted in the United States (“GAAP”). However, management believes certain non-GAAP financial measures provide users with additional meaningful financial information that should be considered when assessing our ongoing performance. Management also uses these non-GAAP financial measures in making financial, operating and planning decisions and in evaluating our performance. Non-GAAP financial measures should be viewed in addition to, and not as an alternative for, our GAAP results. The non-GAAP financial measures we present may differ from similarly captioned measures presented by other companies.We may from time to time be in possession of certain information regarding WestRock that applicable law would not require us to disclose to the public in the ordinary course of business, but would require us to disclose if we were engaged in the purchase or sale of our securities. This presentation shall not be considered to be part of any solicitation of an offer to buy or sell WestRock securities. This presentation also may not include all of the information regarding WestRock that you may need to make an investment decision regarding WestRock securities. Any investment decision should be made on the basis of the total mix of information regarding WestRock that is publicly available as of the date of the investment decision. Forward Looking Statements; Non-GAAP Financial Measures 2

3 Non-GAAP Financial Measure. See Non-GAAP Financial Measures and Reconciliations in the Appendix. Highlights of today’s call Financial ResultsRevenue of $4.4 billionAdjusted Segment EBITDA of $641 million(1)Adjusted Segment EBITDA reflects $80 million negative impact from ransomware incident and winter weather(1)Adjusted EPS of $0.54 per share(1)Strong demand conditions across packaging end marketsImplementing published PPW price increasesAnnounced 20% increase in quarterly dividend Lanett, alabama, food and beverage plant Lanett, alabama, food and beverage plant
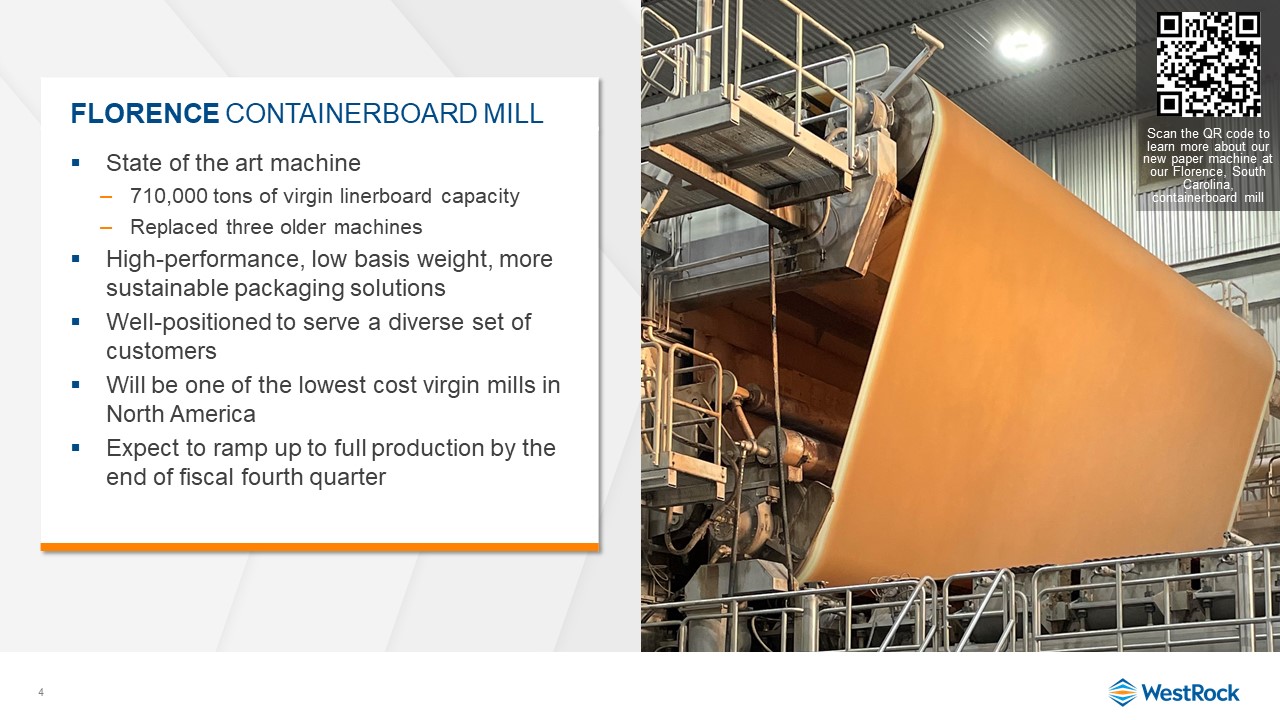
4 Florence Containerboard Mill State of the art machine710,000 tons of virgin linerboard capacityReplaced three older machinesHigh-performance, low basis weight, more sustainable packaging solutionsWell-positioned to serve a diverse set of customersWill be one of the lowest cost virgin mills in North AmericaExpect to ramp up to full production by the end of fiscal fourth quarter Scan the QR code to learn more about our new paper machine at our Florence, South Carolina, containerboard mill

5 priorities EXECUTE DISCIPLINED CAPITAL ALLOCATION LEVERAGE THE power of the enterprise Lead in sustainability Accelerate innovation profitable growth + value creation
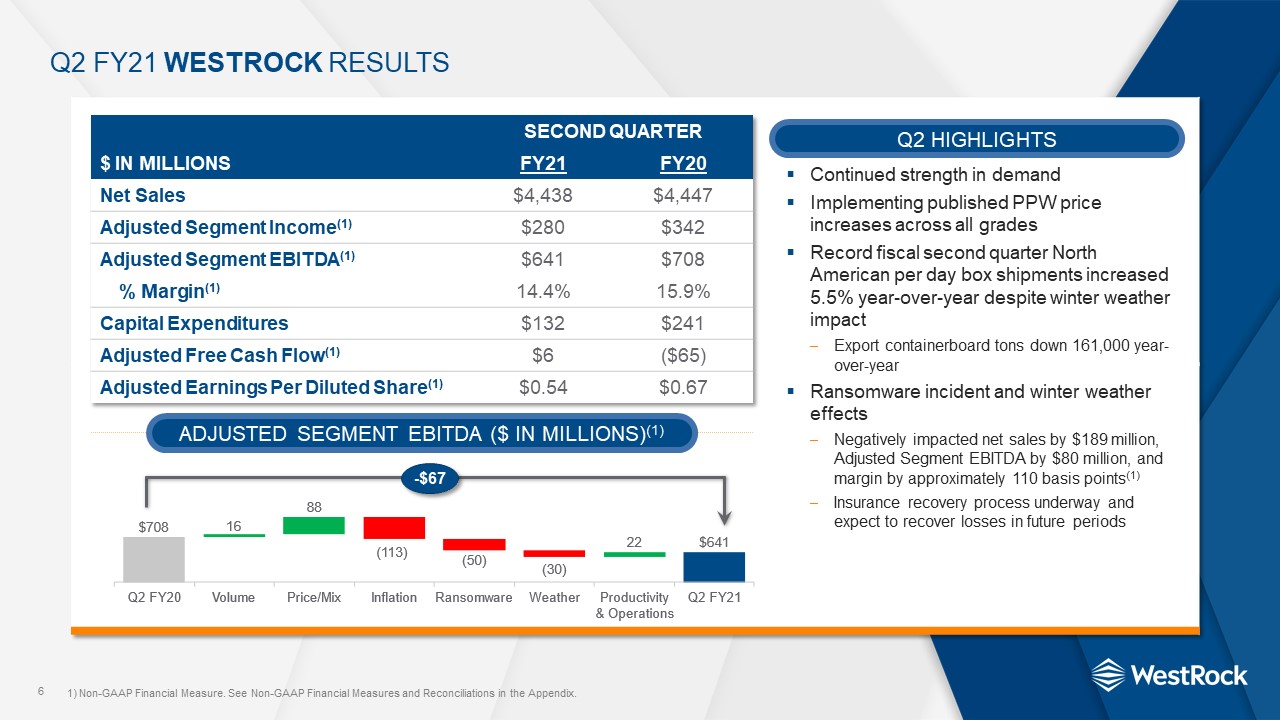
6 Non-GAAP Financial Measure. See Non-GAAP Financial Measures and Reconciliations in the Appendix. SECOND QUARTER $ in millions FY21 FY20 Net Sales $4,438 $4,447 Adjusted Segment Income(1) $280 $342 Adjusted Segment EBITDA(1) $641 $708 % Margin(1) 14.4% 15.9% Capital Expenditures $132 $241 Adjusted Free Cash Flow(1) $6 ($65) Adjusted Earnings Per Diluted Share(1) $0.54 $0.67 Q2 Fy21 WestRock Results Q2 Highlights Adjusted Segment EBITDA ($ in Millions)(1) Continued strength in demandImplementing published PPW price increases across all gradesRecord fiscal second quarter North American per day box shipments increased 5.5% year-over-year despite winter weather impactExport containerboard tons down 161,000 year-over-yearRansomware incident and winter weather effectsNegatively impacted net sales by $189 million, Adjusted Segment EBITDA by $80 million, and margin by approximately 110 basis points(1)Insurance recovery process underway and expect to recover losses in future periods -$67
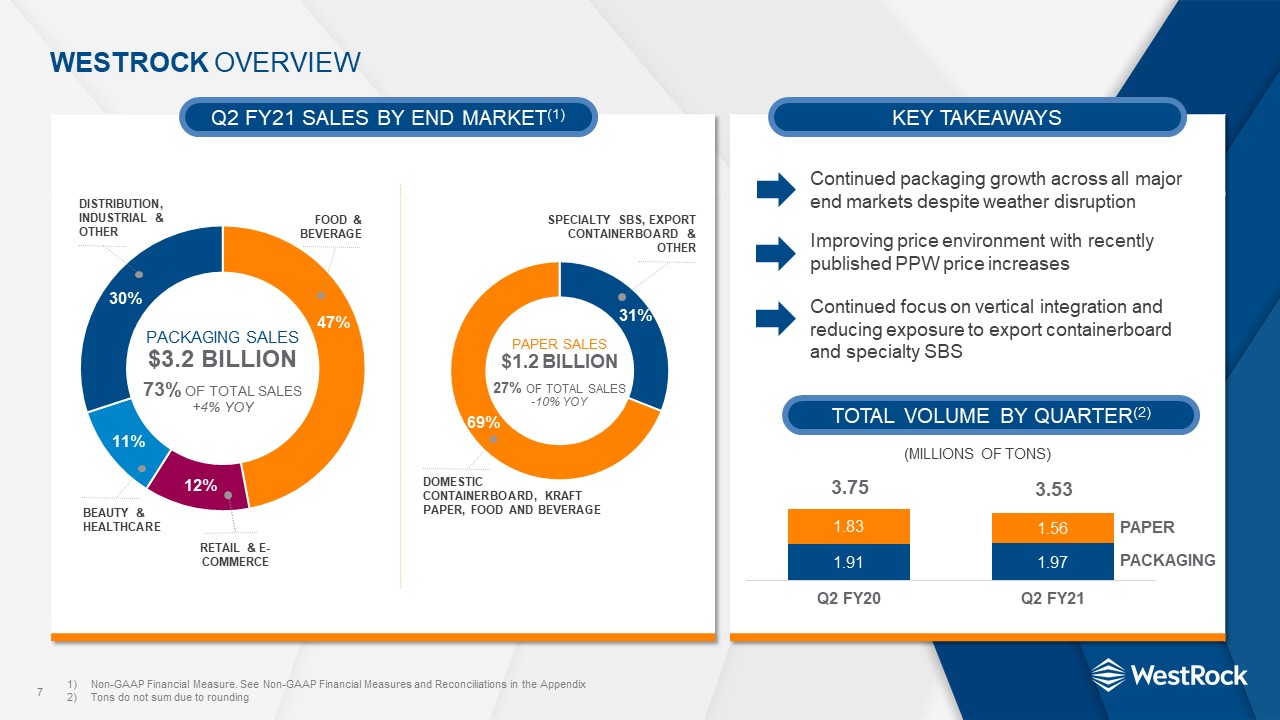
7 Non-GAAP Financial Measure. See Non-GAAP Financial Measures and Reconciliations in the AppendixTons do not sum due to rounding Key takeaways Q2 FY21 Sales by end market(1) WestRock overview Total volume by quarter(2) Paper Packaging 3.75 3.53 Continued packaging growth across all major end markets despite weather disruption Continued focus on vertical integration and reducing exposure to export containerboard and specialty SBS Improving price environment with recently published PPW price increases (Millions of tons) Packaging Sales $3.2 Billion73% of Total Sales+4% Yoy Distribution, Industrial & Other Food & Beverage Beauty & healthcare Retail & e-commerce paper Sales $1.2 Billion27% of Total Sales-10% Yoy SPECIALTY SBS, EXPORT CONTAINERBOARD & OTHER DOMESTIC CONTAINERBOARD, KRAFT PAPER, FOOD and BEVERAGE
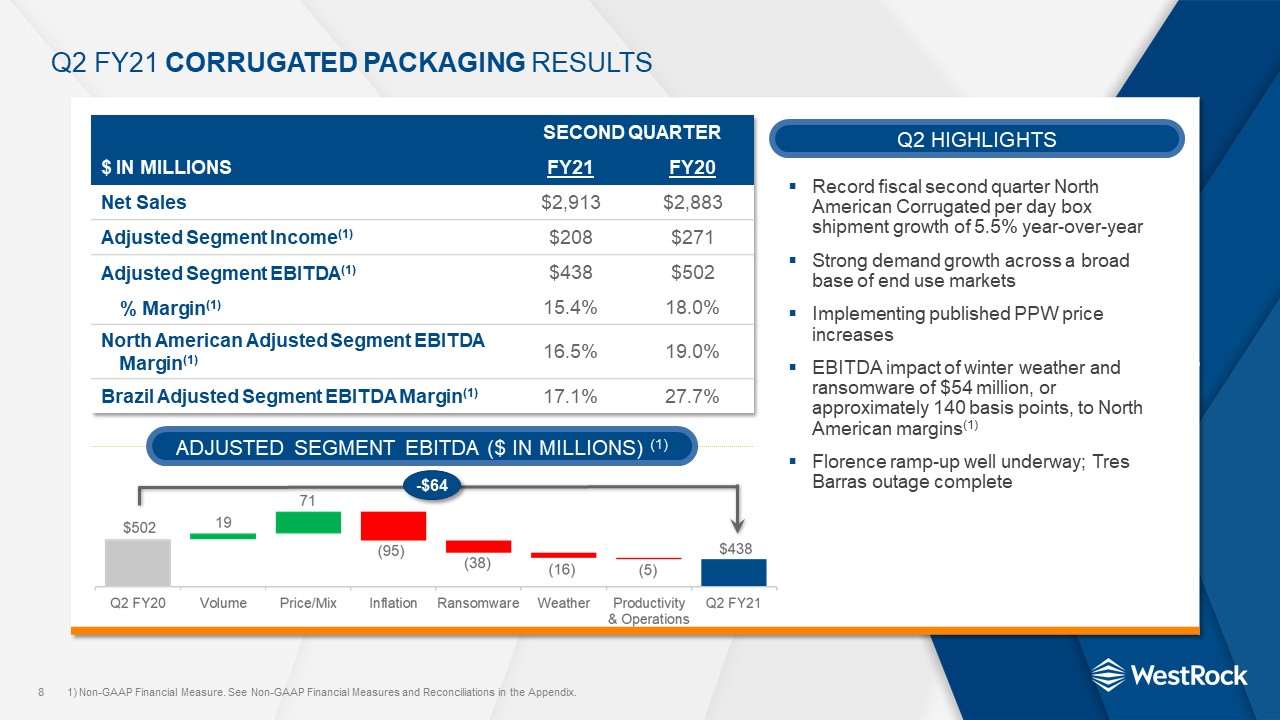
SECOND QUARTER $ in millions FY21 FY20 Net Sales $2,913 $2,883 Adjusted Segment Income(1) $208 $271 Adjusted Segment EBITDA(1) $438 $502 % Margin(1) 15.4% 18.0% North American Adjusted Segment EBITDA Margin(1) 16.5% 19.0% Brazil Adjusted Segment EBITDA Margin(1) 17.1% 27.7% 8 Non-GAAP Financial Measure. See Non-GAAP Financial Measures and Reconciliations in the Appendix. Q2 Fy21 Corrugated Packaging Results Record fiscal second quarter North American Corrugated per day box shipment growth of 5.5% year-over-yearStrong demand growth across a broad base of end use markets Implementing published PPW price increasesEBITDA impact of winter weather and ransomware of $54 million, or approximately 140 basis points, to North American margins(1)Florence ramp-up well underway; Tres Barras outage complete Q2 Highlights Adjusted Segment EBITDA ($ in Millions) (1) -$64
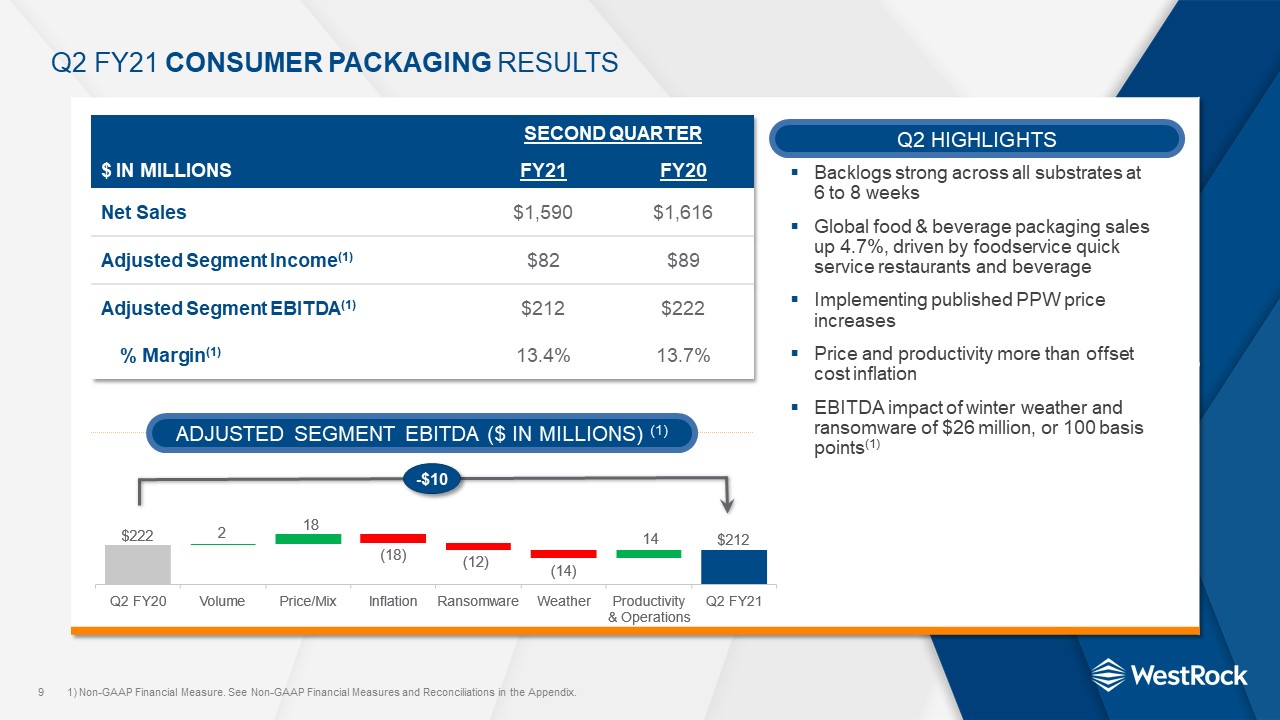
SECOND QUARTER $ in millions FY21 FY20 Net Sales $1,590 $1,616 Adjusted Segment Income(1) $82 $89 Adjusted Segment EBITDA(1) $212 $222 % Margin(1) 13.4% 13.7% 9 Non-GAAP Financial Measure. See Non-GAAP Financial Measures and Reconciliations in the Appendix. Q2 Fy21 consumer Packaging Results Backlogs strong across all substrates at 6 to 8 weeksGlobal food & beverage packaging sales up 4.7%, driven by foodservice quick service restaurants and beverageImplementing published PPW price increasesPrice and productivity more than offset cost inflationEBITDA impact of winter weather and ransomware of $26 million, or 100 basis points(1) Q2 Highlights Adjusted Segment EBITDA ($ in Millions) (1) -$10

10 fy21 guidance Q3 FY21Adjusted Segment EBITDA(1) Q3 FY21Adjusted EPS(1) 3Q FY21 Sequential Guidance DetailsRecovery of operations from Q2 disruptions Implementation of previously published PPW price increases across containerboard, kraft paper, SBS, CNK, CRB and URBModest sequential inflation with higher recycled fiber, chemical and freight costsPeak mill maintenance outage quarter Non-GAAP Financial Measure. See Non-GAAP Financial Measures and Forward-looking Guidance in the Appendix. $775 - $805 MILLION $0.88 - $0.97Per Share FY21 Adjusted Segment EBITDA(1): Approx. $3.05 Billion

11

Appendix 12
Adjusted Earnings Per Diluted ShareWe use the non-GAAP financial measure “adjusted earnings per diluted share,” also referred to as “adjusted earnings per share” or “Adjusted EPS”, because we believe this measure provides our board of directors, investors, potential investors, securities analysts and others with useful information to evaluate our performance since it excludes restructuring and other costs, net, and other specific items that we believe are not indicative of our ongoing operating results. Our management and board of directors use this information to evaluate our performance relative to other periods. We believe the most directly comparable GAAP measure is Earnings per diluted share.Adjusted Operating Cash Flow and Adjusted Free Cash FlowWe use the non-GAAP financial measures “adjusted operating cash flow” and “adjusted free cash flow” because we believe these measures provide our board of directors, investors, potential investors, securities analysts and others with useful information to evaluate our performance relative to other periods because they exclude restructuring and other costs, net of tax, that we believe are not indicative of our ongoing operating results. While these measures are similar to adjusted free cash flow, we believe they provide greater comparability across periods when capital expenditures are changing since they exclude an adjustment for capital expenditures. We believe adjusted free cash flow is also a useful measure as it reflects our cash flow inclusive of capital expenditures. We believe the most directly comparable GAAP measure is net cash provided by operating activities. Adjusted Segment Income, Adjusted Segment EBITDA and Adjusted Segment EBITDA MarginsWe use the non-GAAP financial measures “adjusted segment income”, “adjusted segment EBITDA” and “adjusted segment EBITDA margins”, along with other factors, to evaluate our segment performance against our peers. We believe that investors use these measures to evaluate our performance relative to our peers. We calculate adjusted segment income for each segment by adding segment income to certain adjustments and calculate “adjusted segment EBITDA” by further adding depreciation, depletion and amortization. We calculate adjusted segment EBITDA margin for each segment by dividing that segment’s adjusted segment EBITDA by its adjusted segment sales. Leverage Ratio, Net Leverage Ratio, Total Funded Debt and Adjusted Total Funded DebtWe use the non-GAAP financial measures “leverage ratio” and “net leverage ratio” as measurements of our operating performance and to compare to our publicly disclosed target leverage ratio. We believe investors use each measure to evaluate our available borrowing capacity – in the case of “net leverage ratio”, adjusted for cash and cash equivalents. We define leverage ratio as our Total Funded Debt divided by our Credit Agreement EBITDA, each of which term is defined in our credit agreement, dated July 1, 2015. Borrowing capacity under our credit agreement depends on, in addition to other measures, the Credit Agreement Debt/EBITDA ratio or the leverage ratio. As of March 31, 2021, our leverage ratio was 2.91 times. While the leverage ratio under our credit agreement determines the credit spread on our debt, we are not subject to a leverage ratio cap. Our credit agreement is subject to a Debt to Capitalization and Consolidated Interest Coverage Ratio, as defined therein. We define “Adjusted Total Funded Debt” as our Total Funded Debt less cash and cash equivalents. Net Leverage Ratio is the product of Adjusted Total Funded Debt divided by our Credit Agreement EBITDA. As of March 31, 2021, our net leverage ratio was 2.80 times. Adjusted Net DebtWe use the non-GAAP financial measure “adjusted net debt” to measure our level of debt across periods. We define adjusted net debt as total debt as reduced by items such as cash and cash equivalents, the fair value of debt step-up, and adjusted for the impact of the October 1, 2019 lease standard adoption, to reflect comparability across periods. Forward-looking GuidanceWe are not providing a reconciliation of forward-looking non-GAAP financial measures to the most directly comparable U.S. GAAP measure because we are unable to predict with reasonable certainty the ultimate outcome of certain significant items without unreasonable effort. These items include, but are not limited to, merger and acquisition-related expenses, restructuring expenses, asset impairments, litigation settlements, changes to contingent consideration and certain other gains or losses. These items are uncertain, depend on various factors, and could have a material impact on U.S. GAAP reported results for the guidance period. Non-GAAP Financial Measures 13

Adjusted Segment EBITDA(1) ($ in millions) Q2 SEQUENTIAL BRIDGES 14 WESTROCK CORRUGATED CONSUMER Non-GAAP Financial Measure. See Non-GAAP Financial Measures and Reconciliations in the Appendix. -$29 -$20 -$22

Westrock Serves Diverse End Market segments 15 N.A. Corrugated Packaging Consumer Packaging Segment 2) Represents WestRock trailing twelve-month Q2 FY21 sales of converted shipments and paperboard shipped to end markets. 1) Represents WestRock trailing twelve-month Q2 FY21 sales of North American corrugated boxes, excluding sheets
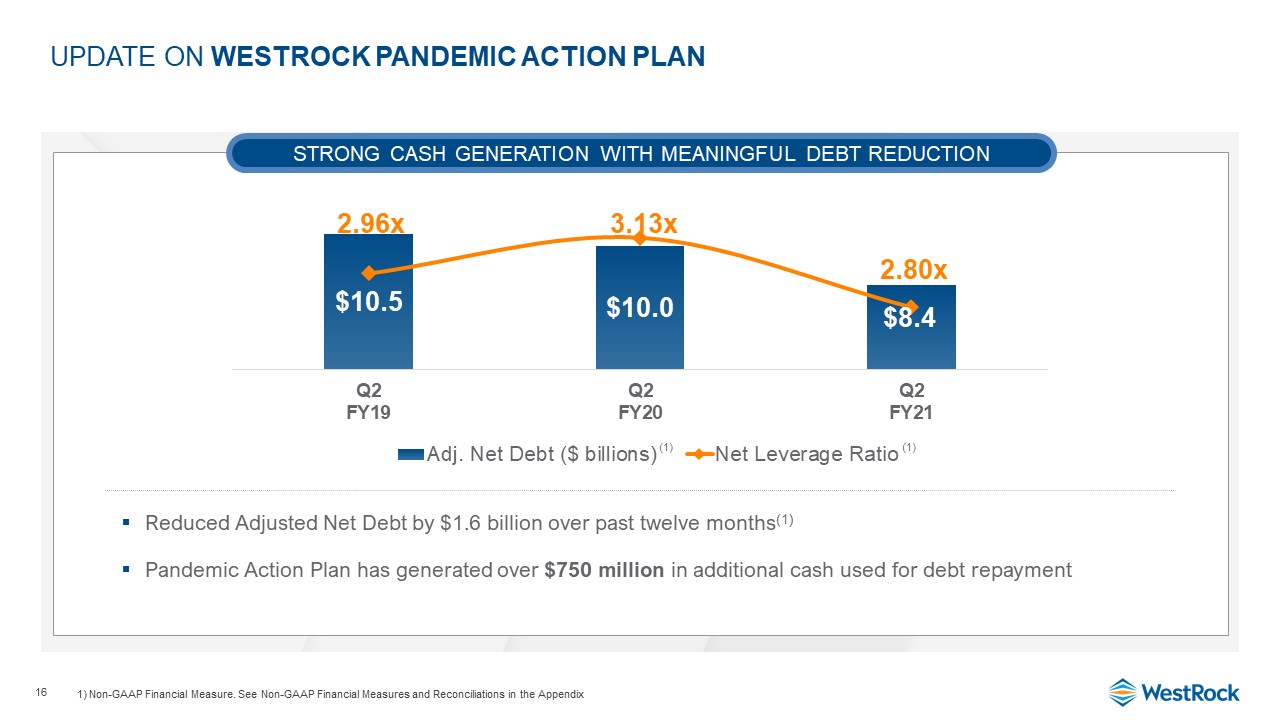
Update on Westrock pandemic action plan Reduced Adjusted Net Debt by $1.6 billion over past twelve months(1)Pandemic Action Plan has generated over $750 million in additional cash used for debt repayment Strong Cash Generation with Meaningful Debt Reduction Non-GAAP Financial Measure. See Non-GAAP Financial Measures and Reconciliations in the Appendix 16 (1) (1)
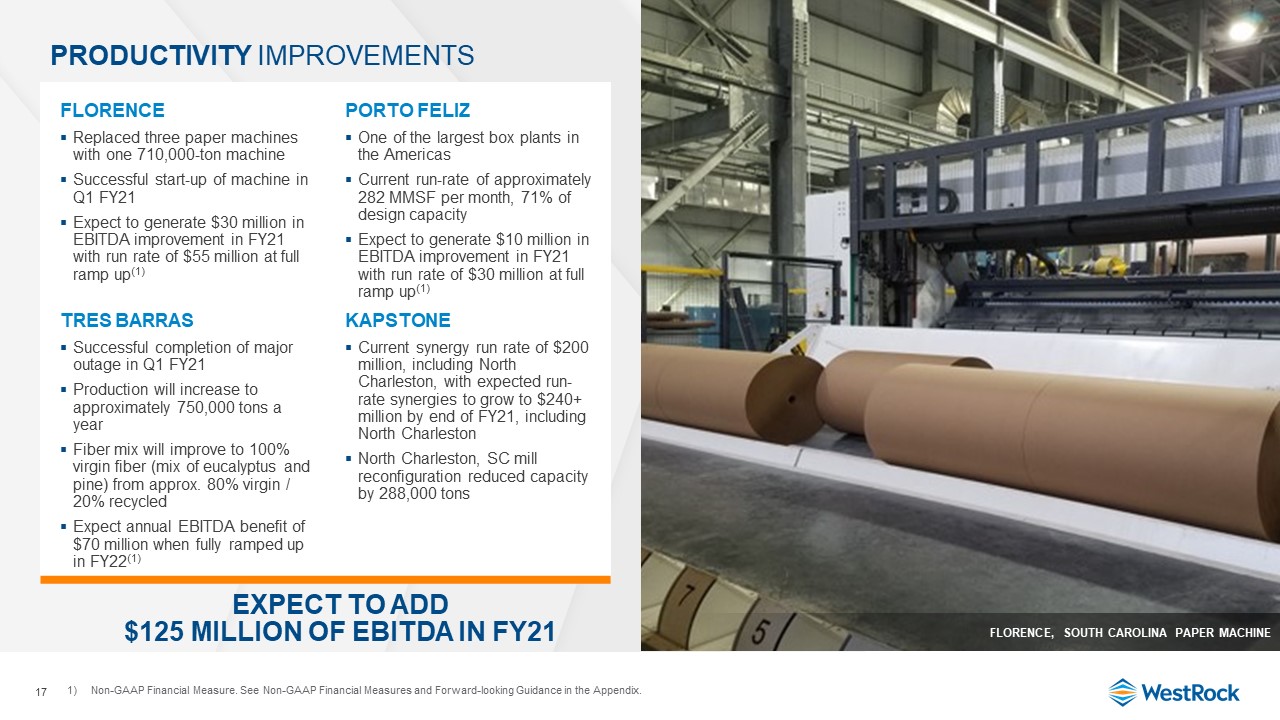
Productivity Improvements FLORENCEReplaced three paper machines with one 710,000-ton machineSuccessful start-up of machine in Q1 FY21Expect to generate $30 million in EBITDA improvement in FY21 with run rate of $55 million at full ramp up(1) PORTO FELIZOne of the largest box plants in the AmericasCurrent run-rate of approximately 282 MMSF per month, 71% of design capacityExpect to generate $10 million in EBITDA improvement in FY21 with run rate of $30 million at full ramp up(1) TRES BARRASSuccessful completion of major outage in Q1 FY21Production will increase to approximately 750,000 tons a yearFiber mix will improve to 100% virgin fiber (mix of eucalyptus and pine) from approx. 80% virgin / 20% recycled Expect annual EBITDA benefit of $70 million when fully ramped up in FY22(1) KAPSTONECurrent synergy run rate of $200 million, including North Charleston, with expected run-rate synergies to grow to $240+ million by end of FY21, including North CharlestonNorth Charleston, SC mill reconfiguration reduced capacity by 288,000 tons FLORENCE, SOUTH CAROLINA PAPER MACHINE EXPECT TO ADD$125 MILLION OF EBITDA IN FY21 17 Non-GAAP Financial Measure. See Non-GAAP Financial Measures and Forward-looking Guidance in the Appendix.

Comprehensive portfolio driving enterprise sales growth 18 Broadest Portfolio of SUSTAINABLE Paper Grades and Packaging Solutions SBS URB CRB CNK® White Top Linerboard Recycled Linerboard / Medium Semi-Chemical Medium Virgin Linerboard / Medium Customers buying more than $1 million from each segment Net Sales to Customers Buying More than $1 Million from Each Segment FY17 FY18 FY16 FY19 FY20 Q2 FY21 TTM $4.7 $7.5 FY17 FY16 FY18 FY19 FY20 Q2 FY21 TTM 102 169 Kraft Paper
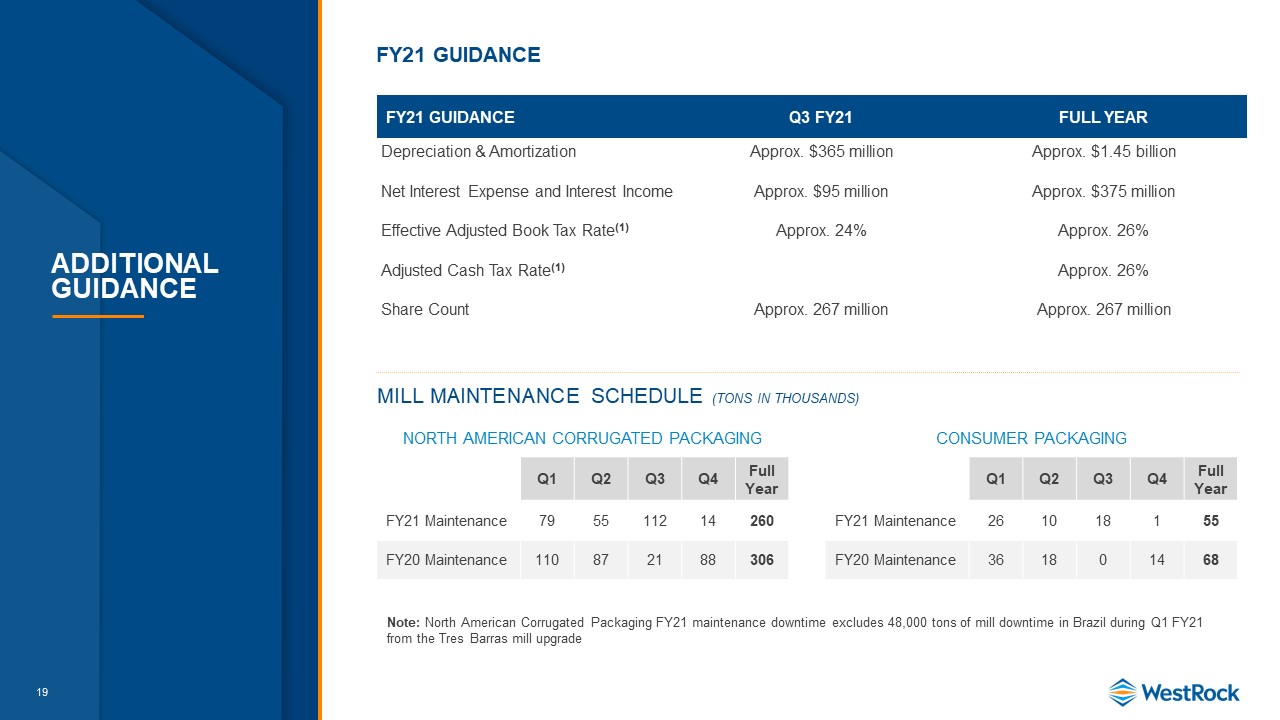
19 Additional guidance FY21 Guidance Q3 FY21 Full Year Depreciation & Amortization Approx. $365 million Approx. $1.45 billion Net Interest Expense and Interest Income Approx. $95 million Approx. $375 million Effective Adjusted Book Tax Rate(1) Approx. 24% Approx. 26% Adjusted Cash Tax Rate(1) Approx. 26% Share Count Approx. 267 million Approx. 267 million Mill Maintenance Schedule (tons in thousands) Q1 Q2 Q3 Q4 Full Year FY21 Maintenance 79 55 112 14 260 FY20 Maintenance 110 87 21 88 306 North American Corrugated Packaging Q1 Q2 Q3 Q4 Full Year FY21 Maintenance 26 10 18 1 55 FY20 Maintenance 36 18 0 14 68 Consumer Packaging Note: North American Corrugated Packaging FY21 maintenance downtime excludes 48,000 tons of mill downtime in Brazil during Q1 FY21 from the Tres Barras mill upgrade FY21 GUIDANCE

20 Key Commodity Annual Consumption Volumes Commodity Category Volume Recycled Fiber (tons millions) 5.7 Wood (tons millions) 42 Natural Gas (MMBTU) 93 Electricity (kwh billions) 5.6 Polyethylene (lbs millions) 36 Caustic Soda (tons thousands) 241 Starch (lbs millions) 576 Approx. FY21 Annual Consumption Volumes Sensitivity Analysis Category Increase in Spot Price Approx. Annual EPS Impact Recycled Fiber (tons millions) +$10.00 / ton ($0.16) Natural Gas (MMBTU) +$0.25 / MMBTU ($0.06) FX Translation Impact +10% USD Appreciation ($0.06) Key Commodity Annual Consumption Volumes
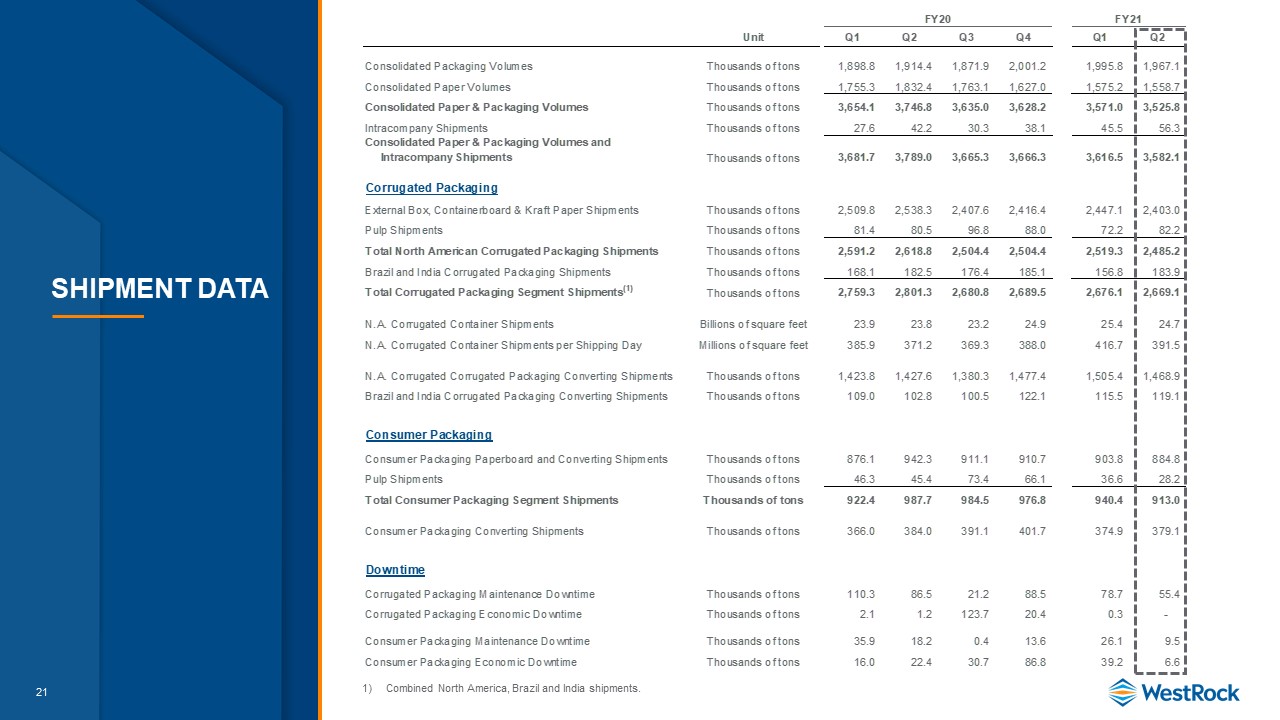
21 Shipment Data Combined North America, Brazil and India shipments.

22 Adjusted Net Income and Adjusted Earnings Per Diluted Share Reconciliation The GAAP results for Pre-Tax, Tax, Net of Tax and EPS are equivalent to the line items “Income before income taxes", "Income tax expense“, "Consolidated net income“ and “Earnings per diluted share”, respectively, as reported on the statements of income.The variance between the Pre-Tax column and the sum of the Adjustments to Segment EBITDA is depreciation and amortization.

23 Adjusted Net Income and Adjusted Earnings Per Diluted Share Reconciliation The GAAP results for Pre-Tax, Tax, Net of Tax and EPS are equivalent to the line items “Income before income taxes", "Income tax expense“, "Consolidated net income“ and “Earnings per diluted share”, respectively, as reported on the statements of income.The variance between the Pre-Tax column and the sum of the Adjustments to Segment EBITDA is depreciation and amortization.The variance between the Pre-Tax column and the sum of the Adjustments to Segment EBITDA is primarily interest income.
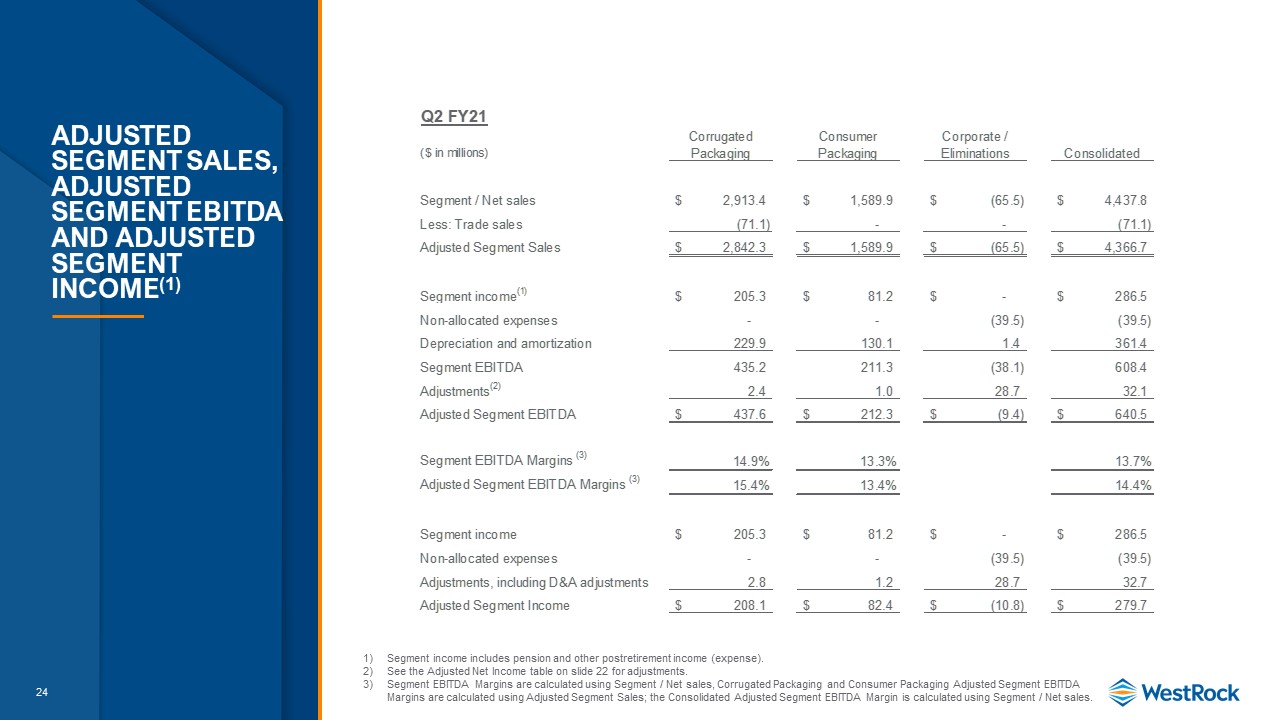
24 Adjusted Segment Sales, Adjusted Segment EBITDA and Adjusted Segment Income(1) Segment income includes pension and other postretirement income (expense).See the Adjusted Net Income table on slide 22 for adjustments.Segment EBITDA Margins are calculated using Segment / Net sales, Corrugated Packaging and Consumer Packaging Adjusted Segment EBITDA Margins are calculated using Adjusted Segment Sales; the Consolidated Adjusted Segment EBITDA Margin is calculated using Segment / Net sales.

25 Corrugated Packaging Adjusted Segment EBITDA The “Other” column includes our Victory Packaging and India corrugated operations.Segment income includes pension and other postretirement income (expense).See the Adjusted Net income table on slide 22 for adjustments.Segment EBITDA Margins are calculated using Segment sales and Adjusted Segment EBITDA Margins are calculated using Adjusted Segment Sales.
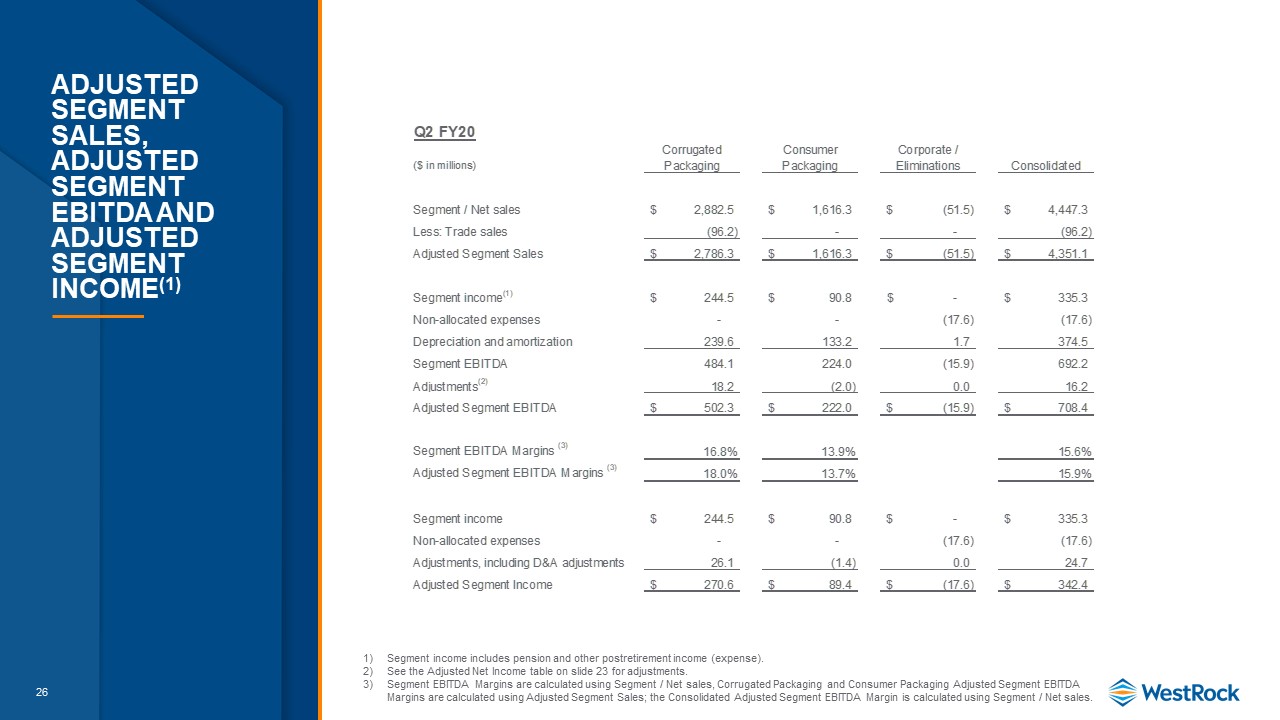
26 Adjusted Segment Sales, Adjusted Segment EBITDA and Adjusted Segment Income(1) Segment income includes pension and other postretirement income (expense).See the Adjusted Net Income table on slide 23 for adjustments.Segment EBITDA Margins are calculated using Segment / Net sales, Corrugated Packaging and Consumer Packaging Adjusted Segment EBITDA Margins are calculated using Adjusted Segment Sales; the Consolidated Adjusted Segment EBITDA Margin is calculated using Segment / Net sales.
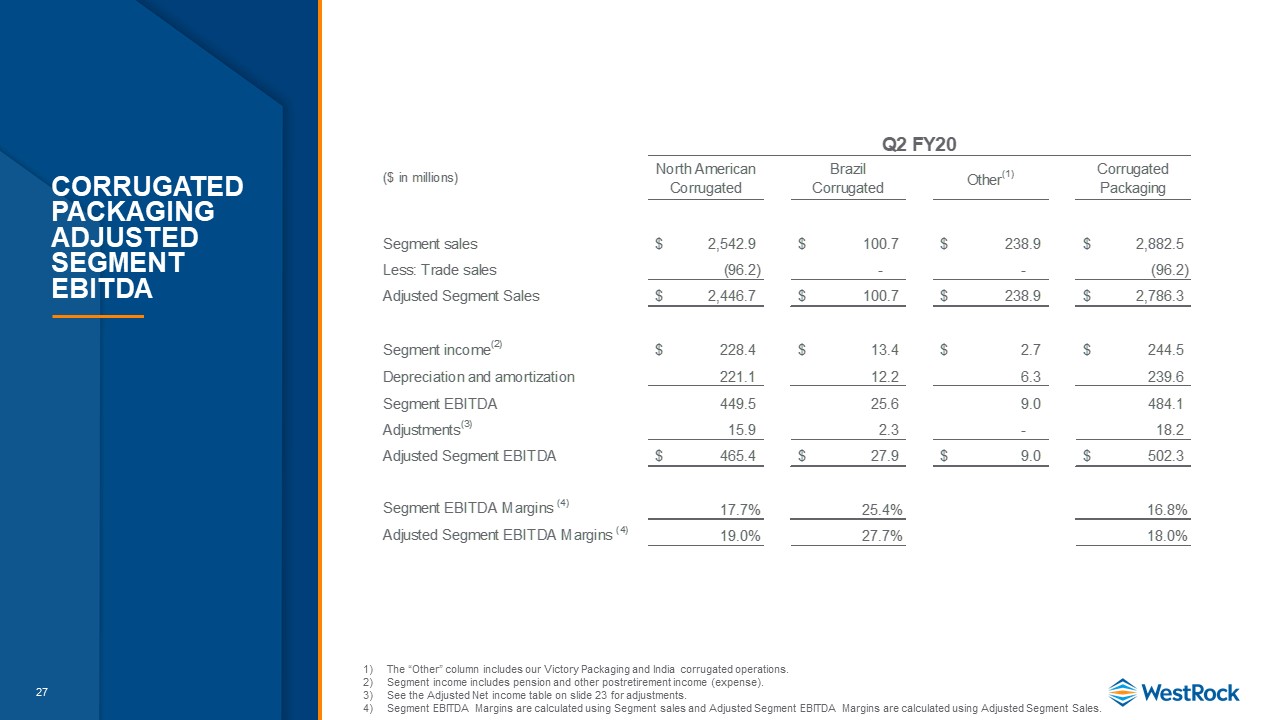
27 Corrugated Packaging Adjusted Segment EBITDA The “Other” column includes our Victory Packaging and India corrugated operations.Segment income includes pension and other postretirement income (expense).See the Adjusted Net income table on slide 23 for adjustments.Segment EBITDA Margins are calculated using Segment sales and Adjusted Segment EBITDA Margins are calculated using Adjusted Segment Sales.
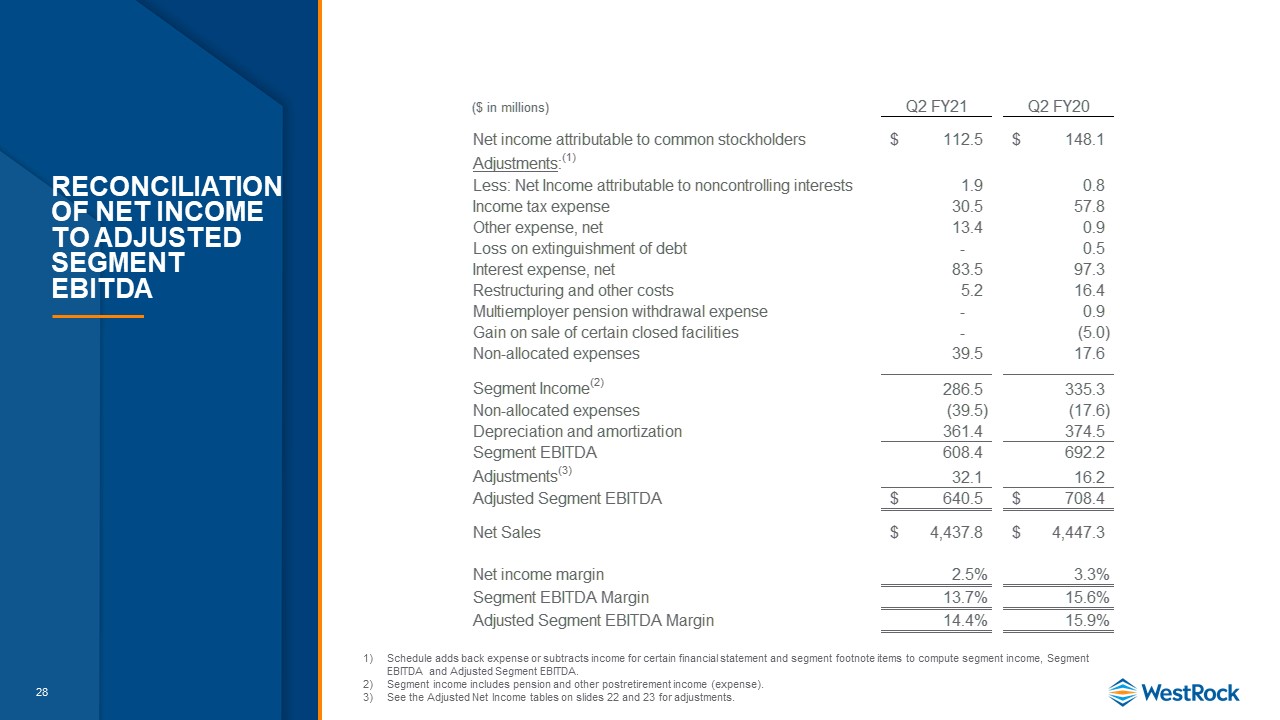
28 Reconciliation of Net Income to Adjusted Segment EBITDA Schedule adds back expense or subtracts income for certain financial statement and segment footnote items to compute segment income, Segment EBITDA and Adjusted Segment EBITDA.Segment income includes pension and other postretirement income (expense).See the Adjusted Net Income tables on slides 22 and 23 for adjustments.
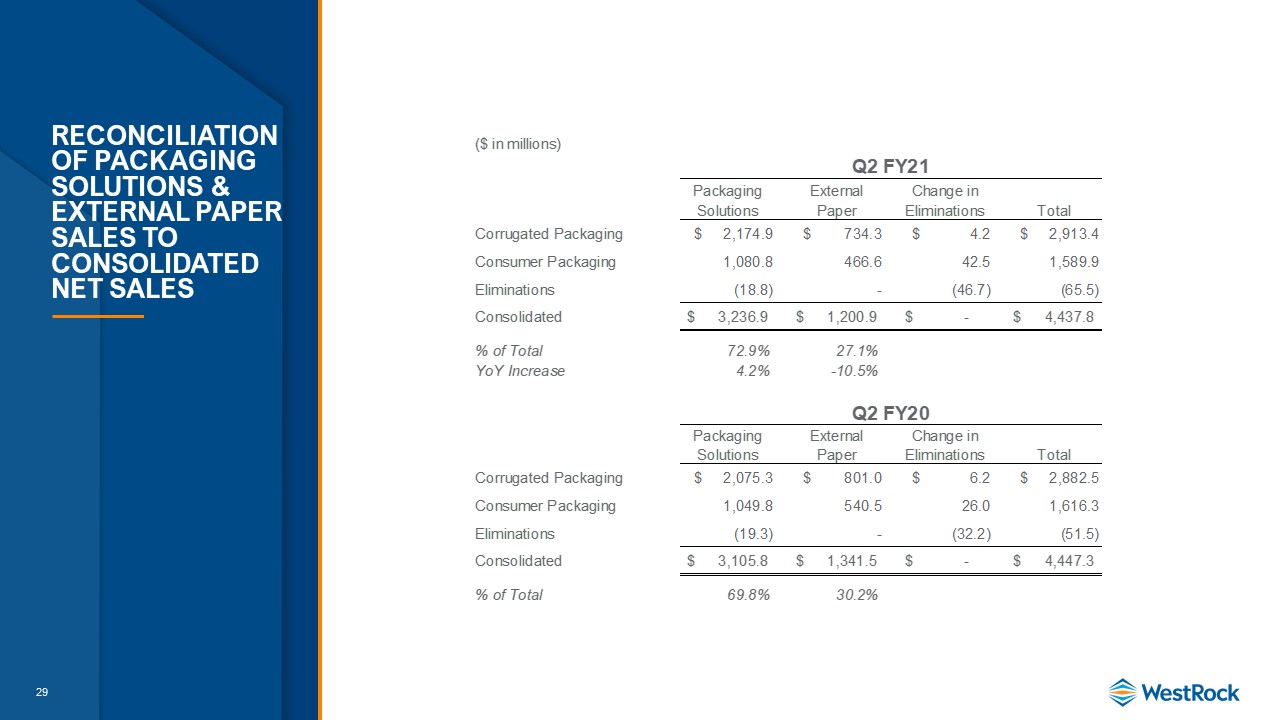
29 Reconciliation of Packaging Solutions & external paper Sales to Consolidated Net Sales
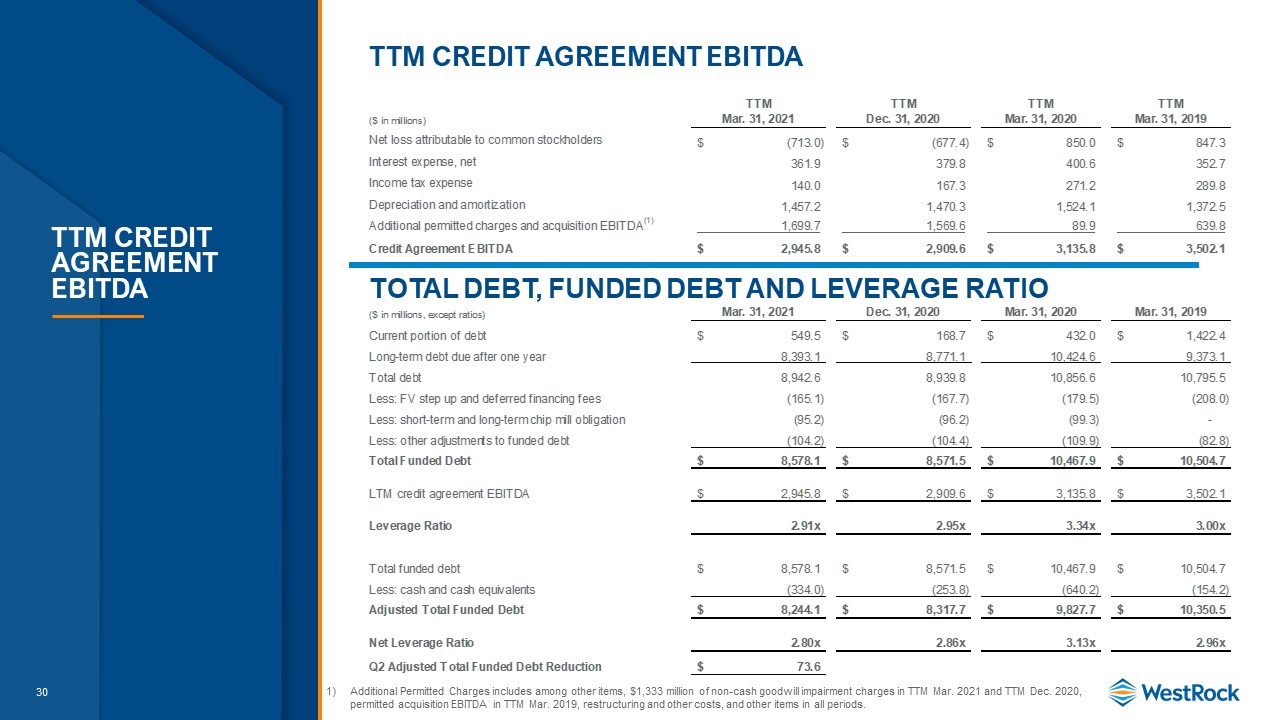
30 TTM Credit Agreement EBITDA Total Debt, Funded Debt and Leverage Ratio Additional Permitted Charges includes among other items, $1,333 million of non-cash goodwill impairment charges in TTM Mar. 2021 and TTM Dec. 2020, permitted acquisition EBITDA in TTM Mar. 2019, restructuring and other costs, and other items in all periods. TTM Credit Agreement EBITDA

31 Adjusted Net Debt Adjusts for the October 1, 2019 lease standard adoption as codified in ASC 842 that caused us to recharacterize a short-term and long-term liability for two chip mills to a finance lease obligation.

32