Exhibit 99.2
![](https://capedge.com/proxy/8-K/0001157523-22-001585/a52965310ex99_2slide1.jpg)
Westrock Q4 fy22 results November 10, 2022
![](https://capedge.com/proxy/8-K/0001157523-22-001585/a52965310ex99_2slide2.jpg)
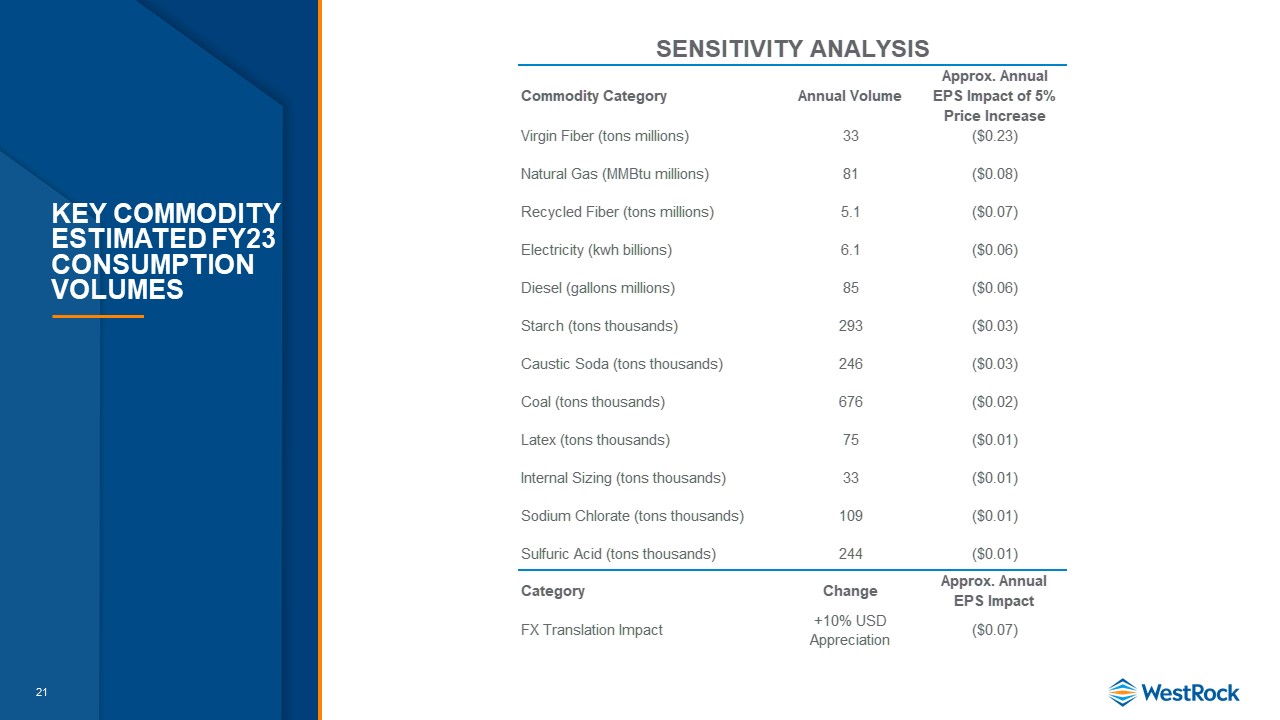
Forward Looking Statements: This presentation contains forward-looking statements within the meaning of the Private Securities Litigation Reform Act of 1995, including but not limited to the statements on the slides entitled “Recent Portfolio Actions”, “Executing on Transformation Initiatives”, “Plastics Replacement Solutions”, “Q1 FY23 Guidance”, “FY23 Guidance”, “Additional Guidance”, and “Key Commodity Estimated FY23 Consumption Volumes” that give guidance or estimates for future periods. Forward-looking statements are based on our current expectations, beliefs, plans or forecasts and are typically identified by words or phrases such as "may," "will," "could," "should," "would," "anticipate," "estimate," "expect," "project," "intend," "plan," "believe," "target," "prospects," "potential" and "forecast," and other words, terms and phrases of similar meaning. Forward-looking statements involve estimates, expectations, projections, goals, forecasts, assumptions, risks and uncertainties. A forward-looking statement is not a guarantee of future performance, and actual results could differ materially from those contained in the forward-looking statement. Forward-looking statements are subject to a number of assumptions, risks and uncertainties, many of which are beyond our control, such as developments related to pricing cycles and volumes; economic, competitive and market conditions generally, including macroeconomic uncertainty, customer inventory rebalancing, the impact of inflation and increases in energy, raw materials, shipping, labor and capital equipment costs; reduced supply of raw materials, energy and transportation, including from supply chain disruptions and labor shortages; intense competition; results and impacts of acquisitions, including timing and operational and financial effects from the planned acquisition of Gondi, S.A. de C.V. (“Grupo Gondi”), and divestitures as well as risks related to our joint ventures; business disruptions, including from public health crises such as a resurgence of COVID, the occurrence of severe weather or a natural disaster or other unanticipated problems, such as labor difficulties, equipment failure or unscheduled maintenance and repair; failure to respond to changing customer preferences; the amount and timing of capital expenditures, including installation costs, project development and implementation costs, and costs related to resolving disputes with third parties with which we work to manage and implement capital projects; risks related to international sales and operations; the production of faulty or contaminated products; the loss of certain customers; adverse legal, reputational, operational and financial effects resulting from cyber incidents and the effectiveness of business continuity plans during a ransomware or other cyber incident; work stoppages and other labor relations difficulties; inability to attract, motivate, train and retain qualified personnel; risks associated with sustainability and climate change, including our ability to achieve our environmental, social and governance targets and goals on announced timelines or at all; our inability to successfully identify and make performance and productivity improvements and risks associated with completing strategic projects on the anticipated timelines and realizing anticipated financial or operational improvements on announced timelines or at all, including with respect to our business systems transformation; risks related to our indebtedness; the scope, costs, timing and impact of any restructuring of our operations and corporate and tax structure; our desire or ability to repurchase company stock; and the scope, timing and outcome of any litigation, claims or other proceedings or dispute resolutions and the impact of any such litigation (including with respect to the Brazil tax liability matter). Such risks and other factors that may impact forward-looking statements are discussed in Item 1A “Risk Factors” in our Annual Report on Form 10-K for the fiscal year ended September 30, 2021, as well as the other risks discussed in our subsequent filings with the Securities and Exchange Commission. The information contained herein speaks as of the date hereof, and the Company does not have or undertake any obligation to update or revise its forward-looking statements, whether as a result of new information, future events or otherwise, except to the extent required by law. Non-GAAP Financial Measures: We report our financial results in accordance with accounting principles generally accepted in the United States (“GAAP”). However, management believes certain non-GAAP financial measures provide users with additional meaningful financial information that should be considered when assessing our ongoing performance. Management also uses these non-GAAP financial measures in making financial, operating and planning decisions and in evaluating our performance. Non-GAAP financial measures should be viewed in addition to, and not as an alternative for, our GAAP results. The non-GAAP financial measures we present may differ from similarly captioned measures presented by other companies. For additional information, see the Appendix. In addition, as explained in the Appendix, we are not providing a reconciliation of forward-looking non-GAAP financial measures to the most directly comparable U.S. GAAP measure because we are unable to predict with reasonable certainty the ultimate outcome of certain significant items without unreasonable effort. Cautionary Language 2
![](https://capedge.com/proxy/8-K/0001157523-22-001585/a52965310ex99_2slide3.jpg)
3 FY22 Year in review Record financial results driven by favorable pricing and strong execution Net sales of $21.3 billion up 13% year-over-year Consolidated Adjusted EBITDA(1) of $3.5 billion up 15% year-over-year Adjusted EPS(1) of $4.76 up 40% year-over-year Adjusted Free Cash Flow(1) of $1.2 billion Reduced net leverage(1) to 2.05x Progress towards WestRock’s transformation Established transformation agenda Re-aligned segment reporting Executed several portfolio actions Began cost-savings initiatives Net Sales Non-GAAP Financial Measure. See Non-GAAP Financial Measures and Reconciliations in the Appendix. Consolidated Adjusted EBITDA Adjusted Earnings per Share ($ in billions) ($ in billions) +13% +15% +40% Focused on continued transformation progress in FY23
![](https://capedge.com/proxy/8-K/0001157523-22-001585/a52965310ex99_2slide4.jpg)
Sales and earnings growth in Q4 FY22 Net sales of $5.4 billion, up 6% year-over-year Consolidated Adjusted EBITDA(1) of $920 million, up 5% year-over-year Consolidated Adjusted EBITDA margin(1) of 17%, down 20 basis points year-over-year Adjusted EPS(1) of $1.43 per share, up 16% year-over-year Generated $268 million of Adjusted Free Cash Flow(1) Packaging sales(2) increased 10% year-over-year driven by successful implementation of price increases Continue to advance our transformation initiatives Net leverage ratio(1) of 2.05x Increased dividend 10% in October 2022 Remaining authorization to repurchase additional 29 million shares 4 Q4 FY22 key highlights Non-GAAP Financial Measure. See Non-GAAP Financial Measures and Reconciliations in the Appendix Packaging sales is a non-GAAP financial measure and consists of Corrugated Packaging segment sales (exclude withe top trade sales) and Consumer Packaging segment sales Adjusted EBITDA margin (excluding white top trade sales), a non-GAAP financial measure Consolidated Adjusted EBITDA margins. Strong earnings growth in dynamic environment ($ in millions) Consolidated Adjusted EBITDA Q4 fy22 Vs. q4 fy21 Corrugated Packaging(3) 16.7% -50bps Consumer Packaging 16.8% -30bps Global Paper 21.4% +40bps Distribution 7.0% +30bps WestRock(4) 17.0% -20bps Adjusted EBITDA Margins
![](https://capedge.com/proxy/8-K/0001157523-22-001585/a52965310ex99_2slide5.jpg)
5 Recent portfolio actions Announced acquisition of remaining stake in Grupo Gondi joint venture Expect to close in December 2022 Calendar 2022 estimated EBITDA of $200 million - $210 million Closed high-cost Panama City mill and St. Paul corrugated medium production Approximately $71 million negative impact to annual Consolidated Adjusted EBITDA(1) Continued to streamline portfolio through planned sales of non-strategic URB assets Includes 3 mills and our 65% stake in URB converting joint venture Approximately $69 million negative impact to annual Consolidated Adjusted EBITDA(1) Reflects fiscal year 2022 market conditions Reduced n.a. corrugated cost/ton by $5 and redirecting significant capital investment to higher return investments Strategic actions to drive return on invested capital
![](https://capedge.com/proxy/8-K/0001157523-22-001585/a52965310ex99_2slide6.jpg)
6 Executing on transformation initiatives Targeting over $250 million in annual net cost savings in fiscal 2023 Executing strategic portfolio actions Grupo Gondi acquisition Panama City closure St. Paul medium closure Sales of URB assets Modernizing IT systems to streamline processes and reduce costs Targeting additional actions to reduce SG&A and to drive increased efficiencies $40 million Estimated annual savings from SG&A reductions in progress $150-200 million Estimated annual run-rate savings from logistics and planning initiatives in progress $45 million Estimated annual savings in indirect spend in progress BY THE NUMBERS $150-200 million Estimated annual savings from mill and converting network efficiencies in progress Additional Highlights $5 per ton Average reduction in North American corrugated mill cost
![](https://capedge.com/proxy/8-K/0001157523-22-001585/a52965310ex99_2slide7.jpg)
7 Plastics replacement Solutions CanCollar Fortuna® Automates customers’ production lines Reduces labor costs CLUSTER-PAK® EVERGROW® ECO-PUSH® CanCollar® X Provide a fiber-based solution Enables ~50% material reduction Uses a fiber-based, glue-free minimalist design Total addressable market of $9 billion in North America and $50 billion globally Current annual run-rate plastics replacement revenue of $345 million, targeting to more than double by end of fiscal 2025 Largest opportunities in beverage, direct food applications and shrink film multipacks Plastics Replacement Opportunity
![](https://capedge.com/proxy/8-K/0001157523-22-001585/a52965310ex99_2slide8.jpg)
8 Solid results despite economic headwinds Net sales up 6%, driven by continued price realization Higher inflation across energy, freight, labor, chemicals and virgin fiber Results include ransomware insurance recovery of $26 million year-over-year Generated $268 million of Adjusted Free Cash Flow Non-GAAP Financial Measure. See Non-GAAP Financial Measures and Reconciliations in the Appendix. Q4 Fy22 WestRock Results Q4 Year-over-year Highlights Consolidated Adjusted EBITDA ($ in Millions) FOURTH QUARTER SECOND QUARTER $ in millions, EXCEPT PER SHARE ITEMS FY22 FY21 YoY Net Sales $5,403 $5,091 6% Consolidated Adjusted EBITDA(1) $920 $878 5% % Margin(1) 17.0% 17.2% -20bps Capital Expenditures $293 $310 -5% Adjusted Free Cash Flow(1) $268 $372 -28% Adjusted Earnings Per Diluted Share(1) $1.43 $1.23 16% +$42
![](https://capedge.com/proxy/8-K/0001157523-22-001585/a52965310ex99_2slide9.jpg)
9 Segment sales up 9% driven by continued flow-through of previously published price increases Higher inflation across energy, freight, labor, chemicals and virgin fiber Lower volumes driven by customer inventory rebalancing and softer economic conditions Strength in Packaged Food and Beverage, offset by softer volumes in Industrial and Foodservice Excludes white top trade sales Non-GAAP Financial Measure. See Non-GAAP Financial Measures and Reconciliations in the Appendix. Q4 Fy22 corrugated packaging Results Q4 Year-over-year Highlights Adjusted EBITDA ($ in Millions) FOURTH QUARTER SECOND QUARTER $ in millions FY22 FY21 YoY Segment Sales(1)(2) $2,301 $2,106 9% Adjusted EBITDA $384 $361 6% % Margin(1)(2) 16.7% 17.2% -50bps +$23
![](https://capedge.com/proxy/8-K/0001157523-22-001585/a52965310ex99_2slide10.jpg)
Q4 Year-over-year Highlights 10 Segment sales up 13% in the quarter driven by strong price/mix and organic volume growth Higher inflation across energy, freight, labor, chemicals and virgin fiber Backlogs remain healthy Strength in Beverage, Retail Food and Healthcare partially offset by softness in Foodservice and Home, Beauty and Personal Care Q4 Fy22 consumer packaging Results Adjusted EBITDA ($ in Millions) FOURTH QUARTER SECOND QUARTER $ in millions FY22 FY21 YoY Segment Sales $1,306 $1,159 13% Adjusted EBITDA $219 $198 11% % Margin 16.8% 17.1% -30bps +$21
![](https://capedge.com/proxy/8-K/0001157523-22-001585/a52965310ex99_2slide11.jpg)
Q4 Year-over-year Highlights 11 Continuing to leverage our strong customer relationships, scale and breadth of paper grades to deliver value and drive profitability Strong price realization exceeded cost inflation Focus on mix and margin drove 40 basis point expansion Flexibility to navigate supply/demand dynamics Q4 Fy22 global paper Results Adjusted EBITDA ($ in Millions) FOURTH QUARTER SECOND QUARTER $ in millions FY22 FY21 YoY Segment Sales $1,429 $1,462 -2% Adjusted EBITDA $306 $307 0% % Margin 21.4% 21.0% +40bps -$1
![](https://capedge.com/proxy/8-K/0001157523-22-001585/a52965310ex99_2slide12.jpg)
Q4 Year-over-year Highlights 12 Segment sales up 7% in the quarter Strong pricing and lower operating costs partially offset by inflation and lower volume Implementing improved pricing processes and inventory management Q4 Fy22 distribution Results Adjusted EBITDA ($ in Millions) FOURTH QUARTER SECOND QUARTER $ in millions FY22 FY21 YoY Segment Sales $374 $349 7% Adjusted EBITDA $26 $23 11% % Margin 7.0% 6.7% +30bps +$3
![](https://capedge.com/proxy/8-K/0001157523-22-001585/a52965310ex99_2slide13.jpg)
13 Adjusted Free Cash Flow Q4 Adjusted Free Cash Flow of $268 million FY22 Adjusted Free Cash Flow of $1.2 billion 7th straight year of Adjusted Free Cash Flow above $1 billion Net leverage of 2.05x, within target of 1.75x to 2.25x FY22 Adjusted Free Cash Flow Conversion of 34%(1)(2) Strong Adjusted Free Cash Flow Adjusted Free Cash Flow(1)($ in Billions) Non-GAAP Financial Measure. See Non-GAAP Financial Measures and Reconciliations in the Appendix. FY22 Adjusted Free Cash Flow of $1.2B and Consolidated Adjusted EBITDA of $3.5B
![](https://capedge.com/proxy/8-K/0001157523-22-001585/a52965310ex99_2slide14.jpg)
14 Q1 fy23 guidance Q1 FY23 Consolidated adjusted EBITDA(1) Q1 FY23 Adjusted EPS(1) Non-GAAP Financial Measure. See Non-GAAP Financial Measures in the Appendix. $625 - $725 MILLION $0.45 - $0.74 Per Share Q1 FY23 Sequential Guidance Details Favorable costs sequentially driven by natural gas down approx. 20% to $6.70 and recycled fiber down approx. 70% to $33 Unfavorable non-cash pension expense of approximately $40M YoY driven by higher interest rates and market volatility Four less shipping days vs. FY22 Q4 (60 vs. 64) Approximately 150K tons of maintenance downtime
![](https://capedge.com/proxy/8-K/0001157523-22-001585/a52965310ex99_2slide15.jpg)
-$50 million Currency impact YoY 15 fy23 guidance Non-GAAP Financial Measure. See Non-GAAP Financial Measures in the Appendix. $3.2 - $3.6 billion FY23 consolidated adjusted EBITDA(1) $3.57 - $4.73 per share FY23 adjusted EPS(1) FY23 Guidance Details Includes recent portfolio actions: Expected acquisition of remaining stake in Grupo Gondi Expected divestiture of non-strategic URB assets Closure of Panama City and St. Paul corrugated medium production Unfavorable non-cash pension expense of approx. $160 million YoY due to interest rates and market volatility Unfavorable currency impact of $50 million Focused on Delivering strong results in FY23 Key Drivers impacting guidance -$160 million Non-cash pension expense YoY +$85 million Pending Portfolio Actions YoY Building on our investor day strategy
![](https://capedge.com/proxy/8-K/0001157523-22-001585/a52965310ex99_2slide16.jpg)
16
![](https://capedge.com/proxy/8-K/0001157523-22-001585/a52965310ex99_2slide17.jpg)
Appendix 17
![](https://capedge.com/proxy/8-K/0001157523-22-001585/a52965310ex99_2slide18.jpg)
Adjusted EBITDA ($ in millions) Q4 year over year BRIDGES 18 Corrugated packaging Consumer packaging distribution Global paper -$1 +$21 +$23 +$3
![](https://capedge.com/proxy/8-K/0001157523-22-001585/a52965310ex99_2slide19.jpg)
Adjusted EBITDA ($ in millions) fy22 year over year BRIDGES 19 Corrugated packaging Consumer packaging distribution Global paper +$362 +$108 -$7 +$11
![](https://capedge.com/proxy/8-K/0001157523-22-001585/a52965310ex99_2slide20.jpg)
20 Additional guidance FY23 Guidance Q1 FY23 Full Year Depreciation & Amortization Approx. $360 million Approx. $1.5 billion Net Interest Expense Approx. $100 million Approx. $470 million Effective Adjusted Book Tax Rate(1) 24% - 26% 24% - 26% Adjusted Cash Tax Rate(1) Approx. 26% Diluted Shares Outstanding(2) 257 million 258 million Mill Maintenance Downtime Schedule (tons in thousands) Q1 Q2 Q3 Q4 Full Year FY23 Maintenance 150 135 165 15 465 FY22 Maintenance 192 124 46 47 409 FY21 Maintenance 105 65 119 12 301 Maintenance(3) FY23 GUIDANCE Non-GAAP Financial Measure. See Non-GAAP Financial Measures in the Appendix Diluted shares outstanding excludes share repurchases Excludes Grupo Gondi and Brazil Maintenance Downtime
![](https://capedge.com/proxy/8-K/0001157523-22-001585/a52965310ex99_2slide21.jpg)
21 Key Commodity Estimated FY23 Consumption Volumes
![](https://capedge.com/proxy/8-K/0001157523-22-001585/a52965310ex99_2slide22.jpg)
22 Shipment Data Quantities may not sum due to trailing decimals (1)
![](https://capedge.com/proxy/8-K/0001157523-22-001585/a52965310ex99_2slide23.jpg)
ADJUSTED EARNINGS PER DILUTED SHARE We use the non-GAAP financial measure “Adjusted Earnings per Diluted Share,” also referred to as “Adjusted Earnings per Share” or “Adjusted EPS”, because we believe this measure provides our management, board of directors, investors, potential investors, securities analysts and others with useful information to evaluate our performance since it excludes restructuring and other costs, business systems transformation costs, and other specific items that we believe are not indicative of our ongoing operating results. Our management and board of directors use this information to evaluate our performance relative to other periods. We believe the most directly comparable GAAP measure is Earnings per diluted share. ADJUSTED OPERATING CASH FLOW, ADJUSTED FREE CASH FLOW and adjusted free cash flow Conversion We use the non-GAAP financial measures “Adjusted Operating Cash Flow”, “Adjusted Free Cash Flow” and “Adjusted Free Cash Flow Conversion” because we believe these measures provide our management, board of directors, investors, potential investors, securities analysts and others with useful information to evaluate our performance relative to other periods because they exclude certain cash restructuring and other costs, net of tax and business systems transformation costs, net of tax that we believe are not indicative of our ongoing operating results. We believe Adjusted Free Cash Flow provides greater comparability across periods by excluding capital expenditures. We believe the most directly comparable GAAP measure is net cash provided by operating activities. Adjusted Free Cash Flow Conversion is computed as Adjusted Free Cash Flow divided by Consolidated Adjusted EBITDA. Consolidated Adjusted EBITDA and Consolidated Adjusted EBITDA MARGINS We use the non-GAAP financial measures “Consolidated Adjusted EBITDA” and “Consolidated Adjusted EBITDA Margins”, along with other factors, to evaluate our performance against our peers. We believe that our management, board of directors, investors, potential investors, securities analysts and others use these measures to evaluate our performance relative to our peers. Management believes that the most directly comparable GAAP measure to “Consolidated Adjusted EBITDA” (formerly referred to as Adjusted Segment EBITDA) is “Net income attributable to common stockholders”. It can also be derived by adding together each segment’s “Adjusted EBITDA” plus “Non-allocated expenses”. “Consolidated Adjusted EBITDA Margins” is calculated as “Consolidated Adjusted EBITDA” divided by Net Sales. Corrugated Adjusted EBITDA Margin, Excluding Trade-Sales “Corrugated Adjusted EBITDA Margin, Excluding Trade Sales” is computed by dividing “Corrugated Adjusted EBITDA” by corrugated segment sales, excluding trade-sales, which is reported segment sales less trade-sales. LEVERAGE RATIO, NET LEVERAGE RATIO, TOTAL FUNDED DEBT AND ADJUSTED TOTAL FUNDED DEBT We use the non-GAAP financial measures “Leverage Ratio” and “Net Leverage Ratio” as measurements of our operating performance and to compare to our publicly disclosed target leverage ratio. We believe our management, board of directors, investors, potential investors, securities analysts and others use each measure to evaluate our available borrowing capacity – in the case of “Net Leverage Ratio”, adjusted for cash and cash equivalents. We define Leverage Ratio as our Total Funded Debt divided by our credit agreement EBITDA, each of which term is defined in our revolving credit agreement, dated July 7, 2022. As of September 30, 2022, our leverage ratio was 2.13 times. While the Leverage Ratio under our credit agreement determines the credit spread on our debt, we are not subject to a leverage ratio cap. Our credit agreement is subject to a Debt to Capitalization Ratio, as defined therein. We define “Adjusted Total Funded Debt” as our Total Funded Debt less cash and cash equivalents. Net Leverage Ratio represents Adjusted Total Funded Debt divided by our credit agreement EBITDA. As of September 30, 2022, our Net Leverage Ratio was 2.05 times. Forward-looking Guidance We are not providing a reconciliation of forward-looking non-GAAP financial measures to the most directly comparable U.S. GAAP measure because we are unable to predict with reasonable certainty the ultimate outcome of certain significant items without unreasonable effort. These items may include, but are not limited to, merger and acquisition-related expenses, restructuring expenses, asset impairments, litigation settlements, changes to contingent consideration and certain other gains or losses. These items are uncertain, depend on various factors, and could have a material impact on U.S. GAAP reported results for the guidance period. In addition, we have not quantified future amounts to develop our Net Leverage Ratio target but have stated our commitment to an investment grade credit profile in order to generally maintain the target. This target does not reflect Company guidance. Non-GAAP Financial Measures 23
![](https://capedge.com/proxy/8-K/0001157523-22-001585/a52965310ex99_2slide24.jpg)
24 The as reported results for Pre-Tax, Tax, Net of Tax and EPS are equivalent to the line items “Income before income taxes", "Income tax expense“, "Consolidated net income“ and “Earnings per diluted share”, respectively, as reported on the statements of income. Adjusted Net Income and Adjusted Earnings Per Diluted Share Reconciliation
![](https://capedge.com/proxy/8-K/0001157523-22-001585/a52965310ex99_2slide25.jpg)
25 The as reported results for Pre-Tax, Tax, Net of Tax and EPS are equivalent to the line items “Income before income taxes", "Income tax expense“, "Consolidated net income“ and “Earnings per diluted share”, respectively, as reported on the statements of income. Adjusted Net Income and Adjusted Earnings Per Diluted Share Reconciliation
![](https://capedge.com/proxy/8-K/0001157523-22-001585/a52965310ex99_2slide26.jpg)
26 The as reported results for Pre-Tax, Tax, Net of Tax and EPS are equivalent to the line items “Income before income taxes", "Income tax expense“, "Consolidated net income“ and “Earnings per diluted share”, respectively, as reported on the statements of income. Adjusted Net Income and Adjusted Earnings Per Diluted Share Reconciliation
![](https://capedge.com/proxy/8-K/0001157523-22-001585/a52965310ex99_2slide27.jpg)
27 The as reported results for Pre-Tax, Tax, Net of Tax and EPS are equivalent to the line items “Income before income taxes", "Income tax expense“, "Consolidated net income“ and “Earnings per diluted share”, respectively, as reported on the statements of income. Adjusted Net Income and Adjusted Earnings Per Diluted Share Reconciliation
![](https://capedge.com/proxy/8-K/0001157523-22-001585/a52965310ex99_2slide28.jpg)
28 Reconciliation of Net Income to Consolidated Adjusted EBITDA Schedule adds back expense or subtracts income for certain financial statement and segment footnote items to compute Consolidated Adjusted EBITDA.
![](https://capedge.com/proxy/8-K/0001157523-22-001585/a52965310ex99_2slide29.jpg)
29 Reconciliation of Net Income to Consolidated Adjusted EBITDA Schedule adds back expense or subtracts income for certain financial statement and segment footnote items to compute Consolidated Adjusted EBITDA.
![](https://capedge.com/proxy/8-K/0001157523-22-001585/a52965310ex99_2slide30.jpg)
30 RECONCILIATION OF Corrugated Packaging ADJUSTED EBITDA MARGIN
![](https://capedge.com/proxy/8-K/0001157523-22-001585/a52965310ex99_2slide31.jpg)
31 RECONCILIATION OF PACKAGING SALES
![](https://capedge.com/proxy/8-K/0001157523-22-001585/a52965310ex99_2slide32.jpg)
32 Adjusted operating cash flow and adjusted free cash flow reconciliation
![](https://capedge.com/proxy/8-K/0001157523-22-001585/a52965310ex99_2slide33.jpg)
33 TTM Credit Agreement EBITDA Total Debt, Funded Debt and Leverage Ratio Additional Permitted Charges primarily include restructuring and other costs, and certain non-cash and other items as allowed under the credit agreement TTM Credit Agreement EBITDA
![](https://capedge.com/proxy/8-K/0001157523-22-001585/a52965310ex99_2slide34.jpg)
34