Free signup for more
- Track your favorite companies
- Receive email alerts for new filings
- Personalized dashboard of news and more
- Access all data and search results
Filing tables
Filing exhibits
Related financial report
WRK similar filings
- 7 Sep 23 Regulation FD Disclosure
- 3 Aug 23 Results of Operations and Financial Condition
- 1 Aug 23 Cost Associated with Exit or Disposal Activities
- 4 May 23 Results of Operations and Financial Condition
- 2 May 23 Cost Associated with Exit or Disposal Activities
- 1 Mar 23 Entry into a Material Definitive Agreement
- 1 Feb 23 Results of Operations and Financial Condition
Filing view
External links
| Exhibit 99.2 |
May 4, 2023 WestRockQ2 FY2023 Results

Cautionary Language Forward Looking Statements: This presentation contains forward-looking statements within the meaning of the Private Securities Litigation Reform Act of 1995, including but not limited to the statements on the slides entitled “Accelerating Transformation Initiatives”, “Driving Cost Improvements”, “Adjusted Free Cash Flow”, “Q3 FY23 Guidance”, “Fiscal Year 2023 Assumptions”, “and “Actions to Drive Long-Term Growth”, Estimated Key Commodity Q3 FY23 Consumption Volumes” that give guidance or estimates for future periods. Forward-looking statements are based on our current expectations, beliefs, plans or forecasts and are typically identified by words or phrases such as "may," "will," "could," "should," "would," "anticipate," "estimate," "expect," "project," "intend," "plan," "believe," "target," "prospects," "potential" and "forecast," and other words, terms and phrases of similar meaning. Forward-looking statements involve estimates, expectations, projections, goals, forecasts, assumptions, risks and uncertainties. A forward-looking statement is not a guarantee of future performance, and actual results could differ materially from those contained in the forward-looking statement. Forward-looking statements are subject to a number of assumptions, risks and uncertainties, many of which are beyond our control, such as developments related to pricing cycles and volumes; economic, competitive and market conditions generally, including macroeconomic uncertainty, and adverse developments affecting the financial services industry, customer inventory rebalancing, the impact of inflation and increases in energy, raw materials, shipping, labor and capital equipment costs; reduced supply of raw materials, energy and transportation, including from supply chain disruptions and labor shortages; intense competition; results and impacts of acquisitions, including operational and financial effects from the Grupo Gondi acquisition, and divestitures as well as risks related to our joint ventures; business disruptions, including from public health crises such as a resurgence of COVID, the occurrence of severe weather or a natural disaster or other unanticipated problems, such as labor difficulties, equipment failure or unscheduled maintenance and repair; failure to respond to changing customer preferences; the amount and timing of capital expenditures, including installation costs, project development and implementation costs, and costs related to resolving disputes with third parties with which we work to manage and implement capital projects; risks related to international sales and operations; the production of faulty or contaminated products; the loss of certain customers; adverse legal, reputational, operational and financial effects resulting from cyber incidents and the effectiveness of business continuity plans during a ransomware or other cyber incident; work stoppages and other labor relations difficulties; inability to attract, motivate, train and retain qualified personnel; risks associated with sustainability and climate change, including our ability to achieve our environmental, social and governance targets and goals on announced timelines or at all; our inability to successfully identify and make performance and productivity improvements and risks associated with completing strategic projects on the anticipated timelines and realizing anticipated financial or operational improvements on announced timelines or at all, including with respect to our business systems transformation; risks related to our indebtedness; the scope, costs, timing and impact of any restructuring of our operations and corporate and tax structure; our desire or ability to repurchase company stock; the scope, timing and outcome of any litigation, claims or other proceedings or dispute resolutions and the impact of any such litigation (including with respect to the Brazil tax liability matter); and additional impairment charges. Such risks and other factors that may impact forward-looking statements are discussed in Item 1A “Risk Factors” in our Annual Report on Form 10-K for the fiscal year ended September 30, 2022, as well as the other risks discussed in our subsequent filings with the Securities and Exchange Commission. The information contained herein speaks as of the date hereof, and the Company does not have or undertake any obligation to update or revise its forward-looking statements, whether as a result of new information, future events or otherwise, except to the extent required by law. Non-GAAP Financial Measures: We report our financial results in accordance with accounting principles generally accepted in the United States (“GAAP”). However, management believes certain non-GAAP financial measures provide users with additional meaningful financial information that should be considered when assessing our ongoing performance. Management also uses these non-GAAP financial measures in making financial, operating and planning decisions and in evaluating our performance. Non-GAAP financial measures should be viewed in addition to, and not as an alternative for, our GAAP results. The non-GAAP financial measures we present may differ from similarly captioned measures presented by other companies. For additional information, see the Appendix. In addition, as explained in the Appendix, we are not providing a reconciliation of forward-looking non-GAAP financial measures to the most directly comparable U.S. GAAP measure because we are unable to predict with reasonable certainty the ultimate outcome of certain significant items without unreasonable effort.
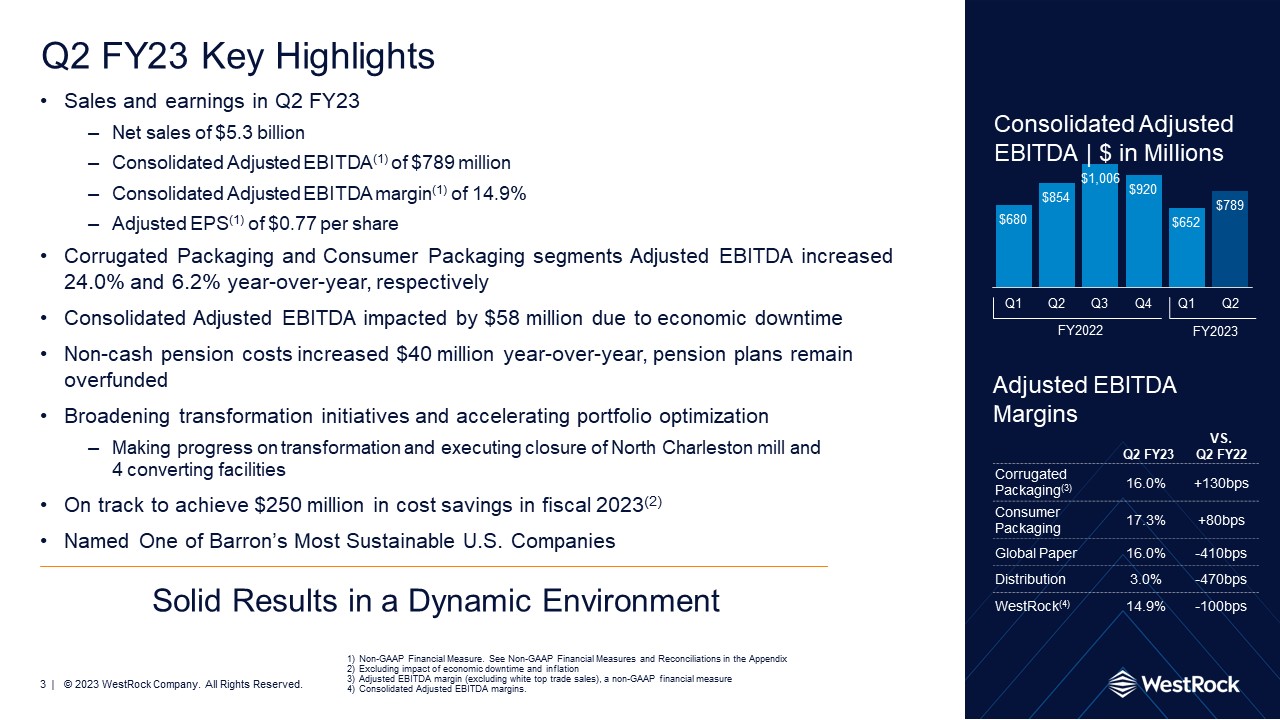
Q2 FY23 Key Highlights Sales and earnings in Q2 FY23 Net sales of $5.3 billion Consolidated Adjusted EBITDA(1) of $789 million Consolidated Adjusted EBITDA margin(1) of 14.9% Adjusted EPS(1) of $0.77 per share Corrugated Packaging and Consumer Packaging segments Adjusted EBITDA increased 24.0% and 6.2% year-over-year, respectively Consolidated Adjusted EBITDA impacted by $58 million due to economic downtime Non-cash pension costs increased $40 million year-over-year, pension plans remain overfunded Broadening transformation initiatives and accelerating portfolio optimization Making progress on transformation and executing closure of North Charleston mill and 4 converting facilities On track to achieve $250 million in cost savings in fiscal 2023(2) Named One of Barron’s Most Sustainable U.S. Companies Non-GAAP Financial Measure. See Non-GAAP Financial Measures and Reconciliations in the Appendix Excluding impact of economic downtime and inflation Adjusted EBITDA margin (excluding white top trade sales), a non-GAAP financial measure Consolidated Adjusted EBITDA margins. Solid Results in a Dynamic Environment Consolidated Adjusted EBITDA | $ in Millions FY2022 FY2023 Q2 fy23 Vs. q2 fy22 Corrugated Packaging(3) 16.0% +130bps Consumer Packaging 17.3% +80bps Global Paper 16.0% -410bps Distribution 3.0% -470bps WestRock(4) 14.9% -100bps Adjusted EBITDA Margins
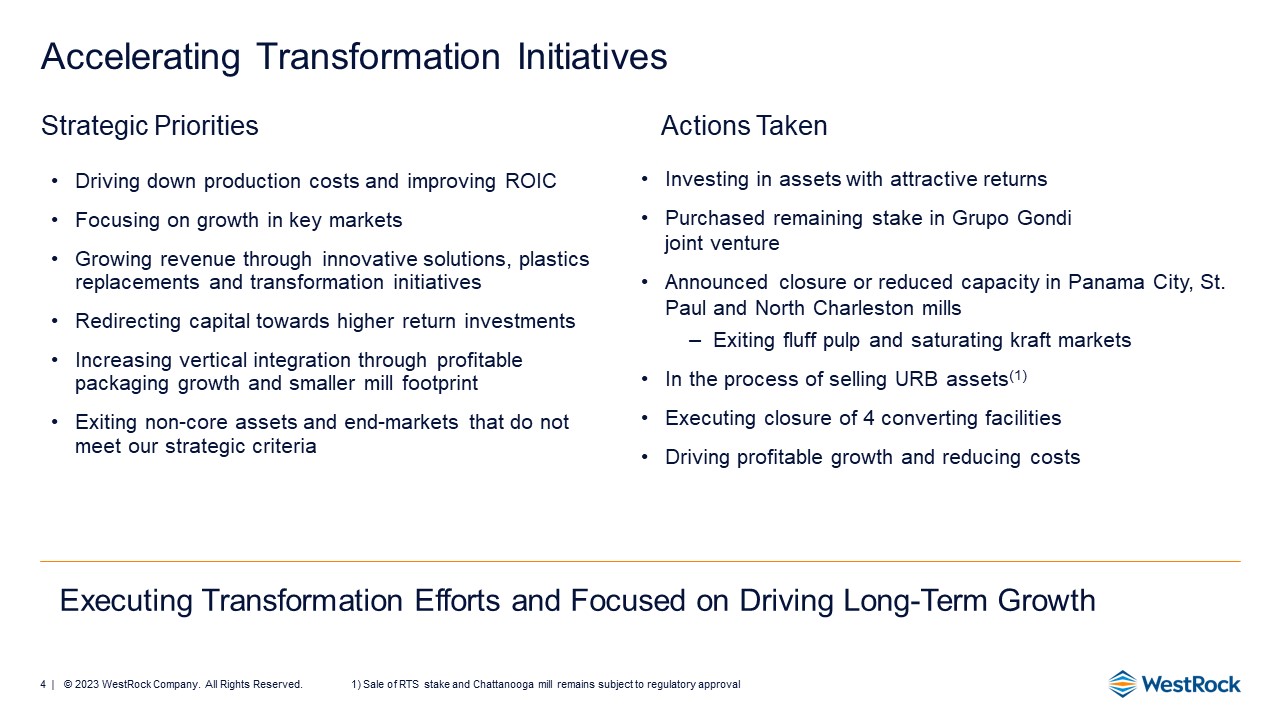
Accelerating Transformation Initiatives Investing in assets with attractive returns Purchased remaining stake in Grupo Gondi joint venture Announced closure or reduced capacity in Panama City, St. Paul and North Charleston mills Exiting fluff pulp and saturating kraft markets In the process of selling URB assets(1) Executing closure of 4 converting facilities Driving profitable growth and reducing costs Executing Transformation Efforts and Focused on Driving Long-Term Growth Driving down production costs and improving ROIC Focusing on growth in key markets Growing revenue through innovative solutions, plastics replacements and transformation initiatives Redirecting capital towards higher return investments Increasing vertical integration through profitable packaging growth and smaller mill footprint Exiting non-core assets and end-markets that do not meet our strategic criteria Actions Taken Strategic Priorities Sale of RTS stake and Chattanooga mill remains subject to regulatory approval
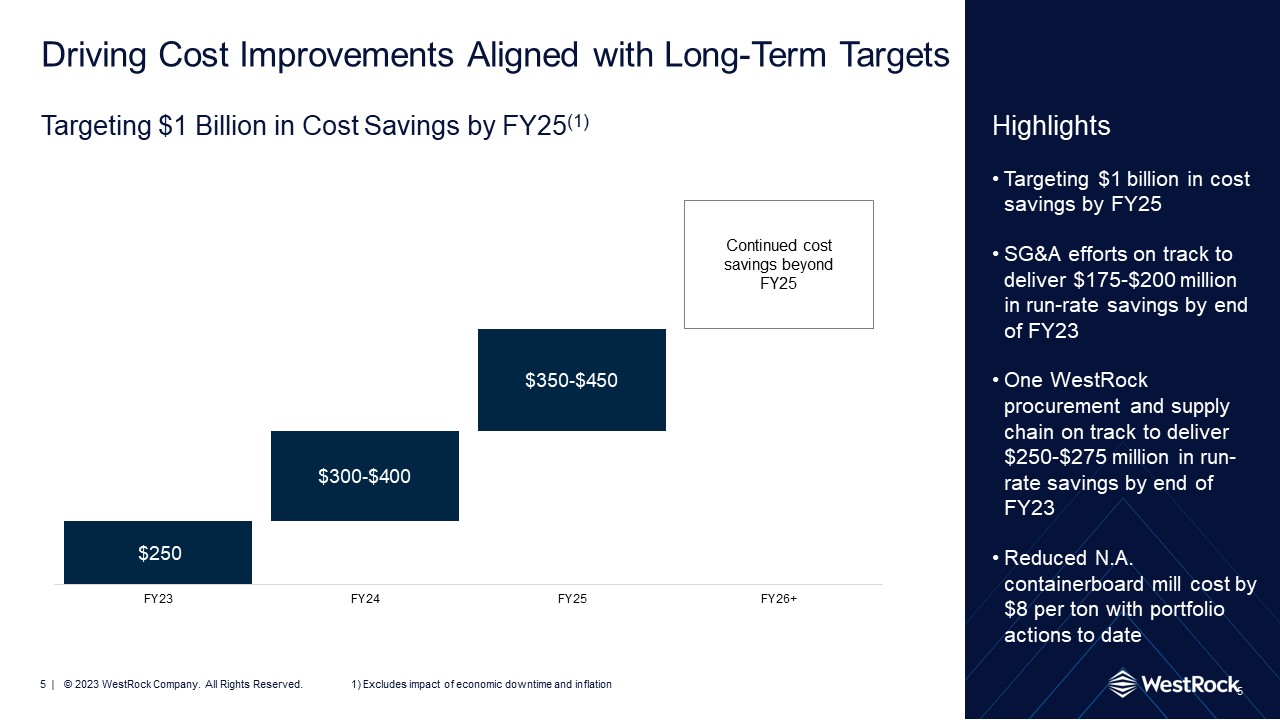
Driving Cost Improvements Aligned with Long-Term Targets Highlights Targeting $1 billion in cost savings by FY25 SG&A efforts on track to deliver $175-$200 million in run-rate savings by end of FY23 One WestRock procurement and supply chain on track to deliver $250-$275 million in run-rate savings by end of FY23 Reduced N.A. containerboard mill cost by $8 per ton with portfolio actions to date 5 Targeting $1 Billion in Cost Savings by FY25(1) Excludes impact of economic downtime and inflation Continued cost savings beyond FY25
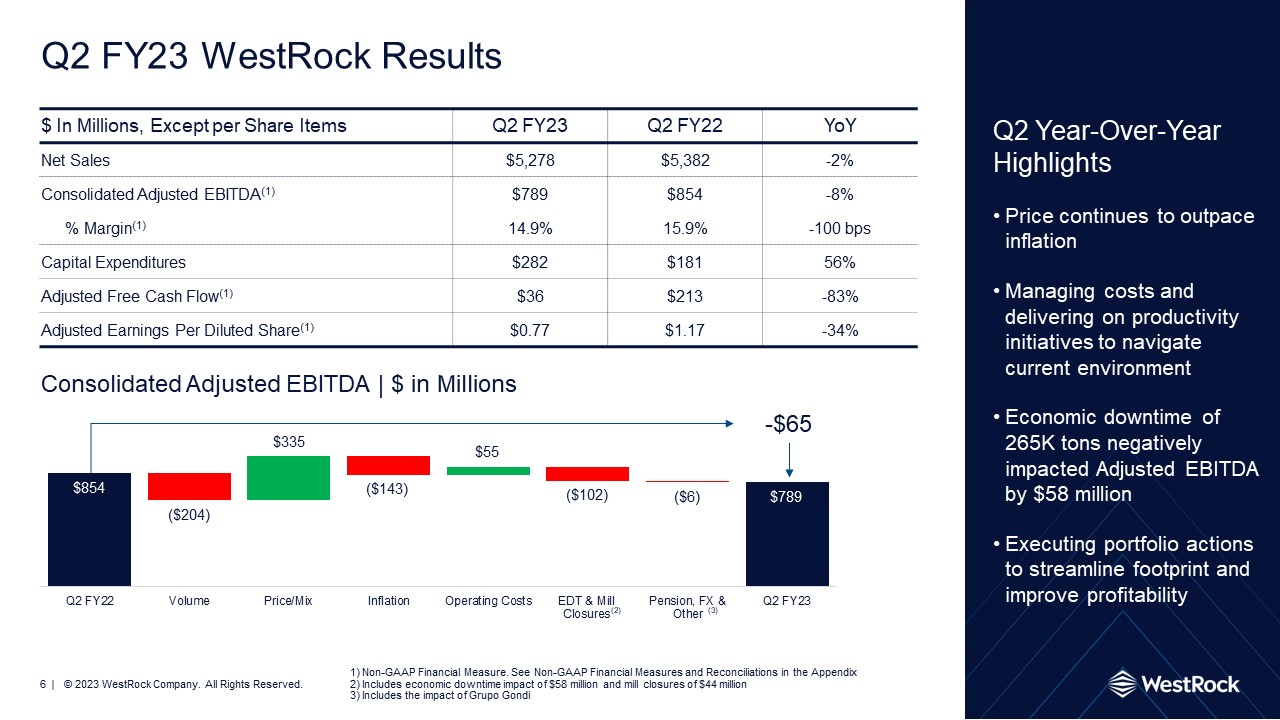
Q2 FY23 WestRock Results Q2 Year-Over-Year Highlights Price continues to outpace inflation Managing costs and delivering on productivity initiatives to navigate current environment Economic downtime of 265K tons negatively impacted Adjusted EBITDA by $58 million Executing portfolio actions to streamline footprint and improve profitability $ In Millions, Except per Share Items Q2 fy23 Q2 FY22 YoY Net Sales $5,278 $5,382 -2% Consolidated Adjusted EBITDA(1) $789 $854 -8% % Margin(1) 14.9% 15.9% -100 bps Capital Expenditures $282 $181 56% Adjusted Free Cash Flow(1) $36 $213 -83% Adjusted Earnings Per Diluted Share(1) $0.77 $1.17 -34% -$65 Consolidated Adjusted EBITDA | $ in Millions Non-GAAP Financial Measure. See Non-GAAP Financial Measures and Reconciliations in the Appendix Includes economic downtime impact of $58 million and mill closures of $44 million Includes the impact of Grupo Gondi ($6) ($102) $55 ($143) $335 ($204) (2) (3)
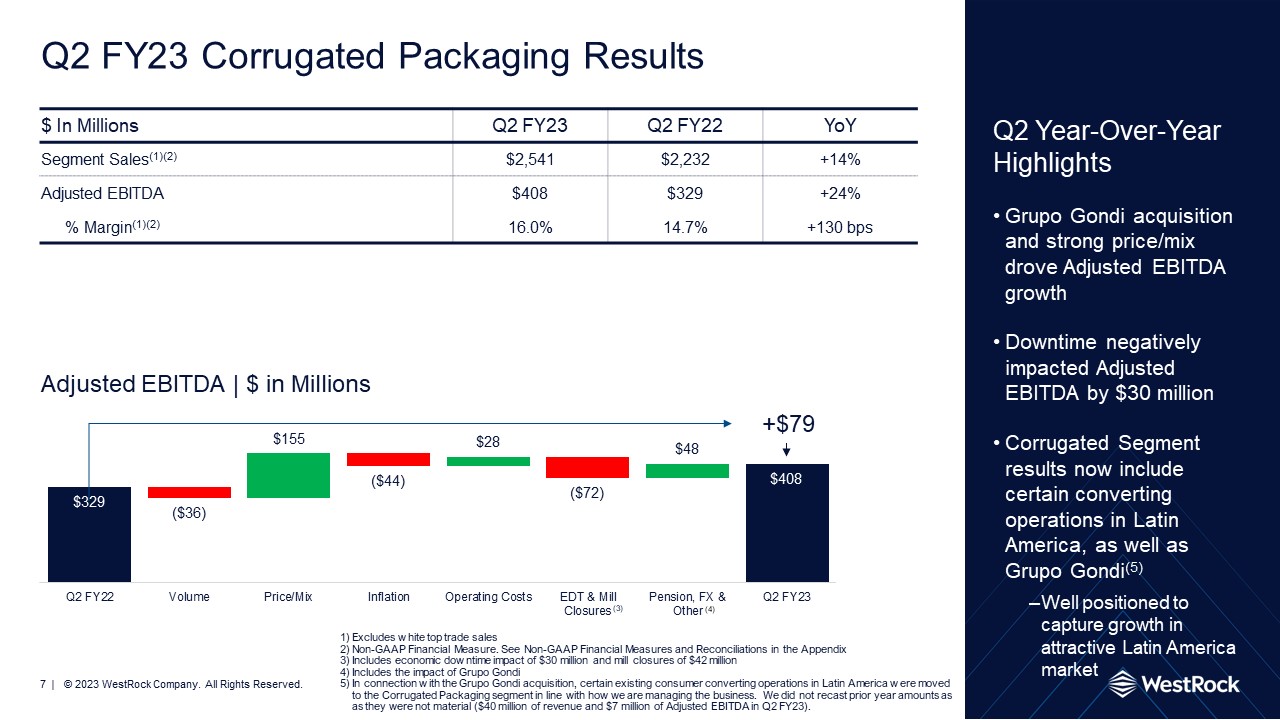
$ In Millions Q2 fy23 Q2 FY22 YoY Segment Sales(1)(2) $2,541 $2,232 +14% Adjusted EBITDA $408 $329 +24% % Margin(1)(2) 16.0% 14.7% +130 bps Q2 FY23 Corrugated Packaging Results Q2 Year-Over-Year Highlights Grupo Gondi acquisition and strong price/mix drove Adjusted EBITDA growth Downtime negatively impacted Adjusted EBITDA by $30 million Corrugated Segment results now include certain converting operations in Latin America, as well as Grupo Gondi(5) Well positioned to capture growth in attractive Latin America market Excludes white top trade sales Non-GAAP Financial Measure. See Non-GAAP Financial Measures and Reconciliations in the Appendix Includes economic downtime impact of $30 million and mill closures of $42 million Includes the impact of Grupo Gondi In connection with the Grupo Gondi acquisition, certain existing consumer converting operations in Latin America were moved to the Corrugated Packaging segment in line with how we are managing the business. We did not recast prior year amounts as they were not material ($40 million of revenue and $7 million of Adjusted EBITDA in Q2 FY23). $155 +$79 Adjusted EBITDA | $ in Millions ($36) ($44) $28 ($72) $48 (3)
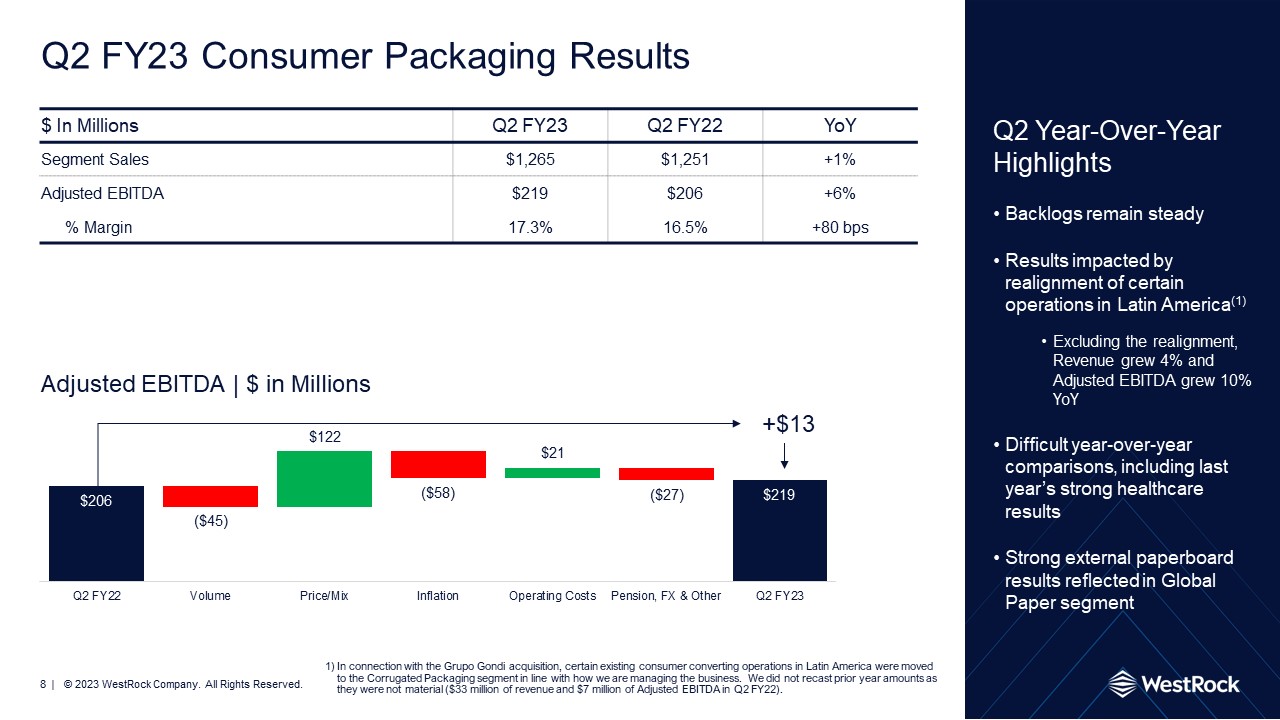
$ In Millions Q2 fy23 Q2 FY22 YoY Segment Sales $1,265 $1,251 +1% Adjusted EBITDA $219 $206 +6% % Margin 17.3% 16.5% +80 bps Q2 FY23 Consumer Packaging Results Q2 Year-Over-Year Highlights Backlogs remain steady Results impacted by realignment of certain operations in Latin America(1) Excluding the realignment, Revenue grew 4% and Adjusted EBITDA grew 10% YoY Difficult year-over-year comparisons, including last year’s strong healthcare results Strong external paperboard results reflected in Global Paper segment In connection with the Grupo Gondi acquisition, certain existing consumer converting operations in Latin America were moved to the Corrugated Packaging segment in line with how we are managing the business. We did not recast prior year amounts as they were not material ($33 million of revenue and $7 million of Adjusted EBITDA in Q2 FY22). ($45) +$13 Adjusted EBITDA | $ in Millions $122 ($58) $21 ($27)
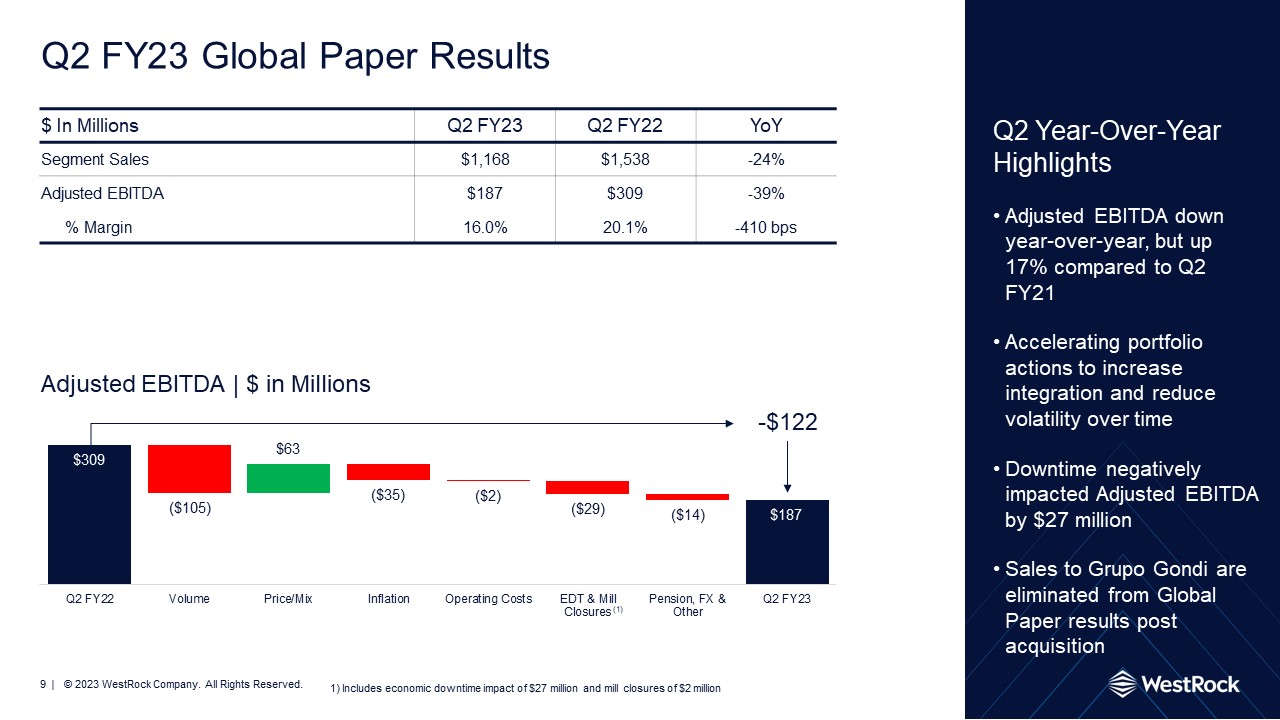
$ In Millions Q2 fy23 Q2 FY22 YoY Segment Sales $1,168 $1,538 -24% Adjusted EBITDA $187 $309 -39% % Margin 16.0% 20.1% -410 bps Q2 FY23 Global Paper Results Q2 Year-Over-Year Highlights Adjusted EBITDA down year-over-year, but up 17% compared to Q2 FY21 Accelerating portfolio actions to increase integration and reduce volatility over time Downtime negatively impacted Adjusted EBITDA by $27 million Sales to Grupo Gondi are eliminated from Global Paper results post acquisition ($105) -$122 $63 ($35) ($2) ($29) ($14) Adjusted EBITDA | $ in Millions Includes economic downtime impact of $27 million and mill closures of $2 million (1)
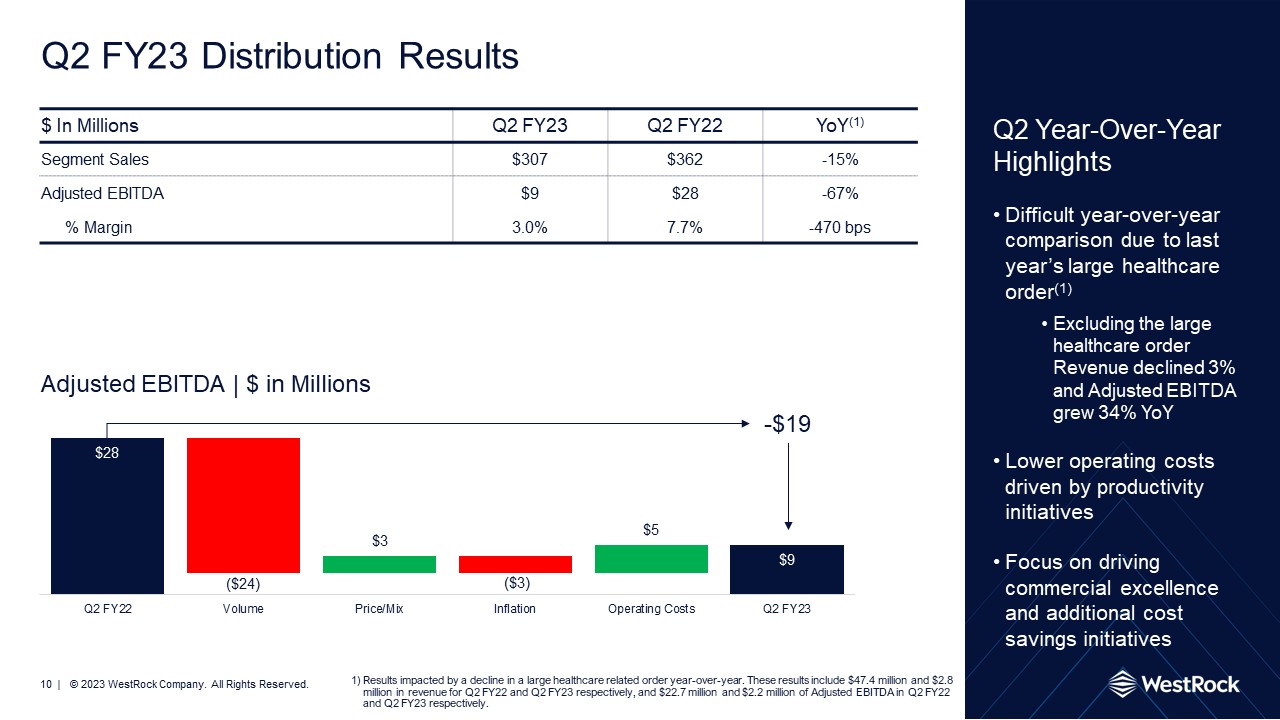
$ In Millions Q2 fy23 Q2 FY22 YoY(1) Segment Sales $307 $362 -15% Adjusted EBITDA $9 $28 -67% % Margin 3.0% 7.7% -470 bps Q2 FY23 Distribution Results Q2 Year-Over-Year Highlights Difficult year-over-year comparison due to last year’s large healthcare order(1) Excluding the large healthcare order Revenue declined 3% and Adjusted EBITDA grew 34% YoY Lower operating costs driven by productivity initiatives Focus on driving commercial excellence and additional cost savings initiatives ($24) -$19 Adjusted EBITDA | $ in Millions Results impacted by a decline in a large healthcare related order year-over-year. These results include $47.4 million and $2.8 million in revenue for Q2 FY22 and Q2 FY23 respectively, and $22.7 million and $2.2 million of Adjusted EBITDA in Q2 FY22 and Q2 FY23 respectively. $3 ($3) $5
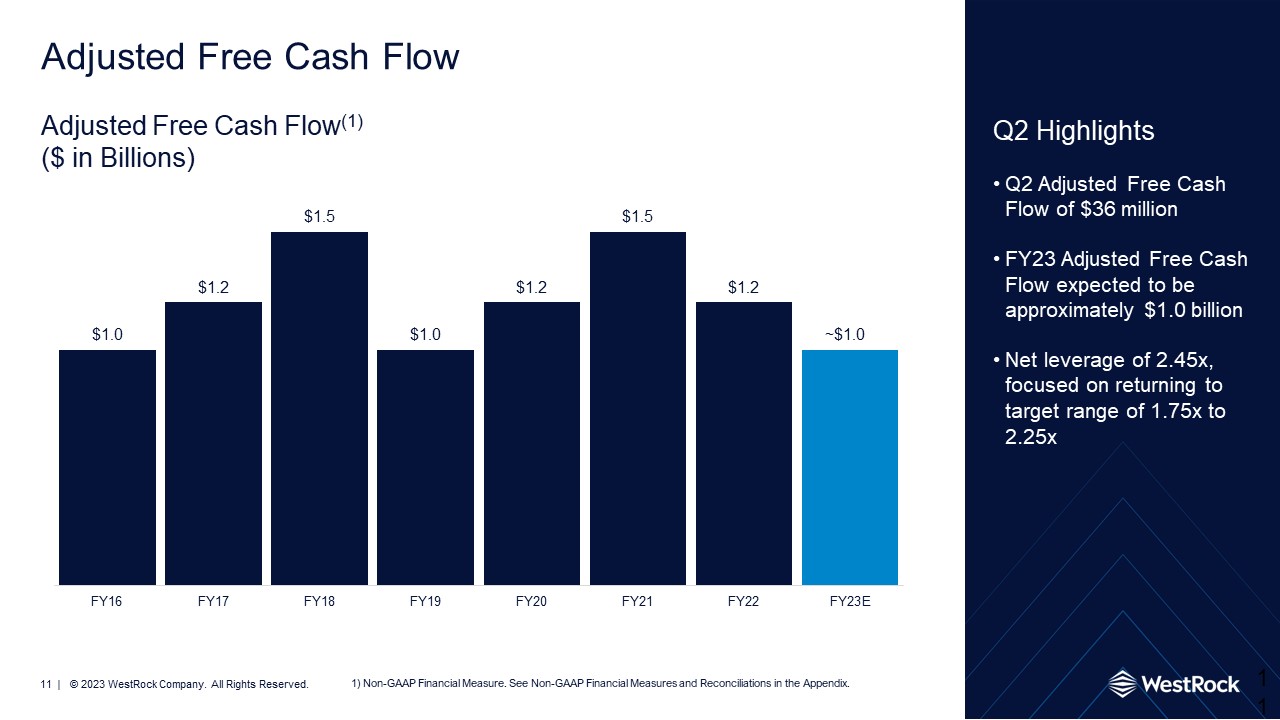
Adjusted Free Cash Flow 11 Adjusted Free Cash Flow(1)($ in Billions) Non-GAAP Financial Measure. See Non-GAAP Financial Measures and Reconciliations in the Appendix. Q2 Highlights Q2 Adjusted Free Cash Flow of $36 million FY23 Adjusted Free Cash Flow expected to be approximately $1.0 billion Net leverage of 2.45x, focused on returning to target range of 1.75x to 2.25x ~

Q3 FY23 Guidance Q3 FY23 Sequential Guidance Details Natural gas costs down 30% Higher recycled fiber Moderately lower virgin fiber, chemicals and freight Effective Adjusted Tax Rate of 24% - 26%(1) Approximately 121K tons of maintenance downtime Q3 FY23 Adjusted EPS(1) $0.30-$0.60 per share Q3 FY23 Consolidated Adjusted EBITDA(1) $650-$750 million Non-GAAP Financial Measure. See Non-GAAP Financial Measures and Reconciliations in the Appendix.
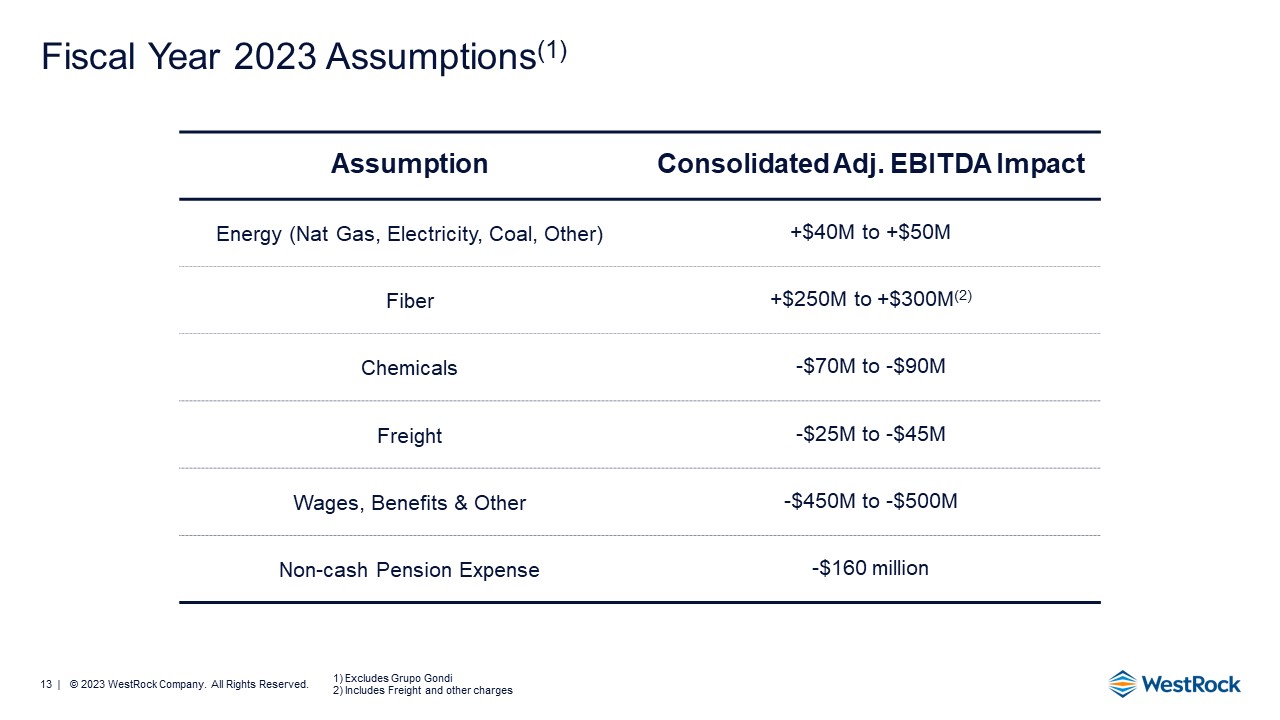
Fiscal Year 2023 Assumptions(1) Assumption Consolidated Adj. EBITDA Impact Energy (Nat Gas, Electricity, Coal, Other) +$40M to +$50M Fiber +$250M to +$300M(2) Chemicals -$70M to -$90M Freight -$25M to -$45M Wages, Benefits & Other -$450M to -$500M Non-cash Pension Expense -$160 million Excludes Grupo Gondi 2) Includes Freight and other charges
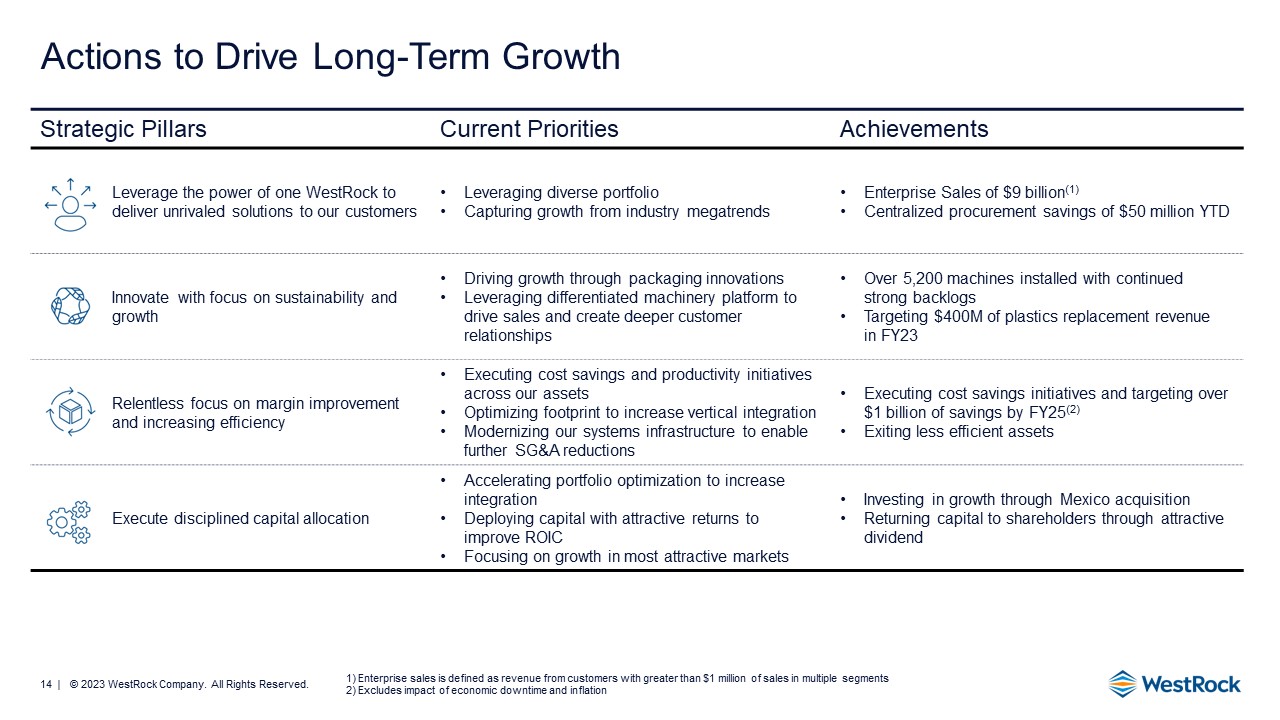
Strategic Pillars Current Priorities Achievements Leverage the power of one WestRock to deliver unrivaled solutions to our customers Leveraging diverse portfolio Capturing growth from industry megatrends Enterprise Sales of $9 billion(1) Centralized procurement savings of $50 million YTD Innovate with focus on sustainability and growth Driving growth through packaging innovations Leveraging differentiated machinery platform to drive sales and create deeper customer relationships Over 5,200 machines installed with continued strong backlogs Targeting $400M of plastics replacement revenue in FY23 Relentless focus on margin improvement and increasing efficiency Executing cost savings and productivity initiatives across our assets Optimizing footprint to increase vertical integration Modernizing our systems infrastructure to enable further SG&A reductions Executing cost savings initiatives and targeting over $1 billion of savings by FY25(2) Exiting less efficient assets Execute disciplined capital allocation Accelerating portfolio optimization to increase integration Deploying capital with attractive returns to improve ROIC Focusing on growth in most attractive markets Investing in growth through Mexico acquisition Returning capital to shareholders through attractive dividend Actions to Drive Long-Term Growth Enterprise sales is defined as revenue from customers with greater than $1 million of sales in multiple segments Excludes impact of economic downtime and inflation
Creating Value 15 Leveraging the power of one WestRock to deliver unrivaled solutions to our customers Innovating with focus on sustainability and growth Relentless focus on margin improvement and increasing efficiency Executing disciplined capital allocation

Appendix 16

Corrugated Packaging Consumer Packaging Q2 Year Over Year Bridges(1)Adjusted EBITDA ($ in millions) Distribution Global Paper -$122 +$79 -$19 +$13 ($36) ($105) $155 ($44) $28 ($72) $48 $63 ($35) ($2) ($29) ($14) ($45) $122 ($58) $21 ($27) ($24) $3 ($3) $5 See footnotes on slides 7, 8, 9, and 10
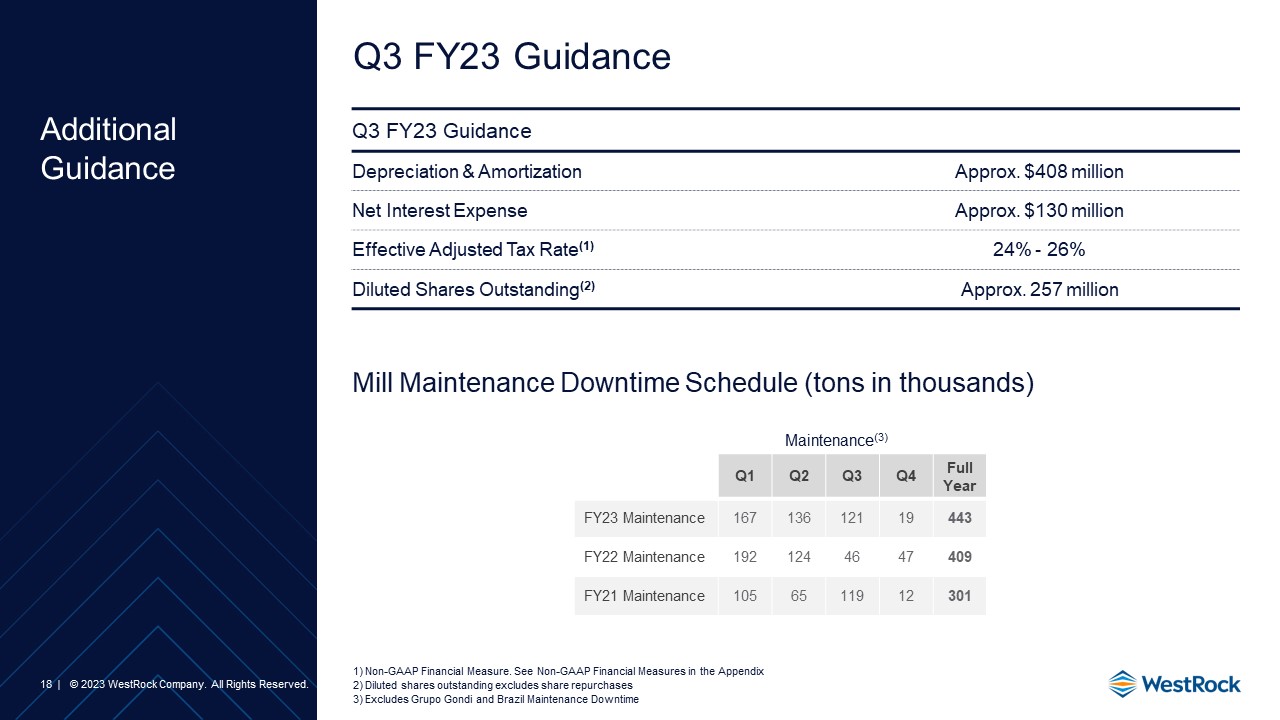
Q3 FY23 Guidance Additional Guidance 18 Q3 FY23 Guidance Depreciation & Amortization Approx. $408 million Net Interest Expense Approx. $130 million Effective Adjusted Tax Rate(1) 24% - 26% Diluted Shares Outstanding(2) Approx. 257 million Mill Maintenance Downtime Schedule (tons in thousands) Q1 Q2 Q3 Q4 Full Year FY23 Maintenance 167 136 121 19 443 FY22 Maintenance 192 124 46 47 409 FY21 Maintenance 105 65 119 12 301 Maintenance(3) Non-GAAP Financial Measure. See Non-GAAP Financial Measures in the Appendix Diluted shares outstanding excludes share repurchases Excludes Grupo Gondi and Brazil Maintenance Downtime
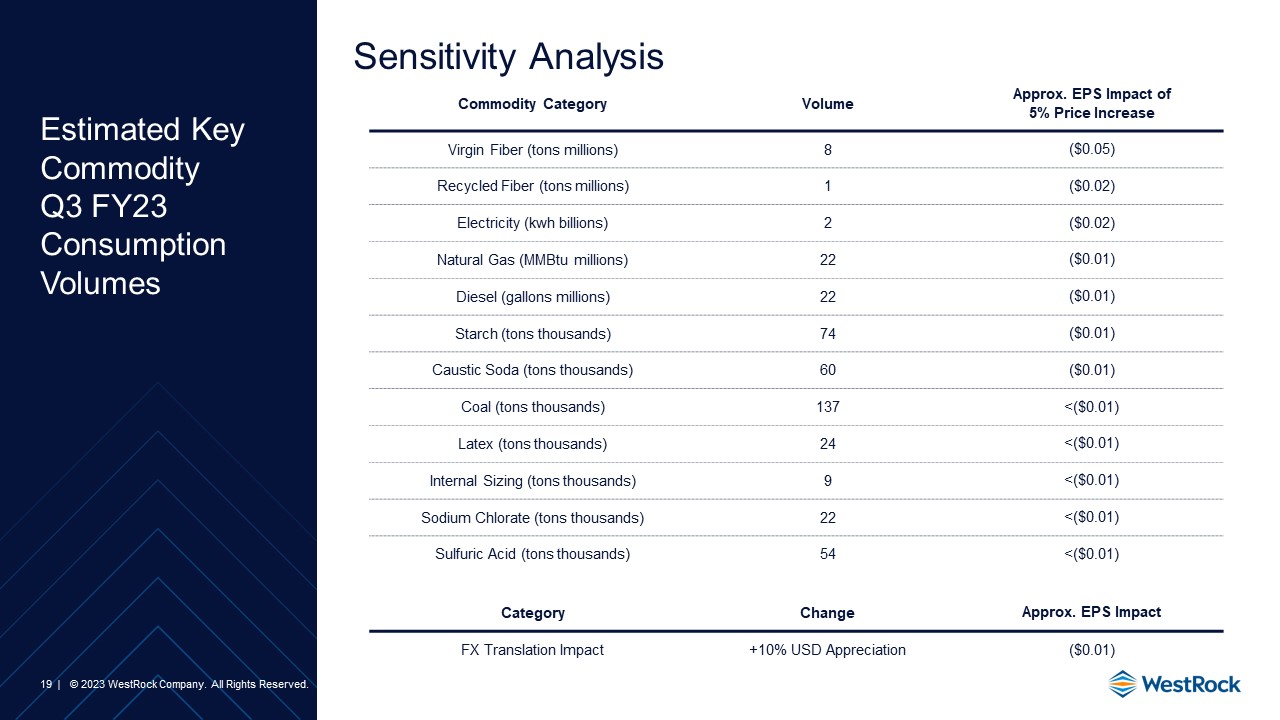
Estimated Key CommodityQ3 FY23 Consumption Volumes 19 Commodity Category Volume Approx. EPS Impact of 5% Price Increase Virgin Fiber (tons millions) 8 ($0.05) Recycled Fiber (tons millions) 1 ($0.02) Electricity (kwh billions) 2 ($0.02) Natural Gas (MMBtu millions) 22 ($0.01) Diesel (gallons millions) 22 ($0.01) Starch (tons thousands) 74 ($0.01) Caustic Soda (tons thousands) 60 ($0.01) Coal (tons thousands) 137 <($0.01) Latex (tons thousands) 24 <($0.01) Internal Sizing (tons thousands) 9 <($0.01) Sodium Chlorate (tons thousands) 22 <($0.01) Sulfuric Acid (tons thousands) 54 <($0.01) Category Change Approx. EPS Impact FX Translation Impact +10% USD Appreciation ($0.01) Sensitivity Analysis

Shipment Data(1) 20 Quantities may not sum due to trailing decimals Revised FY21 and FY22 shipments for Brazil and chart now includes the acquired Grupo Gondi operations beginning December 2022
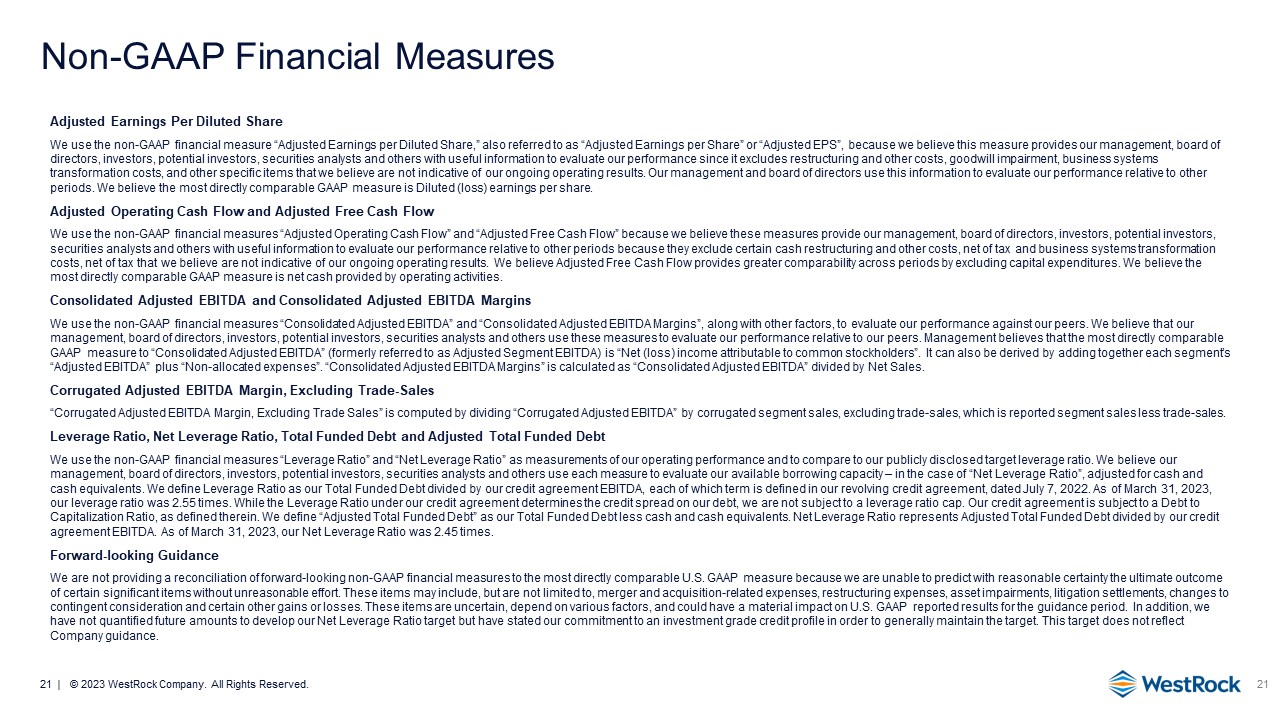
Non-GAAP Financial Measures Adjusted Earnings Per Diluted Share We use the non-GAAP financial measure “Adjusted Earnings per Diluted Share,” also referred to as “Adjusted Earnings per Share” or “Adjusted EPS”, because we believe this measure provides our management, board of directors, investors, potential investors, securities analysts and others with useful information to evaluate our performance since it excludes restructuring and other costs, goodwill impairment, business systems transformation costs, and other specific items that we believe are not indicative of our ongoing operating results. Our management and board of directors use this information to evaluate our performance relative to other periods. We believe the most directly comparable GAAP measure is Diluted (loss) earnings per share. Adjusted Operating Cash Flow and Adjusted Free Cash Flow We use the non-GAAP financial measures “Adjusted Operating Cash Flow” and “Adjusted Free Cash Flow” because we believe these measures provide our management, board of directors, investors, potential investors, securities analysts and others with useful information to evaluate our performance relative to other periods because they exclude certain cash restructuring and other costs, net of tax and business systems transformation costs, net of tax that we believe are not indicative of our ongoing operating results. We believe Adjusted Free Cash Flow provides greater comparability across periods by excluding capital expenditures. We believe the most directly comparable GAAP measure is net cash provided by operating activities. Consolidated Adjusted EBITDA and Consolidated Adjusted EBITDA Margins We use the non-GAAP financial measures “Consolidated Adjusted EBITDA” and “Consolidated Adjusted EBITDA Margins”, along with other factors, to evaluate our performance against our peers. We believe that our management, board of directors, investors, potential investors, securities analysts and others use these measures to evaluate our performance relative to our peers. Management believes that the most directly comparable GAAP measure to “Consolidated Adjusted EBITDA” (formerly referred to as Adjusted Segment EBITDA) is “Net (loss) income attributable to common stockholders”. It can also be derived by adding together each segment’s “Adjusted EBITDA” plus “Non-allocated expenses”. “Consolidated Adjusted EBITDA Margins” is calculated as “Consolidated Adjusted EBITDA” divided by Net Sales. Corrugated Adjusted EBITDA Margin, Excluding Trade-Sales “Corrugated Adjusted EBITDA Margin, Excluding Trade Sales” is computed by dividing “Corrugated Adjusted EBITDA” by corrugated segment sales, excluding trade-sales, which is reported segment sales less trade-sales. Leverage Ratio, Net Leverage Ratio, Total Funded Debt and Adjusted Total Funded Debt We use the non-GAAP financial measures “Leverage Ratio” and “Net Leverage Ratio” as measurements of our operating performance and to compare to our publicly disclosed target leverage ratio. We believe our management, board of directors, investors, potential investors, securities analysts and others use each measure to evaluate our available borrowing capacity – in the case of “Net Leverage Ratio”, adjusted for cash and cash equivalents. We define Leverage Ratio as our Total Funded Debt divided by our credit agreement EBITDA, each of which term is defined in our revolving credit agreement, dated July 7, 2022. As of March 31, 2023, our leverage ratio was 2.55 times. While the Leverage Ratio under our credit agreement determines the credit spread on our debt, we are not subject to a leverage ratio cap. Our credit agreement is subject to a Debt to Capitalization Ratio, as defined therein. We define “Adjusted Total Funded Debt” as our Total Funded Debt less cash and cash equivalents. Net Leverage Ratio represents Adjusted Total Funded Debt divided by our credit agreement EBITDA. As of March 31, 2023, our Net Leverage Ratio was 2.45 times. Forward-looking Guidance We are not providing a reconciliation of forward-looking non-GAAP financial measures to the most directly comparable U.S. GAAP measure because we are unable to predict with reasonable certainty the ultimate outcome of certain significant items without unreasonable effort. These items may include, but are not limited to, merger and acquisition-related expenses, restructuring expenses, asset impairments, litigation settlements, changes to contingent consideration and certain other gains or losses. These items are uncertain, depend on various factors, and could have a material impact on U.S. GAAP reported results for the guidance period. In addition, we have not quantified future amounts to develop our Net Leverage Ratio target but have stated our commitment to an investment grade credit profile in order to generally maintain the target. This target does not reflect Company guidance. 21
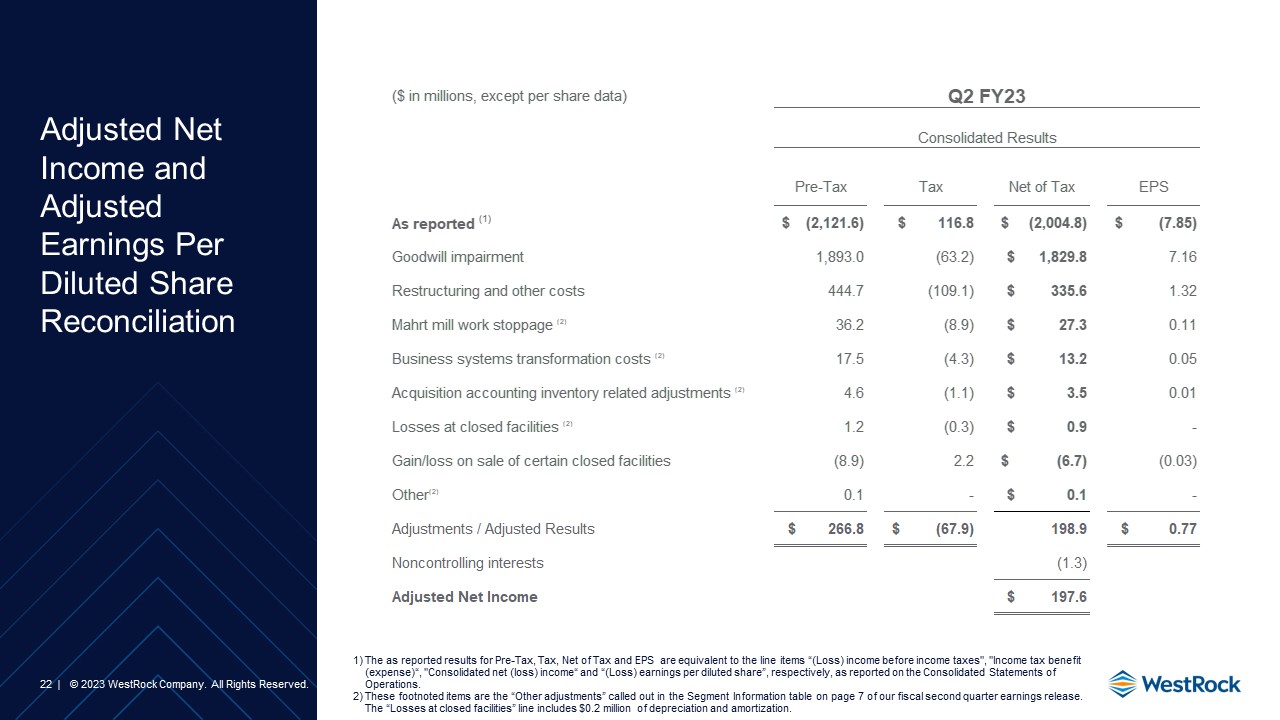
Adjusted Net Income and Adjusted Earnings Per Diluted Share Reconciliation 22 The as reported results for Pre-Tax, Tax, Net of Tax and EPS are equivalent to the line items “(Loss) income before income taxes", "Income tax benefit (expense)“, "Consolidated net (loss) income“ and “(Loss) earnings per diluted share”, respectively, as reported on the Consolidated Statements of Operations. These footnoted items are the “Other adjustments” called out in the Segment Information table on page 7 of our fiscal second quarter earnings release. The “Losses at closed facilities” line includes $0.2 million of depreciation and amortization.
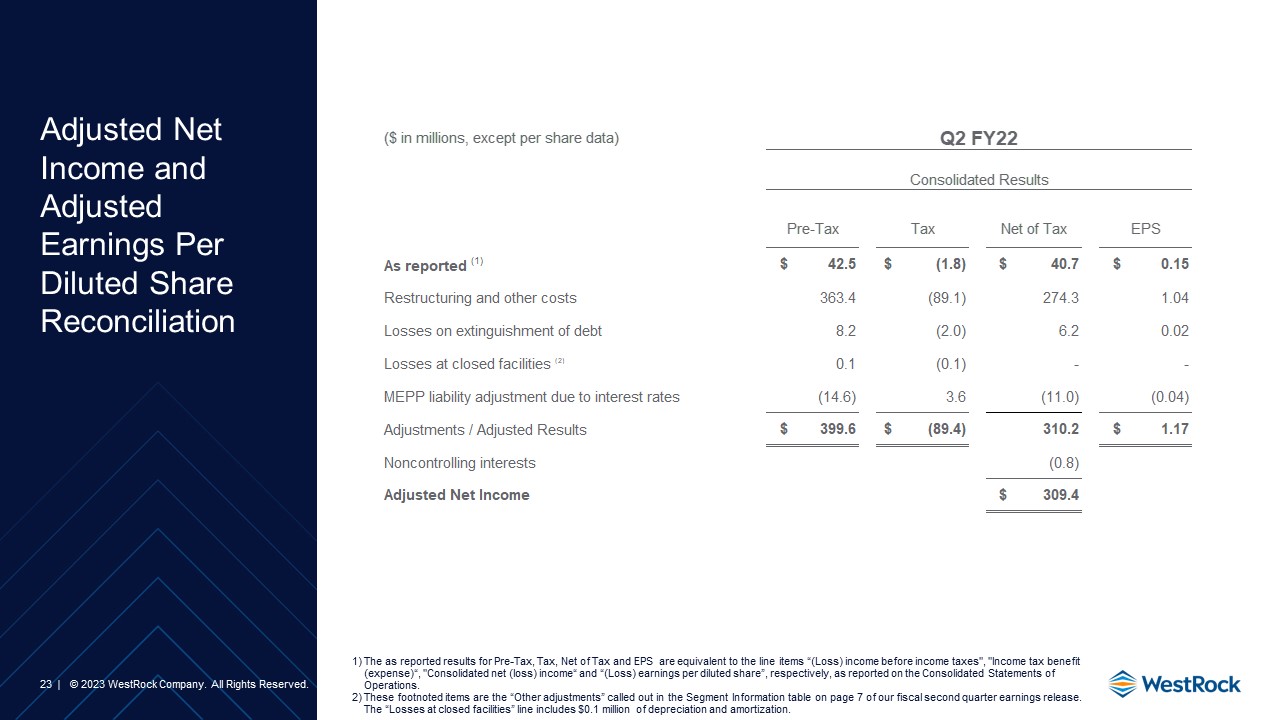
Adjusted Net Income and Adjusted Earnings Per Diluted Share Reconciliation 23 The as reported results for Pre-Tax, Tax, Net of Tax and EPS are equivalent to the line items “(Loss) income before income taxes", "Income tax benefit (expense)“, "Consolidated net (loss) income“ and “(Loss) earnings per diluted share”, respectively, as reported on the Consolidated Statements of Operations. These footnoted items are the “Other adjustments” called out in the Segment Information table on page 7 of our fiscal second quarter earnings release. The “Losses at closed facilities” line includes $0.1 million of depreciation and amortization.

Reconciliation of Net Income to Consolidated Adjusted EBITDA 24 Schedule adds back expense or subtracts income for certain financial statement and segment footnote items to compute Consolidated Adjusted EBITDA.
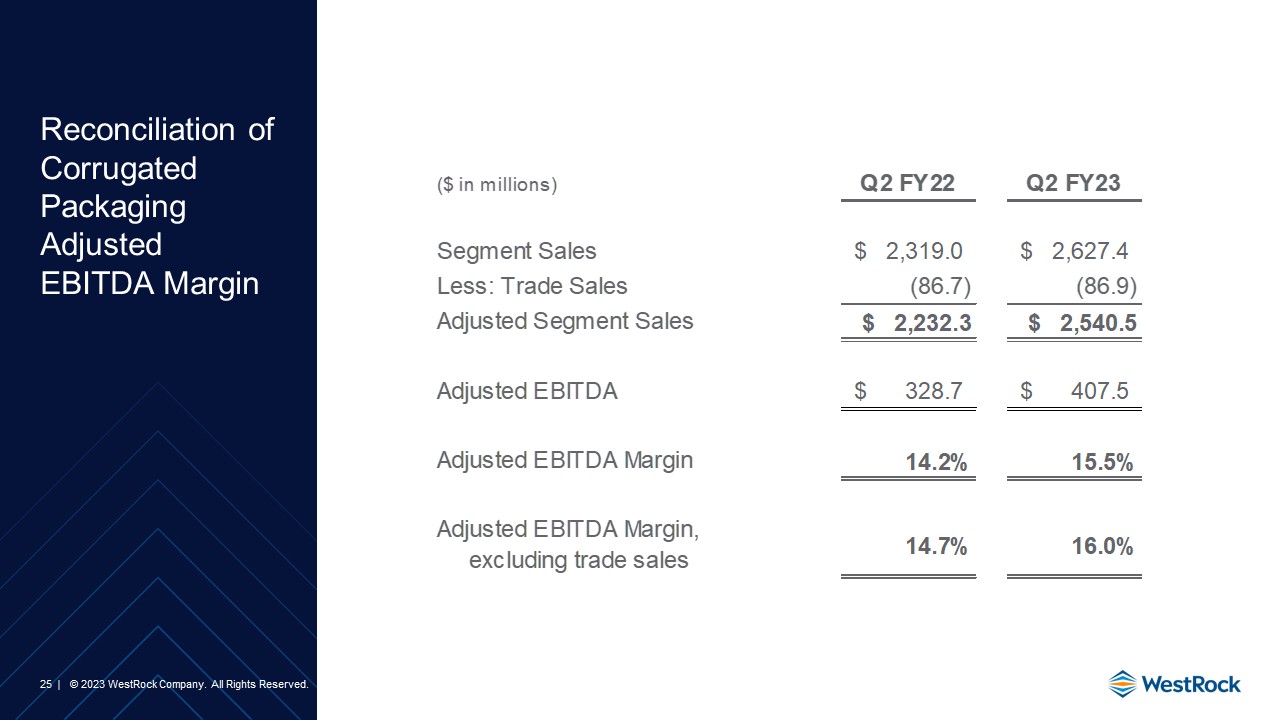
Reconciliation of Corrugated Packaging Adjusted EBITDA Margin 25
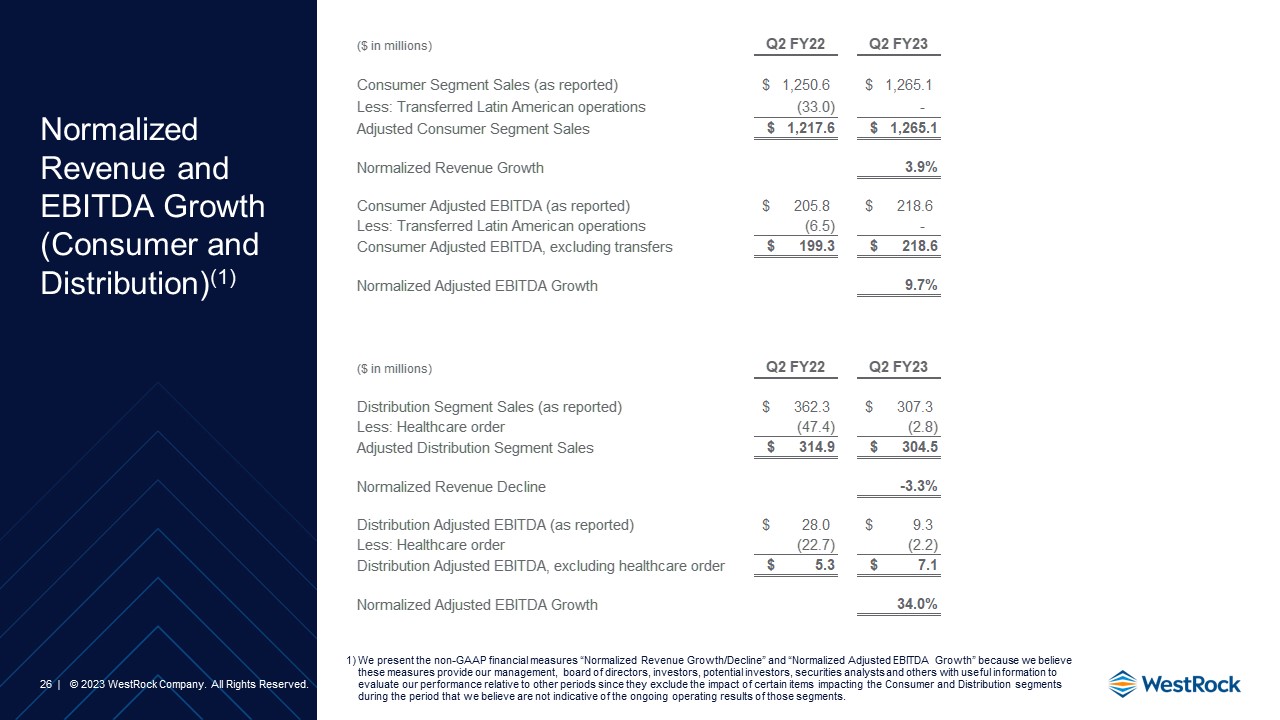
Normalized Revenue and EBITDA Growth (Consumer and Distribution)(1) 26 We present the non-GAAP financial measures “Normalized Revenue Growth/Decline” and “Normalized Adjusted EBITDA Growth” because we believe these measures provide our management, board of directors, investors, potential investors, securities analysts and others with useful information to evaluate our performance relative to other periods since they exclude the impact of certain items impacting the Consumer and Distribution segments during the period that we believe are not indicative of the ongoing operating results of those segments.

Adjusted Operating Cash Flow and Adjusted Free Cash Flow Reconciliation 27
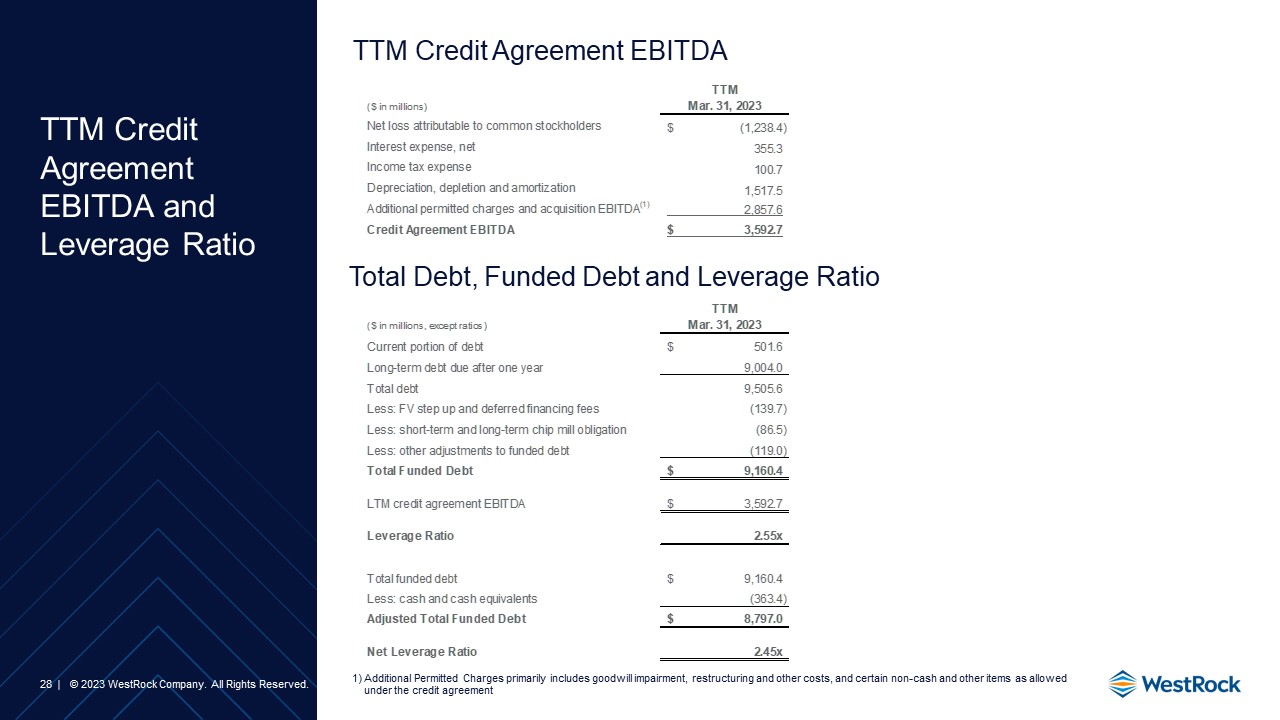
TTM Credit Agreement EBITDA TTM Credit Agreement EBITDA and Leverage Ratio 28 Total Debt, Funded Debt and Leverage Ratio Additional Permitted Charges primarily includes goodwill impairment, restructuring and other costs, and certain non-cash and other items as allowed under the credit agreement