Free signup for more
- Track your favorite companies
- Receive email alerts for new filings
- Personalized dashboard of news and more
- Access all data and search results
Filing tables
Filing exhibits
Related financial report
WRK similar filings
- 1 Feb 24 Results of Operations and Financial Condition
- 30 Jan 24 Submission of Matters to a Vote of Security Holders
- 15 Dec 23 Departure of Directors or Certain Officers
- 9 Nov 23 Results of Operations and Financial Condition
- 29 Sep 23 Entry into a Material Definitive Agreement
- 27 Sep 23 WestRock Announces Results of Consent Solicitation
- 20 Sep 23 WestRock Announces Consent Solicitation
Filing view
External links
| Exhibit 99.2 |
WestRockQ4 FY2023 Results November 9, 2023
Cautionary Language Forward Looking Statements: This presentation contains forward-looking statements within the meaning of the Private Securities Litigation Reform Act of 1995, including but not limited to the statements on the slides entitled “Q4 FY23 Corrugated Packaging Results”, “Q4 FY23 Consumer Packaging Results”, “Q4 FY23 Global Paper Results”, “Q4 FY23 Distribution Results”, “Q1 FY24 WestRock Guidance”, “Fiscal 2024 WestRock Financial Expectations”, “Q1 FY24 Additional Guidance”, and “Sensitivity Analysis”, that give guidance or estimates for future periods. Forward-looking statements are based on our current expectations, beliefs, plans or forecasts and use words or phrases such as "may," "will," "could," "should," "would," "anticipate," "estimate," "expect," "project," "intend," "plan," "believe," "target," "prospects," "potential," “commit,” and "forecast," and other words, terms and phrases of similar meaning or refer to future time periods. Forward-looking statements involve estimates, expectations, projections, goals, targets, forecasts, assumptions, risks and uncertainties. A forward-looking statement is not a guarantee of future performance, and actual results could differ materially from those contained in the forward-looking statement. Forward-looking statements are subject to a number of assumptions, risks and uncertainties, many of which are beyond our control, such as developments related to pricing cycles and volumes; economic, competitive and market conditions generally, including macroeconomic uncertainty, customer inventory rebalancing, the impact of inflation and increases in energy, raw materials, shipping, labor and capital equipment costs; reduced supply of raw materials, energy and transportation, including from supply chain disruptions and labor shortages; intense competition; results and impacts of acquisitions, including operational and financial effects from the acquisition of the remaining stake in Grupo Gondi (the “Mexico Acquisition”), and divestitures; business disruptions, including from the occurrence of severe weather or a natural disaster or other unanticipated problems, such as labor difficulties, equipment failure or unscheduled maintenance and repair, or public health crises; failure to respond to changing customer preferences and to protect our intellectual property; the amount and timing of capital expenditures, including installation costs, project development and implementation costs, and costs related to resolving disputes with third parties with which we work to manage and implement capital projects; risks related to international sales and operations; the production of faulty or contaminated products; the loss of certain customers; adverse legal, reputational, operational and financial effects resulting from information security incidents and the effectiveness of business continuity plans during a ransomware or other cyber incident; work stoppages and other labor relations difficulties; inability to attract, motivate and retain qualified personnel, including as a result of the proposed business combination with Smurfit Kappa plc (the "Transaction"); risks associated with sustainability and climate change, including our ability to achieve our sustainability targets and commitments and realize climate-related opportunities on announced timelines or at all; our inability to successfully identify and make performance improvements and deliver cost savings and risks associated with completing strategic projects on anticipated timelines and realizing anticipated financial or operational improvements on announced timelines or at all, including with respect to our business systems transformation; risks related to the proposed Transaction, including our ability to complete the Transaction on the anticipated timeline, or at all, restrictions imposed on our business under the transaction agreement, disruptions to our business while the proposed Transaction is pending, the impact of management’s time and attention being focused on consummation of the proposed Transaction, costs associated with the proposed Transaction, and integration difficulties; risks related to our indebtedness, including increases in interest rates; the scope, costs, timing and impact of any restructuring of our operations and corporate and tax structure; the scope, timing and outcome of any litigation, claims or other proceedings or dispute resolutions and the impact of any such litigation (including with respect to the Brazil tax liability matter); and additional impairment charges. Such risks and other factors that may impact forward-looking statements are discussed in our Annual Report on Form 10-K for the fiscal year ended September 30, 2022, including in Item 1A “Risk Factors”, as well as in our subsequent filings with the Securities and Exchange Commission. The information contained herein speaks as of the date hereof, and the Company does not have or undertake any obligation to update or revise its forward-looking statements, whether as a result of new information, future events or otherwise, except to the extent required by law. Non-GAAP Financial Measures: We report our financial results in accordance with accounting principles generally accepted in the United States (“GAAP”). However, management believes certain non-GAAP financial measures provide users with additional meaningful financial information that should be considered when assessing our ongoing performance. Management also uses these non-GAAP financial measures in making financial, operating and planning decisions and in evaluating our performance. Non-GAAP financial measures should be viewed in addition to, and not as an alternative for, our GAAP results. The non-GAAP financial measures we present may differ from similarly captioned measures presented by other companies. For additional information, see the Appendix. In addition, as explained in the Appendix, we are not providing a reconciliation of forward-looking non-GAAP financial measures to the most directly comparable U.S. GAAP measure because we are unable to predict with reasonable certainty the ultimate outcome of certain significant items without unreasonable effort.

Q4 FY23 Key Highlights Sales and earnings in Q4 FY23 Net sales of $5.0 billion Consolidated Adjusted EBITDA(1) of $736 million Consolidated Adjusted EBITDA margin(1) of 14.8% Adjusted EPS(1) of $0.81 per share Corrugated Packaging Adjusted EBITDA increased 13.0% and Adjusted EBITDA margin(2) increased 110 basis points to 17.8% each compared to the prior year period Exceeded full-year cost savings target(3) Achieved $200 million of cost savings in Q4 FY23, and $350 million for full year FY23 Exited FY23 with run-rate cost savings of over $450 million Announced consolidation of 8 additional converting facilities (total of 15 through October) Generated $330 million of Adjusted Free Cash Flow(1); reduced total debt by $443 million Consolidated Adjusted EBITDA impacted by $64 million YoY due to economic downtime Non-cash pension costs increased $40 million YoY; U.S. pension plans remain overfunded Non-GAAP Financial Measure. See Non-GAAP Financial Measures and Reconciliations in the Appendix Adjusted EBITDA margin (excluding white top trade sales), a non-GAAP financial measure Cost savings reflect YoY change in certain costs incurred for manufacturing, SG&A, procurement and logistics, but exclude impact of economic downtime and inflation Consolidated Adjusted EBITDA margins Strong Results in a Dynamic Environment Consolidated Adjusted EBITDA | $ in millions FY2023 Q4 fy23 Corrugated Packaging(2) 17.8% Consumer Packaging 16.8% Global Paper 13.2% Distribution 3.5% WestRock(4) 14.8% Adjusted EBITDA Margins

Fiscal Year 2023 Highlights Grew Packaging Adjusted EBITDA(1) 10% YoY and expanded margins 70 bps to 16.6% Improved asset base through targeted investments and footprint rationalization Closed two higher cost mills and two paper machines at third facility to improve cost structure; consolidated converting facilities to streamline footprint and reduce costs Invested in new converting facility in Longview, Washington, to enhance capability in Northwest U.S. Accelerated asset recapitalization program to drive productivity Exited non-core assets and joint ventures to streamline portfolio and prioritize profitable growth Completed Mexico Acquisition that further builds capability to capture on-shoring trends and drive growth in attractive Latin America market Exceeded full year cost-savings target and exiting FY23 with run-rate savings over $450 million Achieved additional recognition for development and commercialization of innovative and sustainable products 6 Paperboard Packaging Council Awards for sustainability and design World Star Global Packaging Award and Asia Star Award for Can Collar Included in Dow Jones Sustainability Index, Newsweek’s America’s Most Responsible Companies and Barron’s 100 Most Sustainable U.S. Companies Packaging Adjusted EBITDA is a non-GAAP financial measure and consists of Corrugated Packaging segment Adjusted EBITDA and Consumer Packaging segment Adjusted EBITDA

Q4 FY23 WestRock Results Highlights Strong execution of cost savings initiatives with $200 million saved in Q4 and $350 million saved in FY23(4) Grew Packaging(5) Adjusted EBITDA 6% and expanded margins 80 bps YoY Revenue impacted by flow-through of previously published price declines Input cost deflation primarily driven by lower OCC and energy Economic downtime (EDT) of 391 thousand tons negatively impacted Adjusted EBITDA by $64 million YoY $ in Millions, Except per Share Items Q4 fy23 Q4 FY22 YoY Net Sales $4,988 $5,403 -7.7% Consolidated Adjusted EBITDA(1) $736 $920 -20.0% % Margin(1) 14.8% 17.0% -220 bps Capital Expenditures $324 $293 +10.5% Adjusted Free Cash Flow(1) $330 $268 +23.0% -$184 Consolidated Adjusted EBITDA | $ in Millions Non-GAAP Financial Measure. See Non-GAAP Financial Measures and Reconciliations in the Appendix Includes economic downtime impact of $64 million and mill closures of $73 million Includes the impact of Mexico Acquisition Cost savings reflect YoY change in certain costs incurred for manufacturing, SG&A, procurement and logistics, but exclude impact of economic downtime and inflation Packaging Adjusted EBITDA is a non-GAAP financial measure and consists of Corrugated Packaging segment Adjusted EBITDA and Consumer Packaging segment Adjusted EBITDA ($5) ($137) $200 $71 ($157) ($156) (2) (3)

$ in Millions Q4 fy23 Q4 FY22 YoY Adj. YoY(2)(5) Segment Sales(1)(2) $2,435 $2,301 +5.8% +4.3% Adjusted EBITDA $434 $384 +13.0% +11.9% % Margin(1)(2) 17.8% 16.7% +110 bps +120 bps Q4 FY23 Corrugated Packaging Results Highlights Inventory destocking subsided and volumes stabilized in quarter Sequential increase in N.A. corrugated packaging shipments of 3% per day Expanded Adjusted EBITDA margin both sequentially and YoY Relative strength in Beverage and Protein; softness in Healthcare and Industrial Expect improving volumes through FY24 Excludes white top trade sales Non-GAAP Financial Measure. See Non-GAAP Financial Measures and Reconciliations in the Appendix Includes positive economic downtime impact of $15 million and negative mill closures of $32 million Includes the impact of the Mexico Acquisition Reflects an adjustment for the fact that in connection with the Mexico Acquisition, certain existing consumer converting operations in Latin America were moved to the Corrugated Packaging segment in line with how we are managing the business. We did not recast prior year amounts under GAAP as they were not material ($35 million of segment sales and $4 million of Adjusted EBITDA in Q4 FY23) ($104) +$50 Adjusted EBITDA | $ in Millions ($30) $73 $88 ($17) $40 (3)

$ in Millions Q4 fy23 Q4 FY22 YoY Adj. YoY(1)(2) Segment Sales $1,211 $1,306 -7.2% -3.6% Adjusted EBITDA $204 $219 -7.0% -4.9% % Margin 16.8% 16.8% 0 bps -20 bps Q4 FY23 Consumer Packaging Results Highlights Strong price/mix continued to offset inflation Results impacted by realignment of certain operations in Latin America and sale of interest in RTS Packaging Notable softness in Healthcare and Packaged Food Healthcare decline partially driven by last year’s strong results Economic downtime negatively impacted Adjusted EBITDA by $27 million YoY Expect return to YoY volume growth in Q2 FY24 driven by end of destocking and new business wins Reflects an adjustment for the fact that in connection with the Mexico Acquisition, certain existing consumer converting operations in Latin America were moved to the Corrugated Packaging segment in line with how we are managing the business. We did not recast prior year amounts under GAAP as they were not material ($34 million of segment sales and $4 million of Adjusted EBITDA in Q4 FY22). Also excludes results from RTS Packaging for September 2022 and 2023 for comparability due to its sale in September 2023 Non-GAAP Financial Measure. See Non-GAAP Financial Measures and Reconciliations in the Appendix ($47) -$15 Adjusted EBITDA | $ in Millions $62 ($34) $45 ($27) ($14)

$ in Millions Q4 fy23 Q4 FY22 YoY Segment Sales $1,012 $1,429 -29.2% Adjusted EBITDA $134 $306 -56.4% % Margin 13.2% 21.4% -820 bps Q4 FY23 Global Paper Results Highlights Containerboard demand stabilized due to end of destocking and seasonal strength Export containerboard volumes grew ~50% sequentially vs. Q3 FY23 Softness in paperboard, particularly in food packaging Volumes negatively impacted by removal of discontinued and divested products Economic downtime negatively impacted Adjusted EBITDA by $52 million YoY Expect YoY volume growthin second half of FY24 ($68) -$172 ($118) $38 $85 ($93) ($16) Adjusted EBITDA | $ in Millions Includes economic downtime impact of $52 million and mill closures of $41 million (1)
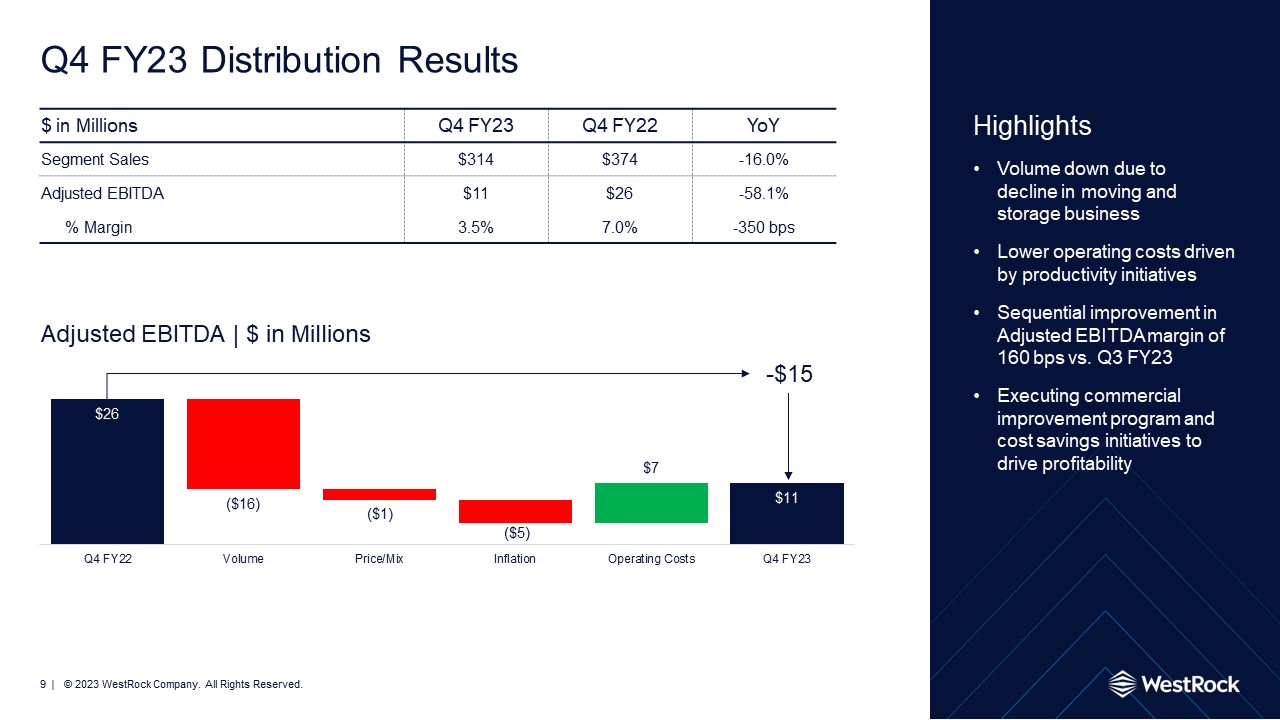
$ in Millions Q4 fy23 Q4 FY22 YoY Segment Sales $314 $374 -16.0% Adjusted EBITDA $11 $26 -58.1% % Margin 3.5% 7.0% -350 bps Q4 FY23 Distribution Results Highlights Volume down due to decline in moving and storage business Lower operating costs driven by productivity initiatives Sequential improvement in Adjusted EBITDA margin of 160 bps vs. Q3 FY23 Executing commercial improvement program and cost savings initiatives to drive profitability ($16) -$15 Adjusted EBITDA | $ in Millions ($1) ($5) $7
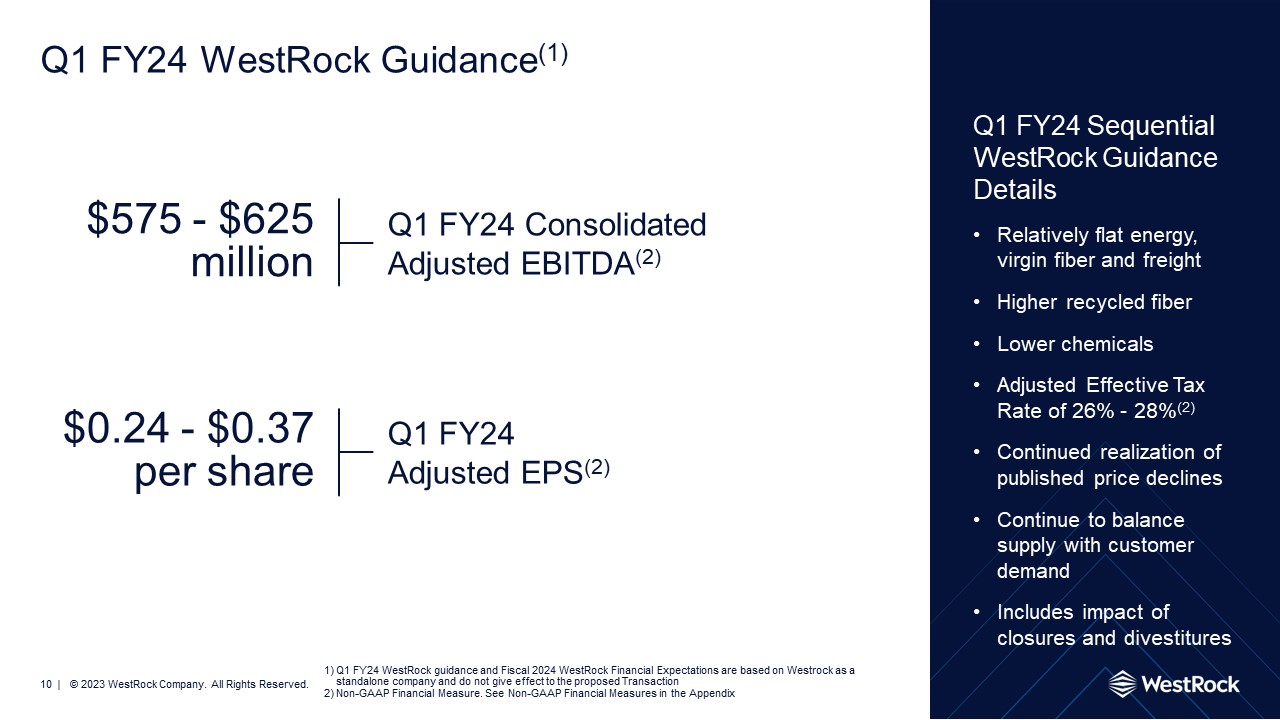
Q1 FY24 WestRock Guidance(1) Q1 FY24 Sequential WestRock Guidance Details Relatively flat energy, virgin fiber and freight Higher recycled fiber Lower chemicals Adjusted Effective Tax Rate of 26% - 28%(2) Continued realization of published price declines Continue to balance supply with customer demand Includes impact of closures and divestitures Q1 FY24 Adjusted EPS(2) $0.24 - $0.37 per share Q1 FY24 Consolidated Adjusted EBITDA(2) $575 - $625million Q1 FY24 WestRock guidance and Fiscal 2024 WestRock Financial Expectations are based on Westrock as a standalone company and do not give effect to the proposed Transaction Non-GAAP Financial Measure. See Non-GAAP Financial Measures in the Appendix

Fiscal 2024 WestRock Financial Expectations(1) Full year financial expectations weighted to second half due to improving demand trends Continued improvement in corrugated packaging demand through the year Recovery in consumer packaging beginning in Q2 FY24, driven primarily by the end of destocking and new business wins Global Paper YoY volume growth in the second half of FY24 Targeting $300 million to $400 million of cost savings(2) in FY24 Continued realization of previously published price declines Higher overall costs driven by recycled fiber, freight, wages and other; partially offset by lower costs for energy, virgin fiber and chemicals Adjusted Tax rate of 24%-26% Capex of approximately $1.2 billion to $1.5 billion comprised of maintenance, asset recapitalization and strategic investments Q1 FY24 WestRock guidance and Fiscal 2024 WestRock Financial Expectations are based on Westrock as a standalone company and do not give effect to the proposed Transaction Cost savings reflect YoY change in certain costs incurred for manufacturing, SG&A, procurement and logistics, but exclude impact of economic downtime and inflation

Creating Value Leveraging the power of one WestRock to deliver unrivaled solutions to our customers Innovating with focus on sustainability and growth Relentless focus on margin improvement and increasing efficiency Executing disciplined capital allocation

Appendix 13
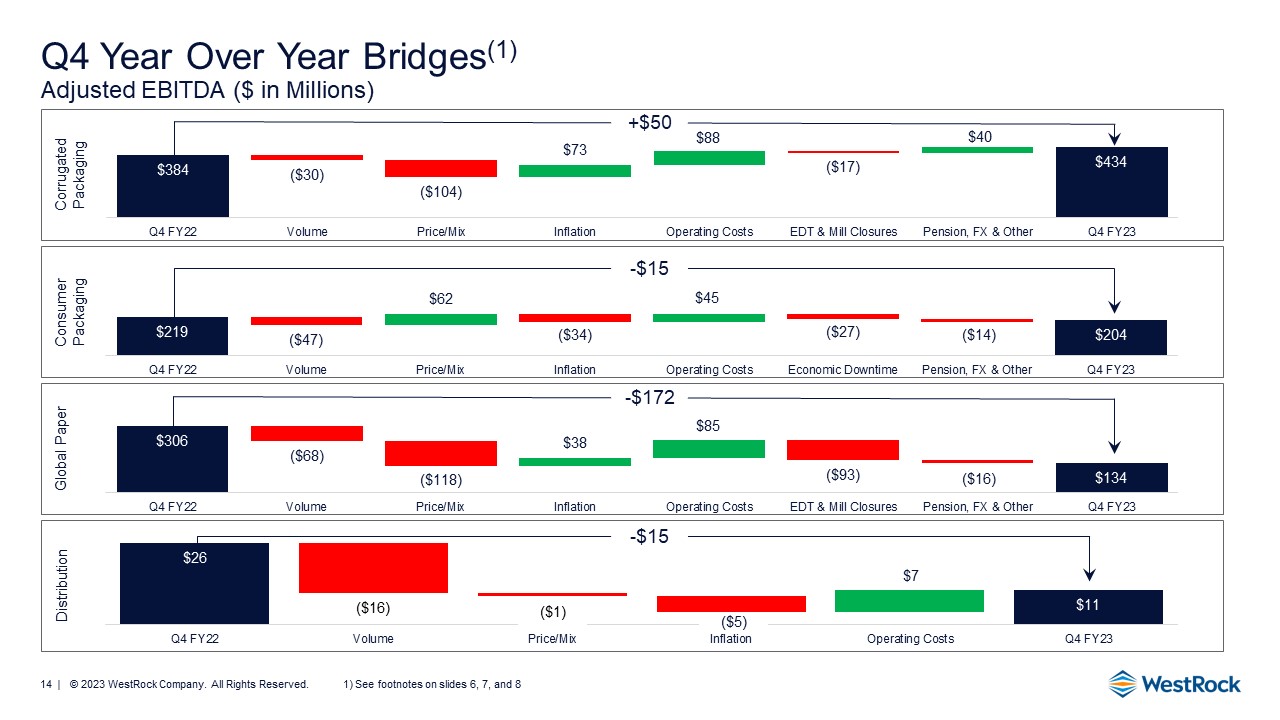
Corrugated Packaging Consumer Packaging Q4 Year Over Year Bridges(1)Adjusted EBITDA ($ in Millions) Distribution Global Paper -$172 +$50 -$15 -$15 ($30) ($68) ($104) $73 $88 ($17) $40 ($118) $38 $85 ($93) ($16) ($16) ($5) $7 See footnotes on slides 6, 7, and 8 ($47) $62 ($34) $45 ($27) ($14) ($1)

Q1 FY24 Guidance Additional Guidance 15 Q1 FY24 Guidance Depreciation & Amortization Approx. $375 million Net Interest Expense Approx. $116 million Effective Adjusted Tax Rate(1) 26% - 28% Diluted Shares Outstanding(2) Approx. 259 million Mill Maintenance Downtime Schedule (tons in thousands) Q1 Q2 Q3 Q4 Full Year FY24 Maintenance 163 98 179 110 550 FY23 Maintenance 184 156 140 27 507 FY22 Maintenance 198 132 62 50 442 Maintenance(3) Non-GAAP Financial Measure. See Non-GAAP Financial Measures in the Appendix Diluted shares outstanding excludes share repurchases Reflects estimates for FY24
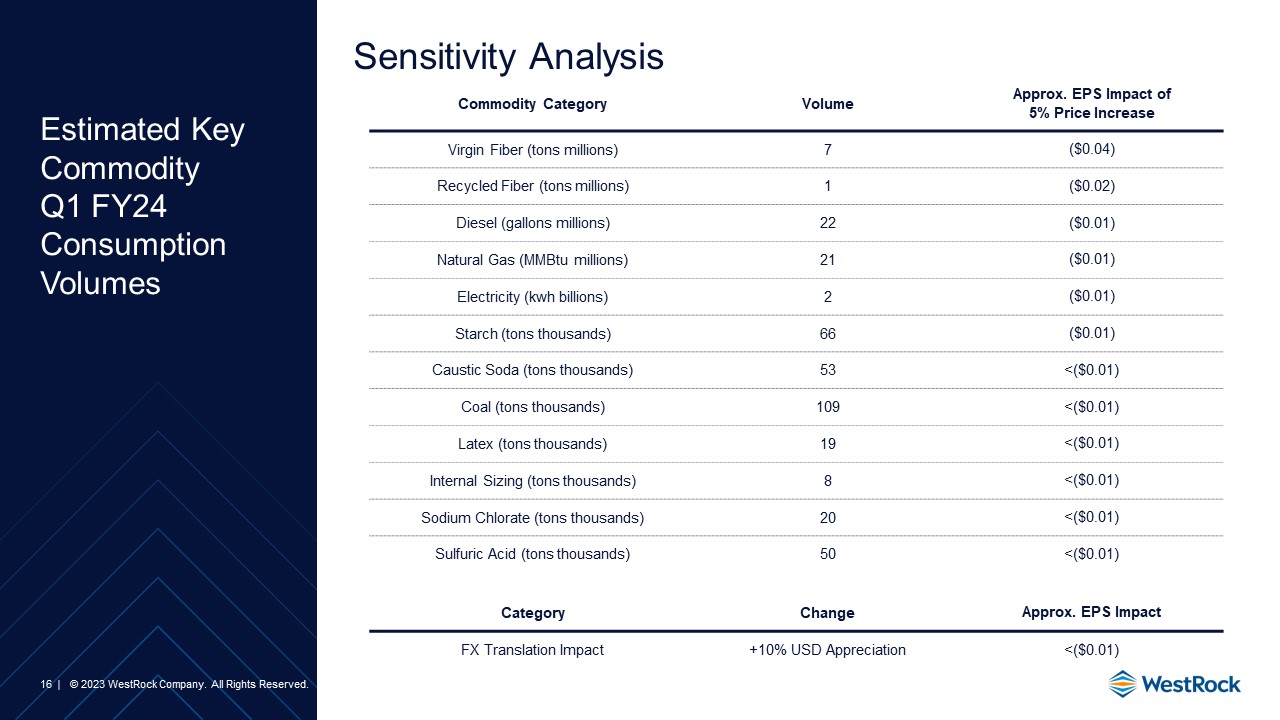
Estimated Key CommodityQ1 FY24 Consumption Volumes 16 Commodity Category Volume Approx. EPS Impact of 5% Price Increase Virgin Fiber (tons millions) 7 ($0.04) Recycled Fiber (tons millions) 1 ($0.02) Diesel (gallons millions) 22 ($0.01) Natural Gas (MMBtu millions) 21 ($0.01) Electricity (kwh billions) 2 ($0.01) Starch (tons thousands) 66 ($0.01) Caustic Soda (tons thousands) 53 <($0.01) Coal (tons thousands) 109 <($0.01) Latex (tons thousands) 19 <($0.01) Internal Sizing (tons thousands) 8 <($0.01) Sodium Chlorate (tons thousands) 20 <($0.01) Sulfuric Acid (tons thousands) 50 <($0.01) Category Change Approx. EPS Impact FX Translation Impact +10% USD Appreciation <($0.01) Sensitivity Analysis
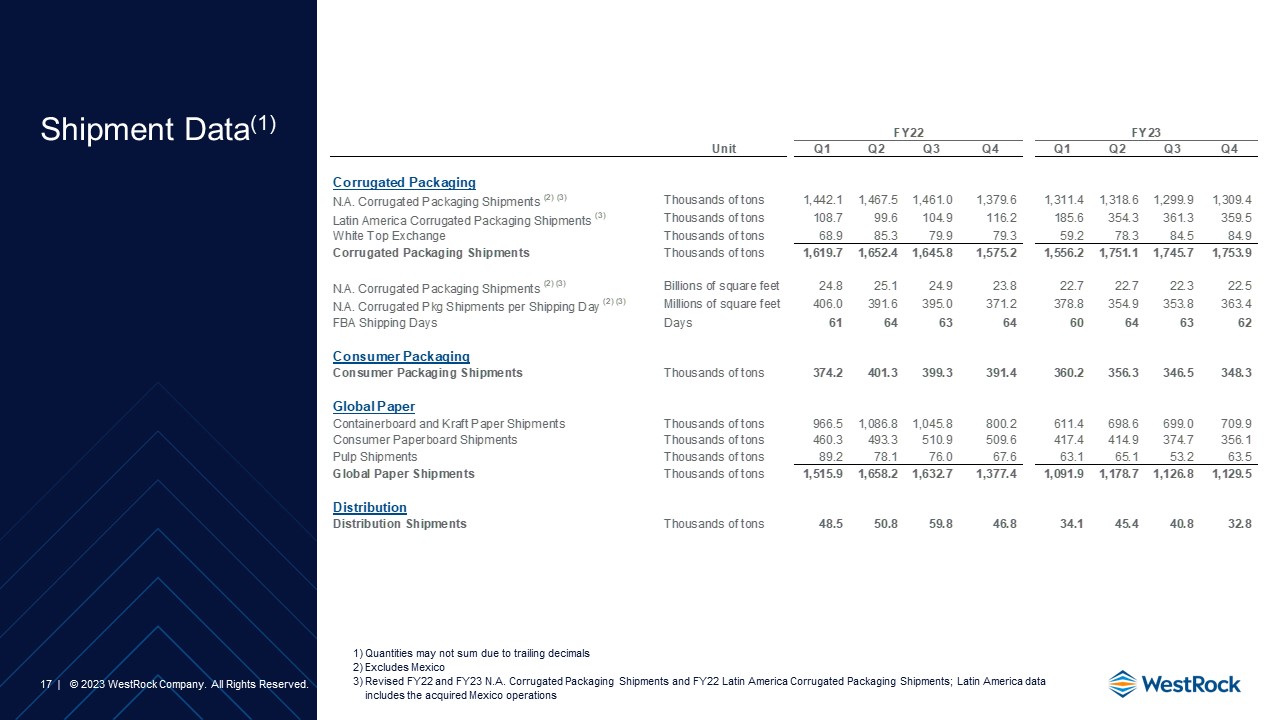
Shipment Data(1) 17 Quantities may not sum due to trailing decimals Excludes Mexico Revised FY22 and FY23 N.A. Corrugated Packaging Shipments and FY22 Latin America Corrugated Packaging Shipments; Latin America data includes the acquired Mexico operations
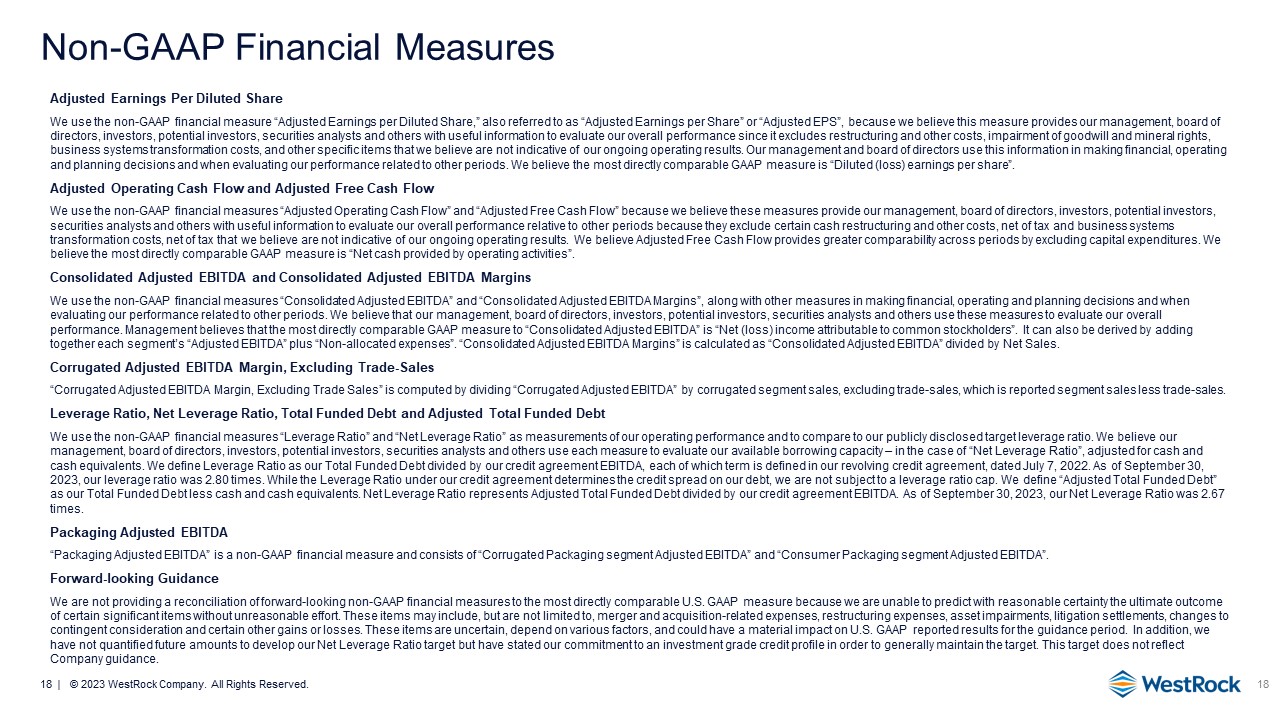
Non-GAAP Financial Measures Adjusted Earnings Per Diluted Share We use the non-GAAP financial measure “Adjusted Earnings per Diluted Share,” also referred to as “Adjusted Earnings per Share” or “Adjusted EPS”, because we believe this measure provides our management, board of directors, investors, potential investors, securities analysts and others with useful information to evaluate our overall performance since it excludes restructuring and other costs, impairment of goodwill and mineral rights, business systems transformation costs, and other specific items that we believe are not indicative of our ongoing operating results. Our management and board of directors use this information in making financial, operating and planning decisions and when evaluating our performance related to other periods. We believe the most directly comparable GAAP measure is “Diluted (loss) earnings per share”. Adjusted Operating Cash Flow and Adjusted Free Cash Flow We use the non-GAAP financial measures “Adjusted Operating Cash Flow” and “Adjusted Free Cash Flow” because we believe these measures provide our management, board of directors, investors, potential investors, securities analysts and others with useful information to evaluate our overall performance relative to other periods because they exclude certain cash restructuring and other costs, net of tax and business systems transformation costs, net of tax that we believe are not indicative of our ongoing operating results. We believe Adjusted Free Cash Flow provides greater comparability across periods by excluding capital expenditures. We believe the most directly comparable GAAP measure is “Net cash provided by operating activities”. Consolidated Adjusted EBITDA and Consolidated Adjusted EBITDA Margins We use the non-GAAP financial measures “Consolidated Adjusted EBITDA” and “Consolidated Adjusted EBITDA Margins”, along with other measures in making financial, operating and planning decisions and when evaluating our performance related to other periods. We believe that our management, board of directors, investors, potential investors, securities analysts and others use these measures to evaluate our overall performance. Management believes that the most directly comparable GAAP measure to “Consolidated Adjusted EBITDA” is “Net (loss) income attributable to common stockholders”. It can also be derived by adding together each segment’s “Adjusted EBITDA” plus “Non-allocated expenses”. “Consolidated Adjusted EBITDA Margins” is calculated as “Consolidated Adjusted EBITDA” divided by Net Sales. Corrugated Adjusted EBITDA Margin, Excluding Trade-Sales “Corrugated Adjusted EBITDA Margin, Excluding Trade Sales” is computed by dividing “Corrugated Adjusted EBITDA” by corrugated segment sales, excluding trade-sales, which is reported segment sales less trade-sales. Leverage Ratio, Net Leverage Ratio, Total Funded Debt and Adjusted Total Funded Debt We use the non-GAAP financial measures “Leverage Ratio” and “Net Leverage Ratio” as measurements of our operating performance and to compare to our publicly disclosed target leverage ratio. We believe our management, board of directors, investors, potential investors, securities analysts and others use each measure to evaluate our available borrowing capacity – in the case of “Net Leverage Ratio”, adjusted for cash and cash equivalents. We define Leverage Ratio as our Total Funded Debt divided by our credit agreement EBITDA, each of which term is defined in our revolving credit agreement, dated July 7, 2022. As of September 30, 2023, our leverage ratio was 2.80 times. While the Leverage Ratio under our credit agreement determines the credit spread on our debt, we are not subject to a leverage ratio cap. We define “Adjusted Total Funded Debt” as our Total Funded Debt less cash and cash equivalents. Net Leverage Ratio represents Adjusted Total Funded Debt divided by our credit agreement EBITDA. As of September 30, 2023, our Net Leverage Ratio was 2.67 times. Packaging Adjusted EBITDA “Packaging Adjusted EBITDA” is a non-GAAP financial measure and consists of “Corrugated Packaging segment Adjusted EBITDA” and “Consumer Packaging segment Adjusted EBITDA”. Forward-looking Guidance We are not providing a reconciliation of forward-looking non-GAAP financial measures to the most directly comparable U.S. GAAP measure because we are unable to predict with reasonable certainty the ultimate outcome of certain significant items without unreasonable effort. These items may include, but are not limited to, merger and acquisition-related expenses, restructuring expenses, asset impairments, litigation settlements, changes to contingent consideration and certain other gains or losses. These items are uncertain, depend on various factors, and could have a material impact on U.S. GAAP reported results for the guidance period. In addition, we have not quantified future amounts to develop our Net Leverage Ratio target but have stated our commitment to an investment grade credit profile in order to generally maintain the target. This target does not reflect Company guidance. 18

Reconciliation of Net Income to Consolidated Adjusted EBITDA 19 Schedule adds back expense or subtracts income for certain financial statement and segment footnote items to compute Consolidated Adjusted EBITDA

Adjusted Net Income and Adjusted Earnings Per Diluted Share Reconciliation 20 The as reported results for Pre-Tax, Tax and Net of Tax are equivalent to the line items "Income (loss) before income taxes", "Income tax benefit (expense)" and "Consolidated net income (loss)", respectively, as reported on the Consolidated Statements of Operations These footnoted items are the “Other adjustments” reported in the Segment Information table on page 7 of our earnings release. The “Losses at closed facilities” line includes $0.8 million of depreciation and amortization

Reconciliation of Corrugated Packaging Adjusted EBITDA Margin 21

Adjusted Operating Cash Flow and Adjusted Free Cash Flow Reconciliation 22

Reconciliation of Packaging Adjusted EBITDA 23

Reconciliation of Packaging Adjusted EBITDA 24

Corrugated Packaging Segment Sales and Adjusted EBITDA Growth, excluding trade sales and transfers(1) 25 We present the non-GAAP financial measures “Adjusted Segment Sales Growth, excluding trade sales and transfers”, “Adjusted EBITDA Growth, excluding transfers”, and “Adjusted EBITDA Margin, excluding trade sales and transfers” because we believe these measures provide our management, board of directors, investors, potential investors, securities analysts and others with useful information to evaluate our performance relative to other periods since they exclude the impact of certain items impacting the Corrugated Packaging segment during the period that we believe are not indicative of the ongoing operating results of that segment

Consumer Packaging Segment Sales and Adjusted EBITDA Growth, excluding transfers and divestitures(1) 26 We present the non-GAAP financial measures “Adjusted Segment Sales Growth, excluding transfers and divestitures”, “Adjusted EBITDA Growth, excluding transfers and divestitures”, and “Adjusted EBITDA Margin, excluding transfers and divestitures” because we believe these measures provide our management, board of directors, investors, potential investors, securities analysts and others with useful information to evaluate our performance relative to other periods since they exclude the impact of certain items impacting the Consumer Packaging segment during the period that we believe are not indicative of the ongoing operating results of that segment We have removed RTS Packaging Segment Sales and Adjusted EBITDA for September 2022 and 2023 for comparability due to its sale in September 2023

TTM Credit Agreement EBITDA TTM Credit Agreement EBITDA and Leverage Ratio 27 Total Debt, Funded Debt and Leverage Ratio Additional Permitted Charges primarily includes goodwill impairment, restructuring and other costs, and certain non-cash and other items as allowed under the credit agreement
