UNITED STATES SECURITIES AND EXCHANGE COMMISSION
Washington, D.C. 20549
FORM 1-K
ANNUAL REPORT
ANNUAL REPORT PURSUANT TO REGULATION A OF THE SECURITIES ACT OF 1933
For the fiscal year ended:December 31, 2018
| SMART DECISION, INC. | ||
| (Exact name of issuer as specified in its charter) |
| Wyoming | 82-3182235 | |
State or other jurisdiction of incorporation or organization | (I.R.S. Employer Identification No.) |
1825 CORPORATE BLVD NW. SUITE 110 BOCA RATON, FL 33431 |
| (Full mailing address of principal executive offices) |
| (877) 267-6278 |
| (Issuer’s telephone number, including area code) |
Class A Common Stock
(Title of each class of securities issued pursuant to Regulation A)
SMART DECISION, INC.
| i |
STATEMENTS REGARDING FORWARD-LOOKING INFORMATION
Some of the statements in this Annual Report on Form 1-K constitute forward-looking statements. Forward-looking statements relate to expectations, beliefs, projections, future plans and strategies, anticipated events or trends and similar matters that are not historical facts. In some cases, you can identify forward-looking statements by terms such as "anticipate," "believe," "could," "estimate," "expect," "intend," "may," "plan," "potential," "should," and "would" or the negatives of these terms or other comparable terminology.
You should not place undue reliance on forward looking statements. The cautionary statements set forth in this Annual Report on Form 1-K identify important factors which you should consider in evaluating our forward-looking statements. These factors include, among other things:
| · | The speculative nature of the business we intend to develop; |
| · | Our reliance on suppliers and customers; |
| · | Our dependence upon external sources for the financing of our operations, particularly given that there are concerns about our ability to continue as a “going concern;” |
| · | Our ability to effectively execute our business plan; |
| · | Our ability to manage our expansion, growth and operating expenses; |
| · | Our ability to finance our businesses; |
| · | Our ability to promote our businesses; |
| · | Our ability to compete and succeed in highly competitive and evolving businesses; |
| · | Our ability to respond and adapt to changes in technology and customer behavior; and |
| · | Our ability to protect our intellectual property and to develop, maintain and enhance strong brands. |
Although the forward-looking statements in this Annual Report on Form 1-K are based on our beliefs, assumptions and expectations, taking into account all information currently available to us, we cannot guarantee future transactions, results, performance, achievements or outcomes. No assurance can be made to any investor by anyone that the expectations reflected in our forward-looking statements will be attained, or that deviations from them will not be material and adverse. We undertake no obligation, other than as maybe be required by law, to re-issue this Annual Report on Form 1-K or otherwise make public statements updating our forward-looking statements.
Smart Decision, Inc.
Smart Decision, Inc. (“Smart Decision,” “SDI,” “we,” or the “Company”) was incorporated in Wyoming on September 5, 2017. Our offices are located at 1825 Corporate Blvd. NW #110, Boca Raton, FL 33431, telephone: (877) 267-6278, Fax: (888) 713-3281, website: http://www.smartdecisioninc.com, email: adam@smartdecisioninc.com. We do not incorporate the information on or accessible through our website into this Annual Report on Form 1-K, and you should not consider any information on, or that can be accessed through, our website a part of this Annual Report on Form 1-K.
| 1 |
Our Business
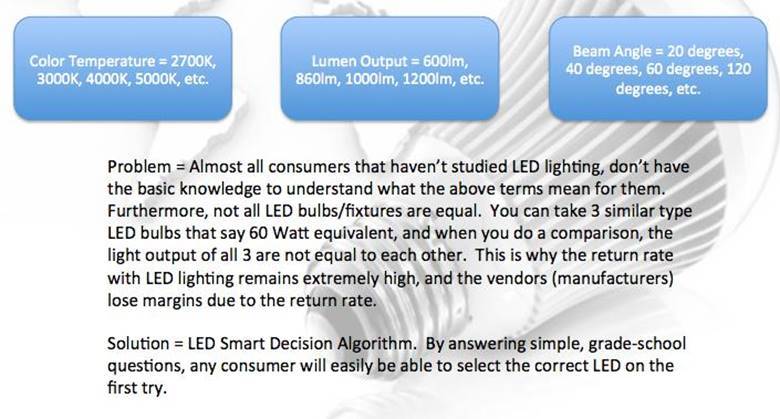
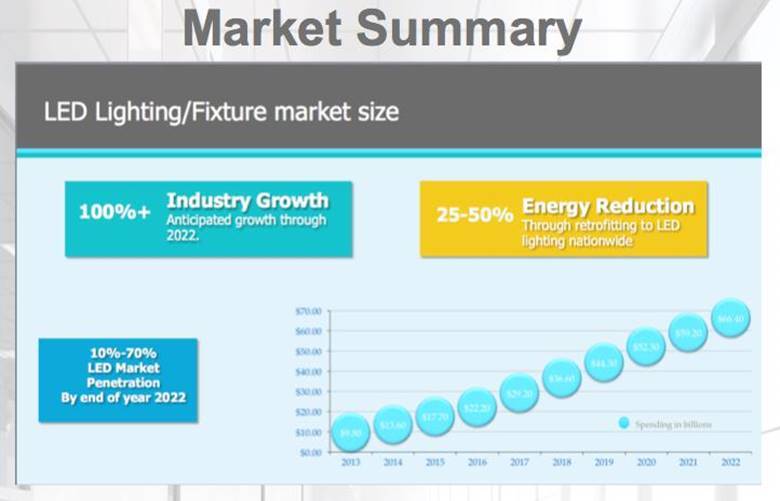
Governments around the world are passing measures to phase out incandescent light bulbs in favor of energy-efficient alternatives such as LEDs. Increasing demand for power-efficient illuminating systems across residential, commercial, and industrial sectors, rising concern over reduction of non-renewable sources of power, and decreasing pricing of LED light bulbs and fixtures are likely to aid in the growth of the LED industry in the coming years. According to “Go Beyond Lighting,” the LED lighting volume and penetration rate in the past year grew to 22% and is expected to rise to 63% by the year 2022. They also stated that the projected LED lighting market scale would reach $37.2 billion in 2018. As more and more industries – such as automotive, architectural and more, work towards large-scale updates, it would stand to reason that the solutions needed in helping them to do so, will rise as well.
SMART DECISION INC.™ has researched and is developing an algorithm for the consumer and business LED lighting market. With our patent-pending “Smart Decision” algorithm, the confusion of selecting the correct LED products will be significantly reduced. Consumers will be able to select the right LED bulbs/fixtures by answering a handful of consumer-friendly questions. Ultimately, we believe that selecting the right product the first time dramatically cuts down on product returns for retailers and creates a positive purchasing experience for the consumer. We intend to develop additional algorithms for other consumer categories in the future.
The Problem We Address
Buying an LED bulb is not like buying a traditional bulb due to numerous LED varieties. Based on our surveys of a local home improvement retailer and its customers, we believe that home improvement store associates are ill equipped to assist customers with complicated LED decisions, resulting in unusually high return rates on LED products. Consumer satisfaction purchasing LED is much less than other household items.
In fact, despite LED products being superior to traditional products, we found, in a survey of 1,000 customers in ten stores of a leading home improvement retailer in South Florida, that as much as 40% of all LED purchases in a given store may be returned for a refund. This causes enormous loss of time and money to stores, manufacturers and consumers. We believe this may hindering the rapid growth of LED lighting as consumers give up on improperly chosen LED bulbs. Further, no more than 12% of customers surveyed in any store knew what they wanted to buy and no more than 7% of customers surveyed in any store found suitable help at the store level.
We intend to simply assist consumers in making smart decisions for their LED lighting. We will do this in a fast, simple and inexpensive way.
Our Solution
SMART DECISION INC.™ will offer an algorithm known as LED Smart Decision™, consisting of innovative technology offering consumers a way to make informed purchases. We seek to disrupt the currently fragmented market by focusing within the LED industry. Our software is designed to filter products and specification that specifically meet the needs of each consumer.
We believe that SMART DECISION INC.™ has the easiest and most advanced methods to help buyers looking to source LED products for their home or business. We will be able to implement the “Smart Decision” algorithm across various consumer product segments.
Our Objectives
SMART DECISION INC.™ has definite objectives in order to fulfill its desire to participate and achieve an ever-growing market share. What follows is a brief summary of the key objectives:
| · | Procure funding to fully develop and launch the LED SMART DECISION INC.™ Algorithm; |
| · | Develop alliances with LED manufacturers (vendors); |
| 2 |
| · | Create relationships with online LED sellers and brick mortar retailers; |
| · | Reduce the exceptionally high return rate on LED for the retailers and manufacturers; and |
| · | Make the purchase of LED painless so consumers make the right purchase the first time. |
Our Keys to Success
SMART DECISION INC.™ is confident of the attributes that demonstrate our keys to success:
| · | Unique Patent-Pending Filtering System to easily select the best LED for all applications; |
| · | Patent of Filtering System to easily select the best LED for all applications; |
| · | Law prohibiting sales of incandescent light bulbs after 2014; and |
| · | Only algorithm/plugin specifically designed for LED with easy to answer questions for the consumer. |
The LED Lighting Market
The LED lighting industry is anticipated to grow 45% yearly through 2021 and beyond. Market forecasts are based on indications that LEDs are leveraging economies of scale to achieve price points attractive to users. Markets appear to be moving toward 100% LED replacement of existing technology including incandescent bulbs. The latest market report by the firm, Pike Research, said, “LEDs will account for almost 75% of the commercial lighting market in the United States within the next ten years.” Lighting accounts for 17.5% of all electricity use within the United States. The growth of LED (light emitting diode) technology is inevitable as the United States currently leads the world in energy usage at 4,065 billion kWh annually.
General lighting has surpassed all other applications, representing nearly 39% of total revenue of packaged LEDs. Electricity consumption can be reduced by more than 50% with the full-scale adoption of LED lighting. This could translate a savings of 334 million barrels of oil per year in the U.S. According to the United States Department of Energy, the adoption of LED lighting in the country over the next 20 years would reduce electricity consumption by 25%, save an accumulated $120 billion in energy costs, and reduce greenhouse gas emissions by millions of metric tons of CO2. According to a recent research study by EL Insights, growth will be strongest in commercial lighting over the next ten years from 2015 to 2020.
Key Market Statistics:
| · | Today, LED market penetration is less than 10%; and |
| · | Return rate in excess of 40% in many sectors of the market. |
Service Description
SMART DECISION INC.™ is proud of the features and benefits that make up the platform’s attractiveness to this ever-growing market. SMART DECISION INC.™ looks to become the premier LED platform, providing a plugin solution for brick and mortar and online retail channels to help promote their products in the U.S. SMART DECISION INC.™ provides an ‘LED Smart Decision Algorithm’ for residential and commercial buyers (facility directors, property managers, etc.) that will provide LED buying recommendations based on specific needs (direct from online resellers and big box retailers). SMART DECISION INC.™ essentially offers an ‘LED Smart Decision Algorithm’ for residential buyers that will make the process of selecting LED very simple. We are also looking to expand into other consumer related markets with similar type filtering engines.
| 3 |
The LED SmartDecision™ algorithm will assist potential LED buyers in making informed decisions when buying LED products. Each category would have a simple questionnaire to assist buyers in selecting products specific to each category. The SMART DECISION INC.™ algorithm will make the LED buying experience simple for:
| · | Consumer and household use (homes, home-office); and |
| · | Commercial use (office buildings, hotels, casinos, hospitals, schools, condos, etc.); including Government (office buildings, hospitals, etc.). |
Competitive Comparison
SMART DECISION INC.™ understands the current struggles and competitive nature of the current retailers. SMART DECISION INC.™’s study of LED retailers has given us a mastery of the strengths and weaknesses of companies that make up our competition. With the competition’s lack of filtering and industry specific categorical breakdowns and displays, SMART DECISION INC.™ should capture its target market.
Sales Literature
SMART DECISION INC.™ is prepared to highlight all the most important benefits and features in a packet of sales literature, as well as a dynamic website with informative web pages. This information, along with other resources, will present a call to action. The sales literature will address questions related to helping the retailer understand how implementing the SMART DECISION INC.™ algorithm can increase sales while decreasing returns.
Who will pay for SMART DECISION INC.™ services?
| · | Big box retailers looking for exposure in the LED field; |
| · | Online LED ecommerce sites want the ability to drive potential online buyers to their site; and |
| · | Vendors and manufactures whose LED product is sold online and in brick and mortar locations. |
How will SMART DECISION INC.™ charge its clients?
| · | Purchase a license agreement to use SMART DECISION INC.™ Plugin; |
| · | Purchase a license agreement to use SMART DECISION INC.™ mobile app; and |
| · | Purchase a license agreement to use SMART DECISION INC.™ algorithm as a kiosk or in-store tablet. |
SMART DECISION INC.™ Case Study:
| · | SMART DECISION INC.™ has spoken to all segments of the lighting industry (manufacturers, resellers, consumers, etc.). Every person, entity, company approached has said that they wanted to be a part of SMART DECISION INC.™. More importantly, they were willing to pay for the privilege; |
| · | SMART DECISION INC.™ has spoken to over 1,000 customers at large home supply retailers looking at LED bulbs/fixtures. 91% of the 1,000 had absolutely no idea what they needed to buy or how to choose an LED product that would closely match their current ‘traditional’ lighting; |
| · | 95% of those customers could not find suitable help in selecting the proper LED at the store level; |
| 4 |
| · | Store managers at 10 locations cited lack of knowledge as the reason that the return rate for LED lighting exceeded 35%; and |
| · | The 30+ industry publications that would assist in driving traffic to SMART DECISION INC.™ currently have more than 2.5 million subscribers/registered users. |
Market Analysis Summary
SMART DECISION INC.™ has done an exhaustive study of the state of its industry. From a growth perspective, the LED lighting industry is one of the most explosive industries in the world. The LED Lighting market in North America is forecasted to grow at a CAGR of 21.12% over the period 2018 to 2021. The LED market presents an ever-increasing market, a healthy bottom line, and excellent opportunities for growth. The LED lighting industry has shown rapid growth, reaching $13.6 billion in the United States and approximately $63.1 billion internationally (2015). In addition, there are over 4,200 Electrical (Lighting) Distributors in the United States; there are 1,500 lighting representatives in the United States; the site 1000bulbs.com has more than 500,000 visitors to their site on a monthly basis; 1000bulbs.com ships over 3,000 packages daily.
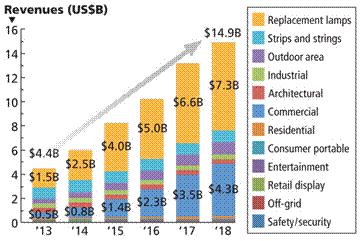
The illumination segment of the LED market will light the way with a compound annual growth rate (CAGR) of nearly 22% in 2018 to 2021. The display portion of the market, including backlit signs and billboards, will also shine brightly, achieving a five-year CAGR of over 14% as cities shift their needs to these more energy-efficient and ecologically friendly solutions. At the present time, there are three ways for America to get involved in reducing the country’s thirst for green electricity: photovoltaic (solar), wind generation and LED lighting. Without question, LED lighting is the most cost-effective and practical way of going green. More importantly, LED offers an ROI that far exceeds the benefits of the other technologies.
While still in its infancy, the penetration of LEDs into the lighting market has created a buzz this past year. The industry’s momentum picked up speed in 2013, with a growth rate of 31% compared to 15% in 2012. Replacement lamps will be a major growth area securing the retrofit market until the new construction market is gaining pace once again. Longer-term outlook continues to be highly positive, with 5-year CAGR forecast at 45%; forecasting overall 53% market growth. The U.S. Department of Energy states: the energy consumed by lighting the United States accounted for about 22% of annual energy production.
| 5 |
Widespread use of LED lighting will decrease the energy consumption by 50%. With this objective in mind, then by 2027, LED lighting will likely achieve annual energy consumption reductions equivalent to 5 billion barrels of oil, while also reducing carbon dioxide emissions. As a result, the market is expected to improve in the near future combined with economic revival and increased environmental awareness.
Market Segmentation & Target Market
SMART DECISION INC.™ aims to understand each and every reason why the consumer will buy LEDs. We not only seek to become experts on why our customers buy, but also what will make our customers buy now. With the technology offering safety (LED bulbs contain no mercury and have no UV rays) and 50% to 90% savings for the consumer, as well as the environment, we look to target large commercial facilities and government buildings with our T8 replacement tube products. With many of these facilities required by law to run lighting 24 hours in common areas, the savings are invaluable to consumers.
Today, there is less than a 1.5% market penetration with LED T8 replacement tubes and less than a 2% penetration with all kinds of LED lighting. Assuming McKinsey & Company’s recent study is correct in its assessment of a 70% LED market penetration by the year 2021, growth will be explosive in the next several years. In their survey, lighting professionals and consumers were also asked to identify a payback period (in years) that would encourage them to choose LED over traditional lighting, by application. The results showed that most people required payback of three years or less.
The acceptable payback period for residential lighting had the highest proportion of participants (22%) that expected payback in less than one year. The acceptable premium that people were willing to pay for a new lighting fixture for the first installation varied on average between 30% above cost (for residential lighting) and 39% (for office lighting). The median value was at 20% for all applications (except office lighting), which had a median value of 30%. Utility costs are rising, and the trend is expected to continue.
| 6 |
In fact, about 75% of facilities managers responsible for 630 buildings reported an increase in utility costs, according to International Facility Management Association. 20% said their increases were 10% or more. Of the costs explored in the study, utility costs showed the largest increase in the past year, spurred by the increased cost of natural gas. That is attributed to increased demand and tight supplies, as well as a colder than normal winter in parts of the country. Although utility costs vary by region, rates edging up got the blame for cost increases from 72% of the respondents, while about 30% said their costs were up as a result of usage being up significantly. Those who completed the survey manage a total of 420 million square feet, including space for office, research, hospital, call center, factory and other operations.
Rising energy costs affects everyone in this market; meaning, businesses have to work harder to remain profitable by controlling costs. All sectors are now faced with the added pressure from governments, investors and consumers to reduce energy consumption and be recognized as environmentally friendly.
Market Needs & Market Trends
Over the past three years, the number of mergers and acquisitions has continuously grown, reflecting the increased consolidation of the LED industry. During this period, there have been 60 significant mergers and acquisitions deals. Vertical integration deals are motivated by the need for companies to access to new technologies, to close knowledge gaps in the LED supply chain, secure supply. Strategic acquisitions are mainly motivated by economies of scale, desire for improved market share, access to a wider customer portfolio, and to increase the sales force. Mergers and acquisitions, rather than organic growth, are the main market-entry strategy by overseas acquirers.
Such deals have been driven primarily by companies seeking access to new markets and local distribution networks. The number of mergers and acquisitions deals is likely to continue to grow as LED technology has created a solid-state lighting (SSL) chasm, modifying all traditional aspects of the lighting industry and forcing suppliers to acquire competencies. SMART DECISION INC.™ believes that LED lighting will continue to grow because it is now a necessity for corporate America to lower overhead and carbon footprint. With an attractive ROI and ease of installation, there is no better way to ‘go green’ and we believe that LED lighting is the best option.
Market Growth & Industry Study
Growth of the LED industry has come from LED use in small displays and has then been driven forward by the LCD display industry. General lighting has surpassed all other applications, representing nearly 39% of total revenue for packaged LEDs.
LED-based lighting product prices have decreased more rapidly than expected, increasing the penetration rate of the technology. Globally, the lighting market will grow to $159 billion in 2020.
| 7 |
The LED lighting market is expected to amount to almost US$94 billion by 2020, representing close to 60% of the total lighting market. SMART DECISION INC.™ recognizes that it’s participating in a large industry with a potentially explosive growth rate. Its projected growth will be set at a rate greater than the industry average. SMART DECISION INC.™ implementation of its business strategy will lend itself to fast paced development and dominance with a significant market share. We have determined the growth of the LED market on the basis of an ever-increasing customer base, and dollar volume base as well.
According to market research published by P&S Market Research and broadcasted using Global Newswire, the LED lighting market size is projected to hit $70.2 billion by 2023, which would be growing at a CAGR of 12.6% between 2017 – 2023. They cite a growing adoption of energy efficient lighting solutions across the globe as one of the primary factors attributing to the growth of the worldwide LED lighting industry. The increase in demand of LED for various lighting applications of general lighting have also benefited the penetration of LED lighting in recent years.
The adoption and acceptance of LED lighting is continuously increasing in the residential, commercial and industrial lighting applications. In a Department of Energy (DOE) 2014 study, energy savings forecast of solid-state lighting (LED) in general illumination applications is predicted that LED lighting will represent 84% of all lighting sales by the year 2030.
According to a report published by Report Buyer via PR Newswire, the Global LED lighting market is expected to surpass US$ 100 Billion by the end of year 2024. The global LED lighting market is currently undergoing a drastic change, propelled by the exponential urban expansion expected over the next decade, and the drive towards even bigger energy efficiency.
In another study conducted by Persistence Market Research, indoor applications of LED lighting are projected to be the most attractive segment from 2017 – 2025.
LED lamps are energy efficient and have a service life of up to 50,000 hours or more. Unlike traditional lighting, LED does not contain any filament or tube that is fragile. LED requires no warm up period and they light up instantly. They are also environmentally friendly. They do not contain mercury or any other hazardous substances. Due to these desirable properties of LED, they are ideal in situations where lamps are required to be switched on and off. LED lighting has zero UV emissions and they can also run on low voltage power supply. Due to these distinct advantages of LED lighting, the global market for LED lighting is expanding at a fast pace and LED lighting has the potential to revolutionize the lighting sector.
According to Persistence Market Research analysis, the global LED lighting market was valued at nearly $37 billion in 2017. It is expected to touch a figure of $126 billion by the year 2025, registering a CAGR of 16.6% and exhibiting an increase of 3.4x in terms of revenue during the forecast period.
Our Marketing Strategy & Implementation
SMART DECISION INC.™ is aware of all of the different options in a marketing strategy. Because of its research, management has chosen to market through SEO, search engine listings with various social media such as Manta, LinkedIn, etc.; email communications that will consist of: letters, PDF file attachments, publisher files, web links to its site, promotional opportunities, etc.; trade publications; press releases in trade magazines that will promote new business, as well as for highlighting the specifics its experience and services.
SMART DECISION INC.™ will also attend industry related trade shows to demonstrate its platform. We will make personal sales calls to retailers and vendors to promote our site/algorithm. The marketing plans and efforts are designed to produce the maximum exposure and response from manufacturers, gain industry recognition, industry presence for increasing sales opportunities and growth. SMART DECISION INC.™ looks to take advantage of the 75% of the population online, with vast relevancy relatable to keywords (organics). Below is an outline of the strategy toward marketing the site and ramping up organic results:
Pre-Launch Beta Stage:
Viral:
| · | Create initial viral video spots; |
| 8 |
| · | Join social networks; |
| · | Outsource blogging; and |
| · | Issue frequent press releases. |
Traditional:
| · | Organic SEO (automatically create Meta tags for all images, media and links on the site); |
| · | Additional SEO methods will be implemented throughout the site; |
| · | Approach relevant newspapers and magazines and issue press releases; and |
| · | Tap into friend and client networks. |
Post Launch:
| · | Create additional viral video spots; |
| · | Grassroots campaign and organic SEO; |
| · | Approach public relations firms; and |
| · | Setup SMART DECISION INC.™ blog (RSS) feed. |
Marketing Programs & Sales Strategy
SMART DECISION INC.™ knows that its marketing programs need to be compelling, detailed and highlight many of its capabilities. SMART DECISION INC.™ knows that its consumers hear its message through every aspect of the staff, reputation, and quality control. SMART DECISION INC.™ strives to be indispensable to both the consumer and the retailer. Its marketing programs work to identify this customer, highlight competitive advantages, as well as show appreciation for customer feedback. We have set deadlines with amounts, as well as budget restrictions for a highly profitable sales program. With our comprehensive marketing program and competitive positioning, we are confident to see our milestones become realities.
Financial Plan
SMART DECISION INC.™ has developed its financial plan with the awareness that cash and bottom line are key components of any successful company. We expect that revenues will come from charges and fees generated from a portion of the sales of LED products and services and licensing agreements with several large retailers. The opportunity to increase revenues is being fully taken advantage of as outlined in our overall marketing strategy. To assure that bottom line adequately follows increases in revenue, every care possible is being taken to control all areas of expenses and overhead.
Important Assumptions & Key Financial Indicators
SMART DECISION INC.™ makes every effort not to assume any aspect of its operation other than having hard factual data to back up any forecast. The entire management team is constantly reminded to base all programs on highly researched statistical information with the slightest possible margin of variation. One of the reasons SMART DECISION INC.™ chose the LED industry for a portal was to minimize as many variables in the business community as possible. SMART DECISION INC.™ recognizes that the most important financial indicators are cash and bottom line. We will be constantly monitoring the flow of revenue to the Company, as well as the expense requirements that deplete the Company of cash. SMART DECISION INC.™ will always try to improve the ratio of revenue and expenses to generate a healthier bottom line.
| 9 |
Within six months of launch, SMART DECISION INC.™ will unveil the stand-alone version of the LED Smart Decision Algorithm. While the algorithm will start off as a tool for the SMART DECISION INC.™ platform, we will be creating a stand-alone version that will:
| 1. | Allow big box retailers (for a licensing fee), the ability to add their inventory to the database and have a tablet at the store level that makes use of the LED Smart Decision Algorithm to assist their customers in selecting the right LED while at the store; |
| 2. | The retailers will have the option of allowing for a location based Smart Phone app that will allow customers to use the LED Smart Decision Algorithm at the store level from their very own smart phone. Again, SMART DECISION INC.™ will charge a licensing fee; |
| 3. | Online retailers will be able to incorporate the LED Smart Decision Algorithm into their own ERP software or use as stand-alone software that will cater to the specific products they carry. This will help their sales associates in making sure that they are selling the right LED to their customers. Again, SMART DECISION INC.™ will charge a licensing fee. |
SMART DECISION INC.™ is currently patent pending for the LED Smart Decision Algorithm, patent application number 14/854692, that will enable it to capture the entire market, when it comes to a simple way for consumers to source LED. Additionally, SMART DECISION INC.™ has been awarded patent 8829773 for Lighting Apparatus with Light-Emitting Diodes, Chips, and Remote phosphor layer.
Available Information
Our website is www.smartdecisioninc.com. We make available through our website additional information on our company and our products. We do not incorporate the information on or accessible through our website into this Annual Report on Form 1-K, and you should not consider any information on, or that can be accessed through, our website a part of this Annual Report on Form 1-K.
Our Technology and Intellectual Property
We may rely on a combination of patent, trademark, copyright, and trade secret laws in the United States as well as confidentiality procedures and contractual provisions to protect our proprietary technology, databases, and our brand. Despite this reliance, we believe the following factors are more essential to establishing and maintaining a competitive advantage:
| · | The skills of our service operations and research and development teams; |
| · | Our research and development; |
| · | the real-time connectivity of our service offerings; and |
| · | a continued focus on the improved results of our clients. |
We have a policy of requiring key employees and consultants to execute confidentiality agreements upon the commencement of an employment or consulting relationship with us. Our employee agreements also require relevant employees to assign to us all rights to any inventions made or conceived during their employment with us. In addition, we have a policy of requiring individuals and entities with which we discuss potential business relationships to sign non-disclosure agreements. Our agreements with clients include confidentiality and non-disclosure provisions.
We have acquired rights to one United States patent and one United States patent application. Patent 8,829,773 covers lighting apparatus with light-emitting diode chips and remote phosphor layer. Patent Application 14/854692 covers a method for an LED product filtering engine. This technology covers a user-friendly method for filtering LED products in order to identify a matching design ideal for a specific lighting application described by a user. It relates generally to a method for a product selection engine in relation to light-emitting diode (LED) fixtures. More specifically, this application is a method for assisting consumers in identifying and selecting a proper LED design based on a set needs and preferences.
| 10 |
Seasonality
We do not expect any seasonality in our business.
Litigation
We have no current, pending or threatened legal proceedings or administrative actions either by or against us that could have a material effect on our business, financial condition, or operations and any current, past or pending trading suspensions
Facilities
Our corporate office is located at 1825 Corporate Boulevard NW, Suite 110, Boca Raton, Florida 33431.
Employees
As of the date of this Annual Report on Form 1-K, we had four employees, including officers and directors. We believe that we have been successful in attracting experienced and capable personnel. All our employees have entered agreements with us requiring them not to compete or disclose our proprietary information. Our employees are not represented by any labor union. We believe that relations with our employees are excellent.
Item 2. Management’s Discussion and Analysis of Financial Condition and Results of Operations
You should read the following discussion and analysis of our financial condition and results of our operations together with our financial statements and the notes thereto appearing elsewhere in this Annual Report on Form 1-K. This discussion contains forward-looking statements reflecting our current expectations, whose actual outcomes involve risks and uncertainties. Actual results and the timing of events may differ materially from those stated in or implied by these forward-looking statements due to a number of factors, including those discussed in the section titled “Cautionary Statement regarding Forward-Looking Statements” and elsewhere in this Annual Report on Form 1-K. Please see the notes to our Financial Statements for information about our Significant Accounting Policies and Recent Accounting Pronouncements.
Overview
Smart Decision, Inc. was incorporated on September 5, 2017 and commenced operations immediately thereafter. We are still in the research development stage of our business, aiming to develop and sell an application for consumers to be able to select the right LED bulb/fixtures. By selecting the right product the first time it dramatically cuts down on product returns for retailers and creates a positive purchasing experience for the consumer. The Company plans to develop additional algorithms for other consumer categories in the future.
In addition to our LED Smart Decision algorithm, we are also starting to develop a similar type algorithm for the Cannabis/CBD space. While there is plenty of technology in the Cannabis/CBD space, it is specifically focused on the “growers”, “stores”, etc. As of yet, there is no technology focused on the consumers. While many have heard that CBD can cure their ailments, consumers are not aware of the dosage or type of product they need. Our future Cannabis/CBD algorithm, will easily help consumers make the best Cannabis/CBD buying decisions for themselves.
Recent Developments
In September 2017, the Company granted 33,750,000 Class A common shares to two founders for services. The shares were valued at a nominal value of $0.0001 per share for a total of $3,375 which was charged to compensation expense.
On February 16, 2018, the Company amended its articles of incorporation to authorize 5,000,000,000 shares of Common Stock having a par value of $0.0001 and to divide its Common Stock into two classes: Class A and Class B. There are 4,900,000,000 designated shares of Class A and 100,000,000 designated shares of Class B. The shares of each class of Common Stock are identical except that the holders of the Class B Common Stock shall be entitled to elect a majority of the board of directors and the holders of the Class A shall elect the remainder of the directors. Each share of Class B Common Stock shall be convertible at any time into one share of Class A Common Stock at the option of the holder.
| 11 |
As part of the amendment the Company also added 1,000,000,000 shares of Preferred Stock having a par value of $0.0001 per share. The board of directors is expressly vested with the authority to fix and determine the relative rights and preferences of the shares of each series so established, however, that the rights and preferences of the various series may vary with only respect to the rate of dividend; whether the shares may be called and, if so, the call price and the terms and conditions of call; the amount payable upon the shares in the event of voluntary and involuntary liquidation; sinking fund provisions; the terms and conditions, if any, on which the shares may be converted; voting rights; and whether the shares will be cumulative , noncumulative, or partially cumulative as to dividends and the dates from which any cumulative dividends are to accumulate.
In February 2018, the Company sold 32,750,000 shares of Class A Common Stock to investors at $0.0001 per share for a total cash consideration of $3,275.
As of the date of the filing of this Annual Report on Form 1-K, the Company sold an additional 5,950,000 shares of Class A Common Stock to investors under its Regulation A offering at $0.01 per share for total cash consideration of $59,500.
Revenue
We generated no revenues during the year ended December 31, 2018 or for the period from September 5, 2017 (inception) to December 31, 2017.
Net loss
As a result of the foregoing, for the period ended December 31, 2018 and 2017 we recorded a net loss of $97,686 and $12,107. The loss is mainly comprised of accounting and audit fees, legal fees, and the remaining attributable to bank charges, general and administrative, office supplies and software license fees. Currently operating costs exceed revenue because we have no sales during this period. We cannot assure when or if revenue will exceed operating costs.
Liquidity and Capital Resources
The Company had cash on hand of $8,983 at December 31, 2018 and $4,009 at December 31, 2017. We may be required to raise additional funds, particularly if we are unable to generate positive cash flow as a result of our operations. We estimate that based on current plans and assumptions, that our cash will not be sufficient to satisfy our cash requirements under our present operating expectations, without further financing, for up to 12 months. In order to continue as a going concern, develop a reliable source of revenues, and achieve a profitable level of operations the Company will need, among other things, additional capital resources. Management’s plans to continue as a going concern include raising additional capital through borrowings and the sale of common stock. No assurance can be given that any future financing will be available or, if available, that it will be on terms that are satisfactory to the Company. Even if the Company is able to obtain additional financing, it may contain undue restrictions on our operations, in the case of debt financing, or cause substantial dilution for our stockholders, in case of an equity financing.
Cash Flows
Operating Activities
For the year ended December 31, 2018 we used $67,801 of cash in operating activities and for the year ended December 31, 2017, we used $3,191 of cash in operating activities. Our 2018 use of cash primarily consisted of our net loss of $97,686 offset by an increase in our accounts payable and accrued expenses of $29,695 while the 2017 cash primarily consisted of our net loss of $12,107 offset by an increase in accounts payable of $5,541 and stock compensation of $3,375.
Financing Activities
For the year ended December 31, 2018, financing activities provided $72,775 and for the year ended December 31, 2017, financing activities provided $7,200. We received proceeds from the issuance of a convertible note and the sale of our Class A common stock.
| 12 |
Off-Balance Sheet Arrangements
We do not have any off-balance sheet arrangements that have, or are reasonably likely, to have a current or future effect on our financial condition, changes in financial condition, revenues or expenses, results of operations, liquidity, capital expenditures or capital resources that is material to investors.
Critical Accounting Policies and Estimates
This summary of significant account policies of the Company is presented to assist in understanding the Company’s financial statements. The financial statements and the notes are the representation of the Company’s management, who are responsible for their integrity and objectivity. These accounting policies conform to U.S. generally accepted accounting principles (“US GAAP”) and have been consistently applied in the preparation of the financial statements.
Use of Estimates
The preparation of financial statements in conformity with US GAAP requires management to make estimates and assumptions that affect reported amounts of assets and liabilities, disclosure of contingent assets and liabilities at the date of the financial statements, and the reported amounts of revenues and expenses during the reporting period. Actual results could differ from those estimates. Significant estimates in the accompanying financial statements include the valuation of stock compensation and the valuation of our deferred tax assets.
Borrowings
Borrowings are recognized initially at cost which is the fair value of the proceeds received, net of transaction costs incurred or beneficial conversion feature values which are recorded as debt discounts. In subsequent periods, borrowings are stated at amortized cost using the effective yield method; any difference between fair value of the proceeds (net of transaction costs) and the redemption amount is recognized as interest expense over the period of the borrowings.
Stock-Based Compensation
The Company records stock-based compensation in accordance with the guidance in ASC Topic 718 which requires the Company to recognize expenses related to the fair value of its employee stock and stock option awards. The expenses are generally recognized over the requisite service periods.
Item 3. Directors and Officers
The following table sets forth information regarding our executive officers, directors and significant employees, including their ages as of April 30, 2019:
Approximate hours per week for part-time employees
| Name and Principal Position | Age | Term of Office | Approximate per week for Part-Time Employees |
| Adam Green – President, Chairman | 48 | Since September 2017 | 60 |
| Eric Gutmann – Secretary-Treasurer, Director | 45 | Since September 2017 | 30 |
| Jonathan Morgan – Director | 44 | Since September 2017 | 20 |
| Dr. James Edward Dempsey – Director | 79 | Since September 2017 | 10-15 |
| 13 |
Adam Green – President, Chairman
Adam Green is performance-driven sales expert and accomplished executive who has consistently delivered exceptional results. He combines strong business acumen with a transformational leadership style. Adam is adept at managing complex and dynamic work environments including LED product manufacturing, distribution, operations, marketing and supply chain management.
His accomplishments:
| · | Mr. Green was one of the first manufacturers in the United States to receive an ETL safety listing for an LED Tube that replaces standard fluorescent tubes. Patent (13/785,827) on the use of remote phosphor in the manufacturing of LED Tubes, slashing manufacturing costs by 40% and increasing the life expectancy of LED Tubes by up to 50%. |
| · | Patent Pending on a method for an LED Product Filtering Engine that will help consumers select the correct LED bulbs/fixtures for their application and help online and brick-and-mortar retailers sell the proper LED to their customers. Developed sales and marketing strategies for LED distributors and sales agencies that helped increase efficiency and profit margins. |
| · | Implemented incentive programs and sales strategy guidelines for inside and outside sales staff to increase production on a monthly basis, increasing sales from $1M to over $13M within 2 years of arrival. In 2012, completed one of the largest LED retrofits at the time in Las Vegas of LED bulbs (30,000 pcs.) for a Station’s Casino property. Worked closely with engineers to insure compatibility with their current lighting control system. |
| · | Guest lecturer at several colleges and universities to both faculty and students. Helped author an LED test study for the Clark County School District in Nevada, proving that students’ test scores improved in classrooms outfitted with LED lighting. |
Eric Gutmann – Secretary-Treasurer, Director
Mr. Gutmann was President and Chief Operating Officer for Natural Synergies, a buying consortium for independent natural food stores throughout the United States. After leaving Natural Synergies Mr. Gutmann became Director of Business Development for Skies International, a distributor of consumer products throughout Central and South America. Mr. Gutmann is an investor in several small start-ups and also manages a family real estate portfolio.
In addition, Mr. Gutmann has been a member of the board of the Jewish Federation of South Palm Beach County and has served as the President of the Board of the Adolph and Rose Levis Jewish Community Center in Boca Raton and continues to serve on their Executive Committee.
Mr. Gutmann graduated with an Honors degree in finance from the University of Florida.
Jonathan Morgan – Director
Jonathan Morgan is a marketing, advertising, design and production of displays, product development, trade show and exhibits, merchandising, promotional products and printing industry expert for the past 24 years and has been an integral Partner at RMI, Inc., and Founder of Happy Head Marketing.RMI, Inc. for the past 45 years is one of the top leading Marketing, Advertising, Pos/Pop, Trade Show and Exhibits, Mobile/Smartphone Web Development, Promotional Products and Printing Agency's in the United States.
Mr. Morgan has worked and created programs with companies such as Vespa Scooters, Citibank, Volvo Cars of NA, Ricoh Corp, Yamaha Music Corp, Ovation Guitars, AAA National, Welch’s Fruit Snacks, Fender Guitars, Magnolia Bakery, Barnes and Noble College Bookstores, TechWeb, Sour Jackets Candy, Women In The World and an additional 120+ other companies. These companies hired Jonathan / RMI Inc. for a one-stop source for their niche marketing opportunities and programs.
| 14 |
Five years ago, Mr. Morgan founded Happy Head Marketing to serve the Medical/Recreational Cannabis and CBD Industry. Happy Head Marketing is a one-stop source to help develop and manufacture the most unique cartridges, electronic vaporizers, pos/pop displays, and packaging for over 40 well recognized brands seen in the Medical/Recreational Cannabis and CBD Industry. Happy Head Marketing provides the best quality products in the market through our manufacturing, innovation and quality standards. Its team has created and worked with some of the biggest brands in the industry. These brands come to Happy Head Marketing for their relationships to direct and navigate through this unregulated industry. Some of these brands are: Bhang, Beboe, Dixie, Harmony Extracts, Green Roads World, 420 Bar, Cannabis Quencher, Etain Health, Ebbu, and KYND.
Mr. Morgan graduated with a Business Marketing Degree from the University of Hartford. He is a member of or affiliated with the Advertising Specialty Institute, Graphics of the Americas, National Cannabis Industry Association, Marijuana Business Association and SGIA.
Dr. James Edward Dempsey – Director
Dr. Dempsey is a former President of the Georgia Society of Otolaryngology and has served as plant physician for NASA. Dr. Dempsey has practiced in all areas of otolaryngology while maintaining a specific interest in otology.
Dr. Dempsey attended Shorter College in Rome, Georgia and graduated in 1961 with a Bachelor of Science degree in chemistry. Following college, he obtained his medical degree from the Medical College of Georgia in 1965, and then returned to Rome to complete a one-year internship at Floyd County hospital. In 1966, Dr. Dempsey entered the United States Air Force for two years. In 1969, he began his otolaryngology residency in Atlanta at Emory and Grady Hospitals. Dr. Dempsey is particularly well versed on the science of algorithms, which his patients use to make decisions on a daily basis.
He is Board Certified in Otolaryngology Head and Neck Surgery. He has been a member or affiliated with the American Academy of Otolaryngology Head and Neck Surgery, American Medical Association, Georgia Society of Otolaryngology (past president), Medical Association of Georgia, Crawford W. Long Society, Fellowship of the American College of Surgeons, and the Greater Atlanta Otolaryngology Society.
There are no family relationships among and between our directors, officers, persons nominated or chosen by the Company to become directors or officers, or beneficial owners of more than five percent (5%) of the any class of the Company’s equity securities.
Employment Agreements
Mr. Green and Mr. Gutmann have entered into an employment agreement with the Company for a term of five years. Pursuant to their employment agreements, they have agreed to devote a substantial portion of their business and professional time and efforts to our business. The employment agreement provides that each employee shall receive a salary determined by the Board of Directors commensurate with the development of the Company. They may be entitled to receive, at the sole discretion of our Board of Directors or a committee thereof, bonuses based on the achievement (in whole or in part) by the Company of our business plan and achievement by the employee of fixed personal performance objectives.
The following table represents information regarding the total compensation our officers and directors of the Company as of December 31, 2018:
| Name and Principal Position | Cash Compensation | Other Compensation | Total Compensation |
| Adam Green, Director, President, Director | $0.00 | $0.00 | $0.00 |
| Eric Gutmann, Secretary –Treasurer, Director | $0.00 | $0.00 | $0.00 |
| Jonathan Morgan – Director | $0.00 | $0.00 | $0.00 |
| Dr. James Edward Dempsey – Director | $0.00 | $0.00 | $0.00 |
| Total | $0.00 | $0.00 | $0.00 |
| 15 |
Item 4. Security Ownership of Management and Certain Securityholders
The following table gives information on ownership of our securities as of April 30, 2019. The following lists ownership of our Common Stock by each person known by us to be the beneficial owner of over 5% of the outstanding Common and Preferred Stock, and by our officers and directors:
| Name (1) | Class A Common Stock | Class B Common Stock | Percentage of Total Class A Common Outstanding (2) | Percentage of Total Class B Common Outstanding (2) | Percentage of Class A Common Stock Outstanding Assuming All Shares Offered are Sold (3) |
| Adam Green | 17,500,000 | 1,000,000 | 24.8 | 52.6 | 3.4 |
| Eric Gutmann | 14,300,000 | 900,000 | 20.3 | 47.4 | 2.8 |
| James Edward Dempsey (4) | 5,500,000 | 0 | 7.8 | 0 | 1.0 |
| R&J Holdings (5) | 3,000,000 | 0 | 4.3 | 0 | 0.5 |
| All officers and directors | 40,300,000 | 1,900,000 | 57.2 | 100 | 7.7 |
| MSB Management | 6,500,000 | 0 | 9.2 | 0 | 1.1 |
| GPL Ventures, LLC | 6,500,000 | 0 | 9.2 | 0 | 1.1 |
| Tri-Bridge Ventures, LLC | 6,000,000 | 0 | 8.5 | 0 | 1.1 |
| (1) | The address for all shareholders is c/o Smart Decision, Inc., 1825 Corporate Blvd. NW, #110, Boca Raton, FL 33431. |
| (2) | Based on a total of 70,500,000 Class A Common and 1,900,000 Class B Common shares outstanding as of April 30, 2019. |
| (3) | Assumes all shares offered are sold. |
| (4) | Mr. Dempsey is a director. |
| (5) | R&J Holdings is controlled by Jonathan Morgan, a director. |
On April 18, 2019, Messrs. Green and Gutmann entered into Share Cancelation Agreements pursuant to which Mr. Green agreed to cancel 1,050,000 shares of Class A Common Stock previously authorized to be issued by the Board of Directors but never issued with the transfer agent and Mr. Gutmann agreed to cancel 900,000 shares of Class A Common Stock previously authorized to be issued by the Board of Directors but never issued with the transfer agent.
Item 5. Interest of Management and Others in Certain Transactions
During the last two full fiscal years and the current fiscal year or any currently proposed transaction, there is no transaction involving the Company, in which the amount involved exceeds the lesser of $120,000 or one percent of the average of the Company’s total assets at year-end for its last three fiscal years.
On February 28, 2019, the Company entered into Lock-up and Resale Restriction Agreements with five principal shareholders, the form of which is included as an exhibit hereto.
The financial statements required by this Item 7 are included in this Annual Report on Form 1-K on the following page.
| 16 |
SMART DECISION, INC.
| F-1 |
![]()
Report of Independent Registered Public Accounting Firm
To the Board of Directors and Stockholders of
Smart Decision, Inc.
Opinion on the Financial Statements
We have audited the accompanying balance sheets of Smart Decision, Inc. as of December 31, 2018 and 2017, the related statements of operations, changes in stockholders’ deficit, cash flows and the related notes (collectively referred to as the “financial statements”) for the year ended December 31, 2018 and for the period from September 5, 2017 (inception) through December 31, 2017. In our opinion, the financial statements present fairly, in all material respects, the financial position of the Company as of December 31, 2018 and 2017 and the results of its operations and its cash flows for the year ended December 31, 2018 and for the period from September 5, 2017 (inception) through December 31, 2017, in conformity with accounting principles generally accepted in the United States of America.
Going Concern
The accompanying financial statements have been prepared assuming that the Company will continue as a going concern. As discussed in Note 1 to the financial statements, the Company has a net loss and cash used in operations of $97,686 and $67,801, respectively, in 2018 and a stockholders’ deficit, accumulated deficit and working capital deficiency of $43,453, $109,793 and $43,453, respectively, at December 31, 2018. These matters raise substantial doubt about the Company’s ability to continue as a going concern. Management’s Plan in regard to these matters is also described in Note 1. The financial statements do not include any adjustments that might result from the outcome of this uncertainty.
Basis for Opinion
These financial statements are the responsibility of the Company’s management. Our responsibility is to express an opinion on the Company’s financial statements based on our audits. We are a public accounting firm registered with the Public Company Accounting Oversight Board (United States) (“PCAOB”) and are required to be independent with respect to the Company in accordance with the U.S. federal securities laws and the applicable rules and regulations of the Securities and Exchange Commission and the PCAOB.
We conducted our audits in accordance with the standards of the PCAOB and in accordance with auditing standards generally accepted in the United States of America. Those standards require that we plan and perform the audits to obtain reasonable assurance about whether the financial statements are free of material misstatement, whether due to error or fraud. The Company is not required to have, nor were we engaged to perform, an audit of internal control over financial reporting. As part of our audits we are required to obtain an understanding of internal control over financial reporting but not for the purpose of expressing an opinion on the effectiveness of the Company’s internal control over financial reporting. Accordingly, we express no such opinion.
Our audits included performing procedures to assess the risks of material misstatement of the financial statements, whether due to error or fraud, and performing procedures that respond to those risks. Such procedures included examining, on a test basis, evidence regarding the amounts and disclosures in the financial statements. Our audits also included evaluating the accounting principles used and significant estimates made by management, as well as evaluating the overall presentation of the financial statements. We believe that our audits provide a reasonable basis for our opinion.
/s/ Salberg & Company, P.A.
SALBERG & COMPANY, P.A.
We have served as the Company’s auditor since 2018.
Boca Raton, Florida
April 29, 2019
2295 NW Corporate Blvd., Suite 240 • Boca Raton, FL 33431-7328
Phone: (561) 995-8270 • Toll Free: (866) CPA-8500 • Fax: (561) 995-1920
www.salbergco.com • info@salbergco.com
Member National Association of Certified Valuation Analysts • Registered with the PCAOB
Member CPAConnect with Affiliated Offices Worldwide • Member AICPA Center for Audit Quality
| F-2 |
SMART DECISION, INC.
| December 31, 2018 | December 31, 2017 | |||||||
| ASSETS | ||||||||
| CURRENT ASSETS: | ||||||||
| Cash | $ | 8,983 | $ | 4,009 | ||||
| TOTAL CURRENT ASSETS | 8,983 | 4,009 | ||||||
| TOTAL ASSETS | $ | 8,983 | $ | 4,009 | ||||
| LIABILITIES AND STOCKHOLDERS' DEFICIT | ||||||||
| CURRENT LIABILITIES: | ||||||||
| Accounts payable | $ | 751 | $ | – | ||||
| Accrued expenses | 32,994 | 5,500 | ||||||
| Accrued interest | 1,491 | 41 | ||||||
| Convertible note | 16,000 | 6,000 | ||||||
| Note payable - related party | 1,200 | 1,200 | ||||||
| TOTAL CURRENT LIABILITIES | 52,436 | 12,741 | ||||||
| Commitments and contingencies (Note 4) | ||||||||
| STOCKHOLDERS' DEFICIT | ||||||||
| Preferred stock; par value $0.0001; 1,000,000,000 shares authorized; none issued and outstanding | – | – | ||||||
| Common stock; par value $0.0001; 5,000,000,000 shares authorized; | ||||||||
| Common stock - Class A; 4,900,000,000 shares designated;72,450,000 and 33,750,000 issued and outstanding at December 31, 2018 and 2017, respectively | 7,245 | 3,375 | ||||||
| Common stock - Class B; 100,000,000 shares designated;1,900,000 and none issued and outstanding at December 31, 2018 and 2017, respectively | 190 | – | ||||||
| Additional paid in capital | 58,905 | – | ||||||
| Accumulated deficit | (109,793 | ) | (12,107 | ) | ||||
| TOTAL STOCKHOLDERS' DEFICIT | (43,453 | ) | (8,732 | ) | ||||
| TOTAL LIABILITIES AND STOCKHOLDERS' DEFICIT | $ | 8,983 | $ | 4,009 | ||||
The accompanying notes are an integral part of these financial statements
| F-3 |
SMART DECISION, INC.
| For the Period From | ||||||||
| September 5, 2017 | ||||||||
| Year Ended | (Inception) to | |||||||
| December 31, 2018 | December 31, 2017 | |||||||
| Revenues | $ | – | $ | – | ||||
| OPERATING EXPENSES | ||||||||
| Accounting | 12,000 | 3,000 | ||||||
| Audit fees | 13,239 | – | ||||||
| Bank charges | 767 | 62 | ||||||
| Compensation | 190 | 3,375 | ||||||
| Computer & internet | 3,546 | 81 | ||||||
| Consulting fees | 12,000 | – | ||||||
| Dues & Subcriptions | 267 | – | ||||||
| Edgar fees | 4,326 | – | ||||||
| Filing fees | 1,636 | – | ||||||
| General and administrative | – | 473 | ||||||
| Investor portal | 5,128 | – | ||||||
| Legal | 26,265 | 5,000 | ||||||
| Meals & entertainment | 497 | – | ||||||
| Office expense | 2,645 | – | ||||||
| Office supplies | 148 | 27 | ||||||
| Patent expense | 2,159 | – | ||||||
| Postage | 75 | – | ||||||
| Professional fees | 3,800 | – | ||||||
| Rent expense | 2,000 | – | ||||||
| Software license fees | 376 | 48 | ||||||
| Telephone expense | 407 | – | ||||||
| Transfer agent fees | 1,200 | – | ||||||
| Travel | 3,565 | – | ||||||
| Total Operating Expenses | 96,236 | 12,066 | ||||||
| LOSS FROM OPERATIONS | (96,236 | ) | (12,066 | ) | ||||
| OTHER (EXPENSE) | ||||||||
| Interest expense | (1,450 | ) | (41 | ) | ||||
| Total other expense | �� | (1,450 | ) | (41 | ) | |||
| LOSS BEFORE INCOME TAX PROVISION | (97,686 | ) | (12,107 | ) | ||||
| INCOME TAX PROVISION | – | – | ||||||
| NET LOSS | $ | (97,686 | ) | $ | (12,107 | ) | ||
| NET LOSS PER SHARE | $ | – | $ | – | ||||
| WEIGHTED AVERAGE COMMON SHARES OUTSTANDING | 63,659,726 | 33,750,000 | ||||||
The accompanying notes are an integral part of these financial statements
| F-4 |
SMART DECISION, INC.
STATEMENTS OF CHANGES IN STOCKHOLDERS’ DEFICIT
FOR THE YEAR ENDED DECEMBER 31, 2018 AND
FOR THE PERIOD FROM SEPTEMBER 5, 2017 (INCEPTION) TO DECEMBER 31, 2017
| Common stock - Class A | Common stock - Class B | |||||||||||||||||||||||||||
| Shares | Amount | Shares | Amount | Additional Paid in Capital | Accumulated Deficit | Total | ||||||||||||||||||||||
| Shares Issued to Founders for Services | 33,750,000 | $ | 3,375 | – | $ | – | $ | – | $ | – | $ | 3,375 | ||||||||||||||||
| Net loss for the period September 5, 2017 (inception) through December 31, 2017 | – | – | – | – | – | (12,107 | ) | (12,107 | ) | |||||||||||||||||||
| Balance, December 31, 2017 | 33,750,000 | $ | 3,375 | – | $ | – | $ | – | $ | (12,107 | ) | $ | (8,732 | ) | ||||||||||||||
| Shares issued for services | – | – | 1,900,000 | 190 | – | – | 190 | |||||||||||||||||||||
| Shares issued for cash | 38,700,000 | 3,870 | – | – | 58,905 | – | 62,775 | |||||||||||||||||||||
| Net loss for the year ended December 31, 2018 | – | – | – | – | (97,686 | ) | (97,686 | ) | ||||||||||||||||||||
| Balance December 31, 2018 | 72,450,000 | $ | 7,245 | 1,900,000 | $ | 190 | $ | 58,905 | $ | (109,793 | ) | $ | (43,453 | ) | ||||||||||||||
The accompanying notes are an integral part of these financial statements
| F-5 |
SMART DECISION, INC.
| For the Period From | ||||||||
| September 5, 2017 | ||||||||
| Year Ended | (Inception) to | |||||||
| December 31, 2018 | December 31, 2017 | |||||||
| Cash Flows from Operating Activities: | ||||||||
| Net Loss | $ | (97,686 | ) | $ | (12,107 | ) | ||
| Adjustments to reconcile net loss to net cash used in operating activities: | ||||||||
| Stock compensation | 190 | 3,375 | ||||||
| Changes in Operating Assets and Liabilities: | ||||||||
| Increase in accounts payable | 751 | – | ||||||
| Increase in accrued expenses | 27,494 | 5,500 | ||||||
| Increase in accrued interest | 1,450 | 41 | ||||||
| Net cash used in operating activities | (67,801 | ) | (3,191 | ) | ||||
| Cash Flows from Financing Activities: | ||||||||
| Loan proceeds from convertible debentures | 10,000 | 6,000 | ||||||
| Loan from related party | – | 1,200 | ||||||
| Proceeds from sale of common stock | 62,775 | – | ||||||
| Net cash provided by financing activities | 72,775 | 7,200 | ||||||
| Net Increase in cash | 4,974 | 4,009 | ||||||
| Cash at the Beginning of the Period | 4,009 | – | ||||||
| Cash at the End of the Period | $ | 8,983 | $ | 4,009 | ||||
| Supplemental Disclosure: | ||||||||
| Cash paid for interest | – | – | ||||||
| Income taxes paid | – | – | ||||||
The accompanying notes are an integral part of these financial statements
| F-6 |
SMART DECISION, INC.
DECEMBER 31, 2018 AND 2017
Note 1 – Nature of Operations and Basis of Presentation
Smart Decision, Inc. (the “Company”) was incorporated in the state of Wyoming on September 5, 2017. The Companyhas researched and developed an algorithm for the consumer and business LED Lighting Market. With the Company’s patent pending “Smart Decision” algorithm, consumers should be able to select the right LED bulbs/fixtures by answering a handful of consumer friendly questions. Ultimately, selecting the right product the first time dramatically cuts down on product returns for retailers and creates a positive purchasing experience for the consumer. The Company intends to develop additional algorithms for other consumer categories in the future.
Risks and Uncertainties
The Company has not commenced planned principal operations. Our activities since inception include devoting substantially all of our efforts to business planning development. Additionally, the Company has allocated a substantial portion of time and investment to the completion of our development activities to launch our marketing plan and generate revenues and to raising capital. The Company has generated no revenue from operations. The Company’s activities during this early stage are subject to significant risks and uncertainties.
Going Concern
The accompanying financial statements are prepared assuming the Company will continue as a going concern. At December 31, 2018, the Company had an accumulated deficit of $109,793, a stockholders’ deficit of $43,453 and a working capital deficiency of $43,453. In 2018, the Company had a net loss and cash used in operating activities of $97,686 and $67,801, respectively, and the Company has not generated any revenues as of the date of this report. These matters raise substantial doubt about the Company’s ability to continue as a going concern for a period of twelve months from the issue date of this report. The ability of the Company to continue as a going concern is dependent upon initiating sales and obtaining additional capital and financing. There is currently no public market for our common stock. While the Company believes in the viability of its strategy to initiate sales volume and in its ability to raise additional funds, there can be no assurances to that effect. The financial statements do not include adjustments to reflect the possible effects on the recoverability and classification of assets or the amounts and classification of liabilities that may result from the outcome of this uncertainty.
Note 2 - Summary of Significant Accounting Policies
This summary of significant account policies of the Company is presented to assist in understanding the Company’s financial statements. The financial statements and the notes are the representation of the Company’s management, who are responsible for their integrity and objectivity. These accounting policies conform to U.S. generally accepted accounting principles (“US GAAP”) and have been consistently applied in the preparation of the financial statements.
Use of Estimates
The preparation of financial statements in conformity with US GAAP requires management to make estimates and assumptions that affect reported amounts of assets and liabilities, disclosure of contingent assets and liabilities at the date of the financial statements, and the reported amounts of revenues and expenses during the reporting period. Actual results could differ from those estimates. Significant estimates in the accompanying financial statements include the valuation of stock compensation and the valuation of our deferred tax assets.
| F-7 |
SMART DECISION, INC.
NOTES TO FINANCIAL STATEMENTS
DECEMBER 31, 2018 AND 2017
Fair Value of Financial Instruments
For certain of the Company’s financial instruments, including cash and cash equivalents and accrued expenses, the carrying amounts approximate fair value due to their short maturities.
Cash and Cash Equivalents
Cash comprises cash held on demand with banks. The Company considers all highly liquid investments with original maturities of 90 days or less to be cash equivalents. There were no cash equivalents at December 31, 2018 and 2017.
Income Taxes
Deferred income taxes are provided using the liability method whereby deferred tax assets are recognized for deductible temporary differences and operating loss and tax credit carry-forwards, and deferred tax liabilities are recognized for taxable temporary differences. Temporary differences are the differences between the reported amounts of assets and liabilities and their tax bases. Deferred tax assets are reduced by a valuation allowance when, in the opinion of management, it is more likely than not that some portion or all of the deferred tax assets will not be realized. Deferred tax assets and liabilities are adjusted for the effects of the changes in tax laws and rates of the date of enactment.
When tax returns are filed, it is highly certain that some positions taken would be sustained upon examination by the taxing authorities, while others are subject to uncertainty about the merits of the position taken or the amount of the position that would be ultimately sustained. The benefit of a tax position is recognized in the financial statements in the period during which, based on all available evidence, management believes it is more likely than not that the position will be sustained upon examination, including the resolution of appeals or litigation processes, if any. Tax positions taken are not offset or aggregated with other positions. Tax positions that meet the more-likely-than-not recognition threshold are measured as the largest amount of tax benefit that is more than 50 percent likely of being realized upon settlement with the applicable taxing authority. The portion of the benefits associated with tax positions taken that exceeds the amount measured as described above is reflected as a liability for unrecognized tax benefits in the accompanying balance sheets along with any associated interest and penalties that would be payable to the taxing authorities upon examination.
Applicable interest and penalties associated with unrecognized tax benefits are classified as additional income taxes in the statements of operations.
Business segments
ASC 280,“Segment Reporting” requires use of the“management approach” model for segment reporting. The management approach model is based on the way a company’s management organizes segments within the company for making operating decisions and assessing performance. The Company determined it has one operating segment as of December 31, 2018 and 2017.
Fair Value Measurements
On September 5, 2017, the Company adopted ASC 820-10,“Fair Value Measurements and Disclosures.” ASC 820-10 defines fair value, and establishes a three-level valuation hierarchy for disclosures of fair value measurement that enhances disclosure requirements for fair value measures. The three levels of valuation hierarchy are defined as follows:
| F-8 |
SMART DECISION, INC.
NOTES TO FINANCIAL STATEMENTS
DECEMBER 31, 2018 AND 2017
Level 1 inputs to the valuation methodology are quoted prices for identical assets or liabilities in active markets.
Level 2 inputs to the valuation methodology include quoted prices for similar assets and liabilities in active markets, and inputs that are observable for the asset or liability, either directly or indirectly, for substantially the full term of the financial instrument.
Level 3 inputs to the valuation methodology are unobservable and significant to the fair value measurement.
The Company did not identify any recurring or non-recurring assets and liabilities that are required to be presented in the balance sheets at fair value in accordance with ASC 815.
Borrowings
Borrowings are recognized initially at cost which is the fair value of the proceeds received, net of transaction costs incurred or beneficial conversion feature values which are recorded as debt discounts. In subsequent periods, borrowings are stated at amortized cost using the effective yield method; any difference between fair value of the proceeds (net of transaction costs) and the redemption amount is recognized as interest expense over the period of the borrowings.
Stock-Based Compensation
The Company records stock-based compensation in accordance with the guidance in ASC Topic 718 which requires the Company to recognize expenses related to the fair value of its employee stock and stock option awards. The expenses are generally recognized over the requisite service periods.
Net Income per Share
The Company computes net loss per share in accordance with ASC 260-10,“Earnings Per Share.” The basic net loss per common share is computed by dividing the net loss by the weighted average number of common shares outstanding. Diluted net loss per share gives effect to all dilutive potential common shares outstanding during the period using the“as if converted” basis. For the periods ended December 31, 2018 and 2017 there were 160,000,000 and 60,000,000, respectively, potential dilutive securities related to convertible notes.
Recent Accounting Pronouncements
The Company has implemented all new accounting pronouncements that are in effect and that may impact its financial statements and does not believe that there are any other new accounting pronouncements that have been issued that might have a material impact on its financial position or results of operations.
Note 3 – Convertible note and note payable related party
Convertible Note and Note payable related party consist of the following at December 31
| 2018 | 2017 | |||||||
| Convertible note dated December 14, 2017, for $6,000, interest accruing at 10%, convertible at the lesser of (i) $0.0001 or (ii) Fifty percent of the lowest trading price in the twenty days prior to the day of conversion, and maturity date of December 14, 2018. Conversion at any date is limited to (i) the number of shares of common stock beneficially held by holder and its affiliates and (ii) 9.99% of outstanding shares of common stock of the company and the note is subject to customary default provisions and liquidated damages of $500 per day per default. On December 13, 2018 the maturity date of the note was extended to December 14, 2019. | $ | 6,000 | $ | 6,000 | ||||
| Convertible note dated March 22, 2018, for $20,000 ($10,000 received as of December 31, 2018), interest accruing at 10%, convertible at the lesser of (i) $0.0001 or (ii) Fifty percent of the lowest trading price in the twenty days prior to the day of conversion, and maturity date of March 22, 2019. Conversion at any date is limited to (i) the number of shares of common stock beneficially held by holder and its affiliates and (ii) 9.99% of outstanding shares of common stock of the Company and the note is subject to customary default provisions and liquidated damages of $500 per day per default. On March 21, 2019 the maturity date of the note was extended to March 22, 2020. | $ | 10,000 | $ | – | ||||
| Note payable – related party, dated October 29, 2017; interest accruing at 8%, maturity November 9, 2018. On November 8, 2018 the maturity date of the note was extended to November 9, 2019 | $ | 1,200 | $ | 1,200 | ||||
| Total | $ | 17,200 | $ | 7,200 | ||||
| Less current portion | $ | (17,200 | ) | $ | (7,200 | ) | ||
| Long term notes payable | $ | – | $ | – | ||||
| F-9 |
SMART DECISION, INC.
NOTES TO FINANCIAL STATEMENTS
DECEMBER 31, 2018 AND 2017
Note 4 – Commitments and Contingencies
On February 15, 2018 the Company entered into an employment agreement with the Company’s CEO. The term of the agreement is for five years and may be extended in one-year increments thereafter. Compensation under the agreement will include a base salary and an annual bonus as determined by the Board of Directors
On February 16, 2018 the Company entered into an employment agreement with the Company’s treasurer. The term of the agreement is for five years and may be extended in one-year increments thereafter. Compensation under the agreement will include a base salary and an annual bonus as determined by the Board of Directors.
On February 22, 2018 the Company entered into an employment agreement with a director of the Company. The agreement may be terminated at the option of the Company for “Cause,” as defined in the agreement. Compensation under the agreement will include a base compensation as determined by the disinterested Board of Directors.
On February 28, 2018 the Company entered into an employment agreement with a director of the Company. The agreement may be terminated at the option of the Company for “Cause,” as defined in the agreement. Compensation under the agreement will include a base compensation as determined by the disinterested Board of Directors.
Note 5 - Equity
On February 16, 2018 the Company amended its articles of incorporation to authorize 5,000,000,000 shares of Common Stock having a par value of $0.0001 and to divide its Common Stock into two classes: Class A and Class B. There are 4,900,000,000 designated shares of Class A and 100,000,000 designated shares of Class B. The shares of each class of Common Stock are identical except that the holders of the Class B Common Stock shall be entitled to elect a majority of the board of directors and the holders of the Class A shall elect the remainder of the directors. Each share of Class B Common Stock shall be convertible at any time into one share of Class A Common Stock at the option of the holder. The presentation of the authorized and designated shares has been retroactively applied to the balance sheet for the periods presented.
As part of the amendment the Company also added 1,000,000,000 shares of Preferred Stock having a par value of $0.0001 per share. The board of directors is expressly vested with the authority to fix and determine the relative rights and preferences of the shares of each series so established, however, that the rights and preferences of the various series may vary with only respect to the rate of dividend; whether the shares may be called and, if so, the call price and the terms and conditions of call; the amount payable upon the shares in the event of voluntary and involuntary liquidation; sinking fund provisions; the terms and conditions, if any, on which the shares may be converted; voting rights; and whether the shares will be cumulative, noncumulative, or partially cumulative as to dividends and the dates from which any cumulative dividends are to accumulate.
In September 2017 the Company granted 33,750,000 Class A common shares to two founders for services. The shares were valued at a nominal value of $0.0001 per share for a total of $3,375 which was charged to compensation expense. As of December 31, 2018 1,950,000 of those shares had not yet been issued by the transfer agent (see Note 8).
On February 6, 2018, the Board of Directors granted the Company’s CEO, 1,000,000 shares of Class B Common, and the Company’s, treasurer, 900,000 shares of Class B Common Stock valued at a nominal $0.0001 per share for services rendered, or $190.
In February 2018 the Company sold 32,750,000 Class A common shares for $0.0001 per share for proceeds of $3,275, and then 5,950,000 Class A Common shares in August through October 2018 for $0.01 per share totaling $59,500.
| F-10 |
SMART DECISION, INC.
NOTES TO FINANCIAL STATEMENTS
DECEMBER 31, 2018 AND 2017
Note 6 – Income Taxes Payable
As of December 31, 2018, the Company had approximately $109,354 in net operating loss carry forwards for federal income tax purposes of which $12,107 may be carried forward through 2037 and $97,247 may be carried forward indefinitely subject to annual usage limitations. Generally, these can be carried forward and applied against future taxable income at the tax rate applicable at that time. The Company is currently using a 21% effective tax rate for our projected available net operating loss carry-forward. The Company’s use of these NOLs may be limited under the provisions of Section 382 of the Internal Revenue Code of 1986, as amended.
Components of deferred tax assets and liabilities are as follows:
| December 31, 2018 | December 31, 2017 | |||||||
| Net Operating loss carryforward | $ | 26,848 | $ | 1,816 | ||||
| Valuation Allowance | $ | (26,848 | ) | $ | (1,816 | ) | ||
| Net Deferred Tax Assets | $ | 0 | $ | 0 | ||||
A reconciliation of the effective tax rate with the statutory Federal income tax rate was as follows for the year ended December 31, 2018:
| For the year ended December 31, 2018: | From September 5, 2017 (inception) to December 31, 2017: | |||||||
| Federal statutory rate | (21% | ) | (15% | ) | ||||
| State taxes, net of Federal benefit | (4.74% | ) | (6% | ) | ||||
| Permanent differences | 0.12% | 0 | ||||||
| Change in valuation allowance | 25.62% | 21% | ||||||
| Effective tax rate | 0% | 0% | ||||||
In accordance with FASB ASC 740 “Income Taxes”, valuation allowances are provided against deferred tax assets, if based on the weight of available evidence, some or all of the deferred tax assets may or will not be realized. The Company has evaluated its ability to realize some or all of the deferred tax assets on its balance sheet for the coming year and has established a valuation allowance in the amount of $26,848 at December 31, 2018. The valuation allowance increased in 2018 by $25,032.
Note 7 – Related Party Transactions
For the purposes of these financial statements, parties are considered to be related if one party has the ability to control the other party or exercise significant influence over the other party in making financial or operational decisions. In considering each possible related party relationship, attention is directed to the substance of the relationship, not merely the legal form.
Related parties may enter into transactions which unrelated parties might not, and transactions between related parties may not be effected on the same terms, conditions and amounts as transactions between unrelated parties.
On October 29, 2017 the Company entered into a loan agreement with an officer of the Company for $1,200. The terms of the note are disclosed in Note 3.
On February 6, 2018 LED Technology Group LLC, an affiliate, assigned its patent for a lighting apparatus with light-emitting diode chips and remote phosphor layer to the Company. On February 2, 2018 the CEO and Treasurer of the Company assigned their patent pending for a method for an LED product filtering engine to the Company. There was no consideration paid or due for those assignments.
| F-11 |
SMART DECISION, INC.
NOTES TO FINANCIAL STATEMENTS
DECEMBER 31, 2018 AND 2017
Note 8 – Subsequent Events
In April 2019, the founders, Adam Green and Eric Gutmann, contributed 1,050,000 and 900,000 Class A common shares back to the Company.
The Company has evaluated events subsequent to the balance sheet date through April 29, 2019 the date these financial statements were available to be issued and has determined there are no other events that would require adjustment to, or disclosure in, the financial statements.
| F-12 |
Index to Exhibits
__________________
| * | Previously filed with the Company’s Form 1-A filed with the SEC on March 23, 2018. |
| ** | Previously filed with the Company’s Form 1-A Amendment filed with the SEC on July 12, 2018. |
| *** | Previously filed with the Company’s Form 1-A Amendment filed with the SEC on July 31, 2018. |
| **** | Previously filed with the Company’s Form 1-A Amendment filed with the SEC on November 26, 2018. |
| 17 |
Pursuant to the requirements of Regulation A, the issuer has duly caused this Annual Report on Form 1-K to be signed on its behalf by the undersigned, thereunto duly authorized.
| Smart Decision, Inc. | |||
| Date: April 30, 2019 | By: | /s/ Adam Green | |
| Adam Green | |||
Chief Executive Officer (Principal Executive Officer) | |||
Pursuant to the requirements of Regulation A, this Annual Report on Form 1-K has been signed below by the following persons on behalf of the issuer and in the capacities and on the dates indicated.
| Smart Decision, Inc. | |||
| Date: April 30, 2019 | By: | /s/ Eric Gutmann | |
| Eric Gutmann | |||
Chief Financial Officer (Principal Financial Officer, Principal Accounting Officer) | |||
| 18 |