UNITED STATES
SECURITIES AND EXCHANGE COMMISSION
Washington, D.C. 20549
__________________________
FORM 10-K
__________________________
(Mark One)
| | | | | |
| x | ANNUAL REPORT PURSUANT TO SECTION 13 OR 15(d) OF THE SECURITIES EXCHANGE ACT OF 1934 |
For the fiscal year ended December 31, 2024
OR
| | | | | |
| o | TRANSITION REPORT PURSUANT TO SECTION 13 OR 15(d) OF THE SECURITIES EXCHANGE ACT OF 1934 |
For the transition period from_____to_____
Commission File Number 001-38636
__________________________
Garrett Motion Inc.
(Exact name of registrant as specified in its charter)
__________________________
| | | | | | | | |
| Delaware | | 82-4873189 |
(State or other jurisdiction of
incorporation or organization) | | (I.R.S. Employer
Identification No.) |
| | |
| 47548 Halyard Drive, Plymouth, MI 48170 |
| and |
| La Pièce 16, 1180 Rolle, Switzerland |
| (Address of Principal Executive Offices) (Zip Code) |
+1 734 392 5500
and
+41 21 695 30 00
(Registrant’s telephone number, including area code)
Securities registered pursuant to Section 12(b) of the Act:
| | | | | | | | |
| Title of each class | Trading Symbol(s) | Name of each exchange on which registered |
| Common Stock, $0.001 par value per share | GTX | The Nasdaq Stock Market LLC |
| | |
Securities registered pursuant to section 12(g) of the Act: None
Indicate by check mark if the registrant is a well-known seasoned issuer, as defined in Rule 405 of the Securities Act. Yes ☒ No ☐
Indicate by check mark if the registrant is not required to file reports pursuant to Section 13 or Section 15(d) of the Act. Yes ☐ No ☒
Indicate by check mark whether the registrant (1) has filed all reports required to be filed by Section 13 or 15(d) of the Securities Exchange Act of 1934 during the preceding 12 months (or for such shorter period that the registrant was required to file such reports), and (2) has been subject to such filing requirements for the past 90 days. Yes ☒ No ☐
Indicate by check mark whether the registrant has submitted electronically every Interactive Data File required to be submitted pursuant to Rule 405 of Regulation S-T (§232.405 of this chapter) during the preceding 12 months (or for such shorter period that the registrant was required to submit such files). Yes ☒ No ☐
Indicate by check mark whether the registrant is a large accelerated filer, an accelerated filer, a non-accelerated filer, a smaller reporting company, or an emerging growth company. See the definitions of “large accelerated filer,” “accelerated filer,” “smaller reporting company,” and “emerging growth company” in Rule 12b-2 of the Exchange Act.
| | | | | | | | | | | | | | |
| Large accelerated filer | ☒ | | Accelerated filer | ☐ |
| | | | |
| Non-accelerated filer | ☐ | | Smaller reporting company | ☐ |
| | | | |
| Emerging growth company | ☐ | | | |
If an emerging growth company, indicate by check mark if the registrant has elected not to use the extended transition period for complying with any new or revised financial accounting standards provided pursuant to Section 13(a) of the Exchange Act. ☐
Indicate by check mark whether the registrant has filed a report on and attestation to its management’s assessment of the effectiveness of its internal control over financial reporting under Section 404(b) of the Sarbanes-Oxley Act (15 U.S.C. 7262(b)) by the registered public accounting firm that prepared or issued its audit report. x
If securities are registered pursuant to Section 12(b) of the Act, indicate by check mark whether the financial statements of the registrant included in the filing reflect the correction of an error to previously issued financial statements. ☐
Indicate by check mark whether any of those error corrections are restatements that required a recovery analysis of incentive-based compensation received by any of the registrant’s executive officers during the relevant recovery period pursuant to §240.10D-1(b). ☐
Indicate by check mark whether the registrant is a shell company (as defined in Rule 12b-2 of the Act). Yes o No x
The aggregate market value of the voting and non-voting common equity held by non-affiliates of the registrant was approximately $1,077 million based on the closing price of its shares of Common Stock, par value $0.001 per share, on the Nasdaq Global Select Market on June 28, 2024, the last business day of the registrant’s second fiscal quarter.
Indicate by check mark whether the registrant has filed all documents and reports required to be filed by Sections 12, 13 or 15(d) of the Securities Exchange Act of 1934 subsequent to the distribution of securities under a plan confirmed by a court. Yes ☒ No ☐
As of February 14, 2025, the registrant had 205,009,801 shares of common stock, $0.001 par value, outstanding.
DOCUMENTS INCORPORATED BY REFERENCE
Portions of the Registrant’s definitive proxy statement relating to its 2025 annual meeting of shareholders (the “2025 Proxy Statement”) are incorporated by reference into Part III of this Annual Report on Form 10-K where indicated. The 2025 Proxy Statement will be filed with the U.S. Securities and Exchange Commission within 120 days after the end of the fiscal year to which this report relates.
BASIS OF PRESENTATION
Unless the context otherwise requires, references to “Garrett,” “we,” “us,” “our,” and “the Company” in this Annual Report on Form 10-K refer to Garrett Motion Inc. and its subsidiaries.
The accompanying consolidated financial statements of Garrett reflect the consolidated results of operations, financial position and cash flows of Garrett, in conformity with accounting principles generally accepted in the United States of America (“U.S. GAAP” or "GAAP").
Throughout this Annual Report on Form 10-K, we reference certain industry sources. While we believe the compound annual growth rate (“CAGR”) and other projections of the industry sources referenced in this Annual Report on Form 10-K are reasonable, forecasts based upon such data involve inherent uncertainties, and actual outcomes are subject to change based upon various factors beyond our control. All data from industry sources is provided as of the latest practicable date prior to the filing of this Annual Report on Form 10-K and may be subject to change.
| | |
| CAUTIONARY NOTE REGARDING FORWARD-LOOKING STATEMENTS |
This Annual Report on Form 10-K (this "Annual Report") and the other reports filed by us with the SEC from time to time, as well as statements incorporated by reference herein and related comments by our management, contain forward-looking statements within the meaning of the U.S. federal securities laws. All statements other than statements of historical fact, including, without limitation, statements regarding our future results of operations and financial position, expectations regarding the growth of the turbocharger and electric vehicle markets and other industry trends, the sufficiency of our cash and cash equivalents, anticipated sources and uses of cash, anticipated investments in our business, our business strategy, pending litigation, anticipated interest expense, and the plans and objectives of management for future operations and capital expenditures, are forward-looking statements. In many cases, you can identify forward-looking statements by terms such as “aim,” “anticipate,” “appears,” “approximately,” “believe,” “continue,” “could,” “designed,” “effect,” “estimate,” “evaluate,” “expect,” “forecast,” “goal,” “initiative,” “intend,” “may,” “objective,” “outlook,” “plan,” “potential,” “priorities,” “project,” “pursue,” “seek,” “should,” “target,” “when,” “will,” “would,” or the negative of these terms or other similar expressions. In making these forward-looking statements, we rely on our current expectations and projections about possible future events and financial trends that we believe may affect our business, financial condition and results of operations. We believe these judgments are reasonable, but these statements are not guarantees of any future events or financial results, and our actual results may differ materially due to a variety of important factors, many of which are beyond our control. These factors, which may be revised or supplemented in subsequent reports we file with the SEC, include, among other things, risks related to the following: (1) the ongoing evolution of the automotive industry; (2) the highly competitive markets in which we operate; (3) our reliance on sales to major customers; (4) changing industry and economic conditions; (5) the unique aspects of our aftermarket business; (6) pricing pressures from our original equipment manufacturer customers; (7) the foreign markets in which we operate; (8) climate change and increased scrutiny from customers, investors, regulators and other stakeholders; (9) recruitment, development, and retention of qualified personnel; (10) program launch difficulties; (11) volatility in the cost of raw materials, components, energy, transportation, and other inputs; (12) supply shortages or supplier distress leading to a disruption of our operations; (13) realization of sales from awarded business; (14) economic, political, regulatory, foreign exchange and other risks of our international operations; (15) geopolitical conditions, catastrophic events and pandemics; (16) joint venture partnerships, joint development projects and other strategic opportunities; (17) intellectual property rights; (18) work stoppages or other disruptions at our facilities; (19) realization of productivity and efficiency improvements and repositioning projects; (20) warranty claims, product recalls, field actions or product liability actions; (21) litigation, government proceedings and other contingencies and uncertainties; (22) environmental matters and liabilities; (23) third-party licensing arrangements; (24) information technology and data privacy considerations, including cybersecurity and other security concerns; (25) our substantial indebtedness and restrictive covenants related to such indebtedness; (26) tax considerations; (27) our ability to raise capital; (28) our pension funding obligations; (29) concentration of ownership of our equity securities; or (30) payment of dividends and share repurchases. For a further discussion of these and other risks, refer to Part I, Item 1A. “Risk Factors” of this Annual Report.
You should read this Annual Report and the documents that we reference herein completely and with the understanding that our actual future results may be materially different from those envisioned by these forward-looking statements. We qualify all of our forward-looking statements by these cautionary statements. These forward-looking statements speak only as of the date of this Annual Report. Except as required by applicable law, we do not plan to publicly update or revise any forward-looking statements contained herein, whether as a result of any new information, future events, changed circumstances or otherwise.
PART I
Item 1. Business
Our Company
Garrett is a cutting-edge technology leader delivering differentiated solutions for emission reduction and energy efficiency. We design, manufacture and sell highly engineered turbocharging, air and fluid compression, and high-speed electric motor technologies for original equipment manufacturers ("OEMs") and distributors within the mobility and industrial space.
We have significant expertise in delivering products at scale for internal combustion engines ("ICE") using gasoline, diesel, natural gas and hydrogen, as well as for zero-emission technologies using hydrogen fuel cell systems, both for mobility and industrial use. As our customers continue to progress on electrification, we are applying our technological pillars to develop highly engineered E-Powertrain and E-Cooling compressor products to support their ambition. These products are key enablers for fuel economy, energy efficiency, thermal management, and compliance with emissions standards and overall greenhouse gas and other emission-reduction targets.
Our growth strategy in zero-emission technologies is to focus on solving OEMs' pain points with existing technologies and bring differentiated technologies for traction (E-Powertrain) and thermal management (E-Cooling compressor), leveraging a unique set of technology pillars that are hard to replicate by competitors, such as high-speed motors and power electronics, controls software, oil-less bearings and system integration. These technology pillars have been developed by Garrett over the past decade and require significant and sustained research and development ("R&D") investments, and have resulted in the successful launch of E-Boosting and fuel cell compressor applications. They bring unique features to our offerings in terms of energy efficiency, lower weight and packaging requirements that are highly valued by our customers.
Our Industry
Overview
We provide cutting-edge technology for the mobility and industrial space, including light vehicles, commercial vehicles (which includes both on-highway and off-highway applications) and industrial applications. Our products include mechanical and electrical products for turbocharging and boosting internal combustion engines, as well as compressing air for fuel cell compressors, and compressing refrigerant for electric cooling compressors.
As of 2024, our primary source of sales is associated with the global turbocharger industry for gasoline, diesel and natural gas engines across light vehicle, commercial vehicle and industrial applications. Sales also come from E-Boosting solutions and hydrogen fuel cell compression solutions, already manufactured at scale.
At the same time, we have developed unique technological competencies, which we aim to continue leveraging to solve our customers’ energy-related challenges in the electrification evolution related to hybrids and electric powertrains. We are developing solutions and allocating our R&D spend appropriately, focusing more than 50% of total R&D expenditure in 2024 on zero-emission technologies, including for electrification, fuel cell compressors for a broad range of cell stack power (40kW to 250kW) and high-value electric vehicle components, including E-Powertrain and E-Cooling Compressor technologies. On turbocharger side, we keep investing to support our customers, especially for hybrids, while also expanding our portfolio range with the development of larger turbocharger aimed at off-highway applications.
Key trends affecting our industry
Current global economic conditions due to geopolitical conflicts, high inflation in Europe and China's slow pace of recovery, all have adversely affected and may continue to adversely affect many industries including the automotive sector.
Changes in overall vehicle production
Light vehicle production decreased by approximately 1% in 2024, compared to prior year. Commercial vehicle production experienced a decrease of almost 4% in 2024, with both the on-highway and off-highway segments decreasing by 5% and 4%, respectively. For 2025, Standard & Poor ("S&P") and KGP Automotive Intelligence ("KGP") expect a similar production to 2024 in the automotive (light vehicle and commercial vehicle) industry. Moreover, significant uncertainty remains around global economic growth, as the macroeconomic landscape continues to experience supply
chain disruptions, geopolitical tensions and economic uncertainties. The shift from pure gasoline and diesel ICE to hybridized powertrains is expected to continue in response to increasingly strict fuel efficiency and regulatory standards. In parallel, the share of pure electric vehicles is expected to continue to increase, with short-term dynamics, such as significant vehicle price gaps between electric vehicles and ICE-powered vehicles, and slower than anticipated charging infrastructure proliferation, limiting the pace of adoption.
Global vehicle fuel efficiency and emissions standards
OEMs are facing increasingly strict constraints for vehicle fuel efficiency and emissions standards globally. Regulatory authorities in key regions such as the United States, the European Union, China, Japan, and Korea have instituted regulations that require sustained and significant reductions in greenhouse gas (including CO2 and NOx) and particulate matter vehicle emissions. OEMs are required to evaluate and adopt various solutions to address these stricter standards. Turbochargers allow OEMs to reduce engine size without sacrificing vehicle performance, thereby increasing fuel efficiency and decreasing harmful emissions. Furthermore, turbochargers allow more precise “air control” over both engine intake and exhaust conditions such as gas pressures, flows and temperatures, enabling optimization of the combustion process. This combustion optimization is critical to engine efficiency, exhaust emissions, power and transient response and enables such concepts as exhaust gas recirculation for diesel engines and Miller-cycle operation for gasoline engines. Consequently, we believe turbocharging will continue to be a key technology for automakers to meet increasingly tough fuel economy and emissions standards without sacrificing performance.
Turbocharger penetration
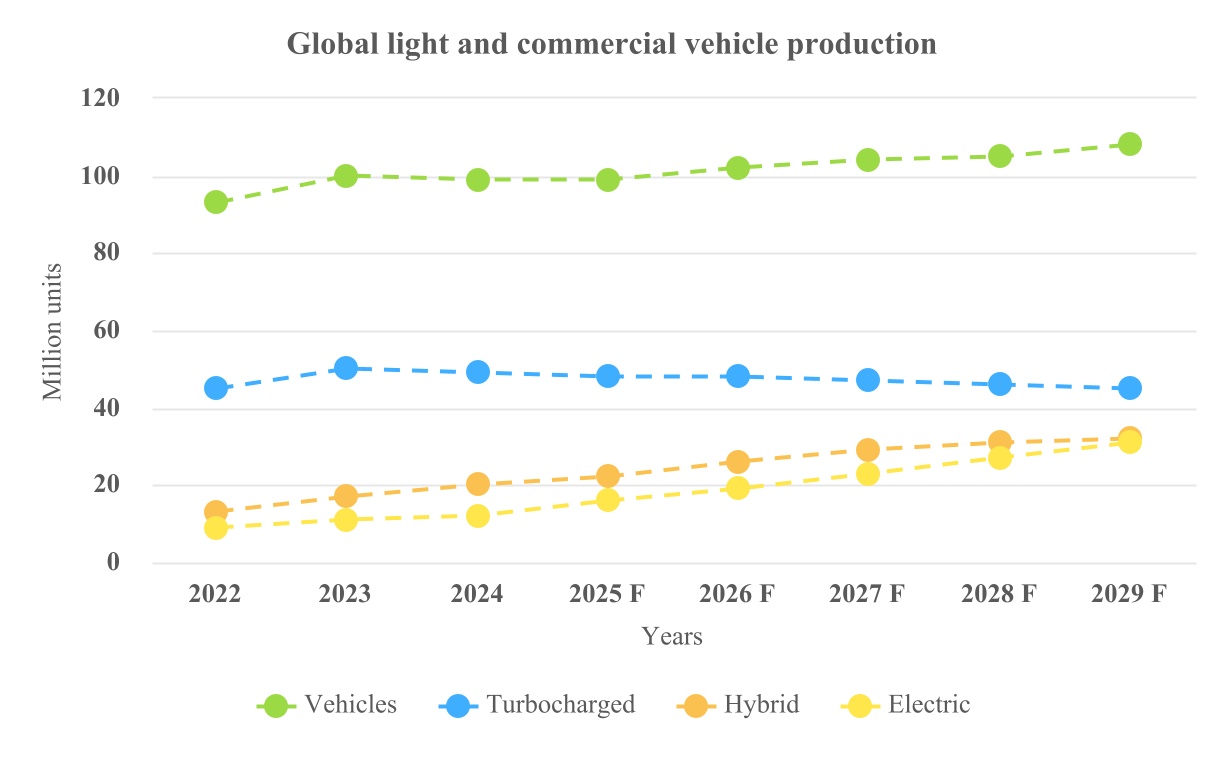
The utilization of turbochargers and electric-boosting technologies on vehicle powertrain systems is one of the most cost-effective solutions to address stricter standards, and OEMs are increasing their adoption of these technologies. Total turbocharger production decreased globally from approximately 50 million units in 2023 to 49 million units in 2024 and is expected to further decrease in 2025 and onward based on current expectations of electric vehicle penetration, gradually decreasing to 2022 volume levels by 2028. S&P forecasts turbocharger penetration on ICE-based powertrains to grow in light vehicles from 54% in 2022 to approximately 58% in 2028 and to then come back to approximately 54% in 2032.
Medium-Term Powertrain Trends
Note: Years 2022 - 2024 represent actual data and years 2025 - 2029 represent forecasted data.
Source: S&P, KGP
Electrification and hybrids
In order to address stricter fuel economy standards, OEMs also have been increasing the electrification of their vehicle offerings, primarily with the addition of hybrid powertrains equipped with a gasoline or diesel internal combustion engine in combination with an electric motor. S&P estimates that hybrid vehicles produced globally will grow from a total of approximately 20 million vehicles in 2024 to 31 million vehicles by 2028, representing a CAGR of 9%. The electrified powertrain of hybrid vehicles enables the usage of highly synergistic electric-boosting technologies, which augment standard turbochargers with electrically assisted boosting and electrical-generation capability. Furthermore, the application of electric boosting extends the requirement for engineering collaboration with OEMs to include electrical integration, software controls, and advanced sensing. Overall, the move to electric boosting further increases the role and value of turbocharging by improving vehicle fuel economy and reducing exhaust emissions.
Battery electric and fuel cell technologies
OEMs are investing in full battery electric vehicles ("BEVs") to comply with increasingly tight regulatory targets across regions. S&P and KGP expect that BEVs will comprise 22% of total light and commercial vehicle production globally by 2027. Consumer adoption hinges not only on future "cost of range," which is tightly linked to the energy capacity of the battery, but also on how well that energy is used. Energy efficiency increases (including how to best address thermal management challenges), battery price (and consequently vehicle price), weight reduction through increases in power density, and shorter recharging times are all critical problems to solve. As OEMs strive to solve these issues, they are increasing investment in hydrogen fuel cell-powered electric vehicles for demanding applications requiring longer ranges, especially in the commercial vehicle space. These vehicles, like battery electric vehicles, have fully electric motor powertrains, but they rely on the hydrogen fuel cell to generate the required electricity. The hydrogen fuel cell also requires advanced electric-boosting technology to run efficiently and optimize range and cost of ownership. We are investing to address selected opportunities, raised by the electrification trend, where our differentiated technology can bring benefits related to lighter, more compact and more energy efficient components for electric vehicles.
Our Products
We are a global leader in the $11 billion OEM turbocharger industry. We believe we will continue to benefit from global technology leadership in the turbocharger industry through our deep-seated relationships with global OEMs. Continuous product innovation to bring innovative and differentiated technologies for electric vehicles (E-Powertrain and E-Cooling compressors), fuel cell compressors and solutions beyond automotive are the new challenges we are embracing and pursuing.
Internal combustion light vehicle products
•Gasoline: The global adoption of turbochargers by OEMs on gasoline engines has increased rapidly from approximately 14% in 2013 to approximately 49% in 2024 and is forecasted by S&P to increase to 51% by 2025. In addition to the volume growth, tightening of CO2 regulations is driving a technology shift, moving away from standard waste gate technology to variable geometry turbo ("VNT") which is a premium technology that offers us technological competitive advantages. In 2016, we launched our first high-volume VNT gasoline application, and this technology is expected to experience increased adoption in years to come. According to a forecast by S&P, VNT represented 38% of global turbo gasoline production in 2024, and is expected to reach 60% by 2029. A key to our strategy for gasoline growth is thus to leverage our technological leadership in high-temperature materials and variable geometry, as well as our scale, global footprint and in-market capabilities to meet the technological demands of global OEMs.
•Diesel: We have a long history of technology leadership in diesel engine turbochargers. Despite the diesel industry's weakness for some vehicle segments, the majority of our diesel turbocharger revenues come from heavier and bigger vehicles like SUVs, pickup trucks and light commercial vehicles (such as delivery vans), which remain a stable part of the diesel industry. Diesel maintains a unique advantage in terms of fuel consumption, cost of ownership, and towing capacity which makes it the powertrain of choice for heavier vehicle applications. Diesel also remains essential for OEMs to meet their CO2 fleet average regulatory targets going forward, as diesel vehicles produce less CO2 on average than gasoline vehicles.
•Hybrid vehicles: We provide a comprehensive portfolio of turbocharger and electric-boosting technologies to manufacturers of hybrid-electric powertrains. OEMs have increased their adoption of hybrid technologies in
light of stricter regulatory standards. Similar to turbochargers for gasoline and diesel engines, turbochargers for hybrid vehicles are an essential component of maximizing fuel efficiency and overall engine performance. Our products provide OEMs with solutions that further optimize engine performance and position us well as they add more hybrid-electric vehicles into their fleets.
Internal combustion commercial vehicles & industrial products
Our Company traces its roots to the 1950s when we helped develop a turbocharged commercial vehicle for Caterpillar. We have maintained our strategic relationship with key commercial vehicle OEMs for over 70 years as well as industry-leading positions for both on- and off-highway use. Our products improve engine performance and enable lower emissions on trucks, buses, agriculture equipment, construction equipment and mining equipment with engine sizes ranging 1.8L to more than 100L. We continue to develop our product range to serve more engine needs, even beyond automotive. For example, we are expanding the application of our turbochargers to power generation, marine applications, and data centers.
Hydrogen fuel cell electric vehicles & industrial products
We provide a comprehensive range of electric air compressors to manufacturers of fuel cell systems. Our system consists of efficient, powerful, and lightweight air compressors using leading automotive technologies to boost fuel cell vehicles. Air supply is critical for performance, durability and hydrogen fuel consumption and range for applications equipped with hydrogen fuel cells. We launched the auto industry's first fuel cell production car application in 2016. We now provide a comprehensive portfolio of fuel cell air compressors covering a broad range of fuel cell stack power from 30kW to 250+kW and we launched our third generation of fuel cell products in 2024.
Electric (battery electric and hydrogen fuel cell electric) vehicles & industrial products
Leveraging a set of unique technological building blocks, we are now offering to our customers disruptive solutions for electric traction (E-Powertrain) and electric thermal management (E-Cooling compressor) that can enhance an application’s energy efficiency in a reduced packaging space and with significant weight savings. Our customers have taken note of these products, and we are engaged in a number of pre-development programs with OEMs in all regions.
Aftermarket and performance products
Our Garrett aftermarket brand has strong recognition across distributors and garages globally, and is known for boosting performance, quality and reliability. We operate through a distribution network of more than 340 distributors covering 165 countries. Our aftermarket business has historically provided a stable stream of revenue supported by our large installed base, currently estimated at nearly 140 million vehicles. As turbocharger penetration rates continue to increase, we expect that our installed base and aftermarket opportunities will continue to grow. We are also working to broaden our portfolio with our Remanufactured (REMAN) offering in Europe, the Middle East and Africa and North America which so far has increased our portfolio with over 300 additional applications, and at the same time provides the additional benefit of utilizing recovered parts while maintaining our required quality standards (by using original components and original assembly processes in our REMAN workshops).
Our Competitive Strengths
We believe that we differentiate ourselves through the following competitive strengths:
•Differentiated and innovative technology in, and beyond, mobility
•Strong and collaborative relationships with leading OEMs globally
•Global and low-cost manufacturing footprint with operational excellence
Differentiated and innovative technology in, and beyond, mobility
We have led the revolution in turbocharging technology over the last 60 years and maintain a leading technology portfolio of approximately 1,300 patents and patents pending. We have a globally deployed team of approximately 1,400 engineers across five R&D centers and nine close-to-customer engineering centers. Our engineers have led the mainstream commercialization of several leading turbocharger innovations, including variable geometry turbines, dual-boost compressors, ball-bearing rotors, electrically actuated controls, and air-bearing electric compressors for hydrogen fuel cells. We maintain a culture of continuous product innovation, introducing about ten new technologies per year and upgrading our existing key product lines approximately every three years. At the end of 2023, we announced an expansion of our
turbocharger portfolio to serve large bore engines used in industrial applications, including marine, power generation and other machinery. In 2024, we delivered the first prototypes of our new industrial applications to a key OEM. Outside of our turbocharger product lines, we apply this culture of continuous innovation to meet the needs of our customers in new areas. We are developing solutions and increasing our R&D spend, focusing almost 60% of total research, development and engineering expenditures in 2024, on zero-emission technologies for mobility and beyond, such as fuel cell compressors for a broad range of cell stack power (40kW to 250kW) and high-value electric products including E-Powertrain and E-Cooling compressor technologies.
Strong and collaborative relationships with leading OEMs globally
We supply our products to more than 60 OEMs globally. Our top ten customers accounted for approximately 62% of net sales and our largest customer represented approximately 12% of our net sales in 2024. With over 60 years in the turbocharger industry, we have developed strong capabilities working with major OEMs around the world. We consistently meet their stringent design, performance and quality standards while achieving capacity and delivery timelines that are critical for customer success. Our track record of successful collaborations, as demonstrated by our strong client base and our ability to successfully launch multiple product applications annually, is well recognized. Our regional research, development and manufacturing capabilities are a key advantage in helping us to supply OEMs as they expand geographically and shift towards standardized engines and vehicle platforms. With regards to new technology offerings for zero-emission vehicles, our proven track record in bringing innovation to production is a key decision factor for our customers to engage in joint technology assessments through pre-development projects with Garrett.
Global and low-cost manufacturing footprint with operational excellence
Our geographic footprint locates R&D, engineering and manufacturing capabilities close to our customers, enabling us to tailor technologies and products for the specific vehicle types sold in each geographic industry. In all regions where we operate, we leverage low-cost sourcing through our robust supplier development program, which continually works to develop new suppliers that are able to meet our specific quality, productivity and cost requirements. We now source more than two-thirds of our materials from low-cost countries and believe our high-quality, low-cost supplier network to be a significant competitive advantage. We have invested heavily to bring differentiated local capabilities to our customers in high-growth regions, including China and India.
In 2024, we manufactured more than 87% of our products in low-cost countries, including seven manufacturing facilities in China, India, Mexico, Brazil, Romania and Slovakia. We have a long-standing culture of lean manufacturing excellence and continuous productivity improvement. We believe global uniformity and operational excellence across facilities is a key competitive advantage in our industry given that OEM powertrain platforms are often designed centrally but manufactured locally, requiring suppliers to meet the exact same specifications across all locations.
Our Strategy
Garrett invests in innovative technologies that address the needs of our customers in the ongoing auto industry transformation. This continued investment into differentiated technology, coupled with our relentless focus on customer relationships and our global capabilities, allows us to drive the following business strategies:
•Strengthen our leadership in the turbocharger industry within the light vehicle, commercial vehicle and industrial space;
•Leverage our differentiated technology to solve key challenges for zero-emission vehicles; and
•Grow our aftermarket business
Strengthen our leadership in the turbocharger industry within the light vehicle, commercial vehicle and industrial space
We are focused on strengthening our industry position in the light vehicle, commercial vehicle and industrial turbocharger industries:
•Light vehicle gasoline turbochargers, which have historically lagged the adoption of diesel turbochargers, after reaching a peak in 2024, are now expected to decrease at a roughly 2% annual CAGR from 2024 to 2027, according to S&P. We have launched the first modern 1.5L VNT gasoline application with a major OEM and expect to see increasing adoption of this technology in the future years. A major key to our strategy for gasoline growth is our plan to leverage our strengths in high temperature materials and variable geometry technologies as well as our scale, global footprint and in-region capabilities to meet the volume demands of global OEMs. This also includes E-Boosting solutions.
•The commercial vehicle (including both on- and off-highway applications) and industrial spaces remain a focus for us, considering its slower shift to electric, and the increasing need for higher energy efficiency and productivity. We continue to invest in turbocharger technology upgrades, including for new types of fuels for ICE, like hydrogen. We also are expanding our portfolio with the launch of new frame sizes aimed at serving larger engines, mostly used in marine and power generation verticals.
Leverage our differentiated technology to solve key challenges for zero emission vehicles
We stand to benefit from the increased adoption of electric (battery or fuel cell) vehicles. S&P estimates that the global production of electrified vehicles (battery and fuel cell electric) will increase from approximately 12 million vehicles in 2024 to approximately 26 million vehicles by 2028, representing an annualized growth rate of approximately 20%. To solve current challenges in terms of range, vehicle cost and performance, OEMs will need technologies enabling step changes in energy efficiency, weight and packaging and thermal management. We expect to continue to invest in product innovation and new technologies, and by leveraging our capabilities and expertise to develop selected offerings for electric vehicles, we believe that we are well positioned to remain a technology leader in the field of electrified vehicles. In particular, we have already developed a full portfolio of fuel cell compressors and we are in the pre-development phase with some of our customers for differentiated E-Powertrain and E-Cooling compressor solutions.
Grow our aftermarket business
We have an opportunity to strengthen our global network of more than 340 distributors in 165 countries by deepening our channel penetration, by leveraging our well-recognized Garrett brand, by utilizing new online technologies for customer engagement and sales, like our Installer Connect program (a global web-based platform providing self-service tools for garage technicians which generated nearly 16,000 additional technicians certified in 2024), and by widening our product portfolio with an expansion initiative on large industrial turbos, for which we plan to onboard certified Service Centers to support these Industrial End customers in the years to come.
Research, Development and Intellectual Property
We maintain technical engineering centers in major automotive production regions of the world to develop and provide advanced products, processes and manufacturing support to all of our manufacturing sites, and to provide our customers with local engineering capabilities and design developments on a global basis. As of December 31, 2024, we employed approximately 1,400 engineers. Our total R&D expenses were $187 million, $175 million and $153 million for the years ended December 31, 2024, 2023 and 2022, respectively, with more than 50% of our total R&D spend in 2024 focused on zero-emission technologies. Additionally, the Company incurred engineering-related expenses, net of customer reimbursements, which are also included in Cost of goods sold of $(26) million, $(12) million and $11 million for the years ended December 31, 2024, 2023 and 2022, respectively. Customer reimbursements included in engineering-related expenses amounted to $67 million, $46 million and $25 million for the years ended December 31, 2024, 2023 and 2022, respectively.
We currently hold approximately 1,300 patents and patents pending. Our current patents are expected to expire between 2025 and 2044. While no individual patent or group of patents, taken alone, is considered material to our business, taken in the aggregate, these patents provide meaningful protection for our intellectual property.
Materials
The most significant raw materials we use to manufacture our products are grey iron, aluminum, stainless steel and a nickel-, iron- and chromium-based alloy. As of December 31, 2024, we have not experienced any significant shortage of raw materials and we or our suppliers (on our behalf) do not typically carry inventories of such raw materials in excess of those reasonably required to meet our production and shipping schedules.
Our Customers
Our global customer base includes most light vehicle commercial vehicle OEMs, including top global OEMs. Our ten largest applications in 2024 were with six different OEMs. OEM sales were approximately 85% of our 2024 revenues while our aftermarket and other products contributed 15%.
Our largest customer is Bayerische Motoren Werke AG (“BMW”). In 2024, 2023 and 2022, BMW accounted for 12%, 12%, and 12%, respectively, of our total sales. In 2024, 2023 and 2022, our sales to Ford Motor Company (“Ford”), our second largest customer, were 10%, 9%, and 10%, respectively, of our total sales.
Supply relationships with our customers
We typically supply products to our OEM customers through “open” purchase orders, which are generally governed by terms and conditions negotiated with each OEM. Although the terms and conditions vary from customer to customer, they typically contemplate a relationship under which our customers are not required to purchase a minimum amount of product from us. These relationships typically extend over the life of the related engine platform. Prices are negotiated with respect to each business award, which may be subject to adjustments under certain circumstances, such as commodity or foreign exchange escalation/de-escalation clauses or for cost reductions achieved by us. The terms and conditions typically provide that we are subject to a warranty on the products supplied. We may also be obligated to share in all or a part of recall costs if the OEM recalls its vehicles for defects attributable to our products.
Individual purchase orders are terminable for cause or non-performance and, in most cases, upon our insolvency and certain change of control events. In addition, many of our OEM customers have the option to terminate for convenience on certain programs, which permits our customers to impose pressure on pricing during the life of the vehicle program, and issue purchase contracts for less than the duration of the vehicle program, potentially reducing our profit margins and increasing the risk of losing future sales under those purchase contracts. We manufacture, and ship based on customer release schedules, normally provided on a weekly basis, which can vary due to cyclical automobile production or inventory levels throughout the supply chain.
Although customer programs typically extend to future periods, and although there is an expectation that we will supply certain levels of OEM production during such future periods, customer agreements including applicable terms and conditions do not necessarily constitute firm orders. Firm orders are generally limited to specific and authorized customer purchase order releases placed with our manufacturing and distribution centers for actual production and order fulfilment. Firm orders are typically fulfilled as promptly as possible from the conversion of available raw materials, sub-components and work-in-process inventory for OEM orders and from current on-hand finished goods inventory for aftermarket orders. The dollar amount of such purchase order releases on hand and not processed at any point in time is not believed to be significant based upon the time frame involved.
Regulatory and Environmental Compliance
We are subject to the requirements of environmental and health and safety laws and regulations in each country in which we operate. These include, among other things, laws regulating air emissions, water discharge, hazardous materials and waste management. We have an environmental management structure designed to facilitate and support our compliance with these requirements globally. Although it is our intent to comply with all such requirements and regulations, we cannot provide assurance that we are at all times in compliance. Environmental requirements are complex, change frequently and have tended to become more stringent over time. Accordingly, we cannot assure that environmental requirements will not change or become more stringent over time or that our eventual environmental costs and liabilities will not be material.
Certain environmental laws assess liability on current or previous owners or operators of real property for the cost of removal or remediation of hazardous substances. At this time, we are involved in various stages of investigation and clean-up related to environmental remediation matters at certain of our present and former facilities. In addition, there may be soil or groundwater contamination at several of our properties resulting from historical, ongoing or nearby activities.
As of December 31, 2024, the undiscounted reserve for environmental investigation and remediation was $16 million. We do not currently possess sufficient information to reasonably estimate the amounts of environmental liabilities to be recorded upon future completion of studies, litigation or settlements, and we cannot determine either the timing or the amount of the ultimate costs associated with environmental matters, which could be material to our consolidated results of operations and operating cash flows in the periods recognized or paid. However, considering our past experience and existing reserves, we do not expect that environmental matters will have a material adverse effect on our consolidated financial position.
Corporate Responsibility
Our sustainability approach
Garrett is a cutting-edge technology leader delivering differentiated solutions for emission reduction and energy efficiency. We are passionate about innovating for mobility and beyond. With a 70-year legacy, we serve customers worldwide with passenger vehicle, commercial vehicle, aftermarket replacement, and performance enhancement solutions.
Garrett’s mission to deliver differentiated solutions for emission reduction and energy efficiency is at the heart of our contribution to society. Our engineering expertise and transformative technologies help optimize fuel efficiency, reduce emissions and manage growing vehicle complexity, all of which are critical areas on the road to a clean transportation future. Garrett's technologies enable sustainable automotive and industry transformation.
Our corporate sustainability framework starts from our mission by spearheading technology development and continuing to deliver industry-first innovations for mobility and beyond. It is built on two main pillars - investing in a culture of innovation and operating responsibly to ensure long-term impact.
Sustainability is embedded in our governance structure. Our Sustainability Committee, composed of the CEO and several members of Garrett’s senior leadership team, is sponsored by our Chief Technology Officer and oversees our sustainability strategy development, definition and deployment. Our Board of Directors, including through its committees, provides oversight of our environment, social and governance ("ESG") activities, corporate responsibility and sustainability strategy. Primary responsibility at the Board level for reviewing and reporting to the full Board on our sustainability programs and policies, as well as our corporate citizen commitments, resides with the Nominating & Governance Committee.
Garrett articulates its commitments to social, environmental and governance considerations in the communities in which it operates in the Company’s Code of Business Conduct, which can be found on our website at www.garrettmotion.com. The Company published its fiscal year 2023 Sustainability Report in 2024, the content of which is not incorporated by reference into this Annual Report or in any other report or document we file with the SEC.
Human Capital
At Garrett, we place a high value on developing the right working environment and skill sets to advance our performance culture, support our growth strategy and ensure that the world at large can continue to benefit from breakthroughs in sustainable mobility. We invest in creating an inclusive, stimulating, and safe work environment where our employees can deliver their workplace best every day. As of December 31, 2024, we employed approximately 7,000 employees globally, with 6,600 on a permanent basis and 400 on a temporary basis. We also had an additional 2,000 workers contracted through third party agencies.
Diversity and inclusion
Diversity and inclusion is one of Garrett’s four fundamentals for how we operate. As such, we strive to ensure that our employees are each involved, supported, respected and connected. Embracing diverse thoughts and ideas through inclusion leads to a competitive advantage in the market, increased innovation as we generate new and better ideas, and customer-centric decision making. We pride ourselves that diversity is represented from the top of the organization, for example 26 different nationalities are represented in our senior management team and they bring with them a wide variety of different backgrounds and experiences. Overall, in our global workforce we have representation of approximately 60 different nationalities.
In 2024, the Company continued to strengthen and develop its approach to diversity and inclusion, and successfully deployed new Employee Resource Groups ("ERGs") across the organization. These include the Garrett Women Network, the Cultural Mosaic, the LGBTQI+ and the Diverse Abilities ERGs.
Actions during the year included:
•Holding regular reviews of our diversity initiatives in each of the countries where we operate
•Supporting our team comprised of Diversity and Inclusion Champions to help them develop local diversity and inclusion initiatives. Thanks to their continuous engagement, more than 15 local new ERGs cover now all three regions, and every region covering all three new ERGs (not including Garrett Women’s Network)
•Raising awareness during Pride Month by recognizing the challenge and educating about the topic through training sessions
•Creating dialogue through local activities on the aspects of LGBTQI, diverse ability and cultural differences
•Training for all managers on Unconscious Bias (more than 1,000 employees completed the training)
•Holding Garrett’s annual Diversity and Inclusion Week in December 2024.
In 2024, the percentage of female employees in Garrett was 22.6%. The percentage of female employees in salaried roles was 26.3% and the percentage of female employees in senior management roles was 22.4%. We strive over the long-term to reach a gender diversity ambition of 25%.
The table below shows the evolution of our gender diversity representation over the last three years:
| | | | | | | | | | | | | | | | | | | | | | |
| | | | 2022 | | 2023 | | 2024 |
| % Women in total workforce | | | | 21.8% | | 22.8% | | 22.6% |
| % Women in salaried workforce | | | | 25.8% | | 26.6% | | 26.3% |
| % Women in senior management | | | | 19.0% | | 19.5% | | 22.4% |
As of December 31, 2024, Garrett's Board of Directors had 22% female representation.
Talent management
At Garrett, we encourage our employees to develop their skills and capabilities through a comprehensive Performance and Talent Management system. From annual goal setting and performance reviews to learning opportunities for employees and leaders, the Company helps its people align their professional experience with the Company’s business objectives and encourages them to take ownership of their development and career paths.
Our learning environment offers employees access to approximately 3,200 online trainings that address a wide range of functional competencies, technical skills, and human skills. Learning can be self-paced, while the Company’s growing online peer-to-peer learning communities also allow employees to easily access courses specific to their function and to share materials and ideas on topics of interest. A variety of instructor led virtual programs were deployed during 2024 to support employees' development and a number of dedicated programs for emerging and experienced leaders were successfully held. More than 86,200 hours of training were delivered during 2024.
We use regular talent reviews to strengthen the Company’s internal development processes and to calibrate assessment of individual performance. Twice per year, we hold succession planning meetings up to and including the executive level, during which the bench-strength of teams are scrutinized and development plans for their talent are reviewed. Ahead of both annual and mid-year performance reviews, leaders hold calibration meetings to ensure that assessment ratings are consistent and fair amongst peer groups. To support our strategy and objectives, in 2023 we implemented a skills intelligence system. This system, enabled by artificial intelligence, can detect known and hidden capabilities of our employees. We expect this system will support us in identifying efficient paths of upskilling, reskilling and hiring for our future needs.
Be well, work well
Health and safety
World-class health and safety considerations are integrated into Garrett’s procedures and processes. Our management system aligns with the global standard ISO 45001 (and ISO 14001 and ISO 50 001) and provides protection of human health and safety during normal and emergency situations. Compliance with our standards and local regulatory requirements is monitored through a company-wide self-assessment process assured through annual audits. In 2024 we continued a rolling 4-year compliance audit against local regulations by a global service provider. The timely development and implementation of process improvement and corrective action plans, including any improvements identified through our local regulatory compliance audits, are closely monitored.
Our safety incident numbers remain low compared to industry when measured by our Total Case Incident Rate (“TCIR”) at 0.11 for 2024. TCIR is measured as the number of recordable injuries multiplied by 200,000 and then divided by the total number of hours worked by employees.
Compensation and benefits
Garrett’s rewards programs are rooted in our “Be well, work well” principle, and aim to support employees in achieving the right work-life balance. We invest significant time and resources in establishing compensation programs that are both competitive and equitable. We constantly evaluate our positions for market competitiveness and adjust, when necessary, with the goal of ensuring the retention of top talent and continuation of equitable pay practices.
As part of our commitment to the well-being of our employees, the Company offers an Employee Assistance Program. It is an external counselling service designed to assist employees with personal, family, or workplace matters. This service is confidential and is also available to each employee’s dependents.
Employee feedback, representation, and retention
Garrett’s Performance and Talent Management system aims to ensure that two-way dialogue is ongoing between employees and managers, punctuated by both an annual and a mid-year review, which provides employees the opportunity to express their opinions and ideas in terms of their development goals and career aspirations.
Garrett’s strategy is to build positive, direct, business-focused working relationships with all employees in order to drive business results. The Company respects employees’ rights and their wish to be part of employee representative bodies including unions, work councils and employee forums. The Company understands the value of collective bargaining in its labor and employee relations strategy and the importance of trust in its working relationships. Approximately 40% of the Company’s permanent employees (including both full-time and part-time employees) are represented by unions and works councils under current collective bargaining agreements.
The Company closely monitors employee turnover to measure retention and define improvement actions as and where necessary. As of December 31, 2024, the Company’s annual voluntary turnover for 2024 was 10.1%, which reflects the trends of the current global marketplace for talent. Garrett has developed a full set of actions to maximize retention that are carried out at both a global and local level, with line managers as well as functional leaders held accountable for their employee turnover performance. We intend to continue to work diligently on this area to mitigate against the challenges of a highly competitive global marketplace for talent.
Educating future innovators
Garrett places a high value on STEM research and learning opportunities that provide young people with the skills needed to develop the future of sustainable mobility. The Company sponsors higher education institutes in several countries to further critical research in technical areas and provide students with opportunities to study STEM programs.
Garrett’s Internship Programs enable students to connect theoretical knowledge with practical responsibilities in the spirit of ‘living laboratories,’ during which they are encouraged to take ownership of business projects and define tactics to meet the project goals. In 2024, Garrett welcomed 322 Interns in 13 countries, versus 205 internships in 2023 (approximately 44% in Engineering, 26% in Integrated Supply Chain, 11% in IT and the remainder in Finance, HR, Marketing, Aftermarket, Sales and Legal).
In 2024, Garrett onboarded 15 graduates into our Graduate Program in China and India to join existing Graduate Program cohorts moving through their rotational cycles and to gain experience and exposure to Garrett's cutting-edge technologies while at the same time building their leadership skills in a fast-paced and professional work environment.
In 2024, the Company sponsored 6 Formula SAE and Formula Student teams in several countries providing the students in the racing team with over 8 technical workshops in electrical powertrain, leadership coaching, parts for the racing vehicle and financial support. Garrett sponsored the Formula SAE event in the U.S., the Formula Student race in Hungary and the Formula Student race in the Czech Republic, where our experts worked as technical judges, provided technical support and awarded 3 EV Formula Student University teams with the Garrett E-Powertrain Innovation award. During 2024, the Company shared its growth vision with over 3,000 students and over 400 female engineers and automotive enthusiasts. The Company also sponsored the European BEST Engineering Competition, the biggest international competition in Central Europe.
The Garrett student programs hires over 120 students globally to support challenging projects in multiple engineering fields providing an enriching growth experience for potential future Garrett employees. The Company also supports local Universities globally with master thesis projects, class speakers and technical sharing events. Garrett is involved in the community supporting STEM activities for high schools worldwide and in 2024, Garrett sponsored a high school team from the Czech Republic competing in hydrogen-powered racing. The Company continues to enhance the engagement with
global organizations with a focus on growing diversity interest in STEM and automotive engineering as well as intern and full time recruiting.
Garrett works closely with leading Universities globally on over 20 collaboration projects that push the envelope of technical innovation.
Seasonality
Our business is typically moderately seasonal. Our primary North American customers historically reduce production during the months of July and December; our European customers generally reduce production during the months of July, August and December; and our Chinese customers often reduce production during the period surrounding the Chinese New Year. Shut-down periods in the rest of the world generally vary by country. In addition, automotive production is traditionally reduced in the months of July, August and September due to the launch of parts production for new vehicle models. Accordingly, our results reflect this seasonality. Our sales predictability in the short term might also be impacted by sudden changes in customer demand, driven by our OEM customers’ supply chain management.
We also typically experience seasonality in cash flow, as a relatively small portion of our full-year cash flow is typically generated in the first quarter of the year and a relatively large portion in the last quarter. This seasonality in cash flow is mostly caused by timing of supplier payments for capital expenditures, changes in working capital balances related to the sales seasonality discussed above, and incentive payments.
Additional Information
Our Annual Reports on Form 10-K, including this Annual Report, our Quarterly Reports on Form 10-Q, Current Reports on Form 8-K, as well as all amendments and other reports filed with or furnished to the SEC, are also available free of charge on our internet site at https://www.garrettmotion.com as soon as reasonably practicable after we electronically file such material with, or furnish it to, the SEC. The contents of our internet site are not incorporated by reference into this Annual Report. The SEC maintains a website at SEC.gov that contains reports, proxy and information statements, and other information regarding issuers that file with the SEC, including our Company.
Item 1A. Risk Factors
You should carefully consider the risks described below, which could materially adversely affect our business, financial condition and results of operations. These risks are not the only risks facing our Company. Risks and uncertainties not currently known to or anticipated by us or that we currently deem immaterial may also adversely affect our business, prospects, financial condition and results of operations.
Risks Relating to our Business and Strategy:
The automotive industry is evolving and if we do not deliver new products and technologies in response to changing customer needs and preferences, our business could suffer.
Our continued success depends on our ability to innovate to meet or exceed the needs of our customers. The automotive industry is increasingly focused on improved vehicle efficiency and reduced emissions, including through the development of hybrid and full-battery electric vehicles, largely driven by increasingly stringent government regulations related to emissions and changing consumer preferences, and we expect this trend to continue. Increased public awareness and concern regarding global climate change may result in even more local, regional and/or federal requirements to reduce or mitigate the effects of greenhouse gas emissions further, and several markets in which we operate are already undertaking efforts to ban internal combustion vehicles altogether. While this trend presents an opportunity for increased incorporation of turbochargers into internal combustion engine ("ICE"), hybrid and fuel-cell based vehicles in the medium-term as original equipment manufacturers ("OEMs") seek to reduce emissions from their existing product portfolios, demand may shift away from the types of vehicles where our turbochargers generate higher profit margins and towards the types of vehicles where our turbochargers generate smaller profit margins, and in the longer-term may shift toward vehicles where no turbocharger is needed, such as with battery electric vehicles. Conversely, if emissions regulations are weakened, postponed or repealed, demand for emissions-reducing technologies, such as turbochargers, may be negatively impacted. If we are unable to respond to changes in the technological needs of our customers, if a transition to battery electric vehicles is pursued more broadly or is implemented more rapidly than we have anticipated, or if we overestimate the turbocharger penetration rate in ICE, hybrid, or fuel-cell-based vehicles in the medium-term, our results of operations and financial condition could be adversely affected.
In addition, in response to the ongoing evolution in the automotive industry and the anticipated shift toward zero-emission vehicles, we have made, and we expect to continue to make, significant investments in technologies supporting zero-emission vehicles, including fuel cell compressors and high value electric vehicle components, including E-Powertrain and E-Cooling Compressor technologies. Many of these new technologies are in the pre-development stage and there is no guarantee that they will be successful. Further, investment in these new technologies is dependent on the profits generated from our turbocharger business; reduced demand for our turbochargers could impact our ability to invest in these new technologies. If we are required to make more significant investments than expected, if consumer demand for zero-emission vehicles fails to develop or develops more slowly than expected or if competition for electrification technologies is more intense than we expect, our business, financial condition and results of operations may be materially adversely affected.
We operate in a highly competitive market.
We compete globally with several other manufacturers and distributors that produce and sell turbochargers, and we face intense competition in the development of technologies for electrification and other zero-emission solutions. Our competitors include independent regional and international suppliers as well as vertically integrated units of major OEMs. We compete with start-ups, which may be well-funded with more operational and financial flexibility than we have, and with competitors that are larger than we are, which may have greater financial and other resources than we do. If we face increased competition or if any of our competitors more accurately respond to market developments, develop products that are superior to our products, produce similar products at a cost that is lower than our cost, or adapt more quickly than we do to new technologies or evolving customer needs, we may not be able to compete successfully and our business, financial condition, and results of operations may be materially adversely affected.
We rely on sales to major customers, and we could be adversely impacted by the loss of any such major customers, changes in their requirements for our products or changes in their financial condition.
In 2024, our top ten customers accounted for approximately 62% of our net sales and our largest customer accounted for approximately 12% of our net sales. Changes in our business relationships with any of our major customers or in the timing, size and continuation of their various programs could have a material adverse impact on our business. We may lose major customers due to factors beyond our control, including due to mergers and acquisitions. Additionally, while we continually bid on new business with our existing customers and continually seek to diversify our customer base, there is no assurance that our efforts will be successful. The loss of any of these customers, the loss of business with respect to one or more of their vehicle models on which we have high component content, or a significant decline in the production levels of such vehicles would negatively impact our business, results of operations and financial condition. Further, to the extent that the financial condition of our largest customers deteriorates, our financial position and results of operations could be adversely affected.
Industry and economic conditions, including any economic downturns, could adversely affect our business and results of operations.
We are dependent on the continued growth, viability and financial stability of our customers, a substantial portion of whom are OEMs in the automotive industry, which is sensitive to general economic conditions and other factors, such as consumer confidence and preferences, inflation, tax rates, interest rates and fuel costs, as well as industry-specific conditions, such as rapid technological change often driven by regulatory changes, vigorous competition, short product life cycles, supplier stability, factory transitions and capacity concerns. Economic and industry conditions have had, and will continue to have, an impact on our business, whether directly or indirectly through our customers and suppliers. Furthermore, the regional concentration of our sales may exacerbate the impact of regional economic conditions on our results of operations, including in China, where we conduct a significant portion of our sales, and which has recently experienced low inflation and a deterioration of the job market. Economic declines that result in significant reductions in automotive sales or production, particularly with respect to light vehicles, or the failure to recover from such economic declines on timelines that we anticipate, would have an adverse effect on our business, results of operations and financial condition.
Our aftermarket business is subject to unique risks.
Sales in our aftermarket operations are directly related to consumer demand and spending for automotive aftermarket products, which may be affected by factors outside of our control, such as the average useful life of OEM parts and components, severity of regional weather conditions, highway and roadway infrastructure deterioration and the average number of miles vehicles are driven by owners. Given the relative importance of our off-highway after market business,
trends in agriculture, mining, oil and gas and construction can influence our aftermarket demand as well. Improvements in technology and product quality are extending the longevity of vehicle component parts, which may result in delayed or reduced aftermarket sales. Our results of operations and financial condition could be adversely affected by these trends, including if we fail to respond in a timely and appropriate manner to changes in the demand for our aftermarket products.
Additionally, we rely upon a network of independent dealers to manage the distribution of our aftermarket products. We rely on the capability of our independent dealers to develop and implement effective sales plans to create demand among purchasers for the equipment and related products and services that the dealers purchase from us. In addition, the dealer channel’s ability to support and service precision technology solutions and emerging power solutions may affect customers’ acceptance and adoption rates of these products. If our dealers are not successful in these endeavors, then we will be unable to grow our sales and revenue, which would have an adverse effect on our financial condition. Furthermore, these dealers may have trouble funding their day-to-day operations, and we or they may seek to terminate our existing relationships. The unplanned loss of any of our dealers could lead to inadequate market coverage or negative customer impressions of us and may adversely impact our ability to collect receivables that are associated with that dealer.
We may not be able to successfully negotiate favorable pricing and other terms with our customers, which may adversely affect our results of operations.
There is substantial and continuing pressure on OEMs to reduce costs, including the costs of the products we supply. Our customer supply agreements typically require step-downs in component pricing over the period of production. In addition, our customers often reserve the right to terminate their supply contracts at any time, which enhances their ability to obtain price reductions. OEMs have also exercised significant influence over their suppliers, including us, because the automotive component supply industry is highly competitive and serves a limited number of customers. Based on these factors, our status as a Tier I supplier (one that supplies vehicle components directly to manufacturers) and the fact that our customers’ product programs typically last several years and are anticipated to encompass large volumes, our customers are often able to negotiate favorable pricing and other terms, and any cost-cutting initiatives that our customers adopt generally will result in increased downward pressure on our pricing. The resulting impacts to our sales levels and margins could significantly reduce our revenues and adversely affect our competitive standing and prospects.
We have invested substantial resources in specific foreign markets where we expect growth, and we may be unable to timely alter our strategies should such expectations not be realized.
We have identified certain countries, such as China and India, as key high-growth geographic markets. We believe these markets are likely to experience substantial long-term growth, and accordingly have made and expect to continue to make substantial investments in manufacturing operations, technical centers, R&D activities and other infrastructure to support anticipated growth in these areas. If market demand for evolving vehicle technologies in these regions does not grow as quickly or materialize as we anticipate, or if we are unable to deepen existing and develop additional customer relationships in these regions, we may fail to realize expected rates of return or incur losses on our existing investments and may be unable to timely redeploy the invested capital to take advantage of other markets or product categories, potentially resulting in lost market share to our competitors. In particular, our ability to remain competitive and continue to grow in these regions depends in part on the absence of competing state-sponsored domestic businesses. If a state-sponsored operation entered a local market as a competitor, it might have access to significant social and financial capital that would enable it to overcome the ordinary barriers to entry in our industry and acquire potentially significant market share, likely at our expense. Further, continued trade tensions and other geopolitical concerns, particularly in China, may require us to shift our operations away from these countries. All of the foregoing could have adverse effect on our business, results of operations, cash flows and financial condition.
We are subject to risks associated with climate change and increased scrutiny from customers, investors, regulators and others regarding our sustainability practices.
Many customers, regulators, investors, employees, and other stakeholders are increasingly focused on sustainability practices, including environmental and social considerations, relating to our businesses and industry, particularly with regards to climate change and greenhouse gas emissions, human and civil rights, and diversity, equity and inclusion. Responding to these considerations and implementing related goals and initiatives involve risks and uncertainties, require investments and depend in part on third-party performance or data that is outside of our control. We cannot guarantee that we will achieve announced goals and initiatives or that our stakeholders will agree with and support them. Additionally, certain organizations have developed rating systems for evaluating companies on their approach to sustainability, and unfavorable ratings may lead to negative customer and/or investor sentiment. Furthermore, our practices may be judged against sustainability standards that are continually evolving and not always clear, and prevailing sustainability standards,
expectations and regulations may also reflect contrasting or conflicting values or agendas. Any failure, or perceived failure, by the Company to achieve these goals, further these initiatives, adhere to its public statements, comply with federal, state or international environmental, social and governance laws and regulations, or meet evolving and varied stakeholder expectations and standards could result in legal and regulatory proceedings against the Company and materially adversely affect the Company’s business, reputation, results of operations and financial condition.
In particular, there is increased public awareness and concern regarding global climate change and climate-related risks, which has resulted, and is expected to continue to result, in increased local, regional and global regulations concerning environmental practices, including requirements to reduce and/or mitigate the effects of greenhouse gas emissions, as well as requirements to make disclosures regarding greenhouse gas emissions, climate-related matters such as enterprise risks, climate-related targets and otherwise, such as those recently adopted in California and Europe, including the Carbon Border Adjustment Mechanism and the Corporate Sustainability Reporting Directive. There continues to be a lack of consistent climate regulation across the jurisdictions in which we operate, which creates economic and regulatory uncertainty. Any future regulations aimed at mitigating climate change may negatively impact the prices of raw materials and energy as well as the demand for certain of our customers' products, which could in turn impact demand for our products and our results of operations. The costs of compliance and any changes to our operations mandated by new or amended regulations, or customer requirements, may be significant. Furthermore, any violations of climate change regulations may result in substantial fines and penalties, remediation costs, damages, or other adverse impacts on our business. Part of our strategy to address these risks includes our investment in technologies supporting zero-emission products, which presents additional risks. See “The automotive industry is evolving, and if we do not deliver new products and technologies in response to changing customer needs and preferences, our business could suffer.” Additionally, we may also be required to make changes at the level of our sourcing and production processes, including due to demands of, and commitments to carbon neutrality or net zero by, automotive OEMs. This could require us to incur additional costs in the form of investments needed to make our products and production processes compliant with such requirements.
Furthermore, the physical manifestations of climate change, such as extreme weather conditions or more frequent extreme weather events have in the past, and may in the future, disrupt our operations, damage our facilities, disrupt our supply chain, including our customers and/or suppliers, impact the availability and cost of materials needed for manufacturing or increase insurance and other operating costs, any of which could have a material adverse effect on our operating results, cash flows or financial condition.
The success of our business depends on the recruitment, development and retention of qualified personnel.
Due to the complex nature of our business, our performance is highly dependent on our ability to recruit, hire, retain and develop talented and diverse employees who are highly skilled in their areas, particularly with respect to key areas, such as engineering, manufacturing, marketing, sales and senior management. Competition for qualified personnel in our industry is intense, and we may not be successful in attracting or retaining qualified personnel. In addition to compensation considerations, current and potential employees are increasingly placing a premium on culture and other various intangibles, such as working for companies with a clear purpose, flexible work arrangements, and other considerations. The loss of key employees, our inability to attract new qualified employees or adequately train new employees, or any delay in hiring or replacing key personnel, could disrupt our operations and negatively affect our business, financial condition and results of operations.
Risks Related to our Operations:
Our profitability and results of operations may be adversely affected by program launch difficulties.
The launch of new programs and product lines is a complex process, the success of which depends on a wide range of factors, including the production readiness of our manufacturing facilities and manufacturing processes and those of our suppliers, as well as factors related to tooling, equipment, employees, product quality and other considerations. Our failure to successfully launch new businesses, or our inability to accurately estimate the cost to design, develop and launch new businesses, could have an adverse effect on our profitability and results of operations. In particular, to the extent we are not able to timely and successfully launch new programs and product lines, our customers may be required to delay or shut down vehicle production, which could result in significant financial penalties to the Company, a diversion of personnel and financial resources and/or our customers awarding business to a competitor, any of which could have an adverse effect on our profitability and cash flows.
Volatility in the cost and availability of raw materials, components, energy, transportation and other inputs has increased, and may continue to increase, our costs.
We have experienced, and may continue to experience, volatility in the cost and availability of raw materials, components, energy, transportation and other inputs as a result of a broad range of factors beyond our control, including, but not limited to, global pandemics, disruptions in the global supply chain, persistently high inflation and interest rates, new or higher tariffs and geopolitical tensions. There is no guarantee that we will be able to pass through these increased costs to our customers, or are otherwise unable to mitigate these cost increases, it could have an adverse effect on our results of operations and financial condition.
Shortages of components from our suppliers, or economic distress experienced by any of our suppliers, could result in the disruption of our operations and could impact our ability to meet commitments to our customers.
Short- or long-term capacity constraints, insufficient quality control, financial distress or significant changes in business conditions at any point in our supply chain could disrupt our operations and adversely affect our financial performance, particularly when the affected suppliers and vendors are the sole sources of products that we require or that have unique capabilities, or when our customers have directed us to use those specific suppliers and vendors. Our ability to manage inventory and meet delivery requirements may be constrained by our suppliers’ inability to scale production and adjust delivery of long-lead time products during times of volatile demand. If our third-party manufacturers fail to deliver products, parts and components of sufficient quality on time and at reasonable prices, we could have difficulties fulfilling our orders on similar terms or at all, sales and profits could decline, and our commercial reputation could be damaged. If we fail to adequately assess the creditworthiness and operational reliability of existing or future suppliers, if our suppliers become insolvent, if there is any unanticipated deterioration in their creditworthiness and operational reliability, or if they do not perform or adhere to our existing or future contractual arrangements, any resulting increase in non-performance by them, our inability to otherwise obtain the supplies or our inability to enforce the terms of the contract or seek other remedies could have a material adverse effect on our financial condition and results of operations.
Furthermore, a significant portion of our supply chain is concentrated in mainland China and, as a result, our ability to continue filling our supply needs may be adversely affected by changes in, or our failure to comply with, Chinese laws, regulations and standards, and by political risks beyond our control, including but not limited to, trade policies, treaties, government regulations and new or higher tariffs. Our inability to fill our supply needs, on terms that we expect or at all, would jeopardize our ability to fulfil obligations under our commercial contracts and could result in reduced sales and profits, contract penalties or terminations, and damage to customer relationships.
We may not realize sales represented by awarded business or effectively utilize our manufacturing capacity.
When we win a bid to provide products and services to an OEM customer, the customer typically does not commit to award us its business until a separate contract has been negotiated, generally with a term ranging from one year to the life of the model (usually three to seven years). Once business has been awarded, the OEM customer typically retains the ability to terminate the arrangement without penalty and does not commit to purchase a minimum volume of products while the contract is in effect. As a result, the volume and timing of sales to our customers may vary significantly due to: (i) variation in demand for, and the success of, our customers’ products; (ii) our customers’ attempts to manage their inventory; (iii) design changes; (iv) changes in our customers’ manufacturing strategies; and (v) consolidation among our customers. A significant decrease in demand for certain key models or a group of related models sold by any of our major customers, or the ability of a manufacturer to re-source its requirements for a particular model or group of models, could have a material adverse effect on our business and financial condition.
In addition, we may be unable to forecast the level of customer orders with sufficient certainty to allow us to optimize production schedules and maximize utilization of manufacturing capacity. If actual production orders from our customers are significantly lower than the projections we use in calculating the amount of our awarded business, we could realize substantially less revenue over the life of these projects than the projected estimate, and if we are unable to mitigate the resulting underutilization of our manufacturing lines, the increased fixed costs relative to our revenues could have an adverse effect on our profitability and results of operations. Similarly, our inability to adapt to any increased production or desired inventory levels (including as a result of accelerated launch schedules for new customer platforms), comply with customer specifications and manufacturing requirements more generally or respond to other unexpected demand changes, could result in financial penalties, increased costs, loss of sales, loss of customers or potential breaches of customer contracts, any of which could have a material adverse effect on our profitability and results of operations.
We are subject to the economic, political, regulatory, foreign exchange and other risks of our international operations.
We operate within a geographic footprint that emphasizes locating R&D, engineering and manufacturing capabilities in close physical proximity to our customers and in regions with relatively lower costs than more developed markets. This international geographic footprint subjects us to many risks, including those related to: exchange control regulations; wage
and price controls; intellectual property protections; antitrust and environmental regulations; employment regulations; data privacy and data protection regulations; foreign investment laws; monetary and fiscal policies and protectionist measures that may prohibit acquisitions or joint ventures, establish local content requirements, or impact trade volumes; import, export and other trade restrictions (such as embargoes) and tariffs; anti-corruption and anti-bribery laws; transactions with state-owned enterprises; nationalization of private enterprises; natural and man-made disasters, hazards and losses; global health risks and pandemics; backlash from foreign labor organizations related to our repositioning actions; violence, civil and labor unrest; acts of terrorism; and our ability to hire and maintain qualified staff and maintain the safety of our employees throughout our operations. For example, certain of the markets in which we operate have adopted increasingly strict data privacy and data protection requirements or may require local storage and processing of data or similar requirements, such as the General Data Protection Regulation (“GDPR”) in the European Union. The GDPR and similar data protection measures may increase the cost and complexity of our ability to deliver our services to ensure compliance. In addition, due to our position as a market leader in the turbocharger industry in many of the markets in which we operate, we could face allegations of abuse of our market position or of collusion with other market participants, which could result in negative publicity and adverse regulatory action by the relevant authorities, including the imposition of monetary fines, which could adversely affect our financial condition and results of operations.
Trade tensions have in the past, and may in the future, negatively impact our business. We may not be able to mitigate the impacts of any new or higher tariffs, and our business, results of operations and financial position would be materially adversely affected by such tariffs. Further changes in U.S. trade policies, tariffs, taxes, export restrictions or other trade barriers, and any related responses from affected countries to any new or expanded U.S. trade barriers, or restrictions on raw materials or components may limit our ability to produce products, increase our manufacturing costs, decrease our profit margins, reduce the competitiveness of our products, or inhibit our ability to sell products or purchase raw materials or components, which could have a material adverse effect on our business, results of operations and financial condition. For example, the U.S. government has recently threatened to impose new tariffs on imported products from Mexico, Canada and China. Although the impact of these tariffs on our business is subject to a number of unknown factors, including the size, effective date and duration of such tariffs, future changes in the scope and nature of the tariffs, any retaliatory responses to such tariffs taken by the target countries, and the effectiveness of any mitigating actions that may be available to us, due to our meaningful operations in China and Mexico, the impact may be significant. These and other instabilities and uncertainties arising from the global geopolitical environment and the recent U.S. elections, along with the cost of compliance with increasingly complex and often conflicting regulations worldwide, can impair our flexibility in modifying product, marketing, pricing or other strategies for growing our businesses, as well as our ability to improve productivity and maintain acceptable operating margins.
Additionally, a significant portion of our revenues and expenses are denominated in currencies other than the U.S. dollar. As a result, we are subject to foreign currency risks and foreign exchange exposure arising from our business operations including, but not limited to, international financing activities between subsidiaries, foreign currency denominated monetary assets and liabilities and transactions arising from international trade. Our results of operations and financial condition have in the past been negatively impacted, and may in the future be negatively impacted, by rapidly fluctuating foreign exchange rates. While we have historically hedged foreign currency exposures and utilized foreign currency exchange forward contracts, we cannot guarantee the future success of such programs. Furthermore, a significant source of the funds attributable to Garrett Motion Inc. are derived from distributions from our non-U.S. subsidiaries. Certain countries in which we operate have adopted or could institute currency exchange controls that limit or prohibit the Company’s local subsidiaries' ability to convert local currency into U.S. Dollars or to make payments outside the country. This could subject the Company to the risks of local currency devaluation and business disruption. We regularly monitor our foreign currency exchange exposure and often seek to reduce such foreign currency risk through hedging activities; however, foreign exchange hedging activities bear a financial cost and may not always be available to us or be successful in eliminating such volatility.
Geopolitical conditions, catastrophic events and pandemics may disrupt our business and adversely affect our results of operations and financial condition.
Geopolitical tensions, including armed conflict, such as the armed conflicts in Ukraine and the Middle East, terrorist activity or general economic disruption or instability, have in the past impacted, and may in the future impact, our operations and create or exacerbate certain risks we face to our business, financial condition and results of operations. For example, Russia’s invasion of Ukraine and the global response, including the imposition of financial and economic sanctions by the United States and other countries, has led to supply constraints that have impacted, and may continue to impact, our business. It has also led to energy shortages globally, especially in Europe. A further prolonged or intensified conflict could result in acute shortages of raw materials and price inflation on transportation costs, materials, and energy, which in turn may adversely impact our supply chain. If the conflict expands beyond Ukraine, it could negatively impact
our operations in neighboring countries. Furthermore, an escalation of geopolitical tensions due to the ongoing conflict, such as increased sanctions or restrictions on global trade, could result in further supply chain disruptions, reduced customer demand, state-sponsored cyberattacks or increased volatility in the financial markets, all of which could have a materially adverse impact on our business and operations.
In addition, catastrophic events, such as a pandemic or large-scale cyberattacks, could lead to disruption or failure of our systems or operations, harming our ability to conduct normal business operations. For example, the Covid-19 pandemic negatively impacted the global economy, disrupted supply chains and created significant volatility and disruption in financial markets, adversely impacting our business and operations including our employees, customers, suppliers, partners and communities. Prolonged negative impacts of such events on global supply chains, general macroeconomic conditions and consumer confidence, could have an adverse effect on our business, results of operations, cash flows and financial condition.
We face risks in connection with joint venture partnerships, joint development projects and other strategic opportunities.
We are engaged in many strategic business relationships and regularly evaluate strategic opportunities, including acquisitions of businesses, products and technologies, joint venture partnerships, and joint development agreements that we believe may complement our business. We may not be able to successfully identify suitable acquisition and joint venture candidates, complete transactions on acceptable terms, integrate acquired operations into our existing operations, or realize potential benefits and synergies from a transaction. Our failure to identify suitable strategic opportunities may restrict our ability to grow our business or expand into new markets. Furthermore, our joint venture, joint development and other business partners may have goals, strategies, priorities, and business incentives that are inconsistent with ours, which could negatively impact the success of the strategic relationship.
Failure to protect our intellectual property, or allegations that we have infringed on the intellectual property of others, could adversely affect us.
We rely on a combination of patents, copyrights, trademarks, tradenames, trade secrets and other proprietary rights, as well as contractual arrangements, including licenses, to establish, maintain and protect our intellectual property rights. Effective intellectual property protection may not be available, or we may not be able to acquire or maintain appropriate registered or unregistered intellectual property, in every country in which we do business. Furthermore, in some areas of our business, the maturity of the industry and product technology may leave limited opportunity for differentiation. Accordingly, our intellectual property may not be sufficient on its own to provide us with a competitive advantage, which in turn could weaken our ability to secure business awards from our customers and/or our ability to achieve targeted product profitability.
Protecting our intellectual property may require us to spend significant amounts of money. Further, the steps we take to protect our intellectual property may not adequately protect our rights or prevent others from infringing, violating or misappropriating our intellectual property rights. Any impairment of our intellectual property rights, including due to changes in U.S. or foreign intellectual property laws or the absence of effective legal protections or enforcement measures, could adversely impact our businesses, financial condition and results of operations.
International technical export control regulations and trade conflicts may limit our ability to use certain intellectual property in our products in some regions of the world, or customers may require assured access to intellectual property through open source-code, joint ownership of intellectual property, free license, or other measures. These constraints could cause us difficulty in securing business awards from our customers, protecting our competitive technology differentiation, and/or our ability to achieve targeted product profitability.
In addition, as we adopt new technology, we face an inherent risk of exposure to the claims of others that we have allegedly violated their intellectual property rights. Successful claims that we infringe on the intellectual property rights of others could require us to enter into royalty or licensing agreements on unfavorable terms or cause us to incur substantial monetary liability. We may also be prohibited from further use of the intellectual property in question or be required to change our business practices to stop the infringing use, which could limit our ability to compete effectively. In addition, our customer agreements may require us to indemnify the customer for infringement. The time and expense of defending against these claims, whether meritorious or not, may have a material adverse impact on our profitability, can be time-consuming and costly and may divert management’s attention and resources away from our business. Furthermore, the publicity we may receive as a result of infringing intellectual property rights may damage our reputation and adversely impact our existing customer relationships and our ability to win new business.
Work stoppages, other disruptions, or the need to relocate any of our facilities could significantly disrupt our business.
Our geographic footprint emphasizes locating engineering and manufacturing capabilities in close physical proximity to our customers and in regions with relatively lower costs than more developed markets, thereby enabling us to adopt technologies and products for the specific vehicle types sold in each geographic market and to manage costs. We are therefore subject to risks inherent in operating in various jurisdictions at a local level. In particular, a work stoppage or other disruption at any of our facilities in a given region could have a material adverse effect on our business, especially insofar as it impacts our ability to serve our customers. Our production in each of our markets is heavily dependent upon our local manufacturing capabilities, and so if we are forced to relocate our operations from our existing facilities to new facilities due to unforeseen circumstances or factors beyond our control, we will incur substantial costs, experience program delays and sacrifice proximity to customers and geographic markets as a result, potentially for an extended period of time, each of which could cause a material adverse effect on our business.
The automotive industry relies heavily on “just-in-time” delivery of components during the assembly and manufacture of vehicles, and when we fail to make timely deliveries to our customers in accordance with our contractual obligations, we generally have to absorb our own costs for identifying and solving the “root cause” of the problem as well as expeditiously producing replacement components or products. We typically must also carry the costs associated with “catching up,” such as overtime and premium freight. Additionally, if we are the cause for a customer being forced to halt production, the customer may seek to recoup its losses and expenses from us. These losses and expenses could be significant and may include consequential losses, such as lost profits.
In addition, a significant disruption in the supply of a key component due to a work stoppage or other disruption at one of our suppliers could impact our ability to make timely deliveries to our customers and, accordingly, have a material adverse effect on our financial results. Further, if a customer halts production because of one of its other suppliers failing to deliver on time, it is unlikely we will be fully compensated, if at all. In addition, many of our major customers have union contracts throughout their operations, and any extended work stoppage or other disruption at one or more of our customers could have an adverse effect on our business.
Failure to achieve productivity and efficiency improvements or successfully execute repositioning projects may reduce our profitability or adversely impact our business.
Our profitability and margin growth are dependent upon, among other things, our ability to drive efficiency improvements throughout our organization. In addition, we seek productivity and cost savings benefits through repositioning actions and projects, such as consolidation of manufacturing facilities, transitions to cost-competitive regions, workforce reductions, asset impairments, product line rationalizations and other cost-saving initiatives. Risks associated with these actions include potential delays in execution of planned initiatives, additional unexpected costs, failure to fully realize expected productivity improvements and adverse effects on employee morale. We may not realize the full operational or financial benefits we expect, the recognition of these benefits may be delayed and these actions may potentially disrupt our operations. In addition, organizational changes, attrition, labor relations difficulties, or workforce stoppages could impact our efforts to improve operational efficiencies, which could have a material adverse effect on our business, reputation, financial position and results of operations.
We may incur material losses as a result of warranty claims, product recalls or field actions, as well as product liability actions that may be brought against us or our customers.
We face the risk of warranty and product liability claims, as well as product recalls and field actions, if our products actually or allegedly fail to perform to specifications or cause property damage or personal injury or death. There can be no assurance that we will have adequate reserves to cover any such recall, repair or replacement costs. In the event that any of our products fails to perform as expected, we may face direct exposure to warranty and product liability claims or may be required to participate in government or self-imposed field actions or recalls involving such products. Depending on the terms under which we supply products to our auto manufacturer customers, we may be required to guarantee or offer warranties for our products and to bear the costs of field actions, recalls, repair or replacement of such products pursuant to new vehicle warranties. Additionally, if our auto manufacturer customers face claims or recalls of their own, they may seek contribution from us. Our agreements with our customers do not always include limitation of liability clauses or, in certain situations or legal jurisdictions, such limitation of liability clauses may not fully protect us from all losses. If any such claims or contribution requests exceed our available insurance, or if there is a product recall, there could be a material adverse impact on our results of operations and could negatively impact our reputation. In addition, a recall claim could require us to review our entire product portfolio to assess whether similar issues are present in other product lines, which could result in significant disruption to our business and result in increased costs. There can be no assurance that we will not experience any material warranty or product liability claim losses in the future or that we will not incur significant costs to defend such claims.
We cannot predict with certainty the outcome of litigation matters, government proceedings and other contingencies and uncertainties.
In the normal course of our business, we are from time to time party to various lawsuits, investigations and disputes arising out of our current and historical business. These proceedings may relate to commercial transactions, product liability, prior acquisitions and divestitures, employment, employee benefits plans, intellectual property, antitrust, import and export, and environmental, health and safety matters, as well as securities litigation, tax proceedings and litigation related to our debt. For additional information regarding our pending legal proceedings, see Item 3, “Legal Proceedings.” We cannot predict with certainty the outcome of legal proceedings or contingencies. The costs incurred in litigation can be substantial and result in the diversion of management’s attention and resources.
We have also made, and in the future may make, certain commitments, including representations, warranties and indemnities relating to current and past operations, including those related to divested businesses, and issue guarantees of third-party obligations. Our potential liabilities are subject to change over time due to new developments in legal proceedings or changes in settlement strategy, and we may become subject to, or be required to pay, damage awards or settlements that could have a material adverse effect on our results of operations, cash flows and financial condition. If we were required to make such payments, these payments could be significant and could exceed the amounts we have therefore accrued for such matters, adversely affecting our business, financial condition and results of operations. While we maintain insurance for certain risks, the amount of our insurance coverage may not be adequate to cover the total amount of all insured claims and liabilities. The occurrence of significant liabilities for which there is no or insufficient insurance coverage could adversely affect our results of operations, cash flows, liquidity and financial condition.
Our operations and the prior operations of predecessor companies may expose us to the risk of environmental liabilities.
We are subject to extensive environmental regulations and our operations may expose us to risks of environmental liabilities. There can be no assurance that we will not incur additional liabilities related to the investigation and cleanup of environmental hazards and to claims of personal injuries or property damage that may arise from hazardous substance releases and exposures, including those relating to activities of our predecessor company or companies that we have acquired or may acquire from time to time. We are also subject to potential liabilities related to the compliance of our operations with the requirements of various federal, state, local and foreign governments that regulate the discharge of materials into the environment and the generation, handling, storage, treatment and disposal of, and exposure to, hazardous substances. If we are found to be in violation of these laws and regulations, we may be subject to substantial fines and criminal sanctions and be required to install costly equipment or make operational changes to achieve compliance with such laws and regulations. In addition, changes in laws, regulations or government enforcement of policies concerning the environment, the discovery of previously unknown contamination or new information related to individual contaminated sites, the establishment of stricter state or federal toxicity standards with respect to certain contaminants, or the imposition of new clean-up requirements or remedial techniques, could require us to incur additional currently unanticipated costs in the future that would have a negative effect on our financial condition or results of operations.
Our emerging opportunities in technology, products and services depend in part on intellectual property and technology licensed from third parties.
While the majority of our current product offerings are not covered by third-party licenses, many of our emerging technology offerings use software components or other intellectual property licensed from third parties, including through proprietary and open-source licenses. Should such emerging products become a significant part of our product offerings, our reliance on third-party licenses may present various risks to our business, including the risk that our ability to access these third-party technologies could be interrupted, or the technologies could become obsolete, defective or incompatible with future versions of our emerging technology offerings. We may be unable to reach or renew agreements with respect to our permitted use of these technologies, on terms acceptable to us or at all, our relationships with these third parties may deteriorate, or our agreements with these third parties may expire or be terminated. We may also face legal or business disputes with licensors that may threaten or lead to the disruption of inbound licensing relationships. Additionally, third parties who license to our competitors could refuse to license to us on equally favorable terms or at all. Our inability to obtain licenses or rights on favorable terms could have a material effect on our emerging technology offerings and our competitiveness, which would adversely impact our financial condition and results of operations.
Additionally, we may incur significant costs in order to remain in compliance with the terms of our licenses, including the need to carefully monitor and manage our use of third-party components. The license terms may also require us to license or publicly disclose our intellectual property without compensation or on undesirable terms. These risks could be heightened in the case of future mergers or acquisitions. Additionally, as a result of any such transaction, third parties may
obtain licenses to some of our intellectual property, or our business may be subject to certain restrictions that were not in place prior to such transaction.
System or service failures, including as a result of cyber or other security incidents, could disrupt business operations, result in the loss of critical and confidential information, and adversely impact our reputation and results of operations.
We rely upon information technology systems to manage or support a variety of our business processes, activities and products, many of which involve sensitive information. As a result, we are subject to systems or service failures, not only resulting from failures of our systems or the failures of systems of third-party service providers, but also from exposure to cyber security threats, including hackers, computer viruses, malware, social engineering and cyber extortion. Global cybersecurity threats and incidents can range from uncoordinated individual attempts to gain unauthorized access to IT systems to sophisticated and targeted measures known as advanced persistent threats, directed at the Company, our products, our customers and/or our third-party service providers, including cloud providers. There has been an increase in the frequency and sophistication of cyber threats our industry faces, and our customers, partners and regulators are increasingly requiring cyber and other security protections and mandating security standards.
We have in the past experienced, and may in the future experience, cyber or other security incidents. Depending on their nature and scope, these could potentially result in the misappropriation, destruction, corruption or unavailability of critical data and confidential or proprietary information (our own or that of third parties) and the disruption of business operations. Moreover, employee error, negligence or malfeasance, as well as intentional or inadvertent non-compliance with our security protocols may result in a breach of our information systems. Cyber incidents aimed at the software embedded in our products could also lead to third-party claims that our product failures have caused a similar range of damages to our customers.
In addition, our reliance on third-party service providers could introduce new cybersecurity risks and vulnerabilities, including supply chain attacks and other threats to our business operations. We rely on third-party service providers and technologies to operate critical business systems to process confidential, proprietary, and sensitive data in a variety of contexts, including, without limitation, cloud-based infrastructure, data center facilities, encryption and authentication technology, employee email, and other functions. We also rely on third-party service providers to provide other products or services to operate our business. If our third-party service providers experience a security incident or other interruption, we could experience adverse consequences. Supply chain attacks have increased in frequency and severity, and we cannot guarantee that third parties’ infrastructure in our supply chain or our third-party partners’ supply chains have not been or will not be compromised.
The risks associated with cyber security incidents include the risks of financial loss, reputational damage resulting in the loss of business, litigation with third parties, theft of intellectual property, fines levied by governmental entities, diminution in the value of our investment in research, development and engineering, and costs associated with incident remediation. We may also be required to expend significant costs and resources to protect against security incidents. The costs related to cyber or other security incidents may not be fully insured or indemnified by other means. The successful assertion of a large claim against us with respect to a cyber or other security incident could seriously harm our business. Even if not successful, these claims could result in significant legal and other costs, may be a distraction to our management and harm our customer relationships, as well as our reputation.
Risks Related to Our Capital Structure
Our substantial indebtedness and other obligations could adversely affect our financial health and our ability to execute our business strategy.
We have substantial consolidated indebtedness. As of December 31, 2024, we had gross outstanding debt of $1,493 million. Our ability to generate sufficient cash flows from operations to service our indebtedness, run our business and execute our growth strategy depends on a range of economic, competitive and business factors, many of which are outside of our control. If we are unable to generate sufficient cash flow to satisfy our debt service payments and other obligations, we may be required to seek alternatives that could have a negative impact on our business and financial condition, such as reducing or delaying investments or capital expenditures, selling assets, or refinancing or obtaining additional equity capital on terms that may be onerous or highly dilutive. Our ability to refinance our indebtedness will depend on the capital markets and our financial condition at the time and we will be limited by certain operating and financial restrictions in our existing debt agreements. We may not be able to employ any of these alternatives on desirable terms or at all, which could
result in a default on our indebtedness and could have a material adverse effect on our results of operations, financial condition and business.
Our substantial indebtedness could, for example: limit our ability to borrow money for our working capital, capital expenditures, debt service requirements, strategic initiatives or other purposes; make it more difficult for us to satisfy our obligations with respect to our indebtedness and any failure to comply with the obligations of any of our debt instruments, including restrictive covenants and borrowing conditions, could result in an event of default under our debt instruments; require us to dedicate a substantial portion of our cash flow from operations to the payment of interest and the repayment of our indebtedness, thereby reducing funds available to us for other purposes; limit our flexibility in planning for, or reacting to, changes in our operations or business; make us more highly leveraged than some of our competitors, which may place us at a competitive disadvantage; impact our rent expense on leased space and interest expense from financing leases, which could be significant; make us more vulnerable to downturns in our business, our industry or the economy; restrict us from making strategic acquisitions, engaging in development activities, introducing new technologies or exploiting business opportunities; cause us to make non-strategic divestitures; limit, along with the financial and other restrictive covenants in our indebtedness, among other things, our ability to borrow additional funds or dispose of assets; or expose us to the risk of increased interest rates, as certain of our borrowings are at variable rates of interest.
If our cash flows were to become insufficient to cover our capital requirements or our access to capital were to become constrained, or if costs of capital increased significantly, whether due to lowered credit ratings, prevailing industry conditions, the solvency of our customers, a material decline in demand for our products, the volatility of the capital markets or other factors, our cash flows and financial condition could be materially adversely affected. These conditions may negatively impact our credit ratings, which could reduce our ability to access new capital and increase our cost of capital, which would negatively impact our financial condition and results of operations.
Our debt agreements contain restrictions that limit our flexibility in operating our business.
Our debt agreements contain and any other existing or future indebtedness of ours would likely contain, a number of covenants that impose significant operating and financial restrictions on us, including restrictions on our and our subsidiaries' ability to, among other things: incur additional debt, guarantee indebtedness or issue certain preferred shares; pay dividends on or make distributions in respect of, or repurchase or redeem, our capital stock or make other restricted payments; prepay, redeem or repurchase certain debt; make loans or certain investments; sell certain assets; create liens on certain assets; consolidate, merge, sell or otherwise dispose of all or substantially all of our assets; enter into certain transactions with our affiliates; substantially alter the businesses we conduct; enter into agreements restricting our subsidiaries' ability to pay dividends; and designate our subsidiaries as unrestricted subsidiaries. In addition, the Revolving Facility requires us to comply with a consolidated total leverage ratio under certain circumstances.
As a result of these covenants, we are limited in the manner in which we conduct our business, and we may be unable to engage in favorable business activities or finance future operations or capital needs. A failure to comply with the covenants in our debt agreements or any of our other existing or future indebtedness could result in an event of default under the applicable agreements, which if not cured or waived, could have a material and adverse effect on our business, financial condition and results of operations. In the event of any such event of default, the lenders under our indebtedness agreements: will not be required to lend any additional amounts to us; could elect to declare all borrowings outstanding, together with accrued and unpaid interest and fees, to be due and payable and terminate all commitments to extend further credit; could require us to apply our available cash to repay these borrowings; or could effectively prevent us from making debt service payments on our long term notes; any of which could result in an event of default under the agreements governing our indebtedness, including cross-defaults under the agreements governing our long-term indebtedness. If we were unable to repay those amounts, the lenders under our existing or future secured indebtedness could proceed against the collateral granted to them to secure such other indebtedness. We have pledged a majority of our assets as collateral under the Senior Credit Facilities. If any of our outstanding indebtedness were to be accelerated, there can be no assurance that our assets would be sufficient to repay such indebtedness in full.
Our U.S. and non-U.S. tax liabilities are dependent, in part, upon the distribution of income among various jurisdictions in which we operate.
Our future results of operations could be adversely affected by changes in our effective tax rate as a result of a change in the mix of earnings in countries with differing statutory tax rates, changes in tax laws, regulations and judicial rulings (or changes in the interpretation thereof), changes in generally accepted accounting principles, changes in the valuation of deferred tax assets and liabilities, the results of audits and examinations of previously filed tax returns and continuing assessments of our tax exposures and various other governmental enforcement initiatives. Our tax expense includes
estimates of tax reserves and reflects other estimates and assumptions, including assessments of our future earnings, which could impact the valuation of our deferred tax assets. Changes in tax laws or regulations, such as the Pillar 2 initiative of the Organization for Economic Cooperation and Development, could increase tax uncertainty and may adversely impact our effective tax rate and provision for income taxes.
Our ability to raise capital in the future may be limited, and any deterioration in industry, economic or financial conditions may restrict our ability to access the capital markets on favorable terms, which could make us unable to fund our capital requirements.
We require working capital to meet our projected operating needs and fund ongoing R&D activities, capital expenditures, and other cash requirements, and may require additional capital in the future to finance our growth and development, upgrade and improve our manufacturing capabilities, implement further marketing and sales activities, fund additional R&D activities, satisfy regulatory and environmental compliance obligations, fund acquisitions or expansion, and meet varied working capital needs. Our capital requirements will depend on many factors, including acceptance of and demand for our products, the extent to which we invest in new technology and R&D projects and the status and timing of these developments. Additional financing may not be available on favorable terms, or at all. If we issue new debt securities and debt holders would have rights senior to our equity holders, and the terms of additional debt could restrict our operations. See "Our debt agreements contain restrictions that limit our flexibility in operating our business." Further, if we issue additional equity securities, existing holders of our securities may experience dilution, and preferred equity securities would also have rights senior to holders of our Common Stock.
Changes in interest rates and asset returns could adversely affect our earnings and/or cash flows and increase our pension funding obligations.
A portion of our indebtedness is made at variable interest rates, which subjects our business results to fluctuations in interest rates. If interest rates increase or remain elevated for extended periods, our borrowing costs may also increase and our returns on financial investments and the valuation of derivative contracts could be negatively affected, which could adversely impact our financial condition, operating results and cash flows. There can be no assurance that we will be able to mitigate any potential material adverse impacts on our earnings and cash flows caused by fluctuations in interest rates.
In addition, we have unfunded obligations under certain of our defined benefit pension and other postretirement benefit plans. The valuation of our future payment obligations under the plans and the related plan assets are subject to significant adverse changes if the credit and capital markets cause interest rates and projected rates of return to decline. Such declines could lead to a material increase in the unfunded obligations of these plans, which could require us to make significant additional contributions to our pension plans and increase our pension expense.
Ownership positions of certain of our major stockholders may lead to conflicts of interest and could negatively impact the price of our securities.
The ownership positions of certain affiliated funds of Centerbridge Partners, L.P. (the "Centerbridge Investors") and certain affiliated funds of Oaktree Capital Management, L.P. (the "Oaktree Investors”) represent a significant portion of the total voting power of our outstanding shares. As a result, these two stockholders can significantly influence matters requiring approval by our stockholders. These two stockholders may, from time to time, have interests that differ from other stockholders and either or both may be averse to the interests of other stockholders and the long-term growth prospects of the Company. Furthermore, the Centerbridge Investors and the Oaktree Investors each have the right to designate one director for election to our Board of Directors, which affords them significant influence over all matters requiring approval by our Board of Directors as well. The concentration of ownership of our shares and representation by these stockholders on our Board of Directors may have the effect of delaying, preventing or deterring a change of control of our Company, could deprive our stockholders of an opportunity to receive a premium for their shares as part of a sale of our Company, and consequently may affect the market price of our shares.
There can be no assurance that we will pay dividends or repurchase shares of our Common Stock under our share repurchase program.
Our Board of Directors has announced that it intends to declare and pay quarterly dividends in an aggregate amount of approximately $50 million during the fiscal year ended December 31, 2025. The actual declaration and payment of any dividend is subject to the approval of our Board of Directors. There can be no assurance that we will declare and pay dividends in the future at any level, or at all. Our ability to pay dividends may be limited by restrictions or limitations on our cash flows, including through restrictions in our debt agreements or our ability to obtain sufficient funds from our subsidiaries, many of which are located outside of the United States. Any declaration and payment of dividends on our
Common Stock will depend on our earnings, financial condition, liquidity and capital requirements, the general economic climate, the terms of our equity securities, contractual restrictions, our ability to service our debt obligations and other factors deemed relevant by the Board of Directors from time to time.
Additionally, our Board of Directors has approved a share repurchase program, pursuant to which we may repurchase up to $250 million of shares of Common Stock from time to time during the fiscal year ended December 31, 2025. The timing, as well as the number and value of shares repurchased under the program, will be determined by the Board of Directors or an authorized committee of the Board of Directors its discretion and will depend on a variety of factors, including our assessment of the intrinsic value of our Common Stock, the market price of our Common Stock, general market and economic conditions, available liquidity, compliance with the Company's debt and other agreements, applicable legal requirements, the nature of other investment opportunities available to the Company, and other considerations. The Company is not obligated to purchase any shares under the share repurchase program, and the program may be suspended, modified, or discontinued at any time without prior notice.
Item 1B. Unresolved Staff Comments
None.
Item 1C. Cybersecurity
Risk Management and Strategy
The Company's cybersecurity objective is to protect Garrett against data privacy breaches, information theft, and external and insider cyber threats through the use of a combination of leading technologies, policies, and procedures. The Company has processes in place to identify, assess and monitor material risks from cybersecurity threats, which are part of the Company’s overall enterprise risk management ("ERM") process and have been embedded in the Company’s operating procedures, internal controls and information systems. To that end, we take a holistic approach to securing our data and business systems from attack, compromise or loss.
The Company has cybersecurity capability, including a Security Operations Center ("SOC") that is managed by a dedicated Chief Information Security Officer (“CISO”) whose team is responsible for leading the Company-wide cybersecurity strategy, policy, standards, architecture, and processes. The SOC provides visibility across all information technology assets and includes proactive cyber security threat detection technology to facilitate the identification of misconfigurations to mitigate threats and prevent data loss. As part of the Company’s holistic approach to cybersecurity, we have implemented programs and technology associated with threat hunting, vulnerability scanning, and threat detection and response technology.
As part of its cybersecurity risk management, the Company delivers specific education to the organization on how to identify potential cybersecurity risks and protect the Company’s resources and information. This training is mandatory for all employees globally on a regular basis and may be supplemented by various testing initiatives including periodic phishing tests.
The Company leverages third-party expertise for periodic effectiveness testing of its prevention, detection, and response capabilities. The Company also requires all third-party service providers to meet certain cybersecurity requirements, including risk assessment and monitoring activities. In addition, third-party service providers with access to the Company's network are also required to undertake cybersecurity training.
While Garrett focuses heavily on prevention and detection, response and recovery plans, service agreements and partner engagements are in place should there be a need for us to respond to a cybersecurity attack. The Company's response process includes identifying the incident; notifying the executive team, activating the crisis team, assessing the business risk and materiality of the incident; managing the recovery of operations; and performing a post-incident analysis. The Company maintains business continuity and disaster recovery plans. The Company also engages in cyber crisis response simulation to assess our incident response ability and effectiveness.
No cybersecurity incidents have occurred that materially affected, or are reasonably likely to materially affect, the Company, including its business strategy, results of operations or financial condition during the year ended December 31, 2024. Notwithstanding the extensive approach we take to cybersecurity, we may not be successful in preventing or mitigating a cybersecurity incident that could have a material adverse effect on us in the future. See Item 1A. "Risk Factors" for a discussion of cybersecurity risks.
Governance
Role of Management
The Company has a Cyber Risk Governance Council consisting of the Senior Vice President Chief Digital and Information Officer (“CDIO”), the CISO, the IT leadership team, and the legal and cybersecurity teams that focuses on cybersecurity and compliance risks. The Cyber Risk Governance Council meets monthly to review cybersecurity risks and related risk management methodologies. Cybersecurity risks are included in the Company’s ERM as appropriate based on potential impact and vulnerability assessed according to certain set criteria and defined ERM materiality thresholds. Regular discussions over cybersecurity developments and risk mitigation approaches are held by the Cyber Risk Governance Council with the Chief Executive Officer and the senior leadership team. The CISO has over 27 years of experience in IT in various capacities with over 21 years in cybersecurity, reporting into the CDIO, who has over 20 years of IT related experience.
Role of the Board
The Board of Directors is responsible for overseeing overall risk management for the Company, including review and approval of the enterprise risk management approach and processes implemented by management to identify, assess, manage and mitigate risk. The Board has delegated responsibility for oversight of the Company's cybersecurity framework and risk management to the Audit Committee.
The CDIO and CISO provide reports to the Audit Committee at least semi-annually on the Company’s cybersecurity program, including the external threat environment, the Company’s programs to address and mitigate the risks associated with the evolving cybersecurity threat environment, and the results of evaluation of the Company’s cybersecurity program by external experts. The Audit Committee, as well as the Board of Directors, is also promptly informed about any information security incidents that may pose significant risk to the Company.
Item 2. Properties
We have created a geographic footprint that emphasizes locating R&D, engineering and manufacturing capabilities in close physical proximity to our customers, thereby enabling us to manage our environmental footprint and to adopt technologies and products for the specific vehicle types sold in each geographic market. Over the past several years, we have invested heavily to be close to our Chinese, Indian and other high-growth region OEM customers to be able to offer world-leading technologies, localized engineering support and unparalleled manufacturing productivity.
As of December 31, 2024, we owned or leased 13 manufacturing sites, five R&D centers and nine close-to-customer engineering sites. We also have many smaller sales offices, warehouses, cybersecurity and integrated vehicle health management sites and other investments strategically located throughout the world. The following table shows the ownership and regional distribution of our manufacturing sites, R&D centers and customer engineering sites:
| | | | | | | | | | | | | | | | | | | | | | | | | | | | | | | | | | | | | | | | | |
| Ownership | | Regional distribution |
| Owned | | Leased | | North America | | Europe,
Middle East & Africa | | South Asia &
Asia Pacific | | South America | | Total |
| Manufacturing Sites | 9 | | 4 | | 2 | | 5 | | 5 | | 1 | | 13 |
| R&D Centers | 1 | | 4 | | 1 | | 2 | | 2 | | — | | 5 |
| Close-to-Customer Engineering Sites | 4 | | 5 | | 2 | | 3 | | 3 | | 1 | | 9 |
We continually and proactively review our real estate portfolio and develop footprint strategies to support our customers’ global plans, while at the same time supporting our technical needs and optimizing operating cost base. We expect our evolving portfolio will meet current and anticipated future needs.
Item 3. Legal Proceedings
The discussion under Note 25, Commitments and Contingencies of the Notes to the Consolidated Financial Statements is incorporated by reference into this Part I, Item 3.
Item 4. Mine Safety Disclosures
Not Applicable.
PART II
Item 5. Market for Registrant’s Common Equity, Related Stockholder Matters and Issuer Purchases of Equity Securities
Market Information
The Common Stock trades on the Nasdaq Global Select Market under the ticker symbol "GTX".
Holders of Record
As of February 14, 2025, there were 26,859 stockholders of record of our Common Stock.
Dividend Policy
In December 2024, the Board of Directors announced that it intends to declare and pay quarterly dividends on our Common Stock in an aggregate amount of approximately $50 million in 2025. The timing, declaration, amount and payment of dividends to stockholders on shares of our Common Stock falls within the discretion of the Board and will depend on our earnings, financial condition, liquidity and capital requirements, the general economic climate, the terms of our equity securities, contractual restrictions, our ability to service our debt obligations and other factors deemed relevant by the Board.
On December 5, 2024, the Board of Directors declared a cash dividend of $0.06 per share of our Common Stock, payable on January 31, 2025, to shareholders of record as of January 15, 2025.
Stock Performance Graph
The following performance graph and related information shall not be deemed “soliciting material” or to be “filed” with the Securities and Exchange Commission, nor shall such information be incorporated by reference into any future filing under the Securities Act or the Exchange Act except to the extent we specifically incorporate it by reference into such filing. Our stock price performance shown in the graph below is not indicative of future stock price performance.
The following graph and table illustrate the total return from April 30, 2021, the date of the Company's emergence from Chapter 11 bankruptcy proceedings ("Emergence") through December 31, 2024, for (i) our Common Stock, (ii) the Standard and Poor’s (“S&P”) Small Cap 600 Index, and (iii) the average stock performance of a group of peer companies consisting of Adient plc, Allison Transmission Holdings, Inc., American Axle & Manufacturing Holdings, Inc., Aptiv PLC, Autoliv Inc., BorgWarner Inc., Dana Incorporated, Gentex Corporation, Lear Corporation, Magna International Inc., Tenneco Inc., Veoneer, Inc., and Visteon Corporation (the "Peer Group").
The graph and the table assume that $100 was invested on April 30, 2021, in shares of each of our Common Stock, the S&P Small Cap 600 Index, and the Common Stock of the Peer Group, with any dividends reinvested. The comparisons reflected in the graph and table are not intended to forecast the future performance of our Common Stock and may not be indicative of our future performance.
Recent Sales of Unregistered Securities
During the period covered by this Annual Report on Form 10-K, we did not offer or sell any equity securities that were not registered under the Securities Act.
Issuer Purchases of Equity Securities
On February 15, 2024, the Company announced that the Board of Directors had authorized a $350 million share repurchase program valid from February 13, 2024, until December 31, 2024. The Company may repurchase shares from time to time under the program through various methods, including in open market transactions, block trades, privately negotiated transactions, and otherwise. The timing, as well as the number and value of shares repurchased under the program, will depend on a variety of factors. The Company is not obligated to purchase any shares under the repurchase program, and the program may be suspended, modified, or discontinued at any time without prior notice. The share repurchase program expired on December 31, 2024.
The following table summarizes our share repurchase activity for the three months ended December 31, 2024, and additional information regarding our share repurchase program.
| | | | | | | | | | | | | | | | | | | | | | | | | | | | | | | | | |
| Period | | Total Number of Common Shares Purchased (1) | | Average Price Paid per Share | | | | | | Total Number of Shares Purchased as Part of Publicly Announced Plan or Program | | Approximate Dollar Value of Shares that May Yet Be Purchased Under the Plan or Program | |
| October 1, 2024 - October 31, 2024 | | 2,284,922 | | $ | 7.92 | | | | | | | 2,284,922 | | | 106,284,643 | | |
| November 1, 2024 - November 30, 2024 | | 2,150,475 | | $ | 7.89 | | | | | | | 2,150,475 | | | 89,324,715 | | |
| December 1, 2024 - December 31, 2024 | | 3,963,585 | | $ | 8.95 | | | | | | | 3,963,585 | | | — | | (2) |
| Total | | 8,398,982 | | $ | 8.40 | | | | | | | 8,398,982 | | | | |
(1) Excludes shares withheld to satisfy tax withholding obligations in connection with the vesting of equity awards.
(2) The share repurchase program expired on December 31, 2024, with an unused balance of $54 million.
Other than the amounts repurchased as part of our share repurchase program, there were no purchases of equity securities by the issuer or affiliated purchasers during the quarter ended December 31, 2024.
On December 4, 2024, the Board of Directors authorized a new $250 million share repurchase program valid from January 1, 2025, until December 31, 2025.
Item 6. Reserved
Not applicable.
Item 7. Management’s Discussion and Analysis of Financial Condition and Results of Operations
The following discussion and analysis of our financial condition and results of operations, which we refer to as our “MD&A,” should be read in conjunction with our Consolidated Financial Statements and related notes thereto and other financial information appearing elsewhere in this Annual Report. Some of the information contained in this discussion and analysis or set forth elsewhere in this Annual Report, including information with respect to our plans and strategy for our business, includes forward-looking statements that involve risks and uncertainties. As a result of many important factors, including those set forth in the "Risk Factors" section of this Annual Report, our actual results could differ materially from the results described in, or implied, by these forward-looking statements.
Executive Summary
Garrett is a cutting-edge technology leader delivering differentiated solutions for emission reduction and energy efficiency. We design, manufacture, and sell highly engineered turbocharging, air and fluid compression, and high-speed electric motor technologies for OEMs and distributors within the mobility and industrial space.
We have significant expertise in delivering products at scale for ICE-powered vehicles using gasoline, diesel, natural gas and hydrogen, as well as for zero-emission technologies using hydrogen fuel cell systems, both for mobility and industrial use. As our customers continue to progress on electrification, we are applying our technological pillars to develop highly engineered E-Powertrain and E-Cooling compressor products to support their ambition. These products are key enablers for fuel economy, energy efficiency, thermal management, and compliance with emissions standards and overall greenhouse gas and other emission reduction targets.
In 2024, turbocharger production decreased globally from approximately 50 million units in 2023 to 49 million units in 2024 and is expected to further decrease from 2025 onward based on current expectations of electric vehicle penetration. We effectively navigated through macroeconomic and geopolitical challenges by implementing strategic permanent and variable cost measures, as well as leveraging commodity deflation pass-through. Our effective management allowed us to achieve Net income of $282 million and Adjusted EBITDA of $598 million for the year.
We continue to achieve success in our turbocharging, hybrid, and zero-emission technology applications. This year, we secured additional pre-production contracts for both light vehicle and commercial vehicle applications, were awarded our first turbo application for a Range Extended Electric Vehicle with a leading Chinese technology company, and made significant progress in testing our new turbo off-highway applications.
On April 3, 2024, we divested our equity interest in an unconsolidated joint venture for approximately $58 million, subject to customary debt and working capital adjustments. We received cash consideration on the divestiture date of $46 million, with an additional $7 million still to be received, and recognized a gain of $27 million related to this divestiture.
During the second quarter of 2024, we completed an offering of $800 million in aggregate principal amount of 7.75% Senior Unsecured Notes due 2032 (the "Senior Notes") and made early debt repayments totaling $985 million on our €450 million secured first-lien Euro Term Facility (the "Euro Term Facility") and $500 million secured first-lien U.S. Dollar term loan facility (the "2023 Dollar Term Facility"), both of which were fully repaid as of June 30, 2024.
In December 2024, the Board of Directors announced that it intends to declare and pay quarterly dividends on our Common Stock in an aggregate amount of approximately $50 million in 2025. The first quarter dividend of $0.06 per share was declared on December 5, 2024, payable to holders of our Common Stock as of January 15, 2025, and was settled in cash for $12 million on January 31, 2025.
Trends, Uncertainties and Opportunities
Current global economic conditions due to geopolitical conflicts, high inflation in Europe, and China's slow pace of recovery, all have adversely affected and may continue to adversely affect many industries, including the automotive industry. We believe a global increase in BEV production will persist into 2025. We anticipate that demand for turbochargers will remain steady in the short to medium term, driven by the growing penetration of hybridized powertrains in response to strict fuel efficiency and emissions standards. While we foresee continued growth in BEV adoption, we believe it will be somewhat constrained in the short term due to the price disparity compared to ICE vehicles, geopolitical risks, and the slower-than-expected development of charging infrastructure.
Disaggregated Revenue
The following tables show our revenues by geographic region and product line for the years ended December 31, 2024, 2023 and 2022.
By Region
| | | | | | | | | | | | | | | | | | | | | | | | | | | | | | | | | | | |
| Year Ended December 31, |
| 2024 | | 2023 | | 2022 |
| (Dollars in millions) |
| United States | $ | 700 | | | 20 | % | | $ | 744 | | | 19 | % | | $ | 694 | | | 19 | % |
| Europe | 1,642 | | | 47 | % | | 1,874 | | | 48 | % | | 1,734 | | | 48 | % |
| Asia | 1,056 | | | 31 | % | | 1,201 | | | 31 | % | | 1,102 | | | 31 | % |
| Other International | 77 | | | 2 | % | | 67 | | | 2 | % | | 73 | | | 2 | % |
| $ | 3,475 | | | | | $ | 3,886 | | | | | $ | 3,603 | | | |
By Product Line
| | | | | | | | | | | | | | | | | | | | | | | | | | | | | | | | | | | |
| Year Ended December 31, |
| 2024 | | 2023 | | 2022 |
| (Dollars in millions) |
| Diesel | $ | 827 | | | 24 | % | | $ | 992 | | | 25 | % | | $ | 949 | | | 26 | % |
| Gas | 1,505 | | | 43 | % | | 1,720 | | | 44 | % | | 1,485 | | | 41 | % |
| Commercial Vehicle | 629 | | | 18 | % | | 656 | | | 17 | % | | 673 | | | 19 | % |
| Aftermarket | 459 | | | 13 | % | | 456 | | | 12 | % | | 442 | | | 12 | % |
| Other | 55 | | | 2 | % | | 62 | | | 2 | % | | 54 | | | 2 | % |
| $ | 3,475 | | | | | $ | 3,886 | | | | | $ | 3,603 | | | |
Results of Operations for the Years Ended December 31, 2024, 2023 and 2022
Net Sales
| | | | | | | | | | | | | | | | | |
| Year Ended December 31, |
| 2024 | | 2023 | | 2022 |
| (Dollars in millions) |
| Net sales | $ | 3,475 | | | $ | 3,886 | | | $ | 3,603 | |
| % change compared with prior period | (10.6) | % | | 7.9 | % | | (0.8 | %) |
The change in net sales compared to the prior year is attributable to the following:
For the year ended December 31, 2024, net sales decreased compared to prior year by $411 million or 11%, including an unfavorable impact of $34 million or 1% due to foreign currency translation driven by lower Chinese Yuan-to-US dollar and lower Japanese Yen-to-US dollar exchange rates, partially offset by higher Euro-to-US dollar exchange rates. This decrease was mainly driven by soft demand in gasoline, diesel, and commercial vehicle applications, partially offset by demand for replacement parts on aftermarket sales. Net sales further decreased due to price, net of inflation pass-through driven by commodity deflation and partially offset by favorable product mix.
Gasoline product sales decreased by $215 million or 13% (including an unfavorable impact of $16 million or 1% due to foreign currency translation) driven by soft demand in China and North America, partially offset by program ramp-ups in Europe, the rest of Asia and South America.
Diesel product sales decreased by $165 million or 17% (including an unfavorable impact of $6 million or 1% due to foreign currency translation), primarily driven by passenger vehicles in Europe, partially offset by sustained demand for pickup trucks in North and South America.
Commercial vehicle sales decreased by $27 million or 4% (including an unfavorable impact of $8 million or 1% due to foreign currency translation), primarily driven by soft demand in the construction and agriculture industries due to high interest rates and lower crop prices, partially offset by sustained demand in the on-highway industry, especially in China and North America.
Aftermarket sales increased by $3 million or 1% (including an unfavorable impact of $3 million or 0% due to foreign currency translation), primarily driven by favorable aftermarket conditions and continued high demand for replacement parts in China, Europe, India, Brazil and Japan, partially offset by softer sales in Australia.
For the year ended December 31, 2023, net sales increased compared to prior year by $283 million or 8%, including an unfavorable impact of $14 million or 0% due to foreign currency translation driven by lower Chinese Yuan-to-US dollar, partially offset by higher Euro-to-US dollar exchange rates. This increase was driven by higher volumes with growth of both global light vehicles and the turbocharger industry, and faster than expected recovery from China Covid-19 pressures and semiconductor shortages experienced in the prior year. Strong demand for new product launches and ramp-ups along with inflation recoveries net of pricing across all product lines also contributed to the net sales growth.
Gasoline product sales increased by $235 million or 16% (including an unfavorable impact of $20 million or 1% due to foreign currency translation) driven by industry recovery from prior year’s global semiconductor shortages and Covid-related lockdown measures in China, combined with new product launches and ramp-ups across all regions.
Diesel product sales increased by $43 million or 5% (including a favorable impact of $10 million or 2% due to foreign currency translation), driven by strong performance in Europe where diesel remains essential to meet fleet CO2 targets in addition to strong light commercial vehicle performance on existing platforms.
Commercial vehicle sales decreased by $17 million or 3% (including an unfavorable impact of $7 million or 2% due to foreign currency translation), primarily driven by global demand softness influenced by macroeconomic headwinds such as higher interest rates and commodity inflation, partially offset by favorable regional mix.
Aftermarket sales improved by $14 million or 3% (including a favorable impact of $2 million or 0% due to foreign currency translation), primarily on strong demand in Europe and especially in Asia Pacific related to favorable aftermarket conditions including the continued high demand for replacement parts. Recovery in China from the end of the Chinese government's zero Covid-19 policy as well as new product introductions and favorable pricing impact also contributed to the growth.
Cost of Goods Sold and Gross Profit
| | | | | | | | | | | | | | | | | |
| Year Ended December 31, |
| 2024 | | 2023 | | 2022 |
| (Dollars in millions) |
| Cost of goods sold | $ | 2,770 | | | $ | 3,130 | | | $ | 2,920 | |
| % change compared with prior period | (11.5) | % | | 7.2 | % | | (0.2 | %) |
| Gross profit percentage | 20.3 | % | | 19.5 | % | | 19.0 | % |
| | | | | | | | | | | | | | |
| | Cost of Goods Sold | | Gross Profit |
| | (Dollars in millions) |
| Cost of Goods Sold / Gross Profit for year ended December 31, 2023 | | $ | 3,130 | | | $ | 756 | |
| Volume | | (290) | | | (122) | |
| Product mix | | 104 | | | 7 | |
| Price, net of inflation pass-through | | — | | | (50) | |
| Commodity, transportation and energy deflation | | (81) | | | 81 | |
| Productivity, net | | (98) | | | 72 | |
| Research & development | | 12 | | | (12) | |
| Foreign exchange rate impacts | | (7) | | | (27) | |
| Cost of Goods Sold / Gross Profit for year ended December 31, 2024 | | $ | 2,770 | | | $ | 705 | |
For the year ended December 31, 2024, cost of goods sold decreased by $360 million, primarily driven by lower sales volumes which contributed a decrease of $290 million. Cost of goods sold further declined from $81 million of commodity, transportation and energy deflation, as well as a $98 million decrease from productivity, net of labor inflation and repositioning costs, and foreign currency impacts from transactional, translational, and hedging effects of $7 million. The decrease was partially offset by unfavorable product mix of $104 million and a $12 million increase in R&D costs, net of customer reimbursements, which reflects our continued investment in new technologies and related headcount year-over-year.
Gross profit decreased by $51 million, mainly driven by lower sales volumes which contributed a decrease of $122 million. Gross profit further declined from $50 million of price, net of inflation pass-through, $12 million higher R&D costs, net of customer reimbursements, and $27 million from foreign currency impacts from transactional, translational and hedging. These decreases were partially offset by $81 million of commodity, transportation and energy deflation, $72 million of productivity, net of labor inflation and repositioning costs, and $7 million of favorable impact from product mix.
| | | | | | | | | | | | | | |
| | Cost of Goods Sold | | Gross Profit |
| | (Dollars in millions) |
| Cost of Goods Sold / Gross Profit for year ended December 31, 2022 | | $ | 2,920 | | | $ | 683 | |
| Volume | | 217 | | | 89 | |
| Product mix | | 27 | | | (79) | |
| Price, net of inflation pass-through | | — | | | 38 | |
| Commodity, transportation & energy inflation | | 30 | | | (30) | |
| Productivity, net | | (55) | | | 60 | |
| Research & development | | 14 | | | (14) | |
| Foreign exchange rate impacts | | (23) | | | 9 | |
| Cost of Goods Sold / Gross Profit for year ended December 31, 2023 | | $ | 3,130 | | | $ | 756 | |
For the year ended December 31, 2023, cost of goods sold increased by $210 million, primarily driven by our higher sales volumes and an unfavorable product mix, which contributed to increases of $217 million and $27 million, respectively. Cost of goods sold further increased due to $30 million of inflation on commodities, transportation and energy, as well as a $14 million increase in R&D costs, net of customer reimbursements, which reflects our continued investment in new technologies and related headcount year-over-year. The increase was partially offset by our continued focus on productivity, net of labor inflation, one-time expenses and higher repositioning costs, which contributed a decrease in cost of goods sold of $55 million, and by foreign currency impacts from transactional, translational and hedging effects, which contributed a decrease in cost of goods sold of $23 million.
Gross profit increased by $73 million, mainly driven by higher sales volumes of $89 million and $60 million of productivity net of labor inflation, one-time expenses and higher repositioning costs. We also saw $38 million more of inflation recoveries from customer pass-through agreements net of pricing, and positive foreign currency impacts from transactional, translational and hedging of $9 million. These increases were partially offset by $30 million of inflation on commodities, transportation and energy costs, $79 million of unfavorable impacts from product mix primarily from growth in small-engine gasoline applications, as well as $14 million of higher R&D costs, net of customer reimbursements.
Selling, General and Administrative Expenses
| | | | | | | | | | | | | | | | | |
| Year Ended December 31, |
| 2024 | | 2023 | | 2022 |
| (Dollars in millions) |
| Selling, general and administrative expense | $ | 240 | | | $ | 247 | | | $ | 216 | |
| % of sales | 6.9 | % | | 6.4 | % | | 6.0 | % |
For the year ended December 31, 2024, selling, general and administrative (“SG&A”) expenses decreased by $7 million compared with the prior year, primarily driven by $4 million of lower repositioning costs, $8 million of lower professional service and legal fees and $3 million of lower IT-related costs. These decreases were partially offset by $8 million of higher stock-based compensation expense and $1 million of unfavorable foreign exchange impacts.
For the year ended December 31, 2023, SG&A expenses increased by $31 million compared with the prior year, primarily due to $9 million of legal and advisory fees related to the Transaction (as defined below), $5 million of labor inflation impact, $6 million of employee repositioning costs, $3 million of higher incentive compensation expense and $5 million of unfavorable impacts from foreign exchange.
Interest expense
| | | | | | | | | | | | | | | | | |
| Year Ended December 31, |
| 2024 | | 2023 | | 2022 |
| (Dollars in millions) |
| Interest expense | $ | 156 | | | $ | 159 | | | $ | 8 | |
For the year ended December 31, 2024, interest expense decreased by $3 million compared to prior year. This reduction was primarily due to $24 million of higher gains recorded on our interest derivatives, lower interest from our $715 million secured first-lien U.S. Dollar term loan facility (the "2021 Dollar Term Facility") and 2023 Dollar Term
Facility, partially offset by $15 million of accelerated debt issuance cost amortization, $4 million of higher marked-to-market remeasurement losses recorded on our undesignated interest rate swap contracts and $2 million of interest expense from our 2032 Senior Notes.
For the year ended December 31, 2023, interest expense increased by $151 million compared to prior year. This increase was mainly due to $33 million of marked-to-market remeasurement losses recorded in 2023 on our undesignated interest rate swap contracts versus $68 million of marked-to-market remeasurement gains in the prior year. We also saw $74 million of higher interest expense due to the new $700 million 2023 Dollar Facility and higher interest rates, and $12 million of debt issuance cost amortization primarily due to a $200 million early debt repayment. These increases in interest expense were partially offset by $10 million of interest accretion in the prior year on our Series B Preferred Stock that was fully redeemed in June 2022, and $28 million of gains on our interest derivatives in 2023.
Non-operating income, net
| | | | | | | | | | | | | | | | | |
| Year Ended December 31, |
| 2024 | | 2023 | | 2022 |
| (Dollars in millions) |
| Non-operating income, net | $ | (13) | | | $ | (2) | | | $ | (47) | |
For the year ended December 31, 2024, non-operating income, net amounted to $13 million compared to $2 million in the prior year. The increase in non-operating income was primarily driven by a $13 million loss on remeasurement of the Series A Preferred Stock Agreements (as defined below) during the prior year and a $6 million increase in the non-service cost components of net periodic pension benefits, partially offset by $6 million of lower equity income due to the sale of an equity interest in an unconsolidated joint venture.
For the year ended December 31, 2023, non-operating income, net amounted to $2 million compared to $47 million in the prior year. The decrease in non-operating income was primarily driven by a $30 million decrease in the non-service components of net periodic pension benefits, a $13 million loss on the remeasurement of the Series A Preferred Stock Agreements during the three months ended June 30, 2023, and a $4 million increase in foreign exchange transactional losses.
Reorganization items, net
| | | | | | | | | | | | | | | | | |
| Year Ended December 31, |
| 2024 | | 2023 | | 2022 |
| (Dollars in millions) |
| Reorganization items, net | $ | — | | | $ | — | | | $ | 3 | |
For the years ended December 31, 2024 and 2023, there were no expenses incurred for Reorganization items, net.
For the year ended December 31, 2022, reorganization items, net was an expense of $3 million related to professional service fees incurred for the remaining securities litigation from Chapter 11.
Tax Expense
| | | | | | | | | | | | | | | | | |
| Year Ended December 31, |
| 2024 | | 2023 | | 2022 |
| (Dollars in millions) |
| Tax expense | $ | 61 | | | $ | 86 | | | $ | 106 | |
| Effective tax rate | 17.8 | % | | 24.8 | % | | 21.4 | % |
The effective tax rate decreased by 7.0 percentage points in 2024 compared to 2023. The decrease was primarily due to releases of reserves due to statute of limitation expirations and settlements with taxing authorities and release of valuation allowance related to deferred tax assets in Brazil (net of US branch taxes). In addition, there was prior year expense due to rate change impact on deferred tax assets attributable to the certification by the Chinese government of the High and New Technology Enterprise status of the Company’s China operations, which reduced the tax rate to 15% for the respective entity. These increases were partially offset by prior year tax benefits in Switzerland due to law changes (net of valuation allowance) and in Korea for prior year tax settlements.
The effective tax rate increased by 3.4 percentage points in 2023 compared to 2022. The increase was primarily due to the rate change impact on deferred tax assets attributable to the certification by the Chinese government of the High and New Technology Enterprise status of the Company’s China operations, which reduced the tax rate to 15% for the respective entity. Further, withholding tax and other taxes on foreign earnings have comparatively increased due to one-time non-recurring benefit recorded in 2022 related to accrued taxes on distributable reserves. These increases were partially offset by 2023 tax benefits in Switzerland due to law changes (net of valuation allowance) and in Korea for prior year tax settlements.
In January 2019, the Organization for Economic Co-operation and Development (“OECD”) announced further work in continuation of its Base Erosion and Profit Shifting project, focusing on two “pillars.” Pillar One provides a framework for the reallocation of certain residual profits of multinational enterprises to market jurisdictions where goods or services are used or consumed. Pillar Two consists of two interrelated rules referred to as Global Anti-Base Erosion (“GloBE”) Rules, which operate to impose a minimum tax rate of 15% calculated on a jurisdictional basis. On December 20, 2021, the OECD published GloBE model rules and released multiple rounds of commentary on those rules over the subsequent months. More than 135 OECD member countries have agreed to the key parameters of the model rules, which allow those OECD member countries to begin implementing the GloBE rules in a manner consistent with the agreement reached. The rules were adopted by a number of countries, with an effective date for fiscal years beginning after December 31, 2023.
We do not expect that Pillar One will have an impact on our operations or effective tax rate. For 2024, Pillar Two does not have a material impact to our effective tax rate.
Net Income
| | | | | | | | | | | | | | | | | |
| Year Ended December 31, |
| 2024 | | 2023 | | 2022 |
| (Dollars in millions) |
| Net Income | $ | 282 | | | $ | 261 | | | $ | 390 | |
For the year ended December 31, 2024, net income increased by $21 million compared with the prior year, primarily due to a $27 million gain on the sale of an equity interest in an unconsolidated joint venture, $7 million of lower SG&A expenses, $3 million of lower interest expense, $11 million of higher non-operating income, and lower income tax expense of $25 million as discussed above. These increases were partially offset by $51 million of decreased gross profit.
For the year ended December 31, 2023, net income decreased by $129 million compared with the prior year, primarily due to $151 million of higher interest expense, $31 million of higher SG&A expenses and $45 million of lower non-operating income, as discussed above. These decreases were partially offset by $73 million of increased gross profit.
Non-GAAP Measures
Management provides non-GAAP financial information, including EBITDA and Adjusted EBITDA, to supplement the understanding of our business operations and performance, and it should be considered by the reader in addition to, but not instead of, the financial statements prepared in accordance with GAAP. Each non-GAAP financial measure is presented along with the most directly comparable GAAP measure so as not to imply that more emphasis should be placed on the non-GAAP measure. The non-GAAP financial information presented may be determined or calculated differently by other companies and may not be comparable to other similarly titled measures used by other companies. Additionally, the non-GAAP financial measures have limitations as analytical tools and should not be considered in isolation or as a substitute for analysis of the Company’s operating results as reported under GAAP. We believe that EBITDA and Adjusted EBITDA are important indicators of operating performance and provide useful information for investors.
1.We define “EBITDA” as our net income calculated in accordance with U.S. GAAP, plus the sum of interest expense net of interest income, tax expense, depreciation and amortization. We define “Adjusted EBITDA” as EBITDA, plus the sum of stock compensation expense, repositioning costs, foreign exchange (gain) loss on debt net of related hedging (gain) loss, discounting costs on factoring, gain on sale of equity investment, acquisition and divestiture expenses, other non-operating income, capital structure transformation expenses, debt refinancing and redemption costs, net reorganization items and loss on extinguishment of debt (if any); and
2.certain adjustment items, while periodically affecting our results, may vary significantly from period to period and have disproportionate effect in a given period, which affects the comparability of our results.
For 2024, we revised our definition of Adjusted EBITDA to exclude acquisition and divestiture expenses, and debt refinancing and redemption costs. We did not revise prior years' Adjusted EBITDA because there were no such charges similar in nature.
In addition, our management uses Adjusted EBITDA in setting performance incentive targets to align performance measurement with operational performance.
EBITDA and Adjusted EBITDA (non-GAAP)
| | | | | | | | | | | | | | | | | |
| Year Ended December 31, |
| 2024 | | 2023 | | 2022 |
| (Dollars in millions) |
| Net income — GAAP | $ | 282 | | | $ | 261 | | | $ | 390 | |
Interest expense, net of interest income (1) | 153 | | | 152 | | | 6 | |
| | | | | |
| Tax expense | 61 | | | 86 | | | 106 | |
| Depreciation | 90 | | | 90 | | | 84 | |
| EBITDA (Non-GAAP) | $ | 586 | | | $ | 589 | | | $ | 586 | |
| Factoring and notes receivables discount fees | 4 | | | 4 | | | 2 | |
Other non-operating income (2) | (12) | | | (6) | | | (41) | |
Reorganization items, net (3) | — | | | — | | | 3 | |
Stock compensation expense (4) | 23 | | | 14 | | | 11 | |
| Repositioning costs | 21 | | | 13 | | | 4 | |
| Foreign exchange gain on debt, net of related hedging gain | — | | | (1) | | | — | |
Capital structure transformation expenses (5) | — | | | 22 | | | — | |
| Gain on sale of equity investment | (27) | | | — | | | — | |
Acquisition and divestiture expenses (6) | 1 | | | — | | | — | |
Debt refinancing and redemption costs (7) | 2 | | | — | | | — | |
| Loss on extinguishment of debt | — | | | — | | | 5 | |
| Adjusted EBITDA (Non-GAAP) | $ | 598 | | | $ | 635 | | | $ | 570 | |
(1)Reflects interest income of $3 million, $7 million and $2 million for the year ended December 31, 2024, 2023 and 2022, respectively.
(2)The adjustment for other non-operating income reflects the non-service component of net periodic pension costs and other income that are not considered directly related to the Company's operations.
(3)On September 20, 2020 (the "Petition Date"), the Company and certain of its subsidiaries each filed a voluntary petition for relief under Chapter 11 of title 11 of the United States Code (the "Chapter 11 Cases") in the United States Bankruptcy Court for the Southern District of New York (the "Bankruptcy Court"). A Revised Amended Plan of Reorganization was confirmed by the Bankruptcy Court on April 26, 2021, and the Company emerged from bankruptcy on April 30, 2021. The Company applied ASC 852 for periods subsequent to the Petition Date to distinguish transactions and events that were directly associated with the Company’s reorganization from the ongoing operations of the business. Accordingly, certain expenses and gains incurred during the Chapter 11 Cases are recorded within Reorganization items, net in the Consolidated Statements of Operations. See Note 2, Plan of Reorganization of the Notes to the Consolidated Financial Statements.
(4)Stock compensation expense includes only non-cash expenses.
(5)Includes the loss on remeasurement of the Series A Preferred Stock Agreements as well as third-party legal and advisory fees that are directly attributable to the Transaction.
(6)Reflects third-party costs incurred for the sale of an equity interest in an unconsolidated joint venture.
(7)Reflects the third-party costs directly attributable to the repricing of our 2021 Dollar Term Facility.
Adjusted EBITDA for the year ended December 31, 2024 compared with year ended December 31, 2023
For the year ended December 31, 2024, net income increased by $21 million versus the prior year as discussed above within the Results of Operations section.
Adjusted EBITDA decreased by $37 million compared to the prior year, mainly from soft demand across all product lines except aftermarket, net of favorable product mix. Additionally, price net of inflation pass-through, higher R&D investment, and unfavorable foreign exchange impacts further reduced Adjusted EBITDA versus prior year. These declines were partially offset by operational productivity, net of labor inflation and repositioning costs, and commodity, transportation, and energy deflation year-over-year.
During 2024, we saw a decline in demand for our gasoline, diesel, and commercial vehicle applications, partially offset by favorable demand in aftermarket for replacement parts in North America, China and Europe. Net sales also decreased due to price, net of inflation pass-through, driven by commodity price decreases.
We drove strong operational productivity in 2024, flexing our variable cost structure and driving fixed cost productivity of $82 million. This, coupled with commodity, transportation, and energy deflation of $81 million versus prior year, partially offset the impact of volume declines and allowed us to expand our Adjusted EBITDA margin while funding a $12 million increase in R&D expenses, net of customer reimbursements.
Losses in foreign currency from translational, transactional, and hedging effects accounted for $23 million of the decrease in Adjusted EBITDA.
Adjusted EBITDA for the year ended December 31, 2023 compared with year ended December 31, 2022
For the year ended December 31, 2023, net income decreased by $129 million versus the prior year as discussed above within the Results of Operations section.
Adjusted EBITDA increased by $65 million compared to the prior year, mainly on higher volumes primarily in small-engine gasoline applications which drove unfavorable mix impact. Additionally, operational productivity and inflation pass-through net of pricing contributed $69 million improvement year-over-year offsetting $14 million higher R&D investment including new zero emission technologies. The impact of foreign currency impact was zero for the year.
During 2023, we saw strong customer demand increases in diesel and gasoline product lines, in a less disruptive supply chain environment, as the industry recovered from semiconductor shortages experienced in the prior year. Favorable impacts were also experienced from new product launches in gasoline, favorable aftermarket conditions such as continued high demand for replacement parts and new product launches coupled with price increases.
We maintained our focus on productivity in 2023 as rising commodity prices led to higher raw material costs, particularly for steel alloys and nickel. We recovered most of these increases through customer pass-through agreements, especially on nickel, and continue to negotiate with our customers for further pass-through while actively managing our supply base and cost recovery mechanisms to minimize the impact of materials cost inflation. The increased productivity was partially offset by year-over-year labor inflation.
R&D expenses increased $14 million which reflects our continued investment in new technologies, increased hiring to accelerate growth in the new technologies and year-over-year labor inflation, net of customer reimbursements.
There was no impact from foreign currency with translational and transactional impacts being offset by hedge remeasurement.
Liquidity and Capital Resources
Overview | | | | | | | | | | | | | | | | | |
| December 31, |
| 2024 | | 2023 | | 2022 |
| | (Dollars in millions) |
| Cash and cash equivalents | $ | 125 | | | $ | 259 | | | $ | 246 | |
| Restricted cash | 1 | | | 1 | | | 2 | |
| Revolving Facility - available borrowing capacity | 600 | | | 570 | | | 475 | |
| Revolving Facility - borrowings or letters of credit outstanding | — | | | — | | | — | |
| Term Loan Facilities - principal outstanding | 692 | | | 1,696 | | | 1,186 | |
| Senior Notes - principal outstanding | 800 | | | — | | | — | |
| | | | | |
| Bilateral letter of credit facility - utilized capacity | 8 | | | 12 | | | 14 | |
On May 21, 2024, our wholly owned subsidiaries, Garrett Motion Holdings Inc. and Garrett LX I S.a.r.l., completed an offering of $800 million in aggregate principal amount of the 2032 Senior Notes. The 2032 Senior Notes mature on May 31, 2032 and bear interest at a rate of 7.75% per annum. We incurred $12 million of debt issuance costs, which have been capitalized and will be amortized on a straight-line basis.
On May 21, 2024, we also entered into the Fourth and Fifth Amendments to the Credit Agreement, dated as of April 30, 2021, by and among the Company, Garrett Motion Holdings Inc., Garrett Motion Sàrl and Garrett LX I S.à.r.l., the lenders and issuing banks party thereto, and JPMorgan Chase Bank, N.A., as administrative agent (as amended from time to time, the "Credit Agreement") which (i) removed the credit spread adjustment with respect to certain US dollar denominated term loan borrowings that are Term Benchmark Loans (as defined in the Credit Agreement), (ii) reduced the Applicable Rate (as defined in the Credit Agreement) on certain US dollar denominated term loans to 2.75% for Term Benchmark Loans and 1.75% for ABR Loans (as defined in the Credit Agreement), and (iii) increased the maximum borrowings available under the Revolving Facility by $30 million. During the year ended December 31, 2024, we repaid $500 million on our 2023 Dollar Term Facility, $485 million (€450 million) on our Euro Term Facility and $7 million on our 2021 Dollar Term Facility.
For 2025, we expect capital spending to increase slightly as compared to 2024. We expect to make net repayments of $7 million on our term loan borrowings following the refinancing of our term loan as discussed in Note 29, Subsequent Events of the Notes to the Consolidated Financial Statements. We expect to pay approximately $42 million related to purchase obligations which were entered into with various vendors in the normal course of business and are consistent with our expected requirements. We expect to make contributions of approximately $5 million to our non-U.S. pension plans. Finally, we also expect to declare and pay quarterly dividends on our Common Stock in an aggregate amount of approximately $50 million in 2025, of which $12 million was paid on January 31, 2025.
We fund our operations primarily through cash flows from operating activities, borrowings from our credit facilities and cash and cash equivalents. We believe the combination of expected cash flows, the term loan borrowings and the
revolving credit facilities being committed until 2030, will provide us with adequate liquidity to support the Company's operations.
Share Repurchase Program
On February 13, 2024, the Board of Directors authorized a $350 million share repurchase program valid until December 31, 2024. For more information, see Item 5. Market for Registrant’s Common Equity, Related Stockholder Matters and Issuer Purchases of Equity Securities - Issuer Purchases of Equity Securities.
During the year ended December 31, 2024, the Company repurchased $296 million of its Common Stock. The share repurchase program expired on December 31, 2024.
On December 4, 2024, the Board of Directors authorized a new $250 million share repurchase program valid January 1, 2025 until December 31, 2025.
Off-Balance Sheet Arrangement
The Company did not engage in any off-balance sheet financial arrangements that have or are reasonably likely to have a material current or future effect on our financial condition, changes in financial condition, revenues or expenses, results of operations, liquidity, capital expenditures or capital resources as of December 31, 2024 and 2023.
Cash Flow Summary for the Years Ended December 31, 2024, 2023 and 2022
Our cash flows from operating, investing and financing activities for the years ended December 31, 2024, 2023 and 2022, as reflected in the Consolidated Financial Statements included in this Annual Report, are summarized as follows:
| | | | | | | | | | | | | | | | | |
| Year Ended December 31, |
| 2024 | | 2023 | | 2022 |
| (Dollars in millions) |
| Cash provided by (used for): | | | | | |
| Operating activities | $ | 408 | | | $ | 465 | | | $ | 375 | |
| Investing activities | (14) | | | (55) | | | (91) | |
| Financing activities | (520) | | | (403) | | | (482) | |
| Effect of exchange rate changes on cash | (8) | | | 5 | | | (18) | |
| Net (decrease) increase in cash and cash equivalents | $ | (134) | | | $ | 12 | | | $ | (216) | |
Cash Flow Summary for the year ended December 31, 2024
Cash provided by operating activities decreased by $57 million for the year ended December 31, 2024 versus the prior year. The decrease was driven by a $32 million change in working capital related primarily to inventory purchases and higher payments made during the current year, partially offset by increased collections. A decrease of $14 million in net income, excluding the effects of non-cash items, and an unfavorable change in other assets and liabilities of $11 million, also contributed to the decrease in cash provided by operating activities.
Cash used for investing activities decreased by $41 million for the year ended December 31, 2024 versus the prior year. The decrease is due to $46 million of proceeds from the sale of an equity investment, $3 million of higher proceeds from our cross-currency swap contracts which have been designated as net investment hedges of our Euro-denominated operations versus the prior year, and $8 million of lower expenditures for property, plant and equipment versus the prior year.
Cash used for financing activities increased by $117 million for the year ended December 31, 2024 compared with the prior year. During 2024, we made an aggregate of $992 million in debt repayments on our term loan facilities. We also made payments of $296 million for the repurchase of Common Stock under our share repurchase program, $8 million for debt issuance costs, $8 million for excise taxes related to Common Stock repurchases and $9 million for other financing activities during the current year. These payments were partially offset by proceeds of $794 million, net of deferred financing costs, from the issuance of our 2032 Senior Notes. In comparison, cash used for financing activities in the prior year was primarily related an aggregate amount of $605 million paid to holders of our Series A Preferred Stock, par value $0.001 per share (the "Series A Preferred Stock"), related to the Transaction, including conversion of the Series A
Preferred Stock as discussed in Note 21, Equity of the Notes to the Consolidated Financial Statements. We also made payments of $213 million for the repurchase of Common Stock under our share repurchase program and debt repayments of $207 million.
Cash Flow Summary for the year ended December 31, 2023
Cash provided by operating activities increased by $90 million for the year ended December 31, 2023 versus the prior year. The increase was driven by $63 million of working capital contribution related primarily to build-ups of inventory in the prior year. An increase of $32 million in net income, excluding the effects of non-cash items, also contributed to the increase in cash provided by operating activities, partially offset by a decrease in other assets and liabilities of $5 million.
Cash used for investing activities decreased by $36 million for the year ended December 31, 2023 versus the prior year. The decrease is due to $28 million of proceeds from our cross-currency swap contracts which have been designated as net investment hedges of our Euro-denominated operations and $8 million of lower expenditures for property, plant and equipment.
Cash used for financing activities decreased by $79 million for the year ended December 31, 2023 compared with the prior year. Cash flows used for financing activities included $667 million from the 2023 Dollar Term Facility net of debt financing costs. We paid an aggregate amount of $605 million to holders of the Series A Preferred Stock related to the Transaction, including conversion of the Series A Preferred Stock as discussed above and in Note 21, Equity of the Notes to the Consolidated Financial Statements. We also made payments of $213 million for the repurchase of Common Stock under our share repurchase program and debt repayments of $207 million. In comparison, cash used for financing activities in the prior year was primarily related to the Company's payment of $381 million for the final early redemption of our Series B Preferred Stock (exclusive of $28 million attributable to interest and included in cash from operating activities) and $83 million for dividends on Series A Preferred Stock, while in 2023, there were $42 million in payments of accrued dividends on the Series A Preferred Stock through June 2023.
Capital Expenditures
We believe our capital spending in recent years has been sufficient to maintain efficient production capacity, to implement important product and process redesigns and to expand capacity to meet increased demand. We expect capital expenditures in 2025 to increase slightly as compared to 2024, primarily driven by higher investments for new product launches across our zero emission and turbo technologies.
Critical Accounting Policies and Estimates
The preparation of our Consolidated Financial Statements in accordance with generally accepted accounting principles is based on the selection and application of accounting policies that require us to make significant estimates and assumptions about the effects of matters that are inherently uncertain. We consider the accounting policies and estimates discussed below to be critical to the understanding of our financial statements. Actual results could differ from our estimates and assumptions, and any such differences could be material to our Consolidated Financial Statements.
Revenue Recognition — Product sales are recognized when we transfer control of the promised goods to our customer, which is based on shipping terms. Revenue is measured as the amount of consideration we expect to receive in exchange for transferring the promised goods, adjusted for any variable consideration such as price concessions or annual price adjustments as estimated at contract inception. We estimate variable consideration at the most likely amount we will receive from customers and reduce revenues recognized accordingly. We include estimated amounts in the transaction price to the extent it is probable that a significant reversal of cumulative revenue recognized will not occur when the uncertainty associated with the variable consideration is resolved. Our estimates of variable consideration and determination of whether to include estimated amounts in the transaction price are based largely on an assessment of our anticipated performance and all information (historical, current and forecasted) that is reasonably available to us. We adjust our estimate of revenue at the earlier of when the value of consideration we expect to receive changes or when the consideration becomes fixed.
Contingent Liabilities — We are subject to lawsuits, investigations and claims that arise out of the conduct of our global business operations or those of previously owned entities, including matters relating to commercial transactions, government contracts, product liability, prior acquisitions and divestitures, employee benefit plans, intellectual property, legal and environmental, health and safety matters. We continually assess the likelihood of any adverse judgments or outcomes to our contingencies, as well as potential amounts or ranges of probable losses, and recognize a liability, if any,
for these contingencies based on a careful analysis of each matter with the assistance of outside legal counsel and, if applicable, other experts. Such analysis includes making judgments concerning matters such as the costs associated with environmental matters, the outcome of negotiations, and the impact of evidentiary requirements. Because most contingencies are resolved over long periods of time, liabilities may change in the future due to new developments (including new discovery of facts, changes in legislation and outcomes of similar cases through the judicial system), changes in assumptions or changes in our settlement strategy. See Note 25, Commitments and Contingencies of the Notes to the Consolidated Financial Statements for a discussion of management’s judgment applied in the recognition and measurement of our most significant contingencies.
Warranties and Guarantees — Expected warranty costs for products sold are recognized based on an estimate of the amount that eventually will be required to settle such obligations. These accruals are based on factors such as past experience, length of the warranty and various other considerations. Costs of product recalls, which may include the cost of the product being replaced as well as the customer’s cost of the recall, including labor to remove and replace the recalled part, are accrued as part of our warranty accrual at the time an obligation becomes probable and can be reasonably estimated. These estimates are adjusted from time to time based on facts and circumstances that impact the status of existing claims. See Note 25, Commitments and Contingencies of the Notes to the Consolidated Financial Statements included herein for additional information.
Pension Benefits — We sponsor defined benefit pension plans covering certain employees, primarily in Switzerland, the U.S. and Ireland. The pension cost and liabilities for these plans are developed from actuarial valuations. Inherent in these valuations are key assumptions including discount rates, expected return on plan assets, mortality rates, and compensation increases. The Company is required to consider current market conditions, including changes in interest rates, and employee demographics such as retirement patterns, in making its assumptions. Changes in the related pension benefit costs or liabilities may occur in the future due to changes in the assumptions.
The discount rate reflects the market rate on December 31 (the measurement date) for high-quality fixed-income investments with maturities corresponding to our pension obligations and is subject to change each year. The discount rate can be volatile from year to year as it is determined based upon prevailing interest rates as of the measurement date. The assumptions as to the expected long-term rates of return on plan assets are based upon historical plan asset returns over varying long-term periods combined with our expectations of future market conditions and asset mix considerations.
We recognize net actuarial gains or losses in excess of 10% of the greater of the fair value of plan assets or the plans’ projected benefit obligation (the corridor) annually in the fourth quarter each year (the “MTM Adjustment”). Net actuarial gains and losses occur when the actual experience differs from any of the various assumptions used to value our pension plans or when assumptions change. The primary factors contributing to actuarial gains and losses are changes in the discount rate used to value pension obligations as of the measurement date each year and the difference between expected and actual returns on plan assets. The mark-to-market accounting method results in the potential for volatile and difficult to forecast MTM Adjustments as the adjustments are primarily driven by events and circumstances beyond the control of the Company such as changes in interest rates and the performance of the financial markets.
Income Taxes — We account for income taxes pursuant to the asset and liability method which requires us to recognize current tax liabilities or receivables for the amount of taxes we estimate are payable or refundable for the current year and deferred tax assets and liabilities for the expected future tax consequences attributable to temporary differences between the financial statement carrying amounts and their respective tax bases of assets and liabilities and the expected benefits of net operating loss and credit carryforwards. Deferred tax assets and liabilities are measured using enacted tax rates expected to apply to taxable income in the years in which those temporary differences are expected to be recovered or settled. The effect on deferred tax assets and liabilities of a change in tax rates is recognized in operations in the period enacted. A valuation allowance is provided when it is more likely than not that a portion or all of a deferred tax asset will not be realized. The ultimate realization of deferred tax assets is dependent upon the generation of future taxable income and the reversal of deferred tax liabilities during the period in which related temporary differences become deductible.
We file tax returns in multiple jurisdictions and are subject to examination by taxing authorities throughout the world. Tax authorities have the ability to review and challenge matters that could be subject to differing interpretation of applicable tax laws and regulations as they relate to the amount, character, timing or inclusion of revenue and expenses or the sustainability of tax attributes. The ultimate resolution of such uncertainties could last several years. When an uncertain tax position is identified, we consider and interpret complex tax laws and regulations in order to determine the need for recognizing a provision in our financial statements. Significant judgment is required in determining the timing and measurement of uncertain tax positions. We utilize internal and external expertise in interpreting tax laws to support our tax
positions. We recognize the financial statement benefit of an uncertain tax position when it is more likely than not that, based on the underlying technical merits, the position will be sustained upon examination.
Although we believe the measurement of our liabilities for uncertain tax positions is reasonable, no assurance can be given that the final outcome of these matters will not be different than what is reflected in the historical income tax provisions and accruals. If additional taxes are assessed as a result of an audit or litigation, they could have a material impact on our income tax provision and net income in the period or periods for which such determination is made. A change in judgment related to the expected ultimate resolution of uncertain tax positions will be recognized in earnings in the quarter in which such change occurs.
Other Matters
Litigation and Environmental Matters
See Note 25, Commitments and Contingencies of the Notes to the Consolidated Financial Statements for a discussion of litigation matters.
Recent Accounting Pronouncements
See Note 3, Summary of Significant Accounting Policies of the Notes to the Consolidated Financial Statements for a discussion of recent accounting pronouncements.
Item 7A. Quantitative and Qualitative Disclosures about Market Risks
Foreign Currency Risk
We are exposed to market risks from changes in currency exchange rates. These exposures may impact future earnings and/or operating cash flows. Our exposure to market risk for changes in foreign currency exchange rates arises from international financing activities between subsidiaries, foreign currency denominated monetary assets and liabilities and transactions arising from international trade.
We historically have hedged balance sheet as well as forecasted currency exposures with natural offsets to the fullest extent possible and, once these opportunities have been exhausted, through foreign currency exchange forward contracts.
We hedge forecasted currency exposure to minimize the earnings exposures arising from foreign currency exchange risk on foreign currency purchases and sales. Under our cash flow hedging program, we designate certain foreign currency forward contracts as cash flow hedges of underlying foreign currency forecasted purchases and sales, with gains and losses on the qualifying derivatives recorded in Accumulated other comprehensive income in the Consolidated Balance Sheet until the underlying forecasted transactions are recognized in earnings. These contracts have varying terms that extend through 2026. We also utilize undesignated foreign currency forward contracts to partially offset gains and losses on the foreign currency remeasurement of balance sheet positions.
Effective with our entry into the Credit Agreement, the Company entered into float-to-float cross-currency swap contracts to limit its exposure to investments in certain foreign subsidiaries exposed to foreign exchange fluctuations. The cross-currency swap contracts have been designated as net investment hedges of its Euro-denominated operations. Gains and losses on the derivatives qualifying as net investment hedges are recorded in Accumulated other comprehensive income within the Consolidated Balance Sheet until the net investment is liquidated or sold.
The Company also uses fixed-to-fixed cross-currency swap contracts to mitigate the foreign currency risk on its 2032 Senior Notes. The cross-currency swap contracts are designated as cash flow hedges, with changes in the fair value of the derivatives recorded in AOCI and reclassified into earnings based upon changes in the spot rate remeasurement of the underlying debt.
As of December 31, 2024, the net fair value of all financial instruments with exposure to currency risk was a $87 million asset. The potential loss or gain in fair value for such financial instruments from a hypothetical 10% adverse or favorable change in quoted currency exchange rates would be $196 million and $(196) million, respectively, at December 31, 2024 exchange rates. The model assumes a parallel shift in currency exchange rates; however, currency exchange rates rarely move in the same direction. The assumption that currency exchange rates change in a parallel fashion may overstate the impact of changing currency exchange rates on assets and liabilities denominated in currencies other than the U.S. dollar.
Interest Rate Risk
Our exposure to risk based on changes in interest rates relates primarily to our Credit Agreement. The Credit Agreement bears interest at floating rates. For variable rate debt, interest rate changes generally do not affect the fair market value of such debt assuming all other factors remain constant but do impact future earnings and cash flows. Accordingly, we may be exposed to interest rate risk on borrowings under the Credit Agreement. We manage this risk by entering into interest rate swap contracts to convert floating rate debt to fixed rate debt to reduce market risk associated with changes in interest rates. As of December 31, 2024, the net fair value of all financial instruments with exposure to interest rate risk was a $6 million asset.
For our outstanding borrowings under the Credit Agreement as of December 31, 2024, a 50 basis point increase (decrease) in interest rates would have increased (decreased) our interest expense by $4 million and ($4) million, respectively, compared to the amount of interest that would have been incurred in such period based on the rates of interest in effect at December 31, 2024. For additional information regarding our Credit Agreement, see Note 16, Long-term Debt and Credit Agreements of the Notes to the Consolidated Financial Statements.
Commodity Price Risk
We do not utilize derivative contracts to manage commodity price risk and are subject to changes in our cost of sales caused by movements in underlying commodity prices. Approximately 83% of our cost of sales consists of purchased components with significant raw material content. A substantial portion of the purchased parts are made of nickel, aluminum and steel alloys. We have index-based escalators in place with most of our suppliers for raw material inflation / deflation. As our costs change, we may be contractually able to pass through a portion of the changes in commodity prices to certain of our customers in accordance with long-term agreements. Where long-term pass-through agreements are not in place with customers, we generally seek to negotiate additional pricing arrangements with our customers. Assuming current levels of commodity purchases, a 10% variation in the commodity prices could impact our cost of sales by up to approximately $43 million per year prior to any price recovery from customers.
Item 8. Financial Statements and Supplementary Data
REPORT OF INDEPENDENT REGISTERED PUBLIC ACCOUNTING FIRM
To the Stockholders and the Board of Directors of Garrett Motion Inc.
Opinion on Internal Control over Financial Reporting
We have audited the internal control over financial reporting of Garrett Motion Inc. and subsidiaries (the "Company") as of December 31, 2024, based on criteria established in Internal Control—Integrated Framework (2013) issued by the Committee of Sponsoring Organizations of the Treadway Commission (COSO). In our opinion, the Company maintained in all material respects, effective internal control over financial reporting as of December 31, 2024, based on criteria established in Internal Control — Integrated Framework (2013) issued by COSO.
We have also audited, in accordance with the standards of the Public Company Accounting Oversight Board (United States) (PCAOB), the consolidated financial statements as of and for the year ended December 31, 2024, of the Company and our report dated February 20, 2025, expressed an unqualified opinion on those consolidated financial statements.
Basis for Opinion
The Company’s management is responsible for maintaining effective internal control over financial reporting and for its assessment of the effectiveness of internal control over financial reporting, included in the accompanying Management’s Report on Internal Control Over Financial Reporting. Our responsibility is to express an opinion on the Company’s internal control over financial reporting based on our audit. We are a public accounting firm registered with the PCAOB and are required to be independent with respect to the Company in accordance with the U.S. federal securities laws and the applicable rules and regulations of the Securities and Exchange Commission and the PCAOB.
We conducted our audit in accordance with the standards of the PCAOB. Those standards require that we plan and perform the audit to obtain reasonable assurance about whether effective internal control over financial reporting was maintained in all material respects. Our audit included obtaining an understanding of internal control over financial reporting, assessing the risk that a material weakness exists, testing and evaluating the design and operating effectiveness of internal control based on the assessed risk, and performing such other procedures as we considered necessary in the circumstances. We believe that our audit provides a reasonable basis for our opinion.
Definition and Limitations of Internal Control over Financial Reporting
A company’s internal control over financial reporting is a process designed to provide reasonable assurance regarding the reliability of financial reporting and the preparation of financial statements for external purposes in accordance with generally accepted accounting principles. A company’s internal control over financial reporting includes those policies and procedures that (1) pertain to the maintenance of records that, in reasonable detail, accurately and fairly reflect the transactions and dispositions of the assets of the company; (2) provide reasonable assurance that transactions are recorded as necessary to permit preparation of financial statements in accordance with generally accepted accounting principles, and that receipts and expenditures of the company are being made only in accordance with authorizations of management and directors of the company; and (3) provide reasonable assurance regarding prevention or timely detection of unauthorized acquisition, use, or disposition of the company’s assets that could have a material effect on the financial statements.
Because of its inherent limitations, internal control over financial reporting may not prevent or detect misstatements. Also, projections of any evaluation of effectiveness to future periods are subject to the risk that controls may become inadequate because of changes in conditions, or that the degree of compliance with the policies or procedures may deteriorate.
/s/ Deloitte SA
Geneva, Switzerland
February 20, 2025
REPORT OF INDEPENDENT REGISTERED PUBLIC ACCOUNTING FIRM
To the Stockholders and the Board of Directors of Garrett Motion Inc.
Opinion on the Financial Statements
We have audited the accompanying consolidated balance sheets of Garrett Motion Inc. and subsidiaries (the "Company") as of December 31, 2024 and 2023, the related consolidated statements of operations, comprehensive income (loss), equity (deficit), and cash flows, for each of the three years in the period ended December 31, 2024, and the related notes and the schedule listed in the Index at Item 15 (collectively referred to as the "financial statements").
In our opinion, the financial statements present fairly, in all material respects, the financial position of the Company as of December 31, 2024 and 2023, and the results of its operations and its cash flows for each of the three years in the period ended December 31, 2024, in conformity with the accounting principles generally accepted in the United States of America.
We have also audited, in accordance with the standards of the Public Company Accounting Oversight Board (United States) (PCAOB), the Company's internal control over financial reporting as of December 31, 2024, based on criteria established in Internal Control — Integrated Framework (2013) issued by the Committee of Sponsoring Organizations of the Treadway Commission and our report dated February 20, 2025 expressed an unqualified opinion on the Company's internal control over financial reporting.
Basis for Opinion
These financial statements are the responsibility of the Company's management. Our responsibility is to express an opinion on the Company's financial statements based on our audits. We are a public accounting firm registered with the PCAOB and are required to be independent with respect to the Company in accordance with the U.S. federal securities laws and the applicable rules and regulations of the Securities and Exchange Commission and the PCAOB.
We conducted our audits in accordance with the standards of the PCAOB. Those standards require that we plan and perform the audit to obtain reasonable assurance about whether the financial statements are free of material misstatement, whether due to error or fraud. Our audits included performing procedures to assess the risks of material misstatement of the financial statements, whether due to error or fraud, and performing procedures that respond to those risks. Such procedures included examining, on a test basis, evidence regarding the amounts and disclosures in the financial statements. Our audits also included evaluating the accounting principles used and significant estimates made by management, as well as evaluating the overall presentation of the financial statements. We believe that our audits provide a reasonable basis for our opinion.
Critical Audit Matter
The critical audit matter communicated below is a matter arising from the current-period audit of the financial statements that was communicated to the audit committee and that (1) relates to accounts or disclosures that are material to the financial statements and (2) involved our especially challenging, subjective, or complex judgments. The communication of a critical audit matter does not alter in any way our opinion on the financial statements, taken as a whole, and we are not, by communicating the critical audit matter below, providing a separate opinion on the critical audit matter or on the accounts or disclosures to which they relate.
Net Sales and Accrued Liabilities - Customer Pricing Reserve related to Variable Consideration – Refer to Notes 3 and 15 to the Financial Statements
Critical Audit Matter Description
As disclosed in Notes 3 and 15 to the consolidated financial statements, the Company records net sales at the amount of consideration the Company expects to receive in exchange for transferring the promised goods, which includes estimates of variable consideration to the extent it is probable that a significant reversal of revenue recognized will not occur. Variability in consideration typically results from discounts and rebates provided to customers. The estimated variable consideration is based primarily on management’s best available information regarding customer negotiations, historical experience, and anticipated future customer pricing strategies. Estimating variable consideration requires significant
judgments by management that affect the amount of revenue recorded in the financial statements. The amount of customer pricing reserve as of December 31, 2024 is $77 million.
Given the significant estimates and assumptions management makes to estimate future discounts and rebates, auditing management's estimates of the amount of customer pricing reserve related to variable consideration to recognize as net sales required a high degree of auditor judgement.
How the Critical Audit Matter Was Addressed in the Audit
Our audit procedures related to the estimate of variable consideration and the customer pricing reserve included the following, among others:
•We tested the effectiveness of relevant controls over the estimation of the variable consideration within net sales including review of discounts and rebates which impact the customer pricing reserve.
•We selected a sample of revenue contracts with variable consideration and performed the following:
◦Obtained contractual documents, including master agreements and other related documents, and evaluated whether variable consideration were consistent with the terms of the contracts.
◦Compared transaction prices to the consideration expected to be received to assess whether variable consideration was completely and accurately recorded.
•We further tested management's estimate of the variable consideration and performed the following:
◦Evaluated historical information to determine management’s ability to accurately estimate sales volumes and future concessions.
◦Inquired with individuals in the Company’s finance, operations and sales departments regarding the customer negotiations and examined supporting evidence as applicable.
◦Performed retrospective assessment of the previous year's accruals within the customer pricing reserve to ensure they were appropriately utilized throughout the current period, in order to conclude on management's ability to make reliable forecasts.
◦Tested the mathematical accuracy of the variable consideration calculation.
We inspected manual revenue journal entries for unusual entries affecting revenue and examined supporting evidence.
/s/ Deloitte SA
Geneva, Switzerland
February 20, 2025
We have served as the Company’s auditor since 2018.
GARRETT MOTION INC.
CONSOLIDATED STATEMENTS OF OPERATIONS
| | | | | | | | | | | | | | | | | |
| Year Ended December 31, |
| 2024 | | 2023 | | 2022 |
| (Dollars in millions except per share amounts) |
| Net sales (Note 4) | $ | 3,475 | | | $ | 3,886 | | | $ | 3,603 | |
| Cost of goods sold | 2,770 | | | 3,130 | | | 2,920 | |
| Gross profit | 705 | | | 756 | | | 683 | |
| Selling, general and administrative expenses | 240 | | | 247 | | | 216 | |
| Other expense, net (Note 5) | 6 | | | 5 | | | 2 | |
| Interest expense | 156 | | | 159 | | | 8 | |
| Loss on extinguishment of debt (Note 17) | — | | | — | | | 5 | |
| | | | | |
| Gain on sale of equity investment (Note 28) | (27) | | | — | | | — | |
| Non-operating income, net (Note 6) | (13) | | | (2) | | | (47) | |
| Reorganization items, net (Note 2) | — | | | — | | | 3 | |
| Income before taxes | 343 | | | 347 | | | 496 | |
| Tax expense (Note 7) | 61 | | | 86 | | | 106 | |
| Net income | 282 | | | 261 | | | 390 | |
| Less: preferred stock dividends (Note 21) | — | | | (80) | | | (157) | |
| Less: preferred stock deemed dividends (Note 21) | — | | | (232) | | | — | |
| Net income (loss) available for distribution | $ | 282 | | | $ | (51) | | | $ | 233 | |
| | | | | |
| Earnings (Loss) per share (Note 24) | | | | | |
| Basic | $ | 1.27 | | | $ | (0.31) | | | $ | 0.75 | |
| Diluted | $ | 1.26 | | | $ | (0.31) | | | $ | 0.75 | |
| | | | | |
| Weighted average common shares outstanding | | | | | |
| Basic | 222,316,484 | | | 166,595,397 | | | 64,708,635 | |
| Diluted | 224,121,156 | | | 166,595,397 | | | 65,075,992 | |
The Notes to the Consolidated Financial Statements are an integral part of this statement.
GARRETT MOTION INC.
CONSOLIDATED STATEMENTS OF COMPREHENSIVE INCOME (LOSS)
| | | | | | | | | | | | | | | | | |
| Year Ended December 31, |
| 2024 | | 2023 | | 2022 |
| (Dollars in millions) |
| Net income | $ | 282 | | | $ | 261 | | | $ | 390 | |
| Foreign exchange translation adjustment | 30 | | | (13) | | | (1) | |
| Defined benefit pension plan adjustment, net of tax (Note 26) | 5 | | | (2) | | | (9) | |
| Changes in fair value of effective cash flow hedges, net of tax (Note 19) | (8) | | | (15) | | | 6 | |
| Changes in fair value of net investment hedges, net of tax (Note 19) | 49 | | | (9) | | | 44 | |
| Total other comprehensive income (loss) | 76 | | | (39) | | | 40 | |
| Comprehensive income | $ | 358 | | | $ | 222 | | | $ | 430 | |
The Notes to the Consolidated Financial Statements are an integral part of this statement.
GARRETT MOTION INC.
CONSOLIDATED BALANCE SHEETS
| | | | | | | | | | | |
| December 31, |
| 2024 | | 2023 |
| (Dollars in millions) |
| ASSETS | | | |
| Current assets: | | | |
| Cash and cash equivalents | $ | 125 | | | $ | 259 | |
| Restricted cash (Note 3) | 1 | | | 1 | |
| Accounts, notes and other receivables, net (Note 8) | 687 | | | 808 | |
| Inventories, net (Note 10) | 286 | | | 263 | |
| Other current assets (Note 11) | 94 | | | 75 | |
| Total current assets | 1,193 | | | 1,406 | |
| Investments and long-term receivables | 10 | | | 29 | |
| Property, plant and equipment, net (Note 13) | 449 | | | 477 | |
| Goodwill (Note 14) | 193 | | | 193 | |
| Deferred income taxes (Note 7) | 207 | | | 216 | |
| Other assets (Note 12) | 224 | | | 206 | |
| Total assets | $ | 2,276 | | | $ | 2,527 | |
| LIABILITIES | | | |
| Current liabilities: | | | |
| Accounts payable | $ | 972 | | | $ | 1,074 | |
| | | |
| Current maturities of long-term debt (Note 16) | 7 | | | 7 | |
| | | |
| | | |
| Accrued liabilities (Note 15) | 299 | | | 293 | |
| Total current liabilities | 1,278 | | | 1,374 | |
| Long-term debt (Note 16) | 1,464 | | | 1,643 | |
| | | |
| Deferred income taxes (Note 7) | 25 | | | 27 | |
| Other liabilities (Note 20) | 182 | | | 218 | |
| | | |
| | | |
| Total liabilities | $ | 2,949 | | | $ | 3,262 | |
COMMITMENTS AND CONTINGENCIES (Note 25) | | | |
| EQUITY (DEFICIT) | | | |
| | | |
| Common Stock, par value $0.001; 1,000,000,000 and 1,000,000,000 shares authorized, 240,987,329 and 238,543,624 issued and 206,387,938 and 238,249,056 outstanding as of December 31, 2024 and 2023, respectively | — | | | — | |
| Additional paid-in capital | 1,213 | | | 1,190 | |
| Retained deficit | (1,653) | | | (1,922) | |
| Accumulated other comprehensive income (loss) (Note 22) | 73 | | | (3) | |
| Treasury Stock, at cost; 34,599,391 and 0 shares as of December 31, 2024 and 2023, respectively (Note 21) | (306) | | | — | |
| Total deficit | (673) | | | (735) | |
| Total liabilities and deficit | $ | 2,276 | | | $ | 2,527 | |
The Notes to the Consolidated Financial Statements are an integral part of this statement.
GARRETT MOTION INC.
CONSOLIDATED STATEMENTS OF CASH FLOWS
| | | | | | | | | | | | | | | | | |
| Year Ended December 31, |
| (Dollars in millions) | 2024 | | 2023 | | 2022 |
| Cash flows from operating activities: | | | | | |
| Net income | $ | 282 | | | $ | 261 | | | $ | 390 | |
| Adjustments to reconcile net income to net cash provided by operating activities | | | | | |
| | | | | |
| Deferred income taxes | 7 | | | 24 | | | 46 | |
| Depreciation | 90 | | | 90 | | | 84 | |
| Amortization of deferred debt issuance costs | 37 | | | 20 | | | 8 | |
| Interest payments on Series B Preferred Stock, net of debt discount accretion | — | | | — | | | (19) | |
| Loss on extinguishment of debt | — | | | — | | | 5 | |
| Loss on remeasurement of forward purchase contract | — | | | 13 | | | — | |
| Gain on sale of equity investment | (27) | | | — | | | — | |
| Foreign exchange loss (gain) | 27 | | | (15) | | | (1) | |
| Stock compensation expense | 23 | | | 14 | | | 11 | |
| Pension expense | (6) | | | (1) | | | (28) | |
| Unrealized (gain) loss on derivatives | (2) | | | 51 | | | (65) | |
| Other | (6) | | | 7 | | | 1 | |
| Changes in assets and liabilities: | | | | | |
| Accounts, notes and other receivables | 89 | | | 1 | | | (102) | |
| Inventories | (48) | | | 12 | | | (48) | |
| Other assets | (25) | | | (2) | | | 34 | |
| Accounts payable | (52) | | | 8 | | | 108 | |
| Accrued liabilities | 26 | | | (8) | | | (17) | |
| | | | | |
| Other liabilities | (7) | | | (10) | | | (32) | |
| Net cash provided by operating activities | 408 | | | 465 | | | 375 | |
| Cash flows from investing activities: | | | | | |
| Expenditures for property, plant and equipment | (91) | | | (83) | | | (91) | |
| Proceeds from cross-currency swap contracts | 31 | | | 28 | | | — | |
| Proceeds from sale of equity investment | 46 | | | — | | | — | |
| Net cash used for investing activities | (14) | | | (55) | | | (91) | |
| Cash flows from financing activities: | | | | | |
| | | | | |
| Proceeds from issuance of long-term debt, net of deferred financing costs | 794 | | | 667 | | | — | |
| | | | | |
| Payments of long-term debt | (992) | | | (207) | | | (7) | |
| | | | | |
| Payments for dividends | — | | | (42) | | | (83) | |
| Repurchases of Series A Preferred Stock | — | | | (580) | | | (7) | |
| Repurchases of Common Stock | (296) | | | (213) | | | — | |
| Excise tax on Common Stock repurchase | (8) | | | — | | | — | |
| | | | | |
| Payments of Additional Amounts for conversion of Series A Preferred Stock | — | | | (25) | | | — | |
| Redemption of Series B Preferred stock | — | | | — | | | (381) | |
| | | | | |
| Payments for debt and revolving facility financing costs | (8) | | | (2) | | | (4) | |
| Other | (10) | | | (1) | | | — | |
| Net cash used for financing activities | (520) | | | (403) | | | (482) | |
| Effect of foreign exchange rate changes on cash, cash equivalents and restricted cash | (8) | | | 5 | | | (18) | |
| Net (decrease) increase in cash, cash equivalents and restricted cash | (134) | | | 12 | | | (216) | |
| Cash, cash equivalents and restricted cash at beginning of period | 260 | | | 248 | | | 464 | |
| Cash, cash equivalents and restricted cash at end of period | $ | 126 | | | $ | 260 | | | $ | 248 | |
| Supplemental cash flow disclosures: | | | | | |
| Income taxes paid (net of refunds) | $ | 64 | | | $ | 60 | | | $ | 42 | |
| Interest paid | 88 | | | 89 | | | 65 | |
| Reorganization items paid | — | | | — | | | 5 | |
| Supplemental disclosure of non-cash financing activities: | | | | | |
| Dividends declared, not paid | $ | 13 | | | $ | — | | | $ | — | |
| | | | | |
| | | | | |
| | | | | |
The Notes to the Consolidated Financial Statements are an integral part of this statement.
GARRETT MOTION INC.
CONSOLIDATED STATEMENTS OF EQUITY (DEFICIT)
| | | | | | | | | | | | | | | | | | | | | | | | | | | | | | | | | | | | | | | | | | | | | | | | | | | | | | | | | | | | |
| Series A
Preferred Stock | | Common Stock | | Treasury Stock | | Additional
Paid-in
Capital | | Retained
Deficit | | Accumulated Other
Comprehensive
Income/(Loss) | | Total
Deficit | |
| Shares | | Amount | | Shares (1) | | Amount | | Shares | | Amount | | | | | |
| (in millions) | |
| | | | | | | | | | | | | | | | | | | | |
| | | | | | | | | | | | | | | | | | | | |
| | | | | | | | | | | | | | | | | | | | |
| | | | | | | | | | | | | | | | | | | | |
| | | | | | | | | | | | | | | | | | | | |
| | | | | | | | | | | | | | | | | | | | |
| | | | | | | | | | | | | | | | | | | | |
| | | | | | | | | | | | | | | | | | | | |
| | | | | | | | | | | | | | | | | | | | |
| | | | | | | | | | | | | | | | | | | | |
| | | | | | | | | | | | | | | | | | | | |
| | | | | | | | | | | | | | | | | | | | |
| | | | | | | | | | | | | | | | | | | | |
| | | | | | | | | | | | | | | | | | | | |
| Balance at December 31, 2021 | 246 | | | $ | — | | | 64 | | | $ | — | | | $ | — | | | $ | — | | | $ | 1,326 | | | $ | (1,790) | | | $ | (4) | | | $ | (468) | | |
| Net income | — | | | — | | | — | | | — | | | — | | | — | | | — | | | 390 | | | — | | | 390 | | |
| Share repurchases | — | | | — | | | — | | | — | | | — | | | — | | | (4) | | | (2) | | | — | | | (6) | | |
| Other comprehensive income, net of tax | — | | | — | | | — | | | — | | | — | | | — | | | — | | | — | | | 40 | | | 40 | | |
| Preferred Stock dividends | — | | | — | | | — | | | — | | | — | | | — | | | — | | | (83) | | | — | | | (83) | | |
| Stock-based compensation | — | | | — | | | — | | | — | | | — | | | — | | | 11 | | | — | | | — | | | 11 | | |
| Balance at December 31, 2022 | 246 | | | $ | — | | | 64 | | | $ | — | | | $ | — | | | $ | — | | | $ | 1,333 | | | $ | (1,485) | | | $ | 36 | | | $ | (116) | | |
| Net income | — | | | — | | | — | | | — | | | — | | | — | | | — | | | 261 | | | — | | | 261 | | |
| Repurchases of Series A Preferred Stock | (70) | | | — | | | — | | | — | | | — | | | — | | | (366) | | | (201) | | | — | | | (567) | | |
| Repurchases of Common Stock | — | | | — | | | (28) | | | — | | | — | | | — | | | — | | | (213) | | | — | | | (213) | | |
| Excise tax on share repurchases | — | | | — | | | — | | | — | | | — | | | — | | | — | | | (8) | | | — | | | (8) | | |
| Other comprehensive loss, net of tax | — | | | — | | | — | | | — | | | — | | | — | | | — | | | — | | | (39) | | | (39) | | |
| Preferred Stock dividends | — | | | — | | | — | | | — | | | — | | | — | | | — | | | (42) | | | — | | | (42) | | |
| Issuance of Common Stock for preference dividends | — | | | — | | | 26 | | | — | | | — | | | — | | | 209 | | | (209) | | | — | | | — | | |
| Conversion of Series A Preferred Stock to Common Stock | (176) | | | — | | | 176 | | | — | | | — | | | — | | | — | | | (25) | | | — | | | (25) | | |
| Stock-based compensation | — | | | — | | | — | | | — | | | — | | | — | | | 14 | | | — | | | — | | | 14 | | |
| Balance at December 31, 2023 | — | | | $ | — | | | 238 | | | $ | — | | | $ | — | | | $ | — | | | $ | 1,190 | | | $ | (1,922) | | | $ | (3) | | | $ | (735) | | |
| Net income | — | | | — | | | — | | | — | | | — | | | — | | | — | | | 282 | | | — | | | 282 | | |
| Share repurchases | — | | | — | | | — | | | — | | | 34 | | | (296) | | | — | | | — | | | — | | | (296) | | |
| Excise tax on share repurchases | — | | | — | | | — | | | — | | | — | | | (3) | | | — | | | — | | | — | | | (3) | | |
| Shares issued under stock plan, net of shares withheld for employee taxes | — | | | — | | | 3 | | | — | | | 1 | | | (7) | | | — | | | — | | | — | | | (7) | | |
| Other comprehensive income, net of tax | — | | | — | | | — | | | — | | | — | | | — | | | — | | | — | | | 76 | | | 76 | | |
| Common Stock dividends | — | | | — | | | — | | | — | | | — | | | — | | | — | | | (13) | | | — | | | (13) | | |
| Stock-based compensation | — | | | — | | | — | | | — | | | — | | | — | | | 23 | | | — | | | — | | | 23 | | |
| Balance at December 31, 2024 | — | | | $ | — | | | 241 | | | $ | — | | | 35 | | | $ | (306) | | | $ | 1,213 | | | $ | (1,653) | | | $ | 73 | | | $ | (673) | | |
1) Common shares issued less treasury shares equals common shares outstanding
The Notes to the Consolidated Financial Statements are an integral part of this statement.
GARRETT MOTION INC.
NOTES TO CONSOLIDATED FINANCIAL STATEMENTS
Note 1. Background and Basis of Presentation
Background
Garrett Motion Inc. (the "Company" or "Garrett") is a cutting-edge technology leader delivering differentiated solutions for emission reduction and energy efficiency. We design, manufacture and sell highly engineered turbocharging, air and fluid compression, and high-speed electric motor technologies for OEMs and distributors within the mobility and industrial space. We have significant expertise in delivering products at scale for ICE using gasoline, diesel, natural gas and hydrogen, as well as for zero emission technologies using hydrogen fuel cell systems, both for mobility and industrial use. As our customers continue to progress on electrification, we are applying our technological pillars to develop highly engineered E-Powertrain and E-Cooling compressor products to support their ambition. These products are key enablers for fuel economy, energy efficiency, thermal management, and compliance with emissions standards and overall greenhouse gas and other emission reduction targets.
Basis of Presentation
The accompanying Consolidated Financial Statements have been prepared in accordance with accounting principles generally accepted in the United States of America (“GAAP”). All amounts presented are in millions, except per share amounts.
We evaluate segment reporting in accordance with ASC 280, Segment Reporting. We concluded that Garrett operates in a single operating segment and a single reportable segment based on the operating results available and evaluated regularly by the chief operating decision maker (“CODM”), who is our Chief Executive Officer, to make decisions about resource allocation and performance assessment. The CODM makes operational performance assessments and resource allocation decisions on a consolidated basis, inclusive of all of the Company’s products across channels and geographies.
Note 2. Plan of Reorganization
On September 20, 2020 (the "Petition Date"), the Company and certain of its subsidiaries each filed a voluntary petition for relief under Chapter 11 of title 11 of the United States Code (the "Chapter 11 Cases") in the United States Bankruptcy Court for the Southern District of New York (the “Bankruptcy Court”). A Revised Amended Plan of Reorganization ("Plan") was confirmed by the Bankruptcy Court on April 26, 2021, and the Company emerged from bankruptcy (“Emergence”) on April 30, 2021 (the "Effective Date").
The Company applied ASC 852, Reorganizations, in preparing its Consolidated Financial Statements during its Chapter 11 bankruptcy proceedings, which required the financial statements for periods subsequent to filing for Chapter 11 to distinguish transactions and events that were directly associated with the Company's reorganization from the ongoing operations of the business. Revenues, expenses, realized gains and losses, and provisions for losses directly resulting from the reorganization and restructuring were reported separately as Reorganization items, net in the Consolidated Statements of Operations. Upon Emergence, the Company did not meet the requirements under ASC 852 for fresh start accounting and in accordance with ASC 852, a new reporting entity was not created for accounting purposes.
Reorganization items, net represent amounts incurred after the Petition Date as a direct result of the Chapter 11 Cases and amounted to an expense of $3 million for the year ended December 31, 2022. There were no Reorganization items, net for the years ended December 31, 2024 and 2023.
Note 3. Summary of Significant Accounting Policies
Use of Estimates
The preparation of the Consolidated Financial Statements in conformity with GAAP requires management to make estimates and assumptions that affect the reported amounts of assets and liabilities and disclosure of contingent assets and liabilities at the date of the financial statements and the reported amounts of revenues and expenses during the reporting period. Actual results could differ from those estimates. Estimates and assumptions are periodically reviewed and the effects of changes are reflected in the Consolidated Financial Statements in the period they are determined to be necessary.
Principles of Consolidation and Combination
The Consolidated Financial Statements include the accounts of Garrett Motion Inc. and all of its subsidiaries in which a controlling financial interest is maintained. We consolidate entities that we control due to ownership of a majority voting interest, and we consolidate variable interest entities when we have variable interests and are the primary beneficiary. Our consolidation policy requires equity investments that we exercise significant influence over but in which we do not have a controlling financial interest to be accounted for using the equity method. Investments through which we are not able to exercise significant influence over the investee and which we do not have readily determinable fair values are accounted for under the cost method. All intercompany transactions and balances are eliminated in consolidation.
Cash and Cash Equivalents
Cash and cash equivalents include cash on hand and highly liquid investments having an original maturity of three months or less.
Restricted Cash
Restricted cash primarily consists of bank deposits pledged as collateral to issue bank notes (refer to Note 9, Factoring and Notes Receivable).
Trade Receivables and Allowance for Doubtful Accounts
Trade accounts receivable are recorded at the invoiced amount as a result of transactions with customers. In accordance with ASC 326, Financial Instruments - Credit Losses, the Company maintains allowances for doubtful accounts for losses as a result of a customer’s inability to make required payments, estimated based on the expected credit losses over the contractual life of the receivables based on days past due as measured from the contractual due date and collection history. The Company also takes into consideration changes in economic conditions that may not be reflected in historical trends (for example, customers in bankruptcy, liquidation or reorganization). Receivables are written-off against the allowance for doubtful accounts when they are determined uncollectible. Such determination includes analysis and consideration of the particular conditions of the account, including time intervals since last collection, customer performance against agreed upon payment plans, solvency of customer and any bankruptcy proceedings.
Transfer of Financial Instruments
Sales and transfers of financial instruments are accounted for under ASC 860, Transfers and Servicing. The Company may discount and sell accounts receivables during the normal course of business. These receivables which are transferred to a third party without recourse to the Company and that meet the criteria of sales accounting as per ASC 860, are excluded from the amounts reported in the Consolidated Balance Sheets. The cash proceeds received from such sales are included in operating cash flows. The expenses associated with the factoring of receivables are recorded within Other expense, net in the Consolidated Statements of Operations.
The Company may also receive bank notes in settlement of accounts receivables, primarily in the Asia Pacific region. Such bank notes are classified as notes receivables under Accounts, notes and other receivables – net in the Consolidated Balance Sheets. The collections of such bank notes are included in operating cash flows and any expenses related to discounting these are included within Other expense, net in the Consolidated Statements of Operations. The Company can hold the bank notes until maturity, exchange them with suppliers to settle liabilities, or sell them to third party financial institutions in exchange for cash.
Inventories
Inventories are stated at the lower of cost, determined on a first-in, first-out basis, including direct material costs and direct and indirect manufacturing costs, or net realizable value. Obsolete inventory is identified based on analysis of inventory for known obsolescence issues. The original equipment inventory on hand in excess of forecasted usage and lack of consumption in the previous 12 months is fully reserved, unless the value of such material is recoverable from either the vendor or the customer.
Property, Plant and Equipment, Net
Property, plant and equipment are recorded at cost less accumulated depreciation and amortization. Depreciation is calculated using the straight-line method over the estimated useful lives of assets, which are 10 to 50 years for buildings and improvements, 2 to 16 years for machinery and equipment, 3 to 10 years for tooling equipment, and 5 to 7 years for software. Maintenance and repairs are expensed as incurred.
Impairment testing of long lived assets is completed by the Company in accordance with ASC 360, Property, Plant and Equipment. The testing is completed when a triggering event occurs, or at least on an annual basis to assess if any impairment triggering events existed during the year. If a triggering event occurs or is identified, the impairment testing is completed using the two-step impairment model. Asset classes are identified and tested for recoverability by comparing the net carrying value of the asset group to the undiscounted net cash flows to be generated from the use and eventual disposition of that asset group. If the carrying amount of an asset group is not recoverable, an impairment loss is recognized if the carrying amount exceeds the fair value. The impairment analysis was completed in 2024 with no triggering events identified.
Leases
Right-of-use (“ROU”) assets represent our right to use an underlying asset for the lease term and lease liabilities represent our obligation to make lease payments arising from the lease. Operating lease ROU assets and liabilities are recognized at the commencement date of a lease (the “commencement date”) based on the present value of lease payments over the lease term. We determine if an arrangement is a lease at inception. Operating leases are included in Other assets, Accrued liabilities, and Other liabilities in our Consolidated Balance Sheets. Finance leases are included in Property, plant and equipment - net in our Consolidated Balance Sheets. As most of our leases do not provide an implicit rate, we use our incremental borrowing rate based on the information available at commencement date in determining the present value of lease payments. We use the implicit rate when readily determinable. The lease ROU asset also includes any lease payments made and excludes lease incentives. Our lease terms may include options to extend or terminate the lease where it is reasonably certain that we will exercise that option. Lease expense for lease payments is recognized on a straight-line basis over the lease term. Variable lease payments are expensed in the period in which they occur. We have lease agreements with lease and non-lease components, which are generally accounted for separately. For machinery and equipment, we account for the lease and non-lease components as a single lease component. We account for short-term leases by recognizing lease payments in net income on a straight-line basis over the lease term and will not recognize any ROU assets and lease liabilities on the Consolidated Balance Sheet.
Goodwill
Goodwill is subject to impairment testing annually, and whenever events or changes in circumstances indicate that the carrying amount may not be fully recoverable. This testing compares carrying value to fair value of our single reporting unit. The Company recognizes an impairment charge for the amount by which the carrying value of the reporting unit exceeds the reporting unit´s fair value. However, any impairment should not exceed the amount of goodwill allocated to the reporting unit. Because we have a single reporting unit with a negative carrying value, no impairment was recognized.
Warranties and Guarantees
Expected warranty costs for products sold are recognized based on an estimate of the amount that eventually will be required to settle such obligations. These accruals are based on factors such as past experience, length of the warranty and various other considerations. Costs of product recalls, which may include the cost of the product being replaced as well as the customer’s cost of the recall, including labor to remove and replace the recalled part, are accrued as part of our warranty accrual at the time an obligation becomes probable and can be reasonably estimated. These estimates are adjusted from time to time based on facts and circumstances that impact the status of existing claims. For additional information, see Note 25, Commitments and Contingencies.
Sales Recognition
Product sales are recognized when we transfer control of the promised goods to our customer, which is based on shipping terms. Revenue is measured as the amount of consideration we expect to receive in exchange for transferring the promised goods, adjusted for any variable consideration such as price concessions or annual price adjustments as estimated at contract inception. Amounts billed but ultimately expected to be refunded to the customer are recorded as part of the customer pricing reserve within Accrued liabilities on the Consolidated Balance Sheet.
In the sale of products in the OEM channel, the transaction price for these goods is generally equal to the agreed price of each unit and represents the standalone selling price for the unit. In the sale of products in the aftermarket channel, the terms of a contract or the historical business practice can give rise to variable consideration due to, but not limited to, discounts and rebates.
We estimate variable consideration at the most likely amount we will receive from customers and reduce revenues recognized accordingly. We include estimated amounts in the transaction price to the extent it is probable that a significant
reversal of cumulative revenue recognized will not occur when the uncertainty associated with the variable consideration is resolved. Our estimates of variable consideration and determination of whether to include estimated amounts in the transaction price are based largely on an assessment of our anticipated performance and all information (historical, current and forecasted) that is reasonably available to us. We adjust our estimate of revenue at the earlier of when the value of consideration we expect to receive changes or when the consideration becomes fixed.
Research and Development
Garrett conducts research and development (“R&D”) activities, which consist primarily of the development of new products and product applications. R&D costs are charged to expense as incurred. Such costs are included in Cost of goods sold and were $187 million, $175 million and $153 million, for the years ended December 31, 2024, 2023 and 2022, respectively. Additionally, the Company incurs engineering-related expenses which are also included in Cost of goods sold and amounted to $(26) million, $(12) million and $11 million for the years ended December 31, 2024, 2023 and 2022, respectively. Engineering-related expenses included customer reimbursements of $67 million, $46 million and $25 million for the years ended December 31, 2024, 2023 and 2022, respectively.
Certain engineering expenses related to long-term supply arrangements are capitalized when defined criteria, such as the existence of a contractual guarantee for reimbursement, are met. As of December 31, 2024 and 2023, $29 million and $12 million, respectively, of such contractually reimbursable costs were capitalized. These amounts are recorded within Other current assets in the Consolidated Balance Sheets.
Government Incentives
The Company receives incentives from governmental entities related to expenses, assets, and other activities. The associated terms of the incentives can vary by country. Government incentives are recorded in the financial statements in accordance with their purpose as a reduction of expense, a reduction of asset cost or other operating or non-operating income. Incentives are recognized when there is probable assurance that the Company will comply with the conditions for the incentives and a reasonable expectation that the funds will be received. Government incentives received prior to being earned are recognized as deferred income whereas incentives earned prior to being received are recognized as receivables. The Company recognized government incentives of $19 million, $14 million and $25 million for the years ended December 31, 2024, 2023 and 2022, respectively. These amounts are recorded in Cost of goods sold and Selling, general and administrative expenses in the Consolidated Statements of Operations.
Supplier Financing
The Company has supplier financing arrangements with two third-party financial institutions under which certain suppliers may factor their receivables from Garrett. The Company also enters into arrangements with banking institutions to issue bankers acceptance drafts in settlement of accounts payables, primarily in the Asia Pacific region. The bankers acceptance drafts, or guaranteed bank notes, have a contractual maturity of six months or less, and may be held by suppliers until maturity, transferred to their suppliers, or discounted with financial institutions in exchange for cash. Supplier financing obligations outstanding and guaranteed bank notes outstanding are recorded within Accounts payable. The following table summarizes the activity related to our supplier financing obligations and guaranteed bank notes:
| | | | | | | | | | | | |
| Supplier Financing Obligations Outstanding | | Guaranteed Bank Notes Outstanding | |
| (Dollars in millions) | |
| Balance at December 31, 2023 | $ | 68 | | | $ | 193 | | |
| Obligations added to the program | 249 | | | 340 | | |
| Obligations settled | (250) | | | (386) | | |
| Foreign currency translation | (3) | | | (6) | | |
| Balance at December 31, 2024 | $ | 64 | | | $ | 141 | | |
| | | | |
| | | | |
| | | | |
Environmental Matters
The Company records liabilities for environmental assessments and remediation activities in the period in which it is probable that a liability has been incurred and the amount of that liability can be reasonably estimated. Estimated costs are recorded at undiscounted amounts, based on experience and assessments and are regularly evaluated. To the extent that the
required remediation procedures change, or additional contamination is identified, the Company’s estimated environmental liabilities may also change. The liabilities are recorded in Accrued liabilities and Other liabilities in the Consolidated Balance Sheets.
Stock-Based Compensation
The principal awards issued under our stock-based compensation plans, which are described in Note 23, Stock-Based Compensation, are performance stock units and restricted stock units. The cost for such awards is measured at the grant date based on the fair value of the award. Compensation expense is recognized over the requisite service periods (generally the vesting period of the equity award) based on the Company's best estimate of ultimate performance against the award targets, and is included in Selling, general and administrative expenses in the Consolidated Statements of Operations. The Company accounts for forfeitures as they occur.
Pension Benefits
We sponsor defined benefit pension plans covering certain employees, primarily in Switzerland, the U.S. and Ireland. For such plans, we are required to disaggregate the service cost component of net benefit costs and report those costs in the same line item or items in the Consolidated Statements of Operations as other compensation costs arising from services rendered by the pertinent employees during the period. The other non service components of net benefit costs are required to be presented separately from the service cost component. We record the service cost component of Pension expense (income) in Cost of goods sold or Selling, general and administrative expenses. The remaining components of net benefit costs within Pension expense (income), primarily interest costs and assumed return on plan assets, are recorded in Non-operating expense (income). We recognize net actuarial gains or losses in excess of 10% of the greater of the fair value of plan assets or the plans’ projected benefit obligation (the corridor) annually in the fourth quarter each year (“MTM Adjustment”). The MTM Adjustment is recorded in Non-operating expense (income).
Foreign Currency Translation
Assets and liabilities of subsidiaries operating outside the United States with a functional currency other than U.S. Dollars are translated into U.S. Dollars using year-end exchange rates. Sales, costs and expenses are translated at the average exchange rates in effect during the year. Foreign currency translation gains and losses are included as a component of Accumulated other comprehensive income ("AOCI").
Derivative Financial Instruments
We minimize our risks from foreign currency exchange rate fluctuations through our normal operating and financing activities and, when deemed appropriate, through the use of derivative financial instruments. Derivative financial instruments are used to manage risk and are not used for trading or other speculative purposes. Derivative financial instruments that qualify for hedge accounting must be designated and effective as a hedge of the identified risk exposure at the inception of the contract. Accordingly, changes in fair value of the derivative contract must be highly correlated with changes in fair value of the underlying hedged item at inception of the hedge and over the life of the hedge contract.
All derivatives are recorded on the Consolidated Balance Sheets as assets or liabilities and measured at fair value. For derivatives designated as cash flow hedges, the effective portion of the changes in fair value of the derivatives are recorded in AOCI and subsequently recognized in earnings when the hedged items impact earnings. Cash flows of such derivative financial instruments are classified consistent with the underlying hedged items. For derivatives designated as net investment hedges, provided the hedging relationship is highly effective, the changes in fair value of the derivatives are recorded in AOCI until the net investment is liquidated or sold.
Income Taxes
We account for income taxes pursuant to the asset and liability method which requires us to recognize current tax liabilities or receivables for the amount of taxes we estimate are payable or refundable for the current year and deferred tax assets and liabilities for the expected future tax consequences attributable to temporary differences between the financial statement carrying amounts and their respective tax bases of assets and liabilities and the expected benefits of net operating loss and credit carryforwards. Deferred tax assets and liabilities are measured using enacted tax rates expected to apply to taxable income in the years in which those temporary differences are expected to be recovered or settled. The effect on deferred tax assets and liabilities of a change in tax rates is recognized in operations in the period enacted. A valuation allowance is provided when it is more likely than not that a portion or all of a deferred tax asset will not be realized. The
ultimate realization of deferred tax assets is dependent upon the generation of future taxable income and the reversal of deferred tax liabilities during the period in which related temporary differences become deductible.
We reclassify taxes from AOCI to earnings as the items to which the tax effects relate are similarly reclassified.
Earnings per share
For the year ended December 31, 2024, basic earnings per share are calculated using the weighted-average number of common shares outstanding during the period.
For the years ended December 31, 2023 and 2022, basic earnings per share were calculated using the two-class method, because our Series A Preferred Stock was considered a participating security prior to its conversion into Common Stock and cancellation pursuant to the Transaction. The two-class method requires an allocation of earnings to all securities that participate in dividends with common shares, which included our Series A Preferred Stock, to the extent that each such security may share in the Company's earnings. Basic earnings per share are calculated by dividing undistributed earnings allocated to Common Stock by the weighted average number of common shares.
Diluted earnings per share for the year ended December 31, 2024 is calculated based on the weighted-average number of common shares outstanding for the period plus the dilutive effect of common stock equivalents using the treasury stock method. Diluted earnings per share for the yeas ended December 31, 2023 and 2022 were calculated using the more dilutive of the two-class or if-converted methods. The two-class method uses net income available to common shareholders and assumes conversion of all potential shares other than the participating securities. The if-converted method uses net income and assumes conversion of all potential shares including the participating securities. See Note 24, Earnings Per Share for further details.
Related Party Transactions
We contract with Trane Technologies ("Trane") for the occasional purchase of goods and services. Mr. Paul Camuti, a director on our Board of Directors, served as an executive officer of Trane through December 31, 2024, and was considered a related party until that time. Our payments under the agreements with Trane amounted to $1 million for the year ended December 31, 2024, and were included in Cost of goods sold in our Consolidated Statement of Operations. The liability balance due to Trane as of December 31, 2024, was immaterial.
We lease certain facilities and receive property maintenance services from Honeywell International ("Honeywell"), which as of Emergence was the owner of our Series B Preferred Stock that has since been fully redeemed by the Company, is a holder of our Common Stock and was also a holder of our Series A Preferred Stock prior to the Transaction, as discussed below and in Note 21, Equity. We also contract with Honeywell for the occasional purchase of certain goods and services. Lease and service agreements were made at commercial terms prevalent in the market at the time they were executed. Honeywell is not considered a related party subsequent to the Transaction, which occurred on June 6, 2023.
Our payments under the agreements with Honeywell during the period that they were considered a related party amounted to $2 million for the year ended December 31, 2023 and $9 million for the year ended December 31, 2022, and were included in Cost of goods sold, and Selling, general and administrative expenses, in our Consolidated Statements of Operations.
As discussed in Note 21, Equity, in order to effect the Transaction, on April 12, 2023, the Company entered into separate definitive agreements (the "Series A Preferred Stock Agreements") with each of Centerbridge Partners, L.P. (“Centerbridge”) and funds managed by Oaktree Capital Management, L.P. (“Oaktree”), to effect a series of integrated transactions (collectively, the "Transaction") designed to simplify the Company's capital structure by converting all outstanding shares of Series A Preferred Stock into a single class of Common Stock, subject to certain conditions. Each of Centerbridge and Oaktree is a holder of our Common Stock and appoints a director to our Board of Directors. Mr. Kevin Mahony, who serves as a Senior Managing Director of Centerbridge, and Mr. Steven Tesoriere, who serves as a Managing Director and Co-Portfolio Manager of Oaktree, have been appointed to our Board of Directors as designees of Centerbridge and Oaktree, respectively. As described more fully in Note 21, Equity, in connection with the Transaction, we paid to Centerbridge and Oaktree an aggregate of approximately $570 million for the repurchase of shares of Series A Preferred Stock, plus an aggregate of approximately $10 million and 7,276,036 shares of Common Stock representing the Additional Amounts and Accumulated Dividends in respect of the repurchased shares of Series A Preferred Stock. Additionally, in connection with the conversion of the Series A Preferred Stock that each of Centerbridge and Oaktree held as of the conversion date, we issued to Centerbridge and Oaktree an aggregate of 65,334,277 shares of Common Stock upon the
conversion of an equivalent number of shares of Series A Preferred Stock, plus Additional Amounts and Accumulated Dividends of approximately $9 million and 6,819,540 shares of Common Stock.
In connection with the conversion of our Series A Preferred Stock, we issued to Honeywell, as a holder of our Series A Preferred Stock, 4,196,330 shares of Common Stock upon the conversion of an equivalent number of shares of Series A Preferred Stock, plus Additional Amounts and Accumulated Dividends of approximately $1 million and 438,009 shares of Common Stock.
Additionally, Mr. John Petry, a director on our Board in 2023, serves as Managing Member of Sessa Capital (Master), L.P., which indirectly held shares of our Series A Preferred Stock prior to the conversion. In connection with the conversion of our Series A Preferred Stock, we issued to Sessa Capital and its affiliates, as holder of our Series A Preferred Stock, 16,592,384 shares of Common Stock upon the conversion of an equivalent number of shares of Series A Preferred Stock, plus Additional Amounts and Accumulated Dividends of approximately $2 million and 1,731,900 shares of Common Stock.
During 2024, we also repurchased from Centerbridge a total of 2,808,988 shares of Common Stock for $25 million under our share repurchase program. The repurchased shares are held as treasury stock.
Recently Issued Accounting Pronouncements
Recently Adopted Accounting Standards
In November 2023, the FASB issued ASU 2023-07, Segment Reporting (Topic 280): Improvements to Reportable Segment Disclosures. The amendments in this update require companies with a single reportable segment to provide all existing segment disclosures, and the disclosure of incremental segment information. The Company adopted the new guidance as of January 1, 2024. See Note 27, Segments and Concentrations for further detail.
Accounting Standards Issued But Not Yet Adopted
In December 2023, the FASB issued ASU 2023-09, Income Taxes (Topic 740): Improvements to Income Tax Disclosures. The amendments in this update increase the transparency around income tax information through improvements to disclosures primarily related to the rate reconciliation and income taxes paid information. The guidance is effective for fiscal years beginning after December 15, 2024 on a prospective basis. Early adoption is permitted. The Company is currently evaluating the guidance to determine the impact on its disclosures.
In March 2024, the SEC adopted a final rule under SEC Release No. 33-11275, The Enhancement and Standardization of Climate-Related Disclosures for Investors, to enhance and standardize climate-related disclosures. The rule will require companies to disclose material Scope 1 and Scope 2 greenhouse gas emissions; climate-related risks, governance, and oversight; and the financial effects of severe weather events and other natural conditions. These disclosures are required to be phased in starting with annual reporting periods beginning in 2025; however, this rule has been stayed pending the outcome of legal challenges. The Company is currently evaluating the guidance to determine the impact of adoption on its disclosures in the event that the stay is lifted.
In November 2024, the FASB issued ASU 2024-03, Income Statement—Reporting Comprehensive Income—Expense Disaggregation Disclosures (Subtopic 220-40): Disaggregation of Income Statement Expenses. The amendments in this update require disclosure of specified information about certain costs and expenses. The guidance is effective for fiscal years beginning after December 15, 2026 on a prospective basis. Early adoption is permitted. The Company is currently evaluating the guidance to determine the impact on its disclosures.
There are no other recently issued, but not yet adopted, accounting pronouncements which are expected to have a material impact on the Company’s Consolidated Financial Statements and related disclosures.
Note 4. Revenue Recognition and Contracts with Customers
The Company generates revenue through the sale of products to customers in the OEM and aftermarket channels. OEM and aftermarket contracts generally include scheduling agreements that stipulate the pricing and delivery terms that identify the quantity and timing of the product to be transferred.
Disaggregated Revenue
For Net sales by region (determined based on country of shipment) and channel, refer to Note 27, Segments and Concentrations. We recognize virtually all of our revenues arising from performance obligations at a point in time. Less than 1% of our revenue is satisfied over time.
Contract Balances
The timing of revenue recognition, billings and cash collections results in unbilled receivables (contract assets) and billed accounts receivable, reported in Accounts, notes and other receivables – net, and customer advances and deposits (contract liabilities), reported in Accrued Liabilities, on the Consolidated Balance Sheets. Contract assets arise when the timing of billing to customers differs from the timing of revenue recognition. Contract assets are recognized when the revenue associated with the contract is recognized prior to billing and derecognized once invoiced in accordance with the terms of the contract. Contract liabilities are recorded in scenarios where we enter into arrangements where customers are contractually obligated to remit cash payments in advance of us satisfying performance obligations and recognizing revenue. Contract liabilities are generally derecognized when revenue is recognized.
These assets and liabilities are reported on the Consolidated Balance Sheets on a contract-by-contract basis at the end of each reporting period.
The following table summarizes our contract assets and liabilities balances:
| | | | | | | | | | | |
| 2024 | | 2023 |
| (Dollars in millions) |
| Contract assets—January 1 | $ | 38 | | | $ | 46 | |
| Contract assets—December 31, | 40 | | | 38 | |
| Change in contract assets—Increase/(Decrease) | $ | 2 | | | $ | (8) | |
| Contract liabilities—January 1 | $ | (11) | | | $ | (8) | |
| Contract liabilities—December 31, | (8) | | | (11) | |
| Change in contract liabilities—(Increase)/Decrease | $ | 3 | | | $ | (3) | |
Performance Obligations
A performance obligation is a promise in a contract to transfer a distinct good or service to the customer and is defined as the unit of account. A contract’s transaction price is allocated to each distinct performance obligation and recognized as revenue when, or as, the performance obligation is satisfied. For product sales, typically each product sold to a customer represents a distinct performance obligation.
Performance obligations are supported by contracts with customers, providing a framework for the nature of the distinct goods, services or bundle of goods and services. The timing of satisfying the performance obligation is typically indicated by the terms of the contract. All performance obligations are expected to be satisfied within one year, with substantially all performance obligations being satisfied within a month.
The timing of satisfaction of our performance obligations does not significantly vary from the typical timing of payment, with most cash advances (contract liabilities) and unbilled receivables (contract assets) being settled within 3 months. For some contracts, we may be entitled to receive an advance payment.
We have applied the practical expedient to not disclose the value of remaining performance obligations for contracts with an original expected term of one year or less.
Note 5. Other Expense, Net
| | | | | | | | | | | | | | | | | |
| Year Ended December 31, |
| 2024 | | 2023 | | 2022 |
| (Dollars in millions) |
| | | | | |
| | | | | |
| | | | | |
| Factoring and notes receivables discount fees | $ | 4 | | | $ | 4 | | | $ | 2 | |
| Supplier financing fees | 1 | | | 1 | | | — | |
| Other | $ | 1 | | | $ | — | | | $ | — | |
| $ | 6 | | | $ | 5 | | | $ | 2 | |
Note 6. Non-Operating Income, Net
| | | | | | | | | | | | | | | | | |
| Year Ended December 31, |
| 2024 | | 2023 | | 2022 |
| (Dollars in millions) |
| Equity income of affiliated companies | $ | (2) | | | $ | (7) | | | $ | (7) | |
| Interest income | (3) | | | (7) | | | (2) | |
| Pension (income) — non service | (13) | | | (7) | | | (37) | |
| Foreign exchange loss | 4 | | | 6 | | | 2 | |
Loss on remeasurement (1) | — | | | 13 | | | — | |
| Others, net | 1 | | | — | | | (3) | |
| $ | (13) | | | $ | (2) | | | $ | (47) | |
(1) Relates to the loss on remeasurement of the Series A Preferred Stock Agreements related to the Transaction. Refer to Note 21, Equity.
Note 7. Income Taxes
The sources of income (loss) from continuing operations, before income taxes, classified between domestic entities and those entities domiciled outside of the U.S., are as follows:
| | | | | | | | | | | | | | | | | | | | |
| | Year Ended December 31, |
| | 2024 | | 2023 | | 2022 |
| | (Dollars in millions) |
| Domestic entities | | $ | (65) | | | $ | (94) | | | $ | 7 | |
| Entities outside the U.S. | | 408 | | | 441 | | | 489 | |
| | $ | 343 | | | $ | 347 | | | $ | 496 | |
Tax expense (benefit)
Tax expense (benefit) consists of:
| | | | | | | | | | | | | | | | | |
| Year Ended December 31, |
| 2024 | | 2023 | | 2022 |
| (Dollars in millions) |
| Current: | | | | | |
| Federal | $ | (3) | | | $ | 12 | | | $ | 9 | |
| State | 1 | | | — | | | 1 | |
| Foreign | 56 | | | 50 | | | 50 | |
| $ | 54 | | | $ | 62 | | | $ | 60 | |
| Deferred: | | | | | |
| Federal | $ | (9) | | | $ | (14) | | | $ | 9 | |
| State | (1) | | | 1 | | | — | |
| Foreign | 17 | | | 37 | | | 37 | |
| $ | 7 | | | $ | 24 | | | $ | 46 | |
| $ | 61 | | | $ | 86 | | | $ | 106 | |
The U.S. federal statutory income tax rate is reconciled to our effective income tax rate as follows:
| | | | | | | | | | | | | | | | | |
| Year Ended December 31, |
| 2024 | | 2023 | | 2022 |
| (Dollars in millions) |
| U.S. federal statutory income tax rate | 21.0 | % | | 21.0 | % | | 21.0 | % |
| Taxes on non-U.S. earnings different from U.S. tax | (3.3) | % | | (3.6) | % | | (3.4) | % |
| Reserves for tax contingencies | (4.7) | % | | 0.2 | % | | (0.4) | % |
| Non-deductible and permanent items | — | % | | — | % | | 0.7 | % |
| Withholding and other taxes on foreign earnings | 7.0 | % | | 7.0 | % | | 3.9 | % |
| Tax law changes | 0.1 | % | | (1.7) | % | | 0.1 | % |
| Changes in valuation allowance | (4.9) | % | | 5.5 | % | | (0.6) | % |
| All other items | 2.6 | % | | (3.6) | % | | 0.1 | % |
| | 17.8 | % | | 24.8 | % | | 21.4 | % |
The effective tax rate decreased by 7.0 percentage points in 2024 compared to 2023. The decrease was primarily due to releases of reserves due to statute of limitation expirations and settlements with taxing authorities and release of valuation allowance related to deferred tax assets in Brazil (net of US branch taxes). In addition, there was prior year expense due to rate change impact on deferred tax assets attributable to the certification by the Chinese government of the High and New Technology Enterprise status of the Company’s China operations, which reduced the tax rate to 15% for the respective entity. These increases were partially offset by prior year tax benefits in Switzerland due to law changes (net of valuation allowance) and in Korea for prior year tax settlements.
The effective tax rate increased by 3.4 percentage points in 2023 compared to 2022. The increase was primarily due to the rate change impact on deferred tax assets attributable to the certification by the Chinese government of the High and New Technology Enterprise status of the Company’s China operations, which reduced the tax rate to 15% for the respective entity. Further, withholding tax and other taxes on foreign earnings have comparatively increased due to one-time non-recurring benefit recorded in 2022 related to accrued taxes on distributable reserves. These increases were partially offset by 2023 tax benefits in Switzerland due to law changes (net of valuation allowance) and in Korea for prior year tax settlements.
Deferred tax assets (liabilities)
The tax effects of temporary differences and tax carryforwards which give rise to future income tax benefits and
payables are as follows:
| | | | | | | | | | | |
| December 31, |
| 2024 | | 2023 |
| (Dollars in millions) |
| Deferred tax assets: | | | |
| Intangibles and fixed assets | $ | 112 | | | $ | 139 | |
| Pension | — | | | 4 | |
| Accruals and reserves | 29 | | | 30 | |
| Net operating losses and other tax attribute carryforwards | 34 | | | 35 | |
| Outside basis differences | 29 | | | 13 | |
| Other | 70 | | | 55 | |
| Total deferred tax assets | 274 | | | 276 | |
| Valuation allowance | (29) | | | (52) | |
| Net deferred tax assets | $ | 245 | | | $ | 224 | |
| Deferred tax liabilities: | | | |
| Outside basis differences | $ | (18) | | | $ | (9) | |
| Other | (45) | | | (26) | |
| Total deferred tax liabilities | (63) | | | (35) | |
| Net deferred tax asset | $ | 182 | | | $ | 189 | |
As of December 31, 2024, the Company had foreign net operating loss carryforwards of approximately $67 million with the majority in the below jurisdictions:
| | | | | | | | | | | |
| Jurisdiction | Expiration
Period | | Net Operating
Loss
Carryforwards |
| | | (Dollars in millions) |
| Brazil | Indefinite | | $ | 42 | |
| Luxembourg | 2038 | | 14 | |
| China | 2034 | | 9 | |
| Other | Various | | 2 | |
| | | $ | 67 | |
We also have net operating loss carryforwards in certain US state jurisdictions, the tax effect of which is not significant.
We maintain a valuation allowance of $29 million against a portion of total deferred tax assets. In the event we determine that we will not be able to realize our net deferred tax assets in the future, we will reduce such amounts through an increase to tax expense in the period such determination is made. Conversely, if we determine that we will be able to realize net deferred tax assets in excess of the carrying amounts, we will decrease the recorded valuation allowance through a reduction to tax expense in the period that such determination is made. Our valuation allowance decreased $23 million from the prior period primarily attributable to a determination that we can ultimately benefit net deferred tax assets recorded in Brazil due to current and future forecasted earnings. Our balance sheet presents a deferred tax asset of $207 million and a deferred tax liability of $25 million after considering jurisdictional netting.
The Company does not intend to permanently reinvest the undistributed earnings of our foreign subsidiaries and have recorded a deferred tax liability, mainly consisting of withholding taxes, of approximately $18 million as of December 31, 2024. The company has historically considered a portion of its undistributed foreign earnings in China as permanently reinvested. In the fourth quarter of 2024 the Company changed this assertion and these earnings are no longer considered permanently reinvested.
The following table summarizes the activity related to the Company’s uncertain tax positions (excluding interest and penalties and related tax attributes):
| | | | | | | | | | | | | | | | | |
| December 31, |
| 2024 | | 2023 | | 2022 |
| (Dollars in millions) |
| Change in unrecognized tax benefits: | | | | | |
| Balance at beginning of year | $ | 66 | | | $ | 71 | | | $ | 80 | |
| Gross increases related to current period tax positions | 5 | | | 3 | | | 4 | |
| Gross increases related to prior periods tax positions | 2 | | | — | | | 5 | |
| Gross decreases related to prior periods tax positions | — | | | — | | | — | |
| Decrease related to resolutions of audits with tax authorities | (6) | | | — | | | — | |
| Expiration of the statute of limitations for the assessment of taxes | (17) | | — | | (8) | | | (14) | |
| | | | | |
| Foreign currency translation | (2) | | | — | | | (4) | |
| Balance at end of year | $ | 48 | | | $ | 66 | | | $ | 71 | |
As of December 31, 2024, 2023, and 2022 there were $48 million, $66 million, and $71 million, respectively, of unrecognized tax benefits that, if recognized, would be recorded as a component of tax expense. The amount of unrecognized tax benefits that is reasonably possible to be resolved in the next twelve months (inclusive of interest and penalties) is expected to be approximately $22 million, all of which, if recognized, would reduce tax expense and the effective tax rate.
Estimated interest and penalties related to uncertain tax benefits are classified as a component of tax expense in the Consolidated Statements of Operations and totaled $2 million of benefit, $5 million of expense, and $2 million of expense for the years ended December 31, 2024, 2023, and 2022, respectively. Accrued interest and penalties were $32 million, $34 million, and $29 million, as of December 31, 2024, 2023, and 2022, respectively.
We are currently under audit in multiple jurisdictions, primarily India for tax years 2021 through 2023 and U.S. for tax years 2018 through 2020. Based on the outcome of these examinations, or as a result of the expiration of statutes of limitations for specific jurisdictions, it is possible that certain unrecognized tax benefits for tax positions taken on previously filed tax returns will significantly change from those recorded as liabilities in our financial statements.
Note 8. Accounts, Notes and Other Receivables—Net
| | | | | | | | | | | |
| December 31, |
| 2024 | | 2023 |
| (Dollars in millions) |
| Trade receivables | $ | 521 | | | $ | 614 | |
| Notes receivables | 96 | | | 101 | |
| Other receivables | 74 | | | 99 | |
| 691 | | | 814 | |
| Less — Allowance for expected credit losses | (4) | | | (6) | |
| $ | 687 | | | $ | 808 | |
Trade receivables include $40 million and $38 million of unbilled balances as of December 31, 2024 and 2023, respectively.
Note 9. Factoring and Notes Receivable
The Company enters into arrangements with financial institutions to sell eligible trade receivables. The receivables are sold without recourse and the Company accounts for these arrangements as true sales. The Company also receives guaranteed bank notes without recourse, in settlement of accounts receivables, primarily in the Asia Pacific region. The Company can hold the bank notes until maturity, exchange them with suppliers to settle liabilities, or sell them to third-party financial institutions in exchange for cash. Bank notes sold to third-party financial institutions without recourse are
likewise accounted for as true sales.
| | | | | | | | | | | | | | | | | |
| Year Ended December 31, |
| 2024 | | 2023 | | 2022 |
| (Dollars in millions) |
| Eligible receivables sold without recourse | $ | 701 | | $ | 783 | | $ | 664 |
| Guaranteed bank notes sold without recourse | 161 | | 92 | | 102 |
The expenses related to the sale of trade receivables and guaranteed bank notes are recognized within Other expense, net in the Consolidated Statements of Operations, and were $4 million, $4 million and $2 million for the years ended December 31, 2024, 2023 and 2022, respectively.
| | | | | | | | | | | |
| December 31, |
| 2024 | | 2023 |
| (Dollars in millions) |
| Receivables sold but not yet collected by the bank from the customer | $ | 6 | | | $ | 7 | |
| Guaranteed bank notes sold but not yet collected by the bank from the customer | — | | | — | |
As of December 31, 2024 and 2023, the Company has no guaranteed bank notes pledged as collateral.
Note 10. Inventories—Net
| | | | | | | | | | | |
| December 31, |
| 2024 | | 2023 |
| (Dollars in millions) |
| Raw materials | $ | 230 | | | $ | 198 | |
| Work in process | 18 | | | 21 | |
| Finished products | 79 | | | 85 | |
| $ | 327 | | | $ | 304 | |
| Less — Reserves | (41) | | | (41) | |
| $ | 286 | | | $ | 263 | |
Note 11. Other Current Assets
| | | | | | | | | | | |
| December 31, |
| 2024 | | 2023 |
| (Dollars in millions) |
| Prepaid expenses | $ | 16 | | | $ | 15 | |
| Taxes receivable | 18 | | | 18 | |
| Advanced discounts to customers, current | 18 | | | 16 | |
| Customer reimbursable engineering | 29 | | | 12 | |
| Foreign exchange forward contracts | 13 | | | 12 | |
| | | |
| Other | — | | | 2 | |
| $ | 94 | | | $ | 75 | |
Note 12. Other Assets
| | | | | | | | | | | |
| December 31, |
| 2024 | | 2023 |
| (Dollars in millions) |
| Advanced discounts to customers, non-current | $ | 29 | | | $ | 41 | |
Operating right-of-use assets (Note 18) | 52 | | | 40 | |
| Income tax receivable | 21 | | | 20 | |
| Pension and other employee related | 23 | | | 11 | |
| Derivatives designated as net investment hedges | 70 | | | 37 | |
| Designated and undesignated derivatives | 20 | | | 46 | |
| Other | 9 | | | 11 | |
| $ | 224 | | | $ | 206 | |
Note 13. Property, Plant and Equipment, Net
| | | | | | | | | | | |
| December 31, |
| 2024 | | 2023 |
| (Dollars in millions) |
| Land and improvements | $ | 13 | | | $ | 14 | |
| Buildings and improvements | 150 | | | 153 | |
| Machinery and equipment | 702 | | | 732 | |
| Tooling | 433 | | | 435 | |
| Software | 90 | | | 83 | |
| Construction in progress | 98 | | | 96 | |
| Others | 25 | | | 24 | |
| 1,511 | | | 1,537 | |
| Less — Accumulated depreciation and amortization | (1,062) | | | (1,060) | |
| $ | 449 | | | $ | 477 | |
Depreciation and amortization expense amounted to $90 million, $90 million and $84 million for the years ended December 31, 2024, 2023 and 2022, respectively.
Note 14. Goodwill
There were no changes to the carrying amount of goodwill for the years ended December 31, 2024 and 2023:
| | | | | | | | | | | |
| December 31, |
| 2024 | | 2023 |
| (Dollars in millions) |
| Goodwill | $ | 193 | | | $ | 193 | |
Note 15. Accrued Liabilities
| | | | | | | | | | | |
| December 31, |
| 2024 | | 2023 |
| (Dollars in millions) |
| Customer pricing reserve | $ | 77 | | | $ | 57 | |
| Compensation, benefits and other employee related | 74 | | | 80 | |
| Repositioning | 12 | | | 9 | |
| Product warranties and performance guarantees - Short-term | 15 | | | 18 | |
| Income and other taxes | 32 | | | 42 | |
| | | |
Customer advances and deferred income (1) | 16 | | | 15 | |
| Accrued interest | 14 | | | 26 | |
Short-term lease liability (Note 18) | 11 | | | 9 | |
| Freight accrual | 9 | | | 9 | |
| Dividends declared (Note 21) | 12 | | | — | |
| Designated and undesignated derivatives | 8 | | | 12 | |
Other (primarily operating expenses)(2) | 19 | | | 16 | |
| $ | 299 | | | $ | 293 | |
(1)Customer advances and deferred income include $8 million and $9 million of contract liabilities as of December 31, 2024 and 2023, respectively. See Note 4, Revenue Recognition and Contracts with Customers.
(2)Includes $6 million and $5 million of environmental liabilities as of December 31, 2024 and 2023, respectively.
The Company incurs repositioning costs related to projects to optimize our product costs and to right-size our organizational structure. Expenses related to the repositioning costs are included in Cost of goods sold and Selling, general and administrative expenses in our Consolidated Statements of Operations.
| | | | | | | | | | | | | | | | | |
| Severance
Costs | | Other Costs | | Total |
| (Dollars in millions) |
| Balance at December 31, 2022 | $ | 9 | | | $ | — | | | $ | 9 | |
| Charges | 11 | | | 2 | | | 13 | |
| Usage—cash | (11) | | | — | | | (11) | |
| Non-cash asset write-offs | — | | | (2) | | | (2) | |
| Balance at December 31, 2023 | 9 | | | — | | | 9 | |
| Charges | 21 | | | — | | | 21 | |
| Usage—cash | (18) | | | — | | | (18) | |
| | | | | |
| Balance at December 31, 2024 | $ | 12 | | | $ | — | | | $ | 12 | |
Note 16. Long-term Debt and Credit Agreements
Long Term Debt
Senior Notes
On May 21, 2024, Garrett Motion Holdings Inc. and Garrett LX I S.à.r.l. (the "Issuers"), wholly owned subsidiaries of the Company, completed an offering of $800 million in aggregate principal amount of 7.75% Senior Unsecured Notes due 2032 (the "2032 Senior Notes"). The 2032 Senior Notes mature on May 31, 2032. The Company incurred $12 million of debt issuance costs, which have been capitalized and will be amortized on a straight-line basis.
The 2032 Senior Notes are guaranteed by the Company and each of the Company's wholly owned subsidiaries that guarantee obligations under the existing Credit Agreement (as defined below), subject to certain exceptions. The proceeds
from the sale of the 2032 Senior Notes, together with cash on hand, were used to repay approximately $800 million of term loan indebtedness, as described below, and to pay related fees and expenses.
Term Loans
On the Effective Date, in accordance with the Plan, the Company entered into a credit agreement (as amended from time to time, the “Credit Agreement”) with JPMorgan Chase Bank, N.A. as administrative agent. The Credit Agreement provides for the following long-term senior secured financing (collectively, the "Term Loan Facilities"):
•2021 Dollar Facility: a seven-year secured first-lien U.S. Dollar term loan facility for $715 million (the "2021 Dollar Term Facility");
•2023 Dollar Facility: a five-year secured first-lien U.S. Dollar term loan facility for $700 million (the "2023 Dollar Term Facility"); and
•Euro Facility: a seven-year secured first-lien Euro term loan facility for €450 million (the "Euro Term Facility").
The principal outstanding and carrying amounts of our long-term debt as of December 31, 2024 and 2023 are as follows:
| | | | | | | | | | | | | | | | | | | | | | | |
| | | | | December 31, |
| (Dollars in millions) | Maturity Date | | Interest Rate | | 2024 | | 2023 |
| 2021 Dollar Term Facility | April 30, 2028 | | SOFR plus 275 bps | | $ | 692 | | | $ | 699 | |
| 2023 Dollar Term Facility | April 30, 2028 | | SOFR plus 450 bps | | — | | | 500 | |
| Euro Term Facility | April 30, 2028 | | EURIBOR plus 350 bps | | — | | | 497 | |
| 2032 Senior Notes | May 31, 2032 | | 7.75% | | 800 | | | — | |
| Other | | | | | 1 | | | — | |
| Total principal outstanding | | | | | 1,493 | | | 1,696 | |
| Less: unamortized deferred financing costs | | | | | (22) | | | (46) | |
| Less: current portion of long-term debt | | | | | (7) | | | (7) | |
| Total long-term debt | | | | | $ | 1,464 | | | $ | 1,643 | |
The following table summarizes the minimum scheduled principal repayments of long-term debt as of December 31, 2024:
| | | | | |
| December 31, |
| (Dollars in millions) |
| 2025 | $ | 7 | |
| 2026 | 7 | |
| 2027 | 7 | |
| 2028 | 672 | |
| 2029 | — | |
| Thereafter | 800 | |
| Total payments on long-term debt | $ | 1,493 | |
Revolving Facility and Letters of Credit
The Credit Agreement also provides for a senior secured first-lien revolving credit facility providing for multi-currency revolving loans (the "Revolving Facility", and together with the Term Loan Facilities, the "Credit Facilities"). The Revolving Facility matures on April 30, 2028 and has a maximum borrowing capacity of $600 million. See discussion in "Amendments to the Credit Agreement", below).
Under the Revolving Facility, the Company may use up to $125 million for the issuance of letters of credit to its subsidiaries. Letters of credit are available for issuance under the Credit Agreement on terms and conditions customary for financings of this kind, which issuances will reduce availability under the Revolving Facility. As of December 31, 2024, the Company had no borrowings outstanding under the Revolving Facility, no outstanding letters of credit, and available
borrowing capacity of $600 million. As of December 31, 2023, the Company had no borrowings outstanding under the Revolving Facility, no outstanding letters of credit, and available borrowing capacity of $570 million.
Separate from the Revolving Facility, the Company has a bilateral letter of credit facility with outstanding letters of credit of $8 million and $12 million at December 31, 2024 and 2023, respectively. The letters of credit typically support customs arrangements and other obligations at its local affiliates.
Amendments to the Credit Agreement
The Company entered into a first and second amendment of the Credit Agreement on January 11, 2022 and March 22, 2022, respectively. Under the first amendment, the maximum borrowing capacity under the Revolving Facility was increased from $300 million to $475 million. The London Inter-bank Offered Rate ("LIBOR") was replaced as an available rate at which borrowings under the Revolving Facility could accrue with, for loans borrowed in U.S. Dollars, the daily Secured Overnight Financing Rate (“SOFR”) published by the Federal Reserve Bank of New York and for loans borrowed in Australian Dollars, the average bid reference rate administered by ASX Benchmarks Pty Limited.
The second amendment removed the requirement that payments made in cash for the benefit of holders of shares of the Company's Series A Preferred Stock on or before December 31, 2022 be made on a ratable basis to the holders of the Common Stock, and made additional clarifying amendments to certain provisions.
On April 27, 2023, the Company entered into a third amendment to the Credit Agreement (the "Third Amendment") which provided for additional financing consisting of the 2023 Dollar Term Facility. The full amount of the 2023 Dollar Term Facility was drawn on June 6, 2023 (the "Third Amendment Closing Date"), and the proceeds were primarily used to finance the repurchases of the Series A Preferred Stock as part of the Transaction, and pay fees and expenses incurred in connection with this amendment.
The 2023 Dollar Term Facility will mature on April 30, 2028. Prior to maturity, the 2023 Dollar Term Facility will be repaid quarterly in an amount equal to, during the first two years occurring after the Third Amendment Closing Date, 7.50% per annum of the aggregate principal amount, and thereafter, 10.00% per annum. The Company may prepay the 2023 Dollar Term Facility at any time in whole or in part without premium or penalty, subject to certain exceptions (including for (i) customary breakage and redeployment costs in the case of prepayment of term benchmark rate loans and (ii) certain repricing events occurring during the period from the Third Amendment Closing Date to the date that is twelve months following the Third Amendment Closing Date).
The Third Amendment also provided for (i) a further increase in the maximum borrowing amount under the Revolving Facility by $95 million (the “Incremental Revolving Commitment”) to an aggregate amount of $570 million; and (ii) an extension of the maturity date for the Revolving Facility by two years from April 30, 2026 to April 30, 2028 (or January 30, 2028 if any of the currently outstanding term loans or term loans under the 2023 Dollar Term Facility maturing as of April 30, 2028 remain outstanding as of such date). The Incremental Revolving Commitment has the same terms and is generally subject to the same conditions applicable to the existing revolving facility under the Credit Agreement, except for fees paid in connection with the arrangement of the increased amount.
On May 21, 2024, the Company entered into Amendment No. 4 (the "Fourth Amendment") and Amendment No. 5 (the "Fifth Amendment") to the Credit Agreement. The Fourth Amendment (i) removed the credit spread adjustment with respect to certain US dollar denominated term loan borrowings that are Term Benchmark Loans (as defined in the Credit Agreement) and (ii) reduced the Applicable Rate (as defined in the Credit Agreement) on certain US dollar denominated term loans to 2.75% for Term Benchmark Loans and 1.75% for ABR Loans (as defined in the Credit Agreement).
The Fifth Amendment increased the amount of revolving loan commitments available to the Company under the Credit Agreement by $30 million ("Incremental Revolving Commitment") to an aggregate amount of $600 million, as discussed below. The Incremental Revolving Commitment has the same terms and is subject to the same conditions applicable to revolving loans generally under the Credit Agreement.
Security
The Credit Facilities are secured on a first-priority basis by: (i) a perfected security interest in the equity interests of each direct material subsidiary of each guarantor under the Credit Facilities and (ii) perfected security interests in, and mortgages on, substantially all tangible and intangible personal property and material real property of each of the guarantors under the Credit Facilities, subject, in each case, to certain exceptions and limitations, including the agreed guaranty and security principles. The guarantors organized under the laws of England and Wales, Luxembourg,
Switzerland and the United States entered into security documents securing the obligations of each borrower concurrently with the effectiveness of the Credit Agreement. The guarantors organized under the laws of Australia, Ireland, Japan, Mexico, Romania and Slovakia have subsequently executed security documents.
Interest Rate and Fees
The 2032 Senior Notes bear interest at a rate of 7.75% per annum. Interest on the 2032 Senior Notes is payable semi-annually in arrears on May 31 and November 30 of each year, commencing on November 30, 2024.
The 2021 Dollar Term Facility is subject to an interest rate, at our option, of either (a) an alternate base rate (“ABR”) (which shall not be less than 1.50%) or (b) an adjusted SOFR rate ("SOFR") (which shall not be less than 0.50%), in each case, plus an applicable margin equal to 2.75% in the case of SOFR loans and 1.75% in the case of ABR loans.
As of December 31, 2024, the Revolving Facility is subject to an interest rate comprised of an applicable benchmark rate (which shall not be less than 1.00% if such benchmark is the ABR rate and not less than 0.00% in the case of other applicable benchmark rates) that is selected based on the currency in which borrowings are outstanding thereunder, in each case, plus an applicable margin that may vary based on our leverage ratio.
Accordingly, the interest rates for the Credit Facilities will fluctuate during the term of the Credit Agreement based on changes in the ABR, SOFR and other applicable benchmark rates or future changes in our leverage ratio. Interest payments with respect to the Term Loan Facilities are required either on a quarterly basis (for ABR loans) or at the end of each interest period (for SOFR loans) or, if the duration of the applicable interest period exceeds three months, then every three months.
In addition to paying interest on outstanding borrowings under the Revolving Facility, the Company is required to pay a quarterly commitment fee based on the unused portion of the Revolving Facility, which is determined by our leverage ratio and ranges from 0.25% to 0.50% per annum.
Prepayments
2032 Senior Notes
The Issuers may redeem some or all of the 2032 Senior Notes at its option prior to May 31, 2027, at a redemption price equal to 100% of the principal amount of the 2032 Senior Notes redeemed, plus a customary "make-whole" premium, plus accrued and unpaid interest excluding, the redemption date.
At any time prior to May 31, 2027, the Issuers may also redeem up to 40% of the aggregate principal amount of the 2032 Senior Notes with funds in an aggregate amount not to exceed the net cash proceeds from certain equity offerings at a redemption price equal to 107.750% of principal plus accrued and unpaid interest. The issuers may redeem the 2032 Senior Notes at its option, in whole at any time or in part from time to time, at the following redemption prices:
•from May 31, 2027 to May 30, 2028: Redemption Price equal to 103.875% of principal plus accrued and unpaid interest;
•from May 31, 2028 to May 30, 2029: Redemption Price equal to 101.938% of principal plus accrued and unpaid interest; and
•from May 31, 2029 and Thereafter: Redemption Price equal to 100% of principal plus accrued and unpaid interest
Additionally, the Issuers may redeem all, but not part, of the 2032 Senior Notes upon the occurrence of specified tax events as described in the indenture.
Term Loans
The Company is obligated to make quarterly principal payments throughout the term of the 2021 Dollar Facility and the 2023 Dollar Term Facility according to the amortization provisions in the Credit Agreement. Such payments may be reduced from time to time in accordance with the terms of the Credit Agreement as a result of the application of loan prepayments made by us, if any, prior to the scheduled date of payment thereof.
We may voluntarily prepay borrowings under the Credit Agreement without premium or penalty, subject to a 1.00% prepayment premium in connection with certain repricing events in connection with the 2023 Dollar Term facility during
the period from the Third Amendment Closing Date to the date that is twelve months following the Third Amendment Closing Date and customary "breakage” costs with respect to SOFR and EURIBOR loans. We may also reduce the commitments under the Revolving Facility, in whole or in part, in each case, subject to certain minimum amounts and increments.
The Credit Agreement also contains certain mandatory prepayment provisions in the event that we incur certain types of indebtedness, receive net cash proceeds from certain non-ordinary course asset sales or other dispositions of property or, starting with the fiscal year ending on December 31, 2022, 0.50% of excess cash flow on an annual basis (with step-downs to 25% and 0% subject to compliance with certain leverage ratios), in each case subject to terms and conditions customary for financings of this kind.
During the year ended December 31, 2023, the Company made an early repayment in the amount of $200 million on the 2023 Dollar Term Facility. The early repayment resulted in incremental amortization on debt issuance cost of $9 million, included within Interest Expense in the Consolidated Statement of Operations.
During the year ended December 31, 2024, we made early debt repayments totalling $985 million on our Euro Term Facility and our 2023 Dollar Term Facility. Both term loans were fully repaid as of December 31, 2024. The early repayments resulted in incremental amortization of debt issuance costs of $27 million, included within Interest expense in the Consolidated Statement of Operations.
Representations and Warranties
The Credit Agreement contains certain representations and warranties (subject to certain agreed qualifications) that are customary for financings of this kind.
Certain Covenants
2032 Senior Notes
The 2032 Senior Notes contain certain covenants that limit the ability of the Company and its restricted subsidiaries to incur certain additional debt, incur certain liens securing debt, pay certain dividends or make other restricted payments, make certain investments, make certain asset sales, and enter into certain transactions with affiliates. These covenants are subject to a number of exceptions, limitations, and qualifications as set forth in the 2032 Senior Notes indenture. Additionally, the indenture contains certain change of control provisions that, under certain conditions, would require the Company to make an offer to repurchase all of the outstanding 2032 Senior Notes at a price equal to 101% of the aggregate principal amount, plus accrued and unpaid interest. The indenture also contains customary events of default.
Term Loans
The Credit Agreement contains certain affirmative and negative covenants customary for financing of this type. The Revolving Facility also contains a financial covenant requiring the maintenance of a consolidated total leverage ratio of not greater than 4.7 times as of the end of each fiscal quarter if, on the last day of any such fiscal quarter, the aggregate amount of loans and letters of credit (excluding backstopped or cash collateralized letters of credit and other letters of credit with an aggregate face amount not exceeding $30 million) outstanding under the Revolving Facility exceeds 35% of the aggregate commitments thereunder. Recent changes in our term loan are discussed in Note 29, Subsequent Events.
As of December 31, 2024, the Company was in compliance with all its financing covenants.
Note 17. Mandatorily Redeemable Series B Preferred Stock
On the Effective Date, pursuant to the Plan, the Company issued 834,800,000 shares of Series B Preferred Stock to Honeywell in satisfaction of certain claims of Honeywell.
During the year ended December 31, 2022, the Company redeemed 488,811,503 shares of Series B Preferred Stock, representing the entirety of the remaining outstanding shares, for a total aggregate price of $409 million, of which $28 million related to settlement of accrued interest. A loss on extinguishment of debt of $5 million was recognized in the Consolidated Statement of Operations related to the final early redemption. There were no shares of Series B Preferred Stock outstanding as of December 31, 2024, 2023 and 2022.
Note 18. Leases
We have operating leases that primarily consist of real estate, machinery and equipment. As of December 31, 2024, the Company has not identified any material finance leases. Our leases have remaining lease terms of up to 13 years, some of which include options to extend the leases for up to two years, and some of which include options to terminate the leases within the year.
The components of lease expense are as follows:
| | | | | | | | | | | | | | | | | |
| Year Ended December 31, |
| 2024 | | 2023 | | 2022 |
| (Dollars in millions) |
| Operating lease cost | $ | 17 | | | $ | 16 | | | $ | 16 | |
Supplemental cash flow information related to operating leases is as follows:
| | | | | | | | | | | | | | | | | |
| Year Ended December 31, |
| 2024 | | 2023 | | 2022 |
| (Dollars in millions) |
| Cash paid for amounts included in the measurement of lease liabilities: | | | | | |
| Operating cash outflows from operating leases | $ | 33 | | | $ | 13 | | | $ | 13 | |
| Right-of-use assets obtained in exchange for lease obligations: | | | | | |
| Operating leases | $ | 11 | | | $ | 3 | | | $ | 5 | |
Supplemental balance sheet information related to operating leases is as follows:
| | | | | | | | | | | |
| Year Ended December 31, |
| 2024 | | 2023 |
| (Dollars in millions) |
| Other assets | $ | 52 | | | $ | 40 | |
| Accrued liabilities | 11 | | | 9 | |
| Other liabilities | 42 | | | 33 | |
| | | |
| | | | | | | | | | | |
| Year Ended December 31, |
| 2024 | | 2023 |
| |
| Weighted-average lease term (in years) | 6.89 | | 8.08 |
| Weighted-average discount rate | 6.71 | % | | 5.69 | % |
Maturities of operating lease liabilities are as follows:
| | | | | |
| Year Ended December 31, 2024 |
| (Dollars in millions) |
| 2025 | $ | 14 | |
| 2026 | 12 | |
| 2027 | 11 | |
| 2028 | 7 | |
| 2029 | 4 | |
| Thereafter | 17 | |
| Total lease payments | 65 | |
| Less imputed interest | (12) | |
| $ | 53 | |
Note 19. Financial Instruments and Fair Value Measures
Credit and Market Risk
We continually monitor the creditworthiness of our customers to which we grant credit terms in the normal course of business. The terms and conditions of our credit sales are designed to mitigate or eliminate concentrations of credit risk with any single customer.
Foreign Currency Risk Management
The Company is exposed to market risks from changes in currency exchange rates. These exposures may impact future earnings and/or operating cash flows. Our exposure to market risk for changes in foreign currency exchange rates arises from international financing activities between subsidiaries, foreign currency denominated monetary assets and liabilities and transactions arising from international trade.
We hedge currency exposures with natural offsets to the fullest extent possible and, once these opportunities have been exhausted, through foreign currency exchange forward contracts. The forward currency exchange contracts are intended to mitigate exposure to foreign exchange rate volatility and the associated impact on earnings related to forecasted foreign currency commitments. Certain of these forward currency exchange contracts are designated as cash flow hedges, whereby the gains and losses on these derivatives are recorded in AOCI until the underlying transactions are recognized in earnings.
As of December 31, 2024 and 2023, we had outstanding designated and undesignated forward currency exchange contracts with aggregate gross notional amounts of $928 million and $1,171 million, respectively, to hedge foreign currencies, principally the U.S. Dollar, Swiss Franc, British Pound, Euro, Chinese Yuan, Japanese Yen, Mexican Peso, New Romanian Leu, Czech Koruna, Australian Dollar and Korean Won.
The Company uses fixed-to-fixed cross-currency swap contracts to mitigate the foreign currency risk on its 2032 Senior Notes. The cross-currency swap contract is designated as a cash flow hedge, with changes in the fair value of the derivative recorded in AOCI and reclassified into earnings based upon changes in the spot rate remeasurement of the underlying debt. The Company also uses cross-currency swap contracts to hedge net investments in foreign subsidiaries. These cross-currency swap contracts are designated as net investment hedges, and the gains and losses on these derivatives are recorded in AOCI until the net investment is liquidated or sold.
Interest Rate Risk Management
The Company is also exposed to market value risk associated with interest rate fluctuations on its variable rate term loan debt. To manage interest rate exposure, the Company enters into interest rate swap contracts. Certain of these interest rate swap contracts are designated as cash flow hedges, whereby the gains and losses on these derivatives are recorded in AOCI until the underlying transactions are recognized in earnings.
Fair Value of Financial Instruments
The FASB’s accounting guidance defines fair value as the price that would be received to sell an asset or paid to transfer a liability in an orderly transaction between market participants at the measurement date (exit price). Financial and nonfinancial assets and liabilities are classified in their entirety based on the lowest level of input that is significant to the fair value measurement. The following table sets forth the Company’s financial assets and liabilities that were accounted for at fair value on a recurring basis as of December 31, 2024 and 2023:
| | | | | | | | | | | | | | | | | | | | | | | | | | | | | | | | | | | | | | | | | |
| | | | | Fair Value |
| Notional Amounts | | Assets | | | Liabilities | |
| December 31,
2024 | | December 31,
2023 | | December 31,
2024 | | December 31,
2023 | | | December 31,
2024 | | December 31,
2023 | |
| (Dollars in millions) | |
| Designated instruments: | | | | | | | | | | | | |
| Forward currency exchange contracts | $ | 331 | | | $ | 456 | | | $ | 4 | | | $ | 11 | | | (a) | $ | 6 | | | $ | 6 | | (c) |
| Cross-currency swaps | 1,515 | | 1,015 | | | 82 | | 37 | | | (b) | — | | | 17 | | (d) |
| Interest rate swaps | — | | | 200 | | | — | | | — | | | (b) | — | | | — | | |
| Subtotal | 1,846 | | | 1,671 | | | 86 | | | 48 | | | | 6 | | | 23 | | |
| Undesignated instruments: | | | | | | | | | | | | |
| Interest rate swaps | 470 | | | 917 | | | 9 | | | 46 | | | (b) | 3 | | | 3 | | (d) |
| Forward currency exchange contracts | 597 | | | 715 | | | 9 | | | 1 | | | (a) | 2 | | | 6 | | (c) |
| Subtotal | 1,067 | | | 1,632 | | | 18 | | | 47 | | | | 5 | | | 9 | | |
| Total designated and undesignated instruments | $ | 2,913 | | | $ | 3,303 | | | $ | 104 | | | $ | 95 | | | | $ | 11 | | | $ | 32 | | |
(a)Recorded within Other current assets in the Company’s Consolidated Balance Sheets
(b)Recorded within Other assets in the Company’s Consolidated Balance Sheets
(c)Recorded within Accrued liabilities in the Company’s Consolidated Balance Sheets
(d)Recorded within Other liabilities in the Company's Consolidated Balance Sheets
Cash Flow Hedges
During 2023, the Company entered into float-to-fixed interest rate swap contracts with an aggregate notional amount of $200 million and maturities in July 2024 and October 2024. The Company also entered into a float-to-fixed cross-currency swap contract comprised of an amortizing swap with an aggregate notional amount of €280 million ($300 million) and notional exchanges in June 2026, June 2027, and June 2028. The interest rate swap and cross-currency swap contracts were early settled in 2024, resulting in net gains of $18 million recorded to Interest expense and a $4 million loss recorded to Non-operating expense in the Consolidated Statement of Operations.
The Company also has outstanding forward currency exchange contracts with maturities up to 18 months and an aggregate notional amount of $331 million and $456 million as of December 31, 2024 and 2023, respectively. These forward currency exchange contracts have been designated as cash flow hedges to mitigate foreign currency exposures primarily on our inventory purchases and manufacturing costs. The gains and losses on the forward currency exchange contracts are recorded in AOCI and reclassified to Cost of goods sold in the Consolidated Statement of Operations when the underlying transactions are recognized in earnings.
In order to mitigate foreign currency risk on its 2032 Senior Notes, the Company entered into fixed-to-fixed cross-currency swap contracts with an aggregate notional amount of €507 million ($550 million) and notional exchanges in May 2027, May 2028, May 2029 and May 2030. Changes in the fair value of the cross-currency swap contracts are recognized in AOCI and reclassified to Non-operating income in the Consolidated Statement of Operations, based upon changes in the spot rate remeasurement of the underlying debt. The net interest settlements on the cross-currency swap contract are recorded in Interest expense in the Consolidated Statements of Operations.
All of the Company’s cash flow hedges are assessed as highly effective. For the years ended December 31, 2024 and 2023, the Company recorded a loss of $8 million, net of tax, and a loss of $15 million, net of tax, respectively, in Other comprehensive income.
Net Investment Hedges
The Company has designated cross-currency swaps with an aggregate notional amount of €858 million ($965 million) and €615 million ($715 million) as of December 31, 2024 and 2023, respectively, as net investment hedges of the Company’s Euro-denominated operations. In April 2024, the Company re-couponed the cross-currency swap contracts and
received a cash settlement of $13 million. The fair values of the net investment hedges were net assets of $70 million and $37 million as of December 31, 2024 and 2023, respectively. Our Consolidated Statements of Comprehensive Income includes Changes in fair value of net investment hedges, net of tax, of a $49 million gain and a $9 million loss for the years ended December 31, 2024, and 2023, respectively. No ineffectiveness has been recorded on the net investment hedges.
Non-Designated Derivatives
As of December 31, 2024 and 2023, the Company has outstanding float-to-fixed interest rate swap contracts with an aggregate notional amount of €450 million ($470 million) and €830 million ($917 million), respectively, and maturities of April 2025, April 2026 and April 2028. Changes in the fair value of the undesignated interest rate swap contracts are recorded in Interest expense in the Consolidated Statements of Operations. For the years ended December 31, 2024 and 2023, the Company recorded losses of $37 million and $33 million, respectively, in Interest expense.
The Company also has outstanding forward currency exchange contracts with maturities generally up to 3 months and an aggregate notional amount of $597 million and $715 million as of December 31, 2024 and 2023, respectively. These derivatives are not designated as hedging instruments and are adjusted to fair value through Non-operating income in the Consolidated Statements of Operations. For the years ended December 31, 2024 and 2023, the Company recorded a gain of $12 million and a loss of $8 million, respectively, in Non-operating income.
Fair Value Measurement
The foreign currency exchange, interest rate swap and cross-currency swap contracts are valued using market observable inputs. As such, these derivative instruments are classified within Level 2. The assumptions used in measuring fair value of the cross-currency swap contracts are considered Level 2 inputs, which are based upon market observable interest rate curves, cross currency basis curves, credit default swap curves, and foreign exchange rates.
The carrying value of Cash, cash equivalents and restricted cash, Account receivables and Notes and Other receivables contained in the Consolidated Balance Sheets approximates fair value.
The following table sets forth the Company’s financial assets and liabilities that were not carried at fair value:
| | | | | | | | | | | |
| December 31, 2024 |
| Carrying Value | | Fair Value |
| (Dollars in millions) |
| Term Loan Facilities | $ | 692 | | | $ | 693 | |
| 2032 Senior Notes | 800 | | | 810 | |
The Company determined the fair value of its long-term debt and related current maturities utilizing transactions in the listed markets for similar liabilities. As such, the fair value of the Term Loan Facilities and related current maturities is considered Level 2. The fair value of the 2032 Senior Notes was determined using quoted prices from daily exchange traded markets and is classified as a Level 1 measurement.
Note 20. Other liabilities
| | | | | | | | | | | |
| December 31, |
| 2024 | | 2023 |
| (Dollars in millions) |
| Income taxes | $ | 79 | | | $ | 99 | |
| Designated and undesignated derivatives | 3 | | | 20 | |
| Pension and other employee related | 18 | | | 23 | |
Long-term lease liability (Note 18) | 42 | | | 33 | |
| Advanced discounts from suppliers | 2 | | | 3 | |
| Product warranties and performance guarantees – Long-term | 8 | | | 9 | |
| Environmental Remediation – Long-term | 10 | | | 13 | |
| Long-term accounts payable | 5 | | | 7 | |
| Other | 15 | | | 11 | |
| $ | 182 | | | $ | 218 | |
Note 21. Equity
Series A Preferred Stock
On April 30, 2021, in connection with the Emergence, the Company issued 247,757,290 shares of the Company's Series A Preferred Stock to affiliated funds of Centerbridge, affiliated funds of Oaktree (together with Centerbridge, the "C&O Investors"), and certain other investors and parties.
On April 12, 2023 (the “Transaction Date”), the Company entered into separate definitive agreements (the “Agreements”) with each of Centerbridge and Oaktree to effect a series of integrated transactions (collectively, the “Transaction”) designed to simplify the Company’s capital structure by converting all outstanding shares of Series A Preferred Stock into a single class of Common Stock, subject to certain conditions.
Under the terms of the Agreements, the Company agreed to purchase a total of $570 million in shares of SeriesA Preferred Stock from the C&O Investors at a cash price per share to be based on the volume-weighted average price of the Common Stock for the fifteen trading days following the announcement of the transactions (the “15 Days VWAP”), subject to a minimum price of $7.875 per share and a maximum price of $8.50 per share. The 15 Days VWAP was subsequently established at a value of $8.177 per share.
Additionally, under the terms of the Agreements, all holders of Series A Preferred Stock, including the C&O Investors, were entitled to receive (i) $0.853509 per share of Series A Preferred Stock, representing accumulated and unpaid preference dividends through June 30, 2023 on each share of Series A Preferred Stock (the “Accumulated Dividends”), which would be paid out in shares of Common Stock valued at the 15 Days VWAP, and (ii) $0.144375 per share of Series A Preferred Stock, representing the preference dividends that would have accrued on the Series A Preferred Stock through September 30, 2023 (the “Additional Amounts”), which would be paid out in cash.
In the second quarter of 2023, the Company completed the following steps in connection with the Transaction:
•The Company issued 25,577,517 shares of Common Stock to holders of the Series A Preferred Stock in respect of the Accumulated Dividends, with immaterial cash payments made in lieu of issuing fractional shares;
•The Company paid approximately $35 million in aggregate to holders of the Series A Preferred Stock in respect of the Additional Amounts, consisting of $10 million to the C&O Investors in consideration of shares to be repurchased and $25 million to all holders in consideration of shares to be converted, which Additional Amounts were considered to be a deemed dividend;
•The Company repurchased 69,707,719 shares of Series A Preferred Stock from the C&O Investors at the 15 Days VWAP for an aggregate purchase price of $570 million; and
•The remaining 175,337,712 shares of Series A Preferred Stock were converted into 175,337,712 shares of Common Stock, and trading of the Series A Preferred Stock on Nasdaq was subsequently suspended.
The Agreements were accounted for as freestanding physically settled forward purchase contracts. The Agreements were initially recorded at fair value and then remeasured through earnings until the establishment of the 15 Days VWAP, whereupon the Agreements were subsequently measured based on the amount of consideration to be paid at settlement. A Monte-Carlo simulation model was used to determine the Transaction Date fair value of the Agreements by simulating a range of possible future stock prices for the Company through the expected settlement date of the Agreements. The significant assumptions utilized in estimating the fair value of the Agreements include: (i) a dividend yield of 0.0%; (ii) an expected volatility of 40.0%; (iii) a risk-free interest rate of 4.23% based on observed interest rates from the Treasury Constant Maturity yield curve consistent with the simulation term; and (iv) a starting share price of $8.25 based on the market price of the Common Stock as of the Transaction Date.
The initial fair value of the Agreements represented a forward purchase liability of $4 million. A loss of $13 million was recognized in Non-operating expense in the Consolidated Statement of Operations to reflect the subsequent remeasurement of fair value of the Agreements due to changes in the market price of the Company’s Common Stock. The difference between the fair value of consideration transferred under the Agreements and the carrying value of the repurchased Series A Preferred Stock, amounting to $201 million, was recorded to Retained Deficit as a deemed dividend on the repurchase of Series A Preferred Stock from the C&O Investors as part of the Transaction. A liability for excise tax, amounting to $6 million, was also recorded to Retained Deficit as a deemed dividend.
The following table summarizes the effects of the Transaction on the Consolidated Financial Statements as of and for the year ended December 31, 2023:
| | | | | | | | | | | | | | | | | | | | | | | | | | | | | | | | | |
| Series A Repurchase | | | | 2023 Conversion | | Settlement of Accumulated Dividends | | Excise tax on Series A Repurchase | | | | Total |
| (Dollars in millions) | | |
| Consolidated Balance Sheet - increase/(decrease): | | | | | | | | |
| Cash and cash equivalents | $ | (580) | | | | | $ | (25) | | | $ | — | | | $ | — | | | | | $ | (605) | |
| Accrued liabilities | — | | | | | — | | | — | | | 6 | | | | | 6 | |
| Preferred Stock | — | | | | | — | | | — | | | — | | | | | — | |
| Common Stock | — | | | | | — | | | — | | | — | | | | | — | |
| Additional Paid-in capital | (366) | | | | | — | | | 209 | | | — | | | | | (157) | |
| Retained earnings | (201) | | | | | (25) | | | (209) | | | (6) | | | | | (441) | |
| Consolidated Statement of Operations: | | | | | | | | | | |
| | | | | | | | | | | | | |
| Non-operating expenses | 13 | | | | | — | | | — | | | — | | | | | 13 | |
| Consolidated Statement of Cash Flows | | | | | | | | | | |
| Repurchases of Series A Preferred Stock | (580) | | | | | — | | | — | | | — | | | | | (580) | |
| Payments for Additional Amounts for conversion of Series A Preferred Stock | — | | | | | (25) | | | — | | | — | | | | | (25) | |
The Company incurred $9 million of Transaction-related costs for the year ended December 31, 2023, primarily for legal and advisory services that are included in Selling, general and administrative expenses in the Consolidated Statement of Operations.
Common Stock
On December 5, 2024, the Board of Directors declared a cash dividend of $0.06 per share of Common Stock, payable on January 31, 2025, to shareholders of record as of January 15, 2025. The total amount of dividends paid on January 31, 2025, amounted to $12 million. Dividends payable on shares of Common Stock to be distributed under the Company's Long-Term Incentive Plan will be paid if and when such shares are distributed. See also Note 23, Stock-Based Compensation for further discussion.
Treasury Stock
Treasury stock represents shares of the Company's Common Stock that have been issued and subsequently repurchased by the Company or withheld to satisfy withholding tax obligations in connection with equity award vestings, and that have not been retired or cancelled. The Company accounts for treasury stock under the cost method and includes treasury stock as a component of Equity (Deficit) on the Consolidated Balance Sheet. The Company accounts for the
reissuance of treasury stock using the average cost method. The Company did not reissue or retire any shares of treasury stock during the year ended December 31, 2024.
Share Repurchase Program
On February 15, 2024, the Company announced that the Board of Directors had authorized a $350 million share repurchase program valid from February 13, 2024, until December 31, 2024. The Company may repurchase shares from time to time under the program through various methods, including in open market transactions, block trades, privately negotiated transactions, and otherwise. The timing, as well as the number and value of shares repurchased under the program, will depend on a variety of factors. The Company is not obligated to purchase any shares under the repurchase program, and the program may be suspended, modified, or discontinued at any time without prior notice. During the year ended December 31, 2024, the Company repurchased 33,493,224 shares of Common Stock for $296 million under the program. The repurchased shares are held as treasury stock. The 2024 share repurchase program expired on December 31, 2024. On December 4, 2024, the Board of Directors authorized a new $250 million share repurchase program valid January 1, 2025 until December 31, 2025.
Note 22. Accumulated Other Comprehensive Income (Loss)
The changes in AOCI by component are shown below:
| | | | | | | | | | | | | | | | | |
| Year Ended December 31, |
| 2024 | | 2023 | | 2022 |
| (Dollars in millions) |
| Foreign Exchange Translation Adjustment | | | | | |
| Balance at beginning of year | $ | (57) | | | $ | (44) | | | $ | (43) | |
| Other comprehensive income (loss) before reclassifications | 35 | | | (13) | | | (1) | |
| Amounts reclassified from AOCI | (5) | | | — | | | — | |
| Balance at end of year | (27) | | | (57) | | | (44) | |
| | | | | |
| Pension Adjustments | | | | | |
| Balance at beginning of year | (20) | | | (18) | | | (9) | |
Other comprehensive income (loss) before reclassifications, net (1) | 14 | | | 1 | | | 18 | |
| Amounts reclassified from AOCI, net | (9) | | | (3) | | | (27) | |
| Balance at end of year | (15) | | | (20) | | | (18) | |
| | | | | |
| Changes in Fair Value of Effective Cash Flow Hedges | | | | | |
| Balance at beginning of year | (2) | | | 13 | | | 7 | |
Other comprehensive income (loss) before reclassifications, net (2) | 21 | | | (2) | | | 24 | |
| Amounts reclassified from AOCI, net | (29) | | | (13) | | | (18) | |
| Balance at end of year | (10) | | | (2) | | | 13 | |
| | | | | |
| Changes in Fair Value of Net Investment Hedges | | | | | |
| Balance at beginning of year | 76 | | | 85 | | | 41 | |
Other comprehensive income (loss) before reclassifications, net (3) | 49 | | | (9) | | | 44 | |
| | | | | |
| Balance at end of year | 125 | | | 76 | | | 85 | |
| | | | | |
| Accumulated other comprehensive income (loss), end of year | $ | 73 | | | $ | (3) | | | $ | 36 | |
(1) Net of tax expense (benefit) of $1 million, $(1) million, and $2 million for the years ended December 31, 2024, 2023 and 2022, respectively. Amounts are included in the computation of net periodic benefit cost. See Note 26, Defined Benefit Pension Plans.
(2) Net of tax expense (benefit) of $(1) million, $3 million, and $(2) million for the years ended December 31, 2024, 2023 and 2022, respectively.
(3) Net of tax expense (benefit) of $14 million, $1 million, and $(13) million for the years ended December 31, 2024, 2023 and 2022, respectively.
Reclassifications from accumulated other comprehensive income (loss) to income were as follows:
| | | | | | | | | | | | | | | | | |
| Year Ended December 31, |
| 2024 | | 2023 | | 2022 |
| (Dollars in millions) |
| Foreign Exchange Translation Adjustment | | | | | |
Reclassification adjustments recognized in income (1) | $ | (5) | | | $ | — | | | $ | — | |
| Amounts reclassified from AOCI | (5) | | | — | | | — | |
| | | | | |
| Pension Adjustments | | | | | |
| Reclassification to Non-operating (income) expense | $ | (10) | | | $ | (3) | | | $ | (31) | |
| Tax effect on reclassification to income | 1 | | | — | | | 4 | |
| Amounts reclassified from AOCI, net | (9) | | | (3) | | | (27) | |
| | | | | |
| Changes in Fair Value of Effective Cash Flow Hedges | | | | | |
| Reclassification forward currency exchange contracts to Cost of goods sold | $ | (3) | | | $ | (23) | | | $ | (21) | |
| Reclassification cross-currency swaps to Interest expense | (4) | | | (3) | | | — | |
| Reclassification cross-currency swaps to Non-operating expense (income) | (26) | | | 10 | | | — | |
| Tax effect on reclassification to income | 4 | | | 3 | | | 3 | |
| Amounts reclassified from AOCI, net | (29) | | | (13) | | | (18) | |
| | | | | |
| Total reclassifications for the year | $ | (43) | | | $ | (16) | | | $ | (45) | |
(1) Cumulative translation losses reclassified to Net income related to the sale of an equity interest in an unconsolidated joint venture. See Note 28, Acquisitions and Divestitures for discussion.
Note 23. Stock-Based Compensation
2021 Long-Term Incentive Plan
On May 25, 2021, the Garrett Motion Inc. 2021 Long-Term Incentive Plan (the “Long-Term Incentive Plan”) was adopted. The Long-Term Incentive Plan provides for the grant of stock options, stock appreciation rights, performance awards, restricted stock units, restricted stock, other stock-based awards, and cash-based awards to employees and non-employee directors of Garrett or its affiliates, and independent contractors or consultants of Garrett. The maximum aggregate number of shares of our Common Stock that may be issued under the Long-Term Incentive Plan is 31,280,476 shares. As of December 31, 2024, an aggregate of 8,931,710 shares of our Common Stock were awarded, net of forfeitures and 22,348,766 shares of our Common Stock were available for future issuance under the Long-Term Incentive Plan.
Restricted Stock Units ("RSUs")
RSUs are issued to certain key employees and directors at fair market value at the date of grant. RSUs typically vest over 3 to 5 years and when vested, each unit entitles the holder to one share of our Common Stock. The following table summarizes information about RSU activity:
| | | | | | | | | | | |
| | Number of Restricted Stock Units | | Weighted Average Grant Date Fair Value Per Share |
| Non-vested at December 31, 2022 | 2,401,900 | | | $ | 7.48 | |
| Granted | 1,522,111 | | | 8.20 | |
| Vested | (718,546) | | | 7.46 | |
| Forfeited | (170,020) | | | 7.29 | |
| | | |
| Non-vested at December 31, 2023 | 3,035,445 | | | $ | 7.86 | |
| Granted | 1,391,412 | | | 9.45 | |
| Vested | (1,428,791) | | | 7.54 | |
| Forfeited | (152,195) | | | 8.46 | |
| | | |
| Non-vested at December 31, 2024 | 2,845,871 | | | $ | 8.76 | |
As of December 31, 2024, there was $15 million of total unrecognized compensation cost related to unvested RSUs, which is expected to be recognized over a weighted-average period of 1.74 years.
Performance Stock Units ("PSUs")
As of December 31, 2024, an aggregate of 4,150,849 PSU awards were granted to officers and certain key employees under the Long-Term Incentive Plan, which, upon vesting, entitles the holder to shares of our Common Stock. The actual number of shares an employee receives for each PSU depends on the Company’s performance against various measures.
For PSUs, the performance measures are based on Adjusted EBITDA and Adjusted EBITDA margin, weighted 50% each, over a three-year performance period. The PSUs vest at levels ranging from 0% to 200% of the target level depending on the Company’s performance against the financial measures.
Additionally, certain PSUs were also granted in 2023 and 2024 that included a performance measure for relative total shareholder return (“rTSR”) with stock price hurdles measured over a three-year performance period. Each grantee is granted a target level of PSUs and may earn between 0% and 200% of the target level depending on the achievement of the rTSR.
The awards associated with the rTSR performance measures are considered to have a market condition. A Monte-Carlo simulation model was used to determine the grant date fair value by simulating a range of possible future stock prices for the Company over the performance period. This model requires an input of assumptions including the simulation term, the risk-free interest rate, a volatility estimate for the Company’s shares, and a dividend yield estimate. The simulation term was the period of time between performance period start date and the performance end date. The risk-free interest rate assumption was based on observed interest rates from the Treasury Constant Maturity yield curve consistent with the simulation term. The Company’s volatility estimate was based on the historical volatilities of peers over a historical period consistent with the simulation term. The dividend yield in the model is set to zero as recipients of the award are entitled to dividend equivalents on shares that vest. The fair value of the PSUs granted in 2023 and 2024 were estimated using the following assumptions:
| | | | | | | | | | | |
| Monte Carlo Assumptions | | PSUs Granted in 2023 | PSUs Granted in 2024 |
| Volatility | | 85.01% | 41.35% |
| Dividend yield | | 0.00% | 0.00% |
| Risk-free interest rate | | 4.26% | 4.25% |
The following table summarizes information about PSU activity related to both the Stock Incentive Plan and the Long-Term Incentive Plan for each of the periods presented:
| | | | | | | | | | | |
| | Number of Performance Stock Units | | Weighted Average Grant Date Fair Value Per Share |
| Non-vested at December 31, 2022 | 1,722,043 | | $ | 8.60 | |
| Granted | 1,204,831 | | 9.37 |
| Vested | — | | — |
| Forfeited | (98,087) | | 7.91 |
| | | |
| Non-vested at December 31, 2023 | 2,828,787 | | | $ | 8.80 | |
| Granted | 1,171,883 | | 10.89 |
| Vested | (1,031,104) | | 8.67 |
| Forfeited | (499,160) | | 8.61 |
| | | |
| Non-vested at December 31, 2024 | 2,470,406 | | | $ | 9.89 | |
The fair value of the TSR-based PSUs is based on the output of the Monte Carlo simulation model noted above and the PSUs not containing a market condition are based on the fair market value of the Company’s common stock at the grant date. The number of underlying shares to be issued will be based on actual performance achievement over the performance period.
The fair value of each PSU grant is amortized monthly into compensation expense on a graded vesting (accelerated) basis over a vesting period of 36 months. The accrual of compensation costs is based on our estimate of the final expected value of the award and is adjusted as required for the performance-based conditions.
As of December 31, 2024, there was $12 million of total unrecognized compensation cost related to unvested PSUs, which is expected to be recognized over a weighted average period of 1.81 years.
Dividend Equivalents
All RSUs and PSUs granted contain rights that entitle the recipient of an award to a dividend equivalent in the amount and form equal to any dividends that would have been paid on the shares of Common Stock underlying the awards had such shares been outstanding on the record dates. Dividend equivalents are accrued on each award from the grant date until the award vests. The accrual is based on the dividends declared on the Company's Common Stock during the vesting period. The dividend equivalents are not paid out until the underlying award has vested and settled. The dividend equivalents are subject to the same vesting and settlement conditions as the awards. If the award does not vest, the accrued dividend equivalent is forfeited.
Stock-Based Compensation Expense
The following table summarizes the impact to the Consolidated Statement of Operations from the Company's incentive awards:
| | | | | | | | | | | | | | | | | |
| | Year Ended December 31, |
| | 2024 | | 2023 | | 2022 |
| (Dollars in millions) |
| RSUs | $ | 11 | | | $ | 9 | | | $ | 6 | |
| PSUs | 12 | | | 5 | | | 5 | |
| | | | | |
| Stock-based compensation expense | 23 | | | 14 | | | 11 | |
| | | | | |
| | | | | |
| Future income tax benefits recognized | 3 | | | 2 | | | 1 | |
Note 24. Earnings Per Share
For the year ended December 31, 2024, basic earnings per share ("EPS") is computed using the weighted average number of common shares outstanding during the period.
For the years ended December 31, 2023 and 2022, basic earnings per share was calculated using the two-class method because our Series A Preferred Stock was considered a participating security prior to its conversion into Common Stock and cancellation pursuant to the Transaction. The two-class method requires an allocation of earnings to all securities that participate in dividends with common shares, which included our Series A Preferred Stock, to the extent that each security may share in the entity’s earnings. Basic earnings per share are then calculated by dividing undistributed earnings allocated to common stock by the weighted average number of common shares outstanding for the period.
Diluted earnings per share for the year ended December 31, 2024 is calculated based on the weighted-average number of common shares outstanding for the period plus the dilutive effect of common stock equivalents using the treasury stock method. Diluted earnings per share for the years ended December 31, 2023 and 2022 is calculated using the more dilutive of the two-class or if-converted methods. The two-class method uses net income available to common shareholders and assumes conversion of all potential shares other than the participating securities. The if-converted method uses net income and assumes conversion of all potential shares including the participating securities.
The details of the earnings per share calculations for the years ended December 31, 2024, 2023 and 2022 are as follows: | | | | | | | | | | | | | | | | | |
| Year Ended December 31 |
| 2024 | | 2023 | | 2022 |
| (Dollars in millions except per share amounts) |
| | | | | |
| Basic earnings per share: | | | | | |
| Net Income | $ | 282 | | | $ | 261 | | | $ | 390 | |
| Less: preferred stock dividend | — | | | (80) | | | (157) | |
| Less: preferred stock deemed dividends | — | | | (232) | | | — | |
| Net income (loss) available for distribution | 282 | | | (51) | | | 233 | |
| Less: earnings allocated to participating securities | — | | | — | | | (184) | |
| Net income (loss) available to common shareholders | 282 | | | (51) | | | 49 | |
| Weighted average common shares outstanding - Basic | 222,316,484 | | | 166,595,397 | | | 64,708,635 | |
| EPS – Basic | $ | 1.27 | | | $ | (0.31) | | | $ | 0.75 | |
| | | | | |
| Diluted earnings per share: | | | | | |
| Method used: | | | Two-class | | Two-class |
| Weighted average common shares outstanding - Basic | 222,316,484 | | | 166,595,397 | | | 64,708,635 | |
| Dilutive effect of unvested RSUs and other contingently issuable shares | 1,804,672 | | | — | | | 367,357 | |
| | | | | |
| Weighted average common shares outstanding – Diluted | 224,121,156 | | | 166,595,397 | | | 65,075,992 | |
| EPS – Diluted | $ | 1.26 | | | $ | (0.31) | | | $ | 0.75 | |
For the periods where a net loss attributable to common shareholders is present, dilutive securities have been excluded from the calculation of diluted net loss per share attributable to common stockholders as including them would have been anti-dilutive. For the year ended December 31, 2023, the weighted-average number of unvested RSUs and other contingently issuable shares excluded from the computations was 1,490,117 shares.
Note 25. Commitments and Contingencies
We are involved in various lawsuits, claims and proceedings incident to the operation of our businesses, including those pertaining to product liability, product safety, environmental, health and safety, intellectual property, employment, commercial and contractual matters and various other matters. We regularly assess the likelihood of adverse judgments or outcomes in these matters, as well as potential ranges of possible losses based on a careful analysis of each matter. We identify below the individual proceedings where we believe a material loss is reasonably possible or probable, and we accrue for matters when we believe that losses are probable and the amount of the potential loss is reasonably estimable. It is inherently difficult to determine whether a loss is probable or reasonably possible or to estimate the size or range of the potential loss. Accordingly, while we believe that appropriate accruals have been established for losses that are probable
and can be reasonably estimated, it is possible that adverse outcomes from such proceedings could exceed the amounts accrued by an amount that could be material to our financial position, results of operations or cash flows.
Securities Litigation
In 2020, various securities class action complaints were filed against Garrett Motion Inc. and certain current and former Garrett officers and directors in the United States District Court for the Southern District of New York asserting claims under Section 10(b) and 20(a) of the Securities Exchange Act of 1934, as amended, for alleged securities fraud and control person liability. In March 2022, the trial court dismissed with prejudice the claims against certain of the defendants, and in March 2023, the trial court dismissed with prejudice all remaining claims. In April 2023, the plaintiffs appealed the trial court’s decision to the United States Court of Appeals for the Second Circuit. In April 2024, the Second Circuit affirmed dismissal of the claims, and the deadline for further appeals has passed.
Brazilian Tax Matters
In September 2020, the Brazilian tax authorities issued an infraction notice against Garrett Motion Industria Automotiva Brasil Ltda, challenging the use of certain tax credits (“Befiex Credits”) between January 2017 and February 2020. The infraction notice results in a loss contingency that may or may not ultimately be incurred by the Company. The estimated total amount of the contingency as of December 31, 2024, was $21 million, including penalties and interest. The Company believes, based on management’s assessment and the advice of external legal counsel, that it has meritorious arguments in connection with the infraction notice and any liability for the infraction notice is currently not probable. Accordingly, no accrual has been taken at this time.
Warranties and Guarantees
In the normal course of business, we issue product warranties and product performance guarantees. We accrue for the estimated cost of product warranties and performance guarantees based on contract terms and historical experience at the time of sale to the customer. Adjustments to initial obligations for warranties and guarantees are made as changes to the obligations become reasonably estimable. Product warranties and product performance guarantees are included in Accrued liabilities and Other Liabilities. The following table summarizes information concerning our recorded obligations for product warranties and product performance guarantees.
| | | | | | | | | | | | | |
| | Year Ended December 31, | | |
| | 2024 | | 2023 | | |
| (Dollars in millions) | | |
| Warranty and product performance guarantees at beginning of year | $ | 27 | | | $ | 28 | | | |
| Accruals for warranties/guarantees issued during the year | 10 | | | 13 | | | |
| Settlement of warranty/guarantee claims | (13) | | | (14) | | | |
| | | | | |
| Foreign currency translation | (1) | | | — | | | |
| Warranty and product performance guarantees at end of year | $ | 23 | | | $ | 27 | | | |
Note 26. Defined Benefit Pension Plans
We sponsor several funded U.S. and non-U.S. defined benefit pension plans. Pension benefits for many of our U.S. employees are provided through a non-contributory, qualified defined benefit plan. We also sponsor defined benefit pension plans in Switzerland and Ireland. Other pension plans outside of the U.S. are not material to the Company either individually or in the aggregate.
The following tables summarize the balance sheet impact, including the benefit obligations, assets and funded status associated with our pension plans.
| | | | | | | | | | | | | | | | | | | | | | | |
| Pension Benefits |
| U.S.
Plans | | U.S.
Plans | | Non-U.S.
Plans | | Non-U.S.
Plans |
| 2024 | | 2023 | | 2024 | | 2023 |
| (Dollars in millions) |
| Change in benefit obligation: | | | | | | | |
| Benefit obligation at beginning of the year | $ | 171 | | | $ | 168 | | | $ | 186 | | | $ | 167 | |
| Service cost | — | | | — | | | 7 | | | 6 | |
| Interest cost | 8 | | | 8 | | | 4 | | | 5 | |
| | | | | | | |
| Actuarial (gains) losses | (10) | | | 5 | | | (1) | | | 7 | |
| Benefits paid and employee contributions | (10) | | | (10) | | | — | | | 2 | |
Settlements and curtailments(1) | — | | | — | | | (12) | | | (16) | |
| Foreign currency translation | — | | | — | | | (12) | | | 11 | |
| | | | | | | |
| Other | — | | | — | | | 8 | | | 4 | |
| Benefit obligation at end of the year | 159 | | | 171 | | | 180 | | | 186 | |
| Change in plan assets: | | | | | | | |
| Fair value of plan assets at beginning of the year | 173 | | | 169 | | | 175 | | | 152 | |
| Actual return on plan assets | 1 | | | 14 | | | 16 | | | 16 | |
| Employer contributions | — | | | — | | | 5 | | | 7 | |
| Benefits paid and employee contributions | (10) | | | (10) | | | 1 | | | 2 | |
Settlements and curtailments(1) | — | | | — | | | (11) | | | (16) | |
| Foreign currency translation | — | | | — | | | (11) | | | 10 | |
| | | | | | | |
| Other | — | | | — | | | 8 | | | 4 | |
| Fair value of plan assets at end of year | 164 | | | 173 | | | 183 | | | 175 | |
| Funded status of plans | $ | 5 | | | $ | 2 | | | $ | 3 | | | $ | (11) | |
| Amounts recognized in Consolidated Balance Sheet consist of: | | | | | | | |
Non-current assets(2) | 5 | | | 2 | | | 18 | | | 9 | |
Non-current liabilities(3) | — | | | — | | | (15) | | | (20) | |
| | | | | | | |
| Net amount recognized | $ | 5 | | | $ | 2 | | | $ | 3 | | | $ | (11) | |
(1)In Switzerland, the total lump sum benefit payments of $11 million and $16 million were greater than the service cost and interest cost for the years ended December 31, 2024 and 2023, respectively, therefore settlement accounting was applied. Following the settlement accounting, part of the previously unrecognized gain amounting to approximately $1 million and $1 million, respectively, was recognized as a gain on pension settlement.
(2)Included in Other assets in the Consolidated Balance Sheets.
(3)Included in Other liabilities in the Consolidated Balance Sheets.
Amounts recognized in AOCI associated with our pension and other postretirement benefit plans as of December 31, 2024 and 2023 are as follow:
| | | | | | | | | | | | | | | | | | | | | | | |
| Pension Benefits |
| U.S.
Plans | | U.S.
Plans | | Non-U.S.
Plans | | Non-U.S.
Plans |
| 2024 | | 2023 | | 2024 | | 2023 |
| (Dollars in millions) |
| Prior service (credit) cost | $ | — | | | $ | — | | | $ | (7) | | | $ | (7) | |
| Net actuarial loss (gain) | 9 | | | 11 | | | (14) | | | (12) | |
| Net amount recognized | $ | 9 | | | $ | 11 | | | $ | (21) | | | $ | (19) | |
The components of net periodic benefit (income) cost for our pension and other postretirement benefit plans are as follow:
| | | | | | | | | | | | | | | | | | | | | | | | | | | | | | | | | | | | | | |
| | | Pension Benefits |
| | | U.S. Plans | | Non-U.S. Plans |
| Net Periodic Benefit Cost | | 2024 | | 2023 | | 2022 | | 2024 | | 2023 | | 2022 |
| | (Dollars in millions) |
| Service cost | | $ | — | | | $ | — | | | $ | 1 | | | $ | 7 | | | $ | 6 | | | $ | 7 | |
| Interest cost | | 8 | | | 8 | | | 5 | | | 4 | | | 5 | | | 2 | |
| Expected return on plan assets | | (8) | | | (8) | | | (9) | | | (7) | | | (9) | | | (6) | |
| Amortization of prior service (credit) cost | | — | | | — | | | — | | | (1) | | | (1) | | | (1) | |
| Recognition of actuarial (gains) losses | | — | | | — | | | — | | | (8) | | | (1) | | | (27) | |
| Settlements and curtailments | | — | | | — | | | — | | | (1) | | | (1) | | | (1) | |
| Net periodic benefit (income) cost | | $ | — | | | $ | — | | | $ | (3) | | | $ | (6) | | | $ | (1) | | | $ | (26) | |
The components of net periodic benefit (income) cost and other amounts recognized in Other comprehensive (income) loss for our pension and other postretirement benefit plans include the following components:
| | | | | | | | | | | | | | | | | | | | | | | | | | | | | | | | | | | | | | |
Other Changes in Plan Assets and Benefits Obligations Recognized in
Other Comprehensive (Income) Loss | | U.S. Plans | | Non-U.S. Plans |
| 2024 | | 2023 | | 2022 | | 2024 | | 2023 | | 2022 |
| | (Dollars in millions) |
| Actuarial (gains) losses | | $ | (3) | | | $ | (1) | | | $ | 14 | | | $ | (11) | | | $ | — | | | $ | (33) | |
| Prior service (credit) cost | | — | | | — | | | — | | | (1) | | | — | | | — | |
| Recognition of prior service credit (cost) | | — | | | — | | | — | | | 1 | | | 1 | | | 1 | |
| Recognition of actuarial gains (losses) | | — | | | — | | | — | | | 9 | | | 2 | | | 30 | |
| Foreign currency translation | | — | | | — | | | — | | | 1 | | | (2) | | | — | |
| Total recognized in other comprehensive (income) loss | | $ | (3) | | | $ | (1) | | | $ | 14 | | | $ | (1) | | | $ | 1 | | | $ | (2) | |
| Total recognized in net periodic benefit (income) cost and other comprehensive (income) loss | | $ | (3) | | | $ | (1) | | | $ | 11 | | | $ | (7) | | | $ | — | | | $ | (28) | |
The main actuarial assumptions used in determining the benefit obligations and net periodic benefit (income) cost for the benefit plans are presented in the following table as weighted averages.
| | | | | | | | | | | | | | | | | | | | | | | | | | | | | | | | | | | |
| Pension Benefits |
| U.S. Plans | | Non-U.S. Plans |
| 2024 | | 2023 | | 2022 | | 2024 | | 2023 | | 2022 |
| Actuarial assumptions used to determine benefit obligations as of December 31: | | | | | | | | | | | |
| Discount rate | 5.68 | % | | 5.02 | % | | 5.21 | % | | 2.21 | % | | 2.36 | % | | 2.91 | % |
| Expected annual rate of compensation increase | 3.00 | % | | 3.00 | % | | 4.98 | % | | 2.11 | % | | 2.38 | % | | 4.93 | % |
Interest credited to accounts (1) | — | % | | — | % | | — | % | | 2.65 | % | | 2.65 | % | | 3.00 | % |
| Actuarial assumptions used to determine net periodic benefit (income) cost for years ended December 31: | | | | | | | | | | | |
| Discount rate—benefit obligation | 5.02 | % | | 5.21 | % | | 2.95 | % | | 2.36 | % | | 2.91 | % | | 0.80 | % |
| Discount rate—service cost | 5.05 | % | | 5.23 | % | | 3.00 | % | | 2.36 | % | | 2.91 | % | | 0.82 | % |
| Discount rate—interest cost | 4.91 | % | | 5.09 | % | | 2.38 | % | | 2.35 | % | | 2.94 | % | | 0.73 | % |
| Expected rate of return on plan assets | 4.86 | % | | 4.98 | % | | 3.97 | % | | 4.42 | % | | 4.94 | % | | 3.36 | % |
| Expected annual rate of compensation increase | 3.00 | % | | 3.00 | % | | 3.20 | % | | 2.38 | % | | 2.43 | % | | 1.99 | % |
(1)Only applicable to the defined benefit pension plan in Switzerland.
The discount rates for the pension plans reflect the current rates at which the associated liabilities could be settled at the measurement date of December 31, 2024. To determine the discount rates, we use a modeling process that involves matching the expected cash outflows of our benefit plans to a yield curve constructed from a portfolio of high quality, fixed-income debt instruments. We use the single weighted-average yield of this hypothetical portfolio as a discount rate benchmark.
For both our U.S. and non-U.S. defined benefit pension plans, we estimate the service and interest cost components of net period benefit (income) cost by utilizing a full yield curve approach in the estimation of these cost components by applying the specific spot rates along the yield curve used in the determination of the pension benefit obligation to their underlying projected cash flows. This approach provides a more precise measurement of service and interest costs by improving the correlation between projected cash flows and their corresponding spot rates.
For non-U.S. benefit plans, actuarial assumptions reflect economic and market factors relevant to each country.
The following amounts relate to our pension plans with accumulated benefit obligations exceeding the fair value of plan assets.
| | | | | | | | | | | | | | | | | | | | | | | |
| December 31, |
| U.S. Plans | | Non-U.S. Plans |
| 2024 | | 2023 | | 2024 | | 2023 |
| (Dollars in millions) |
| Projected benefit obligation | $ | — | | | $ | — | | | $ | 85 | | | $ | 87 | |
| Accumulated benefit obligation | — | | | — | | | 84 | | | 84 | |
| Fair value of plan assets | — | | | — | | | 78 | | | 76 | |
Our U.S. pension asset investment strategy focuses on maintaining a diversified portfolio using various asset classes in order to achieve market exposure and diversification on a risk adjusted basis. Our target allocations are as follows: 91% liability-hedging fixed income investments, 8% global equity securities, and 1% real estate investments. Fixed income investments include corporate and government issues with a target duration close to that of the plan liability. Global equity securities include mutual funds that invest in companies located both inside and outside the United States. The real estate fund invests in real estate investment trusts – companies that purchase office buildings, hotels and other real estate property. Our assets are reviewed on a daily basis to ensure that we are within the targeted asset allocation ranges and, if necessary, asset balances are adjusted back within target allocations.
Our non-U.S. pension assets are typically managed by decentralized fiduciary committees. Our non-U.S. investment policies are different for each country as local regulations, funding requirements, and financial and tax considerations are part of the funding and investment allocation process in each country.
The fair values of both our U.S. and non-U.S. pension plans assets by asset category are as follows:
| | | | | | | | | | | | | | | | | | | | | | | |
| U.S. Plans |
| December 31, 2024 |
| Total | | Level 1 | | Level 2 | | Level 3 |
| (Dollars in millions) |
| Cash and cash equivalents | $ | 3 | | | $ | 3 | | | $ | — | | | $ | — | |
| Equity funds | 12 | | | — | | | 12 | | | — | |
| Government bond funds | 39 | | | — | | | 39 | | | — | |
| Corporate bond funds | 93 | | | — | | | 93 | | | — | |
| Liability driven investment fund | 13 | | | — | | | 13 | | | — | |
| Real estate funds | 2 | | | — | | | 2 | | | — | |
| Other | 2 | | | — | | | 2 | | | — | |
| Total assets at fair value | $ | 164 | | | $ | 3 | | | $ | 161 | | | $ | — | |
| | | | | | | |
| U.S. Plans |
| December 31, 2023 |
| Total | | Level 1 | | Level 2 | | Level 3 |
| (Dollars in millions) |
| Cash and cash equivalents | $ | 3 | | | $ | 3 | | | $ | — | | | $ | — | |
| Equity funds | 7 | | | — | | | 7 | | | — | |
| Government bond funds | 51 | | | — | | | 51 | | | — | |
| Corporate bond funds | 103 | | | — | | | 103 | | | — | |
| Real estate funds | 7 | | | — | | | 7 | | | — | |
| Other | 2 | | | — | | | 2 | | | — | |
| Total assets at fair value | $ | 173 | | | $ | 3 | | | $ | 170 | | | $ | — | |
| | | | | | | | | | | | | | | | | | | | | | | |
| Non-U.S. Plans |
| December 31, 2024 |
| Total | | Level 1 | | Level 2 | | Level 3 |
| (Dollars in millions) |
| Cash and cash equivalents | $ | 6 | | | $ | 6 | | | $ | — | | | $ | — | |
| Money market funds | 29 | | | 29 | | | — | | | — | |
| Equity funds | 49 | | | — | | | 49 | | | — | |
| Government bond funds | 6 | | | — | | | 6 | | | — | |
| Corporate bond funds | 13 | | | — | | | 13 | | | — | |
| Real estate funds | 19 | | | — | | | 19 | | | — | |
| Diversified mutual funds | 49 | | | — | | | 49 | | | — | |
| Other | 12 | | | — | | | 12 | | | — | |
| Total assets at fair value | $ | 183 | | | $ | 35 | | | $ | 148 | | | $ | — | |
| | | | | | | | | | | | | | | | | | | | | | | |
| Non-U.S. Plans |
| December 31, 2023 |
| Total | | Level 1 | | Level 2 | | Level 3 |
| (Dollars in millions) |
| Cash and cash equivalents | $ | 7 | | | $ | 7 | | | $ | — | | | $ | — | |
| Money market funds | 28 | | | 28 | | | — | | | — | |
| Equity funds | 56 | | | — | | | 56 | | | — | |
| Government bond funds | 20 | | | — | | | 20 | | | — | |
| | | | | | | |
| Real estate funds | 17 | | | — | | | 17 | | | — | |
| Diversified mutual funds | 40 | | | — | | | 40 | | | — | |
| Other | 7 | | | — | | | 7 | | | — | |
| Total assets at fair value | $ | 175 | | | $ | 35 | | | $ | 140 | | | $ | — | |
Equity funds, corporate bond funds, government bond funds, real estate funds, swap funds and short-term investments are valued either by bids provided by brokers or dealers or quoted prices of securities with similar characteristics. Other includes private equity and hedge funds. These investments are valued at estimated fair value based on quarterly financial information received from the investment advisor and/or general partner.
Our general funding policy for qualified defined benefit pension plans is to contribute amounts at least sufficient to satisfy regulatory funding standards. We were not required to make any contributions to our U.S. pension plan in 2024. In 2024, contributions of $5 million were made to our non-U.S. pension plans to satisfy regulatory funding requirements. In 2025, we expect to make contributions of cash and/or marketable securities of approximately $5 million to our non-U.S. pension plans to satisfy regulatory funding standards. Contributions for both our U.S. and non-U.S. pension plans do not reflect benefits paid directly from Company assets.
Benefit payments, including amounts to be paid from Company assets, and reflecting expected future service, as appropriate, are expected to be paid as follows:
| | | | | | | | | | | |
| U.S.
Plans | | Non-U.S.
Plans |
| (Dollars in millions) |
| 2025 | $ | 12 | | | $ | 4 | |
| 2026 | 12 | | | 5 | |
| 2027 | 12 | | | 5 | |
| 2028 | 12 | | | 6 | |
| 2029 | 12 | | | 7 | |
| 2030-2034 | 61 | | | 44 | |
Note 27. Segments and Concentrations
The Company has identified our CODM as the Chief Executive Officer. The CODM reviews consolidated net income when assessing the Company's performance, allocating resources and establishing management's compensation. In addition to consolidated net income, the CODM receives discrete information for net sales by product and by geographical location. Consolidated net income is used to monitor budget versus actual results.
The accounting policies of our operating segment are the same as those described in the Company's summary of significant accounting policies.
The Company derives revenues from customers through sales of air and fluid compression and high-speed electric motor technologies for OEMs and distributors within the mobility and industrial space. In addition to consolidated net income, the CODM regularly reviews sales by region and product line.
Sales concentration — Net sales by region (determined based on country of shipment) and product line are as follows:
| | | | | | | | | | | | | | | | | |
| Year Ended December 31, |
| 2024 | | 2023 | | 2022 |
| (Dollars in millions) |
| United States | $ | 700 | | | $ | 744 | | | $ | 694 | |
| Europe | 1,642 | | | 1,874 | | | 1,734 | |
| | | | | |
| | | | | |
| | | | | |
| | | | | |
| Asia | | | | | |
| China | 643 | | | 768 | | | 701 | |
| Rest of Asia | 413 | | | 433 | | | 401 | |
| Other International | 77 | | | 67 | | | 73 | |
| $ | 3,475 | | | $ | 3,886 | | | $ | 3,603 | |
| | | | | | | | | | | | | | | | | |
| Year Ended December 31, |
| 2024 | | 2023 | | 2022 |
| (Dollars in millions) |
| Diesel | $ | 827 | | | $ | 992 | | | $ | 949 | |
| Gas | 1,505 | | | 1,720 | | | 1,485 | |
| Commercial Vehicle | 629 | | | 656 | | | 673 | |
| Aftermarket | 459 | | | 456 | | | 442 | |
| Other | 55 | | | 62 | | | 54 | |
| $ | 3,475 | | | $ | 3,886 | | | $ | 3,603 | |
Customer concentration — Net sales to Garrett’s largest customers and the corresponding percentage of total net sales are as follows:
| | | | | | | | | | | | | | | | | | | | | | | | | | | | | | | | | | | |
| Net sales Year Ended December 31, |
| 2024 | | % | | 2023 | | % | | 2022 | | % |
| (Dollars in millions) |
| Customer A | $ | 401 | | | 12 | | | $ | 474 | | | 12 | | | $ | 444 | | | 12 | |
| Customer B | 354 | | | 10 | | | 364 | | | 9 | | | 350 | | | 10 | |
Others (1) | 2,720 | | | 78 | | | 3,048 | | | 79 | | | 2,809 | | | 78 | |
| | $ | 3,475 | | | 100 | | | $ | 3,886 | | | 100 | | | $ | 3,603 | | | 100 | |
(1) No other customer had sales individually exceeding 10%.
The table below provides segment information about the Company:
| | | | | | | | | | | | | | | | | |
| Year Ended December 31, |
| 2024 | | 2023 | | 2022 |
| (Dollars in millions) |
| Net sales | $ | 3,475 | | | $ | 3,886 | | | $ | 3,603 | |
| Less: | | | | | |
| Material costs | 2,022 | | | 2,323 | | | 2,142 | |
Variable manufacturing costs (1) | 386 | | | 417 | | | 414 | |
Fixed manufacturing costs (2) | 201 | | | 228 | | | 199 | |
| Research, development and engineering costs | 161 | | | 163 | | | 165 | |
| Selling, general and administrative costs | 240 | | | 247 | | | 216 | |
| Interest expense | 156 | | | 159 | | | 8 | |
| Income tax expense | 61 | | | 86 | | | 106 | |
Other segment items (3) | (34) | | | 2 | | | (37) | |
| Consolidated net income | $ | 282 | | | $ | 261 | | | $ | 390 | |
(1) Variable manufacturing costs include freight, duties, direct and indirect labor costs, repairs and maintenance, repositioning costs and variable overhead costs.
(2) Fixed manufacturing costs include depreciation and amortization, rent, overhead labor costs, utilities and other fixed costs.
(3) Other segment items consist of gain on sale of equity interest in unconsolidated joint venture, non-service components of net periodic expense, interest income, equity income, loss on extinguishment of debt, reorganization and other non-operating income items (if any).
Long-lived assets concentration — Long-lived assets (1) by region are as follows:
| | | | | | | | | | | | | |
| December 31 |
| 2024 | | 2023 | | |
| (Dollars in millions) |
| United States | $ | 18 | | | $ | 19 | | | |
| Europe | | | | | |
| Slovakia | 83 | | | 89 | | | |
| Romania | 43 | | | 46 | | | |
| Rest of Europe | 96 | | | 101 | | | |
| Asia | | | | | |
| China | 110 | | | 117 | | | |
| Rest of Asia | 50 | | | 53 | | | |
| Other International | 49 | | | 52 | | | |
| $ | 449 | | | $ | 477 | | | |
(1)Long-lived assets are comprised of property, plant and equipment–net.
The measure of segment assets is reported on the balance sheet as total consolidated assets. The Company had capital expenditure purchases of $91 million, $83 million and $91 million for the years ended December 31, 2024, 2023 and 2022, respectively. The Company had depreciation and amortization expense in the amount of $90 million, $90 million and $84 million for the years ended December 31, 2024, 2023 and 2022, respectively. The Company reports significant non-cash adjustments in its Consolidated Statement of Cash Flows.
Note 28. Acquisitions and Divestitures
On April 3, 2024, the Company divested its equity interest in an unconsolidated joint venture for approximately $58 million, subject to customary debt and working capital adjustments. We received cash consideration on the divestiture
date of $46 million, with an additional $7 million to be received in two equal installments due twelve months and thirty-six months from the divestiture date. A pre-tax gain of $27 million was recognized related to this divestiture, including $5 million of cumulative translation losses reclassified from AOCI to Net income. Transaction fees of $1 million were incurred in connection with the divestiture and are included in Selling, general, and administrative expenses in our Consolidated Statement of Operations.
Note 29. Subsequent Events
On January 30, 2025, the Company entered into an amendment and restatement of the Credit Agreement (the "Restatement Agreement"). Under the Restatement Agreement, the Company refinanced in full its 2021 Dollar Term Facility in an aggregate principal amount of $692 million (the "2025 Dollar Term Facility"). The 2025 Dollar Term Facility will mature on January 30, 2032, and will bear interest at a spread equal to, at the Company's option, 2.25% per annum in the case of Term Benchmark Loans or 1.25% per annum in the case of ABR Loans. The Company also terminated and replaced its existing Revolving Facility with new revolving commitments (the "New Revolving Facility"). The New Revolving Facility has a maximum borrowing capacity of $630 million and matures on January 30, 2030.
On January 31, 2025, the Company paid $12 million in settlement of the cash dividends declared on December 5, 2024.
Note 30. Unaudited Quarterly Financial Information
The following tables show selected unaudited quarterly results of operations for the years ended December 31, 2024 and 2023. The quarterly data have been prepared on the same basis as the audited annual financial statements and include all adjustments, which include only normal recurring adjustments, necessary for the fair statement of our results of operations for these periods.
| | | | | | | | | | | | | | | | | | | | | | | | | | | | | |
| 2024 |
| March 31 | | June 30 | | September 30 | | December 31 | | Year Ended December 31 |
| (Dollars in millions) |
| Net sales | $ | 915 | | | $ | 890 | | | $ | 826 | | | $ | 844 | | | $ | 3,475 | |
| Gross profit | 172 | | | 185 | | | 166 | | | 182 | | | 705 | |
| Net income | 66 | | | 64 | | | 52 | | | 100 | | | 282 | |
| Net income available for distribution | 66 | | | 64 | | | 52 | | | 100 | | | 282 | |
| Earnings per share - basic | 0.28 | | | 0.29 | | | 0.24 | | | 0.47 | | | 1.27 | |
| Earnings per share - diluted | 0.28 | | | 0.28 | | | 0.24 | | | 0.47 | | | 1.26 | |
| | | | | | | | | |
| | | | | | | | | | | | | | | | | | | | | | | | | | | | | |
| 2023 |
| March 31 | | June 30 | | September 30 | | December 31 | | Year Ended December 31 |
| (Dollars in millions) |
| Net sales | $ | 970 | | | $ | 1,011 | | | $ | 960 | | | $ | 945 | | | $ | 3,886 | |
| Gross profit | 189 | | | 202 | | | 176 | | | 189 | | | 756 | |
| Net income | 81 | | | 71 | | | 57 | | | 52 | | | 261 | |
| Net income (loss) available for distribution | 41 | | | (201) | | | 57 | | | 52 | | | (51) | |
| Earnings (loss) per share - basic | 0.13 | | | (1.88) | | | 0.23 | | | 0.22 | | | (0.31) | |
| Earnings (loss) per share - diluted | 0.13 | | | (1.88) | | | 0.23 | | | 0.22 | | | (0.31) | |
Earnings (loss) per share - diluted method (1) | Two-class | | Two-class | | | | | | Two-class |
(1)As our Series A Preferred Stock was converted into Common Stock pursuant to the Transaction, diluted earnings per share for the quarters ended September 30, 2023 and December 31, 2023 are computed using the weighted-average number of common shares outstanding during the period plus the dilutive effect of common stock equivalents using the treasury stock method.
Item 9. Changes in and Disagreements with Accountants on Accounting and Financial Disclosure
None.
Item 9A. Controls and Procedures
Evaluation of Disclosure Controls and Procedures
Our management, with the participation of our Chief Executive Officer and Chief Financial Officer, conducted an evaluation of our disclosure controls and procedures, as such term is defined under Rule 13a-15(e) promulgated under the Exchange Act. In designing and evaluating our disclosure controls and procedures, management recognizes that any controls and procedures, no matter how well designed and operated, can provide only reasonable assurance of achieving the desired control objectives and that it will detect or uncover failures within the Company to disclose material information otherwise required to be set forth in the Company’s periodic reports. In addition, the design of disclosure controls and procedures must reflect the fact that there are resource constraints and that management is required to apply judgment in evaluating the benefits of possible controls and procedures relative to their costs. Based on management's evaluation, our Chief Executive Officer and Chief Financial Officer concluded that our disclosure controls and procedures were effective at the reasonable assurance level as of December 31, 2024.
Management’s Report on Internal Control Over Financial Reporting
Management is responsible for establishing and maintaining adequate internal control over financial reporting, as defined in Rule 13a-15(f) under the Exchange Act. Our management conducted an assessment of the effectiveness of our internal control over financial reporting based on the criteria set forth in “Internal Control-Integrated Framework (2013)” issued by the Committee of Sponsoring Organizations of the Treadway Commission. Based on this assessment, management concluded that our internal control over financial reporting was effective as of December 31, 2024.
Deloitte SA, our independent registered public accounting firm, has issued an attestation report on our internal control over financial reporting, which is included in Item 8, Financial Statements and Supplementary Data, of this Annual Report.
Changes in Internal Control Over Financial Reporting
There have been no changes in our internal control over financial reporting (as defined in Rules 13a-15(f) and 15d-15(f) under the Exchange Act) during the quarter ended December 31, 2024 that have materially affected, or are reasonably likely to materially affect, our internal control over financial reporting.
Item 9B. Other Information
During the three months ended December 31, 2024, no director or Section 16 officer of the Company adopted or terminated a "Rule 10b5-1 trading agreement" or "non-Rule 10b5-1 trading agreement," as each term is defined in Item 408(a) of Regulation S-K.
Item 9C. Disclosure Regarding Foreign Jurisdictions that Prevent Inspections
Not applicable.
PART III
Item 10. Directors, Executive Officers and Corporate Governance
Information with respect to this Item will be set forth in our 2025 Proxy Statement, which will be filed with the Securities and Exchange Commission no later than 120 days after December 31, 2024. For the limited purpose of providing the information necessary to comply with this Item 10, the 2025 Proxy Statement is incorporated herein by this reference.
Item 11. Executive Compensation
Information with respect to this Item will be set forth in our 2025 Proxy Statement, which will be filed with the Securities and Exchange Commission no later than 120 days after December 31, 2024. For the limited purpose of providing the information necessary to comply with this Item 11, the 2025 Proxy Statement is incorporated herein by this reference.
Item 12. Security Ownership of Certain Beneficial Owners and Management and Related Stockholder Matters
Information with respect to this Item will be set forth in our 2025 Proxy Statement, which will be filed with the Securities and Exchange Commission no later than 120 days after December 31, 2024. For the limited purpose of providing the information necessary to comply with this Item 12, the 2025 Proxy Statement is incorporated herein by this reference.
Item 13. Certain Relationships and Related Transactions, and Director Independence
Information with respect to this Item will be set forth in our 2025 Proxy Statement, which will be filed with the Securities and Exchange Commission no later than 120 days after December 31, 2024. For the limited purpose of providing the information necessary to comply with this Item 13, the 2025 Proxy Statement is incorporated herein by this reference.
Item 14. Principal Accountant Fees and Services
Information with respect to this Item will be set forth in our 2025 Proxy Statement, which will be filed with the Securities and Exchange Commission no later than 120 days after December 31, 2024. For the limited purpose of providing the information necessary to comply with this Item 14, the 2025 Proxy Statement is incorporated herein by this reference.
PART IV
Item 15. Exhibits and Financial Statement Schedules
(a) Documents filed as part of this report:
1.The following financial statements are included in Item 8 “Financial Statements and Supplementary Data” herein.
2.The following financial statement schedule should be considered in conjunction with our consolidated financial statements. All other schedules are omitted because they are not applicable, not required or the required information is shown in the consolidated financial statements or notes thereto.
GARRETT MOTION INC.
Schedule II-Valuation and Qualifying Accounts
| | | | | | | | | | | | | | | | | | | | | | | | | | | | | | | | | | |
| For and as of the year ending: | | Balance at Beginning of Period | | Additions Charged to Costs and Expenses | | Deductions | | Foreign
Exchange
Translation
Adjustment | | | | Balance at End of Period |
| | (Dollars in millions) |
| December 31, 2024 | | | | | | | | | | | | |
| Allowance for expected credit losses | | $ | 6 | | | $ | (1) | | | $ | (1) | | | $ | — | | | | | $ | 4 | |
| Inventory reserves | | 41 | | | 4 | | | (2) | | | (2) | | | | | 41 | |
| Tax valuation allowance | | 52 | | | 4 | | | (34) | | | 7 | | | | | 29 | |
| December 31, 2023 | | | | | | | | | | | | |
| Allowance for expected credit losses | | $ | 9 | | | $ | 2 | | | $ | (5) | | | $ | — | | | | | $ | 6 | |
| Inventory reserves | | 31 | | | 13 | | | (4) | | | 1 | | | | | 41 | |
| Tax valuation allowance | | 31 | | | 20 | | | (1) | | | 2 | | | | | 52 | |
| December 31, 2022 | | | | | | | | | | | | |
| Allowance for expected credit losses | | $ | 5 | | | $ | 4 | | | $ | — | | | $ | — | | | | | $ | 9 | |
| Inventory reserves | | 29 | | | 7 | | | (3) | | | (2) | | | | | 31 | |
| Tax valuation allowance | | 32 | | | — | | | (1) | | | — | | | | | 31 | |
3.The exhibits to this report are listed below
| | | | | | | | | | | | | | | | | | | | | | | | | | |
| | | Incorporated by Reference | | | |
Exhibit
Number | | Description | Form | File No. | Exhibit | Filing
Date | Filed/
Furnished Herewith | | | |
| 2.1 | | | 8-K | 001-38636 | 2.1 | 4/27/2021 | | | | |
| 3.1 | | | 10-Q | 001-38636 | 3.1 | 7/25/2024 | | | | |
| | | | | | | | | | | | | | | | | | | | | | | | | | |
| 3.2 | | | 10-Q | 001-38636 | 3.2 | 7/25/2024 | | | | |
| 4.1 | | | | | | | * | | | |
| 4.2 | | | 8-K | 001-38636 | 4.1 | 5/21/2024 | | | | |
| 10.1† | | | 10-12B | 001-38636 | 10.1 | 8/23/2018 | | | | |
| 10.2† | | | 10-12B | 001-38636 | 10.4 | 8/23/2018 | | | | |
| 10.3† | | | 10-12B | 001-38636 | 10.5 | 8/23/2018 | | | | |
| 10.4† | | | 10-Q | 001-38636 | 10.1 | 7/30/2020 | | | | |
| 10.5† | | | 10-Q | 001-38636 | 10.1 | 5/11/2020 | | | | |
| 10.6† | | | | | | | * | | | |
| 10.7† | | | 8-K | 001-38636 | 10.1 | 5/28/2021 | | | | |
| 10.8† | | | 8-K | 001-38636 | 10.2 | 5/28/2021 | | | | |
| 10.9† | | | 8-K | 001-38636 | 10.3 | 5/28/2021 | | | | |
| 10.10† | | | 8-K | 001-38636 | 10.4 | 5/28/2021 | | | | |
| 10.11† | | | 8-K | 001-38636 | 10.5 | 5/28/2021 | | | | |
| 10.12† | | | 10-Q | 001-38636 | 10.4 | 7/27/2023 | | | | |
| 10.13 | | Credit Agreement, dated April 30, 2021, among Garrett Motion Inc., Garrett LX I S.à r.l., Garrett Motion Holdings, Inc., Garrett Motion Sàrl, the lenders and issuing banks party thereto and JPMorgan Chase Bank, N.A., as administrative agent | 8-K | 001-38636 | 10.1 | 4/30/2021 | | | | |
| 10.14 | | Amendment No. 1, dated January 11, 2022, to the Credit Agreement, dated April 30, 2021, among Garrett Motion Inc., Garrett LX I S.à r.l., Garrett Motion Holdings, Inc., Garrett Motion Sàrl, the lenders and issuing banks party thereto and JPMorgan Chase Bank, N.A., as administrative agent | 10-K | 001-38636 | 10.31 | 2/14/2022 | | | | |
| 10.15 | | Amendment No. 2, dated March 23, 2022, to the Credit Agreement, dated April 30, 2021, among Garrett Motion Inc., Garrett LX I S.à r.l., Garrett Motion Holdings, Inc., Garrett Motion Sàrl, the lenders and issuing banks party thereto and JPMorgan Chase Bank, N.A., as administrative agent | POS
AM | 333-256659 | 10.1 | 6/9/2022 | | | | |
| 10.16 | | Amendment No. 3, dated April 27, 2023, to the Credit Agreement, dated April 30, 2021, among Garrett Motion Inc., Garrett LX I S.à r.l., Garrett Motion Holdings, Inc., Garrett Motion Sàrl, the lenders and issuing banks party thereto and JPMorgan Chase Bank, N.A., as administrative agent. | 8-K | 001-38636 | 10.1 | 5/01/2023 | | | | |
| | | | | | | | | | | | | | | | | | | | | | | | | | |
| 10.17 | | Amendment No. 4, dated May 21, 2024, to the Credit Agreement, dated April 30, 2021, among Garrett Motion Inc., Garrett LX I S.à r.l, Garrett Motion Holdings, Inc., Garrett Motion Sàrl, the lenders and issuing banks party thereto and JPMorgan Chase Bank, N.A., as administrative agent. | 8-K | 001-38636 | 10.1 | 5/21/2024 | | | | |
| 10.18 | | Amendment No. 5, dated May 21, 2024, to the Credit Agreement, dated April 30, 2021, among Garrett Motion Inc., Garrett LX I S.à r.l, Garrett Motion Holdings, Inc., Garrett Motion Sàrl, the lenders and issuing banks party thereto and JPMorgan Chase Bank, N.A., as administrative agent. | 8-K | 001-38636 | 10.2 | 5/21/2024 | | | | |
| 10.19 | | | 8-K | 001-38636 | 10.2 | 4/30/2021 | | | | |
| 10.20 | | | 8-K | 001-38636 | 10.3 | 4/30/2021 | | | | |
| 10.21 | | | 8-K | 001-38636 | 10.1 | 4/14/2023 | | | | |
| 10.22 | | | 8-K | 001-38636 | 10.2 | 4/14/2023 | | | | |
| 19 | | | | | | | * | | | |
| 21.1 | | | | | | | * | | | |
| 23.1 | | | | | | | * | | | |
| 31.1 | | | | | | | * | | | |
| 31.2 | | | | | | | * | | | |
| 32.1 | | | | | | | ** | | | |
| 32.2 | | | | | | | ** | | | |
| 97 | | | 10-K | 001-38636 | 97 | 2/15/2024 | | | | |
| 99.1 | | | 8-K | 001-38636 | 2.1 | 4/27/2021 | | | | |
| | | | | | | | | | | | | | | | | | | | | | | | | | |
| 101 | | The following financial information from the Company's Annual Report on Form 10-K for the year ended December 31, 2024, formatted in Inline Extensible Business Reporting Language (iXBRL) includes: (i) the Consolidated Statements of Operations, (ii) the Consolidated Statements of Comprehensive Income, (iii) the Consolidated Balance Sheets, (iv) the Consolidated Statements of Cash Flows, (v) the Consolidated Statements of Equity (Deficit) and (vi) Notes to the Consolidated Financial Statements | | | | | * | | | |
| 104 | | Cover Page Interactive Data File (formatted as Inline XBRL and contained in Exhibit 101) | | | | | * | | | |
* Filed herewith
** Furnished herewith
† Management contract or compensation plan or arrangement
Item 16. Form 10- K Summary
None.
SIGNATURES
Pursuant to the requirements of Section 13 or 15(d) of the Securities Exchange Act of 1934, the registrant has duly caused this report to be signed on its behalf by the undersigned, thereunto duly authorized.
| | | | | | | | |
| Garrett Motion Inc. |
| Date: February 20, 2025 | By: | /s/ Olivier Rabiller |
| | Olivier Rabiller |
| | President and Chief Executive Officer |
Pursuant to the requirements of the Securities Exchange Act of 1934, this report has been signed below by the following persons on behalf of the registrant and in the capacities and on the dates indicated.
| | | | | | | | | | | | | | |
| Signature | | Title | | Date |
| | | | | |
| /s/ Olivier Rabiller | | President, Chief Executive Officer and Director | | February 20, 2025 |
| Olivier Rabiller | | (Principal Executive Officer) | | |
| | | | | |
| /s/ Sean Deason | | Senior Vice President and Chief Financial Officer | | February 20, 2025 |
| Sean Deason | | (Principal Financial Officer) | | |
| | | | | |
| /s/ Joanne Lau | | Vice President and Corporate Controller | | February 20, 2025 |
| Joanne Lau | | (Principal Accounting Officer) | | |
| | | | | |
| /s/ Daniel Ninivaggi | | Chairman of the Board and Director | | February 20, 2025 |
| Daniel Ninivaggi | | | | |
| | | | | |
| /s/ D'aun Norman | | Director | | February 20, 2025 |
| D'aun Norman | | | | |
| | | | | |
| /s/ Paul Camuti | | Director | | February 20, 2025 |
| Paul Camuti | | | | |
| | | | | |
| /s/ Joachim Drees | | Director | | February 20, 2025 |
| Joachim Drees | | | | |
| | | | | |
| /s/ Robert Shanks | | Director | | February 20, 2025 |
| Robert Shanks | | | | |
| | | | | |
| /s/ Kevin Mahoney | | Director | | February 20, 2025 |
| Kevin Mahoney | | | | |
| | | | | |
| /s/ Julia Steyn | | Director | | February 20, 2025 |
| Julia Steyn | | | | |
| | | | |
| /s/ Steven Tesoriere | | Director | | February 20, 2025 |
| Steven Tesoriere | | | | |